
CPI inflation highest since 2008 and 1991.
(Wolf Richter) The Consumer Price Index (CPI) jumped 0.4% in September from August. The relentless series of jumps started in January when this “transitory” inflation took off. But now, “transitory is a dirty word,” as Atlanta Fed President Raphael Bostic phrased it so elegantly, because the underlying dynamics have made it persistent: as some prices back off, others are surging.
On an annual basis, CPI jumped by 5.4%, matching the June high this year, and both are the highest since July and August 2008 (5.6% and 5.4%), and all four are the highest since early 1991, according to data released by the Bureau of Labor Statistics today.
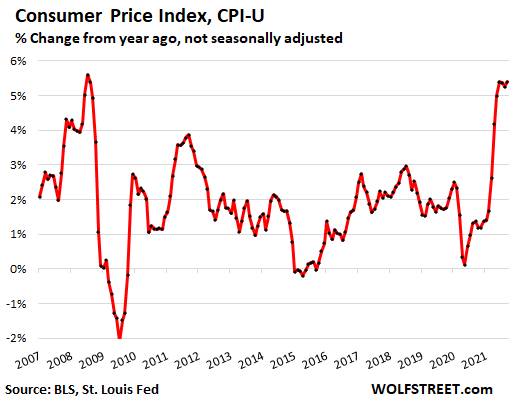
The increase was driven by numerous factors including food and rents and gasoline and utilities and new vehicles.
Food and energy can move sharply and erratically, often following prices of commodities. With food and energy removed, the “core CPI” rose by 0.2% for the month and by 4.0% year-over-year.
Rent is the biggie in CPI. Its two versions are the largest items in the CPI basket of goods and services, and determine nearly one-third of CPI. These rent factors had plunged, and had kept CPI from surging even higher in the spring and summer. But they made a U-turn a few months ago and are now rising but are still holding down CPI. This is going to be the driver of CPI going forward – as market rents are surging in many cities by 10% year-over-year, and in some places over 20%. CPI is now making tentative steps to catch up.
This is the inflation game of Whac-A-Mole, as price increases spiral through the economy from category to category.
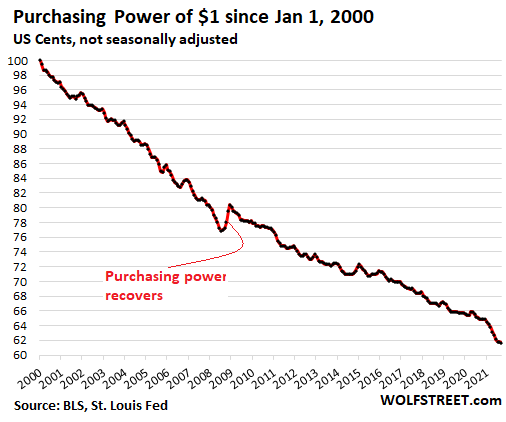
The overall CPI attempts to measure the loss of the purchasing power of the consumer dollar. In September, the purchasing power dropped another 0.3%. On this 20-year chart, you can see the sharp drop-off over the first nine months this year (-4.9%). Since 2000, the purchasing power of $1 has dropped by 38 cents:
CPI understates housing costs, but the CPI for them are taking off.
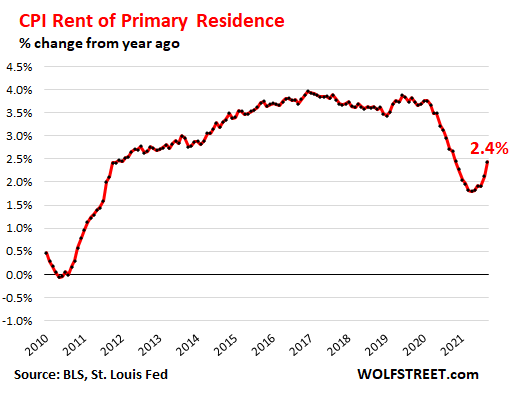
“Rent of primary residence,” which weighs 7.6% in the overall CPI, jumped 0.5% for the month, which brought the year-over-year rise to 2.4%. Before the pandemic, the rent index ran between 3.5% and 4% year-over-year. During the pandemic, it plunged and prevented overall CPI from surging even more. But that phase is now over as surging market rents are gradually getting picked up by the CPI for rent:
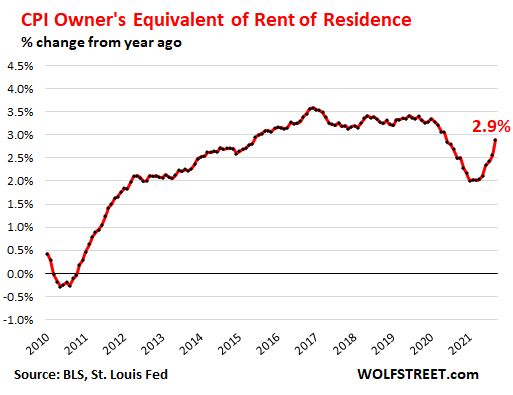
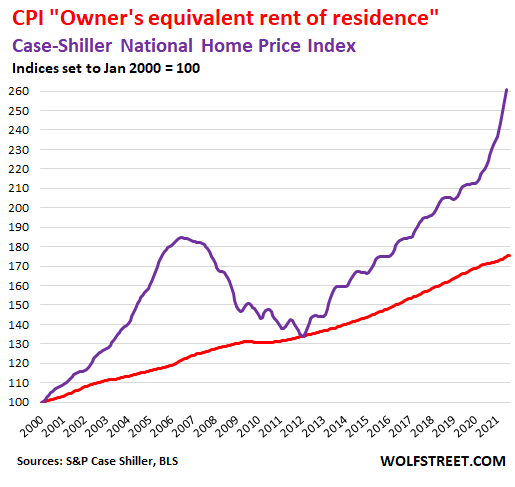
“Owner’s equivalent rent of residences” – which tracks the costs of home ownership and weighs 23.6% in the overall CPI – doesn’t track actual home-price inflation, but is based on surveys that ask what homeowners think their home might rent for and is therefore a measure of rent as seen by the homeowner.
This measure also U-turned and is taking off. In September, it rose 0.4% for the month, the fastest monthly increase since 2006! This brought the year-over-year gain to 2.9%.
So two things:
- The 2.9% rise is still holding down overall CPI (5.4%).
- The 2.9% gain is still ludicrously small compared to the record crazy price explosion in the housing market.
As the index for “Owner’s equivalent of rent” just started budging (red line below), the Case-Shiller Home Price Index, which tracks actual price changes of the same house and is therefore a measure of house price inflation, spiked by 19.7% year-over year, the most in the data going back to 1987 (purple line). Both indexes are set to 100 for January 2000:
Food costs (weighing 13.9% in the overall CPI), jumped 0.9% for the month and 4.6% year-over-year. The CPI for meats spiked by 3.3% for the month and by 12.6% year-over-year, with beef spiking by 4.8% for the month and by 17.6% year-over-year, which is surprising only in that it hasn’t spiked a whole lot more, given reality at the grocery store.
Energy costs (weighing 7.3% in the overall CPI) spiked by 1.3% for the month and by 24.8% year-over-year. Within the category:
- Gasoline +1.2% for the month, +42.1% year-over-year
- Utility natural gas to the home: +2.7% for the month, +20.6% year-over-year
- Electricity service: +0.8% for the month, +5.2% year-over-year.
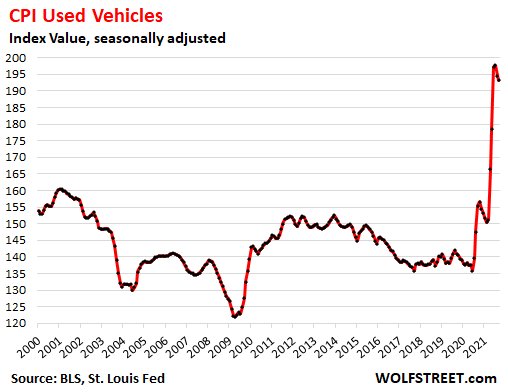
The CPI for used cars and trucks fell by 0.7% for the month, the second decline from the ridiculous spike, but was still up by 24.4% year-over-year. This is based on retail prices at dealers.
But wholesale prices, after dropping for three months in a row, spiked to a new crazy record in September and are set to rise further in October. Wholesale prices lead retail prices by a month or two, so the used vehicle CPI may U-turn in a month or two, just like wholesale prices did with a vengeance in September.
This chart shows the index value (not year-over-year percent change), which essentially hadn’t increased in the prior two decades despite large price increases, thanks to the massive “hedonic quality adjustments” (explanation below). It took this crazy price spike to break the grip “hedonic quality adjustments” had on the index:
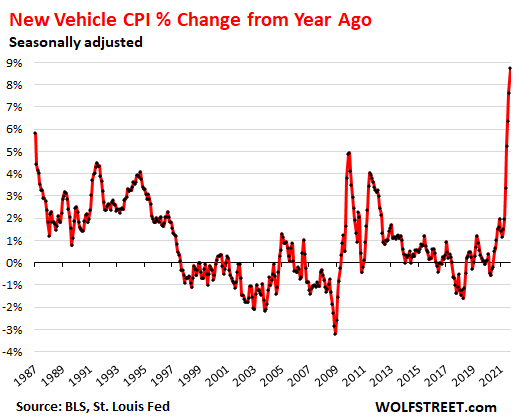
The CPI for new cars and trucks spiked by 1.3% for the month and by 8.8% year-over-year, the most since 1980 during the massive bout of inflation at the time.
Inflation Whac-A-Mole: Just as the used vehicle CPI ticks down, the new vehicle CPI spikes. This is how inflation spirals through the economy, from category to category. This chart shows the year-over-year change:
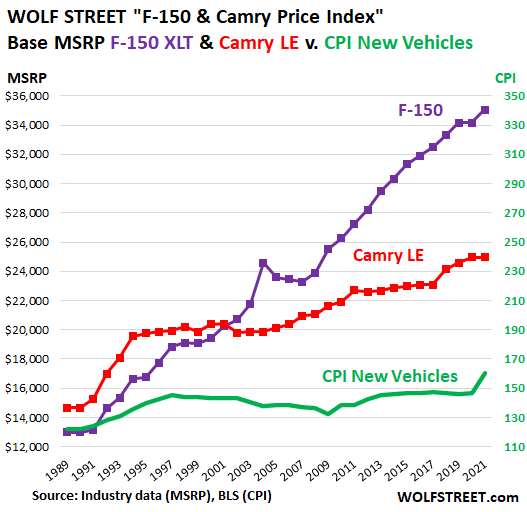
And the chart below shows the index itself (not year-over-year change) for new cars and trucks. As everyone knows, prices of new vehicles surge year after year. But aggressive application of “hedonic quality adjustments” have held down the CPI for new cars and trucks, with the index level in 2019 not far higher than in 1996. But even those aggressive hedonic quality adjustments were no match for the price spike this year:
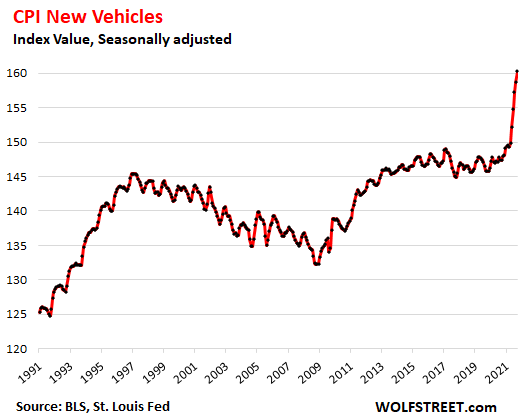
What are “hedonic quality adjustments?” CPI attempts to measure the loss of the purchasing power of the dollar with regards to the same item over time. When the price increases because the product gets better, the portion of the price increase related to the improvement of the product isn’t considered loss of purchasing power. And this makes sense: Pay more for a better product.
In terms of cars and trucks, these improvements have been dramatic, for example, the move over the years from a three-speed automatic transmission to a 10-speed electronically controlled transmission today.
In the end, inflation indexes are political devices, decided by politics, for political purposes – underplaying the actual loss of purchasing power of the dollar and the purchasing power of people’s earnings. Even if the understatements are fairly small each year, they massively compound over the decades. Every government over the past decades adhered to this strategy religiously.
My F-150 and Camry Price Index illustrates how prices have soared, even as the CPI for new cars and trucks (green line) remained nearly flat until the current spike.
Source: by Wolf Richter | Wolf Street
