
The numerous outfits that attempt to measure home price levels and movements in the US all come up with different numbers, and often frustratingly so, in part because they measure different things. Some measure actual cities, others measure the often multi-county area of the entire metroplex. So the absolute price levels differ, and timing may differ as well, but the movements are roughly the same.
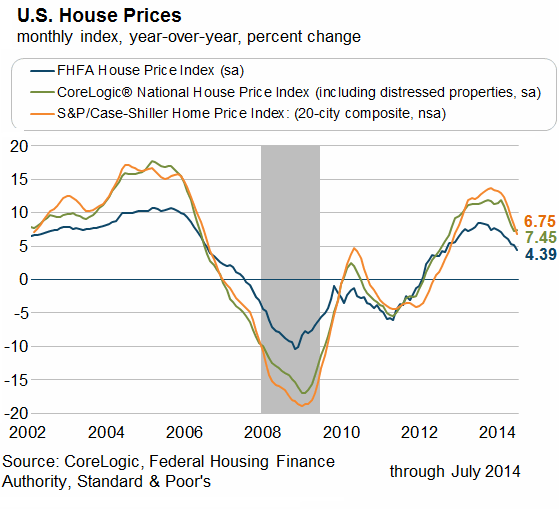
The chart by the Atlanta Fed overlays three of the major real estate data series – the Federal Housing Finance Agency’s House Price Index, the CoreLogic National House Price Index, and the S&P/Case Shiller Home Price Index (20-city). And one thing is now abundantly clear:
Year over year, home-price increases are fading from crazy double digit gains last year toward….?
Note the great housing bubble that the Greenspan Fed instigated with its cheap-money policies that then led to the financial crisis. It was followed by a hangover.
And the show repeats itself:
The ephemeral bump in home prices in 2010 and 2011 was a result of federal and state stimulus money (via tax credits) for home buyers. It was followed by a hangover.
The hefty home price increases of 2012 and 2013 were nourished by investors, including large Wall Street firms with access to nearly free money that QE and ZIRP made available to them. They plowed billions every month into the buy-to-rent scheme. When prices soared past where it made sense for them, they pulled back. And now the hangover has set in.
There is no instance in recent history when home prices soared like this beyond the reach of actual home buyers, then landed softly on a plateau to somehow let incomes catch up with them. Despite the well-honed assurances by the industry, there is no plateau when home prices are inflated by outside forces. When these forces peter out, the hangover sets in.
How long the current hangover will last and how far prices have to drop before demand re-materializes even as interest rates are likely to be nudged up remains a guessing game. So far, prices are still up on a national basis year over year. But in some areas, price changes have started to go negative on a monthly basis. And the trend has been relentless.
Someday perhaps, governments and central banks will figure out that every stimulus and money-printing binge is followed by a hangover. And when that hangover gets painful, suddenly there are new screams for more stimulus and another money-printing binge, regardless of what will come as a result of it, or after it fades.

You must be logged in to post a comment.