
https://www.thedailydoom.com/p/the-deeper-dive-where-are-we
Summery article about the following podcast from December 5th, 2023 that describes everything leading up to today’s frozen real estate market and probable circumstances that will break the ice wall during 2024 and 2025.
Tag Archives: housing market
The Move In Mortgage Rates From 7% To 11% Will Be More Painful Than The Move From 3% To 7%.
National Average U.S. Homeowner Equity Drops For First Time Since 2012
The housing bull market has peaked for now. Recent home price declines are leading to decreased tappable equity for homeowners.
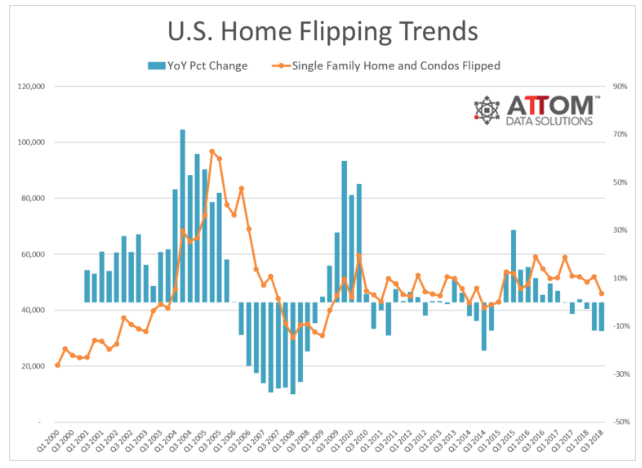
Foreclosures JUMP as Lending Tightens to New All Time RECORD
The 2023 housing market continues its correction, with home prices now falling month over month and year over year according to the National Association of Realtors. On top of that foreclosure starts increased 20% month over month and 22% year over year, and more importantly the speed of the foreclosure process through completion increased 12% quarter over quarter. Additionally JP Morgan sent out a note informing us that lending conditions have now tightened faster than they did during the great financial crisis, with the full effects not being felt until late 2023 or early 2024.
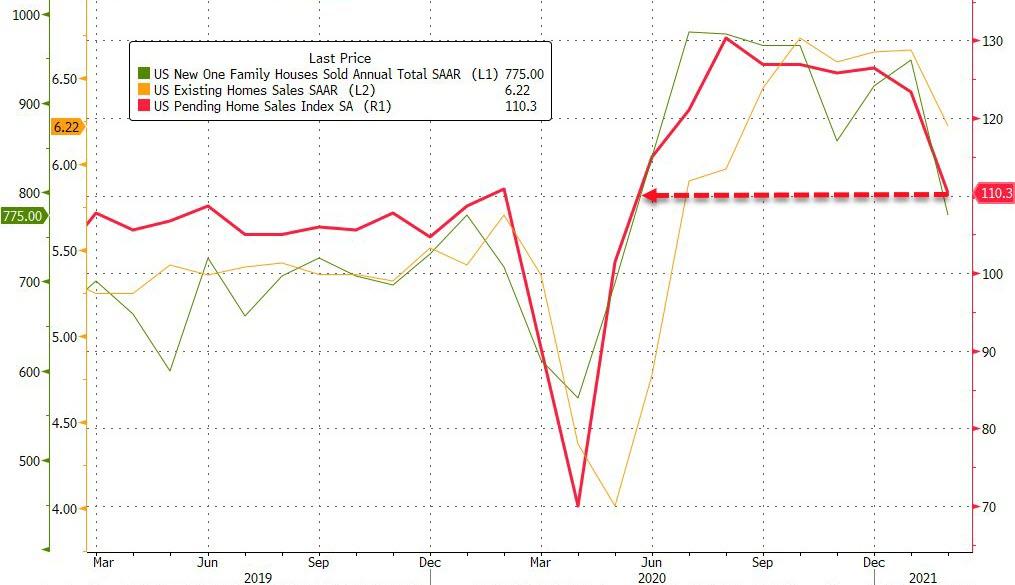
US January YoY Home Sales Down Record 37%, Median Price Up 1.5%, Lowest Since 2012
Existing home sales had fallen for a record 11 straight months ahead of this morning’s print for January, which consensus expected to reveal a 2% MoM rebound. However, existing home sales for January actually tumbled 0.7% MoM (well below the 2.0% jump expected) and the record 12th straight monthly decline with December’s 1.5% decline actually revised even worse to -2.2% MoM…

San Francisco Bay Area Housing Market Crashes, Prices Plunge 35% from Crazy Peak: Where’s Demand Supposed to Come From?
In the first 10 months of Housing Bust 2 (now), the median price plunged a lot faster than in the first 10 months of Housing Bust 1 (2007-11).
About 1 In 12 Mortgaged Homes Purchased in 2022 Have Already Slipped Underwater
A clear bifurcation of risk emerged between mortgaged homes purchased relatively recently versus those bought early in or prior to the pandemic: Black Knight

(Connie Kim) Home price corrections exposed a growing pocket of equity risk concentrated among purchase mortgages originated in 2022, Black Knight said in its latest mortgage monitor report. Of all homes purchased with a mortgage in 2022, 8% are now at least marginally underwater.
Of the 450,000 underwater borrowers at the end of the third quarter, nearly 60% of the mortgages originated in the first nine months of 2022, according to Black Knight. In total, 5% of all mortgages originated so far this year are now marginally underwater, with another 20% in low equity positions.
72% Of Millennials Have Regrets About Homes They Overpaid Or Settled For In 2021 And 2022
As new inventory is finally starting to hit the market and demand has temporarily slowed down thanks to rising rates, the housing expansion between March 2020 and now is still very likely to go down in history as blowing unprecedented amounts of air into an unprecedented bubble.
And now we have the data to show it. Continue reading
Blackstone Prepares A Record $50 Billion To Snap Up Real Estate During The Coming Crash
The past two months have seen a barrage of negative news coverage focusing on the US housing market…
3rd Look at Local Housing Markets in June, Sales Down Sharply, Inventory “Surged”
Today, in the Calculated Risk Real Estate Newsletter: 3rd Look at Local Housing Markets in June, Sales Down Sharply, Inventory “Surged”
A brief excerpt: Continue reading
Sharp Decline in Pending Sales, Inventory Surges In California
“Real Estate Tech” in Existential Crisis
“Real Estate Tech” in Existential Crisis as Housing Sours, Stocks Plunge, New Money Out of Reach: Redfin & Compass Try to Survive by Cutting Staff. Opendoor, Zillow Sag
In short, the party ran out of bamboozle.
Housing Bubble Getting Ready to Pop: Mortgage Applications to Purchase a Home Drop to Lockdown Lows, “Bad Time to Buy” Hits Record amid Sky-High Prices, Spiking Mortgage Rates
(Wolf Richter) This just keeps getting worse: Applications for mortgages to purchase a home dropped 7% for the week, and were down 21% from a year ago, the Mortgage Bankers Association reported today. An indicator of future home sales: Potential homebuyers try to get pre-approved for a mortgage, lock in a mortgage rate, and then start house-hunting.
Mortgage rates have soared this year, and home prices have soared for years to ridiculous levels, causing layers and layers of potential buyers to abandon the market, amid “worsening affordability challenges,” as the MBA called it. And these applications to purchase a home hit the lowest point since the depth of the lockdown in April 2020 (data via Investing.com):
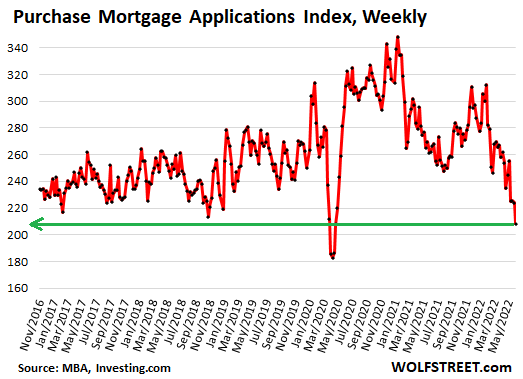
The MBA’s Purchase Mortgage Applications Index has now dropped below the lows of late 2018. By November 2018, the Fed had been hiking rates for years (slowly), and its QT was in full swing, and mortgage rates had edged above 5%, which was enough to begin shaking up the housing market. Home sales volume slowed, prices began to come down in some markets, and stocks were selling off. But with inflation below the Fed’s target, and with Trump, who’d taken ownership of the Dow, constantly throwing darts at Powell, the Fed signaled in December 2018 that it would cave, and instantly mortgage rates began to fall, and volume and prices took off again.
Today, raging inflation is the #1 economic issue, and the Fed is chasing after it, with backing from the White House, and so this issue in the housing market is just going to have to play out.
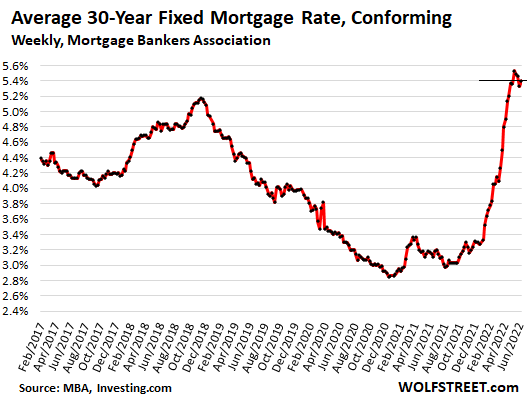
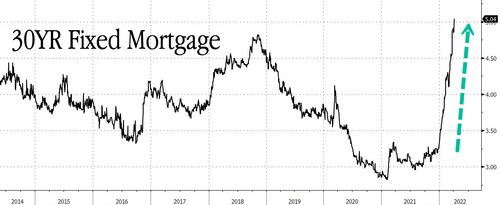
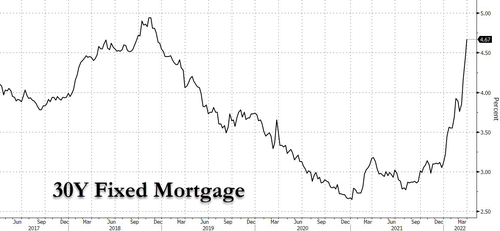
Holy-Moly Mortgage Rates.
The average 30-year fixed mortgage rate with conforming balances and 20% down rose to 5.40% this week, according to the MBA today, having been in this 5.4% range, plus or minus a little, since the end of April, the highest since 2009.
I call them holy-moly mortgage rates because that’s the reaction you get when you apply this rate to figure a mortgage payment for a home at current prices and then accidentally look at the resulting mortgage payment (data via Investing.com):
“Bad time to buy a home.”
Turns out, sky-high home prices to be financed with holy-moly mortgage rates, plus uncertainty about the economy, dropping stock prices, and inflation eating everyone’s lunch make a toxic mix for homebuyers.
The percentage of people who said that now is a “bad time to buy” a home jumped to 79%, another record-worst in the data going back to 2010, according to Fannie Mae’s National Housing Survey for May. Sentiment has been deteriorating since February 2021:
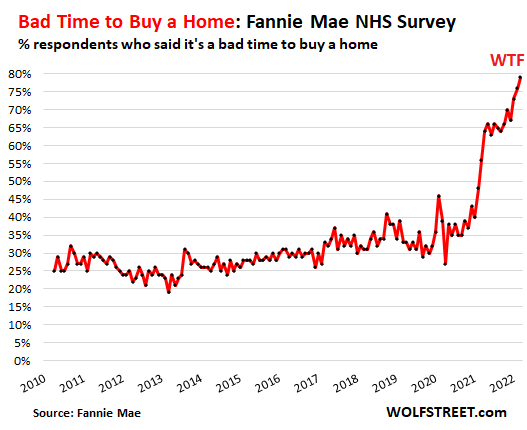
“Consumers’ expectations that their personal financial situations will worsen over the next year reached an all-time high in the May survey, and they expressed greater concern about job security,” according to Fannie Mae’s report.
“These results suggest to us that increased mortgage rates, high home prices, and inflation will likely continue to squeeze would-be home buyers – as well as those potential sellers with lower, locked-in mortgage rates – out of the market, supporting our forecast that home sales will slow meaningfully through the rest of this year and into next,” said Fannie Mae.
Sagging stock prices keep getting blamed.
The stock market is on the front pages every day. Only a small percentage of Americans own any significant amount of equities, but that doesn’t matter. Stock market declines, with many high-flying stocks plunging 70% or 80% or even 90% since February 2021, have rattled a lot of nerves. Which is in part why Fannie Mae pointed out, “consumers’ expectations that their personal financial situations will worsen over the next year reached an all-time high.”
The MBA also had previously pointed at the financial markets as one of the reasons for the plunge in purchase mortgage applications.
In the tech and social media sector, the big declines in stock prices have now triggered the first hiring freezes and a few layoffs. And this too – just the idea of nirvana being somehow over – is shaking up some folks.
Sharp increases in stock portfolios, stock options from employers, or cryptos empowered potential homebuyers and enabled many to borrow against their portfolios to come up with down payments. This option has either vanished or is looking very shaky for many.
Refi applications collapsed to lowest since year 2000.
Applications for mortgages to refinance an existing mortgage dropped another 6% for the week, and have collapsed by 75% from a year ago, to the lowest level since the year 2000, according to the MBA’s Refinance Mortgage Applications Index. The MBA obtains this data from a weekly survey of mortgage bankers.
With these holy-moly mortgage rates, just about the only reason to refinance is to extract cash from the home via a cash-out refi (data via Investing.com):
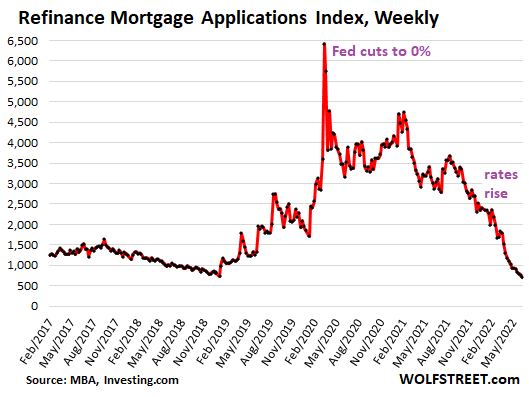
Cash-Out Refi mortgage applications.
According to the AEI Housing Center, which tracks mortgage applications by the number of rate locks, no-cash-out refi applications have collapsed by 92% from a year ago. But cash-out refi applications are primarily driven by the desire to extract cash from a home, with mortgage rates being a secondary issue – and so they continue but a slower pace.
Cash out refi applications in week through May 30 (black line) plunged by 42% from the same week in 2021 and have stabilized roughly level with 2019:
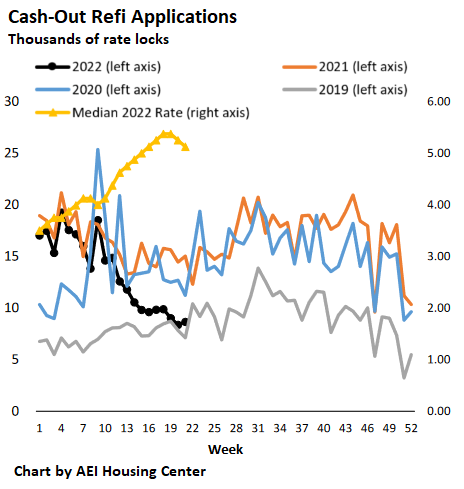
A cash-out refi provides a big lump sum for the homeowner to spend on all kinds of things, from cars to home improvement projects. They are also used to pay off high-cost debts, such as credit cards so that these credit cards can then be used for more purchases. The plunge in cash-out refi reduces the availability of these lump-sums, and therefore reduces the stimulus to the economy they provide.
No-cash-out refi mortgages at lower mortgage rates also boost consumer spending, as the lower rates reduce payments that then leave some extra every month to spend on other stuff. But the spike in mortgage rates, and the subsequent 92% collapse of no-cash-out refi mortgage applications ends this program.
Source: by Wolf Richter | Wolf Street
***
George Gammon: Thinking of buying a house? Stop and watch this first – MS
US housing implosion about to start – Market Sanity
Bank of America declares ‘technical recession’ – NTD
Inflation, consumer woe add to worries that recession is already here – CNBC
“Warning flags are everywhere” – ECB, inflation and U.S. stocks – QTR
Bond market rout so severe double-digit losses are the norm – Yahoo!
Get ready for currency collapses – King World News
Housing Market: Could This Be Worse Than 2008?
“Conditions are changing really fast”
Nick Gerli, in his interview with Wealthion, alludes to a number of figures which spell trouble for the residential market. If you own real estate or we’re considering entering the market soon, it’s worth checking out:
“Major Turning Point” – US Housing Inventory Rises For First Time Since 2019
“Sellers are fueling this turnaround in inventory, with newly listed homes entering the market at a rate not seen since 2019.”
Are Real Estate Prices About To Crash?
No however, difficult is the way, narrow is the gate and in service to each other we will remain free.
Is Housing a Bubble That’s About to Crash?
(Charles Hugh Smith) We are all prone to believing the recent past is a reliable guide to the future. But in times of dynamic reversals, the past is an anchor thwarting our progress, not a forecast.
Are we heading into another real estate bubble / crash? Those who say “no” see the housing shortage as real, while those who say “yes” see the demand as a reflection of the Federal Reserve’s artificial goosing of the housing market via its unprecedented purchases of mortgage-backed securities and “easy money” financial conditions.
Cracks Appear In Housing Market As Sellers Begin To Lower Asking Prices
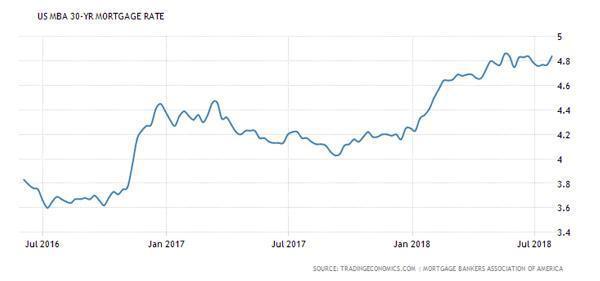
Over the last several weeks, readers have become aware of an emerging housing affordability crisis as US mortgage rates continued their near-vertical ascent, risks jeopardizing the housing market boom. The 30 Year fixed mortgage rate has jumped a staggering 177bps this year, reaching the highest since 1Q10, with Bankrate data showing mortgage rates are above 5%.
Rate Hikes Jeopardize Much More Than Just American Home Ownership
(J.G. Collins) Someone once said that you never actually “buy” a home. Instead, you merely commit to paying an annuity: the mortgage.
That’s largely true. The price and “value” of homes for the overwhelming majority of homeowners is a function of home buyers’ ability to make payments.
And with the Federal Reserve signaling further interest rate hikes, home buyers and sellers—and assorted others who use credit—will incur knock-on effects from those increases.
Biggest Housing Affordability Shock In History Incoming
30 Year fixed mortgage rates have jumped 160bp this year, reaching the highest since November 2018, with the latest Freddie Mac data showing an acceleration in mortgage rates which jumped a quarter point in just the past week, from 4.42% to 4.67%. This is an even bigger increase than we discussed in our recent housing comment.
And while the benchmark 10y Treasury yield has also risen, the increase is “only” 94bp. In other words, there has also been a significant widening in mortgage spreads, by 66bp to 243bp. This could be explained by the Fed’s accelerated pivot from QE to QT, the latter of which we expect will be announced at the next FOMC meeting in May.
As discussed one week ago in “Housing Affordability Is About To Crash The Most On Record“, the move higher in rates means that an already record affordability shock will be even worse! Continue reading
Welcome to the Death Zone
Do you own a house? Do you rent?
Bidding Wars For Homes Fall To Lowest Level This Year
(Jacob Passy) The frequency of bidding wars on homes has dropped to the lowest level this year — the latest sign that the housing market may be cooling and reverting back to its usual seasonal patterns.
While home buyers are still more likely than not to face a bidding war on a property they wish to purchase, competition in the nation’s housing market is cooling. GETTY IMAGES/ISTOCKPHOTO

A new report from Redfin RDFN, -2.39% found that 58.8% of the offers on homes written by the company’s real-estate agents faced competition in August. That’s down from 62.1% the month prior and a peak of 74.3% reached back in April. Redfin defines a bidding war as any situation where there are at least two competing bids on a home.
The Cheapest Housing Lots For Sale In San Francisco Are Entirely Under Water

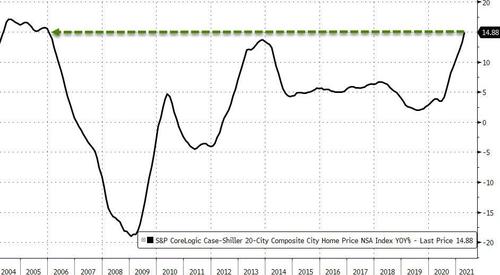
U.S. Home Prices Just Accelerated At Their Fastest Pace On Record
According to the Case-Shiller indices, home prices in America’s 20 largest cities have exploded at 14.88% YoY in April – the highest since Nov 2005…
Home Prices Soar 18% To All Time High; A Record 58% Of Houses Sell Within Two Weeks Of Listing
As if the official government data on soaring home prices wasn’t crazy enough, the latest monthly data from RedFin shows that in April, homes sold at their fastest pace on record with nearly half off-market within one week.
Pending Home Sales Drop For 2nd Month In A Row; Weather, Rates, Inventory Blamed
Following the unexpected plunge in new- and existing-home sales, analysts expected a 3.0% MoM drop in pending home sales to round out the dismal housing data in February. Instead – mimicking the huge drops in other segments of the housing market, pending home sales crashed 10.6% MoM (the biggest drop since April). Worse still, pending home prices are now back down 2.7% YoY…
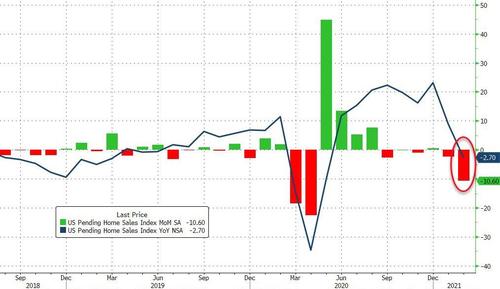
That completes the triple whammy of collapse in the home sales market…
 Source: Bloomberg
U.S. Home Prices Are Soaring At The Fastest Pace In 7 Years
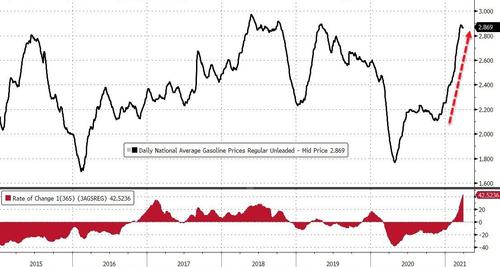
Don’t worry, there’s no inflation – apart from in gas and home prices. According to AAA, gas prices at the pump are back near their highest in 6 years, up a stunning 42% YoY…
 Source: Bloomberg
Continue reading
Red Hot: Sacramento House Receives 122 Offers In Two Days
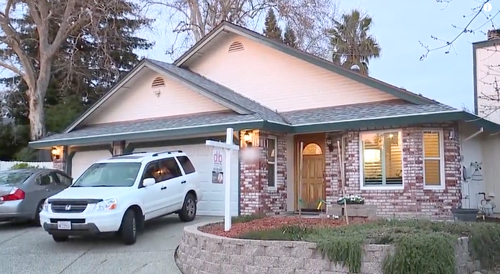
The housing boom unleashed by the Federal Reserve during the pandemic was built on historically low mortgage rates (thanks Powell), low inventory, city-dwellers moving to rural areas, and remote-work phenomenon. In the latest installment of the desperate frenzy of buyers fleeing for suburban life in California, one home received 122 offers in just two days.
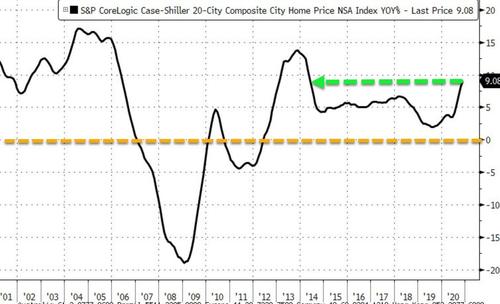
U.S. Home Prices Soar At The Fastest Pace In 7 Years
After surged in October, US home prices (as measured by S&P CoreLogic Case-Shiller index of property values) was expected to accelerate further as a low inventories of listings and solid demand, fueled by cheap borrowing costs, have given sellers more leeway to raise asking prices. And it did not disappoint as November (the latest data) showed the 20-City Composite Home Price Index soared 9.08% YoY… the fastest pace since May 2014.
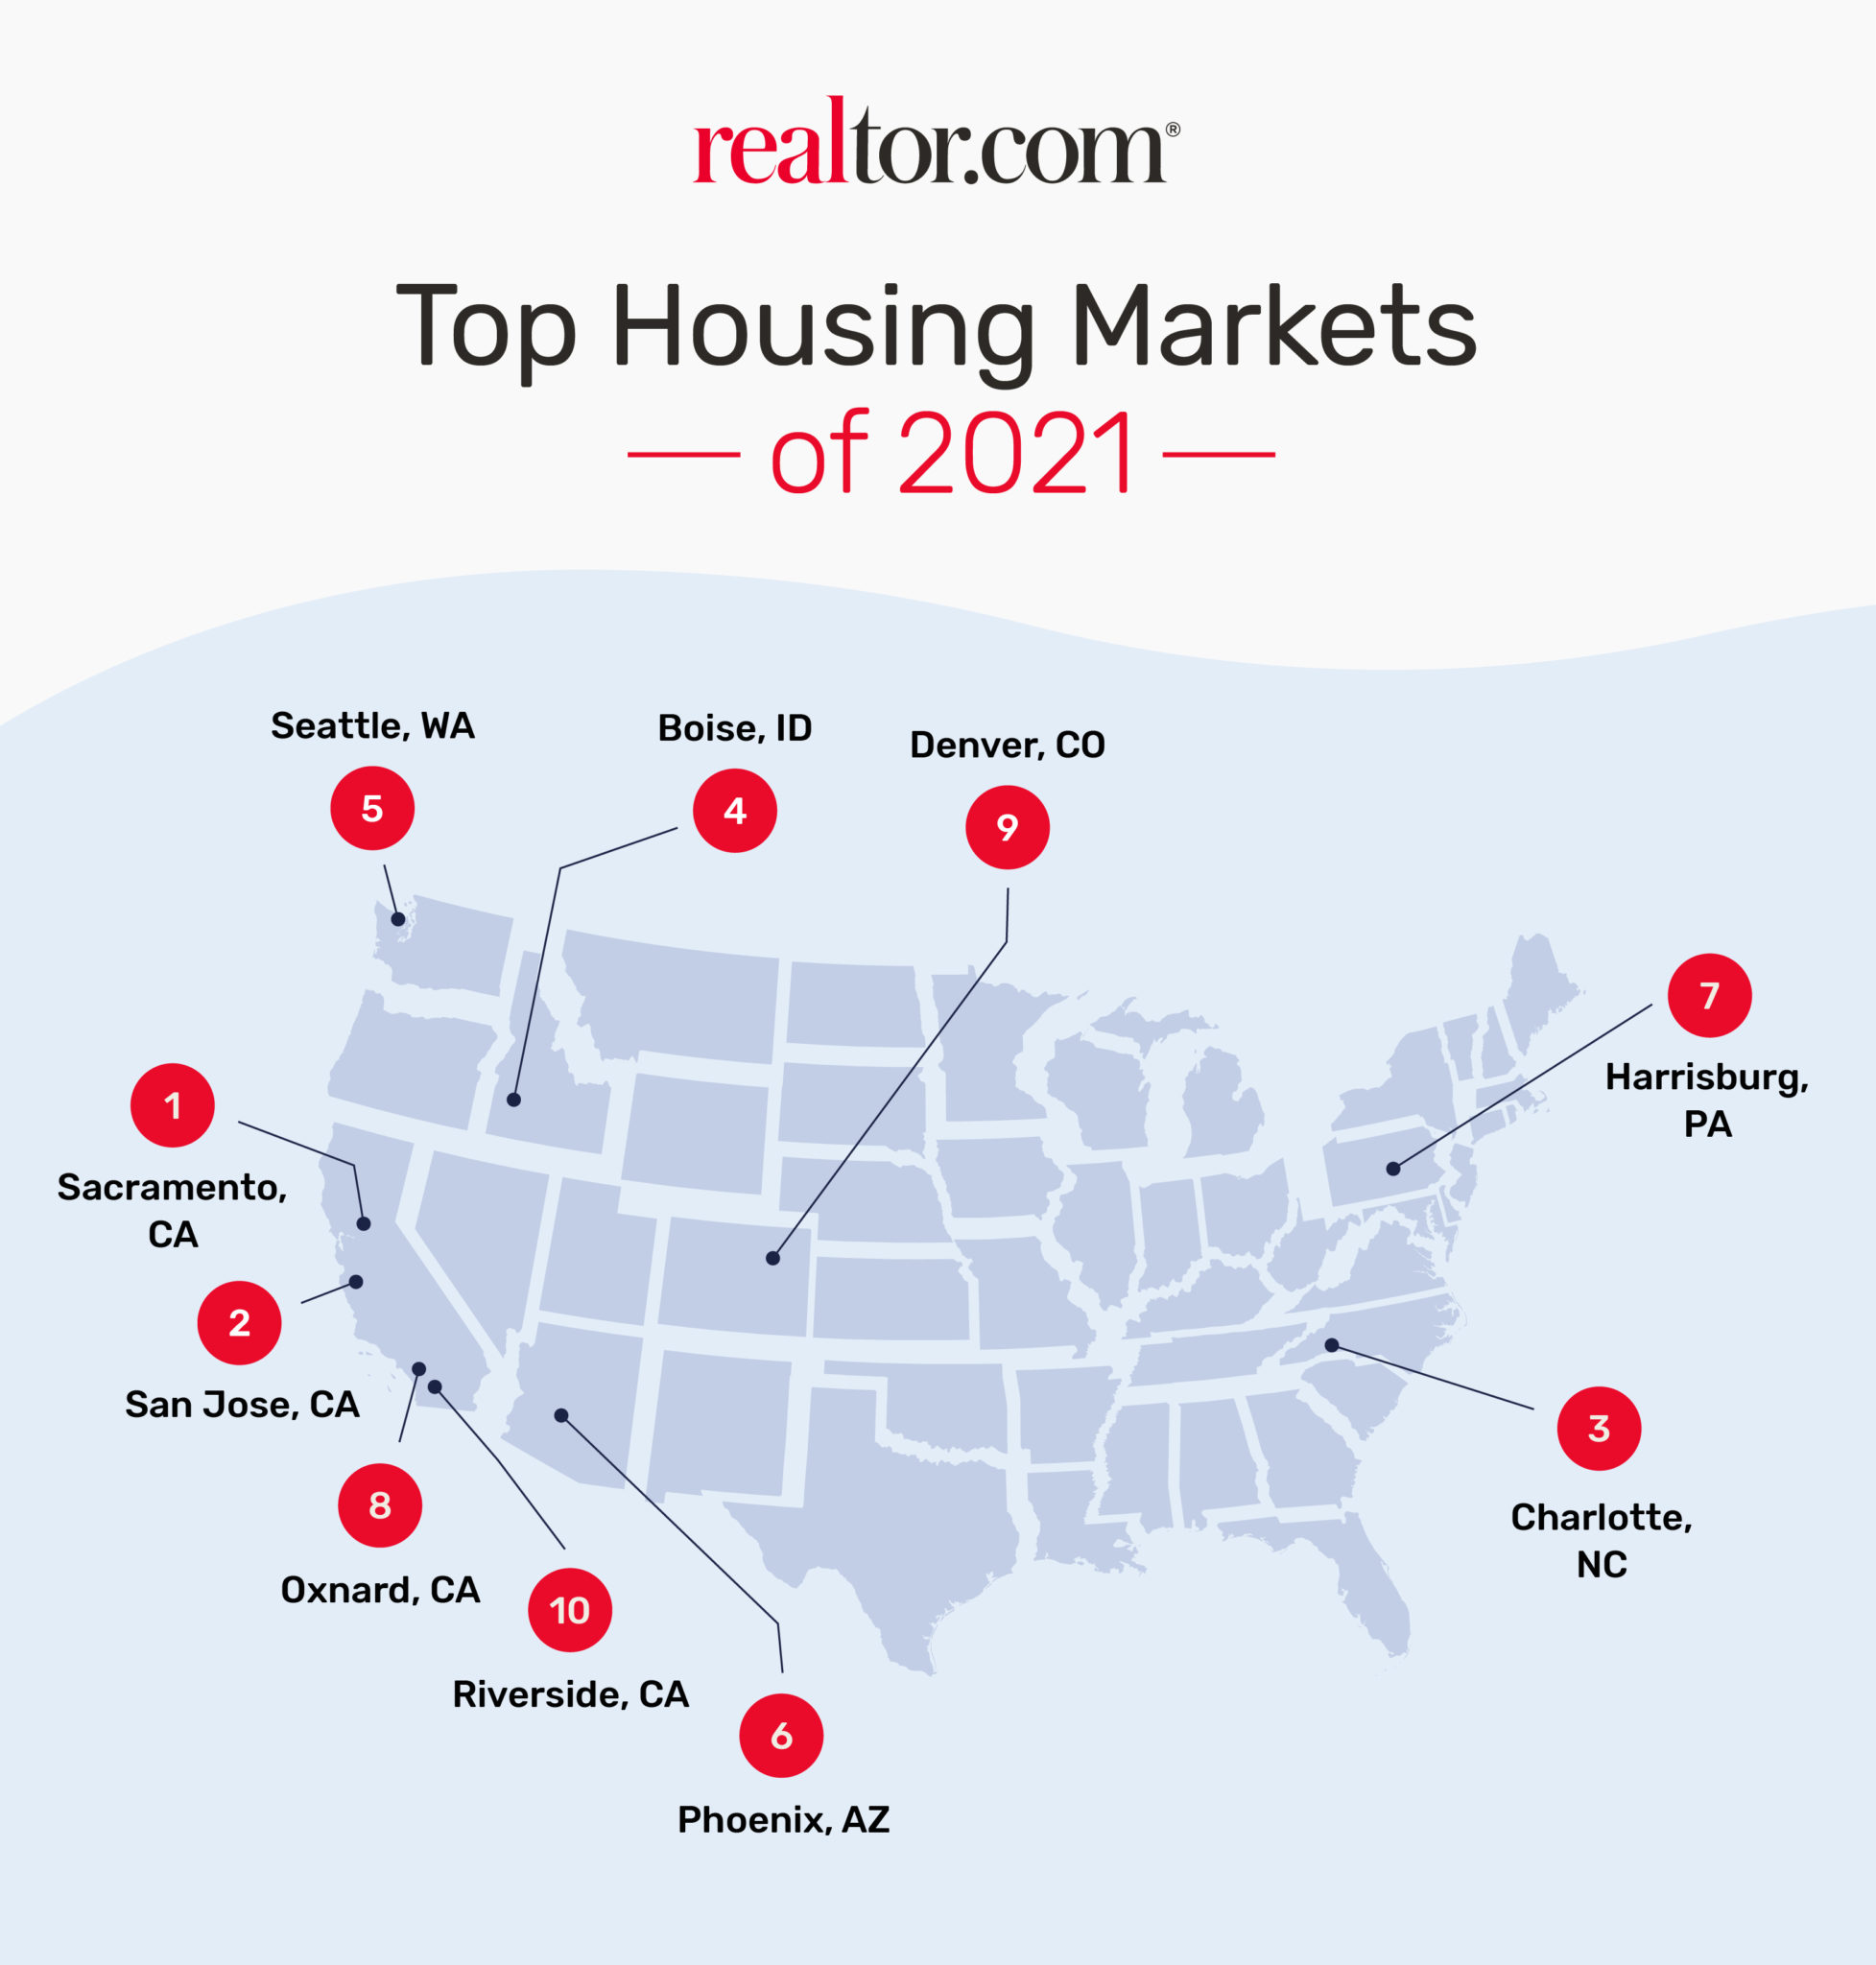
Top Housing Markets For 2021

The Fed Can No Longer Exit The Mortgage Market Without Causing a Housing Crisis
Liquidity must remain high, mortgage rates must remain suppressed and forbearance must be extended or poof, there goes the housing market. Continue reading
A Tale Of Two Housing Markets: Mortgage Delinquencies Spike 450%, Yet Refis Boom With Low-Principal Loans
As we noted last month, the US housing market is reflecting the extremes of the economy right now – between those who can’t make ends meet due to the pandemic, and those who are either still employed, are sitting on a pile of equity, or both.
One one end of the spectrum you’ve got affluent borrowers locking in record-low rates, while mortgage originations reached a record $1.1 trillion in the second quarter as rates on 30-year mortgages dipped below 3% for the first time in history in July, according to Bloomberg.
Meanwhile, refis may just be getting started.
There are still nearly 18 million homeowners with good credit and at least 20% equity who stand to cut at least 0.75% off their current rate by refinancing, according to Ben Graboske, president of Black Knight data and analytics.
“We would expect near-record-low interest rates to continue to buoy the market,” he said in a statement Tuesday. –Bloomberg
What’s impressive is that the quarterly spike in new mortgage originations occurred while under nationwide public health measures that restricted home showings, appraisals, and in-person document signings, according to the report. That said, refis accounted for around 70% of home loans issued during the period.
Also notable is that the average loan-to-value ratio is above 90%, as borrowers are having no trouble securing loans with just 10% or less down.
At the other end of the spectrum, mortgage delinquencies are up 450% from pre-pandemic levels, with around 2.25 million mortgages at least 90 days late in July – the most since the credit crisis, according to Black Knight, Inc.
“The money is in the homes and people with college education are still working, but the pain is being felt where people are unemployed,” said Wharton real estate professor, Susan Wachter, adding “COVID-1984 will drive an increase in the already high income-inequality gap, and wealth inequality, actually, which is much more extreme.”
While the unemployment rate fell to 8.4% in August, more than 11 million jobs were still lost in the pandemic, the Labor Department reported last week. Supplemental benefits for the unemployed of $600 a week expired in July and Congress has been at an impasse over a follow-up aid package. –Bloomberg
More findings from Black Knight (via Bloomberg):
- More borrowers with ability to refinance are using their equity to get cash. About $44.5 billion in equity was tapped through cash-out refinancing in the second quarter, the most in more than a decade.
- Markets with the biggest delinquency increases in July were Miami, Las Vegas, Orlando, New York and New Orleans.
- The number of homeowners in forbearance continued to fall last week and is down by 1 million from its May peak. But the July 31 expiration of extra unemployment benefits means this month “may provide the true test,” Black Knight said in a Sept. 4 report.
- Homeowners with less equity and lower credit quality were more than twice as likely to have entered forbearance plans. About 11.5% of loans by the Federal Housing Administration and Department of Veterans Affairs were in forbearance last week, compared with 5.1% for Fannie Mae and Freddie Mac borrowers, who have better credit and more equity in their houses.
Pending Home Sales Plummet 35% YoY – Biggest Drop Ever As Buyers Forfeit Deposits
Existing home sales collapsed but new home sales rebounded in April, which leaves pending home sales to break the tie and analysts expected a 17.3% MoM drop. However, pending home sales disappointed notably with a 21.8% MoM collapse, sending YoY sales crashing 34.6% – the most ever…
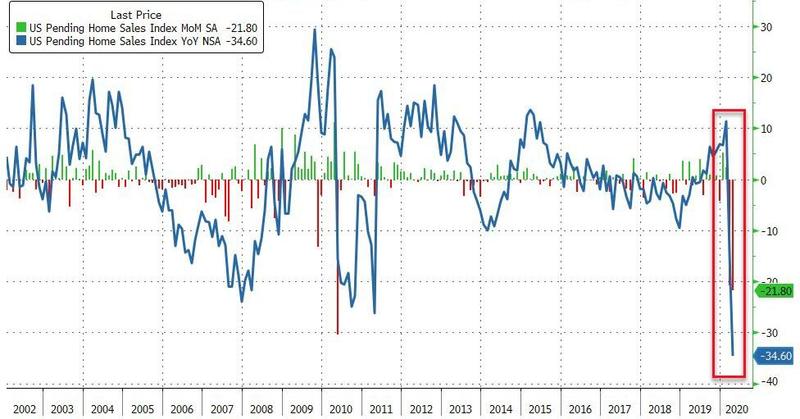
“The housing market is temporarily grappling with the coronavirus-induced shutdown,” which reduced listings and purchases, Lawrence Yun, NAR’s chief economist, said in a statement.
So while all sorts of narratives about lower rates were puked out to defend new home sales outlier data, it seems pending home sales did not get the message…

Every region crashed…
- Northeast fell 14.5%; Feb. rose 2.8%
- Midwest fell 22%; Feb. rose 4.2%
- South fell 19.5%; Feb. fell 0.2%
- West fell 26.8%; Feb. rose 5.1%
That is the lowest level of pending home sales since records began in 2001…
Weekly Mortgage Applications Point To A Remarkable Recovery In Home Buying
If mortgage demand is an indicator, buyers are coming back to the housing market far faster than anticipated, despite coronavirus shutdowns and job losses.

(CNBC) Mortgage applications to purchase a home rose 6% last week from the previous week, according to the Mortgage Bankers Association’s seasonally adjusted index. Purchase volume was just 1.5% lower than a year ago, a rather stunning recovery from just six weeks ago, when purchase volume was down 35% annually.
“Applications for home purchases continue to recover from April’s sizable drop and have now increased for five consecutive weeks,” said Joel Kan, an MBA economist. “Government purchase applications, which include FHA, VA, and USDA loans, are now 5 percent higher than a year ago, which is an encouraging turnaround after the weakness seen over the past two months.”
As states reopen, so are open houses, and buyers have been coming out in force, if masked. Record low mortgage rates, combined with strong pent-up demand from before the pandemic and a new desire to leave urban down towns due to the pandemic, are driving buyers back to the single-family home market. It remains to be seen if this is simply the pent-up demand or a long-term trend.
Buoying buyers, the average contract interest rate for 30-year fixed-rate mortgages with conforming loan balances of up to $510,400 decreased to 3.41% from 3.43%. Points including the origination fee increased to 0.33 from 0.29 for 80 percent loan-to-value ratio loans.
Low rates are not, however, giving current homeowners much incentive to refinance. Those applications fell 6% for the week but were still 160% higher than one year ago, when interest rates were 92 basis points higher. That is the lowest level of refinance activity in over a month.
“The average loan amount for refinances fell to its lowest level since January — potentially a sign that part of the drop was attributable to a retreat in cash-out refinance lending as credit conditions tighten,” said Kan. “We still expect a strong pace of refinancing for the remainder of the year because of low mortgage rates.”
Federal regulators this week changed lending guidelines for Fannie Mae and Freddie Mac, allowing refinances on loans that were or still are in the government’s mortgage bailout, part of the coronavirus relief package. Those loans can be refinanced once borrowers have made at least three regular monthly payments. Given tough economic conditions and rising unemployment, more borrowers may be looking to save money on their monthly payments.
Weaker refinance demand pushed total mortgage application volume down 2.6% for the week.
The refinance share of mortgage activity decreased to 64.3% of total applications from 67% the previous week. The share of adjustable-rate mortgage activity increased to 3.2% of total applications.
Consumer Confidence In Housing Falls To Lowest Level Since Subprime Crash
The economic free fall from Covid-19 is taking its toll on what had been very strong housing demand and sentiment just a few months ago.
After falling sharply in March, housing confidence among consumers took an even deeper dive in April, according to the Fannie Mae Home Purchase Sentiment Index. It was the lowest level since November 2011. Back then, the market was reeling from the subprime mortgage crisis, with home prices cratering and foreclosures rampant.
Consumers suddenly have a much more pessimistic view of buying and selling conditions. In addition, more consumers said their household income is now significantly lower than it was a year ago.
“Individuals’ heightened uncertainty about job security, as registered in the survey over the last two months, is likely weighing on prospective home buyers, who may be more wary of the substantial, long-term financial commitment of a mortgage,” said Doug Duncan, chief economist at Fannie Mae.
This comes even as interest rates are hovering near record lows. And that is helping to keep buyer sentiment slightly ahead of seller sentiment: 46% of those surveyed said it was a bad time to buy a home, while 65% said it’s a bad time to sell a home.
“We expect that the much steeper decline in selling sentiment relative to buying sentiment will soften downward pressure on home prices,” added Duncan.
On average, consumers said they expect home prices to fall 2% over the next 12 months, the lowest expected growth rate in the survey’s history, which dates to 2010.
Home sales have already fallen sharply, and active listings were down 15% annually in April, according to realtor.com. Sellers also pulled their homes from the market, as social distancing measures went into place.
Signs of a rebound?
The numbers are expected to get worse in May, but there is still some demand in the market. Agents in states that are starting to reopen are hosting open houses again, and online searches are rising.
Three in 4 potential sellers said they are preparing to sell their homes following the end of stay-at-home orders, according to a new survey from the National Association of Realtors.
“After a pause, home sellers are gearing up to list their properties with the reopening of the economy,” said Lawrence Yun, NAR’s chief economist. “Plenty of buyers also appear ready to take advantage of record-low mortgage rates and the stability that comes with these locked-in monthly payments into future years.”
Home buying and selling will likely vary dramatically by location, as some harder-hit areas stay closed while others reopen. Sales will still be limited by the tight supply of homes for sale. Even before the pandemic struck, the market was incredibly lean.
US Home Price Gains Slump For 12th Straight Month, Weakest In 7 Years
Case-Shiller’s March home price index showed yet another deceleration in growth – the 12 months in a row of slowing equals the 2014 growth scare’s length but is the weakest growth since July 2012.
After February’s 20-City Composite 3.00% YoY print, expectations were for 2.55% growth in March and it surprised very modestly with a 2.68% YoY print (still the lowest in 7 years)…
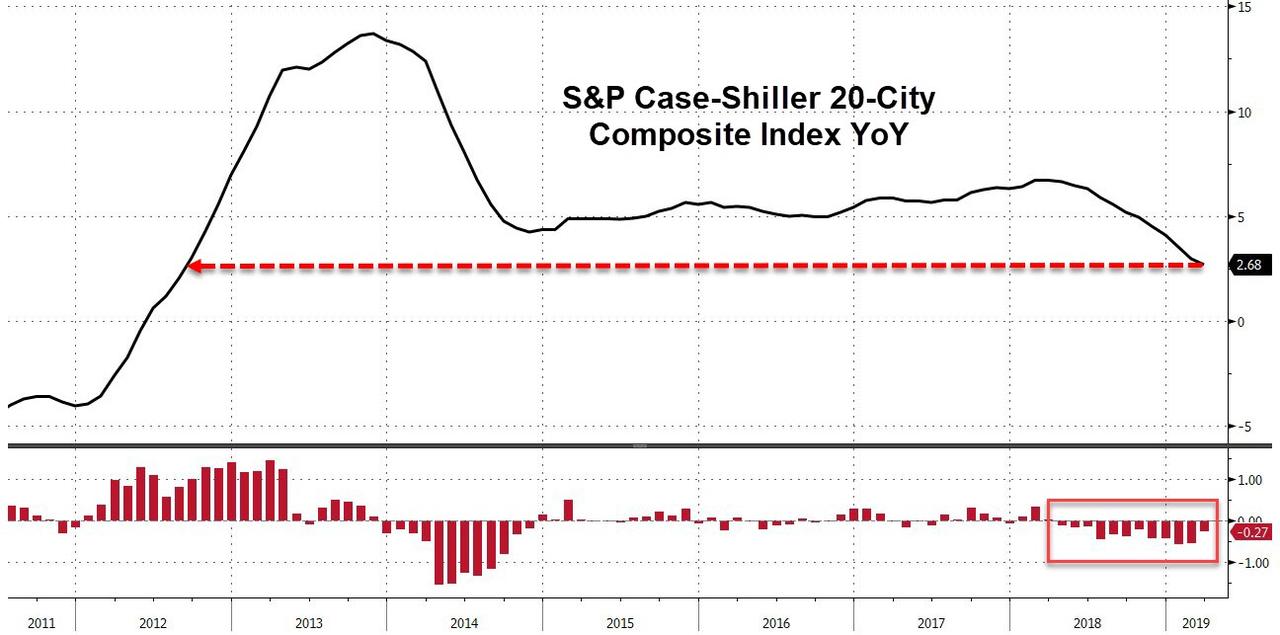
Nationally, home-price gains slowed to a 3.7% pace.
“Given the broader economic picture, housing should be doing better,” David Blitzer, chairman of the S&P index committee, said in a statement.
“Measures of household debt service do not reveal any problems and consumer sentiment surveys are upbeat. The difficulty facing housing may be too-high price increases,” which continue to outpace inflation, he said.
While all 20 cities in the index showed year-over-year gains, five were below 2%: Chicago, Los Angeles, San Diego, San Francisco and Seattle, which a year ago posted a 13% increase. Las Vegas led the nation in March with an 8.2% gain, followed by Phoenix.
Existing Home Sales Tumble YoY For 14th Month – Worst Run Since Housing Crisis
Existing home sales were the odd one out in March (falling as new- and pending-home-sales spiked) but expectations were for a catch-up rebound in April, but did not, dramatically missing the expectation of a 2.7% rise by dropping (again) by 0.4% MoM…
This 0.4% decline comes after existing home sales fell 4.9% MoM in March with a tumbling mortgage rate seemingly not affecting the secondary market…
Single-family units fell 1.1% MoM but Condos/Co-ops jumped 5.6% in April (erasing March’s 5.3% drop).
Supply increased from 3.8 to 4.2 months (the highest since Oct 2018) as median prices jumped to their highest since July 2018.
Only The West saw an increase in sales (up 1.8% MoM) in April, with the Northeast worst, down 4.5% MoM.
Worse still, existing home sales are still down 4.4% year-over-year…

This is the 14th month in a row of annual declines – the longest stretch since the housing crisis over a decade ago…but that’s probably nothing!
Real Estate On New York City’s “Billionaire’s Row” 40% Unsold Due To “Unrealistic” Prices
The area known as “Billionaire’s Row” in Manhattan is becoming one of the biggest real estate gluts in all of the city. 40% of apartments in the area are now sitting unsold in towers that top out at 100 stories, according to the New York Post.
Only half a decade after the One57 building became the city’s first “supertall” residential skyscraper, only 84 of its 132 condos have been purchased. This means that more than a third of them are still on the market and none of them are under contract.
The story is the same down the road – six nearby buildings have as much of 80% of their units available, according to data, with the total value of all unsold inventory estimated to be between $5 billion and $7 billion.

And the supply glut is only going to get worse, as Central Park Tower, at 217-225 W. 57th St. is set to put an additional 179 apartments on the market next year. No deals for the new building have closed, which means if it opened today it would push the overall unsold percentage in the area to nearly 65%. Listings online show asking prices for units between $2.1 million and $64 million. Brokers are blaming the high prices for the sales drought.
Top broker Dolly Lenz said:
“When people come here from other parts of the country and from around the world, the first thing they want to see is Billionaires’ Row. We toured them through the properties but many felt they were too pricey for the market — $7,000, $8,000 and $10,000 a square foot.”
Lenz also said that these prices were caused by a combination of costs of property, construction, financing and high-end marketing, in addition to developers who have clauses in their contracts that keep lenders from forcing them to drop prices.

Many brokers feel pessimistic, expressing that the drought in Billionaire’s Row could telegraph a coming drought for the entire market. The Post provided a host of pessimistic quotes from brokers:
- “Empty buildings are never good for the city,” one broker said.
- “This happened in 1988 to 1992, when there were a glut of condos that didn’t sell. They were smaller and less expensive, but it led to bad times.”
- Another broker said the prospects for selling the vacant apartments were grim.
- “They are priced out of the constellation of buyers out there now,” the broker said.
- “It’s all a function of price. You can do the most spectacular marketing and offer the most incredible amenities, but it all comes down to price.”
- “There’s a whole food chain that relies on people living in these buildings,” one broker said.
One local resident said of the vacancies:
“To find out that people aren’t living in the condos is just, ugh. I wish this was all affordable housing. This really upsets me. So many are struggling in the city.”
An Extell spokeswoman disputed some data provided in the article, stating that One57 “is over 85 percent sold in units and over 90 percent sold in value.”
About one month ago, we reported that Manhattan’s housing market was on its “worst cold streak in 30 years”. We also took note of the rising prices that are pricing potential buyers – even the billionaires – out of the market.
By one broker’s count, Q1 marked the sixth straight quarterly drop in sales volume, the worst streak in at least 30 years.
Per the FT, sales tumbled by 11%, according to broker Stribling & Associates, by 5%, according to Corcoran, and by 2.7% for co-ops and condominium apartments, according to Douglas Elliman and real estate appraisal firm Miller Samuel.

While the average sales price for new developments climbed a staggering 89.4% to $7.6 million, that figure was exaggerated by a single purchase: Ken Griffin’s purchase of a $240 million penthouse at 220 Central Park South, which, according to some, was the most expensive home ever sold in America. But depending on the report, the median sales price ranged from 2% lower to 3.2% higher. And although the entry level market in Manhattan – that is, apartments priced at $1 million and below – had held up for most of the past year, it has recently started to suffer.
“It’s like a layer cake,” Jonathan Miller, CEO of Miller Samuel, told CNBC. “When you have softening at the top, it starts to melt into the next layer and the next layer after that, because those buyers further down have to compete on price.”
According to one broker, sellers with unrealistic expectations are the biggest barrier to sales, because they’re refusing to adjust for the fact that listings have been piling up and sitting on the market for longer periods, giving buyers more room to negotiate, and more options.
Inventory has climbed 9% over the past nine months, and there’s a glut in new developments that’s only going to get worse.
Where Home Prices Are Rising the Fastest (Slowest) In America
Since the end of the great recession, home prices in America have rebounded substantially. Since the dark days of 2009, prices have steadily climbed and are up over 50% on average from the lowest point.
This is great news for homeowners whose homes may be worth more than their pre-recession values, but less great news for homebuyers who can afford less house for the dollar. What’s more is that in some places, home prices have spiked much faster than average, while in other places, home prices have remained depressed.
So where in America are home prices increasing the fastest and the slowest? In light of fluctuating mortgage interest rates, tax reform that’s limited many homeowner deductions, and an affordability crisis in many urban areas, along with Priceonomics customer RefiGuide.org thought we’d dive deeper into the home price data published, aggregated and made available by Zillow.
Over the last year, the median home prices increased the fastest at the state level in Idaho, where prices increased by a staggering 17.2%. In just two states did home prices actually fall last year (Alaska and Delaware). The large cities with the fastest home appreciation were Newark, Dallas, and Buffalo where prices increased more than 15% in each place. The large city where prices decreased the fastest was Seattle, where home prices actually fell 2.4%.
Lastly, we looked at the expensive markets (where homes cost more than a million dollars) that had the highest price appreciation. St. Helena, CA, Quogue, NY and Stinson Beach, CA all had prices increase over 20% last year.
***
For this analysis, we looked at data from the beginning of March 2019 compared to prices one year earlier. We looked at Zillow’s seasonally adjusted median price estimate as published by Zillow Research Data.
Nationally, home prices increased 7.2% last year or about $15,000 more than the year before. However, in some states prices spiked much more than that.
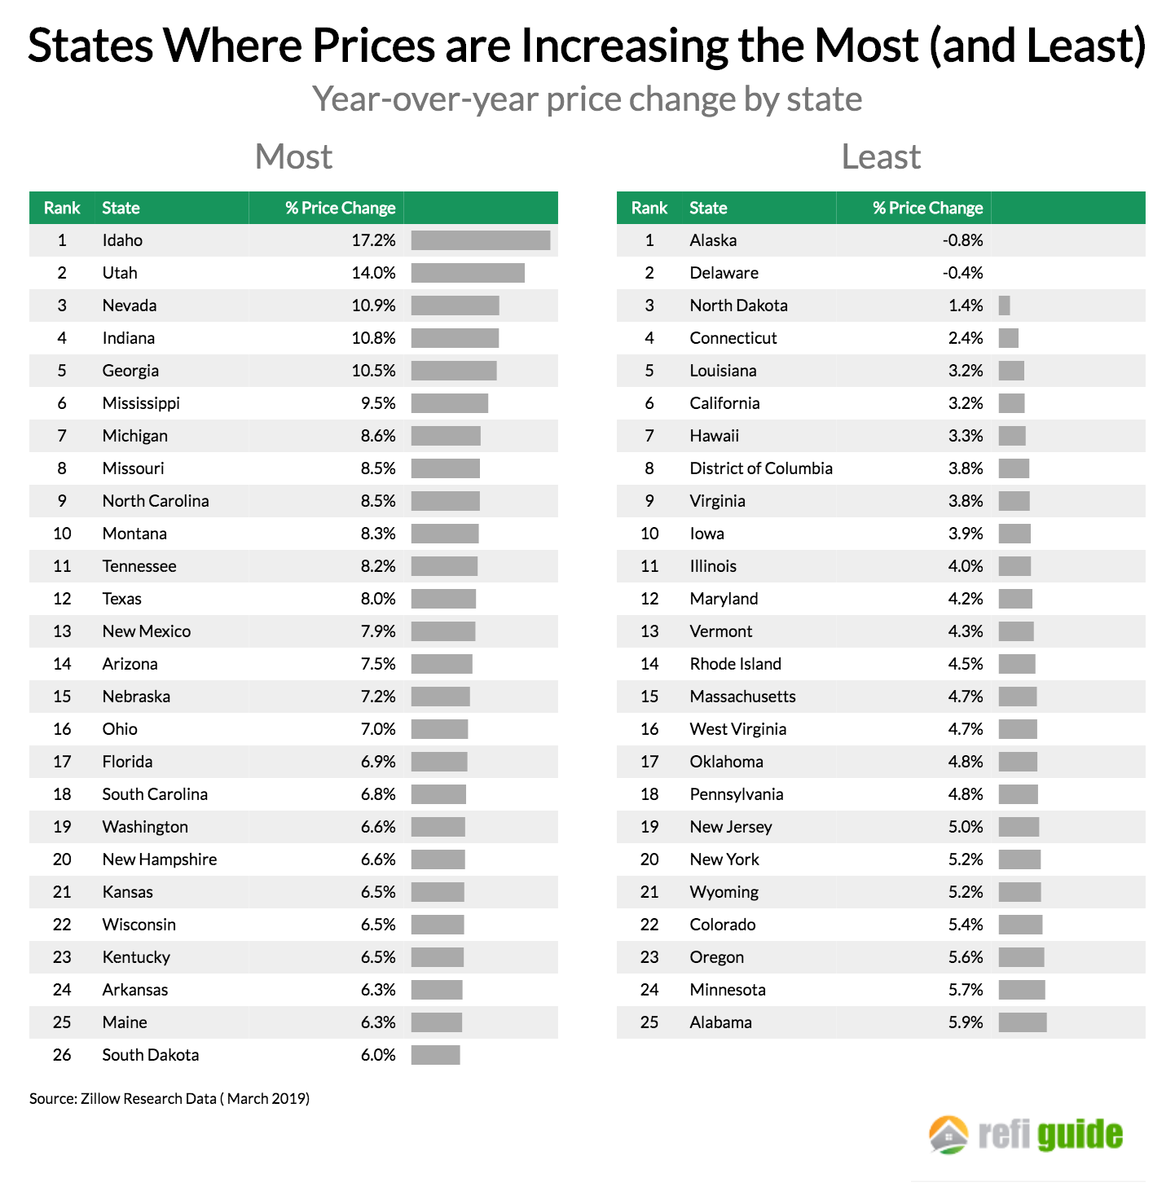
Idaho leads the country with home prices increasing by 17.2% last year, driven by strong demand in the Boise market. In Utah the impact of a thriving economy and growing population is that prices increased 14% in just one year. Nevada, likewise is seeing strong home price growth as people migrate from California and the state’s low taxes are more favorable under the most recent tax reform. Alaska and Delaware have the distinction of being the only states where home prices fell over the last year.
Next, we looked at home prices in the top one hundred largest housing markets, as measured by population. Which cities were experiencing rapid home equity appreciation and which ones are not?
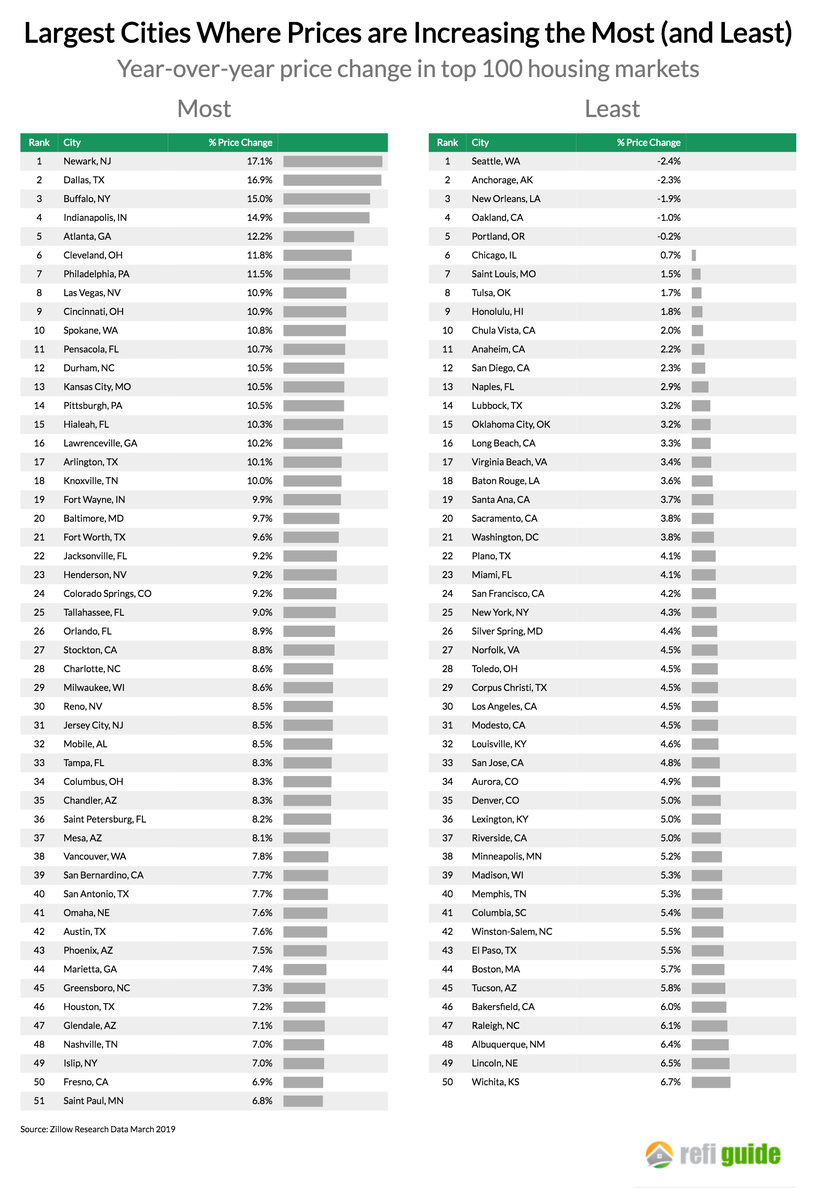
At the city level, home prices have increased the fastest in Newark, NJ where prices have increased more than 17% as buyers who are priced out of New York City have purchased in this area. Dallas, a city with a strong economy and low taxes has seen home prices increase nearly 17% as well.
Notably, some of the most expensive and desirable cities like Seattle, Oakland and Portland have seen their prices decrease in the last year. Each of these locations has experienced price appreciation during this decade, however.
Were there any smaller cities and towns that experienced home prices rising faster than the big cities? Below shows the fifty places in the United States where home prices increased the most this last year:
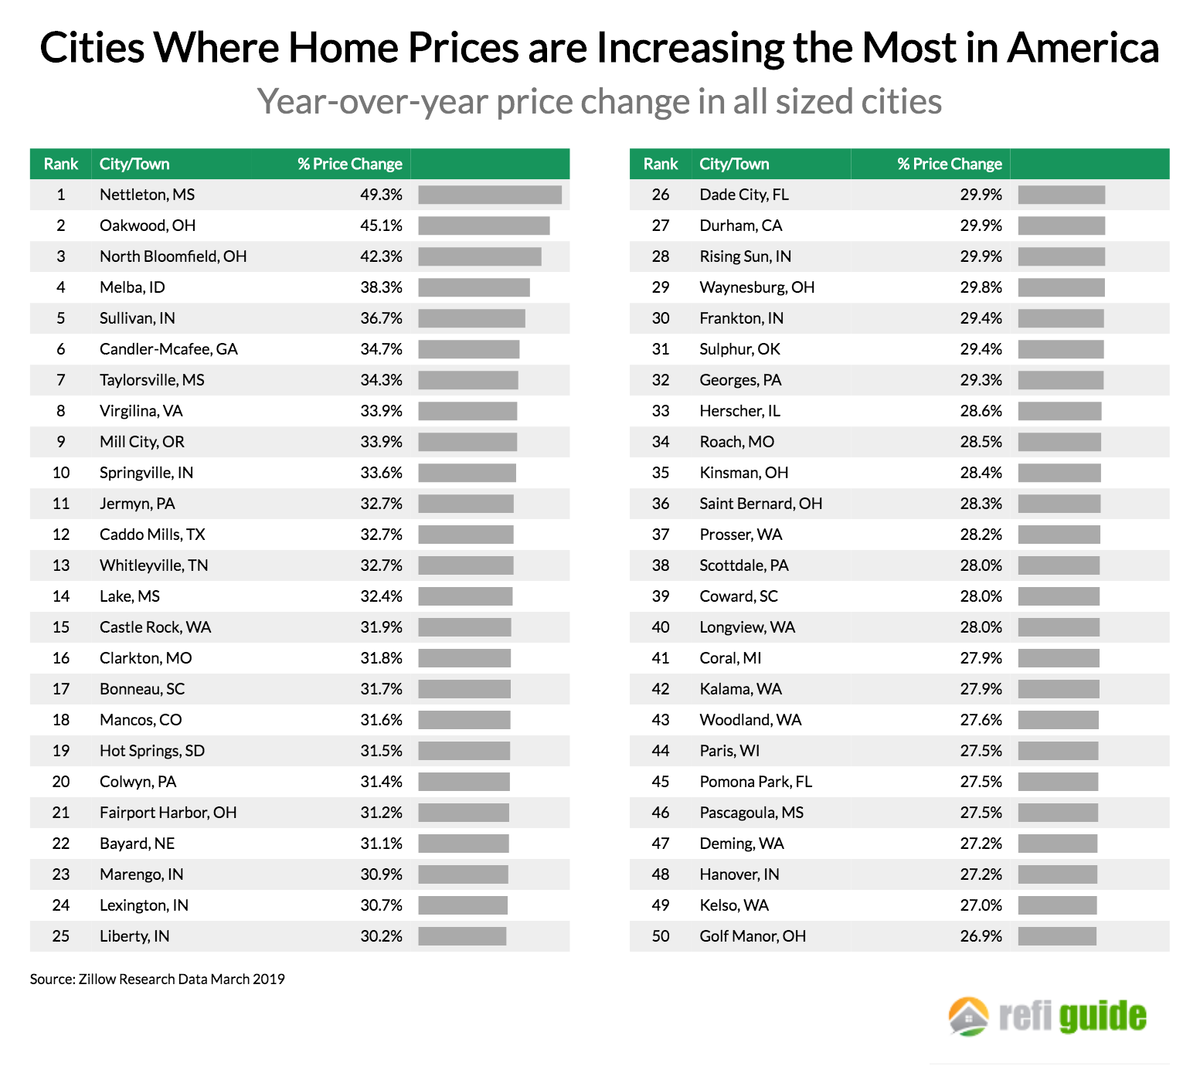
Across the Midwest and South, numerous smaller cities experienced price appreciation much greater than 25% last year. In Nettleton, MS prices increased 49% in just one year! Notably, almost none of these high-price growth cities are located on the coasts.
Lastly, what are expensive places to buy a home in America that are just getting more expensive? To conclude we looked at locations where the median home price was over one million dollars and the prices keep rising:
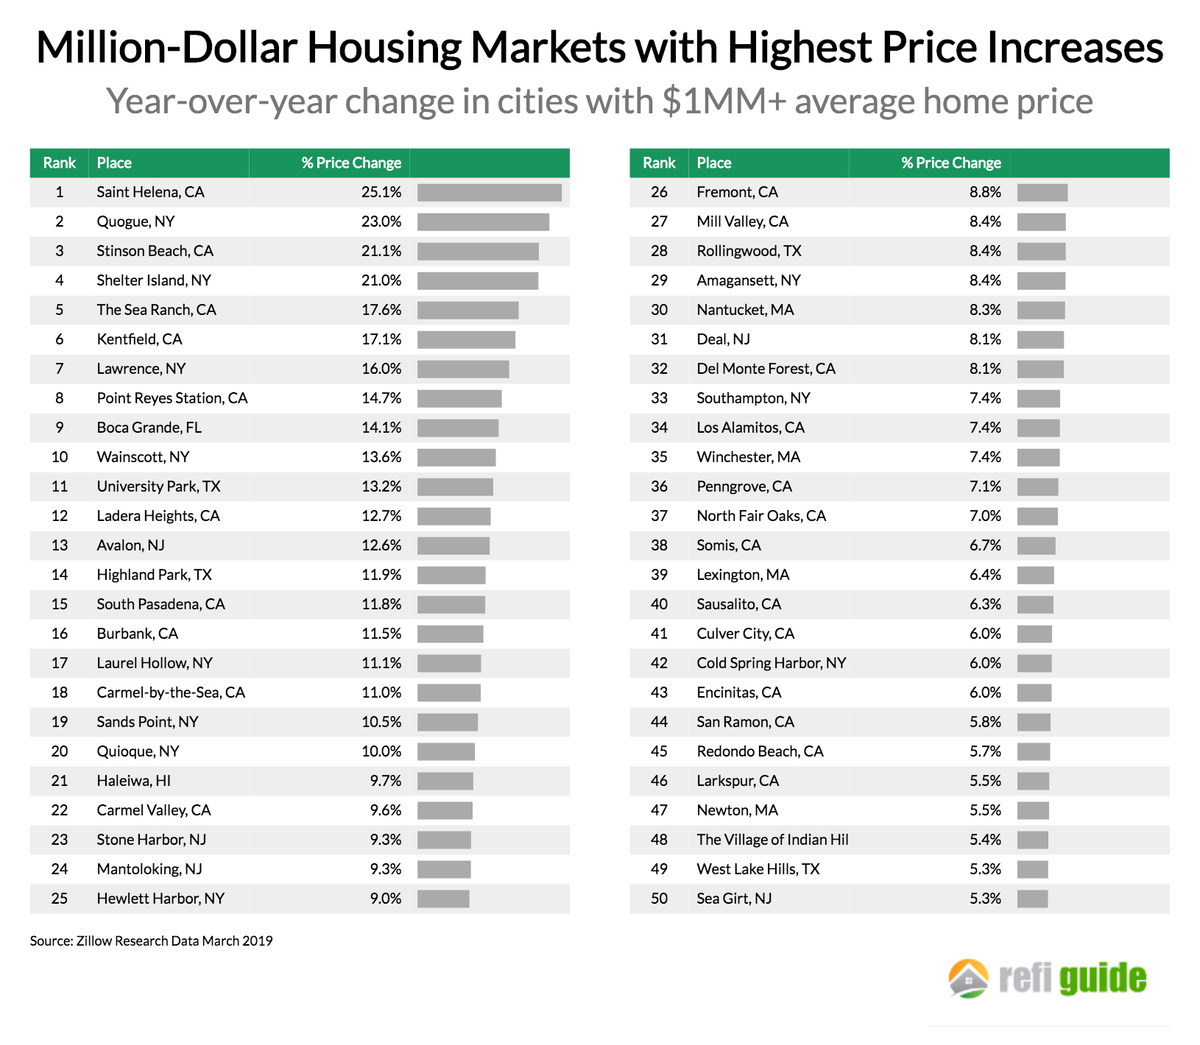
In this rarefied group, prices increased the most in Saint Helena, CA. In this tony town in Napa Valley, prices increased over 25% last year. In second place was Quogue, NY a town in the Hamptons. In fact, 9 out of the top 10 expensive cities with high price appreciation are in California or New York. More specifically, many of these locations are in the vicinity of San Francisco and New York City, the two very large economic engines that are driving home prices.
***
After nearly a decade of vibrant stock market and real estate returns, this year home prices have continued to climb at a steady clip. In only two states in America did prices actually fall, and in five states prices grew more than 10% in a year. As the economy has continued roaring, places that were once known for being affordable like Idaho, Utah, and Nevada have seen home prices spike. While expensive cities like Seattle, Portland and Oakland have seen prices level off in the last year, and places like Newark, Dallas and Buffalo have become less affordable. In this stage of American economic expansion, the once affordable places are seeing their prices escalate.
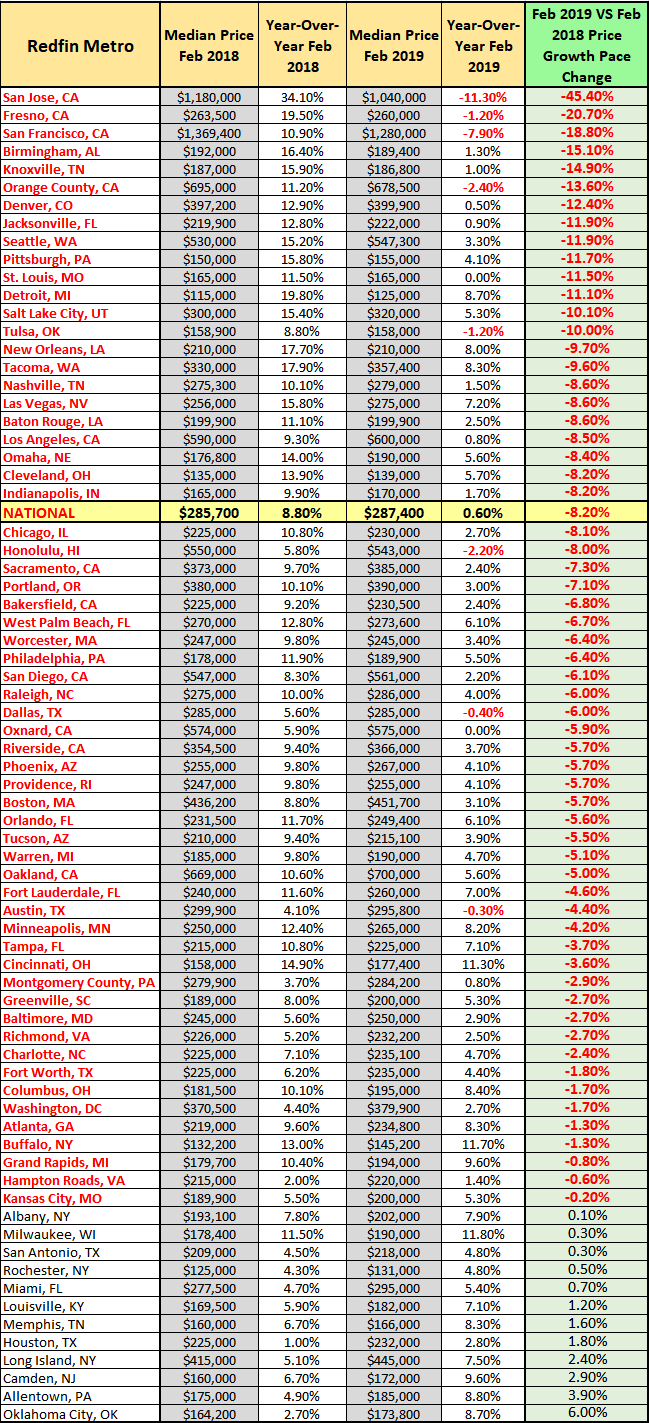
US Housing Hits A Brick Wall: “The House Price Deceleration Is Staggering”
(by Mark Hanson) RedFin puts out a monthly home sales report, which contains a lot of great data. The chart below shows Feb 2018 year-over-year price growth, which was off the charts, compared to Feb 2019 year-over-year growth, which was very weak.
This y/y growth deceleration is staggering, especially in the high-flying regions.
Very few regions escaped a significant deceleration with some prominent regions like San Jose and San Francisco even getting crushed on a year-over-year absolute basis.
The only thing that even comes close to this sharp of deceleration was circa-2007.
It was data like these I have been tracking that led to my call last year that there was no way the Fed could continue to hike in 2019.
For certain housing and related names, this is a killer unless prices re-accelerate quickly.
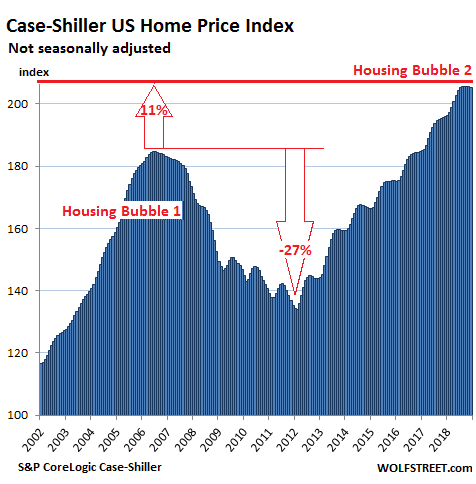
The Most Splendid Housing Bubbles in America Get Pricked
San Francisco Bay Area & Seattle lead with biggest multi-month drops since 2012; San Diego, Denver, Portland, Los Angeles decline. Others have stalled. A few eke out records.
San Francisco and San Diego are catching the Seattle cold, and others are sniffling too, as the most splendid housing bubbles in America are starting to run into reality.
House prices in the Seattle metro dropped 0.6% in December from November, according to S&P CoreLogic Case-Shiller Home Price Index, released this morning, and have fallen 5.7% from the peak in June 2018, the biggest six-month drop since the six-month drop that ended in February 2012 as Housing Bust 1 was bottoming out. The index is now at the lowest level since February 2018. After the breath-taking spike into June, the index is still up 5.1% year-over-year, and is 27% higher than it had been at the peak of Seattle’s Housing Bubble 1 (July 2007):
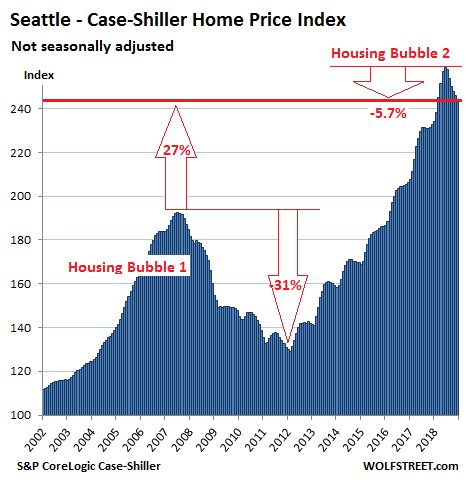
So Seattle’s Housing Bubble 2 is unwinding, but more slowly than it had inflated. Many real estate boosters simply point at the year-over-year gain to say that nothing has happened so far — which makes it a picture-perfect “orderly decline.”
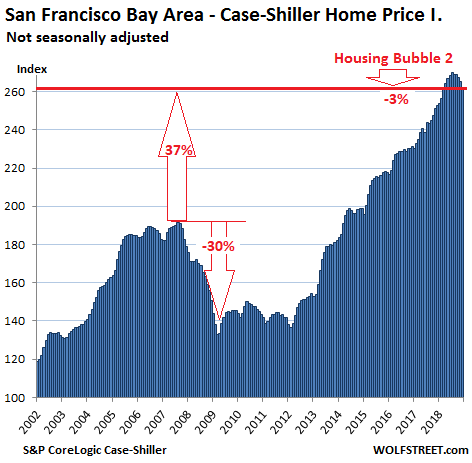
San Francisco Bay Area:
The Case-Shiller index for “San Francisco” includes five counties: San Francisco, San Mateo (northern part of Silicon Valley), Alameda, Contra Costa (both part of the East Bay ), and Marin (part of the North Bay). In December, the index for single-family houses fell 1.4% from November, the steepest month-to-month drop since January 2012. The index is now down 3% from its peak in July, the biggest five-month drop since March 2012.
Given the surge in early 2018, the index is still up 3.6% from a year ago and remains 37% above the peak of Housing Bubble 1, fitting into the theme of a perfect orderly decline:
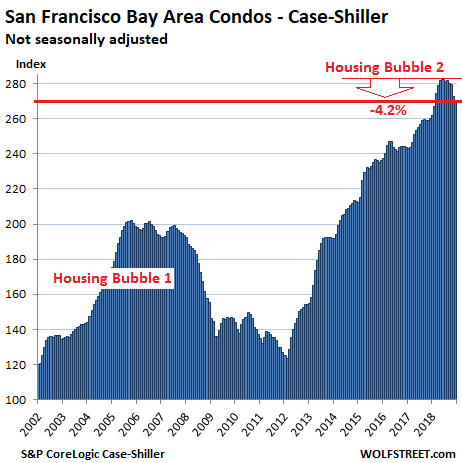
Case-Shiller also has separate data for condo prices in the five-county San Francisco Bay Area, and this index fell 0.9% in December from November, after an blistering 2.4% drop in the prior month. From the peak in June 2018, the index has now dropped 4.2%, the steepest six-month drop since February 2012:
The Case-Shiller Home Price Index is a rolling three-month average; this morning’s release tracks closings that were entered into public records in October, November, and December. By definition, this causes the index to lag more immediate data, such as median prices, by several months.
The index is based on “sales pairs,” comparing the sales price of a house in the current month to the prior transaction of the same house years earlier (methodology). This frees the index from the issues that plague median prices and average prices — but it does not indicate prices.
It was set at 100 for January 2000; a value of 200 means prices as tracked by the index have doubled since the year 2000. Every index on this list of the most splendid housing bubbles in America, except Dallas and Atlanta, has more than doubled since 2000.
The index is a measure of inflation — of house-price inflation. It tracks how fast the dollar is losing purchasing power with regards to buying the same house over time.
So here are the remaining metros on this list of the most splendid housing bubbles in America.
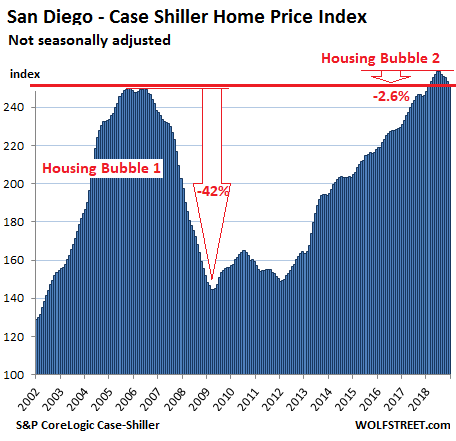
San Diego:
House prices in the San Diego metro declined 0.7% in December from November and are now down 2.6% from the peak in July, the biggest five-month drop since March 2012, leaving the index at the lowest level since February 2018, and just one hair above the peak of Housing Bubble 1:
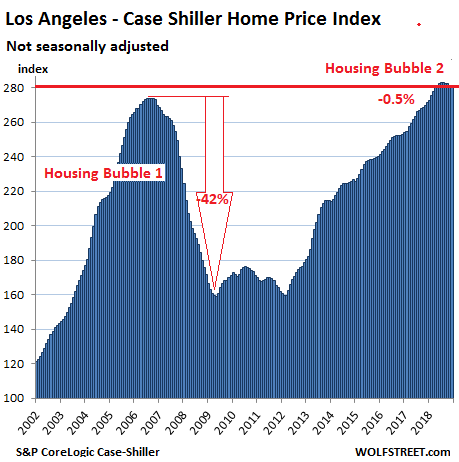
Los Angeles:
The Case-Shiller index for the Los Angeles metro was about flat in December with November but down 0.5% from the peak in August — don’t laugh, the largest four-month decline since March 2012. What this shows is just how relentless Housing Bubble 2 has been. The index is up 3.7% year-over-year:
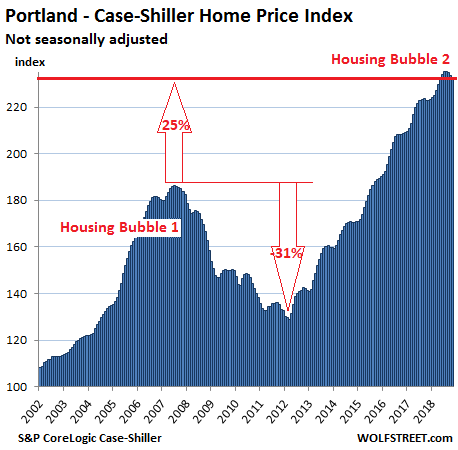
Portland:
The Case-Shiller Index for the Portland metro inched down in December from November for the fifth month in a row and is now down 1.4% from the peak in July 2018. And that was the steepest five-month drop since March 2012. Year-over-year, the index was up 3.9%:
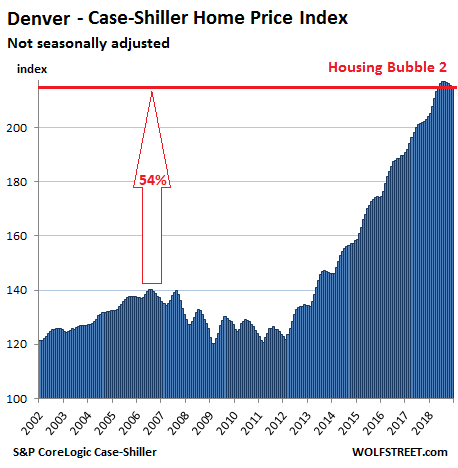
Denver:
House prices in the Denver metro edged down in December from November for the fourth month in a row, after an uninterrupted 33-month run of monthly increases. The four-month drop amounted to 0.9%, which, you guessed it, was the steeped such drop since March 2012. The index is at the lowest level since May 2018 but is still up 5.5% year-over-year:
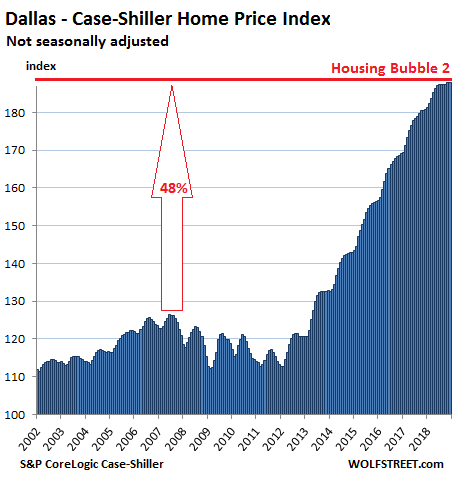
Dallas-Fort Worth:
The Case-Shiller Index for the Dallas-Fort Worth metro in December ticked up by less than a rounding error to a new record, leaving it essentially flat for the seventh month in a row. The index is up 4.0% year-over-year:
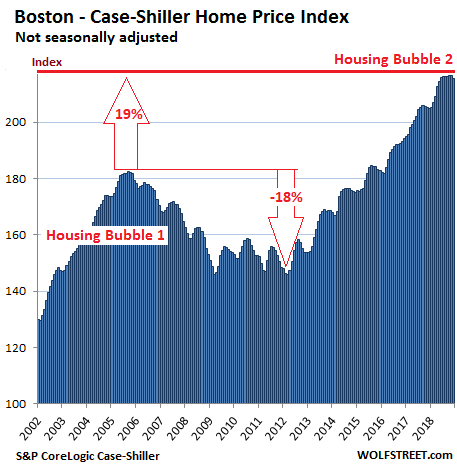
Boston:
In the Boston metro, house prices dipped 0.5% in December from a record in November and are now back where they’d been in June. The Case-Shiller Index is up 5.3% from a year ago:
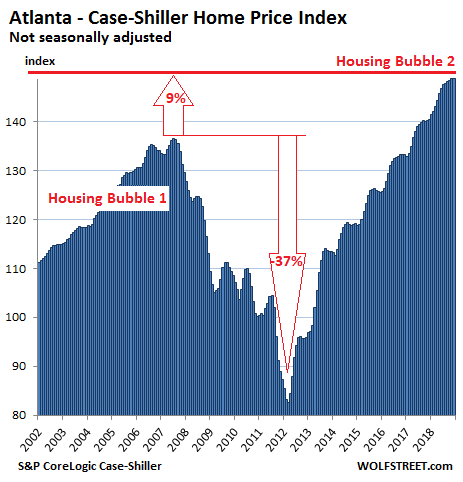
Atlanta:
The Case-Shiller Home Price Index for the Atlanta metro inched up a smidgen in December, to a new record, and is up 5.9% from a year ago:
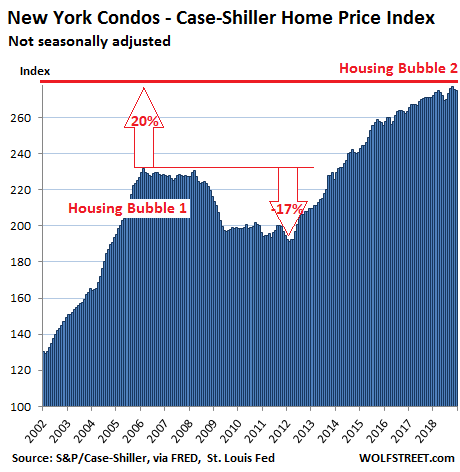
New York City Condos:
The Case-Shiller index for condo prices in the New York City metro ticked down in December for the second month in a row after a mighty bounce in September and an uptick in October. This index can be volatile, but after all these bounces and declines, the index was up just 1.5% from a year ago, the smallest year-over-year price gain on this list of the most splendid housing bubbles in America:
On a national basis, these individual markets get averaged out with other markets that didn’t quite qualify for this list since their housing bubble status has not reached the ultimate splendidness yet. Some of those markets, such as the huge metro of Chicago, remain quite a bit below their Housing Bubble 1 peaks and are now declining, while others are shooting higher.
So the Case-Shiller National Home Price Index has been about flat since July, but is still up 4.7% year-over-year and is 11% higher than it had been at its prior peak in July 2006 during Housing Bubble 1:
It always boils down to this: Regardless of how thin you cut a slice of bologna, there are always two sides to it. When home prices drop after a housing bubble, there are many losers. But here are the winners – including a whole generation. Listen to my latest podcast, an 11-minute walk on the other side…
Enjoy reading WOLF STREET and want to support it? Using ad blockers – I totally get why – but want to support the site? You can donate “beer money.” I appreciate it immensely. Click on the beer mug to find out how:

Would you like to be notified via email when WOLF STREET publishes a new article? Sign up here.
Housing Market Crisis 2.0: The Jury Is In For 2018-2019
Summary
Here is a play-by-play review of a housing crisis that began exploding one story at a time last summer.- What is different this time from last is that the 2007-2009 crisis started in the US and pretty much stayed in the US.
- This one is developing all over the world simultaneously – in the US, Canada, Australia, the UK, etc.

(by David Haggith) As happened with the first housing market crash that began in 2007 but didn’t become widely recognized until mid-2008, the present housing crisis began exploding one story at a time last summer, and this blog was perhaps the first to state that summer’s change was the turning point from decades of ascent into a collapse in housing sales and prices. I said the same thing back in 2007, and people didn’t believe me then either.
The present housing market crash, like the last, was created by the Federal Reserve artificially pressing mortgage rates down, then down further, and then down as deep they dared push for years and years. Falling interest allowed people with flat incomes to keep purchasing increasingly expensive homes. Since people buy payments more than house prices, housing prices kept rising as payments were kept in line via these artificial interest reductions.
The Fed’s ill-conceived plan, however, was never sustainable prior to the last housing market crash and is not now. I’ve said throughout the Great Recession and ensuing years that, sooner or later, we’d get to the point where the Fed would have to raise rates, and I’ve said its quantitative tightening will certainly raise rates as much as it increases its stated interbank lending interest targets. I’ve also said that, by the time the Fed started raising rates, housing prices would be unaffordable without the Fed’s artificially lowered interest; therefore, the market would have to crash all over again because, all over again, people would find themselves underwater on their mortgages.
And now, here we are. US banks have not started to go down, but they are feeling serious pressure as this article will point out, while eight months of statistics now prove housing is relentlessly falling with NO hint of letting up. As I wrote in my first Premium Post, “2019 Economic Headwinds Look Like Storm of the Century,” Housing Market Crash 2.0 is one of the numerous forces that will be knocking the US economy down in 2019. The rest of the global economy is already down further than the US.
The principal driver in Housing Market Crash 2.0 is the Federal Reserve’s Great Recovery Rewind (the downsizing of its balance sheet, which tightens financial conditions). This, I said two years ago, would cause mortgage rates to start rising one year ago, and you can now see that mortgage rates did exactly that all of last year:
Mortgage rates rose only a minuscule blip when the Fed started with a tiny rolloff (tightening) near the end of 2017, even as I had said the Fed’s unwind would not likely cause any serious damage to the economy until January 2018. Rates, however, immediately ramped up steeply when the Fed doubled its roll-off rate in January (which was when I said the balance sheet unwind would start to have serious market impacts). This has hit stocks, bonds, and housing the worst… so far.
Since the housing market is one of the major areas where Americans store wealth and since it is an industry that buys products and labor from a multitude of other industries, a decline in housing impacts the economy more than any other industry.
US Housing Market Crash 2.0
Here is the path US housing prices had been following until the market rolled over:
And here is a play-by-play of how the housing market crash has gone since I made my brazen 2018 summer proclamation that it had arrived on schedule:
June-July, 2018: Average housing demand in the US was reported to have fallen 9.6 percent in June YoY, while the number of listings increased. Overall, 15% fewer offers were made on homes, which is probably why the inventory grew. In many major markets, however, inventory declined. Agents in So. Cal reported bidding wars were cooling down. Where homes had been getting 10-15 offers (causing a bidding war), they were now just getting one or two.
Prices continued to climb or remained high because sales have to slump a lot before sellers become willing to accept the harsh reality that their homes, in which they have so much of their wealth invested, are not worth as much as they were. As inventory rises, buyers become more choosy and make offers on only the best-priced homes, rather than bid prices up. As a result, prices stall so do buyers until eventually their waiting overcomes seller inertia and sellers start to move down to find the more deeply coalesced pool of buyers.
In affluent areas, however, prices already began to fall. In part, this jolt down at the top was due to the Trump Tax Cuts, which funded some cuts by curbing deductions for mortgage interest and particularly for property tax. That hit areas like Manhattan, Westchester County, New Jersey, and Connecticut the hardest because of their high property taxes that had been paid on behalf of the wealthy via income-tax breaks. (Property-tax bills in Westchester County, one of the highest in the nation, commonly hit $50,000 per year or more.)
On a quarterly basis, purchases nationally plunged 18% in the second quarter.
August 2018: Near the end of summer, reports like the following started to appear for the first time in almost a decade:
“We all think next year is going to be a tough year for real estate sales,” said Matthew Roach, a property attorney in Yorktown Heights, New York…. Some buyers are saying, “‘Look, I’m not going to spend more than $35,000 in taxes,’ ” said Angela Retelny, a broker at Compass. “Houses … have to be reduced – because their taxes are just way too high for the price range….” The state of the market is such that you’re seeing “dramatic price reductions every single day – every hour, pretty much,” she said.”
But it was not just high-end markets that hit the skids. Farms in the midwest had been seeing rising bankruptcies for a few years and finally broke above the peak they hit in the last housing market crash:
The rise in farm bankruptcies, however, had little to do with mortgage rates or housing prices, and everything to do with commodity prices (particularly dairy); however, as goes the farm business, so goes the sale of the farm. More people selling in distressed conditions coupled to fewer people interested in buying into a failing industry equals tougher sales; and, so, this distress was certain to flow out into declining sales and prices. (Fire sales of land and equipment due to distress last summer are now well underway.)
The impact hit first in delinquent Ag. loans in the upper midwest, which rose (when measured against the farm capital backing those loans) to strike a level worse than what was seen in the pit of the Great Recession. The Kansas City Fed predicted farm income would worsen into 2019. The Trump Trade War certainly isn’t helping.
(During this same time, my wife and I – putting my belief in a housing market crash to practice – listed our farm in the hope of selling near the peak, possibly renting and then buying back in at a lower price in a couple of years. We hope to retire our mortgage so that we can more easily retire five years from now. We both have jobs that are fairly recession proof, so we’re not too concerned about needing to grow our own food. Still, if we can’t sell at near-peak value, we’ll happily hold on here since the farm produces relatively passive income. (We let other people rent agricultural use and do 90% of the work.) If things ever did go extremely bad, we can grow a huge amount of food in a valley that always has abundant mountain water. So, we’ll be happy to sell at peak value, but happy to sit it out here if we’re already too late to get that value.)
September 2018: By the end of summer on the east coast, some markets like Connecticut saw a rise in people choosing to wait out the foreseeable housing market crash by renting, even at $10,000 a month for higher-end homes, in hopes of buying low at the bottom of the market in a not-too-distant future. Several east-coast counties saw rentals rising sharply as sales fell just as sharply. Owners also began choosing to rent out homes rather than sell them at a loss because losses on a primary residence are not deductible; but if a home has been rented for two years, it can be converted into an investment property so that, at least, the loss can be deducted from taxes. (They may have also hoped that, by renting, they could wait out the decline in prices.)
Todd David Miller, a vice president of sales at the Higgins Group, said that of the $57 million in sales his team has done so far this year, primarily in the towns of Westport and Fairfield, almost all of the sellers have either moved out of state or are renting in the area. Those who are staying in the area are gravitating toward home rentals near the beach.
“These are mainly higher-end transactions, and the majority of them had to sell at a loss,” Mr. Miller said. “They don’t want to put any more money into real estate right now….”
“We’re going through this era of uncertainty. And what do buyers do when the near-term seems uncertain? They pause. People are just nervous that values will continue to decline, and for that reason, more people are opting to rent, if they are not forced to buy”, Miller said.
October 2018: New home sales were expected to start rising again in October but, instead, fell miserably (8.9% MoM). That marked the seventh month of missed expectations. The midwest led the slump that month, falling a hard 22%, but the fall was bad in all parts of the US. At this point, median prices began dropping nationally, too (down 3. 6%). As a result of a backlog from declining sales, inventory began to soar (climbing 7.4 in one month). Sentiment, too, had taken a bad plunge by October with the number of people who said they planned to buy a house in the next twelve months falling by half over the past year.
Sales of new U.S. single-family homes tumbled to a more than 2-1/2-year low in October amid sharp declines in all four regions, further evidence that higher mortgage rates were hurting the housing market.
The Fed crush was fully on.
November 2018: By November, mortgage rates across the United States had hit their highest level since the Great Recession 8-1/2 years earlier. As a result, new mortgage applications across the US fell to their lowest level since December 2014. Since refinancing mostly happens when mortgage interest is lower than it was when a mortgage was taken out, refis hit their lowest point since the year 2000. So, clearly, the Fed has crushed mortgage activity.
By this point, year-on-year sales had fallen for eight straight months across the nation. The west coast – with Seattle leading the earlier procession in sales and prices – had long been one of the nation’s hottest markets, which is why I stated at the start of last summer the housing market’s initial decline in Seattle was a “bellwether” for the whole US market. While my one crow on a wire (detractor) insisted I didn’t know a thing, time has proven my summer proclamation that Housing Market Crash 2.0 had begun to be dead on with Seattle leading the recession in sales and prices:
Since that proclamation, inventories in the region have soared due to a buildup from declining sales. Lending limits have increased due to falling prices and less assurance on the part of banks that collateral will hold its value or that repossessions won’t be the next wave. King County where Seattle is located has led the decline to where the number of single-family homes on the market has doubled in just a year.
Since my summer declaration, King County has recorded a bruising fall. In just half a year, the median price plunged from its peak of $726,000 last spring to $644,000 in November. According to Mike Rosenberg, a Seattle Times real estate reporter, this was the fastest price drop anywhere in the nation (over 11% in half a year – a crushing reversal from years before when rises 10% in a full year were seen as evidence of a superheated market; so, doesn’t that make this flash-frozen fall?) The last drop that steep was back at the start of the Great Recession in 2008! Not a time for housing anyone wants to compare to.
In Southern California, home sales in November plunged 12% YoY. In California, however, prices remain above their 2008 summit and have so far largely resisted following sales down. Nevertheless, Bank of America proclaimed, “We are calling it: existing home sales have peaked.”
LA Times noted if volatility in the stock market and Washington significantly affects consumer confidence and business investment decisions in 2019, the housing market could be due for significant correction into 2020…. Richard K. Green, director of the USC Lusk Center for Real Estate, told the LA Times, he is very pessimistic about the housing situation in Southern California. Green warns prices could plunge 5% to 10% into 2020, even with the current level of economic growth.
Things looked just as stark in Las Vegas by November where, out of the 10,000 homes on the market, 7,000 of those had not received a single offer, a figure 50% worse than the year before. Realtors started warning sellers not to panic, which, in itself, easily becomes a self-fulfilling warning. In the last few years, Las Vegas had risen to become one of the most overvalued markets in the nation. It looks like prices have finally peaked now that they have risen out of site on the back of low-interest loans and now that interest is higher and now that the Trump Tax cuts have stripped away some of the benefits of home ownership in favor of a larger general deduction that goes equally to renters or buyers.
By the end of November, the US Census Bureau reported that new home sales had rolled off a cliff. New homes sitting on the market were at their highest point in five years, and unsold supply per quarter was growing at an alarming annualized rate of 33% (meaning should it continue).
In another sign the market has turned under, housing flips have flopped in the Chicago area. The flipper boom has nearly gone bust. With properties taking longer to sell, higher interest on loans to acquire and repair those fixers eats up more profit and increases the risk involved in flipping homes. With profits sometimes now shifting into reverse, flippers are backing out of the market. The number of homes turned around by flippers in the Chicago area went from a high of 7,600 in the first three quarters of 2017 to 4,000 in the first three quarters of 2018. Across the nation, the number of homes flipped dropped 12%.
December 2018: The median price of a home in Manhattan fell below the one-million-dollar market for the first time in four years, and it took 15% longer to sell even at those lower prices. Again, real estate agents noted that the Trump Tax Cuts were making the situation worse, but particularly in high-end markets.
Relief started spreading to the boroughs, too. Most of Brooklyn’s trendiest neighborhoods saw more than a fifth of sellers pressed to lower their asking price. And in the pricey Hamptons, home purchases in the 4th quarter of 2018 crashed a full 35%, the biggest quarterly fall since … you guessed it, the Great Recession in 2009!
Inventory is piling up across the city, and that’s good news for buyers in search of a bargain. For sellers with dreams of making a big profit, it’s time for a reality check.
Most of us don’t care what banksters are paying (or getting) for a home near their Wall Street office, but the massive year-end plunge in NYC and its surrounds is further evidence that the fall in home prices is not only unabated but worsening. What started showing up at the top of the market in the hottest markets like Seattle last summer is now, as I said would be the case, trending down to lower sectors just as seen in the spread from Manhattan to the boroughs.
This is all terrible news for my crow. If he had any integrity, he’d cannibalize and eat crow. Of course, neither crows nor trolls ever have integrity. However, for those who would like to become first-time home buyers someday, this is news to crow about. How you look at it depends on where you’re standing. Someone might even be able to become a first-time home buyer in Manhattan in a couple of years if the Fed doesn’t quickly spin on its heels and reverse its Great Recovery Rewind, as it is already sounding ready to do.
Nationally, sales dropped 11% in December, but the most valuable thing about December stats is that we get a final tally to reveal how the entire year went. A total of 5.34 million homes sold in 2018, proving the year to have the largest annual drop (about 10%) in total home sales since … you guessed it … the bottom of the Great Recession eight years ago.
Business Insider summarized 2018 as the year that…
The US housing market took a dark turn … as homebuying fell off a cliff and mortgage lenders saw a steep decline in applications, originations,and profits. Interest rates are partly to blame for the slide in housing, but that’s only half of the equation, according to analysts. It’s too soon to panic, but a deeper drought in housing is bad news for just about everybody, not just the banks. Significant housing declines have foreshadowed nine of the 11 post-war US recessions, according to UBS…. The decline has been broad, affecting every region in the US.
2018-2019 Housing Market Crash 2.0 appears inevitable, given how far off the cliff we’ve already fallen and how fast we’re going down.
And here is where home-buying sentiment now lies:

So, eat crow, Crow. In short, sentiment across the nation is as bad as it has ever been. It looks like how people feel after they’ve already fallen off a cliff.
How hard is Housing Market Crash 2.0 hitting banks?
At Wells Fargo, mortgage banking revenues fell 50% to $467 million in the fourth quarter, while originations declined 28% to $38 billion. JPMorgan, meanwhile, saw mortgage income fall to $203 million, a 46% drop from the same period last year. Originations fell 30% to $17.2 billion.
that’s Fifty percent!
Looking forward: Pending sales are a forward-looking indicator. Due to the lag of a month or two between a pending contract and closing, the direction of movement in pending sales tells us where we’ll most likely be in final sales a month or two down the road. November’s pending sales told us that sales in January when all reporting is completed in February will likely be down to their lowest since May 2014. And December’s sales, which were way down in November’s pending report, already came in worse way worse than November’s actuals, falling a whopping 2.2% from where they were in an already bad November. So, we can expect January’s to do no better once all reports are in.
Real estate bimbos had expected a 0.5% rise in December! Of course, they were also ebulliently predicting a warm spring market for 2019 and recently were forced by facts to temper their predictions. In my opinion, real-estate sales people (as a group, not all individuals) fit somewhere among the following groups for lying: 1) transportation sales people (car dealers and horse traders); 2) banksters; 3) stock brokers; and 4) politicians.
 Graph by Wolf Street
“It’s been dripping down, down, down,” NAR chief economist Lawrence Yun said…. “Frustrating that the housing market is not recovering.”
Wolf Street
Pending sales strongly indicate that Housing Market Crash 2.0 is still fully on track for 2019. Moreover, year-on-year declines have been worsening each month since the start of October even though interest rates improved in November. That, to me, supports my view that the Fed has already gone too far to stop the damage, even if it quits tightening altogether.On a longer-term perspective, consider the demographics: School-debt-ridden, under-employed millennials, who are more into buying experiences in life than things, are not inclined to buy homes that are in the housing-bubble price zone. Neither are baby-boomers looking to retire, which often involves downsizing.
None of this bothers me because my wife and I have the best of all worlds – very low fixed interest, a home we bought at the bottom of the market last time around, a chance to sell now high or stay and keep reaping the rewards of living in a beautiful place.
I benefited from the last crash. I hope others are able to reap the same reward by turning the next bottom into their blessing. It’s all about seeing clearly what is coming so you can sell high and buy low. It is what can happen to those who see reality clearly and don’t live in economic denial like my crow who could only see what he wanted to see in praise of his choice for president. My lone crow on a wire, who scoffed at a good call because he didn’t like it, now looks like the fool I warned last summer he would prove to be. He has fallen off the wire because he hasn’t a leg left to stand on. All reports everywhere have come in against consistently month after month for over half a year.
(I’m not advising anyone as everyone’s particular situation is different – just saying what I’ve done, what I’m doing and why. I’m saying what I believed would happen and is now happening so you can weigh all risks and possible rewards for yourself in your own context and your own ability to take risk in order to do as you feel best.)
Here is a picture of where we are in our developing 2018-2019 housing market crash:

After 2018, we look about like this. 2018 pushed us just over the edge into a housing market crash that is as likely to continue sliding as the house in this picture at the top of a bluff that is giving way. (And I’ve seen places in Seattle that look exactly like that.)
Canada Housing Market Crash
One major difference between Housing Market Crash 2.0 and the last time is that this one is already global. The last one started in the US and mostly stayed in the US. This one is rapidly building in several nations because it is part of the bursting of the “Everything Bubble.”
Vancouver, June-July, 2018: Residential property sales fell 14.6% from June 2018 to July but a massive 30.1% from a year before. The 2,070 transactions that took place were the fewest since the end of the last millennium. Buyers and sellers were both reportedly sitting things out in confusion as to whether recent price gains would continue or whether the housing bubble had already burst. (As of August, prices had not started to drop.)
Sales of detached properties in July decreased 32.9% from a year before, and apartments dropped 26.5%. In fact, July’s sales were 29.3% below the 10-year average for July. Much of the plunge was attributed to Vancouver’s new law aimed at shutting out absentee Asian buyers that were ramming up housing prices while leaving the homes abandoned to become derelict in high-end neighborhoods. So, the decline is, in large part, intentional; but, if declining sales bring down prices, the dangers of falling prices to people who find themselves underwater and to their banks remain just as high.
The topping of the Canadian housing market looked like this:
 Canadian market looks like a bus crashing into a brick wall.
January 2019: The B.C. Real Estate Association claimed the huge drop in British Columbia housing sales was due to mortgage stress testing. In spite of the plunge, prices are holding in the province, though no longer rising since last spring. Inventory is building to a level that will probably force prices down by or before summer.
Australia Housing Market Crash
Australia is faring even worse. Melbourne housing prices have plummeted at their fastest quarterly pace ever recorded! Less than two months ago, Australian housing regulators were warned to prepare “contingency plans for a severe collapse in the housing market” that could lead to a “crisis situation.” The Australian market peaked back in October 2017. It’s been downhill ever since with momentum now hitting break-neck speed. Sidney prices are down 12% from their peak.
Experts have been left stunned after Aussie house prices plunged at “the fastest rate of decline ever seen”. And there’s more pain to come…. “We have seen the downturn accelerate over the last three months. At 4 per cent down in Melbourne that’s the fastest rate of decline we’ve ever seen of any rolling three-month period, and Sydney is virtually (the fastest outside) a really brief period in the ’80s.” Sydney’s total decline is now the worst since [CoreLogic] began collecting records in 1980… One analyst has even tipped falls of up to 30 per cent, based on the revelation from the banking royal commission that almost all mortgages written between 2012 and 2016 … over-assess borrowing capacity.
News.com.au
The defaults will be cascading in soon. While Melbourne and Sidney are in an all-out housing crash, other cities in Australia are feeling the pinch, too. Every capital city marked declines, except Canberra. As in the US and Canada, the most expensive end of the market is taking the biggest fall first. Melbourne and Sidney, however, constitute half the value of Australia’s total housing market; so a drop in only those two cities if the plunge were isolated could still be devastating to Australian banks.
Hong Kong Housing Market Crash
Even the world’s hottest housing market is in decline. In stock market terms, one could say it has “entered a correction.” After its longest streak of falling values since 2016, the price of existing homes is down almost 10% from their August peak. This is actually seen by many, including some Chinese government officials, as relief to a market that had long run too hot.
The article above would have been one of my Premium Posts. Such articles are long to readbut are intended to present the most comprehensive overviews you’ll find anywhere. I chose to make this one available to all for two reasons: 1) to show the depth and breadth of Premium Post articles so readers can assess what they are like; and 2) because it concludes an argument made last summer over a prediction made almost two years ago for last summer.
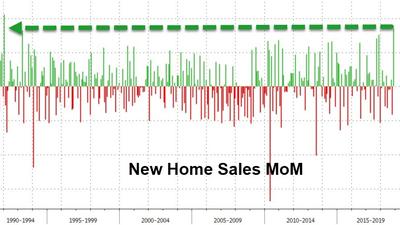
US New Home Sales Fall 7.7% YoY In November, But Rise 16.9% MoM, Most Since 1992 (Months Supply Still Elevated, Median Price Falls)
Let’s start with the +16.9% MoM number, a more cheery, pop the champagne bottle headline.
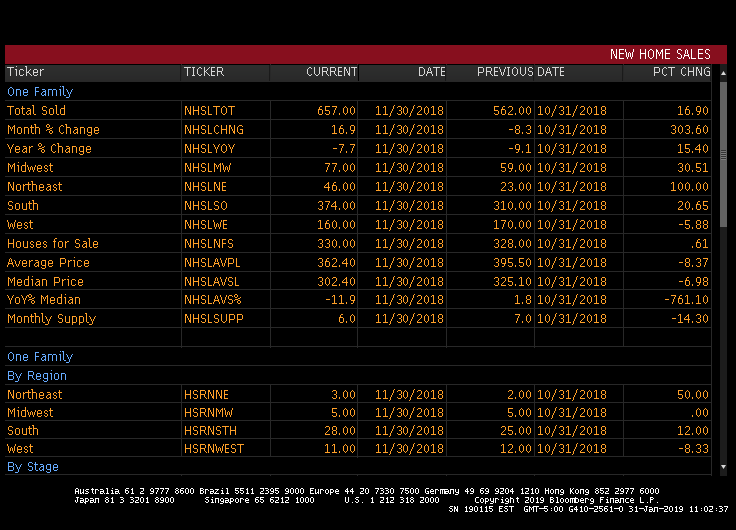
But on a YoY basis, new home sales fell 7.7% in November.

Months supply of new home sales fell in November, but are still at elevated levels.

And the median price of new home sales fell in November as The Fed’s normalization grabs the housing market with its icy grip.

“The weather started getting rough, the tiny ship was tossed….”

Source: by Anthony B. Sanders | Confounded Interest
***
November New Home Sales Surge By The Most Since 1992
…as the median price plunged to $302,400 – the lowest since Feb 2017…
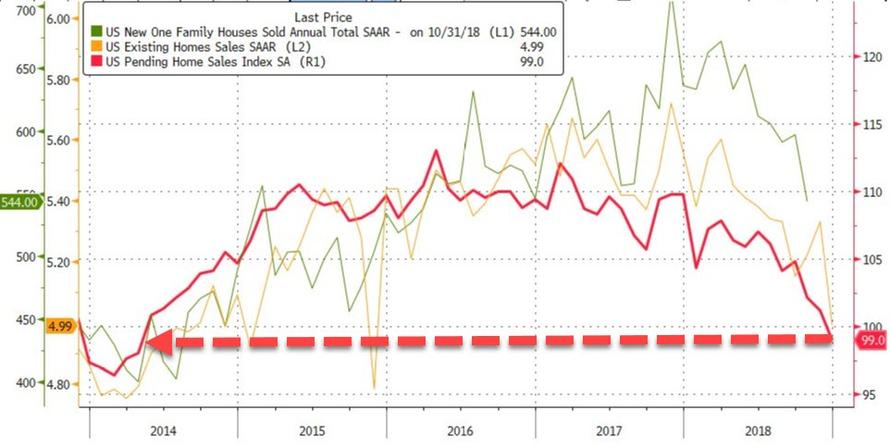
US Pending Home Sales Fall 9.5% YoY In December To Lowest Level Since 2014 As Fed Unwinds
As The Federal Reserve continues to unwind its balance sheet, pending home sales YoY declined 9.5% YoY, the worst since 2014.\

Pending home sales got a big boost from The Fed’s third round of asset purchases (QE3), but PHS are feeling the pain of The Fed’s unwind.

***
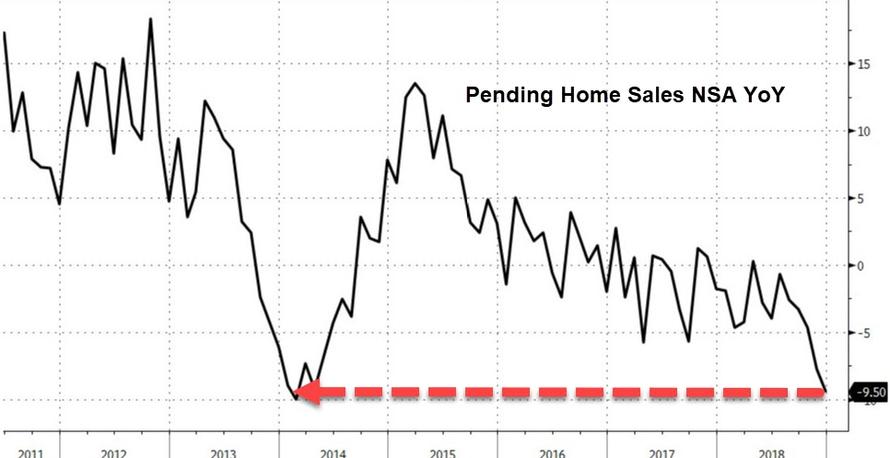
US Pending Home Sales Crash Most In 5 Years
Following Case-Shiller’s report that home price gains are the weakest in four years, Pulte Homes’ CEO admission that 2019 will be a “challenging year,” and existing home sales carnage, Pending Home Sales were expected to very modestly rebound in December.
But they didn’t!
Pending home sales dropped 2.2% MoM (versus a 0.5% expected rise) to the lowest since 2014…
This is the 12th month in a row of annual sales declines… and the biggest annual drop in 5 years…
Yet another sign the housing market is struggling amid elevated property prices and borrowing costs – but there’s always hope…
“The stock market correction hurt consumer confidence, record high home prices cut into affordability and mortgage rates were higher in October and November for consumers signing contracts in December,” NAR Chief Economist Lawrence Yun said in a statement.
But with mortgage rates declining recently and the Fed less likely to raise borrowing costs, “the forecast for home transactions has greatly improved.”
Finally, the Realtors group forecasts a decline in annual home sales to 5.25 million this year from 5.34 million in 2018, which would mark the first back-to-back drops since the last recession.
Global Housing Markets From Hong Kong To Sydney Join Global Rout
It’s not just stocks: the global housing market is in for a rough patch, which has turned ugly for many homeowners and investors from Vancouver to London, with markets in Singapore, Hong Kong, and Australia already showing increased signs of softening.
Macro factors have triggered a global economic slowdown that is unraveling luxury marketplaces worldwide, according to Bloomberg. As a result, a turning point has been reached, with home prices globally now under pressure, and rising mortgage rates leading to depressed consumer optimism, while also triggering a housing affordability crisis, S&P Global Ratings said in a December report. To make matters worse, a simultaneous drop in house prices globally could lead to “financial and macroeconomic instability,” the IMF warned in a report last April.
While each metropolis globally has its distinct characteristics of what triggered its real estate slowdown, there are a few common denominators at play: rising borrowing costs, quantitative tightening, a crackdown on money laundering and increased government regulation, emerging market capital outflows and volatile financial markets. Bloomberg notes that there is also declining demand from Chinese buyers, who were the most powerful force in many housing markets globally over the course of this cycle.
“As China’s economy is affected by the trade war, capital outflows have become more difficult, thus weakening demand in markets including Sydney and Hong Kong,” said Patrick Wong, a real estate analyst at Bloomberg Intelligence.
One of the first dominoes to fall has been in Hong Kong, home values in the city have plummeted for 13 weeks straight since August, the longest losing streak since the 2008 financial crash, data from Centaline Property Agency show. Homeowners and investors have taken great caution due to a jump in borrowing costs, a looming vacancy tax, and the trade war that has derailed economic growth in mainland China.
“The change in attitude can be explained by a slowing mainland economy,” said Henry Mok, JLL’s senior director of capital markets. “Throw in a simmering trade war between China and the U.S., the government has taken actions to restrict capital outflows, which in turn has increased difficulties for developers to invest overseas.”

Home prices in Singapore, which rank among the world’s most expensive places to live, logged the first decline in six quarters in the three months ended December. Bloomberg said luxury experienced the worst declines, with values in prime areas dropping 1.5%.
Most of the slowdown was caused by government policies to cool the overinflated housing market. Cooling measures were implemented in July included higher stamp duties and tougher loan-to-value rules. The policies enacted by the government have halted the home-price recovery that only lasted for five quarters, the shortest since data became available.
“Landed home prices, being bigger ticket items, have taken a greater beating as demand softened,” said Ong Teck Hui, a senior director of research and consultancy at JLL.

The downturn in Sydney’s housing market is expected to continue this year as tighter lending standards and the worst plunge in values since the late 1980s has spooked buyers. Average Sydney home values had dropped 11.1% since their 2017 top, according to a recent CoreLogic Inc. report — surpassing the 9.6% peak to trough decline when Australia was on the cusp of entering its last recession.
Nationwide, home values declined 4.8% last year, marking the weakest housing market conditions since the 2008 financial crash.
“Access to finance is likely to remain the most significant barrier to an improvement in housing market conditions in 2019,” CoreLogic’s head of research Tim Lawless said. Weak consumer sentiment toward the property market is “likely to continue to dampen housing demand.”

Bloomberg notes that home prices in the country are still 60% higher than in 2012, if prices plunge another 10% in 2019, well, it could spark mass panic.
The Reserve Bank of Australia is terrified that an extended downturn will crimp consumption and with the main opposition Labor party pledging to curb tax perks for property investors if it wins an election expected in May, economic optimism would further deteriorate. Treasurer Josh Frydenberg on Thursday told the nation’s top banks not to tighten credit any more as the economic downturn is expected to get much worse.
But all eyes are on what is going on in arguably the most important housing markets in the world – those of Shanghai and Beijing. A government crackdown on leverage and overheating prices have damaged sales and triggered a 5% tumble in home values from their top. Rules on multiple home purchases, or how soon a property can be flipped once it is acquired, are starting to be relaxed, and the giveaways by home builders to lure buyers are starting to get absurd.

One developer in September was giving away new BMWs to new homebuyers at its townhouses in Shanghai. Down-payments have been slashed, with China Evergrande Group asking for 5% rather than the normal 30% deposit required.
“It’s not a surprise to see Beijing and Shanghai residential prices fall given the curbing policies currently on these two markets,” said Henry Chin, head of research at CBRE Group Inc.
As a whole, Bloomberg’s compilation of global housing data showing the unraveling of many housing markets is a sobering reminder that a synchronized global slowdown has started.
***
Vancouver Condo Sales In December Drop To 10 Year Low

Vancouver condo sales fell to a 10 year low in December with sales plunging 47.5% year-over-year, the sharpest annual decline since 2008…
Home Builder Toll Brothers Shocks With 13% Plunge In Orders As California Falls A Staggering 39%
Toll Brothers announced its fourth quarter results on Tuesday, unleashing a fresh flood of concerns about the state of the housing market after it disclosed its first drop in orders since 2014. Orders were down 13% from the year prior, missing the analyst estimate of a 5% increase in dramatic fashion.
The company focuses much of its business on the California high-end home segment, which – as a result of the housing bubble in most west coast cities and rising rates, is facing an “affordability crisis” coupled with a sharp drop in overseas demand. According to the company, orders for the state were down an astounding 39%.

The company blamed rising rates for the drop off in buyer demand, as well as sinking stock prices. What is odd is that stock prices haven’t really “sunk” – unless the company was referring to its own stock…

... with the CEO blaming “the effect on buyer sentiment of well-publicized reports of a housing slowdown” for the plunge in orders. You see, it’s not the housing market that is slowing: it is perceptions about the market slowing, that is hitting the company.
That said, “perceptions” are correct: as we noted last week, new home sales crashed in October, suffering the biggest plunge since 2011.

Even so, the atrocious quarter didn’t deter all analysts, who promptly defended the stock. Drew Reading, Bloomberg Intelligence analyst stated that “there are many positive factors underpinning the economy that we believe are supportive of the housing sector longer-term, and our affluent markets particularly.”
Tolls dismal results follows signs that we have been discussing for much of the past year, which have confirmed that the luxury housing market is cooling off across the country.
Recently, we profiled a mansion in Chicago that was taken off the market after being listed for $50 million and only being assessed for $19.4 million. United Automobile Insurance Chairman and CEO Richard Parrillo constructed the 25,000 sq ft Lincoln Park mansion a decade ago, after buying the property in 2005 for $12.5 million from the Infant Welfare Society.
After two years on the market, Parrillo and his wife held firm at $50 million, a record for the region, their original listing agent told the Chicago Tribune. The agent said the couple plowed more than $65 million into the estate, including land cost.

$50 million Lincoln Park mansion — Chicagoland’s priciest listing — taken off the market
Cook County Assessor’s Office reports shows the mansion’s $50 million asking price was hugely overinflated versus its most recent estimated market value, which stood some 60% lower, at $19.4 million. The report notes the 2018 property value is significantly higher from the assessor’s $14 million estimated market value for the mansion in 2017, due to a quick burst in high-end home sales in the last several years that had since cooled.
“A Rough Decade Ahead” – ‘Math’ & The Future Of The US Housing Market
Authored by Chris Hamilton via Econimica blog,
Summary
- New Housing is being Created at an Unprecedented 2.5x’s the pace of the Growth of the 15 to 64yr/old Population
- Total Annual Population Growth Has Slowed 25% from Peak Growth, 2 Decades Ago
- However, Annual Population Growth Among 15 to 64yr/olds Has Slowed Over 80% From Peak Growth & Will Continue Decelerating Through 2030
- 15 to 64yr/olds Do Nearly all the Net Home Buying, 65+yr/olds Net Home Selling
- 15 to 64yr/olds Have a 70% Labor Force Participation Rate vs. 27% for 65-74yr/olds, just 8% for 75+yr/olds
- 15 to 64yr/olds Earn and Spend Double that of 65-74yr/olds & triple that of 75+yr/olds
- 65+yr/olds Have Highest Home ownership Rate at 78% vs. Just 36% for Group with Lowest Rate, 15 to 34yr/olds
- 15-64yr/olds are Credit Willing Relative to Credit Averse 65+yr/olds
I read an article a few days ago that got me thinking. The article’s author claimed,
“At 5% mortgage rates and with today’s level of affordability, history shows that there is nothing in the way from having a home building boom over the next ten years to satisfy this demographic demand.”
I found the claim contrary to everything I think I know, so I thought I’d lay out the counter argument.
The chart below shows annual growth of the 15+yr/old US population (blue columns) vs. the annual growth of the 15 to 64yr/old population (red balls). The 15+yr/old annual population growth has fallen 25% (decline of a half million annually) since the 1998 peak but more significantly, the 15 to 64yr/old annual population growth has fallen over 80% (decline of 1.8 million/yr) due to a combination of lower immigration rates and lower birth rates.

These population growth trends will only continue to slow through 2030, according to UN and Census estimates (not really estimates, since this population is already born and simply advancing into adulthood). The future estimates for 15 to 64yr/old population growth (presented above) include estimated immigration well above present rates. Most, if not all (net) of the assumed 15 to 64yr/old minimal population growth is premised on ongoing immigration that continues slowing. Thus the forward looking 15 to 64yr/old growth estimates are likely to be lower and perhaps even turning to outright annual declines.
The chart below shows average income, spending, and LFP (labor force participation) rates by age segment. No shocker, those actively working make and spend more than those with low rates of employment. Those who have worked longer earn more than those new to the labor force. Elderly expenditures come into very close alignment with their (generally) fixed incomes.

Noteworthy is that 75+yr/olds have only an 8% LFP rate but will make up over half of the total 65+yr/old population growth through 2030. The next largest growth segment is among 70 to 74yr/olds with a 19% LFP rate, and the smallest increase is among the 65 to 69yr/olds with a 32% LFP. As an aside, 65+ year olds have the highest home ownership rates at 78% vs. 36% for those aged 15 to 34. So while the more affluent portion (5% to 20%?) of 65+yr/olds may be interested in a second home in the desert, the mountains, or beach…the majority already own and are eventually looking to downsize. Simply stated, nearly all the coming growth is among those that work the least, earn the least, spend the least, already own homes, and are more likely to downsize than buy a second home.

Putting it all together (chart below), annual 15+yr/old total population growth (blue columns), 15 to 64yr/old population growth (red line), housing starts (yellow line), and federal funds rate (black line). Given it is the 15 to 64yr/old population that does the net home buying, (and growth among them continues decelerating…coupled with rising rates and elevated valuations versus most population growth among 75+yr/olds who are more likely to sell via downsizing and/or willing properties to their heirs) I contend the US is creating too many homes presently, not too few. Of course, this doesn’t even factor in things like the lack of income growth among the vast majority those working, high student debt loads, slowing household formation, continued delayed family formation and the lowest birth rates in US history which were just recorded in the first quarter of 2018 (according to CDC…HERE), etc. etc.

Contrary to the author of the article that inspired me, I contend that housing is in for another very rough decade (at the very least)… likely worse than the period during the GFC. The math is pretty straightforward on this one.
Home Price Growth Slows Most Since 2011 As Case-Shiller Rolls Over
Amid the collapse on US home sales, as mortgage rates surge above 5.00%, August’s Case-Shiller home price data plunged to its weakest annual growth since Dec 2016, dramatically missing expectations).
Against expectations of a 5.80% YoY rise, August home prices rose 5.49% (slowing from July’s 5.90% YoY) to its weakest since Dec 2016…

This is the biggest two-month slowdown in Case-Shiller home price growth since 2014…

On a non-seasonally-adjusted basis, home prices rose 5.77%, down from 5.99%, the lowest since June 2017.
And judging by mortgage rates, it’s about to get a whole lot worse…

Of course, the establishment is saying this is “contained”:
“Following reports that home sales are flat to down, price gains are beginning to moderate,” David Blitzer, chairman of the S&P index committee, said in a statement. “There are no signs that the current weakness will become a repeat of the crisis, however.”
Las Vegas had the biggest annual increase at 13.9 percent, followed by San Francisco at 10.6 percent and Seattle at 9.6 percent,

But Seattle’s price appreciation slumped MoM…the biggest drop since Feb 2011…

Is it any surprise that home builder stocks have collapsed along with US housing data?

September YoY Home Sales Down 13.2%, Median Price Down 3.5%, S&P Down 6.5% From High
New Home Sales (SAAR) in September plunged to their lowest since Dec 2016, crashing 5.5% MoM (and revised dramatically lower in August)… Maybe Trump has a point on Fed rate hikes?
Remember this is the first month that takes the impact of the latest big spike in rates – not good!
This is a disastrous print:
August’s 629k SAAR was revised drastically lower to 585k and September printed 553k (SAAR) massively missing expectations of 625k (SAAR) – plunging to the weakest since Dec 2016…

That is a 13.2% collapse YoY – the biggest drop since May 2011

The median sales price decreased 3.5% YoY to $320,000…

New homes sales were down across all regions … except the midwest.

As the supply of homes at current sales rate rose to 7.1 months, the highest since March 2011, from 6.5 months.

The decline in purchases was led by a 40.6 percent plunge in the Northeast to the lowest level since April 2015 and 12 percent drop in the West.
70% Of S&P 500 Stocks Are Already In A Correction
Spooked by fears about peak profits, the slowing Chinese economy, Trump’s tariffs, ongoing political turmoil in the UK and Italy, and ongoing jitters among systematic, vol-targeting funds, on Tuesday the S&P tumbled as much as 2.34% in early trade – a drop which almost wiped out all gains for the year – before paring losses and closing only -0.55% lower. The drop pushed the S&P’s decline from its September highs to 6.5%, two-thirds on the way to a technical correction.

However the relatively stability at the index level has masked turmoil among individual names where some 1,256 stocks hit 52-week lows, while only 21 establishing new highs.

More concerning, and a testament to the tech-heavy leadership of the market concentrated amid just a handful of stocks, is that while the broader S&P 500 index has yet to enter a correction, more than three quarters of all S&P stocks – or 353 – have already fallen more than 10% from their highs. Worse, of those, more than half 179 have already fallen by 20% or more from their highs, entering a bear market.

The reason why the broader index has so far avoided a similar fate is because Apple, whose $1 trillion market value makes it by far the most heavily weighted stock within the S&P 500, has fallen only 4.6% from its October 3 record high. That has helped the S&P 500 itself stay out of correction territory.
Broken down by sector, the S&P 500 materials index – the closest proxy of Chinese economic growth – has fared the worst in October, leaving it down 19% from its 52-week highs, with the utilities index is the outperformer, down just 5 percent.

At the individual level, among the bottom 10 S&P 500 performers, are names likes Wynn Resorts and Western Digital, both highly exposed to China. Nektar Therapeutics and Newell Brands are also among the S&P 500’s worst performers.

Taking a step back, despite its relative resilience, the S&P 500 is still on track for its worst month since August 2015, while most global equities are down for the year. North America is still the best performing region with 67% of the six countries having benchmark equities trading higher on the year in US dollar terms, according to Deutsche Bank. In EMEA, only 23% of countries are up, and only 6% of countries in the European Union (in USD). In South American (6 countries) and Asia (18), not a single country has a positive return in USD terms this year.
One day later, and despite widespread call for an imminent market bounce, traders remain completely ambivalent as today’s market cash open action shows:
- Half of S&P 500 stocks rising, half falling
- 5 of 11 S&P 500 groups rising, 6 falling
- 15 DJIA stocks rising, 15 falling
Meanwhile, the Nasdaq has a more negative tone with decliners outpacing advancers. In other words, as Bloomberg’s Andrew Cinko writes, “there’s no follow through on either the upside or the downside after yesterday’s epic rebound. At this moment, he who hesitates isn’t lost, in fact, he’s got a lot of company as stock market pundits engage in verbal duel over where we go from here.”
“The Slowing Is Widespread” – US Home Price Growth Slowest In 11 Months
The US housing market just took another hit as Case-Shiller reported that home prices (in July) rose at the slowest pace since August last year, missing expectations notably.
20-city property values index increased 5.9% y/y (est. 6.2%), least since Aug. 2017, after rising revised 6.4%.

This was the biggest miss since May 2016

July marked the fourth consecutive month that annual price gains in the 20-city index decelerated. That’s in sync with other reports indicating housing is stalling as buyers shy away from higher prices amid mortgage rates near the highest since 2011, in addition to a lack of choice among affordable properties. At the same time, steady hiring and elevated confidence are supporting demand.
“Rising homes prices are beginning to catch up with housing,” says David M. Blitzer, Managing Director and Chairman of the Index Committee at S&P Dow Jones Indices.
“The slowing is widespread: 15 of 20 cities saw smaller monthly increases in July 2018 than in July 2017. “
But despite slowing home price appreciation, all cities saw prices rise faster than income growth.

Sales of existing single family homes have dropped each month for the last six months and are now at the level of July 2016. Housing starts rose in August due to strong gains in multifamily construction. The index of housing affordability has worsened substantially since the start of the year.
This really should not be a huge surprise given the collapse in US housing macro data and home builder stocks…
 US home building companies relative to the S&P 500 index has been falling since 2017.
 Lumber futures, a harbinger for housing, are down solidly on the year amid weaker demand.
Probably time for some more rate-hikes…
International Buyers Are Dropping Out Of US Housing

- The dollar volume of U.S. home sales to international buyers between April 2017 to March 2018 dropped 21 percent compared with the previous 12-month period, according to the National Association of Realtors.
- Buyers from China, Canada, India, Mexico and the United Kingdom accounted for nearly half of the dollar volume of sales to international buyers.
- Sales to Canadian buyers fell by 45 percent.
After strong interest for several years, international buyers appear to be souring on the U.S. housing market.
The dollar volume of U.S. home sales to international buyers between April 2017 and March 2018 dropped 21 percent compared with the year-ago period, according to the National Association of Realtors.
Of the $121 billion in sales to international buyers, those currently living in the U.S purchased $67.9 billion in properties, while nonresident foreigners purchased $53 billion, both marking a drop from the previous year. Foreign buyers accounted for 8 percent of the $1.6 trillion in existing home sales, a drop from 10 percent the previous year.
While high home prices and inventory shortages are clearly playing some role in the drop. Competition from domestic buyers, whose demand is increasing sharply, may also be a deterrent. And the current political climate in the U.S. also should not be overlooked.
“The decline is partly coming off high levels of the prior year, but also surely from the strong rhetoric coming out of Washington against foreigners,” said Lawrence Yun, chief economist for the Realtors. “There has been a large drop-off in foreign students attending U.S. universities already. Chinese [buyers], in particular, purchase homes for their kids while attending college.”
China still leads the pack for international buyers, as it has for six straight years, accounting for 15 percent of international sales. Chinese buyers also purchased the most expensive homes, with a median price of $439,100.
Canada came in second, with a 10 percent share of international sales, but the Canadians’ dollar volume dropped by 45 percent compared to the previous year. Not only are Canadians buying fewer U.S. properties, they are buying cheaper U.S. properties. The median price for Canadian buyers was $292,000.
“The market here is softer, and I imagine that’s why there are perhaps less Canadian buyers,” said Elli Davis, a real estate agent based in Toronto. “That does surprise me, though, as I still know lots of people buying mostly in Florida!”
Buyers from China, Canada, India, Mexico and the United Kingdom accounted for nearly half of the dollar volume of sales to international buyers. Canadian buyers had been the market leaders by far during the U.S. recession. They dropped back significantly as U.S. home prices recovered, Chinese buying increased and U.S. investor purchases climbed.
“Inventory shortages continue to drive up prices and sustained job creation and historically low interest rates mean that foreign buyers are now competing with domestic residents for the same, limited supply of homes,” Yun said.
High prices could certainly be a deterrent for buyers in Southern California. Chinese buyers have been very strong in the single-family market there, as they plan for their children to attend area universities. Irvine, especially, saw huge demand from Chinese buyers, particularly in newly built communities, with larger, multi-generational homes that they favor.
For international investors who are looking for condominiums in large cities as an investment, the supply theory doesn’t really hold.
“I don’t think it’s the supply issue because these buyers are buying in the higher end and there is more supply there, particularly in the gateway cities like Miami and New York,” said Sam Khater, chief economist at Freddie Mac. “It could be just that their appetite for U.S. real estate is waning.”
Rents Surge Most in 16 Months Pressuring Home Buyer Wannabees

The Rent Cafe’s Monthly Rent Report for the 250 largest US cities shows a 3.2% Y-o-Y surge.
The national average rent in April clocked in at $1,377. This marks the highest annual growth rate since the end of 2016.
By Size
- Large cities: Las Vegas sees the fastest increasing rents Y-o-Y (6.0%), followed by Denver (5.8%) and Detroit (5.4%). Apartment prices in Brooklyn and Manhattan continue to slide, while rents in Washington, D.C., Portland, and Austin have been steady, growing by less than 1.5%.
- Mid-size cities: Rents in Sacramento cooled down to 6%, but still lead. At the other end of the spectrum are New Orleans (-2.2%), Tulsa (0.5%), and Wichita (1.0%), where rents are growing the slowest.
- Small cities see the top 20 most significant rent increases in April. Rents in the Midland-Odessa area skyrocketed for another month, 35.6% and 32.6% respectively. At the bottom of the list sit Norman (-2.5%), Lubbock (-2.5%), and Alexandria (-1.1%).
- No significant fluctuation in prices was noticed in Chicago, Philadelphia, and San Francisco, where apartment rents grew slower than 2% over the year.
Significant Changes

Wages Aren’t Keeping Up

The above chart was released today by the BLS. For details, please see Jobs Report: Payroll Miss +164K, Nonfarm Wage Growth Anemic +0.1%.
BLS in Agreement

The BLS also has rent of primary residence up 3.6% (from March).
Median New Home Sales Price

Median Real Wages

Home Buyer Wannabee Dilemma
Home buyer wannabees struggle with rents but cannot afford houses.
The most recent data for median wages is from May of 2016. May of 2017 will be out soon and I will update the chart.
New buyers struggle with rent but home buying is not an option.
Real median wages are down seven of the last 11 years while home prices (not even reflected in the CPI), have soared.
How the Fed’s Inflation Policies Crucify Workers in Pictures
For median wage details, please see How the Fed’s Inflation Policies Crucify Workers in Pictures
Deflationary Bust Coming
The current setup leads to another deflationary collapse as we saw in 2008-2009, not an inflation boom.
“If I were trying to create a deflationary bust, I would do exact exactly what the world’s central bankers have been doing the last six years,” said Stanley Druckenmiller, 2018 recipient of the Alexander Hamilton award.
That is precisely what I have been saying for a long time.
For an explanation of the coming deflationary collapse, please see Can We Please Try Capitalism? Just Once?
“The Home Price Surge Continues” – Case-Shiller Jumps Most In 4 Years, All Cities Up
US housing data has been disappointing so far in 2018 as affordability plummets on the heels of rising rates, but that didn’t stop Case-Shiller Home Prices from surging at a faster-than-expected 6.4% YoY in January.
Home sales, permits, and starts have been underwhelming so far this year…

But according to Case-Shiller, home prices are accelerating at their fastest rate since July 2014 (up 6.4% YoY vs 6.15% YoY exp)…

All 20 cities in the index showed year-over-year gains, led by a 12.9 percent increase in Seattle and an 11.1 percent gain in Las Vegas.
After seasonal adjustment, Seattle, San Francisco and Atlanta had the biggest month-over-month gains.
Washington has the smallest month-over-month advance at 0.2 percent.
“The home price surge continues,” David Blitzer, chairman of the S&P index committee, said in a statement.
“Two factors supporting price increases are the low inventory of homes for sale and the low vacancy rate among owner-occupied housing.”
The 20-City Home price index is less than 1% away from the record highs of 2006…

But the National home price index is over 6% above 2006 highs…

New Home Sales Crashed In December As Prices Reached Record Highs
Following yesterday’s disastrous drop in existing home sales (due to record low supply), new home sales plunged 9.3% MoM after November saw its biggest surge since Jan 1992, revised dramatically lower.
The November 17.5% spike was revised dramatically down to 15.0% spike – the highest since 1993 but December’s 9.3% plunge was already worse than the expected 7.9% giveback…
Biggest MoM drop since Aug 2016.

In fact the downward revisions are huge… October from 624K to 599K; November from 733K to 689K
As good as it gets?

While the blame is immediately laid on weather, the regional drops show that is simply not correct:
Purchases fell in all four U.S. regions, led by a 10 percent drop in the Midwest and a 9.8 percent slide in the South.
Median Home Prices reached a new record high…at $335,400

As Bloomberg notes, new-home sales, tabulated when contracts get signed, account for about 10 percent of the market. They’re considered a timelier barometer than purchases of previously owned homes, which are calculated when contracts close and are reported by the National Association of Realtors.
But the ongoing lack of supply remains the most notable aspect in the US housing ‘recovery’.
Alhambra’s Jeffrey Snider notes critically that it’s what’s going on underneath the headline that really matters (as always). The reluctance of Americans to sell their houses has become such a contradiction to the attempt to paint the housing market, and therefore the overall economic condition, as healthy, even robust. Prices are rising, in some places quickly. Yet, inventory of available-for-sale homes continues to decline, sharply once again in December.

It’s a glaring dichotomy that ever the NAR’s Chief Economist, Larry Yun, has been forced to grudgingly address.
Existing sales concluded the year on a softer note, but they were guided higher these last 12 months by a multi-year streak of exceptional job growth, which ignited buyer demand. At the same time, market conditions were far from perfect. New listings struggled to keep up with what was sold very quickly, and buying became less affordable in a large swath of the country. These two factors ultimately muted what should have been a stronger sales pace.
It’s the “exceptional job growth” premise that leads toward only confusion. It’s one of those terms, like “globally synchronized growth” or “economic boom”, that refers quite differently to only the mainstream depiction of the economy, the one that has been consistently overoptimistic about things for a decade. The actual data suggests an entirely separate set of circumstances, which is where all this misunderstanding comes in.
In truth, falling inventory is quite easily explained, and in a way that is perfectly consistent with labor market and national (labor) income statistics as they are. The BLS outside of the unemployment rate, which, for the nth time doesn’t include Americans who would work if there was work, actually has been describing a consistently and persistently slowing labor market. The timing of where that started matches with where resale inventory began to contract.

There is actually a big difference between an average payroll gain of 150k and 250k; the latter is barely minimal, while the former is what panicked the Fed into launching QE3 in 2012. Last year was by every reasonable measure not even close to a good one for American workers.

The primary effect of sluggish, constrained payroll expansion, along with parallel effects in other labor factors, is weakened aggregate income. Even people who are working start to become uncertain or even fearful when the jobs market as a whole slows down – and not just slows, but continues to decelerate year after year (after year). This trend will be starting its fourth year. At that length, workers and prospective workers become quite certain about their general uncertainty.

If your ground-level view of the jobs environment and therefore economy is far more unsteady and dour than exceptional, you are not going to be as sure about selling your existing home to move up, taking on a larger monthly payment in the process. The more people like you who pass on the opportunity to cash in on higher prices, the more that says this is a widespread view quite different from the narrative established in consumer sentiment surveys and what news outlets write about in their headlines.
The economy is what actually happens, not what people think other people think Economists say is happening. Talk isn’t cheap, it’s way overvalued.
Average U.S. Home Is Selling After Just 3 Weeks On Market; Fastest Pace In At Least 30 Years

Earlier today Bloomberg shared their thoughts that recent data released by the National Association of Realtors (NAR), namely the fact that homes are sitting on the market for a record low average of just 3 weeks before being scooped up, pointed to a devastating shortage of housing inventory for sale. Here was Bloomberg’s take:
Here’s more evidence that the defining characteristic of the U.S. housing market is a shortage of inventory for sale: Homes are sitting on the market for the shortest time in 30 years, according to an annual report on homebuyers and sellers published today by the National Association of Realtors.
The typical home spent just three weeks on the market, according to the report, which focused on about 8,000 homebuyers who purchased their home in the year ending in June. That was down from four weeks in the year ending June 2016 and 11 weeks in 2012, when the U.S. housing market was still reeling from the foreclosure crisis. It was the shortest time since the NAR report began including data on how long homes spend on the market, in 1987.
Buyers are snapping up homes quickly at a time when for-sale listings are in short supply, forcing them to compete. The number of available properties declined in September, according to NAR’s monthly report on existing home sales, marking the 28th consecutive month of year-on-year decline in inventory.

Moreover, the “inventory shortage’ thesis was further reinforced by data showing that a growing percentage of buyers are once again having to pay asking price or more to win their fair share of the American dream.
In addition to moving fast, buyers also had to pony up to close the deal. Forty-two percent of buyers paid at least the listing price, the highest share since the NAR survey started keeping track in 2007.
“With the lower end of the market seeing the worst of the supply crunch, house hunters faced mounting odds in finding their first home,” said Lawrence Yun, NAR chief economist, in a statement. “Multiple offers were a common occurrence, investors paying in cash had the upper hand, and prices kept climbing, which yanked homeownership out of reach for countless would-be buyers.”

That said, while Bloomberg has taken the ‘glass half full’ approach in it’s analysis, one could also easily make the argument that the housing market isn’t suffering from a lack of supply at all but rather an artificially high level of demand courtesy of a combination of perpetually low interest rates and taxpayer subsidized mortgages that require minimal down payments of just 3%.
For evidence of the slightly more pessimistic assessment of the housing market, one has to simply review the fine print included in the NAR report which reveals that the average first-time homebuyer is financing roughly 95% of their purchase price and the tightest housing markets are those that fall below FHA limits. So, what does that tell you about how “tight” housing markets would be if they weren’t subsidized by the U.S. taxpayer?
Of course, to suggest that millennials should hold off on purchasing a home until they can actually afford a debt-to-equity ratio somewhere south of 19x is probably considered a hate crime in many social circles so we can understand why it might be avoided.
Know the Competition: Who’s Buying Homes, Who’s Selling—and Who’s Not?

With soaring rental prices, extremely low mortgage rates, and a stronger economy, it seems that just about everyone wants to buy a home these days. But high home prices are keeping many aspiring homeowners, as well as would-be sellers (who need a new home to move into) out of the market.
So who is buying and selling these days?
It turns out the typical buyer and seller both are getting older—and buyers need to make more money to be able to afford a home of their own, according to the 2017 Profile of Home Buyers and Sellers by the National Association of Realtors®. The report is based on a 131-question survey filled out by nearly 8,000 recent home buyers.
It turns out the typical buyer and seller both are getting older—and buyers need to make more money to be able to afford a home of their own, according to the 2017 Profile of Home Buyers and Sellers by the National Association of Realtors®. The report is based on a 131-question survey filled out by nearly 8,000 recent home buyers.
“Prices are going up,” says Chief Economist Danielle Hale of realtor.com®. “So in order to get into the housing market, buyers need to have more income to afford the same type of properties.”
Who is the typical home buyer these days?
Home buyers come in all shapes and sizes, but the typical one is about 45 years old. That’s up considerably since 1981, the inaugural year of the report, when the median age was just 31.
Buyers these days are also making good money, at about $88,800 a year, according to the report. It was $88,500 in the previous year.
Most buyers preferred the suburbs and more rural areas, at 85%, compared with urban areas, which is where just 13% of folks bought homes. And the vast majority, 83%, also preferred a stand-alone, single-family house, the kind that typically has a lawn out back.
The suburbs reigned supreme because that’s where many of the available homes with the desired features are, says Hale.
“Properties tend to be a bit more affordable than in urban areas,” Hale says. “You’ll get much more space in the suburbs for your money than you will in an urban area, and the schools do tend to be better as well.”
Calling all the single ladies
In another indication of just how much things can change in 36 years, about 18% of home sales were made by single women. That’s up from 17% last year and just 11% in 1981. And while it’s still well below the 65% of sales that married couples scooped up, it’s ahead of the 7% of sales that unmarried men made. An additional 8% of closings were made by unmarried couples.
There are more single women today than there have been historically, says Jessica Lautz, NAR’s managing director of survey research and communications. She points to how folks are marrying later in life, or not at all. Or, some may have been married before and become widowed or divorced.
Being able to have a 30-year fixed mortgage provides financial security, compared with facing rising rental prices, Lautz says.
In addition, single women buy homes that cost just a little bit more than single men: a median $185,000 versus $175,000 for the men. And that’s despite often making less than their male counterparts.
Fewer first-time buyers are getting in on the action
High student debt, coupled with rising home prices, kept many first-time buyers out of the market. These real estate virgins made up only about 34% of home sales, according to the report. That’s slightly down from 35% last year and the long-term average of 39%.
Those who were able to buy a home were a median age of 32.
“Right around turning 30 is still a significant milestone in many people’s lives,” says Hale. “That’s why we tend to see a lot of first-time buyers.”
These buyers typically had a household income of about $75,000, up from $72,000 last year. They were likely to buy a 1,650-square-foot abode for about $190,000 in a suburban area.
“The dreams of many aspiring first-time buyers were unfortunately dimmed over the past year by persistent inventory shortages,” NAR’s Chief Economist Lawrence Yun said in a statement. “Multiple offers were a common occurrence, investors paying in cash had the upper hand, and prices kept climbing, which yanked homeownership out of reach for countless would-be buyers.”
Big student loan bills due every month also make it harder for many of these younger folks to save up for a down payment. And it could affect their debt-to-income ratios, which lenders look at before issuing mortgages.
About 41% of first-time buyers have debt, according to NAR’s report, up from 40% last year. And they now owe about $29,000—compared with $26,000 in 2016. Ouch.
“An overwhelming majority of millennials with student debt believe it’s delaying their ability to buy a home, and typically for seven years,” Yun said in a statement. “Even in markets with a plethora of job opportunities and higher pay, steep rents and home prices make it extremely difficult to put savings aside for a down payment.”
What kinds of homes are buyers snagging?
Buyers overwhelmingly opted for existing homes (ones that had previously been lived in), at about 85%, compared with just 15% who closed on brand-new abodes, according to the report. That’s likely because there are fewer newly built homes on the market as well as the newer homes tending to cost significantly more.
They shelled out a median $235,000 on their homes, which were a median 1,870 square feet. The typical home was built in 1991 and had three bedrooms and two bathrooms.
And they’re not moving far away. Usually buyers moved only about 15 miles from their previous home.
Who’s selling their homes?
They typical home seller in 2017 was much older than the typical buyer, at about 55 years old. Their household incomes were also higher, at about $103,300 a year.
“The age of sellers and repeat buyers continues to increase,” says NAR’s Lautz. That’s because many baby boomers are purchasing retirement homes later in life.
The top reasons for selling were a residence that was too small, the desire to be close to family and friends, and the need to relocate for work.
Sellers usually stayed about 10 years in their homes before putting them on the market. Their properties stayed on the market for a median of three weeks, compared with four weeks last year.
And, in a boon for sellers, they sold their homes for a median $47,500 more than what they originally paid for them, and got about 99% of their final listing price.
Pending Home Sales Plunge; NAR Admits “The Housing Market Has Essentially Stalled”

After dismal drops in existing and new home sales, this morning’s pending home sales data for August was a disaster, tumbling 2.6% MoM (3.1% YoY) to its lowest SAAR since January 2016.

This is the second YoY decline in sales in a row, with SAAR tumbling to its lowest since Jan 2016…

Lawrence Yun, NAR chief economist, says this summer’s terribly low supply levels have officially drained all of the housing market’s momentum over the past year.
“August was another month of declining contract activity because of the one-two punch of limited listings and home prices rising far above incomes,” he said.
“Demand continues to overwhelm supply in most of the country, and as a result, many would-be buyers from earlier in the year are still in the market for a home, while others have perhaps decided to temporarily postpone their search.”
With little relief expected from the housing shortages that continue to plague several areas, Yun believes the housing market has essentially stalled.
Further complicating any sales improvement in the months ahead is the fact that Hurricane Harvey’s damage to the Houston region contributed to the South’s decline in contract signings in August, and will likely continue to do so in the months ahead. Furthermore, the temporary pause in activity in Florida this month in the wake of Hurricane Irma will slow overall sales even more in the South.
Yun now forecasts existing-home sales to close out the year at around 5.44 million, which comes in slightly below (0.2 percent) the pace set in 2016 (5.45 million). The national median existing-home price this year is expected to increase around 6 percent. In 2016, existing sales increased 3.8 percent and prices rose 5.1 percent.
“The supply and affordability headwinds would have likely held sales growth just a tad above last year, but coupled with the temporary effects from Hurricanes Harvey and Irma, sales in 2017 now appear will fall slightly below last year,” said Yun.
“The good news is that nearly all of the missed closings for the remainder of the year will likely show up in 2018, with existing sales forecast to rise 6.9 percent.”
Of course, none of those fun-durr-mentals matter…

Fannie Mae Says Economy Will Slow in 2nd Half Of 2017

WASHINGTON, DC – Expectations for 2017 economic growth remain at 2.0 percent amid a projected second half slowdown, according to the Fannie Mae Economic & Strategic Research (ESR) Group’s July 2017 Economic and Housing Outlook. With the expansion having entered its ninth year, incoming data point to a second quarter economic growth rebound to 2.7 percent annualized, up from 1.4 percent in the first quarter. However, the full percentage point rise in the saving rate since December signals increased caution among consumers, despite elevated consumer confidence. Decelerating corporate profit growth, commonly seen in the late stages of an expansion, presents a challenge to business investment that is compounded by tax policy uncertainty. In addition, residential investment will likely contribute less to second half growth due to lackluster homebuilding activity and tight for-sale inventory that is restraining home sales. Consequently, se cond half growth is expected to slow slightly to 1.9 percent. Moderate growth is expected to continue in 2018, with potential changes to fiscal and monetary policy posing both upside and downside risks to the forecast.
“While second quarter growth is poised to rebound, we expect growth to moderate through the remainder of 2017. Consumer spending, traditionally the largest contributor to economic growth, is sluggish and is lagging positive consumer sentiment and solid hiring,” said Fannie Mae Chief Economist Doug Duncan. “While labor market slack continues to diminish, wage growth is not accelerating and inflation has moved further below the Fed’s target. These conditions support our call that the Fed will continue gradual monetary policy normalization, announce its balance sheet tapering policy in September, and wait until December for additional data, especially on inflation, before raising the fed funds rate for the third time this year.”
“Construction activity has lost some steam following the first quarter’s weather-driven boost,” Duncan continued. “Meanwhile, very lean inventory continues to act as a boon for home prices and a bane for affordability, particularly among potential first-time homeowners. According to our second quarter Mortgage Lender Sentiment Survey, lenders expect to ease credit standards further. However, we continue to project that the pace of growth in total home sales will slow to 3.3 percent this year, as we believe rapid home price gains amid scarce supply will remain a hurdle for potential homebuyers despite improvements in credit access.”
Visit the Economic & Strategic Research site at www.fanniemae.com to read the full July 2017 Economic Outlook, including the Economic Developments Commentary, Economic Forecast, Housing Forecast, and Multifamily Market Commentary. To receive e-mail updates with other housing market research from Fannie Mae’s Economic & Strategic Research Group, please click here.
Existing Home Sales Down 1.8% In June And Why It Matters

Existing Home Sales in June Dive 1.8 Percent: Same Old Problem? Second and Third Quarter Impact?
The wind down to the end of the second quarter is not going very well. Existing home sales in June fell 1.8% to a seasonally adjusted annualized rate of 5.52 million. The Econoday consensus estimate was 5.58 million.
The slip in pending home sales was no false signal as existing home sales fell 1.8 percent in June to a lower-than-expected annualized rate of 5.520 million. Year-on-year, sales are still in the plus column but not by much, at 0.7 percent which is the lowest reading since February.
Compared to sales, prices are rich with the median of $263,800 up 6.5 percent from a year ago. Another negative for sales is supply which fell 0.5 percent in the month to 1.96 million for an on-year decline of 7.1 percent. Relative to sales, supply is at 4.3 months vs 4.2 months in May.
High prices appear to be keeping first-time buyers out of the market with the group representing 32 percent of sales vs 33 percent in May and 35 percent for all of last year.
Rising prices and thin supply, not to mention low wages, are offsetting favorable mortgage rates and holding down sales. Housing data have been up and down and unable to find convincing traction so far this year. Watch for new home sales on Wednesday where general strength is the expectation.
Existing Homes Sales Month-Over-Month and Year-Over-Year

Same Old Problem?
Mortgage News Daily says Existing Home Sales Weakness Blamed on Same Old Problem.
Existing home sales slipped in June, with the blame again placed on low levels of inventory. The decline in sales, announced on Monday by the National Association of Realtors® (NAR), was anticipated, as pending home sales have decreased in each of the previous three months, ticking down 0.8 percent in May.
NAR said sales of existing single-family houses, townhouses, condos and cooperative apartments were down 1.8 percent in June, to a seasonally adjusted annual rate of 5.52 million units, the second slowest performance of the year.
Lawrence Yun, NAR chief economist, says the pullback in existing home sales in June reflected the lull in contract activity in March, April, and May. “Closings were down in most of the country last month because interested buyers are being tripped up by supply that remains stuck at a meager level and price growth that’s straining their budget,” he said. “The demand for buying a home is as strong as it has been since before the Great Recession. Listings in the affordable price range continue to be scooped up rapidly, but the severe housing shortages inflicting many markets are keeping a large segment of would-be buyers on the sidelines.”
The median existing-home price for all housing types in June was $263,800, up 6.5 percent from June 2016 ($247,600). This is a new peak price, surpassing the record set in May. June marked the 64th straight month of year-over-year gains.
The median existing single-family home price was $266,200 in June and the median existing condo price was $245,900. Those prices reflected annual increases of 6.6 percent and 6.5 percent respectively.
The tight supply of homes continues to be reflected in short marketing period. Properties typically stayed on the market for 28 days in June, one day more than in May, but six days fewer than in June 2016. Short sales were on the market the longest at a median of 102 days in June, while foreclosures sold in 57 days and non-distressed homes took 27 days. Fifty-four percent of homes sold in June were on the market for less than a month.
“Prospective buyers who postponed their home search this spring because of limited inventory may have better luck as the summer winds down,” said NAR President William E. Brown. “The pool of buyers this time of year typically begins to shrink as households with children have likely closed on a home before school starts. Inventory remains extremely tight, but patience may pay off in coming months for those looking to buy.”
First-time buyers accounted for 32 percent of existing home sales in June, down from 33 percent the previous month and a year earlier, while individual investors purchased 13 percent, unchanged from a year ago.
Convoluted Logic
Supposedly buyers may have better luck because the pool of buyers is shrinking as summer winds down. Really? By that logic, if there was only one person looking there would be a 100% success rate.
Yun says “The demand for buying a home is as strong as it has been since before the Great Recession.”
Really? By what measure?
Attitudes and Price
This is not a case of inventory or strong unmet demand. Here are the real factors.
- The Fed re-blew the housing bubble and wages did not keep up. People cannot afford the going prices. Thus, the number of first-time buyers keeps shrinking.
- Millenials do not have the same attitudes towards debt, housing, and family formations as their parents.
- Millenials are unwilling to spend money they do not have, for a place that will keep them tied down. They would rather be mobile.
Second and Third Quarter Impact
The decline in existing home purchases portends weakness in consumer spending.
There will be fewer people painting, buying furniture, updating appliances, remodeling kitchens, adding landscaping etc. The pass through effect will be greatest in the third quarter unless there is a rebound.
Premium Homes Dominate Inventory For Sale
Don’t Call It A Comeback: How Rising Home Values May Be Stifling Inventory

By Ralph McLaughin | Chief Economist For Trulia
U.S. home inventory tumbled to a new low in the first quarter of 2017, falling for eight consecutive quarters. Homebuyers have now been stifled by low inventory for the last two years despite prices rising to pre-recession highs in many markets.

In this edition of Trulia’s Inventory and Price Watch, we examine how home value recovery may be limiting supply in markets that have recovered most. We find that homebuyers in markets with the biggest gains are facing the tightest supply.
The Trulia Inventory and Price Watch is an analysis of the supply and affordability of starter homes, trade-up homes, and premium homes currently on the market. Segmentation is important because home seekers need information not just about total inventory, but also about inventory in the price range they are interested in buying. For example, changes in total inventory or median affordability don’t provide first-time buyers useful information about what’s happening with the types of homes they’re likely to buy, which are predominantly starter homes.
Looking at the housing stock nationally and in the 100 largest U.S. metros from Q1 2012 to Q1 2017, we found:
- Nationally, the number of starter and trade-up homes continues drop, falling 8.7% and 7.9% respectively, during the past year, while inventory of premium homes has fallen by just 1.7%;
- The persistent and disproportional drop in starter and trade-up home inventory is pushing affordability further out of reach of homebuyers. Starter and trade-up homebuyers need to spend 2.9% and 1.6% more of their income than this time last year, whereas premium homebuyers only need to shell out 0.9% more of their income;
- A strong recovery may be partly to blame for the large drop in inventory some markets have experienced over the past five years. On average, the more valuable a market’s housing is compared to pre-recession levels, the larger drop in inventory it is has seen.

2017 Ushers in a Dramatic Shortage of Homes
Nationally, housing inventory dropped to its lowest level on record in 2017 Q1. The number of homes on the market dropped for the eighth consecutive quarter, falling 5.1% over the past year. In addition:
- The number of starter homes on the market dropped by 8.7%, while the share of starter homes dropped from 26.1% to 25.9%. Starter homebuyers today will need to shell out 2.9% more of their income towards a home purchase than last year;
- The number of trade-up homes on the market decreased by 7.9%, while the share of trade-up homes dropped from 23.9% to 23%. Trade-up homebuyers today will need to pay 1.6% more of their income for a home than last year;
- The number of premium homes on the market decreased by 1.7%, while the share of premium homes increased from 50% to 51%. Premium homebuyers today will need to spend 0.6% more of their income for a home than last year.


How and Where a Strong Housing Market May Be Hurting Inventory
In the first edition of our report, we provided a few reasons why inventory is low: (1) investors bought up much of the foreclosure home inventory during the financial crisis and turned them into rental units, (2) price spread – that is, when prices of homes in different segments of the housing market diverge from each other – makes it difficult for existing homeowners to tradeup to the next the segment, and (3) slow home value recovery was making it difficult for some homeowners to break even on their homes. While there is evidence that investors indeed converted owner-occupied homes into rentals as well as evidence from our first report that increasing price spread is correlated with decreases in inventory, little work has examined how home value recovery affects inventory. This is perhaps due to the tricky conceptual relationship between home values and inventory: too little recovery might make it difficult for homeowners to sell their home but cheap to buy one, while too much recovery might make it easy for them to sell but difficult to buy.

In fact, we find a negative correlation between how much a housing market has recovered and how much inventory has changed over the past five years. Using the current value of the housing market relative to the peak value as our measure of recovery, we find markets with greater home value recovery have experienced larger decreases in inventory over the past five years. The linear correlation was moderate (-0.36) and statistically significant. We also found that markets with the strongest recovery, on average, have experienced the largest decreases in inventory.
For example, the five-year average change in inventory of housing markets currently valued below their pre-recession peak (< 95% of peak value) isn’t that different from ones that have recovered to 95% – 105% of their peak. (-27.6% vs. -30.1%). However, the average change in inventory in well-recovered markets (> 105%) is 0more drastic at -45.4%.
The disparity also persists when looking at changes in inventory within each segment, although the difference is largest for starter homes. On average, markets with less than 95% recovery or 95% to 105% recovery had a 34.2% and 31.7% decrease in starter inventory, while markets with more than 105% home value recovery had a whopping 58.2% drop. These findings suggest that a moderate home value recovery doesn’t affect inventory much, but a strong recovery does and impacts inventory of starter homes the most.
Fed Announced They’re Ready To Start Shrinking Their 4.5T Balance Sheet ― Prepare For Higher Mortgage Rates
Federal Reserve Shocker! What It Means For Housing
The Federal Reserve has announced it will be shrinking its balance sheet. During the last housing meltdown in 2008, it bought the underwater assets of big banks. It has more than two trillion dollars in mortgage-backed securities that are now worth something because of the latest housing boom. Gregory Mannarino of TradersChoice.net says the Fed is signaling a market top in housing. It pumped up the mortgage-backed securities it bought by inflating another housing bubble. Now, the Fed is going to dump the securities on the market. Mannarino predicts housing prices will fall and interest rates will rise.
Wild Swings in New Home Sales: Median Price Down, Average Price Up
New home sales shot up 6.1% in February aided by 39% jump in the mid-west but a 21.4% decline in the Northeast.

Sales came in just a bit below the top Econoday estimate.
New home sales shot 6.1 percent higher in February to a 592,000 annualized rate that easily beats the Econoday consensus for 565,000 and is near the top estimate of 600,000. Sales appeared to have gotten a boost from builder concessions as the median price fell a monthly 3.9 percent to $296,200 for a year-on-year rate that’s suddenly in the negative column at minus 4.9 percent.
Strength is centered in the Midwest where the sales rate surged 21,000 to 89,000 and easily surpassing 11,000 gains for the both the West, at 157,000, and the South at 313,000. Sales in the Northeast fell sharply in yesterday’s existing home sales report and are down 9,000 to a very low 33,000 annualized rate in today’s report.
Supply of new homes did rise slightly in the month, up 4,000 to 266,000 currently on the market, but relative to sales supply fell to 5.4 months from 5.6 months. Supply has been thin all cycle for new homes and was at 5.5 months in February last year.
Most of the news is good in this report underscored by the average price which, reflecting high-end properties, jumped 9.9 percent in the month for a yearly 11.7 percent gain at $390,400 and a new record. Today’s report helps offset weakness in existing home sales and keeps the housing sector on a moderately climbing slope.
New Home Sales Jump Second Month
Mortgage News Daily reports New Home Sales Build on January Strength.
New home sales posted a much better February than did existing home sales and, in fact, better than most analysts had expected.
It was the second consecutive month of strength for the indicator which had see-sawed between positive and negative results in the waning months of 2016.
On a non-seasonally adjusted basis, there were 49,000 new homes sold in February compared to 41,000 in January. Thirty-six-thousand of the homes sold were in the $200,000 to 299,000 price tier.
The median price of a new home sold in February was 296,200 compared to $311,300 a year earlier. The average price was $390,400 compared to $349,400.
There were strong geographic differences in the rate of sales. In the Northeast, sales were down 21.4 percent for the month while remaining 13.8 percent higher than the previous February. In contrast, the Midwest posted a 30.9 percent month-over-month improvement and the annual change was 50.8 percent.
Sales in the South rose 3.6 percent from January and 7.9 percent from February 2016 and sales in the West were up 7.5 percent and 6.8 percent from the two earlier periods.
At the end of February, there were an estimated 261,000 homes available for sale on a non-seasonally adjusted basis. This is an estimated 5.4-month supply at the current rate of sale. Sixty-three-thousand of the available homes are completed, construction had not started on 51,000.
Median vs Average Sale
It’s interesting to see the median price dropping with the average price soaring. It’s a tale of two economies and who is and isn’t gaining.
That said, these swings are so wild, I smell revisions.
For now, this should boost GDP estimates.
Used Home Sales Fall From 10-Year Yigh
 U.S. home resales fell more than expected in February amid a persistent shortage of houses on the market that is pushing up prices and sidelining potential buyers.
The National Association of Realtors said on Wednesday existing home sales declined 3.7 percent to a seasonally adjusted annual rate of 5.48 million units last month.
January’s sales pace was un-revised at 5.69 million units, which was the highest level since February 2007. Economists polled by Reuters had forecast sales decreasing 2.0 percent to a pace of 5.57 million units last month.
“Realtors are reporting stronger foot traffic from a year ago, but low supply in the affordable price range continues to be the pest that’s pushing up price growth and pressuring the budgets of prospective buyers,” said Lawrence Yun, the NAR’s chief economist.
Sales were up 5.4 percent from February 2016, underscoring the sustainability of the housing market recovery despite rising mortgage rates. In February, houses typically stayed on the market for 45 days, down from 50 days in January.
U.S. financial markets were little moved by the data as investors increasingly worried whether President Donald Trump would be able to push ahead with his pro-growth policies. The dollar fell against a basket of currencies and U.S. stocks were trading mostly lower. Prices for U.S. government bonds fell.
The 30-year fixed mortgage rate is hovering at 4.30 percent.
Home loans could cost more after the Federal Reserve last week raised its benchmark overnight interest rate by 25 basis points to a range of 0.75 percent to 1.00 percent. The U.S. central bank has forecast two more rate hikes for 2017.
BUOYANT LABOR MARKET
Demand for housing is being buoyed by a labor market that is near full employment. But home sales remain constrained by the dearth of properties available for sale, which is keeping prices elevated.
While the number of homes on the market increased 4.2 percent to 1.75 million units last month, housing inventory remained close to the all-time low of 1.65 million units hit in December. Supply was down 6.4 percent from a year ago.
Housing inventory has dropped for 21 straight months on a year-on-year basis. With supply remaining tight, the median house price surged 7.7 percent from a year ago to $228,400 in February. That marked the 60th consecutive month of year-on-year price gains.
Builders have been unable to fill the housing inventory gap, citing rising prices for materials, higher borrowing costs, and shortages of lots and labor.
Lennar Corp, the second-largest U.S. homebuilder, reported on Tuesday a drop in quarterly gross margin as the company struggled with higher land and construction costs.
The Florida-based builder, however, sold 5,453 homes in the first quarter ended Feb. 28, up from 4,832 homes in the year-earlier period, and reported a 12 percent jump in orders.
The NAR estimates housing starts and completions should be in a range of 1.5 million to 1.6 million units to alleviate the chronic shortage. Housing starts are running above a rate of 1.2 million units and completions around a pace of 1 million units.
At February’s sales pace, it would take 3.8 months to clear the stock of houses on the market, up from 3.5 months in January. A six-month supply is viewed as a healthy balance between supply and demand. Though higher prices are increasing equity for homeowners and might encourage some to put their homes on the market, they could be sidelining first-time buyers from the market. First-time buyers accounted for 32 percent of transactionslast month, well below the 40 percent share that economists and realtors say is needed for a robust housing market.
That was down from 33 percent in January but up from 30 percent a year ago.
Who’s Supporting The “New Normal” Housing Market in 2017?

“A housing recovery that is highly dependent on real estate investors is a bit of a double-edged sword,” explained Daren Blomquist, senior VP at ATTOM Data Solutions. “Rapidly rising home values have been good for homeowner equity, but also have caused an affordability crunch for the first-time home buyers the housing market typically relies on for sustained, long-term growth.”
So the housing market is “starkly different than a decade ago,” said Alex Villacorta, VP of research and analytics at Clear Capital. “As such, it’s imperative for all market participants to understand the nuances of the New Normal Real Estate Market.”
They were both commenting on a joint white paper by ATTOM and Clear Capital, titled “Landlord Land,” that analyzes who is behind the US housing boom that drove home prices to new all-time highs, and in many markets far beyond the prior crazy bubble highs – even as homeownership has plunged and remains near its 50-year low.
First-time buyers are the crux to a healthy housing market, but they aren’t buying with enough enthusiasm. In 2012, buyers with FHA-insured mortgages – “who are typically first-time home buyers with a low down payment,” according to the report – accounted for 25% of all home purchases. In 2013, their share dropped to about 20%, in 2014 to 18%. Then hope began rising, briefly:
However, in January 2015, FHA lowered its insurance premium 50 basis points, and there was a modest resurgence in FHA buyers – a trend perhaps indicative of loosening credit requirements or of a desire to re-enter the housing market for those displaced during the crash.
Their share of home purchases ticked up to 22.3%. Alas, “the FHA resurgence was short lived” and in 2016 eased down to 21.7%.
With first-time buyers twiddling their thumbs, who then is buying? Who is driving this housing market?
Institutional investors? Defined as those that buy at least 10 properties a year, they include the largest buy-to-rent Wall Street landlords, some with over 40,000 single-family homes, who’ve “picked up the low-hanging fruit of distressed properties available at a discount between 2009 and 2013,” as the report put it. That was during the foreclosure crisis, when they bought these properties from banks.
In Q3, 2010, institutional investors bought 7% of all homes. In Q1 2013, their share reached 9.5%. As home prices soared, fewer foreclosures were taking place. By 2014, when home prices reached levels where the large-scale buy-to-rent scheme with its heavy expense structure wasn’t working so well anymore, these large buyers began to pull back. In 2016, the share of institutional investors dropped to just 2% of all home sales.
But as institutional investors stepped back, smaller investors jumped into the fray in large numbers, “willing to purchase in a wider variety of market landscapes and operate on thinner margins.”
To approximate total investor purchases of homes, the report looks at the share of purchases where the home is afterwards occupied by non-owner residents. In 2009, according to this metric, 28% of all home purchases were investor-owned properties. In 2010, it rose to 30%. In 2011, 32%. Then as big investors pulled out, it fell back to 30%. But by 2015, small investors arrived in large numbers, and by 2016, investor purchases jumped to 37%, an all-time high in the ATTOM data series going back 21 years.
The chart shows the share of purchases in a given year. Note the declining share of first-time buyers (blue line), the declining share of institutional investors (gray bars), and the surging share of smaller investors (green line). In other words, smaller investors are now driving this housing boom:

The pie chart below shows the share of properties owned by investor size. Among investors in today’s housing market, small landlords that own one or two properties own in aggregate the largest slice of the rental housing pie – 79%:

However, Wall Street landlords are concentrated in just a few urban areas. For example, Invitation Homes, the 2012 buy-to-rent creature of private-equity firm Blackstone, which owns over 48,000 single-family homes and has nearly unlimited financial resources, including government guarantees on some of its debt, is concentrated in just 12 urban areas, where it has had an outsized impact.
Whereas small investors own properties across the entire country, in urban and rural areas, in cheap markets and ludicrously expensive markets. They own condos, detached houses, duplexes, and smaller multi-unit buildings.
So when the industry tells us about low inventories and strong demand in the housing market, it’s good to remember where a record 37% of that demand in 2016 came from: investors, most of them smaller investors. And when the financial equation no longer works for them, they’ll pull back, just like institutional investors have already done.
Pending Home Sales Unexpectedly Dive In November

The Pending Home Sales Index declined 2.5% in November.
Economists, who are generally surprised by everything, were caught off guard once again.
Despite the fact that mortgage rates have been climbing for months, the economists’ consensus expectation was for pending home sales to rise 0.5%. Not a single economist predicted a decline this month. The range of estimates was 0.3% to 2.0%.
Dispirited Buyers
Mortgage News Daily reports Pending Home Sales Reflect “Dispirited” Buyers.
Pending sales, which were widely expected to make a good showing in November, pulled back sharply instead. The National Association of Realtors® (NAR) said its Pending Home Sales Index (PHSI), a forward-looking indicator based on contracts for existing home purchases, declined 2.5 percent to 107.3 in November from 110.0 in October. NAR said “the brisk upswing in mortgage rates and not enough inventory dispirited some would-be buyers.” The decrease brought the PHSI to its lowest level since January of this year and it is now 0.4 percent below the index last November which stood at 107.7.
Analysts polled by Econoday had been upbeat about the November outlook. The consensus was for an increase of 0.5 percent with some analysts predicting as much as a 2.0 percent gain.
Lawrence Yun, NAR chief economist said, “The budget of many prospective buyers last month was dealt an abrupt hit by the quick ascension of rates immediately after the election. Already faced with climbing home prices and minimal listings in the affordable price range, fewer home shoppers in most of the country were successfully able to sign a contract.”
Only one of the four regions displayed any strength in November. Pending sales in the Northeast were up 0.6 percent to 97.5 and are 5.7 percent higher than in November 2015.
The Midwest saw contract signings decline 2.5 percent to 103.5, falling behind the previous November by 2.4 percent. Sales in the South were down 1.2 percent to an index of 118.7, this is 1.3 percent behind the level a year earlier. The West posted the largest loss, 6.7 percent, and a year-over-year drop of 1.0 percent.
Yun says higher borrowing costs somewhat cloud the outlook for the housing market in 2017. NAR’s most recent HOME survey, found that renters have less confidence about the present being a good time to buy than they had at the beginning of the year. On the other hand, Yun says that the impact of higher rates will be partly neutralized by stronger wage growth because of the 2 million net new job additions expected next year.
The Pending Home Sales Index is based on a large national sample, typically representing about 20 percent of transactions for existing-home sales. An index of 100 is equal to the average level of contract activity during 2001, which was the first year to be examined. By coincidence, the volume of existing-home sales in 2001 fell within the range of 5.0 to 5.5 million, which is considered normal for the current U.S. population. Pending sales are generally expected to close within two months of contract signing.
The notion that strong wage growth and jobs will partially neutralize rising interest rates is silly. But Yun has a mission: Always be as positive as possible about housing.
Economists had a second reason to expect sales would decline: On December 16, I reported Housing Starts Dive 18.7 Percent: Mortgage Rates Soar.
Leak Reveals Secret Tax Crackdown On Foreign-Money Real Estate Deals In Vancouver
Confidential briefing for CRA auditors outlines strategy to tackle suspected tax cheats who do not report global income or who ‘flip’ homes – but reveals that last year, there was only one successful audit of global income for all of British Columbia

A backhoe destroys a C$6 million mansion in Vancouver’s Shaughnessy neighbourhood this year. The destruction of the well-kept home prompted community outrage and was cited in a briefing for Canadian tax auditors looking into Vancouver real estate transactions. Photo: Twitter / @DeborahAMG
A secret strategy briefing for Canada Revenue Agency auditors has revealed plans to crack down on real estate tax cheats in Vancouver, with 50 auditors being assigned to investigate purchases funded by unreported foreign income.
Presentation notes for the seminar, delivered to auditors on June 2 and leaked to the South China Morning Post, show that only one successful audit of worldwide income was conducted in British Columbia in the past year, in spite of Vancouver’s reputation as a hotspot for immigrant “astronaut families” whose breadwinners often work in mainland China and Hong Kong.
The plans, which come amid a furore over the role of Chinese money in Vancouver’s runaway housing market, were provided by a Canada Revenue Agency employee who attended the June 2 briefing. The briefing is identified as a “protected B” confidential document on the cover.

The cover for a confidential CRA briefing for auditors. Photo: SCMP Pictures
But the employee feared the sweep would prove inadequate. “Sure, they’ve upped the numbers because it’s hitting the papers,” they said. But on average, they estimated, each redeployed income auditor would only be able to conduct 10 to 12 audits per year – about 500 or 600 in total. “This is nothing,” compared to the likely scale of the cheating, they said.

Confidential briefing notes for CRA auditors reveal how the Canadian tax agency is targeting unreported global income and other issues related to real estate sales in the Vancouver region. Photo: SCMP Pictures
That estimate is in keeping with the briefing text which says the crackdown will “review the top 500 highest risk files within our region”.
The briefing lists four areas being targeted for audit under the CRA’s “real estate projects”, launched in response to “significant media attention”: unreported worldwide income, property “flipping”, under-reporting of capital gains from home sales, and under-reporting of Goods and Services Tax (GST) on sales of new homes.
‘High-end homes, minimal income’
The time-consuming global income audits will tackle “individuals living in high-valued areas in BC who are reporting minimal income not supporting their lifestyle”, as well as those who buy “high-end homes with minimal income being reported.”

The supposed case of a C$5.8 million home bought by someone who claimed a tax break intended for the poor is cited in the CRA briefing. Photo: SCMP Pictures
The presentation includes a photo of a luxury home supposedly bought for C$5.8million whose owner claimed the “working income tax benefit” for low earners. It also lists the tuition fees of Vancouver private schools.

Confidential briefing notes for CRA auditors show that 50 income tax auditors are being redeployed to tackle real estate cheats in BC. Photo: SCMP Pictures
Property flippers who swiftly resell homes for profit will meanwhile be audited to see if their properties truly qualify for exemption from capital gains tax, granted to people selling their principal residence.
The briefing describes various excuses given by owners who moved out of newly purchased homes, including a negative feng shui report, the “bad omen” of tripping over a crack in the sidewalk, and a painter dying in the home.
Immigration mega-fraud: the rich Chinese immigrants to Canada who don’t really want to live there
It cites the highly publicized case of a well-kept 20-year-old, C$6million mansion that was simply torn down after being bought, prompting community outrage.
Yes, we are getting a response now, but the government has known about this issue for a few years. They held back
The briefing does not say the owners of this home, or the $5.8 million home, are tax cheats and nor does the SCMP suggest so.
The CRA employee said the briefing, which was streamed online, was delivered by CRA’s Pacific region business intelligence director, Mal Gill.

The CRA briefing lists various excuses given by people who moved out of new homes, apparently claimed as principal residences. Photo: SCMP Pictures
Gill declined to discuss the briefing. “I cannot confirm anything to you,” he said, referring the SCMP to a CRA communications manager.

The case of a well-kept C$6million Vancouver home that was simply demolished after purchase is cited in leaked notes for Canadian tax auditors. Photo: SCMP Pictures
A spokeswoman said: “The CRA cannot comment or release information related to risk assessment or non-compliance strategies.”
However, she said real estate transactions in Toronto have been the subject of greater scrutiny, for some years. “More recently, the CRA has been actively monitoring and auditing real estate transactions in British Columbia,” she said.
“For the year ending March 31, 2016, the CRA completed 2,203 files [in BC and Ontario] related to real estate,” she said.
In addition to the 50 redeployed income auditors, the leaked briefing says CRA is assigning 20 GST auditors and 15 other staff to the real estate project in BC.
Children of rich Chinese home alone in Canada face challenges
The CRA source said they leaked the material because, “like many people, I’m pretty disgusted by what’s happening here [in the Vancouver real estate market], and a lack of enforcement has been a part of the problem. Yes, we are getting a response now, but the government has known about this issue for a few years. They held back.”

The CRA briefing reveals that there was just one successful audit conducted on unreported global income in BC last fiscal year. Photo: SCMP Pictures
The employee said they were surprised to discover that only one successful audit of global income had been conducted in BC in the year to March 31. “That’s the ludicrousness of this. I was shocked when I saw this, and they only got C$27,000 in tax revenue out of it,” they said.
Asked whether this might show a widespread problem with undeclared worldwide income did not exist in BC, the source said: “No, what it shows is that inadequate people and resources have been put to the task. These [tax cheats] are highly sophisticated individuals, with good representation from their lawyers and accountants, and we are sending out our least experienced people to catch them. That’s the problem.”
Source cites CRA’s ‘racism fear’
Census data from 2011 has previously shown that 25,000 households in the City of Vancouver spent more on their housing costs than their entire declared income, with these representing 9.5 per cent of all households.
But far from being impoverished, such households were concentrated in some of the city’s most expensive neighborhoods, where homes sell for multi-million-dollar prices.
In Bizarro Vancouver, 25,000 households declare less income than they spend on housing alone
The source suggested CRA bureaucrats previously feared being labelled racist if they targeted low-income declarers buying real estate “because the vast majority of these cases, involving high real estate values, involve mainland Chinese”.
The crackdown was not intended for public knowledge, and instead was to satisfy “people from high up” in the CRA and government who wanted to know “what are you guys doing about this…there’s stuff hitting the papers every day”, the source said. Yet the briefing says the crackdown “will not address the major concerns about affordability of real estate”.
“The vast majority of these [undeclared global income] cases, involving high real estate values, involve mainland Chinese”
The source said there had previously been little done to check whether taxpayers were secretly living and working abroad while supporting a family in Vancouver. “There’s virtually no liaising done with immigration. The common auditor would never check when people are actually coming and going, to check whether they might be going back to China or wherever to work. You can be lied to, to your face: ‘Oh no, I live here [in Canada] full-time’.”
The leaked documents show that in in addition to the single audit on global income in the last fiscal year, CRA in BC conducted 93 successful audits on property flips, 20 on capital gains tax and 225 on under-reported GST. The audits yielded C$14.4 million in new tax, of which C$10million was GST. There was C$1.3 million in fines.
As of April 29, there were 40 audits of global income under way, 205 related to flipping, 34 related to capital gains and 428 related to GST.
The average Vancouver house price now sits around C$1.75million for the metropolitan region, while the Real Estate Board of Greater Vancouver’s “benchmark” price for all residential properties is C$889,100, a 30 per cent increase over the past year. However, incomes remain among the lowest in Canada, making Vancouver one of the world’s most un-affordable cities .
The CRA responds here. No corrections have been made to this story as a result.
Read the secret CRA briefing notes via this link, or see below
Cra Webinar June 2 2016 by Ian Young on Scribd
The Hongcouver blog is devoted to the hybrid culture of its namesake cities: Hong Kong and Vancouver. All story ideas and comments are welcome. Connect with me by email ian.young@scmp.com or on Twitter, @ianjamesyoung70
This article appeared in the South China Morning Post print edition as:
CRACKDOWN ON VANCOUVER CHEATS
As International Billionaires Get Nervous, Sales In L.A.’s Ultra-Luxury Housing Market Slow
Billionaire Steve Wynn finally found a buyer for his Bel-Air home when he dropped the asking price to $15.95 million, or $300,000 less than what he bought it for in 2014. (Redfin)
A cooling market for the most expensive homes is costing hotel and casino magnate Steve Wynn some money.
Two years ago, Wynn paid $16.25 million for an 11,000-square-foot mansion perched on nearly an acre above the Bel-Air Country Club. Less than a year later, he sought to unload the home with a paneled library and staff bedroom for $20 million.
No luck. Then he tried $17.45 million. No luck again.
In May, Wynn dropped his price to $15.95 million, $300,000 less than what he paid for the property in 2014. The home went into escrow “very close” to that price last month, said Coldwell Banker agent Mary Swanson, who confirmed Wynn would be taking a loss.
It’s not just Wynn who isn’t getting as much money as he hoped.
Even before Britain’s vote last week to leave the European Union jolted investors worldwide, there were reports of a slowdown in the ultra-luxury housing market.
In Los Angeles, agents were seeing more price cuts. Condo sales on New York’s Billionaires’ Row were slowing. Luxury developers shelved projects in Miami. And prices at the tip-top end of the London market were on their way down.
Blame it on the global economy, which has displayed weakness in the past year, choking off the spigot of international millionaires and billionaires seeking a pied-à-terre, or two, in glamorous locales.
So far, in Los Angeles, Wynn’s experience aside, the effect has been minimal, given the nature of Southern California ultra-luxury development – which largely consists of one dramatic hillside estate at a time, rather than a condo tower with multiple units.
But a spate of new construction is on the horizon. By one estimate, there are about 30 new hillside homes priced above $30 million that could hit the market in the next year and a half.
The so-called Brexit vote may not help matters. It has sown economic uncertainty on a global scale and caused the dollar to strengthen against major currencies – potentially leading international buyers to trim their purchases in the United States.
“The price of real estate here in California and the U.S. has gotten more expensive,” said Jordan Levine, an economist with the California Assn. of Realtors.
In Manhattan, the slowdown has taken a sharp toll. The number of previously owned homes that sold in the first quarter for $10 million or more fell 40% from a year earlier to 15, according to appraisal firm Miller Samuel.
One builder, Extell Development Co., trimmed $162 million in projected revenue from its One57 condo-and-hotel project, a 1,000-foot tower on Manhattan’s 57th Street originally slated to bring in $2.73 billion, according to a March regulatory filing.
It features more than 90 units, with several reportedly selling for more than $40 million and one bought by an investment group for about $90 million.
“More has been constructed in New York,” said Stephen Kotler, chief revenue officer of real estate brokerage Douglas Elliman. “You have some sellers [in Los Angeles] getting more realistic, but in New York you are seeing more.”
In Los Angeles County, by comparison, $10-million plus sales ticked up by one to 17 in the first quarter compared with a year earlier, according to the California Assn. of Realtors, whose data largely covers resale transactions.
But over a longer timeline, it appears the market has begun to stall. The number of sales of $10 million or more in L.A. County has dipped in three of the last five quarters for which data is available, even as inventory has steadily grown, according to the Realtors group.
And, brokers say, the slowdown is more pronounced the higher the price.
As of mid-June, nine homes in the county had sold this year for $20 million or more, compared with 18 during the same period last year, according to Loren Goldman a vice president with First American Title Co.
Michael Nourmand, president of L.A. luxury brokerage Nourmand & Associates Realtors, said the slowdown will probably bleed into the rest of the market eventually, but that’s not likely to happen “any time soon.”
Like elsewhere, local agents put much of the blame on a pullback by international buyers who had flooded Los Angeles in recent years. Turmoil in their economies, along with a strong dollar, have many from Russia, the Middle East and China second-guessing a purchase here.
“It used to be, if they like it they buy it, or more like, if they like it they buy two,” said Cindy Ambuehl, director of residential estates for the Agency. “Now they are keeping their hands in their pockets and they are waiting.”
Nourmand has seen that first-hand.
A client from the Middle East recently hoped to pull the trigger on a nearly $40-million estate in Bel Air – one set behind gates with a driveway that took “one to two minutes” to walk from street to front door.
But the buyer got cold feet in February and backed out, Nourmand said, explaining that her family’s businesses had taken a beating along with the price of oil, which plunged last year.
“You have a shrinking buyer pool for the really expensive stuff,” he said.
Daren Metropoulos plans to reconnect the Playboy Mansion, above, to his estate next door, creating a 7.3-acre compound. (Jim Bartsch)
Unlike other brokers, Adam Rosenfeld, founding partner of brokerage Mercer Vine, said he thinks the market is still strong and pointed to some recent mega-deals that went into escrow, including the Playboy Mansion, which is being purchased by the son of a billionaire food magnate for $105 million – a record for L.A. County.
(Though that’s half the asking price of $200 million, agents who know the market say they didn’t expect the mansion to sell for that astronomical, headline-grabbing figure.)
But even Rosenfeld said it was unclear how well the upcoming flood of high-end homes will sell.
“There are only so many buyers that can afford a $30-million plus house,” he said. “The [developers] that do them the best probably will make a killing. Guys who don’t … some of those people might lose their shirts.”
Levine, of the Realtors association, said that one dynamic has yet to play out – whether the strong dollar deters international investors from entering the U.S. real estate market, or as their own home country currencies weaken, they come to increasingly view it as a haven.
“It’s not necessarily clear which one of those two is going to win out,” he said.
Case-Shiller Reports Home Prices Rise At Slowest Pace In 8 Months, As San Francisco Sales Volume Slump
April was not a good month for home prices – despite hopeful signs from seasonally adjusted sales data. S&P Case-Shiller 20-City index rose just 0.45% MoM (well below expectations and March’s 0.85% gain) – the weakest rise since Aug 2015. The broader Home Price Index hovered near unchanged for the 2nd month – the weakest since January 2012. Most worrisome, perhaps, is the 18.16% YoY plunge in San Francisco home sales… as perhaps the bubble is finally bursting.
20-City (Seasonally Adjusted) Index…

Broad (Seasonally-Adjusted) Home Price Index…

Portland Home Values Continue to Grow at Nation’s Fastest Pace

Aerial Tram, Portland Oregon
The local market in March posted 12.3% year-over-year gains in home values, which was the largest increase by a significant margin among the 20 metro areas surveyed. Seattle (10.8%) and Denver (10%) were the only other two regions to post double-digit annual gains.
“It remains a tough home buying season for buyers, with little inventory available among lower-priced homes,” said Svenja Gudell, chief economist at Zillow, in an email. “The competition is locking out some first-time buyers, who instead are paying record-high rents.”
Portland’s inventory has been historically low recently. The latest report from the local Regional Multiple Listing Service showed inventory at a miniscule 1.4 months in April. The figure estimates how long it would take for all current homes on the market to sell at the current pace. (Six months of inventory indicates a balanced market.)
Prices have also reached record highs; the average sale price in the Portland area was $397,700 in April and the median reached $350,000.
Nationally, home values in March posted annual gains of 5.2%, the Case-Shiller report found, down from 5.3% the previous month.
“Home prices are continuing to rise at a 5% annual rate, a pace that has held since the start of 2015,” said David M. Blitzer, chairman of the index committee, in a news release. “The economy is supporting the price increases with improving labor markets, falling unemployment rates and extremely low mortgage rates.”
Blitzer added that the number of homes currently for sale is “less than two percent of the number of households in the U.S., the lowest percentage seen since the mid-1980s.”
“The Pacific Northwest and the west continue to be the strongest regions,” Blizter said.
Low Supply Plagues Spring Housing: Here’s where it is worst
 The usually strong spring housing market could be far stronger this year, if only there were more homes for sale.
The number of listings continues to drop, as demand outstrips supply and potential sellers bow out, fearing they won’t be able to find something else to buy.
The inventory of homes for sale nationally in April was 3.6 percent lower than in April 2015, according to the National Association of Realtors. Redfin, a real estate brokerage, also recently reported a drop in new listings.
The supply numbers are even tighter in certain local markets: Inventory is down 32 percent in Portland, Oregon, from a year ago; down 22 percent in Kansas City; down 21 percent in Dallas and Seattle; down 17 percent in Charlotte, North Carolina; down 12 percent in Atlanta; down nearly 10 percent in Chicago; and down 8 percent in Los Angeles, according to Zillow. Houston and Miami are seeing big gains in supply, due to economic issues specific to those markets.
“The struggle will continue for home shoppers this summer,” said Zillow chief economist Svenja Gudell. “New construction has been sluggish over the past year; we’re building about half as many homes as we should be in a normal market. There still aren’t enough homes on the market to keep up with the high demand from every type of home buyer.”
The short supply is pushing home prices higher than expected this year. Zillow had predicted 2 percent growth in home values from April 2015 to April 2016, but its latest data show values currently soaring more than twice that, at 4.9 percent.
“In many markets, those looking to buy a home in the bottom or middle of the market will need to be prepared for bidding wars and homes selling for over the asking price. This summer’s selling season’s borders will most likely be blurred again, as many buyers are left without homes and will need to keep searching,” added Gudell.
The inventory drops are most severe in the lower-priced tier of the market. Homes in the top tier are seeing gains and therefore show more price cuts. Sixteen percent of top-tier homes had a price cut over the past year, compared with 11 percent of bottom-tier homes and 13 percent of middle-tier, according to Zillow.
Sales of New Homes Fall on Slump in West
 Purchases of new homes unexpectedly declined in March for a third month, reflecting the weakest pace of demand in the West since July 2014.
Total sales decreased 1.5% to a 511,000 annualized pace, a Commerce Department report showed Monday. The median forecast in a Bloomberg survey was for a gain to 520,000. In Western states, demand slumped 23.6%.
Purchases rose in two regions last month, indicating uneven demand at the start of the busiest time of the year for builders and real estate agents. While new construction has been showing limited upside, cheap borrowing costs and solid hiring will help ensure residential real estate continues to expand.
“Housing is certainly not booming,” Jim O’Sullivan, chief U.S. economist at High Frequency Economics Ltd. in Valhalla, N.Y., said before the report. “Some people may be shut out of the market because lending standards are still tight. There may still be some reluctance to buy versus rent.”
Even so, “through the volatility, the trend is still more up than down, and we expect modest growth in sales,” he said.
Economists’ estimates for new-home sales ranged from 488,000 to 540,000. February purchases were revised to 519,000 from 512,000. The monthly data are generally volatile, one reason economists prefer to look at longer term trends.
The report said there was 90% confidence the change in sales last month ranged from a 13.5% drop to a 16.5% increase.
Sales in the West declined to a 107,000 annualized rate in March after surging 21.7% the previous month to 140,000. In the South, purchases climbed 5% to a 314,000 pace in March, the strongest in 13 months. Sales in the Midwest advanced 18.5%, the first gain in three months, and were unchanged in the Northeast.
The median sales price decreased 1.8% from March 2015 to $288,000.
There were 246,000 new houses on the market at the end of March, the most since September 2009. The supply of homes at the current sales rate rose to 5.8 months, the highest since September, from 5.6 months in the prior period.
From a year earlier, purchases increased 5.8% on an unadjusted basis.
New-home sales, which account for less than 10% of the residential market, are tabulated when contracts get signed. They are generally considered a timelier barometer of the residential market than purchases of previously owned dwellings, which are calculated when a contract closes, typically a month or two later.
Borrowing costs are hovering close to a three-year low, helping to bring house purchases within the reach of more Americans. The average rate for a 30-year fixed mortgage was 3.59% last week, down from 3.97% at the start of the year, according to data from Freddie Mac.
The job market is another source of support. Monthly payrolls growth averaged 234,000 in the past year, and the unemployment rate of 5% is near an eight-year low. Still, year-over-year wage gains have been stuck in a 2% to 2.5% range since the economic expansion began in mid-2009.
The market for previously owned homes improved last month, climbing 5.1% to a 5.33 million annualized rate, the National Association of Realtors reported April 20. Prices rose as inventories remained tight.
Even so, the market is getting little boost from first-time buyers, who accounted for 30% of all existing-home purchases, a historically low share, according to the group.
Recent data on home building has been less encouraging, although those figures are volatile month to month. New-home construction slumped in March, reflecting a broad-based retreat, a Commerce Department report showed last week. Home starts fell 8.8% to the weakest annual pace since October. Permits, a proxy for future construction, also unexpectedly dropped.
Some Wild Stuff Going On in the Los Angeles Housing Market Last Month
Housing prices in Crenshaw jumped way up, while Hancock Park’s tumbled way down

Redfin’s housing market report for February has been released, and, as per usual, a lot of activity took place east of Vermont. Neighborhoods like Echo Park, Eagle Rock, Glassell Park, Mount Washington, and East LA all saw double digit rises in median housing price.
Mount Washington’s median price for February was up 19.2 percent to $790,000, which is up significantly from the $699,000 median price Redfin cited in January when it predicted Mount Washington would be the hottest neighborhood of 2016. Their prediction may be coming true (self-fulfilling?). Sellers in Mount Washington are getting 6.5 percent above asking price and houses are staying on the market for an average of only 13 days.
The Valley also saw some action in February: Studio City, Sherman Oaks, Sun Valley, and Van Nuys all had double digit jumps in median housing prices. Studio City fared the best with a 26.9 percent increase, to $888,250, and a 22.9 percent increase in total sales.
Around town other neighborhoods experienced some major fluctuations. On the positive end, Crenshaw had a big February; median prices in that neighborhood shot up a whopping 66.8 percent, to $628,125. Total sales in Crenshaw were up 64.3 percent.
Redfin also reports a 25 percent increase in the median price of houses on the Westside of town—those are now selling for a median of $1.5 million.
Conversely, Hancock Park did not fare so well in the February report. Median prices for the neighborhood contracted 68.8 percent, to an even (and crazy low) $500,000. Sales were down 31.3 percent and sellers were getting 1.7 percent below asking price.
Los Angeles on the whole had a 14.6 percent increase in median price, up to $590,000. The city also saw a lot of new houses added to the market in February, with inventory moving up 10.5 percent. But total sales were down 2.5 percent for the month.

U.S. Home Price Gains Concentrated in West, Says Case-Shiller Price Index

According to the S&P/Case-Shiller Home Price Indices for July 2015, U.S. home prices continued their rise across the country over the last 12 months.
Year-over-Year
The S&P/Case-Shiller U.S. National Home Price Index, covering all nine U.S. census divisions, recorded a slightly higher year-over-year gain with a 4.7% annual increase in July 2015 versus a 4.5% increase in June 2015. The 10-City Composite was virtually unchanged from last month, rising 4.5% year-over-year. The 20-City Composite had higher year-over-year gains, with an increase of 5.0%. San Francisco, Denver and Dallas reported the highest year-over-year gains among the 20 cities with price increases of 10.4%, 10.3%, and 8.7%, respectively. Fourteen cities reported greater price increases in the year ending July 2015 over the year ending June 2015.
San Francisco and Denver are the only cities with a double digit increase, and Phoenix had the longest streak of year-over-year increases. Phoenix reported an increase of 4.6% in July 2015, the eighth consecutive year over-year increase. Boston posted a 4.3% annual increase, up from 3.2% in June 2015; this is the biggest jump in year-over year gains this month.
Month-over-Month
Before seasonal adjustment, the National Index posted a gain of 0.7% month-over-month in July. The 10-City Composite and 20-City Composite both reported gains of 0.6% month-over-month. After seasonal adjustment, the National index posted a gain of 0.4%, while the 10-City and 20-City Composites were both down 0.2% month-over-month. All 20 cities reported increases in July before seasonal adjustment; after seasonal adjustment, 10 were down, nine were up, and one was unchanged.
Market Analysis
“Prices of existing homes and housing overall are seeing strong growth and contributing to recent solid growth for the economy,” says David M. Blitzer, Managing Director and Chairman of the Index Committee at S&P Dow Jones Indices.
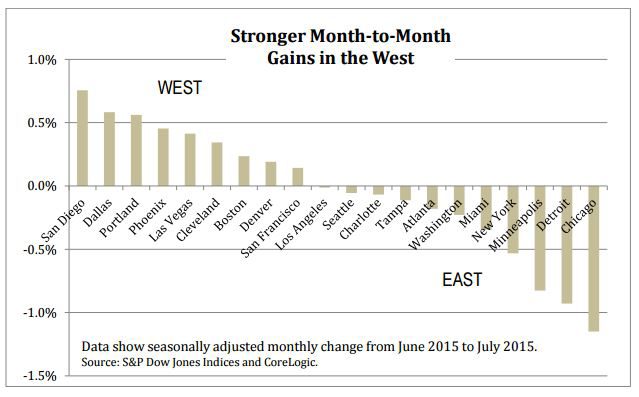 “The S&P/Case Shiller National Home Price Index has risen at a 4% or higher annual rate since September 2012, well ahead of inflation. Most of the strength is focused on states west of the Mississippi. The three cities with the largest cumulative price increases since January 2000 are all in California: Los Angeles (138%), San Francisco (116%) and San Diego (115%). The two smallest gains since January 2000 are Detroit (3%) and Cleveland (10%). The Sunbelt cities – Miami, Tampa, Phoenix and Las Vegas – which were the poster children of the housing boom have yet to make new all-time highs.
“The economy grew at a 3.9% real annual rate in the second quarter of 2015 with housing making a major contribution. Residential investment grew at annual real rates of 9-10% in the last three quarters (2014:4th quarter, 2015:1st-2 nd quarters), far faster than total GDP.
Further, expenditures on furniture and household equipment, a sector that depends on home sales and housing construction, also surpassed total GDP growth rates. Other positive indicators of current and expected future housing activity include gains in sales of new and existing housing and the National Association of Home Builders sentiment index. An interest rate increase by the Federal Reserve, now expected in December by many analysts, is not likely to derail the strong housing performance.”
Home Builder Stocks’ Selloff May Be Following The Bear Market In Lumber
Market timer Tom McClellan says downtrend in lumber prices warns of weakness in housing market

by Tomi Gilgore. Read more in Market Watch
If investors in stocks of home builders are wondering why they are losing money Thursday despite such upbeat new home sales data, traders of lumber futures may be smugly thinking: “Told you so.”
New home sales for August jumped more than expected to the highest level since February 2008. But the SPDR S&P Home builders exchange-traded fund XHB, +0.17% fell 0.5% in afternoon trade Thursday, and was down as much as 2.1% earlier in the session. The home builder-sector tracker (XHB) has lost 2.8% this week, and slumped 8.8% since it hit an 8 1/2-year high on Aug. 19.

FactSet Pullback in home builder stocks may be just the beginning
Some chart watchers might say, that’s easy.
Tom McClellan, publisher of the investment newsletter McClellan Market Report, said his research suggests lumber prices seem to foretell, about 12 months in advance, changes in the rate of new home sales. “That is important because lumber has been falling rapidly this year, which suggests a corresponding drop in new home sales in store over the next 12 months,” McClellan wrote in a recent report to clients.
Based on that assessment, home builder stocks appear to be well overdue for a bigger selloff.
Continuous lumber futures LBX5, -0.09% declined 0.1% Thursday to the lowest level in nearly four years, as they have tumbled 34% so far this year.

Selloff in lumber prices may suggest home builder stocks are overdue for bigger decline
What’s worse, McClellan said this week that recent data in the Commitment of Traders Report, published by the Commodity Futures Trading Commission, regarding the recent activity of commercial traders—the so-called “smart money”–suggests log prices are likely to see a further big drop over the next couple of months.
“And that is another sign of economic troubles about to befall not only the lumber market but also the rest of the economy,” McClellan said.
‘Housing Bubble 2’ Has Bloomed Into Full Magnificence
The current housing boom has Dallas solidly in its grip. As in many cities around the US, prices are soaring, buyers are going nuts, sellers run the show, realtors are laughing all the way to the bank, and the media are having a field day. Nationwide, the median price of existing homes, at $236,400, as the National Association of Realtors sees it, is now 2.7% higher than it was even in July 2006, the insane peak of the crazy housing bubble that blew up with such spectacular results.
Housing Bubble 2 has bloomed into full magnificence: In many cities, the median price today is far higher, not just a little higher, than it was during the prior housing bubble, and excitement is once again palpable. Buy now, or miss out forever! A buying panic has set in.
And so the July edition of D Magazine – “Making Dallas Even Better,” is its motto – had this enticing cover, sent to me by David in Texas, titled, “The Great Dallas Land Rush”:

“Dallas Real Estate 2015: The Hottest Market Ever,” the subtitle says.
That’s true for many cities, including San Francisco. The “Boom Town,” as it’s now called, is where the housing market has gone completely out of whack, with a median condo price at $1.13 million and the median house price at $1.35 million. This entails some consequences [read… The San Francisco “Housing Crisis” Gets Ugly].
The fact that Housing Bubble 2 is now even more magnificent than the prior housing bubble, even while real incomes have stagnated or declined for all but the top earners, is another sign that the Fed, in its infinite wisdom, has succeeded elegantly in pumping up nearly all asset prices to achieve its “wealth effect.” And it continues to do so, come heck or high water. It has in this ingenious manner “healed” the housing market.
But despite the current “buying panic,” the soaring prices, and all the hoopla round them, there is a fly in the ointment: overall home ownership is plunging.
The home ownership rate dropped to 63.4% in the second quarter, not seasonally adjusted, according to a new report by the Census Bureau, down 1.3 percentage points from a year ago. The lowest since 1967!
 Wolf Street
The process has been accelerating, instead of slowing down. The 1.2 percentage point plunge in 2014 was the largest annual drop in the history of the data series going back to 1965. And this year is on track to match this record: the drop over the first two quarters so far amounts to 0.6 percentage points. This accelerated drop in home ownership rates coincides with a sharp increase in home prices. Go figure.
The plunge in home ownership rates has spread across all age groups, but to differing degrees. Younger households have been hit the hardest. In the age group under 35, the home ownership rate in Q2 saw a slight uptick to 34.8%, from the dismal record low of 34.6% in the prior quarter. Either a feeble ray of hope or just one of the brief upticks, as in the past, to be succeeded by more down ticks on the way to lower lows.
This chart by the Economics and Strategy folks at National Bank Financial shows the different rates of home ownership by age group. The 35-year and under group is where the first-time buyers are concentrated; and they’re being sidelined, whether they have no interest in buying, or simply don’t make enough money to buy (represented by the sharply descending solid black line, left scale). Note how the oldest age group (dotted blue line, right scale) has recently started to cave as well:
 Wolf Street
The bitter irony? In the same breath, the Census Bureau also reported that the rental vacancy rate dropped to 6.8%, from 7.5% a year ago, the lowest since 1985. America is turning into a country of renters.
This chart shows the dynamics between home ownership rates (black line, left scale) and rental vacancy rates (red line, right scale) over time: they essentially rise and dive together. It makes sense on an intuitive basis: as people abandon the idea of owning a home, they turn into renters, and the rental market tightens up, and vacancy rates decline.
 Wolf Street
This too has been by design, it seems. Since 2012, private equity firms bought several hundred thousand vacant single-family homes in key markets, drove up prices in the process, and started to rent them out. Thousands of smaller investors have jumped into the fray, buying homes, driving up prices, and trying to rent them out. This explains the record median home price across the country, and the totally crazy price increases in some key markets, even as regular Americans are trying to figure out how to pay for a basic roof over their heads.
This has worked out well. By every measure, rents have jumped. According to the Census Bureau’s report, the median asking rent in the US rose 6.2% from a year ago, and 17.6% since 2011. So inflation bites. But the Fed is still desperately looking for signs of inflation and simply cannot find any.
And how much have incomes risen over these years to allow renters to meet these rising rents? OK, that was a rhetorical question. We already know what has been happening to incomes.
That’s what it always boils down to in the Fed’s salvation of the economy: people who can’t afford to pay the rising rents with their stagnant or declining incomes should borrow the money to make up the difference and then spend even more on consumer goods. After us, the deluge.
Rents Have Been Skyrocketing In These 13 US Cities
Seven years ago, the American home ownership “dream” was shattered when a housing bubble built on a decisively shaky foundation burst in spectacular fashion, bringing Wall Street and Main Street to their knees.
In the blink of an eye, the seemingly inexorable rise in the American home ownership rate abruptly reversed course, and by 2014, two decades of gains had disappeared and the ashes of Bill Clinton’s National Home ownership Strategy lay smoldering in the aftermath of the greatest financial collapse since the Great Depression.

In short, decades of speculative excess driven by imprudence, greed, and financial engineering and financed by the world’s demand for GSE debt had come crashing down and in relatively short order, a nation of homeowners was transformed into a nation of renters.
It wasn’t difficult to predict what would happen next.
As demand for rentals increased and PE snapped up foreclosures, rents rose, just as a subpar jobs market, a meteoric rise in student debt, tougher lending standards, and critically important demographic shifts put further pressure on home ownership rates. Now, America faces a rather dire housing predicament: buying and renting are both unaffordable. Or, as WSJ put it last month, “households are stuck between homes they can’t qualify for and rents they can’t afford.”
We’ve seen evidence of this across the country with perhaps the most telling statistic coming courtesy of The National Low Income Housing Coalition who recently noted that in no state can a minimum wage worker afford a one bedroom apartment.
In this context, Bloomberg is out with a list of 13 cities where single-family rents have risen by double-digits in just the last 12 months. Note that in Iowa, rents have risen more than 20% over the past year alone.
 More color from Bloomberg:
Landlords have been preparing to raise rents on single-family homes this year, Bloomberg reported in April. It looks like those plans are already being put into action.
The median rent for a three-bedroom single-family house increased 3.3 percent, to $1,320, during the second quarter, according to data compiled by RentRange and provided to Bloomberg by franchiser Real Property Management. Median rents are up 6.1 percent over the past 12 months. Even that kind of increase would have been welcome in 13 U.S. cities where single-family rents increased by double digits.
It’s more evidence that rising rents have affected a broad scope of Americans. Sixty percent of low-income renters spend more than 50 percent of their income on rent, according to a report in May from New York University’s Furman Center. High rents have also stretched the budgets of middle-class workers and made it harder for young professionals to launch careers and start families.
“You’re finding that people who wouldn’t have shared accommodations in the past are moving in with friends,”says Don Lawby, president of Real Property Management. “Kids are staying in their parents’ homes for longer and delaying the formation of families.”
And for those with short memories, we thought this would be an opportune time to remind you of who became America’s landlord in the wake of the crisis…

These Are the Top 20 Cities Americans Are Ditching
Soaring costs of living meant residents left New York City and its suburbs in droves.

Erin Roman and Wei Lu in Bloomberg News
New York City, Los Angeles, Honolulu: They’re all places you would think would be popular destinations for Americans. So it might come as a surprise that these are among the cities U.S. residents are fleeing in droves.
The map below shows the 20 metropolitan areas that lost the greatest share of local people to other parts of the country between July 2013 and July 2014, according to a Bloomberg News analysis of U.S. Census Bureau data. The New York City area ranked 2nd, losing about a net 163,000 U.S. residents, closely followed by a couple surrounding suburbs in Connecticut. Honolulu ranked fourth and Los Angeles ranked 14th. The Bloomberg calculations looked at the 100 most populous U.S. metropolitan areas.

Interestingly, these are also the cities with some of the highest net inflows of people from outside the country. That gives many of these cities a steadily growing population, despite the net exodus of people moving within the U.S.
So what’s going on here? Michael Stoll, a professor of public policy and urban planning at the University of California Los Angeles, has an idea. Soaring home prices are pushing local residents out and scaring away potential new ones from other parts of the country, he said. (Everyone knows how unaffordable the Manhattan area has become.)
And as Americans leave, people from abroad move in to these bustling cities to fill the vacant low-skilled jobs. They are able to do so by living in what Stoll calls “creative housing arrangements” in which they pack six to eight individuals, or two to four families, into one apartment or home. It’s an arrangement that most Americans just aren’t willing to pursue, and even many immigrants decide it’s not for them as time goes by, he said.
In addition, the growing demand for high-skilled workers, especially in the technology industry, brought foreigners who possess those skills to the U.S. They are compensated appropriately and can afford to live in these high-cost areas, just like Americans who hold similar positions. One example is Washington, D.C., which had a lot of people from abroad arriving to soak up jobs in the growing tech-hub, Stoll said.
Other areas weren’t so lucky. Take some of the Rust Belt cities that experienced fast drops in their American populations, like Cleveland, Dayton and Toledo, even though they are relatively inexpensive places to live. These cities didn’t get enough international migrants to make up for the those who left, a reflection of the fact that locals were probably leaving out of a lack of jobs.
This is part of a multiple-decade trend of the U.S. population moving away from these manufacturing hubs to areas in the Sun Belt and the Pacific Northwest, Stoll said. Retiring baby boomers are also leaving the Northeast and migrating to more affordable places with better climates.
This explains why the majority of metropolitan areas in Florida and Texas, as well as west-coast cities like Portland, had an influx of people.
El Paso, Texas, the city that residents fled from at the fastest pace, also saw a surprisingly small number of foreigners settling in given how close it is to Mexico.
“A lot of young, reasonably educated people are having a hard time finding work there,” Stoll said. “They’re not staying in town after they graduate,” leaving for the faster-growing economies of neighboring metro areas like Dallas and Austin, he said.
Methodology: Bloomberg ranked 100 of the most populous U.S. metropolitan areas based on their net domestic migration rates, from July 1, 2013 to July 1, 2014, as a percentage of total population as of July 2013. Domestic migration refers to people moving within the country (e.g. someone moving from New York City to San Francisco). A negative rate indicates more people leaving than coming in. International migration refers to a local resident leaving for a foreign country or someone from outside the U.S. moving into the U.S.
US Home Sales Surge In June To Fastest Pace In 8-Plus Years

WASHINGTON (AP) — Americans bought homes in June at the fastest rate in over eight years, pushing prices to record highs as buyer demand has eclipsed the availability of houses on the market.
The National Association of Realtors said Wednesday that sales of existing homes climbed 3.2 percent last month to a seasonally adjusted annual rate of 5.49 million, the highest rate since February 2007. Sales have jumped 9.6 percent over the past 12 months, while the number of listings has risen just 0.4 percent.
Median home prices climbed 6.5 percent over the past 12 months to $236,400, the highest level reported by the Realtors not adjusted for inflation.
Home-buying has recently surged as more buyers are flooding into the real estate market. Robust hiring over the past 21 months and an economic recovery now in its sixth year have enabled more Americans to set aside money for a down payment. But the rising demand has failed to draw more sellers into the market, causing tight inventories and escalating prices that could cap sales growth.
“The recent pace can’t be sustained, but it points clearly to upside potential,” said Ian Shepherdson, chief economist at Pantheon Macroeconomics.
A mere five months’ supply of homes was on the market in June, compared to 5.5 months a year ago and an average of six months in a healthy market.
Some markets are barely adding any listings. The condominium market in Massachusetts contains just 1.8 months’ supply, according to a Federal Reserve report this month. The majority of real estate agents in the Atlanta Fed region – which ranges from Alabama to Florida- said that inventories were flat or falling over the past year.
Some of the recent sales burst appears to come from the prospect of low mortgage rates beginning to rise as the Federal Reserve considers raising a key interest rate from its near-zero level later this year. That possibility is prompting buyers to finalize sales before higher rates make borrowing costs prohibitively expensive, noted Daren Blomquist, a vice president at RealtyTrac, a housing analytics firm.
The premiums that the Federal Housing Administration charges to insure mortgages are also lower this year, further fueling buying activity, Blomquist said.
It’s also possible that home buyers are checking the market for listings more aggressively, making it possible for them to act fast with offers despite the lack of new inventory.
“Buyers can more quickly be alerted of new listings and also more conveniently access real estate data to help them pre-search a potential purchase before they even step foot in the property,” Blomquist said. “That may mean we don’t need such a large supply of inventory to feed growing sales.”
Properties typically sold last month in 34 days, the shortest time since the Realtors began tracking the figure in May 2011. There were fewer all-cash, individual investor and distressed home sales in the market, as more traditional buyers have returned.
Sales improved in all four geographical regions: Northeast, Midwest, South and West.

Still, the limited supplies could eventually prove to be a drag on sales growth in the coming months.
Ever rising home values are stretching the budgets of first-time buyers and owners looking to upgrade. As homes become less affordable, the current demand will likely taper off.
Home prices have increased nearly four times faster than wages, as average hourly earnings have risen just 2 percent over the past 12 months to $24.95 an hour, according to the Labor Department.
Some buyers are also bristling at the few available options on the market. Tony Smith, a Charlotte, North Carolina real estate broker, said some renters shopping for homes are now choosing instead to re-sign their leases and wait until a better selection of properties comes onto the market.
New construction has yet to satisfy rising demand, as builders are increasingly focused on the growing rental market.
Approved building permits rose increased 7.4 percent to an annual rate of 1.34 million in June, the highest level since July 2007, the Commerce Department said last week. Almost all of the gains came for apartment complexes, while permits for houses last month rose only 0.9 percent.
The share of Americans owning homes has fallen this year to a seasonally adjusted 63.8 percent, the lowest level since 1989.
Real estate had until recently lagged much of the six-year rebound from the recession, hobbled by the wave of foreclosures that came after the burst housing bubble.
But the job market found new traction in early 2014. Employers added 3.1 million jobs last year and are on pace to add 2.5 million jobs this year. As millions more Americans have found work, their new paychecks are increasingly going to housing, both in terms of renting and owning.
Low mortgage rates have also helped, although rates are now starting to climb to levels that could slow buying activity.
Average 30-year fixed rates were 4.09 percent last week, according to the mortgage giant Freddie Mac. The average has risen from a 52-week low of 3.59 percent.
Southern California Home Sales Soar in June

The Southern California housing market, known for its dramatic swings, is settling into a more normal, healthy pattern.
Home sales are up. All-cash and investor purchases are down. And home prices are rising at a more sustainable pace than in the last few years.
Economists said those factors put the regional housing market on a path for growth that won’t wash away in a tsunami of foreclosures and ruined credit scores.
“The healing continues,” said Stuart Gabriel, director of UCLA’s Ziman Center for Real Estate.
On Thursday, fresh evidence of that trend emerged in a report from CoreLogic. Home sales posted a sizable 18.1% pop in June from a year earlier, while the median price rose 5.7% from June 2014 to $442,000, the real estate data firm said.
The sales increase, the largest in nearly three years, put the number of sales just 9.6% below average, CoreLogic said. A year ago, sales were nearly 24% below average.
Notably, it appears more families are entering the market as the economy improves. Although still elevated in comparison to long-term averages, the share of absentee buyers — mostly investors — slid to 21.1%, the lowest percentage since April 2010, CoreLogic said.
“This is the real recovery,” Christopher Thornberg, founding partner of Beacon Economics, said of a market where increasingly buyers actually want to live in the houses they purchase. “The last was the investor recovery.”
Sustained job growth has given more people the confidence to buy houses, CoreLogic analyst Andrew LePage said. California added a robust 54,200 jobs in May, one of the strongest showings in the last year.
The housing market improvement extends nationally, with sales of previously owned homes up in May to the highest pace in nearly six years, partly because more first-time buyers entered the market, according to data from the National Assn. of Realtors.
One factor driving deals is an expected decision from the Federal Reserve to raise its short-term interest rate later this year, real estate agents say.
In response, families rushed to lock in historically low rates this spring, agents say. CoreLogic’s sales figures represent closed deals, meaning most went into escrow during May.
Leslie Appleton-Young, chief economist for the California Association of Realtors, cautioned that the market still has too few homes for sale and that prices have risen to a point where many can’t afford a house.
Unless that changes, sales are unlikely to reach levels in line with historical norms, she said.
“I am not saying the housing market isn’t robust,” she said.
“I think housing affordability is a big issue…The biggest problem is losing millennials to places like Denver and Austin and Seattle.”
For now, deals are on the rise and people are paying more.
Sales and prices climbed in all six south land counties: Los Angeles, Orange, Riverside, San Bernardino, San Diego and Ventura. In Orange County, the median price rose 4.9% from a year earlier to $629,500.
In Los Angeles County, prices climbed 8.7% to $500,000.
NAR Releases Mid-2015 U.S. Economic and Housing Forecast

According to the National Association of Realtors (NAR), the U.S. housing market will continue its gradual pace of recovery as more home buyers enter a tight housing market for the balance of 2015, being nudged by rising mortgage rates and improving consumer confidence.
NAR’s chef economist Lawrence Yun has released the following observations for the US economy at large, and for the U.S. housing market specifically:
The U.S. Economy
- GDP growth was slightly negative in the first quarter but will pick up in the second half. For the year as whole, GDP will expand at 2.1 percent. Not bad but not great. A slow hum.
- Consumer spending will open up because of lower gasoline prices. Personal consumption expenditure grew at 2.1 percent rate in the first quarter. Look for 3 percent growth rate in the second half.
- Auto sales dropped a bit in the first quarter because of heavy snow, but will ramp up nicely in the second half.
- Spending for household furnishing and equipment has been solid, growing 6 percent in the first quarter after clocking 6 percent in the prior. Recovering housing sector is the big reason for the nice numbers.
- Spending at restaurants was flat. That is why retail vacancy rates are not notching down.
- Online shopping is up solidly. That is why industrial and warehouse vacancy rates are coming down.
- Spending for health care grew at 5 percent in the first quarter, marking two consecutive quarters of fast growth. The Affordable Care Act has expanded health care demand. The important question for the future is will the supply of new doctors and nurses expand to meet this rising demand or will it lead to medical care shortage?
- Business spending was flat in the first quarter but will surely rise because of large cash holdings and high profits.
- Spending for business equipment rose by 3 percent in the first quarter. Positive and good, but nothing to shout about.
- Spending for business structures (building of office and retail shops, for example) fell by 18 percent. The freezing first-quarter weather halted some construction. This just means pent-up construction activity in the second half.
- In the past small business start-ups spent and invested. It was not uncommon to experience double-digit growth rates for 3 years running for business equipment. Not happening now. But business spending will inevitably grow because of much improved business financial conditions of lower debt and more profits and rising GDP.
- What has been missing is the “animal spirit” of entrepreneurship. The number of small business start-ups remains surprisingly low at this phase of economic expansion.
- Residential construction spending increased 6 percent in the first quarter. Housing starts are rising and therefore this component will pick up even at a faster pace in the second half.
- Government spending fell by 1 percent. At the federal level, non-defense spending grew by 2 percent, while national defense spending fell by 1 percent. At the state and local level, spending fell by 1 percent.
- The federal government is still running a deficit. Even though it is spending more than what it takes in from tax revenue, the overall deficit level has been falling to a sustainable level. It would be ideal to run a surplus, but a falling deficit nonetheless does provide the possibility of less severe sequestration.
- U.S. government finances are ugly. Interestingly though, they are less ugly than other countries. That is why the U.S. dollar has been strengthening against most other major currencies. It’s like finding the least dirty shirt from a laundry basket.
- Imports have been rising while exports have been falling. The strong dollar makes it so. Imports grew by 7 percent while exports fell by 6 percent. The net exports (at minus $548 billion) were the worst in seven years. Fortunately, with the West Coast longshoremen back at work, the foreign trade situation will not worsen, which means it will help GDP growth.
- All in all, GDP will growth by 2.5 to 3 percent in the second half. That translates into jobs. A total of 2.5 million net new jobs are likely to be created this year.
- Unemployment insurance filings have been rising in oil-producing states of Texas and North Dakota.
- Unemployment insurance filings for the country as a whole have been falling, which implies lower level of fresh layoffs and factory closings. That assures continuing solid job growth in the second half of the year.
- We have to acknowledge that not all is fine with the labor market. The part-time jobs remain elevated and wage growth remains sluggish with only 2 percent annual growth. There are signs of tightening labor supply and the bidding up of wages. Wages are to rise by 3 percent by early next year. The total income of the country and the total number of jobs are on the rise.
The U.S. Housing Market Mid-2015 Trends
- Existing home sales in May hit the highest mark since 2009, when there had been a homebuyer tax credit … remember, buy a home and get $8,000 from Uncle Sam. This tax credit is no longer available but the improving economy is providing the necessary incentive and financial capacity to buy. Meanwhile new home sales hit a seven-year high and housing permits to build new homes hit an eight-year high. Pending contracts to buy existing homes hit a nine-year high.
- Buyers are coming back in force. One factor for the recent surge could have been due to the rising mortgage rates. As nearly always happens, the initial phase of rising rates nudges people to make decision now rather than wait later when the rates could be higher still.
- The first-time buyers are scooping up properties with 32 percent of all buyers being as such compared to only 27 percent one year ago. A lower fee on FHA mortgages is helping.
- Investors are slowly stepping out. The high home prices are making the rate of return numbers less attractive.
- Buyers are back. What about sellers? Inventory remains low by historical standards in most markets. In places like Denver and Seattle, where a very strong job growth is the norm, the inventory condition is just unreal – less than one month supply.
- The principal reason for the inventory shortage is the cumulative impact of homebuilders not being in the market for well over five years. Homebuilders typically put up 1.5 million new homes annually. Here’s what they did from 2009 to 2014:
- 550,000
- 590,000
- 610,000
- 780,000
- 930,000
- 1.0 million
- Where is 1.5 million? Maybe by 2017.
- Building activity for apartments has largely come back to normal. The cumulative shortage is on the ownership side.
- Builders will construct more homes. By 1.1 million in 2015 and 1.4 million in 2016. New home sales will follow this trend. This rising trend will steadily relieve housing shortage.
- There is no massive shadow inventory that can disrupt the market. The number of distressed home sales has been steadily falling – now accounting for only 10 percent of all transactions. It will fall further in the upcoming months. There is simply far fewer mortgages in the serious delinquent stage (of not being current for 3 or more months). In fact, if one specializes in foreclosure or short sales, it is time to change the business model.
- In the meantime, there is still a housing shortage. The consequence is a stronger than normal home price growth. Home price gains are beating wage-income growths by at least three or four times in most markets. Few things in the world could be more frustrating and demoralizing than for renters to start a savings program but only to witness home prices and down payment requirements blowing past them by.
- Housing affordability is falling. Home prices rising too fast is one reason. The other reason is due to rising mortgage rates. Cash-buys have been coming down so rates will count for more in the future.
- The Federal Reserve will be raising short-term rates soon. September is a maybe, but it’s more likely to be in October. The Fed will also signal the continual raising of rates over the next two years. This sentiment has already pushed up mortgage rates. They are bound to rise further, particularly if inflation surprises on the upside.
- Inflation is likely to surprise on the upside. The influence of low gasoline prices in bringing down the overall consumer price inflation to essentially zero in recent months will be short-lasting. By November, the influence of low gasoline prices will no longer be there because it was in November of last year when the oil prices began their plunge. That is, by November, the year-over-year change in gasoline price will be neutral (and no longer big negative). Other items will then make their mark on inflation. Watch the rents. It’s already rising at near 8-year high with a 3.5 percent growth rate. The overall CPI inflation could cross the red line of above 3 percent by early next year. The bond market will not like it and the yields on all long-term borrowing will rise.
- Mortgage rates at 4.3% to 4.5% by the year end and easily surpassing 5% by the year end of 2016.
- The rising mortgage rates initially rush buyers to decide but a sustained rise will choke off as to who can qualify for a mortgage. Fortunately, there are few compensating factors to rising rates.
- Credit scores are not properly aligned with expected default rate. New scoring methodology is being tested and will be implemented. In short, credit scores will get boosted for many individuals after the new change.
- FHA mortgage premium has come down a notch thereby saving money for consumers. By the end of the year, FHA program will show healthier finances. That means, there could be additional reduction to premiums in 2016. Not certain, but plausible.
- Fannie and Freddie are owned by the taxpayers. And they are raking-in huge profits as mortgages have not been defaulting over the past several years. The very high profit is partly reflecting too-tight credit with no risk taking. There is a possibility to back a greater number of lower down payment mortgages to credit worthy borrowers without taking on much risk. In short, mortgage approvals should modestly improve next year.
- Portfolio lending and private mortgage-backed securities are slowly reviving. Why not? Mortgages are not defaulting and there is fat cash reserves held by financial institutions. Less conventional mortgages will therefore be more widely available.
- Improving credit available at a time of likely rising interest rates is highly welcome. Many would-be first-time buyers have been more focused about getting a mortgage (even at a higher rate) than with low rates.
- All in all, existing and new home sales will be rising. Combined, there will be 5.8 million home sales in 2015, up 7 percent from last year. Note the sales total will still be 25 percent below the decade ago level during the bubble year. Home prices will be rising at 7 percent. For the industry, the business revenue will be rising by 14 percent in 2015. The revenue growth in 2016 will be additional 7 to 10 percent.
California Housing Market Slows Considerably
Non-distressed sales drop for the first time since 2005

California’s massive housing market is slowing down in almost every way imaginable, according to the latest California Real Property Report from PropertyRadar.
California single-family home and condominium sales dropped 3.5% to 36,912 in May from 38,249 in April.
However, the report explained that what is unusual this month is that the decrease in sales was due to a decline in both distressed and non-distressed property sales that fell 8.6% and 2.5%, respectively. The monthly decline in non-distressed sales is the first May decline since 2005.
On a yearly basis, sales were up slightly, gaining 2.3% from 36,096 in May 2014.
“With the exception of a few counties, price increases have slowed considerably,” said Madeline Schnapp, director of economic research for PropertyRadar. “You cannot defy gravity.”
“The environment of rising prices on lower sales volumes was destined not to last. Higher borrowing costs since the beginning of the year and decreased affordability was bound to impact sales sooner or later. We may also be seeing the fourth year in a row where prices jumped early in the year, only to roll-over and head lower later the rest of the year,” Schnapp continued.
Back in March, PropertyRadar’s report showed California was finally ramping up for the spring homebuying season, posting that March single-family home and condominium sales surged to 31,989, a 33.1% jump from 24,031 in February. It was the biggest March increase in three years.
Meanwhile, May’s median price of a California home was nearly unchanged at $396,750 in May, down 1.8% from $404,000 in April.
Within California’s 26 largest counties, most experienced slight increases in median home prices, edging higher in 21 of California’s largest 26 counties.
Year-over-year, the median price of a California home was nearly unchanged, up 0.4% from $395,000 dollars in April 2014.
While at the county level most of California’s 26 largest counties exhibited slower price increases, four counties continued to post double digit gains.
Ramshackle San Francisco home sells for $1.2 million
This San Francisco fixer-upper proves the old real estate adage, “Location, location, location.”

by Daniel Goldstein Click here to see more images of the home.
The tale of this otherwise humble two-story home selling for more than $1.2 million has gone viral and has much of the real-estate chattering class talking.

“This is not a joke,” wrote SFist’s Jay Barmann. “[T]his is the world we live in.” He called the 1907 four-bedroom, two-bath Craftsman home “ramshackle.” A “total disaster,” chimed in Tracy Elsen, a real-estate blogger in San Francisco.
Indeed, it might not look like much from the outside or on the inside, but where it is — 1644 Great Highway, San Francisco, CA, 94122 — is where it is.
The 1,832-square-foot house, listed on Redfin.com as a “contractor’s special” in a “deteriorative state” that “needs everything,” just sold, on March 24, for a whopping $1.21 million in cash (or $660 a square foot) after being listed in February for $799,000 (a premium of $411,000). At that per-square-foot price, this house, on San Francisco’s often-chilly western fringe, was more expensive than the going rates in Boston, Washington and New York.
The home, even though it has been gutted, has an unobstructed view of the Pacific Ocean and sits a short walk across San Francisco’s Great Highway to the beach, and it is just five blocks from San Francisco’s famed Golden Gate Park. Oh, and it’s got off-street parking, not a small thing in the City by the Bay.
The house sold for $340,000 in August of 1997 and was sold for $935,000 in June of 2008, when it looked a lot better.
A minimalist museum and a literary landmark

Since then, the house has taken a pounding. Many of the Craftsman-era fixtures common to Bay Area homes, including stained glass and Tiffany-style lamps, have been ripped out, as have most of the fixtures and carpeting and, evidently, the outdoor hot tub that was listed in 2008 but not mentioned in the 2015 listing. A second-story deck in the front of the house with a view of the ocean remains, but it is badly weathered, as is the forest-green paint, in sharp contrast with the careful upkeep evident in 2008.
But some of what made this home a gem in 2008 remains intact, including its picture windows, its decked garden, the fireplaces with wood mantels, the built-in cabinets common to Craftsman homes, the wainscoting and a gas O’Keefe & Merritt stove that dates back to the late 1940s or early 1950s (collector’s items that are prized by many homeowners in the Bay Area).
And given the fact that San Francisco’s median home price recently hit $1 million, and that it rose 10% between February 2014 and February 2015 and is expected to gain another 4.3% through February 2016, the price for this house, on this lot, might just prove to be a bargain.
Housing Contribution To US GDP Lowest In Post-War Era
In “Underwater Homeowners Here To Stay” we highlighted a report from Zillow which showed that negative equity has now become a permanent fixture of the US housing market. The report also showed that the percentage of homeowners who are underwater was flat from Q314 to Q414, breaking a string of 10 consecutive quarters of declines. We also recently noted that a completely ridiculous new home sales print that defied all logic notwithstanding, housing data, including starts and existing home sales, has come in below expectations. On a side note, home price appreciation has outpaced wage growth at a rate of 13:1, to which we would add:
Of course, the biggest determinant of home price appreciation over the past 2 years has nothing to do with US consumers, or household formation, as confirmed by the collapse in first-time home buyers or the unprecedented depression in new mortgage origination, and everything to do with what we first suggested is one of the main drivers of the US housing bubble – foreigners parking their illegally procured cash in the US and evading taxes, now that US housing, with the NAR’s anti-money laundering exemption blessing, is the new normal’s Swiss Bank Account. That and flipping homes from one “all-cash” buyer to another “all-cash” buyer in hopes of a quick capital appreciation and the constant presence of the proverbial dumb money.
Against this backdrop, Deutsche Bank is out predicting that a sluggish US housing market is likely to impact the supply of MBS going forward. As DB notes, housing isn’t the GDP contributor it once was and not by a long shot. Not only that, but when it comes to recoveries, the housing market’s GDP contribution was 7 times below its post WW2 average in year one and has fared even worse since. Here’s DB with more:
The contribution of housing to US GDP continues to run at some of the lowest levels since the end of World War II. New construction of single- and multi-family homes, renovations, broker fees and the like still only make up a bit more than 3% of current GDP, well below the post-war average of 4.7%. Not only has the level of lift from housing come in low, but it has bounced out of the last official recession slowly, too. Housing on average has contributed a half a percentage point to GDP a year after the end of every post-war US recession. This time around, housing added only 7 bp. And the contribution of housing in the second and third years after the recent recession also has fallen well below post-war averages. And while “insufficient supply” (not enough homes) was cited as a possible contributor to the existing home sales miss, DB notes that at least as of today, there appears to still be a “supply hangover” (although it’s waning):
US home ownership started the decade at 66.9%, peaked in 2004 at 69.2% and ended at 66.5%. It has since dropped to 64.0%. The exodus of owners initially threatened to leave a lot of extra houses behind and reduce the need to build new ones. But investors have come in to pick up the keys, and many houses have found a new home in the market for single-family rentals. This has helped reduce the supply of distressed homes, although it’s still higher than the levels that prevailed in the early 1990s when homeownership last ranged around 64% . The supply hangover isn’t done but should be in the next two or three years.
And demand isn’t looking so hot either:
Demand has likely played a part in slow housing, too, starting with owners that bought their homes in the last decade. Thanks to a 38% drop in home prices nationally from 2006 to 2012, according to Case-Shiller, a lot of those owners walked out the front door without any equity and without the ability to reenter the market as buyers. This has almost certainly contributed to the drop in rental unit vacancies from 10.6% in mid-2009 to 7.0% today. As for potential new owners, Americans, even before the crisis, started moving into their own place at a much slower pace than the long-term average of 1.2 million new households a year, that is, until recently. Demand from former and potential new owners has been soft.
Even in the best case scenario is which supply falls and demand rises, banks’ reluctance to lend could end up hobbling the market for the foreseeable future.
Although the market seems to be clearing out the lingering housing supply and the economy and the labor market look likely to repair demand, the availability of credit could prove to be the lasting constraint. Today’s lending standards reflect limits designed to keep the last decade’s boom and bust from happening again. Borrowers today without the ability to repay will not get a loan. But it looks like some borrowers with the ability to repay—but with low FICO scores or with needs that keep them outside the agency or prime jumbo markets—will also not get a loan. The market is reducing risk today to avoid risk tomorrow. But it also is likely reducing housing growth today to avoid a downturn tomorrow.
And here’s further confirmation of this from BofAML:
So there is your housing recovery in a nutshell: supply hangover, lackluster demand, and reluctant lenders all coalescing in a housing market whose contribution to US economic growth is virtually nonexistent.


And if you’re looking for the next shoe to drop, here’s a hint:

Leading Texas Golf Resort Communities Revealed
By Scott Kauffman | World Property Journal

While much of America struggled during the last financial crisis, Texas grew in greater economic stature on a number of levels. Fueled by a thriving energy economy, strong tech sector and job market, one strong growth area was real estate development.
Texans have always had a strong affinity to golf so it’s no surprise real estate communities, resorts and private clubs feature golf as a central component. Two top leisure properties in Texas are 72-hole Horseshoe Bay Resort in Texas Hill Country and TPC Four Seasons at Las Colinas, home to the AT&T Byron Nelson Championship.
On the private club front, the “Big D” features a collection of renowned golf clubs, including Brook Hollow Country Club, Dallas National and Preston Trail Golf Club, where initiation fees start at $125,000.
The following is a handful of golf and resort-style communities leading the Lone Star State’s leisure real estate sector today.
Vaquero Club, Westlake, Texas
When it comes to country club living, this Dallas-area private club is as luxurious as they come. Originally developed by Discovery Land Company, the Beverly Hills, Calif.-based company known for creating such elite clubs as Estancia in Scottsdale, Ariz. the Madison Club in La Quinta, Calif., and Kukio on the Big Island of Hawaii, Vaquero Club is now member-owned and fresh off an extensive $2.8 million renovation to its Tom Fazio-designed golf course.
According to club executives, part of the motivation behind the project was to enhance real estate vistas and create a more core-golf experience. A perfect example of this took place on the club’s drivable par-4 fourth hole, where new tee boxes were added, as well as on nine other holes.
This means resident members inside Vaquero’s stately manors have even more beautiful views to enjoy. Of an estimated dozen listings by the Jeff Watson Group of Briggs Freeman Sotheby’s International Realty, Vaquero’s most affordable home is currently listed at $1.295 million for a 4-bedroom, 4 1/2 -bath residence and it goes up to $5.995 million for a 5-bedroom estate on 3.8 acres featuring a 5-car garage and wine cellar with 1,500-bottle capacity.
The Vaquero Club consists of 385 equity memberships with an initiation fee approaching $200,000. Besides world-class golf, the club also offers a family-friendly Fish Camp, wine programs and other member amenities and services.
Cordillera Ranch, Boerne, Texas

Located 30 minutes northwest of San Antonio, Cordillera Ranch is a debt-free 8,700-acre master-planned residential community in the Texas Hill Country. The family-owned and operated development is not short on activities, considering residents of the gated community can join The Clubs of Cordillera Ranch that feature seven resort-style clubs in one location: The Golf Club, The Social Club, The Tennis and Swim Club, The Equestrian Club, The Rod and Gun Club, The Spa and Athletic Club and The River Club.
Opened in 2007, the community’s Jack Nicklaus Signature golf course has consistently been ranked among the best in Texas, most recently placing fifth on the Dallas Morning News‘ annual poll. Its par-3 16th has claimed the No. 1 spot as “Most Beautiful Hole” by the same publication for the past five years.
Among the community’s newest real estate offerings are golf course frontage lots, villas and an entirely new section aimed at young families. Overall, Cordillera Ranch boasts ¼-acre villa homes, valley-view and Guadalupe River-front homes, hilltop home sites and 1-to-10-acre estate residences.
According to the developer, 2014 was a banner year in both real estate and membership sales. For instance, Cordillera Ranch sold 33 homes at an average of $886,000 and total lot sales increased by 32 percent.
Trending in 2015: 46 new homes are under construction totaling more than $60 million in new starts – easily the highest total of any upscale community in the San Antonio area, according to the developer. Another 39 homes are in the architectural review approval process – a 65 percent increase over 2013.
Since its inception in 1997, more than 1,200 lots have been sold and approximately 700 homes have been completed. At final build-out, this low-density Hill Country community will total approximately 2,500 homes and preserve approximately 80 percent of the land in its natural vegetation. More than 70 new members were added in 2014, bucking the national trend of private club membership attrition.
“We’re excited and humbled to be a leader in the luxury lifestyle category,” says Charlie Hill, Vice President of Development at Cordillera Ranch. “With the economy thriving and the San Antonio area continuing to prosper, we expect the upward trend in real estate sales to continue in 2015.”
Cordillera Ranch credits much of its growth to being in the highly acclaimed Boerne School District, which is regarded as one of the best in Texas and boasts schools ranked in numerous national-best lists. The community is also benefitting from being in the prosperous Eagle Ford Shale. While other oil-rich areas have struggled with the drop in oil prices, the Eagle Ford Shale has continued to produce. That has attracted oil and gas executives to come to the Texas Hill Country and settle down in communities like Cordillera Ranch.
Boot Ranch, Fredericksburg, Texas

Three years after being put up for sale, the once-bankrupt Boot Ranch community has kicked back into high sales gear. This posh 2,051-acre master-planned golf community in Texas Hill Country’s Gillespie County started selling luxury lots in 2005 and opened a golf course designed by PGA Tour star Hal Sutton in 2006.
But sales were sluggish as the real estate market started to collapse worldwide and Lehman Brothers eventually foreclosed on the property in 2010. Then, the Municipal Police Employees Retirement System of Louisiana, one of Sutton’s original backers and a past partner on the project, sued a number of Boot Ranch partnerships and corporations, putting the project under further stress.
With all of these financial and legal troubles behind them, Boot Ranch is now able to focus on a revitalized real estate market and the renewed life is paying off for this private golf and family community near the popular town of Fredericksburg.
Case in point is Boot Ranch is coming off an eight-year record high for home and property sales, highlighted last year by $13.781 million in year-to-date sales through Sept. 30. Of the $13.781 million in sales, $9.057 million came from estate home sites; another $1.524 million was from Overlook Cabin home sites and $2.825 million were sales of fractional shares of the club’s Sunday Houses.

Overall, Boot Ranch sold 135 lots last year and had 16 homes completed with another 20 under construction or in the planning stages. Boot Ranch real estate options range from fractional ownership shares of 4,500-square-foot Sunday Houses to large Overlook Cabins priced from the $800,000s to estate home sites from $300,000 to $2.5 million for 2-18 acres.
“The booming demand for luxury ranch living is a byproduct of the successful Texas economy, particularly the energy business,” says Sean Gioffre, Boot Ranch director of marketing and sales. “The advent of hydraulic fracturing and the achievements of prized shale formations, like the Eagle Ford, Permian and Bakken, have pushed oil and gas production to record highs. With low interest rates, many people are looking to second homes as a hedge against inflation and as a tangible asset in which to put their money.”
Five miles north of the historic town of Fredericksburg, Boot Ranch is a master-planned retreat featuring one of the rare Sutton-designed courses, and a 34-acre practice park comprised of a short game range and executive par-three course. Other amenities at Boot Ranch include access to the 55,000-square-foot Clubhouse Village, casual and fine dining, a fully-stocked wine cellar, golf shop, ReStore Spa & Fitness Center, the 4.5-acre Ranch Club with pavilion, pools, tennis and sports courts, 10 member/guest lodge suites, a trap and skeet range overlooking Longhorn Lake, hiking, mountain biking, canoeing and fishing.
Construction is under way on a fishing pier and comfort station near Boot Ranch’s signature tenth hole on the golf course.
“We call Boot Ranch the ‘American Dream Texas Style,'” says co-director of marketing and sales Andrew Ball. “The motivation for buyers seems to be for recreational property – somewhere where owners can golf, fish, dine, swim, relax and generally enjoy the Texas outdoors. Many people say they just want to get their kids and grandkids out of the city, even if for only a few days or weeks at a time.”
Traditions Club and Community, Bryan, TX

This new upscale golf and country club development gives Texas A&M loyalists something else to brag about in Aggieland. Located less than 10 minutes from 10 minutes from a bustling college town and burgeoning health and research center, it’s no surprise why this is shaping up to be another successful Texas real estate project.
Traditions Club and Community is the private golf and residential community in “Aggieland” and home to the Texas A&M men’s and women’s golf teams. Located in Bryan-College Station, the club rests in the shadow of the university and in the heart of The Research Valley’s “One Health Plus Biocorridor.”
From custom-garden homes to large estate lots, Traditions Club has a wide range of developments that cater to many buyers. Future plans to attract even more residents call for a multi-use retail, entertainment and health/fitness complex to be built within the neighboring Biocorridor area that would mirror one of the top suburbs in Houston, The Woodlands.
Traditions’ tournament-caliber, Jack Nicklaus/Jack Nicklaus II-designed golf course hosts many high-profile junior, collegiate and amateur events. Other amenities include a 21,000-square foot, four-building clubhouse with men’s and women’s locker rooms; 25-meter junior Olympic lap and sport-leisure pools; family swim center with beach-like wading pool; and fully-equipped fitness center.
Casual fare is offered at the Poole Grille and fine dining at the clubhouse, home to an impressive wine cellar. Overnight accommodations are available in two-, three- and four-bedroom cottages and casitas located just walking distance from all the club’s amenities.
Overlooking stately oak trees, gently rolling terrain and the lush green fairways of the golf course, the Traditions Club and Community is an enclave of custom estates, Game Day Cottages, cozy casitas, villas, garden homes and luxurious condominiums. Home sites range from .25 acres up to an acre, with homes spanning 1,800 to 8,000 square feet.

Traditions Clubhouse
The newest phase being marketed is the Blue Belle home sites, a collection of 34 lots designed for two and three-bedroom custom homes. Overlooking a heavily wooded and rolling landscape in a peaceful and quiet enclave, the home sites encompass up to one-third of an acre and are priced with the home. The residences range from 2,200 to 3,500 square-feet and start in the low $400,000s.
Blue Belle residents can enjoy the outdoors without having to worry about extensive home and yard maintenance. Creative landscaped patios open up to peaceful settings that exemplify private community living. A multi-use trail meandering around a small lake is perfect for short walks and hikes
Interiors exude Texas Hill County elegance, with hardwood flooring, granite countertops, gourmet kitchens, high ceilings and open living area. The floor plans are highly personalized, providing a rich, distinguished selection of upscale finishes and features.
“Real estate sales in vibrant college towns like Bryan/College Station continue to thrive as master-planned communities like Traditions build to suit an array of buyers,” says Spencer Clements, Traditions Club Principal. “Empty-nesters or those seeking a second home with minimal maintenance will find Blue Belle offers the square-footages, relaxing setting and customized features catering to their needs and lifestyle.”
Tribute, The Colony, Texas

The Tribute, a Matthews Southwest, Wynne/Jackson master-planned community on the shores of Lake Lewisville, is one of the more ambitious golf and country club developments in the Dallas-Fort Worth metroplex.
Located just 23 miles from Dallas-Fort Worth International Airport, the Tribute is a 36-hbole upscale semi-private facility whose original plans call for 1,150 single-family homes, 160 golf villas, 183 townhomes, and 700 European condominium units.
The community’s newest course, Old American Golf Club, opened in the summer of 2009 and was designed by Tripp Davis and PGA Tour player and native son Justin Leonard. When Old American opened (it was originally called the
New Course), the developers offered premium lake-view, golf course-fronting lots in the Balmerino Village.
This initial phase of lots, located adjacent to the No. 5 green and the No. 6 tee box featured unobstructed views of Lake Lewisville and ranged in price from $135,000 to $275,000 for little more than 1/3 of an acre.
What makes the Tribute so unique it its Scottish links-inspired setting. For instance, the Tribute’s namesake layout, or “Old Course” as it’s often called, is patterned after the legendary courses of Scotland and the Open Championship what with its wind-swept dunes and fescue grasses.
The first and 18th holes share the same broad fairway, just the Old Course at St. Andrews, and you’ll also find a likeness of Royal Troon’s Postage Stamp hole and experience replica holes from Prestwick, Muirfield, Western Gailes and Royal Dornoch. For a special treat, make sure to stay in one of the overnight guest suites above the clubhouse that overlook the course.
The Tribute’s newest course pays homage to famed golf course architects such as Donald Ross and A.W. Tillinghast, many of whom came to the United States from Great Britain around the turn of the century.
According to an Old American spokesman, the new course currently has about 58 resident members of the club, which represents approximately 25 percent of the overall membership. Among the other amenities enjoyed by members are first-class amenity centers, pools, parks, playgrounds, on-site schools, hike-and-bike trails, landscaped canals and hundreds of acres of accessible open space reminiscent of the Scottish Highlands.
Airbnb And Other Short-Term Rentals Worsen Housing Shortage, Critics Say

Landlords in Venice and other tourist-friendly areas are converting units into short-term rentals, worsening the area’s housing shortage, a study says.
The last time he advertised one of his apartments, longtime Los Feliz landlord Andre LaFlamme got a request he’d never seen before.
A man wanted to rent LaFlamme’s 245-square-foot bachelor unit with hardwood floors for $875 a month, then list it himself on Airbnb.
“Thanks but no thanks,” LaFlamme told the prospective tenant. “You’ve got to be kidding me.”
But he understood why: More money might be made renting to tourists a few days at a time than to a local for 12 months or more.
About 12,700 rental units were listed on Airbnb in Los Angeles County on Dec. 22, 2014, but they were not spread out equally. In parts of Venice and Hollywood, Airbnb listings accounted for 4% or more of all housing units.
As short-term rental websites such as Airbnb explode in popularity in Southern California, a growing number of homeowners and landlords are caving to the economics. A study released Wednesday from Los Angeles Alliance for a New Economy, a labor-backed advocacy group, estimates that more than 7,000 houses and apartments have been taken off the rental market in metro Los Angeles for use as short-term rentals. In parts of tourist-friendly neighborhoods such as Venice and Hollywood, Airbnb listings account for 4% or more of all housing units, according to a Times analysis of data from Airbnb’s website.
That’s worsening a housing shortage that already makes Los Angeles one of the least affordable places to rent in the country.
“In places where vacancy is already limited and rents are already squeezing people out, this is exacerbating the problem,” said Roy Samaan, a policy analyst who wrote the alliance’s report. “There aren’t 1,000 units to give in Venice or Hollywood.”
![]()
Fast-growing Airbnb and others like it say they help cash-strapped Angelenos earn a little extra money. Airbnb estimates that 82% of its 4,500 L.A. hosts are “primary residents” of the homes they list, and that nearly half use the proceeds to help pay their rent or mortgage. And the effect on the broader housing market is so small that it’s all but irrelevant, said Tom Davidoff, a housing economist at the University of British Columbia whom Airbnb hired to study its impact.
“Over the lifetime of a lease, rents maybe go up 1.5%,” he said. “That’s peanuts relative to the increases we’ve seen in housing costs in a lot of places.”
But there are growing signs of professionalization of the short-term rental world, from property-manager middlemen like the one who e-mailed LaFlamme to Airbnb “hosts” who list dozens of properties on the site. The Los Angeles Alliance study estimates that 35% of Airbnb revenue in Southern California comes from people who list more than one unit.
“I don’t think anyone would begrudge someone renting out a spare bedroom,” Samaan said. “But there’s a whole cottage industry that’s springing up around this.”
City Council member Mike Bonin, whose coastal district includes Venice, and Council President Herb Wesson want to study how these rentals have affected the city. No regulations have been drafted, and Bonin said the council would seek extensive community input. Current rules bar short-term rentals in many residential areas of the city, but critics say they’re rarely enforced.
As city officials craft new ones, they’ll certainly be hearing from Airbnb and its allies. Last year, the company spent more than $100,000 lobbying City Hall and released a study touting its economic impact in L.A. — more than $200 million in spending by guests, supporting an estimated 2,600 jobs. A group representing short-term rental hosts has made the rounds of City Council offices as well.
This industry “needs to be regulated and regulated the right way,” said Sebastian de Kleer, co-founder of the Los Angeles Short Term Rental Alliance and owner of a Venice-based vacation rental company. “For a lot of people, this is a very new issue.”
Neighborhood groups are sure to weigh in too, especially in Venice.
 The beach neighborhood has the highest concentration of Airbnb listings in all of metro Los Angeles. Data collected by Beyond Pricing, a San Francisco-based start-up that helps short-term rental hosts optimize pricing, show that in census tracts along Venice Beach and Abbott-Kinney Boulevard, Airbnb listings accounted for 6% to 7% of all housing units — about 10 times the countywide average.
A letter last fall from the Venice Neighborhood Council to city officials estimated that the number of short-term rental listings in the area had tripled in a year, citing a “Gold Rush mentality” among investors looking for a piece of the action. That’s hurting local renters, said Steve Clare, executive director of Venice Community Housing.
“Short-term rentals are really taking over a significant portion of the rental housing market in our community,” Clare said. “It’s going to further escalate rents, and take affordable housing out of Venice.”
Along the Venice boardwalk, a number of apartment buildings now advertise short-term rentals, and houses on the city’s famed “walk streets” routinely show up in searches on Airbnb. Even several blocks inland, at Lincoln Place Apartments — a 696-unit, newly renovated complex that includes a pool, gym and other tourist-friendly amenities — Roman Barrett recently counted more than 40 listings on Airbnb and other sites. Barrett, who moved out over the issue, said Airbnb effectively drives up the rent. He paid $2,700 a month for a one-bedroom; now he’s looking farther east for something he can afford.
“It’s making places like Santa Monica and Venice totally priced out. Silver Lake is impossible. I’m looking in Koreatown right now,” Barrett said. “They need to make a law about this.”

A new law of some sort is the goal at City Hall. New York, San Francisco and Portland, Ore., have crafted regulations to govern taxes, zoning and length of stay in short-term rentals, and Airbnb says it’s glad to help in that process here.
“It’s time for all of us to work together on some sensible solutions that let people share the home in which they live and contribute to their community,” spokesman Christopher Nulty said in a statement Tuesday.
Will Youngblood, the man who e-mailed LaFlamme about managing his apartment in Los Feliz, says he’d also appreciate clearer rules and an easier way to pay occupancy taxes.
Youngblood runs five Airbnb apartments, mostly in Hollywood. A former celebrity assistant, he’s been doing this for two years; it’s a full-time job. Most of Youngblood’s clients own their homes but travel a lot or live elsewhere. One, he rents and lists full time. He’s been looking around for another.
“I’m honest about what I do,” he said. “Some [landlords] are like, ‘That’s insane. No way.’ Other people say, ‘We’d love that.'”
If the city decides it doesn’t like what he’s doing, Youngblood said, he’ll go do something else. But for now, he said, it’s a good way to make some cash and meet interesting people.
But he won’t meet LaFlamme. The longtime landlord concedes he “might be old-fashioned,” but he just doesn’t like the idea of strangers traipsing through his apartments. He prefers good, long-term tenants, and in L.A.’s red-hot rental market he has no problem finding them.
“I almost find it painful to rent things these days,” he said. “There’s so much demand and so many people who are qualified and nice people who I have to turn away.”
For that apartment in Los Feliz, LaFlamme said, he found a tenant in less than 24 hours.
25 Percent of all U.S. Foreclosures Are Zombie Homes

RealtyTrac’s Q1 2015 Zombie Foreclosure Report, found that as of the end of January 2015, 142,462 homes actively in the foreclosure process had been vacated by the homeowners prior to the bank repossessing the property, representing 25 percent of all active foreclosures.
The total number of zombie foreclosures was down 6 percent from a year ago, but the 25 percent share of total foreclosures represented by zombies was up from 21 percent a year ago.
“While the number of vacated zombie foreclosures is down from a year ago, they represent an increasing share of all foreclosures because they tend to be the problem cases still stuck in the pipeline,” said Daren Blomquist vice president at RealtyTrac. “Additionally, the states where overall foreclosure activity has been increasing over the past year — counter to the national trend — tend to be states with a longer foreclosure process more susceptible to the zombie problem.”
“In states with a bloated foreclosure process, the increase in zombie foreclosures is actually a good sign that banks and courts are finally moving forward with a resolution on these properties that may have been sitting in foreclosure limbo for years,” Blomquist continued. “In many markets there is plenty of demand from buyers and investors to snatch up these distressed properties as soon as they become available to purchase.”
Florida, New Jersey, New York have most zombie foreclosures

Despite a 35 percent decrease in zombie foreclosures compared to a year ago, Florida had the highest number of any state with 35,903 — down from 54,908 in the first quarter of 2014. Zombie foreclosures accounted for 26 percent of all foreclosures in Florida.
Zombie foreclosures increased 109 percent from a year ago in New Jersey, and the state posted the second highest total of any state with 17,983 — 23 percent of all properties in foreclosure.
New York zombie foreclosures increased 54 percent from a year ago to 16,777, the third highest state total and representing 19 percent of all residential properties in foreclosure.
Illinois had 9,358 zombie foreclosures at the end of January, down 40 percent from a year ago but still the fourth highest state total, while California had 7,370 zombie foreclosures at the end of January, up 24 percent from a year ago and the fifth highest state total.
“We are now in the final cycle of the foreclosure crisis cleanup, in which we are witnessing a large final wave of walkaways,” said Mark Hughes, Chief Operating Officer at First Team Real Estate, covering the Southern California market. “This has created an uptick in vacated or ‘zombie’ foreclosures and the intrinsic neighborhood issues most of them create.
“A much longer recovery, a largely veiled underemployment issue, and growing examples of faster bad debt forgiveness have most likely fueled this last wave of owners who have finally just walked away from their American dream,” Hughes added.
Other states among the top 10 for most zombie foreclosures were Ohio (7,360), Indiana (5,217), Pennsylvania (4,937), Maryland (3,363) and North Carolina (3,177).
“Rising home prices in Ohio are motivating lending servicers to commence foreclosure actions more quickly and with fewer workout options offered to delinquent homeowners, creating immediate vacancies earlier in the foreclosure process,” said Michael Mahon, executive vice president at HER Realtors, covering the Ohio housing markets of Cincinnati, Dayton and Columbus. “Delinquent homeowners need to understand how prices have increased in recent months, and how this increase in equity may provide positive options for them to avoid foreclosure.”

Metros with most zombie foreclosures: New York, Miami, Chicago, Tampa and Philadelphia. The greater New York metro area had by far the highest number of zombie foreclosures of any metropolitan statistical area nationwide, with 19,177 — 17 percent of all properties in foreclosure and up 73 percent from a year ago.
Zombie foreclosures decreased from a year ago in Miami, Chicago and Tampa, but the three metros still posted the second, third and fourth highest number of zombie foreclosures among metro areas nationwide: Miami had 9,580 zombie foreclosures,19 percent of all foreclosures but down 34 percent from a year ago; Chicago had 8,384 zombie foreclosures, 21 percent of all foreclosures but down 35 percent from a year ago; and Tampa had 7,838 zombie foreclosures, 34 percent of all foreclosures but down 25 percent from a year ago.
Zombie foreclosures increased 53 percent from a year ago in the Philadelphia metro area, giving it the fifth highest number of any metro nationwide in the first quarter of 2015. There were 7,554 zombie foreclosures in the Philadelphia metro area as of the end of January, 27 percent of all foreclosures.
Other metro areas among the top 10 for most zombie foreclosures were Orlando (3,718), Jacksonville, Florida (2,368), Los Angeles (2,074), Las Vegas (1,832), and Baltimore, Maryland (1,722).
Metros with highest share of zombie foreclosures: St. Louis, Portland, Las Vegas
Among metro areas with a population of 200,000 or more and at least 500 zombie foreclosures as of the end of January, those with the highest share of zombie foreclosures as a percentage of all foreclosures were St. Louis (51 percent), Portland (40 percent) and Las Vegas (36 percent).
Metros with biggest increase in zombie foreclosures: Atlantic City, Trenton, New York
Among metro areas with a population of 200,000 or more and at least 500 zombie foreclosures as of the end of January, those with the biggest year-over-year increase in zombie foreclosures were Atlantic City, New Jersey (up 133 percent), Trenton-Ewing, New Jersey (up 110 percent), and New York (up 73 percent).


Tenants Benefit When Rent Payment Data Are Factored Into Credit Scores
by Kenneth R. Harney | LA Times
It’s the great credit divide in American housing: If you buy a home and pay your mortgage on time regularly, your credit score typically benefits. If you rent an apartment and pay the landlord on time every month, you get no boost to your score. Since most landlords aren’t set up or approved to report rent payments to the national credit bureaus, their tenants’ credit scores often suffer as a direct result.
All this has huge implications for renters who hope one day to buy a house. To qualify for a mortgage, they’ll need good credit scores. Young, first-time buyers are especially vulnerable — they often have “thin” credit files with few accounts and would greatly benefit by having their rent histories included in credit reports and factored into their scores. Without a major positive such as rent payments in their files, a missed payment on a credit card or auto loan could have significant negative effects on their credit scores.
You probably know folks like these — sons, daughters, neighbors, friends. Or you may be one of the casualties of the system yourself, a renter with a perfect payment history that creditors will never see when they pull your credit. Think of it this way and the great divide gets intensely personal.
But here’s some good news: Growing numbers of landlords are now reporting rent payments to the bureaus with the help of high-tech intermediaries who set up electronic rent-collection systems for tenants.
One of these, RentTrack, says it already has coverage in thousands of rental buildings nationwide, with a total of 100,000-plus apartment units, and expects to be reporting rent payments for more than 1 million tenants within the year. Two others, ClearNow Inc. and PayYourRent, also report to one of the national bureaus, Experian, which includes the data in consumer credit files. RentTrack reports to Experian and TransUnion.
Why does this matter? Two new studies illustrate what can happen when on-time rent payments are factored into consumers’ credit reports and scores. RentTrack examined a sample of the tenants in its database and found that 100% of renters who previously were rated as “unscoreable” — there wasn’t enough information in their credit files to evaluate — became scoreable once they had two months to six months of rental payments reported to the credit bureaus.

Tenants who had scores below 650 at the start of the sampling gained an average of 29 points with the inclusion of positive monthly payment data. Overall, residents in all score brackets saw an average gain of 9 points. The scores were computed using the VantageScore model, which competes with FICO scores and uses a similar 300 to 850 scoring scale, with high scores indicating low risk of nonpayment.
Experian, the first major credit bureau to begin integrating rental payment records into credit files, also completed a major study recently. Using a sample of 20,000 tenants who live in government-subsidized apartment buildings, Experian found that 100% of unscoreable tenants became scoreable, and that 97% of them had scores in the “prime” (average 688) and “non-prime” (average 649) categories. Among tenants who had scores before the start of the research, fully 75% saw increases after the addition of positive rental information, typically 11 points or higher.
Think about what these two studies are really saying: Tenants often would score higher — sometimes significantly higher — if rent payments were reported to the national credit bureaus. Many deserve higher credit scores but don’t get them.
Matt Briggs, chief executive and founder of RentTrack, says for many tenants, their steady rent payments “may be the only major positive thing in their credit report,” so including them can be crucial when lenders pull their scores.
Justin Yung, vice president of ClearNow, told me that “for most [tenants] the rent is the largest payment they make per month and yet it doesn’t appear on their credit report” unless their landlord has signed up with one of the electronic payment firms.
Is this something difficult or complicated? Not really. You, your landlord or property manager can go to one of the three companies’ websites (RentTrack.com, ClearNow.com and PayYourRent.com), check out the procedures and request coverage. Costs to tenants are either minimal or zero, and the benefits to the landlord of having tenants pay rents electronically appear to be attractive.
Everybody benefits. So why not?
kenharney@earthlink.net Distributed by Washington Post Writers Group. Copyright © 2015, Los Angeles Times
Dreaming Big: Americans Still Yearning for Larger Homes

43% of adults would prefer homes bigger than where they currently live, but attitudes differ by age. Baby boomers would prefer to upsize rather than downsize by only a small margin, while the gap among millennials is much wider, with GenXers falling in between. Would-be downsizers outnumber upsizers only among households living in the largest homes.
Last year, we found that Baby Boomers were especially unlikely to live in multi-unit housing. At the same time, we noted that the share of seniors living in multi-unit housing rather than single-family homes has been shrinking for decades. These findings got us thinking about how the generations vary in house-size preference. So we surveyed over 2000 people at the end of last year to figure out if boomers have different house-size preferences than their younger counterparts. And that led us to ask: What size homes do Americans really want?

Most Americans are not living in the size home they want

As a whole, Americans are living in a world of mismatch – only 40% of our respondents said they are living in the size home that’s ideal. Furthermore, over 43% answered that the size of their ideal residence is somewhat or much larger than their current digs. Only 16% told us that their ideal residence is smaller than their existing home. However, these overall figures mask what is going on within different generations.
It’s natural to think that baby boomers are the generation most likely to downsize. After all, their nests are emptying and they may move when they retire. As it turns out though, more boomers would prefer to live in a larger home than a smaller one: 21% said their ideal residence is smaller than their current home, while 26% wanted a larger home – a 5-percentage-point difference. Clearly, boomers don’t feel a massive yearn to downsize. On the contrary, just over half (53%) said they’re already living in their ideally sized home. Nonetheless, members of this generation are more likely to want to downsize than millennials and GenXers.
In fact, those younger generations want some elbow room. First, the millennials. They’re looking to move on up by a big margin: just over 60% told us their ideal residence is larger than where they live now – the largest proportion among the generations in our sample. By contrast, only a little over 13% of millennials said they’d rather have a smaller home than their existing one – which is also the smallest among the generations in our sample. The results are clear: millennials are much more likely to want to upsize than downsize.
The next generation up the ladder, the GenXers, are hitting their peak earning years and many in this group may be in a position to trade up. Many aren’t living in their ideally sized home. Just 38% said where they live now is dream sized. Nearly a majority (48%) said their dream home is larger, while only 14% of GenXers would rather have a smaller home. This is the generation that bore the brunt of the foreclosure crisis. So, some of this mismatch could be because a significant number of GenXers lost homes during the housing bust and may now be living in smaller-than-desired quarters. But a much more probable reason is that many GenXers are in their peak child-rearing years. With kids bouncing off the walls, the place may be feeling a tad crowded.
Even the groups that seem ripe for downsizing don’t want smaller homes
Of course, age doesn’t tell the whole story about why people might want to downsize. It could be that certain kinds of households, – such as those without children, and living in the suburbs or in affordable areas – might be more likely to live in larger homes than they need. But our survey shows that households in these categories are about twice as likely to want a larger than a smaller home. For those with kids especially, the desire to upsize is strong: 39% preferred a larger home versus 18% who liked a smaller home. For those living in the suburbs, the disparity is even greater – 42% to 16%. And even among those living in the most affordable zip codes, where ideally-sized homes might be within the budgets of households, 40% of our respondents preferred larger homes versus 20% who said smaller.

Are all households more likely to upsize than downsize?
At this point you might be asking, “Are there any types of households that want to downsize?” The answer is yes. But only one kind of household falls into this category – those living in homes larger than 3,200 square feet. Of this group, 26% wanted to downsize versus 25% that wanted to upsize – a slight difference. But, when we looked overall at survey responses based on the size of current residence, households wanting a larger home kicked up as current home size went down. We can see this clearly when we divide households into six groups based on the size of the home they’re living in now. Among households living in 2,600-3,200 square foot homes, 37% prefer a larger home versus 16% a smaller home; in 2,000–2,600 square foot homes, its 34% to 18%; 38% to 18% in 1,400–2,000 square foot homes; 55% to 13% in 800–1,400 square foot homes; and 66% to 13% in homes less than 800 square feet. This makes intuitive sense. Those living in the biggest homes are most likely to have gotten a home larger than their ideal size. And those in the smallest homes are probably the ones feeling most squeezed.

The responses to our survey show significantly more demand for larger homes than for smaller ones. But the reality, of course, is that households must make tradeoffs between things like accessibility, amenities, and affordability when choosing what size homes to get. The “ideal” sized home for most Americans may be larger than where they’re living now. But that spacious dream home may not be practical. As result, the mismatch between what Americans say they want and what best suits their circumstances may persist.
Texas Home Buyers Are Better Off Than National Average

The March 2015 Texas Home buyers and Sellers Report from the Texas Association of Realtors shows that between July 2013 and June 2014 median household income for Texas home buyers increased 5.9 percent year-over-year compared with a national increase of only 1.4 percent.
Home buyers in Texas are older, more likely to be married and make more money than the national averages, according to the March 2015 Texas Home buyers and Sellers Report from the Texas Association of Realtors.
The study shows that between July 2013 and June 2014 median household income for Texas home buyers increased 5.9 percent year-over-year compared with a national increase of only 1.4 percent. However, the percentage of first-time home buyers in Texas fell 4 points to 29 percent, compared to a 5 percent decline nationally to 33 percent.
Home buyers in Texas are also two years older compared to the previous period, edging up to 45 years of age, and 72 percent of home buyers are married, compared to 65 percent nationally.
Texans are also buying larger and newer homes than other buyers across the U.S. In Texas, the typical three-bedroom, two-bathroom home had 2,100 square feet and was built in 2002, compared to the typical national home built in 1993 with 1,870 square feet.
Forty-seven percent of first-time home buyers in Texas said that finding the right property was the most difficult step in buying a home, as did 48 percent of repeat home buyers.
For Texans selling homes, 21 percent said that the reason for selling was because of job relocation, followed by 16 percent who said that their home was too small. The median household income for a Texas home seller was $120,800, compared with a national media income of $96,700 among home sellers.
Texas home buyers (overall): July 2013 – June 2014
- Median household income: +5.9% to $97,500
- Percent of homes bought that were new: 28% (-1% from July 2012 – June
- 2013)
- Percentage of first-time home buyers: 29% (-4% from July 2012 – June
- 2013)
- Age of typical home buyer: 45 years old (+2 years from July 2012 – June 2013)
- Average age of first-time home buyer: 32 years old (+1 year from July
- 2012 – June 2013)
- Average age of repeat home buyer: 50 years old (unchanged from July 2012 – June 2013)
- Median household income for first-time home buyers: +5.8% to $72,000 (compared to July 2012 – June 2013)
- Median household income for repeat home buyers: -8.9% to $97,500 (compared to July 2012 – June 2013)
- Percent of married home buyers: 72% (+1% from July 2012 – June 2013)
- New homes purchased: 28% (-2% from July 2012 – June 2013)
- Median household income for home sellers: $120,800
- Age of average home seller: 49 years
National home buyers (overall): June 2013 – July 2014
- Median household income: +1.4% to $84,500
- Percent of homes bought that were new: 16% (constant from July 2012 – June 2013)
- Percentage of first-time home buyers: 33% (-5% from July 2012 – June 2013)
- Age of typical home buyer: 44 years old (+2 years from July 2012 – June
- 2013)
- Average age of first-time home buyer: 31 years old (unchanged from July
- 2012 – June 2013)
- Average age of repeat home buyer: 53 years old (+1 year from July 2012 – June 2013)
- Median household income for first-time home buyers: +2.3% to $68,300 (compared to July 2012 – June 2013)
- Median household income for repeat home buyers: -1% to $95,000 (compared to July 2012 – June 2013)
- Percent of married home buyers: 65% (-1% from July 2012 – June 2013)
- New homes purchased: 16% (unchanged from July 2012 – June 2013)
- Median household income for home sellers: $96,700
- Age of average home seller: 54 years
Housing Industry Frets About the Next Brick to Drop

Stephen Schwarzman, CEO and co-founder of Blackstone Group, the world’s largest private-equity firm with $290 billion in assets under management, made $690 million for 2014 via a mix of dividends, compensation, and fund payouts, according to a regulatory filing. A 50% raise from last year.
The PE firm’s subsidiary Invitation Homes, doped with nearly free money the Fed’s policies have made available to Wall Street, has become America’s number one mega-landlord in the span of three years by buying up 46,000 vacant single-family homes in 14 metro areas, initially at a rate of $100 million per week, now reduced to $35 million per week.
As of September 30, Invitation Homes had $8.7 billion worth of homes on its balance sheet, followed by American Homes 4 Rent ($5.5 billion), Colony Financial ($3.4 billion), and Waypoint ($2.6 billion). Those are the top four. Countless smaller investors also jumped into the fray. Together they scooped up several hundred thousand single-family houses.
A “bet on America,” is what Schwarzman called the splurge two years ago.
The bet was to buy vacant homes out of foreclosure, outbidding potential homeowners who’d actually live in them, but who were hobbled by their need for mortgages in cash-only auctions. The PE firms were initially focused only on a handful of cities. Each wave of these concentrated purchases ratcheted up the prices of all other homes through the multiplier effect.
Homeowners at the time loved it as the price of their home re-soared. The effect rippled across the country and added about $7 trillion to homeowners’ wealth since 2011, doubling equity to $14 trillion.
But it pulled the rug out from under first-time buyers. Now, only the ludicrously low Fed-engineered interest rates allow regular people – the lucky ones – to buy a home at all. The rest are renting, in a world where rents are ballooning and wages are stagnating.
Thanks to the ratchet effect, whereby each PE firm helped drive up prices for the others, the top four landlords booked a 23% gain on equity so far, with Invitation Homes alone showing $523 million in gains, according to RealtyTrac. The “bet on America” has been an awesome ride.
But now what? PE firms need to exit their investments. It’s their business model. With home prices in certain markets exceeding the crazy bubble prices of 2006, it’s a great time to cash out. RealtyTrac VP Daren Blomquist told American Banker that small batches of investor-owned properties have already started to show up in the listings, and some investors might be preparing for larger liquidations.
“It is a very big concern for real estate professionals,” he said. “They are asking what the impact will be if investors liquidate directly onto the market.”
But larger firms might not dump these houses on the market unless they have to. American Banker reported that Blackstone will likely cash out of Invitation Homes by spinning it off to the public, according to “bankers close to the Industry.”
After less than two years in this business, Ellington Management Group exited by selling its portfolio of 900 houses to American Homes 4 Rent for a 26% premium over cost, after giving up on its earlier idea of an IPO. In July, Beazer Pre-Owned Rental Homes had exited the business by selling its 1,300 houses to American Homes 4 Rent, at the time still flush with cash from its IPO a year earlier.
Such portfolio sales maintain the homes as rentals. But smaller firms are more likely to cash out by putting their houses on the market, Blomquist said. And they have already started the process.
Now the industry is fretting that liquidations by investors could unravel the easy Fed-engineered gains of the last few years. Sure, it would help first-time buyers and perhaps put a halt to the plunging home ownership rates in the US [The American Dream Dissipates at Record Pace].
But the industry wants prices to rise. Period.
When large landlords start putting thousands of homes up for sale, it could get messy. It would leave tenants scrambling to find alternatives, and some might get stranded. A forest of for-sale signs would re-pop up in the very neighborhoods that these landlords had targeted during the buying binge. Each wave of selling would have the reverse ratchet effect. And the industry’s dream of forever rising prices would be threatened.
“What kind of impact will these large investors have on our communities?” wondered Rep. Mark Takano, D-California, in an email to American Banker. He represents Riverside in the Inland Empire, east of Los Angeles. During the housing bust, home prices in the area plunged. But recently, they have re-soared to where Fitch now considers Riverside the third-most overvalued metropolitan area in the US. So Takano fretted that “large sell-offs by investors will weaken our housing recovery in the very same communities, like mine, that were decimated by the sub prime mortgage crisis.”
PE firms have tried to exit via IPOs – which kept these houses in the rental market.
Silver Bay Realty Trust went public in December 2012 at $18.50 a share. On Friday, shares closed at $16.16, down 12.6% from their IPO price.
American Residential Properties went public in May 2013 at $21 a share, a price not seen since. “Although people look at this as a new industry, there’s really nothing new about renting single-family homes,” CEO Stephen Schmitz told Bloomberg at the time. “What’s new is that it’s being aggregated, we’re introducing professional management and we’re raising institutional capital.” Shares closed at $17.34 on Friday, down 17.4% from their IPO price.
American Homes 4 Rent went public in August 2013 at $16 a share. On Friday, shares closed at $16.69, barely above their IPO price. These performances occurred during a euphoric stock market!
So exiting this “bet on America,” as Schwarzman had put it so eloquently, by selling overpriced shares to the public is getting complicated. No doubt, Blackstone, as omnipotent as it is, will be able to pull off the IPO of Invitation Homes, regardless of what kind of bath investors end up taking on it.
Lesser firms might not be so lucky. If they can’t find a buyer like American Homes 4 Rent that is publicly traded and doesn’t mind overpaying, they’ll have to exit by selling their houses into the market.
But there’s a difference between homeowners who live in their homes and investors: when homeowners sell, they usually buy another home to live in. Investors cash out of the market. This is what the industry dreads. Investors were quick to jump in and inflated prices. But if they liquidate their holdings at these high prices, regular folks might not materialize in large enough numbers to buy tens of thousands of perhaps run-down single-family homes. And then, getting out of the “bet on America” would turn into a real mess.
Housing Crash In China Steeper Than In Pre-Lehman America

by Wolf Richter • February 26, 2015
China has long frustrated the hard-landing watchers – or any-landing watchers, for that matter – who’ve diligently put two and two together and rationally expected to be right. They see the supply glut in housing, after years of malinvestment. They see that unoccupied homes are considered a highly leveraged investment that speculators own like others own stocks, whose prices soar forever, as if by state mandate, but that regular people can’t afford to live in.
Hard-landing watchers know this can’t go on forever. Given that housing adds 15% to China’s GDP, when this housing bubble pops, the hard-landing watchers will finally be right.
Home-price inflation in China peaked 13 months ago. Since then, it has been a tough slog.
Earlier this month, the housing news from China’s National Bureau of Statistics gave observers the willies once again. New home prices in January had dropped in 69 of 70 cities by an average of 5.1% from prior year, the largest drop in the new data series going back to 2011, and beating the prior record, December’s year-over-year decline of 4.3%. It was the fifth month in a row of annual home price declines, and the ninth month in a row of monthly declines, the longest series on record.
Even in prime cities like Beijing and Shanghai, home prices dropped at an accelerating rate from December, 3.2% and 4.2% respectively.
For second-hand residential buildings, house prices fell in 67 of 70 cities over the past 12 months, topped by Mudanjiang, where they plunged nearly 14%.
True to form, the stimulus machinery has been cranked up, with the People’s Bank of China cutting reserve requirements for major banks in January, after cutting its interest rate in November. A sign that it thinks the situation is getting urgent.
So how bad is this housing bust – if this is what it turns out to be – compared to the housing bust in the US that was one of the triggers in the Global Financial Crisis?
Thomson Reuters overlaid the home price changes of the US housing bust with those of the Chinese housing bust, and found this:
The US entered recession around two years after house price inflation had peaked. After nine months of recession, Lehman Brothers collapsed. As our chart illustrates, house price inflation in China has slowed from its peak in January 2014 at least as rapidly as it did in the US.
Note the crashing orange line on the left: year-over-year home-price changes in China, out-crashing (declining at a steeper rate than) the home-price changes in the US at the time….
The hard-landing watchers are now wondering whether the Chinese stimulus machinery can actually accomplish anything at all, given that a tsunami of global stimulus – from negative interest rates to big bouts of QE – is already sloshing through the globalized system. And look what it is accomplishing: Stocks and bonds are soaring, commodities – a demand gauge – are crashing, and real economies are languishing.
Besides, they argue, propping up the value of unoccupied and often unfinished investment properties that most Chinese can’t even afford to live in might look good on paper, but it won’t solve the problem. And building even more of these units props up GDP nicely in the short term, and therefore it’s still being done on a massive scale, but it just makes the supply glut worse.
Sooner or later, the hard-landing watchers expect to be right. They know how to add two and two together. And they’re already smelling the sweet scent of being right this time, which, alas, they have smelled many times before.
But it does make you wonder what the China housing crash might trigger when it blooms into full maturity, considering the US housing crash helped trigger of the Global Financial Crisis. It might be a hard landing for more than just China. And ironically, it might occur during, despite, or because of the greatest stimulus wave the world has ever seen.
Stocks, of course, have been oblivious to all this and have been on a tear, not only in China, but just about everywhere except Greece. But what happens to highly valued stock markets when they collide with a recession? They crash.
What to Expect When This Stock Market Meets a Recession
by Doug Short • February 25, 2015
Last week I had a fascinating conversation with Neile Wolfe, of Wells Fargo Advisors, LLC., about high equity valuations and what happens when they collide with a recession.
Here is my monthly update that shows the average of the four valuation indicators: Robert Shiller’s cyclically adjusted price-to-earnings ratio (CAPE), Ed Easterling’s Crestmont P/E, James Tobin’s Q Ratio, and my own monthly regression analysis of the S&P 500:

Based on the underlying data in the chart above, Neile made some cogent observations about the historical relationships between equity valuations, recessions and market prices:
- High valuations lead to large stock market declines during recessions.
- During secular bull markets, modest overvaluation does not produce large stock market declines.
- During secular bear markets, modest overvaluation still produces large stock market declines.
Here is a table that highlights some of the key points. The rows are sorted by the valuation column.

Beginning with the market peak before the epic Crash of 1929, there have been fourteen recessions as defined by the National Bureau of Economic Research (NBER). The table above l ists the recessions, the recession lengths, the valuation (as documented in the chart illustration above), the peak-to-trough changes in market price and GDP. The market price is based on the S&P Composite, an academic splicing of the S&P 500, which dates from 1957 and the S&P 90 for the earlier years (more on that splice here).
I’ve included a row for our current valuation, through the end of January, to assist us in making an assessment of potential risk of a near-term recession. The valuation that preceded the Tech Bubble tops the list and was associated with a 49.1% decline in the S&P 500. The largest decline, of course, was associated with the 43-month recession that began in 1929.
Note: Our current market valuation puts us between the two.
Here’s an interesting calculation not included in the table: Of the nine market declines associated with recessions that started with valuations above the mean, the average decline was -42.8%. Of the four declines that began with valuations below the mean, the average was -19.9% (and that doesn’t factor in the 1945 outlier recession associated with a market gain).
What are the Implications of Overvaluation for Portfolio Management?
Neile and I discussed his thoughts on the data in this table with respect to portfolio management. I came away with some key implications:
- The S&P 500 is likely to decline severely during the next recession, and future index returns over the next 7 to 10 years are likely to be low.
- Given this scenario, over the next 7 to 10 years a buy and hold strategy may not meet the return assumptions that many investors have for their portfolio.
- Asset allocation in general and tactical asset allocation specifically are going to be THE important determinant of portfolio return during this time frame. Just buying and holding the S&P 500 is likely be disappointing.
- Some market commentators argue that high long-term valuations (e.g., Shiller’s CAPE) no longer matter because accounting standards have changed and the stock market is still going up. However, the impact of elevated valuations — when it really matters — is expressed when the business cycle peaks and the next recession rolls around. Elevated valuations do not take a toll on portfolios so long as the economy is in expansion.
How Long Can Periods of Overvaluations Last?
Equity markets can stay at lofty valuation levels for a very long time. Consider the chart posted above. There are 1369 months in the series with only 58 months of valuations more than two Standard Deviations (STD) above the mean. They are:
- September 1929 (i.e., only one month above 2 STDs prior to the Crash of 1929)
- Fifty-one months during the Tech bubble (that’s over FOUR YEARS)
- Six of the last seven months have been above 2 STDs
Stay tuned.
Affordable Housing Plan Slaps Fee on California Property Owners

by Phil Hall
The speaker of California’s State Assembly is seeking to raise new funds for affordable housing development by adding a new $75 fee to the costs of recording real estate documents.
Toni Atkins, a San Diego Democrat, stated that the new fee would be a permanent addition to the state’s line-up of fees and taxes and would apply to all real estate documents except those related to home sales. Atkins conspicuously avoided citing the $75 figure in a press statement issued by her office, only briefly identifying it as a “small fee” while insisting that she had broad support for the plan.
“The permanent funding source, which earned overwhelming support from California’s business community, will generate hundreds of millions annually for affordable housing and leverage billions of dollars more in federal, local, and bank investment,” Atkins said. “This plan will reap benefits for education, healthcare and public safety as well. The outcomes sought in other sectors improve when housing instability is addressed.”
Atkins added that her plan should add between $300 million to $720 million a year for the state’s affordable housing endeavors. But Atkins isn’t completely focused on collecting revenue: She is simultaneously proposing that developers offering low-income housing should receive $370 million in tax credits, up from the current level of $70 million.
This is the third time that a $75 real estate transaction fee has been proposed in the state legislature. Earlier efforts were put forward in 2012 and 2013, but failed to gained traction. Previously, opponents to the proposal argued that transactions involving multiple documents would be burdened with excess costs because the fee applies on a per-document basis and not a per-transaction basis.
One of the main opponents of Atkins’ proposal, Jon Coupal, president of the Howard Jarvis Taxpayers Association, told the San Francisco Chronicle that the speaker was playing word games by insisting this was merely a fee and that she was penalizing property owners to finance a problem that they did not create.
“It’s clearly a tax, not a fee,” said Coupal. “There is not a nexus between the fee payer and the public need being addressed. It’s not like charging a polluter a fee for the pollution they caused. It’s a revenue that is totally divorced from the so-called need for affordable housing.”
A Raw Deal for Real-Estate Agents
Real estate can be risky for agents themselves. Fickle buyers, unforeseen structural issues, setbacks in financing can all scuttle a deal.

THE COMMITMENT-PHOBE Known for repeatedly pulling out of the purchase right before the contract is signed. Illustration: Laszlito Kovacs
By Nancy Keates | Wall Street Journal, Feb. 19, 2015
She saw a ghost. That was the excuse, anyway, for one buyer’s decision to back out at the last minute from closing on a $1.4 million house in San Francisco, losing a roughly $21,000 deposit in the process.
Her real-estate agent, Amanda Jones of Sotheby’s International Realty, estimates she spent about 250 hours over six months showing the prospective buyer about 130 houses in the Bay Area. In the end, she believes the woman just changed her mind. “It was horrible,” the agent says.
Few professions demand as much upfront time and legwork with the risk of zero return on the effort as real-estate sales. Fickle buyers, unforeseen structural issues, setbacks in financing can all scuttle a sale. Now, there’s another common deal breaker: an overheated housing market in which frenzied bidding wars lead to rash decisions—followed by buyers’ remorse.
“It’s such a fast-paced market right now. Buyers are expected to make offers after seeing a place once at a packed house, so they don’t have time to think things through,” says Kaitlin Adams, an agent with New York-based Compass.

THE NERVOUS NELLIE Spends countless hours to find the perfect home, but backs out at the last minute, saying it just doesn’t ‘feel right.
Nationally, median home prices in 2014 rose to their highest level since 2007, while housing inventory continued to drop—falling 0.5% lower than a year ago, according to the National Association of Realtors. The percentage of buyers backing out of contracts has gone up by about 8%—to 19.1% in the third quarter of 2014 from 17.76% in the third quarter of 2012, according to Evercore ISI, an investment-banking advisory firm.
The war stories come mostly at the high end in select markets, where affluent buyers are less affected by the prospect of losing thousands in earnest money or down payments. Cormac O’Herlihy of Sotheby’s International Realty in Los Angeles recently had buyers he calls “nervous nellies” back out on a $6 million house. “They enjoy an overabundance of financial ability,” Mr. O’Herlihy says.
Julie Zelman, a New York-based agent with Engel & Völkers, spent the past year searching for an apartment for a recently divorced client in his 40s who said he wanted to move from Manhattan’s Upper East Side to a building downtown—preferably one populated by celebrities. Twice the client was about to close when he changed his mind: The first time was at a building called Soho Mews—he’d read it was the home of an Oscar-nominated actress and a Grammy-winning musician. The man offered $2.8 million for a two-bedroom unit but then backed out. Another time, he walked away after offering $3.1 million on a two-bedroom unit in 1 Morton Square, where a popular TV actress once lived.
“He was wasting everyone’s time. It was humiliating for me,” says Ms. Zelman, who thinks the client wasn’t mentally ready for such a big change. The client ended up renting an apartment on the Upper East Side.

THE FAULT FINDER Cites microscopic flaws to quash the deal—and get the earnest money back.
When buyers change their minds before signing a contract, they don’t lose any money. Nataly Rothschild, a New York-based broker, says she thought she had finally closed a deal after a couple’s yearlong house hunt. Because there were five other offers pending, her clients offered $200,000 over the almost $2 million asking price on the three-bedroom, three-bathroom listed for $1.8 million on Manhattan’s Upper East Side. Then Ms. Rothschild, an agent at Engel & Völkers, got a call from the couple’s attorney saying the buyer, who was nine months pregnant, had broken down in tears, saying she just couldn’t sign because it didn’t feel right. “I felt miserable for her,” says Ms. Rothschild. “But we were all shocked.”
Buyers who change their minds after signing a contract typically lose their earnest money, a deposit that shows the offer was made in good faith. That money is often held by the title company or in an escrow account and later applied to down payment and closing costs. If the deal falls through, whoever holds the deposit determines who gets the earnest money. In standard contracts, the earnest money goes to the seller. If, however, a contingency spelled out in the contract emerges—the buyer’s financing falls through, for example—the buyer usually gets the earnest money back.
Vivian Ducat, an agent with Halstead Property in New York, had a client lose $55,000 in earnest money after a change of heart on a $550,000 co-op. The woman, who was living in California, had wanted to buy a place in New York because one of her children was living there. At the last minute she balked, emailing that she “couldn’t handle the New York lifestyle.” She’d signed the contract and even filled out all the paperwork for the co-op board.

THE OVER BIDDER. Gets caught up in the frenzy of the bidding war, then realizes he didn’t mean to spend so much.
In rare instances, buyers can get their earnest money back through arbitration if they can prove a valid cause. Ms. Adams, the Compass agent, represented the sellers of a one-bedroom apartment in Brooklyn Heights that was listed for just under $600,000. When a bidding war with five offers ensued, the unit went for $70,000 above asking price to a couple from the West Coast who wanted to use it as a part-time residence. After the contract was signed, the building’s co-op board enacted a new rule that owners had to live in the building full time. As a result, the West Coast couple got their earnest money back, and the unit sold to another buyer at about $80,000 above the asking price.
Even if the real reason is simply buyer’s remorse, real-estate agents say buyers can get back earnest money as long as they can find some valid-sounding reason for dissatisfaction. Ms. Jones in San Francisco had clients withdraw an offer on a $1.1 million house. They’d been looking for two years and when the house came up the wife was traveling abroad; the husband said he was sure she would love it. Turns out the wife didn’t like it at all. The couple used the excuse of a leak found in the inspection process and got their $33,000 deposit back.
And about that ghost. A buyer who put down $43,000 in earnest money pulled out after a neighbor told them the previous owner had died in the home, among other things. The matter went into arbitration, and the potential buyer got the entire deposit back.
Ever since then, Ms. Jones says she has sellers disclose in their contracts the possibility that there might be a ghost. “You have to prepare for anything,” she says.
Increasing Rent Costs Present a Challenge to Aspiring Homeowners
 by Tory Barringer
Fast-rising rents have made it difficult for many Americans to save up a down payment for a home purchase—and experts say that problem is unlikely to go away any time soon.
Late last year, real estate firm Zillow reported that renters living in the United States paid a cumulative $441 billion in rents throughout 2014, a nearly 5 percent annual increase spurred by rising numbers of renters and climbing prices. Last month, the company said that its own Rent Index increased 3.3 percent year-over-year, accelerating from 2013 even as home price growth slows down.
Results from a more recent survey conducted by Zillow and Pulsenomics suggest that rent prices will continue to be a problem for the aspiring homeowner for years to come.
Out of more than 100 real estate experts surveyed, 51 percent said they expect rental affordability won’t improve for at least another two years, Zillow reported Friday. Another 33 percent were a little more optimistic, calling for a deceleration in rental price increases sometime in the next one to two years.
Only five percent said they expect affordability conditions to improve for renters within the next year.
Despite the challenge that rising rents presents to home ownership throughout the country, more than half—52 percent of respondents—said the market should be allowed to correct the problem on its own, without government intervention.
“Solving the rental affordability crisis in this country will require a lot of innovative thinking and hard work, and that has to start at the local level, not the federal level,” said Zillow’s chief economist, Stan Humphries. “Housing markets in general and rental dynamics in particular are uniquely local and demand local, market-driven policies. Uncle Sam can certainly do a lot, but I worry we’ve become too accustomed to automatically seeking federal assistance for housing issues big and small, instead of trusting markets to correct themselves and without waiting to see the impact of decisions made at a broader local level.”
On the topic of government involvement in housing matters: The survey also asked respondents about last month’s reduction in annual mortgage insurance premiums for loans backed by the Federal Housing Administration (FHA). The Obama administration has projected that the cuts will help as many as 250,000 new homeowners make their first purchase.
The panelists were lukewarm on the change: While two-thirds of those with an opinion said they think the changes could be “somewhat effective in making homeownership more accessible and affordable,” just less than half said the new initiatives are unwise and potentially risky to taxpayers.
Finally, the survey polled panelists on their predictions for U.S. home values this year. As a whole, the group predicted values will rise 4.4 percent in 2015 to a median value of $187,040, with projections ranging from a low of 3.1 percent to a high of 5.5 percent.
“During the past year, expectations for annual home value appreciation over the long run have remained flat, despite lower mortgage rates,” said Terry Loebs, founder of Pulsenomics. “Regarding the near-term outlook, there is a clear consensus among the experts that the positive momentum in U.S. home prices will continue to slow this year.”
On average, panelists said they expect median home values will pass their precession peak ($196,400) by May 2017.
Global Capital Will Continue to Flow into Real Estate in 2015

By Michael Gerrity
According to LaSalle Investment Management’s new 2015 Investment Strategy Annual (ISA) report, money will continue to flow into real estate from across the capital markets worldwide, but investors should be increasingly concerned about getting caught late in the cycle and should anticipate the next cyclical downturn in a few years.
ISA report states that different regions of the world will be growing at different speeds in 2015, investors need to prepare their portfolios for world where interest rates begin to rise more quickly in some parts than others.
Jacques Gordon, LaSalle’s Global Head of Research and Strategy said, “Where we are in the real estate cycle is one of the most commonly asked questions of real estate investment managers and with good reason. Investors are concerned about what might happen if capital markets turn away from property. Timing strategies are difficult to apply to a relatively illiquid asset class like real estate. Nevertheless, adjusting portfolios as assets and markets move through their respective cycles can improve performance by enhancing returns and reducing risk.”ISA Investor Advice Includes:
- Diversify their holdings across a number of countries that are in different stages of the capital market cycle.
- Anticipate different interest rate environments by allocating to real estate assets with income streams that keep pace with rising inflation or debt costs in growing economies like the U.K or the U.S. Also, focus on high quality properties and locations in markets where growth/interest rates will stay “lower for longer”, such as Japan or Western Europe.
- Invest in secular trends, rather than cyclical ones, that will be less exposed to a downturn. The ISA found that investments linked to Demographics, Technology and Urbanization (DTU) – first identified last year – are likely to be key in helping investors to identify such trends.
- Continue to place a high emphasis on sustainability factors, like energy efficiency and recycling, when buying, improving and operating buildings. Tenants and the capital markets will be paying much more attention to environmental standards in the years ahead.
Gordon also noted that markets around the world are at very different stages in terms of market fundamentals and capital markets, and hence future performance. Thus, it makes sense to have an investment program that takes advantage of real estate cycles. Examples of cycle-sensitive strategies include: Harvesting gains and selling properties in frothy capital markets, taking advantage of higher levels of leasing/rental growth in growth markets, and focusing on locations/sectors that are positioned to qualify as mainstream “core” assets in a few years.
Other themes for 2015 identified by the ISA include:
- Money is likely to continue to flow into real estate as long as the yields on property continue to offer a premium to investment-grade bonds.
- The debt markets are also embracing real estate, although lending is not yet as aggressive as it was during the peak of the credit bubble.
- Taken together, this is likely to keep pushing prices up, while continuing to lower the expected future returns on real estate.
- It could also lead to an escalation in new development. After many years of low levels of new construction in nearly all G-20 countries, most major markets can easily absorb moderate additions to inventory without creating an oversupply problem.
Key Trends in The United States
Overall, North America is in a good position for 2015 with healthy real estate markets and economic growth. Despite global headwinds, the U.S. economy and real estate markets will improve at a faster pace over the next three years, a welcome trend after five years of below average recovery. Capital flows to real estate will remain very strong next year, with overall real estate transaction levels close to or surpassing the pre-recession peak. Both equity and debt will be plentiful, and lenders will become increasingly aggressive in deploying capital.
In addition, occupancy rates will continue to improve for industrial, retail and most notably office in 2015. However, occupancy rates will be stable in the apartment sector as new supply matches demand, while rental rates in select markets such as San Francisco, New York City and Portland will outpace the national average.
The Investment Strategy Annual also predicts that many firms will be willing to pay higher rents in 2015 for properties located in Central Business Districts, because these locations greatly improve the ability to recruit talented Millennials. Moreover, E-commerce will continue to take market share in the retail sector, although new fashion trends, convenience, services, and out-of-home dining will keep the best shopping centers full and able to raise rents. Urban retail will continue to outperform due to strong tenant demand and little new supply.
Key Trends in Canada
The Investment Strategy Annual predicts that Canada’s near-term economic growth in 2015 will trail the United States, yet remain ahead of most other G7 countries. While slower global growth could impact demand in Canada’s resources sector, improvement in the U.S. economy will benefit Canada in the form of stronger export volumes in 2015 and beyond. Private consumption is forecast to grow more slowly in 2015 given elevated housing prices and high household debt levels. Stronger business investment and government expenditures should partially offset this.
Growth in the Alberta oil sands will slow in 2015 as oil prices face downward pressure and U.S. production escalates. However, traditional oil and gas drilling is re-emerging as fracking technology improves and pipeline expansion delays have been alleviated by significant growth in rail transport. Consequently, economic growth and real estate demand in cities in Western Canada will continue to outpace the nation.
In addition, e-commerce adoption will continue to grow as a share of overall retail trade and drive further changes among retailers and distribution chains in Canada. Retailers with a proven, established e-commerce platform will grow at the expense of those with less efficient or no models.
Key Trends in Mexico
Given its close links to the U.S., Mexico’s economy should outperform many other emerging markets in 2015 and beyond. Economic growth should accelerate in 2015, led by export-oriented manufacturing. In addition, the negative effects of the 2014 tax reforms will fade out and the government will implement a more expansive fiscal policy for large infrastructure projects.
Inaccurate Zillow ‘Zestimates’ A Source Of Conflict Over Home Prices

When “CBS This Morning” co-host Norah O’Donnell asked the chief executive of Zillow recently about the accuracy of the website’s automated property value estimates — known as Zestimates — she touched on one of the most sensitive perception gaps in American real estate.
Zillow is the most popular online real estate information site, with 73 million unique visitors in December. Along with active listings of properties for sale, it also provides information on houses that are not on the market. You can enter the address or general location in a database of millions of homes and probably pull up key information — square footage, lot size, number of bedrooms and baths, photos, taxes — plus a Zestimate.
Shoppers, sellers and buyers routinely quote Zestimates to realty agents — and to one another — as gauges of market value. If a house for sale has a Zestimate of $350,000, a buyer might challenge the sellers’ list price of $425,000. Or a seller might demand to know from potential listing brokers why they say a property should sell for just $595,000 when Zillow has it at $685,000.
Disparities like these are daily occurrences and, in the words of one realty agent who posted on the industry blog ActiveRain, they are “the bane of my existence.” Consumers often take Zestimates “as gospel,” said Tim Freund, an agent with Dilbeck Real Estate in Westlake Village. If either the buyer or the seller won’t budge off Zillow’s estimated value, he told me, “that will kill a deal.”
Back to the question posed by O’Donnell: Are Zestimates accurate? And if they’re off the mark, how far off? Zillow CEO Spencer Rascoff answered that they’re “a good starting point” but that nationwide Zestimates have a “median error rate” of about 8%.
Whoa. That sounds high. On a $500,000 house, that would be a $40,000 disparity — a lot of money on the table — and could create problems. But here’s something Rascoff was not asked about: Localized median error rates on Zestimates sometimes far exceed the national median, which raises the odds that sellers and buyers will have conflicts over pricing. Though it’s not prominently featured on the website, at the bottom of Zillow’s home page in small type is the word “Zestimates.” This section provides helpful background information along with valuation error rates by state and county — some of which are stunners.
For example, in New York County — Manhattan — the median valuation error rate is 19.9%. In Brooklyn, it’s 12.9%. In Somerset County, Md., the rate is an astounding 42%. In some rural counties in California, error rates range as high as 26%. In San Francisco it’s 11.6%. With a median home value of $1,000,800 in San Francisco, according to Zillow estimates as of December, a median error rate at this level translates into a price disparity of $116,093.
Some real estate agents have done their own studies of accuracy levels of Zillow in their local markets.
Last July, Robert Earl, an agent with Choice Homes Team in the Charlottesville, Va., area, examined selling prices and Zestimates of all 21 homes sold that month in the nearby community of Lake Monticello. On 17 sales Zillow overestimated values, including two houses that sold for 61% below the Zestimate.
In Carlsbad, Calif., Jeff Dowler, an agent with Solutions Real Estate, did a similar analysis on sales in two ZIP Codes. He found that Zestimates came in below the selling price 70% of the time, with disparities ranging as high as $70,000. In 25% of the sales, Zestimates were higher than the contract price. In 95% of the cases, he said, “Zestimates were wrong. That does not inspire a lot of confidence, at least not for me.” In a second ZIP Code, Dowler found that 100% of Zestimates were inaccurate and that disparities were as large as $190,000.
So what do you do now that you’ve got the scoop on Zestimate accuracy? Most important, take Rascoff’s advice: Look at them as no more than starting points in pricing discussions with the real authorities on local real estate values — experienced agents and appraisers. Zestimates are hardly gospel — often far from it.
kenharney@earthlink.net Distributed by Washington Post Writers Group.
Millennials Are Finally Entering The Home Buying Market
First-time buyers Kellen and Ben Goldsmith are shown in their new town home, which they purchased for $620,000 in Seattle’s Eastlake neighborhood. (Ken Lambert / Tribune News Service. Authored by Kenneth R. Harney
Call them the prodigal millennials: Statistical measures and anecdotal reports suggest that young couples and singles in their late 20s and early 30s have begun making a belated entry into the home-buying market, pushed by mortgage rates in the mid-3% range, government efforts to ease credit requirements and deep frustrations at having to pay rising rents without creating equity.
Listen to Kathleen Hart, who just bought a condo unit with her husband, Devin Wall, that looks out on the Columbia River in Wenatchee, Wash.: “We were just tired of renting, tired of sharing with roommates and not having a place of our own. Finally the numbers added up.”
Erin Beasley and her fiance closed on a condo in the Capitol Hill area of Washington, D.C., in January. “With the way rents kept on going,” she said, “we realized it was time” after five years as tenants. “With renting, at some point you get really tired of it — you want to own, be able to make changes” that suit you, not some landlord.
Hart and Beasley are part of the leading edge of the massive millennial demographic bulge that has been missing in action on home buying since the end of the Great Recession. Instead of representing the 38% to 40% of purchases that real estate industry economists say would have been expected for first-timers, they’ve lagged behind in market share, sometimes by as much as 10 percentage points. But new signs are emerging that hint that maybe the conditions finally are right for them to shop and buy:
• Redfin, a national real estate brokerage, said that first-time buyers accounted for 57% of home tours conducted by its agents mid-month — the highest rate in recent years. Home-purchase education class requests, typically dominated by first-timers, jumped 27% in January over a year earlier. “I think it is significant,” Redfin chief economist Nela Richardson said. “They are sticking a toe in the water.”
• The Campbell/Inside Mortgage Finance HousingPulse Tracking Survey, which monthly polls 2,000 realty agents nationwide, reported that first-time buyer activity has started to increase much earlier than is typical seasonally. First-timers accounted for 36.3% of home purchases in December, according to the survey.
• Anecdotal reports from realty brokers around the country also point to exceptional activity in the last few weeks. Gary Kassan, an agent with Pinnacle Estate Properties in the Los Angeles area, says nearly half of his current clients are first-time buyers. Martha Floyd, an agent with McEnearney Associates Inc. Realtors in McLean, Va., said she is working with “an unusually high” number of young, first-time buyers. “I think there are green shoots here,” she said, especially in contrast with a year ago.
Assuming these early impressions could point to a trend, what’s driving the action? The decline in interest rates, high rents and sheer pent-up demand play major roles.
But there are other factors that could be at work. In the last few weeks, key sources of financing for entry-level buyers — the Federal Housing Administration and giant investors Fannie Mae and Freddie Mac — have announced consumer-friendly improvements to their rules. The FHA cut its punitively high upfront mortgage insurance premiums and Fannie and Freddie reduced minimum down payments to 3% from 5%.
Price increases on homes also have moderated in many areas, improving affordability. Plus many younger buyers have discovered the wide spectrum of special financing assistance programs open to them through state and local housing agencies.
Hart and her husband made use of one of the Washington State Housing Finance Commission’s buyer assistance programs, which provides second-mortgage loans with zero interest rates to help with down payments and closing costs. Dozens of state agencies across the country offer help for first-timers, often with generous qualifying income limits.
Bottom line: Nobody knows yet whether or how long the uptick in first-time buyer activity will last, but there’s no question that market conditions are encouraging. It just might be the right time.
kenharney@earthlink.net Distributed by Washington Post Writers Group. Copyright © 2015, LA Times
Millions of Boomerang Buyers Poised to Re-Enter Housing Market
 by WPJ
According to RealtyTrac, the first wave of 7.3 million homeowners who lost their home to foreclosure or short sale during the foreclosure crisis are now past the seven-year window they conservatively need to repair their credit and qualify to buy a home as we begin 2015.
In addition, more waves of these potential boomerang buyers will be moving past that seven-year window over the next eight years corresponding to the eight years of above-normal foreclosure activity from 2007 to 2014.

“The housing crisis certainly hit home the fact that home ownership is not for everyone, but those burned during the crisis should not immediately throw the baby out with the bathwater when it comes to their second chance at home ownership,” said Chris Pollinger, senior vice president of sales at First Team Real Estate, covering the Southern California market which has more than 260,000 potential boomerang buyers. “Home ownership done responsibly is still one of the best disciplined wealth-building strategies, and there is much more data available for home buyers than there was five years ago to help them make an informed decision about a home purchase.”
- Nearly 7.3 million potential boomerang buyers nationwide will be in a position to buy again from a credit repair perspective over the next eight years.
- Markets with the most potential boomerang buyers over the next eight years among metropolitan statistical areas with a population of at least 250,000.
- Markets with the highest rate of potential boomerang buyers as a percentage of total housing units over the next eight years among metro areas with at least 250,000 people.
- Markets most likely to see the boomerang buyers materialize are those where there are a high percentage of housing units lost to foreclosure but where current home prices are still affordable for median income earners and where the population of Gen Xers and Baby Boomers — the two generations most likely to be boomerang buyers — have held steady or increased during the Great Recession.
- There were 22 metros among those with at least 250,000 people where this trifecta of market conditions is in place, making these metros the most likely nationwide to see a large number of boomerang buyers materialize in 2015 and beyond.


Latest S&P/Case-Shiller Data Points to Potential Woes
by Phil Hall

The latest data from the S&P/Case-Shiller Home Price Indices found housing prices slowing down during November 2014, leading to concern of a possibly weak housing market for this year.
The 10-City Composite gained 4.2 percent year-over-year in November, but that was down from 4.4 percent in October. The 20-City Composite gained 4.3 percent year-over-year, which was down from 4.5 percent in October. The S&P/Case-Shiller U.S. National Home Price Index, which covers all nine U.S. census divisions, recorded a 4.7 percent annual gain in November 2014, slightly above the 4.6 percent level recorded one month earlier.
However, there was good news from November’s numbers: Miami and San Francisco posted annual gains of 8.6 percent and 8.9 percent, respectively, while Tampa, Atlanta, Charlotte, and Portland also saw year-over-year housing price increases.
David Blitzer, managing director and chairman of the Index Committee at S&P Dow Jones Indices, acknowledged that the housing market could be stronger.
“With the spring home buying season, and spring training, still a month or two away, the housing recovery is barely on first base,” Blitzer said. “Prospects for a home run in 2015 aren’t good. Strong price gains are limited to California, Florida, the Pacific Northwest, Denver, and Dallas. Most of the rest of the country is lagging the national index gains. Moreover, these price patterns have been in place since last spring. Existing home sales were lower in 2014 than 2013, confirming these trends.
“Difficulties facing the housing recovery include continued low inventory levels and stiff mortgage qualification standards,” Blitzer added. “Distressed sales and investor purchases for buy-to-rent declined somewhat in the fourth quarter. The best hope for housing is the rest of the economy where the news is better.”

“Houston, You Have A Problem” – Texas Is Headed For A Recession Due To Oil Crash, JPM Warns

by Tyler Durden
It was back in August 2013, when there was nothing but clear skies ahead of the US shale industry that we asked “How Much Is Oil Supporting U.S. Employment Gains?” The answer we gave:
The American Petroleum Institute said last week the U.S. oil and natural gas sector was an engine driving job growth. Eight percent of the U.S. economy is supported by the energy sector, the industry’s lobbying group said, up from the 7.7 percent recorded the last time the API examined the issue. The employment assessment came as the Energy Department said oil and gas production continued to make gains across the board. With the right energy policies in place, API said the economy could grow even more. But with oil and gas production already at record levels, the narrative over the jobs prospects may be failing on its own accord…. The API’s report said each of the direct jobs in the oil and natural gas industry translated to 2.8 jobs in other sectors of the U.S. economy. That in turn translates to a total impact on U.S. gross domestic product of $1.2 trillion, the study found.
Two weeks ago we followed up with an article looking at “Jobs: Shale States vs Non-Shale States” in which we showed the following chart:

And added the following:
According to a new study, investments in oil and gas exploration and production generate substantial economic gains, as well as other benefits such as increased energy independence. The Perryman Group estimates that the industry as a whole generates an economic stimulus of almost $1.2 trillion in gross product each year, as well as more than 9.3 million permanent jobs across the nation.
The ripple effects are everywhere. If you think about the role of oil in your life, it is not only the primary source of many of our fuels, but is also critical to our lubricants, chemicals, synthetic fibers, pharmaceuticals, plastics, and many other items we come into contact with every day. The industry supports almost 1.3 million jobs in manufacturing alone and is responsible for almost $1.2 trillion in annual gross domestic product. If you think about the law, accounting, and engineering firms that serve the industry, the pipe, drilling equipment, and other manufactured goods that it requires, and the large payrolls and their effects on consumer spending, you will begin to get a picture of the enormity of the industry.

Another way of visualizing the impact of the shale industry on the US economy comes courtesy of this chart from the Manhattan Institute which really needs no commentary:

The Institute had this commentary to add:
The jobs recovery since the 2008 recession has been the slowest of any post recession recovery in the U.S. since World War II. The number of people employed has yet to return to the 2007 level. The country has suffered a deeper and longer-lasting period of job loss than has followed any of the ten other recessions since 1945.
There has, however, been one employment bright spot: jobs in America’s oil & gas sector and related industries. Since 2003, more than 400,000 jobs have been created in the direct production of oil & gas and some 2 million more in indirect employment in industries such as transportation, construction, and information services associated with finding, transporting, and storing fuels from the new shale bounty.
In addition, America is seeing revitalized growth and jobs in previously stagnant sectors of the economy, from chemicals production and manufacturing to steel and even textiles because of access to lower cost and reliable energy.
The surge in American oil & gas production has become reasonably well-known; far less appreciated are two key features, which are the focus of this paper: the widespread geographic dispersion of the jobs created; and the fact that the majority of the jobs have been created not in the ranks of the Big Oil companies but in small businesses, even more widely dispersed.
Fast forward to today when we are about to learn that Newton’s third law of Keynesian economics states that every boom, has an equal and opposite bust.
Which brings us to Texas, the one state that more than any other, has benefited over the past 5 years from the Shale miracle. And now with crude sinking by the day, it is time to unwind all those gains, and give back all those jobs. Did we mention: highly compensated, very well-paying jobs, not the restaurant, clerical, waiter, retail, part-time minimum-wage jobs the “recovery” has been flooded with.
Here is JPM’s Michael Feroli explaining why Houston suddenly has a very big problem.
- In less than five years Texas’ share of US oil production has gone from around 25% to over 40%
- By some measures, the oil intensity of the Texas economy looks similar to what it was in the mid-1980s
- The 1986 collapse in oil prices led to a painful regional recession in Texas
- While the rest of the country looks to benefit from cheap oil, Texas could be headed for recession
The collapse in oil prices will create winners and losers, both globally and here in the US. While we expect the country, overall, will be a net beneficiary from falling oil prices, two states look like they will bear the brunt of the pain: North Dakota and Texas. Given its much larger size, the prospect of a recession in Texas could have some broader reverberations.
By now, most people are familiar with the growth of the fossil fuel industry in places like Pennsylvania and Ohio. However, that has primarily been a natural gas story. The renaissance of US crude oil production has been much more concentrated: over 90% of the growth in the past five years has been in North Dakota and Texas; with Texas alone accounting for 67% of the increase in the nation’s crude output over that period.
In the first half of 1986, crude oil prices fell just over 50%. At the end of 1985, the unemployment rate in Texas was equal to that in the nation as a whole; at the end of 1986 it was 2.6%- points higher than the national rate. There are some reasons to think that it may not be as bad this time around, but there are even better reasons not to be complacent about the risk of a regional recession in Texas.
Geography of a boom
The well-known energy renaissance in the US has occurred in both the oil and natural gas sectors. Some states that are huge natural gas producers have limited oil production: Pennsylvania is the second largest gas producing state but 19th largest oil producer. The converse is also true: North Dakota is the second largest crude producer but 14th largest gas producer. However, most of the economic data as it relates to the energy sector, employment, GDP, etc, often lump together the oil and gas extraction industries. Yet oil prices have collapsed while natural gas prices have held fairly steady. To understand who is vulnerable to the decline in oil prices specifically we turn to the EIA’s state-level crude oil production data.
The first point, mentioned at the outset, is that Texas, already a giant, has become a behemoth crude producer in the past few years, and now accounts for over 40% of US production. However, there are a few states for which oil is a relatively larger sector (as measured by crude production relative to Gross State Product): North Dakota, Alaska, Wyoming, and New Mexico. For two other states, Oklahoma and Montana, crude production is important, though somewhat less so than for Texas. Note, however, that these are all pretty small states: the four states where oil is more important to the local economy than Texas have a combined GSP that is only 16% of the Texas GSP. Finally, there is one large oil producer, California, which is dwarfed by such a huge economy that its oil intensity is actually below the national average, and we would expect it, like the country as a whole, to benefit from lower oil prices.
Texas-sized challenges
As discussed above, Texas is unique in the country as a huge economy and a huge oil producer. When thinking about the challenges facing the Texas economy in 2015 it may be useful, as a starting point, to begin with the oil price collapse of 1986. Then, like now, crude oil prices collapsed around 50% in the space of a few short months. As noted in the introduction, the labor market response was severe and swift, with the Texas unemployment rate rising 2.0%-points in the first three months of 1986 alone. Following the hit to the labor market, the real estate market suffered a longer, slower, burn, and by the end of 1988 Texas house prices were down over 14% from their peak in early 1986 (over the same period national house prices were up just over 14%). The last act of this tragedy was a banking crisis, as several hundred Texas banks failed, with peak failures occurring in 1988 and 1989.
How appropriate is it to compare the challenges Texas faces today to the ones they faced in 1986? The natural place to begin is by getting a sense of the relative energy industry intensity of Texas today versus 1986. Unfortunately, the GSP-by-industry data have a definitional break in 1997, but splicing the data would suggest a similar share of the oil and gas sector in Texas GSP now and in 1985: around 11%. Employment in the mining and logging sector (which, in Texas, is overwhelmingly dominated by the oil and gas sector) was around 3.7% in 1985 and is 2.7% now. This is consistent with a point we have been making in the national context: the oil and gas sector is very capital-intensive, and increasingly so. Even so, as the 1986 episode demonstrated, there do seem to be sizable multiplier effects on non-energy employment. Finally, there does not exist capital spending by state data, but at the national level we can see the flip side of the increasing capital intensive nature of energy: oil and gas related cap-ex was 0.58% of GDP in 4Q85, and is 0.98% of GDP now.
Given this, what is the case for arguing that this time is different, and the impact will be smaller than in 1986? One is that now, unlike in 1986, natural gas prices haven’t moved down in sympathy with crude oil prices, and the Texas recession in 1986 may have owed in part also to the decline in gas prices. Another is that, as noted above, the employment share is somewhat lower, and thus the income hit will be felt more by capital-holders – i.e. investors around the country and the world. Finally, unlike 1986, the energy industry is experiencing rapid technological gains, pushing down the energy extraction cost curve.
While these are all valid, they are not so strong as to signal smooth sailing for the Texas economy. Financially, oil is a fair bit more important than gas for Texas, both now and in 1986, with a dollar value two to three times as large. Moreover, while energy employment may be somewhat smaller now, we are not talking about night and day. The current share is about 3/4ths what it was in 1986. (Given the higher capital intensity, there are some reasons to think employment may be greater now in sectors outside the traditional oil and gas sectors, such as pipeline and heavy engineering construction).
As we weigh the evidence, we think Texas will, at the least, have a rough 2015 ahead, and is at risk of slipping into a regional recession. Such an outcome could bring with it the usual collateral damage that occurs in a slowdown. Housing markets have been hot in Texas. Although affordability in Texas looks good compared to the national average, it always does; compared to its own history, housing in some major Texas metro areas looks quite dear, suggesting a risk of a pull-back in the real estate market.
The national economy performed quite well in 1986, in spite of the Texas recession. We expect the US economy will perform well next year too , though some regions – most notably Texas – could significantly under perform the national average.

* * *
So perhaps it is finally time to add that footnote to the “unambiguously good” qualified when pundits describe the oil crash: it may be good for everyone… except Texas which is about to enter a recession. And then Pennsylvania. And then North Dakota. And then Colorado. And then West Virginia. And then Alaska. And then Wyoming. And then Oklahoma. And then Montana, and so on, until finally we find just where the new equilibrium is following the exodus of hundreds of thousands of the best-paying jobs created during the “recovery” offset by minimum-wage waiters, bartenders, retail workers and temps.
BofA Analyst Credits Falling Oil Prices for Lower Mortgage Rates
 by Phil Hall
The precipitous drop in global oil prices has created a domino effect that led to a new decline in lower mortgage rates, according to a report by Chris Flanagan, a mortgage rate specialist at Bank of America Merrill Lynch.
“The oil collapse of 2014 appears to have been a key driver [in declining mortgage rates],” stated Flanagan in his report, which was obtained by CBS Moneywatch. “Further oil price declines could lead the way to sub-3.5 percent mortgage rates.”
Flanagan applauded this development, noting that the reversal of mortgage rates might propel housing to a stronger recovery.
“We have maintained the view that 4 percent mortgage rates are too high to allow for sustainable recovery in housing,” he wrote. Flanagan also theorized that if rates fell into 3.25 percent to 3.5 percent range, it would boost “supply from both refinancing and purchase mortgage channels.”
Flanagan’s report echoes the sentiments expressed by Frank Nothaft, Freddie Mac’s chief economist, who earlier this week identified the link between oil prices and housing.
“The recent drop in oil prices has been an unexpected boon for consumers’ pocketbooks and most businesses,” Nothaft stated. “Economic growth has picked up over the final nine months of 2014 and lower energy costs are expected to support growth of about 3 percent for the U.S. in 2015. Therefore we expect the housing market to continue to strengthen with home sales rising to their best sales pace in eight years, national house price indexes up, and rental markets continuing to display low vacancy rates and the highest level of new apartment completions in 25 years.”
But not everyone is expected to benefit from this development. A report issued last week by the Houston Association of Realtors forecast a 10 percent to 12 percent drop in home sales over the next year, owing to a potential slowdown in job growth for the Houston market’s energy industry if oil prices continue to plummet.
Housing Price Gains Slow For 9th Straight Month, Says S&P/Case-Shiller
 by Erin Carlyle
Growth in home sales prices continued to slow across the nation in September, marking nine straight months of deceleration, data from S&P/Case-Shiller showed Tuesday.
U.S. single-family home prices gained just 4.8% (on a seasonally-adjusted basis) over prices one year earlier, down from a 5.1% annual increase in August, the S&P/Case-Shiller National Home Price Index shows. The measure covers all nine Census divisions. Significantly, September also marked the first month that the National Index decreased (by 0.1%) on a month-over-month basis since November 2013.
“The overall trend in home price increases continues to slow down,” says David M. Blitzer, chairman of the Index Committee at S&P Dow Jones Indices. “The only region showing any sustained strength is the Southeast led by Florida; price gains are also evident in Atlanta and Charlotte.”
Price gains have been steadily slowing since December after a streak of double-digit annual price increases in late 2013 and early 2014. Eighteen of the 20 cities Case-Shiller tracks reported slower annual price gains in September than in August, with Charlotte and Dallas the only cities where annual price gains increased. Miami (10.3%) was the only city to report double-digit annual price gains.

The chart above depicts the annual returns of the U.S. National, the 10-City Composite and the 20-City Composite Home Price Indices. The S&P/Case-Shiller U.S. National Home Price Index, which covers all nine U.S. census divisions, recorded a 4.8% annual gain in September 2014. The 10- and 20-City Composites posted year-over-year increases of 4.8% and 4.9%, compared to 5.5% and 5.6% in August.
National Index, year-over-year change in prices (seasonally adjusted):
June 2013: 9.2%
July 2013: 9.7%
August 2013: 10.2%
September 2013: 10.7%
October 2013: 10.9%
November 2013: 10.8%
December 2013: 10.8%
January 2014: 10.5%
February 2014: 10.2%
March 2014: 9.0%
April 2014: 8.0%
May 2014: 7.1%
June 2014: 6.3%
July 2014: 5.6%
August 2014: 5.1%
September 2014: 4.8%
“Other housing statistics paint a mixed to slightly positive picture,” Blitzer said. “Housing starts held above one million at annual rates on gains in single family homes, sales of existing homes are gaining, builders’ sentiment is improving, foreclosures continue to be worked off and mortgage default rates are at precrisis levels. With the economy looking better than a year ago, the housing outlook for 2015 is stable to slightly better.”
Blitzer is referring to a report last week that showed housing starts (groundbreakings on new homes) down 2.8% in October, but still at a stronger pace than one year earlier. What’s more, single-family starts showed a 4.2% increase over the prior month. Also, in October existing (or previously-owned) home sales hit their fastest pace in more than one year. (Both reports are one month ahead of the S&P/Case-Shiller report, the industry standard but unfortunately with a two-month lag time.) Taken together, the data suggest that the rapid price gains seen late last year and in the first part of this year are mostly behind us.

“The days of double-digit home value appreciation continue to rapidly fade away as more inventory comes on line, and the market is becoming more balanced between buyers and sellers,” said Stan Humphries, Zillow’s chief economist. “Like a perfectly prepared Thanksgiving turkey, it’s important for things to cool off a bit in the housing market, because too-fast appreciation risks burning both buyers and sellers. In this more sedate environment, buyers can take more time to find the right deal for them, and sellers can rest assured they won’t be left without a seat at the table when they turn around and become buyers. This slowdown is a critical step on the road back to a normal housing market, and as we approach the end of 2014, the housing market has plenty to be thankful for.”
As of September 2014, average home prices across the U.S. are back to their spring 2005 levels for the National Index (which covers 70% of the U.S. housing market), while both the 10-City and 20-City Composites are back to their autumn 2004 levels. For the city Composite indices, prices are still off their mid-summer 2006 peaks by about 15% to 17%. Prices have bounced back from their March 2012 lows by 28.8% and 29.6% for the 10-City and 20-City composites.
S&P/Case-Shiller is now releasing its National Home Price Index each month. Previously, it was published quarterly, while the 10-City and 20-City Composites were published monthly. The “July” numbers above for the National Index above reflect a roll-up of data for the three-month average of May, June and July prices.
The Next Housing Crisis May Be Sooner Than You Think
How we could fall into another housing crisis before we’ve fully pulled out of the 2008 one.

When it comes to housing, sometimes it seems we never learn. Just when America appeared to be recovering from the last housing crisis—the trigger, in many ways, for 2008’s grand financial meltdown and the beginning of a three-year recession—another one may be looming on the horizon.
There are at several big red flags.
For one, the housing market never truly recovered from the recession. Trulia Chief Economist Jed Kolko points out that, while the third quarter of 2014 saw improvement in a number of housing key barometers, none have returned to normal, pre-recession levels. Existing home sales are now 80 percent of the way back to normal, while home prices are stuck at 75 percent back, remaining undervalued by 3.4 percent. More troubling, new construction is less than halfway (49 percent) back to normal. Kolko also notes that the fundamental building blocks of the economy, including employment levels, income and household formation, have also been slow to improve. “In this recovery, jobs and housing can’t get what they need from each other,” he writes.
Americans are spending more than 33 percent of their income on housing.
Second, Americans continue to overspend on housing. Even as the economy drags itself out of its recession, a spate of reports show that families are having a harder and harder time paying for housing. Part of the problem is that Americans continue to want more space in bigger homes, and not just in the suburbs but in urban areas, as well. Americans more than 33 percent of their income on housing in 2013, up nearly 13 percent from two decades ago, according to newly released data from the Bureau of Labor Statistics (BLS). The graph below plots the trend by age.
Over-spending on housing is far worse in some places than others; the housing market and its recovery remain highly uneven. Another BLS report released last month showed that households in Washington, D.C., spent nearly twice as much on housing ($17,603) as those in Cleveland, Ohio ($9,061). The chart below, from the BLS report, shows average annual expenses on housing related items:

The result, of course, is that more and more American households, especially middle- and working-class people, are having a harder time affording housing. This is particularly the case in reviving urban centers, as more affluent, highly educated and creative-class workers snap up the best spaces, particularly those along convenient transit, pushing the service and working class further out.
Last but certainly not least, the rate of home ownership continues to fall, and dramatically. Home ownership has reached its lowest level in two decades—64.4 percent (as of the third quarter of 2014). Here’s the data, from the U.S. Census Bureau:

Home ownership currently hovers from the mid-50 to low-60 percent range in some of the most highly productive and innovative metros in this country—places like San Francisco, New York, and Los Angeles. This range seems “to provide the flexibility of rental and ownership options required for a fast-paced, rapidly changing knowledge economy. Widespread home ownership is no longer the key to a thriving economy,” I’ve written.
What we are going through is much more than a generational shift or simple lifestyle change. It’s a deep economic shift—I’ve called it the Great Reset. It entails a shift away from the economic system, population patterns and geographic layout of the old suburban growth model, which was deeply connected to old industrial economy, toward a new kind of denser, more urban growth more in line with today’s knowledge economy. We remain in the early stages of this reset. If history is any guide, the complete shift will take a generation or so.
It’s time to impose stricter underwriting standards and encourage the dense, mixed-use, more flexible housing options that the knowledge economy requires.
The upshot, as the Nobel Prize winner Edmund Phelps has written, is that it is time for Americans to get over their house passion. The new knowledge economy requires we spend less on housing and cars, and more on education, human capital and innovation—exactly those inputs that fuel the new economic and social system.
But we’re not moving in that direction; in fact, we appear to be going the other way. This past weekend, Peter J. Wallison pointed out in a New York Times op-ed that federal regulators moved back off tougher mortgage-underwriting standards brought on by 2010’s Dodd-Frank Act and instead relaxed them. Regulators are hoping to encourage more home ownership, but they’re essentially recreating the conditions that led to 2008’s crash.
Wallison notes that this amounts to “underwriting the next housing crisis.” He’s right: It’s time to impose stricter underwriting standards and encourage the dense, mixed-use, more flexible housing options that the knowledge economy requires.
During the depression and after World War II, this country’s leaders pioneered a series of purposeful and ultimately game-changing polices that set in motion the old suburban growth model, helping propel the industrial economy and creating a middle class of workers and owners. Now that our economy has changed again, we need to do the same for the denser urban growth model, creating more flexible housing system that can help bolster today’s economy.

Dream housing for new economy workers?
Energy Workforce Projected To Grow 39% Through 2022
 b
b
The dramatic resurgence of the oil industry over the past few years has been a notable factor in the national economic recovery. Production levels have reached totals not seen since the late 1980s and continue to increase, and rig counts are in the 1,900 range. While prices have dipped recently, it will take more than that to markedly slow the level of activity. Cycles are inevitable, but activity is forecast to remain at relatively high levels.
An outgrowth of oil and gas activity strength is a need for additional workers. At the same time, the industry workforce is aging, and shortages are likely to emerge in key fields ranging from petroleum engineers to experienced drilling crews. I was recently asked to comment on the topic at a gathering of energy workforce professionals. Because the industry is so important to many parts of Texas, it’s an issue with relevance to future prosperity.
Although direct employment in the energy industry is a small percentage of total jobs in the state, the work is often well paying. Moreover, the ripple effects through the economy of this high value-added industry are large, especially in areas which have a substantial concentration of support services.

Employment in oil and gas extraction has expanded rapidly, up from 119,800 in January 2004 to 213,500 in September 2014. Strong demand for key occupations is evidenced by the high salaries; for example, median pay was $130,280 for petroleum engineers in 2012 according to the Bureau of Labor Statistics (BLS).
Due to expansion in the industry alone, the BLS estimates employment growth of 39 percent through 2022 for petroleum engineers, which comprised 11 percent of total employment in oil and gas extraction in 2012. Other key categories (such as geoscientists, wellhead pumpers, and roustabouts) are also expected to see employment gains exceeding 15 percent. In high-activity regions, shortages are emerging in secondary fields such as welders, electricians, and truck drivers.
The fact that the industry workforce is aging is widely recognized. The cyclical nature of the energy industry contributes to uneven entry into fields such as petroleum engineering and others which support oil and gas activity. For example, the current surge has pushed up wages, and enrollment in related fields has increased sharply. Past downturns, however, led to relatively low enrollments, and therefore relatively lower numbers of workers in some age cohorts. The loss of the large baby boom generation of experienced workers to retirement will affect all industries. This problem is compounded in the energy sector because of the long stagnation of the industry in the 1980s and 1990s resulting in a generation of workers with little incentive to enter the industry. As a result, the projected need for workers due to replacement is particularly high for key fields.
The BLS estimates that 9,800 petroleum engineers (25.5 percent of the total) working in 2012 will need to be replaced by 2022 because they retire or permanently leave the field. Replacement rates are also projected to be high for other crucial occupations including petroleum pump system operators, refinery operators, and gaugers (37.1 percent); derrick, rotary drill, and service unit operators, oil, gas, and mining (40.4 percent).

Putting together the needs from industry expansion and replacement, most critical occupations will require new workers equal to 40 percent or more of the current employment levels. The total need for petroleum engineers is estimated to equal approximately 64.5 percent of the current workforce. Clearly, it will be a major challenge to deal with this rapid turnover.
Potential solutions which have been attempted or discussed present problems, and it will require cooperative efforts between the industry and higher education and training institutions to adequately deal with future workforce shortages. Universities have had problems filling open teaching positions, because private-sector jobs are more lucrative for qualified candidates. Given budget constraints and other considerations, it is not feasible for universities to compete on the basis of salary. Without additional teaching and research staff, it will be difficult to continue to expand enrollment while maintaining education quality. At the same time, high-paying jobs are enticing students into the workforce, and fewer are entering doctoral programs.
Another option which has been suggested is for engineers who are experienced in the workplace to spend some of their time teaching. However, busy companies are naturally resistant to allowing employees to take time away from their regular duties. Innovative training and associate degree and certification programs blending classroom and hands-on experience show promise for helping deal with current and potential shortages in support occupations. Such programs can prepare students for well-paying technical jobs in the industry. Encouraging experienced professionals to work past retirement, using flexible hours and locations to appeal to Millennials, and other innovative approaches must be part of the mix, as well as encouraging the entry of females into the field (only 20 percent of the current workforce is female, but over 40 percent of the new entries).
Industry observers have long been aware of the coming “changing of the guard” in the oil and gas business. We are now approaching the crucial time period for ensuring the availability of the workers needed to fill future jobs. Cooperative efforts between the industry and higher education/training institutions will likely be required, and it’s time to act.

Single Family Construction Expected to Boom in 2015
 Kenny DeLaGarza, a building inspector for the city of Midland, at a 600-home Betenbough development.
Single-family home construction is expected to increase 26 percent in 2015, the National Association of Home Builders reported Oct. 31. NAHB expects single-family production to total 802,000 units next year and reach 1.1 million by 2016.
Economists participating in the NAHB’s 2014 Fall Construction Forecast Webinar said that a growing economy, increased household formation, low interest rates and pent-up demand should help drive the market next year. They also said they expect continued growth in multifamily starts given the nation’s rental demand.
The NAHB called the 2000-03 period a benchmark for normal housing activity; during those years, single-family production averaged 1.3 million units a year. The organization said it expects single-family starts to be at 90 percent of normal by the fourth quarter 2016.
NAHB Chief Economist David Crowe said multifamily starts currently are at normal production levels and are projected to increase 15 percent to 365,000 by the end of the year and hold steady into next year.
The NAHB Remodeling Market Index also showed increased activity, although it’s expected to be down 3.4 percent compared to last year because of sluggish activity in the first quarter 2014. Remodeling activity will continue to increase gradually in 2015 and 2016.
Moody’s Analytics Chief Economist Mark Zandi told the NAHB that he expects an undersupply of housing given increasing job growth. Currently, the nation’s supply stands at just over 1 million units annually, well below what’s considered normal; in a normal year, there should be demand for 1.7 million units.
Zandi noted that increasing housing stock by 700,000 units should help meet demand and create 2.1 million jobs. He also noted that things should level off by the end of 2017, when mortgage rates probably will rise to around 6 percent.
“The housing market will be fine because of better employment, higher wages and solid economic growth, which will trump the effect of higher mortgage rates,” Zandi told the NAHB.
Robert Denk, NAHB assistant vice president for forecasting and analysis, said that he expects housing recovery to vary by state and region, noting that states with higher levels of payroll employment or labor market recovery are associated with healthier housing markets
States with the healthiest job growth include Louisiana, Montana, North Dakota, Texas and Wyoming, as well as farm belt states like Iowa.
Meanwhile Alabama, Arizona, Nevada, New Jersey, New Mexico and Rhode Island continue to have weaker markets.
Number of U.S. First-Time Homebuyers Plummets

by National Mortgage Professional Magazine
Despite an improving job market and low interest rates, the share of first-time homebuyers fell to its lowest point in nearly three decades and is preventing a healthier housing market from reaching its full potential, according to an annual survey released by the National Association of Realtors (NAR). The survey additionally found that an overwhelming majority of buyers search for homes online and then purchase their home through a real estate agent.
The 2014 NAR Profile of Home Buyers and Sellers continues a long-running series of large national NAR surveys evaluating the demographics, preferences, motivations, plans and experiences of recent home buyers and sellers; the series dates back to 1981. Results are representative of owner-occupants and do not include investors or vacation homes.
The long-term average in this survey, dating back to 1981, shows that four out of 10 purchases are from first-time home buyers. In this year’s survey, the share of first-time home buyers dropped five percentage points from a year ago to 33 percent, representing the lowest share since 1987 (30 percent).
“Rising rents and repaying student loan debt makes saving for a down payment more difficult, especially for young adults who’ve experienced limited job prospects and flat wage growth since entering the workforce,” said Lawrence Yun, NAR chief economist. “Adding more bumps in the road, is that those finally in a position to buy have had to overcome low inventory levels in their price range, competition from investors, tight credit conditions and high mortgage insurance premiums.”
Yun added, “Stronger job growth should eventually support higher wages, but nearly half (47 percent) of first-time buyers in this year’s survey (43 percent in 2013) said the mortgage application and approval process was much more or somewhat more difficult than expected. Less stringent credit standards and mortgage insurance premiums commensurate with current buyer risk profiles are needed to boost first-time buyer participation, especially with interest rates likely rising in upcoming years.”
The household composition of buyers responding to the survey was mostly unchanged from a year ago. Sixty-five percent of buyers were married couples, 16 percent single women, nine percent single men and eight percent unmarried couples.
 In 2009, 60 percent of buyers were married, 21 percent were single women, 10 percent single men and 8 percent unmarried couples. Thirteen percent of survey respondents were multi-generational households, including adult children, parents and/or grandparents.
The median age of first-time buyers was 31, unchanged from the last two years, and the median income was $68,300 ($67,400 in 2013). The typical first-time buyer purchased a 1,570 square-foot home costing $169,000, while the typical repeat buyer was 53 years old and earned $95,000. Repeat buyers purchased a median 2,030-square foot home costing $240,000.
When asked about the primary reason for purchasing, 53 percent of first-time buyers cited a desire to own a home of their own. For repeat buyers, 12 percent had a job-related move, 11 percent wanted a home in a better area, and another 10 percent said they wanted a larger home. Responses for other reasons were in the single digits.
According to the survey, 79 percent of recent buyers said their home is a good investment, and 40 percent believe it’s better than stocks.
Financing the purchase
Nearly nine out of 10 buyers (88 percent) financed their purchase. Younger buyers were more likely to finance (97 percent) compared to buyers aged 65 years and older (64 percent). The median down payment ranged from six percent for first-time buyers to 13 percent for repeat buyers. Among 23 percent of first-time buyers who said saving for a down payment was difficult, more than half (57 percent) said student loans delayed saving, up from 54 percent a year ago.
 In addition to tapping into their own savings (81 percent), first-time homebuyers used a variety of outside resources for their loan downpayment. Twenty-six percent received a gift from a friend or relative—most likely their parents—and six percent received a loan from a relative or friend. Ten percent of buyers sold stocks or bonds and tapped into a 401(k) fund.
Ninety-three percent of entry-level buyers chose a fixed-rate mortgage, with 35 percent financing their purchase with a low-down payment Federal Housing Administration-backed mortgage (39 percent in 2013), and nine percent using the Veterans Affairs loan program with no downpayment requirements.
“FHA premiums are too high in relation to default rates and have likely dissuaded some prospective first-time buyers from entering the market,” said Yun. “To put it in perspective, 56 percent of first-time buyers used a FHA loan in 2010. The current high mortgage insurance added to their monthly payment is likely causing some young adults to forgo taking out a loan.”
Buyers used a wide variety of resources in searching for a home, with the Internet (92 percent) and real estate agents (87 percent) leading the way. Other noteworthy results included mobile or tablet applications (50 percent), mobile or tablet search engines (48 percent), yard signs (48 percent) and open houses (44 percent).
According to NAR President Steve Brown, co-owner of Irongate, Inc., Realtors® in Dayton, Ohio, although more buyers used the Internet as the first step of their search than any other option (43 percent), the Internet hasn’t replaced the real estate agent’s role in a transaction.
“Ninety percent of home buyers who searched for homes online ended up purchasing their home through an agent,” Brown said. “In fact, buyers who used the Internet were more likely to purchase their home through an agent than those who didn’t (67 percent). Realtors are not only the source of online real estate data, they also use their unparalleled local market knowledge and resources to close the deal for buyers and sellers.”
When buyers were asked where they first learned about the home they purchased, 43 percent said the Internet (unchanged from last year, but up from 36 percent in 2009); 33 percent from a real estate agent; 9 percent a yard sign or open house; six percent from a friend, neighbor or relative; five percent from home builders; three percent directly from the seller; and one percent a print or newspaper ad.
Likely highlighting the low inventory levels seen earlier in 2014, buyers visited 10 homes and typically found the one they eventually purchased two weeks quicker than last year (10 weeks compared to 12 in 2013). Overall, 89 percent were satisfied with the buying process.
First-time home buyers plan to stay in their home for 10 years and repeat buyers plan to hold their property for 15 years; sellers in this year’s survey had been in their previous home for a median of 10 years.
 The biggest factors influencing neighborhood choice were quality of the neighborhood (69 percent), convenience to jobs (52 percent), overall affordability of homes (47 percent), and convenience to family and friends (43 percent). Other factors with relatively high responses included convenience to shopping (31 percent), quality of the school district (30 percent), neighborhood design (28 percent) and convenience to entertainment or leisure activities (25 percent).
This year’s survey also highlighted the significant role transportation costs and “green” features have in the purchase decision process. Seventy percent of buyers said transportation costs were important, while 86 percent said heating and cooling costs were important. Over two-thirds said energy efficient appliances and lighting were important (68 and 66 percent, respectively).
Seventy-nine percent of respondents purchased a detached single-family home, eight percent a townhouse or row house, 8 percent a condo and six percent some other kind of housing. First-time home buyers were slightly more likely (10 percent) to purchase a townhouse or a condo than repeat buyers (seven percent). The typical home had three bedrooms and two bathrooms.
The majority of buyers surveyed purchased in a suburb or subdivision (50 percent). The remaining bought in a small town (20 percent), urban area (16 percent), rural area (11 percent) or resort/recreation area (three percent). Buyers’ median distance from their previous residence was 12 miles.
Characteristics of sellers
The typical seller over the past year was 54 years old (53 in 2013; 46 in 2009), was married (74 percent), had a household income of $96,700, and was in their home for 10 years before selling—a new high for tenure in home. Seventeen percent of sellers wanted to sell earlier but were stalled because their home had been worth less than their mortgage (13 percent in 2013).
“Faster price appreciation this past year finally allowed more previously stuck homeowners with little or no equity the ability to sell after waiting the last few years,” Yun said.
Sellers realized a median equity gain of $30,100 ($25,000 in 2013)—a 17 percent increase (13 percent last year) over the original purchase price. Sellers who owned a home for one year to five years typically reported higher gains than those who owned a home for six to 10 years, underlining the price swings since the recession.
The median time on the market for recently sold homes dropped to four weeks in this year’s report compared to five weeks last year, indicating tight inventory in many local markets. Sellers moved a median distance of 20 miles and approximately 71 percent moved to a larger or comparably sized home.
A combined 60 percent of responding sellers found a real estate agent through a referral by a friend, neighbor or relative, or used their agent from a previous transaction. Eighty-three percent are likely to use the agent again or recommend to others.
For the past three years, 88 percent of sellers have sold with the assistance of an agent and only nine percent of sales have been for-sale-by-owner, or FSBO sales.
For-sale-by-owner transactions accounted for 9 percent of sales, unchanged from a year ago and matching the record lows set in 2010 and 2012; the record high was 20 percent in 1987. The share of homes sold without professional representation has trended lower since reaching a cyclical peak of 18 percent in 1997.
Factoring out private sales between parties who knew each other in advance, the actual number of homes sold on the open market without professional assistance was 5 percent. The most difficult tasks reported by FSBOs are getting the right price, selling within the length of time planned, preparing or fixing up the home for sale, and understanding and completing paperwork.
NAR mailed a 127-question survey in July 2014 using a random sample weighted to be representative of sales on a geographic basis. A total of 6,572 responses were received from primary residence buyers. After accounting for undeliverable questionnaires, the survey had an adjusted response rate of 9.4 percent. The recent home buyers had to have purchased a home between July of 2013 and June of 2014. Because of rounding and omissions for space, percentage distributions for some findings may not add up to 100 percent. All information is characteristic of the 12-month period ending in June 2014 with the exception of income data, which are for 2013.
BLS: Midland Texas Again Posts Third Lowest Jobless Rate In Nation

For the second straight month, Midland posted the third lowest unemployment rate in the nation, according to figures released Wednesday by the Bureau of Labor Statistics.
Bismarck, North Dakota, topped the list for the fourth straight month with a jobless rate of 2.1 percent. Fargo, North Dakota, was second at 2.3. Midland and Logan, Utah, tied for third at 2.6.
A total of 10 metropolitan statistical areas around the nation posted unemployment rates of 3.0 percent or lower. Midland was the lone MSA in Texas at or below 3.0.
Midland again ranked near the top of the list of MSAs in the nation when it came to percentage gain in employment. Midland’s 6.4 percent growth ranked second to Muncie, Indiana (8.9 percent). In September, Midland showed a work force 100,100, an increase of nearly 5,000 from September 2013.
The following are the lowest unemployment rates in the nation during the month of September, according to the Bureau of Labor Statistics.
Bismarck, North Dakota 2.1
Fargo, North Dakota 2.3
Midland 2.6
Logan, Utah 2.6
Sioux Falls, South Dakota 2.7
Grand Forks, North Dakota 2.8
Lincoln, Nebraska 2.8
Mankato, Minnesota 2.9
Rapid City, South Dakota 2.9
Billings, Montana 3.0
Lowest rates from August
Bismarck, North Dakota 2.2, Fargo North Dakota 2.4; Midland 2.8. Also: Odessa 3.4
July
Bismarck, North Dakota, 2.4; Sioux Falls, South Dakota, 2.7; Fargo, North Dakota, 2.8; Midland 2.9. Also: Odessa 3.6
June
Bismarck, North Dakota, 2.6, Midland 2.9, Fargo, North Dakota, 3.0. Also: Odessa 3.6
May
Bismarck, North Dakota, 2.2, Fargo, North Dakota, 2.5, Logan, Utah, 2.5, Midland 2.6. Also: Odessa 3.2
April
Midland 2.3, Logan, Utah 2.5, Bismarck, North Dakota 2.6, Ames, Iowa 2.7. Also: Odessa 2.9
March
Midland 2.7, Houma-Bayou Cane-Thibodaux, La. 3.1, Bismarck, N.D. 3.1, Odessa 3.3, Fargo, N.D. 3.3, Ames, Iowa 3.3, Burlington, Vt. 3.3
February
Houma-Bayou Cane-Thibodaux, La. 2.8; Midland 3.0; Lafayette, La. 3.1
January
Midland 2.9; Logan, Utah 3.3; Bismarck, N.D. 3.4
December
Bismarck, N.D. 2.8; Logan, Utah 2.8; Midland 2.8
OCWEN Fakes foreclosure Notices To Steal Homes – Downgrade Putting RMBS at Risk

If you really would rather own the property than the note, take a few lessons in fraud from Owen Financial Corp. According to allegations from New York’s financial regulator, Benjamin Lawsky, the lender sent “thousands” of foreclosure “warnings” to borrowers months after the window of time had lapsed during which they could have saved their homes[1]. Lawskey alleges that many of the letters were even back-dated to give the impression that they had been sent in a timely fashion. “In many cases, borrowers received a letter denying a mortgage loan modification, and the letter was dated more than 30 days prior to the date that Ocwen mailed the letter.”
The correspondence gave borrowers 30 days from the date of the denial letter to appeal, but the borrowers received the letters after more than 30 days had passed. The issue is not a small one, either. Lawskey says that a mortgage servicing review at Ocwen revealed “more than 7,000” back-dated letters.”
In addition to the letters, Ocwen only sent correspondence concerning default cures after the cure date for delinquent borrowers had passed and ignored employee concerns that “letter-dating processes were inaccurate and misrepresented the severity of the problem.” While Lawskey accused Ocwen of cultivating a “culture that disregards the needs of struggling borrowers,” Ocwen itself blamed “software errors” for the improperly-dated letters[2]. This is just the latest in a series of troubles for the Atlanta-based mortgage servicer; The company was also part the foreclosure fraud settlement with 49 of 50 state attorneys general and recently agreed to reduce many borrowers’ loan balances by $2 billion total.
Most people do not realize that Ocwen, although the fourth-largest mortgage servicer in the country, is not actually a bank. The company specializes specifically in servicing high-risk mortgages, such as subprime mortgages. At the start of 2014, it managed $106 billion in subprime loans. Ocwen has only acknowledged that 283 New York borrowers actually received improperly dated letters, but did announce publicly in response to Lawskey’s letter that it is “investigating two other cases” and cooperating with the New York financial regulator.
WHAT WE THINK: While it’s tempting to think that this is part of an overarching conspiracy to steal homes in a state (and, when possible, a certain enormous city) where real estate is scarce, in reality the truth of the matter could be even more disturbing: Ocwen and its employees just plain didn’t care. There was a huge, problematic error that could have prevented homeowners from keeping their homes, but the loan servicer had already written off the homeowners as losers in the mortgage game. A company that services high-risk loans likely has a jaded view of borrowers, but that does not mean that the entire culture of the company should be based on ignoring borrowers’ rights and the vast majority of borrowers who want to keep their homes and pay their loans. Sure, if you took out a mortgage then you have the obligation to pay even if you don’t like the terms anymore. On the other side of the coin, however, your mortgage servicer has the obligation to treat you like someone who will fulfill their obligations rather than rigging the process so that you are doomed to fail.
Do you think Lawskey is right about Ocwen’s “culture?” What should be done to remedy this situation so that note investors and homeowners come out of it okay?
Thank you for reading the Bryan Ellis Investing Letter!
Your comments and questions are welcomed below.
[2] http://realestate.aol.com/blog/2014/10/22/ocwen-mortgage-alleged-foreclosure-abuse/
http://investing.bryanellis.com/11703/lender-fakes-foreclosure-notices-to-steal-homes/
—
Ocwen posts open letter and apology to borrowers
Pledges independent investigation and rectification
October 27, 2014 10:37AM
Ocwen Financial (OCN) has taken a beating after the New York Department of Financial Services sent a letter to the company on Oct. 21 alleging that the company had been backdating letters to borrowers, and now Ocwen is posting an open letter to homeowners.
Ocwen CEO Ron Faris writes to its clients explaining what happened and what steps the company is taking to investigate the issue, identify any problems, and rectify the situation.
Click here to read the full text of the letter.
“At Ocwen, we take our mission of helping struggling borrowers very seriously, and if you received one of these incorrectly-dated letters, we apologize. I am writing to clarify what happened, to explain the actions we have taken to address it, and to commit to ensuring that no borrower suffers as a result of our mistakes,” he writes.
“Historically letters were dated when the decision was made to create the letter versus when the letter was actually created. In most instances, the gap between these dates was three days or less,” Faris writes. “In certain instances, however, there was a significant gap between the date on the face of the letter and the date it was actually generated.”
Faris says that Ocwen is investigating all correspondence to determine whether any of it has been inadvertently misdated; how this happened in the first place; and why it took so long to fix it. He notes that Ocwen is hiring an independent firm to conduct the investigation, and that it will use its advisory council comprised of 15 nationally recognized community advocates and housing counselors.
“We apologize to all borrowers who received misdated letters. We believe that our backup checks and controls have prevented any borrowers from experiencing a foreclosure as a result of letter-dating errors. We will confirm this with rigorous testing and the verification of the independent firm,” Faris writes. “It is worth noting that under our current process, no borrower goes through a foreclosure without a thorough review of his or her loan file by a second set of eyes. We accept appeals for modification denials whenever we receive them and will not begin foreclosure proceedings or complete a foreclosure that is underway without first addressing the appeal.”
Faris ends by saying that Ocwen is committed to keeping borrowers in their homes.
“Having potentially caused inadvertent harm to struggling borrowers is particularly painful to us because we work so hard to help them keep their homes and improve their financial situations. We recognize our mistake. We are doing everything in our power to make things right for any borrowers who were harmed as a result of misdated letters and to ensure that this does not happen again,” he writes.
Last week the fallout from the “Lawsky event” – so called because of NYDFS Superintendent Benjamin Lawsky – came hard and fast.
Compass Point downgraded Ocwen affiliate Home Loan Servicing Solutions (HLSS) from Buy to Neutral with a price target of $18.
Meanwhile, Moody’s Investors Service downgraded Ocwen Loan Servicing LLC’s servicer quality assessments as a primary servicer of subprime residential mortgage loans to SQ3 from SQ3+ and as a special servicer of residential mortgage loans to SQ3 from SQ3+.
Standard & Poor’s Ratings Services lowered its long-term issuer credit rating to ‘B’ from ‘B+’ on Ocwen on Wednesday and the outlook is negative.
http://www.housingwire.com/articles/31846-ocwen-posts-open-letter-and-apology-to-borrowers
—-
Ocwen Writes Open Letter to Homeowners Concerning Letter Dating Issues
October 24, 2014
Dear Homeowners,
In recent days you may have heard about an investigation by the New York Department of Financial Services’ (DFS) into letters Ocwen sent to borrowers which were inadvertently misdated. At Ocwen, we take our mission of helping struggling borrowers very seriously, and if you received one of these incorrectly-dated letters, we apologize. I am writing to clarify what happened, to explain the actions we have taken to address it, and to commit to ensuring that no borrower suffers as a result of our mistakes.
What Happened
Historically letters were dated when the decision was made to create the letter versus when the letter was actually created. In most instances, the gap between these dates was three days or less. In certain instances, however, there was a significant gap between the date on the face of the letter and the date it was actually generated.
What We Are Doing
We are continuing to investigate all correspondence to determine whether any of it has been inadvertently misdated; how this happened in the first place; and why it took us so long to fix it. At the end of this exhaustive investigation, we want to be absolutely certain that we have fixed every problem with our letters. We are hiring an independent firm to investigate and to help us ensure that all necessary fixes have been made.
Ocwen has an advisory council made up of fifteen nationally recognized community advocates and housing counsellors. The council was created to improve our borrower outreach to keep more people in their homes. We will engage with council members to get additional guidance on making things right for any borrowers who may have been affected in any way by this error.
We apologize to all borrowers who received misdated letters. We believe that our backup checks and controls have prevented any borrowers from experiencing a foreclosure as a result of letter-dating errors. We will confirm this with rigorous testing and the verification of the independent firm. It is worth noting that under our current process, no borrower goes through a foreclosure without a thorough review of his or her loan file by a second set of eyes. We accept appeals for modification denials whenever we receive them and will not begin foreclosure proceedings or complete a foreclosure that is underway without first addressing the appeal.
In addition to these efforts we are committed to cooperating with DFS and all regulatory agencies.
We Are Committed to Keeping Borrowers in Their Homes
Having potentially caused inadvertent harm to struggling borrowers is particularly painful to us because we work so hard to help them keep their homes and improve their financial situations. We recognize our mistake. We are doing everything in our power to make things right for any borrowers who were harmed as a result of misdated letters and to ensure that this does not happen again. We remain deeply committed to keeping borrowers in their homes because we believe it is the right thing to do and a win/win for all of our stakeholders.
We will be in further communication with you on this matter.
Sincerely,
Ron Faris
CEO
YOU DECIDE
—
Ocwen Downgrade Puts RMBS at Risk
Moody’s and S&P downgraded Ocwen’s servicer quality rating last week after the New York Department of Financial Services made “backdating” allegations. Barclays says the downgrades could put some RMBS at risk of a servicer-driven default.
Home Ownership Rate Since 2005

by Wolf Richter
The quintessential ingredient in the stew that makes up a thriving housing market has been evaporating in America. And a recent phenomenon has taken over: private equity firms, REITs, and other Wall-Street funded institutional investors have plowed the nearly free money the Fed has graciously made available to them since 2008 into tens of thousands of vacant single-family homes to rent them out. And an apartment building boom has offered alternatives too.
Since the Fed has done its handiwork, institutional investors have driven up home prices and pushed them out of reach for many first-time buyers, and these potential first-time buyers are now renting homes from investors instead. Given the high home prices, in many cases it may be a better deal. And apartments are often centrally located, rather than in some distant suburb, cutting transportation time and expenses, and allowing people to live where the urban excitement is. Millennials have figured it out too, as America is gradually converting to a country of renters.
So in its inexorable manner, home ownership has continued to slide in the third quarter, according to the Commerce Department. Seasonally adjusted, the rate dropped to 64.3% from 64.7 in the prior quarter. It was the lowest rate since Q4 1994 (not seasonally adjusted, the rate dropped to 64.4%, the lowest since Q1 1995).
This is what that relentless slide looks like:
Home ownership since 2008 dropped across all age groups. But the largest drops occurred in the youngest age groups. In the under-35 age group, where first-time buyers are typically concentrated, home ownership has plunged from 41.3% in 2008 to 36.0%; and in the 35-44 age group, from 66.7% to 59.1%, with a drop of over a full percentage point just in the last quarter – by far the steepest.
Home ownership, however, didn’t peak at the end of the last housing bubble just before the financial crisis, but in 2004 when it reached 69.2%. Already during the housing bubble, speculative buying drove prices beyond the reach of many potential buyers who were still clinging by their fingernails to the status of the American middle class … unless lenders pushed them into liar loans, a convenient solution many lenders perfected to an art.
It was during these early stages of the housing bubble that the concept of “home” transitioned from a place where people lived and thrived or fought with each other and dealt with onerous expenses and responsibilities to a highly leveraged asset for speculators inebriated with optimism, an asset to be flipped willy-nilly and laddered ad infinitum with endless amounts of cheaply borrowed money. And for some, including the Fed it seems, that has become the next American dream.
Despite low and skidding home ownership rates, home prices have been skyrocketing in recent years, and new home prices have reached ever more unaffordable all-time highs.

Assisted-Living Complexes for Young People

One of the most surprising developments in the aftermath of the housing crisis is the sharp rise in apartment building construction. Evidently post-recession Americans would rather rent apartments than buy new houses.
When I noticed this trend, I wanted to see what was behind the numbers.
Is it possible Americans are giving up on the idea of home ownership, the very staple of the American dream? Now that would be a good story.
What I found was less extreme but still interesting: The American dream appears merely to be on hold.
Economists told me that many potential home buyers can’t get a down payment together because the recession forced them to chip away at their savings. Others have credit stains from foreclosures that will keep them out of the mortgage market for several years.
More surprisingly, it turns out that the millennial generation is a driving force behind the rental boom. Young adults who would have been prime candidates for first-time home ownership are busy delaying everything that has to do with becoming a grown-up. Many even still live at home, but some data shows they are slowly beginning to branch out and find their own lodgings — in rental apartments.
A quick Internet search for new apartment complexes suggests that developers across the country are seizing on this trend and doing all they can to appeal to millennials. To get a better idea of what was happening, I arranged a tour of a new apartment complex in suburban Washington that is meant to cater to the generation.
What I found made me wish I was 25 again. Scented lobbies crammed with funky antiques that led to roof decks with outdoor theaters and fire pits. The complex I visited offered Zumba classes, wine tastings, virtual golf and celebrity chefs who stop by to offer cooking lessons.
“It’s like an assisted-living facility for young people,” the photographer accompanying me said.
Economists believe that the young people currently filling up high-amenity rental apartments will eventually buy homes, and every young person I spoke with confirmed that this, in fact, was the plan. So what happens to the modern complexes when the 20-somethings start to buy homes? It’s tempting to envision ghost towns of metal and pipe wood structures with tumbleweeds blowing through the lobbies. But I’m sure developers will rehabilitate them for a new demographic looking for a renter’s lifestyle.
FHA Is Set To Return To Anti-House-Flipping Restrictions

House flippers buy run-down properties, fix them up and resell them quickly at a higher price. Above, a home under renovation in Amsterdam, N.Y. (Mike Groll / Associated Press)
Can you still do a short-term house flip using federally insured, low-down payment mortgage money? That’s an important question for buyers, sellers, investors and realty agents who’ve taken part in a nationwide wave of renovations and quick resales using Federal Housing Administration-backed loans during the last four years.
The answer is yes: You can still flip and finance short term. But get your rehabs done soon. The federal agency whose policy change in 2010 made tens of thousands of quick flips possible — and helped large numbers of first-time and minority buyers with moderate incomes acquire a home — is about to shut down the program, FHA officials confirmed to me.
In an effort to stimulate repairs and sales in neighborhoods hard hit by the mortgage crisis and recession, the FHA waived its standard prohibition against financing short-term house flips. Before the policy change, if you were an investor or property rehab specialist, you had to own a house for at least 90 days before reselling — flipping it — to a new buyer at a higher price using FHA financing. Under the waiver of the rule, you could buy a house, fix it up and resell it as quickly as possible to a buyer using an FHA mortgage — provided that you followed guidelines designed to protect consumers from being ripped off with hyper-inflated prices and shoddy construction.
Since then, according to FHA estimates, about 102,000 homes have been renovated and resold using the waiver. The reason for the upcoming termination: The program has done its job, stimulated billions of dollars of investments, stabilized prices and provided homes for families who were often newcomers to ownership.
However, even though the waiver program has functioned well, officials say, inherent dangers exist when there are no minimum ownership periods for flippers. In the 1990s, the FHA witnessed this firsthand when teams of con artists began buying run-down houses, slapped a little paint on the exterior and resold them within days — using fraudulent appraisals — for hyper-inflated prices and profits. Their buyers, who obtained FHA-backed mortgages, often couldn’t afford the payments and defaulted. Sometimes the buyers were themselves part of the scam and never made any payments on their loans — leaving the FHA, a government-owned insurer, with steep losses.
For these reasons, officials say, it’s time to revert to the more restrictive anti-quick-flip rules that prevailed before the waiver: The 90-day standard will come back into effect after Dec. 31.
But not everybody thinks that’s a great idea. Clem Ziroli Jr., president of First Mortgage Corp., an FHA lender in Ontario, says reversion to the 90-day rule will hurt moderate-income buyers who found the program helpful in opening the door to home ownership.
“The sad part,” Ziroli said in an email, “is the majority of these properties were improved and [located] in underserved areas. Having a rehabilitated house available to these borrowers” helped them acquire houses that had been in poor physical shape but now were repaired, inspected and safe to occupy.
Paul Skeens, president of Colonial Mortgage in Waldorf, Md., and an active rehab investor in the suburbs outside Washington, D.C., said the upcoming policy change will cost him money and inevitably raise the prices of the homes he sells after completing repairs and improvements. Efficient renovators, Skeens told me in an interview, can substantially improve a house within 45 days, at which point the property is ready to list and resell. By extending the mandatory ownership period to 90 days, the FHA will increase Skeens’ holding costs — financing expenses, taxes, maintenance and utilities — all of which will need to be added onto the price to a new buyer.
Paul Wylie, a member of an investor group in the Los Angeles area, says he sees “more harm than good by not extending the waiver. There are protections built into the program that have served [the FHA] well,” he said in an email. If the government reimposes the 90-day requirement, “it will harm those [buyers] that FHA intends to help” with its 3.5% minimum-down-payment loans. “Investors will adapt and sell to non-FHA-financed buyers. Entry-level consumers will be harmed unnecessarily.”
Bottom line: Whether fix-up investors like it or not, the FHA seems dead set on reverting to its pre-bust flipping restrictions. Financing will still be available, but selling prices of the end product — rehabbed houses for moderate-income buyers — are almost certain to be more expensive.
kenharney@earthlink.net. Distributed by Washington Post Writers Group. Copyright © 2014, Los Angeles Times
8 Major Reasons Why The Current Low Oil Price Is Not Here To Stay

Summary:
- The slump in the oil price is primarily a result of extreme short positioning, a headline-driven anxiety and overblown fears about the global economy.
- This is a temporary dip and the oil markets will recover significantly by H1 2015.
- Now is the time to pick the gold nuggets out of the ashes and wait to see them shine again.
- Nevertheless, the sky is not blue for several energy companies and the drop of the oil price will spell serious trouble for the heavily indebted oil producers.
Introduction: It has been a very tough market out there over the last weeks. And the energy stocks have been hit the hardest over the last five months, given that most of them have returned back to their H2 2013 levels while many have dropped even lower down to their H1 2013 levels.
But one of my favorite quotes is Napoleon’s definition of a military genius: “The man who can do the average thing when all those around him are going crazy.” To me, you don’t have to be a genius to do well in investing. You just have to not go crazy when everyone else is.
In my view, this slump of the energy stocks is a deja-vu situation, that reminded me of the natural gas frenzy back in early 2014, when some fellow newsletter editors and opinion makers with appearances on the media (i.e. CNBC, Bloomberg) were calling for $8 and $10 per MMbtu, trapping many investors on the wrong side of the trade. In contrast, I wrote a heavily bearish article on natural gas in February 2014, when it was at $6.2/MMbtu, presenting twelve reasons why that sky high price was a temporary anomaly and would plunge very soon. I also put my money where my mouth was and bought both bearish ETFs (NYSEARCA:DGAZ) and (NYSEARCA:KOLD), as shown in the disclosure of that bearish article. Thanks to these ETFs, my profits from shorting the natural gas were quick and significant.
This slump of the energy stocks also reminded me of those analysts and investors who were calling for $120/bbl and $150/bbl in H1 2014. Even T. Boone Pickens, founder of BP Capital Management, told CNBC in June 2014 that if Iraq’s oil supply goes offline, crude prices could hit $150-$200 a barrel.
But people often go to the extremes because this is the human nature. But shrewd investors must exploit this inherent weakness of human nature to make easy money, because factory work has never been easy.
Let The Charts And The Facts Speak For Themselves
The chart for the bullish ETF (NYSEARCA:BNO) that tracks Brent is illustrated below:

And the charts for the bullish ETFs (NYSEARCA:USO), (NYSEARCA:DBO) and (NYSEARCA:OIL) that track WTI are below:

and below:

and below:

For the risky investors, there is the leveraged bullish ETF (NYSEARCA:UCO), as illustrated below:

It is clear that these ETFs have returned back to their early 2011 levels amid fears for oversupply and global economy worries. Nevertheless, the recent growth data from the major global economies do not look bad at all.
In China, things look really good. The Chinese economy grew 7.3% in Q3 2014, which is way far from a hard-landing scenario that some analysts had predicted, and more importantly the Chinese authorities seem to be ready to step in with major stimulus measures such as interest rate cuts, if needed. Let’s see some more details about the Chinese economy:
1) Exports rose 15.3% in September from a year earlier, beating a median forecast in a Reuters poll for a rise of 11.8% and quickening from August’s 9.4% rise.
2) Imports rose 7% in terms of value, compared with a Reuters estimate for a 2.7% fall.
3) Iron ore imports rebounded to the second highest this year and monthly crude oil imports rose to the second highest on record.
4) China posted a trade surplus of $31.0 billion in September, down from $49.8 billion in August.
Beyond the encouraging growth data coming from China (the second largest oil consumer worldwide), the US economy grew at a surprising 4.6% rate in Q2 2014, which is the fastest pace in more than two years.
Meanwhile, the Indian economy picked up steam and rebounded to a 5.7% rate in Q2 2014 from 4.6% in Q1, led by a sharp recovery in industrial growth and gradual improvement in services. And after overtaking Japan as the world’s third-biggest crude oil importer in 2013, India will also become the world’s largest oil importer by 2020, according to the US Energy Information Administration (EIA).
The weakness in Europe remains, but this is nothing new over the last years. And there is a good chance Europe will announce new economic policies to boost the economy over the next months. For instance and based on the latest news, the European Central Bank is considering buying corporate bonds, which is seen as helping banks free up more of their balance sheets for lending.
All in all, and considering the recent growth data from the three biggest oil consumers worldwide, I get the impression that the global economy is in a better shape than it was in early 2011. On top of that, EIA forecasts that WTI and Brent will average $94.58 and $101.67 respectively in 2015, and obviously I do not have any substantial reasons to disagree with this estimate.
The Reasons To Be Bullish On Oil Now
When it comes to investing, timing matters. In other words, a lucrative investment results from a great entry price. And based on the current price, I am bullish on oil for the following reasons:
1) Expiration of the oil contracts: They expired last Thursday and the shorts closed their bearish positions and locked their profits.
2) Restrictions on US oil exports: Over the past three years, the average price of WTI oil has been $13 per barrel cheaper than the international benchmark, Brent crude. That gives large consumers of oil such as refiners and chemical companies a big cost advantage over foreign rivals and has helped the U.S. become the world’s top exporter of refined oil products.
Given that the restrictions on US oil exports do not seem to be lifted anytime soon, the shale oil produced in the US will not be exported to impact the international supply/demand and lower Brent price in the short-to-medium term.
3) The weakening of the U.S. dollar: The U.S. dollar rose significantly against the Euro over the last months because of a potential interest rate hike.
However, U.S. retail sales declined in September 2014 and prices paid by businesses also fell. Another report showed that both ISM indices weakened in September 2014, although the overall economic growth remained very strong in Q3 2014.
The ISM manufacturing survey showed that the reading fell back from 59.0 in August 2014 to 56.6 in September 2014. The composite non-manufacturing index dropped back as well, moving down from 59.6 in August 2014 to 58.6 in September 2014.
(click to enlarge)
Source: Pictet Bank website
These reports coupled with a weak growth in Europe and a potential slowdown in China could hurt U.S. exports, which could in turn put some pressure on the U.S. economy.
These are reasons for caution and will most likely deepen concerns at the U.S. Federal Reserve. A rate hike too soon could cause problems to the fragile U.S. economy which is gradually recovering. “If foreign growth is weaker than anticipated, the consequences for the U.S. economy could lead the Fed to remove accommodation more slowly than otherwise,” the U.S. central bank’s vice chairman, Stanley Fischer, said.
That being said, the US Federal Reserve will most likely defer to hike the interest rate planned to begin in H1 2015. A delay in expected interest rate hikes will soften the dollar over the next months, which will lift pressure off the oil price and will push Brent higher.
4) OPEC’s decision to cut supply in November 2014: Many OPEC members need the price of oil to rise significantly from the current levels to keep their house in fiscal order. If Brent remains at $85-$90, these countries will either be forced to borrow more to cover the shortfall in oil tax revenues or cut their promises to their citizens. However, tapping bond markets for financing is very expensive for the vast majority of the OPEC members, given their high geopolitical risk. As such, a cut on promises and social welfare programs is not out of the question, which will likely result in protests, social unrest and a new “Arab Spring-like” revolution in some of these countries.
This is why both Iran and Venezuela are calling for an urgent OPEC meeting, given that Venezuela needs a price of $121/bbl, according to Deutsche Bank, making it one of the highest break-even prices in OPEC. Venezuela is suffering rampant inflation which is currently around 50%, and the government currency controls have created a booming black currency market, leading to severe shortages in the shops.
Bahrain, Oman and Nigeria have not called for an urgent OPEC meeting yet, although they need between $100/bbl and $136/bbl to meet their budgeted levels. Qatar and UAE also belong to this group, although hydrocarbon revenues in Qatar and UAE account for close to 60% of the total revenues of the countries, while in Kuwait, the figure is close to 93%.
The Gulf producers such as the UAE, Qatar and Kuwait are more resilient than Venezuela or Iran to the drop of the oil price because they have amassed considerable foreign currency reserves, which means that they could run deficits for a few years, if necessary. However, other OPEC members such as Iran, Iraq and Nigeria, with greater domestic budgetary demands because of their large population sizes in relation to their oil revenues, have less room to maneuver to fund their budgets.
And now let’s see what is going on with Saudi Arabia. Saudi Arabia is too reliant on oil, with oil accounting for 80% of export revenue and 90% of the country’s budget revenue. Obviously, Saudi Arabia is not a well-diversified economy to withstand low Brent prices for many months, although the country’s existing sovereign wealth fund, SAMA Foreign Holdings, run by the country’s central bank, consisting mainly of oil surpluses, is the world’s third-largest, with assets totaling 737.6 billion US dollars.
This is why Prince Alwaleed bin Talal, billionaire investor and chairman of Kingdom Holding, said back in 2013: “It’s dangerous that our income is 92% dependent on oil revenue alone. If the price of oil decline was to decline to $78 a barrel there will be a gap in our budget and we will either have to borrow or tap our reserves. Saudi Arabia has SAR2.5 trillion in external reserves and unfortunately the return on this is 1 to 1.5%. We are still a nation that depends on the oil and this is wrong and dangerous. Saudi Arabia’s economic dependence on oil and lack of a diverse revenue stream makes the country vulnerable to oil shocks.”
And here are some additional key factors that the oil investors need to know about Saudi Arabia to place their bets accordingly:
a) Saudi Arabia’s most high-profile billionaire and foreign investor, Prince Alwaleed bin Talal, has launched an extraordinary attack on the country’s oil minister for allowing prices to fall. In a recent letter in Arabic addressed to ministers and posted on his website, Prince Alwaleed described the idea of the kingdom tolerating lower prices below $100 per barrel as potentially “catastrophic” for the economy of the desert kingdom. The letter is a significant attack on Saudi’s highly respected 79-year-old oil minister Ali bin Ibrahim Al-Naimi who has the most powerful voice within the OPEC.
b) Back in June 2014, Saudi Arabia was preparing to launch its first sovereign wealth fund to manage budget surpluses from a rise in crude prices estimated at hundreds of billions of dollars. The fund would be tasked with investing state reserves to “assure the kingdom’s financial stability,” Shura Council financial affairs committee Saad Mareq told Saudi daily Asharq Al-Awsat back then. The newspaper said the fund would start with capital representing 30% of budgetary surpluses accumulated over the years in the kingdom. The thing is that Saudi Arabia is not going to have any surpluses if Brent remains below $90/bbl for months.
c) Saudi Arabia took immediate action in late 2011 and early 2012, under the fear of contagion and the destabilisation of Gulf monarchies. Saudi Arabia funded those emergency measures, thanks to Brent which was much higher than $100/bbl back then. It would be difficult for Saudi Arabia to fund these billion dollar initiatives if Brent remained at $85-$90 for long.
d) Saudi Arabia and the US currently have a common enemy which is called ISIS. Moreover, the American presence in the kingdom’s oil production has been dominant for decades, given that U.S. petroleum engineers and geologists developed the kingdom’s oil industry throughout the 1940s, 1950s and 1960s.
From a political perspective, the U.S. has had a discreet military presence since 1950s and the two countries were close allies throughout the Cold War in order to prevent the communists from expanding to the Middle East. The two countries were also allies throughout the Iran-Iraq war and the Gulf War.
5) Geopolitical Risk: Right now, Brent price carries a zero risk premium. Nevertheless, the geopolitical risk in the major OPEC exporters (i.e. Nigeria, Algeria, Libya, South Sudan, Iraq, Iran) is highly volatile, and several things can change overnight, leading to an elevated level of geopolitical risk anytime.
For instance, the Levant has a new bogeyman. ISIS, the Islamic State of Iraq, emerged from the chaos of the Syrian civil war and has swept across Iraq, making huge territorial gains. Abu Bakr al-Baghdadi, the group’s figurehead, has claimed that its goal is to establish a Caliphate across the whole of the Levant and that Jordan is next in line.
At least 435 people have been killed in Iraq in car and suicide bombings since the beginning of the month, with an uptick in the number of these attacks since the beginning of September 2014, according to Iraq Body Count, a monitoring group tracking civilian deaths. Most of those attacks occurred in Baghdad and are the work of Islamic State militants. According to the latest news, ISIS fighters are now encamped on the outskirts of Baghdad, and appear to be able to target important installations with relative ease.
Furthermore, Libya is on the brink of a new civil war and finding a peaceful solution to the ongoing Libyan crisis will not be easy. According to the latest news, Sudan and Egypt agreed to coordinate efforts to achieve stability in Libya through supporting state institutions, primarily the military who is fighting against Islamic militants. It remains to be see how effective these actions will be.
On top of that, the social unrest in Nigeria is going on. Nigeria’s army and Boko Haram militants have engaged in a fierce gun battle in the north-eastern Borno state, reportedly leaving scores dead on either side. Several thousand people have been killed since Boko Haram launched its insurgency in 2009, seeking to create an Islamic state in the mainly Muslim north of Nigeria.
6) Seasonality And Production Disruptions: Given that winter is coming in the Northern Hemisphere, the global oil demand will most likely rise effective November 2014.
Also, U.S. refineries enter planned seasonal maintenance from September to October every year as the federal government requires different mixtures in the summer and winter to minimize environmental damage. They transition to winter-grade fuel from summer-grade fuels. U.S. crude oil refinery inputs averaged 15.2 million bopd during the week ending October 17. Input levels were 113,000 bopd less than the previous week’s average. Actually, the week ending October 17 was the eighth week in a row of declines in crude oil runs, and these rates were the lowest since March 2014. After all and given that the refineries demand less crude during this period of the year, the price of WTI remains depressed.
On top of that, the production disruptions primarily in the North Sea and the Gulf of Mexico are not out of the question during the winter months. Even Saudi Arabia currently faces production disruptions. For instance, production was halted just a few days ago for environmental reasons at the Saudi-Kuwait Khafji oilfield, which has output of 280,000 to 300,000 bopd.
7) Sentiment: To me, the recent sell off in BNO is overdone and mostly speculative. To me, the recent sell-off is primarily a result of a headline-fueled anxiety and bearish sentiment.
8) Jobs versus Russia: According to Olga Kryshtanovskaya, a sociologist studying the country’s elite at the Russian Academy of Sciences in Moscow, top Kremlin officials said after the annexation of Crimea that they expected the U.S. to artificially push oil prices down in collaboration with Saudi Arabia in order to damage Russia.
And Russia is stuck with being a resource-based economy and the cheap oil chokes the Russian economy, putting pressure on Vladimir Putin’s regime, which is overwhelmingly reliant on energy, with oil and gas accounting for 70% of its revenues. This is an indisputable fact.
The current oil price is less than the $104/bbl on average written into the 2014 Russian budget. As linked above, the Russian budget will fall into deficit next year if Brent is less than $104/bbl, according to the Russian investment bank Sberbank CIB. At $90/bbl, Russia will have a shortfall of 1.2% of gross domestic product. Against a backdrop of falling revenue, finance minister Anton Siluanov warned last week that the country’s ambitious plans to raise defense spending had become unaffordable.
Meanwhile, a low oil price is also helping U.S. consumers in the short term. However, WTI has always been priced in relation to Brent, so the current low price of WTI is actually putting pressure on the US consumers in the midterm, given that the number one Job Creating industry in the US (shale oil) will collapse and many companies will lay off thousands of people over the next few months. The producers will cut back their growth plans significantly, and the explorers cannot fund the development of their discoveries. This is another indisputable fact too.
For instance, sliding global oil prices put projects under heavy pressure, executives at Chevron (NYSE:CVX) and Statoil (NYSE:STO) told an oil industry conference in Venezuela. Statoil Venezuela official Luisa Cipollitti said at the conference that mega-projects globally are under threat, and estimates that more than half the world’s biggest 163 oil projects require a $120 Brent price for crude.
Actually, even before the recent fall of the oil price, the oil companies had been cutting back on significant spending, in a move towards capital discipline. And they had been making changes that improve the economies of shale, like drilling multiple wells from a single pad and drilling longer horizontal wells, because the “fracking party” was very expensive. Therefore, the drop of the oil price just made things much worse, because:
a) Shale Oil: Back in July 2014, Goldman Sachs estimated that U.S. shale producers needed $85/bbl to break even.
b) Offshore Oil Discoveries: Aside Petr’s (NYSE: PBR) pre-salt discoveries in Brazil, Kosmos Energy’s (NYSE: KOS) Jubilee oilfield in Ghana and Jonas Sverdrup oilfield in Norway, there have not been any oil discoveries offshore that move the needle over the last decade, while depleting North Sea fields have resulted in rising costs and falling production.
The pre-salt hype offshore Namibia and offshore Angola has faded after multiple dry or sub-commercial wells in the area, while several major players have failed to unlock new big oil resources in the Arctic Ocean. For instance, Shell abandoned its plans in the offshore Alaskan Arctic, and Statoil is preparing to drill a final exploration well in the Barents Sea this year after disappointing results in its efforts to unlock Arctic resources.
Meanwhile, the average breakeven cost for the Top 400 offshore projects currently is approximately $80/bbl (Brent), as illustrated below:
(click to enlarge)
Source: Kosmos Energy website
c) Oil sands: The Canadian oil sands have an average breakeven cost that ranges between $65/bbl (old projects) and $100/bbl (new projects).
In fact, the Canadian Energy Research Institute forecasts that new mined bitumen projects requires US$100 per barrel to breakeven, whereas new SAGD projects need US$85 per barrel. And only one in four new Canadian oil projects could be vulnerable if oil prices fall below US$80 per barrel for an extended period of time, according to the International Energy Agency.
“Given that the low-bearing fruit have already been developed, the next wave of oil sands project are coming from areas where geology might not be as uniform,” said Dinara Millington, senior vice president at the Canadian Energy Research Institute.
So it is not surprising that Suncor Energy (NYSE:SU) announced a billion-dollar cut for the rest of the year even though the company raised its oil price forecast. Also, Suncor took a $718-million charge related to a decision to shelve the Joslyn oilsands mine, which would have been operated by the Canadian unit of France’s Total (NYSE:TOT). The partners decided the project would not be economically feasible in today’s environment.
As linked above, others such as Athabasca Oil (OTCPK: ATHOF), PennWest Exploration (NYSE: PWE), Talisman Energy (NYSE: TLM) and Sunshine Oil Sands (OTC: SUNYF) are also cutting back due to a mix of internal corporate issues and project uncertainty. Cenovus Energy (NYSE:CVE) is also facing cost pressures at its Foster Creek oil sands facility.
And as linked above: “Oil sands are economically challenging in terms of returns,” said Jeff Lyons, a partner at Deloitte Canada. “Cost escalation is causing oil sands participants to rethink the economics of projects. That’s why you’re not seeing a lot of new capital flowing into oil sands.”
After all, helping the US consumer spend more on cute clothes today does not make any sense, when he does not have a job tomorrow. Helping the US consumer drive down the street and spend more at a fancy restaurant today does not make any sense, if he is unemployed tomorrow.
Moreover, Putin managed to avoid mass unemployment during the 2008 financial crisis, when the price of oil dropped further and faster than currently. If Russia faces an extended slump now, Putin’s handling of the last crisis could serve as a template.
In short, I believe that the U.S. will not let everything collapse that easily just because the Saudis woke up one day and do not want to pump less. I believe that the U.S. economy has more things to lose (i.e. jobs) than to win (i.e. hurt Russia or help the US consumer in the short term), in case the current low WTI price remains for months.
My Takeaway
I am not saying that an investor can take the plunge lightly, given that the weaker oil prices squeeze profitability. Also, I am not saying that Brent will return back to $110/bbl overnight. I am just saying that the slump of the oil price is primarily a result from extreme short positioning and overblown fears about the global economy.
To me, this is a temporary dip and I believe that oil markets will recover significantly by the first half of 2015. This is why, I bought BNO at an average price of $33.15 last Thursday, and I will add if BNO drops down to $30. My investment horizon is 6-8 months.
Nevertheless, all fingers are not the same. All energy companies are not the same either. The rising tide lifted many of the leveraged duds over the last two years. Some will regain quickly their lost ground, some will keep falling and some will cover only half of the lost ground.
I am saying this because the drop of the oil price will spell serious trouble for a lot of oil producers, many of whom are laden with debt. I do believe that too much credit has been extended too fast amid America’s shale boom, and a wave of bankruptcy that spreads across the oil patch will not surprise me. On the debt front, here is some indicative data according to Bloomberg:
1) Speculative-grade bond deals from energy companies have made up at least 16% of total junk issuance in the U.S. the past two years as the firms piled on debt to fund exploration projects. Typically the average since 2002 has been 11%.
2) Junk bonds issued by energy companies, which have made up a record 17% of the $294 billion of high-yield debt sold in the U.S. this year, have on average lost more than 4% of their market value since issuance.
3) Hercules Offshore’s (NASDAQ:HERO) $300 million of 6.75% notes due in 2022 plunged to 57 cents a few days ago after being issued at par, with the yield climbing to 17.2%.
4) In July 2014, Aubrey McClendon’s American Energy Partners LP tapped the market for unsecured debt to fund exploration projects in the Permian Basin. Moody’s Investors Service graded the bonds Caa1, which is a level seven steps below investment-grade and indicative of “very high credit risk.” The yield on the company’s $650 million of 7.125% notes maturing in November 2020 reached 11.4% a couple of days ago, as the price plunged to 81.5 cents on the dollar, according to Trace, the Financial Industry Regulatory Authority’s bond-price reporting system.
Due to this debt pile, I have been very bearish on several energy companies like Halcon Resources (NYSE:HK), Goodrich Petroleum (NYSE:GDP), Vantage Drilling (NYSEMKT: VTG), Midstates Petroleum (NYSE: MPO), SandRidge Energy (NYSE:SD), Quicksilver Resources (NYSE: KWK) and Magnum Hunter Resources (NYSE:MHR). All these companies have returned back to their H1 2013 levels or even lower, as shown at their charts.
But thanks also to this correction of the market, a shrewd investor can separate the wheat from the chaff and pick only the winners. The shrewd investor currently has the unique opportunity to back up the truck on the best energy stocks in town. This is the time to pick the gold nuggets out of the ashes and wait to see them shine again. On that front, I recommended Petroamerica Oil (OTCPK: PTAXF) which currently is the cheapest oil-weighted producer worldwide with a pristine balance sheet.
Last but not least, I am watching closely the situation in Russia. With economic growth slipping close to zero, Russia is reeling from sanctions by the U.S. and the European Union. The sanctions are having an across-the-board impact, resulting in a worsening investment climate, rising capital flight and a slide in the ruble which is at a record low. And things in Russia have deteriorated lately due to the slump of the oil price.
Obviously, this is the perfect storm and the current situation in Russia reminds me of the situation in Egypt back in 2013. Those investors who bought the bullish ETF (NYSEARCA: EGPT) at approximately $40 in late 2013, have been rewarded handsomely over the last twelve months because EGPT currently lies at $66. Therefore, I will be watching closely both the fluctuations of the oil price and several other moving parts that I am not going to disclose now, in order to find the best entry price for the Russian ETFs (NYSEARCA: RSX) and (NYSEARCA:RUSL) over the next months.

U.S. To Ease Repurchase Demands On Bad Mortgages
Melvin Watt, director of the Federal Housing Finance Agency, outlined ways in which his agency would clarify actions it takes against bankers on loans that go bad. (Jacquelyn Martin / Associated Press).
by E. Scott Reckard, John Glionna & Tim Logan
Hoping to boost mortgage approvals for more borrowers, the federal regulator of Fannie Mae and Freddie Mac told lenders that the home financing giants would ease up on demands that banks buy back loans that go delinquent.
Addressing a lending conference here Monday, Melvin Watt, director of the Federal Housing Finance Agency, outlined ways in which his agency would clarify actions it takes against bankers on loans that go bad after being sold to Freddie and Fannie.
The agency’s idea is to foster an environment in which lenders would fund mortgages to a wider group of borrowers, particularly first-time home buyers and those without conventional pay records.
To date, though, the agency’s demands that lenders repurchase bad loans made with shoddy underwriting standards have resulted in bankers imposing tougher criteria on borrowers than Fannie and Freddie require.
A lot of good loans don’t get done because of silly regulations that are not necessary. – Jeff Lazerson, a mortgage broker from Orange County
Those so-called overlays in lending standards, in turn, have contributed to sluggish home sales, a drag on the economic recovery and lower profits on mortgages as banks reduced sales to Fannie and Freddie and focused mainly on borrowers with excellent credit.
Watt acknowledged to the Mortgage Bankers Assn. audience that his agency in the past “did not provide enough clarity to enable lenders to understand when Fannie Mae or Freddie Mac would exercise their remedy to require repurchase of a loan.”
Going forward, Watt said, Fannie and Freddie would not force repurchases of mortgages found to have minor flaws if the borrowers have near-perfect payment histories for 36 months.
He also said flaws in reporting borrowers’ finances, debt loads and down payments would not trigger buy-back demands so long as the borrowers would have qualified for loans had the information been reported accurately. And he said that the agency would release guidelines “in the coming weeks” to allow increased lending to borrowers with down payments as low as 3% by considering “compensating factors.”
The mortgage trade group’s chief executive, David Stevens, said Watt’s remarks “represent significant progress in the ongoing dialogue” among the industry, regulators and Fannie and Freddie. Several banks released positive statements that echoed his remarks.
Others at the convention, however, said Watt’s speech lacked specifics and did little to reassure mortgage lenders that the nation’s housing market would soon be back on track.
“The speech was horribly disappointing,” said Jeff Lazerson, a mortgage broker from Orange County, calling Watt’s delivery and message “robotic.”
“They’ve been teasing us, hinting that things were going to get better, but nothing new came out,” Lazerson said. “A lot of good loans don’t get done because of silly regulations that are not necessary.”
Philip Stein, a lawyer from Miami who represents regional banks and mortgage companies in loan repurchase cases, said the situation was far from returning to a “responsible state of normalcy,” as Watt described it.
“When the government talked of modifications in the process, I thought, ‘Oh, this could be good,'” Stein said. “But I don’t feel good about what I heard today.”
Despite overall improvements in the economy and interest rates still near historic lows, the number of home sales is on pace to fall this year for the first time since 2010 as would-be buyers struggle with higher prices and tight lending conditions
Loose underwriting standards–scratch that, non-existent underwriting standards–caused the mortgage meltdown. If borrowers are willing to put down just 3% for their down payment, their note rate should be 0.50% higher and 1 buy-down point. The best rates should go to 20% down payments.
Once-torrid price gains have cooled, too, as demand has subsided. The nation’s home ownership rate is at a 19-year low.
First-time buyers, in particular, have stayed on the sidelines. Surveys by the National Assn. of Realtors have found first-time owners making up a significantly smaller share of the housing market than the 40% they typically do.
There are reasons for this, economists said, including record-high student debt levels, young adults delaying marriage, and the still-soft job market. But many experts agree that higher down-payment requirements and tougher lending restrictions are playing a role.
Stuart Gabriel, director of the Ziman Center for Real Estate at UCLA, said he’s of a “mixed mind” about the changes.
On one hand, Gabriel said, tight underwriting rules are clearly making it harder for many would-be buyers to get a loan, perhaps harder than it should be.
“If they loosen the rules a bit, they’ll see more qualified applicants and more applicants getting into mortgages,” he said. “That would be a good thing.”
But, he said, a down payment of just 3% doesn’t leave borrowers with much of a cushion. If prices fall, he said, it risks a repeat of what happened before the downturn.
“We saw that down payments at that level were inadequate to withstand even a minor storm in the housing market,” he said. “It lets borrowers have very little skin in the game, and it becomes easy for those borrowers to walk away.”
Selma Hepp, senior economist at the California Assn. of Realtors, said lenders will welcome clarification of the rules over repurchase demands.
But in a market in which many buyers struggle to afford a house even if they can get a mortgage, she wasn’t sure the changes would have much effect on sales.
“We’re still unclear if we’re having a demand issue or a supply issue here,” said Hepp, whose group recently said it expects home sales to fall in California this year. “It may not have an immediate effect. But in the long term, I think it’s very positive news.”
Watt’s agency has recovered billions of dollars from banks that misrepresented borrowers’ finances and home values when they sold loans during the housing boom. The settlements have helped stabilize Fannie and Freddie, which were taken over by the government in 2008, and led many bankers to clamp down on new loans.
Fannie and Freddie buy bundles of home loans from lenders and sell securities backed by the mortgages, guaranteeing payment to investors if the borrowers default.
Reckard and Logan reported from Los Angeles; Glionna from Las Vegas
US Home Prices Are Rolling Over (in one Chart)
The numerous outfits that attempt to measure home price levels and movements in the US all come up with different numbers, and often frustratingly so, in part because they measure different things. Some measure actual cities, others measure the often multi-county area of the entire metroplex. So the absolute price levels differ, and timing may differ as well, but the movements are roughly the same.
The chart by the Atlanta Fed overlays three of the major real estate data series – the Federal Housing Finance Agency’s House Price Index, the CoreLogic National House Price Index, and the S&P/Case Shiller Home Price Index (20-city). And one thing is now abundantly clear:
Year over year, home-price increases are fading from crazy double digit gains last year toward….?
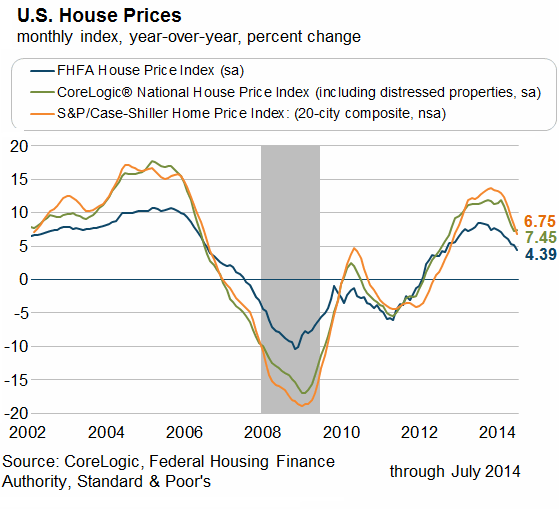
Note the great housing bubble that the Greenspan Fed instigated with its cheap-money policies that then led to the financial crisis. It was followed by a hangover.
And the show repeats itself:
The ephemeral bump in home prices in 2010 and 2011 was a result of federal and state stimulus money (via tax credits) for home buyers. It was followed by a hangover.
The hefty home price increases of 2012 and 2013 were nourished by investors, including large Wall Street firms with access to nearly free money that QE and ZIRP made available to them. They plowed billions every month into the buy-to-rent scheme. When prices soared past where it made sense for them, they pulled back. And now the hangover has set in.
There is no instance in recent history when home prices soared like this beyond the reach of actual home buyers, then landed softly on a plateau to somehow let incomes catch up with them. Despite the well-honed assurances by the industry, there is no plateau when home prices are inflated by outside forces. When these forces peter out, the hangover sets in.
How long the current hangover will last and how far prices have to drop before demand re-materializes even as interest rates are likely to be nudged up remains a guessing game. So far, prices are still up on a national basis year over year. But in some areas, price changes have started to go negative on a monthly basis. And the trend has been relentless.
Someday perhaps, governments and central banks will figure out that every stimulus and money-printing binge is followed by a hangover. And when that hangover gets painful, suddenly there are new screams for more stimulus and another money-printing binge, regardless of what will come as a result of it, or after it fades.
Last Time this Happened, the Housing Market Crashed
Home builder KB Homes, when it reported earnings for the quarter ended August 31, revealed that the average price of the homes it sold rose 9% to $327,000. In the West, prices jumped by 20% to $579,700. With these juicy price increases, sales in dollars were up 7% from a year ago. But the number of homes it sold actually declined by 2%. That’s how the housing market in America operates these days – even at the high end that KB Homes serves.
At the same moment, the Commerce Department reported that new home sales suddenly jumped by 18% in August from July, and a breath-taking 33% from August last year, after having been in the doldrums or declining for months (PDF). But the margin of errors are elephantine (±16.3% and ±21.7% respectively), so a grain of salt comes in handy.
With such an enormous jump in sales, if it doesn’t get revised back down next month, you’d think that inventories of homes for sale would have been drawn down during the month. On the surface, that happened: supply dropped from 6 months to 4.8 months. But…
The actual inventory of new homes still for sale at the end of August, despite the burst in sales, rose 2% to 206,000, from July’s 202,000 – and was up 16% from August a year ago. August and July were the only two months in the 12-month period when inventory was over 200,000 new homes. Among these homes, the inventory of “completed” homes – rather than “not started” and “under construction” – jumped 23%. These homes, despite the presumed spurt in sales, are stacking up!
Now RealtyTrac found that sales of all residential properties – single family homes, condominiums, and town homes – in August dropped 0.5% from the already dismally low level of July to an estimated annual pace of just over 4.5 million. Year over year, a 16% plunge!
Until mid-2013, the annual rate had been rising toward 5.5 million homes. Investors had been scouring the hottest markets, buying up homes by the thousands, and driving up prices in the process. But they succeeded so well in driving up prices that their equation wasn’t working anymore. And they walked. What was left was a toxic mix [read…. After Mucking up the Housing Market, Investors Flee].
Mid-2013, everyone thought the housing market was once again entering the paradise of eternally rising prices and sales. But in the fall, the hot air started hissing out of it. Sales spiraled down, amidst a slew of now ludicrous industry excuses.
This chart shows the change of the annual rate of sales every month, starting January last year (fat line, left scale). Note how beautifully it rose toward 5.5 million homes in mid-2013. Then investors began to bail out. The light blue bars (right scale) indicate the year-over-year percentage changes in the annual rate of sales, which has plummeted relentlessly over the last 12 months:
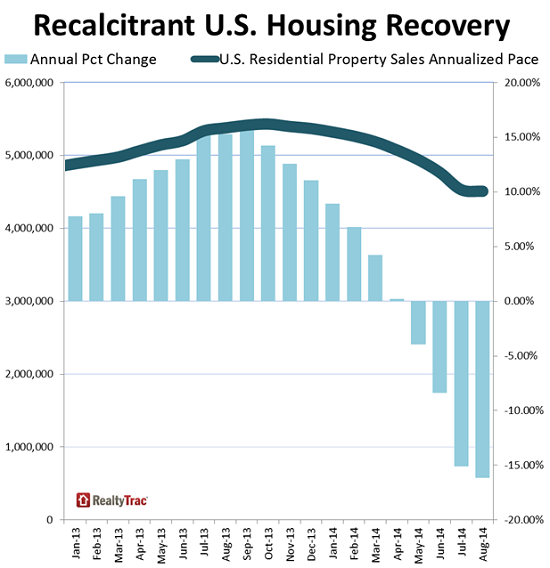
But here is the miracle: Despite plunging sales, the median price rose 3% from July to $195,000 – the highest since August 2008 – and was up 15% from a year ago. These soaring prices are hurtling along on the same time-honored collision course with plunging sales. In the past, that type of race ended in a crash.
And there is a Fed-induced twist to just about everything in this economic “recovery”: the higher end, where the beneficiaries of the Fed’s “wealth effect” operate, is doing well, while the bottom is falling out at the lower half: The share of sales in the price range below $200,000 dropped 9% year over year. With the median sale price at $195,000, over half of the homes sold were in this miserable category.
But the categories above $200,000 gained in share. Homes over $1 million saw their share explode by 38% year over year – even as the total home sales pie shrank by 16%!
This chart shows how the overall sales pie is split up, with the lower half of the housing market in terrible shape, while at the expensive end, the Fed’s “wealth effect” has kicked in nicely. The problem? The number of people who can afford a $1 million home is minuscule.
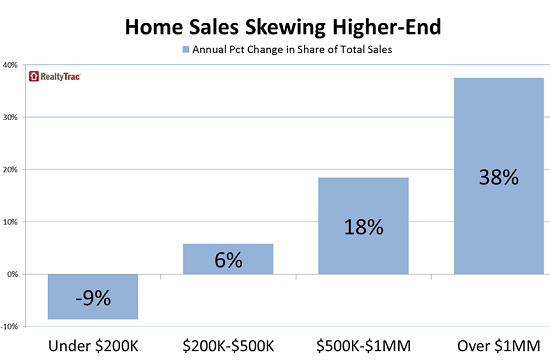
The housing market has become Exhibit A of what happens when the Fed is trying to engineer a “recovery” by dousing Wall Street with free money that then needs a place to go. It went everywhere, and in late 2011, it found fertile grounds in the American Dream. The middle class had no chance against the hundreds of billions of dollars that suddenly poured in. Now it’s largely priced out of the market.
Sellers are feeling it too. They’re still clinging to their dreams of big gains even if they can’t sell the home because potential buyers can’t afford it. Then something gives. This is precisely where the last housing crash began.
The Fed has liberally taken credit for this “recovery” of the housing market, but it is doubtful that it will liberally take credit for the main-street consequences of its actions.
And that American Dream? It’s not for millennials, apparently. Read…. California Home Sales Dive, Prices Hit Wall, Millennials Blamed
China’s “Secret Money Laundering”; Pouring Into US Luxury Real Estate
By Tyler Durden
Last week, Zero Hedge first reported on this side of the Pacific, some very troubling news: the biggest offshore buyer of luxury US real estate, that would be Chinese money laundering oligarchs and other member of the upper class, may be locked out of any future US housing purchases for a long, long time. The reason: an unexpected revelation by the power state CCTV channel revealed that contrary to popular disinformation, some of the largest Chinese banks – the PBOC included – were not only permitting but actively encouraging Chinese “money laundering” far above the $50,000/year statutory limit, the immediate result of which was soaring prices of the luxury segment of the US housing market.
We summarized the next steps last Thursday:
“So what happens next? Assuming there is the anticipated resulting backlash and crackdown on Chinese banks, which will finally enforce the $50K/year outflow limitation, this could well be the worst possible news not only for Chinese inflation, which suddenly – no longer having a convenient outlet for the unprecedented liquidity formed in the country every month – is set to soar, but also for the ultra-luxury housing in the US.
Because without the Chinese bid in a market in which the Chinese are the biggest marginal buyer scooping up real estate across the land, sight unseen, and paid for in laundered cash (which the NAR blissfully does not need to know about due to its AML exemptions), watch as suddenly the 4th dead cat bounce in US housing since the Lehman failure rediscovers just how painful gravity really is.”
We forgot to mention one other thing that would promptly happen: the rest of the US mainstream media would quickly catch to this critical story which is still woefully unreported.
First, the WSJ, from earlier today, which basically provides a recap of what we wrote before:
China’s major banks have halted an experimental program, sanctioned by the country’s central bank, that helped citizens transfer large sums overseas despite government capital controls, according to people with knowledge of the matter.
The halt, which the people said was likely to be temporary, comes after the program was criticized by China’s powerful state television broadcaster, underscoring the political sensitivity of the issue of wealthy Chinese moving money abroad. Experts said the criticism could set back China’s efforts to ease its grip on the country’s financial system.
* * *
The controversy comes at a politically sensitive time. China’s top leadership is deepening a nationwide effort to fight corruption, with a focus on officials suspected of trying to move abroad assets they might have gotten through bribes or other illegal means. Earlier this month, Liu Yunshan —a member of the Communist Party’s top decision-making body who is in charge of the country’s propaganda apparatus—called on the government to address the problem of what are known in the country as naked officials, or those whose families have moved overseas.
Analysts and economists have widely acknowledged that China’s closed capital-account system has become more porous and that the rules are routinely circumvented. A 2008 report by the PBOC said that up to 18,000 corrupt officials and employees of state-owned enterprises had fled abroad or gone into hiding since the mid-1990s, and that they were suspected of having taken $123 billion with them. A favored method, according to the PBOC report, involved squirreling cash away with the help of loved ones emigrating abroad.
The CCTV report brought to light a trial program the PBOC launched about two years ago that allowed a few approved banks, including Bank of China, ICBC and China Citic, to start offering cross-border yuan remittance services for Chinese individuals through their branches in the southern province of Guangdong. The PBOC never publicly announced the program because it intended to carry out the trial quietly, the people familiar with the matter said.
“The program itself is neither illegal nor improper as it’s been approved by the central bank, but the question is if any particular bank has gone too far by offering clients services they are not supposed to,” said a senior executive at a big state-owned bank in Beijing. “We all had to put a brake on it before the central bank draws a conclusion from its investigation.”
Of course the program was legal and proper: it served a key purpose – to keep Chinese hot money inflation under control, by which we mean, exporting it to the US housing market. This is what we said last week:
Why would the PBOC agree to quietly bless this activity which it has, at least openly, blasted vocally in the past?
Simple – to keep inflation in check.
Recall that China is a country which creates nearly $4 trillion in bank deposits every year. Also recall that back in 2011 China nearly chocked when inflation briefly soared out of control, leading to sporadic “Arab Spring” type riots in various cities. And since China simply can not reduce the pace of its loan creation at the macro level without crushing the economy, what it needs is to find outlets – legal or otherwise – that permit the outflow of funds.
Which is why it is not at all surprising that as SCMP reports, the scheme was launched in 2011, just as China’s scary encounter with soaring inflation was unfolding and Beijing needed a fast way to solve the overabundance of domestic liquidity. Basically at that point the central bank agreed to keep its eyes shut as wealthy oligarchs transferred funds to developed world nations, something the US government and NAR were delighted by as it kept real estate prices (if only at the very top) soaring, dragging the entire housing market higher with them. Furthermore recall: the one thing the Fed has wanted more than anything for the past several years is inflation. And since the US economy is nowhere near strong enough to create the kind of inflation needed, with the bulk of the Fed’s reserves ending up in the capital markets and the latest and greatest credit bubble, the Fed would be more than happy to import some of China’s inflation from it, even if that means a housing market which at the upper end is no longer accessible to anyone but the 0.0001%.
This explains the following qualifier from the WSJ:
Officials close to the PBOC said on Monday that it isn’t likely that the central bank will withdraw the trial program altogether, as it is in keeping with Beijing’s broader effort to make it easier for funds to move in and out of the mainland and to promote the yuan’s use overseas. In its latest announcements aimed at gradually freeing up the flow of money, China’s foreign-exchange regulator on Monday issued revised rules that would make it easier for Chinese companies to keep overseas profits and dividends earned in other countries.
Some analysts say the halting of the business amounts to a setback to the government’s reform efforts, at least for now. “This action highlights the tension between the benefits of easing restrictions on capital flows and the risks of allowing freer movement of capital in the absence of effective regulation of financial institutions,” said Eswar Prasad, a China scholar at Cornell University.
Worse, should the hot money flow into ultra luxury US real estate stop, watch as New York City double (and triple) digit million duplex and triplex condo plummet in value as the dumb, marginal money is locked out for good.
Which brings us to the next account of the same story: that of Bloomberg, and its specifics of just how it took place. According to Bloomberg the endorsed money laundering program was introduced in 2011 for overseas property purchases and emigration and, drumroll, doesn’t constitute money laundering, Bank of China said in a July 9 statement. The transfers were allowed by regulators and reported to them, the bank said.
“What it shows is the government has been trying to internationalize the renminbi for a lot longer than we thought,” Jim Antos, a Hong Kong-based analyst at Mizuho Securities Ltd., said by phone, using the official name for China’s currency and referring to policy makers’ long-stated goal of allowing the yuan to become freely convertible with other currencies. “I’m rather encouraged by this news because this is the way they need to go.”
China’s foreign-exchange rules cap the maximum amount of yuan that individuals are allowed to convert at $50,000 each year and ban them from transferring the currency abroad directly. Policy makers have taken steps in recent years, including allowing freer movements of capital in and out of China, as they seek to boost the global stature of the not-yet-fully convertible yuan.
“There’s a silver lining in this incident as it may force the regulators to address the issue in a more open and transparent way,” Zhou Hao, a Shanghai-based economist at Australia & New Zealand Banking Group Ltd., said by phone. “This is an irreversible trend.”
The issue came to light after CCTV said Bank of China helped customers transfer unlimited amounts of yuan abroad through a product called Youhuitong, which means “superior foreign-exchange channel.”
Of course, this being China, it is far more likely that the “incident” will force the regulators to step aside and keep this all too critical overflow valve of China’s epic hot money, amounting to over nearly $4 trillion in credit money created out of thin air every year, perfectly function for future needs. Especially considering the original report has now been permanently “suicided.” That’s right: any reference to this story in China no longer exists!
The Guangdong branch of China’s currency regulator, the State Administration of Foreign Exchange, picked Bank of China, China Citic Bank Corp. (998) and a foreign lender to let individuals transfer yuan abroad in a trial the banks were told not to promote, Time Weekly reported in April 2013. A Beijing-based Citic Bank press officer declined to comment on the program.
While Bank of China didn’t provide figures, the 21st Century Business Herald estimated the lender has moved about 20 billion yuan ($3.2 billion) abroad through Youhuitong, citing people with knowledge of the trial program. “Many commercial banks” in Guangdong offer a similar service, Bank of China said in its statement, without naming them.
On CCTV’s website, the report on Bank of China hasn’t been viewable since at least July 12. Today, the story link led only to a series of advertisements. A spokeswoman for CCTV’s international relations department, which handles foreign media inquiries, didn’t immediately respond to an e-mailed request for comment on why the story wasn’t available.
And the details:
Youhuitong customers would typically deposit yuan with Bank of China at least two weeks before the transfer, the person said. Once approved, the customer and the bank agree on an exchange rate before the funds are moved to an overseas account designated by the customer, he said. Money destined for real estate would go directly to the property seller’s account to ensure the cash won’t be misused, he said.
Remember: the program is endorsed not only by the PBOC but certainly by the Fed which is delighted in importing tens of billions in offshore money spurring inflation in the US, even if it is very localized, asset-price inflation:
A Beijing-based press officer for Bank of China declined to comment. Industrial & Commercial Bank of China Ltd. and China Construction Bank Corp. (939), the nation’s two largest banks, declined to comment on whether they offer similar products.
HSBC Holdings Plc (5), which runs the largest branch network among foreign banks in China, offers its Chinese clients another way to access offshore mortgages while avoiding the cap on foreign-exchange conversion, according to a person familiar with the mechanism, who asked not to be identified without having authorization to speak publicly.
Customers deposit yuan with HSBC’s mainland unit or purchase its wealth-management products, and the bank’s overseas branch then issues a foreign-currency denominated mortgage using the China deposits as collateral, the person said.
“We seek to abide by the rules and laws of the jurisdictions and geographies in which we operate,” said Gareth Hewett, a Hong Kong-based HSBC spokesman.
Translation: unlike money laundering originating at BNP or elsewhere in continental Europe, this particular instance of offshore funds parking in US real estate has been blessed by Janet Yellen. Why? “Clearly the property market wouldn’t nearly be so robust as it is today without mainland money,” Mizuho’s Antos said. “How did they do it? With Bank of China’s help. There has been a tremendous amount of mainland money flowing offshore and it couldn’t have happened without” official approval.”
And it’s not just the US:
Chinese have become the biggest investors in Australia’s commercial and residential property, with purchases surging 42 percent to A$5.9 billion ($5.6 billion) in the year to June 2013, according to the country’s Foreign Investment Review Board.
Vancouver’s real estate market has also seen the impact, having been “fueled tremendously in the last couple of years by high-end wealthy Chinese and Hong Kong buyers,” according to real estate agent Malcolm Hasman.
But it’s the US that would be crushed should Chinese money laundering into ultra luxury real estate – something we said is happening in 2012 – cease. From Bloomberg:
While Chinese buyers’ $22b in spending on U.S. homes in yr through March is “small fraction” of total existing-home sales, a halt in spending would “make a big impact” in cities with the most Chinese buyers, including Los Angeles, Las Vegas, NYC, San Francisco, Nela Richardson, Redfin chief economist, says in note to Bloomberg First Word. She notes Redfin agents have told her Chinese buyers will sometimes have several family, friends transfer $50k at closing, in keeping with yuan cap
Chinese parents also buy high-end properties where kids are going to college, use them as vacation homes or rentals after graduation
Raymond James also piggybacked on our conclusion adding that on the West Coast, Chinese, Taiwanese, Filipino buyers have been scouring parts of Orange County, and Las Vegas; and clearly it may hurt Lennar, SPF if travel/capital flows are suddenly restricted.
Because remember: there is good illegal money laundering, such as this one, and then there is bad illegal laundering, that which does not end up being invested in the massively overvalued luxury segment of the US housing market.
And that is all you need to know on a topic which will hardly receive much more coverage in any media outlets in the US, and certainly not China.
* * *
There is much more on this fascinating topic: those eager for a glimpse of the next steps are urged to read: “Bank of China-CCTV drama may reveal power struggle in Beijing – Money laundering accusation may be sign of a power struggle within mainland banking system.” Because when the laundering of trillions of dollars is at stake, a power struggle is certainly assured.
Implosion of Housing Bubble 2 Hits Six Cities In The West
Source: Testosterone Pit
“Homes in more than 1,000 cities and towns nationwide either already are, or soon will be, more expensive than ever,” Zillow reported gleefully the other day. “National home values have climbed year-over-year for 21 consecutive months, a steady march upward….”
Glorious recovery. Our phenomenal housing bubble that, when it blew up spectacularly, helped topple our financial system, threw the economy into the Great Recession, caused millions of jobs to evaporate, and made people swear up and down: never-ever again another housing bubble.
Steps in the Fed, and trillions of dollars get printed and handed to Wall Street, and asset prices become airborne, and Wall Street jumps into the housing market and buys up hundreds of thousands of vacant single-family homes, drives up prices, and armed with free money, shoves aside first-time buyers and others who would actually live in these homes, and turned them instead into rental units. Now in over 1,000 cities, prices are, or soon will be, as high as they were at the peak of the last housing bubble.
The difference? Last time, all that craziness was called a “bubble” with hindsight. This time, it’s called a “housing recovery.”
The result of this, as Zillow called it, “remarkable milestone”: real buyers who intend to live in these homes are falling by the wayside. Every week for months, mortgages to purchase homes have been between 10% and 15% below the same week in the prior year. In the latest week, they dropped 21%, the worst week I remember seeing. The number of refis has plunged even more, but that only ate into bank income statements and caused thousands of people to get laid off. Purchase mortgages, when they drop, decimate home sales.
Real Americans, rather than Wall Street, have been priced out of the housing market. Inflation has eaten into their wages. Many people can only find part-time work. Mortgage interest has risen from ridiculously low to just historically low [ Hot Air Hisses Out Of Housing Bubble 2.0: Even Two Middle-Class Incomes Aren’t Enough Anymore To Buy A Median Home].
So the rate of homeownership in the first quarter, after ticking up last year and triggering bouts of false hope, fell to 64.8%. The lowest level since 1995! It had peaked in Q2 2004 at 69.2%, a sign that even as the prior housing bubble was gaining steam, regular folks were already priced out of the market. This ugly trajectory is the face of the “housing recovery” sans Wall Street:
And now history has become a Fed-induced rerun. It started in six until recently white-hot housing markets in Arizona and California – Phoenix, Ventura, Riverside, L.A., Sacramento, and San Diego – where home prices have skyrocketed to the point where few people can afford them. Electronic real-estate broker Redfin, which covers 19 metro areas around the country, explained the impact of “the double whammy” – rising prices and mortgage rates – this way:
Someone who purchased a $350,000 home in Riverside in March 2013 with a 20 percent down payment and a 30-year fixed rate of 3.4% would have a monthly mortgage payment of $1,241. But with prices up 19.6%, the same home would now cost $418,600. At the current mortgage rate of 4.33%, the monthly mortgage payment on that home is now $1,663, a 34% jump from a year ago.
And even a year ago, a family with two median incomes had to stretch to buy that house. Now, in these six markets, sales are plunging and inventories of houses for sale are soaring. A deadly mix.
In Phoenix, inventories were up 42.7% in March from prior year, but sales were down 17.4%. So sellers slashed prices to get rid of these homes. In Phoenix, the hardest hit of the bunch, 45% of the sellers cut their prices. That’s how it starts. Haven’t we been there before? For instance, at the beginning of the prior housing-bubble implosion? This is what that debacle looks like:
It didn’t look quite this terrible in 11 of the other markets that Redfin tracks: Austin, Baltimore, Boston, Chicago, Long Island, Philadelphia, Portland, San Francisco, San Jose, Seattle, and Washington, D.C. (due to “data anomalies,” Denver and Las Vegas were not included). Sales were still down, but so were inventories. When the last housing bubble imploded, it didn’t happen all at once across the country. In some cities, home prices peaked in early 2006; in San Francisco, they peaked in November 2007.
And what happened to the Wall Street investors who whipped the market into frenzy by deploying the Fed’s free money? Soaring prices are “eroding investor profit potential,” Redfin points out, and many have pulled back. As of year-end 2013, the percentage of investor purchases in these six markets dropped to 10.6% from 15.6% a year earlier. And since then, they’ve dropped even more. Easy come, easy go.
“Housing affordability is really taking a bite out of the market,” is how the chief economist for the California Association of Realtors explained the March home sales fiasco. “We haven’t seen this issue since 2007.” And so, the benchmarks established during the terrible implosion of the prior housing bubble are suddenly reappearing.
California Dominates Top 10 Sellers’ Housing Markets
Source: Reverse Mortgage Daily
Five of the nation’s top 10 sellers’ markets are located in California, while all of the top buyers’ markets are located in Midwest and Eastern metros as the housing market increasingly becomes localized.
San Jose, San Francisco, Los Angeles, Riverside, and Sacramento are among the top sellers’ markets according to the February Zillow Real Estate Market Reports, accompanied by San Antonio, Seattle, Denver, D.C., and Dallas-Forth Worth.
It’s more of a buyer’s market on the other side of the country, where there’s less competition and more room for bargaining on prices in metros such as Cleveland, Philadelphia, Tampa, Chicago, and Pittsburgh.
“The real estate data in markets on both coasts are telling markedly different stories. Relatively strong job markets in the West are helping spur robust demand, which is being met with limited supply, causing rapid home value appreciation and giving sellers an edge,” said Zillow Chief Economist Dr. Stan Humphries. ”In the East, housing markets are appreciating a bit more slowly, and homes are staying on the market longer, which helps give buyers the upper hand.”
Buyers in sellers’ markets can expect tight inventory, more competition, and a greater sense of urgency, he continued.
Home values rose to $169,200 in February, Zillow’s Home Value Index indicates, up 5.6% year-over-year, and are expected to rise another 3% through next February. However, national home values stayed almost flat from January to February, while monthly and annual home value appreciation slowed to their lowest paces in months.
“As we put the housing recession further in the rear-view mirror, the broad-based dynamics that applied during those days, when all markets were reacting similarly to nationwide economic conditions, are fading,” Humphries said. “Real estate has always been local, and as the spring market gains momentum, this old adage will only become more pronounced.”

You must be logged in to post a comment.