Nick Gerli, in his interview with Wealthion, alludes to a number of figures which spell trouble for the residential market. If you own real estate or we’re considering entering the market soon, it’s worth checking out:
End of this cycle is neigh. Prepare you and yours now.
“In real terms, home prices have never been so high. My data goes back over 100 years, so this is something,” Nobel prize-winning economist Robert Shiller told CNBC’s “Trading Nation.”
Shiller is the co-founder of the S&P CoreLogic Case-Shiller home price index. He is worried about a housing bubble forming where the “Wild West” mentality pushes prices higher. He also is concerned about stocks and cryptocurrencies.
Glenn Kelman, CEO at Redfin, spoke with Bloomberg Radio’s Denise Pellegrini on Wednesday about the state of the US housing market. He said the latest surge in home prices could subside.
The Federal Reserve continued to increase its holdings of mortgage-backed securities by the tune of $40 billion per month, fueling a housing bubble with record-low mortgage rates and low inventory.
Even as the housing sector has more than recovered from the downturn, Chair Jerome Powell continues pedal to the metal with MBS purchases. According to the National Association of Realtors (NAR), this has resulted in the median price for a single-family home to soar the most on record in the first quarter.
Don’t worry, there’s no inflation – apart from in gas and home prices. According to AAA, gas prices at the pump are back near their highest in 6 years, up a stunning 42% YoY…
The housing boom unleashed by the Federal Reserve during the pandemic was built on historically low mortgage rates (thanks Powell), low inventory, city-dwellers moving to rural areas, and remote-work phenomenon. In the latest installment of the desperate frenzy of buyers fleeing for suburban life in California, one home received 122 offers in just two days.
San Francisco Bay Area & Seattle lead with biggest multi-month drops since 2012; San Diego, Denver, Portland, Los Angeles decline. Others have stalled. A few eke out records.
San Francisco and San Diego are catching the Seattle cold, and others are sniffling too, as the most splendid housing bubbles in America are starting to run into reality.
House prices in the Seattle metro dropped 0.6% in December from November, according toS&P CoreLogic Case-Shiller Home Price Index, released this morning, and have fallen 5.7% from the peak in June 2018, the biggest six-month drop since the six-month drop that ended in February 2012 as Housing Bust 1 was bottoming out. The index is now at the lowest level since February 2018. After the breath-taking spike into June, the index is still up 5.1% year-over-year, and is 27% higher than it had been at the peak of Seattle’s Housing Bubble 1 (July 2007):
So Seattle’s Housing Bubble 2 is unwinding, but more slowly than it had inflated. Many real estate boosters simply point at the year-over-year gain to say that nothing has happened so far — which makes it a picture-perfect “orderly decline.”
San Francisco Bay Area:
The Case-Shiller index for “San Francisco” includes five counties: San Francisco, San Mateo (northern part of Silicon Valley), Alameda, Contra Costa (both part of the East Bay ), and Marin (part of the North Bay). In December, the index for single-family houses fell 1.4% from November, the steepest month-to-month drop since January 2012. The index is now down 3% from its peak in July, the biggest five-month drop since March 2012.
Given the surge in early 2018, the index is still up 3.6% from a year ago and remains 37% above the peak of Housing Bubble 1, fitting into the theme of a perfect orderly decline:
Case-Shiller also has separate data for condo prices in the five-county San Francisco Bay Area, and this index fell 0.9% in December from November, after an blistering 2.4% drop in the prior month. From the peak in June 2018, the index has now dropped 4.2%, the steepest six-month drop since February 2012:
The Case-Shiller Home Price Index is a rolling three-month average; this morning’s release tracks closings that were entered into public records in October, November, and December. By definition, this causes the index to lag more immediate data, such as median prices, by several months.
The index is based on “sales pairs,” comparing the sales price of a house in the current month to the prior transaction of the same house years earlier (methodology). This frees the index from the issues that plague median prices and average prices — but it does not indicate prices.
It was set at 100 for January 2000; a value of 200 means prices as tracked by the index have doubled since the year 2000. Every index on this list of the most splendid housing bubbles in America, except Dallas and Atlanta, has more than doubled since 2000.
The index is a measure of inflation — of house-price inflation. It tracks how fast the dollar is losing purchasing power with regards to buying the same house over time.
So here are the remaining metros on this list of the most splendid housing bubbles in America.
San Diego:
House prices in the San Diego metro declined 0.7% in December from November and are now down 2.6% from the peak in July, the biggest five-month drop since March 2012, leaving the index at the lowest level since February 2018, and just one hair above the peak of Housing Bubble 1:
Los Angeles:
The Case-Shiller index for the Los Angeles metro was about flat in December with November but down 0.5% from the peak in August — don’t laugh, the largest four-month decline since March 2012. What this shows is just how relentless Housing Bubble 2 has been. The index is up 3.7% year-over-year:
Portland:
The Case-Shiller Index for the Portland metro inched down in December from November for the fifth month in a row and is now down 1.4% from the peak in July 2018. And that was the steepest five-month drop since March 2012. Year-over-year, the index was up 3.9%:
Denver:
House prices in the Denver metro edged down in December from November for the fourth month in a row, after an uninterrupted 33-month run of monthly increases. The four-month drop amounted to 0.9%, which, you guessed it, was the steeped such drop since March 2012. The index is at the lowest level since May 2018 but is still up 5.5% year-over-year:
Dallas-Fort Worth:
The Case-Shiller Index for the Dallas-Fort Worth metro in December ticked up by less than a rounding error to a new record, leaving it essentially flat for the seventh month in a row. The index is up 4.0% year-over-year:
Boston:
In the Boston metro, house prices dipped 0.5% in December from a record in November and are now back where they’d been in June. The Case-Shiller Index is up 5.3% from a year ago:
Atlanta:
The Case-Shiller Home Price Index for the Atlanta metro inched up a smidgen in December, to a new record, and is up 5.9% from a year ago:
New York City Condos:
The Case-Shiller index for condo prices in the New York City metro ticked down in December for the second month in a row after a mighty bounce in September and an uptick in October. This index can be volatile, but after all these bounces and declines, the index was up just 1.5% from a year ago, the smallest year-over-year price gain on this list of the most splendid housing bubbles in America:
On a national basis, these individual markets get averaged out with other markets that didn’t quite qualify for this list since their housing bubble status has not reached the ultimate splendidness yet. Some of those markets, such as the huge metro of Chicago, remain quite a bit below their Housing Bubble 1 peaks and are now declining, while others are shooting higher.
So the Case-Shiller National Home Price Index has been about flat since July, but is still up 4.7% year-over-year and is 11% higher than it had been at its prior peak in July 2006 during Housing Bubble 1:
It always boils down to this: Regardless of how thin you cut a slice of bologna, there are always two sides to it. When home prices drop after a housing bubble, there are many losers. But here are the winners – including a whole generation. Listen to my latest podcast, an 11-minute walk on the other side…
Enjoy reading WOLF STREET and want to support it? Using ad blockers – I totally get why – but want to support the site? You can donate “beer money.” I appreciate it immensely. Click on the beer mug to find out how:
Would you like to be notified via email when WOLF STREET publishes a new article?Sign up here.
Now that Housing Bubble #2 Is Bursting… How Low Will It Go?
Unless the Fed is going to start buying millions of homes outright, prices are going to fall to what buyers can afford.
There are two generalities that can be applied to all asset bubbles:
1. Bubbles inflate for longer and reach higher levels than most pre-bubble analysts expected
2. All bubbles burst, despite mantra-like claims that “this time it’s different”
The bubble burst tends to follow a symmetrical reversal of very similar time durations and magnitudes as the initial rise. If the bubble took four years to inflate and rose by X, the retrace tends to take about the same length of time and tends to retrace much or all of X.
If we look at the chart of the Case-Shiller Housing Index below, this symmetry is visible in Housing Bubble #1 which skyrocketed from 2003-2007 and burst from 2008-2012.
Housing Bubble #1 wasn’t allowed to fully retrace the bubble, as the Federal Reserve lowered interest rates to near-zero in 2009 and bought $1+ trillion in sketchy mortgage-backed securities (MBS), essentially turning America’s mortgage market into a branch of the central bank and federal agency guarantors of mortgages (Fannie and Freddie, VA, FHA).
These unprecedented measures stopped the bubble decline by instantly making millions of people who previously could not qualify for a privately originated mortgage qualified buyers. This vast expansion of the pool of buyers (expanded by a flood of buyers from China and other hot-money locales) drove sales and prices higher for six years (2012-2018).
As noted on the chart below, this suggests the bubble burst will likely run from 2019-2025, give or take a few quarters.
The question is: what’s the likely magnitude of the decline? Scenario 1 (blue line) is a symmetrical repeat of Housing Bubble #2: a retrace of the majority of the bubble’s rise but not 100%, which reverses off this somewhat higher base to start Housing Bubble #3.
Since the mainstream consensus denies the possibility that Housing Bubble #2 even exists (perish the thought that real estate prices could ever–gasp–drop), they most certainly deny the possibility that prices could retrace much of the gains since 2012.
More realistic analysts would probably agree that if the current slowdown (never say recession, it might cost you your job) gathers momentum, some decline in housing prices is possible. They would likely agree with Scenario 1 that any such decline would be modest and would simply set the stage for an even grander housing bubble #3.
But there is a good case for Scenario 2, in which price plummets below the 2012 lows and keeps on going, ultimately retracing the entire housing bubble gains from 2003.
Why is Scenario 2 not just possible but likely? There are no more “saves” in the Fed’s locker. Dropping interest rates to zero and buying another trillion in MBS won’t have the same positive effects they had in 2009-2018. Those policies have run their course.
Among independent analysts, Chris Hamilton is a must-read for his integration of demographics and economics. Please read (via Zero Hedge)Demographics, Debt, & Debasement: A Picture Of American Insolvencyif you want to understand why near-zero interest rates and buying mortgage-backed securities isn’t going to spark Housing Bubble #3.
Millennials are burdened with $1 trillion in student loans and most don’t earn enough to afford a home at today’s nosebleed prices. When the Fed drops the Fed Funds Rate to zero, it doesn’t follow that mortgage rates drop to zero. They drop a bit, but not enough to transform an unaffordable house into an affordable one.
Buying up $1 trillion in sketchy mortgages worked in 2009 because it bailed out everyone who was at risk of absorbing huge losses as a percentage of those mortgages defaulted. The problem now isn’t one of liquidity or iffy mortgages: it’s the generation that would like to buy homes finds they don’t earn enough, and their incomes are not secure enough, to gamble everything on an overpriced house that chains them to a local economy they might want to leave if opportunities arise elsewhere.
In other words, the economy has changed, and the sacrifices required to buy a house in hot markets at today’s prices make no sense. The picture changes, of course, in areas where 2X or 3X a typical income will buy a house, and 1X a pretty good income will buy a house.
Unless the Fed is going to start buying millions of homes outright, prices are going to fall to what buyers can afford. As China’s debt bubble implodes, the Chinese buyers with cash (probably not even cash, just money borrowed in China’s vast unregulated Shadow Banking System) who have propped up dozens of markets from France to Vancouver will vanish, leaving only the unwealthy as buyers.
The only question of any real interest is how low prices will drop by 2025. We’re so accustomed to being surprised on the upside that we’ve forgotten we can surprised on the downside as well.
(Ben Jones) A report from theOrange County Registerin California. “When 2018 started, the housing buzz was ‘where’s the supply?’ Now with the year almost complete, the industry now wonders ‘where did all the buyers go?’ Ponder that in housing-starved Southern California, builders have the largest standing supply of completed homes to sell in six years. Yes, newly constructed residences are a pricey niche that’s not for everyone. Still, the change of momentum is remarkable.”
“Housing tracker MetroStudy reports that at the end of the third quarter, 3,401 new homes were finished but unsold in the four-county region covered by the Southern California News Group. That’s up 428 homes in 12 months, or 14 percent, and was the highest inventory level since 2012’s second quarter.”
“But this year, house hunters have pulled back — for both new and existing residences. If you need a stark measurement of the buyer reluctance, look at this: CoreLogic reported Southern California home sales of all types in September suffered their largest year-over-year decline in nearly eight years.”
“It adds up to a situation where not too long ago local builders had many buyers waiting months for homes to be completed. Today, most housing projects offer new homes ready for immediate occupancy — with special pricing, no less.”
“Look at the market upheaval in Orange County. It’s got the region’s biggest boost in new-home supply, according to MetroStudy. As of Sept. 30, O.C. had 1,074 finished residences for sale, up 277 or 35 percent in a year. It’s O.C.’s largest new-home inventory in nearly 12 years.”
“Builders, faced with their own industry competition, also are up against homeowners in the region who rushed to list their homes. As that new-home supply swelled in the third quarter, Southern California owners averaged 35,333 listings, according to ReportsOnHousing. That’s 4,568 more existing homes on the market than a year earlier — or 10 times the growth of unsold new homes.”
“Yet this is an autumn period when many owners typically take homes off the market. Who knew that 2018 would be the year when house hunters had too many homes to choose from?”
FromCurbed Los Angeles. “The number of homes for sale in the Los Angeles area climbed more than 30 percent in October, according to Zillow. That suggests the region’s sky-high home prices could continue to fall, as they did in September.”
“During the month of October, inventory (the total number of houses and condos on the market) in Los Angeles and Orange counties jumped nearly 32 percent above levels recorded in October of last year. A bump in the number of homes available for sale often corresponds with falling prices, since sellers have more competition when listing their homes and are less likely to be overwhelmed with offers above asking price.”
“The spike in the number of homes available for purchase mirrors—and far exceeds—a nationwide trend. Across the country, inventory went up 3 percent since last year, marking the first yearly increase since 2014.”
“‘This is a phenomenon we’re seeing in several pricey markets throughout the country,’ says Zillow economist Aaron Terrazas. He points out that inventory has also risen by double digit percentages in San Francisco, Seattle, and San Jose.”
“Terrazas tells Curbed that much of the inventory growth in LA and other markets is driven by homes that take longer to sell, suggesting that buyers may be less willing to pay bloated prices.”
“‘This is a reflection of how poor affordability is in those areas,’ says Terrazas. ‘Buyers are starting to pull back a little bit from where they were a year ago.’”
Hong Kong homeowners who bought flats in the last several months have seen their value decline as much as 20% in a matter of recent weeks, according to HSBC, sending values into negative equity which had only left the region from the prior downturn that ended in early 2017, reports theSouth China Morning Post.
Hong Kong’s famously expensive property market has started to feel the strain lately from a fall in demand caused by rising interest rates, a struggling stock market and fears about the impact of the US-China trade war. Negative equity occurs when a home loan exceeds the market value of the property, and has not been seen in Hong Kong since early 2017. –SCMP
“Theoretically, buyers who obtained a mortgage of 90 per cent of the flat’s value will fall into negative equity once home prices have dropped more than 10 per cent,” said Chief Vice-President at mReferral Mortgage Brokerage Services, Sharmaine Lau.
The largest losses are likely to be flat owners who paid sky-high prices for tiny apartments in older tenements, according to industry watchers, who add that banks tend to become very conservative in valuing such properties when the real estate market takes a turn for the worse.
“Lower valuations will first apply to flats that have less marketability. Banks’ valuations, which are supported by surveyors, are made in line with market conditions,” said Cushman and Wakefield head of valuation and advisory services for the Asia-Pacific region, Chiu Kam-kuen.
Meanwhile, SCMP was able to find apartments at older housing developments which are now valued at HSBC far below their recent selling prices.
A 234 square foot unit at 36-year-old Lee Bo Building in Tuen Mun, which was sold for HK$3.82 million on October 8, is now valued 20 per cent lower at HK$3.08 million. In North Point, a 128 square foot unit at 41-year-old Yalford Building, sold on August 29 for HK$3.1 million, is also valued a fifth lower now by the bank, at HK$2.48 million.
In Kowloon, a 210 square foot unit at 34-year-old Hong Fai Building in Cheung Sha Wan sold for HK$3.87 million on June 20 is already down about 13 per cent, according to HSBC, at HK$3.38 million.
The spectre of negative equity is only going to get worse, according to Louis Chan, Asia-Pacific vice-chairman and chief executive for residential sales at Centaline Property.
“More homeowners will fall into negative equity next year as flat prices may decline by 10 per cent,” he said. –SCMP
The precipitous drop may force companies such as the Hong Kong Mortgage Corporation (HKMC) to adjust their mortgage insurance program in light of market developments.
Under the program, buyers of flats worth less than HK$4.5 million can get mortgage loans of up to 90 per cent of the unit’s value, capped at HK$3.6 million, while for flats priced between HK$4.5 million and HK$6 million the maximum loan-to-value ratio is 80 per cent, capped at HK$4.8 million.
In the first quarter of 2018, HKMC said 6,955 applicants secured HK$26.86 billion in home loans under the mortgage insurance program. In 2017, a total of HK$32.3 billion in mortgages were granted to 8,829 applicants, up from HK$24.6 billion of 7,145 successful in 2016. –SCMP
Negative equity reached its peak in Hong Kong in 2003 following an outbreak of Severe Acute Respiratory Syndrome (SARS) which sent already-teetering home values plummeting. According to the HKMA, over 105,000 households found themselves in negative equity at the time – all of which were above water as of the first quarter of last year.
Fannie Mae and Freddie Mac, the mortgage giants in seemingly perpertual conversatorship with the FHFA, have mortgage loans that are even more risky in terms of loan-to-value (LTV) ratios than during the catastrophic housing bubble of the 2000s.
The “good” news is that the average FICO (credit) score for Fannie and Freddie loan purchases is above those from the housing bubble. But the trend is worrisome.
In terms of Debt-to-income ratios (or Detes as Tom Haverford would say), the Detes are below housing bubble levels, but have been rising since the end of 2008.
The housing market indicated that a crisis was coming in 2008. Is the same thing happening once again in 2018?
For several years, the housing market has been one of the bright spots for the U.S. economy. Home prices, especially in the hottest markets on the east and west coasts, had been soaring. But now that has completely changed, and home sellers are cutting prices at a pace that we have not seen since the last recession. In case you are wondering, this is definitely a major red flag for the economy. According toCNBC, home sellers are “slashing prices at the highest rate in at least eight years”…
After three years of soaring home prices, the heat is coming off the U.S. housing market. Home sellers are slashing prices at the highest rate in at least eight years, especially in the West, where the price gains were hottest.
It is quite interesting that prices are being cut fastest in the markets that were once the hottest, because that is exactly what happened during the subprime mortgage meltdown in 2008 too.
According toRedfin, more than one out of every four homes for sale in America had a price drop within the most recent four week period…
In the four weeks ended Sept. 16, more than one-quarter of the homes listed for sale had a price drop, according to Redfin, a real estate brokerage. That is the highest level since the company began tracking the metric in 2010. Redfin defines a price drop as a reduction in the list price of more than 1 percent and less than 50 percent.
That is absolutely crazy.
I have never even heard of a number anywhere close to that in a 30 day period.
Of course the reason why prices are being dropped is because homes are not selling. The supply of homes available for saleis shooting up, and that is good news for buyers but really bad news for sellers.
It could be argued that home prices needed to come down because they had gotten ridiculously high in recent months, and I don’t think that there are too many people that would argue with that.
But is this just an “adjustment”, or is this the beginning of another crisis for the housing market?
Just like a decade ago, millions of American families have really stretched themselves financially to get into homes that they really can’t afford. If a new economic downturn results in large numbers of Americans losing their jobs, we are once again going to see mortgage defaults rise to stunning heights.
The general burden of the American worker is the daily task of squaring the difference between the booming economy reported by the government bureaus and the dreary economy reported in their biweekly paychecks. There is sound reason to believe that this task, this burden of the American worker, has been reduced to some sort of practical joke. An exhausting game of chase the wild goose.
How is it that the economy’s been growing for nearly a decade straight, but the average worker’s seen no meaningful increase in their income? Have workers really been sprinting in place this entire time? How did they end up in this ridiculous situation?
The fact is, for the American worker, America’s brand of a centrally planned economy doesn’t pay. The dual impediments of fake money and regulatory madness apply exactions which cannot be overcome. There are claims to the fruits of one’s labors long before they’ve been earned.
The economy, in other words, has been rigged. The value that workers produce flows to Washington and Wall Street, where it’s siphoned off and miss-allocated to the cadre of officials, cronies, and big bankers. What’s left is spent to merely keep the lights on, the car running, and food upon the table.
And unfortunately, things are likely to only go downhill from here.
[T]here came another folly of government intervention in 1930 transcending all the rest in significance. In a world staggering under a load of international debt which could be carried only if countries under pressure could produce goods and export them to their creditors, we, the great creditor nation of the world, with tariffs already far too high, raised our tariffs again. The Hawley-Smoot Tariff Act of June 1930 was the crowning folly of the who period from 1920 to 1933….
Protectionism ran wild all over the world. Markets were cut off. Trade lines were narrowed. Unemployment in the export industries all over the world grew with great rapidity, and the prices of export commodities, notably farm commodities in the United States, dropped with ominous rapidity….
The dangers of this measure were so well understood in financial circles that, up to the very last, the New York financial district retained hope the President Hoover would veto the tariff bill. But late on Sunday, June 15, it was announced that he would sign the bill. This was headline news Monday morning. The stock market broke twelve points in the New York Time averages that day and the industrials broke nearly twenty points. The market, not the President, was right.
Even though the stock markethas been booming, everything else appears to indicate that the U.S. economy is slowing down.
If home prices continue to fall precipitously, that is going to put even more pressure on the system, and it won’t be too long before we reach a breaking point.
We have a decidedly nuanced view ofReal Estate: Whilenot neccessarily a bubble, it has been the prime driver of the economy since rates were slashed to half century lows 3 years ago.
The early stages of a housing cycle are fun for pretty much everyone. Homeowners see their equity start to rise and feel smart for having bought, home seekers have to pay up, but not too much, and fully expect their new home to keep appreciating. People with modest incomes feel a bit of pinch but can still afford to stick around.
But later on the bad starts to outweigh the good. Existing homeowners still enjoy the ride but would-be buyers find themselves priced out of their top-choice neighborhoods. And residents who aren’t tech millionaires find that they can no longer afford to live where they work. Consider the plight of a teacher or cop pretty much anywhere in California these days:
Drew Barclay has a master’s degree in education and three years of experience as an English teacher, but, like most new teachers in Davis, he can’t afford to live there.
Instead, Barclay, 31, shares a rental in Sacramento that costs him $950 a month — about 40 percent of the $2,550 he brings home each month after taxes.
He is so certain that he won’t be able to qualify for a loan for a home in Davis on his $47,000 annual salary that he hasn’t bothered to house hunt. The median price for a house in the city in March was $682,500, according to tracking firm CoreLogic. Renting also is prohibitive, with the average rent in Davis about $2,500 a month, according to Zillow, a real estate website.
Davis Joint Unified officials hope to get a little help from state legislators. Last week, the state Senate voted 24-8 to waive the annual school district parcel tax of $620 for teachers and other employees of the Yolo County school district.
Davis school board member Alan Fernandes said that about two-thirds of the district’s teachers live outside Davis where housing is less expensive. He said the bill would encourage more of the district’s teachers to live in the community they serve.
Davis Joint Unified regularly passes parcel taxes to keep class sizes down and to support classroom programs. In 2016, 71 percent of Davis voters approved Measure H, a yearly tax of $620 on each parcel of taxable real property in the district for eight years. The measure raises $9.5 million a year to support math, reading and science programs and reduced class sizes for elementary grades.
But the roughly $50 a month exemption isn’t likely to help Davis Joint Unified teachers enough to make buying a house affordable. The teachers are some of the lowest-paid educators in the region, with some of the highest health care costs.
Barclay said he knows teachers 10 or 15 years older than he is who are renting rooms in other educators’ homes to get by. He said some teachers have weekend jobs to make enough money to pay their bills.
“Because I’m fairly certain I can’t put down permanent roots here, I don’t see this position as a permanent one,” Barclay said of his job as an English teacher at Davis Senior High School.
California school districts have responded by offering signing bonuses, housing stipends, computers and free tuition to educators who sign up with their districts.
When housing costs reach this point there’s no real fix. Raise taxes to increase teacher pay and there’s political trouble. Cut back on other services and the quality of life declines. “Streamline” the schools and educational outcomes and teacher morale plummet.
There’s a limit, in other words, to the ascent of home prices beyond which the system starts to break down. And when the people who make a town run smoothly – teachers, firefighters, cops, sanitation workers – can no longer afford to live there, that town has clearly crossed the line.
Based on the Case-Shiller home price index, which is now back to its 2007 housing bubble peak, there are a lot more Davis, CAs out there, with all the pathologies that that implies.
A housing bubble, of course, is just a symptom of a bigger problem. Easy money distorts the workings of a market economy by causing the prices of many assets to soar beyond all reason, enriching the owners and impoverishing the users. Typically, when housing reaches this point so have stocks and other financial assets,CEO salaries, corporate concentration, political corruption and a long list of other evils that feed on low interest rates and lax lending standards. The confluence of resulting problems then brings the cycle to a noisy end.
The housing market is starting to overheat. Again.
According to the latest BLS data, average hourly wages for all US workers in November rose at a relativelybrisk 2.7% relative to the previous year, if below the Fed’s “target” of 3.5-4.5% as countless economists are unable to explain how 4.1% unemployment, and “no slack” in the economy fails to boost wage growth. Another problem with tepid wage growth, in addition to crushing the Fed’s credibility, is that it keeps a lid on how much overall price levels can rise by, i.e. inflation. Meanwhile, with record global debt, it has been the Fed’s imperative to boost inflation at any cost to inflate away the debt overhang, however weak wages have made this impossible.
Well, not really.
Because a quick look at US housing shows that while wages may be growing at roughly 2.7%, according to thelatest Case Shiller data, 18 of 20 metro areas in the US saw home prices grow at a higher pace, while 16 of 20 major U.S. cities experienced home price growth of 5.4% or higher, double the average wage growth, and something which even the NAR has been complaining about with its chief economist Larry Yun warning that as the disconnect between prices and wages becomes wider, homes become increasingly unaffordable for most Americans.
Confirming the recent jump in home prices, at the national level in February home prices for the Top 20 metro areas soared 6.8% YoY according to Case Shiller, the fastest rate since June 2014…
… and hitting a new all time high nationwide.
And while this should not come as a surprise – considering we have pointed it out on numerous occasions in the past – one look at the chart below confirms that something very troubling is taking place in San Francisco, which has either become “Vancouver South” when it comes to Chinese hot money laundering, or the second housing bubble has finally arrived on the West Coast. And while according to Case-Shiller data, home prices in San Francisco rose “only” 10.1% Y/Y, a more accurate breakdown of San Fran housing prices fromParagon Real Estateindicates a record 24% annual increase in San Francisco home prices, which increased by $110,000 in just the past quarter.
Behold: a housing bubble…
Also worth keeping an eye on: price appreciation in Sin City has quietly surged in recent months, and in February home prices jumped 11.6% Y/Y, the highest annual increase in years. Considering Las Vegas was the epicenter of the last housing bubble when prices exploded higher only to crash, it may be a good idea to keep a close eye on price tendencies in this metro area for a broader confirmation of the second housing bubble, than just the microcosm that is San Francisco.
* * *
Meanwhile, for those looking to buy for the first time, conditions have never been worse. Growth in property values is outpacing wage gains and limiting affordability, representing a major headwind for first-time buyers, and the broader market.
Finally, putting the above data in context, here are twocharts courtesy of real-estate expert Mark Hanson, the first of which shows how much household income increase is needed to buy the median priced home in key US cities…
… while the next chart shows the divergence between actual household income, and the income needed to buy the median priced house.
This home on Plymouth Drive in Sunnyvale, Calif. recently set the highest price per square foot ever recorded by the Multiple Listing Service. The two bedroom, two bath home – 848 square feet in size – sold in two days for $2 million. It had been listed for $1.45 million. That means it sold for $2,358 per square foot, which is the highest price per square foot in Sunnyvale recorded by MLS Listings which has data going back to Jan. 1, 2000.
SUNNYVALE — The small, unassuming home in the Cherry Chase neighborhood was on the market just two days before it sold for $2 million, a whopping $550,000 over its asking price.]
In this red-hot real estate market, the price tag barely caused a stir. What did was the other number that turned the home into another Bay Area record-breaker: It sold for the highest square-foot price recorded in Sunnyvale — a stunning $2,358, according to MLSListings, which tracks homes sales going back to 2000.
The jaw-dropping price tag suggests Sunnyvale, which has traditionally been less expensive than neighboring cities Cupertino or Palo Alto, is becoming a real estate destination in itself.
“I was blown away by it,”Doug Larson of Coldwell Banker, the real estate agent who sold the home, said of the price it fetched.
There’s nothing particularly breathtaking about the modest, one-story house on quiet, tree-lined Plymouth Drive. But it sits nestled at the center of one of the country’s most expensive real estate markets. As prices continue to increase throughout the Bay Area,pushing out even some highly paid tech workers, experts say more residents are flocking to relatively affordable Sunnyvale, driving up prices there.
“It’s become the new hot market,” said Jim Harrison, president and CEO of MLSListings.
Homes in Sunnyvale sold for a median price of $1.57 million in January, according to Zillow. That’s affordable compared to neighboring Cupertino, with a median sale price of $2.2 million, or Palo Alto, with a median price of $3 million.
But it may not stay that way for long. So far this year, homes in Sunnyvale are selling for an average of 28 percent over their listed price and are spending just nine days on the market, Harrison said. A four-bedroom, two-bath, 2,000 square foot house in the city recentlysold for close to $800,000 over its listing price, fetching $2.47 million.
The Plymouth Drive house is small by comparison, just 848 square feet, which contributed to its high per-square-foot price. But it’s on a large lot — 6,000 square feet. That makes it a prime candidate for the new owner to tear it down and build something else, Harrison said.
Realtor Juliana Lee of Keller Williams, who represents the buyer of the Plymouth Drive home, declined to comment on behalf of herself and her client.
Listing photos of the home show a small, beige house with a huge backyard, hardwood floors and a large front window with white shutters. Before the sale, the most expensive per-square-foot price recorded in Sunnyvale was $2,175, according to MLSListings. That was for a 1,839-square-foot, two-bedroom home on a 36,155 square foot lot, which sold for $4 million.
Sunnyvale has become popular in part because of its proximity to Silicon Valley’s tech jobs, said realtor James Morris of James Morris Homes, which has offices in San Jose and Saratoga. LinkedIn is headquartered in the city, Apple is just next door in Cupertino, and Google is on the other side in Mountain View.
Millennials don’t want to endure long commutes on the Bay Area’s clogged freeways, Morris said.
“They will pay that premium to be close to their jobs and not have to drive,” he said.
When Larson put the Plymouth Drive house on the market on Feb. 7, he asked for $1.45 million and assumed his client would get about $1.6 million. The next day, he opened the house for a realtor tour so the community’s agents could check out the property and determine if it was something their clients might want. It generated a lot of interest, Larson said, with some agents indicating they had buyers willing to offer as much as $1.8 million.
Friday morning, a realtor called Larson and told him she was sending over an offer. Larson told her his client wasn’t accepting offers until the following Wednesday, but the persistent realtor refused to take no for an answer and sent her client’s offer that afternoon.
It was too tempting to pass up — $2 million, all cash, closing in 10 days. The seller was shocked.
“She said, ‘What?’” Larson said. “She was as taken aback as I was.”
Just after Wolf Richter reported on the minuscule 1.4% year-over-year growth of per-capita “real” disposable income and the lowest saving rate in 12 years —for the lucky ones— there’s another asset-bubble doozie: The S&P CoreLogic Case-Shiller National Home Price Index for November, released this morning, rose 6.2% year-over-year (not-seasonally-adjusted). The index has now surpassed by 6.1% what was afterwards called the crazy peak of Housing Bubble 1 in July 2006 and is up 46% from the bottom of Housing Bust 1:
Real estate prices are a result of local dynamics but are also impacted by national and global factors, including monetary policies and foreign non-resident investors trying to get their money out of harm’s way. This causes local housing bubbles, operating on their own schedules. When enough of them occur simultaneously, it becomes a national housing bubble. See chart above.
The Case-Shiller Index is based on a rolling three-month average; today’s release was for September, October, and November data. Instead of median prices, the index uses “home price sales pairs,” for example for a house that sold in 2010 and then again in 2017. The index provider incorporates other factors and uses algorithms to adjust the price movement into an index data point. The index was set at 100 for January 2000. An index value of 200 means prices as figured by the algorithm have doubled since then.
Here are the most magnificent leaders among the housing bubbles in major metro areas:
Boston:
The index for the Boston metro area edged down again on a monthly basis, the second decline in a row after 22 months in a row of increases. It has essentially been flat for four months but is still up 6.3% year-over-year. The slight monthly decline could be within the normal seasonal variations but there were no seasonal variations during the relentless surge in 2016 and 2015. During Housing Bubble 1, from January 2000 to October 2005, the index for Boston soared 82% before plunging. The index now exceeds the peak of Housing Bubble 1 by 12.5%:
Seattle:
The Case-Shiller home price index for the Seattle metro ticked up a smidgen on a month-to-month basis, after the first two back-to-back declines since the end of 2014! It has now been flat for the past five months. However, flat spots or slight declines in the index this time of the year were not unusual before 2015. The index is up 12.7% year-over-year, 20% from the peak of Housing Bubble 1 (July 2007), and 79% from the bottom of Housing Bust 1 in February 2011:
Denver:
The index for the Denver metro ticked up again on a monthly basis, the 25th increase in a row. It is up 7.0% year-over-year and has surged 45% above the prior peak in July 2006. Instead of the craziness of Housing Bubble 1, Denver experienced more “normal” home-price increases, and was therefore also spared the ravages of Housing Bust 1. But in 2012, Housing Bubble 2 erupted in full force:
Dallas-Fort Worth:
The index for the Dallas-Fort Worth metro ticked up again on a monthly basis — the 46th month in a row of increases. It is up 7.0% year-over-year and 43% from the prior peak in June 2007. Like Denver, Dallas experienced saner times during Housing Bubble 1. But prices began to surge relentlessly in 2012:
Atlanta:
The home price index for the Atlanta metro has now been flat (actually down a tiny bit) for three months in a row, in line with prior seasonal declines, but is still up 5.2% year-over-year and 2.6% above the peak of Housing Bubble 1 in July 2007. From that peak, the index plunged 37%. It’s now up 70% since February 2012:
Portland:
The Case-Shiller index for Portland was flat in November, and has now been flat or slightly down for five months in a row, and for now still in the range of normal seasonal patterns. The index is up 6.9% year-over-year and has skyrocketed 73% in five years. It’s 20% above the crazy peak of Housing Bubble 1 and has ballooned 123% since 2000:
San Francisco Bay Area:
The index for “San Francisco” covers the county of San Francisco plus four other Bay Area counties — Alameda, Contra Costa, Marin, and San Mateo (the northern part of Silicon Valley). It jumped 1.4% for the month, after jumping 1.2% in the prior month. It’s up 9.1% year-over-year, up 31.3% from the insane peak of Housing Bubble 1, and up 85% from the end of Housing Bust 1. The index has surged 151% since 2000:
Los Angeles:
Home prices in the Los Angeles metro, as tracked by the index, rose 0.7% for the month, and 7.0% year-over-year. LA’s Housing Bubble 1 was in a category of its own in its steepness on both sides, with home prices skyrocketing 174% from January 2000 to July 2006, before collapsing and surrendering much of the gains. The index has skyrocketed since Housing Bust 1 and is now within a smidgen of the prior insane peak:
New York City Condos:
Case-Shiller has a special index for New York City’s condo because this is such a vast market. And this index rose another notch in November and is up 4.4% year-over-year. The index soared 131% from 2000 to February 2006 during Housing Bubble 1, barely deflated during the bust before QE unleashed money from around the world which then re-floated Wall Street more than anything else. The index is 18% above the peak of Condo Bubble 1 and has nearly tripled over the past 17 years:
This is asset-price inflation at work — now that “homes” have become a global asset class. These homes didn’t get 50% bigger or 50% nicer over the past few years. Instead the purchasing power of the dollar with regards to these assets has been purposefully demolished by the Fed’s monetary policies that resulted in practically no wage inflation, moderate consumer price inflation, but massive asset-price inflation. Asset-price inflation without corresponding wage inflation means that the value of labor (wages earned) with regards to homes and other assets has been crushed — a phenomenon now hypocritically called the “affordability crisis” in many big urban areas in the US.
Following yesterday’sdisastrous drop in existing home sales(due to record low supply), new home sales plunged 9.3% MoM after November saw its biggest surge since Jan 1992, revised dramatically lower.
The November 17.5% spike was revised dramatically down to 15.0% spike – the highest since 1993 but December’s 9.3% plunge was already worse than the expected 7.9% giveback…
Biggest MoM drop since Aug 2016.
In fact the downward revisions are huge… October from 624K to 599K; November from 733K to 689K
As good as it gets?
While the blame is immediately laid on weather, the regional drops show that is simply not correct:
Purchases fell in all four U.S. regions, led by a 10 percent drop in the Midwest and a 9.8 percent slide in the South.
Median Home Prices reached a new record high…at $335,400
As Bloomberg notes, new-home sales, tabulated when contracts get signed, account for about 10 percent of the market. They’re considered a timelier barometer than purchases of previously owned homes, which are calculated when contracts close and are reported by the National Association of Realtors.
But the ongoing lack of supply remains the most notable aspect in the US housing ‘recovery’.
Alhambra’s Jeffrey Snider notescritically that it’s what’s going on underneath the headline that really matters (as always). The reluctance of Americans to sell their houses has become such a contradiction to the attempt to paint the housing market, and therefore the overall economic condition, as healthy, even robust. Prices are rising, in some places quickly. Yet, inventory of available-for-sale homes continues to decline, sharply once again in December.
It’s a glaring dichotomy that ever the NAR’s Chief Economist, Larry Yun, has been forcedto grudgingly address.
Existing sales concluded the year on a softer note, but they were guided higher these last 12 months by a multi-year streak of exceptional job growth, which ignited buyer demand. At the same time, market conditions were far from perfect. New listings struggled to keep up with what was sold very quickly, and buying became less affordable in a large swath of the country. These two factors ultimately muted what should have been a stronger sales pace.
It’s the “exceptional job growth” premise that leads toward only confusion. It’s one of those terms, like “globally synchronized growth” or “economic boom”, that refers quite differently to only the mainstream depiction of the economy, the one that has been consistently overoptimistic about things for a decade. The actual data suggests an entirely separate set of circumstances, which is where all this misunderstanding comes in.
In truth, falling inventory is quite easily explained, and in a way that is perfectly consistent with labor market and national (labor) income statistics as they are. The BLS outside of the unemployment rate, which, for the nth time doesn’t include Americans who would work if there was work, actually has been describing a consistently and persistently slowing labor market. The timing of where that started matches with where resale inventory began to contract.
There is actually a big difference between an average payroll gain of 150k and 250k; the latter is barely minimal, while the former is what panicked the Fed into launching QE3 in 2012. Last year was by every reasonable measure not even close to a good one for American workers.
The primary effect of sluggish, constrained payroll expansion, along with parallel effects in other labor factors, is weakened aggregate income. Even people who are working start to become uncertain or even fearful when the jobs market as a whole slows down – and not just slows, but continues to decelerate year after year (after year). This trend will be starting its fourth year. At that length, workers and prospective workers become quite certain about their general uncertainty.
If your ground-level view of the jobs environment and therefore economy is far more unsteady and dour than exceptional, you are not going to be as sure about selling your existing home to move up, taking on a larger monthly payment in the process. The more people like you who pass on the opportunity to cash in on higher prices, the more that says this is a widespread view quite different from the narrative established in consumer sentiment surveys and what news outlets write about in their headlines.
The economy is what actually happens, not what people think other people think Economists say is happening. Talk isn’t cheap, it’s wayovervalued.
A little over a year ago, home prices finally surpassed their prior all-time highs, reached during the heyday of the housing bubble back in 2006.
But with home prices in 80% of US cities are growing twice as fast as wages, working-class families across the US are finding it increasingly difficult to support their families – let alone afford a home. But fortunately, this hasn’t been a problem for institutional investors like Blackstone, which are presently enjoying the luxury of a controversial valuation assessment known as a Broker Price Opinion – or BPO.
As the Wall Street Journalexplains, Congress prohibited the use of BPOs to underpin traditional mortgages as part of Dodd-Frank. But, fortunately for private-equity firms and their limited partners, that prohibition doesn’t apply to investors buying tens of thousands of homes.
Blackstone and its lender, Deutsche Bank AG, settled on a sort of drive-by valuation done by real-estate agents that are more cursory and cost far less than traditional appraisals.
Congress outlawed the use of such assessments, called broker price opinions, or BPOs, to value properties for traditional mortgages. But the prohibition, enacted as part of postcrash financial regulation, doesn’t apply to investors buying tens of thousands of houses.
Now these perfunctory valuations abound, underpinning tens of billions of dollars of home deals. Sometimes the process is outsourced to India, where companies charge real-estate agents a few dollars to come up with U.S. home values by consulting Google Earth and real-estate websites.
That’s right: Shoddy satellite photos and workers at call centers in India – thousands of miles away from the homes they’re evaluating – are making up prices for homes that are then used to value collateral used in bond offerings. In fact, BPOs have been used to value collateral in the more than $20 billion of bonds sold by institutional landlord. They’re also thefast-growing business of lending to individual house flippers. Banks request them when considering whether to foreclose or negotiate repayment plans with delinquent homeowners.
Their popularity shows how Wall Street is finding ways to adapt to government efforts to crack down on some of the excesses that contributed to the housing crisis. Whileauthorities in Canada and Australiahave passed laws to curb speculation in their respective housing markets, US regulators have been unwilling to challenge BPOs – though the SEC is investigating whether certain rental-home companies used these shoddy valuations to distort the value of bonds tied to the deal. Critics say BPOs are ill-suited to gauge home values and could leave debt holders with less collateral than they thought.
So what are the risks, exactly? Well, inaccurate pricing information could result in abrupt and unexpected losses for investors when a more thorough appraisal is sought.
“BPOs are a creature of financial institutions that want deals to close fast, and so they don’t have to use an appraiser,” said Donald Epley, a retired University of South Alabama professor who helped write national appraisal standards after the 1980s savings-and-loan collapse. “You’re just dumbing down the standards to make the loan.”
Some credit rating firms have realized that these valuations aren’t reliable, and have stopped accepting them, or sought a second opinion.
When Fannie Mae last year guaranteed about $1 billion of Invitation Homes debt, it accepted BPOs for the 7,204 houses serving as collateral. Assuming a typical appraisal price of $450 and the $95 that Invitation Homes pays per BPO, the company saved about $2.6 million.
Credit-rating firms usually discount BPO values when grading rent-backed bonds. Kroll Bond Rating Agency has trimmed them by about 10% and uses the lower of the reduced BPOs and the amounts spent buying and renovating the homes.
“We’re never taking BPOs at face value,” said Kroll’s Daniel Tegen.
With many institutional investors expect, as Goldman Sachs put it, “a strong and synchronous global expansion” during the coming year, housing bears are difficult to come by. But Bloomberg managed to find one: James Stack, an investor who manages $1.3 billion for high net worth individuals, says that his “Housing Bubble Bellwether Barometer” is flashing red again. Stack predicted the housing crash back in 2005, just as home prices were reaching their peak.
His assessment of the market should send a chill down the spine of foreign investors who have poured money into New York City, San Francisco and other hot urban housing markets that have led the recovery in home valuations.
“It is 2005 all over again in terms of the valuation extreme, the psychological excess and the denial,” said Stack, whose fireproof files of newspaper articles on bear markets date back to 1929. “People don’t believe housing is in a bubble and don’t want to hear talk about prices being a little bit bubblish.”
Despite the torrid rally in home prices, Stack is one of the few real-estate market observers who foresee a sizable correction in prices. Indeed, as the vital spring selling season approaches, there are plenty of reasons for buyers to be optimistic – not the least of which is the “wealth effect” stemming from gains in equity prices. A backup in home building following the recession has left a paucity of inventory just as the housing needs of two generations – millennials who are buying their first homes and Baby Boomers who are downsizing in retirement – are shifting.
But there’s a structural mismatch between different tiers of the housing market that are poised to create problems for home builders.
There are plenty of reasons to be optimistic. The housing needs of two massive generations – millennials aging into home ownership and baby boomers getting ready for retirement – are expected to fuel demand for years to come if employment remains strong. Sales in master-planned communities, many of which target buyers who are at least 55, reached a record last year, according to John Burns Real Estate Consulting. Last month, a gauge of confidence from the National Association of Home Builders/Wells Fargo rose to the highest level in 18 years, and starts of single-family homes in November were the strongest in a decade.
“As soon as homes are finished, they’re flying off the shelf,” said Matthew Pointon, Capital Economics Ltd.’s U.S. property economist.
Home builders, which have focused on pricier homes since the market bottomed in 2012, are now getting ready for a wave of first-time buyers left with little to choose from on the existing-home market. Investors are rushing to builders of starter homes, because lower-priced homes in the U.S. are in the shortest supply. Shares of LGI Homes Inc., which targets renters with ads that trumpet monthly payments instead of prices, rose 161 percent last year. D.R. Horton Inc., the biggest builder, powered by its fast-selling Express entry-level brand, gained 87 percent.
Home builder stocks rallied 75% last year, outpacing the S&P 500’s best performance since the once-in-a-generation return in 2013. That gain made home builders one of the best-performing subsets of the market.
While demand for low-income homes remains robust, home builders have so far been fixated on housing stock for high-income earners – particularly in hot markets like San Francisco, New York City and Washington DC. Meanwhile, the SEC requested information in May from Radian Group about the BPO’s it provided for rent-backed bonds.
Of course, its premature to say that this will have any kind of tangible impact on the market. But it should certainly make investors think twice about valuations.
This is how monetary policies have crushed the value of labor.
For the good folks who hope fervently that the Fed doesn’t have reasons to raise rates or unwind QE because there isn’t enough inflation, here is an update on one aspect of inflation – asset price inflation, and particularly house price inflation – where the value of your hard-earned dollars has collapsed over a given number of years to where it takes a whole lot more dollars to pay for the same house.
So here are some visuals of amazing house price bubbles, city by city. Bubbles really aren’t hard to recognize, if you want to recognize them. What’s hard to predict accurately is when they will burst. Normally the Fed doesn’t want to acknowledge them. But now it has its eyes focused on them.
The S&P CoreLogic Case-Shiller National Home Price Index for June was released today. It jumped 5.8% year-over-year, not seasonally adjusted, once again outpacing growth in household incomes, as it has done for years. At 192.6, the index has surpassed by 5% the peak in May 2006 of crazy Housing Bubble 1, which everyone called “housing bubble” after it imploded (data viaFRED, St. Louis Fed):
The Case-Shiller Index is based on a rolling-three month average; today’s release was for April, May, and June data. Instead of median prices, it uses “home price sales pairs,” for example, a house sold in 2011 and then again in 2017. Algorithms adjust this price movement and add other factors. The index was set at 100 for January 2000. An index value of 200 means prices have doubled in the past 17 years, which is what most of the metros in this series have accomplished, or are close to accomplishing.
Real estate is local. Therefore real estate bubbles are local. If enough local bubbles balloon at the same time, it becomes a national housing bubble. As the above chart shows, the US national Housing Bubble 2 now exceeds the crazy levels of Housing Bubble 1, and in all ten major metro areas, home prices are setting new records.
In the Boston metro, the home price index is now 11% above the peak of Housing Bubble 1 (Nov 2005):
Home prices in the Seattle metro have spiked over the past year, pushing the index 20% above the peak of Housing Bubble 1 (Jul 2007):
Then there’s Denver’s very special house price bubble. The index has soared a stunning 43% above the peak of Housing Bubble 1 (Aug 2006):
People in the Dallas-Fort Worth metro felt left out during Housing Bubble 1, when prices rose only 13% in five years, while folks in other parts of the country were getting rich just sitting there. They also skipped much of the house price crash. But they know how to party when time comes. The index has now surged by 42% from the peak in June 2007:
The Atlanta metro, where home prices had plunged 36% after Housing Bubble 1, has now finally squeaked past the prior peak by 2%, with a near-perfect V-shaped bubble recovery:
Portland’s home prices have kicked butt since 2012, with the index soaring 71% in five years – not that homes were cheap in Portland in 2012. Portland’s house price bubble is now 20% above the peak of Housing Bubble 1:
The San Francisco Case-Shiller Index, which covers the five-county Bay Area and not just San Francisco, is now 10% above the insane peak of Housing Bubble 1. During the last housing crash, the index plunged 43%. Eight years of global monetary craziness has sent liquidity from around the world sloshing knee-deep through the streets, which has performed miracles:
Los Angeles home prices performed similar feat, doubling from 2002 to July 2006, before giving up two-thirds of those gains, then soaring once again. The index is now 3% above the peak of totally insane Housing Bubble 1:
New York City condo bubble never saw the crash in its full bloom. Prices are now 19% above the peak of the prior bubble (Feb. 2006). Over the past 15 years, the index has soared 112%:
While the monetary policies of the past eight years have had no impact on wage inflation in the US, and only moderate impact on consumer price inflation, they’ve been a rip-roaring success in creating asset price inflation.
Asset price inflation means that the dollar loses its value when it comes to buying assets. Wage earners, when they’re trying to buy assets today – not just homes but any type of asset, including buying into retirement plans – are finding out that their labor is buying only a fraction of the assets that their labor could buy eight years ago. This is how these monetary policies have crushed the value of labor.
A really long, long time ago, well before most of today’s wall street analysts made it through puberty, the entire international financial system almost collapsed courtesy of a mortgage lending bubble that allowed anyone with a pulse to finance over 100% of a home’s purchase price…with pretty much no questions asked.
And while the millennial titans of high finance today may consider a decade-old case study on mortgage finance to be about as useful as a Mark Twain novel when it comes to underwriting mortgage risk, they may want to considered at least taking a look at the ancient finance scrolls from 2009 before gleefully repeating the sins of their forefathers.
Alas, it may be too late. AsBlack Knight Financial Servicespoints out, down payments, the very thing that is supposed to deter rampant housing speculation by forcing buyers to have ‘skin in the game’, are once again disappearing from the mortgage market. In fact, just in the last 12 months, 1.5 million borrowers have purchased a home with less than 10% down, a 7-year high.
– Over the past 12 months, 1.5M borrowers have purchased a home by putting down less than 10 percent, which is close to a seven-year high in low down payment purchase volumes
– The increase is primarily a function of the overall growth in purchase lending, but, after nearly four consecutive years of declines, low down payment loans have ticked upwards in market share over the past 18 months
– Looking back historically, we see that half of all low down payment lending (less than 10 percent down) in 2005-2006 involved piggyback second liens rather than a single high LTV first lien mortgage
– The low down payment market share actually rose through 2010 as the GSEs and portfolio lenders pulled back, the PLS market dried up, and FHA lending buoyed the purchase market as a whole
– The FHA/VA share of purchase lending rose from less than 10 percent during 2005-2006 to nearly 50 percent in 2010
– As the market normalized and other lenders returned, the share of low-down payment lending declined consistent with a drop in the FHA/VA share of the purchase market
On the bright side, at least Yellen’s interest rate bubble means that today’s housing speculators don’t even have to rely on introductory teaser rates to finance their McMansions...Yellen just artificially set the 30-year fixed rate at the 2007 ARM teaser rate…it’s just much easier this way.
“The increase is primarily a function of the overall growth in purchase lending, but, after nearly four consecutive years of declines, low down payment loans have ticked upward in market share over the past 18 months as well,” said Ben Graboske, executive vice president at Black Knight Data & Analytics, in a recent note. “In fact, they now account for nearly 40 percent of all purchase lending.”
At that time half of all low down payment loans being made involved second loans, commonly known as “piggyback loans,” but today’s mortgages are largely single, first liens, Graboske noted.
The loans of the past were also far riskier – mostly adjustable-rate mortgages, which, according to the Black Knight report, are virtually nonexistent among low down payment mortgages today. Instead, most are fixed rate. Credit scores of borrowers taking out these loans today are also about 50 points higher than those between 2004 and 2007.
Finally, on another bright note, tax payers are just taking all the risk upfront this time around…no sense letting the banks take the risk while pretending that taxpayers aren’t on the hook for their poor decisions…again, it’s just easier this way.
The pending home sales index, an estimate of existing home sales, has accurately provided the direction of the monthly home resale reports.
The survey is down for the second month, providing further evidence of a housing slowdown.
TheEconodayconsensus estimate was for the index to rise 0.5%. Instead, the pending home sales index declined 1.3%.
“Spring sales data have not been favorable for the housing sector. Pending home sales are down for a second straight month, 1.3 percent lower in April to an index of 109.8 which is 3.3 percent below this time last year. This index tracks contract signings for resales and the results point to weakness for final sales in May and June. Final resales contracted in April as did new home sales while the month’s housing starts were also weak. Spring is the big season for housing and these are not the results of a sector that will be leading the 2017 economy.”
Pending home sales had been expected to rise slightly in April after declining 0.8 percent in March. Instead, the National Association of Realtors’® (NAR’s) Pending Home Sale Index (PHSI) slumped for the second straight month, dropping 1.3 percent. The PHSI, based on contracts signed for existing home purchases, fell from 111.3 (revised from 111.4) in March to 109.8.
The April dip put the Index 3.3 percent below its level in April 2016. This was the first year-over-year decline since last December and the largest since the Index fell 7.1 percent in June 2014.
Lawrence Yun, NAR chief economist, said the fading contract activity in the normally active spring market is due to significantly weak supply levels. These, in turn, are spurring deteriorating affordability conditions. “Much of the country for the second straight month saw a pullback in pending sales as the rate of new listings continues to lag the quicker pace of homes coming off the market,” he said. “Realtors are indicating that foot traffic is higher than a year ago, but it’s obviously not translating to more sales.”
Yun added, “Prospective buyers are feeling the double whammy this spring of inventory that’s down 9.0 percent from a year ago and price appreciation that’s much faster than any rise they’ve likely seen in their income.”
The economist sees little evidence that the record low levels of inventory will improve anytime soon. Homebuilding activity remains below the necessary levels and too few homeowners are listing their home for sale.
“The unloading of single-family homes purchased by real estate investors during the downturn for rental purposes would also go a long way in helping relieve these inventory shortages,” said Yun. “To date, there are no indications investors are ready to sell. However, they should be mindful of the fact that rental demand will soften as the overall population of young adults starts to shrink in roughly five years.”
NAR expects that existing home sales will increase about 3.5 percent from 2016 to 5.64 million units and the national median existing-home price is expected to increase around 5 percent. In 2016, existing sales increased 3.8 percent and prices rose 5.1 percent.
The decline of sales was nearly nationwide in scope and all four regions are now running lower index numbers than the previous April. The West was the only region enjoying a month-over-main gain. The PHSI in the Northeast decreased 1.7 percent to an index of 97.2, now 0.6 percent lower than the previous April. In the Midwest, the index fell 4.7 percent to 104.4, a decline of 6.1 percent year-over-year.
Supply Issue?
In addition to the decline this month, the Pending Home Sales Index for March was revised lower, from -0.8 % to -0.9 %. The second quarter recovery thesis is dying on the vine.
Once again Yun blames supply. And once again Yun is wrong. If supply was triple and prices remained the same, sales would not be skyrocketing.
Of course, if supply tripled and sales did not soar, prices would drop. That is the real issue. Prices are above what buyers can afford to pay.
Although the number of resales is well below the bubble years, the median price isn’t.
Median Home Prices 1963-Present:
More Trapped Home Buyers:
New home sales are recorded at signing. Existing home sales are recorded at closing.
Thus, the March report has negative implications for April and May, while the April report has negative implications for resales in May and June.
Looking ahead, existing home buyers in the last two to three years overpaid. In some areas, notably California, home buyers overpaid dramatically.
Another round of trapped home buyers unable to sell their homes is right around the corner.
Two days agowe looked at the latest troubling developmentin US home price trends: a new bubble appears to be emerging in all the “usual suspect” places. As we noted on Thursday, “home prices in markets that bubbled over back in 2006/2007, like Las Vegas and San Francisco, got cut in half in 2009 but have since doubled again of their lows. Meanwhile, markets like Denver and Dallas that didn’t participate as much in the 2007 mania are now surging to all-time highs, with Dallas prices up 55% over the past 5 years.”
TheWall Street Journal addedthat some of the home buying behaviors of consumers, like paying prices well above appraisal values and waiving home inspections, are starting to be eerily reminiscent of 2006:
In some markets, bidding wars are breaking out. Agents said some buyers are kicking in extra cash when properties don’t appraise for the asking price, and some are waiving their right to home inspections.
“It can’t be sustained,” said David Berson, chief economist at Nationwide Insurance and a former chief economist at mortgage giant Fannie Mae, referring to the frenzied buying. “It can’t go on forever.”
Other signs of overexuberance have emerged, including surging levels of licensed Realtors all chasing a quick buck.
The number of licensed Realtors has jumped by nearly 25% since 2012, hitting a nine-year high in 2016 and sitting just 9% below the peak in 2006, according to real-estate consultant John Burns. In Denver, homes are selling briskly. The median number of days that homes spent on the market declined to eight in the first three months of the year from 61 in 2012, according to Redfin. Home prices rose 8.5% in Denver over the year ended in February, according to Case-Shiller.
Nicki Thompson, an agent in Denver, said she recently had a listing that was on the market for two weekends at $1.2 million and she received multiple all-cash offers above the listing price.
“It’s just crazy,” she said.
And for a practical example of just how crazy it truly is,take this renovated 2-bedroom, 1,948 sq. ft house first built in 1951 in the Eagle Rock section of Los Angeles, which was listed in mid-March for $699,000, was estimated by Redfin at $780,000, andsold yesterday for $980,888(more than $500/sq foot) and 40% above asking, just over a month after it was first listed.
In the 1960s-80s drums played on some of the most famous pop songs known (Good Vibrations, Mrs. Robinson, A Little Less Conversation, to name a few) were built in this garage in our beloved Eagle Rock. A. F. Blaemire and his wife, Kirsten, filled this home with music and creativity for decades, and now it’s ready for its next inspired owner! With freshly refinished hardwood floors and repainted interior, 5208 Monte Bonito is a blank canvas with great potential. The rooms are bright and spacious, including a downstairs recreation room perfect for a jam room, art studio, den (or all of the above!). The two-car garage has direct access to the house and an additional storage room. The back yard has plenty of space for entertaining and gardening – there is already an avocado tree, an orange tree, and a pitaya to get you started! Views of the Eagle Rock from the master bedroom, and sunset views from the front porch make this the ideal setting to call home.
Then again, maybe not.
So what do you get for just under a million in LA these days? Not much: two bedrooms, less than two bathrooms, a 2 car garage, a decorative fireplace, a rec room, and a 7,195 sq foot lot.
Here are some photos showing what a “million dollar house” looks like in the latest US housing bubble.
A recent poll found that two-thirds of metropolitan Vancouver residents believe “foreigners investing” is a main cause of high housing costs, and 70 per cent said the government should work to improve affordability.
One month ago, when describing the latest in an endless series of Vancouver real estate horror stories, in this case an abandoned, rotting home (which is currently listed for a modest$7.2 million), we explained the simple money-laundering dynamic involving Chinese “investors” as follows.
Chinese investors smuggle out millions in embezzled cash, hot money or perfectly legal funds, bypassing the $50,000/year limit in legal capital outflows.
They make “all cash” purchases, usually sight unseen, using third parties intermediaries to preserve their anonymity, or directly in person, in cities like Vancouver, New York, London or San Francisco.
The house becomes a new “Swiss bank account”, providing the promise of an anonymous store of value and retaining the cash equivalent value of the original capital outflow.
We also explained that hundreds if not thousands of Vancouver houses, have become a part of the new normal Swiss bank account: “a store of wealth to Chinese investors eager to park “hot money” outside of their native country, and bidding up any Canadian real estate they could get their hands on.”
This realization has now fully filtered down to the local population, and as the National Post writes in its latest troubling look at the “dark side” of Vancouver’s real estate market, it cites wholesaler Amanda who says that “Vancouver seems to be evolving from a residential city into almost like a lock box for money… but I have to live among the empty houses. I’m a resident, not just an investor.”
The Post article, however, is not about the use of Vancouver (or NYC, or SF, or London) real estate as the end target of China’s hot money outflows – by now most are aware what’s going on. It focuses, instead, on those who make the wholesale selling of Vancouver real estate to Chinese tycoons who are bidding up real estate in this western Canadian city to a point where virtually no domestic buyer can afford it, and specifically the job that unlicensed “wholesalers” do in spurring and accelerating what is currently the world’s biggest housing bubble.
A bubble which, the wholesalers themselves admit, will inevitably crash in spectacular fashion.
Vancouver’s real estate market has been very good to Amanda. She’s not a licensed realtor, but buying and selling property is her full-time job.
She started about eight years ago as an unlicensed “wholesaler” in Vancouver.
She would approach homeowners and make unsolicited offers for private cash deals. Amanda made a 10-per-cent fee on each purchase by immediately assigning the contract to a background investor. It is seen as the lowest job in property investment, but it is low risk and very profitable. Amanda has done so well that she now owns two homes in Vancouver and develops property in the U.S.
Unlicensed wholesaling is an illicit and predatory business that is quickly growing in Metro Vancouver because enforcement is virtually non-existent.
It’s similar to a tactic currently being examined by B.C. real estate authorities known as “assignment flipping,” which involves legally but secretly trading homes on paper to enrich realtors and circles of investors.
However, unlicensed wholesaling is completely unregulated. Amanda estimates hundreds of wholesalers are scouring Metro Vancouver’s never-hotter speculative market — not including the realtors who are secretly wholesaling for themselves.
Amanda decided to step away from the easy money for moral reasons.
She’s most concerned that wholesalers are targeting B.C.’s vulnerable seniors who don’t understand the value of their old homes. She is also worried about offshore money being laundered, and the resulting vacant homes.
Because wholesalers are unlicensed, they have no obligation to identify their background investors or reveal the source of funds to Canadian authorities who fight money laundering.
“Vancouver seems to be evolving from a residential city into almost like a lock box for money,” Amanda said. “But I have to live among the empty houses. I’m a resident, not just an investor.”
Amanda said she believes that unethical and ignorant investors are driving B.C.’s housing market at full speed towards a crash. For these reasons, and with the condition that we not use her real name, she came forward to reveal how wholesalers operate.
The calling cards of wholesalers — hand-written flyers offering homeowners “confidential” and “discreet” cash sales — started flooding west side Vancouver homes over the past 18 months. With the dramatic surge in home prices, wholesalers now are spreading into neighborhoods across Metro Vancouver and Vancouver Island.
In eight years Amanda has never seen the market hotter than it is right now, and her colleagues are urging her to start wholesaling again.
Notices offering cash for homes are the calling card of unlicensed wholesalers
“A lot of money is leaving China, so now every second day people are asking if I can go out and find places for them. They have tons of money,” Amanda said. “They are basically brokering business deals specifically for Chinese investors.”
She said the mechanics of wholesaling schemes work like this:
The investor behind the unlicensed broker targets a block, often with older homes, and gives the wholesaler cash in a legal trust.
The wholesaler persuades a homeowner to sell, offering immediate cash, no subjects, no home inspections, and savings on realtor fees.
While the wholesaler claims to represent one buyer, or in some cases to be the buyer, Amanda said three or four contract flippers are often already lined up, with an end-buyer from China who will eventually take title in most cases. These unlicensed broker deals appear to be illegal.
A veteran Vancouver realtor confirmed these types of deals. The realtors we spoke to have been asked by their brokerages not to comment to reporters, so we agreed to withhold their names.
“I work with some non-licensed flippers,” one said. “They walk on to the lawn of an older house, see the owner and yell, ‘We’re not realtors!’ The owner invites them in, thinks they’re saving a commission — which they are — and loses big-time on the actual sale. I’ve seen it first-hand.”
According to flyers obtained from across Metro Vancouver and interviews with homeowners who were solicited, wholesalers often say they have Chinese buyers willing to pay a premium for quick sales.
Homeowners in Richmond, Vancouver’s east and west sides, Surrey, Langley, Coquitlam, Burnaby, White Rock, Delta and North Vancouver confirmed such offers in interviews.
One resident of Vancouver’s west side Dunbar area said she was annoyed by wholesalers constantly soliciting her, and a man in Surrey said his elderly mother was bothered by wholesalers.
“A guy walked up and he offered $700,000 cash within a day, and he said I would save on the realtor fees,” said Zack Flegel, who lives near 119th Street and Scott Road in Delta.
“He also says he will give me $100,000 cash and move me into a $600,000 house. He said he has a bunch of properties. He was talking about my house like it was a trading card. We don’t have abandoned homes yet like Vancouver, but this is how it happens, right?”
After the offer is accepted, the wholesaler assigns the purchase contract to the investor for a 10-per-cent markup, Amanda said. But some wholesalers aren’t content with making $100,000 or more per sale.
“People were going in and offering, for example, an 80-year-old widow, she bought the house for $70,000 and it is now worth $800,000 and they were offering her $200,000,” Amanda said. “So they are making $300,000 or $400,000 (after assigning the contract).
“And you are socializing with other wholesalers, and it is hard to hear them say, ‘Oh this whole street is filled with seniors whose partners are dropping off like flies.’ Or, ‘They just want to get rid of it, they have no clue what their house is worth, and it’s the whole street.’”
Amanda said her father died recently. She pictured her mother being targeted by wholesalers and resolved never to play that role again.
“There are elements of this that are elder abuse, absolutely.”
In a recent story that deals with implications of rising property taxes rather than predatory real estate practices, the Financial Post reported that, especially in Vancouver and Toronto’s scorching markets, “it’s not uncommon for some Canadian seniors to be unaware of the value of their location.”
B.C.’s Superintendent of Real Estate, Carolyn Rogers, conceded the potential for elder abuse as reported by Amanda.
“We would welcome an opportunity to speak to (Amanda) and assuming she gives us the same information, we would open a file,” Rogers said. “The conditions in the Vancouver market right now present risks … and seniors could be an example of that.”
It is illegal for wholesalers to privately buy and sell property for investors without a licence, Rogers said. She said her officers have approached some wholesalers recently and asked them to become licensed or cease their activities.
A review of the superintendent’s website shows no enforcement orders, fines or consumer alerts filed in connection to unlicensed wholesalers making cash deals and flipping contracts.
Amanda said that over the past year she learned of new levels of “layering and complexity that I didn’t see five years ago” in wholesaling and assignment-clause flipping.
“Five years ago I didn’t see realtors wholesaling, and I didn’t see people calling me so that I would get them a property and not assign the property to them, but work as a ‘partner’ and I would attach a 10-per-cent fee.
“And then they would assign it to their boss and attach 10 per cent, and then that person’s boss would attach 10 per cent. I’ve been watching over the last month, and it has got astounding.”
Amanda said some wholesale deals involve only unlicensed brokers and pools of offshore cash organized informally, and some appear to involve realtors and brokerages hiding behind unlicensed wholesalers.
“I’ve seen it from the back end. We have friends in the British Properties and the realtor said he will buy their property for $2 million. And then six months later it was sold for $3.5 million. When I’m looking at that, it is a pretty clear wholesale deal.”
Darren Gibb, spokesman for Canada’s anti-money-laundering agency, FINTRAC, confirmed that unlicensed property buyers have no obligation to report the identity or sources of funds of the buyers they represent.
However, Gibb said, if realtors are involved in “assignment flipping” it is mandatory that they and unlicensed assistants make efforts to identify every assignment-clause buyer and their sources of funds.
Vancouver realtors confirmed that money laundering is a big concern in assignment-flipping deals, whether organized by an unlicensed wholesaler or a realtor.
“When you are a non-realtor broker you no longer have to play by any rules,” one Vancouver realtor said.
“There is a role for assignments, but nobody is asking where the money came from. We are creating vehicles for money laundering.”
“No person in their right mind wants to buy your house once, and sell it three more times in a small window of opportunity, unless they have a whole pool of people lined up trying to get their money out of the country. The higher the prices go, these vehicles to get money out of the country get bigger and bigger.”
NDP MLA David Eby and Green MLA Andrew Weaver commented that allegations of unlicensed brokers targeting seniors and participating in potential money-laundering schemes call for direct action from Victoria and independent investigation, because these concerns fall outside the jurisdiction of the B.C. Real Estate Council and its current ongoing review of real estate practices.
“It is very troubling to me,” Eby said, “that not only do we have a layer of real estate agents that are acting improperly and violating the rules, but there might be this additional layer who are not bound by any rule and have explicitly avoided becoming agents for that reason.
“This unscrupulous behavior is targeting seniors who need money for retirement. What kind of society is that?” Weaver said.
Mortgage delinquency rates are low as long as home prices are soaring since you can always sell the home and pay off the mortgage, or most of it, and losses for lenders are minimal. Nonbank lenders with complicated corporate structures backed by a mix of PE firms, hedge funds, debt, and IPO monies revel in it. Regulators close their eyes because no one loses money when home prices are soaring. The Fed talks about having “healed” the housing market. And the whole industry is happy.
The show is run by some experienced hands: former executives from Countrywide Financial, which exploded during the Financial Crisis and left behind one of the biggest craters related to mortgages and mortgage backed securities ever. Only this time, they’re even bigger.
PennyMac is the nation’s sixth largest mortgage lender and largest nonbank mortgage lender. Others in that elite club include AmeriHome Mortgage, Stearns Lending, and Impac Mortgage. The LA Times:
All are headquartered in Southern California, the epicenter of the last decade’s subprime lending industry. And all are run by former executives of Countrywide Financial, the once-giant mortgage lender that made tens of billions of dollars in risky loans that contributed to the 2008 financial crisis.
During their heyday in 2005, non-bank lenders, often targeting subprime borrowers, originated 31% of all home mortgages. Then it blew up. From 2009 through 2011, non-bank lenders originated about 10% of all mortgages. But then PE firms stormed into the housing market. In 2012, non-bank lenders originated over 20% of all mortgages, in 2013 nearly 30%, in 2014 about 42%. And it will likely be even higher this year.
That share surpasses the peak prior to the Financial Crisis.
As before the Financial Crisis, they dominate the riskiest end of the housing market, according to the LA Times: “this time, loans insured by the Federal Housing Administration, aimed at first-time and bad-credit buyers. Such lenders now control 64% of the market for FHA and similar Veterans Affairs loans, compared with 18% in 2010.”
Low down payments increase the risks for lenders. Low credit scores also increase risks for lenders. And they coagulate into a toxic mix with high home prices during housing bubbles, such as Housing Bubble 2, which is in full swing.
The FHA allows down payments to be as low as 3.5%, and credit scores to be as low as 580, hence “subprime” borrowers. And these borrowers in many parts of the country, particularly in California, are now paying sky-high prices for very basic homes.
When home prices drop and mortgage payments become a challenge for whatever reason, such as a layoff or a miscalculation from get-go, nothing stops that underwater subprime borrower from not making any more payments and instead living in the home for free until kicked out.
“Those are the loans that are going to default, and those are the defaults we are going to be arguing about 10 years from now,” predicted Wells Fargo CFO John Shrewsberry at a conference in September. “We are not going to do that again,” he said, in reference to Wells Fargo’s decision to stay out of this end of the business.
But when home prices are soaring, as in California, delinquencies are low and don’t matter. They only matter after the bubble bursts. Then prices are deflating and delinquencies are soaring. Last time this happened, it triggered the most majestic bailouts the world has ever seen.
The LA Times:
For now, regulators aren’t worried. Sandra Thompson, a deputy director of the Federal Housing Finance Agency, which oversees government-sponsored mortgage buyers Fannie Mae and Freddie Mac, said non-bank lenders play an important role.
“We want to make sure there is broad liquidity in the mortgage market,” she said. “It gives borrowers options.”
But another regulator isn’t so sanguine about the breakneck growth of these new non-bank lenders: Ginnie Mae, which guarantees FHA and VA loans that are packaged into structured mortgage backed securities, has requested funding for 33 additional regulators. It’s fretting that these non-bank lenders won’t have the reserves to cover any losses.
“Where’s the money going to come from?” wondered Ginnie Mae’s president, Ted Tozer. “We want to make sure everyone’s going to be there when the next downturn comes.”
But the money, like last time, may not be there.
PennyMac was founded in 2008 by former Countrywide executives, including Stanford Kurland, as the LA Times put it, “the second-in-command to Angelo Mozilo, the Countrywide founder who came to symbolize the excesses of the subprime mortgage boom.” Kurland is PennyMac’s Chairman and CEO. The company is backed by BlackRock and hedge fund Highfields Capital Management.
In September 2013, PennyMac went public at $18 a share. Shares closed on Monday at $16.23. It also consists of PennyMac Mortgage Investment Trust, a REIT that invests primarily in residential mortgages and mortgage-backed securities. It went public in 2009 with an IPO price of $20 a share. It closed at $16.64 a share. There are other intricacies.
According to the company, “PennyMac manages private investment funds,” while PennyMac Mortgage Investment Trust is “a tax-efficient vehicle for investing in mortgage-related assets and has a successful track record of raising and deploying cost-effective capital in mortgage-related investments.”
The LA Times describes it this way:
It has a corporate structure that might be difficult for regulators to grasp. The business is two separate-but-related publicly traded companies, one that originates and services mortgages, the other a real estate investment trust that buys mortgages.
And they’re big: PennyMac originated $37 billion in mortgages during the first nine months this year.
Then there’s AmeriHome. Founded in 1988, it was acquired by Aris Mortgage Holding in 2014 from Impac Mortgage Holdings, a lender that almost toppled under its Alt-A mortgages during the Financial Crisis. Aris then started doing business as AmeriHome. James Furash, head of Countrywide’s banking operation until 2007, is CEO of AmeriHome. Clustered under him are other Countrywide executives.
It gets more complicated, with a private equity angle. In 2014, Bermuda-based insurer Athene Holding, home to other Countrywide executives and majority-owned by PE firm Apollo Global Management, acquired a large stake in AmeriHome and announced that it would buy some of its structured mortgage backed securities, in order to chase yield in the Fed-designed zero-yield environment.
Among the hottest products the nonbank lenders now offer are, to use AmeriHomes’ words, “a wider array of non-Agency programs,” including adjustable rate mortgages (ARM), “Non-Agency 5/1 Hybrid ARMs with Interest Only options,” and “Alt-QM” mortgages.
“Alt-QM” stands for Alternative to Qualified Mortgages. They’re the new Alt-A mortgages that blew up so spectacularly, after having been considered low-risk. They might exceed debt guidelines. They might come with higher rates, adjustable rates, and interest-only payment periods. And these lenders chase after subprime borrowers who’ve been rejected by banks and think they have no other options.
Even Impac Mortgage, which had cleaned up its ways after the Financial Crisis, is now offering, among other goodies, these “Alt-QM” mortgages.
Yet as long as home prices continue to rise, nothing matters, not the volume of these mortgages originated by non-bank lenders, not the risks involved, not the share of subprime borrowers, and not the often ludicrously high prices of even basic homes. As in 2006, the mantra reigns that you can’t lose money in real estate – as long as prices rise.
The current housing boom has Dallas solidly in its grip. As in many cities around the US, prices are soaring, buyers are going nuts, sellers run the show, realtors are laughing all the way to the bank, and the media are having a field day. Nationwide, the median price of existing homes, at $236,400, as the National Association of Realtors sees it, is now 2.7% higher than it was even in July 2006, the insane peak of the crazy housing bubble that blew up with such spectacular results.
Housing Bubble 2 has bloomed into full magnificence: In many cities, the median price today is far higher, not just a little higher, than it was during the prior housing bubble, and excitement is once again palpable. Buy now, or miss out forever! A buying panic has set in.
And so the July edition of D Magazine – “Making Dallas Even Better,” is its motto – had this enticing cover, sent to me by David in Texas, titled, “The Great Dallas Land Rush”:
“Dallas Real Estate 2015: The Hottest Market Ever,” the subtitle says.
That’s true for many cities, including San Francisco. The “Boom Town,” as it’s now called, is where the housing market has gone completely out of whack, with a median condo price at $1.13 million and the median house price at $1.35 million. This entails some consequences [read… The San Francisco “Housing Crisis” Gets Ugly].
The fact that Housing Bubble 2 is now even more magnificent than the prior housing bubble, even while real incomes have stagnated or declined for all but the top earners, is another sign that the Fed, in its infinite wisdom, has succeeded elegantly in pumping up nearly all asset prices to achieve its “wealth effect.” And it continues to do so, come heck or high water. It has in this ingenious manner “healed” the housing market.
But despite the current “buying panic,” the soaring prices, and all the hoopla round them, there is a fly in the ointment: overall home ownership is plunging.
The home ownership rate dropped to 63.4% in the second quarter, not seasonally adjusted, according to a new report by the Census Bureau, down 1.3 percentage points from a year ago. The lowest since 1967!
Wolf Street
The process has been accelerating, instead of slowing down. The 1.2 percentage point plunge in 2014 was the largest annual drop in the history of the data series going back to 1965. And this year is on track to match this record: the drop over the first two quarters so far amounts to 0.6 percentage points. This accelerated drop in home ownership rates coincides with a sharp increase in home prices. Go figure.
The plunge in home ownership rates has spread across all age groups, but to differing degrees. Younger households have been hit the hardest. In the age group under 35, the home ownership rate in Q2 saw a slight uptick to 34.8%, from the dismal record low of 34.6% in the prior quarter. Either a feeble ray of hope or just one of the brief upticks, as in the past, to be succeeded by more down ticks on the way to lower lows.
This chart by the Economics and Strategy folks at National Bank Financial shows the different rates of home ownership by age group. The 35-year and under group is where the first-time buyers are concentrated; and they’re being sidelined, whether they have no interest in buying, or simply don’t make enough money to buy (represented by the sharply descending solid black line, left scale). Note how the oldest age group (dotted blue line, right scale) has recently started to cave as well:
Wolf Street
The bitter irony? In the same breath, the Census Bureau also reported that the rental vacancy rate dropped to 6.8%, from 7.5% a year ago, the lowest since 1985. America is turning into a country of renters.
This chart shows the dynamics between home ownership rates (black line, left scale) and rental vacancy rates (red line, right scale) over time: they essentially rise and dive together. It makes sense on an intuitive basis: as people abandon the idea of owning a home, they turn into renters, and the rental market tightens up, and vacancy rates decline.
Wolf Street
This too has been by design, it seems. Since 2012, private equity firms bought several hundred thousand vacant single-family homes in key markets, drove up prices in the process, and started to rent them out. Thousands of smaller investors have jumped into the fray, buying homes, driving up prices, and trying to rent them out. This explains the record median home price across the country, and the totally crazy price increases in some key markets, even as regular Americans are trying to figure out how to pay for a basic roof over their heads.
This has worked out well. By every measure, rents have jumped. According to the Census Bureau’s report, the median asking rent in the US rose 6.2% from a year ago, and 17.6% since 2011. So inflation bites. But the Fed is still desperately looking for signs of inflation and simply cannot find any.
And how much have incomes risen over these years to allow renters to meet these rising rents? OK, that was a rhetorical question. We already know what has been happening to incomes.
That’s what it always boils down to in the Fed’s salvation of the economy: people who can’t afford to pay the rising rents with their stagnant or declining incomes should borrow the money to make up the difference and then spend even more on consumer goods. After us, the deluge.
Examining the reasons to buy a house today may give us some idea where the housing market is heading in the future.
There are three reasons to buy a house:
Reason 1 – Utility
A house (any dwelling) is a shelter. It provides enjoyment, a home to raise one’s family, or just a place to watch that big screen TV. Utility is not quantifiable and it differs from household to household.
Reason 2 – Savings
If financed, a mortgage is a way of saving something every month until the mortgage is paid in full. If paid for, the savings come in the form of “owners’ equivalent rent”, which is what the census bureau uses to measure inflation in housing.
Reason 3 – Asset appreciation
At 5% appreciation per year, a $100k house today will be worth $412k in 30 years. Even a more modest 3% appreciation would result in better than a double.
Why Not to Buy a House Today
Based on the reasons above, it appears to be a slam dunk decision. Why would anyone not want to buy a house? There are three obstacles:
Obstacle 1 – Affordability
Housing, as a percentage of household income, is too expensive. A decade of ill-conceived government intervention and Federal Reserve accommodations prevented natural economic forces from driving house prices to equilibrium. As a result, not only is entry difficult, but many are struggling and are stuck in dire housing traps. Corelogic estimated that as of the 1st quarter of 2015, 10.2% of mortgages are still under water while 9.7 million households have less than 20% equity.
Obstacle 2 – High Risk
Say you are young couple that purchased a home two years ago, using minimal down financing. The wife is now pregnant and the husband has an excellent career opportunity in another city. The couple has insufficient savings and the house has not appreciated enough to facilitate a sale, which results in negative equity after selling expenses. The house can become a trap that diminishes a life time of income stream.
Obstacle 3 – “Dead zones”
Say you live in the middle of the country, in Kane County Illinois. For the privilege of living there, you pay 3% in property taxes. That is like adding 3% to a mortgage that never gets paid down. Your property would have to appreciate 3% per year just to break even. By the way, “appreciation” is unheard of in Kane County, good times or bad. There are many Kane Counties in the US. Real estate in these counties should be named something else and should not be co-mingled with other housing statistics. Employment is continuing to trend away from these areas. What is going to happen to real estate in these markets?
The Kane County court house: where real estate goes to vegetate
The factors listed above are nothing new. They provide some perspective as to where are are heading. Looking at each of the reasons and obstacles, they are all trending negatively.
The country is spending too much on housing, a luxury that is made possible by irresponsible Fed policies. 50% debt to income ratios are just insane and Ms. Yellen has the gall to call mortgage lending restrictive. Can we not see what is happening to Greece?
Mortgage backed securities held by the Federal Reserve System, a non-market central economic planning institution that is the chief instigator of house price inflation. Still growing, in spite of QE having officially ended – via Saint Louis Federal Reserve Research, click to enlarge.
Real estate is an investment that matures over time. The first few years are the toughest, until equity can be built up. With appreciation slowing, not to mention the possibility of depreciation, it is taking much longer to reach financial safety. The current base is weak, with too high a percentage of low equity and no equity ownership. The stress of a recession, or just a few years of a flat market, can impact the economy beyond expectations. The risks that might have been negligible once upon a time are much higher today. Many who purchased ten years ago are still living with the consequences of that ill-timed decision today.
By stepping back and looking at the big picture, we can see that real estate should be correcting and trending down. The reasons why our grandparents bought their homes have changed. Government intervention cannot last forever. It will change from accommodation to devastation, when they finally run out of ideas.
Conclusion
In summary, my working life had its origins in real estate and I am not trying to bite the hand that fed me. However, the reality is that the circumstances that prevailed when I entered the market are non-existent today. I seriously doubt that I would chose real estate as a career, or as an investment avenue, if I were starting over. As for buying a house, I would consider it more of a luxury as opposed to an investment, and one has to be prepared for the possibility of it being a depreciating asset, especially if one decides to move.
RealtyTrac’s Q1 2015 Zombie Foreclosure Report, found that as of the end of January 2015, 142,462 homes actively in the foreclosure process had been vacated by the homeowners prior to the bank repossessing the property, representing 25 percent of all active foreclosures.
The total number of zombie foreclosures was down 6 percent from a year ago, but the 25 percent share of total foreclosures represented by zombies was up from 21 percent a year ago.
“While the number of vacated zombie foreclosures is down from a year ago, they represent an increasing share of all foreclosures because they tend to be the problem cases still stuck in the pipeline,” said Daren Blomquist vice president at RealtyTrac. “Additionally, the states where overall foreclosure activity has been increasing over the past year — counter to the national trend — tend to be states with a longer foreclosure process more susceptible to the zombie problem.”
“In states with a bloated foreclosure process, the increase in zombie foreclosures is actually a good sign that banks and courts are finally moving forward with a resolution on these properties that may have been sitting in foreclosure limbo for years,” Blomquist continued. “In many markets there is plenty of demand from buyers and investors to snatch up these distressed properties as soon as they become available to purchase.”
Florida, New Jersey, New York have most zombie foreclosures
Despite a 35 percent decrease in zombie foreclosures compared to a year ago, Florida had the highest number of any state with 35,903 — down from 54,908 in the first quarter of 2014. Zombie foreclosures accounted for 26 percent of all foreclosures in Florida.
Zombie foreclosures increased 109 percent from a year ago in New Jersey, and the state posted the second highest total of any state with 17,983 — 23 percent of all properties in foreclosure.
New York zombie foreclosures increased 54 percent from a year ago to 16,777, the third highest state total and representing 19 percent of all residential properties in foreclosure.
Illinois had 9,358 zombie foreclosures at the end of January, down 40 percent from a year ago but still the fourth highest state total, while California had 7,370 zombie foreclosures at the end of January, up 24 percent from a year ago and the fifth highest state total.
“We are now in the final cycle of the foreclosure crisis cleanup, in which we are witnessing a large final wave of walkaways,” said Mark Hughes, Chief Operating Officer at First Team Real Estate, covering the Southern California market. “This has created an uptick in vacated or ‘zombie’ foreclosures and the intrinsic neighborhood issues most of them create.
“A much longer recovery, a largely veiled underemployment issue, and growing examples of faster bad debt forgiveness have most likely fueled this last wave of owners who have finally just walked away from their American dream,” Hughes added.
Other states among the top 10 for most zombie foreclosures were Ohio (7,360), Indiana (5,217), Pennsylvania (4,937), Maryland (3,363) and North Carolina (3,177).
“Rising home prices in Ohio are motivating lending servicers to commence foreclosure actions more quickly and with fewer workout options offered to delinquent homeowners, creating immediate vacancies earlier in the foreclosure process,” said Michael Mahon, executive vice president at HER Realtors, covering the Ohio housing markets of Cincinnati, Dayton and Columbus. “Delinquent homeowners need to understand how prices have increased in recent months, and how this increase in equity may provide positive options for them to avoid foreclosure.”
Metros with most zombie foreclosures: New York, Miami, Chicago, Tampa and Philadelphia. The greater New York metro area had by far the highest number of zombie foreclosures of any metropolitan statistical area nationwide, with 19,177 — 17 percent of all properties in foreclosure and up 73 percent from a year ago.
Zombie foreclosures decreased from a year ago in Miami, Chicago and Tampa, but the three metros still posted the second, third and fourth highest number of zombie foreclosures among metro areas nationwide: Miami had 9,580 zombie foreclosures,19 percent of all foreclosures but down 34 percent from a year ago; Chicago had 8,384 zombie foreclosures, 21 percent of all foreclosures but down 35 percent from a year ago; and Tampa had 7,838 zombie foreclosures, 34 percent of all foreclosures but down 25 percent from a year ago.
Zombie foreclosures increased 53 percent from a year ago in the Philadelphia metro area, giving it the fifth highest number of any metro nationwide in the first quarter of 2015. There were 7,554 zombie foreclosures in the Philadelphia metro area as of the end of January, 27 percent of all foreclosures.
Other metro areas among the top 10 for most zombie foreclosures were Orlando (3,718), Jacksonville, Florida (2,368), Los Angeles (2,074), Las Vegas (1,832), and Baltimore, Maryland (1,722).
Metros with highest share of zombie foreclosures: St. Louis, Portland, Las Vegas
Among metro areas with a population of 200,000 or more and at least 500 zombie foreclosures as of the end of January, those with the highest share of zombie foreclosures as a percentage of all foreclosures were St. Louis (51 percent), Portland (40 percent) and Las Vegas (36 percent).
Metros with biggest increase in zombie foreclosures: Atlantic City, Trenton, New York
Among metro areas with a population of 200,000 or more and at least 500 zombie foreclosures as of the end of January, those with the biggest year-over-year increase in zombie foreclosures were Atlantic City, New Jersey (up 133 percent), Trenton-Ewing, New Jersey (up 110 percent), and New York (up 73 percent).
Stephen Schwarzman, CEO and co-founder of Blackstone Group, the world’s largest private-equity firm with $290 billion in assets under management, made $690 million for 2014 via a mix of dividends, compensation, and fund payouts, according to a regulatory filing. A 50% raise from last year.
The PE firm’s subsidiary Invitation Homes, doped with nearly free money the Fed’s policies have made available to Wall Street, has become America’s number one mega-landlord in the span of three years by buying up 46,000 vacant single-family homes in 14 metro areas, initially at a rate of $100 million per week, now reduced to $35 million per week.
As of September 30, Invitation Homes had $8.7 billion worth of homes on its balance sheet, followed by American Homes 4 Rent ($5.5 billion), Colony Financial ($3.4 billion), and Waypoint ($2.6 billion). Those are the top four. Countless smaller investors also jumped into the fray. Together they scooped up several hundred thousand single-family houses.
A “bet on America,” is what Schwarzman called the splurge two years ago.
The bet was to buy vacant homes out of foreclosure, outbidding potential homeowners who’d actually live in them, but who were hobbled by their need for mortgages in cash-only auctions. The PE firms were initially focused only on a handful of cities. Each wave of these concentrated purchases ratcheted up the prices of all other homes through the multiplier effect.
Homeowners at the time loved it as the price of their home re-soared. The effect rippled across the country and added about $7 trillion to homeowners’ wealth since 2011, doubling equity to $14 trillion.
But it pulled the rug out from under first-time buyers. Now, only the ludicrously low Fed-engineered interest rates allow regular people – the lucky ones – to buy a home at all. The rest are renting, in a world where rents are ballooning and wages are stagnating.
Thanks to the ratchet effect, whereby each PE firm helped drive up prices for the others, the top four landlords booked a 23% gain on equity so far, with Invitation Homes alone showing $523 million in gains, according to RealtyTrac. The “bet on America” has been an awesome ride.
But now what? PE firms need to exit their investments. It’s their business model. With home prices in certain markets exceeding the crazy bubble prices of 2006, it’s a great time to cash out. RealtyTrac VP Daren Blomquist told American Banker that small batches of investor-owned properties have already started to show up in the listings, and some investors might be preparing for larger liquidations.
“It is a very big concern for real estate professionals,” he said. “They are asking what the impact will be if investors liquidate directly onto the market.”
But larger firms might not dump these houses on the market unless they have to. American Banker reported that Blackstone will likely cash out of Invitation Homes by spinning it off to the public, according to “bankers close to the Industry.”
After less than two years in this business, Ellington Management Group exited by selling its portfolio of 900 houses to American Homes 4 Rent for a 26% premium over cost, after giving up on its earlier idea of an IPO. In July, Beazer Pre-Owned Rental Homes had exited the business by selling its 1,300 houses to American Homes 4 Rent, at the time still flush with cash from its IPO a year earlier.
Such portfolio sales maintain the homes as rentals. But smaller firms are more likely to cash out by putting their houses on the market, Blomquist said. And they have already started the process.
Now the industry is fretting that liquidations by investors could unravel the easy Fed-engineered gains of the last few years. Sure, it would help first-time buyers and perhaps put a halt to the plunging home ownership rates in the US [The American Dream Dissipates at Record Pace].
But the industry wants prices to rise. Period.
When large landlords start putting thousands of homes up for sale, it could get messy. It would leave tenants scrambling to find alternatives, and some might get stranded. A forest of for-sale signs would re-pop up in the very neighborhoods that these landlords had targeted during the buying binge. Each wave of selling would have the reverse ratchet effect. And the industry’s dream of forever rising prices would be threatened.
“What kind of impact will these large investors have on our communities?” wondered Rep. Mark Takano, D-California, in an email to American Banker. He represents Riverside in the Inland Empire, east of Los Angeles. During the housing bust, home prices in the area plunged. But recently, they have re-soared to where Fitch now considers Riverside the third-most overvalued metropolitan area in the US. So Takano fretted that “large sell-offs by investors will weaken our housing recovery in the very same communities, like mine, that were decimated by the sub prime mortgage crisis.”
PE firms have tried to exit via IPOs – which kept these houses in the rental market.
Silver Bay Realty Trust went public in December 2012 at $18.50 a share. On Friday, shares closed at $16.16, down 12.6% from their IPO price.
American Residential Properties went public in May 2013 at $21 a share, a price not seen since. “Although people look at this as a new industry, there’s really nothing new about renting single-family homes,” CEO Stephen Schmitz told Bloomberg at the time. “What’s new is that it’s being aggregated, we’re introducing professional management and we’re raising institutional capital.” Shares closed at $17.34 on Friday, down 17.4% from their IPO price.
American Homes 4 Rent went public in August 2013 at $16 a share. On Friday, shares closed at $16.69, barely above their IPO price. These performances occurred during a euphoric stock market!
So exiting this “bet on America,” as Schwarzman had put it so eloquently, by selling overpriced shares to the public is getting complicated. No doubt, Blackstone, as omnipotent as it is, will be able to pull off the IPO of Invitation Homes, regardless of what kind of bath investors end up taking on it.
Lesser firms might not be so lucky. If they can’t find a buyer like American Homes 4 Rent that is publicly traded and doesn’t mind overpaying, they’ll have to exit by selling their houses into the market.
But there’s a difference between homeowners who live in their homes and investors: when homeowners sell, they usually buy another home to live in. Investors cash out of the market. This is what the industry dreads. Investors were quick to jump in and inflated prices. But if they liquidate their holdings at these high prices, regular folks might not materialize in large enough numbers to buy tens of thousands of perhaps run-down single-family homes. And then, getting out of the “bet on America” would turn into a real mess.
China has long frustrated the hard-landing watchers – or any-landing watchers, for that matter – who’ve diligently put two and two together and rationally expected to be right. They see the supply glut in housing, after years of malinvestment. They see that unoccupied homes are considered a highly leveraged investment that speculators own like others own stocks, whose prices soar forever, as if by state mandate, but that regular people can’t afford to live in.
Hard-landing watchers know this can’t go on forever. Given that housing adds 15% to China’s GDP, when this housing bubble pops, the hard-landing watchers will finally be right.
Home-price inflation in China peaked 13 months ago. Since then, it has been a tough slog.
Earlier this month, the housing news from China’s National Bureau of Statistics gave observers the willies once again. New home prices in January had dropped in 69 of 70 cities by an average of 5.1% from prior year, the largest drop in the new data series going back to 2011, and beating the prior record, December’s year-over-year decline of 4.3%. It was the fifth month in a row of annual home price declines, and the ninth month in a row of monthly declines, the longest series on record.
Even in prime cities like Beijing and Shanghai, home prices dropped at an accelerating rate from December, 3.2% and 4.2% respectively.
For second-hand residential buildings, house prices fell in 67 of 70 cities over the past 12 months, topped by Mudanjiang, where they plunged nearly 14%.
True to form, the stimulus machinery has been cranked up, with the People’s Bank of China cutting reserve requirements for major banks in January, after cutting its interest rate in November. A sign that it thinks the situation is getting urgent.
So how bad is this housing bust – if this is what it turns out to be – compared to the housing bust in the US that was one of the triggers in the Global Financial Crisis?
Thomson Reuters overlaid the home price changes of the US housing bust with those of the Chinese housing bust, and found this:
The US entered recession around two years after house price inflation had peaked. After nine months of recession, Lehman Brothers collapsed. As our chart illustrates, house price inflation in China has slowed from its peak in January 2014 at least as rapidly as it did in the US.
Note the crashing orange line on the left: year-over-year home-price changes in China, out-crashing (declining at a steeper rate than) the home-price changes in the US at the time….
The hard-landing watchers are now wondering whether the Chinese stimulus machinery can actually accomplish anything at all, given that a tsunami of global stimulus – from negative interest rates to big bouts of QE – is already sloshing through the globalized system. And look what it is accomplishing: Stocks and bonds are soaring, commodities – a demand gauge – are crashing, and real economies are languishing.
Besides, they argue, propping up the value of unoccupied and often unfinished investment properties that most Chinese can’t even afford to live in might look good on paper, but it won’t solve the problem. And building even more of these units props up GDP nicely in the short term, and therefore it’s still being done on a massive scale, but it just makes the supply glut worse.
Sooner or later, the hard-landing watchers expect to be right. They know how to add two and two together. And they’re already smelling the sweet scent of being right this time, which, alas, they have smelled many times before.
But it does make you wonder what the China housing crash might trigger when it blooms into full maturity, considering the US housing crash helped trigger of the Global Financial Crisis. It might be a hard landing for more than just China. And ironically, it might occur during, despite, or because of the greatest stimulus wave the world has ever seen.
Stocks, of course, have been oblivious to all this and have been on a tear, not only in China, but just about everywhere except Greece. But what happens to highly valued stock markets when they collide with a recession? They crash.
What to Expect When This Stock Market Meets a Recession
Last week I had a fascinating conversation with Neile Wolfe, of Wells Fargo Advisors, LLC., about high equity valuations and what happens when they collide with a recession.
Here is my monthly update that shows the average of the four valuation indicators: Robert Shiller’s cyclically adjusted price-to-earnings ratio (CAPE), Ed Easterling’s Crestmont P/E, James Tobin’s Q Ratio, and my own monthly regression analysis of the S&P 500:
Based on the underlying data in the chart above, Neile made some cogent observations about the historical relationships between equity valuations, recessions and market prices:
High valuations lead to large stock market declines during recessions.
During secular bull markets, modest overvaluation does not produce large stock market declines.
During secular bear markets, modest overvaluation still produces large stock market declines.
Here is a table that highlights some of the key points. The rows are sorted by the valuation column.
Beginning with the market peak before the epic Crash of 1929, there have been fourteen recessions as defined by the National Bureau of Economic Research (NBER). The table above l ists the recessions, the recession lengths, the valuation (as documented in the chart illustration above), the peak-to-trough changes in market price and GDP. The market price is based on the S&P Composite, an academic splicing of the S&P 500, which dates from 1957 and the S&P 90 for the earlier years (more on that splice here).
I’ve included a row for our current valuation, through the end of January, to assist us in making an assessment of potential risk of a near-term recession. The valuation that preceded the Tech Bubble tops the list and was associated with a 49.1% decline in the S&P 500. The largest decline, of course, was associated with the 43-month recession that began in 1929.
Note: Our current market valuation puts us between the two.
Here’s an interesting calculation not included in the table: Of the nine market declines associated with recessions that started with valuations above the mean, the average decline was -42.8%. Of the four declines that began with valuations below the mean, the average was -19.9% (and that doesn’t factor in the 1945 outlier recession associated with a market gain).
What are the Implications of Overvaluation for Portfolio Management?
Neile and I discussed his thoughts on the data in this table with respect to portfolio management. I came away with some key implications:
The S&P 500 is likely to decline severely during the next recession, and future index returns over the next 7 to 10 years are likely to be low.
Given this scenario, over the next 7 to 10 years a buy and hold strategy may not meet the return assumptions that many investors have for their portfolio.
Asset allocation in general and tactical asset allocation specifically are going to be THE important determinant of portfolio return during this time frame. Just buying and holding the S&P 500 is likely be disappointing.
Some market commentators argue that high long-term valuations (e.g., Shiller’s CAPE) no longer matter because accounting standards have changed and the stock market is still going up. However, the impact of elevated valuations — when it really matters — is expressed when the business cycle peaks and the next recession rolls around. Elevated valuations do not take a toll on portfolios so long as the economy is in expansion.
How Long Can Periods of Overvaluations Last?
Equity markets can stay at lofty valuation levels for a very long time. Consider the chart posted above. There are 1369 months in the series with only 58 months of valuations more than two Standard Deviations (STD) above the mean. They are:
September 1929 (i.e., only one month above 2 STDs prior to the Crash of 1929)
Fifty-one months during the Tech bubble (that’s over FOUR YEARS)
Six of the last seven months have been above 2 STDs
If you bought or rented in 2014 a larger portion of your income went to housing. Rents and housing values are quickly outpacing any pathetic gains to be had with wages. With the stock market at a peak, talking heads are surprised when the public is still largely negative on the economy. Can it be that many younger adults are living at home or wages are stagnant? It can also be that our housing market is still largely operated as some feudal operation. Many lucrative deals were done with big banks and generous offers circumventing accounting rules. This works because many perceive they are temporarily embarrassed Trumps, only one flip away from being a millionaire. Why punish financial crimes when you will likely need those laws to protect your gains once you join the club? The radio talk shows are all trying to convince people to over leverage and buy a home because you know, this time is the last time ever to buy. Yet home sales are pathetic because people don’t have the wages to support current prices. So sales drop and many sellers pull properties off the market. You want to play, you have to pay today. Rents are also rising and this is where a large portion of household growth has occurred. 2015 will continue to see housing consume a large portion of income and will lead many into a new modern day serfdom.
The Gain Of 7 Million Rental Households
Over the last decade we have added 7 million renting households. Is this because of population growth? No. This trend was driven because of the boom and bust in the housing market. Investors crowded out regular home buyers in buying single family homes and now, we have millions of new renters out in the market. Many of these people are folks who lost their homes via foreclosure.
Take a look at the obvious jump in renters:
For better or worse, home ownership is a path to building equity. It is a forced saving account for many. Most Americans don’t even benefit from the stock market peaking because nearly half of the country doesn’t even own stocks. And many own only a small amount. Most Americans derive their net worth from their primary residence. With fewer buying and more renting, I doubt that on a full scale people are suddenly buying stocks for the long-term. But it is also the case that many are simply renting because that is all they can afford. Many young Americans have so much debt that this is all they can pay. Think of places like San Francisco where jobs pay well but rents are simply out of this world and home prices are nutty.
Rents More Stable Versus Wild Housing Prices
Thanks to low rates, generous tax structures, and the American Dream marketing machine home values are operating in a casino like environment. This wasn’t the case in previous generation but take a look at fluctuations in rents versus home prices:
A crazy year for rents is when rents go up over 4 percent year-over-year. For home values we routinely had year-over-year gains of 25 percent in the last 20 years (including the latest boom in 2013). Rents are driven by net income of local families. No funny leverage here. But with buying homes, you have investors chasing yields, or loans that allow tiny down payments for buyers but then tack on a massive 30 year mortgage with a monthly nut that seems reasonable but only because of a low interest rate. Some of these people have no retirement account yet take on a $600,000 or $800,000 mortgage without batting an eye. So what we find is this psychological shift where some that want to buy are convinced that they need to start at the bottom of the ladder and pay an enormous price tag just to get in. To move out of serfdom, you have to embrace the cult of Mega Debt.
Young Adults More Likely To Stay Close To Home – And Rent
Young adults are facing the biggest impact of the housing crunch. Many are living at home because they can’t even afford current rents. Those that do venture out, will likely rent as their first step. A recent survey found that many young adults are planning on staying local. Say you live with your baby boomer parents in Pasadena or San Francisco. You want to buy like they did but good luck. So many have their network within said community and will likely rent (or live with mom and dad deep into their 30s and 40s):
I found this data interesting. People are simply moving less from their home area. So this will create more demand for rentals in these markets. In California, we have 2.3 million adults living at home. Pent up demand? Unlikely. The main reason they are at home is because of financial constraints. These are people that can’t even afford a rental. I’m sure this trend is occurring in other higher priced metro areas as well.
Rental Income Soaring For Investors
Rental income has soared since the bust happened. The biggest winners? Those who bought properties to become the new feudal landlords. You can see by the below chart that there was a larger concerted effort to consolidate rental income beyond the mom and pop buyers of former years:
Serfdom is also occurring to many households buying. They are leveraging every penny into their mortgage payment. Think you own your place? Try missing a few payments and become part of the 7 million completed foreclosures since the crisis hit. 2014 simply saw more net income going into housing. Is this good? Not really since housing is a dud for the economy unless we have new construction being built but that is not happening on a large scale. 2015 will likely see this continuation of serfdom via renting or buying but at least you might save a few bucks with lower oil! The road to serfdom apparently runs through housing.
As the generational war heats up, we should all remember the source of all the bubbles and all the policies that could only result in generational poverty: The Federal Reserve.
Federal Reserve chair Janet Yellen recently treated the nation to an astonishing lecture on the solution to rising wealth inequality–according to Yellen, low-income households should save capital and buy assets such as stocks and housing.
It’s difficult to know which is more insulting: her oily sanctimony or her callous disregard for facts. What Yellen and the rest of the Fed Mafia have done is inflate bubbles in credit and assets that have made housing unaffordable to all but the wealthiest households.
Fed policy has been especially destructive to young households: not only is it difficult to save capital when your income is declining in real terms, housing has soared out of reach as the direct consequence of Fed policies.
Two charts reflect this reality. The first is of median household income, the second is the Case-Shiller Index of housing prices for the San Francisco Bay Area.
I have marked the wage chart with the actual price of a modest 900 square foot suburban house in the S.F. Bay Area whose price history mirrors the Case-Shiller Index, with one difference: this house (and many others) are actually worth more now than they were at the top of the national bubble in 2006-7.
But that is a mere quibble. The main point is that housing exploded from 3 times median income to 12 times median income as a direct result of Fed policies. Lowering interest rates doesn’t make assets any more affordable–it pushes them higher.
The only winners in the housing bubble are those who bought in 1998 or earlier. The extraordinary gains reaped since the late 1990s have not been available to younger households. The popping of the housing bubble did lower prices from nosebleed heights, but in most locales price did not return to 1996 levels.
As a multiple of real (inflation-adjusted) income, in many areas housing is more expensive than it was at the top of the 2006 bubble.
While Yellen and the rest of the Fed Mafia have been enormously successful in blowing bubbles that crash with devastating consequences, they failed to move the needle on household income. Median income has actually declined since 2000.
Inflating asset bubbles shovels unearned gains into the pockets of those who own assets prior to the bubble, but it inflates those assets out of reach of those who don’t own assets–for example, people who were too young to buy assets at pre-bubble prices.
Inflating housing out of reach of young households as a matter of Fed policy isn’t simply unjust–it’s cruel. Fed policies designed to goose asset valuations as a theater-of-the-absurd measure of “prosperity” overlooked that it is only the older generations who bought all these assets at pre-bubble prices who have gained.
In the good old days, a 20% down payment was standard. How long will it take a young family to save $130,000 for a $650,000 house? How much of their income will be squandered in interest and property taxes for the privilege of owning a bubblicious-priced house?
If we scrape away the toxic sludge of sanctimony and misrepresentation from Yellen’s absurd lecture, we divine her true message: if you want a house, make sure you’re born to rich parents who bought at pre-bubble prices.
As the generational war heats up, we should all remember the source of all the bubbles and all the policies that could only result in generational poverty: The Federal Reserve.
When it comes to housing, sometimes it seems we never learn. Just when America appeared to be recovering from the last housing crisis—the trigger, in many ways, for 2008’s grand financial meltdown and the beginning of a three-year recession—another one may be looming on the horizon.
There are at several big red flags.
For one, the housing market never truly recovered from the recession.TruliaChief Economist Jed Kolko points out that, while the third quarter of 2014 saw improvement in a number of housing key barometers, none have returned to normal, pre-recession levels. Existing home sales are now 80 percent of the way back to normal, while home prices are stuck at 75 percent back, remaining undervalued by 3.4 percent. More troubling, new construction is less than halfway (49 percent) back to normal. Kolko also notes that the fundamental building blocks of the economy, including employment levels, income and household formation, have also been slow to improve. “In this recovery, jobs and housing can’t get what they need from each other,” he writes.
Americans are spending more than 33 percent of their income on housing.
Second, Americans continue to overspend on housing. Even as the economy drags itself out of its recession, a spate of reports show that families are having a harder and harder time paying for housing. Part of the problem is that Americans continue to want more space in bigger homes, and not just in the suburbs but in urban areas, as well. Americans more than 33 percent of their income on housing in 2013, up nearly 13 percent from two decades ago, according to newly released data from the Bureau of Labor Statistics (BLS). The graph below plots the trend by age.
Over-spending on housing is far worse in some places than others; the housing market and its recovery remain highly uneven. Another BLS report released last month showed that households in Washington, D.C., spent nearly twice as much on housing ($17,603) as those in Cleveland, Ohio ($9,061). The chart below, from the BLS report, shows average annual expenses on housing related items:
(Bureau of Labor Statistics)
The result, of course, is that more and more American households, especially middle- and working-class people, are having a harder time affording housing. This is particularly the case in reviving urban centers, as more affluent, highly educated and creative-class workers snap up the best spaces, particularly those along convenient transit, pushing the service and working class further out.
Last but certainly not least, the rate of home ownership continues to fall, and dramatically. Home ownership has reached its lowest level in two decades—64.4 percent (as of the third quarter of 2014). Here’s the data, from the U.S. Census Bureau:
(Data from U.S. Census Bureau)
Home ownership currently hovers from the mid-50 to low-60 percent range in some of the most highly productive and innovative metros in this country—places like San Francisco, New York, and Los Angeles. This range seems “to provide the flexibility of rental and ownership options required for a fast-paced, rapidly changing knowledge economy. Widespread home ownership is no longer the key to a thriving economy,” I’ve written.
What we are going through is much more than a generational shift or simple lifestyle change. It’s a deep economic shift—I’ve called it the Great Reset. It entails a shift away from the economic system, population patterns and geographic layout of the old suburban growth model, which was deeply connected to old industrial economy, toward a new kind of denser, more urban growth more in line with today’s knowledge economy. We remain in the early stages of this reset. If history is any guide, the complete shift will take a generation or so.
It’s time to impose stricter underwriting standards and encourage the dense, mixed-use, more flexible housing options that the knowledge economy requires.
The upshot, as the Nobel Prize winner Edmund Phelpshas written, is that it is time for Americans to get over their house passion. The new knowledge economy requires we spend less on housing and cars, and more on education, human capital and innovation—exactly those inputs that fuel the new economic and social system.
But we’re not moving in that direction; in fact, we appear to be going the other way. This past weekend, Peter J. Wallison pointed out in a New York Times op-ed that federal regulators moved back off tougher mortgage-underwriting standards brought on by 2010’s Dodd-Frank Act and instead relaxed them. Regulators are hoping to encourage more home ownership, but they’re essentially recreating the conditions that led to 2008’s crash.
Wallison notes that this amounts to “underwriting the next housing crisis.” He’s right: It’s time to impose stricter underwriting standards and encourage the dense, mixed-use, more flexible housing options that the knowledge economy requires.
During the depression and after World War II, this country’s leaders pioneered a series of purposeful and ultimately game-changing polices that set in motion the old suburban growth model, helping propel the industrial economy and creating a middle class of workers and owners. Now that our economy has changed again, we need to do the same for the denser urban growth model, creating more flexible housing system that can help bolster today’s economy.
In a recent Wall Street Journal article, several couples across the country are quoted saying that instead of downsizing to a new home, they are choosing to live with their adult children.
This is what many families across the country are doing for both a “peace of mind” and for “higher property values.”
“For both domestic and foreign buyers, the hottest amenity in real estate these days is an in-law unit, an apartment carved out of an existing home or a stand-alone dwelling built on the homeowners’ property,” writes Katy McLaughlin of the WSJ. “While the adult children get the peace of mind of having mom and dad nearby, real-estate agents say the in-law accommodations are adding value to their homes.”
And how much more are these homes worth? In an analysis by Zillow, the homes with this type of living accommodations were priced about 60 percent higher than regular single-family homes.
Local builders are noticing the trend, too. Horsham based Toll Brothers are building more communities that include both large, single-family homes and smaller homes for empty nesters, the company’s chief marketing officer, Kira Sterling, told the WSJ.
Despite an improving job market and low interest rates, the share of first-time homebuyers fell to its lowest point in nearly three decades and is preventing a healthier housing market from reaching its full potential, according to an annual survey released by the National Association of Realtors (NAR). The survey additionally found that an overwhelming majority of buyers search for homes online and then purchase their home through a real estate agent.
The 2014 NAR Profile of Home Buyers and Sellers continues a long-running series of large national NAR surveys evaluating the demographics, preferences, motivations, plans and experiences of recent home buyers and sellers; the series dates back to 1981. Results are representative of owner-occupants and do not include investors or vacation homes.
The long-term average in this survey, dating back to 1981, shows that four out of 10 purchases are from first-time home buyers. In this year’s survey, the share of first-time home buyers dropped five percentage points from a year ago to 33 percent, representing the lowest share since 1987 (30 percent).
“Rising rents and repaying student loan debt makes saving for a down payment more difficult, especially for young adults who’ve experienced limited job prospects and flat wage growth since entering the workforce,” said Lawrence Yun, NAR chief economist. “Adding more bumps in the road, is that those finally in a position to buy have had to overcome low inventory levels in their price range, competition from investors, tight credit conditions and high mortgage insurance premiums.”
Yun added, “Stronger job growth should eventually support higher wages, but nearly half (47 percent) of first-time buyers in this year’s survey (43 percent in 2013) said the mortgage application and approval process was much more or somewhat more difficult than expected. Less stringent credit standards and mortgage insurance premiums commensurate with current buyer risk profiles are needed to boost first-time buyer participation, especially with interest rates likely rising in upcoming years.”
The household composition of buyers responding to the survey was mostly unchanged from a year ago. Sixty-five percent of buyers were married couples, 16 percent single women, nine percent single men and eight percent unmarried couples.
In 2009, 60 percent of buyers were married, 21 percent were single women, 10 percent single men and 8 percent unmarried couples. Thirteen percent of survey respondents were multi-generational households, including adult children, parents and/or grandparents.
The median age of first-time buyers was 31, unchanged from the last two years, and the median income was $68,300 ($67,400 in 2013). The typical first-time buyer purchased a 1,570 square-foot home costing $169,000, while the typical repeat buyer was 53 years old and earned $95,000. Repeat buyers purchased a median 2,030-square foot home costing $240,000.
When asked about the primary reason for purchasing, 53 percent of first-time buyers cited a desire to own a home of their own. For repeat buyers, 12 percent had a job-related move, 11 percent wanted a home in a better area, and another 10 percent said they wanted a larger home. Responses for other reasons were in the single digits.
According to the survey, 79 percent of recent buyers said their home is a good investment, and 40 percent believe it’s better than stocks.
Financing the purchase Nearly nine out of 10 buyers (88 percent) financed their purchase. Younger buyers were more likely to finance (97 percent) compared to buyers aged 65 years and older (64 percent). The median down payment ranged from six percent for first-time buyers to 13 percent for repeat buyers. Among 23 percent of first-time buyers who said saving for a down payment was difficult, more than half (57 percent) said student loans delayed saving, up from 54 percent a year ago.
In addition to tapping into their own savings (81 percent), first-time homebuyers used a variety of outside resources for their loan downpayment. Twenty-six percent received a gift from a friend or relative—most likely their parents—and six percent received a loan from a relative or friend. Ten percent of buyers sold stocks or bonds and tapped into a 401(k) fund.
Ninety-three percent of entry-level buyers chose a fixed-rate mortgage, with 35 percent financing their purchase with a low-down payment Federal Housing Administration-backed mortgage (39 percent in 2013), and nine percent using the Veterans Affairs loan program with no downpayment requirements.
“FHA premiums are too high in relation to default rates and have likely dissuaded some prospective first-time buyers from entering the market,” said Yun. “To put it in perspective, 56 percent of first-time buyers used a FHA loan in 2010. The current high mortgage insurance added to their monthly payment is likely causing some young adults to forgo taking out a loan.”
Buyers used a wide variety of resources in searching for a home, with the Internet (92 percent) and real estate agents (87 percent) leading the way. Other noteworthy results included mobile or tablet applications (50 percent), mobile or tablet search engines (48 percent), yard signs (48 percent) and open houses (44 percent).
According to NAR President Steve Brown, co-owner of Irongate, Inc., Realtors® in Dayton, Ohio, although more buyers used the Internet as the first step of their search than any other option (43 percent), the Internet hasn’t replaced the real estate agent’s role in a transaction.
“Ninety percent of home buyers who searched for homes online ended up purchasing their home through an agent,” Brown said. “In fact, buyers who used the Internet were more likely to purchase their home through an agent than those who didn’t (67 percent). Realtors are not only the source of online real estate data, they also use their unparalleled local market knowledge and resources to close the deal for buyers and sellers.”
When buyers were asked where they first learned about the home they purchased, 43 percent said the Internet (unchanged from last year, but up from 36 percent in 2009); 33 percent from a real estate agent; 9 percent a yard sign or open house; six percent from a friend, neighbor or relative; five percent from home builders; three percent directly from the seller; and one percent a print or newspaper ad.
Likely highlighting the low inventory levels seen earlier in 2014, buyers visited 10 homes and typically found the one they eventually purchased two weeks quicker than last year (10 weeks compared to 12 in 2013). Overall, 89 percent were satisfied with the buying process.
First-time home buyers plan to stay in their home for 10 years and repeat buyers plan to hold their property for 15 years; sellers in this year’s survey had been in their previous home for a median of 10 years.
The biggest factors influencing neighborhood choice were quality of the neighborhood (69 percent), convenience to jobs (52 percent), overall affordability of homes (47 percent), and convenience to family and friends (43 percent). Other factors with relatively high responses included convenience to shopping (31 percent), quality of the school district (30 percent), neighborhood design (28 percent) and convenience to entertainment or leisure activities (25 percent).
This year’s survey also highlighted the significant role transportation costs and “green” features have in the purchase decision process. Seventy percent of buyers said transportation costs were important, while 86 percent said heating and cooling costs were important. Over two-thirds said energy efficient appliances and lighting were important (68 and 66 percent, respectively).
Seventy-nine percent of respondents purchased a detached single-family home, eight percent a townhouse or row house, 8 percent a condo and six percent some other kind of housing. First-time home buyers were slightly more likely (10 percent) to purchase a townhouse or a condo than repeat buyers (seven percent). The typical home had three bedrooms and two bathrooms.
The majority of buyers surveyed purchased in a suburb or subdivision (50 percent). The remaining bought in a small town (20 percent), urban area (16 percent), rural area (11 percent) or resort/recreation area (three percent). Buyers’ median distance from their previous residence was 12 miles.
Characteristics of sellers The typical seller over the past year was 54 years old (53 in 2013; 46 in 2009), was married (74 percent), had a household income of $96,700, and was in their home for 10 years before selling—a new high for tenure in home. Seventeen percent of sellers wanted to sell earlier but were stalled because their home had been worth less than their mortgage (13 percent in 2013).
“Faster price appreciation this past year finally allowed more previously stuck homeowners with little or no equity the ability to sell after waiting the last few years,” Yun said.
Sellers realized a median equity gain of $30,100 ($25,000 in 2013)—a 17 percent increase (13 percent last year) over the original purchase price. Sellers who owned a home for one year to five years typically reported higher gains than those who owned a home for six to 10 years, underlining the price swings since the recession.
The median time on the market for recently sold homes dropped to four weeks in this year’s report compared to five weeks last year, indicating tight inventory in many local markets. Sellers moved a median distance of 20 miles and approximately 71 percent moved to a larger or comparably sized home.
A combined 60 percent of responding sellers found a real estate agent through a referral by a friend, neighbor or relative, or used their agent from a previous transaction. Eighty-three percent are likely to use the agent again or recommend to others.
For the past three years, 88 percent of sellers have sold with the assistance of an agent and only nine percent of sales have been for-sale-by-owner, or FSBO sales.
For-sale-by-owner transactions accounted for 9 percent of sales, unchanged from a year ago and matching the record lows set in 2010 and 2012; the record high was 20 percent in 1987. The share of homes sold without professional representation has trended lower since reaching a cyclical peak of 18 percent in 1997.
Factoring out private sales between parties who knew each other in advance, the actual number of homes sold on the open market without professional assistance was 5 percent. The most difficult tasks reported by FSBOs are getting the right price, selling within the length of time planned, preparing or fixing up the home for sale, and understanding and completing paperwork.
NAR mailed a 127-question survey in July 2014 using a random sample weighted to be representative of sales on a geographic basis. A total of 6,572 responses were received from primary residence buyers. After accounting for undeliverable questionnaires, the survey had an adjusted response rate of 9.4 percent. The recent home buyers had to have purchased a home between July of 2013 and June of 2014. Because of rounding and omissions for space, percentage distributions for some findings may not add up to 100 percent. All information is characteristic of the 12-month period ending in June 2014 with the exception of income data, which are for 2013.
The quintessential ingredient in the stew that makes up a thriving housing market has been evaporating in America. And a recent phenomenon has taken over: private equity firms, REITs, and other Wall-Street funded institutional investors have plowed the nearly free money the Fed has graciously made available to them since 2008 into tens of thousands of vacant single-family homes to rent them out. And an apartment building boom has offered alternatives too.
Since the Fed has done its handiwork, institutional investors have driven up home prices and pushed them out of reach for many first-time buyers, and these potential first-time buyers are now renting homes from investors instead. Given the high home prices, in many cases it may be a better deal. And apartments are often centrally located, rather than in some distant suburb, cutting transportation time and expenses, and allowing people to live where the urban excitement is. Millennials have figured it out too, as America is gradually converting to a country of renters.
So in its inexorable manner, home ownership has continued to slide in the third quarter, according to the Commerce Department. Seasonally adjusted, the rate dropped to 64.3% from 64.7 in the prior quarter. It was the lowest rate since Q4 1994 (not seasonally adjusted, the rate dropped to 64.4%, the lowest since Q1 1995).
This is what that relentless slide looks like:
Home ownership since 2008 dropped across all age groups. But the largest drops occurred in the youngest age groups. In the under-35 age group, where first-time buyers are typically concentrated, home ownership has plunged from 41.3% in 2008 to 36.0%; and in the 35-44 age group, from 66.7% to 59.1%, with a drop of over a full percentage point just in the last quarter – by far the steepest.
Home ownership, however, didn’t peak at the end of the last housing bubble just before the financial crisis, but in 2004 when it reached 69.2%. Already during the housing bubble, speculative buying drove prices beyond the reach of many potential buyers who were still clinging by their fingernails to the status of the American middle class … unless lenders pushed them into liar loans, a convenient solution many lenders perfected to an art.
It was during these early stages of the housing bubble that the concept of “home” transitioned from a place where people lived and thrived or fought with each other and dealt with onerous expenses and responsibilities to a highly leveraged asset for speculators inebriated with optimism, an asset to be flipped willy-nilly and laddered ad infinitum with endless amounts of cheaply borrowed money. And for some, including the Fed it seems, that has become the next American dream.
Despite low and skidding home ownership rates, home prices have been skyrocketing in recent years, and new home prices have reached ever more unaffordable all-time highs.
“Homes in more than 1,000 cities and towns nationwide either already are, or soon will be, more expensive than ever,” Zillow reported gleefully the other day. “National home values have climbed year-over-year for 21 consecutive months, a steady march upward….”
Glorious recovery. Our phenomenal housing bubble that, when it blew up spectacularly, helped topple our financial system, threw the economy into the Great Recession, caused millions of jobs to evaporate, and made people swear up and down: never-ever again another housing bubble.
Steps in the Fed, and trillions of dollars get printed and handed to Wall Street, and asset prices become airborne, and Wall Street jumps into the housing market and buys up hundreds of thousands of vacant single-family homes, drives up prices, and armed with free money, shoves aside first-time buyers and others who would actually live in these homes, and turned them instead into rental units. Now in over 1,000 cities, prices are, or soon will be, as high as they were at the peak of the last housing bubble.
The difference? Last time, all that craziness was called a “bubble” with hindsight. This time, it’s called a “housing recovery.”
The result of this, as Zillow called it, “remarkable milestone”: real buyers who intend to live in these homes are falling by the wayside. Every week for months, mortgages to purchase homes have been between 10% and 15% below the same week in the prior year. In the latest week, they dropped 21%, the worst week I remember seeing. The number of refis has plunged even more, but that only ate into bank income statements and caused thousands of people to get laid off. Purchase mortgages, when they drop, decimate home sales.
Real Americans, rather than Wall Street, have been priced out of the housing market. Inflation has eaten into their wages. Many people can only find part-time work. Mortgage interest has risen from ridiculously low to just historically low [ Hot Air Hisses Out Of Housing Bubble 2.0: Even Two Middle-Class Incomes Aren’t Enough Anymore To Buy A Median Home].
So the rate of homeownership in the first quarter, after ticking up last year and triggering bouts of false hope, fell to 64.8%. The lowest level since 1995! It had peaked in Q2 2004 at 69.2%, a sign that even as the prior housing bubble was gaining steam, regular folks were already priced out of the market. This ugly trajectory is the face of the “housing recovery” sans Wall Street:
And now history has become a Fed-induced rerun. It started in six until recently white-hot housing markets in Arizona and California – Phoenix, Ventura, Riverside, L.A., Sacramento, and San Diego – where home prices have skyrocketed to the point where few people can afford them. Electronic real-estate broker Redfin, which covers 19 metro areas around the country, explained the impact of “the double whammy” – rising prices and mortgage rates – this way:
Someone who purchased a $350,000 home in Riverside in March 2013 with a 20 percent down payment and a 30-year fixed rate of 3.4% would have a monthly mortgage payment of $1,241. But with prices up 19.6%, the same home would now cost $418,600. At the current mortgage rate of 4.33%, the monthly mortgage payment on that home is now $1,663, a 34% jump from a year ago.
And even a year ago, a family with two median incomes had to stretch to buy that house. Now, in these six markets, sales are plunging and inventories of houses for sale are soaring. A deadly mix.
In Phoenix, inventories were up 42.7% in March from prior year, but sales were down 17.4%. So sellers slashed prices to get rid of these homes. In Phoenix, the hardest hit of the bunch, 45% of the sellers cut their prices. That’s how it starts. Haven’t we been there before? For instance, at the beginning of the prior housing-bubble implosion? This is what that debacle looks like:
It didn’t look quite this terrible in 11 of the other markets that Redfin tracks: Austin, Baltimore, Boston, Chicago, Long Island, Philadelphia, Portland, San Francisco, San Jose, Seattle, and Washington, D.C. (due to “data anomalies,” Denver and Las Vegas were not included). Sales were still down, but so were inventories. When the last housing bubble imploded, it didn’t happen all at once across the country. In some cities, home prices peaked in early 2006; in San Francisco, they peaked in November 2007.
And what happened to the Wall Street investors who whipped the market into frenzy by deploying the Fed’s free money? Soaring prices are “eroding investor profit potential,” Redfin points out, and many have pulled back. As of year-end 2013, the percentage of investor purchases in these six markets dropped to 10.6% from 15.6% a year earlier. And since then, they’ve dropped even more. Easy come, easy go.
“Housing affordability is really taking a bite out of the market,” is how the chief economist for the California Association of Realtors explained the March home sales fiasco. “We haven’t seen this issue since 2007.” And so, the benchmarks established during the terrible implosion of the prior housing bubble are suddenly reappearing.


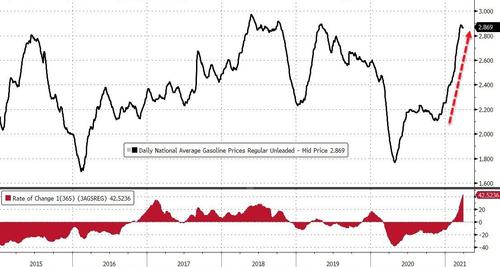
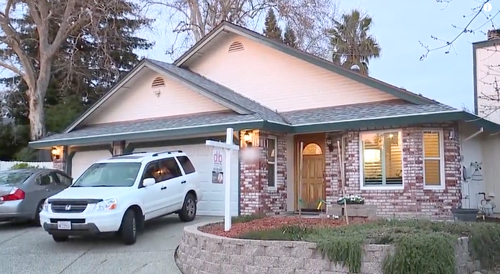
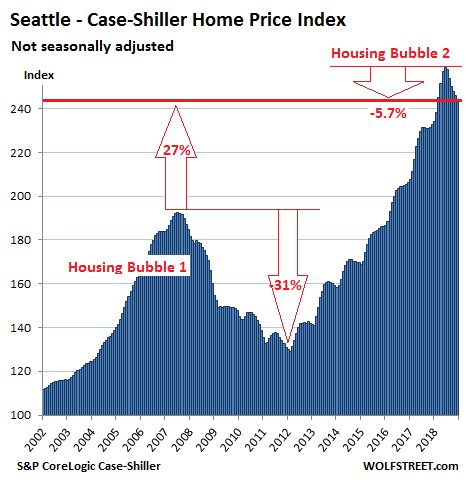
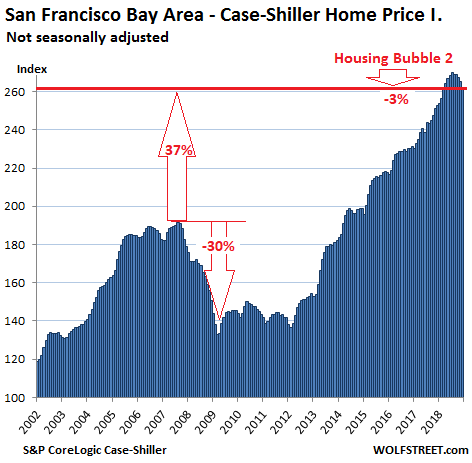
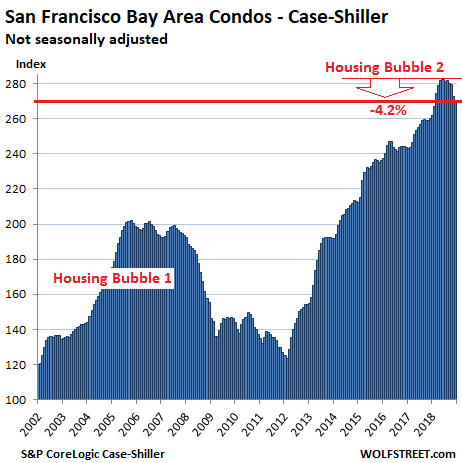
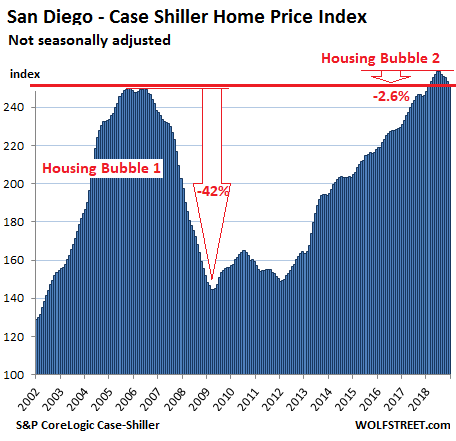
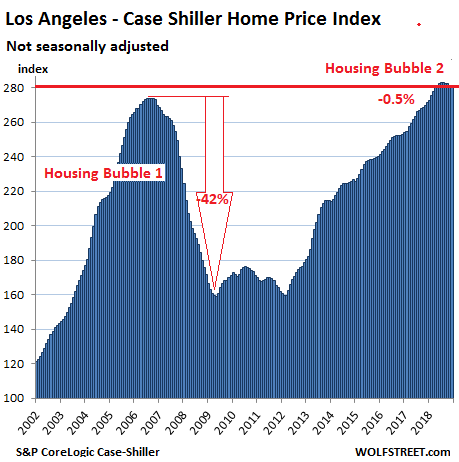
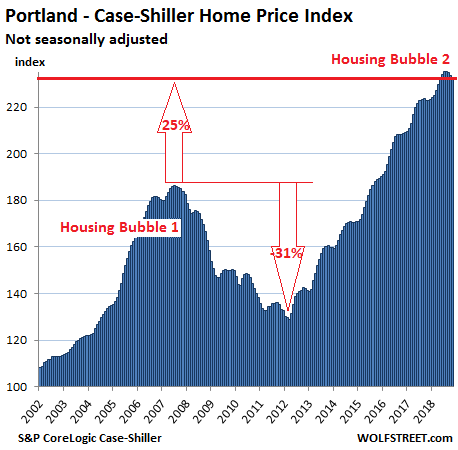
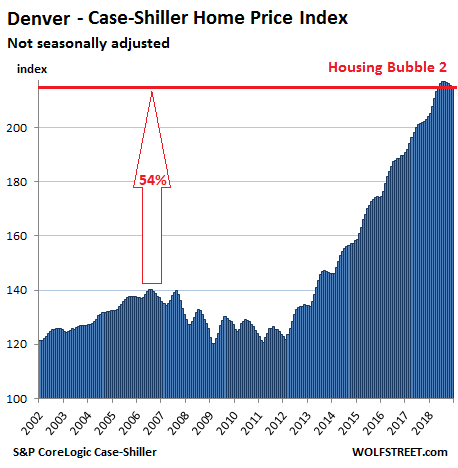
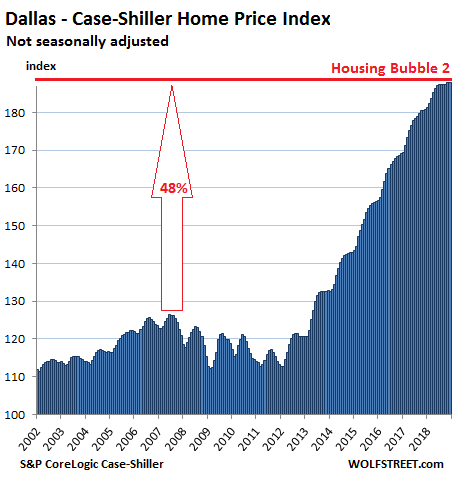
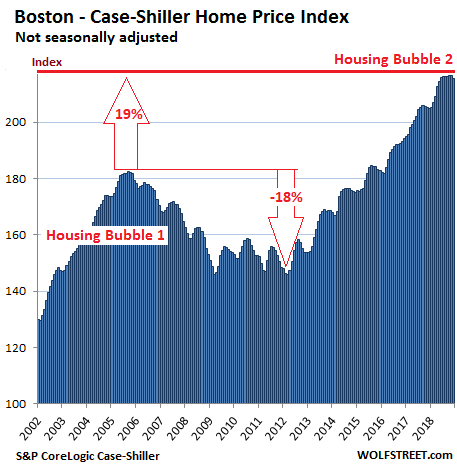
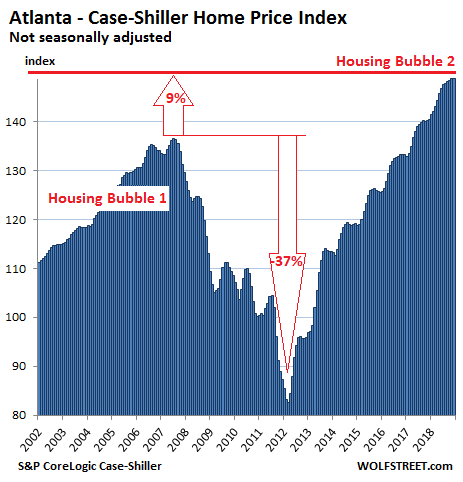
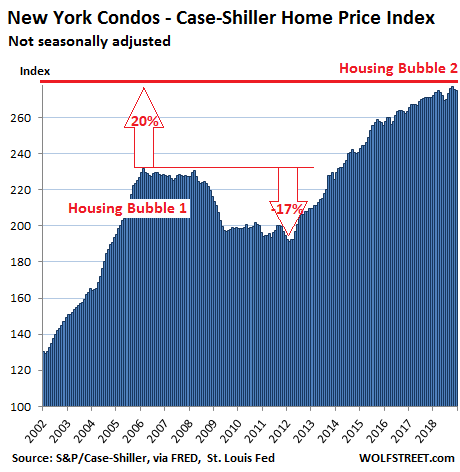
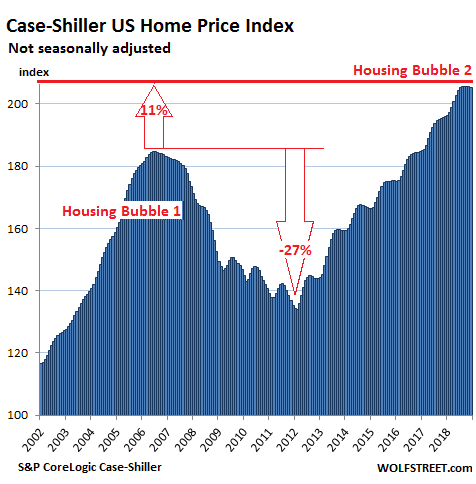

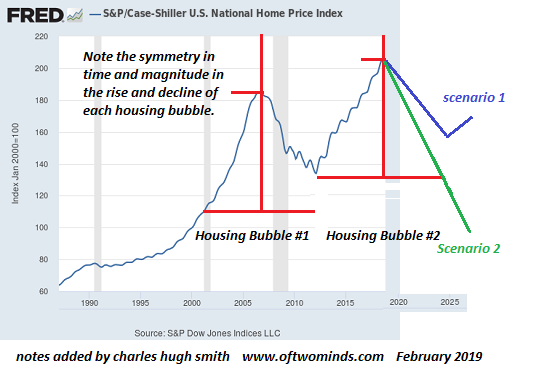
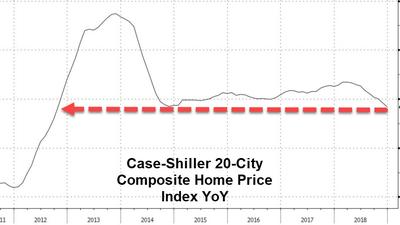
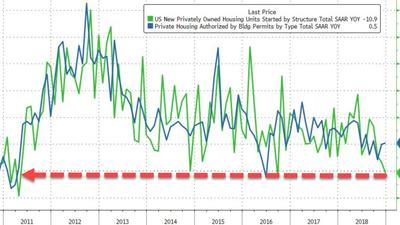

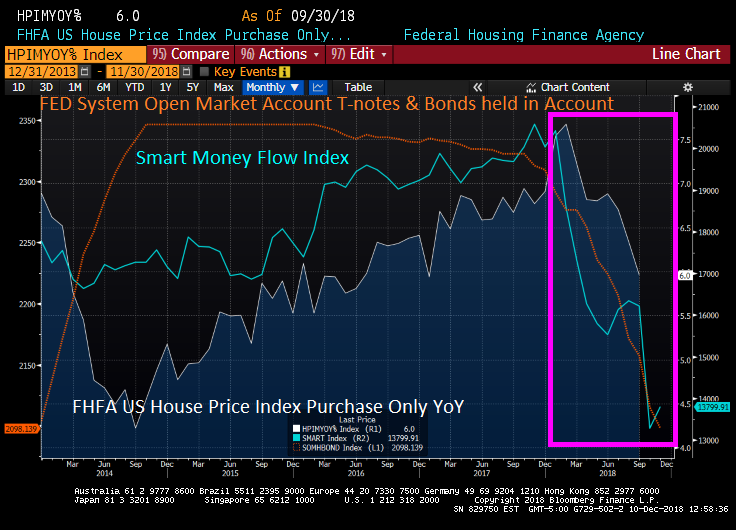


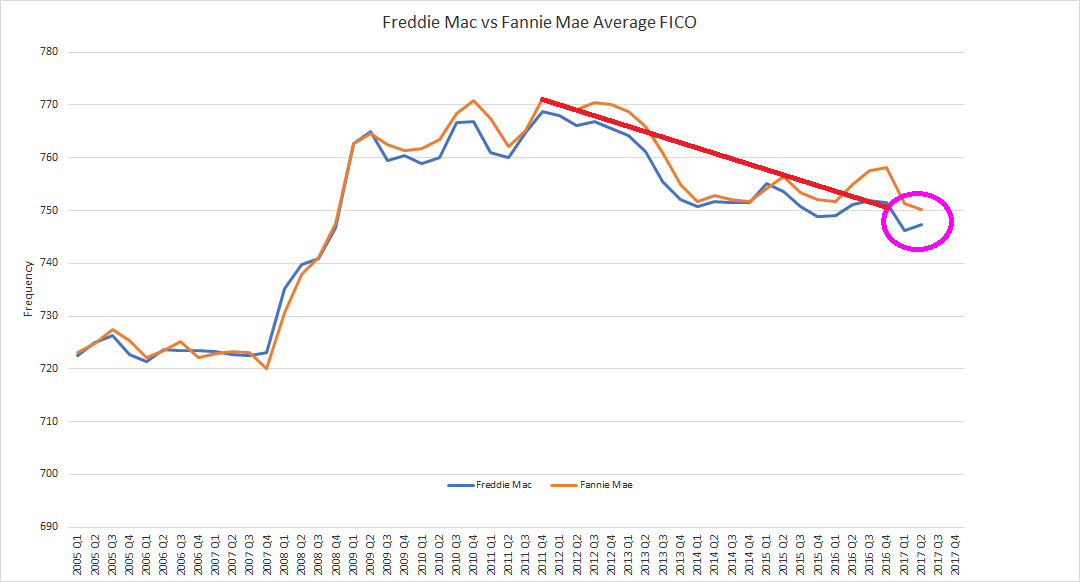


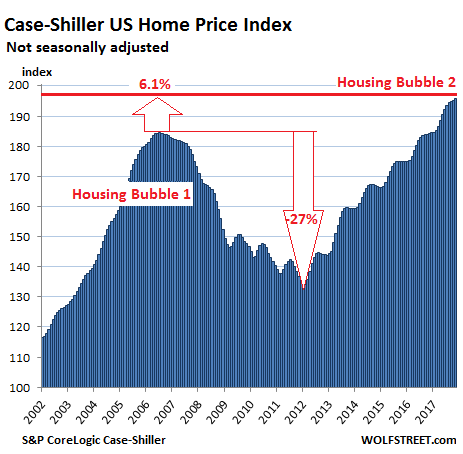
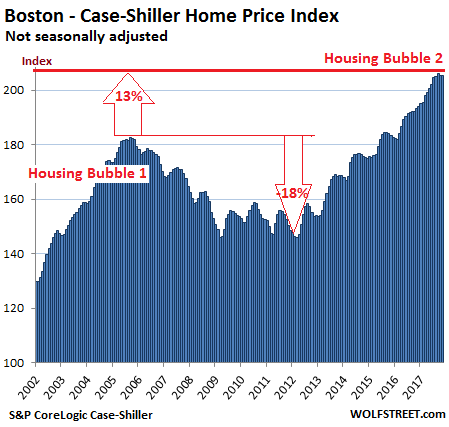
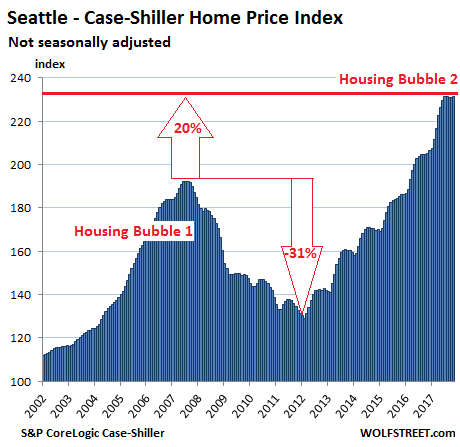
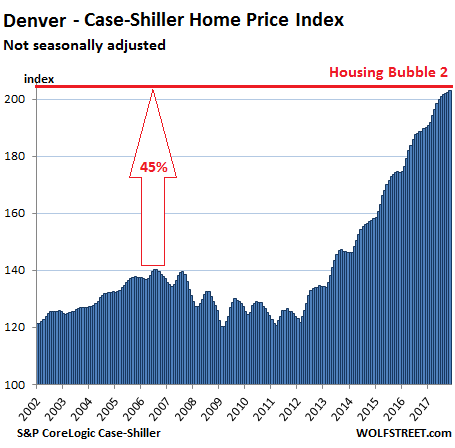
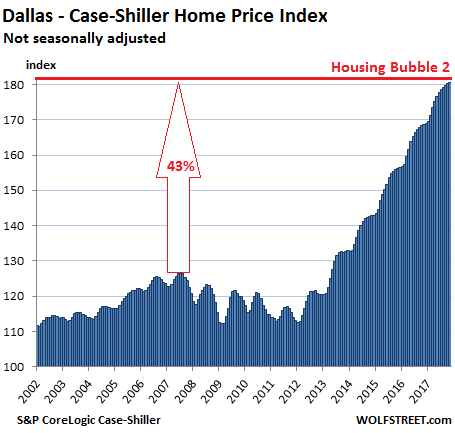
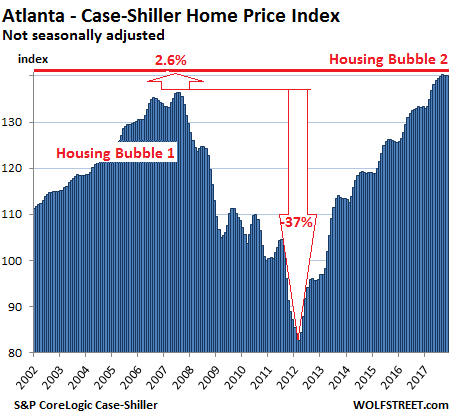
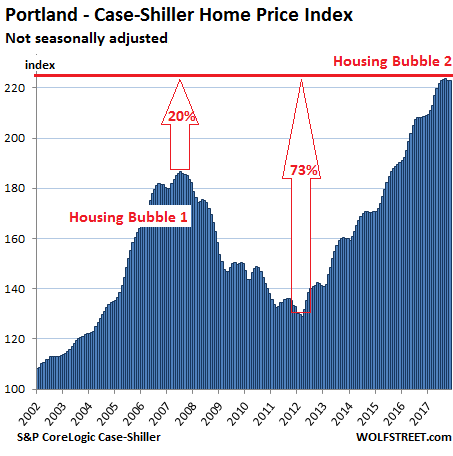
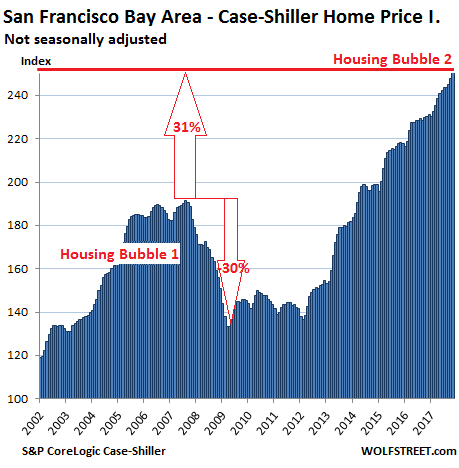
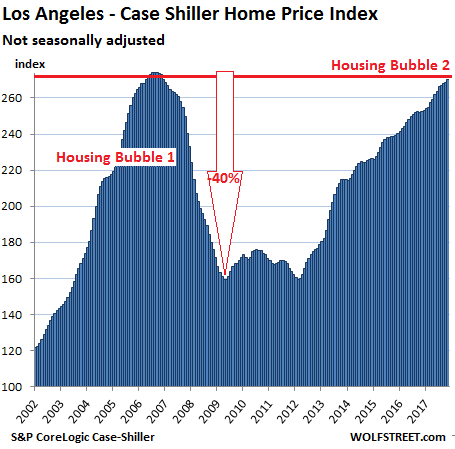
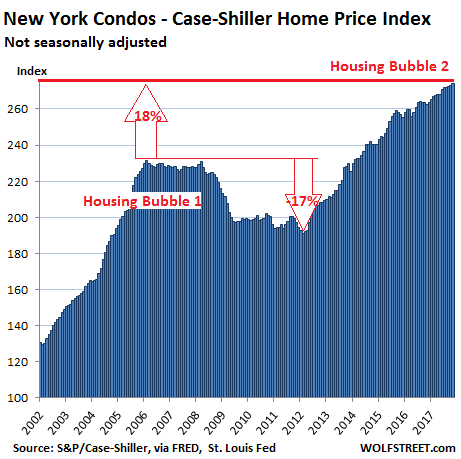


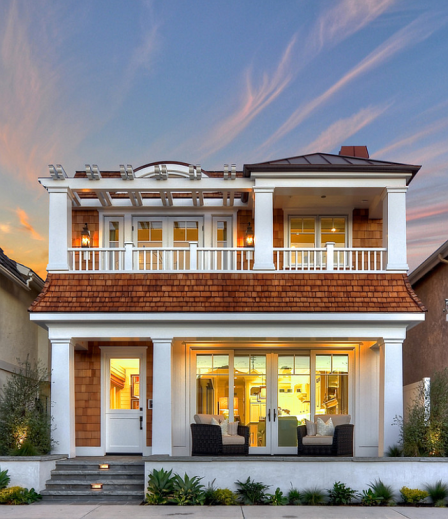


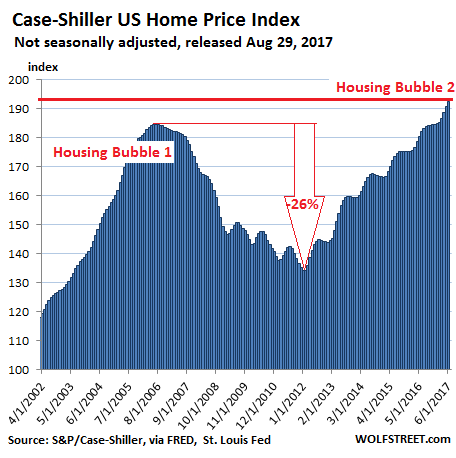
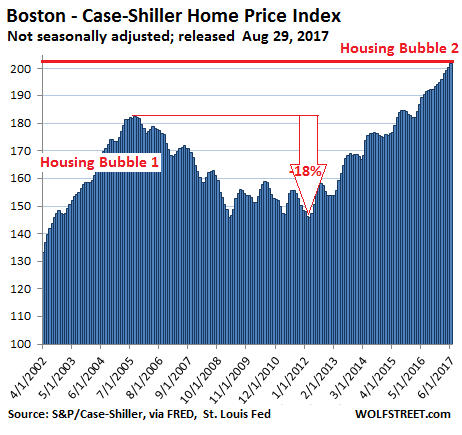
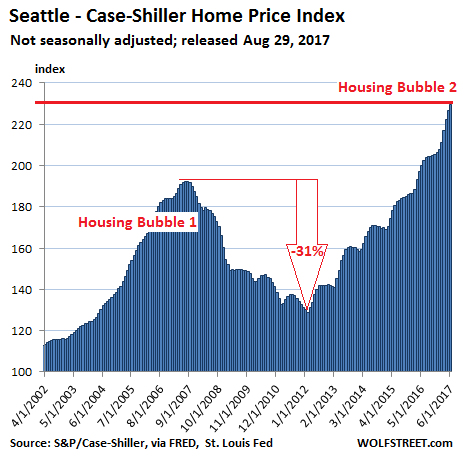
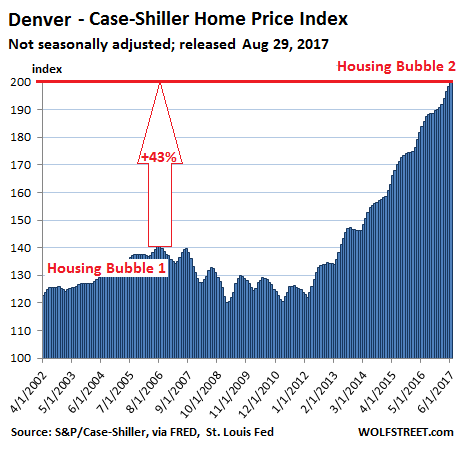
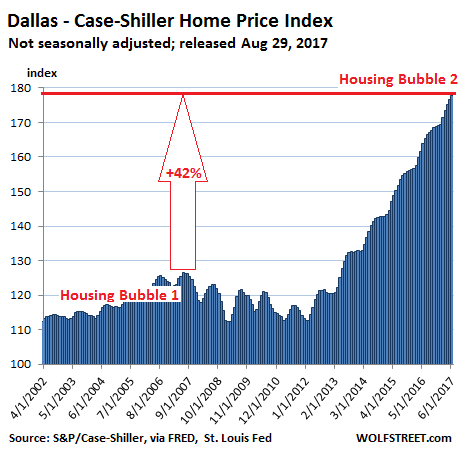
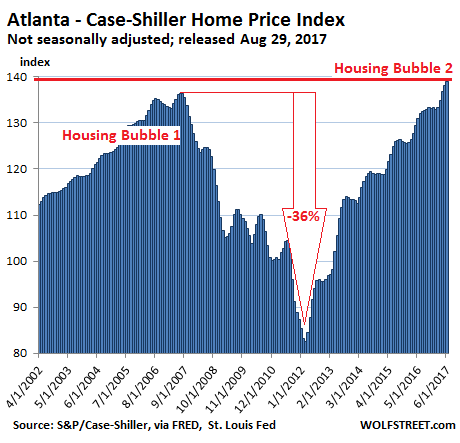
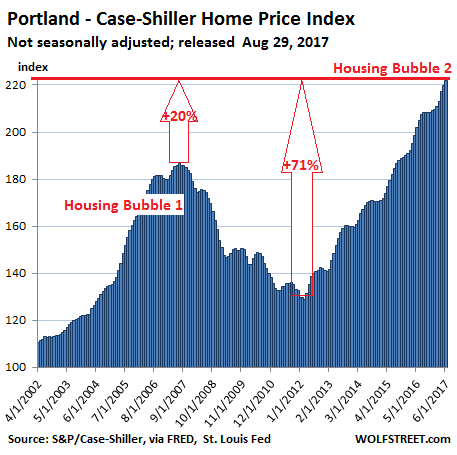
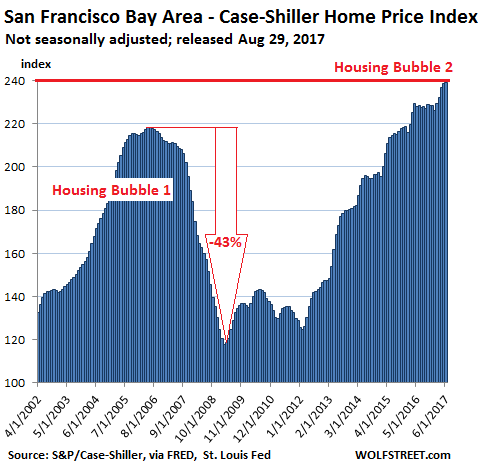
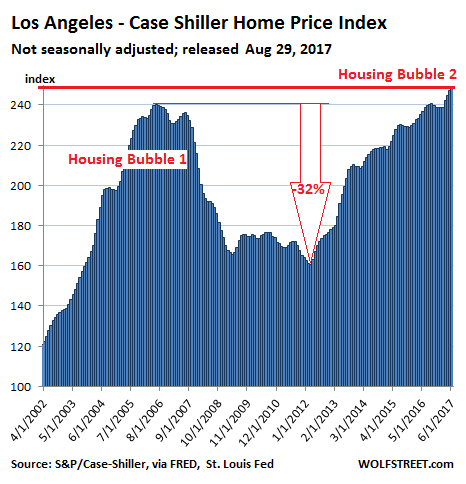
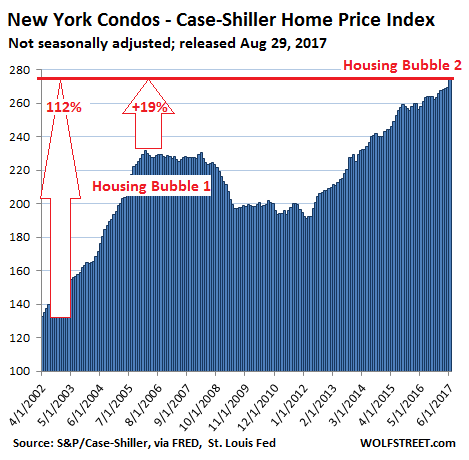


 The Kane County court house: where real estate goes to vegetate


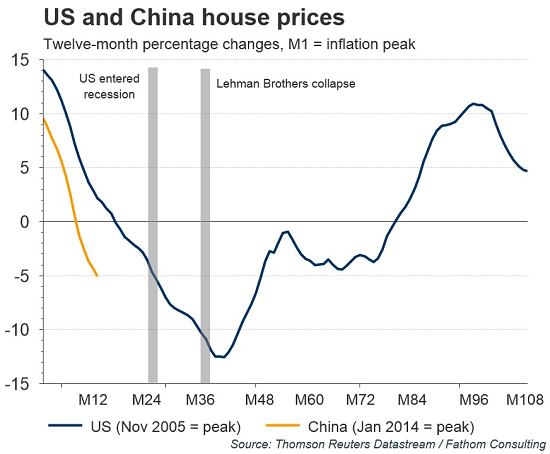


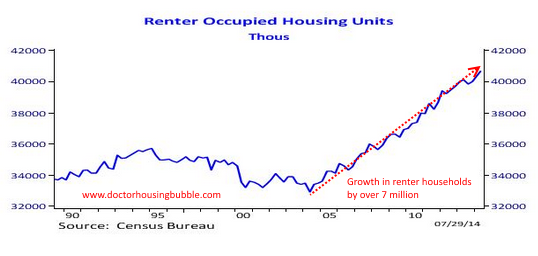
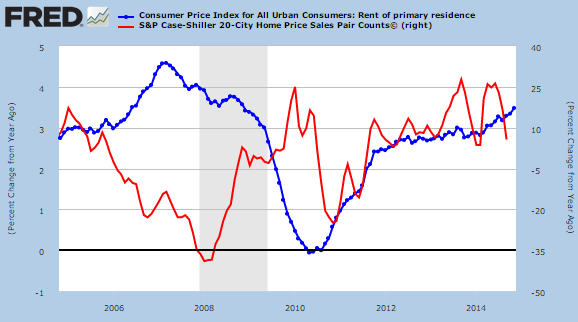
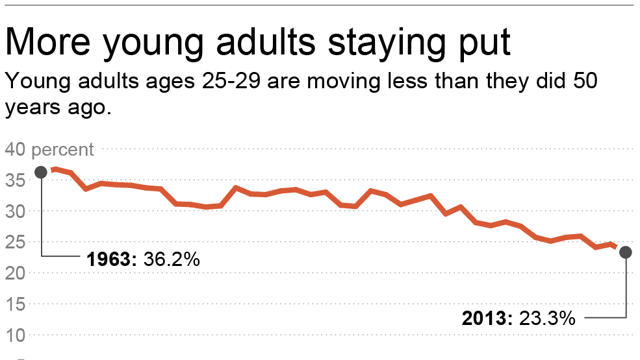
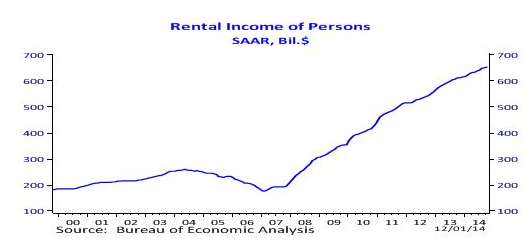


 In 2009, 60 percent of buyers were married, 21 percent were single women, 10 percent single men and 8 percent unmarried couples. Thirteen percent of survey respondents were multi-generational households, including adult children, parents and/or grandparents.
 In addition to tapping into their own savings (81 percent), first-time homebuyers used a variety of outside resources for their loan downpayment. Twenty-six percent received a gift from a friend or relative—most likely their parents—and six percent received a loan from a relative or friend. Ten percent of buyers sold stocks or bonds and tapped into a 401(k) fund.
 The biggest factors influencing neighborhood choice were quality of the neighborhood (69 percent), convenience to jobs (52 percent), overall affordability of homes (47 percent), and convenience to family and friends (43 percent). Other factors with relatively high responses included convenience to shopping (31 percent), quality of the school district (30 percent), neighborhood design (28 percent) and convenience to entertainment or leisure activities (25 percent).
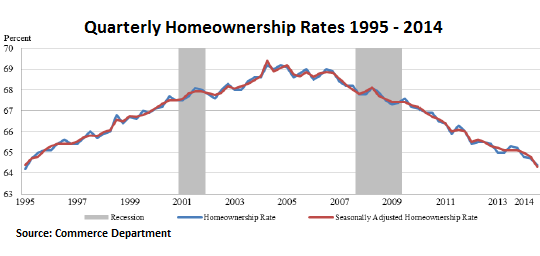


You must be logged in to post a comment.