Pending Home Sales Puked In August
To The Lowest On Record
Biggest Housing Collapse In U.S. History Has Begun
– John Perez

“Conditions are changing really fast”
Nick Gerli, in his interview with Wealthion, alludes to a number of figures which spell trouble for the residential market. If you own real estate or we’re considering entering the market soon, it’s worth checking out:
(J.G. Collins) Someone once said that you never actually “buy” a home. Instead, you merely commit to paying an annuity: the mortgage.
That’s largely true. The price and “value” of homes for the overwhelming majority of homeowners is a function of home buyers’ ability to make payments.
And with the Federal Reserve signaling further interest rate hikes, home buyers and sellers—and assorted others who use credit—will incur knock-on effects from those increases.
The policies of Joe Biden exclude an entire wave of young citizens from a critical component of the American Dream.
As America descends into oligarchy, conglomerates and their affiliated political stooges manipulate markets and public policy to centralize power and disenfranchise the historic drivers of social cohesion in America, especially vibrant churches, prosperous small businesses, and thriving families. Regarding families, a pillar of family formation and lasting generational strength in America long revolved around private property, the creation and sustenance of ownership over single-family housing.
In a world where over $16 trillion in debt now trades with negative yields…
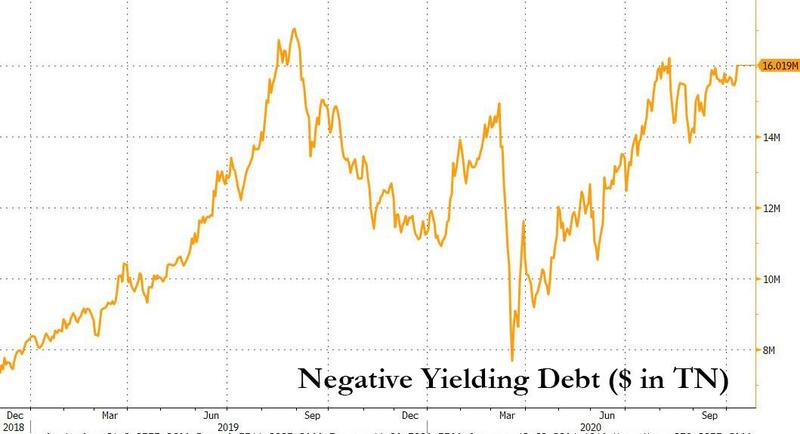
… the US remains one of the outliers where nominal yields are still positive (if not for too long). Still, with rates in the US remaining caught in a tight range, and as bank funding conditions increasingly normalize, it means that yields on mortgages continue to shrink, and sure enough according to the latest Freddie Mac data, the average yield for a 30-year, fixed loan dropped to 2.81%, down from 2.87% last week, which was not only the lowest in almost 50 years of data-keeping, but also the 10th record low this year. The previous all time low – 2.86% – held for about a month.

The availability of record cheap loans – which is unlikely to change with the Fed signaling it will hold its benchmark rate near zero through at least 2023 – has fueled a home buying spree which while bolstering the pandemic economy, has resulted in yet another bubble (for more details see Visualizing The U.S. Housing Frenzy In 34 Charts)
Meanwhile, the surging demand for the scarce supply of properties on the market is pushing up prices, putting home ownership out of reach for many Americans, and leading to even greater wealth inequality which, as a reminder, is how we got here in the first place. Adding insult to injury, lenders have tightened credit standards to near record levels, presenting another potential obstacle for would-be buyers.

“It’s important to remember that not all people are able to take advantage of low rates, given the effects of the pandemic,” Sam Khater, Freddie Mac’s chief economist, said in the statement.
Best ‘K’ shaped economic recovery ever…
Ah, to be a mortgage banker doing refinancings as the global economy grinds to a halt.
According to the Mortgage Bankers Association, refinancing applications rose 37% week-over-week (WoW).

Refi applications have soared to their highest level since mid-2016 as mortgage rates plunge.

Mortgage purchase applications have not been the same since lenders tightened their lending standards and banks increased capital ratios. Not to mention the creation of the Consumer Financial Protection Bureau.

As the NY Fed. pointed out, housing debt is almost back to its prior housing bubble peak of $10 trillion.

Phoenix AZ leads the nation in QoQ mortgage debt growth. Why? A rebound effect in the lower tier of Phoenix home prices.

After sliding 2.1% the prior week, mortgage applications collapsed 7.1% last week as mortgage rates topped 5.00%…
Ignoring the collapses during the Xmas week of 12/29/00 and 12/26/14, this is the lowest level of mortgage applications since September 2000…

The Refinance Index decreased 9 percent from the previous week.
The seasonally adjusted Purchase Index decreased 6 percent from one week earlier. The unadjusted Purchase Index decreased 6 percent compared with the previous week and was 2 percent higher than the same week one year ago.
Perhaps this is why…
The average contract interest rate for 30-year fixed-rate mortgages with conforming loan balances ($453,100 or less) increased to its highest level since February 2011, 5.10 percent, from 5.05 percent, with points increasing to 0.55 from 0.51 (including the origination fee) for 80 percent loan-to-value ratio (LTV) loans.

Still, The Fed should keep on hiking, right? Because – “greatest economy ever..” and so on…
As we noted previously, the refinance boom that rescued so many in the post-2008 ‘recovery’ is now over. If rates hit 5%, the pool of homeowners who would qualify for and benefit from a refinance will shrink to 1.55 million, according to mortgage-data and technology firm Black Knight Inc. That would be down about 64% since the start of the year, and the smallest pool since 2008.
Naturally, hardest hit by the rising rates will be young and first-time buyers who tend to make smaller down payments than older buyers who have built up equity in their previous homes, and middle-income buyers, who can least afford the extra cost. Khater said that about 45% of the loans that Freddie Mac is backing are to first-time buyers, up from about 30% normally, which also means that rising rates could have an even bigger impact on the market than usual.
Younger buyers are also more likely to be shocked by higher rates because they don’t remember when rates were more than 18% in the early 1980s, or more recently, the first decade of the 2000s, when rates hovered around 5% to 7%.
“There’s almost a generation that has been used to seeing 3% or 4% rates that’s now seeing 5% rates,” said Vishal Garg, founder and chief executive of Better Mortgage.
Between Hurricanes Michael and Hurricane Jerome (Powell), mortgage refinancing applcations are taking a big hit.
The Mortgage Bankers Association (MBA) refinancing applications index fell 9% from the previous week as 30-year mortgage rate continued to rise.

Mortgage purchase applications fell 5.52% WoW, but it is in the “mean season” for mortgage purchase applications and there was a hurricane (Michael). And then you have hurricane Jerome (Powell) battering the mortgage markets.

In addition to Hurricane (weather and Federal government), there is also the decline in Adjustable Rate Mortgages (ARMs) since the financial crisis.

With US consumers suddenly dreading to see the bottom line on their next 401(k) statement, they now have the housing market to worry about.
As interest rates spiked in the past month, one direct consequence is that U.S. mortgage rates, already at a seven-year high, surged by the most since the Trump elections.
According to the latest weekly Freddie Mac statement, the average rate for a 30-year fixed mortgage jumped to 4.9%, up from 4.71% last week and the highest since mid-April 2011. It was the biggest weekly increase since Nov. 17, 2016, when the 30-year average surged 37 basis points.

With this week’s jump, the monthly payment on a $300,000, 30-year loan has climbed to $1,592, up from $1,424 in the beginning of the year, when the average rate was 3.95%.
Even before this week’s spike, the rise in mortgage rates had cut into affordability for buyers, especially in markets where home prices have been climbing faster than incomes, which as we discussed earlier this week, is virtually all. That’s led to a sharp slowdown in sales of both new and existing homes: last month the NAR reported that contracts to buy previously owned properties declined in August by the most in seven months, as purchasing a new home becomes increasingly unaffordable.
“With the escalation of prices, it could be that borrowers are running out of breath,” said Sam Khater, chief economist at Freddie Mac.
“Rising rates paired with high and escalating home prices is putting downward pressure on purchase demand,” Khater told Bloomberg, adding that while rates are still historically low, “the primary hurdle for many borrowers today is the down payment, and that is the reason home sales have decreased in many high-priced markets.”

Meanwhile, lenders and real-estate agents say that, even now, all but the most qualified buyers making large down payments face borrowing rates of 5%. And while rates have been edging higher in recent months, “the last week we’ve seen an explosion higher in mortgage rates,” said Rodney Anderson, a mortgage lender in the Dallas area quoted by the WSJ.
Meanwhile, the WSJ reports that once-hot markets are showing signs of cooling down. Bill Nelson, president of Your Home Free, a Dallas-based real-estate brokerage, said that in the neighborhoods where he works, the number of homes experiencing price cuts is more than double the number that are going into contract.
The rise in rates could have far-reaching effects for the mortgage industry. Some lenders—particularly non-banks that don’t have other lines of business —could take on riskier customers to keep up their level of loan volume, or be forced to sell themselves. Many U.S. mortgage lenders, including some of the biggest players, didn’t exist a decade ago and only know a low-rate environment, and many younger buyers can’t remember a time when rates were higher.
Meanwhile, in more bad news for the banks, higher rates will kill off any lingering possibility of a refinancing boom, which bailed out the mortgage industry in the years right after the 2008 financial crisis. If rates hit 5%, the pool of homeowners who would qualify for and benefit from a refinance will shrink to 1.55 million, according to mortgage-data and technology firm Black Knight Inc. That would be down about 64% since the start of the year, and the smallest pool since 2008.
Naturally, hardest hit by the rising rates will be young and first-time buyers who tend to make smaller down payments than older buyers who have built up equity in their previous homes, and middle-income buyers, who can least afford the extra cost. Khater said that about 45% of the loans that Freddie Mac is backing are to first-time buyers, up from about 30% normally, which also means that rising rates could have an even bigger impact on the market than usual.
Younger buyers are also more likely to be shocked by higher rates because they don’t remember when rates were more than 18% in the early 1980s, or more recently, the first decade of the 2000s, when rates hovered around 5% to 7%.
“There’s almost a generation that has been used to seeing 3% or 4% rates that’s now seeing 5% rates,” said Vishal Garg, founder and chief executive of Better Mortgage.
It was inevitable. Federal Reserve rate hikes and balance sheet shrinkage is having the predictive effect: killing mortgage refinancing applications.

And, mortgage purchases applications SA have stalled in terms of growth with Fed rate hikes and balance sheet shrinkage.

WASHINGTON, D.C. (October 10, 2018) – Mortgage applications decreased 1.7 percent from one week earlier, according to data from the Mortgage Bankers Association’s (MBA) Weekly Mortgage Applications Survey for the week ending October 5, 2018.
The Market Composite Index, a measure of mortgage loan application volume, decreased 1.7 percent on a seasonally adjusted basis from one week earlier. On an un-adjusted basis, the Index decreased 2 percent compared with the previous week. The Refinance Index decreased 3 percent from the previous week. The seasonally adjusted Purchase Index decreased 1 percent from one week earlier. The un-adjusted Purchase Index decreased 1 percent compared with the previous week and was 2 percent higher than the same week one year ago.
The refinance share of mortgage activity decreased to 39.0 percent of total applications from 39.4 percent the previous week. The adjustable-rate mortgage (ARM) share of activity increased to 7.3 percent of total applications.
The FHA share of total applications increased to 10.5 percent from 10.2 percent the week prior. The VA share of total applications remained unchanged at 10.0 percent from the week prior. The USDA share of total applications increased to 0.8 percent from 0.7 percent the week prior.

Yes, The Fed has begun its bomb run.

Authored by Bryce Coward via Knowledge Leaders Capital blog,
Sooner or later, higher mortgage rates (which are keyed off of the 10-year treasury yield) were always bound to start slowing the housing market. It was more a matter of what level of rates would be necessary to take the first bites out of housing. We think the answer is playing out right in front of us. With mortgage rates recently breaching the highest level since 2011, housing data has been coming in on the weak side all year long, and may be set to get even worse in the coming months. Let’s explain…
In the first chart below we show pending home sales (blue line, left axis) overlaid on the 30 year fixed mortgage rate (red line, right axis, inverted, leading by 2 quarters). As we can see, pending home sales are closely inversely related to the level of mortgage rates, and rates lead pending home sales by about two quarters. The breakout in mortgage rates we’ve seen over the last few months portend more weakness in pending sales.

The next chart compares mortgage applications (blue line, left axis) to the 30 year fixed mortgage rate (red line, right axis, inverted) and shows that these two series are also closely inversely related. Higher rates are slowing demand for financing and demand for overall housing. Not exactly a heroic observation, but an important one nonetheless.

The home builders seem to have caught on, as we would expect. In the next chart we show the 1 year change in private residential construction including improvements (blue line, left axis) compared to the 30 year fixed mortgage rate (red line, right axis, inverted, leading by 2 quarters). As rates have moved higher this year, new home construction growth has slowed to just 2.5% YoY. If rates are any indication, new home construction growth may turn negative in the months just ahead.

To be fair, everything housing related isn’t that bad. Inventory levels, even though they have moved up a lot over the last several years, are still at reasonable levels and well shy of peak bubble levels of 2005-2007. Even so inventory levels may no longer be supportive of housing action.

And these moderate levels of inventory have helped keep prices stable, for now.

But, housing affordability is taking a nosedive. Here we show the National Association of Realtors housing affordability index (blue line, left axis) against mortgage rates (red line, right axis, inverted, leading by 1 quarter). Up until a few months ago housing affordability was well above trend. But now we’ve moved back to into the range which prevailed from 1991-2004.

In sum, the effects of higher long-term interest rates are starting to be squarely felt in the housing space. Pending sales, mortgage applications and new construction have all been weak and look set to get even weaker in the quarters to come as the lagged effects of higher mortgage rates set in. Home prices have yet to respond since inventory levels are still moderate, but inventories aren’t the support they were just two years ago. Meanwhile, affordability levels are no longer very supportive. All this suggests that the housing sector, which has been a bright spot of this recovery over the last five or six years, may not be the same source of wealth accumulation and growth over the next few years, or as long as higher mortgage rates continue to take the juice out of this sector.

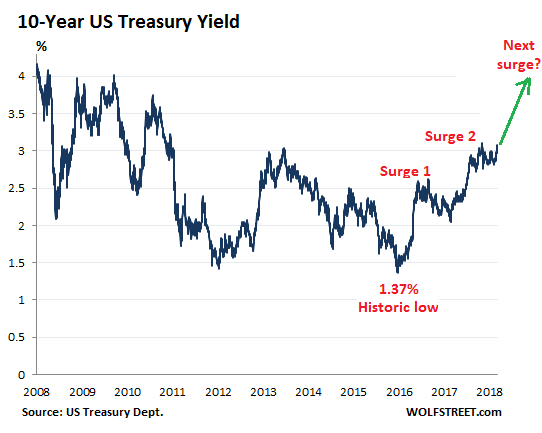
There’s an interesting thing that just happened, which shows that the US Treasury 10-year yield is ready for the next leg up, and that the yield curve might not invert just yet: the 10-year yield climbed over the 3% hurdle again, and there was none of the financial-media excitement about it as there was when that happened last time. It just dabbled with 3% on Monday, climbed over 3% yesterday, and closed at 3.08% today, and it was met with shrugs. In other words, this move is now accepted.
Note how the 10-year yield rose in two big surges since the historic low in June 2016, interspersed by some backtracking. This market might be setting up for the next surge:
And it’s impacting mortgage rates – which move roughly in parallel with the 10-year Treasury yield. The Mortgage Bankers Association (MBA) reported this morning that the average interest rate for 30-year fixed-rate mortgages with conforming loan balances ($453,100 or less) and a 20% down-payment rose to 4.88% for the week ending September 14, 2018, the highest since April 2011.
And this doesn’t even include the 9-basis-point uptick of the 10-year Treasury yield since the end of the reporting week on September 14, from 2.99% to 3.08% (chart via Investing.com; red marks added):
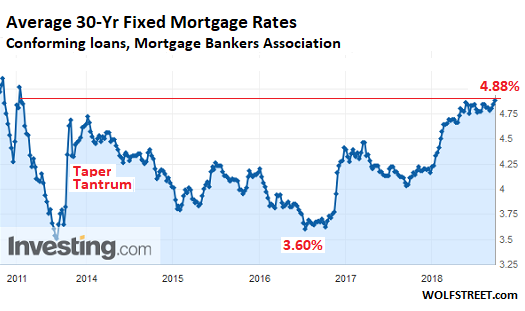
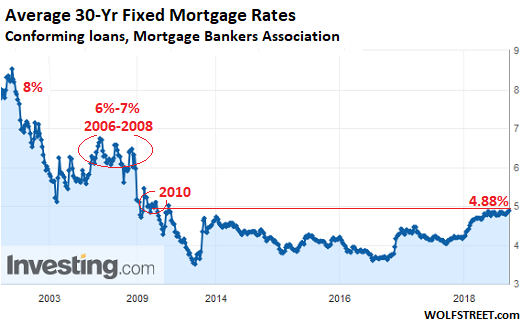
While 5% may sound high for the average 30-year fixed rate mortgage, given the inflated home prices that must be financed at this rate, and while 6% seems impossibly high under current home price conditions, these rates are low when looking back at rates during the Great Recession and before (chart via Investing.com):
And more rate hikes will continue to drive short-term yields higher, even as long-term yields for now are having trouble keeping up. And these higher rates are getting baked in. Since the end of August, the market has been seeing a 100% chance that the Fed, at its September 25-26 meeting, will raise its target for the federal funds rate by a quarter point to a range between 2.0% and 2.25%, according to CME 30-day fed fund futures prices. It will be the 3rd rate hike in 2018.
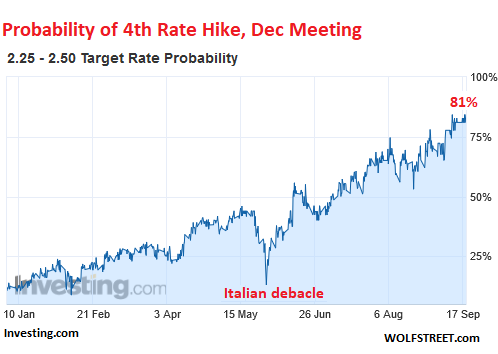
And the market now sees an 81% chance that the Fed will announced a 4th rate hike for 2018 after the FOMC meeting in December (chart via Investing.com, red marks added):
The Fed’s go-super-slow approach – everything is “gradual,” as it never ceases to point out – is giving markets plenty of time to prepare and adjust, and gradually start taking for granted what had been considered impossible just two years ago: That in 2019, short-term yields will be heading for 3% or higher – the 3-month yield is already at 2.16% — that the 10-year yield will be going past 4%, and that the average 30-year fixed rate mortgage will be flirting with a 6% rate.
Potential home buyers next year haven’t quite done the math yet what those higher rates, applied to home prices that have been inflated by 10 years of interest rate repression, will do to their willingness and ability to buy anything at those prices, but they’ll get around to it.
As for holding my breath that an inverted yield curve – a phenomenon when the 2-year yield is higher than the 10-year yield – will ominously appear and make the Fed stop in its tracks? Well, this rate-hike cycle is so slow, even if it is speeding up a tiny bit, that long-term yields may have enough time to go through their surge-and-backtracking cycles without being overtaken by slowly but consistently rising short-term yields.
There has never been a rate-hike cycle this slow and this drawn-out: We’re now almost three years into it, and rates have come up, but it hasn’t produced the results the Fed is trying to achieve: A tightening of financial conditions, an end to yield-chasing in the credit markets and more prudence, and finally an uptick in the unemployment rate above 4%. And the Fed will keep going until it thinks it has this under control.
There are a large number of public and private services that measure the change in home prices. The algorithms behind these services, while complex, are primarily based on recent sale prices for comparative homes and adjusted for factors like location, property characteristics and the particulars of the house. While these pricing services are considered to be well represented measures of house prices, there is another important factor that is frequently overlooked despite the large role in plays in house prices.
In August 2016, the 30-year fixed mortgage rate as reported by the Federal Reserve hit an all-time low of 3.44%. Since then it has risen to its current level of 4.50%. While a 1% increase may appear small, especially at this low level of rates, the rise has begun to adversely affect housing and mortgage activity. After rising 33% and 22% in 2015 and 2016 respectively, total mortgage originations were down -16% in 2017. Further increases in rates will likely begin to weigh on house prices and the broader economy. This article will help quantify the benefit that lower rates played in making houses more affordable over the past few decades. By doing this, we can appreciate how further increases in mortgage rates might adversely affect house prices.
In 1981 mortgage rates peaked at 18.50%. Since that time they have declined steadily and now stands at a relatively paltry 4.50%. Over this 37-year period, individuals’ payments on mortgage loans also declined allowing buyers to get more for their money. Continually declining rates also allowed them to further reduce their payments through refinancing. Consider that in 1990 a $500,000 house, bought with a 10%, 30-year fixed rate mortgage, which was the going rate, would have required a monthly principal and interest payment of $4,388. Today a loan for the same amount at the 4.50% current rate is almost half the payment at $2,533.
The sensitivity of mortgage payments to changes in mortgage rates is about 9%, meaning that each 1% increase or decrease in the mortgage rate results in a payment increase or decrease of 9%. From a home buyer’s perspective, this means that each 1% change in rates makes the house more or less affordable by about 9%.
Given this understanding of the math and the prior history of rate declines, we can calculate how lower rates helped make housing more affordable. To do this, we start in the year 1990 with a $500,000 home price and adjust it annually based on changes in the popular Case-Shiller House Price Index. This calculation approximates the 28-year price appreciation of the house. Second, we further adjust it to the change in interest rates. To accomplish this, we calculated how much more or less home one could buy based on the change in interest rates. The difference between the two, as shown below, provides a value on how much lower interest rates benefited home buyers and sellers.
 Data Courtesy: S&P Core Logic Case-Shiller House Price Index
The graph shows that lower payments resulting from the decline in mortgage rates benefited buyers by approximately $325,000. Said differently, a homeowner can afford $325,000 more than would have otherwise been possible due to declining rates.
As stated, mortgage rates have been steadily declining for the past 37 years. There are some interest rate forecasters that believe the recent uptick in rates may be the first wave of a longer-term change in trend. If this is, in fact, the case, quantifying how higher mortgage rates affect payments, supply, demand, and therefore the prices of houses is an important consideration for the direction of the broad economy.
The graph below shows the mortgage payment required for a $500,000 house based on a range of mortgage rates. The background shows the decline in mortgage rates (10.00% to 4.50%) from 1990 to today.

To put this into a different perspective, the following graph shows how much a buyer can afford to pay for a house assuming a fixed payment ($2,333) and varying mortgage rates. The payment is based on the current mortgage rate.

As the graphs portray, home buyers will be forced to make higher mortgage payments or seek lower-priced houses if rates keep rising.
The Fed has raised interest rates six times since the end of 2015. Their forward guidance from recent Federal Open Market Committee (FOMC) meeting statements and minutes tells of their plans on continuing to do so throughout this year and next. Additionally, the Fed owns over one-quarter of all residential mortgage-backed securities (MBS) through QE purchases. Their stated plan is to reduce their ownership of those securities over the next several quarters. If the Fed continues on their expected path with regard to rates and balance sheet, it creates a significant market adjustment in terms of supply and demand dynamics and further implies that mortgage rates should rise.
The consequences of higher mortgage rates will not only affect buyers and sellers of housing but also make borrowing on the equity in homes more expensive. From a macro perspective, consider that housing contributes 15-18% to GDP, according to the National Association of Home Builders (NAHB). While we do not expect higher rates to devastate the housing market, we do think a period of price declines and economic weakness could accompany higher rates.
This analysis is clinical using simple math to illustrate the relationship, cause, and effects, between changes in interest rates and home prices. However, the housing market is anything but a simple asset class. It is among the most complex of systems within the broad economy. Rising rates not only impact affordability but also the general level of activity which feeds back into the economy. In addition to the effect that rates may have, also consider that the demographics for housing are challenged as retiring, empty-nest baby boomers seek to downsize. To whom will they sell and at what price?
If interest rates do indeed continue to rise, there is a lot more risk embedded in the housing market than currently seems apparent as these and other dynamics converge. The services providing pricing insight into the value of the housing market may do a fine job of assessing current value, but they lack the sophistication required to see around the next economic corner.
Yesterday when looking at the latest MBA Mortgage Application data, we found that, as mortgage rates jumped to the highest level since 2011, mortgage refi applications, not unexpectedly tumbled to the lowest level since the financial crisis, choking off a key revenue item for banks, and resulting in even more pain for the likes of Wells Fargo.

Today, according to the latest Freddie Mac mortgage rates report, after plateauing in recent weeks, mortgage rates reversed course and reached a new high last seen eight years ago as the 30-year fixed mortgage rate edged up to 4.61% matching the highest level since May 19, 2011.

But while the highest mortgage rates in 8 years are predictably crushing mortgage refinance activity, they appears to be having the opposite effect on home purchases, where there is a sheer scramble to buy, and sell, houses. As Bloomberg notes, citing brokerage Redfin, the average home across the US that sold last month went into contract after a median of 36 only days on the market – a record speed in data going back to 2010.

To Sam Khater, chief economist of Freddie Mac, this was a sign of an economy firing on all cylinders: “This is what happens when the economy is strong,” Khater told Bloomberg in a phone interview. “All the higher-rate environment does is it either causes them to try and rush or look at different properties that are more affordable.”
Of course, one can simply counter that what rising rates rally do is make housing – for those who need a mortgage – increasingly more unaffordable, as a result of the higher monthly mortgage payments. Case in point: with this week’s jump, the monthly payment on a $300,000, 30-year loan has climbed to $1,540, up over $100 from $1,424 in the beginning of the year, when the average rate was 3.95%.

As such, surging rates merely pulls home demand from the future, as potential home buyers hope to lock in “lower” rates today instead of risking tomorrow’s rates. It also means that after today’s surge in activity, a vacuum in transactions will follow, especially if rates stabilize or happen to drop. Think “cash for clunkers”, only in this case it’s houses.
Meanwhile, the short supply of home listings for sale and increased competition is only making their purchases harder to afford: according to Redfin, this spike in demand and subdued supply means that home prices soared 7.6% in April from a year earlier to a median of $302,200, and sellers got a record 98.8% of what they asked on average.
Call it the sellers market.
Furthermore, bidding wars are increasingly breaking out: Minneapolis realtor Mary Sommerfeld said a family she works with offered $33,000 more than the $430,000 list price for a home in St. Paul. The listing agent gave her the bad news: There were nine offers and the family’s was second from the bottom.
For Sommerfeld’s clients, the lack of inventory is a bigger problem than rising mortgage rates. If anything, they want to close quickly before they get priced out of the market — and have to pay more interest.
“I don’t think it’s hurting the buyer demand at all,” she said. “My buyers say they better get busy and buy before the interest rates go up any further.”
Then again, in the grand scheme of things, 4.61% is still low. Kristin Wilson, a loan officer with Envoy Mortgage in Edina, Minnesota, tells customers to keep things in perspective. When she bought a house in the early 1980s, the interest on her adjustable-rate mortgage was 12 percent, she said.
“One woman actually used the phrase: ‘Rates shot up,’” Wilson said. “We’ve been spoiled after a number of years with rates hovering around 4 percent or lower.”
Of course, if the average mortgage rate in the America is ever 12% again, look for a real life recreation of Mad Max the movie in a neighborhood near you…
On the heels of the 10Y treasury yield breaking out of its recent range to its highest since July 2011, this morning’s mortgage applications data shows directly how Bill Gross may be right that the economy may not be able to handle The Fed’s ongoing actions.

As Wolf Richter notes, the 10-year yield functions as benchmark for the mortgage market, and when it moves, mortgage rates move. And today’s surge of the 10-year yield meaningfully past 3% had consequences in the mortgage markets, as Mortgage News Daily explained:
Mortgage rates spiked in a big way today, bringing some lenders to the highest levels in nearly 7 years (you’d need to go back to July 2011 to see worse). That heavy-hitting headline is largely due to the fact that rates were already fairly close to 7-year highs, although today did cover quite a bit more distance than other recent “bad days.”
The “most prevalent rates” for 30-year fixed rate mortgages today were between 4.75% and 4.875%, according to Mortgage News Daily.

And that is crushing demand for refinancing applications…

Despite easing standards – a net 9.7% of banks reported loosening lending standards for QM-Jumbo mortgages, respectively, compared to a net 1.6% in January, respectively.
According to Wolf Richter over at Wolf Street, the good times in real estate are ending…
The big difference between 2010 and now, and between 2008 and now, is that home prices have skyrocketed since then in many markets – by over 50% in some markets, such as Denver, Dallas, or the five-county San Francisco Bay Area, for example, according to the Case-Shiller Home Price Index. In other markets, increases have been in the 25% to 40% range. This worked because mortgage rates zigzagged lower over those years, thus keeping mortgage payments on these higher priced homes within reach for enough people. But that ride is ending.
And as Peter Reagan writes at Birch Group, granted, even if rates go up over 6%, it won’t be close to rates in the 1980’s (when some mortgage rates soared over 12%). But this time, rising rates are being coupled with record-high home prices that, according to the Case-Shiller Home Price Index, show no signs of reversing (see chart below).

So you have fast-rising mortgage rates and soaring home prices. What else is there?
It’s not just home refinancing demand that is collapsing… as we noted yesterday, loan demand is tumbling everywhere, despite easing standards…

But seriously, who didn’t see that coming?
Growth? Inflation? Be careful what you wish for, as the surge in Treasury yields has sent mortgage interest rates to their highest in four years, flashing a big red warning light for affordability and home sales in 2018…
The U.S. weekly average 30-year fixed mortgage rate rocketed up 10 basis points to 4.32 percent this week. Following a turbulent Monday, financial markets settled down with the 10-year Treasury yield resuming its upward march. Mortgage rates have followed. The 30-year fixed mortgage rate is up 33 basis points since the start of the year.

Will higher rates break housing market momentum?
As the following chart shows, that surge in rates will have a direct impact on home sales (or prices will be forced to adjust lower) as affordability collapses…

A housing bust may be just around the corner. Rates have climbed to a level last seen in May of 2014.
Mortgage News Daily reports Mortgage Rates Surge to Highest Levels in More Than 3 Years.
The chart does not quite show what MND headline says but the difference is a just a few basis points. I suspect rates inched lower just after the article came out.
For the past few weeks, rates made several successive runs up to the highest levels in more than 9 months. It was really only the spring of 2017 that stood in the way of rates being the highest since early 2014. After Friday marked another “highest in 9 months” day, it would only have taken a moderate movement to break into the “3+ year” territory. The move ended up being even bigger.
From a week and a half ago, most borrowers are now looking at another eighth of a percentage point higher in rate. In total, rates are up the better part of half a point since December 15th. This marks the only time rates have risen this much without having been at long term lows in the past year. For example, late 2010, mid-2013, mid-2015, and late 2016 all saw sharper increases in rates overall, but each of those moves happened only 1-3 months after a long term rate low.
Not a Drill
So far this month, MBS have stunningly dropped over 200 bps, which easily translates into a .5% or more increase in rates. I’ve been shouting “lock early” for quite a while, and this is precisely why, This isn’t a drill, or a momentary rate upturn. It’s likely the end of a decade+ long bull bond market. LOCK EARLY. -Ted Rood, Senior Originator
Housing Bust Coming
Drill or not, if rising rates stick, they are bound to have a negative impact on home buying.
In the short term, however, rate increases may fuel the opposite reaction people expect.
Why?
Those on the fence may decide it’s now or never and rush out to purchase something, anything. If that mentality sets in, there could be one final homebuilding push before the dam breaks. That’s not my call. Rather, that could easily be the outcome.
Completed Homes for Sale
Speculation by home builders sitting on finished homes in 2007 is quite amazing.
What about now?
Supply of Homes in Months at Current Sales Rate
Note that spikes in home inventory coincide with recessions.
A 5.9 month supply of homes did not seem to be a problem in March of 2006. In retrospect, it was the start of an enormous problem.
In absolute terms, builders are nowhere close to the problem situation of 2007. Indeed, it appears that builders learned a lesson.
Nonetheless, pain is on the horizon if rates keep rising.
Price Cutting Coming Up?
If builders cut prices to get rid of inventory, everyone who bought in the past few years is likely to quickly go underwater.
The U.S. 10-Year Treasury Yield has dropped back below the line containing the past decade’s “extraordinarily low-rate” regime.
Among the many significant moves in financial markets last fall in the aftermath of the U.S. presidential election was a spike higher in U.S. bond yields. This spike included a jump in the 10-Year Treasury Yield (TNX) above its post-2007 Down trendline. Now, this was not your ordinary trendline break. Here is the background, as we noted in a post in January when the TNX subsequently tested the breakout point:
“As many observers may know, bond yields topped in 1981 and have been in a secular decline since. And, in fact, they had been in a very well-defined falling channel for 26 years (in blue on the chart below). In 2007, at the onset of the financial crisis, yields entered a new regime.
Spawned by the Fed’s “extraordinarily low-rate” campaign, the secular decline in yields began a steeper descent. This new channel (shown in red) would lead the TNX to its all-time lows in the 1.30%’s in 2012 and 2016.
The top of this new channel is that post-2007 Down trendline. Thus, recent price action has 10-Year Yields threatening to break out of this post-2007 technical regime. That’s why we consider the level to be so important.”
We bring up this topic again today because, unlike January’s successful hold of the post-2007 “low-rate regime” line, the TNX has dropped back below it in recent days. Here is the long-term chart alluded to above.

And here is a close-up version.

As can be seen on the 2nd chart, the TNX has just broken below several key Fibonacci Retracement levels near the 2.30% level – not to mention the post-2007 Down trendline which currently lies in the same vicinity. Does this meant the extraordinarily low-rate environment is back?
Well, first of all, the Federal Reserve only sets the overnight “Fed Funds” rate – not longer-term bond yields (at least not directly). So this is not the Fed’s direct doing (and besides, they’re in the middle of a rate hiking cycle). Therefore, the official “extraordinarily low-rate” environment that the Fed maintained for the better part of a decade is not coming back – at least not imminently. But how about these longer rates?
Outside of some unmistakable influence resulting from Fed policy, longer-term Treasury Yields are decided by free market forces. Thus, this return to the realm of the TNX’s ultra low-rate regime is market-driven, whatever the reason. Is there a softer underlying economic current than what is generally accepted at the present time? Is the Trump administration pivoting to a more dovish posture than seen in campaign rhetoric? Are the geopolitical risks playing a part in suppressing yields back below the ultra low-rate “line of demarcation”?
Some or all of those explanations may be contributing to the return of the TNX to its ultra low-rate regime. We don’t know and, frankly, we don’t really care. All we care about, as it pertains to bond yields, is being on the right side of their path. And currently, the easier path for yields is to the downside as a result of the break of major support near 2.30%.
The Federal Reserve has announced it will be shrinking its balance sheet. During the last housing meltdown in 2008, it bought the underwater assets of big banks. It has more than two trillion dollars in mortgage-backed securities that are now worth something because of the latest housing boom. Gregory Mannarino of TradersChoice.net says the Fed is signaling a market top in housing. It pumped up the mortgage-backed securities it bought by inflating another housing bubble. Now, the Fed is going to dump the securities on the market. Mannarino predicts housing prices will fall and interest rates will rise.

The monthly housing market reports I publish each month became bullish in late 2011 due to the relative undervaluation of properties at the time. I was still cautious due to weak demand, excessive shadow inventory, the uncertainty of the duration of the interest rate stimulus, and an overall skepticism of the lending cartel’s ability to manage their liquidations.
In 2012, the lending cartel managed to completely shut off the flow of foreclosures on the market, and with ever-declining interest rates, a small uptick in demand coupled with a dramatic reduction in supply caused the housing market to bottom.
Even with the bottom in the rear-view mirror, I remained skeptical of the so-called housing recovery because the market headwinds remained, and the low-interest rate stimulus could change at any moment. Without the stimulus, the housing market would again turn down.
It wasn’t until Ben Bernanke, chairman of the federal reserve, took out his housing bazooka and fired it in September 2012 that I became convinced the bottom was really in for housing. Back in September, Bernanke pledged to buy $40 billion in mortgage-backed securities each month for as long as it takes for housing to fully recover. With an unlimited pledge to provide stimulus, any concerns about a decline in prices was washed away.
In addtion to buying new securities, the federal reserve also embarked on a policy of reinvesting principal payments from agency debt and mortgage-backed securities back into mortgages — a policy they continue to this day.

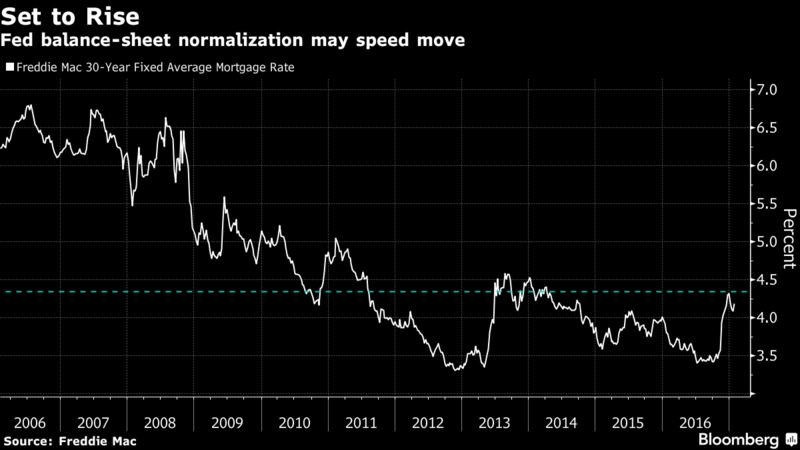
by Liz McCormick and Matt Scully, February 5, 2017
Almost a decade after it all began, the Federal Reserve is finally talking about unwinding its grand experiment in monetary policy.
And when it happens, the knock-on effects in the bond market could pose a threat to the U.S. housing recovery.
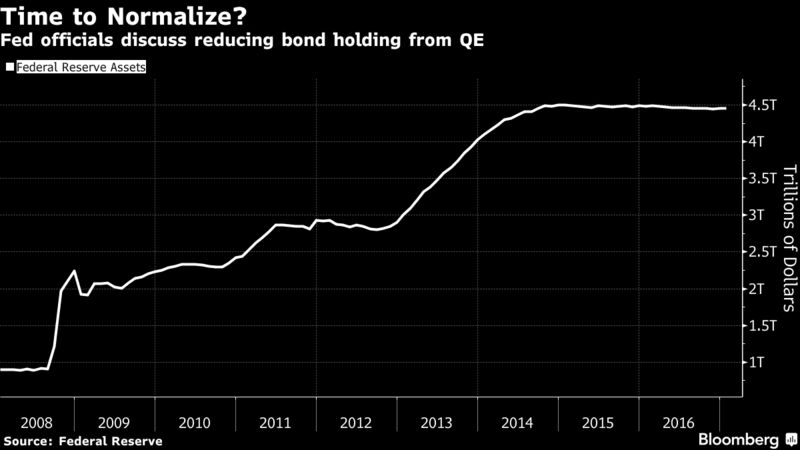
Just how big is hard to quantify. But over the past month, a number of Fed officials have openly discussed the need for the central bank to reduce its bond holdings, which it amassed as part of its unprecedented quantitative easing during and after the financial crisis. The talk has prompted some on Wall Street to suggest the Fed will start its drawdown as soon as this year, which has refocused attention on its $1.75 trillion stash of mortgage-backed securities.
While the Fed also owns Treasuries as part of its $4.45 trillion of assets, its MBS holdings have long been a contentious issue, with some lawmakers criticizing the investments as beyond what’s needed to achieve the central bank’s mandate. Yet because the Fed is now the biggest source of demand for U.S. government-backed mortgage debt and owns a third of the market, any move is likely to boost costs for home buyers. …
In the past year alone, the Fed bought $387 billion of mortgage bonds just to maintain its holdings. Getting out of the bond-buying business as the economy strengthens could help lift 30-year mortgage rates past 6 percent within three years, according to Moody’s Analytics Inc.
It’s difficult to imagine that losing a buyer of that magnitude wouldn’t cause prices to fall, thereby raising yields and mortgage interest rates.

The surge in mortgage rates is already putting a dent in housing demand. Sales of previously owned homes declined more than forecast in December, …, according to data from the National Association of Realtors.
People are starting to ask the question, “Gee, did I miss my opportunity here to get a low-rate mortgage?” …
While this may close the door on the opportunity to get a low rate, it opens the door on the opportunity to get a low price.
People can only afford what they can afford. If their payment stretches to finance huge sums like they do today, then prices get bid up to that equilibrium price level. If their payment finances a smaller sum, like they will if mortgage rates rise, then prices will need to “adjust” downward to this new equilibrium price level.
I wouldn’t count on a big drop. Prices are sticky on the way down, particularly without a flood of foreclosures to push them down. Today’s owners with low-rate mortgages won’t sell unless they really need to, and lenders would rather can-kick than cause another foreclosure crisis, so any downward movement would be slow.
As prices creep downward, rents and incomes will rise offsetting some of the pain, and those buyers that are active will substitute downward in quality to something they can afford. It’s a prescription for low sales volumes and unhappy buyers and sellers. The buyers pay too much, and the sellers get too little.
Nevertheless, the consequences for the U.S. housing market can’t be ignored.
The “Fed has already hiked twice and the market is expecting” more, said Munish Gupta, a manager at Nara Capital, a new hedge fund being started by star mortgage trader Charles Smart. “Tapering is the next logical step.”
As the federal reserve tapers its purchases of mortgage bonds, it opens up this market to private investment. Perhaps money will flow out of 10-year treasuries into mortgage-backed securities for a little more yield. It’s also possible that Congress will reform mortgage finance and remove the government guarantee from these securities, making them less desirable.
It’s entirely possible that the yield on the 10-year treasury will drop this year. Higher short term rates and a strengthening economy means the US dollar should appreciate relative to other currencies, attracting foreign capital. Once converted to US dollars, that capital must find someplace to invest, and US Treasuries are the safest investment providing some yield. If a great deal of foreign capital enters the country and buys treasuries, yields will drop, and mortgage rates may drop with them. Rising mortgage rates are not a certainty.
For now, the federal reserve will keep buying mortgage-backed securities, but the messy taper is on the horizon. Apparently, when it comes to boosting housing, Yellen plans to stay the course.

Almost a decade after it all began, the Federal Reserve is finally talking about unwinding its grand experiment in monetary policy.
And when it happens, the knock-on effects in the bond market could pose a threat to the U.S. housing recovery.
Just how big is hard to quantify. But over the past month, a number of Fed officials have openly discussed the need for the central bank to reduce its bond holdings, which it amassed as part of its unprecedented quantitative easing during and after the financial crisis. The talk has prompted some on Wall Street to suggest the Fed will start its drawdown as soon as this year, which has refocused attention on its $1.75 trillion stash of mortgage-backed securities.
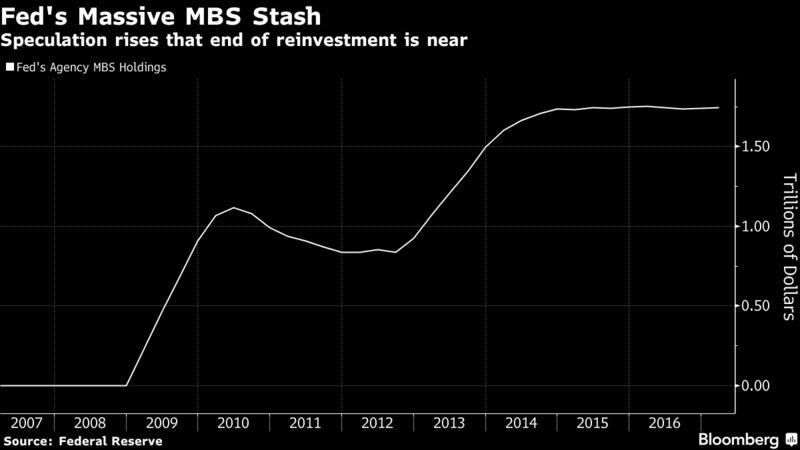
While the Fed also owns Treasuries as part of its $4.45 trillion of assets, its MBS holdings have long been a contentious issue, with some lawmakers criticizing the investments as beyond what’s needed to achieve the central bank’s mandate. Yet because the Fed is now the biggest source of demand for U.S. government-backed mortgage debt and owns a third of the market, any move is likely to boost costs for home buyers.
In the past year alone, the Fed bought $387 billion of mortgage bonds just to maintain its holdings. Getting out of the bond-buying business as the economy strengthens could help lift 30-year mortgage rates past 6 percent within three years, according to Moody’s Analytics Inc.
Unwinding QE “will be a massive and long-lasting hit” for the mortgage market, said Michael Cloherty, the head of U.S. interest-rate strategy at RBC Capital Markets. He expects the Fed to start paring its investments in the fourth quarter and ultimately dispose of all its MBS holdings.
Unlike Treasuries, the Fed rarely owned mortgage-backed securities before the financial crisis. Over the years, its purchases have been key in getting the housing market back on its feet. Along with near-zero interest rates, the demand from the Fed reduced the cost of mortgage debt relative to Treasuries and encouraged banks to extend more loans to consumers.
In a roughly two-year span that ended in 2014, the Fed increased its MBS holdings by about $1 trillion, which it has maintained by reinvesting its maturing debt. Since then, 30-year bonds composed of Fannie Mae-backed mortgages have only been about a percentage point higher than the average yield for five- and 10-year Treasuries, data compiled by Bloomberg show. That’s less than the spread during housing boom in 2005 and 2006.
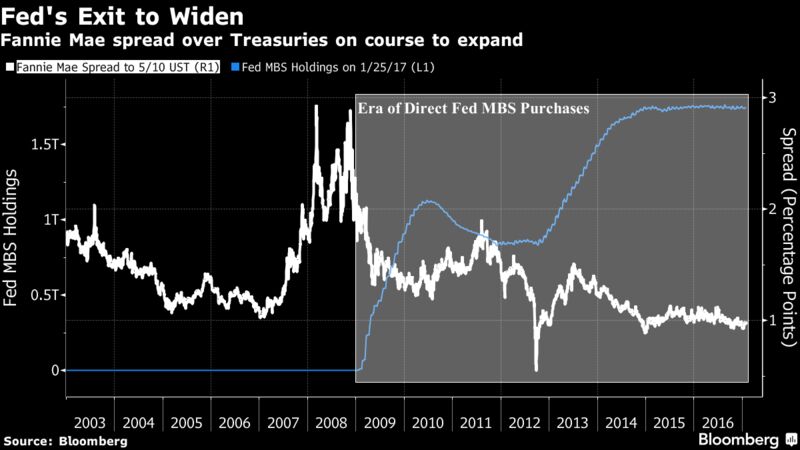
Talk of the Fed pulling back from the market has bond dealers anticipating that spreads will widen. Goldman Sachs Group Inc. sees the gap increasing 0.1 percentage point this year, while strategists from JPMorgan Chase & Co. say that once the Fed actually starts to slow its MBS reinvestments, the spread would widen at least 0.2 to 0.25 percentage points.
“The biggest buyer is leaving the market, so there will be less demand for MBS,” said Marty Young, fixed-income analyst at Goldman Sachs. The firm forecasts the central bank will start reducing its holdings in 2018. That’s in line with a majority of bond dealers in the New York Fed’s December survey.
The Fed, for its part, has said it will keep reinvesting until its tightening cycle is “well underway,” according to language that has appeared in every policy statement since December 2015. The range for its target rate currently stands at 0.5 percent to 0.75 percent.
Mortgage rates have started to rise as the Fed moves to increase short-term borrowing costs. Rates for 30-year home loans surged to an almost three-year high of 4.32 percent in December. While rates have edged lower since, they’ve jumped more than three-quarters of a percentage point in just four months.
The surge in mortgage rates is already putting a dent in housing demand. Sales of previously owned homes declined more than forecast in December, even as full-year figures were the strongest in a decade, according to data from the National Association of Realtors.
People are starting to ask the question, “Gee, did I miss my opportunity here to get a low-rate mortgage?” said Tim Steffen, a financial planner at Robert W. Baird & Co. in Milwaukee. “I tell them that rates are still pretty low. But are rates going to go up? It certainly seems like they are.”
Part of it, of course, has to do with the Fed simply raising interest rates as inflation perks up. Officials have long wanted to get benchmark borrowing costs off rock-bottom levels (another legacy of crisis-era policies) and back to levels more consist with a healthy economy. This year, the Fed has penciled in three additional quarter-point rate increases.
The move to taper its investments has the potential to cause further tightening. Morgan Stanley estimates that a $325 billion reduction in the Fed’s MBS holdings from April 2018 through end of 2019 may have the same impact as nearly two additional rate increases.
Finding other sources of demand won’t be easy either. Because of the Fed’s outsize role in the MBS market since the crisis, the vast majority of transactions are done by just a handful of dealers. What’s more, it’s not clear whether investors like foreign central banks and commercial banks can absorb all the extra supply — at least without wider spreads.
On the plus side, getting MBS back into the hands of private investors could help make the market more robust by increasing trading. Average daily volume has plunged more than 40 percent since the crisis, Securities Industry and Financial Markets Association data show.
“Ending reinvestment will mean there are more bonds for the private sector to buy,” said Daniel Hyman, the co-head of the agency-mortgage portfolio management team at Pacific Investment Management Co.
What’s more, it may give the central bank more flexibility to tighten policy, especially if President Donald Trump’s spending plans stir more economic growth and inflation. St. Louis Fed President James Bullard said last month that he’d prefer to use the central bank’s holdings to do some of the lifting, echoing remarks by his Boston colleague Eric Rosengren.
Nevertheless, the consequences for the U.S. housing market can’t be ignored.
The “Fed has already hiked twice and the market is expecting” more, said Munish Gupta, a manager at Nara Capital, a new hedge fund being started by star mortgage trader Charles Smart. “Tapering is the next logical step.”

China’s holdings of US Treasury securities plunged by a stunning $66.4 billion in November 2016, after having already plunged $41 billion in October, the US Treasury Department reported today in its Treasury International Capital data release. After shedding Treasuries for months, China’s holdings, now the second largest behind Japan, are down to $1.049 trillion.
At this pace, it won’t take long before China’s pile of Treasuries falls below the $1 trillion mark. It was China’s sixth month in a row of declines. Over the 12-month period, China slashed its holdings by $215.2 billion, or by 17%!
Japan’s holdings of US Treasuries dropped by $23 billion in November. Over the 12-month period, its holdings are down by $36.3 billion.

But we don’t really know all the details. We only get to see part of it. This data is collected “primarily,” as the Treasury says, from US-based custodians and broker-dealers that are holding these securities. Treasury securities in custodial accounts overseas “may not be attributed to the actual owners.” These custodial accounts are in often tiny countries with tax-haven distinctions. And what happens there, stays there. The ones with the largest holdings are (in $ billions):

The UK is on this list because of the “City of London Corporation,” the center of a web of tax havens.
Total holdings by foreign entities, including by central banks and institutional investors, fell by $96.1 billion in November. China’s decline accounted for 69% of it, and Japan’s for 24%.
This says more about China than it says about the US, or US Treasuries, though November was a particularly ugly month of US Treasuries, when the 10-year yield surged from 1.84% to 2.37%, spreading unpalatable losses among investors. This surge in yields and swoon in prices wasn’t ascribed to China’s dumping of Treasuries, of course, but to the “Trump Trade” that changed everything after the election.
But China’s foreign exchange reserves have been dropping relentlessly, as authorities are trying to prop up the yuan, while trying to figure out how to stem rampant capital flight, even as wealthy Chinese are finding ways to get around every new rule and hurdle. Authorities are trying to manage their asset bubbles, particularly in the property sector. They’re trying to keep them from getting bigger, and they’re trying to keep them from imploding, all at the same time. And they’re trying to keep their bond market duct-taped together. And in juggling all this, they’ve been unloading their official foreign exchange reserves.
They dropped by $41 billion in December to $3.0 trillion. They’re now down 25% from $4.0 trillion in the second quarter of 2014. That’s a $1-trillion decline over 30 months! What’s included in these foreign-exchange reserves is a state secret. But pundits assume that about two-thirds are securities denominated in US dollars (via Trading Economics):

Japan and China remain by far the largest creditors of the US, and the US still owes them $2.16 trillion combined. But that’s down by $90 billion from a month earlier and down $251 billion from a year earlier. And it’s not because the US is suddenly running a trade surplus with them. Far from it. But it’s because both countries are struggling with their own unique sets of problems, and something has to give.
The fact that the two formerly-largest buyers of US Treasuries are no longer adding to their positions but are instead shedding their positions has changed the market dynamics. And both have a lot more to shed! This is in addition to the changes in the Fed’s monetary policy – now that the tightening cycle has commenced in earnest. And it comes on top of rising inflation in the US. These factors are forming a toxic trifecta for Treasury bondholders.

Short Covering Setup
Ongoing Lock/Float Considerations
 To visualize the impact the recent spike in mortgage rates will have on the US housing market in general, and home refinancing activity in particular, look no further than this chart from the October Mortgage Monitor slidepack by Black Knight.
The chart profiles the sudden collapse of the refi market using October and November rates. As Black Knight writes, it looks at the – quite dramatic – effect the mortgage rate rise has had on the population of borrowers who could both likely qualify for and have interest rate incentive to refinance. It finds it was cut in half in just one month.
Some more details from the source:

Which is bad news not only for homeowners, but also for the banks, whose refi pipeline – a steady source of income and easy profit – is about to vaporize.
It’s not just refinancings, however, According to the report, as housing expert Mark Hanson notes, here is a summary of the adverse impact the spike in yields will also have on home purchases:
The carnage in bonds has consequences. The average interest rate of the a conforming 30-year fixed mortgage as of Friday was quoted at 4.125% for top credit scores. That’s up about 0.5 percentage point from just before the election, according to Mortgage News Daily. It put the month “on a short list of 4 worst months in more than a decade.”
One of the other three months on that short list occurred at the end of 2010 and two “back to back amid the 2013 Taper Tantrum,” when the Fed let it slip that it might taper QE Infinity out of existence.
Investors were not amused. From the day after the election through November 16, they yanked $8.2 billion out of bond funds, the largest weekly outflow since Taper-Tantrum June.
The 10-year Treasury yield jumped to 2.36% in late trading on Friday, the highest since December 2015, up 66 basis point since the election, and up one full percentage point since July!
The 10-year yield is at a critical juncture. In terms of reality, the first thing that might happen is a rate increase by the Fed in December, after a year of flip-flopping. A slew of post-election pronouncements by Fed heads – including Yellen’s “relatively soon” – have pushed the odds of a rate hike to 98%.
Then in January, the new administration will move into the White House. It will take them a while to get their feet on the ground. Legislation isn’t an instant thing. Lobbyists will swarm all over it and ask for more time to shoehorn their special goodies into it. In other words, that massive deficit-funded stimulus package, if it happens at all, won’t turn into circulating money for a while.
So eventually the bond market is going to figure this out and sit back and lick its wounds. A week ago, I pontificated that “it wouldn’t surprise me if yields fall some back next week – on the theory that nothing goes to heck in a straight line.”
And with impeccable timing, that’s what we got: mid-week, one teeny-weeny little squiggle in the 10-year yield, which I circled in the chart below. The only “pullback” in the yield spike since the election. (via StockCharts.com):

Note how the 10-year yield has jumped 100 basis points (1 percentage point) since July. I still think that pullback in yields is going to happen any day now. As I said, nothing goes to heck in a straight line.
In terms of dollars and cents, this move has wiped out a lot of wealth. Bond prices fall when yields rise. This chart (via StockCharts.com) shows the CBOT Price Index for the 10-year note. It’s down 5.6% since July:

The 30-year Treasury bond went through a similar drubbing. The yield spiked to 3.01%. The mid-week pullback was a little more pronounced. Since the election, the yield has spiked by 44 basis points and since early July by 91 basis points (via StockCharts.com):

Folks who have this “risk free” bond in their portfolios: note that in terms of dollars and cents, the CBOT Price Index for the 30-year bond has plunged 13.8% since early July!

However, the election razzmatazz hasn’t had much impact on junk bonds. They’d had a phenomenal run from mid-February through mid-October, when NIRP refugees from Europe and Japan plowed into them, along with those who believed that crushed energy junk bonds were a huge buying opportunity and that the banks after all wouldn’t cut these drillers’ lifelines to push them into bankruptcy, and so these junk bonds surged until mid-October. Since then, they have declined some. But they slept through the election and haven’t budged much since.
It seems worried folks fleeing junk bonds, or those cashing out at the top, were replaced by bloodied sellers of Treasuries.
Overall in bond-land, the Bloomberg Barclays Global Aggregate bond Index fell 4% from Friday November 4, just before the election, through Thursday. It was, as Bloomberg put it, “the biggest two-week rout in the data, which go back to 1990.”
And the hated dollar – which by all accounts should have died long ago – has jumped since the election, as the world now expects rate hikes from the Fed while other central banks are still jabbering about QE. In fact, it has been the place to go since mid-2014, which is when Fed heads began sprinkling their oracles with references to rate hikes (weekly chart of the dollar index DXY back to January 2014):

The markets now have a new interpretation: Every time a talking head affiliated with the future Trump administration says anything about policies — deficit-funded stimulus spending for infrastructure and defense, trade restrictions, new tariffs, walls and fences, keeping manufacturing in the US, tax cuts, and what not — the markets hear “inflation.”
So in the futures markets, inflation expectations have jumped. This chart via OtterWood Capital doesn’t capture the last couple of days of the bond carnage, but it does show how inflation expectations in the futures markets (black line) have spiked along with the 10-year yield (red line), whereas during the Taper Tantrum in 2013, inflation expectations continued to head lower:

Inflation expectations and Treasury yields normally move in sync. And they do now. The futures markets are saying that the spike in yields and mortgage rates during the Taper Tantrum was just a tantrum by a bunch of spooked traders, but that this time, it’s real, inflation is coming and rates are going up; that’s what they’re saying.
The spike in mortgage rates has already hit demand for mortgages, and mortgage applications during the week plunged. Read… What’ll Happen to Housing Bubble 2 as Mortgage Rates Jump? Oops, they’re already jumping.
Dear Janet…
In the last few months, as The Fed has jawboned a rate hike into markets, mortgage applications in America have collapsed 30% to 10-month lows – plunging over 9% in the last week as mortgage rates approach 4.00%.


We suspect the divergent surge in homebuilders is overdone…

Donald Trump’s victory sparked a tremendous sell-off in the Treasury market from an expectation of fiscal stimulus, but more broadly, from an expectation that a unified-party government can enact business-friendly policies (protectionism, deregulation, tax cuts) which will be inflationary and economically positive. It doesn’t take too much digging to show that the reality is different. The deluge of commentaries suggesting ‘big-reflation’ are short-sighted. Just as before last Tuesday we thought the 10yr UST yield would get below 1%, we still think this now.

No matter the President, this economic expansion is seven and a half years old (since 6/2009), and is pushing against a difficult history. It is already the 4th longest expansion in the US back to the 1700’s (link is external). As Larry Summers has pointed out (link is external) after 5 years of recovery, you add roughly 20% of a recession’s probability each year thereafter. Using this, there is around a 60% chance of recession now.
History also doesn’t bode well for new Republican administrations. Certainly, the circumstances were varied, but of the five new Republican administrations replacing Democrats in the 19th and 20th centuries, four of them (Eisenhower, Nixon, Reagan, and George W. Bush) faced new recessions in their first year. The fifth, Warren Harding, started his administration within a recession.
Fiscal stimulus through infrastructure projects and tax cuts is now expected, but the Federal Reserve has been begging for more fiscal help since the financial crisis and it has been politically infeasible. The desire has not created the act. A unified-party government doesn’t make it any easier when that unified party is Republican; the party of fiscal conservatism. Many newer House of Representatives members have been elected almost wholly on platforms to reduce the Federal debt. Congress has gone to the wire several times with resistance to new budgets and debt ceilings. After all, the United States still carries a AA debt rating from S&P as a memento from this. Getting a bill through congress with a direct intention to increase debt will not be easy. As we often say, the political will to do fiscal stimulus only comes about after a big enough decrease in the stock market to get policy makers scared.
Also, fiscal stimulus doesn’t seem to generate inflation, probably because it is only used as a mitigation against recessions. After the U.S. 2009 Fiscal stimulus bill, the YoY CPI fell from 1.7% to 1% two years later. Japan has now injected 26 doses (link is external) of fiscal stimulus into its economy since 1990 and the country has a 0.0% YoY core CPI, and a 10yr Government bond at 0.0%.
A hallmark of this economic recovery has been its reliance on debt to fuel it. The more debt outstanding, the more interest rates influence the economy’s performance. Not only does the Trump administration need low rates to try to sell fiscal stimulus to the nation, but the private sector needs it to survive. The household, business, and public sectors are all heavily reliant on the price of credit. So far, interest rates rising by 0.5% in the last two months is a drag on growth.

Global policies favoring low rates continue to be extended, and there isn’t any economic reason to abandon them. Just about every developed economy (US, Central Europe, Japan, UK, Scandinavia) has policies in place to encourage interest rates to be lower. To the extent that the rest of the world has lower rates than in the US, this continues to exert a downward force on Treasury yields.

As Japan knows and we are just getting into, aging demographics is an unmovable force against consumption, solved only with time. The percent of the population 65 and over in the United States is in the midst of its steepest climb. As older people spend less, paired with slowing immigration from the new administration, consumer demand slackens and puts downward pressure on prices.

We haven’t seen such a rush to judgement of boundless higher rates that we can remember. Its noise-level is correlated with its desire, not its likelihood. While we cannot call the absolute top of this movement in interest rates, it is limited by these enduring factors and thus, we think it is close to an end. In a sentence, not only will the Trump-administration policies not be enacted as imagined, but even if they were, they won’t have the net-positive effect that is hoped for. We think that a 3.0% 30yr UST is a rare opportunity buy.

The national average 30-year fixed home mortgage rate in the U.S. recently fell to 3.36 percent, matching the record low first reached in December 2012, according to Bankrate.com. Would-be home-buyers and homeowners looking to refinance existing mortgages at lower rates have benefited from a drop in U.S. Treasury yields since U.K. voters decided in June to leave the European Union. A comparable Freddie Mac mortgage gauge watched by the industry is near a record low, at 3.48 percent.

The dollar extended its slide for a second day as traders ruled out the possibility that the Federal Reserve will raise interest rates at its meeting next
The currency fell against all of its major peers, depressed by tepid U.S. job growth and comments by Fed Chair Janet Yellen that didn’t signal timing for the central bank’s next move. Traders see a zero percent chance the Fed will raise rates at its June 15 meeting, down from 22 percent a week ago, futures contracts indicate. The greenback posted its largest losses against the South African rand, the Mexican peso and the Brazilian real.
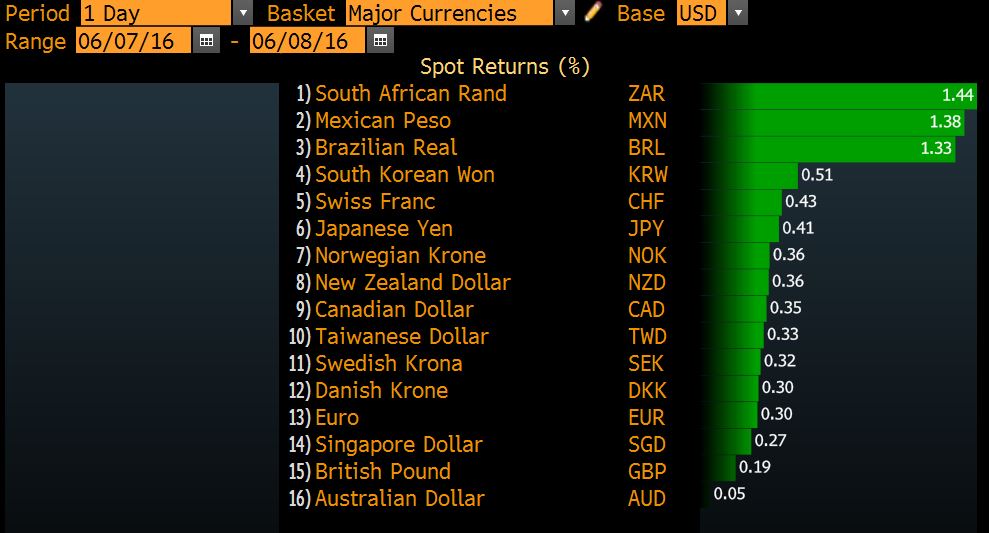
“There’s a bias to trade on the weaker side in the weeks to come” for the dollar, which will probably stay in its recent range, said Andres Jaime, a foreign-exchange and rates strategist at Barclays Plc in New York. “June and July are off the table — the probability of the Fed deciding to do something in those meetings is extremely low.”
The greenback resumed its slide this month as a lackluster jobs report weakened the case for the Fed to boost borrowing costs and dimmed prospects for policy divergence with stimulus increases in Europe and a Asia. The losses follow a rally in May, when policy makers including Yellen said higher rates in the coming months looked appropriate.
The Bloomberg Dollar Spot Index declined 0.5 percent as of 9:31 a.m. New York time, reaching the lowest level since May 4. The U.S. currency slipped 0.4 percent against the euro to $1.1399 and lost 0.5 percent to 106.83 yen.
There’s a 59 percent probability the central bank will hike by year-end, futures data showed. The Federal Open Market Committee will end two-day meeting on June 15 with a policy statement, revised economic projections and a news conference.
“Until the U.S. economy can make the case for a rate rise, the dollar will be at risk of slipping further,” said Joe Manimbo, an analyst with Western Union Business Solutions, a unit of Western Union Co., in Washington. The Fed’s “economic projections are going to be key, as well as Ms. Yellen’s news conference — if they were to sketch an even shallower path of rate rises next week, that would add fuel to the dollar’s selloff.”


According to the National Association of Realtors (NAR), the U.S. housing market will continue its gradual pace of recovery as more home buyers enter a tight housing market for the balance of 2015, being nudged by rising mortgage rates and improving consumer confidence.
NAR’s chef economist Lawrence Yun has released the following observations for the US economy at large, and for the U.S. housing market specifically:
The U.S. Economy
The U.S. Housing Market Mid-2015 Trends
Not buying a home right now will cost you, because home prices and interest rates are going to rise. Many renters would like to own, but they can’t afford down payments or don’t qualify for mortgages. Those two conclusions, drawn from separate reports released this week, sum up the housing market dilemma for many young professionals: Buyers get more for their money than renters—but most renters can’t afford to enter the home buying market.
The chart below comes from data published today by realtor.com that estimates the financial benefits of buying a home based on projected increases in mortgage rates and home prices in local housing markets. Specifically, it shows the amount that buyers gain, over a 30-year period, over renters in the country’s largest metropolitan areas.

The penalties for waiting to buy tend to be greater in smaller metro areas, especially in California. For example, the estimated cost of waiting one year was $61,805 in San Jose and $65,780 in Santa Cruz. Over the course of 30 years, homeowners save more than $1 million in Santa Cruz, the largest amount of any U.S. city.
To compile those numbers, realtor.com compared median home prices and the cost of renting a three-bedroom home in 382 local markets, then factored in estimates for transaction costs, price appreciation, future mortgage rates, and interest earned on any money renters saved when it was cheaper to rent.
In other words, researchers went to a lot of trouble to quantify something that renters intuitively know: They would probably be better off if they could come up with the money to buy. Eighty-one percent of renters said they would prefer to own but can’t afford it, according to a new report on Americans’ economic well-being published by the Federal Reserve.

Not all markets favor buyers over renters. In Dallas, the benefit of buying was about $800 over 30 years, according to realtor.com’s model, which expects price appreciation to regress to historical norms. In many popular markets, though, there are greater benefits to owning.
“It shouldn’t be a surprise that the places where you can have the highest reward over time also have the highest prices,” said Jonathan Smoke, chief economist for realtor.com. “It’s not true that if you’re a median-income household, that you can’t find a home that’s affordable, but in places like San Jose and Santa Cruz, less than 10 percent of inventory would be affordable.”
Or as Logan Mohtashami, a senior loan officer at AMC Lending Group in Irvine, Calif., told Bloomberg Radio this week: “The rich have no problem buying homes.”
“Mortgage Rates need to go up. There it is. They do. These rates are killing the industry. The DC Real Estate Market is the Poster Child for why interest rates need to go up.”

Since the beginning of this year, I have lost two clients to the decision to rent for another year. I have written 11 contracts for would-be home buyers, and I have only been able to secure two of those contracts. I promise this is not because I’m a horrible agent. It is because I have a conscience, and I don’t let clients do stupid things on my watch.
The bidding wars are insane and when the going gets tough, I advise people to take their money and keep looking. I realize that steering people away from buying houses and wishing rates would go up makes me the anti-Agent, but flying with the pack is overrated.
It is profoundly problematic for interest rates to stay so low for this long. The primary reason is that it shifts demand and supply into different time frames instead of letting the economy adjust and self-correct.
Buyers live in “today,” and if they think rates will go up, they panic. If rates tick up an eighth of a point, they feel robbed and cheated. They lament the fact that they didn’t get the house they bid on last week. Then, a few days pass, and rates drop back down, and they kick up their feet and start singing again. They run back out to see more houses. Feeling the looming threat of a rate increase again, they scramble to buy something – anything, just to lock in the low rate. Operating solely out of fear of a rate hike, they become desperate. They make the mistake of overpaying.
We see it every single day, but it bears repeating: low rates encourage desperate buyers to bid prices up, sometimes to an unrealistic number. The demand of the future is effectively robbed because next year’s home buyer is buying now.
That desperate buyer out there? They are not the only one. There are plenty of others, competing for homes and driving prices up, all in the name of interest rates and not necessarily because of real need. Many of these buyers will get homes that need work, are imperfect, are not in desirable areas, because it was all they could get, and they wanted to lock in while the rates were low.
Instead of a balanced market where these less than desirable homes sell for lower prices, the low rates make even the duds look better. Two more problems stem from this scenario.

First, these homes will still be duds in several years unless the location magically improves or the owner renovates to make the home more desirable. When markets are more balanced, buyers aren’t interested in these homes if they can get one in a better area or better condition for a similar price.
Second, many of the homes purchased today would be on the market again in 5-10 years due to normal changes in people’s lives that require them to sell. If prices stabilize or even slide when this looming rate hike hits, anyone who overpaid will be faced with three options: sell for a loss (which many won’t do), stay, or rent the house to someone else. So now the supply for the future is compromised too.
Many of today’s home sellers have locked in or refinanced at low rates and can make money if they rent. They can move on to another house and let their current one become an investment. And look at that! They don’t even have to refinance to loan-to-value ratios of 75% that are required of investors.
If they recently refinanced while this was their primary home, they can have a much higher loan-to-value ratio than if they were to purchase the same house at the same price but strictly as an investment. Why sell? Seems like a home run to just rent it, which many do, so they can take some monthly cash flow with them and move on. So there’s another house that will not be on the market for sale this spring.

There are also cases where people need or want to move, but are priced out of buying anything else. I recently had a chat with someone who asked my advice on this issue. Because of a schooling situation with their child, they were considering moving from Maryland to Virginia for several years, then moving back and wanted to know what they could sell their house for. I asked why they would sell it, given the costs of selling, moving, buying, selling again, and moving back. They wisely noted, “Yes, and in 3 years, we probably couldn’t afford our neighborhood again since we really couldn’t afford to buy again right now.”
I stopped them from four needless transactions and advised them to rent their home out and rent a place to live so they could come back to their home when they were ready. Well, there’s another four transactions that won’t be happening in the next decade. And I’m not sorry.
After this weekend of house tours, I’ll be writing 5 contracts for 2 different clients with the hopes that they each walk away with a house. Crossing my fingers. And I’ve told both of these clients as well as all my others: things are looking too unstable for the near future and not to plan on selling in the next 10 years. They need to buy the best house they can get for the best deal possible, not be afraid to walk away from overpriced homes, and not get into a bidding war. If they can commit to that, they stand a chance of making a decent investment.
By Melissa Terzis, Realtor, City Chic Real Estate, Washington, DC

for Bloomberg News
Bill Gross, the former manager of the world’s largest bond fund, said the Federal Reserve won’t raise interest rates until late this year “if at all” as falling oil prices and a stronger U.S. dollar limit the central bank’s room to increase borrowing costs.
While the Fed has concluded its three rounds of asset purchases, known as quantitative easing, interest rates in almost all developed economies will remain near zero as central banks in Europe and Japan embark on similar projects, Gross said today in an outlook published on the website of Janus Capital Group Inc. (JNS:US), where he runs the $1.2 billion Janus Global Unconstrained Bond Fund.
“With the U.S. dollar strengthening and oil prices declining, it is hard to see even the Fed raising short rates until late in 2015, if at all,” he said. “With much of the benefit from loose monetary policies already priced into the markets, a more conservative investment approach may be warranted by maintaining some cash balances. Be prepared for low returns in almost all asset categories.”
Benchmark U.S. oil prices fell below $50 a barrel for the first time in more than five years today, as surging supply signaled that the global glut that drove crude into a bear market will persist. Gross, the former chief investment officer of Pacific Investment Management Co. who left that firm in September to join Janus, said in a Dec. 12 Bloomberg Surveillance interview with Tom Keene that the Fed has to take lower oil prices “into consideration” and take more of a “dovish” stance.
Yields on the 10-year U.S. Treasury note fell to 2.05 percent today, the lowest level since May 2013. Economists predict the U.S. 10-year yield will rise to 3.06 percent by end of 2015, according to a Bloomberg News survey with the most recent forecasts given the heaviest weightings.
 by Phil Hall
The precipitous drop in global oil prices has created a domino effect that led to a new decline in lower mortgage rates, according to a report by Chris Flanagan, a mortgage rate specialist at Bank of America Merrill Lynch.
“The oil collapse of 2014 appears to have been a key driver [in declining mortgage rates],” stated Flanagan in his report, which was obtained by CBS Moneywatch. “Further oil price declines could lead the way to sub-3.5 percent mortgage rates.”
Flanagan applauded this development, noting that the reversal of mortgage rates might propel housing to a stronger recovery.
“We have maintained the view that 4 percent mortgage rates are too high to allow for sustainable recovery in housing,” he wrote. Flanagan also theorized that if rates fell into 3.25 percent to 3.5 percent range, it would boost “supply from both refinancing and purchase mortgage channels.”
Flanagan’s report echoes the sentiments expressed by Frank Nothaft, Freddie Mac’s chief economist, who earlier this week identified the link between oil prices and housing.
“The recent drop in oil prices has been an unexpected boon for consumers’ pocketbooks and most businesses,” Nothaft stated. “Economic growth has picked up over the final nine months of 2014 and lower energy costs are expected to support growth of about 3 percent for the U.S. in 2015. Therefore we expect the housing market to continue to strengthen with home sales rising to their best sales pace in eight years, national house price indexes up, and rental markets continuing to display low vacancy rates and the highest level of new apartment completions in 25 years.”
But not everyone is expected to benefit from this development. A report issued last week by the Houston Association of Realtors forecast a 10 percent to 12 percent drop in home sales over the next year, owing to a potential slowdown in job growth for the Houston market’s energy industry if oil prices continue to plummet.

If you really would rather own the property than the note, take a few lessons in fraud from Owen Financial Corp. According to allegations from New York’s financial regulator, Benjamin Lawsky, the lender sent “thousands” of foreclosure “warnings” to borrowers months after the window of time had lapsed during which they could have saved their homes[1]. Lawskey alleges that many of the letters were even back-dated to give the impression that they had been sent in a timely fashion. “In many cases, borrowers received a letter denying a mortgage loan modification, and the letter was dated more than 30 days prior to the date that Ocwen mailed the letter.”
The correspondence gave borrowers 30 days from the date of the denial letter to appeal, but the borrowers received the letters after more than 30 days had passed. The issue is not a small one, either. Lawskey says that a mortgage servicing review at Ocwen revealed “more than 7,000” back-dated letters.”
In addition to the letters, Ocwen only sent correspondence concerning default cures after the cure date for delinquent borrowers had passed and ignored employee concerns that “letter-dating processes were inaccurate and misrepresented the severity of the problem.” While Lawskey accused Ocwen of cultivating a “culture that disregards the needs of struggling borrowers,” Ocwen itself blamed “software errors” for the improperly-dated letters[2]. This is just the latest in a series of troubles for the Atlanta-based mortgage servicer; The company was also part the foreclosure fraud settlement with 49 of 50 state attorneys general and recently agreed to reduce many borrowers’ loan balances by $2 billion total.
Most people do not realize that Ocwen, although the fourth-largest mortgage servicer in the country, is not actually a bank. The company specializes specifically in servicing high-risk mortgages, such as subprime mortgages. At the start of 2014, it managed $106 billion in subprime loans. Ocwen has only acknowledged that 283 New York borrowers actually received improperly dated letters, but did announce publicly in response to Lawskey’s letter that it is “investigating two other cases” and cooperating with the New York financial regulator.
WHAT WE THINK: While it’s tempting to think that this is part of an overarching conspiracy to steal homes in a state (and, when possible, a certain enormous city) where real estate is scarce, in reality the truth of the matter could be even more disturbing: Ocwen and its employees just plain didn’t care. There was a huge, problematic error that could have prevented homeowners from keeping their homes, but the loan servicer had already written off the homeowners as losers in the mortgage game. A company that services high-risk loans likely has a jaded view of borrowers, but that does not mean that the entire culture of the company should be based on ignoring borrowers’ rights and the vast majority of borrowers who want to keep their homes and pay their loans. Sure, if you took out a mortgage then you have the obligation to pay even if you don’t like the terms anymore. On the other side of the coin, however, your mortgage servicer has the obligation to treat you like someone who will fulfill their obligations rather than rigging the process so that you are doomed to fail.
Do you think Lawskey is right about Ocwen’s “culture?” What should be done to remedy this situation so that note investors and homeowners come out of it okay?
Thank you for reading the Bryan Ellis Investing Letter!
Your comments and questions are welcomed below.
[2] http://realestate.aol.com/blog/2014/10/22/ocwen-mortgage-alleged-foreclosure-abuse/
http://investing.bryanellis.com/11703/lender-fakes-foreclosure-notices-to-steal-homes/
—
Ocwen posts open letter and apology to borrowers
Pledges independent investigation and rectification
October 27, 2014 10:37AM
Ocwen Financial (OCN) has taken a beating after the New York Department of Financial Services sent a letter to the company on Oct. 21 alleging that the company had been backdating letters to borrowers, and now Ocwen is posting an open letter to homeowners.
Ocwen CEO Ron Faris writes to its clients explaining what happened and what steps the company is taking to investigate the issue, identify any problems, and rectify the situation.
Click here to read the full text of the letter.
“At Ocwen, we take our mission of helping struggling borrowers very seriously, and if you received one of these incorrectly-dated letters, we apologize. I am writing to clarify what happened, to explain the actions we have taken to address it, and to commit to ensuring that no borrower suffers as a result of our mistakes,” he writes.
“Historically letters were dated when the decision was made to create the letter versus when the letter was actually created. In most instances, the gap between these dates was three days or less,” Faris writes. “In certain instances, however, there was a significant gap between the date on the face of the letter and the date it was actually generated.”
Faris says that Ocwen is investigating all correspondence to determine whether any of it has been inadvertently misdated; how this happened in the first place; and why it took so long to fix it. He notes that Ocwen is hiring an independent firm to conduct the investigation, and that it will use its advisory council comprised of 15 nationally recognized community advocates and housing counselors.
“We apologize to all borrowers who received misdated letters. We believe that our backup checks and controls have prevented any borrowers from experiencing a foreclosure as a result of letter-dating errors. We will confirm this with rigorous testing and the verification of the independent firm,” Faris writes. “It is worth noting that under our current process, no borrower goes through a foreclosure without a thorough review of his or her loan file by a second set of eyes. We accept appeals for modification denials whenever we receive them and will not begin foreclosure proceedings or complete a foreclosure that is underway without first addressing the appeal.”
Faris ends by saying that Ocwen is committed to keeping borrowers in their homes.
“Having potentially caused inadvertent harm to struggling borrowers is particularly painful to us because we work so hard to help them keep their homes and improve their financial situations. We recognize our mistake. We are doing everything in our power to make things right for any borrowers who were harmed as a result of misdated letters and to ensure that this does not happen again,” he writes.
Last week the fallout from the “Lawsky event” – so called because of NYDFS Superintendent Benjamin Lawsky – came hard and fast.
Compass Point downgraded Ocwen affiliate Home Loan Servicing Solutions (HLSS) from Buy to Neutral with a price target of $18.
Meanwhile, Moody’s Investors Service downgraded Ocwen Loan Servicing LLC’s servicer quality assessments as a primary servicer of subprime residential mortgage loans to SQ3 from SQ3+ and as a special servicer of residential mortgage loans to SQ3 from SQ3+.
Standard & Poor’s Ratings Services lowered its long-term issuer credit rating to ‘B’ from ‘B+’ on Ocwen on Wednesday and the outlook is negative.
http://www.housingwire.com/articles/31846-ocwen-posts-open-letter-and-apology-to-borrowers
—-
Ocwen Writes Open Letter to Homeowners Concerning Letter Dating Issues
October 24, 2014
Dear Homeowners,
In recent days you may have heard about an investigation by the New York Department of Financial Services’ (DFS) into letters Ocwen sent to borrowers which were inadvertently misdated. At Ocwen, we take our mission of helping struggling borrowers very seriously, and if you received one of these incorrectly-dated letters, we apologize. I am writing to clarify what happened, to explain the actions we have taken to address it, and to commit to ensuring that no borrower suffers as a result of our mistakes.
What Happened
Historically letters were dated when the decision was made to create the letter versus when the letter was actually created. In most instances, the gap between these dates was three days or less. In certain instances, however, there was a significant gap between the date on the face of the letter and the date it was actually generated.
What We Are Doing
We are continuing to investigate all correspondence to determine whether any of it has been inadvertently misdated; how this happened in the first place; and why it took us so long to fix it. At the end of this exhaustive investigation, we want to be absolutely certain that we have fixed every problem with our letters. We are hiring an independent firm to investigate and to help us ensure that all necessary fixes have been made.
Ocwen has an advisory council made up of fifteen nationally recognized community advocates and housing counsellors. The council was created to improve our borrower outreach to keep more people in their homes. We will engage with council members to get additional guidance on making things right for any borrowers who may have been affected in any way by this error.
We apologize to all borrowers who received misdated letters. We believe that our backup checks and controls have prevented any borrowers from experiencing a foreclosure as a result of letter-dating errors. We will confirm this with rigorous testing and the verification of the independent firm. It is worth noting that under our current process, no borrower goes through a foreclosure without a thorough review of his or her loan file by a second set of eyes. We accept appeals for modification denials whenever we receive them and will not begin foreclosure proceedings or complete a foreclosure that is underway without first addressing the appeal.
In addition to these efforts we are committed to cooperating with DFS and all regulatory agencies.
We Are Committed to Keeping Borrowers in Their Homes
Having potentially caused inadvertent harm to struggling borrowers is particularly painful to us because we work so hard to help them keep their homes and improve their financial situations. We recognize our mistake. We are doing everything in our power to make things right for any borrowers who were harmed as a result of misdated letters and to ensure that this does not happen again. We remain deeply committed to keeping borrowers in their homes because we believe it is the right thing to do and a win/win for all of our stakeholders.
We will be in further communication with you on this matter.
Sincerely,
Ron Faris
CEO
YOU DECIDE
—
Ocwen Downgrade Puts RMBS at Risk
Moody’s and S&P downgraded Ocwen’s servicer quality rating last week after the New York Department of Financial Services made “backdating” allegations. Barclays says the downgrades could put some RMBS at risk of a servicer-driven default.

One of the most surprising developments in the aftermath of the housing crisis is the sharp rise in apartment building construction. Evidently post-recession Americans would rather rent apartments than buy new houses.
When I noticed this trend, I wanted to see what was behind the numbers.
Is it possible Americans are giving up on the idea of home ownership, the very staple of the American dream? Now that would be a good story.
What I found was less extreme but still interesting: The American dream appears merely to be on hold.
Economists told me that many potential home buyers can’t get a down payment together because the recession forced them to chip away at their savings. Others have credit stains from foreclosures that will keep them out of the mortgage market for several years.
More surprisingly, it turns out that the millennial generation is a driving force behind the rental boom. Young adults who would have been prime candidates for first-time home ownership are busy delaying everything that has to do with becoming a grown-up. Many even still live at home, but some data shows they are slowly beginning to branch out and find their own lodgings — in rental apartments.
A quick Internet search for new apartment complexes suggests that developers across the country are seizing on this trend and doing all they can to appeal to millennials. To get a better idea of what was happening, I arranged a tour of a new apartment complex in suburban Washington that is meant to cater to the generation.
What I found made me wish I was 25 again. Scented lobbies crammed with funky antiques that led to roof decks with outdoor theaters and fire pits. The complex I visited offered Zumba classes, wine tastings, virtual golf and celebrity chefs who stop by to offer cooking lessons.
“It’s like an assisted-living facility for young people,” the photographer accompanying me said.
Economists believe that the young people currently filling up high-amenity rental apartments will eventually buy homes, and every young person I spoke with confirmed that this, in fact, was the plan. So what happens to the modern complexes when the 20-somethings start to buy homes? It’s tempting to envision ghost towns of metal and pipe wood structures with tumbleweeds blowing through the lobbies. But I’m sure developers will rehabilitate them for a new demographic looking for a renter’s lifestyle.

But one of my favorite quotes is Napoleon’s definition of a military genius: “The man who can do the average thing when all those around him are going crazy.” To me, you don’t have to be a genius to do well in investing. You just have to not go crazy when everyone else is.
In my view, this slump of the energy stocks is a deja-vu situation, that reminded me of the natural gas frenzy back in early 2014, when some fellow newsletter editors and opinion makers with appearances on the media (i.e. CNBC, Bloomberg) were calling for $8 and $10 per MMbtu, trapping many investors on the wrong side of the trade. In contrast, I wrote a heavily bearish article on natural gas in February 2014, when it was at $6.2/MMbtu, presenting twelve reasons why that sky high price was a temporary anomaly and would plunge very soon. I also put my money where my mouth was and bought both bearish ETFs (NYSEARCA:DGAZ) and (NYSEARCA:KOLD), as shown in the disclosure of that bearish article. Thanks to these ETFs, my profits from shorting the natural gas were quick and significant.
This slump of the energy stocks also reminded me of those analysts and investors who were calling for $120/bbl and $150/bbl in H1 2014. Even T. Boone Pickens, founder of BP Capital Management, told CNBC in June 2014 that if Iraq’s oil supply goes offline, crude prices could hit $150-$200 a barrel.
But people often go to the extremes because this is the human nature. But shrewd investors must exploit this inherent weakness of human nature to make easy money, because factory work has never been easy.
The chart for the bullish ETF (NYSEARCA:BNO) that tracks Brent is illustrated below:

And the charts for the bullish ETFs (NYSEARCA:USO), (NYSEARCA:DBO) and (NYSEARCA:OIL) that track WTI are below:

and below:

and below:

For the risky investors, there is the leveraged bullish ETF (NYSEARCA:UCO), as illustrated below:

It is clear that these ETFs have returned back to their early 2011 levels amid fears for oversupply and global economy worries. Nevertheless, the recent growth data from the major global economies do not look bad at all.
In China, things look really good. The Chinese economy grew 7.3% in Q3 2014, which is way far from a hard-landing scenario that some analysts had predicted, and more importantly the Chinese authorities seem to be ready to step in with major stimulus measures such as interest rate cuts, if needed. Let’s see some more details about the Chinese economy:
1) Exports rose 15.3% in September from a year earlier, beating a median forecast in a Reuters poll for a rise of 11.8% and quickening from August’s 9.4% rise.
2) Imports rose 7% in terms of value, compared with a Reuters estimate for a 2.7% fall.
3) Iron ore imports rebounded to the second highest this year and monthly crude oil imports rose to the second highest on record.
4) China posted a trade surplus of $31.0 billion in September, down from $49.8 billion in August.
Beyond the encouraging growth data coming from China (the second largest oil consumer worldwide), the US economy grew at a surprising 4.6% rate in Q2 2014, which is the fastest pace in more than two years.
Meanwhile, the Indian economy picked up steam and rebounded to a 5.7% rate in Q2 2014 from 4.6% in Q1, led by a sharp recovery in industrial growth and gradual improvement in services. And after overtaking Japan as the world’s third-biggest crude oil importer in 2013, India will also become the world’s largest oil importer by 2020, according to the US Energy Information Administration (EIA).
The weakness in Europe remains, but this is nothing new over the last years. And there is a good chance Europe will announce new economic policies to boost the economy over the next months. For instance and based on the latest news, the European Central Bank is considering buying corporate bonds, which is seen as helping banks free up more of their balance sheets for lending.
All in all, and considering the recent growth data from the three biggest oil consumers worldwide, I get the impression that the global economy is in a better shape than it was in early 2011. On top of that, EIA forecasts that WTI and Brent will average $94.58 and $101.67 respectively in 2015, and obviously I do not have any substantial reasons to disagree with this estimate.
When it comes to investing, timing matters. In other words, a lucrative investment results from a great entry price. And based on the current price, I am bullish on oil for the following reasons:
1) Expiration of the oil contracts: They expired last Thursday and the shorts closed their bearish positions and locked their profits.
2) Restrictions on US oil exports: Over the past three years, the average price of WTI oil has been $13 per barrel cheaper than the international benchmark, Brent crude. That gives large consumers of oil such as refiners and chemical companies a big cost advantage over foreign rivals and has helped the U.S. become the world’s top exporter of refined oil products.
Given that the restrictions on US oil exports do not seem to be lifted anytime soon, the shale oil produced in the US will not be exported to impact the international supply/demand and lower Brent price in the short-to-medium term.
3) The weakening of the U.S. dollar: The U.S. dollar rose significantly against the Euro over the last months because of a potential interest rate hike.
However, U.S. retail sales declined in September 2014 and prices paid by businesses also fell. Another report showed that both ISM indices weakened in September 2014, although the overall economic growth remained very strong in Q3 2014.
The ISM manufacturing survey showed that the reading fell back from 59.0 in August 2014 to 56.6 in September 2014. The composite non-manufacturing index dropped back as well, moving down from 59.6 in August 2014 to 58.6 in September 2014.
(click to enlarge)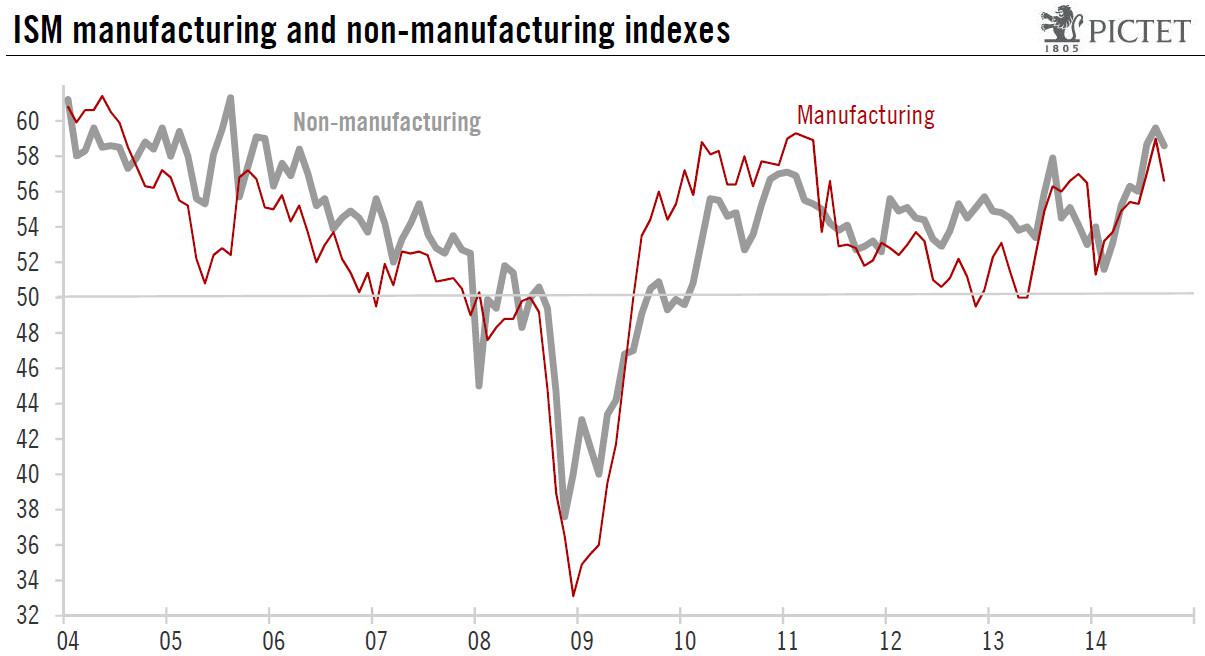
Source: Pictet Bank website
These reports coupled with a weak growth in Europe and a potential slowdown in China could hurt U.S. exports, which could in turn put some pressure on the U.S. economy.
These are reasons for caution and will most likely deepen concerns at the U.S. Federal Reserve. A rate hike too soon could cause problems to the fragile U.S. economy which is gradually recovering. “If foreign growth is weaker than anticipated, the consequences for the U.S. economy could lead the Fed to remove accommodation more slowly than otherwise,” the U.S. central bank’s vice chairman, Stanley Fischer, said.
That being said, the US Federal Reserve will most likely defer to hike the interest rate planned to begin in H1 2015. A delay in expected interest rate hikes will soften the dollar over the next months, which will lift pressure off the oil price and will push Brent higher.
4) OPEC’s decision to cut supply in November 2014: Many OPEC members need the price of oil to rise significantly from the current levels to keep their house in fiscal order. If Brent remains at $85-$90, these countries will either be forced to borrow more to cover the shortfall in oil tax revenues or cut their promises to their citizens. However, tapping bond markets for financing is very expensive for the vast majority of the OPEC members, given their high geopolitical risk. As such, a cut on promises and social welfare programs is not out of the question, which will likely result in protests, social unrest and a new “Arab Spring-like” revolution in some of these countries.
This is why both Iran and Venezuela are calling for an urgent OPEC meeting, given that Venezuela needs a price of $121/bbl, according to Deutsche Bank, making it one of the highest break-even prices in OPEC. Venezuela is suffering rampant inflation which is currently around 50%, and the government currency controls have created a booming black currency market, leading to severe shortages in the shops.
Bahrain, Oman and Nigeria have not called for an urgent OPEC meeting yet, although they need between $100/bbl and $136/bbl to meet their budgeted levels. Qatar and UAE also belong to this group, although hydrocarbon revenues in Qatar and UAE account for close to 60% of the total revenues of the countries, while in Kuwait, the figure is close to 93%.
The Gulf producers such as the UAE, Qatar and Kuwait are more resilient than Venezuela or Iran to the drop of the oil price because they have amassed considerable foreign currency reserves, which means that they could run deficits for a few years, if necessary. However, other OPEC members such as Iran, Iraq and Nigeria, with greater domestic budgetary demands because of their large population sizes in relation to their oil revenues, have less room to maneuver to fund their budgets.
And now let’s see what is going on with Saudi Arabia. Saudi Arabia is too reliant on oil, with oil accounting for 80% of export revenue and 90% of the country’s budget revenue. Obviously, Saudi Arabia is not a well-diversified economy to withstand low Brent prices for many months, although the country’s existing sovereign wealth fund, SAMA Foreign Holdings, run by the country’s central bank, consisting mainly of oil surpluses, is the world’s third-largest, with assets totaling 737.6 billion US dollars.
This is why Prince Alwaleed bin Talal, billionaire investor and chairman of Kingdom Holding, said back in 2013: “It’s dangerous that our income is 92% dependent on oil revenue alone. If the price of oil decline was to decline to $78 a barrel there will be a gap in our budget and we will either have to borrow or tap our reserves. Saudi Arabia has SAR2.5 trillion in external reserves and unfortunately the return on this is 1 to 1.5%. We are still a nation that depends on the oil and this is wrong and dangerous. Saudi Arabia’s economic dependence on oil and lack of a diverse revenue stream makes the country vulnerable to oil shocks.”
And here are some additional key factors that the oil investors need to know about Saudi Arabia to place their bets accordingly:
a) Saudi Arabia’s most high-profile billionaire and foreign investor, Prince Alwaleed bin Talal, has launched an extraordinary attack on the country’s oil minister for allowing prices to fall. In a recent letter in Arabic addressed to ministers and posted on his website, Prince Alwaleed described the idea of the kingdom tolerating lower prices below $100 per barrel as potentially “catastrophic” for the economy of the desert kingdom. The letter is a significant attack on Saudi’s highly respected 79-year-old oil minister Ali bin Ibrahim Al-Naimi who has the most powerful voice within the OPEC.
b) Back in June 2014, Saudi Arabia was preparing to launch its first sovereign wealth fund to manage budget surpluses from a rise in crude prices estimated at hundreds of billions of dollars. The fund would be tasked with investing state reserves to “assure the kingdom’s financial stability,” Shura Council financial affairs committee Saad Mareq told Saudi daily Asharq Al-Awsat back then. The newspaper said the fund would start with capital representing 30% of budgetary surpluses accumulated over the years in the kingdom. The thing is that Saudi Arabia is not going to have any surpluses if Brent remains below $90/bbl for months.
c) Saudi Arabia took immediate action in late 2011 and early 2012, under the fear of contagion and the destabilisation of Gulf monarchies. Saudi Arabia funded those emergency measures, thanks to Brent which was much higher than $100/bbl back then. It would be difficult for Saudi Arabia to fund these billion dollar initiatives if Brent remained at $85-$90 for long.
d) Saudi Arabia and the US currently have a common enemy which is called ISIS. Moreover, the American presence in the kingdom’s oil production has been dominant for decades, given that U.S. petroleum engineers and geologists developed the kingdom’s oil industry throughout the 1940s, 1950s and 1960s.
From a political perspective, the U.S. has had a discreet military presence since 1950s and the two countries were close allies throughout the Cold War in order to prevent the communists from expanding to the Middle East. The two countries were also allies throughout the Iran-Iraq war and the Gulf War.
5) Geopolitical Risk: Right now, Brent price carries a zero risk premium. Nevertheless, the geopolitical risk in the major OPEC exporters (i.e. Nigeria, Algeria, Libya, South Sudan, Iraq, Iran) is highly volatile, and several things can change overnight, leading to an elevated level of geopolitical risk anytime.
For instance, the Levant has a new bogeyman. ISIS, the Islamic State of Iraq, emerged from the chaos of the Syrian civil war and has swept across Iraq, making huge territorial gains. Abu Bakr al-Baghdadi, the group’s figurehead, has claimed that its goal is to establish a Caliphate across the whole of the Levant and that Jordan is next in line.
At least 435 people have been killed in Iraq in car and suicide bombings since the beginning of the month, with an uptick in the number of these attacks since the beginning of September 2014, according to Iraq Body Count, a monitoring group tracking civilian deaths. Most of those attacks occurred in Baghdad and are the work of Islamic State militants. According to the latest news, ISIS fighters are now encamped on the outskirts of Baghdad, and appear to be able to target important installations with relative ease.
Furthermore, Libya is on the brink of a new civil war and finding a peaceful solution to the ongoing Libyan crisis will not be easy. According to the latest news, Sudan and Egypt agreed to coordinate efforts to achieve stability in Libya through supporting state institutions, primarily the military who is fighting against Islamic militants. It remains to be see how effective these actions will be.
On top of that, the social unrest in Nigeria is going on. Nigeria’s army and Boko Haram militants have engaged in a fierce gun battle in the north-eastern Borno state, reportedly leaving scores dead on either side. Several thousand people have been killed since Boko Haram launched its insurgency in 2009, seeking to create an Islamic state in the mainly Muslim north of Nigeria.
6) Seasonality And Production Disruptions: Given that winter is coming in the Northern Hemisphere, the global oil demand will most likely rise effective November 2014.
Also, U.S. refineries enter planned seasonal maintenance from September to October every year as the federal government requires different mixtures in the summer and winter to minimize environmental damage. They transition to winter-grade fuel from summer-grade fuels. U.S. crude oil refinery inputs averaged 15.2 million bopd during the week ending October 17. Input levels were 113,000 bopd less than the previous week’s average. Actually, the week ending October 17 was the eighth week in a row of declines in crude oil runs, and these rates were the lowest since March 2014. After all and given that the refineries demand less crude during this period of the year, the price of WTI remains depressed.
On top of that, the production disruptions primarily in the North Sea and the Gulf of Mexico are not out of the question during the winter months. Even Saudi Arabia currently faces production disruptions. For instance, production was halted just a few days ago for environmental reasons at the Saudi-Kuwait Khafji oilfield, which has output of 280,000 to 300,000 bopd.
7) Sentiment: To me, the recent sell off in BNO is overdone and mostly speculative. To me, the recent sell-off is primarily a result of a headline-fueled anxiety and bearish sentiment.
8) Jobs versus Russia: According to Olga Kryshtanovskaya, a sociologist studying the country’s elite at the Russian Academy of Sciences in Moscow, top Kremlin officials said after the annexation of Crimea that they expected the U.S. to artificially push oil prices down in collaboration with Saudi Arabia in order to damage Russia.
And Russia is stuck with being a resource-based economy and the cheap oil chokes the Russian economy, putting pressure on Vladimir Putin’s regime, which is overwhelmingly reliant on energy, with oil and gas accounting for 70% of its revenues. This is an indisputable fact.
The current oil price is less than the $104/bbl on average written into the 2014 Russian budget. As linked above, the Russian budget will fall into deficit next year if Brent is less than $104/bbl, according to the Russian investment bank Sberbank CIB. At $90/bbl, Russia will have a shortfall of 1.2% of gross domestic product. Against a backdrop of falling revenue, finance minister Anton Siluanov warned last week that the country’s ambitious plans to raise defense spending had become unaffordable.
Meanwhile, a low oil price is also helping U.S. consumers in the short term. However, WTI has always been priced in relation to Brent, so the current low price of WTI is actually putting pressure on the US consumers in the midterm, given that the number one Job Creating industry in the US (shale oil) will collapse and many companies will lay off thousands of people over the next few months. The producers will cut back their growth plans significantly, and the explorers cannot fund the development of their discoveries. This is another indisputable fact too.
For instance, sliding global oil prices put projects under heavy pressure, executives at Chevron (NYSE:CVX) and Statoil (NYSE:STO) told an oil industry conference in Venezuela. Statoil Venezuela official Luisa Cipollitti said at the conference that mega-projects globally are under threat, and estimates that more than half the world’s biggest 163 oil projects require a $120 Brent price for crude.
Actually, even before the recent fall of the oil price, the oil companies had been cutting back on significant spending, in a move towards capital discipline. And they had been making changes that improve the economies of shale, like drilling multiple wells from a single pad and drilling longer horizontal wells, because the “fracking party” was very expensive. Therefore, the drop of the oil price just made things much worse, because:
a) Shale Oil: Back in July 2014, Goldman Sachs estimated that U.S. shale producers needed $85/bbl to break even.
b) Offshore Oil Discoveries: Aside Petr’s (NYSE: PBR) pre-salt discoveries in Brazil, Kosmos Energy’s (NYSE: KOS) Jubilee oilfield in Ghana and Jonas Sverdrup oilfield in Norway, there have not been any oil discoveries offshore that move the needle over the last decade, while depleting North Sea fields have resulted in rising costs and falling production.
The pre-salt hype offshore Namibia and offshore Angola has faded after multiple dry or sub-commercial wells in the area, while several major players have failed to unlock new big oil resources in the Arctic Ocean. For instance, Shell abandoned its plans in the offshore Alaskan Arctic, and Statoil is preparing to drill a final exploration well in the Barents Sea this year after disappointing results in its efforts to unlock Arctic resources.
Meanwhile, the average breakeven cost for the Top 400 offshore projects currently is approximately $80/bbl (Brent), as illustrated below:
(click to enlarge)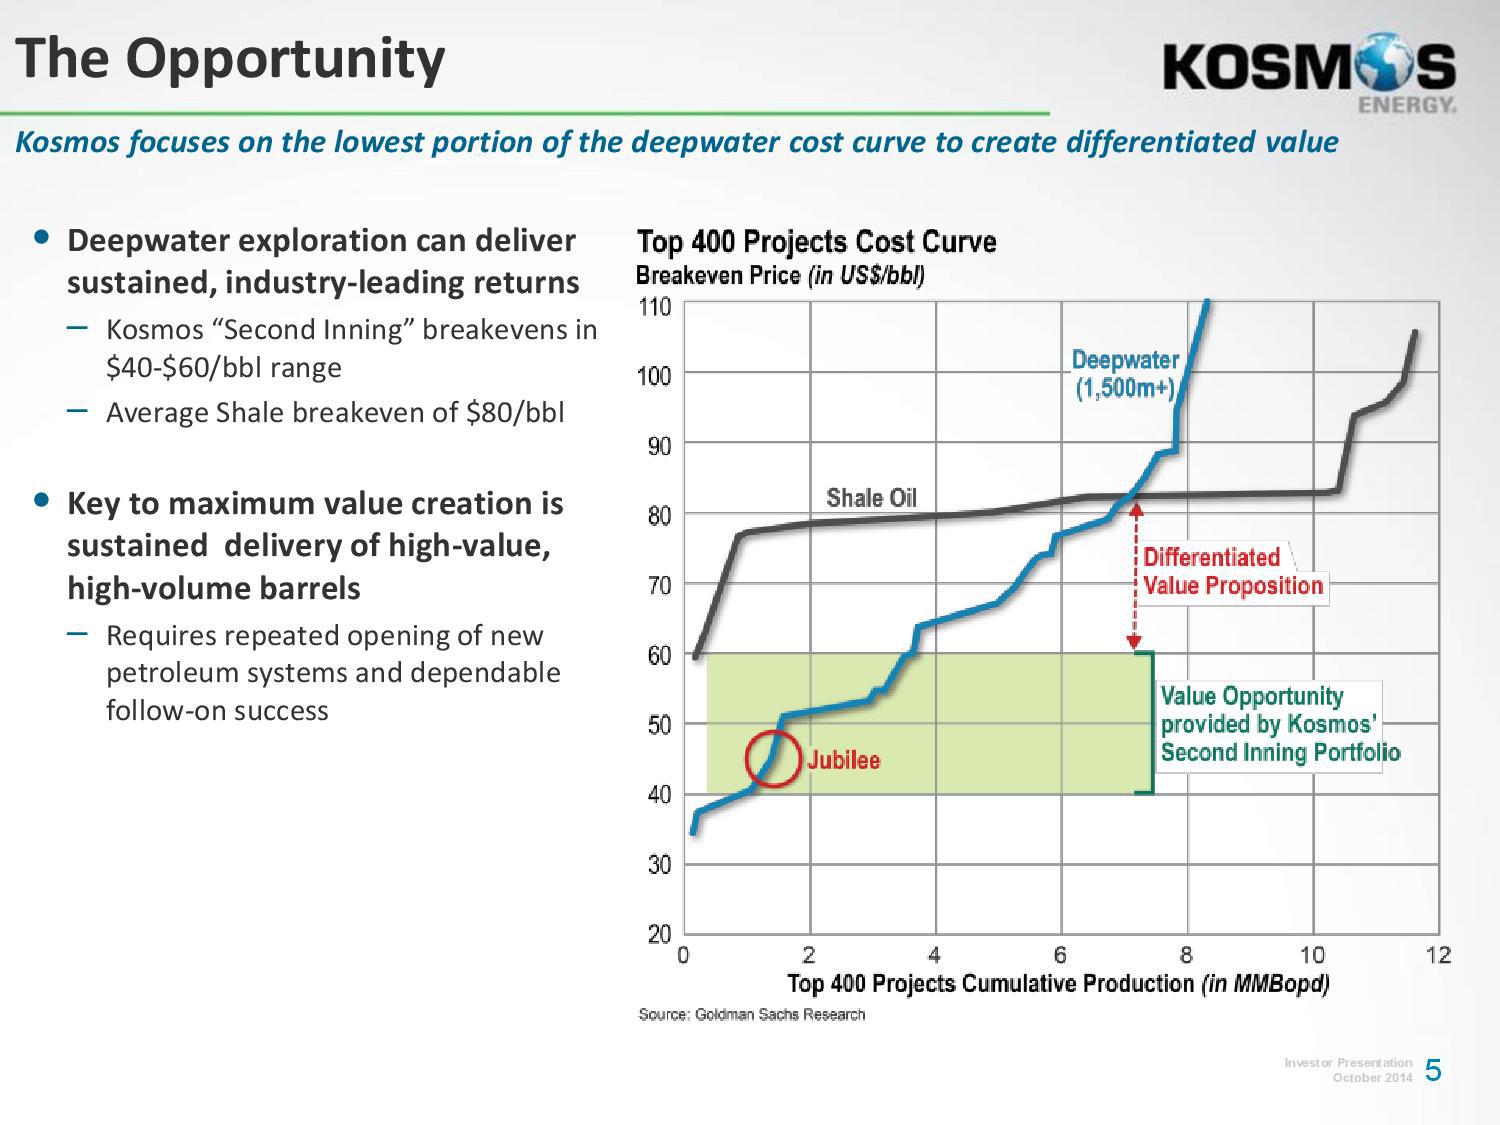
Source: Kosmos Energy website
c) Oil sands: The Canadian oil sands have an average breakeven cost that ranges between $65/bbl (old projects) and $100/bbl (new projects).
In fact, the Canadian Energy Research Institute forecasts that new mined bitumen projects requires US$100 per barrel to breakeven, whereas new SAGD projects need US$85 per barrel. And only one in four new Canadian oil projects could be vulnerable if oil prices fall below US$80 per barrel for an extended period of time, according to the International Energy Agency.
“Given that the low-bearing fruit have already been developed, the next wave of oil sands project are coming from areas where geology might not be as uniform,” said Dinara Millington, senior vice president at the Canadian Energy Research Institute.
So it is not surprising that Suncor Energy (NYSE:SU) announced a billion-dollar cut for the rest of the year even though the company raised its oil price forecast. Also, Suncor took a $718-million charge related to a decision to shelve the Joslyn oilsands mine, which would have been operated by the Canadian unit of France’s Total (NYSE:TOT). The partners decided the project would not be economically feasible in today’s environment.
As linked above, others such as Athabasca Oil (OTCPK: ATHOF), PennWest Exploration (NYSE: PWE), Talisman Energy (NYSE: TLM) and Sunshine Oil Sands (OTC: SUNYF) are also cutting back due to a mix of internal corporate issues and project uncertainty. Cenovus Energy (NYSE:CVE) is also facing cost pressures at its Foster Creek oil sands facility.
And as linked above: “Oil sands are economically challenging in terms of returns,” said Jeff Lyons, a partner at Deloitte Canada. “Cost escalation is causing oil sands participants to rethink the economics of projects. That’s why you’re not seeing a lot of new capital flowing into oil sands.”
After all, helping the US consumer spend more on cute clothes today does not make any sense, when he does not have a job tomorrow. Helping the US consumer drive down the street and spend more at a fancy restaurant today does not make any sense, if he is unemployed tomorrow.
Moreover, Putin managed to avoid mass unemployment during the 2008 financial crisis, when the price of oil dropped further and faster than currently. If Russia faces an extended slump now, Putin’s handling of the last crisis could serve as a template.
In short, I believe that the U.S. will not let everything collapse that easily just because the Saudis woke up one day and do not want to pump less. I believe that the U.S. economy has more things to lose (i.e. jobs) than to win (i.e. hurt Russia or help the US consumer in the short term), in case the current low WTI price remains for months.
I am not saying that an investor can take the plunge lightly, given that the weaker oil prices squeeze profitability. Also, I am not saying that Brent will return back to $110/bbl overnight. I am just saying that the slump of the oil price is primarily a result from extreme short positioning and overblown fears about the global economy.
To me, this is a temporary dip and I believe that oil markets will recover significantly by the first half of 2015. This is why, I bought BNO at an average price of $33.15 last Thursday, and I will add if BNO drops down to $30. My investment horizon is 6-8 months.
Nevertheless, all fingers are not the same. All energy companies are not the same either. The rising tide lifted many of the leveraged duds over the last two years. Some will regain quickly their lost ground, some will keep falling and some will cover only half of the lost ground.
I am saying this because the drop of the oil price will spell serious trouble for a lot of oil producers, many of whom are laden with debt. I do believe that too much credit has been extended too fast amid America’s shale boom, and a wave of bankruptcy that spreads across the oil patch will not surprise me. On the debt front, here is some indicative data according to Bloomberg:
1) Speculative-grade bond deals from energy companies have made up at least 16% of total junk issuance in the U.S. the past two years as the firms piled on debt to fund exploration projects. Typically the average since 2002 has been 11%.
2) Junk bonds issued by energy companies, which have made up a record 17% of the $294 billion of high-yield debt sold in the U.S. this year, have on average lost more than 4% of their market value since issuance.
3) Hercules Offshore’s (NASDAQ:HERO) $300 million of 6.75% notes due in 2022 plunged to 57 cents a few days ago after being issued at par, with the yield climbing to 17.2%.
4) In July 2014, Aubrey McClendon’s American Energy Partners LP tapped the market for unsecured debt to fund exploration projects in the Permian Basin. Moody’s Investors Service graded the bonds Caa1, which is a level seven steps below investment-grade and indicative of “very high credit risk.” The yield on the company’s $650 million of 7.125% notes maturing in November 2020 reached 11.4% a couple of days ago, as the price plunged to 81.5 cents on the dollar, according to Trace, the Financial Industry Regulatory Authority’s bond-price reporting system.
Due to this debt pile, I have been very bearish on several energy companies like Halcon Resources (NYSE:HK), Goodrich Petroleum (NYSE:GDP), Vantage Drilling (NYSEMKT: VTG), Midstates Petroleum (NYSE: MPO), SandRidge Energy (NYSE:SD), Quicksilver Resources (NYSE: KWK) and Magnum Hunter Resources (NYSE:MHR). All these companies have returned back to their H1 2013 levels or even lower, as shown at their charts.
But thanks also to this correction of the market, a shrewd investor can separate the wheat from the chaff and pick only the winners. The shrewd investor currently has the unique opportunity to back up the truck on the best energy stocks in town. This is the time to pick the gold nuggets out of the ashes and wait to see them shine again. On that front, I recommended Petroamerica Oil (OTCPK: PTAXF) which currently is the cheapest oil-weighted producer worldwide with a pristine balance sheet.
Last but not least, I am watching closely the situation in Russia. With economic growth slipping close to zero, Russia is reeling from sanctions by the U.S. and the European Union. The sanctions are having an across-the-board impact, resulting in a worsening investment climate, rising capital flight and a slide in the ruble which is at a record low. And things in Russia have deteriorated lately due to the slump of the oil price.
Obviously, this is the perfect storm and the current situation in Russia reminds me of the situation in Egypt back in 2013. Those investors who bought the bullish ETF (NYSEARCA: EGPT) at approximately $40 in late 2013, have been rewarded handsomely over the last twelve months because EGPT currently lies at $66. Therefore, I will be watching closely both the fluctuations of the oil price and several other moving parts that I am not going to disclose now, in order to find the best entry price for the Russian ETFs (NYSEARCA: RSX) and (NYSEARCA:RUSL) over the next months.

The numerous outfits that attempt to measure home price levels and movements in the US all come up with different numbers, and often frustratingly so, in part because they measure different things. Some measure actual cities, others measure the often multi-county area of the entire metroplex. So the absolute price levels differ, and timing may differ as well, but the movements are roughly the same.
The chart by the Atlanta Fed overlays three of the major real estate data series – the Federal Housing Finance Agency’s House Price Index, the CoreLogic National House Price Index, and the S&P/Case Shiller Home Price Index (20-city). And one thing is now abundantly clear:
Year over year, home-price increases are fading from crazy double digit gains last year toward….?
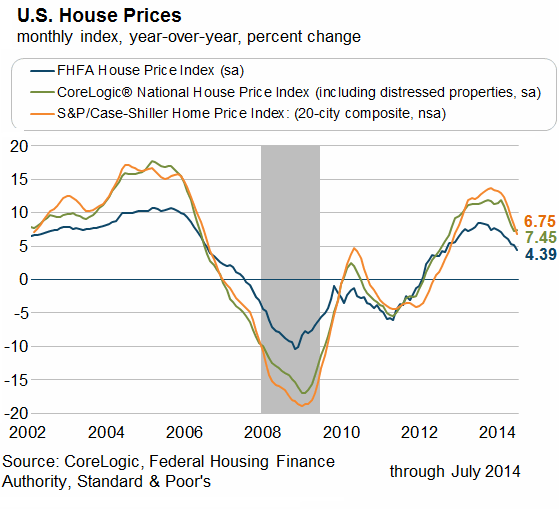
Note the great housing bubble that the Greenspan Fed instigated with its cheap-money policies that then led to the financial crisis. It was followed by a hangover.
And the show repeats itself:
The ephemeral bump in home prices in 2010 and 2011 was a result of federal and state stimulus money (via tax credits) for home buyers. It was followed by a hangover.
The hefty home price increases of 2012 and 2013 were nourished by investors, including large Wall Street firms with access to nearly free money that QE and ZIRP made available to them. They plowed billions every month into the buy-to-rent scheme. When prices soared past where it made sense for them, they pulled back. And now the hangover has set in.
There is no instance in recent history when home prices soared like this beyond the reach of actual home buyers, then landed softly on a plateau to somehow let incomes catch up with them. Despite the well-honed assurances by the industry, there is no plateau when home prices are inflated by outside forces. When these forces peter out, the hangover sets in.
How long the current hangover will last and how far prices have to drop before demand re-materializes even as interest rates are likely to be nudged up remains a guessing game. So far, prices are still up on a national basis year over year. But in some areas, price changes have started to go negative on a monthly basis. And the trend has been relentless.
Someday perhaps, governments and central banks will figure out that every stimulus and money-printing binge is followed by a hangover. And when that hangover gets painful, suddenly there are new screams for more stimulus and another money-printing binge, regardless of what will come as a result of it, or after it fades.

Bank earnings decreased in the first quarter (Q1) of 2014, down 7.6% from a year earlier. Lost revenue due to decreased mortgage activity was mostly to blame, according to the Federal Deposit Insurance Corporation (FDIC). Total reported net income for FDIC-insured banks and savings institutions was $37.2 billion in Q1 2014.
FDIC chairman Martin J. Gruenberg attributes the loss both to a decline in both purchase and refinance mortgages, as well as shrinking margins due to high interest rates. Indeed, the dollar amount of mortgage originations and refinances for one-to-four family residential homes was a whopping 71% lower than in Q1 2013.
Our message to lenders: get used to it. Lower profit margins are here to stay for the next 20-30 years as banks struggle to keep mortgage rates enticing to homebuyers while maintaining their margins. That’s because we’re entering the upswing of a 60-year rate cycle: roughly 30 years of falling interest rates, followed by 30 years of rising interest rates. We hit the bottom of the cycle at the end of 2012, followed by a premature rate spike in mid-2013, seen in this chart:
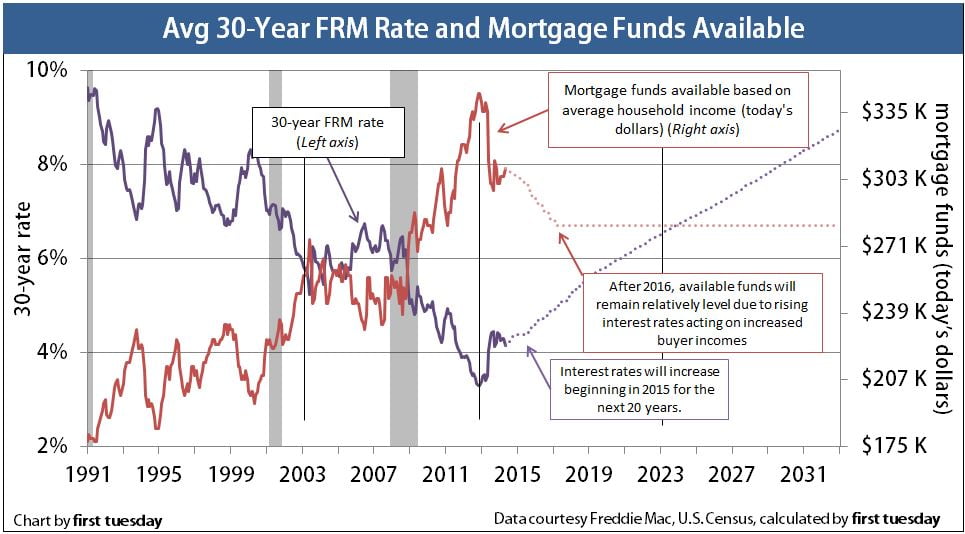
Together with outrageous home prices in the aftermath of 2013’s speculator free-for-all, today’s higher mortgage rates equal reduced buyer purchasing power.
The good news is that mortgage rates aren’t expected to increase for several more months. Mortgage rates will rise when members of the bond market push long-term rates higher in anticipation of the Federal Reserve (the Fed) raising rates in the latter half of 2015. The Fed’s hope is the U.S. economy will be fully recovered and picking up steam by the time they act to raise rates in 2015. Thus, more financially able home buyers will be better equipped to deal with higher rates and bank profits won’t feel the blow too much. However, once mortgage rates begin to increase, they will continue to rise for two-three decades.
Source: fool.com
Mortgage rates play a key role in making houses affordable for would-be home buyers, as the lower mortgage rates are, the lower monthly payments will be on any loan amount. Yet as the Federal Reserve has continued along its yearlong path of winding down the amount of mortgage-backed securities it buys on the open market, financial analysts have been confounded regarding why mortgage rates haven’t risen in response. Moderation in mortgage rates has been beneficial to the Dow Jones industrials (DJINDICES: ^DJI ) and to financial institutions, especially Dow component JPMorgan Chase (NYSE: JPM ) and other major mortgage lenders.

Simple economics
The fears of investors in JPMorgan and in other banks outside the Dow Jones Industrials are fairly easy to understand. Throughout 2013, the Federal Reserve spent $85 billion each month to buy bonds, including $40 billion specifically aimed at the mortgage-backed securities market. By focusing buying activity on mortgage-backed securities (unlike previous quantitative easing programs), the Fed believed that it could keep mortgage rates down more effectively than by counting on market mechanisms to restrain them.
As buying activity helped keep mortgage rates down, it was natural for investors to assume that taking away those purchases would allow mortgage rates to rise again. Indeed, about a year ago, just the hint that the Fed might taper its bond purchases in the future sent mortgage rates soaring, creating problems for financial stocks both inside and outside of the Dow as mortgage-lending activity dried up and bond prices started falling to earth.
Since the end of last year, the Fed has reduced that $40 billion monthly amount toward mortgage-backed securities purchases by $5 billion each meeting, with the latest pronouncement Wednesday cutting the total to just $15 billion per month. At this rate, the Fed will stop buying mortgage-backed bonds entirely by the end of 2014.
The other side of the equation
But looking only at demand for mortgage-backed securities gives you only half of the story. Interestingly, the supply of mortgage-backed securities has also fallen lately. Data from the Securities Industry and Financial Markets Association show that Fannie Mae (NASDAQOTCBB: FNMA ) and Freddie Mac (NASDAQOTCBB: FMCC ) have both dramatically reduced the amount of mortgage-backed debt they have outstanding, likely as part of their ongoing process of winding down in conservatorship.

Source: SIFMA.
Even as Fannie Mae and Freddie Mac see their outstanding debt levels shrink, even the modest uptick in mortgage rates has already had a big impact on activity in the market. Most people had already refinanced their mortgages at the lowest rates possible, and so refinancing activity will be much lower going forward than seen in the past. That will reduce the turnover in existing mortgage-backed securities and eliminate the need for as many newly issued securities to come out.
Of course, the Federal Reserve has started signaling that short-term interest rates will also eventually start making their way back up. Once monetary policy starts tightening more aggressively, it would be much harder to see mortgage rates sustain their current levels. For now, though, mortgage rates have held their own, and that has been a boon for the big mortgage banks and for the Dow Jones industrials in general.


You must be logged in to post a comment.