In proof we trust
Blockchain technology will revolutionize far more than money: it will change your life. Here’s how it actually works,
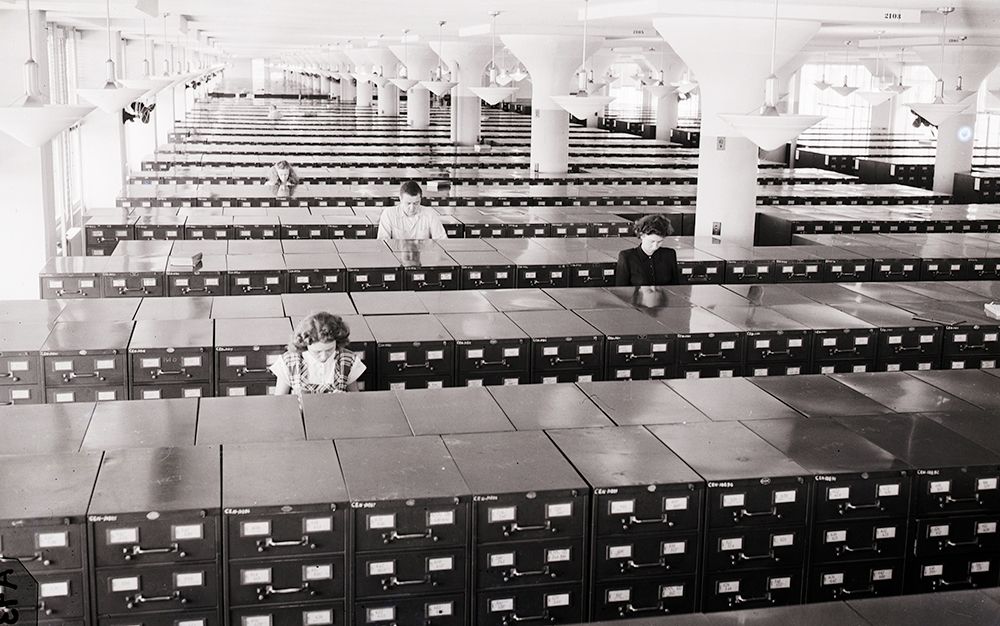
The impact of record-keeping on the course of history cannot be overstated. For example, the act of preserving Judaism and Christianity in written form enabled both to outlive the plethora of other contemporary religions, which were preserved only orally. William the Conqueror’s Domesday Book, compiled in 1086, was still being used to settle land disputes as late as the 1960s. Today there is a new system of digital record-keeping. Its impact could be equally large. It is called the blockchain.
Imagine an enormous digital record. Anyone with internet access can look at the information within: it is open for all to see. Nobody is in charge of this record. It is not maintained by a person, a company or a government department, but by 8,000-9,000 computers at different locations around the world in a distributed network. Participation is quite voluntary. The computers’ owners choose to add their machines to the network because, in exchange for their computer’s services, they sometimes receive payment. You can add your computer to the network, if you so wish.
All the information in the record is permanent – it cannot be changed – and each of the computers keeps a copy of the record to ensure this. If you wanted to hack the system, you would have to hack every computer on the network – and this has so far proved impossible, despite many trying, including the US National Security Agency’s finest. The collective power of all these computers is greater than the world’s top 500 supercomputers combined.
New information is added to the record every few minutes, but it can be added only when all the computers signal their approval, which they do as soon as they have satisfactory proof that the information to be added is correct. Everybody knows how the system works, but nobody can change how it works. It is fully automated. Human decision-making or behavior doesn’t enter into it.
If a company or a government department were in charge of the record, it would be vulnerable – if the company went bust or the government department shut down, for example. But with a distributed record there is no single point of vulnerability. It is decentralized. At times, some computers might go awry, but that doesn’t matter. The copies on all the other computers and their unanimous approval for new information to be added will mean the record itself is safe.
This is possibly the most significant and detailed record in all history, an open-source structure of permanent memory, which grows organically. It is known as the block chain. It is the breakthrough tech behind the digital cash system, Bitcoin, but its impact will soon be far wider than just alternative money.
Many struggle to understand what is so special about Bitcoin. We all have accounts online with pounds, dollars, euros or some other national currency. That money is completely digital, it doesn’t exist in the real world – it is just numbers in a digital ledger somewhere. Only about 3 per cent of national currency actually exists in physical form; the rest is digital. I have supermarket rewards points and air miles as well. These don’t exist physically either, but they are still tokens to be exchanged for some kind of good or service, albeit with a limited scope; so they’re money too. Why has the world got so excited about Bitcoin?
To understand this, it is important to distinguish between money and cash.
If I’m standing in a shop and I give the shopkeeper 50 pence for a bar of chocolate, that is a cash transaction. The money passes straight from me to him and it involves nobody else: it is direct and frictionless. But if I buy that bar of chocolate with a credit card, the transaction involves a payment processor of some kind (often more than one). There is, in other words, a middle man.
The same goes for those pounds, dollars or euros I have in the accounts online. I have to go through a middle man if I want to spend them – perhaps a bank, PayPal or a credit-card company. If I want to spend those supermarket rewards points or those air miles, there is the supermarket or airline to go through.
Since the early 1980s, computer coders had been trying to find a way of digitally replicating the cash transaction – that direct, frictionless, A-to-B transaction – but nobody could find a way. The problem was known as the problem of ‘double-spending’. If I send you an email, a photo or a video – any form of computer code – you can, if you want, copy and paste that code and send it to one or a hundred or a million different people. But if you can do that with money, the money quickly becomes useless. Nobody could find a way around it without using a middle man of some kind to verify and process transactions, at which point it is no longer cash. By the mid 2000s, coders had all but given up on the idea. It was deemed unsolvable. Then, in late 2008, quietly announced on an out-of-the-way mailing list, along came Bitcoin.
On a dollar bill you will see the words: ‘In God we trust.’ Bitcoin aficionados are fond of saying: ‘In proof we trust’
By late 2009, coders were waking up to the fact that its inventor, Satoshi Nakamoto, had cracked the problem of double spending. The solution was the block chain, the automated record with nobody in charge. It replaces the middle man. Rather than a bank process a transaction, transactions are processed by those 8,000-9,000 computers distributed across the Bitcoin network in the collective tradition of open-source collaboration. When those computers have their cryptographic and mathematical proof (a process that takes very little time), they approve the transaction and it is then complete. The payment information – the time, the amount, the wallet addresses – is added to the database; or, to use correct terminology, another block of data is added to the chain of information – hence the name block chain. It is, simply, a chain of information blocks.
Money requires trust – trust in central banks, commercial banks, other large institutions, trust in the paper itself. On a dollar bill you will see the words: ‘In God we trust.’ Bitcoin aficionados are fond of saying: ‘In proof we trust.’ The block chain, which works transparently by automation and mathematical and cryptographic proof, has removed the need for that trust. It has enabled people to pay digital cash directly from one person to another, as easily as you might send a text or an email, with no need for a middle man.
So the best way to understand Bitcoin is, simply: cash for the internet. It is not going to replace the US dollar or anything like that, as some of the diehard advocates will tell you, but it does have many uses. And, on a practical level, it works.
Testament to this is the rise of the online black market. Perhaps £1 million-worth of illegal goods and services are traded through dark marketplaces every day and the means of payment is Bitcoin. Bitcoin has facilitated this rapid rise. (I should stress that even though every Bitcoin transaction, no matter how small, is recorded on the blockchain, the identity of the person making that transaction can be hidden if desired – hence its appeal). In the financial grand scheme of things, £1 million a day is not very much, but the fact that ordinary people on the black market are using Bitcoin on a practical, day-to-day basis as a way of paying for goods and services demonstrates that the tech works. I’m not endorsing black markets, but it’s worth noting that they are often the first to embrace a new tech. They were the first to turn the internet to profit, for example. Without deep pools of debt or venture capital to fall back on, black markets have to make new tech work quickly and practically.
But Bitcoin’s potential use goes far beyond dark markets. Consider why we might want to use cash in the physical world. You use it for small payments – a bar of chocolate or a newspaper from your corner shop, for example. There is the same need online. I might want to read an article in The Times. I don’t want to take out an annual subscription – but I do want to read that article. Wouldn’t it be nice to have a system where I could make a micropayment to read that article? It is not worth a payment processor’s time to process a payment that small, but with internet cash, you don’t need a processor. You can pay cash and it costs nothing to process – it is direct. This potential use could usher in a new era of paid content. No longer will online content-providers have to be so squeezed, and give out so much material for nothing in the hope of somehow recouping later, now that the tech is there to make and receive payment for small amounts in exchange for content.
We also use cash for quick payments, direct payments and tipping. You are walking past a busker, for example, and you throw him a coin. Soon you will able to tip an online content-provider for his or her YouTube video, song or blog entry, again as easily and quickly as you click ‘like’ on the screen. Even if I pay my restaurant bill with a card, I’ll often tip the waiter in cash. That way I know the waiter will receive the money rather than some unscrupulous employer. I like to pay cash in markets, where a lot of small businesses start out because a cash payment goes directly to the business owner without middle men shaving off their percentages. The same principle of quick, cheap, direct payment will apply online. Cheap processing costs are essential for low-margin businesses. Internet cash will have a use there, too. It also has potential use in the remittance business, which is currently dominated by the likes of Western Union. For those working oversees who want to send money home, remittance and foreign exchange charges can often amount to as much as 20 per cent of the amount transferred. With Bitcoin that cost can be removed.
Some of us also use cash for payments we want kept private. Private does not necessarily mean illegal. You might be buying a present for your wedding anniversary and don’t want your spouse to know. You might be making a donation to a cause or charity and want anonymity. You might be doing something naughty: many of those who had their Ashley Madison details leaked would have preferred to have been able to pay for their membership with cash – and thus have preserved their anonymity.
More significantly, cash is vital to the 3.5 billion people – half of the world’s population – who are ‘un-banked’, shut out of the financial system and so excluded from e-commerce. With Bitcoin, the only barrier to entry is internet access.
Bitcoin is currently experiencing some governance and scalability issues. Even so, the tech works, and coders are now developing ways to use block chain tech for purposes beyond an alternative money system. From 2017, you will start to see some of the early applications creeping into your electronic lives.
One application is in decentralized messaging. Just as you can send cash to somebody else with no intermediary using Bitcoin, so can you send messages – without Gmail, iMessage, WhatsApp, or whoever the provider is, having access to what’s being said. The same goes for social media. What you say will be between you and your friends or followers. Twitter or Facebook will have no access to it. The implications for privacy are enormous, raising a range of issues in the ongoing government surveillance discussion.
We’ll see decentralized storage and cloud computing as well, considerably reducing the risk of storing data with a single provider. A company called Trustonic is working on a new block chain-based mobile phone operating system to compete with Android and Mac OS.
Just as the block chain records where a bitcoin is at any given moment, and thus who owns it, so can block chain be used to record the ownership of any asset and then to trade ownership of that asset. This has huge implications for the way stocks, bonds and futures, indeed all financial assets, are registered and traded. Registrars, stock markets, investment banks – disruption lies ahead for all of them. Their monopolies are all under threat from block chain technology.
Land and property ownership can also be recorded and traded on a block chain. Honduras, where ownership disputes over beachfront property are commonplace, is already developing ways to record its land registries on a block chain. In the UK, as much as 50 per cent of land is still unregistered, according to the investigative reporter Kevin Cahill’s book Who Owns Britain? (2001). The ownership of vehicles, tickets, diamonds, gold – just about anything – can be recorded and traded using block chain technology – even the contents of your music and film libraries (though copyright law may inhibit that). Block chain tokens will be as good as any deed of ownership – and will be significantly cheaper to provide.
The Peruvian economist Hernando de Soto Polar has won many prizes for his work on ownership. His central thesis is that lack of clear property title is what has held back so many in the Third World for so long. Who owns what needs to be clear, recognized and protected – otherwise there will be no investment and development will be limited. But if ownership is clear, people can trade, exchange and prosper. The block chain will, its keenest advocates hope, go some way to addressing that.
Smart contracts could disrupt the legal profession and make it affordable to all, just as the internet has done with music and publishing
Once ownership is clear, then contract rights and property rights follow. This brings us to the next wave of development in block chain tech: automated contracts, or to use the jargon, ‘smart contracts’, a term coined by the US programmer Nick Szabo. We are moving beyond ownership into contracts that simultaneously represent ownership of a property and the conditions that come with that ownership. It is all very well knowing that a bond, say, is owned by a certain person, but that bond may come with certain conditions – it might generate interest, it might need to be repaid by a certain time, it might incur penalties, if certain criteria are not met. These conditions could be encoded in a block chain and all the corresponding actions automated.
Whether it is the initial agreement, the arbitration of a dispute or its execution, every stage of a contract has, historically, been evaluated and acted on by people. A smart contract automates the rules, checks the conditions and then acts on them, minimizing human involvement – and thus cost. Even complicated business arrangements can be coded and packaged as a smart contract for a fraction of the cost of drafting, disputing or executing a traditional contract.
One of the criticisms of the current legal system is that only the very rich or those on legal aid can afford it: everyone else is excluded. Smart contracts have the potential to disrupt the legal profession and make it affordable to all, just as the internet has done with both music and publishing.
This all has enormous implications for the way we do business. It is possible that block chain tech will do the work of bankers, lawyers, administrators and registrars to a much higher standard for a fraction of the price.
As well as ownership, block chain tech can prove authenticity. From notarization – the authentication of documents – to certification, the applications are multi fold. It is of particular use to manufacturers, particularly of designer goods and top-end electrical goods, where the value is the brand. We will know that this is a genuine Louis Vuitton bag, because it was recorded on the block chain at the time of its manufacture.
Block chain tech will also have a role to play in the authentication of you. At the moment, we use a system of usernames and passwords to prove identity online. It is clunky and vulnerable to fraud. We won’t be using that for much longer. One company is even looking at a block chain tech system to replace current car- and home-locking systems. Once inside your home, block chain tech will find use in the internet of things, linking your home network to the cloud and the electrical devices around your home.
From identity, it is a small step to reputation. Think of the importance of a TripAdvisor or eBay rating, or a positive Amazon review. Online reputation has become essential to a seller’s business model and has brought about a wholesale improvement in standards. Thanks to TripAdvisor, what was an ordinary hotel will now treat you like a king or queen in order to ensure you give it five stars. The service you get from an Uber driver is likely to be much better than that of an ordinary cabbie, because he or she wants a good rating.
There will be no suspect recounts in Florida! The block chain will also usher in the possibility of more direct democracy
The feedback system has been fundamental to the success of the online black market, too. Bad sellers get bad ratings. Good sellers get good ones. Buyers go to the sellers with good ratings. The black market is no longer the rip-off shop without recourse it once was. The feedback system has made the role of trading standards authorities, consumer protection groups and other business regulators redundant. They look clunky, slow and out of date.
Once your online reputation can be stored on the block chain (ie not held by one company such as TripAdvisor, but decentralized) everyone will want a good one. The need to preserve and protect reputation will mean, simply, that people behave better. Sony is looking at ways to harness this whereby your education reputation is put on the block chain – the grades you got at school, your university degree, your work experience, your qualifications, your resumé, the endorsements you receive from people you’ve done business with. LinkedIn is probably doing something similar. There is an obvious use for this in medical records too, but also in criminal records – not just for individuals, but for companies. If, say, a mining company has a bad reputation for polluting the environment, it might be less likely to win a commission for a project, or to get permission to build it.
We are also seeing the development of new voting apps. The implications of this are enormous. Elections and referenda are expensive undertakings – the campaigning, the staff, the counting of the ballot papers. But you will soon be able to vote from your mobile phone in a way that is 10 times more secure than the current US or UK systems, at a fraction of the cost and fraud-free. What’s more, you will be able to audit your vote to make sure it is counted, while preserving your anonymity. Not even a corrupt government will be able to manipulate such a system, once it is in place. There will be no suspect recounts in Florida! The block chain will also usher in the possibility of more direct democracy: once the cost and possibility of fraud are eliminated, there are fewer excuses for not going back to the electorate on key issues.
Few have seen this coming, but this new technology is about to change the way we interact online. The revolution will not be televised, it will be cryptographically time-stamped on the block chain. And the block chain, originally devised to solve the conundrum of digital cash, could prove to be something much more significant: a digital Domesday Book for the 21st century, and so much more.
by Dominic Frisby | Aeon


 FactSet


You must be logged in to post a comment.