Tag Archives: Fracking

Is Big Oil In Bed With The Saudis To Destroy The Fracking Industry?

Summary

  • Saudis want Big Oil to win – have predictable working relationship with them.
  • Big Oil is waiting on the sidelines until the price of properties drop.
  • Those with DUC wells and enough reserves will be able to survive the onslaught.
  • U.S. shale oil remains viable, but the players are going to change.

https://s16-us2.ixquick.com/cgi-bin/serveimage?url=http%3A%2F%2Fwww.cornucopia.org%2Fwp-content%2Fuploads%2F2015%2F08%2FUnlinedHotFrackingWaterPit-FacesofFracking.jpg&sp=5e83ddd577051c082e8bf0083737a243

As the strategy of Saudi Arabia becomes clearer, along with the response of shale producers to low oil prices, the question now has to be asked as to whether or not the big oil companies support the decision by Saudi Arabia to crush frackers until they have to offer their various plays at fire sale prices.

With the emergence of frackers came a significant number of new competitors in the market that didn’t have an interest in playing nice with OPEC and Saudi Arabia, as major oil companies have in the past. This was a real threat as other OPEC members and shale companies started to take share away from Saudi Arabia.

The general consensus is Saudi Arabia isn’t interested in crushing any particular competitor, rather it’ll keep production at high levels until the weakest producers capitulate. I have thought that as well until recently.

What changed my thinking was analyzing who was the biggest threat to OPEC and Saudi Arabia, and in fact it is the shale industry in the U.S. The reason I draw that conclusion is the energy industry had its traditional competitors in place for many years, and other than occasional moves to impact the price of oil using production levels as the weapon, it has been a relatively stable industry. Shale changed all that.

I think what bothered Saudi Arabia in particular was it didn’t have a working relationship with many of these new competitors, who have been very aggressive with expanding production capacity over the last few years. They were in fact real competitors who were working to take market share away from existing players. And with Saudi Arabia being the low-cost producer with the highest reserves in the world, it was without a doubt a direct assault on its authority and leverage it historically has had on the oil market. Its response to frackers is obvious: it isn’t willing to give up share for any reason.

Where the challenge for Saudi Arabia now is it has started to have to draw on its own reserves and issue bonds to make up for budget shortfalls. It has plenty of reserves, but it appears we now have a clear picture on when it would really come under pressure, which is within a four to five year period. That’s the time it has to devastate its shale competitors.

The other problem for the country is it could take down some members of OPEC in the process, where there are already significant problems they’re facing, which could lead to unrest.

From a pure oil perspective, it seems to be an easy read. Saudi Arabia can outlast the small shale producers with no problem. I think that’s its goal. But it is putting enormous pressure on other countries as well, and there will be increasing pressure for them to slow production in order to support oil prices.

This even extends to Russia, which produces more oil than any other country.

My belief is Saudi Arabia is attempting to force consolidation in the shale industry, so it can resume its dealings with big oil players it has worked with for many years. I believe it’s also what big oil players want. All they have to do is sit back and experience some temporary pain and wait for some of the attractive plays to come onto the market at low prices.

So far the price is still high in the U.S., but as time goes on, the smaller companies will be forced to sell, one way or another. That’s the big opportunity for investors. Identifying those companies with the resources and desire to acquire these properties is the key. That and evaluating the plays with the most potential for those buying them up.

At what price can Saudi crush shale oil?

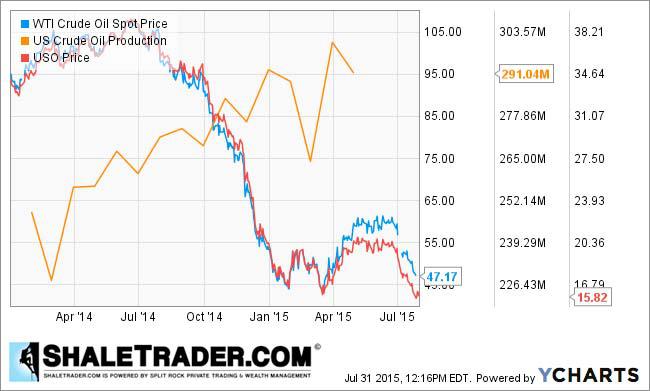
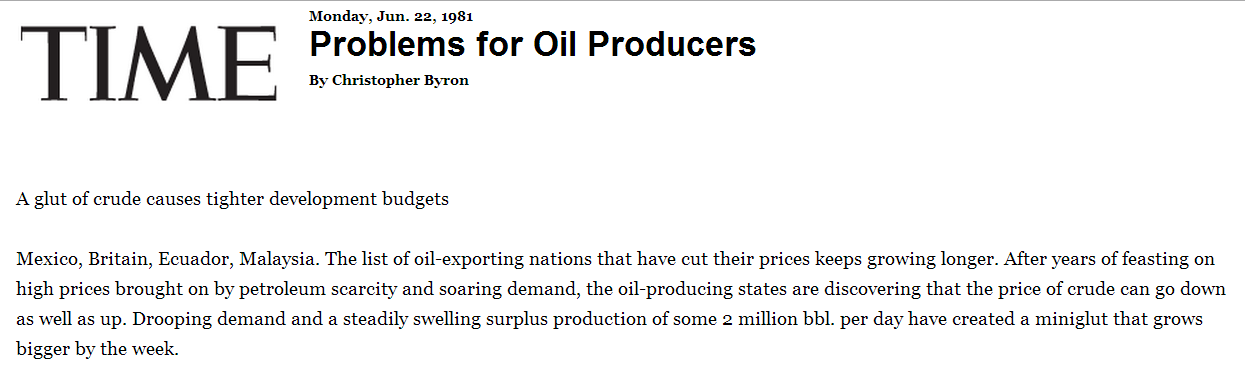
There are analysts predicting oil price levels that are all over the board. I’ve seen those that believe it’s going to shoot up to over $100 per barrel again, and those that have estimated it could fall to as low as $15 per barrel.

The best way to analyze this is to consider what Saudi Arabia can handle over the longest period of time without destroying its own economy and industry, meaning at what price it can remain fairly healthy and outlast its competitors.

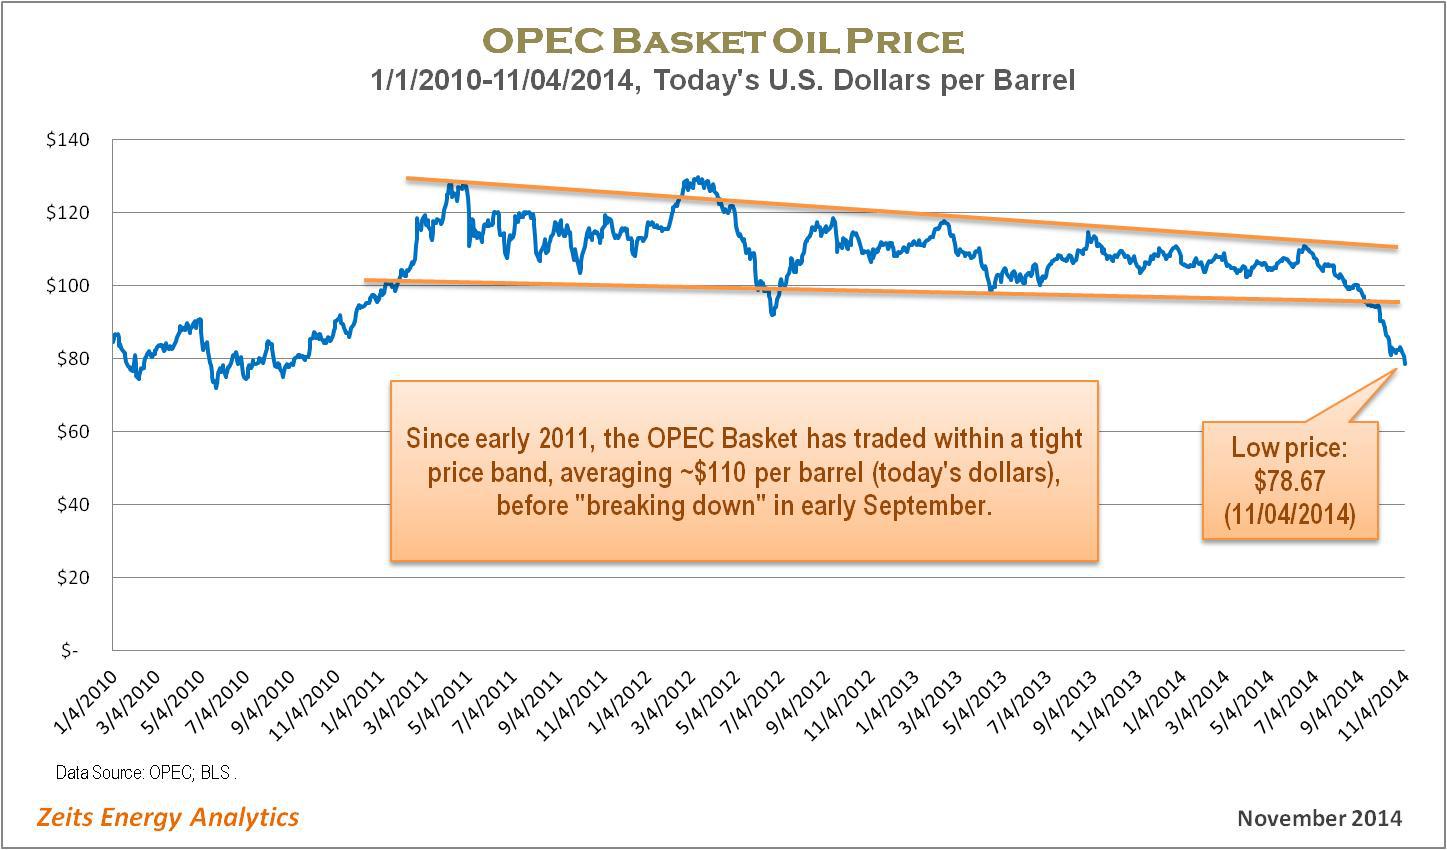
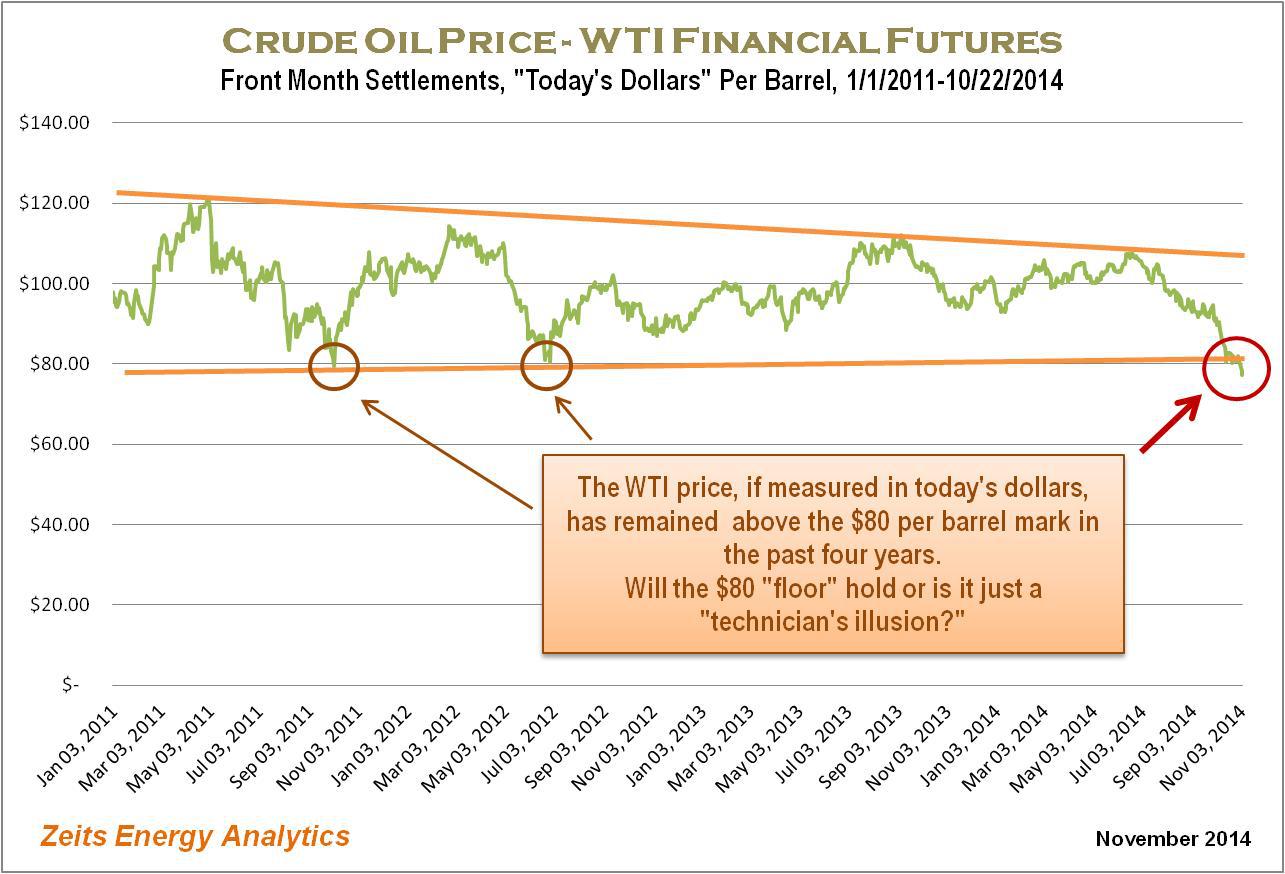
Looking at the price movement of oil and the range it’s now settled into, I think it’s close to what the Saudi have been looking for.

Most smaller shale producers will struggle to make it, if the price of oil remains under $60 per barrel, which it will probably do until Saudi Arabia cuts back on production. There will be occasional moves above that, and probably below $50 per barrel again as well, but I think we can now look to somewhere in the $50 per barrel area as the target being sought. We’ll probably see this be the price range oil will move in for the next couple of years, with $50 being the desired low and $60 being the desired high.

I don’t mean by this Saudi Arabia can absolutely control the price of oil, but it can influence the range it operates in, and I think that’s where we are now.

For that reason oil investors should be safe in investing under these assumptions, understanding there will be occasional price moves outside of that range because of usual trading momentum.

Response from shale oil companies

Some may question why the price of oil got slammed not too long ago, falling below $40 per barrel, if the probable price range for oil is about $10 to $20 per barrel higher.

As mentioned above, some of that was simply from trading momentum. It didn’t take long for it to rebound soon afterward.

The other element was the response by shale companies to the new price of oil, which threatened their ability to pay interest on loans that were due.

Frackers weren’t boosting production because they believed they could outlast Saudi Arabia; they kept production levels high because they had to continue to sell even into that low-price environment or default on their payments. This was a major factor in why prices dropped so far over the short term.

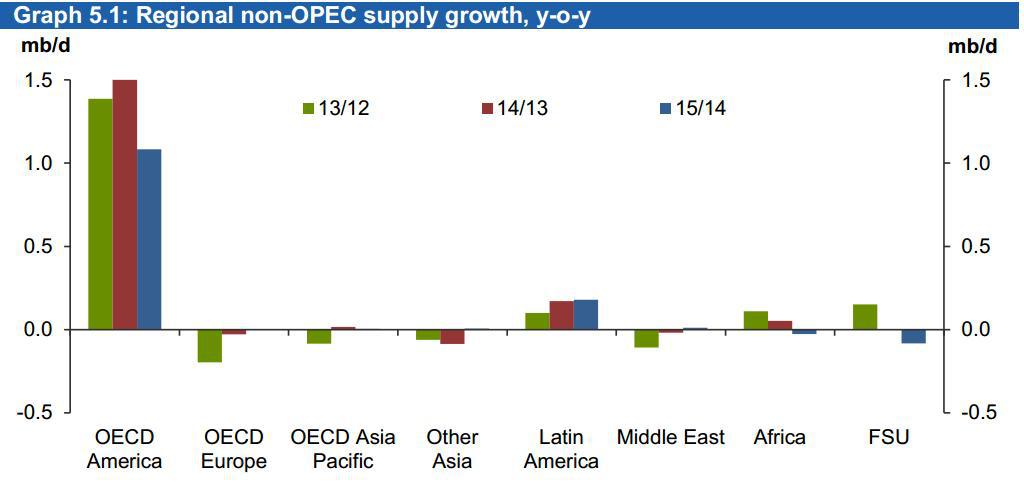
With the bulk of the over $5 trillion spent on shale exploration and development coming from companies operating in the U.S., that is also where the bulk of the risk is.

Much of the efficiencies have been wrung out of operations, and moving to higher producing wells that are less costly to operate can only last so long. I believe efficiencies will position some in the industry to survive the current competitive environment, but they will also have to have enough reserves to tap into in order to do so.

Top producing shale wells are at their highest level of productivity in the first 6 months it goes into operation. It gradually fades after that.

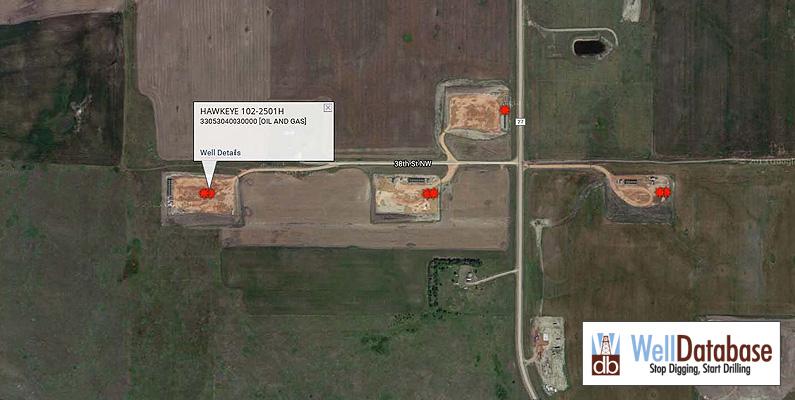
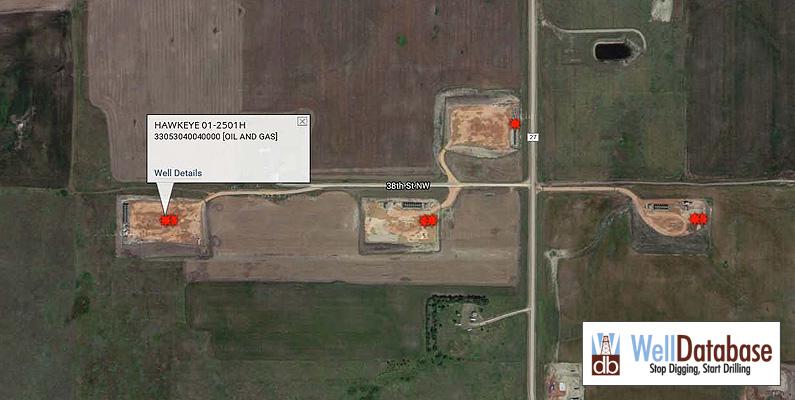
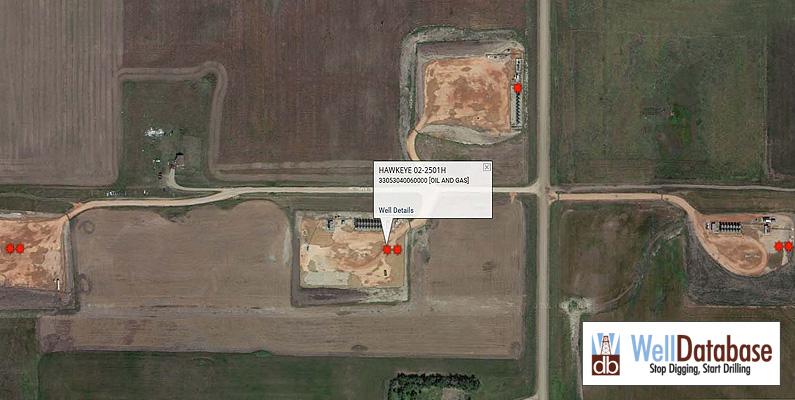
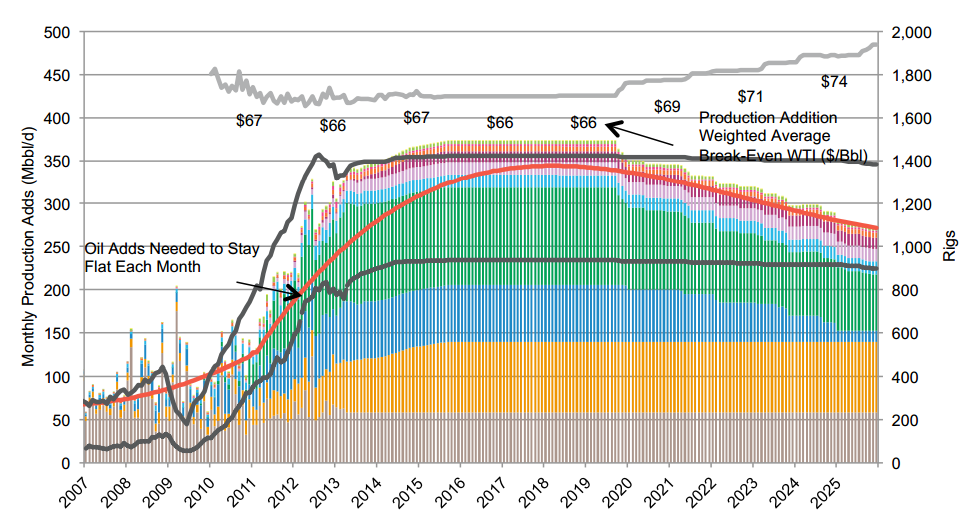
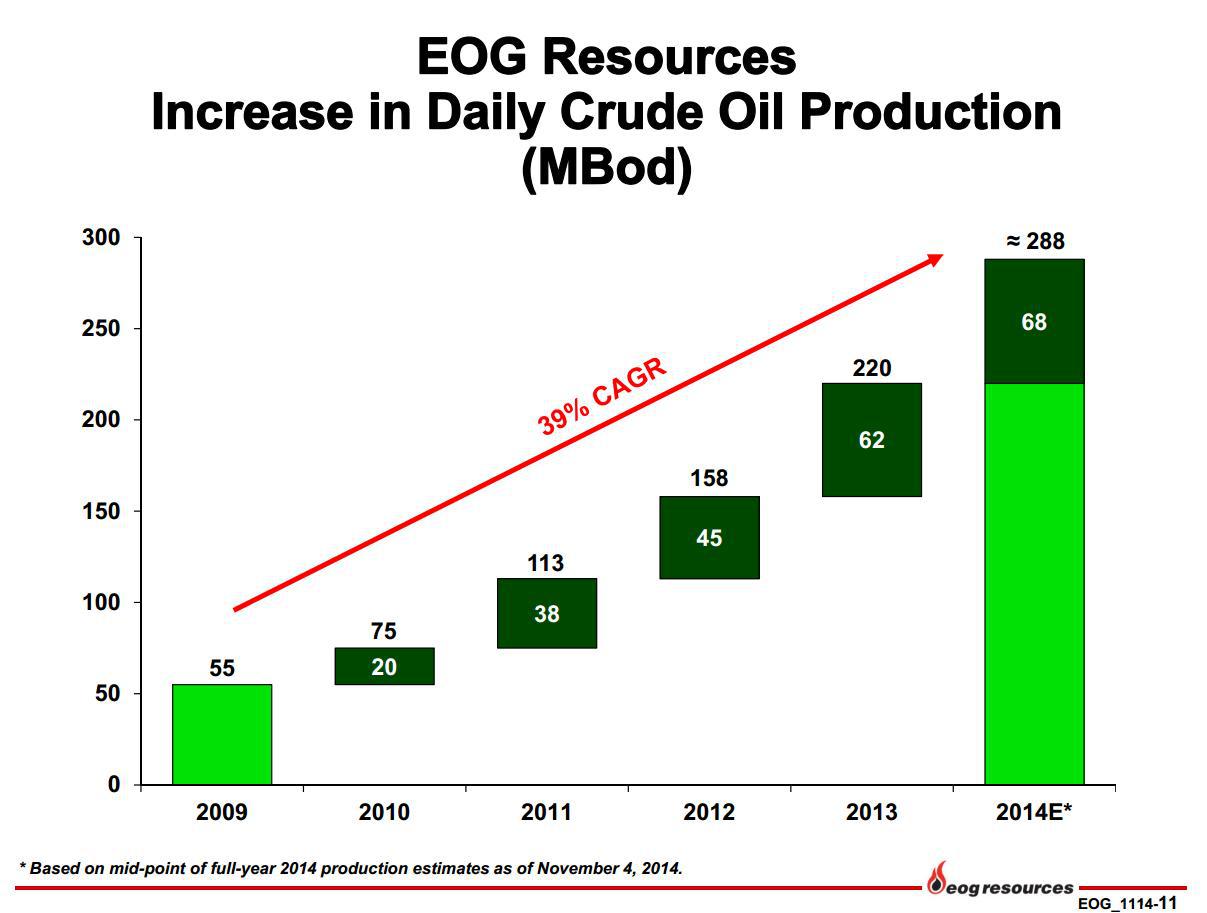
Larger players like EOG Resources (NYSE:EOG) have continued to drill, but they are stopping short of production, with approximately 320 DUC wells ready to bring online when the price of oil reaches desired levels. Its smaller competitors don’t have the resources to wait out existing production levels, which is what will again offer the opportunity for patient investors.

In other words, most of what can be done has been or is currently being done, and from now on it’s simply a waiting game to see how long the Saudis are willing to keep the oil flowing.

Most shale producers believed the lowest oil prices would sustainably fall and would be about $70 per barrel. Decisions were made based upon that assumption.

Big oil and Saudi Arabia

Saudi Arabia and big international energy companies have had close relationships a long time via Saudi Aramco, the state-owned firm.

Those relationships, while competitive, still operated within parameters most agreed upon. Shale producers weren’t playing that game, as they invested trillions and aggressively went after market share. If Saudi Arabia wanted to maintain market share, it had to respond.

If the smaller shale producers thought their strategy though, they must have underestimated the will of Saudi Arabia to fight back against them. Either that or they became overly optimistic and started to believe their own press about the shale revolution.

It’s a revolution for sure, but the majority of those that helped launch it won’t be finishing it.

My point is big oil, in my opinion, doesn’t mind quietly standing on the sidelines as their somewhat friendly competitors destroys their competition and prepares the way for them to acquire shale properties at extremely attractive prices.

I’ve said for some time the shale revolution will go on. The oil isn’t going anywhere. What is changing is who the players will end up being, and what properties they’ll end up acquiring.

With EOG, the strongest shale player, it said the prices of those plays now for sale are still too high; that means the smaller players still think they have some leverage.

My only thought is they are hoping for the large players to enter a bidding war and they can at least recoup some of their capital. I think they’re going to wait until they’re desperate and have no more options.

Sure, some big players may lose out on a desirable property or two, but everyone will get a piece of the action. It appears once the prices move down to levels they’re looking for, at that time they’ll swoop in and make their bids. At that time it’s going to be a buyer’s market.

Big oil companies are the preferable players Saudi Arabia wants to do business with and compete against. They will play the game with them, and there won’t be a lot of surprises.

Some of the companies to watch

Some of the larger companies that have already filed for bankruptcy this year include Hercules Offshore (NASDAQ:HERO), Sabine Oil & Gas (SOGC) and Quicksilver Resources (OTCPK:KWKAQ).

Companies known to have hired advisers for that purpose are Swift Energy (NYSE:SFY) and Energy XXI Ltd. (NASDAQ:EXXI).

Some under heavy pressure include Halcón Resources Corporation (NYSE:HK), SandRidge Energy, Inc. (NYSE:SD) and Rex Energy Corporation (NASDAQ:REXX).

There are more in each category, but I included only those that had at least a decent market cap, with the exception of those that already declared bankruptcy.

Here are a couple of other companies to look at going forward, which can be used for the purpose of analyzing ongoing low prices.

Stone Energy’s credit facility of $500 million is reaffirmed, but may not be liquid enough to endure the next couple of years, even though in the short term it does have decent liquidity. If Saudi Arabia keeps up the pressure, it’s doubtful it will be able to survive on its own. There are quite a few companies falling under these parameters, including Laredo (NYSE:LPI). The basic practice of all of them was to limit the amount of leverage they have in place in order not to have paying off interest as the priority use of their capital, while maintaining a strong credit facility.

I’m not saying these companies will survive, but they will survive if the price of oil stays low, but it will take a lot more to root them up than their highly leveraged peers.

Clayton Williams (NYSE:CWEI) recently put itself up for sale because it can’t afford to continue operating at these prices. It has approximately 340,000 acres under its control, and two of the most productive shale basins in the U.S.

Once it announced it was open to selling, the share price skyrocketed, but since it’s struggling to afford extracting the oil, it’s puzzling as to why some believe it’s going to attract a premium price. It’s possible because of the quality of assets, but it would make more sense for larger companies to wait.

This will be a good test on how big oil companies are going to respond. It’s possible they may be willing to pay for the higher quality shale plays, but under these conditions shareholders would resist paying a significant premium.

If Clayton Williams does go for a premium, it doesn’t in any way mean that’s how it’ll work out for most of the shale companies.

There would have to be a significant reason they would pay such a high price. In the case of CWEI, the catalyst would be high production.

Conclusion

All of this sounds neatly packaged, and if all things proceed as planned, this is how it will play out.

Where there could be some risk is if the Middle East explodes and oil production is interrupted. That would change this entire scenario, and if it were to happen soon, shale companies still in operation would not only survive, but thrive.

Barring that level of disruption, which would have to be something huge, this is how it will play out. After all, with everything going on there now, it hasn’t done anything to disrupt Middle East oil. It would take a big event or a series of events to bring it about. That’s definitely a possibility, but it’s one that is unlikely.

Once all of this plays out, there is no doubt in my mind the bigger oil companies will be much stronger and able to produce a lot more oil.

What we’ll probably see happen is for them to cut back on production to levels where everyone is happy, including the Saudi.

That’s what this war is all about, because shale oil deposits remain in the ground. While some companies can quickly resume production because of the nature of shale oil, which can ramp up production fast, it depends on the will and determination of Saudi Arabia and whether or not the geopolitical situation remains under control.

I don’t care too much about the number of rig counts in shale plays because production can be resumed or initiated quick. The risk is how leveraged the shale companies are, and whether or not they have to continue production at a loss in order to pay off their interest on loans in hopes the price of oil will rise.

What I’m looking for with existing plays is for companies like EOG Resources, which continues to develop wells, but does so without the idea of completing them and bringing them into production until the price of oil rebounds.

Shale oil in the U.S. is alive and well, but those companies overextended and few resources are going to be forced to sell at bargain prices. That will produce a lot of added value to the big oil companies waiting on the sidelines watching it all unfold.

Read more by Gary Bourgeault on Seeking Alpha

Fracking & The Petrodollar – There Will Be Blood

By Chris at www.CapitalistExploits.at

As the housing boom of the 2000’s minted new millionaires every second Tuesday. So, too, the shale oil boom minted wealth faster than McDonald’s mints new diabetics.

Estimates by the UND Center for Innovation Foundation in Grand Forks, are that the North Dakota shale oil boom was creating 2,000 millionaires per year. For instance, the average income in Montrail County has more than doubled since the boom started.

Taken direct from Wikipedia:

Despite the Great Recession, the oil boom resulted in enough jobs to provide North Dakota with the lowest unemployment rate in the United States. The boom has given the state of North Dakota, a state with a 2013 population of about 725,000, a billion-dollar budget surplus. North Dakota, which ranked 38th in per capita gross domestic product (GDP) in 2001, rose steadily with the Bakken boom, and now has per capita GDP 29% above the national average.

I wonder how many North Dakotan’s have any idea the effect low oil prices are going exert on their living standards, freshly elevated house prices, employment stats, and government revenues.

We’re all about to find out. Here is the last piece in our 5-part series by Harris Kupperman exploring what this means for the fracking industry, oil in general, and the one topic nobody is paying much attention to: the petrodollar.

Enjoy!

——————————

Date: 27 September 2015

Subject: There Will Be Blood – Part V

Starting at the end of 2014, I wrote a number of pieces detailing how QE was facilitating the production of certain real assets like oil where the production decision was no longer being tied to profitability. For instance, shale producers could borrow cheaply, produce at a loss and debt investors would simply look the other way because of the attractive yields that were offered on the debt. The overriding theme of these pieces was that the eventual crack-up in the energy sector would precipitate a crisis that was much larger than the great subprime crisis of last decade as waves of shale defaults would serve as the catalyst for investors to stop reaching for yield and once again try to understand what exactly they owned.

Fast forward 9 months from the last piece and most of these shale producers are mere shells of themselves. If you got out of the way—good for you. Amazingly, these companies can still find creative ways to tap the debt markets, stay alive and flood the market with oil. Eventually, most won’t make it and I believe that the ultimate global debt write-off is in the hundreds of billions of dollars—maybe even a trillion depending on which larger players stumble. That doesn’t even include the service companies or the employees who have their own consumer and mortgage debt.

I believe that shale producers are the “sub-prime” of this decade. As they vaporize hundreds of billions in investor capital, thus far, there has been a collective shrug as everyone ignores the obvious – until suddenly it begins to matter. By way of timelines, I think we are now getting to the early summer of 2008 – suddenly the smart people are beginning to realize that something is wrong. Credit spreads are the life-line of the global financial world. They’re screaming danger. I think the equity markets are about to listen.

HY Spreads

High-yield – 10-year spread is blowing out

Then again, a few hundred billion is a rounding error in our QE world. There is a much bigger animal and no one is talking about it yet – the petrodollar.

Roughly defined, petrodollars are the dollars earned by oil exporting countries that are either spent on goods or more often tucked away in central bank war chests or sovereign wealth funds to be invested. I’ve read dozens of research reports on the topic and depending on how its calculated, this flow of capital has averaged between $500 billion and $1 trillion per year for most of the past decade. This is money that has been going into financial assets around the world – mainly in the US. This flow of reinvested capital is now effectively shut off. Since many of these countries are now running huge budget deficits, it seems only natural that if oil stays at these prices, this flow of capital will go in reverse as countries are forced to sell foreign assets to cover these deficits.

Petrodollars

Over the past year, the carnage in the emerging markets has been severe. Barring another dose of QE, I think this carnage is about to come to the more developed world as the petrodollar flow unwinds and two decades of central bank inspired lunacy erupts.

There Will Be Blood

We agree with Harris, and not coincidentally the petrodollar unwind forms a part of the global USD carry trade unwind I’ve been harping on about recently.

Capitalist Exploits subscribers will receive a free report on 3 actionable trades in the oil and gas sector later this week. Leave us your email address here to get the report.

– Chris

“So, ladies and gentlemen… if I say I’m an oil man you will agree. You have a great chance here, but bear in mind, you can lose it all if you’re not careful.” – Daniel Day-Lewis, There Will Be Blood


Why U.S. Oil Production Remains High While Prices Tank – Bakken Update

Summary

  • US production remains high due to high-grading, well design, cost efficiencies, and lower oil service contracts.
  • High-grading from marginal to core areas can increase per well production from 200% to 500% depending on area, which means one core well can equate to several marginal producers.
  • Shorter stages, increased proppant and frac fluids increase production and flatten the depletion curve.
  • EOG’s work in Antelope field provides a framework for other operators to increase production while completing fewer wells.
  • Few operators are currently developing Mega-fracs, this provides significant upside to US shale production as others start producing more resource per foot.
by Michael Filloon, Split Rock Private Trading and Wealth Management

US Oil production remains at volumes seen when WTI was at $100/bbl. Many analysts believed operators couldn’t survive, but $60/bbl may be good enough for operators to drill economic wells. Oil prices have decreased significantly, and the US Oil ETF (NYSEARCA:USO) with it. Many were wrong about US production, and the belief $60/bbl oil would decrease US production. Although completions have been deferred, high-grading and mega-fracs have made up for fewer producing wells. When calculating US production going forward, it is important to account for the number of new completions. If more wells are completed, the higher the influx of production should be. We are finding the quality of geology and well design have a greater effect on total production than originally thought.

(click to enlarge)

(Source: Shaletrader.com)

There are several factors influencing US production. Operators have moved existing rigs to core areas. This decreases its ability getting acreage held by production. In the Bakken, rigs have moved near the Nesson Anticline.

In the Eagle Ford, Karnes seems to be the area of interest. Midland County in the Permian has also been attractive. Operators have decided to complete wells with better geology. When an operator completes wells in core acreage versus marginal leasehold, we see increased production per location. This is just part of the reason US production remains high.

The average investor does not understand the significance. Most think wells have like production, but areas are much different. When oil was at a $100/bbl, it allowed operators to get acreage held by production, although payback times were not as good. Marginal acreage was more attractive, even at lower IRRs. Operators have a significant investment in acreage, and do not want to lose it. Because of this, many would operate in the red expecting future rewards. Just because E&Ps lose money, does not mean the business isn’t economic. It is the way business is done in the short term as oil is an income stream. Wells produce for 35 to 40 years, and once well costs are paid back there are steady revenues. Changes in oil prices have changed this, as now operators will have to focus on better acreage.

Re-fracs are starting to influence production. Although most operators have not begun programs, interest is high. Re-fracs may not be a game changer, but could be an excellent way to increase production at a lower cost. This is not as significant with well designs of today, but older designs left a significant amount of resource. More importantly, when operators began, it was drilling the best acreage. Archaic well designs could leave some stages completely untouched. Current seismic can now identify this, and provide for a better re-frac. We expect to see some very good results in 2016. In conjunction with high-grading, well design continues to be the main reason production has maintained. Changes to well design have been significant, and the resulting production increases much better than anticipated.

No operator is better than EOG Resources (NYSE:EOG) at well design. From the Bakken, to the Eagle Ford and Permian it continues to outperform the competition.

The following map courtesy of ShaleMapsPro.com does a good job of illustrating EOG’s exposure in the Eagle Ford.

EagleFord.SeekingAlpha

(Source: Shalemapspro.com)

EOG’s focusing of frac jobs closer to the well bore has provided for much better source rock stimulation (fraccing). Since more fractures are created, there is a greater void in the shale. This means more producing rock has contact with the well. EOG continues to push more sand and fluids in the attempt to recover more resource per foot. To evaluate production, it must be broken into days over 6 to 12 months. To evaluate well design, locations must be close to one another and by the same operator. This consistency allows us to see advantages to well design changes. Lastly, we compare marginal acreage it is no longer working to the high-grading program. This is how operators are spending less and producing more.

EOG is working in the Antelope field of northeast McKenzie County. This is Bakken core acreage and considered excellent in both the middle Bakken and upper Three Forks.

(click to enlarge)
(Source: Welldatabase.com)

The center of the above map is the location of both its Riverview and Hawkeye wells. These six wells are located in two adjacent sections. The pad is just west of New Town in North Dakota. Riverview 100-3031H was completed in 6/12. It is an upper Three Forks well. 39 stages were used on an approximate 9000 foot lateral. 5.7 million pounds of sand were used with 85000 barrels of fluids.

(click to enlarge)
(Source: Welldatabase.com)

Date Oil (BBL) Gas ((NYSEMKT:MCF)) BOE
6/1/2012 4,384.00 3,972.00 3972
7/1/2012 27,133.00 15,337.00 15337
8/1/2012 24,465.00 17,223.00 17223
9/1/2012 21,457.00 9,190.00 9190
10/1/2012 18,040.00 12,601.00 12601
11/1/2012 19,924.00 13,366.00 13366
12/1/2012 28,134.00 22,259.00 22259
1/1/2013 15,382.00 12,661.00 12661
2/1/2013 3,429.00 2,451.00 2451
3/1/2013 15,242.00 22,774.00 22774
4/1/2013 15,761.00 8,479.00 8479
5/1/2013 13,786.00 18,372.00 18372
6/1/2013 14,485.00 18,555.00 18555
7/1/2013 15,668.00 27,250.00 27250
8/1/2013 12,084.00 23,876.00 23876
9/1/2013 13,841.00 46,815.00 46815
10/1/2013 11,388.00 45,800.00 45800
11/1/2013 2,711.00 10,533.00 10533
12/1/2013 0 0 0
1/1/2014 5,953.00 35 35
2/1/2014 11,368.00 20,851.00 20851
3/1/2014 8,784.00 11,179.00 11179
4/1/2014 5,607.00 8,479.00 8479
5/1/2014 4,727.00 5,663.00 5663
6/1/2014 8,359.00 12,726.00 12726
7/1/2014 8,799.00 22,957.00 22957
8/1/2014 7,958.00 31,621.00 31621
9/1/2014 7,218.00 44,318.00 44318
10/1/2014 3,778.00 14,058.00 14058
11/1/2014 3,701.00 9,951.00 9951
12/1/2014 6,612.00 18,435.00 18435
1/1/2015 6,181.00 24,142.00 24142
2/1/2015 3,517.00 10,722.00 10722
3/1/2015 5,218.00 24,175.00 24175
4/1/2015 4,275.00 24,233.00 24233

(Source: Welldatabase.com)

Riverview 100-3031H was a progressive well design for 2012. It produced well. To date it has produced 379 thousand bbls of crude and 615 thousand Mcf of natural gas. This equates to $24 million in revenues. Over the first 360 days (using the true number of production days) it produced 240,036 bbls of crude. The month of December 2013, this well was shut in for the completion of an adjacent well. There was a return to production but no significant jump in production from pressure generated by the new locations. This well declined 42% over 12 months. This is much lower than estimates shown through other well models. The next year we see a 35% decline. 10 months later we see an additional decline of approximately 55%. The decline curve of a well is very specific to geology and well design. Keep in mind averages are just that, and do not provide specific data. These averages should not be used to evaluation acreage and operator as there are wide average swings. Also, averages are generally over a long time frame. Production in the Bakken began in 2004 (first horizontal well completed). Wells in 2004 produce nothing like wells today. Updated averages based on year (IP 360) are more useful. Riverview 100-3031H was part of a two well pad. A middle Bakken well was also completed.

Riverview 4-3031H began producing a month after Riverview 100-3031H. It was a 38 stage 9000 foot lateral. 4.3 million lbs of sand were used and 69000 bbls of fluids.

(click to enlarge)
(Source: Welldatabase.com)

The Riverview and Hawkeye wells analyzed in this article were drilled in a southern fashion.

Date Oil Gas BOE
7/1/2012 20,529.00 12,537.00 12537
8/1/2012 16,553.00 16,903.00 16903
9/1/2012 17,096.00 10,148.00 10148
10/1/2012 23,197.00 17,914.00 17914
11/1/2012 20,122.00 14,402.00 14402
12/1/2012 27,340.00 33,217.00 33217
1/1/2013 16,044.00 24,394.00 24394
2/1/2013 4,267.00 4,946.00 4946
3/1/2013 27,516.00 26,219.00 26219
4/1/2013 20,792.00 7,940.00 7940
5/1/2013 17,516.00 35,948.00 35948
6/1/2013 15,457.00 50,500.00 50500
7/1/2013 13,480.00 50,807.00 50807
8/1/2013 11,254.00 42,300.00 42300
9/1/2013 9,319.00 40,341.00 40341
10/1/2013 8,559.00 33,116.00 33116
11/1/2013 2,190.00 40 40
12/1/2013 0 0 0
1/1/2014 1,124.00 11 11
2/1/2014 5,271.00 81 81
3/1/2014 8,931.00 9,827.00 9827
4/1/2014 5,469.00 7,940.00 7940
5/1/2014 4,807.00 5,748.00 5748
6/1/2014 8,522.00 13,819.00 13819
7/1/2014 7,982.00 17,983.00 17983
8/1/2014 7,169.00 26,755.00 26755
9/1/2014 5,750.00 22,586.00 22586
10/1/2014 1,349.00 3,194.00 3194
11/1/2014 6,495.00 15,947.00 15947
12/1/2014 6,442.00 18,806.00 18806
1/1/2015 5,840.00 22,126.00 22126
2/1/2015 4,171.00 18,682.00 18682
3/1/2015 4,221.00 18,539.00 18539
4/1/2015 3,878.00 19,725.00 19725

(Source: Welldatabase.com)

Riverview 4-3031H has produced 361 thousand bbls of crude and 657 thousand Mcf of natural gas. It under produced Riverview 100-3031H, but this is consistent with well design. 360 day production totaled 237,735 bbls of oil. We do not know if the Three Forks is a better pay zone than the middle Bakken as the well design was not consistent. Most operators have reported better results from the middle Bakken. The Three Forks well used one more stage (less feet per stage should mean better fracturing). It also used significantly more sand and fluids. Either way both wells were good results. Riverview 4-3031H only declined approximately 36% in a comparison of the first month to month 12. This was 7% better than 100-3031H. It declined another 41% in year two on a month to month comparison. This was 6% greater. 56% was seen when compared to adjusted production for 5/15. The Three Forks well declines slower in later production than 4-3031H. This may be due to well design. The well with more stages, proppant and fluids continues to out produce the Bakken well. It is possible the source rock is better. There are many other variables to look at, but this data provides why EOG continues to push ahead with more complex locations.

In September of 2012, EOG drilled its next well in this area. Hawkeye 100-2501H is a 13700 foot lateral targeting the upper Three Forks. It is a 47 stage frac. 14 million pounds of sand were used with 158000 bbls of fluids.

(click to enlarge)
(Source: Welldatabase.com)

Of the three pads, this well is located in the center. It was an interesting design, given the length of the lateral.

Date Oil Gas BOE
9/1/2012 21,959.00 444 444
10/1/2012 54,927.00 155 155
11/1/2012 47,557.00 57,300.00 57300
12/1/2012 55,367.00 92,144.00 92144
1/1/2013 33,396.00 55,877.00 55877
2/1/2013 22,100.00 32,810.00 32810
3/1/2013 36,631.00 57,544.00 57544
4/1/2013 29,075.00 32,696.00 32696
5/1/2013 22,210.00 33,351.00 33351
6/1/2013 17,544.00 25,794.00 25794
7/1/2013 15,872.00 23,600.00 23600
8/1/2013 19,647.00 28,746.00 28746
9/1/2013 15,486.00 22,352.00 22352
10/1/2013 21,325.00 31,678.00 31678
11/1/2013 6,418.00 9,214.00 9214
12/1/2013 0 0 0
1/1/2014 0 0 0
2/1/2014 0 0 0
3/1/2014 29,699.00 23,822.00 23822
4/1/2014 39,782.00 32,696.00 32696
5/1/2014 35,267.00 61,543.00 61543
6/1/2014 27,554.00 49,551.00 49551
7/1/2014 7,229.00 12,565.00 12565
8/1/2014 31,155.00 98,086.00 98086
9/1/2014 12,617.00 32,742.00 32742
10/1/2014 2 4 4
11/1/2014 7,769.00 15,996.00 15996
12/1/2014 15,487.00 49,147.00 49147
1/1/2015 4,427.00 9,918.00 9918
2/1/2015 9,344.00 20,654.00 20654
3/1/2015 8,459.00 25,171.00 25171
4/1/2015 7,235.00 24,752.00 24752

(Source: Welldatabase.com)

Hawkeye 100-2501H had some excellent early production numbers. From that perspective, it is one of the best wells to date in the Bakken. It has already produced 655,000 bbls of crude and 960,000 Mcf of natural gas. It has revenues in excess of $42 million to date. This includes roughly four non-producing or unproductive months. Crude production over the first 360 days was 389,835 bbls. Over the first 12 months, this well produced crude revenues in excess of $23 million. Decline rates were higher, as the first full month of production declined 65% over the first year. This isn’t important as early production rates were some of the highest seen in North Dakota. It is important to note, decline rates are emphasized but higher pressured wells may deplete faster depending on choke and how quickly production is propelled up and out of the wellbore. Any well that produces very well initially will have higher decline rates, but this does not lessen the value of the well. This specific well is depleting faster, but no one is complaining about payback times well under a year. Decline rates decrease significantly in year two at 11%. This well saw a marked increase in production when adjacent wells were turned to sales. The additional pressure associated with well communication increased production from 20,000 bbls/month to 35,000 bbls/month on average. This occurred over a 6 month period.

(click to enlarge)
(Source: Welldatabase.com)

Hawkeye 102-2501H was the fourth completion. This 14,000 foot 62 stage lateral targeted the upper Three Forks. It used 14.5 million pounds of sand and 164,000 bbls of fluids.

Date Oil Gas BOE
1/1/2013 18,486.00 41 41
2/1/2013 27,120.00 8,705.00 8705
3/1/2013 39,702.00 15,748.00 15748
4/1/2013 17,714.00 30,501.00 30501
5/1/2013 41,368.00 57,489.00 57489
6/1/2013 26,602.00 34,399.00 34399
7/1/2013 0 0 0
8/1/2013 133 0 0
9/1/2013 0 0 0
10/1/2013 0 0 0
11/1/2013 0 0 0
12/1/2013 0 0 0
1/1/2014 5,163.00 6,403.00 6403
2/1/2014 41,917.00 74,353.00 74353
3/1/2014 36,439.00 18,111.00 18111
4/1/2014 19,477.00 30,501.00 30501
5/1/2014 26,388.00 43,071.00 43071
6/1/2014 27,480.00 49,456.00 49456
7/1/2014 14,529.00 33,072.00 33072
8/1/2014 24,542.00 62,753.00 62753
9/1/2014 17,613.00 53,460.00 53460
10/1/2014 17,451.00 66,544.00 66544
11/1/2014 9,634.00 33,366.00 33366
12/1/2014 16,338.00 76,547.00 76547
1/1/2015 11,450.00 65,277.00 65277
2/1/2015 8,971.00 50,919.00 50919
3/1/2015 3,177.00 14,820.00 14820
4/1/2015 6,495.00 13,616.00 13616

(Source: Welldatabase.com)

It has produced 458,000 bbls of crude and 839,000 Mcf to date. This equates to roughly $30 million over well life. 360 day production was 394,673 bbls of crude. Production was interesting as initial production was outstanding. The big production numbers were hindered as many of the early months had missed production days. We don’t know if there were production problems, but do know the well was shut when adjacent wells were turned to sales. Production was over 1000 bbls/d over the first six months. It was shut in for another six months. After this production jumped, but this is misleading. Given the fewer days of production per month, there wasn’t much of an increase when the new wells were turned to sales. The decline over the first year on a monthly basis is 20%. The second year is much greater at 80%. We have seen recent production decrease significantly, and is something to watch. Lower decline rates initially are more important. This is because production rates are higher. It equates to greater total production.

Hawkeye 01-2501H was completed in January of 2013.

(click to enlarge)
(Source: Welldatabase.com)

It is a 64 stage, 15000 foot lateral targeting the middle Bakken. This well used 172,000 bbls of fluids and 15 million pounds of sand.

Date Oil Gas BOE
1/1/2013 18,792.00 43 43
2/1/2013 30,211.00 13,879.00 13879
3/1/2013 42,037.00 17,648.00 17648
4/1/2013 17,433.00 36,881.00 36881
5/1/2013 38,754.00 63,501.00 63501
6/1/2013 28,602.00 48,817.00 48817
7/1/2013 0 0 0
8/1/2013 134 1 1
9/1/2013 0 0 0
10/1/2013 0 0 0
11/1/2013 0 0 0
12/1/2013 0 0 0
1/1/2014 6,311.00 7,186.00 7186
2/1/2014 43,713.00 74,099.00 74099
3/1/2014 39,156.00 18,492.00 18492
4/1/2014 23,408.00 36,881.00 36881
5/1/2014 21,681.00 33,498.00 33498
6/1/2014 28,502.00 51,543.00 51543
7/1/2014 18,795.00 45,017.00 45017
8/1/2014 25,512.00 58,837.00 58837
9/1/2014 20,522.00 60,662.00 60662
10/1/2014 19,137.00 68,576.00 68576
11/1/2014 12,093.00 37,043.00 37043
12/1/2014 16,587.00 45,980.00 45980
1/1/2015 14,246.00 62,819.00 62819
2/1/2015 9,220.00 35,931.00 35931
3/1/2015 3,617.00 6,634.00 6634
4/1/2015 13,702.00 42,551.00 42551

(Source: Welldatabase.com)

It has produced 492,170 bbls of crude and 866,520 Mcf of natural gas. 360 day production was 412,072 bbls of oil.

(click to enlarge)
(Source: Welldatabase.com)

This is an excellent well, but the location of focus is Hawkeye 02-2501H. It was completed last in this group. This well provides the link between changes in well design to production improvements.

Date Oil Gas BOE
12/1/2013 3,022.00 6,533.00 6533
1/1/2014 37,385.00 75,940.00 75940
2/1/2014 30,066.00 58,949.00 58949
3/1/2014 22,876.00 50,690.00 50690
4/1/2014 26,703.00 43,926.00 43926
5/1/2014 31,987.00 55,124.00 55124
6/1/2014 27,777.00 47,166.00 47166
7/1/2014 31,500.00 50,279.00 50279
8/1/2014 51,709.00 99,583.00 99583
9/1/2014 43,292.00 98,069.00 98069
10/1/2014 40,143.00 98,927.00 98927
11/1/2014 24,064.00 50,495.00 50495
12/1/2014 31,488.00 99,684.00 99684
1/1/2015 27,087.00 94,621.00 94621
2/1/2015 22,207.00 94,490.00 94490
3/1/2015 22,590.00 125,634.00 125634
4/1/2015 17,707.00 94,910.00 94910

(Source: Welldatabase.com)

The production numbers are significant. In less than a year and a half, it has produced 490,000 bbls of crude and 1.25 Bcf of natural gas. Revenues to date are $33.2 million. Its 360 day crude production was 427,663 bbls. The production is impressive but the decline curve is more important. This Hawkeye well has a steady production rate with only a slight decline. This is where the analysts may be getting it wrong, as decline curves change significantly by area and well design. What EOG has done is not only increased production significantly, but also flattened the curve. Initial production is interesting as we don’t see peak production until nine months. This means our best month is August of 2014, and not the first full month. When we analyze the production after one full year of production, there is no drop off.

This 12800 foot 69 stage lateral is a very good middle Bakken design. EOG decided to pull back some of the lateral length. There are several possible reasons for this. We think it is possible EOG has discovered it was having difficulty in getting proppant to the toe of the well. But this is why operators test the length. More importantly, the increase in stages in conjunction with a shorter lateral provides for shorter stages. This means the operator will probably do a better job of stimulating the source rock. This well also used massive volumes of fluids and sand. 460,000 bbls of fluids were used with over 27 million lbs of proppant. I don’t normally break down the types of sand, as it can be trivial to some but in this case I have as the design seems somewhat unique. This well used approximately 16 million lbs of 100 mesh sand, 7 million lbs of 30/70 and 4 million 40/70. The large volumes of mesh sand are interesting. It would seem EOG is trying to push the finest sand deep into the fractures to maintain deeper shale production.

Well Date Lateral Ft. Stages Proppant Lbs. Fluids Bbls. 12 mo. Oil Production Bbls. Production/Ft.
Riverview 100-3031H 6/12 9,000 39 5.7M 85,000 240,036 26.67
Riverview 4-3031H 7/12 9,000 38 4.3M 69,000 237,735 26.42
Hawkeye 100-2501H 9/12 13,700 47 14M 158,000 389,835 28.46
Hawkeye 102-2501H 1/13 14,000 62 14.5M 164,000 394,673 28.19
Hawkeye 01-2501H 1/13 15,000 64 15M 172,000 412,072 27.47
Hawkeye 02-2501H 12/13 12,800 69 27M 460,000 427,663 33.41

I completed the above table for several reasons. The first was to show well design’s effect on one year total production. We used 360 days as a base. We didn’t use 12 months as that will skew data, as some wells don’t produce every day of every month. Wells are shut in for service or more importantly when new production from adjacent locations are turned to sales. So these are a specific number of days and not estimates. We also broke down production per foot of lateral. This may be more important than any other factor. Production per well is important, but lateral length is a key as it shows how well the source rock was stimulated. In reality, production per foot matters more at longer lateral lengths. Many operators don’t like to do laterals longer than 10,000 feet, as production per foot decreases sharply. When looking at well production data, it is obvious that production per foot suffers as the toe of the lateral gets farther from the vertical.

There are several other ETFs that focus on U.S. and world crude prices:

  • iPath S&P Crude Oil Total Return Index ETN (NYSEARCA:OIL)
  • ProShares Ultra Bloomberg Crude Oil ETF (NYSEARCA:UCO)
  • VelocityShares 3x Long Crude Oil ETN (NYSEARCA:UWTI)
  • ProShares Ultrashort Bloomberg Crude Oil ETF (NYSEARCA:SCO)
  • U.S. Brent Oil ETF (NYSEARCA:BNO)
  • PowerShares DB Oil ETF (NYSEARCA:DBO)
  • VelocityShares 3x Inverse Crude Oil ETN (NYSEARCA:DWTI)
  • PowerShares DB Crude Oil Double Short ETN (NYSEARCA:DTO)
  • U.S. 12 Month Oil ETF (NYSEARCA:USL)
  • U.S. Short Oil ETF (NYSEARCA:DNO)
  • PowerShares DB Crude Oil Long ETN (NYSEARCA:OLO)
  • PowerShares DB Crude Oil Short ETN (NYSEARCA:SZO)
  • iPath Pure Beta Crude Oil ETN (NYSEARCA:OLEM)

All six wells had fantastic results. The first two Riverview wells are still considered sand heavy fracs and produced almost a quarter of a million barrels of oil. This does not include natural gas in the estimates, but EURs for these wells are approximately 1200 MBo. We don’t put much emphasis on EURs other than an indicator of how good production is in comparison. Since locations will produce from 35 to 40 years, we are more inclined to emphasize one year production. Although the Hawkeye wells drilled on 9/12 and 1/13 didn’t show a large uptick in production per foot, it is still quite impressive considering the lateral length. Overall production uplift was exceptional, and these wells produce decent payback times at current oil price realizations.

There is no doubt this area has superior geology. It is definitely a core area, but may not be as good as Parshall field. Because of this, we know other areas would not produce as well, but still it provides a decent comparison for the upside to well design. Geology is still key and this is probably why EOG recently drilled a 15 well pad in the same general area. These wells are still in confidential status, so we do not know the outcome. Given the results in this area, these wells could be very interesting. The most important reason to focus on these Mega-Fracs is repeatability. If EOG can do this, so can other operators. Our expectations are many operators will be able to complete wells this good within the next 12 to 24 months. If this occurs we could see production maintained at much lower prices and fewer completions.

Why Cheap Oil May Be Here To Stay

https://i0.wp.com/m.wsj.net/video/20141212/121214table3/121214table3_1280x720.jpg
By
Kyle Spencer

Summary

  • Many investors are still skeptical that Saudi Arabia will hold firm on oil production.
  • Increased global consumption due to falling prices is unlikely to offset North American production.
  • US consumption is in a secular, structural decline due to increased efficiency and demographic changes. That’s unlikely to change any time soon.
  • The floor may not be where the Saudis think it is.

Investors are slowly waking up to the fact that Saudi Arabia is willing to take OPEC hostage to defend its market share, with Oil Minister Ali Al-Naimi declaring that –

In a situation like this, it is difficult, if not impossible, that the kingdom or OPEC would carry out any action that may result in a reduction of its share in market and an increase of others’ shares.

Alas, rather than embrace the cheap petroleum paradigm that has dominated most of the 20th century, many investors continue to cling to old shibboleths. Case in point: Brian Hicks, a portfolio manager at US Global Investors, recently noted that

The theme going into 2015 is mean reversion. Oil prices are below where they should be (emphasis mine), and hopefully they will start gravitating back to the equilibrium price of between $US80 and $US85 a barrel.

I emphasize the words “below where they should be” because the notion that oil (NYSEARCA:USO) prices belong somewhere – and it’s always higher, somehow – is the linchpin of the bullish thesis. But the question of why a high price regime should prevail over a low price regime is never satisfactorily explained.

Higher extraction costs? A sizable chunk of those costs are sunk costs that can simply be ignored in production decisions and lowering the effective breakeven price. A tighter focus on already drilled wells in areas with mature infrastructure could lower costs even further. Moreover, service sector costs fall as rigs are idled. Depleted reserves? Most resource-producing basins are experiencing an increasing yield over time despite the rapid depletion of individual wells. A lot of that is due to extraction efficiency, which is increasing at a phenomenal rate; in fact, one rig today brings on four times the amount of gas in the Barnett Shale than it did in 2006. Drill times in the Bakken are also falling, while new well production per rig is steadily rising since 2011.

Drill Times (Spud to Rig) 2004-2013

(SOURCE: ITG Research)

Technically oversold? Good luck catching that knife. Traders have been pounding the table on “oversold conditions” since $80. Proponents of the Oversold Hypothesis who like to point historical examples of oil’s extreme short-term volatility for validation are conveniently ignoring the vast number of counter-examples like this TIME Magazine headline from June, 1981, which almost reads as if it could have been written yesterday:

(Source: TIME Archives)

1981 is an intriguing date for another reason: It marked the first time in over a decade that Non-OPEC nations countries outproduced OPEC. Despite repeated cuts by OPEC, it took five years for capitulation to set in. Nor are lower prices guaranteed to lead to cuts. Indeed, when oil prices plummeted from $4/bbl to 35 cents in 1862, the Cleveland wildcatters didn’t idle their pumps; they pumped faster to pay the interest on their debt.

Don’t Iran and Venezuela require higher oil prices in order to balance their budgets and head off domestic upheaval? Please. The Saudis don’t care about Iran’s budget problems. Venezuela is a non-entity despite it’s immense reserves. In fact, Venezuela’s hell-in-a-handbasket status was one of the major reasons for Cuba’s recent defection to the US.

Asian stimulus? The only reason that Japanese consumers know that oil prices are lower is from Western news headlines. The share of a day’s wages to buy a single gallon of gas in Japan is 5.59% vs. 2.45% in the US. Nevertheless, the Japanese are riding high compared to the BRICS: In Brazil, it’s 17.62%; in Russia, 7.95%; in India it’s 114.92%; in China it’s 23.54%. Not the most fertile ground for a demand-side revolution; especially since oil is priced in dollars rather than yen, reals, rubles, or rupees.

What about the US? Won’t lower prices lead to higher consumption? Despite what you read about our “insatiable thirst” for oil, Americans don’t actually drink the stuff. Our machines do, and those machines are becoming more and more efficient due to CAFE standards and new transportation technologies, especially NGVs. Demographic changes are also leading a secular decline in consumption. Fig. 2 below highlights the steady march down for miles traveled per capita as the Baby Boomers retire to slower paced lives.

(Source: Citigroup, Census, CIRA)

The reality is that there’s little that an uptick in demand can do to offset oil’s continuing price collapse if the Saudis aren’t prepared to cut to the bone. The wildcatters certainly aren’t going to; on the contrary, they have every incentive (and no real alternative at this point) to pump like crazy to pay down debt and break OPEC’s back. Most doom and gloom prognostications for North American shale use full-cycle breakeven estimates like the ones presented in Figure 2.

Full-Cycle Breakeven Costs by Resource (Assuming Zero Efficiency Gains)

Unfortunately for the bulls, all-in sustaining cost (full-cycle capex) is a totally irrelevant metric for establishing a floor on commodity prices. Commodities prices are based on the marginal cost of production of the most prolific producers, not the full-cycle costs of marginal, high cost producers lopped in with the market leaders. As Seth Kleinman’s group at Citi has pointed out

…what counts at this stage is half-cycle costs, which are in the significantly lower band of $37 to $45 a barrel. This means that the floor is falling and may not be nearly as firm as the Saudi view assume(s).

How Low Can the Price of Oil Plunge?

https://i0.wp.com/www.gulf-times.com/NewsImages/2014/10/27/30d677e0-63da-4004-ac67-2ce174ec36a9.jpgby Wolf Richter

It is possible that a miracle intervenes and that the price of oil bounces off and zooms skyward. We’ve seen stocks perform these sorts of miracles on a routine basis, but when it comes to oil, miracles have become rare. As I’m writing this, US light sweet crude trades at $76.90 a barrel, down 26% from June, a price last seen in the summer of 2010.

But this price isn’t what drillers get paid at the wellhead. Grades of oil vary. In the Bakken, the shale-oil paradise in North Dakota, wellhead prices are significantly lower not only because the Bakken blend isn’t as valuable to refiners as the benchmark West Texas Intermediate, but also because take-away capacity by pipeline is limited. Crude-by-rail has become the dominant – but more costly – way to get the oil from the Northern Rockies to refineries on the Gulf Coast or the East Coast.

These additional transportation costs come out of the wellhead price. So for a particular well, a driller might get less than $60/bbl – and not the $76.90/bbl that WTI traded for at the New York Mercantile Exchange.

Fracking is expensive, capital intensive, and characterized by steep decline rates. Much of the production occurs over the first two years – and much of the cash flow. If prices are low during those two years, the well might never be profitable.

Meanwhile, North Sea Brent has dropped to $79.85 a barrel, last seen in September 2010.

So the US Energy Information Administration, in its monthly short-term energy outlook a week ago, chopped down its forecast of the average price in 2015: WTI from $94.58/bbl to $77.55/bbl and Brent from $101.67/bbl to $83.24/bbl.

Independent exploration and production companies have gotten mauled. For example, Goodrich Petroleum plunged 71% and Comstock Resources 58% from their 52-week highs in June while Rex Energy plunged 65% and Stone Energy 54% from their highs in April.

Integrated oil majors have fared better, so far. Exxon Mobil is down “only” 9% from its July high. On a broader scale, the SPDR S&P Oil & Gas Exploration & Production ETF (XOP) is down 28% from June – even as the S&P 500 set a new record.

https://i0.wp.com/maxspeak.net/wp-content/uploads/2014/08/34852468Rick-Santelli-380x190.jpg

So how low can oil drop, and how long can this go on?

The theory is being propagated that the price won’t drop much below the breakeven point in higher-cost areas, such as the tar sands in Canada or the Bakken in the US. At that price, rather than lose money, drillers would stop fracking and tar-sands operators would shut down their tar pits. And soon, supplies would tighten up, inventories would be drawn down, and prices would jump.

But that’s not what happened in natural gas. US drillers didn’t stop fracking when the price of natural gas plunged below the cost of production and kept plunging for years. In April 2012, it reached not a four-year low but a decade-low of about $1.90 per million Btu at the Henry hub. At the time, shorts were vociferously proclaiming that gas storage would be full by fall, that the remaining gas would have to be flared, and that the price would then drop to zero.

But drillers were still drilling, and production continues to rise to this day, though the low price also caused an uptick in consumption that coincided with a harsh winter, leaving storage levels below the five-year minimum for this time of the year.

The gas glut has disappeared. The price at the Henry hub has since more than doubled, but it remains below breakeven for many wells. And when natural gas was selling for $4/MM Btu at the Henry hub, it was selling for $2/MM Btu at the Appalachian hubs, where the wondrous production from the Marcellus shale comes to market. No one can make money at that price.

And they’re still drilling in the Marcellus.

Natural gas drillers had a cover: a well that also produced a lot of oil and natural gas liquids was profitable because they fetched a much higher price. But this too has been obviated by events: on top of the rout in oil, the inevitable glut in natural gas liquids has caused their prices to swoon too (chart).

Yet, they’re still drilling, and production is still rising. And they will continue to drill as long as they can get the moolah to do so. They might pick and choose where they drill, and they might back off a smidgen, but as long as they get the money, they’ll drill.

Money has been flowing into the oil and gas business like a tsunami unleashed by yield-desperate investors who, driven to near insanity by the Fed’s policies, do what the Fed has been telling them to do: close their eyes and hold their noses and disregard risk and hand over their money, and borrow money for nearly free and hand over that money too.

Oil and gas companies have issued record amounts of junk bonds. They’ve raised record amounts of money via a record number of IPOs. They’ve raised money by spinning off assets into publicly traded MLPs. They’ve borrowed from banks that then packaged these loans into securities that were then sold. The industry has taken this cheap money and has drilled it into the ground.

This is one of the consequences of the Fed’s decision to flood the land with free liquidity. When the cost of capital is near zero, and when returns on low-risk investments are near zero as well, or even below zero, investors go into a sort of coma. But when they come out of it and realize that “sunk capital” has taken on a literal meaning, they’ll shut off the spigot.

Only then will drilling and production decline. As with natural gas, it can take years. And as with natural gas, the price might plunge through a four-year low and hit a decade low – which would be near $40/bbl, a price last seen in 2009. The bloodletting would be epic. To see where this is going, watch the money.

https://i0.wp.com/www.independent.co.uk/incoming/article9783416.ece/alternates/w620/pg-58-oil-getty.jpg

Don’t Count On A Major Slowdown In U.S. Oil Production Growth

https://i0.wp.com/upachaya.com/wp-content/uploads/2014/05/fracking.jpgby Richard Zeits

Summary

  • The presumption that North American shale oil production is the “swing” component of global supply may be incorrect.
  • Supply cutbacks from other sources may come first.
  • Growth momentum in North American unconventional oil production will likely carry on into 2015, with little impact from lower oil prices on the next two quarters’ volumes.
  • The current oil price does not represent a structural “economic floor” for North American unconventional oil production.

The recent pull back in crude oil prices is often portrayed as being a consequence of the rapid growth of North American shale oil production.

The thesis is often further extrapolated to suggest that a major slowdown in North American unconventional oil production growth, induced by the oil price decline, will be the corrective mechanism that will bring oil supply and demand back in equilibrium (given that OPEC’s cost to produce is low).

Both views would be, in my opinion, overly simplistic interpretations of the global supply/demand dynamics and are not supported by historical statistical data.

Oil Price – The Economic Signal Is Both Loud and Clear

The current oil price correction is, arguably, the most pronounced since the global financial crisis of 2008-2009. The following chart illustrates very vividly that the price of the OPEC Basket (which represents waterborne grades of oil) has moved far outside the “stability band” that seems to have worked well for both consumers and producers over the past four years. (It is important, in my opinion, to measure historical prices in “today’s dollars.”)

(Source: Zeits Energy Analytics, November 2014)

Given the sheer magnitude of the recent oil price move, the economic signal to the world’s largest oil suppliers is, arguably, quite powerful already. A case can be made that it goes beyond what could be interpreted as “ordinary volatility,” giving the hope that the current price level may be sufficient to induce some supply response from the largest producers – in the event a supply cut back is indeed needed to eliminate a transitory supply/demand imbalance.

Are The U.S. Oil Shales The Culprit?

It is debatable, in my opinion, if the continued growth of the U.S. onshore oil production can be identified as the primary cause of the current correction in the oil price. Most likely, North American shale oil is just one of several powerful factors, on both supply and demand sides, that came together to cause the price decline.

The history of oil production increases from North America in the past three years shows that the OPEC Basket price remained within the fairly tight band, as highlighted on the graph above, during 2012-2013, the period when such increases were the largest. Global oil prices “broke down” in September of 2014, when North American oil production was growing at a lower rate than in 2012-2013.

(Source: OPEC, October 2014)

If the supply growth from North America was indeed the primary “disruptive” factor causing the imbalance, one would expect the impact on oil prices to become visible at the time when incremental volumes from North America were the highest, i.e., in 2012-2013.

Should One Expect A Strong Slowdown in North American Oil Production Growth?

There is no question that the sharp pullback in the price of oil will impact operating margins and cash flows of North American shale oil producers. However, a major slowdown in North American unconventional oil production growth is a lot less obvious.

First, the oil price correction being seen by North American shale oil producers is less pronounced than the oil price correction experienced by OPEC exporters. It is sufficient to look at the WTI historical price graph below (which is also presented in “today’s dollars”) to realize that the current WTI price decline is not dissimilar to those seen in 2012 and 2013 and therefore represents a signal of lesser magnitude than the one sent to international exporters (the OPEC Basket price).

(Source: Zeits Energy Analytics, November 2014)

Furthermore, among all the sources of global oil supply, North American oil shales are the least established category. Their cost structure is evolving rapidly. Given the strong productivity gains in North American shale oil plays, what was a below-breakeven price just two-three years ago, may have become a price stimulating growth going into 2015.

Therefore, the signal sent by the recent oil price decline may not be punitive enough for North American shale oil producers and may not be able to starve the industry of external capital.

Most importantly, review of historical operating statistics provides an indication that the previous similar WTI price corrections – seen in 2012 and 2013 – did not result in meaningful slowdowns in the North American shale oil production.

The following graph shows the trajectory of oil production in the Bakken play. From this graph, it is difficult to discern any significant impact from the 2012 and 2013 WTI price corrections on the play’s aggregate production volumes. While a positive correlation between these two price corrections and the pace of production growth in the Bakken exists, there are other factors – such as takeaway capacity availability and local differentials – that appear to have played a greater role. I should also note that the impact of the lower oil prices on production volumes was not visible in the production growth rate for more than half a year after the onset of the correction.

(Source: Zeits Energy Analytics, November 2014)

Leading U.S. Independents Will Likely Continue to Grow Production At A Rapid Pace

Production growth track record by several leading shale oil players suggests that U.S. shale oil production will likely remain strong even in the $80 per barrel WTI price environment. Several examples provide an illustration.

Continental Resources (NYSE:CLR) grew its Bakken production volumes at a 58% CAGR over the past three years (slide below). By looking at the company’s historical production, it would be difficult to identify any impact from the 2012 and 2013 oil price corrections on the company’s production growth rate. Continental just announced a reduction to its capital budget in 2015 in response to lower oil prices, to $4.6 billion from $5.2 billion planned initially. The company still expects to grow its total production in 2015 by 23%-29% year-on-year.

(Source: Continental Resources, October 2014)

EOG Resources (NYSE:EOG) expects that its largest core plays (Eagle Ford, Bakken and Delaware Basin) will generate after-tax rates of return in excess of 100% in 2015 at $80 per barrel wellhead price. EOG went further to suggest that these plays may remain economically viable (10% well-level returns) at oil prices as low as $40 per barrel. The company expects to continue to grow its oil production at a double-digit rate in 2015 while spending within its cash flow. EOG achieved ~40% oil production growth in 2012-2013 and expects 31% growth for 2014. While a slowdown is visible, it is important to take into consideration that EOG’s oil production base has increased dramatically in the past three years and requires significant capital just to be maintained flat. Again, one would not notice much impact from prior years’ oil price corrections on EOG’s production growth trajectory.

(Source: EOG Resources, November 2014)

Anadarko Petroleum’s (NYSE:APC) U.S. onshore oil production growth story is similar. Anadarko increased its U.S. crude oil and NLS production from 100,000 barrels per day in 2010 to close to almost 300,000 barrels per day expected in Q4 2014. Anadarko has not yet provided growth guidance for 2015, but indicated that the company’s exploration and development strategies remain intact. While recognizing a very steep decline in the oil price, Anadarko stated that it wants “to watch this environment a little longer” before reaching conclusions with regard to the impact on its future spending plans.

(Source: Anadarko Petroleum, October 2014)

Devon Energy (NYSE:DVN) posted company-wide oil production of 216,000 barrels per day in Q3 2014. While Devon will provide detailed production and capital guidance at a later date, the company has indicated that it sees 20% to 25% oil production growth and mid‐single digit top‐line growth “on a retained‐property basis” (pro forma for divestitures) in 2015.

The list can continue on.

In Conclusion…

Based on preliminary 2015 growth indications from large shale oil operators, North American oil production growth in 2015 will likely remain strong, barring further strong decline in the price of oil.

No slowdown effect from lower oil prices will be seen for at least six months from the time operators received the “price signal” (August-September 2014).

Given the effects of the technical learning curve in oil shales and continuously improving drilling economics, the current ~$77 per barrel WTI price is unlikely to be sufficient to eliminate North American unconventional production growth.

North American shale oil production remains a very small and highly fragmented component of the global oil supply.

The global oil “central bank” (Saudi Arabia and its close allies in OPEC) remain best positioned to quickly re-instate stability of oil price in the event further significant decline occurred.