Tag Archives: oil price

The First Crude Oil To Price Below $0.00 Happened This Week

When Goldman’s crude oil analysts wrote on Monday that “This Is The Largest Economic Shock Of Our Lifetimes“, they echoed something we said last week – nameley that the record surge in excess oil output amounting to a mind blowing 20 million barrels daily or roughly 20% of global demand…

… which is the result of the Saudi oil price war which has unleashed a record gusher in Saudi oil production, coupled with a historic crash in oil demand (which Goldman estimated at 26mmb/d), could send the price of landlocked crude oil negative: “this shock is extremely negative for oil prices and is sending landlocked crude prices into negative territory.”

We didn’t have long to wait, because while oil prices for virtually all grades have now collapsed to cash costs…

… Bloomberg points out that in a rather obscure corner of the American physical oil market, crude prices have now officially turned negative as “producers are actually paying consumers to take away the black stuff.”

The first crude stream to price below zero was Wyoming Asphalt Sour, a dense oil used mostly to produce paving bitumen. Energy trading giant Mercuria bid negative 19 cents per barrel in mid-March for the crude, effectively asking producers to pay for the luxury of getting rid of their output.

Echoing Goldman, Elisabeth Murphy, an analyst at consultant ESAI Energy said that “these are landlocked crude with just no buyers. In areas where storage is filling up quickly, prices could go negative. Shut-ins are likely to happen by then.”

While Brent and WTI are hovering just around $20 a barrel, in the world of physical oil where actual barrels change hands  producers are getting much less according to Bloomberg as demand plunges due to the lock down to contain the spread of the coronavirus.

Brent is a waterborne crude priced on an island in the North Sea, 500 meters from the water. In contrast, WTI is landlocked and 500 miles from the water. As I like to say, I would rather have a high-cost waterborne crude oil that can access a ship than a landlocked pipeline crude sitting behind thousands of miles of pipe, like the crude oils in the US, Russia and Canada.

As we noted last night, when we asked who would see zero dollar oil first, several grades in North America are already trading in single digit territory as the market tries to force some output to shut-in. Canadian Western Select, the benchmark price for the giant oil-sands industry in Canada, fell to $4 on Monday, while Midland Texas was last seen trading just around $10.

Southern Green Canyon in the Gulf of Mexico is worth $11.51 a barrel, Oklahoma Sour is changing hands at $5.75, Nebraska Intermediate at $8, while Wyoming Sweet prices at $3 a barrel, per Bloomberg.

While there is very little hope of a dramatic improvement in the situation, late on Tuesday, President Trump said the U.S. would meet with Saudi Arabia and Russia with the goal of halting the historic plunge in oil prices. Trump, speaking at the White House Tuesday, said he’s raised the issue with Russian President Vladimir Putin and Saudi Crown Prince Mohammed bin Salman.

“They’re going to get together and we’re all going to get together and we’re going to see what we can do,” he said. “The two countries are discussing it. And I am joining at the appropriate time, if need be.”

It’s unclear what if anything Trump “can do” in what is effectively a collusive war between the two nations meant to crush shale oil.

Trump’s intervention comes as April shapes up to be a calamitous month for the oil market. Saudi Arabia plans to boost its supply to a record 12.3 million barrels a day, up from about 9.7 million in February. At the same time, fuel consumption is poised to plummet by 15 million to 22 million barrels as coronavirus-related lock downs halt transit in much of the world.

There is another problem: oil demand has been so battered by government lock downs to stop the spread of the coronavirus that any conceivable oil production cut agreement between the U.S., Canada, Russia and OPEC members would still fall well short of what’s needed to shore up the market, Goldman calculated. In fact, assuming roughly 20 million in excess supply currently, the only thing that could balance the oil market is nothing short of both Saudi Arabia and Russia halting all output together. And that will never happen.

Finally, below we put the “long history” of oil prices in context:

Source: ZeroHedge

These Are The Banks With Most Energy Exposure

With energy junk bonds crashing

… amid a (long-overdue) investor revulsion to the highly levered energy sector, much of which is funded in the high yield market, as crashing oil prices bring front and center a doomsday scenario of mass defaults as shale companies are unable to meet their debt and interest payment obligations, investor focus is shifting up the funding chain, and after assessing which shale names are likely to be hit the hardest, with many filing for bankruptcy if oil remains at or below $30, the next question is which banks have the most exposure to the energy loans funding these same E&P companies.

Conveniently, in a note this morning looking at the impact of plunging interest rates on bank profitability, Morgan Stanley also lays out the US banks that have the highest exposure to energy in their Q4 loan books.

Real Motive Behind Saudi Royal Flush Emerges: $800 Billion In Confiscated Assets

From the very beginning, there was something off about Sunday’s unprecedented countercoup purge unleashed by Mohammad bin Salman on alleged political enemies, including some of Saudi Arabia’s richest and most powerful royals and government officials: it was just too brazen to be a simple “power consolidation” move; in fact most commentators were shocked by the sheer audacity, with one question outstanding: why take such a huge gamble? After all, there was little chatter of an imminent coup threat against either the senile Saudi King or the crown prince, MbS, and a crackdown of such proportions would only boost animosity against the current ruling royals further.

Things gradually started to make sense when it emerged that some $33 billion in oligarch net worth was “at risk” among just the 4 wealthiest arrested Saudis, which included the media-friendly prince Alwaleed.

https://i0.wp.com/www.zerohedge.com/sites/default/files/images/user5/imageroot/2017/10/21/rich%20saudis%20confiscated.jpg

One day later, a Reuters source reported that in a just as dramatic expansion of the original crackdown, bank accounts of over 1,200 individuals had been frozen, a number which was growing by the minute. Commenting on this land cashgrab, we rhetorically asked “So when could the confiscatory process end? As we jokingly suggested yesterday, the ruling Saudi royal family has realized that not only can it crush any potential dissent by arresting dozens of potential coup-plotters, it can also replenish the country’s foreign reserves, which in the past 3 years have declined by over $250 billion, by confiscating some or all of their generous wealth, which is in the tens if not hundreds of billions. If MbS continues going down the list, he just may recoup a substantial enough amount to what it makes a difference on the sovereign account.”

https://i0.wp.com/www.zerohedge.com/sites/default/files/images/user5/imageroot/2017/10/21/saudi%20reserves.jpg

Then an article overnight from the WSJ confirmed that fundamentally, the purge may be nothing more than a forced extortion scheme, as the Saudi government – already suffering from soaring budget deficits, sliding oil revenues and plunging reserves – was “aiming to confiscate cash and other assets worth as much as $800 billion in its broadening crackdown on alleged corruption among the kingdom’s elite.

As we reported yesterday, the WSJ writes that the country’s central bank, the Saudi Arabian Monetary Authority, said late Tuesday that it has frozen the bank accounts of “persons of interest” and said the move is “in response to the Attorney General’s request pending the legal cases against them.” But what is more notable, is that while we first suggested – jokingly – on Monday that the ulterior Saudi motive would be to simply “nationalize” the net worth of some of Saudi Arabia’s wealthiest individuals, now the WSJ confirms that this is precisely the case, and what’s more notably is that the amount in question is absolutely staggering: nearly 2x Saudi Arabia’s total foreign reserves!

As the WSJ alleges, “the crackdown could also help replenish state coffers. The government has said that assets accumulated through corruption will become state property, and people familiar with the matter say the government estimates the value of assets it can reclaim at up to 3 trillion Saudi riyal, or $800 billion.”

While much of that money remains abroad – and invested in various assets from bonds to stocks to precious metals and real estate – which will complicate efforts to reclaim it, even a portion of that amount would help shore up Saudi Arabia’s finances.

However, this is problematic: first, not only is the list of names of detained and “frozen” accounts growing by the day…

The government earlier this week vowed that it would arrest more people as part of the corruption investigation, which began around three years ago. As a precautionary measure, authorities have banned a large number of people from traveling outside the country, among them hundreds of royals and people connected to those arrested, according to people familiar with the matter. The government hasn’t officially named the people who were detained.

… but the mere shock of a move that would be more appropriate for the 1950s USSR has prompted crushed any faith and confidence the international community may have had in Saudi governance and business practices.

The biggest irony would be if from this flagrant attempt to shore up the Kingdom’s deteriorating finances, a domestic and international bank run emerged, with locals and foreign individuals and companies quietly, or not so quietly, pulling their assets and capital from confiscation ground zero, in the process precipitating the very economic collapse that the move was meant to avoid.

Judging by the market reaction, which has sent Riyal forward tumbling on rising bets of either a recession, or devaluation, or both, this unorthodox attempt to inject up to $800 billion in assets into the struggling local economy, could soon backfire spectacularly.

A prolonged period of low oil prices forced the government to borrow money on the international bond market and to draw extensively from the country’s foreign reserves, which dropped from $730 billion at their peak in 2014 to $487.6 billion in August, the latest available government data.

Confirming our speculation was advisory firm Eurasia Group, which in a note said that the crown prince “needs cash to fund the government’s investment plans” adding that “It was becoming increasingly clear that additional revenue is needed to improve the economy’s performance. The government will also strike deals with businessmen and royals to avoid arrest, but only as part of a greater commitment to the local economy.”

Of course, there is a major danger that such a draconian cash grab would result in a violent blow back by everyone who has funds parked in the Kingdom. To assuage fears, Saudi Arabia’s minister of commerce, Majid al Qasabi, on Tuesday sought to reassure the private sector that the corruption investigation wouldn’t interfere with normal business operations. The procedures and investigations undertaken by the anti-corruption agency won’t affect ongoing business or projects, he said. Furthermore, the Saudi central bank said that individual accounts had been frozen, not corporate accounts. “It is business as usual for both banks and corporates,” the central bank said.

https://i0.wp.com/www.zerohedge.com/sites/default/files/images/user5/imageroot/2017/11/07/2017-11-08.jpg

Meanwhile, for those still confused about the current political scene in Saudi Arabia, here is an infographic courtesy of the WSJ which explains “Who Has Been Promoted, Who Has Been Detained in Saudi Arabia

https://i0.wp.com/www.zerohedge.com/sites/default/files/images/user5/imageroot/2017/11/07/arrested%20saudi.jpgSource: ZeroHedge

The Stock Market Decline Is Gaining Momentum

Summary:

  • The current stock market decline began with transportation stocks and small capitalization stocks severely under-performing the market.
  • Weakness then spread to the energy complex and high-yield bonds.
  • Yield focused stocks were the next to fall, with Kinder Morgan being the most prominent example.
  • Stalwarts like Apple and Gilead lost their momentum with the August 2015 decline and never regained their mojo.
  • In 2016, a slow motion crash is occurring in the stock market, and the price action has finally impacted the leading FANG stocks.

“Hysteria is impossible without an audience. Panicking by yourself is the same as laughing alone in an empty room. You feel really silly.” – Chuck Palahniuk

“Life is ten percent what you experience and ninety percent how you respond to it.” – Dorothy M. Neddermeyer

Introduction:

The stock market decline has gained momentum in 2016, and much like a runaway train, the current decline will be hard to stop, until the persistent overvaluations plaguing the stock market over this current bull market are corrected.

The correction that has caused the average stock in the United States to correct over 25%, thus far, started as an innocuous move down in global equities, outside of the depression enveloping the downtrodden emerging markets and commodities stocks, and then spread from transportation stocks to market leaders like biotechnology companies. The first wave down culminated in a gut-wrenching August 2015 sell-off that saw the Dow Jones Industrial Average (NYSEARCA:DIA) fall 1000 points at the open on August 24th, 2015. The panic was quickly brushed aside, but not forgotten, as market leading stocks made new highs in the fall of 2015.

That optimism, has given way to the reality that global quantitative easing has not provided the boost that its biggest supporters claimed. Now, everything is falling in tandem, and there is not much hope with the Fed nearly out of bullets, other than perhaps lower energy prices, to spark a true recovery.

The financial markets have taken notice, and are repricing assets accordingly. Just like forays to the upside are not one way affairs, the move down will not be a one-way adjustment, and investors should be prepared for sharp counter-trend rallies, and the price action yesterday, Thursday, January 14th, 2016 is a perfect example. To close, with leading stocks now suffering sizable declines that suggest institutional liquidation, investors should have their respective defensive teams on the field, and be looking for opportunistic, out-of-favor investments that have already been discounted.

Thesis:

The market correction is gaining steam and will not be completed until leading stocks and market capitalization indexes correct materially.

Small-Caps & Transports Led The Downturn:

While U.S. stocks have outperformed international markets since 2011, 2014 and 2015 saw the development of material divergences. Specifically, smaller capitalization stocks, measured by the Russell 2000 Index, and represented by the iShares Russell 2000 ETF (NYSEARCA:IWM), began under performing in 2014. Importantly, small-caps went on to make a new high in 2015, but their negative divergence all the way back in 2014, planted the seeds for the current decline, as illustrated in the chart below.

Building on the negative divergences, transportation stocks began severely under performing the broader markets in 2015. To illustrate this, I have used the charts of two leading transportation stocks, American Airlines (NASDAQ:AAL) and Union Pacific Corporation (NYSE:UNP), which are depicted below. For the record, I have taken a fundamental interest in both companies as I believe they are leading operators in their industries.


The Next Dominoes – Oil Prices & High Yield Bonds:

Oil prices, as measured by the United States Oil Fund (NYSEARCA:USO) in the chart below, were actually one of the first shoes to drop, even prior to small-cap stocks, starting a sizable move down in June of 2014.

Industry stalwart Chevron Corporation (NYSE:CVX) peaked in July of 2014, and despite tremendous volatility since then, has been in a confirmed downtrend.

As the energy complex fell apart with declining oil prices, high-yield bonds, as measured by the iShares iBoxx High Yield Corporate Bond Fund (NYSEARCA:HYG), and by the SPDR Barclays High Yield Bond ETF (NYSEARCA:JNK), made material new lows.

Yield Focused Stocks Take It On The Chin

As the energy downturn intensified, many companies that had focused on providing attractive yields, to their yield starved investors, saw their business models questioned at best, and implode at worst. The most prominent example was shares of Kinder Morgan (NYSE:KMI).


The fallout did not stop with KMI, as many MLP s and other yield oriented stocks continue to see declines as 2015 has rolled into 2016. Williams Companies (NYSE:WMB) has been especially hard hit, showing extreme volatility over the past several weeks.

Leading GARP Stocks Never Recovered:

Even though I have been bearish on the markets for some time, I was not sure if the markets would melt-up or meltdown in December of 2015, as I articulated in a Seeking Alpha article at the time.

In hindsight, the under performance of growth-at-a-reasonable-price stocks, like Apple (NASDAQ:AAPL) and Gilead Sciences (NASDAQ:GILD), which had struggled ever since the August 2015 sell-off, should have been an ominous sign.

FANG Stocks, The Last Shoe To Drop:

Even as many divergences developed in the financial markets over the last year, many leading stocks made substantial new highs in the fall of 2015, led by the FANG stocks. Facebook (NASDAQ:FB), Amazon (NASDAQ:AMZN), Netflix (NASDAQ:NFLX), and Alphabet (NASDAQ:GOOG) (NASDAQ:GOOGL), along with NASDAQ stalwarts Microsoft (NASDAQ:MSFT) and Starbucks (NASDAQ:SBUX), attracted global capital as growth became an increasingly scarce commodity. The last two weeks have challenged the assumption that these companies are a safe-haven, immune from declines impacting the rest of the stock market, as the following charts show.


The PowerShares QQQ ETF (NASDAQ:QQQ), which is designed to track the performance of the NASDAQ 100 Index, and counts five of the world’s ten largest market capitalization companies among its largest holdings, Apple, Alphabet, Microsoft, Amazon, and Facebook, has outperformed the S&P 500 Index, as measured by the SPDRs S&P 500 ETF (NYSEARCA:SPY), for a majority of the current bull market, with a notable exception being the last week of 2015, and the first two weeks of 2016. Wholesale, sustained selling is now starting to grip the markets.


Conclusion – The Market Downturn Is Gaining Momentum:

The developing market correction is gaining momentum. Like an avalanche coming down a mountain, it is impacting everything it touches, and no sectors or companies, even the previously exalted FANG stocks, are immune from its reaches. Investors should have their respective defensive teams on the field, while looking for opportunities in undervalued, out-of-favor assets, as many stocks have been in their own bear markets for years.

by William Koldus in Seeking Alpha

The Biggest Threat To Oil Prices: 2-Mile Long Stretch Of Iraq Oil Tankers Headed For The U.S.

https://s17-us2.ixquick.com/cgi-bin/serveimage?url=http%3A%2F%2Fens-newswire.com%2Fwp-content%2Fuploads%2F2013%2F07%2F20130705_shipssingapore.jpg&sp=88dd9c2a647d73922d4d13126517cc68

After some initial excitement, November has seen crude oil prices collapse back towards cycle lows amid demand doubts (e.g. slumping China oil imports, overflowing Chinese oil capacity, plunging China Industrial Production) and supply concerns (e.g. inventories soaring). However, an even bigger problem looms that few are talking about. As Iraq – the fastest-growing member of OPEC – has unleashed a two-mile long, 3 million metric ton barrage of 19 million barrel excess supply directly to US ports in November.

Crude prices are already falling:


But OPEC has another trick up its sleeve to crush US Shale oil producers. As Bloomberg reports,

Iraq, the fastest-growing producer within the 12-nation group, loaded as many as 10 tankers in the past several weeks to deliver crude to U.S. ports in November, ship-tracking and charters compiled by Bloomberg show.


Assuming they arrive as scheduled, the 19 million barrels being hauled would mark the biggest monthly influx from Iraq since June 2012, according to Energy Information Administration figures.

The cargoes show how competition for sales among members of the Organization of Petroleum Exporting Countries is spilling out into global markets, intensifying competition with U.S. producers whose own output has retreated since summer. For tanker owners, it means rates for their ships are headed for the best quarter in seven years, fueled partly by the surge in one of the industry’s longest trade routes.

Worst still, they are slashing prices…

Iraq, pumping the most since at least 1962 amid competition among OPEC nations to find buyers, is discounting prices to woo customers.

The Middle East country sells its crude at premiums or discounts to global benchmarks, competing for buyers with suppliers such as Saudi Arabia, the world’s biggest exporter. Iraq sold its Heavy grade at a discount of $5.85 a barrel to the appropriate benchmark for November, the biggest discount since it split the grade from Iraqi Light in May. Saudi Arabia sold at $1.25 below benchmark for November, cutting by a further 20 cents in December.

“It’s being priced much more aggressively,” said Dominic Haywood, an oil analyst at Energy Aspects Ltd. in London. “It’s being discounted so U.S. Gulf Coast refiners are more incentivized to take it.”

So when does The Obama Administration ban crude imports?

And now, we get more news from Iraq:

  • *IRAQ CUTS DECEMBER CRUDE OIL OSPS TO EUROPE: TRADERS

So taking on the Russians?

*  *  *

Finally, as we noted previously, it appears Iraq (and Russia) are more than happy to compete on price.. and have been successful – for now – at gaining significant market share…

Even as both Iran and Saudi Arabia are losing Asian market share to Russia and Iraq, Tehran is closely allied with Baghdad and Moscow while Riyadh is not. That certainly seems to suggest that in the long run, the Saudis are going to end up with the short end of the stick.

Once again, it’s the intersection of geopolitics and energy, and you’re reminded that at the end of the day, that’s what it usually comes down to.

Source: Zero Hedge


WTI Tumbles To $43 Handle After API Confirms Huge Inventory Build

API reported a huge 6.3 million barrel inventory build (notably larger than expected) extending the series of build to seven weeks. Even more worrying was the massive 2.5 million barrel build at Cushing, even as gasoline inventories fell 3.2mm. WTI immediately dropped 35c, breaking back to a $43 handle after-hours.

A huge build…


But for Cushing it was massive…

The reaction was quick and on heavy volume…

Source: Zero Hedge


Four US Firms With $4.8 Billion In Debt Warned This Week They May Default Any Minute

The last 3 days have seen the biggest surge in US energy credit risk since December 2014, blasting back above 1000bps. This should not be a total surprise since underlying oil prices continue to languish in “not cash-flow positive” territory for many shale producers, but, as Bloomberg reports, the industry is bracing for a wave of failures as investors that were stung by bets on an improving market earlier this year try to stay away from the sector. “It’s been eerily silent,” in energy credit markets, warns one bond manager, “no one is putting up new capital here.”

The market is starting to reprice dramatically for a surge in defaults...

Eleven months of depressed oil prices are threatening to topple more companies in the energy industry. As Bloomberg details,

Four firms owing a combined $4.8 billion warned this week that they may be at the brink, with Penn Virginia Corp., Paragon Offshore Plc, Magnum Hunter Resources Corp. and Emerald Oil Inc. saying their auditors have expressed doubts that they can continue as going concerns. Falling oil prices are squeezing access to credit, they said. And everyone from Morgan Stanley to Goldman Sachs Group Inc. is predicting that energy prices won’t rebound anytime soon.

The industry is bracing for a wave of failures as investors that were stung by bets on an improving market earlier this year try to stay away from the sector. Barclays Plc analysts say that will cause the default rate among speculative-grade companies to double in the next year. Marathon Asset Management is predicting default rates among high-yield energy companies will balloon to as high as 25 percent cumulatively in the next two to three years if oil remains below $60 a barrel.


“No one is putting up new capital here,”
said Bruce Richards, co-founder of Marathon, which manages $12.5 billion of assets. “It’s been eerily silent in the whole high-yield energy sector, including oil, gas, services and coal.”

That’s partly because investors who plowed about $14 billion into high-yield energy bonds sold in the past six months are sitting on about $2 billion of losses, according to data compiled by Bloomberg.

And the energy sector accounts for more than a quarter of high-yield bonds that are trading at distressed levels, according to data compiled by Bloomberg.

Barclays said in a Nov. 6 research note that the market is anticipating “a near-term wave of defaults” among energy companies. Those can’t be avoided unless commodity prices make “a very large” and “unexpected” resurgence.

“Everybody’s liquidity is worse than it was at this time last year,” said Jason Mudrick, founder of Mudrick Capital Management. “It’s a much more dire situation than it was 12 months ago.”

Source: Zero Hedge


Something Very Strange Is Taking Place Off The Coast Of Galveston, TX

Having exposed the world yesterday to the 2-mile long line of tankers-full’o’crude heading from Iraq to the US, several weeks after reporting that China has run out of oil storage space we can now confirm that the global crude “in transit” glut is becoming gargantuan and is starting to have adverse consequences on the price of oil.

While the crude oil tanker backlog in Houston reaches an almost unprecedented 39 (with combined capacity of 28.4 million barrels), as The FT reports that from China to the Gulf of Mexico, the growing flotilla of stationary supertankers is evidence that the oil price crash may still have further to run, as more than 100m barrels of crude oil and heavy fuels are being held on ships at sea (as the year-long supply glut fills up available storage on land). The storage problems are so severe in fact, that traders asking ships to go slow, and that is where we see something very strange occurring off the coast near Galveston, TX.


FT reports that “
the amount of oil at sea is at least double the levels of earlier this year and is equivalent to more than a day of global oil supply. The numbers of vessels has been compiled by the Financial Times from satellite tracking data and industry sources.”

The storage glut is unprecedented:
 
 
Off Indonesia, Malaysia and Singapore, Asia’s main oil hub, around 35m barrels of crude and shipping fuel are being stored on 14 VLCCs.
 
“A lot of the storage off Singapore is fuel oil as the contango is stronger,” said Petromatrix analyst Olivier Jakob. Fuel oil is mainly used in shipping and power generation.
 
Off China, which is on course to overtake the US as the world’s largest crude importer, five heavily laden VLCCs — each capable of carrying more than 2m barrels of oil — are parked near the ports of Qingdao, Dalian and Tianjin.
 
In Europe, a number of smaller tankers are facing short-term delays at Rotterdam and in the North Sea, where output is near a two-year high. In the Mediterranean a VLCC has been parked off Malta since September.
 
On the US Gulf Coast, tankers carrying around 20m barrels of oil are waiting to unload, Reuters reported. Crude inventories on the US Gulf Coast are at record levels.
 
A further 8m barrels of oil are being held off the UAE, while Iran — awaiting the end of sanctions to ramp up exports — has almost 40m barrels of fuel on its fleet of supertankers near the Strait of Hormuz. Much of this is believed to be condensate, a type of ultralight oil.
And unlike the last oil price collapse during the financial crisis only half of the oil held on the water has been put there specifically by traders looking to cash in by storing the fuel until prices recover. Instead, sky-high supertanker rates have prevented them from putting more oil into so-called floating storage, shutting off one of the safety valves that could prevent oil prices from falling further.
 
 
A widening oil market structure known as contango — where future prices are higher than spot prices — could make floating storage possible.


The difference between Brent for delivery in six months’ time and now rose to $4.50 last week, up from $1.50 in May. Traders estimate it may need to reach $6 to make sea storage viable.
JBC Energy, a consultancy, said in many regions onshore oil storage is approaching capacity, arguing oil prices may have to fall to allow more to be stored profitably at sea.
 
 
“Onshore storage is not quite full but it is at historically high levels globally,” said David Wech, managing director of JBC Energy.
 
“As we move closer to capacity that is creating more infrastructure hiccups and delays in the oil market, leading to more oil being backed out on to the water.”
 
Patrick Rodgers, the chief executive of Euronav, one of the world’s biggest listed tanker companies, said oil glut was so severe traders were asking ships to go slow to help them manage storage levels.
 
“We are being kept at relatively low speeds. The owners of the oil are not in a hurry to get their cargoes. They are managing their storage capacity by keeping ships at a certain speed.”
As a result of all this, something very unusual going on off the coast of Galveston, where more than 39 crude tankers w/ combined cargo capacity of 28.4 million bbls wait near Galveston (Galveston is area where tankers can anchor before taking cargoes to refineries at Houston and other nearby plants), vessel tracking data compiled by Bloomberg show, which compares w/ 30 vessels, 21 million bbls of capacity in May. Vessels wait avg of 5 days, compared w/ 3 days May.

As AP puts it,a traffic jam of oil tankers is the latest sign of an unyielding global supply glut.”

More than 50 commercial vessels were anchored outside ports in the Houston area at the end of last week, of which 41 were tankers, according to Houston Pilots, an organization that assists in navigation of larger vessels. Normally, there are 30 to 40 vessels, of which two-thirds are tankers, according to the group.
 
Although the channel has been shut intermittently in recent weeks because of fog or flooding, oil traders pointed to everything from capacity constraints to a lack of buyers.
 
“It appears that the glut of supply in the global market is only getting worse,” said Matt Smith, director of commodity research at ClipperData. Several traders said some ships might have arrived without a buyer, which can be hard to find as ample supply and end-of-year taxes push refiners to draw down inventories.
And here, courtesy of MarineTraffic is the interactive snapshot (readers can recreate it here):

All of which explains why this is happening:


Crude Jumps After API Reports Modest Inventory Draw (First In 8 Weeks) Despite Another Big Build At Cushing

11/17/2015: After seven straight weeks of significant inventory builds, API reported a modest 482k draw. That was all the algos needed and WTI immediately ramped back above $41.00. However, what they likely missed was the 2nd weekly (huge) build in Cushing (1.5mm barrels) as we warned earlier on land storage starting to really fill…

Cushing saw another big build…

And crude reacted…

As we noted earlier,

In short: “The US is the last place with significant onshore crude storage space left.”

Which leads directly to Citi’s conclusion: “‘Sell the rally’ near-term as fundamentals remain very sloppy and inventory constraints are becoming increasingly more binding.”

Source: Zero Hedge

Why U.S. Oil Production Remains High While Prices Tank – Bakken Update

Summary

  • US production remains high due to high-grading, well design, cost efficiencies, and lower oil service contracts.
  • High-grading from marginal to core areas can increase per well production from 200% to 500% depending on area, which means one core well can equate to several marginal producers.
  • Shorter stages, increased proppant and frac fluids increase production and flatten the depletion curve.
  • EOG’s work in Antelope field provides a framework for other operators to increase production while completing fewer wells.
  • Few operators are currently developing Mega-fracs, this provides significant upside to US shale production as others start producing more resource per foot.
by Michael Filloon, Split Rock Private Trading and Wealth Management

US Oil production remains at volumes seen when WTI was at $100/bbl. Many analysts believed operators couldn’t survive, but $60/bbl may be good enough for operators to drill economic wells. Oil prices have decreased significantly, and the US Oil ETF (NYSEARCA:USO) with it. Many were wrong about US production, and the belief $60/bbl oil would decrease US production. Although completions have been deferred, high-grading and mega-fracs have made up for fewer producing wells. When calculating US production going forward, it is important to account for the number of new completions. If more wells are completed, the higher the influx of production should be. We are finding the quality of geology and well design have a greater effect on total production than originally thought.

(click to enlarge)

(Source: Shaletrader.com)

There are several factors influencing US production. Operators have moved existing rigs to core areas. This decreases its ability getting acreage held by production. In the Bakken, rigs have moved near the Nesson Anticline.

In the Eagle Ford, Karnes seems to be the area of interest. Midland County in the Permian has also been attractive. Operators have decided to complete wells with better geology. When an operator completes wells in core acreage versus marginal leasehold, we see increased production per location. This is just part of the reason US production remains high.

The average investor does not understand the significance. Most think wells have like production, but areas are much different. When oil was at a $100/bbl, it allowed operators to get acreage held by production, although payback times were not as good. Marginal acreage was more attractive, even at lower IRRs. Operators have a significant investment in acreage, and do not want to lose it. Because of this, many would operate in the red expecting future rewards. Just because E&Ps lose money, does not mean the business isn’t economic. It is the way business is done in the short term as oil is an income stream. Wells produce for 35 to 40 years, and once well costs are paid back there are steady revenues. Changes in oil prices have changed this, as now operators will have to focus on better acreage.

Re-fracs are starting to influence production. Although most operators have not begun programs, interest is high. Re-fracs may not be a game changer, but could be an excellent way to increase production at a lower cost. This is not as significant with well designs of today, but older designs left a significant amount of resource. More importantly, when operators began, it was drilling the best acreage. Archaic well designs could leave some stages completely untouched. Current seismic can now identify this, and provide for a better re-frac. We expect to see some very good results in 2016. In conjunction with high-grading, well design continues to be the main reason production has maintained. Changes to well design have been significant, and the resulting production increases much better than anticipated.

No operator is better than EOG Resources (NYSE:EOG) at well design. From the Bakken, to the Eagle Ford and Permian it continues to outperform the competition.

The following map courtesy of ShaleMapsPro.com does a good job of illustrating EOG’s exposure in the Eagle Ford.

EagleFord.SeekingAlpha

(Source: Shalemapspro.com)

EOG’s focusing of frac jobs closer to the well bore has provided for much better source rock stimulation (fraccing). Since more fractures are created, there is a greater void in the shale. This means more producing rock has contact with the well. EOG continues to push more sand and fluids in the attempt to recover more resource per foot. To evaluate production, it must be broken into days over 6 to 12 months. To evaluate well design, locations must be close to one another and by the same operator. This consistency allows us to see advantages to well design changes. Lastly, we compare marginal acreage it is no longer working to the high-grading program. This is how operators are spending less and producing more.

EOG is working in the Antelope field of northeast McKenzie County. This is Bakken core acreage and considered excellent in both the middle Bakken and upper Three Forks.

(click to enlarge)
(Source: Welldatabase.com)

The center of the above map is the location of both its Riverview and Hawkeye wells. These six wells are located in two adjacent sections. The pad is just west of New Town in North Dakota. Riverview 100-3031H was completed in 6/12. It is an upper Three Forks well. 39 stages were used on an approximate 9000 foot lateral. 5.7 million pounds of sand were used with 85000 barrels of fluids.

(click to enlarge)
(Source: Welldatabase.com)

Date Oil (BBL) Gas ((NYSEMKT:MCF)) BOE
6/1/2012 4,384.00 3,972.00 3972
7/1/2012 27,133.00 15,337.00 15337
8/1/2012 24,465.00 17,223.00 17223
9/1/2012 21,457.00 9,190.00 9190
10/1/2012 18,040.00 12,601.00 12601
11/1/2012 19,924.00 13,366.00 13366
12/1/2012 28,134.00 22,259.00 22259
1/1/2013 15,382.00 12,661.00 12661
2/1/2013 3,429.00 2,451.00 2451
3/1/2013 15,242.00 22,774.00 22774
4/1/2013 15,761.00 8,479.00 8479
5/1/2013 13,786.00 18,372.00 18372
6/1/2013 14,485.00 18,555.00 18555
7/1/2013 15,668.00 27,250.00 27250
8/1/2013 12,084.00 23,876.00 23876
9/1/2013 13,841.00 46,815.00 46815
10/1/2013 11,388.00 45,800.00 45800
11/1/2013 2,711.00 10,533.00 10533
12/1/2013 0 0 0
1/1/2014 5,953.00 35 35
2/1/2014 11,368.00 20,851.00 20851
3/1/2014 8,784.00 11,179.00 11179
4/1/2014 5,607.00 8,479.00 8479
5/1/2014 4,727.00 5,663.00 5663
6/1/2014 8,359.00 12,726.00 12726
7/1/2014 8,799.00 22,957.00 22957
8/1/2014 7,958.00 31,621.00 31621
9/1/2014 7,218.00 44,318.00 44318
10/1/2014 3,778.00 14,058.00 14058
11/1/2014 3,701.00 9,951.00 9951
12/1/2014 6,612.00 18,435.00 18435
1/1/2015 6,181.00 24,142.00 24142
2/1/2015 3,517.00 10,722.00 10722
3/1/2015 5,218.00 24,175.00 24175
4/1/2015 4,275.00 24,233.00 24233

(Source: Welldatabase.com)

Riverview 100-3031H was a progressive well design for 2012. It produced well. To date it has produced 379 thousand bbls of crude and 615 thousand Mcf of natural gas. This equates to $24 million in revenues. Over the first 360 days (using the true number of production days) it produced 240,036 bbls of crude. The month of December 2013, this well was shut in for the completion of an adjacent well. There was a return to production but no significant jump in production from pressure generated by the new locations. This well declined 42% over 12 months. This is much lower than estimates shown through other well models. The next year we see a 35% decline. 10 months later we see an additional decline of approximately 55%. The decline curve of a well is very specific to geology and well design. Keep in mind averages are just that, and do not provide specific data. These averages should not be used to evaluation acreage and operator as there are wide average swings. Also, averages are generally over a long time frame. Production in the Bakken began in 2004 (first horizontal well completed). Wells in 2004 produce nothing like wells today. Updated averages based on year (IP 360) are more useful. Riverview 100-3031H was part of a two well pad. A middle Bakken well was also completed.

Riverview 4-3031H began producing a month after Riverview 100-3031H. It was a 38 stage 9000 foot lateral. 4.3 million lbs of sand were used and 69000 bbls of fluids.

(click to enlarge)
(Source: Welldatabase.com)

The Riverview and Hawkeye wells analyzed in this article were drilled in a southern fashion.

Date Oil Gas BOE
7/1/2012 20,529.00 12,537.00 12537
8/1/2012 16,553.00 16,903.00 16903
9/1/2012 17,096.00 10,148.00 10148
10/1/2012 23,197.00 17,914.00 17914
11/1/2012 20,122.00 14,402.00 14402
12/1/2012 27,340.00 33,217.00 33217
1/1/2013 16,044.00 24,394.00 24394
2/1/2013 4,267.00 4,946.00 4946
3/1/2013 27,516.00 26,219.00 26219
4/1/2013 20,792.00 7,940.00 7940
5/1/2013 17,516.00 35,948.00 35948
6/1/2013 15,457.00 50,500.00 50500
7/1/2013 13,480.00 50,807.00 50807
8/1/2013 11,254.00 42,300.00 42300
9/1/2013 9,319.00 40,341.00 40341
10/1/2013 8,559.00 33,116.00 33116
11/1/2013 2,190.00 40 40
12/1/2013 0 0 0
1/1/2014 1,124.00 11 11
2/1/2014 5,271.00 81 81
3/1/2014 8,931.00 9,827.00 9827
4/1/2014 5,469.00 7,940.00 7940
5/1/2014 4,807.00 5,748.00 5748
6/1/2014 8,522.00 13,819.00 13819
7/1/2014 7,982.00 17,983.00 17983
8/1/2014 7,169.00 26,755.00 26755
9/1/2014 5,750.00 22,586.00 22586
10/1/2014 1,349.00 3,194.00 3194
11/1/2014 6,495.00 15,947.00 15947
12/1/2014 6,442.00 18,806.00 18806
1/1/2015 5,840.00 22,126.00 22126
2/1/2015 4,171.00 18,682.00 18682
3/1/2015 4,221.00 18,539.00 18539
4/1/2015 3,878.00 19,725.00 19725

(Source: Welldatabase.com)

Riverview 4-3031H has produced 361 thousand bbls of crude and 657 thousand Mcf of natural gas. It under produced Riverview 100-3031H, but this is consistent with well design. 360 day production totaled 237,735 bbls of oil. We do not know if the Three Forks is a better pay zone than the middle Bakken as the well design was not consistent. Most operators have reported better results from the middle Bakken. The Three Forks well used one more stage (less feet per stage should mean better fracturing). It also used significantly more sand and fluids. Either way both wells were good results. Riverview 4-3031H only declined approximately 36% in a comparison of the first month to month 12. This was 7% better than 100-3031H. It declined another 41% in year two on a month to month comparison. This was 6% greater. 56% was seen when compared to adjusted production for 5/15. The Three Forks well declines slower in later production than 4-3031H. This may be due to well design. The well with more stages, proppant and fluids continues to out produce the Bakken well. It is possible the source rock is better. There are many other variables to look at, but this data provides why EOG continues to push ahead with more complex locations.

In September of 2012, EOG drilled its next well in this area. Hawkeye 100-2501H is a 13700 foot lateral targeting the upper Three Forks. It is a 47 stage frac. 14 million pounds of sand were used with 158000 bbls of fluids.

(click to enlarge)
(Source: Welldatabase.com)

Of the three pads, this well is located in the center. It was an interesting design, given the length of the lateral.

Date Oil Gas BOE
9/1/2012 21,959.00 444 444
10/1/2012 54,927.00 155 155
11/1/2012 47,557.00 57,300.00 57300
12/1/2012 55,367.00 92,144.00 92144
1/1/2013 33,396.00 55,877.00 55877
2/1/2013 22,100.00 32,810.00 32810
3/1/2013 36,631.00 57,544.00 57544
4/1/2013 29,075.00 32,696.00 32696
5/1/2013 22,210.00 33,351.00 33351
6/1/2013 17,544.00 25,794.00 25794
7/1/2013 15,872.00 23,600.00 23600
8/1/2013 19,647.00 28,746.00 28746
9/1/2013 15,486.00 22,352.00 22352
10/1/2013 21,325.00 31,678.00 31678
11/1/2013 6,418.00 9,214.00 9214
12/1/2013 0 0 0
1/1/2014 0 0 0
2/1/2014 0 0 0
3/1/2014 29,699.00 23,822.00 23822
4/1/2014 39,782.00 32,696.00 32696
5/1/2014 35,267.00 61,543.00 61543
6/1/2014 27,554.00 49,551.00 49551
7/1/2014 7,229.00 12,565.00 12565
8/1/2014 31,155.00 98,086.00 98086
9/1/2014 12,617.00 32,742.00 32742
10/1/2014 2 4 4
11/1/2014 7,769.00 15,996.00 15996
12/1/2014 15,487.00 49,147.00 49147
1/1/2015 4,427.00 9,918.00 9918
2/1/2015 9,344.00 20,654.00 20654
3/1/2015 8,459.00 25,171.00 25171
4/1/2015 7,235.00 24,752.00 24752

(Source: Welldatabase.com)

Hawkeye 100-2501H had some excellent early production numbers. From that perspective, it is one of the best wells to date in the Bakken. It has already produced 655,000 bbls of crude and 960,000 Mcf of natural gas. It has revenues in excess of $42 million to date. This includes roughly four non-producing or unproductive months. Crude production over the first 360 days was 389,835 bbls. Over the first 12 months, this well produced crude revenues in excess of $23 million. Decline rates were higher, as the first full month of production declined 65% over the first year. This isn’t important as early production rates were some of the highest seen in North Dakota. It is important to note, decline rates are emphasized but higher pressured wells may deplete faster depending on choke and how quickly production is propelled up and out of the wellbore. Any well that produces very well initially will have higher decline rates, but this does not lessen the value of the well. This specific well is depleting faster, but no one is complaining about payback times well under a year. Decline rates decrease significantly in year two at 11%. This well saw a marked increase in production when adjacent wells were turned to sales. The additional pressure associated with well communication increased production from 20,000 bbls/month to 35,000 bbls/month on average. This occurred over a 6 month period.

(click to enlarge)
(Source: Welldatabase.com)

Hawkeye 102-2501H was the fourth completion. This 14,000 foot 62 stage lateral targeted the upper Three Forks. It used 14.5 million pounds of sand and 164,000 bbls of fluids.

Date Oil Gas BOE
1/1/2013 18,486.00 41 41
2/1/2013 27,120.00 8,705.00 8705
3/1/2013 39,702.00 15,748.00 15748
4/1/2013 17,714.00 30,501.00 30501
5/1/2013 41,368.00 57,489.00 57489
6/1/2013 26,602.00 34,399.00 34399
7/1/2013 0 0 0
8/1/2013 133 0 0
9/1/2013 0 0 0
10/1/2013 0 0 0
11/1/2013 0 0 0
12/1/2013 0 0 0
1/1/2014 5,163.00 6,403.00 6403
2/1/2014 41,917.00 74,353.00 74353
3/1/2014 36,439.00 18,111.00 18111
4/1/2014 19,477.00 30,501.00 30501
5/1/2014 26,388.00 43,071.00 43071
6/1/2014 27,480.00 49,456.00 49456
7/1/2014 14,529.00 33,072.00 33072
8/1/2014 24,542.00 62,753.00 62753
9/1/2014 17,613.00 53,460.00 53460
10/1/2014 17,451.00 66,544.00 66544
11/1/2014 9,634.00 33,366.00 33366
12/1/2014 16,338.00 76,547.00 76547
1/1/2015 11,450.00 65,277.00 65277
2/1/2015 8,971.00 50,919.00 50919
3/1/2015 3,177.00 14,820.00 14820
4/1/2015 6,495.00 13,616.00 13616

(Source: Welldatabase.com)

It has produced 458,000 bbls of crude and 839,000 Mcf to date. This equates to roughly $30 million over well life. 360 day production was 394,673 bbls of crude. Production was interesting as initial production was outstanding. The big production numbers were hindered as many of the early months had missed production days. We don’t know if there were production problems, but do know the well was shut when adjacent wells were turned to sales. Production was over 1000 bbls/d over the first six months. It was shut in for another six months. After this production jumped, but this is misleading. Given the fewer days of production per month, there wasn’t much of an increase when the new wells were turned to sales. The decline over the first year on a monthly basis is 20%. The second year is much greater at 80%. We have seen recent production decrease significantly, and is something to watch. Lower decline rates initially are more important. This is because production rates are higher. It equates to greater total production.

Hawkeye 01-2501H was completed in January of 2013.

(click to enlarge)
(Source: Welldatabase.com)

It is a 64 stage, 15000 foot lateral targeting the middle Bakken. This well used 172,000 bbls of fluids and 15 million pounds of sand.

Date Oil Gas BOE
1/1/2013 18,792.00 43 43
2/1/2013 30,211.00 13,879.00 13879
3/1/2013 42,037.00 17,648.00 17648
4/1/2013 17,433.00 36,881.00 36881
5/1/2013 38,754.00 63,501.00 63501
6/1/2013 28,602.00 48,817.00 48817
7/1/2013 0 0 0
8/1/2013 134 1 1
9/1/2013 0 0 0
10/1/2013 0 0 0
11/1/2013 0 0 0
12/1/2013 0 0 0
1/1/2014 6,311.00 7,186.00 7186
2/1/2014 43,713.00 74,099.00 74099
3/1/2014 39,156.00 18,492.00 18492
4/1/2014 23,408.00 36,881.00 36881
5/1/2014 21,681.00 33,498.00 33498
6/1/2014 28,502.00 51,543.00 51543
7/1/2014 18,795.00 45,017.00 45017
8/1/2014 25,512.00 58,837.00 58837
9/1/2014 20,522.00 60,662.00 60662
10/1/2014 19,137.00 68,576.00 68576
11/1/2014 12,093.00 37,043.00 37043
12/1/2014 16,587.00 45,980.00 45980
1/1/2015 14,246.00 62,819.00 62819
2/1/2015 9,220.00 35,931.00 35931
3/1/2015 3,617.00 6,634.00 6634
4/1/2015 13,702.00 42,551.00 42551

(Source: Welldatabase.com)

It has produced 492,170 bbls of crude and 866,520 Mcf of natural gas. 360 day production was 412,072 bbls of oil.

(click to enlarge)
(Source: Welldatabase.com)

This is an excellent well, but the location of focus is Hawkeye 02-2501H. It was completed last in this group. This well provides the link between changes in well design to production improvements.

Date Oil Gas BOE
12/1/2013 3,022.00 6,533.00 6533
1/1/2014 37,385.00 75,940.00 75940
2/1/2014 30,066.00 58,949.00 58949
3/1/2014 22,876.00 50,690.00 50690
4/1/2014 26,703.00 43,926.00 43926
5/1/2014 31,987.00 55,124.00 55124
6/1/2014 27,777.00 47,166.00 47166
7/1/2014 31,500.00 50,279.00 50279
8/1/2014 51,709.00 99,583.00 99583
9/1/2014 43,292.00 98,069.00 98069
10/1/2014 40,143.00 98,927.00 98927
11/1/2014 24,064.00 50,495.00 50495
12/1/2014 31,488.00 99,684.00 99684
1/1/2015 27,087.00 94,621.00 94621
2/1/2015 22,207.00 94,490.00 94490
3/1/2015 22,590.00 125,634.00 125634
4/1/2015 17,707.00 94,910.00 94910

(Source: Welldatabase.com)

The production numbers are significant. In less than a year and a half, it has produced 490,000 bbls of crude and 1.25 Bcf of natural gas. Revenues to date are $33.2 million. Its 360 day crude production was 427,663 bbls. The production is impressive but the decline curve is more important. This Hawkeye well has a steady production rate with only a slight decline. This is where the analysts may be getting it wrong, as decline curves change significantly by area and well design. What EOG has done is not only increased production significantly, but also flattened the curve. Initial production is interesting as we don’t see peak production until nine months. This means our best month is August of 2014, and not the first full month. When we analyze the production after one full year of production, there is no drop off.

This 12800 foot 69 stage lateral is a very good middle Bakken design. EOG decided to pull back some of the lateral length. There are several possible reasons for this. We think it is possible EOG has discovered it was having difficulty in getting proppant to the toe of the well. But this is why operators test the length. More importantly, the increase in stages in conjunction with a shorter lateral provides for shorter stages. This means the operator will probably do a better job of stimulating the source rock. This well also used massive volumes of fluids and sand. 460,000 bbls of fluids were used with over 27 million lbs of proppant. I don’t normally break down the types of sand, as it can be trivial to some but in this case I have as the design seems somewhat unique. This well used approximately 16 million lbs of 100 mesh sand, 7 million lbs of 30/70 and 4 million 40/70. The large volumes of mesh sand are interesting. It would seem EOG is trying to push the finest sand deep into the fractures to maintain deeper shale production.

Well Date Lateral Ft. Stages Proppant Lbs. Fluids Bbls. 12 mo. Oil Production Bbls. Production/Ft.
Riverview 100-3031H 6/12 9,000 39 5.7M 85,000 240,036 26.67
Riverview 4-3031H 7/12 9,000 38 4.3M 69,000 237,735 26.42
Hawkeye 100-2501H 9/12 13,700 47 14M 158,000 389,835 28.46
Hawkeye 102-2501H 1/13 14,000 62 14.5M 164,000 394,673 28.19
Hawkeye 01-2501H 1/13 15,000 64 15M 172,000 412,072 27.47
Hawkeye 02-2501H 12/13 12,800 69 27M 460,000 427,663 33.41

I completed the above table for several reasons. The first was to show well design’s effect on one year total production. We used 360 days as a base. We didn’t use 12 months as that will skew data, as some wells don’t produce every day of every month. Wells are shut in for service or more importantly when new production from adjacent locations are turned to sales. So these are a specific number of days and not estimates. We also broke down production per foot of lateral. This may be more important than any other factor. Production per well is important, but lateral length is a key as it shows how well the source rock was stimulated. In reality, production per foot matters more at longer lateral lengths. Many operators don’t like to do laterals longer than 10,000 feet, as production per foot decreases sharply. When looking at well production data, it is obvious that production per foot suffers as the toe of the lateral gets farther from the vertical.

There are several other ETFs that focus on U.S. and world crude prices:

  • iPath S&P Crude Oil Total Return Index ETN (NYSEARCA:OIL)
  • ProShares Ultra Bloomberg Crude Oil ETF (NYSEARCA:UCO)
  • VelocityShares 3x Long Crude Oil ETN (NYSEARCA:UWTI)
  • ProShares Ultrashort Bloomberg Crude Oil ETF (NYSEARCA:SCO)
  • U.S. Brent Oil ETF (NYSEARCA:BNO)
  • PowerShares DB Oil ETF (NYSEARCA:DBO)
  • VelocityShares 3x Inverse Crude Oil ETN (NYSEARCA:DWTI)
  • PowerShares DB Crude Oil Double Short ETN (NYSEARCA:DTO)
  • U.S. 12 Month Oil ETF (NYSEARCA:USL)
  • U.S. Short Oil ETF (NYSEARCA:DNO)
  • PowerShares DB Crude Oil Long ETN (NYSEARCA:OLO)
  • PowerShares DB Crude Oil Short ETN (NYSEARCA:SZO)
  • iPath Pure Beta Crude Oil ETN (NYSEARCA:OLEM)

All six wells had fantastic results. The first two Riverview wells are still considered sand heavy fracs and produced almost a quarter of a million barrels of oil. This does not include natural gas in the estimates, but EURs for these wells are approximately 1200 MBo. We don’t put much emphasis on EURs other than an indicator of how good production is in comparison. Since locations will produce from 35 to 40 years, we are more inclined to emphasize one year production. Although the Hawkeye wells drilled on 9/12 and 1/13 didn’t show a large uptick in production per foot, it is still quite impressive considering the lateral length. Overall production uplift was exceptional, and these wells produce decent payback times at current oil price realizations.

There is no doubt this area has superior geology. It is definitely a core area, but may not be as good as Parshall field. Because of this, we know other areas would not produce as well, but still it provides a decent comparison for the upside to well design. Geology is still key and this is probably why EOG recently drilled a 15 well pad in the same general area. These wells are still in confidential status, so we do not know the outcome. Given the results in this area, these wells could be very interesting. The most important reason to focus on these Mega-Fracs is repeatability. If EOG can do this, so can other operators. Our expectations are many operators will be able to complete wells this good within the next 12 to 24 months. If this occurs we could see production maintained at much lower prices and fewer completions.

Energy Companies Face “Come-To-Jesus” Point As Bankruptcies Loom

Last week, amid a renewed bout of crude carnage, Morgan Stanley made a rather disconcerting call on oil. 

“On current trajectory, this downturn could become worse than 1986: An additional +1.5 mb/d [of OPEC supply] is roughly one year of oil demand growth. If sustained, this could delay the rebalancing of oil markets by a year as well. The forward curve has started to price this in: as the chart shows, the forward curve currently points towards a recovery in prices that is far worse than in 1986. This means the industrial downturn could also be worse. In that case, there would be little in analysable history that could be a guide to this cycle,” the bank wrote, presaging even tougher times ahead for the O&G space.

If Morgan Stanley is correct, we’re likely to see tremendous pressure on the sector’s highly indebted names, many of whom have been kept afloat thus far by easy access to capital markets courtesy of ZIRP.

With a rate hike cycle on the horizon, with hedges set to roll off, and with investors less willing to throw good money after bad on secondaries and new HY issuance, banks are likely to rein in credit lines in October when the next assessment is due. At that point, it will be game over in the absence of a sharp recovery in crude prices. 

https://s15-us2.ixquick.com/cgi-bin/serveimage?url=http%3A%2F%2Fts1.mm.bing.net%2Fth%3Fid%3DJN.ZLR3KYf8IWnQf4RM8n3EFg%26pid%3D15.1%26f%3D1&sp=357f055eb112ef212bb5189aeccf6ad8

Against this challenging backdrop, we bring you the following commentary from Emanuel Grillo, partner at Baker Botts’s bankruptcy and restructuring practice who spoke to Bloomberg Brief last week.  

*  *  *

Via Bloomberg Brief

How does the second half of this year look when it comes to energy bankruptcies?

A: People are coming to realize that the market is not likely to improve. At the end of September, companies will know about their bank loan redeterminations and you’ll see a bunch of restructurings. And, as the last of the hedges start to burn off and you can’t buy them for $80 a barrel any longer, then you’re in a tough place.

The bottom line is that if oil prices don’t increase, it could very well be that the next six months to nine months will be worse than the last six months. Some had an ability to borrow, and you saw other people go out and restructure. But the options are going to become fewer and smaller the longer you wait.

Are there good deals on the horizon for distressed investors?

A: The markets are awash in capital, but you still have a disconnect between buyers and sellers. Sellers, the guys who operate these companies, are hoping they can hang on. Buyers want to pay bargain-basement prices. There’s not enough pressure on the sellers yet. But I think that’s coming. 

https://s16-us2.ixquick.com/cgi-bin/serveimage?url=http%3A%2F%2Fts4.mm.bing.net%2Fth%3Fid%3DJN.WRi8a7AqdL7XZWEYpZehUA%26pid%3D15.1%26f%3D1&sp=65edb29198ceb6054d44a4f53685920c

Banks will be redetermining their borrowing bases again in October. Will they be as lenient this time around as they were in April?

A: I don’t know if you’ll get the same slack in October as in April, absent a turnaround in the market price for oil. It’s going to be that ‘come-to-Jesus’ point in time where it’s about how much longer can they let it play. If the banks get too aggressive, they’re going to hurt the value for themselves and their ability to exit. So they’re playing a balancing act.

They know what pressure they’re facing from a regulatory perspective. At the same time, if they push too far in that direction, toward complying with the regulatory side and getting out, then they’re going to hurt themselves in terms of what their own recovery is going to be. All of the banks have these loans under very close scrutiny right now. They’d all get out tomorrow if they could. That’s the sense they’re giving off to the marketplace, because the numbers are just not supporting what they need to have from a regulatory perspective.

Source: Zero Hedge

Crude Oil Remains A ‘Sell’ After Rising Imports Fuel Surprise Inventory Build

Summary

  • Crude oil prices closed down 4% yesterday, breaking through a 2-month support level at $57/barrel, after an EIA report showed an unexpected build in inventories.
  • I argue that the domestic supply/demand balance has not improved and is just as bearish now as it was last winter when oil was in free fall.
  • Based on my analysis of supply/demand data presented in this article, I believe crude oil has further to fall.
  • My trading strategy, including holdings, price targets, and entry/exit points are discussed in detail.
 

By Force Majeure

After trading tightly range-bound between $58/barrel and $61/barrel since mid-April, crude oil finally broke down yesterday, after an EIA Petroleum report showed that crude oil inventories increased more than expected. The commodity slid 4.2% – its largest single-day loss since April 8 – to a 9-week low closing price of $56.92/barrel. The commodity is down 6.6% since recording a peak of $61/barrel one week ago on Tuesday. Further weighing on prices were unclear reports of a draft of an Iranian nuclear deal that would relax sanctions and permit a resumption of exports, as well as continued fears over Greece’s exit from the eurozone. This article will discuss yesterday’s EIA inventory report and use this data to support my argument that crude oil supply and demand remain just as unbalanced presently as when oil was trading at $45 per share, justifying my continued bearish position on the commodity.

In yesterday’s Petroleum Report for the week ending June 26, the EIA announced that crude oil inventories increased by 2.4 million barrels, versus the analyst consensus for a 2-million barrel storage withdrawal. The storage build was also markedly bearish compared to last week’s 4.9 million barrel withdrawal, last year’s 3.2 million barrel withdrawal and the 5-year average 4.1 million barrel withdrawal. It was the first storage injection in 9 weeks since the week ending April 24. Storage injections during the final week of June are highly unusual, and last week’s build was the first storage injection during the last week of June since the week ending June 29, 2007, and only the third this millennium.

At 480 million barrels, total crude oil storage is 90 million barrels above the five-year average inventory level and 80 million barrels above last year’s level, versus a 84 and 75 million barrel surplus last week, respectively. The increase in crude oil surplus is a sharp departure from the past two months which had seen surpluses, versus the five-year average decline in 8 of the past 9 weeks from a peak of over 113 million barrels. Figure 1 below shows the storage surplus versus the five-year average and 2014 over the past year.

(click to enlarge)

Figure 1: Crude oil storage surplus versus 2014 and the 5-year average showing an increase in the surplus after several weeks of decline. [Source: Chart is my own, data from the EIA.]

What happened over the past week that led to such an abrupt change in crude oil supply/demand balance?

Not much, I argue. And that is the problem.

There are three components of US supply/demand balance – domestic production, demand (measured by refinery inputs), and imports.

Domestic production was largely unchanged last week, declining by 9,000 barrels per day, from 9.604 million barrels per day the previous week to 9.595 million barrels last week. Domestic production remains at record highs, despite an oil rig count that has fallen 60% since October. Production is up 1.2 million barrels year-over-year.

Crude oil demand was likewise flat week-over-week, declining a negligible 1,000 barrels per day last week to 16.531 million barrels per day. Demand is up 313,000 barrels per day year-over-year. Note that this is well shy of the 1.2 million barrel per day year-over-year increase in production. As a result, the purely domestic supply/demand picture – demand minus US production – is markedly loose compared to last year. Figure 2 below compares the purely domestic supply/demand picture for 2015 versus 2014.

(click to enlarge)

Figure 2: Purely domestic crude oil supply/demand balance equal to demand minus domestic production. Supply/demand remains loose to 2014 and has been flat over the past 2 months, indicating minimal tightening of the market. [Source: Chart is my own, data from the EIA.]

Note that last year at this time, demand exceeded domestic production by 7.8 million barrels per day, while last week, this spread was just 6.9 million barrels. Further, despite all of the hullabaloo over record demand and declining domestic production, this spread is sitting near the 2015-to-date average of 6.6 million barrels, and has been essentially flat since late April.

It is the third component of the US supply/demand picture – imports – that drove last week’s bearish storage build and had been masking the persistent supply/demand mismatch shown above in Figure 2 that allowed crude oil to rally more than 30% off the March lows. Imports increased by 748,000 barrels per day last week to 7.513 million barrels per day. It was the largest week-over-week increase since the week ending April 3rd and the largest daily average since the week of April 17th. Nevertheless, the 7.5 million barrel per day tally was a mere 170,000 barrels per day above the 1-year average import level. Figure 3 below plots crude oil imports versus the 1-year average over the last 12 months.

(click to enlarge)

Figure 3: Crude oil imports versus the 1-year average. After 2 months well below the 1-year average, crude oil demand rebounded last week. [Source: Chart is my own, data from the EIA.]

Note that after hovering in the 6.75-7.25 million barrel per day range since late April, last week’s imports were merely a return to the baseline. Furthermore, imports have room to go even higher. Figure 4 below shows the week-over-week change and the departure from 2015-to-date average imports by country.

(click to enlarge)

Figure 4: Crude oil imports by nation with week-over-week and departure versus the 2015 average included. While imports from Canada rebounded last week, large deficits versus the 2015 average remain in Canada, Saudi Arabia, and Mexico. [Source: Chart is my own, data from the EIA.]

Note that the second-largest weekly increase in imports last week came from our biggest oil trading partner, Canada, where imports increased by 142,000 barrels per day. However, thanks to persistent wildfires in Alberta’s prolific oil sands, imports are still 187,000 barrels per day below their 2015 average. As these wildfires have largely diminished, I expect Canadian imports will continue to increase, from 2.8 million barrels per day last week back to their 3.0 million barrel per day 2015 average in coming weeks. An even more impressive departure versus the 2015 average was seen in Saudi Arabia, where imports remained flat at 700,000 barrels per day last week, more than 250,000 barrels below their 2015 average of 992,000 barrels per day. Saudi Arabia is a country whose rig count is at record highs and which is spearheading the effort to destroy the US shale oil industry, so I expect these imports will recover rapidly over the next month. Finally, our third-largest trading partner, Mexico, saw its imports slide 290,000 barrels per day last week, and currently sit 215,000 barrels per day below its 2015 average – likely another short-term anomaly. Were just these three countries to have had their imports at 2015 baseline levels, last week’s storage build would have been a massive 7.1 million barrels. The gains seen in Venezuela, Kuwait, and other smaller trading partners that sent tallies above their 2015 averages may be at least partially attributable to a surge in Gulf Coast imports following delays caused by Tropical Storm Bill, and therefore, may decline in coming weeks. However, I expect the net change in imports to be upwards over the next month, putting further pressure on the supply/demand balance.

My rationale for emphasizing imports compared to US production and demand is that I believe that they have been artificially creating the appearance of a tightening supply/demand balance. Thanks to wildfires in Canada, Tropical Storm Bill interrupting shipments in the Gulf of Mexico, and unrest in the Middle East, imports during April, May, and early June (as shown in Figure 3) were depressed below the five-year average. This correlated strongly with a transition to storage withdrawals that helped to fuel the back-end of crude oil’s 30% rally from the March low of $43/barrel to $61/barrel. Figure 5 below compares crude oil weekly storage injections/withdrawals to imports.

(click to enlarge)

Figure 5: Crude oil storage changes versus imports. There is a strong correlation between storage withdrawals between May and late June and a decline in imports. Storage injections resumed last week, following a surge in imports. This supports imports being the major driver of the domestic supply/demand balance over the past few months. [Source: Chart is my own, data from the EIA.]

During this same period (as shown in Figure 2), domestic production and demand remained relatively unchanged. As a result, I firmly believe that the decline in imports hoodwinked many investors into thinking that the supply/demand balance was permanently tightening, due either to increasing demand from cheap oil or declining production from the declining rig count, when it was really a temporary drop in imports. Now that imports have returned to a baseline level, this “masking” of the supply/demand balance has been lifted, and the result was a bearish injection similar to those seen during oil’s springtime free fall – but during a time when the market expects withdrawals. It is therefore unsurprising that oil retreated to the tune of 4% yesterday.

What I believe to be even more concerning is that there is little room to go higher on the demand front. Refinery utilization – the percentage of US refinery capacity that is being utilized to convert crude oil to gasoline and other finished products – was at 95.0% last week. This is the highest refinery utilization during the final week of June over the last 10 years. Figure 6 below shows refinery utilization for the last week of June from 2006 to the present.

(click to enlarge)

Figure 6: Refinery utilization during the final week of June for the past 10 years showing that, at 95%, 2015’s utilization is the highest of the decade. [Source: Chart is my own, data from the EIA.]

Furthermore, the maximum refinery utilization during any week in the last 10 years was 95.4%, recorded several times, most recently last December. As a result, at 95.0% refinery, utilization is nearly at its maximum capacity. The fact that we saw a 2.4 million barrel storage injection, with demand near its maximal level pulling hard at crude oil inventories and with imports still with room to run higher, suggests to me that oil still has room to fall.

Oil’s 4% decline to under $57/barrel represented a major breakdown not only from a fundamental level, as discussed above, but from a technical level. During the 44-day period from April 29 to June 30, crude oil had traded within a tight $4.17 range between $61.43/barrel and $57.26/barrel, the narrowest range since March 2004. Oil broke out of that range yesterday. Figure 7 plots the price of crude oil over the last 3 months, showing the rally, range-bound action, and the breakdown yesterday.

(click to enlarge)

Figure 7: Crude oil prices over the last 2 months showing range-bound trading largely between $58/barrel and $61/barrel. followed by a breakdown yesterday. [Source: Chart is my own, data from the EIA.]

Now that oil has fallen below its 2-month support level, I would not be surprised if more investors head for the exits.

I continue to hold three positions betting on a continued downtrend in crude oil prices. I own a 10% short position in the popular United States Oil ETF (NYSEARCA:USO) – increased from 5% last week – a large 15% short position in the leveraged VelocityShares 3x Long Crude Oil ETN (NYSEARCA:UWTI), and a 5% short position in the Market Vectors Russia ETF (NYSEARCA:RSX). The latter provides short exposure to an oil-driven economy, as well as the turmoil encompassing Europe. The short UWTI position is a higher-risk play on leverage-induced decay due to choppy trading. USO, of course, is a safer direct play on declining oil prices.

Should oil drop to $55/barrel – which has long been my short-term price target – I will begin to aggressively cover my UWTI short position to protect profits in a highly volatile trade, which is currently up 20% and would likely be pushing 35% if oil reaches $55/barrel. I will likewise plan to close out my RSX short around the same level to lock in profits, should the European crisis appear to be resolving.

However, I plan to hold USO for the foreseeable future. Following yesterday’s decline, contango in the oil futures market is again rising, with the 4-month spread up to $1.21, or 2.2%, after bottoming out at $0.86 last week. Should oil continue to fall, the contango will likely widen further, and I could easily see contango-generated returns topping 5% on a position held through the Fall. I feel USO is a safer, less volatile long-term hold than UWTI (despite the fact that UWTI triples the contango-generated gains and also benefits from leverage-induced decay). My price target to close out my USO position is currently $50/barrel. Factors that would likely cause me to cover sooner would include any socioeconomic forces that look like they would suppress imports for an extended period, or if US production (finally) begins declining in a meaningful way. As a result, my “stop” is a fundamental stop, and I do not have a specific stop price. Should oil rally in the face of the current bearish fundamentals, I will even consider adding to my USO short position up to 15%. If I had no crude oil short exposure, I would be reluctant to open a position here with oil down 7% in a week. Rather, I would wait for a bounce before initiating any position.

In conclusion, I believe that US crude oil demand and production remain in a stable, bearish pattern. Instead, the fundamental supply/demand picture is, and has been, dictated by fluctuations in crude oil imports. I do not believe that the underlying fundamental picture has changed since March, and that a return to baseline import levels last week following months of temporary suppression unmasked this persistent supply/demand imbalance. With crude oil demand unlikely to go higher with refineries near peak capacity, domestic production stable, and crude oil imports with room to go even higher, particularly from Canada and Saudi Arabia, I expect continued weakness in crude oil in the months to come. Once the summer driving season fades and demand declines, I would not be surprised to see the domestic oil surplus climb back above 100 million barrels over the next 1-3 months. Further exacerbating bearish sentiment are the possible resumption of Iranian exports and continued anxiety over Greece and the eurozone, although I believe these fears to be secondary to the ongoing domestic storage glut. My 1-3 month price target is $55/barrel, with a potential to drop as low as $50/barrel during this time. As a result, I plan to hold my large basket of crude oil short positions in USO, UWTI, and RSX.

Additional disclosure: As noted in the article, I am also short RSX and UWTI.

Is $50 “Hard Floor” Oil Price Already In?

Volte-Face Investments believes that it is …

https://martinhladyniuk.files.wordpress.com/2015/04/011bb-peak-oil-situation-31-jul-12.jpg

The Last Two Oil Crashes Show Peak Oil Is Real

Summary

  • Recent oil crashes show you the hard floor for gauging value oil company equities.
  • Properly understood, the crashes lend an insight into the concept of Peak Oil.
  • All oil equity investors should understand the overarching upward trend on display here.
 

Note: ALL prices used in this article are using current 2015 dollars, inflation adjusted using the
US BLS inflation calculator.

Generally, when I invest, I try to keep my thesis very simple. Find good companies, with good balance sheets and some kind of specific catalytic event on the horizon. But when one starts to concentrate their holdings in a sector, as I have recently in energy (see my recent articles on RMP Energy (OTCPK:OEXFF) and DeeThree Energy (OTCQX:DTHRF), you need to also get a good handle on the particular tail or headwinds that are affecting it. Sometimes a sector like oil (NYSEARCA:USO) can be subjected to such forces, like the recent oil price crash, where almost no company specific data mattered.

One of the biggest arguments, normally used by proponents of owning oil stocks as core holdings, in the energy sector is “Peak Oil.” For the unfamiliar, it is a theory forwarded first by M. King Hubbert in the 1950s regarding U.S. oil production. Essentially, the theory stated that the U.S. would reach a point where the oil reserves would become so depleted that it would be impossible to increase oil production further, or even maintain it at a given level, regardless of effort. This would inevitably lead to oil price rises of extreme magnitudes.

Since those early beginnings, the details have been argued over in an ever-evolving fashion. The argument has shifted with global events, technological developments, and grown to encompass nearly every basin in the world (even best-selling books have been written about peak oil like Twilight in the Desert: The Coming Saudi Oil Shock and the World Economy by Matt Simmons about a decade ago) consuming endless bytes of the Internet in every kind of investment forum and medium of exchange.

In general, I believe that the term “peak oil” is a highly flawed one. Some picture peak oil in a Mad Max fashion, with oil supplies running out like a science fiction disaster movie. Others simply dismiss peak oil as having failed to predict these so-called peaks repeatedly (the world is producing a record amount of oil right now, so all previous absolute “Peak Oil” calls below these amounts are obviously wrong). But what people should be stating when they use these terms is a Peak Oil Price.

Using my own thinking and phrasing, I believe civilization has probably passed $25 Peak Oil. This means that if you set the oil price to $25 a barrel, there is no method available to humanity to provide enough oil to meet demand over any period of time that’s really relevant. I also believe we are in the middle of proving that we have also passed $50 Peak Oil. My final conjecture here is that we will prove in the near-term future to have reached $75 Peak Oil. I don’t believe we are quite at $100 Peak Oil.

Notice that in my formulation the term Peak Oil is always stated as a peak price. Oil is not consumed in a vacuum. The price affects the demand the world has for the product and simultaneously changes the ability of all sorts of entities (businesses and governments) to retrieve deposits of it. This is what I hope to prove in this article.

So what data could I bring to this crowded table?

Well we have one thing we now have that previous entrants into the Peak Oil melee didn’t, which is the recent price crash in oil. Peak oil is often falsely portrayed as a failed idea since it hasn’t resulted in a super squeeze to ultra high prices. These spike prices are viewed as the really critical element by energy investors since they are trying to find the best case. After all, who doesn’t want to own an oil producer if they can identify a spot in which oil prices will rise to some enormous number.

But that is the wrong way to go about it for your oil investments over the long haul. Because what $50 Peak Oil really provides is a floor. In a world where we have passed $25 Peak Oil, it should be impossible, without exogenous events of enormous magnitude (world war, etc.), to press the price of the product below that price. If you could do so, you would immediately disprove the thesis. You would then know the floor provided by whichever peak oil price level you selected was wrong. The same idea seems to hold true for $50 Peak Oil now.

To prove this “floor” we need to choose times of extreme stress in the oil markets, and look at those oil prices and see what the bottoms were. For these examples, let’s select WTI oil, whose weekly average prices are reported all the way back to 1986 by the EIA.

Let’s take the three big crashes in the oil markets. I will use a full year’s average to try to smooth out the various difficulties presented by weather, seasonal effects, or various one-off events (outages, etc.). The first crash I will use as a benchmark is The 1986 Oil Crash. The 1986 breakdown was a supply crash, caused by supply swamping demand. How big a disaster was it for the oil industry?

In 1986, the Saudis opened the spigot and sparked a four-month, 67 percent plunge that left oil just above $10 a barrel. The U.S. industry collapsed, triggering almost a quarter-century of production declines, and the Saudis regained their leading role in the world’s oil market.

This was quite a crash obviously. Triggering a 25 year decline? Not going to find a lot worse than this. So in inflation adjusted dollars what was WTI oil at for the year of 1986? It sold for around $32 a barrel. Now let’s note that at this time WTI crude was actually at a higher price vs. Brent and other world prices. On a Brent basis, crude would have been just around $25 for the year. This will prove to be an important point in a short while.

The next crash we will use to benchmark was the 2008 Financial Crisis. On this website, I should hope that this world crisis will need no introduction and little explanation. This crash in oil prices (and just about every other thing priced by human beings) was a demand crash. The financial disintegration across the world led to massive drops in demand, as jobs were lost across the world by the millions. So with this demand crash what was the average price of WTI crude in the year 2009? It sold in that year for a little over $60.

The last crash I will add is the current drop, starting sometime around October by my reckoning. I would find it hard to imagine any reader of this article is unfamiliar with the current situation in North America or the world regarding oil, at least in a headline sense. This seems to be a supply crash again, where North American-led tight oil drillers have caused an increase in production that the world’s demand couldn’t handle at the $100 price level. Since then, prices have dropped down to a level that suppresses the production of oil and enhances demand.

In the first four months of 2015, the North American oil rig count has already dropped by more than 50% as compared to last year and the demand for oil has begun to increase according to EIA statistics. The current price of WTI oil has been just over $49 as an average for the year 2015. However, let us note that WTI oil now sells for a large discount to world prices, and during the previous two crashes, WTI sold for a premium.

Now we have three data points. Each one is a fairly long period of time, not just a single week. We know that the world in 1986 nearly ended for the oil industry, yet in current dollars, WTI oil was unable to trade for a year below $30 a barrel. Then we had in 2008 and 2009 an economic crisis which was widely described as being the most dire financial disaster since WWII. In 2009, WTI oil still ended up trading well over the 1986 low. In fact it was nearly double that price. This shows just how hard it can be using almost any technique to push oil prices below a true peak number.

Now we have another supply led crunch. One that is widely described as the worst oil crash since 1986, a nearly 30 year time gap. We are attacking the oil price from the supply side instead of 2008’s demand side. Yet thus far, in 2015, oil is still trading more than 50% higher than the 1986 year average, inflation adjusted. In fact, WTI, when adjusted for its current discount to world prices, is trading close to its 2009 average price. Again, nearly double the price of the 1986 crash.

What does this all mean for investing? It means to me that $25 Peak Oil is behind us. You couldn’t really hit and maintain that number in the 1986 crash when many more virgin conventional reservoirs of oil were available. Despite the last three oil crises, not one of them could get WTI oil to $25 and keep it there. Now, using much more expensive oil resources (shale fracing, deep water drilling, arctic development, etc.), it doesn’t seem like the last two disasters have been able to press WTI oil much below $50 for a material length of time. In this recent crash, the $50 floor was able to be reached only with several years of hyper-investment made possible by the twin forces of sustained high prices and access to ultra-cheap capital. Both of these forces are no longer present in the oil markets.

Therefore, I think using a $50 Peak Oil number is a very reasonable hard floor to use when stress testing your oil stocks. It means that when I am choosing a stock that produces oil, it can survive both from supply and the demand led crashes using the worst the world can throw at it.

Some will say this reasoning is simplistic. One could claim any number of variables in the future (technology, peace in the Middle East, etc.) could change all the points I am relying on here. But we have thrown everything at the oil complex between 2008 and now; both from the supply side and the demand sides; breakdowns of the whole world economy, wars, sanctions, natural disasters, hugely stupid governmental policies, OPEC’s seeming fade to irrelevance, biofuels, periods of ultra-high prices, technological progress, electric cars, etc. Yet, here we stand with these numbers staring us in the face.

In conclusion, I feel these price points prove the reality of $50 Peak Oil (WTI). If WTI oil averages more than $50 in 2015 (which I strongly feel the data shows will happen), then it will confirm my thesis that no matter what happens in the world, human beings cannot seem to produce the amount of oil they require for less than that number. Therefore, one will know what the hard floor for petroleum is provided by the hugely complex interplay of geology, politics, economics, and technology by simply measuring those effects on one easy-to-measure point of data, namely price. This version of peak oil also means I have a minimum to test my selections on. I can buy companies that can at least deal with that floor, then make large profits as the prices rise from that hard floor. All oil fields deplete, and for the past twenty years, the solution has universally been to add more expensive technological solutions, exploit smaller or more physically difficult deposits, or use more expensive alternatives. The oil market does not have the same options available to it like it did 1986. Large, cheap conventional oil deposits are no longer available in sufficient supply, which is likely what the oil price is telling us by having higher Peak Floors during crashes. Without the magic of sustained ultra high prices, the investment levels that made this run at the $50 Peak Oil level will not exist going into the future. This means that the Peak Oil floor price should be creeping higher as a sector tailwind, giving a patient and selective investor a tremendous advantage for themselves.

Read more: Volte-Face Investments: The Last Two Oil Crashes Show Peak Oil Is Real

Cheaper Foreign Oil Caps US Drilling Outlook

https://irancorner.files.wordpress.com/2012/05/spiegel-iran-oil-embargo1.jpg

By Chris Tomlinson | Houston Chronicle | MRT.com

The shale oil revolutionaries are retreating in disarray, and cheap foreign oil may banish them to the margins of the market.

As oil and natural gas move into a period of low prices, new data shows that North American drillers may not have the wherewithal to keep producing shale wells, which make up 90 percent of new drilling. In fact, if prices remain low for years to come, which is a real possibility, then investors may never see a return on the money spent to drill shale wells in the first place.

The full cost of producing oil and natural gas at a representative sample of U.S. companies, including capital spent to build the company and buy assets, is about $80 per barrel of oil equivalent, according to a study from the Bureau of Economic Geology’s Center for Energy Economics at the University of Texas.

The analysis of 2014 corporate financial data from 15 of the top publicly traded producers, which I got an exclusive look at before it’s published this week, determined that companies will have a hard time recovering the capital spent that year and maintaining production unless prices rise above $80 a barrel.

The price for West Texas Intermediate has spent most of the year below $50 a barrel.

Low prices, though, won’t mean that producers will shut in existing wells. Many of these same companies can keep pumping to keep cash coming into the company, and they can still collect a 10 percent return above the well’s operating costs at $50 a barrel of oil. They just won’t make enough money to invest in new wells or recover the capital already spent.

This harsh reality of what it will take to keep the shale revolution going shows how vulnerable it is to competition from cheap overseas oil.

“Everyone walks around thinking that they know how much this stuff costs because they see published information on what people spend to just drill wells,” explained Michelle Foss, who leads the Houston-based research center. “That is not what it takes for a company to build these businesses, to recover your capital and to make money.” The bureau was founded in 1909 and functions as the state geological agency.

Low oil prices will also exacerbate the economic impact of low natural gas prices. For years natural gas has kept flowing despite prices below $4 for a million British thermal units because about 50 percent of wells produced both gas and liquids, such as crude oil and condensate.

True natural gas costs

High oil prices have helped companies subsidize natural gas wells, but lower oil prices mean natural gas wells that don’t produce liquids will need to stand on their own economics.

The center’s analysis found that among the sample companies focused primarily on gas, prices will need to top $6 a million BTUs just to cover full costs and rise above $12 a million BTUs to recover the capital expended to develop the wells.

“We have important resources, but people have to be realistic about the challenges of developing them,” Foss told me. “There will have to be higher prices.”

Everyone predicts prices will rise again. The only questions are how quickly and to what price. Some experts predict WTI prices will reach $70 a barrel by the end of 2015, while others see $60. The soonest most expect to see $80 a barrel oil is in 2017. Saudi Arabian officials have said they believe the price has stabilized and don’t see oil returning to $100 a barrel for the next five years.

High prices and shale

https://i0.wp.com/www.arabamericannews.com/news/images/articles/2008_05/1049/u1_SAUDI.gif

The Saudi opinion is particularly important because that nation can produce oil cheaper than any other country and can produce more oil than any other country. As the informal leader of the Organization of the Petroleum Exporting Countries, Saudi Arabia kept the price of oil inside a band between $80 and $100 a barrel for years. Now, the Saudis appear ready to keep the price low.

That’s because high prices inspired the shale revolution, where American companies figured out how to economically drill horizontally into tight rocks and then hydraulically fracture them to release oil and natural gas. Since OPEC countries rely on high oil prices to finance their governments, everyone assumed OPEC would cut production and keep revenues high.

Arab leaders, though, were more concerned about holding on to market share and allowed prices to fall below levels that make most shale wells economic. Foss, who recently returned from meetings in the United Arab Emirates, said OPEC is unlikely to change course because developing countries are seeking alternatives to oil and reducing demand.

“The Saudis and their partners see pressures on oil use everywhere they look, and what they want is their production, in particular their share of the global supply pie, to be as competitive as it can be to ensure they’ve got revenue coming into the kingdom for future generations,” she said.

OPEC is afraid rich countries like the U.S. are losing their addiction to oil, and by lowering prices hope to keep us hooked. And OPEC has plenty of product.

“There’s 9 million barrels a day in current and potential production capacity in Iraq and Iran that is tied up by political conflicts, and if you sort that out enough, that’s a flood of cheap oil onto the market,” Foss said.

On the losing end

If prices remain low, the big losers will be the bond holders and shareholders of indebted, small and medium-size companies that drill primarily in North America. Since these companies are not getting high enough prices to pay off capital expenditures through higher share prices or interest payments , they are in serious trouble.

The inability of Denver-based Whiting Petroleum to sell itself is an example. The board of the North Dakota-focused company was forced to issue new shares, reducing the company’s value by 20 percent, and take on more expensive debt. Quicksilver Resources, based in Fort Worth, filed for Chapter 11 bankruptcy on March 17 because it couldn’t make the interest payments on its debt and no one was willing to invest more capital.

Until one of these companies is bought, we won’t know the true value of the shale producers at the current oil and natural gas prices.

But as more data reaches the market, there is a real danger that these companies are worth even less than investors fear, even though they may have high-quality assets.

Why Oil Price Should Bottom In April

Summary

  • Oil production continues to eclipse record highs on a weekly basis despite the oil rig count declining 49% since October.
  • A single oil-well declines exponentially up to 75% in its first year of production. However, in a process known as Convolution, older wells buffer the rapid decline from new rigs.
  • This article provides a comprehensive analysis of principles behind oil drilling and production, applies it to the current crude oil climate, and predicts future production, rig counts, and oil price.
  • Based on my analysis, I remain short-term bearish but long-term bullish on the commodity. My trading strategy based on this analysis is discussed in detail.

by Force Majeure | Seeking Alpha

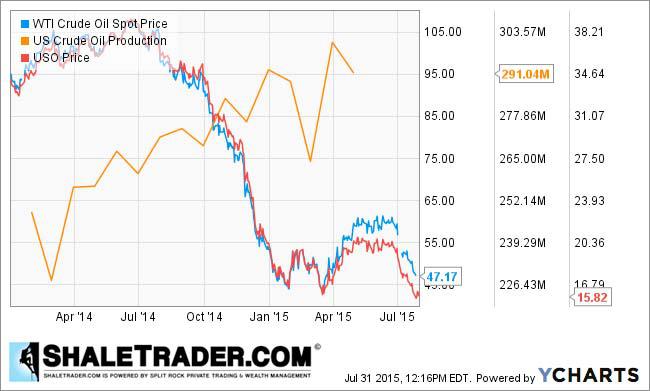
On Friday, March 20, Baker Hughes (NYSE:BHI) reported that the crude oil rig count had fallen an additional 41 rigs to 825 active rigs. This was the 15th straight week and 25th out of 26 weeks that the rig count has declined. Active oil rigs are now at the lowest level since the week ending March 18th, 2011 and total drilling rigs (oil + natural gas) are the fewest since October 2009. Overall, the oil rig count is down 49% in the 23 weeks since peaking in October. Nevertheless, in its weekly Petroleum Report, the EIA announced last Wednesday that domestic oil production set yet another record high of 9.42 million barrels per day. Since the rig count peaked the week of October 10, 2014 and began its subsequent collapse, oil production has climbed 460,000 barrels per day, or 5.2%. This continued increase in production in the face of a plummeting rig count has confounded journalists, flummoxed investors, and inflated supplies to record highs leading to a continued slump in oil prices.

The two main questions on traders’ minds are 1) why is oil production still at record highs five months after the rig count started dropping? And 2) when, if at all, will oil production begin to fall and how far will it fall? This article provides a comprehensive analysis of the principles behind the relationship between oil drilling and production, applies it to the current crude oil climate, and predicts where both production and the rig count will go in the coming year.

Before we discuss the real-world oil production and drilling situation – an extremely complex picture with over 1 million rigs producing oil – let’s look at a simple, hypothetical situation. The first key point is that once an oil well is drilled, its production is not constant. In fact, production not only begins to decline almost immediately, it does so in an exponential fashion. After analyzing production curves from multiple wells, I will be estimating weekly oil production from a single oil well by the following equation:

Equation 1:

Daily Oil Production From Single Well = (Initial Daily Production)/(1+ (Week # from start of production*K)

Where K is a constant equal to 0.06

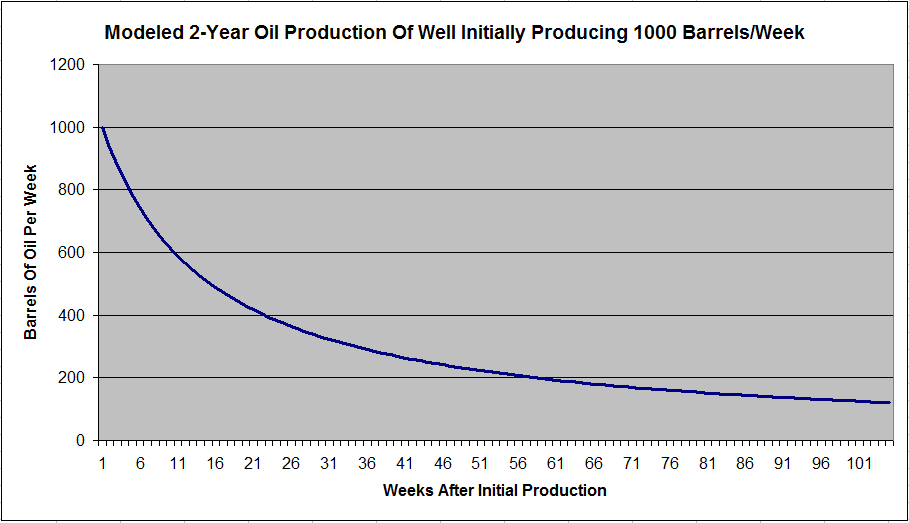
When graphed using a well that initially produces 1000 barrels of oil per week this equation is represented by Figure 1 below:

Figure 1: Crude oil production curve of single, hypothetical well showing exponential decay.

There are two take home points to note from this chart. First, initial decay is very rapid, with weekly production declining by about 75% after 1 year. Second, after the initial rapid decay, production declines much slower and becomes approximately linear with decay rates of 5-10% per year. Although this graph ends after 2 years or 104 weeks, production continues slowly and steadily beyond 5 years.

Figure 1 represents production from a single well. What happens when we add multiple wells over a period of time? The process by which multiple functions – in this case, oil wells – are added over time is known as Convolution. As noted before, even after an oil well has been active for many years, it is still producing a small volume of oil, a fraction of its initial output. However, there are a LOT of these old, low-output rigs – over 1.1 million in fact. When the number of drilling rigs decreases – thus reducing the number of new wells that come into the service – the old, stable wells plus the production from the declining number of new wells is initially enough to buffer the decline in rig count and net output will continue to rise.

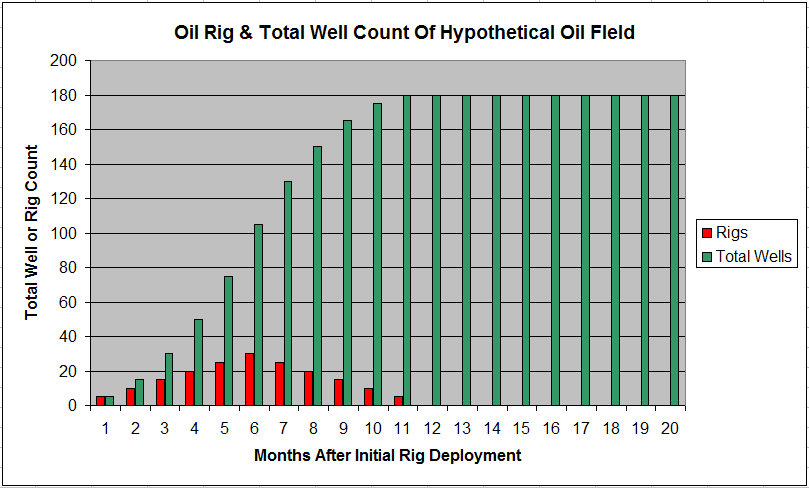
Let’s illustrate this with a simple example. Imagine a new oil field monopolized with a single company that owns 30 oil rigs. The company adds five new rigs each month. Each rig is able to drill 1 new well per month. After six months, the company has deployed all of its rigs to the field. Unfortunately, shortly thereafter the company encounters financial difficulties and is forced to withdraw rigs at a rate of 5 per month until zero remain drilling. Figure 2 below compares active drilling rigs and total wells in this field.

Figure 2: Rig count and total well count of hypothetical oil field

Note that after the rig count peaks and begins to decline, total wells continue to increase before ultimately peaking at 180, where it remains for the remainder of the 20-month period.

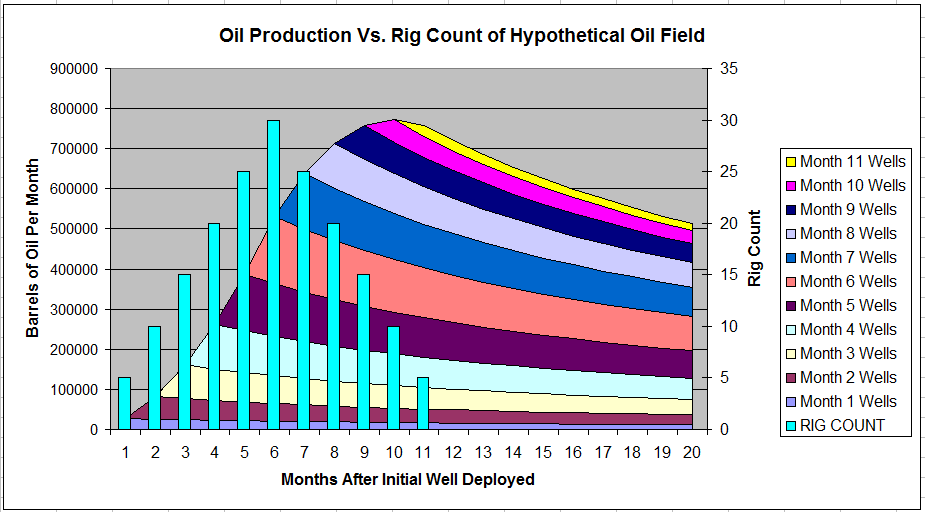
Each well initially produces 200 barrels of oil per day and declines according to Equation 1 and the chart in Figure 1. Figure 3 below shows total oil field production overlaid with the total rig count of the field.

Figure 3: Oil Production from hypothetical oil field illustrating how crude oil production can continue to climb despite a sharp reduction in the rig count due to convolution.

Oil production initially climbs rapidly as more rigs are added to the field, reaching 500,000 barrels per month by the time the rig count peaks after 6 months. However, even though the rig count declines to zero six months later, total production continues to increase and peaks at 770,000 barrels per month in month 10 – 4 months after the rig count peaked. Production then begins to decline, but slowly. Even by month 20 after the rig count has been at zero for eight months, production has only declined by 33%.

This is obviously a simply, insular example, but it illustrates several important points. First, there is a delay between when the rig count peaks and when production begins to decline as the combination of old, accumulated oil wells and the continued addition of new wells by the declining rigs is sufficient to coast production higher initially. Second, even when production begins to decline, it is blunted, with production declining a fraction of the actual reduction in rig count. For those interested, the Following Article delves into these principles further and provides useful insight.

Let’s now apply these principles to actual domestic oil production. Before we can set up the model, there are three baseline metrics that need to be established: 1) Rate that rigs drill a well, 2) Time between initial spudding of a well and when it begins production, and 3) Initial production rate of new oil wells.

The EIA has released well counts on a quarterly basis for the past two years. Their data shows that the ratio of new wells to rigs has increased slowly from around 4.75 per quarter in 2012 to 5.3 per quarter in 2014. This equates to about 0.4 wells per week per rig presently. For the model, I used a linear reduction in drilling efficiency with drilling rates down to 0.3 wells per week per rig in 2006.

It takes 15-30 days to drill a new oil well. Once the hole is dug, the well must be completed. It typically takes another week for the rig to be removed and new equipment to be set up. A further week is devoted to hydraulic fracturing. Initial flow back and priming of production takes place over the next 3-4 days. Over the final week, the well is primed for continuous production including installation of tank batteries, the pump jack, and assorted power connections. The well is then connected to the pipeline and permanent production begins. Thus, it takes roughly two months from initial spudding of the well to when it begins production. However, once a well is completed it does not always begin to produce immediately and may not do so for up to six months.

Initial oil production rates have increased markedly over the past decade as drilling technology has improved. The EIA released the chart shown below in Figure 4 showing yearly initial production rates in the Eagleford Shale.

Figure 4: Yearly production rates in Eagleford Shale Formation showing rapidly increased initial rates of production 2009-2014. (Source: EIA)

Initial rates increased from less than 50 barrels per day (or 350 per week) in 2009 to nearly 400 barrels per day (or 2800 per week) in 2014. Note that the decay rate has also increased such that by 2-3 years, all wells are approaching the same output despite the significant differences in increased production. This is a relatively new oil formation and older formations produced more oil initially prior to 2010. For my model, I assumed initial production of 2625 barrels of oil per well per week in 2014-2015 with initial production declining to 1400 barrels per well per week in 2006.

Using this data and the methodology discussed in the example above, a modeled projection of U.S. oil production is created dating back to 2006. This data is shown in Figure 5 below and is compared to actual oil production, calculated on a weekly basis. My preferred unit of time is 1 week as this is the frequency that both the rig count and oil production numbers are released.

Figure 5: Projected oil production based on my model vs. observed crude oil production vs. Baker Hughes Rig Count [Sources: Baker Hughes, EIA]

Overall, this model accurately projects oil production based on active drilling rigs. Between 2006 and 2015, the average error was 88,000 barrels per day, or 1.2%. Over the past six months, this error has averaged just 44,000 barrels per day. The model correctly shows production continuing to increase despite the sharp reduction in active drilling rigs. It is interesting to note that the largest deviation between projected oil production and observed production occurred in late 2009 and early 2010, or shortly after the rig count bottomed out from the previous oil price collapse. The model predicted that oil production would decline somewhat while actual production actually just leveled off before beginning a new rally once the rig count rebounded later in 2010.

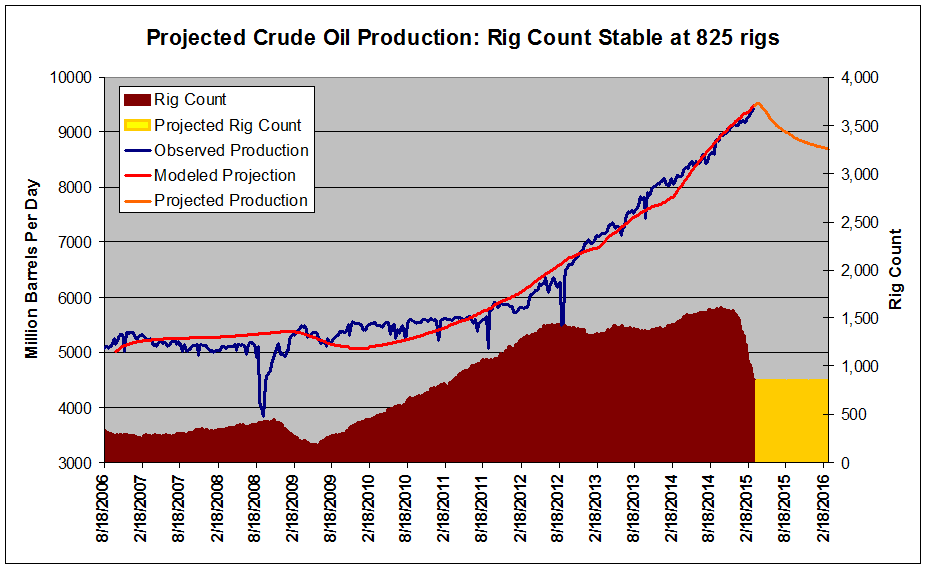
This model can be used to project how oil production might behave heading into the future. To do so, we must make assumptions about how the rig count might behave heading into the future. First, let’s pretend that the rig count stays unchanged at 825 active oil rigs for the next 1 year. Figure 6 below projects crude oil production to 1 year.

Figure 6: Projected oil production based the rig count remaining unchanged at 825 [Sources: Baker Hughes, EIA]

Using this projection, crude oil production will peak during the week ending April 10 at 9.51 million barrels per day and then begin declining. By next March 2016, production will have declined to 8.68 million barrels per day, down 9.5% from the projected peak. Again, this goes to show the buffering capacity of older rigs, given that a sustained 50% reduction in the rig count results in a comparatively small <10% decrease in output.

Two qualifying notes are necessary. This model shows a relatively short period of time between production plateauing and production beginning its decline. 1) Given that this model assumes all completed wells are producing oil within 3 months of spudding, it is certainly possible that the production curve may flatten out for a longer period of time due to additional completed wells that have been idle are slowly hooked up to pipelines over the next several months. 2) This model also makes the assumption that all rigs produce oil equally. If rigs drilling less-productive oil fields have been selectively retired while those drilling richer fields have remained active, the rate of decline will similarly be slower and less than projected.

The most recent historical comparison to the events currently unfolding took place in 2008-2009 following the collapse of oil from record highs during the great recession from a high of $146/barrel to near $30/barrel. The rig count during that event was likewise slashed by 50% before rapidly recovering when prices rebounded. However, this is not an apples-to-apples comparison since drilling technology has changed substantially – decline rates are much more rapid, initial production is nearly double that in 2008, etc – and inferences cannot necessarily be made about the future of production. However, let’s assume that the current rig count follows a similar trend. If so, the rig count will slow its descent and bottom out in roughly six weeks near 760-780. If the rig count follows the trend seen in 2009, the count will then rapidly rise and will reach 1330 by this time next year. Production will again peak during the week of April 10, before declining. Production will bottom out in late October near 8.9 million barrels per day, down just 6.3% from its peak before again increasing late in the year.

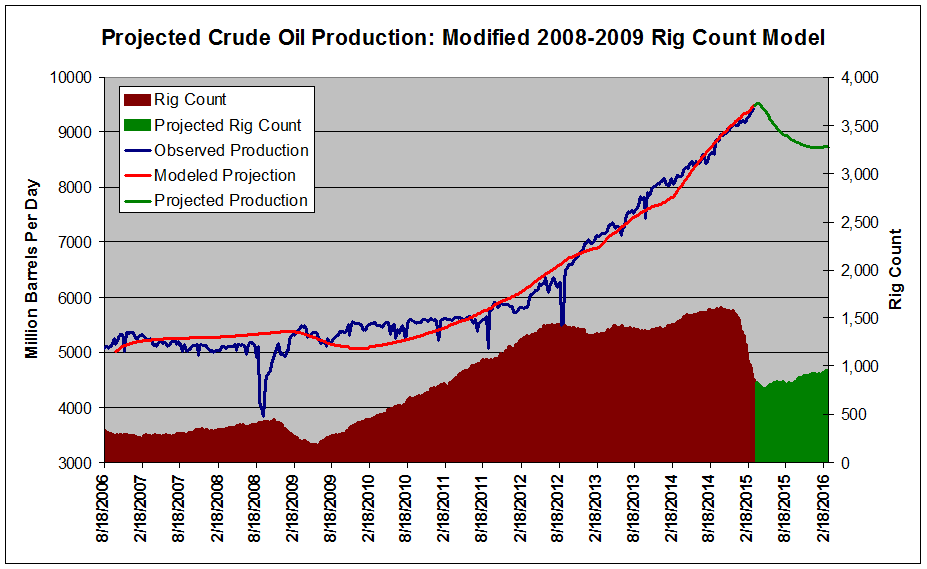
However, the decline in oil in 2008-2009 was based more on the combination of a bubble bursting and a slumping economy than fundamental forces while the current slump is predicated on a supply/demand mismatch. I expect this will keep prices and rigs down significantly longer than in 2008-2009. Let’s amplify the 2008-2009 rig count curve and project instead that rigs bottom out near 730-750 and that the rate of recovery is roughly half that of 2008-2009 with total rigs at just 950 this time next year. Using this model, production will continue to slowly decline through the New Year and flatten out near 8.7 million barrels per day by March 2016, down 8.4% from the peak. I believe that this is a more realistic model for crude oil production. This projection is shown below in Figure 7.

Figure 7: Projected oil production based on 2008-2009 rig count [Sources: Baker Hughes, EIA]

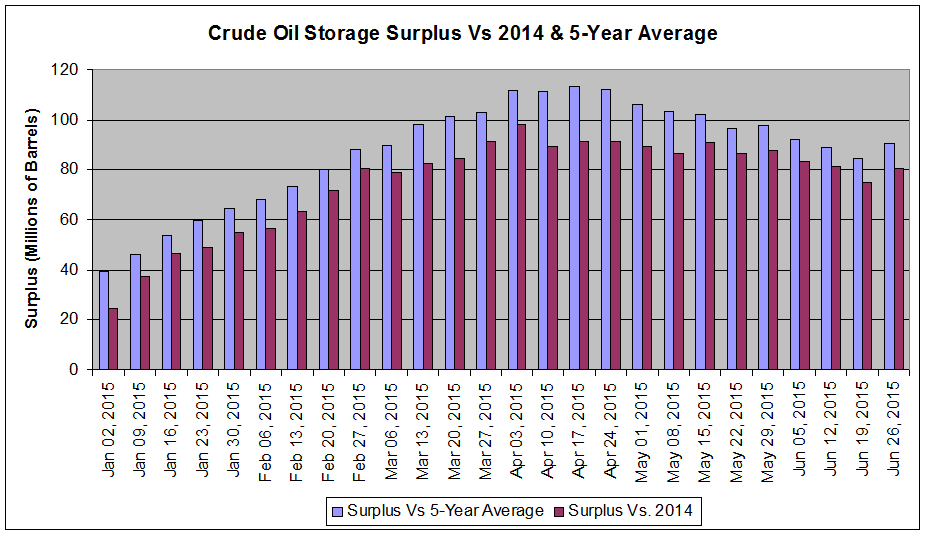
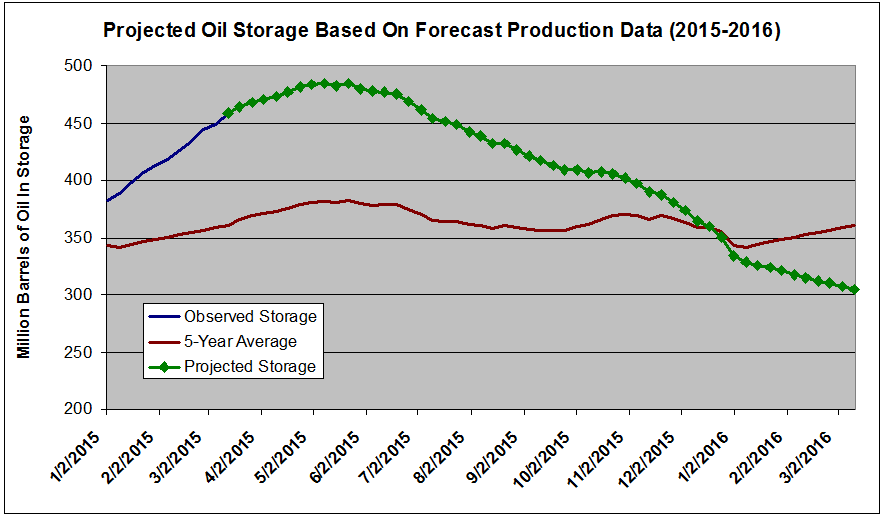
What does this mean for the supply/demand situation? As I have discussed in my previous articles, crude oil supply and demand are severely mismatched. This has led to oil inventories skyrocketing to a record high of 458 million barrels, a huge 98.7 million barrels above the five-year mean for March. Applying the projected production curve shown in Figure 7 to crude oil storage yields some surprising results. Even with just an 8.7% reduction in supply, the inventory surplus will narrow markedly. These results are shown below in Figure 8, which compares the five-year average storage level and current and projected storage levels. Note: These projections assume that total imports will remain flat and that total demand will follow the five-year average.

Figure 8: Projected crude oil storage based on projected oil production data vs. 5-year average [Source: EIA]

While the rig count continues to climb and then plateaus, I expect that the storage surplus will continue to widen with total inventories approaching 500 million barrels by early May. However, as production drops off, the inventory surplus begins to decline. By the last week of 2015, total supply has declined by 4.7 million barrels per week and projected inventory levels cross the five-year average for the first time since October 2014. Should the rig count begin the slow rise that is projected, by March of 2016, total storage levels will be 50 million barrels BELOW the five-year average. Even if the two qualifying statements discussed above verify or the rig count rises more rapidly than projected, I expect that, based on the drop in rig count already, crude oil inventories will be at or below average this time next year.

https://i0.wp.com/www.doomsteaddiner.net/blog/wp-content/uploads/2015/02/end_is_nigh.jpg

What does this mean for crude oil prices? There is a chicken and egg situation going on here. This article makes references to the rebound in rig count after bottoming out in the next month or two. This, of course, is predicated on a rise in price to make drilling again profitable. Without a rally, the count will continue to fall or, at the very least NOT rise, putting further pressure on supply and down-shifting the projected production curve further, making it more likely that prices will THEN rally. Until they finally do. One way or another, I do not see how crude oil can remain priced at under $45/barrel for longer than a few months. Something has to give. Drilling technology is simply not yet to the point where this is a profitable price range for the majority of companies.

Given that these projections show production increasing through early April, I would not be surprised to see continued short-term pressure on oil prices. As I discussed in My Article Last Week, storage at Cushing, the closely watched oil pipeline hub, continues to fill rapidly and threatens to reach capacity by early May. I would welcome such an event, as crude oil would likely drop under $40/barrel presenting an even better buying opportunity. I therefore maintain a short-term bearish, long-term bullish stance on oil.

https://i0.wp.com/i1.ytimg.com/vi/FwzUzFhyo00/maxresdefault.jpg

My favorite way to play a rally in oil is to short the VelocityShares 3x Inverse Crude Oil ETN (NYSEARCA:DWTI) to gain long exposure. This takes advantage of leverage-induced decay to at least partially negate the impact of contango on the ETF. The United States Oil ETF USO), on the other hand, is intended to track 1x the price of oil and leaves an investor directly exposed to contango, which is now 15% over the next six months. The same applies to the VelocityShares 3x Long Crude Oil ETN (NYSEARCA:UWTI), except that exposure to contango is now tripled to 45%.

The advantage to USO is in its safety. A short position in DWTI theoretically leaves an investor open to infinite losses should the price of oil continue to drop. Further, shares must be borrowed to short, which can cost 3-5% annually depending on the broker. And if, once a trader has a position, these shares are no longer available, the position can be forcibly closed at an inopportune time. A slightly less risky position would be the ProShares UltraShort Bloomberg Crude Oil ETF (NYSEARCA:SCO) that is more liquid and less volatile.

For this reason, I started a small position in USO on Thursday at $16.05 when oil erased its post-Fed Remarks gains from Wednesday. This position is equal to just 2% of my portfolio. I will add to my USO position once oil breaks $45/barrel and then again should the commodity break $42/barrel for a total exposure of 6% of my portfolio. Should oil continue to decline to under $40/barrel, I will begin to sell short DWTI at what I assume to be a safer entry point until 10% of my portfolio is allocated to oil ETFs.

https://i0.wp.com/s1.hubimg.com/u/8463556_f260.jpg

Should oil rebound, I will look to take profits. Once the rig count bottoms, I will begin taking profits once oil reaches $50/barrel. I will selectively sell USO initially. I prefer to close out the position most exposed to contango initially in the event that oil reverses and I would otherwise be stuck holding it for an extended period of time. I will then close out DWTI if and when crude oil again reaches $60/barrel. While I believe that oil may ultimately see higher prices, I am concerned at the speed at which rigs may be re-deployed once drilling again becomes profitable. I believe that this will keep oil under $70/barrel for the foreseeable future and will look to exit prior to this level.

In conclusion, an oil production model based on 9 years of domestic production and rig count data is used to project oil production for the past 1 year. This model suggests that oil will bottom around the week ending April 10. However, this is just a modeled projection and the actual peak in production will depend on nuances in drilling discussed above. Nevertheless, I believe that the peak in oil production will represent a significant psychological inflection point and that crude oil is poised for a rally once production begins to roll over.

BofA Analyst Credits Falling Oil Prices for Lower Mortgage Rates

https://i0.wp.com/www.syntheticoilchangeprice.com/wp-content/gallery/cheap-oil-change/cheap_oil_change_hero.jpgby Phil Hall

The precipitous drop in global oil prices has created a domino effect that led to a new decline in lower mortgage rates, according to a report by Chris Flanagan, a mortgage rate specialist at Bank of America Merrill Lynch.

“The oil collapse of 2014 appears to have been a key driver [in declining mortgage rates],” stated Flanagan in his report, which was obtained by CBS Moneywatch. “Further oil price declines could lead the way to sub-3.5 percent mortgage rates.”

Flanagan applauded this development, noting that the reversal of mortgage rates might propel housing to a stronger recovery.

“We have maintained the view that 4 percent mortgage rates are too high to allow for sustainable recovery in housing,” he wrote. Flanagan also theorized that if rates fell into 3.25 percent to 3.5 percent range, it would boost “supply from both refinancing and purchase mortgage channels.”

Flanagan’s report echoes the sentiments expressed by Frank Nothaft, Freddie Mac’s chief economist, who earlier this week identified the link between oil prices and housing.

“The recent drop in oil prices has been an unexpected boon for consumers’ pocketbooks and most businesses,” Nothaft stated. “Economic growth has picked up over the final nine months of 2014 and lower energy costs are expected to support growth of about 3 percent for the U.S. in 2015. Therefore we expect the housing market to continue to strengthen with home sales rising to their best sales pace in eight years, national house price indexes up, and rental markets continuing to display low vacancy rates and the highest level of new apartment completions in 25 years.”

But not everyone is expected to benefit from this development. A report issued last week by the Houston Association of Realtors forecast a 10 percent to 12 percent drop in home sales over the next year, owing to a potential slowdown in job growth for the Houston market’s energy industry if oil prices continue to plummet.

The Real Reason Saudis Didn’t Cut Oil Production

https://i0.wp.com/www.touristmaker.com/images/saudi-arabia/medina-saudi-arabia.jpgby Martin Vleck

Summary

  • There have been plenty of explanations why OPEC didn’t cut production quotas.
  • Most of them make sense. But they fail to explain the whole strategic long-term picture.
  • There is a rarely mentioned strategic reason why – counter intuitively – oil prices falling and staying low in 2015 is in the best long-term interest of most oil exporters.
  • Moreover, the current status threatens OPEC’s influence over oil prices. OPEC will need to reform and include virtually all major oil producers in quota negotiations. Otherwise, OPEC will become irrelevant.
  • There is also an unexpected historical parallel for the current oil slump.

The conventional explanations for OPEC not cutting the production

The OPEC leaving production quotas unchanged has naturally been the top news last week and most investors have spent at least some time over the weekend to reflect on the implications of the move on their portfolios. There have been several theories and explanations as to why the OPEC didn’t cut. The obvious reasons stretch from the lack of agreement between OPEC members on whether to cut, by how, and most importantly, how much production each country sacrifices. Other explanations include the strategy of the dominant OPEC member, Saudi Arabia, to let the prices fall in order to squeeze out high-cost oil producers, such as Canadian oil sands and U.S. shale oil. The explanations or speculations also include some supposed secret deal between the U.S. and Saudi Arabia to damage Russia, Iran, ISIS and other “rogue” regimes or interest groups around the world. There are certainly many more theories for why OPEC didn’t cut.

Saudis are most probably thinking long term, so any explanation needs to include a combination of short term and long-term strategic goals. And the question also lingers whether OPEC still has enough power over oil prices.

Is this the real reason why Saudis didn’t cut?

There have been plenty of explanations why the OPEC didn’t cut production quotas. But there is one very long-term strategic reason why the price fall may be welcome by OPEC. This explanation has not been discussed too much, at least I haven’t seen it mentioned. Yet over the very long, very strategic time horizon, this would be the most probable explanation for letting the price of oil to fall now.

Who is the biggest competitor for the Saudis, or OPEC countries? Is it Canada? Is it the U.S.? Russia? Offshore Africa? The answer is no. Let me give you a hint. What is the biggest threat to not just Saudi Arabia, or OPEC, but to all oil producers? The answer is simple:

The biggest threat to all oil producers of the world is the high oil price. (No, that’s not a typo).

Alternative energy sources are the true competitor of all participants in the oil and gas industry.

High price of oil spurs faster development and implementation of alternative energy technologies. It is just a matter of time before solar, wind and other alternative sources of energy will become competitive or cheaper than oil and gas in many applications. In some places they already are. Sometimes even without any subsidies and including the benefits that oil and gas industry receives in the form of free negative externalities, such as the damage to the water and environment in general. To be fair, the negative environmental impact of the solar panel production and disposition is rarely mentioned.

Moreover, the cost of generating alternative energy has been falling and there is no reason why the cost should stop falling as the technological process keeps leaping ahead. It will probably take centuries before the world runs out of good sunny or windy spots (Sahara, Saudi desert – interestingly, Southern U.S. for solar and plenty of shores for wind are just some examples), so the costs to extract additional alternative energy megawatts will not rise. Plus, the sun rises every day, so the source of this energy is almost infinite and doesn’t deplete or deteriorate. It is like a fixed cost which will never rise over time.

On the other hand, the reserves of oil and gas are finite and the cost of extracting an additional barrel of oil has been rising – and will most probably keep rising – due to cheap sources of oil being always extracted first as well as due to generally rising overall costs associated with oil production.

Alternative energy space is rapidly developing

The recent technical development in the area of electricity storage (batteries, etc.) and alternative energy is surprisingly fast. Panasonic, Tesla and many others are investing in cheaper and more efficient large-scale batteries for economically viable electricity storage. The sales of electric cars, while still tiny, grow at rapid annual rates globally. Hydrogen fuel cell powered cars are emerging (Honda, Hyundai and Toyota already sold/leased some hydrogen models to the public, Audi has a fully functional prototype, many other brands are at similar stages but the technology is evolving rapidly). Ironically, hydrogen is usually produced from natural gas or methane. However, the efficiency is roughly 80%, which is extremely high, much higher than conventional combustion engines. Natural gas also has a much lower value for the oil and gas producers than the oil (lots of it is still just burnt on the spot). So the overall revenue for the oil and gas industry will be significantly lower from a hydrogen-powered car than from a conventional gasoline car. The same holds true for electric cars of course. The hydrogen fueling stations infrastructure is in its infancy, and only a true fan would buy/rent a hydrogen car now, but judging from the hydrogen car mileage and activities of car manufacturers, fuel cell infrastructure may be just 2-3 years behind the electric vehicle infrastructure. If some favorable legislation chips in, the gap could actually close very soon.

But cars are just one of many examples of how alternative energy sources threaten to replace significant volumes of oil in the future. On the other end of the spectrum are speculative developments, such as the fusion power which has been a fata-morgana for many decades. Even a working solution now would probably take five to ten years to make it commercially available. However, Lockheed Martin now claims to have made a breakthrough in fusion technology, offering no details though. So their claim may easily be just part of a creative PR campaign. (I am not suggesting they are lying, but I have to discount the information because there is no way to prove it)

Oil is here to stay for decades

Of course lots of oil will still need to be consumed, for many decades to come. But the market will be shrinking or stagnant in dollar terms. Actual physical volumes may moderately rise. The improvements in power consumption efficiencies are not exactly going to help the price and volume. On the other hand, growing global population and rising buying power of a global consumer is a major positive factor. All in all, I believe the current oil price weakness will continue only in the short run. The prices of WTI crude should stabilize in the medium term of several months or quarters at the level of $60-$80 per barrel.

http://allsortsofposts.files.wordpress.com/2013/02/riyadh-saudi-arabia.jpg

The only way many oil and gas exporting countries can survive in the long run

Oil and gas revenues are often a dominant source of income for the producing countries. To say many are very dependent on oil and gas revenues is a gross understatement. Preserving at least some oil and gas revenue is a matter of life and death for these countries. Therefore, the only way to survive the next few decades for most oil and gas producing countries is to cut the price of oil drastically NOW. That is their only chance to at least slow down the development and implementation of alternative energy sources into widespread usage, before it is too late from their point of view. If they fail, the price of oil will get stuck at much lower levels almost permanently.

OPEC will lose relevance if it doesn’t manage to reform and include virtually all major oil producers in quota negotiations

Higher-cost producers are planning to increase their oil/oil products exports to global markets. For example, Canada prepares to sign a free trade agreement with South Korea “in the coming months” which will cut crude oil and LNG duties by 3% and by 8% on refined products virtually immediately upon signing the deal, and this deal would serve as a “gateway to the wider Asia-Pacific region”). Similarly, the U.S. has been warming up to the idea of looser oil export policies and discussing a free trade deal with the EU. The fact that Saudi Arabia recently cut price for its Asian customers while raising them for the U.S. would give some more support the theory that the North American market and its producers are the prime target of its strategy. And this is probably the medium-term goal of the Saudis, according to my opinion.

The fact that oil prices topped in the middle of June, almost exactly on the date when the message about the planned free trade agreement with South Korea was officially released (June 16, 2014), is certainly an interesting coincidence. Or is it? Additionally, it is likely that the Saudis see the waning pricing power of OPEC due to flexible production from the U.S. shale oil fields which can be quickly boosted or cut in order to influence the total world production. This ability takes away the power over oil from the Saudis which have possessed this power to adjust production until recently. Therefore, the Saudis probably try to reign in all OPEC members and force them to respect the set quotas and share any potential cuts among all members, without the Saudis bearing most of the quota cut. But the falling oil price has an interesting historical parallel and implications.

Lower price of oil serves as an inverse oil price shock (the opposite of the 70’s)

Besides the conventional explanations for the current oil price slump, there is a surprising inverse historical parallel – the first and second oil price shock in the 70’s (1973 and 1979). Back then, prices of oil spiked rapidly and remained high and the time was generally characterized by booming population growth, young population, rapid inflation, high interest rates which subsequently caused a supply-side shock and a recession. But this period also spurred unprecedented innovation around the world with advances in robotics, miniaturization, semiconductors, and other fields which radically improved efficiencies which decreased energy and material intensity of production, especially in Japan.

The current situation is almost exactly the opposite. The price of oil is not rising but falling rapidly. Inflation is extremely low (parts of the world already experience deflation), aggregate demand is sluggish amid falling real income, almost non-existent population growth and aging population (in the U.S. and other developed countries). All this discourages investments in energy innovation and energy efficiency (low interest rates help a lot, though).

Existing alternative energy solutions are becoming more and more uneconomical compared to falling price of oil and gas, and the opportunity cost of using subsidized “green” energy is rising relative to cheaper oil. Existing subsidies suddenly may not be high enough to cover the costs to install further alternative energy capacities. Investments into further alternative energy R&D will be hard to obtain due to low potential ROI of the innovations if the future price of oil is expected to remain low. This will help conserve the status quo or at least slow down alternative energy advances. For the current oil producers – from all around the world, not only for Saudi Arabia or OPEC – lower prices are great news in the long run, even though they are painful now.

My oil price outlook

In the short run (several months and quarters), I am very bearish on oil prices because the oil producers have motivation to keep the price low until the highly leveraged, high-cost oil producers go out of business or are bought for pennies by their stronger competitors. Also, oil producing countries would need to maintain at least several quarters of weak oil to discourage long-term investments into alternative energy innovation, possibly until the current round of alternative energy R&D companies and some solar energy companies go out of business or consolidate.

However, over the medium to long term (years and decades), I am neutral to moderately bullish on oil prices as I believe the markets and industry will find a decent equilibrium around $60-80 per barrel. However, I don’t expect long-lasting spikes above $90-100 per barrel (barring the global security situation getting out of hand) because the flexible U.S. shale producers currently hold a permanent “call option” on the oil market. Every time the price spikes, they will quickly add more production, balancing the market. It is quite similar to the Bernanke put option, just working the opposite way and in oil.

Investment implication

I opened a long position in United States Oil ETF (NYSEARCA:USO) (selling covered calls to help mitigate contango issues) and Seadrill (NYSE:SDRL) late last week. I am also considering establishing a long position in British Petroleum (NYSE:BP). Furthermore, for long-term investors with high risk tolerance, I recommend smaller positions in more speculative and risky oil and gas services small-cap stocks which I analyzed in the past few weeks. These include Tidewater (NYSE:TDW), TGC Industries (NASDAQ:TGE), Dawson Geophysical (NASDAQ:DWSN), GulfMark Offshore (NYSE:GLF), Ion Geophysical (NYSE:IO) and CGG Industries (NYSE:CGG). I don’t hold any positions in any of these due to my preference for a highly concentrated portfolio but may decide to open long positions depending on future situation.

Oil & Gas Stocks: ‘Stability At The Bottom’ May Be A Positive Sign

https://i0.wp.com/www.avidtrader.com/wordpress/wp-content/uploads/2012/10/oil_and_gas.jpgby Richard Zeits

Summary:

  • The article provides “correction scorecards” by stock and by group versus commodities.
  • In the past two weeks, oil & gas stocks firmed up, despite the continued slide in the price of oil.
  • Small- and mid-capitalization oil-focused E&Ps were the strongest winners.
  • Emerging markets Oil Majors and Upstream MLPs were the worst performers.

During the two weeks since my previous update, stocks in the Oil & Gas sector demonstrated what an optimist might interpret as “stability at the bottom.” The net effect of another sequence of high-amplitude intraday moves was a slight recovery from the two weeks ago levels across the vast majority of segments and stock groups, as shown on the chart below. It should be no surprise that those groups that had declined the most were also the biggest gainers in the past two weeks.

Most notable is the fact that the descend trend in the Oil & Gas stocks was interrupted (and even marginally reversed) in spite of the new lows posted by the price of oil. One could try to interpret this performance as an indication that the current price levels already discount the market’s fear that the oil price paradigm has shifted. This stability may also indicate that the wave of forced liquidations by hedge funds and in individual margin accounts has run its course and the worst part of this correction may be already behind us.

Even though this recent stock price “stability” is a welcome development, it provides little consolation to investors in the Oil & Gas sector who still see their positions trading far below the peak levels achieved last summer. The correction scorecard graph below summarizes average “peak-to-current” performance by individual stocks that are grouped together by sector and size. Individual stock performance is provided in full detail in the spreadsheets at the end of this note.

Mid- and small-capitalization stocks, in both Upstream and Oil Service segments, remain the worst performing groups, now trading at an average discount to each individual stock’s recent peak price of over 40%, a staggering decline. Large-capitalization E&P independents and large-capitalization oil service stocks are trading at a 20%-24% average discount.

Emerging Markets Oil Majors Post A Strong Decline:

Emerging markets Oil Majors were one of the worst performing categories during the past two weeks:

Petrobras (NYSE:PBR) continued to slide down, moving 12% down since my previous update. Petrobras stands out as one of the most disappointing Oil Majors in terms of stock performance in the past five years, having lost a staggering three-quarters of its value during that period. The company’s market capitalization currently stands at only $62 billion.

· Lukoil (OTCPK:LUKOY) and Petrochina (NYSE:PTR) are other examples of strong declines in the past two weeks, with the stocks losing 8% and 7%, respectively. Lukoil’s performance may in fact be interpreted as “solid,” given the continued deterioration of Russia’s political and credit risk.

A strong contrast is the performance of the three oil super-majors – Exxon (NYSE:XOM), Chevron (NYSE:CVX) and Shell (NYSE:RDS.A) – that gained ~2% during the past two weeks and remain the best performing group in the Oil & Gas sector. I have argued in my earlier notes that, given the combined $0.9 trillion market capitalization of these three stocks, the resilient performance by the Super-majors has effectively isolated the correction in the Oil & Gas sector from the broader markets. From a fundamental perspective, the Super-majors are characterized by very low financial leverage, high proportion of counter-cyclical production sharing contracts (“PSAs”) and the effective hedge from downstream assets, which limits their exposure to the oil price decline.

Small-Capitalization E&P Stocks Bounce Back:

After a dramatic underperformance, small- and mid-capitalization E&P stocks posted meaningful gains in the past two weeks. However, in most cases the recovery is “a drop in the bucket,” given that high-percentage moves are measured off price levels that sometimes are a fraction of recent peak prices. The sector remains a menu of bargains for those investors who believe in a recovery in oil prices.

  • Enerplus (NYSE:ERF): +20%
  • Northern Oil & Gas (NYSEMKT:NOG): +17%
  • Concho Resources (NYSE:CXO): +15%
  • Approach Resources (NASDAQ:AREX): +48%
  • Goodrich Petroleum (NYSE:GDP): +24%
  • Synergy Resources (NYSEMKT:SYRG): +15%
  • Penn Virginia (NYSE:PVA): +17%
  • Comstock Resources (NYSE:CRK): +25%

E&P MLPs Retreat:

Upstream MLPs were one of the exceptions in the E&P sector, declining by an average of 4% in the past two weeks. The largest Upstream MLP, Linn Energy (NASDAQ:LINE) and its sister entity LinnCo(NASDAQ:LNCO), are again trading close to their lows, after having enjoyed a strong bounce a month ago. The previously very wide gap in relative performance between Upstream MLPs and other Upstream equities has contracted substantially which, arguably, makes sense given that both categories of companies participate in the same business, irrespective of the corporate envelope.

Oil & Gas Sector Correction Scorecards:


OPEC Forecasts $110 Nominal Price Through End Of This Decade:

OPEC’s World Oil Outlook And Pivot To Asia

https://i0.wp.com/www.sweetcrudereports.com/wp-content/uploads/2013/06/OPEC-conference.jpgby Jennifer Warren

Summary

  • OPEC published its recent global oil market outlook, which offers a slightly different and instructional viewpoint.
  • OPEC sees its share of crude oil/liquids production reducing in light of increases in U.S. and Canada production.
  • OPEC also indicates a pivot toward Asia, where it sees the greatest demand for its primary exports in the future.

In perusing through OPEC’s recently released “World Oil Outlook,” several viewpoints are noteworthy. According to OPEC, demand grows mainly from developing countries and U.S. supply slows its run up after 2019. After 2019, OPEC begins to pick up the slack, supplying its products more readily. In OPEC’s view, Asia becomes a center of gravity given global population growth, up nearly 2 billion by 2040, and economic prosperity. The world economy grows by 260% versus that of 2013 on a purchasing power parity basis.

During the period 2013-2040, OPEC says oil demand is expected to increase by just over 21 million barrels per day (mb/d), reaching 111.1 mb/d by 2040. Developing countries alone will account for growth of 28 mb/d and demand in the OECD will fall by over 7 mb/d (p.1). On the supply side, “in the long-term, OPEC will supply the majority of the additional required barrels, with the OPEC liquids supply forecast increasing by over 13 mb/d in the Reference Case from 2020-2040,” they offer (p.1). OPEC shaved off 0.5 million barrels from their last year’s forecast to 2035. Asian oil demand accounts for 71% of the growth of oil demand.

Morgan Stanley pulled out the following items:

The oil cartel released its World Oil Outlook last week, showing OPEC crude production falling to 29.5 million barrels per day in 2015 and 28.5 million barrels per day in 2016. This year’s average of 30 million barrels per day has helped flood the market and push oil prices to multi-year lows.

In the period to 2019, this chart illustrates where the barrels will flow:

Prices

With regard to price, OPEC acknowledges that the marginal cost to supply barrels continues to be a factor in expectations in the medium and long term. This sentiment has been echoed by other E&P CEOs in various communiques this year. OPEC forecasts a nominal price of $110 to the end of this decade:

On this evidence, a similar price assumption is made for the OPEC Reference Basket (ORB) price in the Reference Case compared to that presented in the WOO 2013: a constant nominal price of $110/b is assumed for the rest of the decade, corresponding to a small decline in real values.

Real values are assumed to approach $100/b in 2013 prices by 2035, with a slight further increase to $102/b by 2040. Nominal prices reach $124/b by 2025 and $177/b by 2040. These values are not to be taken as targets, according to OPEC. They acknowledge the challenge of predicting the world economy as well as non-OPEC supply. The Energy Information Administration (EIA) forecast a price for Brent averaging over $101 in 2015 and West Texas Intermediate (WTI) of over $94 as of their October 7th forecast. (This will have likely changed as of November 12th after the steep declines of October are weighed into their equations.) WTI averaged around the $97 range for 2013 and 2014. Importantly, U.S. supply may ratchet down slightly (green broken line) in response to price declines, if they continue.

It’s also the cars, globally

In 2013, OPEC says gasoline and diesel engines comprised 97% of the passenger cars total in 2013, and will hold 92% of the road in 2040. The diesel share for autos rises from 14% in 2013 to 21% in 2040. Basically, the number of cars buzzing on roads doubles from now to 2040. And 68% of the increase in cars comes from developing countries. China comprises the lion’s share of car volume growing by more than 470 million between 2011-2040, followed by India, then OPEC members will attribute 110 million new cars on the road. These increases assume levels similar to advanced economy (OECD) car volumes of the 1990s. In spite of efficiency and fuel economy, oil use per vehicle is expected to decline by 2.2%.

Commercial vehicles gain 300 million by 2040 from about 200 million in 2011. There are now more commercial vehicles in developing countries than developed.

U.S. Supply and OPEC

According to OPEC, U.S. and Canada supply increases through the period to 2019, the medium term. After 2017, they believe U.S. supply tempers from 1.2 million barrels of tight oil increases between 2013 and 2014 to 0.4 million in 2015, and less incremental increases thereafter. This acknowledges shale oil’s contribution to supply, with other supply sources declining, i.e., conventional and offshore.

OPEC Suggests:

The amount of OPEC crude required will fall from just over 30 mb/d in 2013 to 28.2 mb/d in 2017, and will start to rise again in 2018. By 2019, OPEC crude supply, at 28.7 mb/d, is still lower than in 2013.

However, the OPEC requirements are expected to ramp back up after 2019. By 2040, they expect to be supplying the world with 39 mb/d, a 9 million barrel/d increase from 2013. OPEC’s global share of crude oil supply is then 36%, above 2013 levels of about 30%. A select few firms like Pioneer Natural Resources (NYSE:PXD), Occidental Petroleum (NYSE:OXY), Chevron (NYSE:CVX) and even small-cap RSP Permian (NYSE:RSPP) are staying the course on shale oil production in the Permian for the present. After the first of the year, they will evaluate the price environment.

How does this outlook by OPEC inform the future? From the appearances in its forecasts, OPEC has slightly lower production in the medium term (to 2019), a decline of 1.3 million b/d in 2019 from the 2014 production of 30 million b/d. Thus, the main lever for an increase in prices for oil markets is for OPEC to restrict production, or encourage other members to keep to the current quota of 30 million b/d. Better economic indicators also could help. However, Saudi Arabia, the swing producer, has shown interest in maintaining its market share vis-à-vis the price cuts it has offered China, first, and then the U.S. more recently.

The global state of crude oil and liquids and prices has fundamentally changed with the addition of tight oil or shale oil, particularly from the U.S. While demand particulars have dominated the price regime recently, the upcoming decisions by OPEC at the late November meeting will have an influence on price expectations. In an environment of softer perceived demand now because of global economics and in the future because of non-OPEC supply, it would seem rational for OPEC to indicate some type of discipline among members’ production.

Source: OPEC “2014 World Oil Outlook,” mainly from the executive summary.

Don’t Count On A Major Slowdown In U.S. Oil Production Growth

https://i0.wp.com/upachaya.com/wp-content/uploads/2014/05/fracking.jpgby Richard Zeits

Summary

  • The presumption that North American shale oil production is the “swing” component of global supply may be incorrect.
  • Supply cutbacks from other sources may come first.
  • Growth momentum in North American unconventional oil production will likely carry on into 2015, with little impact from lower oil prices on the next two quarters’ volumes.
  • The current oil price does not represent a structural “economic floor” for North American unconventional oil production.

The recent pull back in crude oil prices is often portrayed as being a consequence of the rapid growth of North American shale oil production.

The thesis is often further extrapolated to suggest that a major slowdown in North American unconventional oil production growth, induced by the oil price decline, will be the corrective mechanism that will bring oil supply and demand back in equilibrium (given that OPEC’s cost to produce is low).

Both views would be, in my opinion, overly simplistic interpretations of the global supply/demand dynamics and are not supported by historical statistical data.

Oil Price – The Economic Signal Is Both Loud and Clear

The current oil price correction is, arguably, the most pronounced since the global financial crisis of 2008-2009. The following chart illustrates very vividly that the price of the OPEC Basket (which represents waterborne grades of oil) has moved far outside the “stability band” that seems to have worked well for both consumers and producers over the past four years. (It is important, in my opinion, to measure historical prices in “today’s dollars.”)

(Source: Zeits Energy Analytics, November 2014)

Given the sheer magnitude of the recent oil price move, the economic signal to the world’s largest oil suppliers is, arguably, quite powerful already. A case can be made that it goes beyond what could be interpreted as “ordinary volatility,” giving the hope that the current price level may be sufficient to induce some supply response from the largest producers – in the event a supply cut back is indeed needed to eliminate a transitory supply/demand imbalance.

Are The U.S. Oil Shales The Culprit?

It is debatable, in my opinion, if the continued growth of the U.S. onshore oil production can be identified as the primary cause of the current correction in the oil price. Most likely, North American shale oil is just one of several powerful factors, on both supply and demand sides, that came together to cause the price decline.

The history of oil production increases from North America in the past three years shows that the OPEC Basket price remained within the fairly tight band, as highlighted on the graph above, during 2012-2013, the period when such increases were the largest. Global oil prices “broke down” in September of 2014, when North American oil production was growing at a lower rate than in 2012-2013.

(Source: OPEC, October 2014)

If the supply growth from North America was indeed the primary “disruptive” factor causing the imbalance, one would expect the impact on oil prices to become visible at the time when incremental volumes from North America were the highest, i.e., in 2012-2013.

Should One Expect A Strong Slowdown in North American Oil Production Growth?

There is no question that the sharp pullback in the price of oil will impact operating margins and cash flows of North American shale oil producers. However, a major slowdown in North American unconventional oil production growth is a lot less obvious.

First, the oil price correction being seen by North American shale oil producers is less pronounced than the oil price correction experienced by OPEC exporters. It is sufficient to look at the WTI historical price graph below (which is also presented in “today’s dollars”) to realize that the current WTI price decline is not dissimilar to those seen in 2012 and 2013 and therefore represents a signal of lesser magnitude than the one sent to international exporters (the OPEC Basket price).

(Source: Zeits Energy Analytics, November 2014)

Furthermore, among all the sources of global oil supply, North American oil shales are the least established category. Their cost structure is evolving rapidly. Given the strong productivity gains in North American shale oil plays, what was a below-breakeven price just two-three years ago, may have become a price stimulating growth going into 2015.

Therefore, the signal sent by the recent oil price decline may not be punitive enough for North American shale oil producers and may not be able to starve the industry of external capital.

Most importantly, review of historical operating statistics provides an indication that the previous similar WTI price corrections – seen in 2012 and 2013 – did not result in meaningful slowdowns in the North American shale oil production.

The following graph shows the trajectory of oil production in the Bakken play. From this graph, it is difficult to discern any significant impact from the 2012 and 2013 WTI price corrections on the play’s aggregate production volumes. While a positive correlation between these two price corrections and the pace of production growth in the Bakken exists, there are other factors – such as takeaway capacity availability and local differentials – that appear to have played a greater role. I should also note that the impact of the lower oil prices on production volumes was not visible in the production growth rate for more than half a year after the onset of the correction.

(Source: Zeits Energy Analytics, November 2014)

Leading U.S. Independents Will Likely Continue to Grow Production At A Rapid Pace

Production growth track record by several leading shale oil players suggests that U.S. shale oil production will likely remain strong even in the $80 per barrel WTI price environment. Several examples provide an illustration.

Continental Resources (NYSE:CLR) grew its Bakken production volumes at a 58% CAGR over the past three years (slide below). By looking at the company’s historical production, it would be difficult to identify any impact from the 2012 and 2013 oil price corrections on the company’s production growth rate. Continental just announced a reduction to its capital budget in 2015 in response to lower oil prices, to $4.6 billion from $5.2 billion planned initially. The company still expects to grow its total production in 2015 by 23%-29% year-on-year.

(Source: Continental Resources, October 2014)

EOG Resources (NYSE:EOG) expects that its largest core plays (Eagle Ford, Bakken and Delaware Basin) will generate after-tax rates of return in excess of 100% in 2015 at $80 per barrel wellhead price. EOG went further to suggest that these plays may remain economically viable (10% well-level returns) at oil prices as low as $40 per barrel. The company expects to continue to grow its oil production at a double-digit rate in 2015 while spending within its cash flow. EOG achieved ~40% oil production growth in 2012-2013 and expects 31% growth for 2014. While a slowdown is visible, it is important to take into consideration that EOG’s oil production base has increased dramatically in the past three years and requires significant capital just to be maintained flat. Again, one would not notice much impact from prior years’ oil price corrections on EOG’s production growth trajectory.

(Source: EOG Resources, November 2014)

Anadarko Petroleum’s (NYSE:APC) U.S. onshore oil production growth story is similar. Anadarko increased its U.S. crude oil and NLS production from 100,000 barrels per day in 2010 to close to almost 300,000 barrels per day expected in Q4 2014. Anadarko has not yet provided growth guidance for 2015, but indicated that the company’s exploration and development strategies remain intact. While recognizing a very steep decline in the oil price, Anadarko stated that it wants “to watch this environment a little longer” before reaching conclusions with regard to the impact on its future spending plans.

(Source: Anadarko Petroleum, October 2014)

Devon Energy (NYSE:DVN) posted company-wide oil production of 216,000 barrels per day in Q3 2014. While Devon will provide detailed production and capital guidance at a later date, the company has indicated that it sees 20% to 25% oil production growth and mid‐single digit top‐line growth “on a retained‐property basis” (pro forma for divestitures) in 2015.

The list can continue on.

In Conclusion…

Based on preliminary 2015 growth indications from large shale oil operators, North American oil production growth in 2015 will likely remain strong, barring further strong decline in the price of oil.

No slowdown effect from lower oil prices will be seen for at least six months from the time operators received the “price signal” (August-September 2014).

Given the effects of the technical learning curve in oil shales and continuously improving drilling economics, the current ~$77 per barrel WTI price is unlikely to be sufficient to eliminate North American unconventional production growth.

North American shale oil production remains a very small and highly fragmented component of the global oil supply.

The global oil “central bank” (Saudi Arabia and its close allies in OPEC) remain best positioned to quickly re-instate stability of oil price in the event further significant decline occurred.