
Investors were stunned when a one-month Treasury rate chart showed an unprecedented rise of 100 basis points last Friday.
Tag Archives: bonds
ALERT: Government Bond “Illiquidity” Crisis
(Michael Oliver) We are now facing a government bond “illiquidity” crisis that threatens the entire system.

Deutsche Bank: Global Bonds Are in First Bear Market in 76 Years
“Based on two centuries of data”
Contemporary value of everything with your name on it is derived from bonds.
Gregory Mannarino Tells Mike Adams How To Protect Yourself From The Eventual Global Debt Implosion
Sometimes the only thing you can do is shine a light.
Commercial Loan Demand Plunges To New Post-Lehman Low Even As Lending Standards Ease
All T-Bills Up To 3 Months Now Have Negative Yields
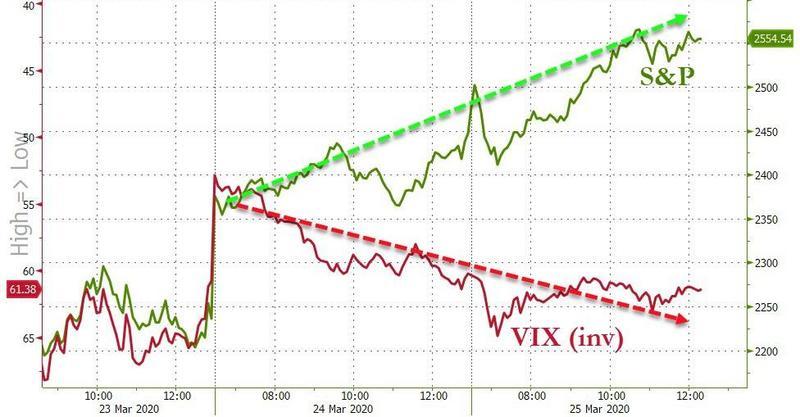
There was something strange about today’s continuation rally in stocks: while risk assets soared, the VIX barely moved. In fact the Vix is now roughly where it was on Monday, largely ignoring the move in stocks.
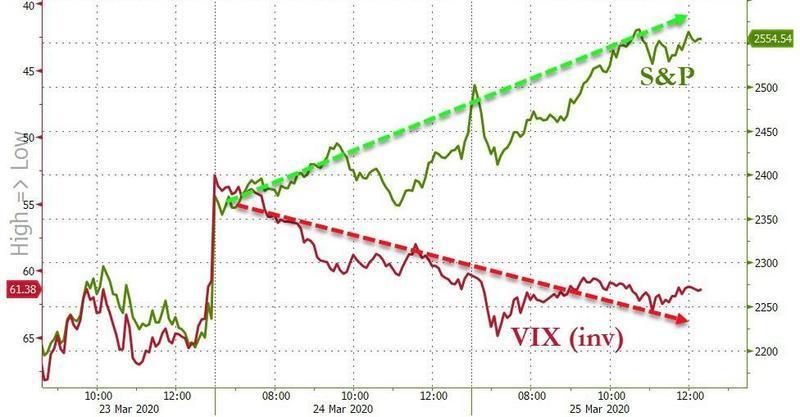
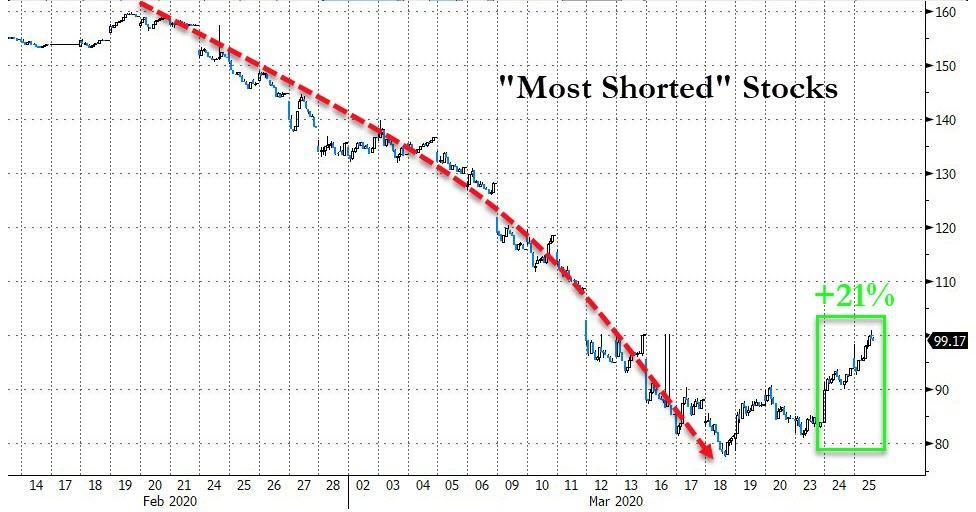
But there was another more sinister move in today’s risk rally, which as we noted earlier, appears to have been mostly a massive short squeeze, in fact the biggest two-day short squeeze in history…
… namely the persistent buying of safe havens such as Treasury’s but more importantly, Bills.
And so, one week after we reported that yields on many T-Bills through 3 months turned negative for the first time since the financial crisis, today virtually all Bills maturing around July had a negative yield.
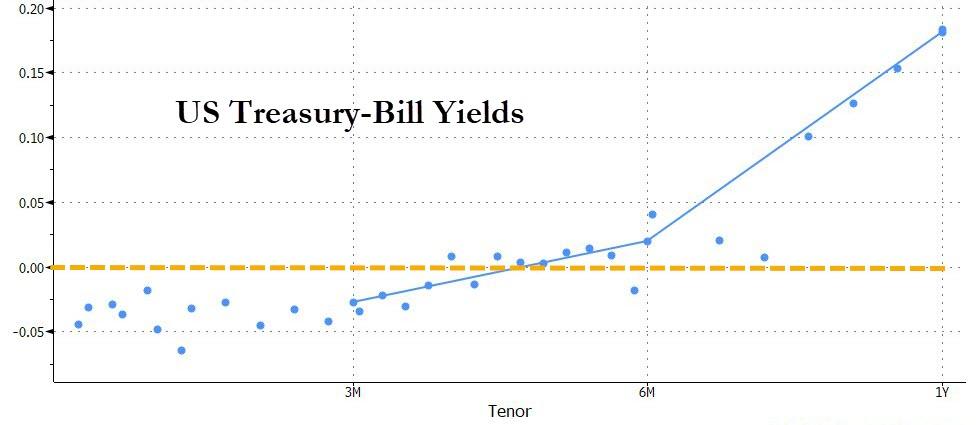
Needless to say, a scramble for both cash-equivalents (i.e. Bills) and stocks is rather unorthodox, and sparked debate among Wall Street desks what may be behind it. One answer that emerged is that for those who did not have faith in today’s stock rally and wanted to allocate their funds elsewhere, yet in the absence of available physical gold as a result of the unprecedented scarcity described yesterday, the one place where investors could find “cash equivalent” securities was among the short T-Bill maturities.
If this theory is correct, it would mean that the pent up demand for physical gold is unprecedented and any newly available precious metal will be quickly snapped up as soon as it is available, which in light of the unprecedented expansion in central bank balance sheets as virtually every state is now pursuing helicopter money, is hardly that surprising.
Alarm! Europe’s And US Bond Volatility Grinding To A Halt (Precursor To Recession)
European bond volatility (according to the Merrill Lynch 3-month EUR option volatility estimate) has plunged to the lowest level on record.

A similar chart for the US bond market is the Merrill Lynch Option Volatility Estimate for 3-months shows exactly the same thing. The US bond market is grinding to a halt.

Note that the US MOVE 3-month estimate hit a low in May 2007, just ahead of The Great Recession of 2007-2009.
***
Stocks End Week With Five Days Of Declines
- U.S. stocks almost clawed their way to break-even, shaking off concerns over slowing global growth, a weak hiring report in the U.S., and disappointing China trade data.
- S&P fell 0.2% as did the Nasdaq, and the Dow nudged down 0.1%.
- For the week, the Nasdaq declined 2.5%, while the S&P 500 and the Dow each slipped 2.2%.
- Among industry sectors, utilities (+0.4%) and materials (+0.2%) gained the most on Friday, while energy (-2.0%) and consumer discretionary (-0.7%) were the biggest underperformers.
- 10-year Treasury yield fell is down about 1 basis point to 2.63%.
Bond Bear Stops Here: Bill Gross Warns Economy Can’t Support Higher Rates

Having thrown in the towel on his bond bear market call two weeks ago, Janus Henderson’s billionaire bond investor Bill Gross now believes that the most recent bearish bond price (rise in yields) will stop here as the economy cannot support higher yields.
As Gross said two weeks ago, yields won’t see a substantial move from here.
“Supply from the Treasury is a factor in addition to what the Fed might do in terms of a mild, bearish tone for U.S. Treasury bonds,” Gross told Bloomberg TV.
“I would expect the 10-year to basically meander around 2.80 to perhaps 3.10 or 3.15 for the balance of the year. It’s a hibernating bear market, which means the bear is awake but not really growling.”

Since then, yields have tested the upper-end of his channel and are breaking out today to their highest since 2011 (10Y)…

and back to their critical resistance levels (30Y)…

And now Gross is out with a pair of tweets (here and here) saying that the record bond shorts should not get too excited here…

Bill Gross thinks they won’t be right. He highlights the long-term downtrend over the past 30-years, which comes in a 3.22%.
“30yr Tsy long-term downward yield trend line for the past 3 decades now at 3.22%, only ~4bps higher than today’s yield.”

“Will 3.22% be broken to upside?” he asks.
“I don’t think so. The economy can’t support yields higher than 3.25% for 30s and 10s, nor 3% for 5s.
Continuing hibernating bond bear market is best forecast.”
Asa ForexLive also notes, if he’s right it doesn’t necessarily mean the US dollar will reverse right away but it would be a good sign for stocks and would limit how far the US dollar might run.

So, will Gross be right? Is this latest spike all rate-locks on upcoming IG issuance? And will this leave speculators with a record short position now wondering who will be the one holding the greatest fool bag by the end of the year…
Well worth your time to hear what geo-economic consultant Martin Armstrong has to say.
Are Bonds Headed Back To Extraordinarily Low Rate Regime?
The U.S. 10-Year Treasury Yield has dropped back below the line containing the past decade’s “extraordinarily low-rate” regime.
Among the many significant moves in financial markets last fall in the aftermath of the U.S. presidential election was a spike higher in U.S. bond yields. This spike included a jump in the 10-Year Treasury Yield (TNX) above its post-2007 Down trendline. Now, this was not your ordinary trendline break. Here is the background, as we noted in a post in January when the TNX subsequently tested the breakout point:
“As many observers may know, bond yields topped in 1981 and have been in a secular decline since. And, in fact, they had been in a very well-defined falling channel for 26 years (in blue on the chart below). In 2007, at the onset of the financial crisis, yields entered a new regime.
Spawned by the Fed’s “extraordinarily low-rate” campaign, the secular decline in yields began a steeper descent. This new channel (shown in red) would lead the TNX to its all-time lows in the 1.30%’s in 2012 and 2016.
The top of this new channel is that post-2007 Down trendline. Thus, recent price action has 10-Year Yields threatening to break out of this post-2007 technical regime. That’s why we consider the level to be so important.”
We bring up this topic again today because, unlike January’s successful hold of the post-2007 “low-rate regime” line, the TNX has dropped back below it in recent days. Here is the long-term chart alluded to above.

And here is a close-up version.

As can be seen on the 2nd chart, the TNX has just broken below several key Fibonacci Retracement levels near the 2.30% level – not to mention the post-2007 Down trendline which currently lies in the same vicinity. Does this meant the extraordinarily low-rate environment is back?
Well, first of all, the Federal Reserve only sets the overnight “Fed Funds” rate – not longer-term bond yields (at least not directly). So this is not the Fed’s direct doing (and besides, they’re in the middle of a rate hiking cycle). Therefore, the official “extraordinarily low-rate” environment that the Fed maintained for the better part of a decade is not coming back – at least not imminently. But how about these longer rates?
Outside of some unmistakable influence resulting from Fed policy, longer-term Treasury Yields are decided by free market forces. Thus, this return to the realm of the TNX’s ultra low-rate regime is market-driven, whatever the reason. Is there a softer underlying economic current than what is generally accepted at the present time? Is the Trump administration pivoting to a more dovish posture than seen in campaign rhetoric? Are the geopolitical risks playing a part in suppressing yields back below the ultra low-rate “line of demarcation”?
Some or all of those explanations may be contributing to the return of the TNX to its ultra low-rate regime. We don’t know and, frankly, we don’t really care. All we care about, as it pertains to bond yields, is being on the right side of their path. And currently, the easier path for yields is to the downside as a result of the break of major support near 2.30%.
Foreign Governments Dump US Treasuries as Never Before, But Who the Heck is Buying Them?
It started with a whimper a couple of years ago and has turned into a roar: foreign governments are dumping US Treasuries. The signs are coming from all sides. The data from the US Treasury Department points at it. The People’s Bank of China points at it in its data releases on its foreign exchange reserves. Japan too has started selling Treasuries, as have other governments and central banks.
Some, like China and Saudi Arabia, are unloading their foreign exchange reserves to counteract capital flight, prop up their own currencies, or defend a currency peg.
Others might sell US Treasuries because QE is over and yields are rising as the Fed has embarked on ending its eight years of zero-interest-rate policy with what looks like years of wild flip-flopping, while some of the Fed heads are talking out loud about unwinding QE and shedding some of the Treasuries on its balance sheet.
Inflation has picked up too, and Treasury yields have begun to rise, and when yields rise, bond prices fall, and so unloading US Treasuries at what might be seen as the peak may just be an investment decision by some official institutions.
The chart below from Goldman Sachs, via Christine Hughes at Otterwood Capital, shows the net transactions of US Treasury bonds and notes in billions of dollars by foreign official institutions (central banks, government funds, and the like) on a 12-month moving average. Note how it started with a whimper, bounced back a little, before turning into wholesale dumping, hitting record after record (red marks added):

The People’s Bank of China reported two days ago that foreign exchange reserves fell by another $12.3 billion in January, to $2.998 trillion, the seventh month in a row of declines, and the lowest in six years. They’re down 25%, or almost exactly $1 trillion, from their peak in June 2014 of nearly $4 trillion (via Trading Economics, red line added):

China’s foreign exchange reserves are composed of assets that are denominated in different currencies, but China does not provide details. So of the $1 trillion in reserves that it shed since 2014, not all were denominated in dollars.
The US Treasury Department provides another partial view, based on data collected primarily from US-based custodians and broker-dealers that are holding these securities for China and other countries. But the US Treasury cannot determine which country owns the Treasuries held in custodial accounts overseas. Based on this limited data, China’s holdings of US Treasuries have plunged by $215.2 billion, or 17%, over the most recent 12 reporting months through November, to just above $1 trillion.
So who is buying all these Treasuries when the formerly largest buyers – the Fed, China, and Japan – have stepped away, and when in fact China, Japan, and other countries have become net sellers, and when the Fed is thinking out loud about shedding some of the Treasuries on its balance sheet, just as nearly $900 billion in net new supply (to fund the US government) flooded the market over the past 12 months?
Turns out, there are plenty of buyers among US investors who may be worried about what might happen to some of the other hyper-inflated asset classes.
And for long suffering NIRP refugees in Europe, there’s a special math behind buying Treasuries. They’re yielding substantially more than, for example, French government bonds, with the US Treasury 10-year yield at 2.4%, and the French 10-year yield at 1.0%, as the ECB under its QE program is currently the relentless bid, buying no matter what, especially if no one else wants this paper. So on the face of it, buying US Treasuries would be a no-brainer.
But the math got a lot more one-sided in recent days as French government bonds now face a new risk, even if faint, of being re-denominated from euros into new French francs, against the will of bondholders, an act of brazen default, and these francs would subsequently get watered down, as per the euro-exit election platform of Marine Le Pen. However distant that possibility, the mere prospect of it, or the prospect of what might happen in Italy, is sending plenty of investors to feed on the richer yields sprouting in less chaos, for the moment at least, across the Atlantic.
Global Bonds Yields Plunge To Record As Treasuries Test Flash-Crash Lows
German, Japanese, and British bond yields are plumbing historic depths as low growth outlooks combined with event risk concerns (Brexit, elections, etc.) have sent investors scurrying for safe-havens (away from US Biotechs).

At 2.0bps, 10Y Bunds are inching ever closer to the Maginot Line of NIRP which JGBs have already crossed, and all of this global compression is dragging US Treasury yields to their lowest levels since February’s flash-crash… back below 10Y’s lowest close level since 2013.

As Bloomberg reports, the rush into government bonds during 2016 shows no sign of reversing as a weakening global economic outlook fuels demand for perceived havens.
Bonds are off to their best start to a year since at least 1997, according to a broad global gauge of investment-grade debt that has gained 4.6 percent since the end of December, based on Bank of America Corp. data. They rallied most recently after the weakest U.S. payrolls data in almost six years was reported June 3, damping expectations the Federal Reserve will raise interest rates in the next few months.
At the same time, polls indicate Britain’s vote on remaining or exiting the European Union is too close to call. Billionaire investor George Soros was said to be concerned large market shifts may be at hand.
“The environment is fundamentally supportive of these low yields, and there is nothing in sight, at least in the short term, that could trigger a trend reversal,” said Marius Daheim, a senior rates strategist at SEB AB in Frankfurt. “The labor market report was one thing which has driven the Treasury market and has supported other markets. If you look in the euro zone, you have Brexit risks that have risen recently, and that is also creating safe-haven flows.”
10Y Japanese Government bonds plunged to record lows at -15bps!

With Gilts down 9 days in a row…

The World Bank this week cut its outlook for global growth as business spending sags in advanced economies including the U.S., while commodity exporters in emerging markets struggle to adjust to low prices.
The yield on the Bloomberg Global Developed Sovereign Bond Index dropped to a record 0.601 percent Thursday.

And stocks are waking up to that reality…

Why The US 10 Year Treasury Is Headed Below 1%
US GDP Output Gap Update – Q1 2016

Among our favorite indicators to write about is the GDP output gap. Today we update it with the latest Q1 2016 GDP data. We’ve written about it many times in the past (some recent examples: 09/30/2015, 12/27/2014, and 06/06/2014). It is the standard for representing economic slack in most other developed countries but is usually overlooked in the United States in favor of the gap between the unemployment rate and full employment (also called NAIRU (link is external). This is partially because the US Federal Reserve’s FOMC has one half of its main goal to promote ‘full employment’ (along with price stability) but it is also partially because the unemployment rate makes the economy look better, which is always popular to promote. In past US business cycles, these two gaps had a close linear relationship (Okun’s law (link is external) and so normally they were interchangeable, yet, in this recovery, the unemployment rate suggests much more progression than the GDP output gap.
The unemployment gap now, looked at on its face, would imply that the US is at full employment; i.e., the unemployment rate is 5% and full employment is considered to be 5%. Thus, this implies that the US economy is right on the verge of generating inflation pressure. Yet, the unemployment rate almost certainly overstates the health of the economy because of a sharp increase over the last many years of unemployed surveys claiming they are not involved in the workforce (i.e. not looking for a job). From the beginning of the last recession, November 2007, the share of adults claiming to be in the workforce has fallen by 3.0% of the adult population, or 7.6 million people of today’s population! Those 7.6 million simply claiming to be looking for a job would send the unemployment rate up to 9.4%!. In other words, this metric’s strength is heavily reliant on whether people say they are looking for a job or not, and many could switch if the economy was better. Thinking about this in a very simplistic way; a diminishing share of the population working still has to support the entire population and without offsetting higher real wages, this pattern is regressive to the economy. The unemployment rate’s strength misses this.
Adding to the evidence that the unemployment rate is overstating the health of the economy is the mismatch between the Bureau of Labor Statistics’ (BLS) household survey (unemployment rate) and the establishment survey (non-farm payroll number). Analyzing the growth in non-farm payrolls over the period of recovery (and adjusting for aging demographics) suggests that the US economy still has a gap to full employment of about 1.5 million jobs; this is the Hamilton Project’s Jobs Gap (link is external).
But, the labor market is a subset of the economy, and while its indicators are much more accessible and frequent than measurements on the entire economy, the comprehensive GDP output gap merits being part of the discussion on the economy. Even with the Congressional Budget Office (CBO) revising potential GDP lower each year, the GDP output gap (chart) continues to suggest a dis-inflationary economy, let alone a far away date when the Federal Reserve needs to raise rates to restrict growth. This analysis suggests a completely different path for the Fed funds rate than the day-to-day hysterics over which and how many meetings the Fed will raise rates this year. This analysis is the one that has worked, not the “aspirational” economics that most practice.
In an asset management context, US Treasury interest rates tend to trend lower when there is an output gap and trend higher when there is an output surplus. This simple, yet overlooked rule has helped to guide us to stay correctly long US Treasuries over the last several years while the Wall Street community came up with any reason why they were a losing asset class. We continue to think that US Treasury interest rates have significant appreciation ahead of them. As we have stated before, we think the 10yr US Treasury yield will fall to 1.00% or below.
The Stock Market Decline Is Gaining Momentum
Summary:
- The current stock market decline began with transportation stocks and small capitalization stocks severely under-performing the market.
- Weakness then spread to the energy complex and high-yield bonds.
- Yield focused stocks were the next to fall, with Kinder Morgan being the most prominent example.
- Stalwarts like Apple and Gilead lost their momentum with the August 2015 decline and never regained their mojo.
- In 2016, a slow motion crash is occurring in the stock market, and the price action has finally impacted the leading FANG stocks.
“Hysteria is impossible without an audience. Panicking by yourself is the same as laughing alone in an empty room. You feel really silly.” – Chuck Palahniuk
“Life is ten percent what you experience and ninety percent how you respond to it.” – Dorothy M. Neddermeyer
Introduction:
The stock market decline has gained momentum in 2016, and much like a runaway train, the current decline will be hard to stop, until the persistent overvaluations plaguing the stock market over this current bull market are corrected.
The correction that has caused the average stock in the United States to correct over 25%, thus far, started as an innocuous move down in global equities, outside of the depression enveloping the downtrodden emerging markets and commodities stocks, and then spread from transportation stocks to market leaders like biotechnology companies. The first wave down culminated in a gut-wrenching August 2015 sell-off that saw the Dow Jones Industrial Average (NYSEARCA:DIA) fall 1000 points at the open on August 24th, 2015. The panic was quickly brushed aside, but not forgotten, as market leading stocks made new highs in the fall of 2015.
That optimism, has given way to the reality that global quantitative easing has not provided the boost that its biggest supporters claimed. Now, everything is falling in tandem, and there is not much hope with the Fed nearly out of bullets, other than perhaps lower energy prices, to spark a true recovery.
The financial markets have taken notice, and are repricing assets accordingly. Just like forays to the upside are not one way affairs, the move down will not be a one-way adjustment, and investors should be prepared for sharp counter-trend rallies, and the price action yesterday, Thursday, January 14th, 2016 is a perfect example. To close, with leading stocks now suffering sizable declines that suggest institutional liquidation, investors should have their respective defensive teams on the field, and be looking for opportunistic, out-of-favor investments that have already been discounted.
Thesis:
The market correction is gaining steam and will not be completed until leading stocks and market capitalization indexes correct materially.
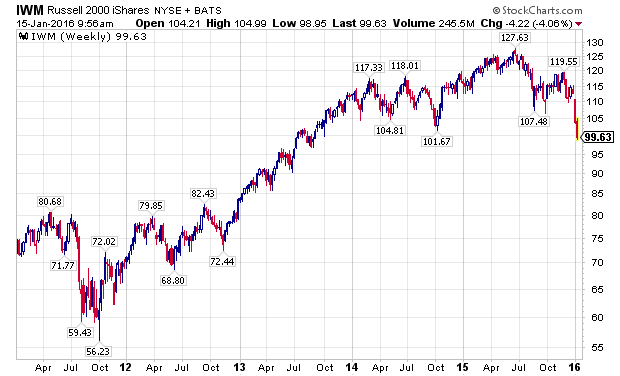
Small-Caps & Transports Led The Downturn:
While U.S. stocks have outperformed international markets since 2011, 2014 and 2015 saw the development of material divergences. Specifically, smaller capitalization stocks, measured by the Russell 2000 Index, and represented by the iShares Russell 2000 ETF (NYSEARCA:IWM), began under performing in 2014. Importantly, small-caps went on to make a new high in 2015, but their negative divergence all the way back in 2014, planted the seeds for the current decline, as illustrated in the chart below.
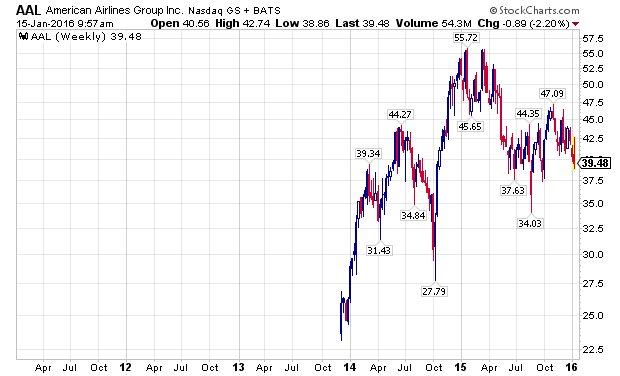
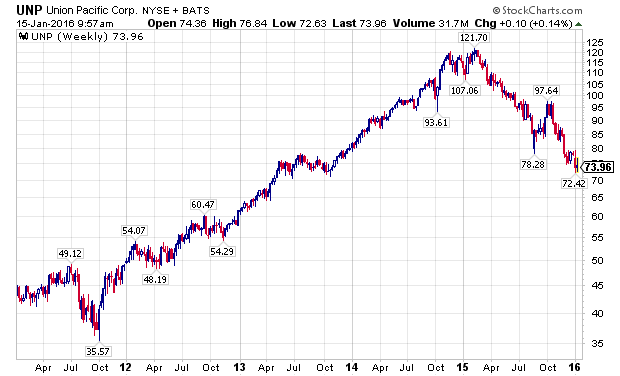
Building on the negative divergences, transportation stocks began severely under performing the broader markets in 2015. To illustrate this, I have used the charts of two leading transportation stocks, American Airlines (NASDAQ:AAL) and Union Pacific Corporation (NYSE:UNP), which are depicted below. For the record, I have taken a fundamental interest in both companies as I believe they are leading operators in their industries.
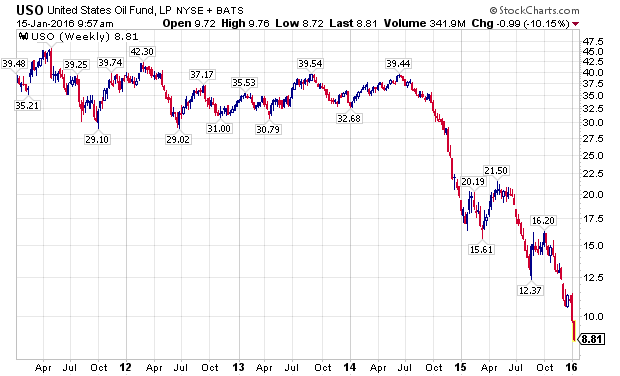
The Next Dominoes – Oil Prices & High Yield Bonds:
Oil prices, as measured by the United States Oil Fund (NYSEARCA:USO) in the chart below, were actually one of the first shoes to drop, even prior to small-cap stocks, starting a sizable move down in June of 2014.
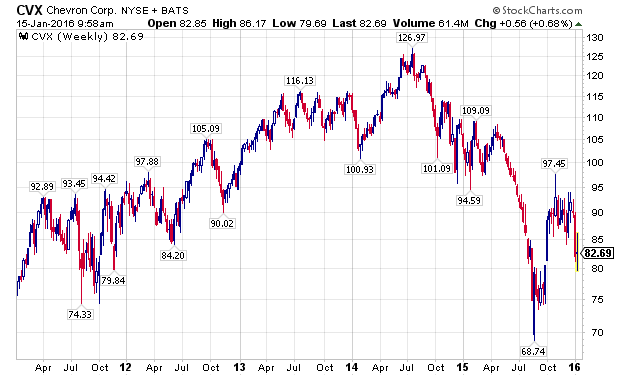
Industry stalwart Chevron Corporation (NYSE:CVX) peaked in July of 2014, and despite tremendous volatility since then, has been in a confirmed downtrend.
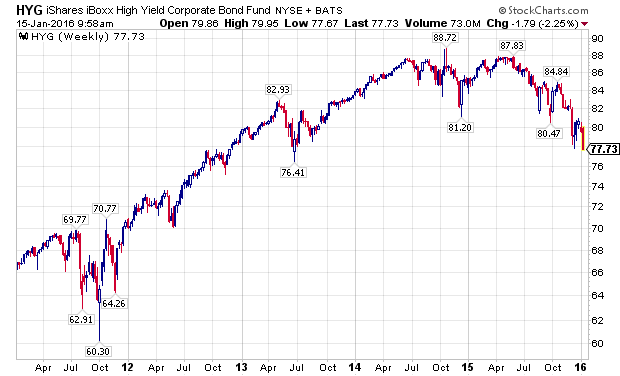
As the energy complex fell apart with declining oil prices, high-yield bonds, as measured by the iShares iBoxx High Yield Corporate Bond Fund (NYSEARCA:HYG), and by the SPDR Barclays High Yield Bond ETF (NYSEARCA:JNK), made material new lows.

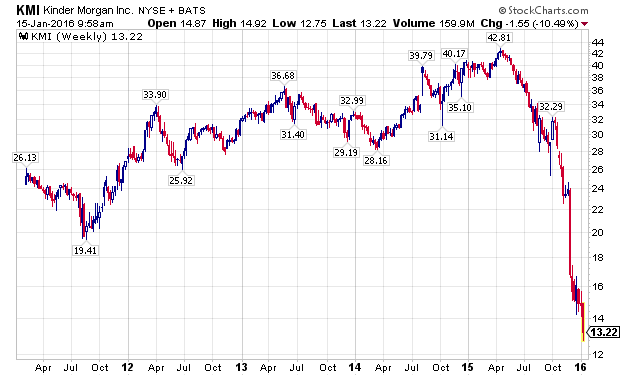
Yield Focused Stocks Take It On The Chin
As the energy downturn intensified, many companies that had focused on providing attractive yields, to their yield starved investors, saw their business models questioned at best, and implode at worst. The most prominent example was shares of Kinder Morgan (NYSE:KMI).
The fallout did not stop with KMI, as many MLP s and other yield oriented stocks continue to see declines as 2015 has rolled into 2016. Williams Companies (NYSE:WMB) has been especially hard hit, showing extreme volatility over the past several weeks.

Leading GARP Stocks Never Recovered:
Even though I have been bearish on the markets for some time, I was not sure if the markets would melt-up or meltdown in December of 2015, as I articulated in a Seeking Alpha article at the time.
In hindsight, the under performance of growth-at-a-reasonable-price stocks, like Apple (NASDAQ:AAPL) and Gilead Sciences (NASDAQ:GILD), which had struggled ever since the August 2015 sell-off, should have been an ominous sign.
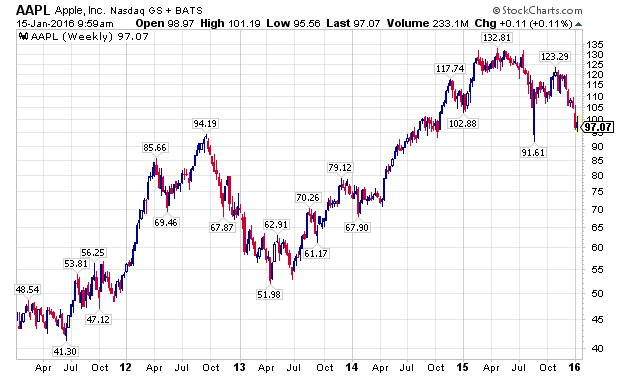

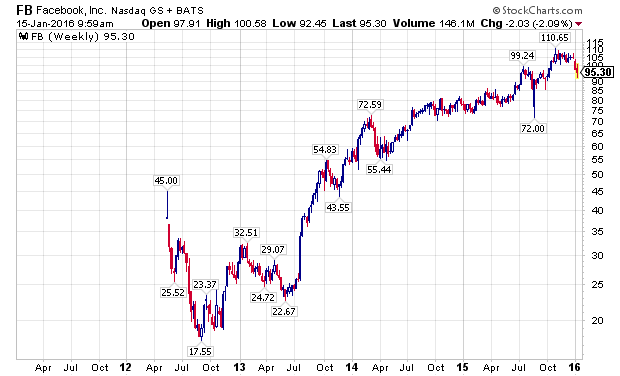
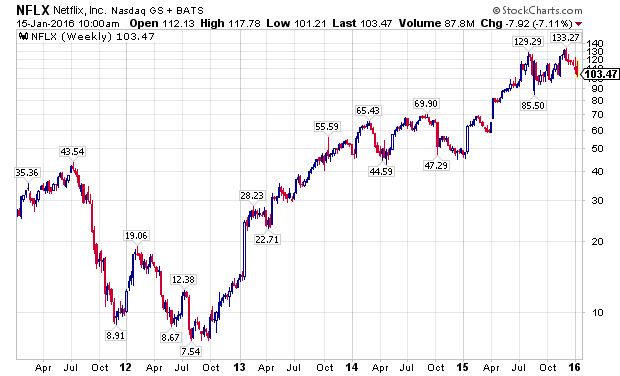
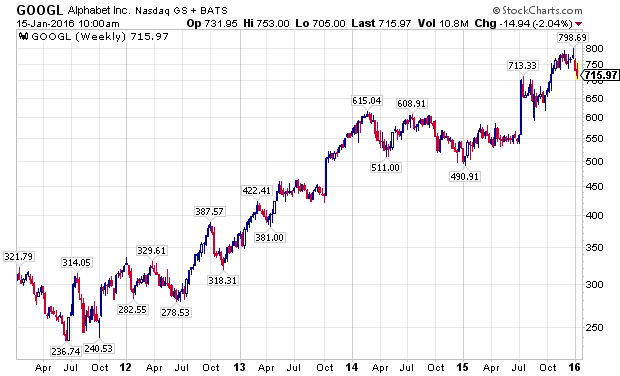
FANG Stocks, The Last Shoe To Drop:
Even as many divergences developed in the financial markets over the last year, many leading stocks made substantial new highs in the fall of 2015, led by the FANG stocks. Facebook (NASDAQ:FB), Amazon (NASDAQ:AMZN), Netflix (NASDAQ:NFLX), and Alphabet (NASDAQ:GOOG) (NASDAQ:GOOGL), along with NASDAQ stalwarts Microsoft (NASDAQ:MSFT) and Starbucks (NASDAQ:SBUX), attracted global capital as growth became an increasingly scarce commodity. The last two weeks have challenged the assumption that these companies are a safe-haven, immune from declines impacting the rest of the stock market, as the following charts show.

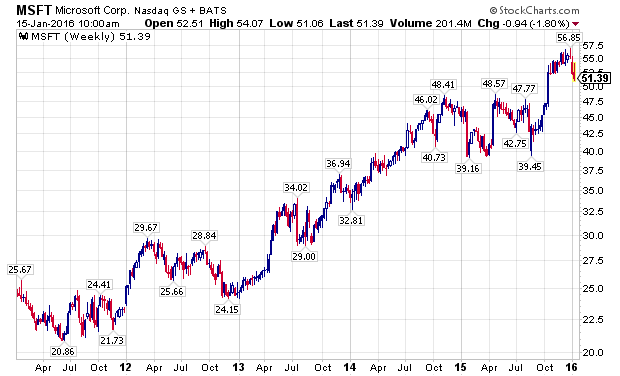
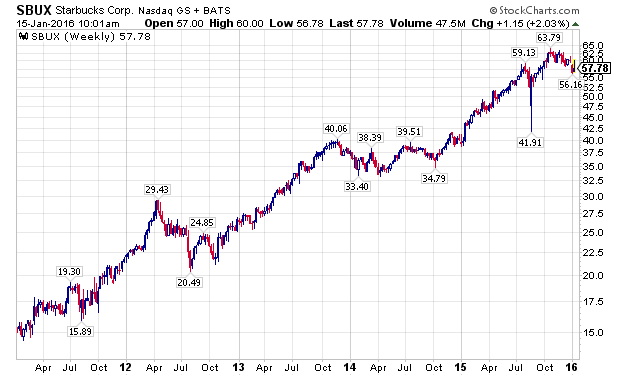
The PowerShares QQQ ETF (NASDAQ:QQQ), which is designed to track the performance of the NASDAQ 100 Index, and counts five of the world’s ten largest market capitalization companies among its largest holdings, Apple, Alphabet, Microsoft, Amazon, and Facebook, has outperformed the S&P 500 Index, as measured by the SPDRs S&P 500 ETF (NYSEARCA:SPY), for a majority of the current bull market, with a notable exception being the last week of 2015, and the first two weeks of 2016. Wholesale, sustained selling is now starting to grip the markets.


Conclusion – The Market Downturn Is Gaining Momentum:
The developing market correction is gaining momentum. Like an avalanche coming down a mountain, it is impacting everything it touches, and no sectors or companies, even the previously exalted FANG stocks, are immune from its reaches. Investors should have their respective defensive teams on the field, while looking for opportunities in undervalued, out-of-favor assets, as many stocks have been in their own bear markets for years.
by William Koldus in Seeking Alpha
Why The Junk Bond Selloff Is Getting Scary
High-yield bonds have led previous big reversals in S&P 500

The junk bond market is looking more and more like the boogeyman for stock market investors.
The iShares iBoxx $ High Yield Corporate Bond exchange-traded fund HYG, -2.34% tumbled 2.4% in midday trade Friday, putting the ETF (HYG) on course for the lowest close since July 2009. Volume as of 12 p.m. Eastern was already more than double the full-day average, according to FactSet.
While weakness in the junk bonds — bonds with credit ratings below investment grade — is nothing new, fears of meltdown have increased after high-yield mutual fund Third Avenue Focused Credit Fund TFCIX, -2.86% TFCVX, -2.70% on Thursday blocked investors from withdrawing their money amid a flood of redemption requests and reduced liquidity.
This chart shows why stock market investors should care:
 FactSet
When junk bonds and stocks disagree, junks bonds tend to be right.
The MainStay High Yield Corporate Bond Fund MHCAX, -0.19% was used in the chart instead of the HYG, because HYG started trading in April 2007.
When investors start scaling back, and market liquidity starts to dry up, the riskiest investments tend to get hurt first. And when money starts flowing again, and investors start feeling safe, bottom-pickers tend to look at the hardest hit sectors first.
So it’s no coincidence that when the junk bond market and the stock market diverged, it was the junk bond market that proved prescient. Read more about the junk bond market’s message for stocks.
There’s still no reason to believe the run on the junk bond market is nearing an end.
As Jason Goepfert, president of Sundial Capital Research, points out, he hasn’t seen any sign of panic selling in the HYG, which has been associated with previous short-term bottoms. “Looking at one-month and three-month lows [in the HYG] over the past six years, almost all of them saw more extreme sentiment than we’re seeing now,” Goepfert wrote in a note to clients.
by Tomi Gilmore in MarketWatch
Icahn Warns “Meltdown In High Yield Is Just Beginning”
 by Tyler Durden
Amid the biggest weekly collapse in high-yield bonds since March 2009, Carl Icahn gently reminds investors that he saw this coming… and that it’s only just getting started!
As we warned here, and confirmed here, something has blown-up in high-yield…

With the biggest discount to NAV since 2011…

The carnage is across the entire credit complex… with yields on ‘triple hooks’ back to 2009 levels…

As fund outflows explode..

And here’s why equity investors simply can’t ignore it anymore…


If all of that wasn’t bad enough… the week is apocalyptic…

Icahn says, it’s only just getting started…
If you haven’t seen ‘Danger Ahead’ watch it on https://t.co/4rVAcLBsH9. Unfortunately I believe the meltdown in High Yield is just beginning
— Carl Icahn (@Carl_C_Icahn) December 11, 2015
As we detailed previously, to be sure, no one ever accused Carl Icahn of being shy and earlier this year he had a very candid sitdown with Larry Fink at whom Icahn leveled quite a bit of sharp (if good natured) criticism related to BlackRock’s role in creating the conditions that could end up conspiring to cause a meltdown in illiquid corporate credit markets. Still, talking one’s book speaking one’s mind is one thing, while making a video that might as well be called “The Sky Is Falling” is another and amusingly that is precisely what Carl Icahn has done.
Over the course of 15 minutes, Icahn lays out his concerns about many of the issues we’ve been warning about for years and while none of what he says will come as a surprise (especially to those who frequent these pages), the video, called “Danger Ahead”, is probably worth your time as it does a fairly good job of summarizing how the various risk factors work to reinforce one another on the way to setting the stage for a meltdown. Here’s a list of Icahn’s concerns:
- Low rates and asset bubbles: Fed policy in the wake of the dot com collapse helped fuel the housing bubble and given what we know about how monetary policy is affecting the financial cycle (i.e. creating larger and larger booms and busts) we might fairly say that the Fed has become the bubble blower extraordinaire. See the price tag attached to Picasso’s Women of Algiers (Version O) for proof of this.
- Herding behavior: The quest for yield is pushing investors into risk in a frantic hunt for yield in an environment where risk free assets yield at best an inflation adjusted zero and at worst have a negative carrying cost.
- Financial engineering: Icahn is supposedly concerned about the myopia displayed by corporate management teams who are of course issuing massive amounts of debt to fund EPS-inflating buybacks as well as M&A. We have of course been warning about debt fueled buybacks all year and make no mistake, there’s something a bit ironic about Carl Icahn criticizing companies for short-term thinking and buybacks as he hasn’t exactly been quiet about his opinion with regard to Apple’s buyback program (he does add that healthy companies with lots of cash should repurchases shares).
- Fake earnings: Companies are being deceptive about their bottom lines.
- Ineffective leadership: Congress has demonstrated a remarkable inability to do what it was elected to do (i.e. legislate). To fix this we need someone in The White House who can help break intractable legislative stalemates.
- Corporate taxes are too high: Inversions are costing the US jobs.
Ultimately what Icahn has done is put the pieces together for anyone who might have been struggling to understand how it all fits together and how the multiple dynamics at play serve to feed off one another to pyramid risk on top of risk. Put differently: one more very “serious” person is now shouting about any and all of the things Zero Hedge readers have been keenly aware of for years.
* * *
Finally, here is Bill Gross also chiming in:
Gross: HY Fund closes exit doors. Who will get in if you can’t get out? Risk off.
— Janus Capital (@JanusCapital) December 11, 2015
HSBC Forecasting 1.50% US 10-year Bond Yield In 2016

Steven Major
HSBC’s Steven Major is out with a bold new forecast.
In a client note on Thursday titled “Yanking down the yields,” the interest-rates strategist projected that bond yields would be much lower than the markets expected because central banks including the Federal Reserve were reluctant to raise interest rates.
Major sees the benchmark US 10-year yield, now at 2.05%, averaging 2.10% in the fourth quarter, but then tumbling to 1.5% by the third quarter of 2016. He also lowered projections for European bond yields.
According to Bloomberg, the median strategist’s forecast is for the 10-year yield to rally to 2.9% by Q3 2016 and 3.0% by Q4 2016. Of 65 published forecasts, Major’s 1.5% call is the only one below 1.65%.
He wrote:
Much of the shift lower in our yield forecasts derives from the view that the ECB [European Central Bank] will continue to buy bonds in its QE [Quantitative Easing] program. The forecast for a ‘bowing-in’ of curves reflects our opinion that a long period of unconventional policy will create an unconventional outcome. Central banks did not forecast the persistently weak growth or recent decline in inflation. So data dependency does not easily justify lifting rates from the zero-bound — it might suggest the opposite.
In September, the Federal Reserve passed on what would have been its first interest-rate hike in nine years, as concerns about the labor market and global weakness weighed on voting members’ minds. Also last month, European Central Bank president Mario Draghi said the ECB would expand its stimulus program if needed.
For years, pros across Wall Street have argued that interest rates have nowhere to go but up. Major was one of the few forecasters to correctly predict that in 2014 bond yields would fall and end the year lower. Others had predicted that yields would rise as the Fed wound down its massive bond-buying program known as quantitative easing.
 St. Louis Fed, Business Insider
“The conventional view has been that a normalization of monetary policy would be led by the Federal Reserve, involve a rise in short rates and a flatter curve,” Major wrote. “This has already been proven completely wrong.”
Once again, Major is going against the grain to say yields will fall even further, though the Fed has maintained that it could raise short-term interest rates this year.
Major is in the small minority, with others including Komal Sri-Kumar, president of Sri-Kumar Global Strategies, who wrote on Business Insider earlier this week that the 10-year yield would slide below 2% to 1.5%.
Also, DoubleLine Capital’s Jeff Gundlach forecast in June that bond yields would end 2015 near where they started the year. Gundlach also noted in his presentation that yields had risen in previous periods in which the Fed raised rates.
The 10-year yield was at 2.17% at the beginning of January. On Thursday, it was near 2.05%.
Typically, higher interest rates make existing bonds less attractive to buyers, since they can get new notes at loftier yields. And as demand for these bonds falls, their prices also fall, and yields rise.
This chart shows Major’s forecasts versus the consensus:

Why Insider Trading Should Be Legal
 TIVOLI, New York — It’s hot here in the Hudson River Valley.
People are taking it easy, sitting on benches in the shade. We had to put in a window air conditioner to take some of the heat out. Still, we sweat … and we wait for the cool of the evening.
The markets are lackluster, too. A little up, a little down. Languid. Summertime slow.
Counterfeit information
We have been focusing on technology — sometimes directly, often obliquely.
It is the subject of our next monthly issue of The Bill Bonner Letter, requiring us to do some homework with the help of our resident tech expert, Jeff Brown.
But today, let’s look at how the stock market reacts to new technology.
Investors are supposed to look ahead. They are expected to dole out the future earnings of technology stocks and figure out their present value.
Not that they know immediately and to the penny what Twitter or Tesla should be worth, but markets are always discovering prices, based on public information flowing to investors.
The problem is the feds have distorted, twisted, and outright counterfeited this information. They falsified it for the benefit of the people it’s supposed to be protecting us against: the insiders.
The entire edifice of federal regulation and policing is a scam — at least when it comes to the stock market.
First the feds claimed to be creating a “level playing field” by prohibiting “insider trading.”
If you had privileged information — say, as the accountant for a Fortune 500 company, or the lawyer for an upcoming merger — you were supposed to play dead.
“Front-running” — buying or selling in advance of the public release of information — is against the law. And in 1934, Congress set up a special bureaucracy, the Securities Exchange Commission — to enforce it.
Tilting the playing field
But the SEC never leveled the playing field. Instead, it tilted it even more in the insiders’ favor.
Those who knew something were not supposed to take advantage of it, so this information became even more valuable.
That is why so many investors turned to “private equity.” Insiders at private companies — held close to the vest by the investment firms that owned them — could trade on all the inside information they wanted.
The law prohibits insiders from manipulating a publicly traded stock for their benefit.
But there’s an odd exemption for the people who control a public company. General Motors announces a share buyback plan, for example. It will spend $5 billion to buy back its shares in the open market and then cancel them. This raises the earnings per share of the outstanding shares, making them more valuable as a result.
Why would an automaker — recently back from the dead, thanks to a handout from the feds — take its precious capital and give it to management (in the form of more valuable stock options) and shareholders (in the form of higher stock prices)?
There you have your answer: GE execs and their insider shareholders (mostly hedge funds) joined forces to manipulate the stock upward and give themselves a big payday.
Reports the Harvard Business Review:

‘A little coup de whiskey’
Here at the Diary, we disagree …
The feds should not ban share buybacks. Instead, insider trading should be legal for everyone.
And the feds shouldn’t bail out the insiders, either. The government bailed out GM to the tune of $50 billion in return for a 61% equity stake in the company.

But at the end of 2013, Washington was able to sell off the last of its GM shares … for “just” an $11 billion loss.
How?
The Fed fiddled with stock market prices … by pushing down the so-called “risk-free” rate on bonds. A lower rate means less opportunity cost for stock market investors.
Just look at the valuations of today’s tech companies. They’re over the top, much like they were at the peak of the dot-com bubble in 2000. They are driven to extraordinary levels not by a prudent calculation of anticipated earnings but by the Fed’s EZ money regime.
This conclusion, by the way, was buttressed by our look at the automakers of 100 years ago.
Now, there was a game-changing industry!
It was so promising and so crowded with new entrants that you could barely walk down Shelby Street in Detroit without getting run over by an automobile you’d never heard of.
Most of those companies went broke within a few years. A few, however, prospered.
GM’s share price barely budged between 1915 and 1925 — when the company was one of the greatest success stories of the greatest new tech industry the world had ever seen.
But then, in 1927, the influential New York Fed President Benjamin Strong gave the market “a little coup de whiskey.”
The Fed not only bought $445 million of government bonds, resulting in the biggest increase in bank reserves the US had ever seen, but it also cut its key lending rate from 4% to 3.5%.
After that, it was off to the races! GM shares rose 2,200%.
In other words, the prices of “tech” stocks were manipulated then, as now, by the feds.
Cheap credit — not an honest calculation of anticipated earnings — is what sent GM soaring in the late 1920s.
And it is why our billion-dollar tech babies are flying so high today.
