‘The time has come to pick your poison or become unwitting collateral damage’

Everywhere you turn, the biggest players in the $23.7 trillion US Treasuries market are in retreat.
Sometimes the only thing you can do is shine a light.
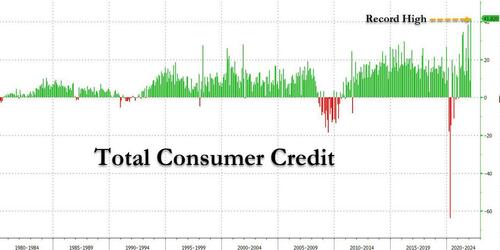
While it is traditionally viewed as a B-grade indicator, the February consumer credit report from the Federal Reserve was an absolute stunner and confirmed what we have been saying for month: any excess savings accumulated by the US middle class are long gone, and in their place Americans have unleashed a credit-card fueled spending spree.
Here are the shocking numbers: in November, consumer credit exploded by a whopping $41.8 billion, more than double the expected $18.1 billion print, nearly five times more than the upward revised $8.9 billion January number (revised from $6.8 billion), the highest on record!
Household debt surged by more than $600 billion in 2019, marking the biggest annual increase since just before the financial crisis, according to the New York Federal Reserve.

Total household debt balances rose by $601 billion last year, topping $14 trillion for the first time, according to a new report by the Fed branch. The last time the growth was that large was 2007, when household debt rose by just over $1 trillion.
Fed economists said on the Liberty Street Economics blog that the growth was driven mainly by a large increase in mortgage debt balances, which increased $433 billion and was also the largest gain since 2007.
Housing debt now accounts for $9.95 billion of the total balance. Balances for auto loans and credit cards both increased by $57 billion for the year, according to the Fed.
The economists said in the blog post that credit cards have again surpassed student loans as the most common form of initial credit history among young borrowers, following several years after the crisis when student loans were higher.
“The data also show that transitions into delinquency among credit card borrowers have steadily risen since 2016, notably among younger borrowers,” Wilbert Van Der Klaauw, senior vice president at the New York Fed, said in a statement.
However, even as the total amount of household debt has risen, the level of household debt service as a percentage of disposable personal income is at all-time lows going back to 1980.
The new report showed that credit standards tightening for some forms of debt even as the overall balance increased. The median credit score for newly originating borrowers for mortgages and auto loans increased slightly in the fourth quarter, according to the Fed.
Mortgage originations were $752 billion in the fourth quarter, the highest quarterly increase since 2005, but this was mostly due to an increase refinancing activity, the Fed said in a press release.
Zerohedge readers who follow our monthly consumer credit updates already knew, aggregate household debt balances jumped in 4Q18. As of late December, total household indebtedness was at a staggering $13.54 trillion, $32 billion higher than 3Q18.

More troubling is that 37 million Americans had a 90-day delinquent strike added to their credit report last quarter, an increase of two million from the fourth quarter of 2017. These 37 million delinquent accounts held roughly $68 billion in debt, or roughly the market cap of BlackRock, Inc.
* * *
New evidence this week points to a further deterioration in consumer creditworthiness.
To understand the American credit card debt crisis, real estate data company Clever surveyed 1,000 credit card users earlier this month.
Using Consumer Financial Protection credit card complaint data and other forms of consumer metrics, the company was able to gain tremendous insight into the average American’s purchasing habits, dependence on credit cards, and feelings about their debt situation.
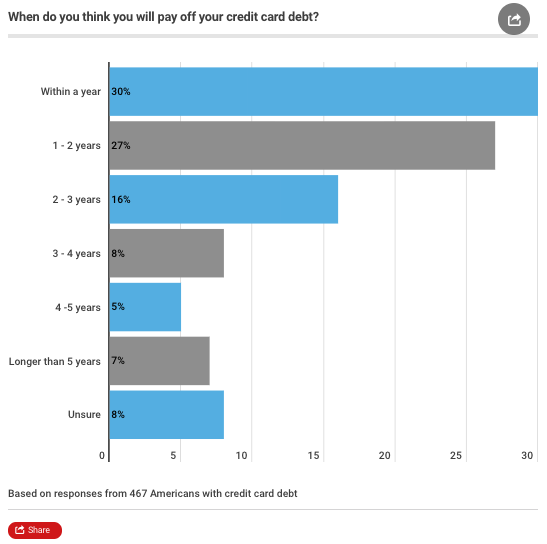
The survey found that 47% of Americans have a monthly balance on their credit card. About 30% of respondents with credit card debt believe they’ll extinguish the debt this year, leading many of the respondents stuck in an endless debt cycle.
Fifty-six percent of the respondents say they’ve had credit card debt for more than a year. About 20% estimate their debt will be paid off by 2022, while 8% were unsure about a timeline.
“It’s a big issue,” Ted Rossman, credit industry expert for CreditCards.com, tells CNBC. With credit card APR soaring to about 17.64%, a new high, the interest accrued on monthly balances can quickly add up and trap unsuspecting consumers with insurmountable debt.
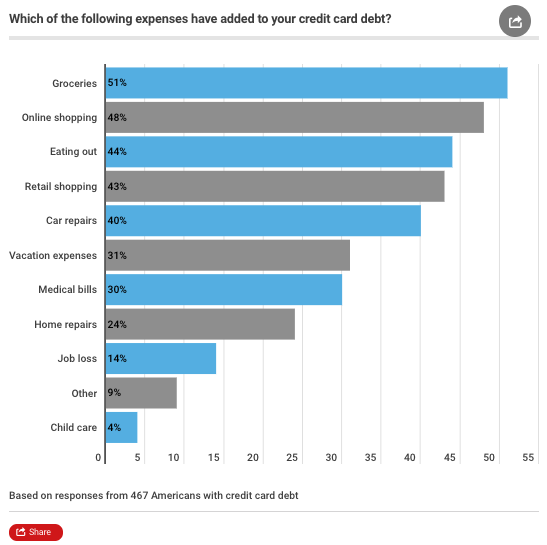
The U.S. recovery has been the slowest since WWII. Consumers have been stuck in the gig-economy with low wage and skill jobs. Their wages have not been able to outpace rapid inflation in groceries and rent. So many have resorted to credit cards to supplement their daily expenses. This is especially prevalent with lower-income families, defined here as those earning less than $50,000 a year. Buying groceries” ranked as the top expense that racked up people’s balances, the survey said.
About 28% of respondents say they’re fully dependent on credit cards to pay rent and utilities.
Emergency expenses were also a major contributor to credit card balances. About 30% cite medical bills and 40% say automobile repairs have moved their balances higher.
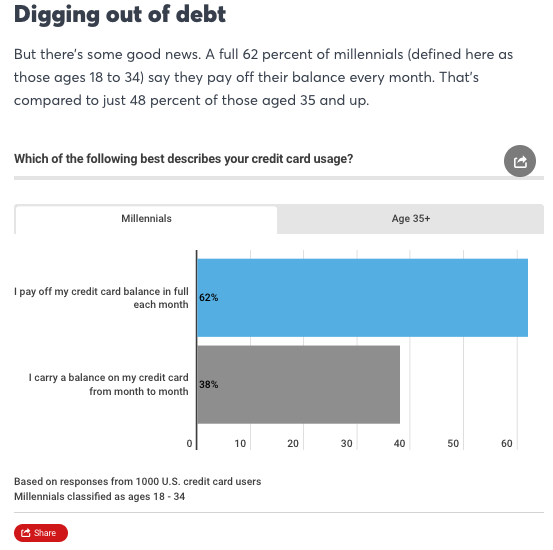
Surprisingly, there is some good news. Sixty-two percent of millennials indicate they pay their balance every month. That’s compared to just 48% of Generation X and Baby Boomers.
Credit cards are an integral part of developing credit and proving creditworthiness. Multiple reports show the consumer is on the cusp of a dangerous deleveraging, an ominous sign that the credit cycle has likely turned. Winter is here.
When compared to a similar point in time, Millennials are deeper in debt than any other generation that has come before them. And the biggest reason why they are in so much debt may surprise you.

We’ll get to that in a minute, but first let’s talk about the giant mountain of debt that Millennials have accumulated. According to the New York Fed, the total amount of debt that Millennials are carrying has risen by a whopping 22 percent in just the last five years…
New findings from the New York Federal Reserve reveal that millennials have now racked up over US$1 trillion of debt.
This troubling amount of debt, an increase of over 22% in just five years, is more than any other generation in history. This situation may leave you wondering how millennials ended up in such a sorry state.
Many young adults are absolutely drowning in debt, but the composition of that debt is quite different when compared to previous generations at a similar point in time.
Mortgage debt and credit card debt levels are far lower for Millennials, but the level of student loan debt is far, far higher…
While the debt levels accumulated by millennials eclipse those of the previous generation, Generation X, at a similar point in time, the complexion of the debt is very different.
According to a 2018 report from the St. Louis Federal Reserve Bank, mortgage debt is about 15% lower for millennials and credit card debt among millennials was about two-thirds that of Gen X.
However, student loan debt was over 300% greater.
Over the last 10 years, the total amount of student loan debt in the United States has more than doubled.
It is an absolutely enormous financial problem, and there doesn’t seem to be an easy solution. Some politicians on the left are pledging to make college education “free” in the United States, but they never seem to explain who is going to pay for that.
But what everyone can agree on is that student loan debt levels are wildly out of control. The following statistics come from Forbes…
The latest student loan debt statistics for 2019 show how serious the student loan debt crisis has become for borrowers across all demographics and age groups. There are more than 44 million borrowers who collectively owe $1.5 trillion in student loan debt in the U.S. alone. Student loan debt is now the second highest consumer debt category – behind only mortgage debt – and higher than both credit cards and auto loans. Borrowers in the Class of 2017, on average, owe $28,650, according to the Institute for College Access and Success.
What makes all of this even more depressing is the fact that the quality of “higher education” in the U.S. has gone down the toilet in recent years. For much more on this, please see my recent article entitled “50 Actual College Course Titles That Prove That America’s Universities Are Training Our College Students To Be Socialists”.
Our colleges and universities are not adequately preparing our young people for their future careers, but they are burdening them with gigantic financial obligations that will haunt many of them for decades to come.
We have a deeply broken system, and we desperately need a complete and total overhaul of our system of higher education.
Due to the fact that so many of them are swamped by student loan debt, the homeownership rate for Millennials is much, much lower than the homeownership rate for the generations that immediately preceded them. The following comes from CNBC…
The homeownership rate for those under 35 was just 36.5 percent in the last quarter of 2018, compared with 61 percent for those aged 35 to 44, and 70 percent for those aged 45 to 54, according to the U.S. Census. The millennial homeownership rate actually dropped in the fourth quarter compared with the third quarter, but was unchanged year over year.
This is one of the big reasons why “Housing Bubble 2” is beginning to burst. There are not enough Millennials buying homes, and it looks like things could be even worse for Generation Z.
If you are a young adult, I would encourage you to limit your exposure to student loan debt as much as possible, because the debt that you accumulate while in school can have very serious long-term implications that you may not even be considering right now.
Total household debt hit a new record high, rising by $219 billion (1.6%) to $13.512 trillion in Q3 of 2018, according to the NY Fed’s latest household debt report, the biggest jump since 2016. It was also the 17th consecutive quarter with an increase in household debt, and the total is now $837 billion higher than the previous peak of $12.68 trillion, from the third quarter of 2008. Overall household debt is now 21.2% above the post-financial-crisis trough reached during the second quarter of 2013.
Mortgage balances—the largest component of household debt—rose by $141 billion during the third quarter, to $9.14 trillion. Credit card debt rose by $15 billion to $844 billion; auto loan debt increased by $27 billion in the quarter to $1.265 trillion and student loan debt hit a record high of $1.442 trillion, an increase of $37 billion in Q3.

Balances on home equity lines of credit (HELOC) continued their downward trend, declining by $4 billion, to $432 billion. The median credit score of newly originating mortgage borrowers was roughly unchanged, at 760.

Mortgage originations edged up to $445 billion in the second quarter, from $437 billion in the second quarter. Meanwhile, mortgage delinquencies were unchanged improve, with 1.1% of mortgage balances 90 or more days delinquent in the third quarter, same as the second quarter.
Most newly originated mortgages continued went to borrowers with the highest credit scores, with 58% of new mortgages borrowed by consumers with a 760 credit score or higher.

The median credit score of newly originating borrowers was mostly unchanged; the median credit score among newly originating mortgage borrowers was 758, suggesting that with half of all mortgages going to individuals with high credit scores, mortgages remain tight by historical standards. For auto loan originators, the distribution was flat, and individuals with subprime scores received a substantial share of newly originated auto loans.
In what will come as a surprise to nobody, outstanding student loans rose $37BN to a new all time high of $1.44 trillion as of Sept 30. It should also come as no surprise – or maybe it will to the Fed – that student loan delinquencies remain stubbornly above 10%, a level they hit 6 years ago and have failed to move in either direction since…

… while flows of student debt into serious delinquency – of 90 or more days – spiked in Q3, rising to 9.1% in the third quarter from 8.6% in the previous quarter, according to data from the Federal Reserve Bank of New York.

The third quarter marked an unexpected reversal after a period of improvement for student debt, which totaled $1.4 trillion. Such delinquency flows have been rising on auto debt since 2012 and on credit card debt since last year, which has raised a red flag for economists.
Auto loan balances also hit an all time high, as they continued their six-year upward trend, increasing by $9 billion in the quarter, to $1.24 trillion. Meanwhile, credit card balances rose by $14 billion, or 1.7%, after a seasonal decline in the first quarter, to $829 billion.
Despite rising interest rates, credit card delinquency rates eased slightly, with 7.9% of balances 90 or more days delinquent as of June 30, versus 8.0% at March 31. The share of consumers with an account in collections fell 23.4% between the third quarter of 2017 and the second quarter of 2018, from 12.3% to 9.4%, due to changes in reporting requirements of collections agencies.
Auto loan balances also hit an all time high, as they continued their six-year upward trend, increasing by $27 billion in the quarter, to $1.265 trillion. Meanwhile, credit card balances rose by $15 billion to $844 billion. In line with rising interest rates, credit card delinquency rates rose modestly, with 4.9% of balances 90 or more days delinquent as of Sept 30, versus 4.8% in Q2.
Overall, as of September 30, 4.7% of outstanding debt was in some stage of delinquency, an uptick from 4.5% in the second quarter and the largest in 7 years. Of the $638 billion of debt that is delinquent, $415 billion is seriously delinquent (at least 90 days late or “severely derogatory”). This increase was primarily due to the abovementioned increase in the flow into delinquency for student loan balances during the third quarter of 2018. The flow into 90+ day delinquency for credit card balances has been rising for the last year and remained elevated since then compared to its recent history, while the flow into 90+ day delinquency for auto loan balances has been slowly trending upward since 2012. About 215,000 consumers had a bankruptcy notation added to their credit reports in 2018Q3, slightly higher than in the same quarter of last year. New bankruptcy notations have been at historically low levels since 2016.
This quarter, for the first time, the Fed also broke down consumer debt by age group, and found that debt balances remain more concentrated among older borrowers. The shift over the past decade is due to at least three major forces. First, demographics have changed with large cohorts of baby boomers entering into retirement. Second, demand for credit has shifted, along with changing preferences and borrowing needs following the Great Recession. Finally, the supply of credit has changed: mortgage lending has been tight, while auto loans and credit cards have been more widely available.

In addition to an overall increase in the share of debt held by older borrowers, there has been a noticeable shift in the composition of debt held by different age groups. Student and auto loan debt represent the majority of debt for borrowers under thirty, while housing-related debt makes up the vast majority of debt owned by borrowers over sixty.

Confirming what many know, namely that Millennial borrowers are screwed, the Ny Fed writes that older borrowers have longer credit histories with more borrowing experience, as well as higher and typically steadier incomes; “thus, they often have higher credit scores and are safer bets for lenders.” Tighter mortgage underwriting during the years following the Great Recession has limited mortgage borrowing by younger and less creditworthy borrowers; meanwhile, student loan balances – and as most know “student” loans are usually used for anything but tuition – and participation rose dramatically and credit standards loosened for auto loans and credit cards. Consequently, there has been a relative shift toward non-housing balances among younger borrowers, while housing balances moved to the older and more creditworthy borrowers with lower delinquency rates and better performance overall.
And since this is a circular Catch 22, absent an overhaul of how credit is apportioned by age group, Millennials and other young borrowers will keep getting squeezed out of the credit market resulting in a decline in loan demand – and supply – which is slow at first and then very fast.
US debt continues to climbs along with interest rates. The interest paid to private banks and others on US Treasury debt has hit $523 BILLIION … and rising.
Meanwhile, in China bondholders are being paid in ham instead of cash. Or perhaps bacon. Ron Swanson would approve!
Ten years after the Lehman bankruptcy, the financial elite is obsessed with what will send the world spiraling into the next financial crisis. And with household debt relatively tame by historical standards (excluding student loans, which however will likely be forgiven at some point in the future), mortgage debt nowhere near the relative levels of 2007, the most likely catalyst to emerge is corporate debt. Indeed, in a NYT op-ed penned by Morgan Stanley’s, Ruchir Sharma, the bank’s chief global strategist made the claim that “when the American markets start feeling it, the results are likely be very different from 2008 — corporate meltdowns rather than mortgage defaults, and bond and pension funds affected before big investment banks.“
But what would be the trigger for said corporate meltdown?
According to a new report from Goldman Sachs, the most likely precipitating factor would be rising interest rates which after the next major round of debt rollovers over the next several years in an environment of rising rates would push corporate cash flows low enough that debt can no longer be serviced effectively.
* * *
While low rates in the past decade have been a boon to capital markets, pushing yield-starved investors into stocks, a dangerous side-effect of this decade of rate repression has been companies eagerly taking advantage of low rates to more than double their debt levels since 2007. And, like many homeowners, companies have also been able to take advantage of lower borrowing rates to drive their average interest costs lower each year this cycle…. until now.
According to Goldman, based on the company’s forecasts, 2018 is likely to be the first year that the average interest expense is expected to tick higher, even if modestly.
There is one major consequence of this transition: interest expenses will flip from a tailwind for EPS growth to a headwind on a go-forward basis and in some cases will create a risk to guidance. As shown in the chart below, in aggregate, total interest has increased over the course of this cycle, though it has largely lagged the overall increase in debt levels.

The silver lining of the debt bubble created by central banks since the global financial crisis, is that along with refinancing at lower rates, companies have been able to generally extend maturities in recent years at attractive rates given investors search for yield as well as a gradual flattening of the yield curve.
According to Goldman’s calculations, the average maturity of new issuance in recent years has averaged between 15-17 years, up from 11-13 years earlier this cycle and <10 years for most of the late 1990’s and early 2000’s.
And while this has pushed back the day when rates catch up to the overall increase in debt, as is typically the case, there is nonetheless a substantial amount of debt coming due over the next few years: according to the bank’s estimates there is over $1.3 trillion of debt for our non-financials coverage maturing through 2020, roughly 20% of the total debt outstanding.

What is different now – as rates are finally rising – is that as this debt comes due, it is unlikely that companies will be able to roll to lower rates than they are currently paying. A second source of upward pressure on average interest expense is the recent surge in leverage loan issuance, i.e., those companies with floating rate debt (just 9% in aggregate for large caps, but a much larger percent for small-caps). The Fed Funds Futures curve currently implies four more rate hikes (~100 bp) through year-end 2019 (our economists are looking for 2 more than that, for a total of six through year-end 2019). While it is possible that some companies have hedges in place, there is still a substantial amount of outstanding bank loans directly tied to LIBOR which will result in a far faster “flow through” of interest expense catching up to the income statement.
While rising rates has already become a theme in several sectors such as Utilities and Real Estate, Goldman warns that this has the potential to be more widespread:
We saw evidence of this during the 2Q earnings season, where a number of companies cited higher interest expense as a headwind to reported earnings and/or guidance. Some examples:
What does that mean for the bigger picture?
While many cash-rich companies have a remedy to rising rates, namely paying down debt as it matures, this is unlikely to be a recourse for the majority of corporations. The good news is that today, corporate America looks extremely healthy against a solid US economic backdrop. Revenue growth is running above trend, and EPS and cash flow growth are even stronger, boosted by Tax Reform.
And while Goldman economists assign a low likelihood that this will change anytime soon, there has been a sharp pickup in the “Recession 2020” narrative as of late. Specifically, along with the growth of the fiscal deficit which will see US debt increase by over $1 trillion next year, the fact that debt growth has outpaced EBITDA growth this cycle has implications for investors if and when the cycle turns.
Which brings us round circle to the potential catalyst of the next crisis: record debt levels.
According to Goldman’s calculations, Net Debt/EBITDA for its coverage universe as a whole remains near the highest levels this cycle, if not all time high. And while the bank cannot pinpoint exactly when the cycle will turn, it is easy to claim that US companies are “over-earning” relative to their cycle average today, a key points as the Fed continues “normalizing” its balance sheet. Indeed, this leverage picture looks even more stretched when viewed through a “normalized EBITDA” lens (which Goldman defines as the median LTM 2007 Q1-2018 Q2).

There are two main factors that have driven this increase: net debt has increased while cash levels have declined:
Meanwhile, and touching on another prominent topic in recent months in which many on Wall Street have highlighted the deterioration in the investment grade space, i.e., the universe of “near fallen angels”, or companies that could be downgraded from BBB to junk, Goldman writes that credit metrics for low-grade IG and HY have been moving lower. If the cycle turns, the cost of debt could increase, with convexity suggesting that this turn could happen fast.
Picking up on several pieces we have written on the topic (most recently “Fallen Angel” Alert: Is Ford’s Downgrade The “Spark” That Crashes The Bond Market“), Goldman specifically highlights the potential high yield supply risk that could unfold.
Here are the numbers: currently there are $2tn of non-financial bonds rated BBB, the lowest rating across the investment grade scale. The amount has increased to 58% of the non-financial IG market over the last several years and is currently at its highest level in the last 10 years.
And for those wondering what could prompt the junk bond market to finally break – and Ford’s recently downgrade is precisely such a harbinger – Goldman’s credit strategists warn that this is important “because a turn in the cycle could result in these bonds being downgraded to high yield.”
From a market standpoint, too many bonds falling to the high yield market would create excess supply and potentially pressure prices. Looking back to prior cycles, approximately 5% to 15% of the BBB rated bonds were downgraded to high yield. If we assume the same percentages are applied to a theoretical down-cycle today, a staggering $100-300bn of debt could be at risk of falling to the high yield market in a cycle correction, an outcome that would choke the bond market and shock market participants. It is also the reason why Bank of America recently warned that the ECB can not afford a recession, as the resulting avalanche of “fallen angels” would crush the high yield bond market, sending shockwaves across the entire fixed income space.
And while such a reversal is not a near-term risk given solid sales/earnings growth and low recession risk, “it is potentially problematic given the current size of the high yield market is only $1.2tn.”
Should the market indeed turn, prices would need to adjust – i.e. drop sharply – in order to generate the level of demand that would require a potential 25% increase in the size of the high yield market – especially at a time when risk appetite could be low.

Careful not to scare its clients too much, Goldman concedes that an imminent risk of a wave of credit rating downgrades is low, but warns that “the market could potentially be overlooking the underlying cost of capital/financial risks (high leverage, low coverage) for certain issuers based on their current access to market.“
* * *
As for the worst case scenario, it should be self-explanatory: a sharp slowdown in the economy, coupled with a major repricing of bond market risk could result in a crash in the bond market, which together with the stock market has been the biggest beneficiary of the Fed’s unorthodox monetary policies. Furthermore, should companies suddenly find themselves unable to refinance debt, or – worse – rollover debt maturities, would lead to a wave of corporate defaults that starts at the lowest level of the capital structure and moves its way up, impacting such supposedly “safe” instrument as leveraged loans which in recent months have seen an explosion in issuance due to investor demand for higher yields.
To be sure, this transition will not happen overnight, but it will happen eventually and it will start with the riskiest companies.
To that end, Goldman has created a watch list for those companies that are most at risk: the ones with a credit rating of BBB or lower that are paying low average interest rates (less than 5%), have limited interest coverage (EBIT/Interest of <5x) and high leverage (Net Debt/EBITDA>2.5x) based on 2019 estimates; the screen is also limited to companies where Net Debt is a substantial portion of Enterprise value (30% or higher). The screen is hardly exhaustive and Goldman admits that “there are much more highly levered companies out there that could be more exposed to a turn in the cycle.” However, the bank focuses on this subset given the low current interest cost relative to the risk-free rate, “suggesting investors could be complacent around their financing costs.”
In other words, investors who are exposed to debt in the following names may want to reasses if holding such risk is prudent in a time when, for the first time in a decade, the average interest expense is expected to tick higher.


In a further signal of the weakening US economy, borrowing amongst US consumers continue to grow which correspondingly sees the total outstanding debt rise to new highs. In addition, and we have discussed this in some detail in our subscription podcasts, there has been a rise also in the delinquency rates across multiple sectors, including auto loans, credit cards and mortgages.
US Household debt now stands at around $13tn, rising around 4.5% in the last 12 months, fueled in part, by credit card debt and also the auto loan sector. Such unsustainable debt is further compounded by stagnant wage growth, zero contract hour jobs, poorly paid service sector employment and the increasing move towards part-time employment opportunities.
This is all the more reason why talk of the Fed raising interest rates is farcical because not only will stagnant wage growth and rising household debt, seriously impact consumer spending, but rising interest rates will further impact economic growth and cause further rises in delinquency rates. This is precisely why interest rates are raised to dampen what might be termed an overheating economy, something we most certainly could not attribute to the current US economy.
There is no doubt that stagnant wage growth is impacting consumer spending but it is also likely to lead to a greater demand for credit which in turn exacerbates the debt and delinquency cycle further. There is no doubt that US household debt will continue to rise and if the Fed was to ever seriously consider raising interest rates it is going to seriously impact those trying to service debt in a stagnant wage growth environment. Delinquency rates continue to rise with e.g. credit card debt delinquencies rising 7.5% year-on-year, and mortgage debt rising 4% year-on-year.

This is a clear example of why QE and ZIRP has been deeply damaging to the US economy. Relatively low-cost borrowing has encouraged this level of indebtedness, coupled with questionable practices concerning the refinancing of existing and delinquent loans.
Given that a service based economy and consumer spending is responsible for nearly three-quarters of the total US GDP, coupled with rising delinquency rates, it is quite clear that this debt cycle is unsustainable and the current $13tn bubble is going to burst, at some point, with disastrous consequences for the US economy.
To put this in further context, total US consumer debt is now 15% higher than it was during the economic crisis of 2008. When we factor in rising costs coupled with stagnant wage growth it will become increasingly difficult for US consumers to met their minimum monthly payment obligations, never mind begin to lower their debt levels.
The sad irony is that the primary economic driver in the US economy, namely consumer spending, coupled with the insane long-term QE/ZIRP policy means that in order for the US economic to avoid implosion, consumers must continue to feed the frenzy at whatever personal cost to themselves, which will ultimately contribute to the economic implosion.

If we accept that our financial system is nothing but a wealth-transfer mechanism from the productive elements of our economy to parasitic, neofeudal rentier-cartels and self-serving state fiefdoms, that raises a question: what do we do about it?
The typical answer seems to be: deny it, ignore it, get distracted by carefully choreographed culture wars or shrug fatalistically and put one’s shoulder to the debt-serf grindstone.
There is another response, one that very few pursue: fanatic frugality in service of financial-political independence. Debt-serfs and dependents of the state have no effective political power, as noted yesterday in It Isn’t What You Earn and Owe, It’s What You Own That Generates Income.


As Aristotle observed, “We are what we do every day.” That is the core of fanatic frugality and the capital-accumulation mindset.
For your amusement: a few photos of everyday fanatic frugality (and dumpster-diving).


The only leverage available to all is extreme frugality in service of accumulating savings that can be productively invested in building human, social and financial capital.
Debt is serfdom, capital in all its forms is freedom. Waste nothing, build some form of capital every day, seek opportunity rather than distraction.
Debt = Serfdom (April 2, 2013)
How Frugal Are You? (August 7, 2010)
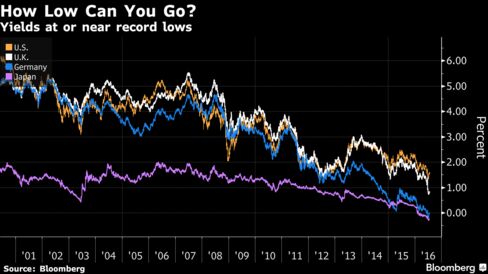
Negative yields. Political risk. The Fed. Now add the U.S. deficit to the list of worries to keep beleaguered bond investors up at night.
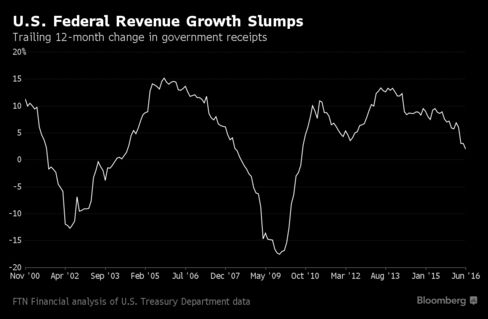
Since peaking at $1.4 trillion in 2009, the budget deficit has plunged amid government spending cuts and a rebound in tax receipts. But now, America’s borrowing needs are rising once again as a lackluster economy slows revenue growth to a six-year low, data compiled by FTN Financial show. That in turn will pressure the U.S. to sell more Treasuries to bridge the funding gap.
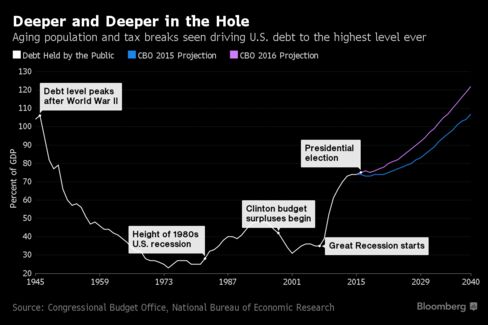
No one predicts an immediate jump in issuance, or a surge in bond yields. But just about everyone agrees that without drastic changes to America’s finances, the government will have to ramp up its borrowing in a big way in the years to come. After a $96 billion increase in the deficit this fiscal year, the U.S. will go deeper and deeper into the red to pay for Social Security and Medicare, projections from the Congressional Budget Office show. The public debt burden could swell by almost $10 trillion in the coming decade as a result.
All the extra supply may ultimately push up Treasury yields and expose holders to losses. And it may come when the Federal Reserve starts to unwind its own holdings — the biggest source of demand since the financial crisis.
“It’s looking like we are at the end of the line,” when it comes to declining issuance of debt that matures in more than a year, said Michael Cloherty, head of U.S. interest-rate strategy at RBC Capital Markets, one of 23 dealers that bid at Treasury debt auctions. “We have deficits that are going to run higher, and at some point, a Fed that will start allowing its Treasury securities to mature.”
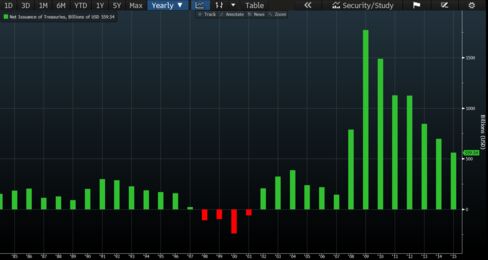
After the U.S. borrowed heavily in the wake of the financial crisis to bail out the banks and revive the economy, net issuance of Treasuries has steadily declined as budget shortfalls narrowed. In the year that ended September, the government sold $560 billion of Treasuries on a net basis, the least since 2007, data compiled by Bloomberg show.
Coupled with increased buying from the Fed, foreign central banks and investors seeking low-risk assets, yields on Treasuries have tumbled even as the overall size of the market ballooned to $13.4 trillion. For the 10-year note, yields hit a record 1.318 percent this month. They were 1.57 percent today. Before the crisis erupted, investors demanded more than 4 percent.
One reason the U.S. may ultimately have to boost borrowing is paltry revenue growth, said Jim Vogel, FTN’s head of interest-rate strategy.
With the economy forecast to grow only about 2 percent a year for the foreseeable future as Americans save more and spend less, there just won’t enough tax revenue to cover the burgeoning costs of programs for the elderly and poor. Those funding issues will ultimately supersede worries about Fed policy, regardless of who ends up in the White House come January.
As a percentage of the gross domestic product, revenue will remain flat in the coming decade as spending rises, CBO forecasts show. That will increase the deficit from 2.9 percent this fiscal year to almost 5 percent by 2026.
“As the Fed recedes a little bit into the background, all of these other questions need to start coming back into the foreground,” Vogel said.
The potential for a glut in Treasuries is emerging as some measures show buyers aren’t giving themselves any margin of safety. A valuation tool called the term premium stands at minus 0.56 percentage point for 10-year notes. As the name implies, the term premium should normally be positive and has been for almost all of the past 50 years. But in 2016, it’s turned into a discount.
Some of the highest-profile players are already sounding the alarm. Jeffrey Gundlach, who oversees more than $100 billion at DoubleLine Capital, warned of a “mass psychosis” among investors piling into debt securities with ultra-low yields. Bill Gross of Janus Capital Group Inc. compared the sky-high prices in the global bond market to a “supernova that will explode one day.”
Despite the increase in supply, things like the gloomy outlook for global growth, an aging U.S. society and more than $9 trillion of negative-yielding bonds will conspire to keep Treasuries in demand, says Jeffrey Rosenberg, BlackRock Inc.’s chief investment strategist for fixed income.
What’s more, the Treasury is likely to fund much of the deficit in the immediate future by boosting sales of T-bills, which mature in a year or less, rather than longer-term debt like notes or bonds.
“We don’t have any other choice — if we’re going to increase the budget deficits, they have to be funded” with more debt, Rosenberg said. But, “in today’s environment, you’re seeing the potential for higher supply in an environment that is profoundly lacking supply of risk-free assets.”
Deutsche Bank AG also says the long-term fiscal outlook hinges more on who controls Congress. And if the Republicans, who hold both the House and Senate, retain control in November, it’s more likely future deficits will come in lower than forecast, based on the firm’s historical analysis.
FED HOLDINGS OF TREASURIES COMING DUE
2016 ────────────── $216 BILLION
2017 ────────────── $197 BILLION
2018 ────────────── $410 BILLION
2019 ────────────── $338 BILLION
However things turn out this election year, what the Fed does with its $2.46 trillion of Treasuries may ultimately prove to be most important of all for investors. Since the Fed ended quantitative easing in 2014, the central bank has maintained its holdings by reinvesting the money from maturing debt into Treasuries. The Fed will plow back about $216 billion this year and reinvest $197 billion in the next, based on current policy.
While the Fed has said it will look to reduce its holdings eventually by scaling back re-investments when bonds come due, it hasn’t announced any timetable for doing so.
“It’s the elephant in the room,” said Dov Zigler, a financial markets economist at Bank of Nova Scotia. “What will the Fed’s role be and how large will its participation be in the Treasury market next year and the year after?”
 QUESTION: Mr. Armstrong, I think I am starting to see the light you have been shining. Negative interest rates really are “completely insane”. I also now see that months after you wrote about central banks were trapped, others are now just starting to entertain the idea. Is this distinct difference in your views that eventually become adopted with time because you were a hedge fund manager?
ANSWER: I believe the answer is rather simple. How can anyone pretend to be analysts if they have never traded? It would be like a man writing a book explaining how it feels to give birth. You cannot analyze what you have never done. It is just impossible. Those who cannot teach and those who can just do. Negative interest rates are fueling deflation. People have less income to spend so how is this beneficial? The Fed always needed 2% inflation. The father of negative interest rates is Larry Summers. He teaches or has been in government. He is not a trader and is clueless about how markets function. I warned that this idea of negative interest rates was very dangerous.
Yes, I have warned that the central banks are trapped. Their QE policies have totally failed. There were numerous “analysts” without experience calling for hyperinflation, collapse of the dollar, yelling the Fed is increasing the money supply so buy gold. The inflation never appeared and gold declined. Their reasoning was so far off the mark exactly as people like Larry Summers. These people become trapped in their own logic it becomes irrational gibberish. They only see one side of the coin and ignore the rest.
Central banks have lost all ability to manage the economy even in theory thanks to this failed reasoning. They have bought-in the bonds and are unable to ever resell them again. If they reverse their policy of QE and negative interest rates, government debt explodes with insufficient buyers. If the central banks refuse to reverse this crazy policy of QE and negative interest rates they will see a massive capital flight from government to the private sector once the MAJORITY realize the central banks are incapable of any control.

The central banks have played a very dangerous game and lost. It appears we are facing the collapse of Social Security which began August 14th, 1935 (1935.619) because they stuffed with government debt and robbed the money for other things. Anyone else would go to prison for what politicians have done and prosecutors would never defend the people because they want to become famous politicians. We will probably see the end of this Social Security program by 2021.772 (October 9th, 2021), or about 89 weeks into the next business cycle. These people are completely incompetent to manage the economy and we are delusional to think people with no experience as a trader can run things. If you have never traded, you have no busy trying to “manipulate” society with you half-baked theories. So yes. The central banks are trapped. They have lost ALL power. It becomes just a matter of time as the clock ticks and everyone wakes up and say: OMG!
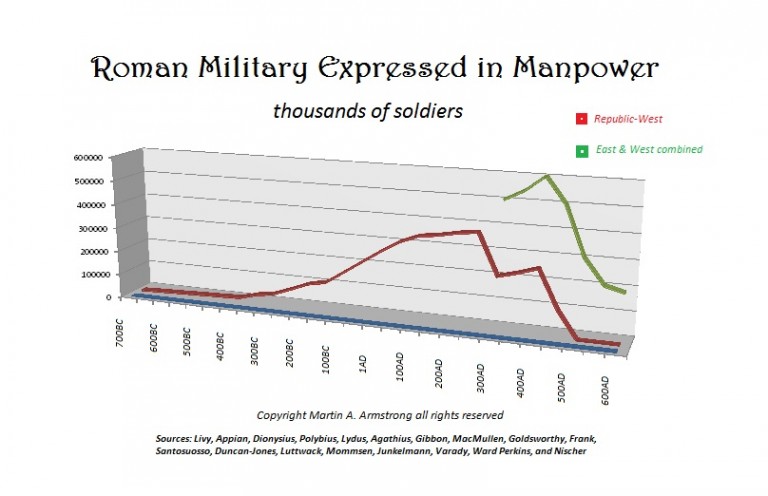
We have government addicted to borrowing and if rates rise, then everything will explode in their face. Western Civilization is finished as we know it just as Communism collapsed because we too subscribe to the theory of Marx that government is capable of managing the economy. Just listen to the candidates running for President. They are all preaching Marx. Vote for me and I will force the economy to do this. IMPOSSIBLE! We have debt which is unsustainable the further you move away from the United States which is the core economy such as emerging markets. Unfunded pensions destroyed the Roman Empire. We are collapsing in the very same manner and for the very same reason. We are finishing a very very very important report on the whole pension crisis issue worldwide.
The Fed Funds Futures, which are largely based on statements from the Fed Presidents/Governors, are at 74% for a December 2015 raise as of November 26, 2015. This is up from 50% at the end of October 2015. If the Fed does raise the Fed Funds rate, will the raise have a positive effect or a negative one? Let’s examine a few data points.
First raising the Fed Funds rate will cause the value of the USD to go up relative to other currencies. It is expected that a Fed Funds rate raise will cause a rise in US Treasury yields. This means US Treasury bond values will go down at least in the near term. In the near term, this will cost investors money. However, the new higher yield Treasury notes and bonds will be more attractive to investors. This will increase the demand for them. That is the one positive. The US is currently in danger that demand may flag if a lot of countries decide to sell US Treasuries instead of buying them. The Chinese say they are selling so that they can defend the yuan. Their US Treasury bond sales will put upward pressure on the yields. That will in turn put upward pressure on the value of the USD relative to other currencies.
So far the Chinese have sold US Treasuries (“to defend the yuan”); but they have largely bought back later. Chinese US Treasuries holdings were $1.2391T as of January 2015. They were $1.258T as of September 2015. However, if China decided to just sell, there would be significant upward pressure on the US Treasury yields and on the USD. That would make China’s and other countries products that much cheaper in the US. It would make US exports that much more expensive. It would mean more US jobs lost to competing foreign products.
To better assess what may or may not happen on a Fed Funds rate raise, it is appropriate to look at the values of the USD (no current QE) versus the yen and the euro which have major easing in progress. Further it is appropriate to look at the behavior of the yen against the euro, where both parties are currently easing.
The chart below shows the performance of the euro against the USD over the last two years.
(click to enlarge)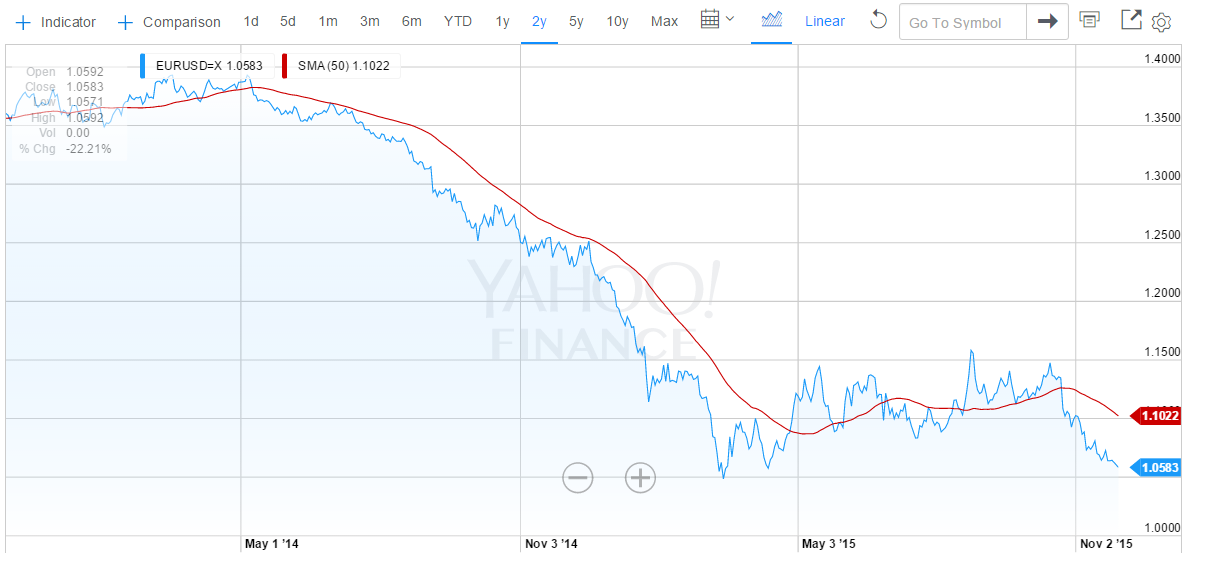
The chart below shows the performance of the Japanese yen against the USD over the last two years.
(click to enlarge)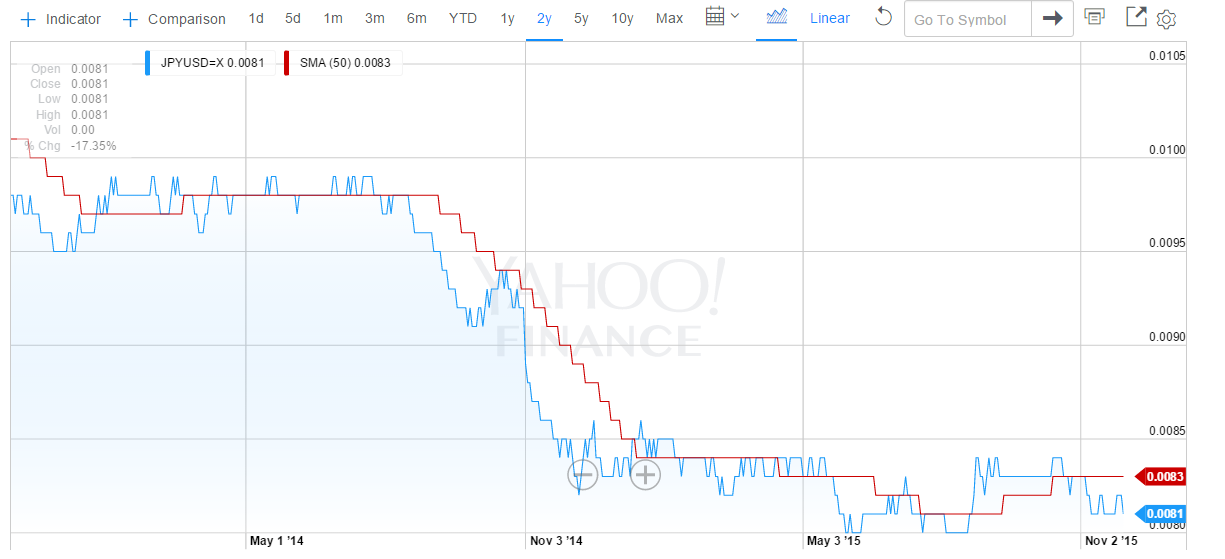
As readers can see both charts are similar. In each case the BOJ or the ECB started talking seriously about a huge QE plan in the summer or early fall of 2014. Meanwhile the US was in the process of ending its QE program. It did this in October 2014. The results of this combination of events on the values of the two foreign currencies relative to the USD are evident. The value of the USD went substantially upward against both currencies.
The chart below shows the performance of the euro against the Japanese yen over the last two years.
(click to enlarge)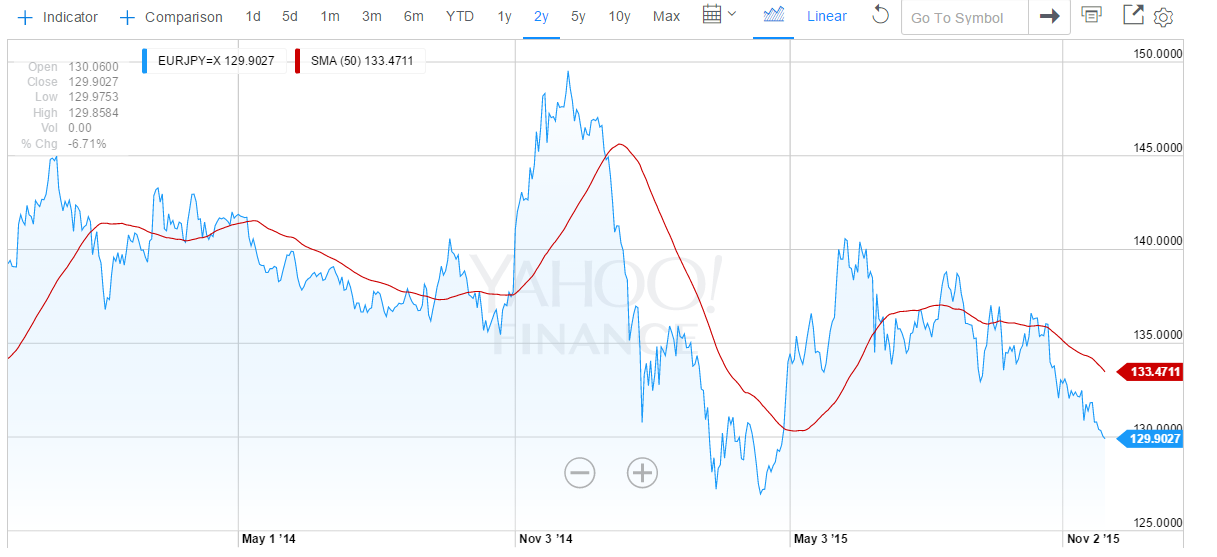
As readers can see the yen has depreciated versus the euro; but that depreciation has been less than the depreciation of the yen against the USD and the euro against the USD. Further the amount of Japanese QE relative to its GDP is a much higher at roughly 15%+ per year than the large ECB QE program that amounts to only about 3%+ per year of effectively “printed money”. The depreciation of the yen versus the euro is the result that one would expect based on the relative amounts of QE. Of course, some of the strength of the yen is due to the reasonable health of the Japanese economy. It is not just due to QE amount considerations. The actual picture is a complex one; and readers should not try to over simplify it. However, they can generally predict/assume trends based on the macro moves by the BOJ, the ECB, and the US Fed.
The chart below shows the relative growth rates of the various central banks’ assets.
(click to enlarge)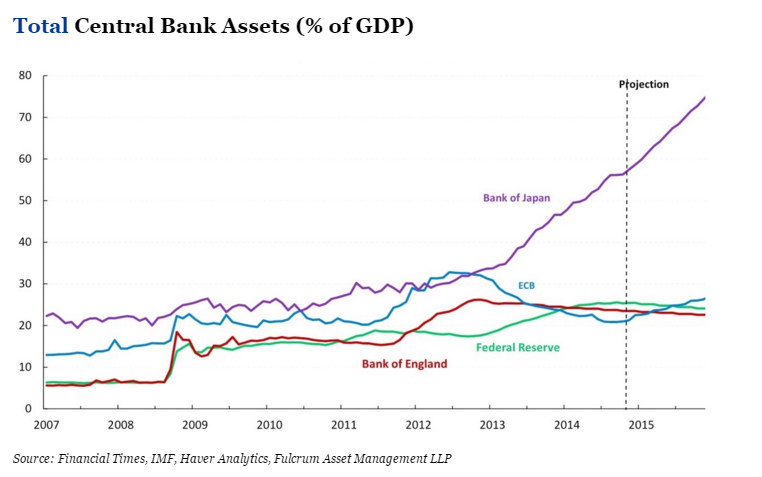
As readers can see, this chart makes it appear that Japan is in trouble relative to the other countries. When this situation will explode (implode) into a severe recession for Japan is open to question. That is not the theme of this article, so I will not speculate here. Still it is good to be aware of the relative situation. Japan is clearly monetizing its debts relative to the other major currencies. That likely means effective losses in terms of “real” assets for the other countries. It means Japan is practicing mercantilism against its major competitors to a huge degree. Do the US and other economies want to allow this to continue unabated? Theoretically that means they are allowing Japanese workers to take their jobs unfairly.
I will not try to include the Chinese yuan in the above description, since it has not been completely free floating. Therefore the data would be distorted. However, the yuan was allowed to fall against other major currencies by the PBOC in the summer of 2015. In essence China is participating in the major QE program that many of the world’s central banks seem to be employing. It has also been steadily “easing” its main borrowing rate for more than a year now from 6.0% before November 23, 2014 to 4.35% after its latest cut October 23, 2015. It has employed other easing measures too. I have omitted them for simplicity’s sake. Many think China will continue to cut rates in 2016 and beyond as the Chinese economy continues to slow.
All of these countries are helping their exports via mercantilism by effectively devaluing their currencies against the USD. The table below shows the trade data for US-China trade for 2015.
(click to enlarge)
As readers can see in the table above the US trade deficit popped up in the summer about the time China devalued the yuan. Some of this pop was probably seasonal; but a good part of it was almost certainly not seasonal. This means the US is and will be losing more jobs in the future to China (and perhaps other countries), if the US does not act to correct/reverse this situation.
The US Total Trade Deficit has also been going up.
⦁ For January-September 2013, the deficit was -$365.3B.
⦁ For January-September 2014, the deficit was -$380.0B.
⦁ For January-September 2015, the deficit was -$394.9B.
The US Total Trade Deficit has clearly been trending upward. The lack of QE by the US for the last year plus and the massive QE by the US’ major trade partners is making the situation worse. The consequently much higher USD has been making the situation worse. The roughly -$30B increase in the US Total Trade Deficit for the first nine months of the year from 2013 to 2015 means the US has been paying US workers -$30B less than it would have if the level of the deficit had remained the same. If the deficit had gone down, US workers would have benefited even more.
If you take Cisco Systems (NASDAQ:CSCO) as an example, it had trailing twelve month revenue of $49.6B as of its Q3 2015 earnings report. That supported about 72,000 jobs. CSCO tends to pay well, so those would be considered “good” jobs. Adjusting for three fourths of the year and three fifths of the amount of money (revenue), this amounts to roughly -57,000 well paying jobs that the US doesn’t have due to the extra deficit. If I then used the multiplier effect from the US Department of Commerce for Industrial Machinery and Equipment jobs of 9.87, that would translate into over -500,000 jobs lost. Using that logic the total trade deficit may account for more than -5 million jobs lost. Do US citizens really want to see their jobs go to foreign countries? Do US citizens want to slowly “sell off the US”? How many have seen the Chinese buying their houses in California?
The US Fed is planning to make that situation worse. A raise of the Fed Funds rate will lead directly to a raise in the yield on US Treasuries. It will lead directly to a stronger USD. That will translate into an even higher US trade deficit. That will mean more US jobs lost. Who thinks that will be good for the US economy? Who thinks the rate of growth of the US trade deficit is already too high? When you consider that oil prices are about half what they were a year and a half ago, you would think that the US Trade Deficit should not even be climbing. Yet it has, unabated. That bodes very ill for the US economy for when oil prices start to rise again. The extra level of non-oil imports will not disappear when oil prices come back. Instead the Total Trade Deficit will likely spike upward as oil prices double or more. Ouch! That may mean an instant recession, if we are not already there by then. Does the US Fed want to make the already bad situation worse?
Consider also that other countries use the USD as a secondary currency, especially South American and Latin American countries. Their GDP’s are computed in USD’s. Those currencies have already shown weakness in recent years. One of the worse is Argentina. It has lost almost -60% of its value versus the USD over the last five years (see chart below).
(click to enlarge)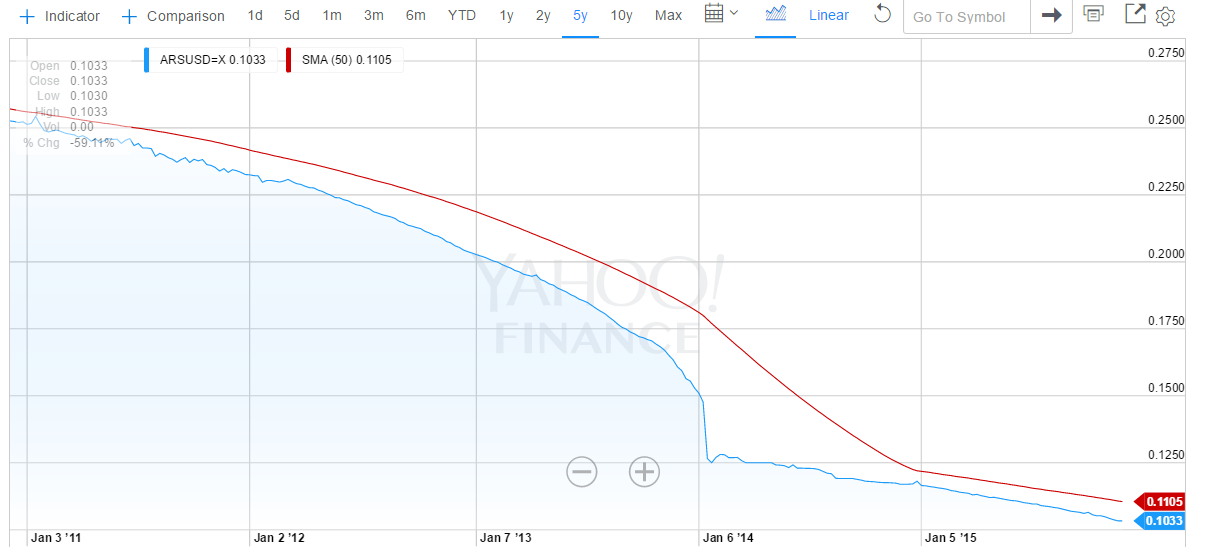
The big drop in January 2014 was when the government devalued its currency from 6 pesos to the USD to 8 pesos to the USD. If the Fed causes the USD to go up in value, that will lead to an automatic decrease in the Argentine GDP in USD terms. Effectively that will lead to an automatic cut in pay for Argentine workers, who are usually paid in pesos. It will cause a more rapid devaluation of the Argentine peso due to the then increased scarcity of USD’s with which to buy imports, etc. Remember also that a lot of goods are bought with USDs in Argentina because no one has any faith in the long term value of the Argentine peso. Therefore a lot of Argentine retail and other trade is done with USD’s. The Fed will immediately make Argentinians poorer. Labor will be cheaper. The cost of Argentine exports will likely go down. The US goods will then have even more trouble competing with cheaper Argentine goods. That will in turn hurt the US economy. Will that then cause a further raise to the US Treasury yields in order to make them more attractive to buyers? There is that possibility of a nasty spiral in rates upward that will be hard to stop. Further the higher rates will increase the US Budget Deficit. Higher taxes to combat that would slow the US economy further. Ouch! The Argentine scenario will likely play out in every South American and Latin American country (and many other countries around the world). Is this what the Fed really wants to accomplish? Christine Lagarde (head of the IMF) has been begging them not to do this. Too many Third World and Emerging Market economies are already in serious trouble.
Of course, there is the argument that the US has to avoid inflation; but how can the US be in danger of that when commodities prices are so low? For October export prices ex-agriculture and import prices ex-oil were both down -0.3%. The Core PPI was down -0.3%. Industrial Production was down -0.2%. The Core CPI was only up + 0.2%. The Core PCE Prices for October were unchanged at 0.0%. Isn’t that supposed to be one of the Fed’s favorite inflation gauges? Personal Spending was only up +0.1%, although Personal Income was up +0.4%. I just don’t see the inflation the Fed seems to be talking about. Perhaps when oil prices start to rise again, it will be time to raise rates. However, when there are so many arguments against raising rates, why would the Fed want to do so early? It might send the US economy into a recession. It would only increase the rate of rise of the US Trade Deficit and the US Budget Deficit. It would only hurt Third World and Emerging Market economies.
Of course, there is the supposedly full employment argument. However, the article, “20+ Reasons The Fed Won’t Raise Even After The Strong October Jobs Number” contains a section (near the end of the article) that explains that the US employment rate is actually 10.8% relatively to the level of employment in 2008 (before the Great Recession). The US has not come close to recovering from the Great Recession in terms of jobs; and for the US Fed or the US government to pretend that such a recovery has occurred is a deception of US citizens. I am not talking about the U6 number for people who are only partially employed. If I were, the unemployment number would be roughly 15%. I am merely adding in all of the people who had jobs in 2008, who are no longer “in the work force” because they have stopped “looking for jobs” (and therefore not in the unemployment number calculation). The unemployment number the government and the Fed are citing is a farce if you are talking about the 2008 employment level; and people should recognize this. The Fed should also be recognizing this when they are making decisions based on the unemployment level. Political posturing by Democrats (Obama et al) to improve the Democratic performance in the 2016 elections will only have a negative impact on the US economy. There is no “full employment” at the moment.
We all know that the jobs numbers are usually good due to the Christmas season. Some say those jobs don’t count because they are all part time. However, a lot of businesses hire full time temporarily. Think of all of those warehouse jobs for e-commerce. Do you think they want to train more people to work part time? Or do you think they want to train fewer people to work perhaps even more than full time? Confusion costs money. It slows things down. Fewer new people is often the most efficient way to go. A lot of the new jobs for the Christmas season are an illusion. They will disappear come late January 2016. Basing a Fed Funds rate raise on Christmas season hiring is again a mistake that will cost the US jobs in the longer term. If the Fed does this, it will be saying that the US economy exists in a US vacuum. It will be saying that the US economy is unaffected by the economies of the rest of the world. Remember the latest IMF calculation for the world economic outlook for FY2015 was cut in October 2015 to +3.1% GDP Growth. This is -0.2% below the IMF’s July 2015 estimate and -0.3% below FY2014. If the world economic growth outlook is falling, is it at all reasonable to think that US economic growth will be so high as to cause significant inflation? Is it instead more reasonable to think that a higher Fed Funds rate, higher Treasury yields, and a more highly valued USD will cause the US economy to slow further as would be the normal expectation? Does the Fed want to cause STAGFLATION?
If the Fed goes through with their plan to raise rates in December 2015, they will be committing the Sin Of Pride. That same sin is at least partially responsible for the US losing so many of its jobs to overseas competitors over the last 50 years. One could more logically argue that the Fed should be instituting its own QE program in order to combat the further lost of US jobs to the mercantilist behaviors of its trade partners. The only reason not to do this is that it believes growing its balance sheet will be unhealthy in the long run. However, the “Total Central Bank Assets (as a % of GDP)” chart above shows that the US is lagging both the ECB and the BOJ in the growth of its balance sheet. In other words our major competitors are monetizing their debts at a faster rate than we are. You could argue that someone finally has to stop this trend. However, the logical first step should be not adding to the central banks’ asset growth. Reversing the trend should not be attempted until the other major central banks have stopped easing measures. Otherwise the US Fed is simply committing the SIN OF PRIDE; and as the saying goes, “Pride goeth before a fall”. There are a lot of truisms in the Bible (Proverbs). It is filled with the wisdom of the ages; and even the Fed can benefit from its lessons. Let’s hope they do.
by David White in Seeking Alpha
Just like “America’s time-share king”, America just keeps on making the same mistakes over and over again. Prior to the financial collapse of 2008, time-share mogul David Siegel and his wife Jackie began construction on their “dream home” near Disney World in Orlando, Florida. This dream home would be approximately 90,000 square feet in size, would be worth $100 million when completed, and would be named “Versailles” after the French palace that inspired it. In fact, you may remember David and Jackie from an excellent 2012 documentary entitled “The Queen of Versailles”. That film documented how the Siegels almost lost everything after the financial collapse of 2008 devastated the U.S. economy because they were over leveraged and drowning in debt.
Source: Zero Hedge – Author: Michael Snyder

But since that time, David’s time-share company has bounced back, and the Siegels now plan to finally finish construction on their dream home and make it bigger and better than ever before.
But before you pass judgment on the Siegels, it is important to keep in mind that we are behaving exactly the same way as a nation. Instead of addressing our fundamental problems after the last financial crisis, we have just continued to make the exact same mistakes that we made before. And ultimately, things are going to end very, very badly for us. As Americans, we like to think that we are somehow entitled to the biggest and best of everything. We have been trained to believe that we are the wealthiest and most prosperous nation on the entire planet and that it will always be that way. This generation was handed the keys to the greatest economic machine in world history, but instead of treating it with great care, we have wrecked it. Our economic infrastructure is being systematically dismantled, Wall Street has been transformed into the biggest casino in the history of the planet, we have piled up a mountain of debt unlike anything the world has ever seen, and the reckless Federal Reserve is turning our currency into Monopoly money. All of our decisions have been designed to make things better for ourselves in the short-term without any consideration about what we were doing to the future of this country.
That is why “Versailles” is such a perfect metaphor for America. The Siegels always had to have the biggest and the best of everything, and they almost lost it all when the financial markets crashed…
David Siegel (“They call me the time-share king”) and his wife, Jackie Siegel — titular star of the 2012 documentary “The Queen of Versailles” — began building their dream home near Disney World about a decade ago. Soon it became evident that the sheer size of the mansion was almost unprecedented in America; it’s thought that only Biltmore House and Oheka Castle are bigger and still standing, and both of those are now run as tourist attractions, not true single-family homes.
But when the bottom fell out of the financial markets in 2008, their fortunes were upended too. By the time the documentary ended, their dream home had gone into default and they’d put it on the market. The listing asked for $100 million finished — “based on the royal palace of Louix XIV of the 17th century or to the buyer’s specifications — or $75 million “as is with all exterior finishings in crates in the 20-car garage on site.”
But just like the U.S. economy, the Siegels have seemingly recovered, at least for the moment.
Thanks to a rebound in the time-share business, the Siegels plan to finally complete their dream home and make it bigger and better than ever…
The unfinished home sits on 10 acres of lakefront property and when completed will feature 11 kitchens, 30 bathrooms, 20-car garage, two-lane bowling alley, indoor rollerskating rink, three indoor pools, two outdoor pools, video arcade, ballroom, two-story movie theater modeled off the Paris Opera House, fitness center with 10,000-square-foot spa, yoga studios, 20,000-bottle wine cellar and an exotic fish aquarium.
Two tennis courts, a baseball diamond and formal garden will be included on the grounds.
The couple admitted that some of their plans for the house – such as children’s playrooms – will have to be modified now that their kids are older.
However, they are determined to see the project through.
‘I’m not at the ending to my story yet, but so far, it’s a happy ending, and I’m really looking forward to starting the next chapter of my life and moving into my palace, finishing it and throwing lots of parties – anxious for the world to see it,’ Mrs Siegel said.
It is easy to point fingers at the Siegels, but the truth is that they are just behaving like we have been behaving as an entire nation.
When our financial bubbles burst the last time, our leaders did not really do anything to address our fundamental economic problems. Instead, they were bound and determined to reinflate those bubbles and make them even larger than before.
Now we stand at the precipice of the greatest financial crisis in our history, and we only have ourselves to blame.
Just consider what has happened to our national debt. Just prior to the last recession, it was sitting at about 9 trillion dollars. Today, it has just crossed the 18 trillion dollar mark…
 You may not think that you are to blame for this, but most of the people that will read this article voted for politicians that fully supported all of this borrowing and spending. And yes, that includes most Democrats and most Republicans.
We have stolen trillions of dollars from future generations of Americans in a desperate attempt to prop up our failing standard of living in the present. What we have done is a horrific crime, and if we lived in a just society a whole lot of people would be going to prison over this.
A similar pattern emerges when we look at the spending habits of ordinary Americans. This next chart shows one measure of consumer credit in America. During the last recession, we actually had a brief period of deleveraging (which was good), but now we are back on the exact same trajectory as before…
 Even though we had a higher standard of living than all previous generations of Americans, that was never good enough for us. We always had to have more, and we have borrowed and spent ourselves into oblivion.
We have also shown absolutely no respect for our currency. Having the primary reserve currency of the world has been an incredible advantage for the U.S. economy, but we are squandering that privilege. Like I said at the top of the article, the Federal Reserve has been treating the U.S. dollar like Monopoly money in recent years in an attempt to prop up the financial system. Just look at what “quantitative easing” has done to the Fed balance sheet since the last recession…
 Most of the new money that the Fed has created has been funneled into the financial markets. This has created some financial bubbles which are absolutely insane. For example, just look at how the NASDAQ has performed since the last financial crisis…
 These Fed-created bubbles are inevitably going to implode, because they have no relation to economic reality whatsoever. And when they implode, millions of Americans are going to be financially wiped out.
Just like David and Jackie Siegel, we simply can’t help ourselves. We just keep on making the same old mistakes.
And in the end, we will all pay a great, great price for our utter foolishness.


You must be logged in to post a comment.