
Everywhere you turn, the biggest players in the $23.7 trillion US Treasuries market are in retreat.
Tag Archives: bond market
Deutsche Bank: Global Bonds Are in First Bear Market in 76 Years
“Based on two centuries of data”
Contemporary value of everything with your name on it is derived from bonds.
Game Over, They’re Pulling the Plug – Bill Holter

Housing Bubble Getting Ready to Pop: Mortgage Applications to Purchase a Home Drop to Lockdown Lows, “Bad Time to Buy” Hits Record amid Sky-High Prices, Spiking Mortgage Rates
(Wolf Richter) This just keeps getting worse: Applications for mortgages to purchase a home dropped 7% for the week, and were down 21% from a year ago, the Mortgage Bankers Association reported today. An indicator of future home sales: Potential homebuyers try to get pre-approved for a mortgage, lock in a mortgage rate, and then start house-hunting.
Mortgage rates have soared this year, and home prices have soared for years to ridiculous levels, causing layers and layers of potential buyers to abandon the market, amid “worsening affordability challenges,” as the MBA called it. And these applications to purchase a home hit the lowest point since the depth of the lockdown in April 2020 (data via Investing.com):
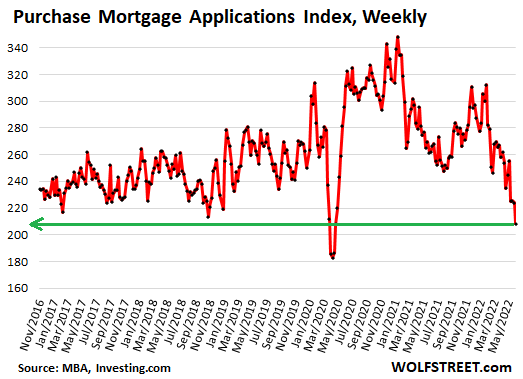
The MBA’s Purchase Mortgage Applications Index has now dropped below the lows of late 2018. By November 2018, the Fed had been hiking rates for years (slowly), and its QT was in full swing, and mortgage rates had edged above 5%, which was enough to begin shaking up the housing market. Home sales volume slowed, prices began to come down in some markets, and stocks were selling off. But with inflation below the Fed’s target, and with Trump, who’d taken ownership of the Dow, constantly throwing darts at Powell, the Fed signaled in December 2018 that it would cave, and instantly mortgage rates began to fall, and volume and prices took off again.
Today, raging inflation is the #1 economic issue, and the Fed is chasing after it, with backing from the White House, and so this issue in the housing market is just going to have to play out.
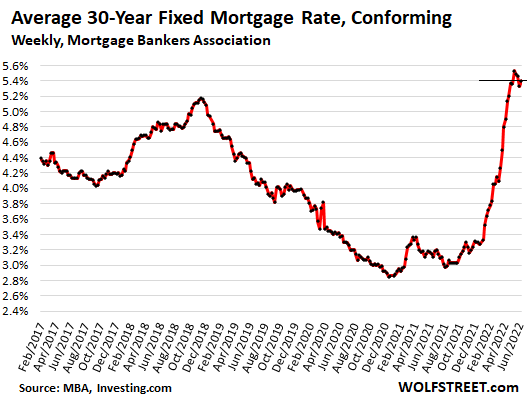
Holy-Moly Mortgage Rates.
The average 30-year fixed mortgage rate with conforming balances and 20% down rose to 5.40% this week, according to the MBA today, having been in this 5.4% range, plus or minus a little, since the end of April, the highest since 2009.
I call them holy-moly mortgage rates because that’s the reaction you get when you apply this rate to figure a mortgage payment for a home at current prices and then accidentally look at the resulting mortgage payment (data via Investing.com):
“Bad time to buy a home.”
Turns out, sky-high home prices to be financed with holy-moly mortgage rates, plus uncertainty about the economy, dropping stock prices, and inflation eating everyone’s lunch make a toxic mix for homebuyers.
The percentage of people who said that now is a “bad time to buy” a home jumped to 79%, another record-worst in the data going back to 2010, according to Fannie Mae’s National Housing Survey for May. Sentiment has been deteriorating since February 2021:
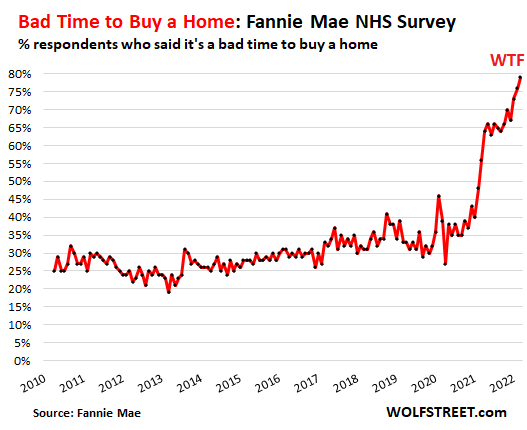
“Consumers’ expectations that their personal financial situations will worsen over the next year reached an all-time high in the May survey, and they expressed greater concern about job security,” according to Fannie Mae’s report.
“These results suggest to us that increased mortgage rates, high home prices, and inflation will likely continue to squeeze would-be home buyers – as well as those potential sellers with lower, locked-in mortgage rates – out of the market, supporting our forecast that home sales will slow meaningfully through the rest of this year and into next,” said Fannie Mae.
Sagging stock prices keep getting blamed.
The stock market is on the front pages every day. Only a small percentage of Americans own any significant amount of equities, but that doesn’t matter. Stock market declines, with many high-flying stocks plunging 70% or 80% or even 90% since February 2021, have rattled a lot of nerves. Which is in part why Fannie Mae pointed out, “consumers’ expectations that their personal financial situations will worsen over the next year reached an all-time high.”
The MBA also had previously pointed at the financial markets as one of the reasons for the plunge in purchase mortgage applications.
In the tech and social media sector, the big declines in stock prices have now triggered the first hiring freezes and a few layoffs. And this too – just the idea of nirvana being somehow over – is shaking up some folks.
Sharp increases in stock portfolios, stock options from employers, or cryptos empowered potential homebuyers and enabled many to borrow against their portfolios to come up with down payments. This option has either vanished or is looking very shaky for many.
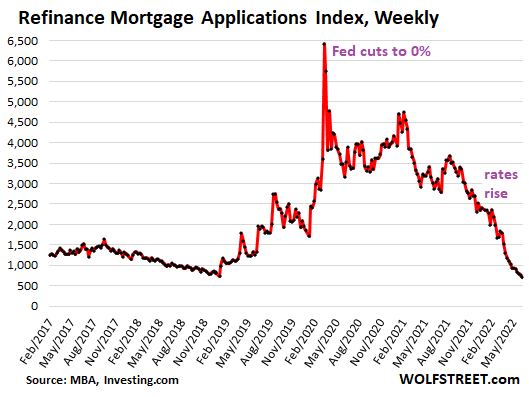
Refi applications collapsed to lowest since year 2000.
Applications for mortgages to refinance an existing mortgage dropped another 6% for the week, and have collapsed by 75% from a year ago, to the lowest level since the year 2000, according to the MBA’s Refinance Mortgage Applications Index. The MBA obtains this data from a weekly survey of mortgage bankers.
With these holy-moly mortgage rates, just about the only reason to refinance is to extract cash from the home via a cash-out refi (data via Investing.com):
Cash-Out Refi mortgage applications.
According to the AEI Housing Center, which tracks mortgage applications by the number of rate locks, no-cash-out refi applications have collapsed by 92% from a year ago. But cash-out refi applications are primarily driven by the desire to extract cash from a home, with mortgage rates being a secondary issue – and so they continue but a slower pace.
Cash out refi applications in week through May 30 (black line) plunged by 42% from the same week in 2021 and have stabilized roughly level with 2019:
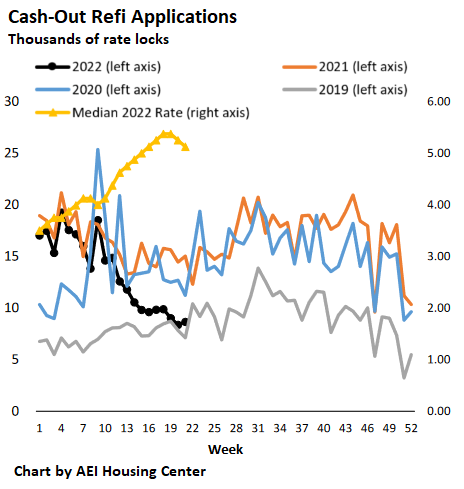
A cash-out refi provides a big lump sum for the homeowner to spend on all kinds of things, from cars to home improvement projects. They are also used to pay off high-cost debts, such as credit cards so that these credit cards can then be used for more purchases. The plunge in cash-out refi reduces the availability of these lump-sums, and therefore reduces the stimulus to the economy they provide.
No-cash-out refi mortgages at lower mortgage rates also boost consumer spending, as the lower rates reduce payments that then leave some extra every month to spend on other stuff. But the spike in mortgage rates, and the subsequent 92% collapse of no-cash-out refi mortgage applications ends this program.
Source: by Wolf Richter | Wolf Street
***
George Gammon: Thinking of buying a house? Stop and watch this first – MS
US housing implosion about to start – Market Sanity
Bank of America declares ‘technical recession’ – NTD
Inflation, consumer woe add to worries that recession is already here – CNBC
“Warning flags are everywhere” – ECB, inflation and U.S. stocks – QTR
Bond market rout so severe double-digit losses are the norm – Yahoo!
Get ready for currency collapses – King World News
Bond Traders Grounded By Violent Curve Flattening Losses
Over the weekend,ZeroHedge reported that in the aftermath of last week’s staggering, 6-sigma bond moves which saw unprecedented surges in short-term rates everywhere from Australia, to Canada and the U.K. amid growing speculation that the world’s central banks will accelerate plans for raising interest rates in the face of persistent inflation…

This Goose Is Cooked: “I’ve Never, Ever, Ever Seen Anything Like This Before”
“You have enormous buyers of debt meeting massive coordinated fiscal stimulus by governments across the globe. For bond investors, you’re caught between a rock and a hard place.”
With the Fed buying $622 billion in Treasury and MBS, a staggering 2.9% of US GDP, in just the past five days…
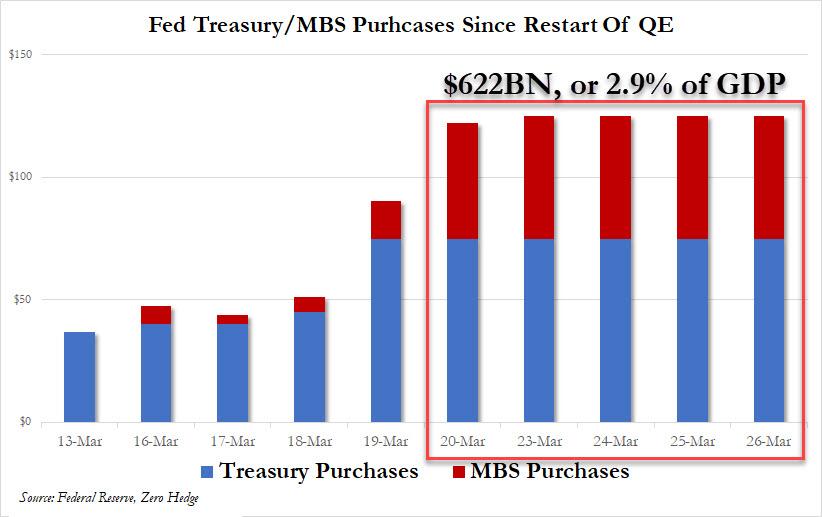
… any debate what to call the current phase of the Fed’s asset monetization – “NOT NOT-QE”, QE4, QE5, or just QEternity – can be laid to rest: because what the Fed is doing is simply Helicopter money, as it unleashes an unprecedented debt – and deficit – monetization program, one which is there to ensure that the trillions in new debt the US Treasury has to issue in the coming year to pay for the $2 (or is that $6) trillion stimulus package find a buyer, which with foreign central banks suddenly dumping US Treasuries…

… would otherwise be quite problematic, even if it means the Fed’s balance sheet is going to hit $6 trillion in a few days.
The problem, at least for traders, is that this new regime is something they have never encountered before, because during prior instances of QE, Treasuries were a safe asset. Now, however, with fears that helicopter money will unleash a tsunami of so much debt not even the Fed will be able to contain it resulting in hyperinflation, everything is in flux, especially when it comes to triangulating pricing on the all important 10Y and 30Y Treasury.
Indeed, as Bloomberg writes today, core investor tenets such as what constitutes a safe asset, the value of bonds as a portfolio hedge, and expectations for returns over the next decade are all being thrown out as governments and central banks strive to avert a global depression.
And as the now infamous “Money Printer go Brrr” meme captures so well, underlying the uncertainty is the risk that trillions of dollars in monetary and fiscal stimulus, and even more trillions in debt, “could create an eventual inflation shock that will trigger losses for bondholders.”
Needless to say, traders are shocked as for the first time in over a decade, they actually have to think:
“You have enormous buyers of debt meeting massive coordinated fiscal stimulus by governments across the globe. For bond investors, you’re caught between a rock and a hard place.”
And while equity investors may be confident that in the long run, hyperinflation results in positive real returns if one sticks with stocks, the Weimar case showed that that is not the case. But that is a topic for another day. For now we will focus on bond traders, who are finding the current money tsunami unlike anything they have seen before.
Indeed, while past quantitative easing programs have led to similar concerns, this emergency response is different because it’s playing out in weeks rather than months and limits on QE bond purchases have quickly been scrapped.
Any hope that the Fed will ease back on the Brrring printer was dashed when Fed Chairman Jerome Powell said Thursday the central bank will maintain its efforts “aggressively and forthrightly” saying in an interview on NBC’s “Today” show that the Fed will not “run out of ammunition” after promising unlimited bond purchases. His comments came hours after the European Central Bank scrapped most of the bond-buying limits in its own program.
The problem is that while this type of policy dominates markets, fundamental analysis scrambling to calculate discount rates and/or debt in the system fails, and “strategic thinking is stymied and some prized investment tools appear to be defunct”, said Ronald van Steenweghen of Degroof Petercam Asset Management.
“Valuation models, correlation, mean reversion and other things we rely on fail in these circumstances,” said the Brussels-based money manager. Oh and as an added bonus, “Liquidity is also very poor so it is difficult to be super-agile.”
The irony: the more securities the Fed soaks up, be they Treasuries, MBS, Corporate bonds, ETFs or stocks, the worse the liquidity will get, as the BOJ is finding out the hard way, as virtually nobody wants to sell their bonds to the central bank.
Another irony: normally the prospect of a multi-trillion-dollar government spending surge globally ought to send borrowing costs soaring. But central bank purchases are now reshaping rates markets – emulating the Bank of Japan’s yield-curve control policy starting in 2016 – and quashing these latest volatility spikes.
In effect, the Fed’s takeover of bond markets (and soon all capital markets), means that any signaling function fixed income securities have historically conveyed, is now gone, probably for ever.
“Investors shouldn’t expect to see much more than moderately steep yield curves, since the Fed and its peers don’t want higher benchmark borrowing costs to undermine their stimulus,” said Blackrock strategist Scott Thiel. “That would be detrimental to financial conditions and to the ability for the stimulus to feed through to the economy. So the short answer is, it’s yield-curve control.”
Said otherwise, pretty soon the entire yield curve will be completely meaningless when evaluating such critical for the economy conditions as the price of money or projected inflation. They will be, simply said, whatever the Fed decides.
And with the yield curve no longer telegraphing any inflationary risk, it is precisely the inflationary imbalances that will build up at an unprecedented pace.
Additionally, when looking further out, Bloomberg notes that money managers need to reassess another assumption that’s become widely held in recent years: that inflation is dead. Van Steenweghen says he’s interested in inflation-linked bonds, though timing a foray into that market is “tricky.”
Naeimi also said he expects that the coordination by central banks and governments will spike inflation at some stage. “It all adds to the volatility of holding bonds,” he said. But for the time being, he’s range-trading Australian bonds — buying when 10-year yields hit 1.5%, and selling at 0.6%.
That’s right: government bonds have become a daytrader’s darling. Whatever can possibly go wrong.
But the biggest fear – one we have warned about since 2009 – is that helicopter money, which was always the inevitable outcome of QE, will lead to hyperinflation, and the collapse of both the US Dollar, and the fiat system, of which it is the reserve currency. Bloomberg agrees:
Many market veterans agree that faster inflation may return in a recovery awash with stimulus that central banks and governments may find tough to withdraw. A reassessment of consumer-price expectations would be a major setback for expensive risk-free bonds, especially those with the longest maturities, which are most vulnerable to inflation eroding their value over time.
Of course, at the moment that’s hard to envisage, with market-implied inflation barely at 1% over the next decade, but as noted above, at a certain point the bond market no longer produces any signal, just central bank noise, especially when, as Bloomberg puts it, “central bank balance sheets are set to explode further into unchartered territory.” Quick note to the Bloomberg editors: it is “uncharted”, although you will have plenty of opportunity to learn this in the coming months.
Alas, none of this provides any comfort to bond traders who no longer have any idea how to trade in this new “helicopter normal“, and thus another core conviction is being revised: the efficacy of U.S. Treasuries as a safe haven and portfolio hedge.
Mark Holman, chief executive and founding partner of TwentyFour Asset Management in London, started questioning that when the 10-year benchmark hit its historic low early this month.
“Will government bonds play the same role in your portfolio going forward as they have in the past?” he said. “To me the answer is no they don’t — I’d rather own cash.”
For now, Mark is turning to high-quality corporate credit for low-risk income, particularly in the longer maturity bonds gradually rallying back from a plunge, especially since they are now also purchased by the Fed. He sees no chance of central banks escaping the zero-bound’s gravitational pull in the foreseeable future. “What we do know is we’re going to have zero rates around the world for another decade, and we’re going to have the need for income for another decade,” he said.
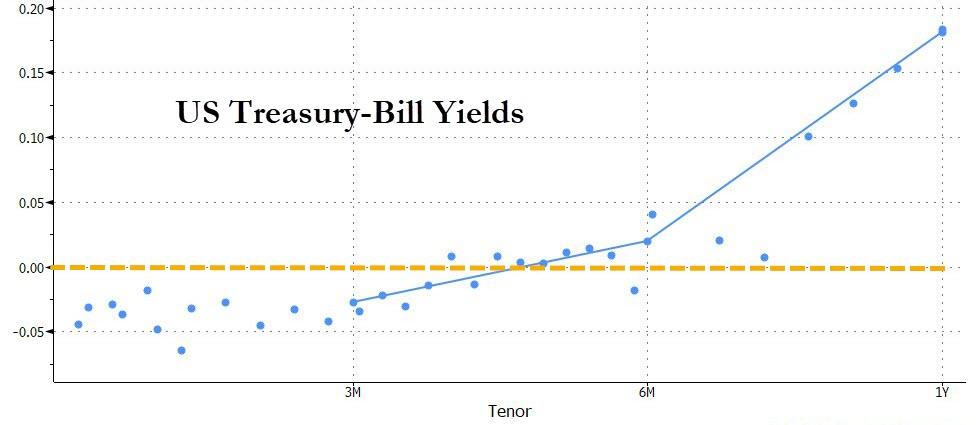
Other investors agree that cash is the only solution, which is why T-Bills – widely seen as cash equivalents – are now trading with negative yields for 3 months and over.
Yet others rush into the safety of gold… if they can find it. At least check, physical gold was trading with a 10% premium to paper gold and rising fast.
Ultimately, as Bloomberg concludes, investors will have to find their bearings “in a crisis without recent historical parallel.”
“It’s very hard to look at this in a historical context and then apply an investment framework around it,” said BlackRock’s Thiel. “The most applicable period is right before America entered WW2, when you had gigantic stimulus to spur the war effort. I mean, Ford made bombers in WW2 and now they’re making ventilators in 2020.”
Welcome to the New America
The Man Who Accurately Predicted The Collapse In Bond Yields Reveals “There Is A Lot More To Come”
Earlier this week ZeroHedge wrote that after decades of waiting, for Albert Edwards vindication was finally here – if only outside the US for now – because as per BofA calculations, average non-USD sovereign yields on $19 trillion in global debt had, as of Monday, turned negative for the first time ever at -3bps.

So now that virtually every rates strategist is rushing to out-“Ice Age” the SocGen strategist (who called the current move in rates years if not decades ago) by forecasting even lower yields (forgetting conveniently that just a year ago consensus called for the 10Y to rise well above 3% by… well, some time now), what does the man who correctly called the unprecedented move in global yields – which has sent $17 trillion in sovereign debt negative – think?
In a word: “There is a lot more to come.“
Although the tsunami of negative yields sweeping the eurozone has attracted most attention, yields have also plunged in the US with 30y yields falling to an all-time low just below 2%. For many this represents a bubble of epic proportions, driven by QE and ripe for bursting.
Here Edwards makes it clear that he disagrees , and cautions “that there is a lot more to come.”
What does he mean?
As Albert explains, “when you see the creeping advance of negative bond yields throughout the investment universe, you really start to doubt your sanity. For me it is not so much that 10Y+ government bond yields are increasingly negative, but when European junk bonds go negative I really start to scratch my head.” And as we wrote in “Redefining “High” Yield: There Are Now 14 Junk Bonds With Negative Yields“, there certainly is a lot of scratching to do.
One thing Edwards isn’t scratching his head over is whether this is a bond bubble: as he explains, his “own view is that this government bond rally is not a bubble but an appropriate reaction to the market discounting the next recession hitting the global economy from all over leveraged corners of the world (including China), with close to zero core inflation and precious few working tools left at policymakers’ disposal.”
This means that “the bubbles are not in the government bond market in my view. They are in corporate equities and corporate bonds.“
If Edwards is correct about the focus of the next mega-bubble, it is very bad news for risk assets as the “global deflationary bust will wreak havoc with financial markets”, prompting Edwards to ask a rhetorical question:
Does anyone seriously believe that in the next global recession equity markets will not collapse? Do market participants really believe fiscal stimulus and helicopter money will save us from a gut wrenching global bust that will make 2008 look like a picnic? Has the longest US economic cycle in history beguiled investors into soporific complacency? I hope not.
He may hope not, but that’s precisely what has happened in a world where for over a decade, even a modest market correction has lead to central banks immediately jawboning stocks higher and/or cutting rates and launching QE.
So to validate his point that the rates market is not a bubble, Edwards goes on to show that “US and even euro zone government bond yields are not in fact overextended – certainly not on a technical level – but also that fundamentals should carry government bond yields still lower.”
In his note, Edwards launches into an extended analysis of the declining workweek for both manufacturing and total workers, and explains why sharply higher recession odds (which we recently discussed here), are far higher than consensus expected.

But what we found most notable was his technical analysis of the ongoing collapse in 10Y Bund yields. As Edwards writes, “looking at the chart for German 10Y yields (monthly plot) their decline to close to minus 0.7% does not seem so extraordinary – merely the continuation of a downtrend within very clearly defined upper and lower bounds (see chart below).”
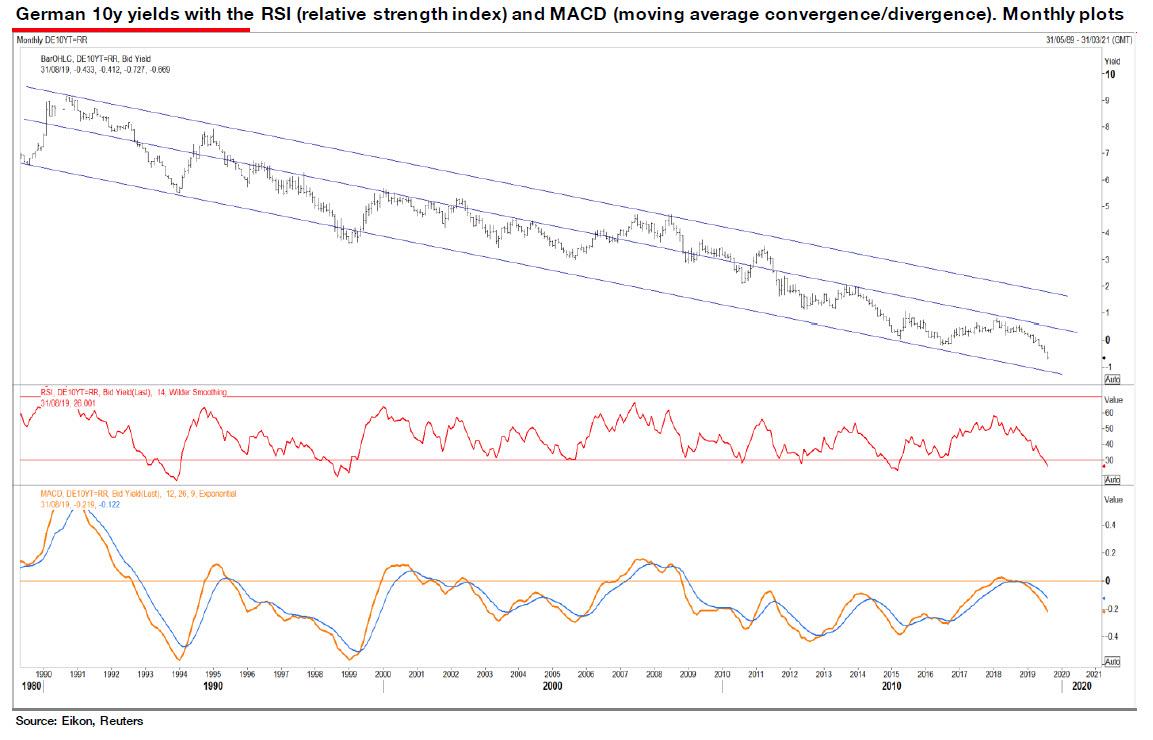
As Edwards explains referring to the chart above, “the bund yield has remained in the lower half of that band since 2011, but there is good reason for that as the ECB has struggled with a moribund euro zone economy and core inflation consistently undershooting its 2% target.”
Still, even Edwards admits that the pace of the recent decline in bund 10Y yields is indeed unusually rapid (with a 14-month RSI of 26, middle panel).
And although this suggests a pause in the decline in yields is technically warranted, the MACD (bottom panel) doesn’t look at all stretched. After a pause (data allowing), 10Y bunds could easily fall to the bottom of the lower trend line (ie below -1.5%) without any great technical excess being incurred.
His conclusion: “This market certainly doesn’t look like a bubble to me.”
Shifting attention from Germany to the US, Edwards writes that unlike the 10Y German bund yield, “the US 10Y has mostly occupied the top half of its wide downtrend band since 2013.”
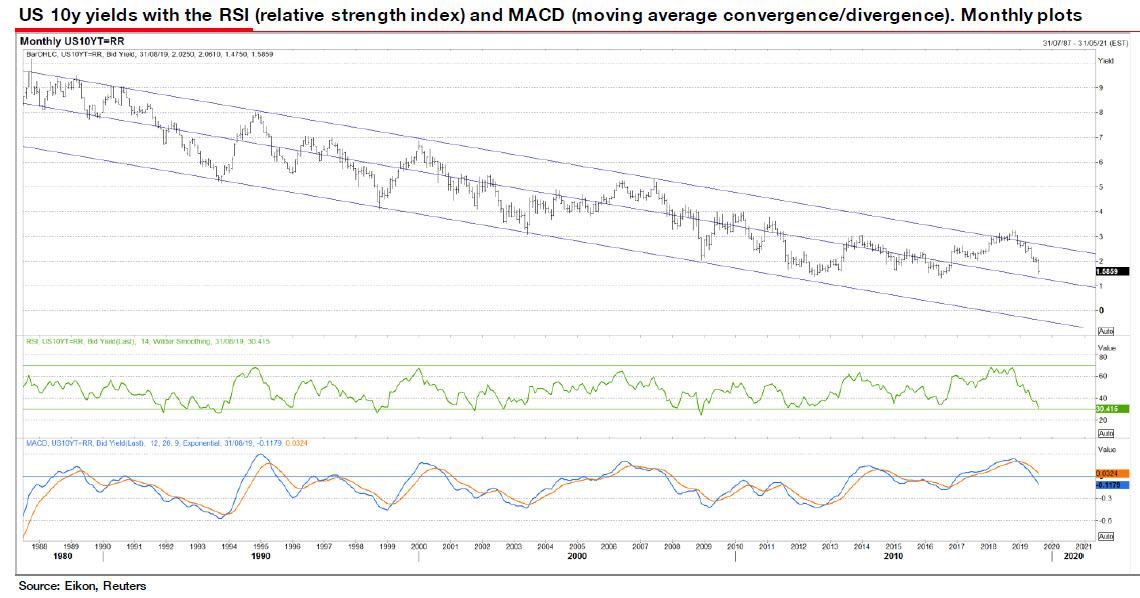
That is fairly unsurprising given the stronger US economy together with Fed rate hikes. Technically the RSI is much less extended to the downside than the bund, but like Germany the MACD could still have a long way to fall. The bottom of the lower downtrend is around minus 0.5% by the end of 2020.
It is Edwards’ opinion that “we are on autopilot until we get” to 0.5%.
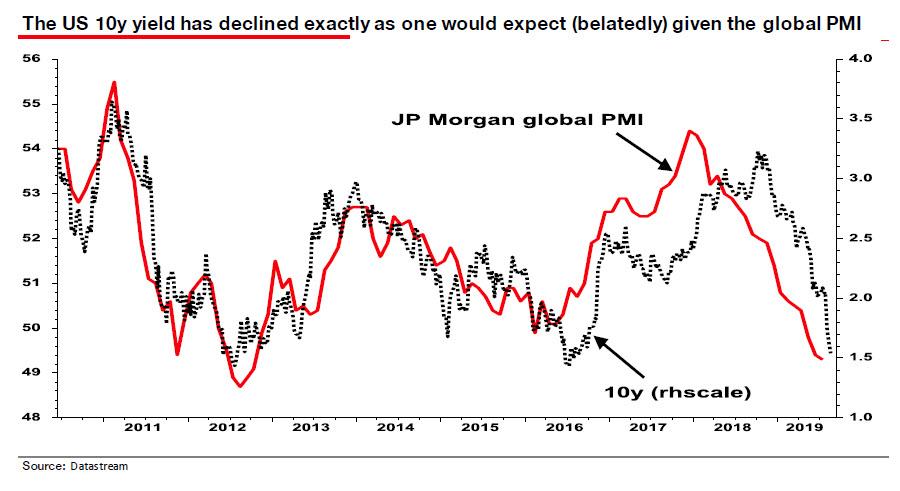
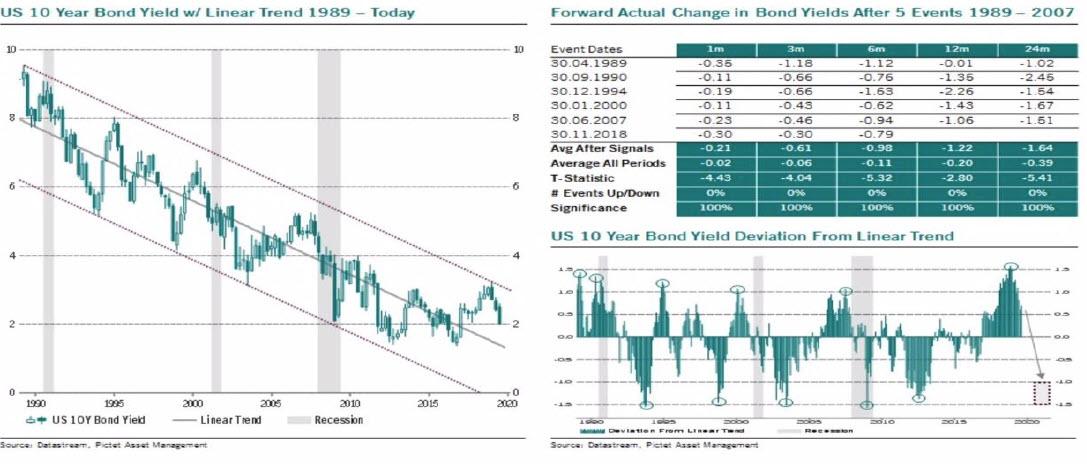
But wait, there’s more, because in referring to the charting of Pictet’s Julien Bittle (shown below), Edwards points out the right-hand panel which demonstrates how far US 10Y yields might fall over various time periods after hitting a cyclical peak. “He shows that on average we should expect a decline of 1-1½ pp from the trend line, which takes us pretty much to zero (see slide).” Personally, Edwards says, he is even “more bullish than that!”
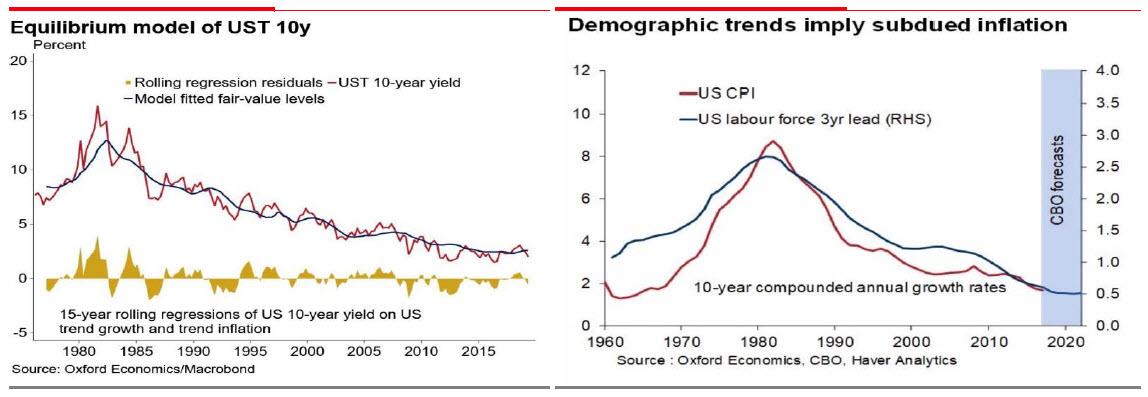
Edwards then points us to the work of Gaurav Saroliya, Director of Macro Strategy at Oxford Economics who “certainly doesn’t think that QE is depressing bond yields.” In this particular case, Saroliya uses a simple model which fits US 10Y bond yields with trend growth and inflation reasonably accurately (see left hand chart below). As Edwards notes, “given the demographic situation, inflation is likely to remain subdued.”
In conclusion Edwards presents one final and classic Ice Age chart to finish off.
As the bearish – or is that bullish… for bonds – strategist notes, “the last few cycles have seen a sequence of lower lows and highs for nominal quantities (along with bond yield and Fed Funds). I have used a 4-year moving average and have added where I think we may be heading in the next downturn and rebound – and more importantly where I think the market is now thinking where we are heading.”

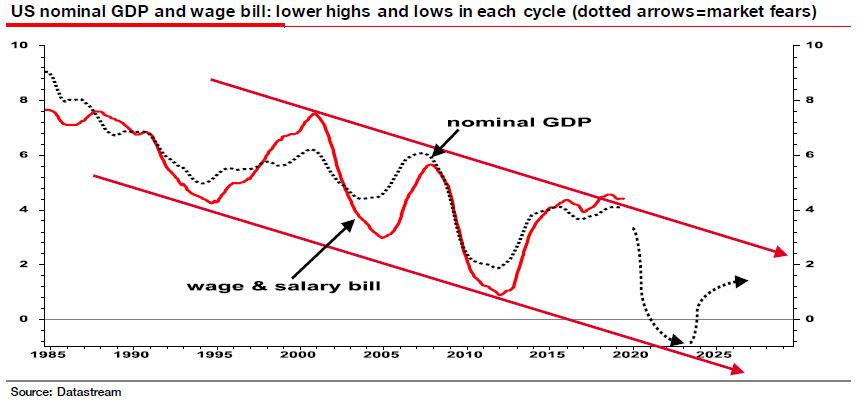
Referring to the implied upcoming plunge in nominal GDP, Edwards explains that “that is why this is not a bond bubble. It is the next phase of The Ice Age. And it is here.”
One last note: is it possible that Edwards’ apocalyptic view is wrong? As he admits, “of course” he could be wrong: “And given my dystopian vision for the global economy, equity and corporate bond investors, I sincerely hope I am.”
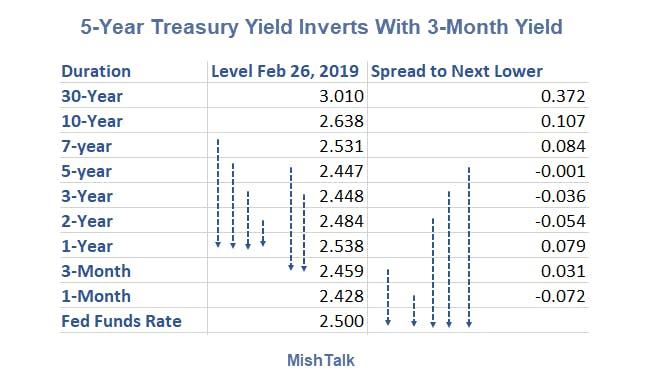
Recession Signal Getting Louder: 5-Year Yield Inverts With 3-Month Yield
The yield curve is inverted in 11 different spots. The latest is 5-year to 3-month inversion.
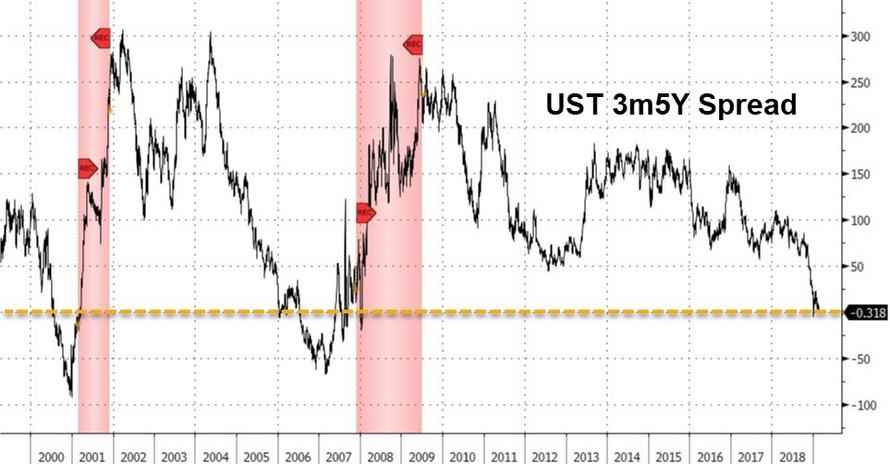
The yield curve recession signal is louder and louder. Inversions are persistent and growing.
Let’s compare the spreads today to that of December 18, the start of the December 2018 FOMC meeting.
Yield Curve 2019-02-26 vs December and October 2018
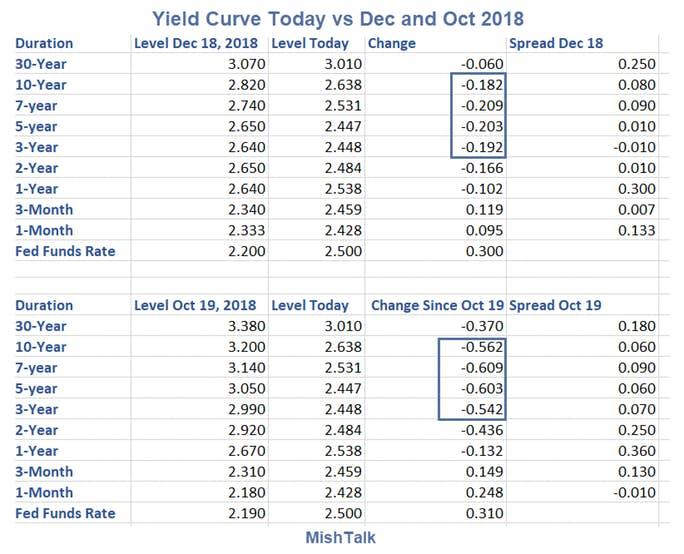
Yield Curve Spread Analysis
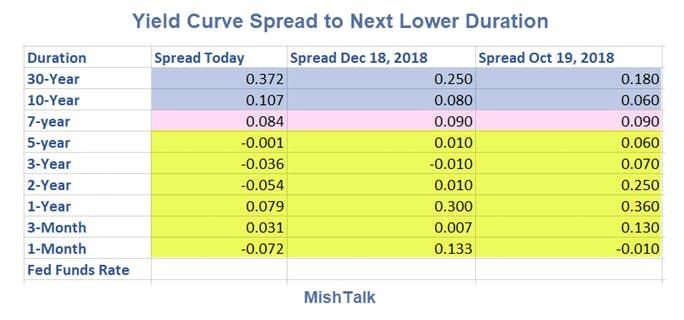
Spread Changes
- Yellow: Spreads Collapsed Since October (1 Month to 5 Years)
- Pink: Spreads Remained Roughly the Same (7 Year)
- Blue: Spreads Increased (30-Year and 10-Year)
Something Happening
Something is happening. What is it?
Possibilities
- The bond market is staring to worry about trillion dollar deficits as far as the eye can see
- The bond market has stagflation worries
- The bond bull market is over or approaching
My take is number one and possibly all three.
An in regards to recession the economy is weakening fast.
- Housing Starts: Yet Another Unexpected Thud, Down 11.2 Percent
- Home Resales: Existing Home Sales Down Again: -1.2% Month Over Month, -8.5% Year-Over-Year
- Industrial Production: Industrial Production Dives, Wiping Out a Strong December and Then Some
- Retail Sales: Shockingly Weak Retail Sales: Down 1.2% in December, Sharpest Decline Since 2009
Source: by Mike Shedlock via MishTalk| ZeroHedge
***
Core US Factory Orders Suffer Worst Slump In 3 Years
US core factory orders (ex transports) fell for the second month in a row in December. This is the worst sequential drop since Feb 2016.
New orders ex-trans fell 0.6% in Dec. after falling 1.3% the prior month.
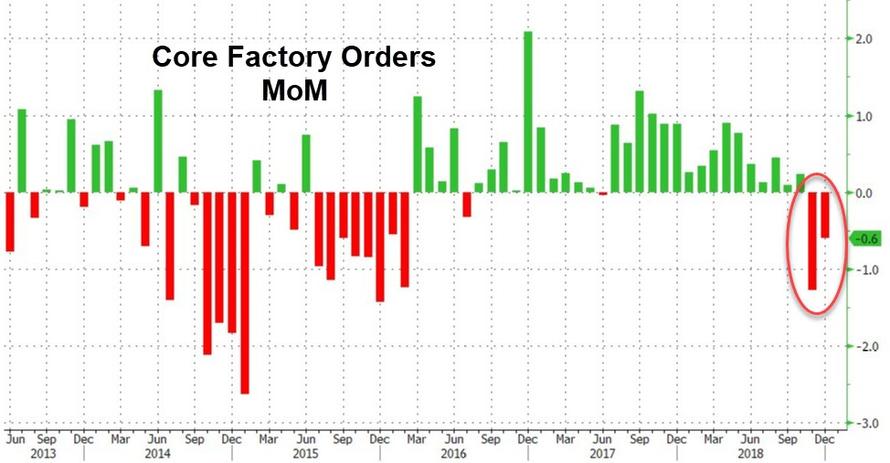
The headline factory orders rose 0.1% MoM (well below the 0.6% MoM gain expected).
Capital goods non-defense ex aircraft new orders for Dec. fall 1% after falling 1.1% in Nov.
Non-durables shipments for Dec. fall 1% after falling 2% in Nov.
Not a pretty picture, but it was an 8.0% drop in Defense spending that triggered the weakness – so we’re gonna need moar war.
Where The Next Financial Crisis Begins

(Global Macro Monitor) We are not sure of how the next financial crisis will exactly unfold but reasonably confident it will have its roots in the following analysis. Maybe it has already begun.
The U.S. Treasury market is the center of the financial universe and the 10-year yield is the most important price in the world, of which, all other assets are priced. We suspect the next major financial crisis may not be in the Treasury market but will most likely emanate from it.
U.S. Public Sector Debt Increase Financed By Central Banks
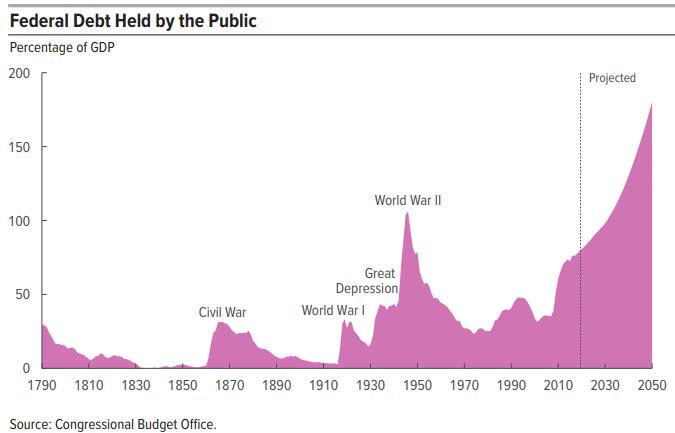
The U.S. has had a free ride for this entire century, financing its rapid run up in public sector debt, from 58 percent of GDP at year-end 2002, to the current level of 105 percent, mostly by foreign central banks and the Fed.
Marketable debt, in particular, notes and bonds, which drive market interest rates have increased by over $9 trillion during the same period, rising from 20 percent to 55 percent of GDP.
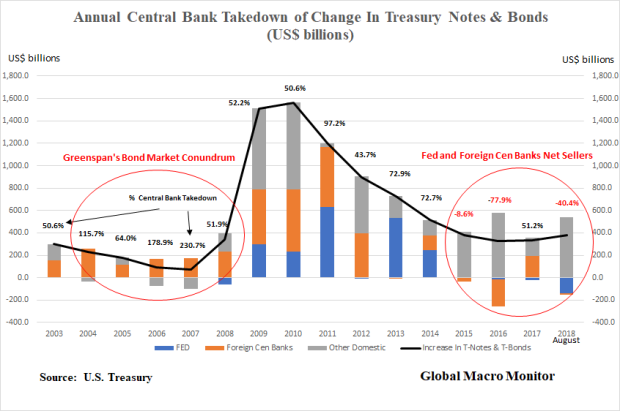
Central bank purchases, both the Fed and foreign central banks, have, on average, bought 63 percent of the annual increase in U.S. Treasury notes and bonds from 2003 to 2018. Note their purchases can be made in the secondary market, or, in the case of foreign central banks, in the monthly Treasury auctions.
In the shorter time horizon leading up to the end of QE3, that is 2003 to 2014, central banks took down, on average, the equivalent of 90 percent of the annual increase in notes and bonds. All that mattered to the price-insensitive central banks was monetary and exchange rate policy.
Stunning.
Greenspan’s Bond Market Conundrum
The charts and data also explain what Alan Greenspan labeled the bond market conundrum just before the Great Financial Crisis (GFC). The former Fed chairman was baffled as long-term rates hardly budged while the Fed raised the funds rate by 425 bps from 2004 to 2006, largely, to cool off the housing market.
The data show foreign central banks absorbed 120 percent of all the newly issued T-notes and bonds during the years of the Fed tightening cycle, freeing up and displacing liquidity for other asset markets, including mortgages. Though the Fed was tight, foreign central bank flows into the U.S., coupled with Wall Street’s financial engineering, made for easy financial conditions.
Greenspan lays the blame on these flows as a significant factor as to why the Fed lost control of the yield curve. The yield curve inverted because of these foreign capital flows and the reasoning goes that the inversion did not signal a crisis; it was a leading cause of the GFC (great financial crisis) as mortgage lending failed to slow, eventually blowing up into a massive bubble.
Because it had lost control of the yield curve, the Fed was forced to tighten until the glass started shattering. Boy, did it ever.
Central Bank Financing Is A Much Different Beast
The effective “free financing” of the rapid increase in the portion of the U.S debt that matters most to markets, by creditors who could not give one whit about pricing, displaced liquidity from the Treasury market, while at the same time, keeping rates depressed, thus lifting other asset markets.
More importantly, central bank Treasury purchases are not a zero-sum game. There is no reallocation of assets to the Treasury market in order to make the bond buys. The purchases are made with printed money.
Reserve Accumulation
It is a bit more complicated for foreign central banks, which accumulate reserves through currency intervention and are often forced to sterilize their purchase of dollars, and/or suffer the inflationary consequences.
Nevertheless, foreign central banks park much of their reserves in U.S. Treasury securities, mainly notes.
Times They Are A Chang ‘en
The charts and data show that since 2015, central banks have on average been net sellers of Treasury notes and bonds to the tune of an annual average of -19 percent of the yearly increase in net new note and bonds issued. The roll-off of the Fed’s SOMA Treasury portfolio, which is usually financed by a further increase in notes and bonds, does not increase the debt stock but, it is real cash flow killer for the U.S. government.
Unlike the years before 2015, the increase in new note and bond issuance is now a zero-sum game and financed by either the reallocation from other asset markets or an increase in financial leverage. The structural change in the financing of the Treasury market is taking place at a unpropitious time as deficits are ramping up.
Because 2017 was unique and an aberration of how the Treasury financed itself due to debt ceiling constraint, the markets are just starting to feel this effect. Consequently, the more vulnerable emerging markets are taking a beating this year and volatility is increasing across the board.
The New Market Meta-Narrative
We suspect very few have crunched these numbers or understand them and this new meta-narrative supported by the data is the main reason for the increase in market gyrations and volatile capital flows this year. We are pretty confident in the data, and the construction of our analysis. Feel free to correct us if you suspect data error and where you think we are wrong in our analysis. We look forward to hearing from you.
Moreover, the screws will tighten further as the ECB ends their QE in December. We don’t think, though we reserve the right to be wrong, as we often are, this is just a short-term bout of volatility, but it is the beginning of a structural change in the markets as reflected in the data.
Interest Rates Will Continue To Rise
It is clear, at least to us, the only possibility for the longer-term U.S. Treasury yields to stay at these low levels is an increase in haven buying, which, ergo other asset markets will have to be sold. If you expect a normal world going forward, that is no recession or sharp economic slowdown, no major geopolitical shock, or no asset market collapse, by default, you have to expect higher interest rates. The sheer logic is in the data.
Of course, Chairman Powell could cave to political pressure and “just print money to lower the debt” but we seriously doubt it and suspect the markets would not respond positively.
Stay tuned.


From Russia With Love?
Russia Dumps US Treasuries As Rates Climb
As predicted, Russia has reduced its holdings of US Treasuries as US rates continue to rise.
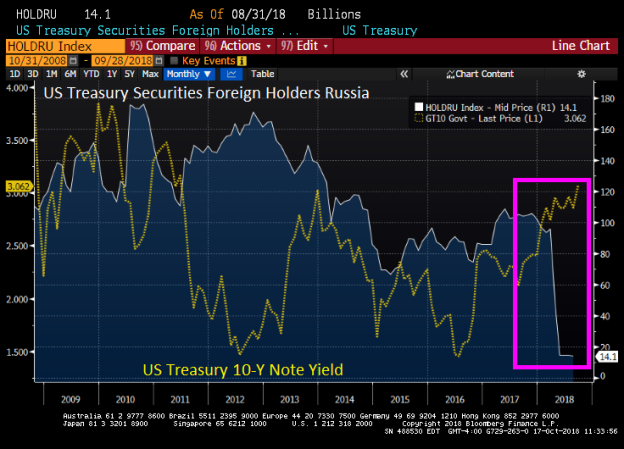
But Russia is a relatively small player in the US Treasury market (unless they are using proxies like postage-stamp sized Luxembourg, Ireland or the Cayman Islands).

As The Federal Reserve SLOWLY unwinds its balance sheet, the Confounded Interest blog is surprised that Japan and China have not unloaded MORE of their Treasury holdings.
Bonds Experienced Biggest Bloodbath Since Trump’s Election
Yields spiked by the most since Nov 2016 (the day of and following President Trump’s election).

NOTE – After 1430ET, bond were suddenly bid (and stocks sold off).
30Y yields spiked to the highest since Sept 2014…

10Y yields spiked to the highest since June 2011…

5Y yields spiked to the highest since Oct 2008…

The yield curve steepened dramatically…

All of which is fascinating given that Treasury Futures net speculative positioning is already at record shorts…

The entire global developed sovereign bond market saw yields surge…

…observations and serious concerns from a trader.
JGB Market Enters “Uncharted Territory” As Bond Rout Goes Global
“Monster Move” In Treasuries Unleashes Global Market Rout

Fed Chair Powell Hints He May Soon Crash The Market
Emerging Markets Continue to Slide as Dollar Pressures $3.7 Trillion Debt Wall
Emerging market stocks extended their declines Friday as investors continue to pull cash from some of the world’s biggest developing economies amid concerns that the greenback’s recent rally will pressure the cost of servicing some of the $3.7 trillion in debt taken on in the ten years since the global financial crisis.
Argentina has been at the forefront of the recent emerging market pullback this week, with the peso suffering its biggest single-day slump in three years — including a fifth of its value yesterday — before the central bank stepped in with a move to lift interest rates to an eye-watering 60% amid concerns that President Mauricio Macri’s efforts to cut spending and stave off a looming recession in South America’s third largest economy will ignite social unrest that could toppled his government.
“We have agreed with the International Monetary Fund to advance all the necessary funds to guarantee compliance with the financial program next year,” Macri said Wednesday in reference to a $50 billion support plan in the works. “This decision aims to eliminate any uncertainty. Over the last week we have seen new expressions of lack of confidence in the markets, specifically over our financing capacity in 2019.”
Those moves shadow a similar concern for the Turkish Lira, which resumed its slide against the dollar Thursday following a warning from Moody’s Investors Service earlier this week as the ratings agency downgraded its outlook on 20 domestic banks owning to the country’s slowing growth and their exposure to dollar-denominated debts.
The Turkish lira recovered from yesterday’s decline, but was still marked at 6.57 against the dollar, near to the weakest since the peak of its currency crisis in early August. Larger emerging market economy currencies were on the ropes Thursday, with the Indian rupee hitting a lifetime low of 70.68 against the dollar this week and falling 3.6% this month, the biggest decline since August 2015, while the Russian ruble bounced back from a two-year low to trade at 68.06.
The sell-off has also affected emerging market stocks, which continue to lag their advanced counterparts, with most major EM benchmarks either in or near so-called ‘bear market’ territory, which defines a market that has fallen 20% from its recent peak.
The benchmark MSCI International Emerging Markets index, for example, is down 0.4% today and more than 3% this month alone, extending its decline from the high it reached on January 29 to nearly 17%, while Reuters data notes that 20 out of 23 emerging market benchmarks are trading below their 200-day moving average, a technical condition that investors use as a signal for further selling.
Each of the three major emerging market ETFs, which collectively hold around $143 billion in assets — Vanguard’s FTSE EM (VWO – Get Report) , and iShares’ Core MSCI EM (IEMG – Get Report) and MSCI EM (EEM – Get Report) — have seen net asset values fall by an average of 15.3% since their January 26 peak.
The Bank for International Settlements, often described as the ‘central bank for central bank’s, estimates that emerging market countries are sitting on $3.7 trillion in dollar-denominated debt, all of which must be serviced in increasingly expensive greenbacks.
And while the dollar index is sitting at a four-week low of 94.60, it has risen more than 5% since the start of the second quarter and is expected to add further gains as the Federal Reserve signals future rate hikes amid a surging domestic economy, which grew 4.2% last quarter and is on pace for a similar advance in the three months ending in September, according to the Atlanta Fed’s GDPNow estimate.
“We look for the dollar to stay bid particularly against the emerging market FX segment where a meaningful decline in risky currencies is spilling over into the wider risk sentiment,” said ING’s Petr Krpata. “
Debt service costs aren’t the only concern, however, as many emerging market economies rely on the export of basic resources, such as oil and gas and other commodities, to fuel their growth.
With China’s economy showing persistent signs of a second half slowdown amid its ongoing trade dispute with the United States, many of those countries are seeing slowing demand, which is pressuring dollar-denominated revenues at exactly the time their needed to both support the value of their currencies in foreign exchange markets and make timely payments on the estimated $700 billion worth of debt that is set to mature over the next two years.
Are Bonds Sending A Signal?
Michael Lebowitz previously penned an article entitled “Face Off” discussing the message from the bond market as it relates to the stock market and the economy. To wit:
“There is a healthy debate between those who work in fixed-income markets and those in the equity markets about who is better at assessing markets. The skepticism of bond guys and gals seems to help them identify turning points. The optimism of equity pros lends to catching the full run of a rally. As an ex-bond trader, I have a hunch but refuse to risk offending our equity-oriented clients by disclosing it. In all seriousness, both professions require similar skill sets to determine an asset’s fair value with the appropriate acknowledgment of inherent risks. More often than not, bond traders and stock traders are on the same page with regard to the economic outlook. However, when they disagree, it is important to take notice.”
This is an interesting point given that despite the ending parade of calls for substantially higher interest rates, due to rising inflationary pressures and stronger economic growth, yields have stubbornly remained below 3% on the 10-year Treasury.
In this past weekend’s newsletter, we discussed the current “bullish optimism” prevailing in the market and that “all-time” highs are now within reach for investors.
“Currently, the “bulls” remain clearly in charge of the market…for now. While it seems as if much of the “tariff talk” has been priced into stocks, what likely hasn’t as of yet is rising evidence of weakening economic data (ISM, employment, etc.), weakening consumer demand, and the impact of higher rates.
While on an intermediate-term basis these macro issues will matter, it is primarily just sentiment that matters in the short-term. From that perspective, the market retested the previous breakout above the March highs last week (the Maginot line)which keeps Pathway #1 intact. It also suggests that next weekwill likely see a test of the January highs.“

“With moving averages rising, this shifts Pathway #2a and #2b further out into the August and September time frames. The potential for a correction back to support before a second attempt at all-time highs would align with normal seasonal weakness heading into the Fall. “
One would suspect with the amount of optimism toward the equity side of the ledger, and with the Federal Reserve on firm footing for further rate increases at a time where the U.S. Government is about to issue a record amount of new debt, interest rates, in theory, should be rising.
But they aren’t.
As Mike noted previously:
“Given our opinions on the severe economic headwinds facing economic growth and steep equity valuations, we believe this divergence poses a potential warning for equity holders. Accordingly, we thought it appropriate to provide a few graphs to demonstrate the ‘smarter’ guys are not on board the growth and reflation train.”
In today’s missive, we will focus on the “price” and “yield” of the 10-year Treasury from a strictly “technical”perspective with respect to the signal the bond market may be sending with respect to the stock market. Given that “credit” is the “lifeblood” of the Government, corporate and consumer markets, it should not be surprising the bond market tends to tell the economic story over time.
We can prove this in the following chart of interest rates versus the economic composite of GDP, inflation, and wages.

Despite hopes of surging economic growth, the economic composite has remained in an elongated nominal range between 40 and 60 since 2011. This stagnation has never occurred in history and is a function of the massive interventions by the Government and the Federal Reserve to support economic growth. However, now those supports are being removed as the Federal Reserve lifts short-term borrowing costs and reduces liquidity support through their balance sheet reinvestments.
As I said, credit is the “lifeblood” of the economy. Think about all the ways that higher rates impact economic activity in the economy:
1) Rising interest rates raise the debt servicing requirements which reduces future productive investment.
2) Rising interest rates will immediately slow the housing market taking that small contribution to the economy away. People buy payments, not houses, and rising rates mean higher payments.
3) An increase in interest rates means higher borrowing costs which leads to lower profit margins for corporations.
4) The “stocks are cheap based on low interest rates” argument is being removed.
5) The massive derivatives and credit markets are at risk. Much of the recovery to date has been based on suppressing interest rates to spur growth.
6) As rates increase so does the variable rate interest payments on credit cards.
7) Rising defaults on debt service will negatively impact banks.
8) Many corporate share buyback plans and dividend issuances have been done through the use of cheap debt, which has led to increases corporate balance sheet leverage.
9) Corporate capital expenditures are dependent on borrowing costs. Higher borrowing costs lead to lower CapEx.
10) The deficit/GDP ratio will begin to soar as borrowing costs rise sharply. The many forecasts for lower future deficits will crumble as new forecasts begin to propel higher.
I could go on, but you get the idea.
So, with the Fed hiking rates, surging bankruptcies for older Americans who are under-saved and over-indebted, stumbling home sales, inflationary prices rising from surging energy costs, what is the 10-year Treasury telling us now.
Short-Term
On a very short-term basis, the 10-year Treasury yield has started a potential-topping process. Given that “yield” is the inverse of the “price” of bonds, the “buy” and “sell” signals are also reversed. As shown below, the 10-year yield appears to be forming the “right shoulder” of a “head and shoulder” topping formation and is currently on a short-term “buy” signal. Such would suggest lower yields over the next couple of months.

The two signals above aren’t a rarity. The chart below expands this view back to 1970. There have only been a few times historically that yields have been this overbought and trading at 3 to 4 standard deviations above their one-year average.

The outcome for investors was never ideal.
Longer-Term
Even using monthly closing data, which smooths out volatility to a greater degree, the same message appears. The chart below goes back to 1994. Each time yields have been this overbought (remember since yield is the inverse of price, this means bonds are very oversold) it is has signaled an issue with both the economy and the markets.

Again, we see the same issue going back historically. Also, notice that yields are currently not only extremely overbought, they are also at the top of the long-term downtrend that started back in 1980.

Even Longer Term
Okay, let’s smooth this even more by using quarterly data closes. again, the picture doesn’t change.

As I noted yesterday, the economic cycle is extremely advanced and both stocks and bonds are slaves to the full market cycle.

“The “full market cycle” will complete itself in due time to the detriment of those who fail to heed history, valuations, and psychology.”
Of course, during the late stage of any market advance, there is always the argument which suggests “this time is different.” Mike made an excellent point in this regard previously:
“Given the divergences shown between bond and equity markets, logic says somebody’s wrong. Another possibility is that neither market is sending completely accurate signals about the future state of the economy and inflation. It is clear that bond traders do not buy into this latest growth narrative. Conversely, equity investors are buying the growth and reflation narrative lock, stock and barrel. To be blunt, with global central banks buying both bonds and stocks, the integrity of the playing field as well as normally reliable barometers of market conditions, are compromised.
This divergence between bond and equity traders could prove meaningless, or it may be a prescient warning for one or both of these markets. Either way, investors should be aware of the divergence as such a wide gap in economic opinions is unusual and may portend increased volatility in one or both markets.”
While anything is certainly possible, historical probabilities suggest that not only is “this time NOT different,” it will likely end the same way it always has for investors who fail to heed to bond markets warnings.
Why You Should Care About The Narrowest Yield Curve Since 2007
Money manager Michael Pento is sounding the alarm because we are getting very close to something called a “yield curve inversion.” Pento explains, “Why do I care if the yield curve inverts? Because 9 out of the last 10 times the yield curve inverted, we had a recession… The spread with the yield curve is the narrowest it has been since outside of the start of the Great Recession that commenced in December of 2007… The last two times the yield curve inverted, we had a stock market drop of 50%. The market dropped, and the S&P 500 lost 50% of its value.”
For those who don’t have enough money to require professional management, consider storing water and food because that will never go out of style.
Bond Bear Stops Here: Bill Gross Warns Economy Can’t Support Higher Rates

Having thrown in the towel on his bond bear market call two weeks ago, Janus Henderson’s billionaire bond investor Bill Gross now believes that the most recent bearish bond price (rise in yields) will stop here as the economy cannot support higher yields.
As Gross said two weeks ago, yields won’t see a substantial move from here.
“Supply from the Treasury is a factor in addition to what the Fed might do in terms of a mild, bearish tone for U.S. Treasury bonds,” Gross told Bloomberg TV.
“I would expect the 10-year to basically meander around 2.80 to perhaps 3.10 or 3.15 for the balance of the year. It’s a hibernating bear market, which means the bear is awake but not really growling.”

Since then, yields have tested the upper-end of his channel and are breaking out today to their highest since 2011 (10Y)…

and back to their critical resistance levels (30Y)…

And now Gross is out with a pair of tweets (here and here) saying that the record bond shorts should not get too excited here…

Bill Gross thinks they won’t be right. He highlights the long-term downtrend over the past 30-years, which comes in a 3.22%.
“30yr Tsy long-term downward yield trend line for the past 3 decades now at 3.22%, only ~4bps higher than today’s yield.”

“Will 3.22% be broken to upside?” he asks.
“I don’t think so. The economy can’t support yields higher than 3.25% for 30s and 10s, nor 3% for 5s.
Continuing hibernating bond bear market is best forecast.”
Asa ForexLive also notes, if he’s right it doesn’t necessarily mean the US dollar will reverse right away but it would be a good sign for stocks and would limit how far the US dollar might run.

So, will Gross be right? Is this latest spike all rate-locks on upcoming IG issuance? And will this leave speculators with a record short position now wondering who will be the one holding the greatest fool bag by the end of the year…
Well worth your time to hear what geo-economic consultant Martin Armstrong has to say.
T-Minus… Prepare For Much Higher Long-Term Rates

It is late. We have been crunching data for three days, and won’t bore you with too much prose.
We will be back to fill in the blanks in the next few days but will leave you with some nice charts and data to contemplate. They may help explain why the stock market is trading so poorly even with, what appears, to be stellar earnings.
Determination Of The 10-year Yield
There will be many posts to come on this topic as we believe it is the most critical issue investors need to grapple with and get right over the next year.
What is the right price for the U.S. 10-year Treasury yield?
Moreover, how is the yield determined, and how has it been distorted over the past 20 years by central banks, both foreign and the Federal Reserve?
What does the future hold?
Capital Flows
We agree that inflation, growth expectations, and other fundamental factors weigh heavily on determining bond yields but we always maintain, first, and foremost,
“asset prices are always and everywhere determined by capital flows.”
New Issuance, Foreign, and Fed Flows Into The Treasury Market
The following table illustrates the new issuance of marketable Treasury securities held by the public and net purchases by foreign investors, including central banks, and the Federal Reserve over various periods.

The data show since the beginning of the century, foreign investors, mainly central banks, and the Federal Reserve net purchase of Treasury securities, those which trade in the secondary market, is equivalent to 60 percent of all new marketable debt issued by the Treasury since 2000.
We do not suggest all these purchases were made directly in Treasury auctions, though many of the foreign buys certainly were.
From 2000-2010, foreign central banks were recycling their massive build of foreign exchange reserves back into the Treasury market. During this period, the foreign central banks bought the equivalent of 50 percent of the new issuance. Add foreign private investors and the Fed’s primary open market operations, and the total equated to 70 percent of the debt increase over the period.
Alan Greenspan blames the foreign inflows into the Treasury market during this period for Fed losing control of the yield curve, a major factor and cause of the housing bubble, and not excessively loose monetary policy.
Given the decoupling of monetary policy from long-term mortgage rates, accelerating the path of monetary tightening that the Fed pursued in 2004-2005 could not have “prevented” the housing bubble. – Alan Greenspan, March 2009
Greenspan raised the Fed Funds rate 425 bps from June 2004 to June 2006 and the 10-year barely budged, rising only 52 bps. More on this later.
Fed Plus Total Foreign Purchases


During the Fed’s QE period, 2010-2015, foreign investors and the Fed took down the equivalent of 80 percent of the new debt issuance.
The charts also illustrate that for several of the 3-month rolling periods, net purchases were significantly higher than 100 percent of new supply, distorting not only the 10-year yield, but the valuation of all other asset prices.
Interest rate repression also cause economic distortions, which have political consequences. Most notably, wealth and income disparities.
Rapid Technical Deterioration
Since 2015, flows into the Treasury market have deteriorated markedly, and the timing could not be worse as new Treasury issuance is ballooning with skyrocketing budget deficits.
During the past twelve months, for example, net foreign and Fed flows collapsed to just 17.6 percent of new borrowings. Even worse, the net flows were negative (we estimated March international flows) during the first quarter during a record new issuance of Treasury securities of almost $500 billion.
Can we say, “Gulp”?
Stock Of Outstanding Treasury Securities
Given the rapidly deteriorating technicals and fundamentals — rising inflation –, we believe the 10-year yield should be and will be much higher sometime soon.
That is we are looking for a “super spike” in bond yields, and expect the 10-year to finish the year between 4-5 percent. The term premium, which has been repressed due to all of the above, should begin to normalize.
Why is taking so long?
Aside from the record shorts and natural inertia of markets, the stock of Treasury securities remains favorable, as the bulk is still held by the Fed and foreign central banks, who are not price sensitive.
Debt Stock Shortage, Debt Flow Surplus
Ironically, there remains an artificial shortage of the stock of Treasuries but now a huge glut in the flow. See here for a must read.
The Bund And JGB Anchor?
Treasuries are at almost at record spreads on some maturities vis-à-vis the German bund, and foreigners are on a buying strike as the above data show.
How can an anchor be an anchor if there are no buyers? One asset arbitrage?
It is also not normal for the 10-year to be trading in such a tight range with a record short position in the futures market. The average daily move in the VIX has increased from 0.20 percent in 2016, to 1.37 percent in 2017, and shorts are now hardly spooked by a 500 point flop in the Dow.
Something must be going on beneath the earth’s crust. We have our ideas.
Dollar Strength
The recent dollar strength may be a signal foreigners are getting yield-hungry again, however. We are not so sure the rally has legs.
Market concerns over the political stability of the U.S may trump yield-seeking for the rest of the year.
How Foreign Flows Contributed To The Housing Bubble
We are not going to spend much time here but we are starting coming around to Mr. Greenspan’s reasoning. The lack of response of long-term yields to a 425 bps increase in the Fed Funds rate from 2004-2006 greatly contributed to the housing bubble. The 10-year yield only moved up 52 bps from when the Fed started their tightening to when they paused.
Take a look at the chart.

The Fed’s interest rate hikes didn’t even put a dent in the momentum of the housing bubble. Household mortgage debt continued to rise from 60 to 72 percent of GDP from the first interest rate hike before the market collapsed on itself.
Bubbles are hard to pop.

Why Long-Term Yields Didn’t Respond
Simple.
As, always and everywhere, capital flows or the recycling thereof.
The biggest economic event in the past 25 years, in our opinion, is the exchange rate regime shift that took place in the emerging markets in the late 1990’s. These countries now refuse to allow their currencies to appreciate in any significant magnitude as the result of capital inflows.
They learned some hard lessons in the mid-1990’s with Mexican Peso and Asian Financial Crisis, and the Russian Debt Default.
Balance of payments surpluses are now reconciled with dirty float currency regimes, where central banks intermittently intervene if their currency becomes too strong.
The result was a massive build of global currency reserves, much of which were recycled back into the U.S. Treasury market in the mid-2000’s.

The chart illustrates that foreign central bank net purchases of Treasury securities, alone, were equivalent to the over 66 percent of net Treasury issuance during the Fed 2004-2006 tightening cycle.
International Reserves Drive Gold
The gold price also ramped with international reserves during this period.
We believe the global monetary base, mainly international reserves, is the main driver of gold. See here.
Reserves have not been growing witness the punk trading range in gold. This may change as the U.S. current account blows out again.

Current Account And Trade Deficits
The Mnuchin crowd are wasting their time in China trying to negotiate lower trade deficits. Trade deficits are the result of internal imbalances where investment exceeds savings. See here for another must read.
Introducing trade distortions to artificially lower the external deficit will only accelerate stagflaton, which is already starting to take hold. Then we will all be worse off. See here.
Besides, where is Mr. Mnuchin going to obtain the financing for his proliferating budget deficits if his goal is to run trade surplus or balances with our trading partners?
We are all for better terms of trade and protecting are intellectual property rights, but know and understand thy national income accounting before starting trade wars.
Upshot
We have laid out why we believe, and we could be wrong, long-term yields are unlikely to behave as they did during the last monetary tightening. That is the a further collapse in Treasury term premia and a yield curve inversion until something breaks.
Unless the U.S. blows up its current account again, credit expansion accelerates significantly, creating another blast of capital flows into the emerging markets, to be recycled back to the U.S,, the foreign and Fed financing of the U.S. budget deficit is over. Punto!
We are preparing for a significant move higher in bond yields.
What Is The Right Real Yield?
Do you really think with the deteriorating flows in the bond market, coupled with rising inflation warrant a 0.5 percent real 10-year yield?
Au contraire! We believe a 2-3 percent real yield is closer to fair value.
Tack on another 2.5 percent for inflation, generous as shortages seem to be breaking out everywhere, and that gets the 10-year to at least 4 1/2 percent.
Timing
A little CYA. Yields could move a little lower, maybe to 2.80 percent (a stretch), given the dollar strength as Europe slows, and shorts get spooked.
Our suspicions, however, it is going to be a hot summer. Higher interest rates and lower stock prices.
Disclaimer
Now let us add our disclaimer.
Even if all our facts are correct, our conclusions may be completely wrong.
If you have been reading the Global Macro Monitor over the years, you have probably seen it several times.
To illustrate our point, we like to tell the story Abraham Lincoln used to persuade juries when he was an Illinois circuit court lawyer.
The story goes that Lawyer Lincoln was worried he had not convinced the jury during the closing argument of a civil case against a railroad. The jurors had gone to lunch to deliberate. Lincoln followed them and interrupted their dessert with a story about a farmer’s son gripped by panic,
“Pa, Pa, the hired man and sis are in the hay mow and she’s lifting up her skirt and he’s letting down his pants and they’re a fixin’ to pee on the hay.” “Son, you got your facts absolutely right, but you’re drawing the wrong conclusion.”
The jury ruled in Lincoln’s favor.
China’s Empty Threat of Dumping its US Treasuries
“We are looking at all options.”
In an interview about the trade sanctions that President Trump is throwing at China and at Corporate America – whose supply chains go through China in search of cheap labor and other cost savings – Ambassador Cui Tiankai defended the perennial innocence of China, as is to be expected, and trotted out the standard Chinese fig leafs and state-scripted rhetoric that confirmed in essence that Trump’s decision is on the right track.
Speaking on Bloomberg TV, he also trotted out all kinds of more or less vague and veiled threats – such as, “We will take all measures necessary,” or “We’ll see what we’re doing next” – perhaps having forgotten that China and Hong Kong combined export three times as much to the US as the other way around, and the pain of a trade war would be magnified by three on the Chinese side.
When asked about the possibility of China’s cutting back on purchases of US Treasuries – the ultimate threat, it seems, these days as Congress is piling on record deficits leading to a ballooning mounting of debt that requires a constant flow of new buyers – Ambassador Cui Tiankai said:
“We are looking at all options. That’s why we believe any unilateral and protectionist move would hurt everybody, including the United States itself. It would certainly hurt the daily life of American middle-class people, and the American companies, and the financial markets.”
So let’s dig into this threat.
China held $1.17 trillion in Treasuries as of January. That’s about 5.5% of the $21 trillion in total Treasury debt. So it’s not like they have a monopoly on it. These holdings have varied over the years and are down nearly $100 billion from November 2015:
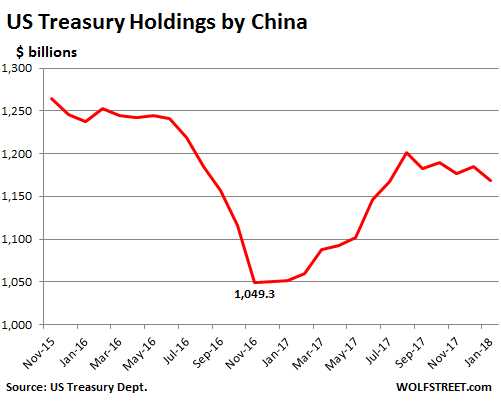
So over the years, the Chinese haven’t been adding Treasuries anyway. Instead, they’ve been shedding some. At the moment, they’re replacing securities that are maturing and nothing more. So they could decide not to replace any maturing Treasuries or they could decide to sell Treasuries. How much impact would that have?
If China dumped its Treasury holdings, in theory, new buyers would have to emerge to buy them, and these new buyers would have to be induced by higher yields. Hence long-term Treasury yields would have to rise.
The vast majority of Treasury debt is held by pension funds of the US government and of state and local governments, and by Americans, either directly or via bond funds, or via stocks in companies like Apple and Microsoft, whose “offshore” cash is invested in all kinds of US securities, including large amounts of US Treasuries, and shareholders of those companies own those securities.
Then there’s the Fed. It holds $2.42 trillion in US Treasuries, or $1.64 trillion more than before the Financial Crisis as a result of QE. If push comes to shove, the Fed could easily mop up a trillion of Treasuries, as it has done before.
In addition, everyone is now fretting about an “inverted yield curve,” which is the phenomenon when long-term yields, such as the 10-year yield, fall below short-term yields, such as the three-month yield or the two-year yield.The last time this happened was before the Financial Crisis.
The Fed’s rate hikes, which started in December 2015, have pushed up short-term yields. For example, the three-month yield went from 0% in late 2015 to 1.74% today. But the 10-year yield, at around 2.2% in December 2015, then declined to a historic low. It has since risen, but only to 2.82% today. In other words, since December 2015, it has gained 62 basis points, while the three-month yield has gained 174 basis points.
What the Fed wants to accomplish with its rate hikes is push up long-term rates. But markets have been fighting the Fed so far. So a sort of a monetary shock, administered from China’s dumping US Treasuries and thus pushing up US long-term yields, would solve that problem. And the Fed can go about its path of raising short-term yields, confident that the Chinese authorities will do their part to push up long-term yields faster than the Fed is pushing up short-term yields. This would steepen the yield curve.
For people who dread and want to avoid a flat or an inverted yield curve, China’s dumping of US Treasuries would be a God send. So China’s threats of this type of retaliation make good media soundbites but are ultimately vacuous.
Bond Carnage hits Mortgage Rates. But This Time, it’s Real
The “risk free” bonds have bloodied investors.
The carnage in bonds has consequences. The average interest rate of the a conforming 30-year fixed mortgage as of Friday was quoted at 4.125% for top credit scores. That’s up about 0.5 percentage point from just before the election, according to Mortgage News Daily. It put the month “on a short list of 4 worst months in more than a decade.”
One of the other three months on that short list occurred at the end of 2010 and two “back to back amid the 2013 Taper Tantrum,” when the Fed let it slip that it might taper QE Infinity out of existence.
Investors were not amused. From the day after the election through November 16, they yanked $8.2 billion out of bond funds, the largest weekly outflow since Taper-Tantrum June.
The 10-year Treasury yield jumped to 2.36% in late trading on Friday, the highest since December 2015, up 66 basis point since the election, and up one full percentage point since July!
The 10-year yield is at a critical juncture. In terms of reality, the first thing that might happen is a rate increase by the Fed in December, after a year of flip-flopping. A slew of post-election pronouncements by Fed heads – including Yellen’s “relatively soon” – have pushed the odds of a rate hike to 98%.
Then in January, the new administration will move into the White House. It will take them a while to get their feet on the ground. Legislation isn’t an instant thing. Lobbyists will swarm all over it and ask for more time to shoehorn their special goodies into it. In other words, that massive deficit-funded stimulus package, if it happens at all, won’t turn into circulating money for a while.
So eventually the bond market is going to figure this out and sit back and lick its wounds. A week ago, I pontificated that “it wouldn’t surprise me if yields fall some back next week – on the theory that nothing goes to heck in a straight line.”
And with impeccable timing, that’s what we got: mid-week, one teeny-weeny little squiggle in the 10-year yield, which I circled in the chart below. The only “pullback” in the yield spike since the election. (via StockCharts.com):

Note how the 10-year yield has jumped 100 basis points (1 percentage point) since July. I still think that pullback in yields is going to happen any day now. As I said, nothing goes to heck in a straight line.
In terms of dollars and cents, this move has wiped out a lot of wealth. Bond prices fall when yields rise. This chart (via StockCharts.com) shows the CBOT Price Index for the 10-year note. It’s down 5.6% since July:

The 30-year Treasury bond went through a similar drubbing. The yield spiked to 3.01%. The mid-week pullback was a little more pronounced. Since the election, the yield has spiked by 44 basis points and since early July by 91 basis points (via StockCharts.com):

Folks who have this “risk free” bond in their portfolios: note that in terms of dollars and cents, the CBOT Price Index for the 30-year bond has plunged 13.8% since early July!

However, the election razzmatazz hasn’t had much impact on junk bonds. They’d had a phenomenal run from mid-February through mid-October, when NIRP refugees from Europe and Japan plowed into them, along with those who believed that crushed energy junk bonds were a huge buying opportunity and that the banks after all wouldn’t cut these drillers’ lifelines to push them into bankruptcy, and so these junk bonds surged until mid-October. Since then, they have declined some. But they slept through the election and haven’t budged much since.
It seems worried folks fleeing junk bonds, or those cashing out at the top, were replaced by bloodied sellers of Treasuries.
Overall in bond-land, the Bloomberg Barclays Global Aggregate bond Index fell 4% from Friday November 4, just before the election, through Thursday. It was, as Bloomberg put it, “the biggest two-week rout in the data, which go back to 1990.”
And the hated dollar – which by all accounts should have died long ago – has jumped since the election, as the world now expects rate hikes from the Fed while other central banks are still jabbering about QE. In fact, it has been the place to go since mid-2014, which is when Fed heads began sprinkling their oracles with references to rate hikes (weekly chart of the dollar index DXY back to January 2014):

The markets now have a new interpretation: Every time a talking head affiliated with the future Trump administration says anything about policies — deficit-funded stimulus spending for infrastructure and defense, trade restrictions, new tariffs, walls and fences, keeping manufacturing in the US, tax cuts, and what not — the markets hear “inflation.”
So in the futures markets, inflation expectations have jumped. This chart via OtterWood Capital doesn’t capture the last couple of days of the bond carnage, but it does show how inflation expectations in the futures markets (black line) have spiked along with the 10-year yield (red line), whereas during the Taper Tantrum in 2013, inflation expectations continued to head lower:

Inflation expectations and Treasury yields normally move in sync. And they do now. The futures markets are saying that the spike in yields and mortgage rates during the Taper Tantrum was just a tantrum by a bunch of spooked traders, but that this time, it’s real, inflation is coming and rates are going up; that’s what they’re saying.
The spike in mortgage rates has already hit demand for mortgages, and mortgage applications during the week plunged. Read… What’ll Happen to Housing Bubble 2 as Mortgage Rates Jump? Oops, they’re already jumping.
The Fed’s Stunning Admission Of What Happens Next
Following an epic stock rout to start the year, one which has wiped out trillions in market capitalization, it has rapidly become a consensus view (even by staunch Fed supporters such as the Nikkei Times) that the Fed committed a gross policy mistake by hiking rates on December 16, so much so that this week none other than former Fed president Kocherlakota openly mocked the Fed’s credibility when he pointed out the near record plunge in forward break evens suggesting the market has called the Fed’s bluff on rising inflation.
All of this happened before JPM cut its Q4 GDP estimate from 1.0% to 0.1% in the quarter in which Yellen hiked.
To be sure, the dramatic reaction and outcome following the Fed’s “error” rate hike was predicted on this website on many occasions, most recently two weeks prior to the rate hike in “This Is What Happened The Last Time The Fed Hiked While The U.S. Was In Recession” when we demonstrated what would happen once the Fed unleashed the “Ghost of 1937.”
As we pointed out in early December, conveniently we have a great historical primer of what happened the last time the Fed hiked at a time when it misread the US economy, which was also at or below stall speed, and the Fed incorrectly assumed it was growing.
We are talking of course, about the infamous RRR-hike of 1936-1937, which took place smack in the middle of the Great Recession.

Here is what happened then, as we described previously in June.
[No episode is more comparable to what is about to happen] than what happened in the US in 1937, smack in the middle of the Great Depression. This is the only time in US history which is analogous to what the Fed will attempt to do, and not only because short rates collapsed to zero between 1929-36 but because the Fed’s balance sheet jumped from 5% to 20% of GDP to offset the Great Depression.
Just like now.
Follows a detailed narrative of precisely what happened from a recent Bridgewater note:
The first tightening in August 1936 did not hurt stock prices or the economy, as is typical.
The tightening of monetary policy was intensified by currency devaluations by France and Switzerland, which chose not to move in lock-step with the US tightening. The demand for dollars increased. By late 1936, the President and other policy makers became increasingly concerned by gold inflows (which allowed faster money and credit growth).
The economy remained strong going into early 1937. The stock market was still rising, industrial production remained strong, and inflation had ticked up to around 5%. The second tightening came in March of 1937 and the third one came in May. While neither the Fed nor the Treasury anticipated that the increase in required reserves combined with the sterilization program would push rates higher, the tighter money and reduced liquidity led to a sell-off in bonds, a rise in the short rate, and a sell-off in stocks. Following the second increase in reserves in March 1937, both the short-term rate and the bond yield spiked.
Stocks also fell that month nearly 10%. They bottomed a year later, in March of 1938, declining more than 50%!
Or, as Bank of America summarizes it: “The Fed exit strategy completely failed as the money supply immediately contracted; Fed tightening in H1’37 was followed in H2’37 by a severe recession and a 49% collapse in the Dow Jones.”
* * *
As it turns out, however, the Fed did not even have to read this blog, or Bank of America, or even Bridgewater, to know the result of its rate hike. All it had to do was to read… the Fed.
But first, as J Pierpont Morgan reminds us, it was Charles Kindleberger’s “The World in Depression” which summarized succinctly just how 2015/2016 is a carbon copy of the 1936/1937 period. In explaining how and why both the markets and the economy imploded so spectacularly after the Fed’s decision to tighten in 1936, Kindleberger says:
“For a considerable time there was no understanding of what had happened. Then it became clear. The spurt in activity from October 1936 had been dominated by inventory accumulation. This was especially the case in automobiles, where, because of fears of strikes, supplies of new cars had been built up. It was the same in steel and textiles – two other industries with strong CIO unions.”
If all off this sounds oddly familiar, here’s the reason why: as we showed just last week, while inventories remain at record levels, wholesale sales are crashing, and the result is that the nominal spread between inventories and sales is all time high.

The inventory liquidation cycle was previewed all the way back in June in “The Coming US Recession Charted” long before it became “conventional wisdom.”
Kindleberger continues:
When it became evident after the spring of of 1937 that commodity prices were not going to continue upward, the basis for the inventory accumulation was undermined, and first in textiles, then in steel, the reverse process took place.
Oil anyone?
And then this: “The steepest economic descent in the history of the United States, which lost half the ground gained for many indexes since 1932, proved that the economic recovery in the United States had been built on an illusion.“
Which, of course, is what we have been saying since day 1, and which even such finance legends as Bill Gross now openly admit when they say that the zero-percent interest rates and quantitative easing created leverage that fueled a wealth effect and propped up markets in a way that now seems unsustainable, adding that “the wealth effect is created by leverage based on QE’s and 0% rates.“
And not just Bill Gross. The Fed itself.
Yes, it was the Fed itself who, in its Federal Reserve Bulletin from June 1938 as transcribed in the 8th Annual General Meeting of the Bank of International Settlements, uttered the following prophetic words:
The events of 1929 taught us that the absence of any rise in prices did not prove that no crisis was pending. 1937 has taught us that an abundant supply of gold and a cheap money policy do not prevent prices from falling.
If only the Fed had listened to, well, the Fed.
What happened next? The chart below shows the stock market reaction in 1937 to the Fed’s attempt to tighten smack in the middle pf the Great Depression.

If the Fed was right, the far more prophetic 1937 Fed that is not the current wealth effect-pandering iteration, then the market is about to see half its value wiped out.

Fear porn or another opportunity to BTFD? Source: ZeroHedge
Why US Stock And Bond Markets Are High
We’ve been saying for quite some time now that the US equity market’s seemingly inexorable (until this week) tendency to rise to new highs in the absence of the Fed’s guiding hand is almost certainly in large part attributable to the fact that in a world where you are literally guaranteed to lose money if you invest in safe haven assets such as negative-yielding German bunds, corporations can and will take advantage of the situation by issuing debt and using the proceeds to buy back stock, thus underwriting the rally in US equities. Here’s what we said after stocks turned in their best month in three years in February:
It also explains why, in the absence of the Fed, stocks continue to rise as if QE was still taking place: simply said, bondholders – starved for any yield in an increasingly NIRP world – have taken the place of the Federal Reserve, and are willing to throw any money at companies who promise even the tiniest of returns over Treasuries, oblivious if all the proceeds will be used immediately to buyback stock, thus pushing equity prices even higher, but benefiting not only shareholders but management teams who equity-linked compensation has likewise never been higher.
If you need further proof that this is precisely what is going on in US markets, consider the following from Citi:
Companies are rapidly re-leveraging…

…and the proceeds sure aren’t being invested in future productivity, but rather in buy backs and dividends…

…and Citi says all that debt issued by struggling oil producers may prove dangerous given that “default risk in the energy space has jumped [and considering] the energy sector now accounts for 18% of the market”…
 …and ratings agencies are behind the curve…

 We’ll leave you with the following:
To be sure, this theater of financial engineering – because stocks are not going up on any resemblance of fundamental reasons but simply due to expanding balance sheet leverage – will continue only until it can no longer continue.
