Tag Archives: Recession

New Data: Huge Plunge in Manufacturing. Recession is Here!

(Peter St Onge, Ph.D) The Federal Reserve has been gas lighting the American people for two years now on inflation in the economy. At this point the happy talk is hitting reality with the latest Empire State manufacturing survey, a bellwether for conditions across the country showing its biggest plunge ever, second only to the month they literally shut down the economy for COVID-19.  Economists had expected a minus five on the survey. A minus means the economy is contracting.  The actual number was minus 31.

Continue reading

If SVB Was Insolvent, So Is Everyone Else

(Simon Black) On Sunday afternoon, September 14, 2008, hundreds of employees of the financial giant Lehman Brothers walked into the bank’s headquarters at 745 Seventh Avenue in New York City to clear out their offices and desks.

Lehman was hours away from declaring bankruptcy. And its collapse the next day triggered the worst economic and financial devastation since the Great Depression.

Continue reading

JPMorgan Admits Central Banks Need A Recession “To Cure Inflation”

Over the past few months we have repeated a statement which – because it is controversial and because it is true – sparked feigned outrage among the financially illiterate macrotourists (which these days is the vast majority of the financial commentariat): we said that in light of the galloping inflation which has crushed BIden’s approval ratings and has ensured a landslide loss for Democrats in the midterms, the Fed desperately wants to create a recession (and, at this rate, it will get it).

Today, our tinfoil conspiratorial theories once again were validated today when none other than JPMorgan’s European economists admitted that…

Continue reading

Trucker Stocks Plunge After First Post-COVID Job-Losses As Freight Recession Looms

Tender rejections are the best indicator into real-time supply/demand in the truckload sector.

Just wait for April… 

https://www.zerohedge.com/markets/why-freight-recession-imminent

***

Yield Curve Inverts Dramatically As Goldman Sees Recession Risks Soaring

..2s30s just inverted for the first time since 2007…


Recession 2020: 5 Reasons It Will Be Worse Than 2009

In this recession 2020 video YOU are going to discover 5 reasons (NO ONE IS TALKING ABOUT) the next recession will be far worse than the 2008/2009 recession. The Fed has created so much mal investment, by keeping interest rates artificially low, we now have the EVERYTHING BUBBLE. Stocks are in a bubble, bonds are in a bubble, housing is in a bubble and the 2020 recession (which the data suggests is highly probable) will be the pin that pricks them all.

We’ve had recessions in the US every 6-8 years throughout our history, and we’re currently 10 years into an expansion which makes the US due for a recession in 2020. While not all recessions are devastating, because the debt bubbles are so much bigger now than in 2009, the next recession has the potential to be the worst by far.

Yield Curve Steepest In 14 Months: What Happens Next?

The Fed, reportedly, took action in 2019 – with its massive flip-flop, cutting rates drastically and expanding its balance sheet at the fastest pace since the financial crisis –  in order to ‘fix’ the yield curve which had dropped into the media-terrifying inverted state… but what investors (and The Fed) appear to have forgotten (or choose to ignore) is that it is now much more concerning.

The last few months have seen the yield curve steepen dramatically, up 35bps from August’s -5bps spread in 2s10s to over 30bps today – the steepest since October 2018…

Source: Bloomberg

That is great news, right? No more recession risk, right?

Wrong!


While investors buy stocks with both hands and feet, we take a look at how risk assets perform after the curve flattens and/or inverts. According to back tests from Goldman, while risky assets in general can have positive performance with a flat yield curve, risky asset performances tend to be lower. This is consistent with Goldman’s base case forecast combining low (but positive) returns from here given the lack of profit growth and a less favorable macro backdrop.

What is far more notable, as ZeroHedge showed most recently last July, is that since the mid-1980s, significant stock draw downs (i.e. market crashes) began only when term slope started steepening after being inverted.

And remember, the yield curve’s forecasting record since 1968 has been perfect: not only has each inversion been followed by a recession, but no recession has occurred in the absence of a prior yield-curve inversion. There’s even a strong correlation between the initial duration and depth of the curve inversion and the subsequent length and depth of the recession.

So, be careful what you wish for… and celebrate; because as history has shown, the un-inverting of the yield curve is when the recessions start and when the markets begin to reflect reality.

Source: ZeroHedge

The Real Reasons Why The Media Is Suddenly Admitting To The Recession Threat

(Brandon Smith) One thing that is important to understand about the mainstream media is that they do tell the truth on occasion. However, the truths they admit to are almost always wrapped in lies or told to the public far too late to make the information useful.   Dissecting mainstream media information and sifting out the truth from the propaganda is really the bulk of what the alternative media does (or should be doing).  In the past couple of weeks I have received a rush of emails asking about the sudden flood of recession and economic crash talk in the media.  Does this abrupt 180 degree turn by the MSM (and global banks) on the economy warrant concern?  Yes, it does.

The first inclination of a portion of the liberty movement will be to assume that mainstream reports of imminent economic crisis are merely an attempt to tarnish the image of the Trump Administration, and that the talk of recession is “overblown”.  This is partially true; Trump is meant to act as scapegoat, but this is not the big picture.  The fact is, the pattern the media is following today matches almost exactly with the pattern they followed leading up to the credit crash of 2008.  Make no mistake, a financial crash is indeed happening RIGHT NOW, just as it did after media warnings in 2007/2008, and the reasons why the MSM is admitting to it today are calculated.

Before we get to that, we should examine how the media reacted during the lead up to the crash of 2008.

Multiple mainstream outlets ignored all the crash signals in 2005 and 2006 despite ample warnings from alternative economists. In fact, they mostly laughed at the prospect of the biggest bull market in the history of stocks and housing (at that time) actually collapsing. Then abruptly the media and the globalist institutions that dictate how the news is disseminated shifted position and started talking about “recession” and “crash potential”. From the New York Times to The Telegraph to Reuters and others, as well as the IMF, BIS and Federal Reserve officials – Everyone suddenly started agreeing with alternative economists without actually deferring to them or giving them any credit for making the correct financial calls.

In 2007/2008, the discussion revolved around derivatives, a subject just complicated enough to confuse the majority of people and cause them to be disinterested in the root trigger for the economic crisis, which was central bankers creating and deflating bubbles through policy engineering. Instead, the public just wanted to know how the crash was going to be fixed. Yes, some blame went to the banking system, but almost no one at the top was punished (only one banker in the US actually faced fraud charges). Ultimately, the crisis was pinned on a “perfect storm” of coincidences, and the central banks were applauded for their “swift action” in using stimulus and QE to save us all from a depression level event. The bankers were being referred to as “heroes”.

Of course, central bank culpability was later explored, and Alan Greenspan even admitted partial responsibility, saying the Fed knew there was a bubble, but was “not aware” of how dangerous it really was. This was a lie. According to Fed minutes from 2004, Greenspan sought to silence any dissent on the housing bubble issue, saying that it would stir up debate on a process that “only the Fed understood”. Meaning, there was indeed discussion on housing and credit warning signs, but Greenspan snuffed it out to prevent the public from hearing about it.

Today we have a very similar dynamic. Use of the “R word” in the mainstream media and among central banks has been strictly contained for the past several years.  In the October 2012 Fed minutes, Jerome Powell specifically warned of what would happen if the Federal Reserve tightened liquidity and raised interest rates into economic weakness.  He warned that this would have negative effects on the stimulus addicted investment environment that the central bank had fostered.  This discussion was held back from the public until only a year-and-a-half ago.  As soon as Powell became chairman, he implemented those exact actions.

Only in the past year has talk of recession begun to break out, and only in the past couple of weeks have outlets become aggressive in pushing the notion that a financial crash is just around the corner. The reality is that if one removes the illusory support of central bank stimulus, our economy never left the “Great Recession” of 2008.  Signals of renewed sharp declines in economic fundamentals have been visible since before the 2016 elections.  Alarms have been blaring on housing, auto markets, manufacturing, freight and shipping, historic debt levels, the yield curve, etc. since at least winter of last year, just as the Fed raised rates to their neutral rate of inflation and increased asset cuts from the balance sheet to between $30 billion to $50 billion or more per month.

The media should have been reporting on economic crisis dangers for the past 2-3 years.  But, they didn’t give these problems much credence until recently.  So, what changed?

I can only theorize on why the media and the banking elites choose the timing they do to admit to the public what is about to happen. First, it is clear from their efforts to stifle free discussion that they do not want to let the populace know too far ahead of time that a crash is coming. According to the evidence, which I have outlined in-depth in previous articles, central banks and international banks sometimes engineer crash events in order to consolidate wealth and centralize their political power even further. Is it a conspiracy? Yes, it is, and it’s a provable one.

When they do finally release the facts, or allow their puppet media outlets to report on the facts, it seems that they allow for around 6-8 months of warning time before economic shock events occur. In the case of the current crash in fundamentals (and eventually stocks), the time may be shorter. Why? Because this time the banks and the media have a scapegoat in the form of Donald Trump, and by extension, they have a scapegoat in the form of conservatives, populists, and sovereignty activists.

The vast majority of articles flowing through mainstream news feeds on economic recession refer directly to Trump, his supporters and the trade war as the primary villains behind the downturn. The warnings from the Fed, the BIS and the IMF insinuate the same accusation.

Anyone who has read my work for the past few years knows I have been warning about Trump as a false prophet for the liberty movement and conservatives in general. And everyone knows my primary concern has been that the globalists will crash the Everything Bubble on Trump’s watch, and then blame all conservatives for the consequences.

To be clear, Trump is not the cause of the Everything Bubble, nor is he the cause of its current implosion. No president has the power to trigger a collapse of this magnitude, only central banks have that power. When Trump argues that the Fed is causing a downturn, he is telling the truth, but when he claims that recession fears are exaggerated, or “inappropriate”, he is lying.   What he is not telling the public is that his job is to HELP the Fed in this process of controlled economic demolition.

Admissions of crisis in the media are coinciding directly with Trump’s policy actions. In other words, Trump is providing perfect cover for the central banks to crash the economy without receiving any of the blame. Trump’s insistence on taking full credit for the bubble in stock markets as well as fraudulent GDP and employment numbers, after specifically warning about all of these things during his election campaign, has now tied the economy like a noose around the necks of conservatives. The tone of warning in the media indicates to me that the banking elites are about to tighten that noose.

Another factor on our timeline beyond Trump’s helpful geopolitical distractions is the possibility of a ‘No-Deal’ Brexit in October.  I continue to believe this outcome (or something very similar) has been pushed into inevitability by former Prime Minister Theresa May and EU globalists, and that it will be used as yet another scapegoat for the now accelerating crash in the EU.  With Germany on the verge of admitting recession, Deutsche Bank on the edge of insolvency, Italy nearing political and financial crisis, etc., it is only a matter of months before Europe sees its own “Lehman moment”.  The Brexit is, in my view, a marker for a timeline on when the crash will hit its stride.

To summarize, the mainstream media and global banking institutions have two goals in informing the public about recession right now – They are seeking to cover their own asses when the next shoe drops so they can say they “tried to warn us”, and, they are conditioning a majority of the public to automatically blame conservatives and sovereignty proponents when the consequences hit them without mercy.

As the truth of a recession smacks the public in the face, the media will likely pull back slightly, just as they did in 2008, and suggest that the downturn is “temporary”.  They will claim it’s “not a repeat of the credit crisis”, or that it will “subside after Trump is out of office”.  These will all be lies designed to keep the public complacent even as the house of cards collapses around them.  The fact is, the hard data shows that economic conditions in the US and in most of the world are far more unstable than they were in 2008.  We are not looking at the crash of a credit bubble, we are looking at the crash of the ‘Everything Bubble’.

The pace of the narrative is quickening, and I would suggest that a collapse of the bubble will move rather quickly, perhaps in the next four to six months. If it does, then it is likely that Trump is not slated for a second term as president in 2020. Trump’s highly divisive support for “Red Flag” gun laws, a move that will lose him considerable support among pro-gun conservatives, also indicates to me that it is likely he is not meant to be president in 2020.  This is another sign that a massive downturn is closing in.

As events are unfolding right now, it appears that Trump has served his purpose for the globalists and is slated to be replaced next year; probably by an extreme far-left Democrat.  There are only a couple of scenarios I can imagine in which Trump remains in office, one of them being a major war which might require him to retain the presidency so the globalists can finish out a regime change agenda in nations like Iran or Venezuela.  This could, however, be pursued under a Democrat president almost as easily as long as Trump and his elitist cabinet lay the groundwork beforehand.

As in 2007/2008, it is unlikely that the mainstream would admit to a downturn that is not coming soon. Using the behavior of the media and of banking institutions as a guide, we can predict with some measure of certainty a crisis within the economy in the near term. Clearly, a major breakdown is slated to take place before the election of 2020, if not much sooner.

Source: by Brandon Smith | Alt-Market.com

Recession Alarm: US Manufacturing PMI Unexpectedly Crashes Into Contraction With Lowest Print In 10 Years

With all eyes focused squarely on Germany’s dismal PMI prints, which have been in contraction for over half a year, the investing public forgot that the US economy is similarly slowing down. And moments ago it got a jarring reminder when Markit reported that the US manufacturing PMI unexpectedly tumbled into contraction territory, down from 50.4 last month, and badly missing expectations of a 50.5 rebound. This was the first print below the 50.0 expansion threshold for the first time since September 2009.

But wait, there’s more, because whereas until now the US services segment appeared immune to the slowdown in US manufacturing, in August the service PMI tumbled to 50.9, down from 53.0 in July, matching the lowest print in at least 3 years, and well below the 52.8 consensus expectation.  According to Markit, subdued demand conditions continued to act as a brake on growth, with the latest rise in new work the slowest since March 2016. This contributed to a decline in backlogs of work for the first time in 2019 to date.

Meanwhile, business expectations among service providers for the next 12 months eased in August and were the lowest since this index began nearly a decade ago.

As the report further notes, the decline in the headline PMI mainly reflected a much weaker contribution from new orders, which offset a stabilization in employment and fractionally faster output growth.

This however was offset by new business received by manufacturing companies, which fell for the second time in the past four months during August. Although only marginal, the latest downturn in order books was the sharpest for exactly 10 years. The data also signaled the fastest reduction in export sales since August 2009.

Survey respondents indicated that a drop in sales often cited a soft patch across the automotive sector, alongside a headwind to manufacturing exports from weaker global economic conditions. Meanwhile, manufacturing companies continued to trim their inventory levels in August, which was mainly linked to concerns about the demand outlook. Pre-production inventories fell for the fourth month running, while stocks of finished goods decreased to the greatest extent since June 2014 fastest reduction in export sales since August 2009.

Survey respondents indicated that a drop in sales often cited a soft patch across the automotive sector, alongside a headwind to manufacturing exports from weaker global economic conditions.

Commenting on the flash PMI data, Tim Moore, Economics Associate Director at IHS Markit said:

“August’s survey data provides a clear signal that economic growth has continued to soften in the third quarter. The PMIs for manufacturing and services remain much weaker than at the beginning of 2019 and collectively point to annualized GDP growth of around 1.5%.

The most concerning aspect of the latest data is a slowdown in new business growth to its weakest in a decade, driven by a sharp loss of momentum across the service sector. Survey respondents commented on a headwind from subdued corporate spending as softer growth expectations at home and internationally encouraged tighter budget setting.

“Manufacturing companies continued to feel the impact of slowing global economic conditions, with new export sales falling at the fastest pace since August 2009.

“Business expectations for the year ahead became more gloomy in August and remain the lowest since comparable data were first available in 2012. The continued slide in corporate growth projections suggests that firms may exert greater caution in relation to spending, investment and staff hiring during the coming months.”

An interesting nuance as noted by Viraj Patel of Arkera, is that while German economic sentiment may be troughing (granting in very contractionary territory), it is now America’s turn to slump into recession:


A few days ago ZeroHedge reported that the easiest way for Trump to get the Fed to launch QE was to i) start a global economic war or ii) send the US economy into recession. Based on today’s data, Trump is making great progress on the latter, and we are confident the former can’t be far behind.

Source: ZeroHedge

It’s Not Too Soon For A Fed Rate Cut, According To This Chart

  • The time between the Fed’s final interest rate hike and its first rate cut in the past five cycles has averaged just 6.6 months, according to Natixis economist Joseph LaVorgna. 
  • The bond market  has quickly pivoted, and fed funds futures are pricing in a quarter point of easing for this year, just days after the Fed forecast no more hikes for this year. 
  • LaVorgna said there are three conditions required for a Fed reversal, and that of a soft economy could soon be met.

(by Patti Domm) The bond market has quickly priced in a Federal Reserve interest rate cut this year, just days after the Fed said it would stop raising rates.

That has been a surprise to many investors, but it shouldn’t be — if history is a guide.

Joseph LaVorgna, Natixis’ economist for the Americas, studied the last five tightening cycles and found there was an average of just 6.6 months from the Federal Reserve’s last interest rate hike in a hiking cycle to its first rate cut.

The economist points out, however, that the amount of time between hike and cut has been lengthening.

“For example, there was only one month from the last tightening in August 1984 to the first easing in September 1984. This was followed by a four-month window succeeding the July 1989 increase in rates, a five-month gap after the February 1995 hike, an eight-month interlude from May 2000 to January 2001, and then a record 15- month span between June 2006 and September 2007,” he wrote.

The Fed last hiked interest rates by a quarter point in December. Last week, it confirmed a new dovish policy stance by eliminating two rate hikes from its forecast for this year. That would leave interest rates unchanged for the balance of the year, with the Fed expecting one more increase next year.

But the fed funds futures market has quickly moved to price in a full fledged 25 basis point easing, or cut, for this year.

“The market’s saying it’s going to happen in December,” said LaVorgna.

There are three conditions that need to be met for the Fed to reverse course and cut interest rates, LaVorgna said. First, the economy’s bounce back after the first quarter slump would have to be weaker than expected, with growth just around potential. Secondly, there would have to be signs that inflation is either undershooting the Fed’s 2 percent target or even decelerating. Finally, the Fed would have to see a tightening of financial conditions, with stock prices under pressure and credit spreads widening.

LaVorgna said the condition of a sluggish economy could be met.

“I don’t think the economy did very well in the first quarter just based on the fact the momentum downshifted hard from Q4, sentiment was awful, production was soft,” he said. ’I’m worried growth is close to zero in the first quarter.”

LaVorgna said he does not see much of a snap back in the second quarter.

In the current cycle, the Federal Reserve began raising interest rates in December 2015 after taking the fed funds target rate to zero during the financial crisis.

Source: by Patti Domm | CNBC

***

Americans Are Only Now Starting To Seek Higher Deposit Rates… Just As The Fed Prepares To Cut


Yield Curve Inverts For The First Time Since 2007: Recession Countdown Begins

The most prescient recession indicator in the market just inverted for the first time since 2007.

https://www.zerohedge.com/s3/files/inline-images/bfm960.jpg?itok=c0gP8hQC

https://i0.wp.com/northmantrader.com/wp-content/uploads/2019/03/yield.png?ssl=1

Don’t believe us? Here is Larry Kudlow last summer explaining that everyone freaking out about the 2s10s spread is silly, they focus on the 3-month to 10-year spread that has preceded every recession in the last 50 years (with few if any false positives)… (fwd to 4:20)

As we noted below, on six occasions over the past 50 years when the three-month yield exceeded that of the 10-year, economic recession invariably followed, commencing an average of 311 days after the initial signal. 

And here is Bloomberg showing how the yield curve inverted in 1989, in 2000 and in 2006, with recessions prompting starting in 1990, 2001 and 2008. This time won’t be different.

https://www.zerohedge.com/s3/files/inline-images/prior%20inversions.jpg?itok=BgnEMjCQ

On the heels of a dismal German PMI print, world bond yields have tumbled, extending US Treasuries’ rate collapse since The Fed flip-flopped full dovetard.

https://www.zerohedge.com/s3/files/inline-images/bfm14B0.jpg?itok=Ez0lIVd_

The yield curve is now inverted through 7Y…

https://www.zerohedge.com/s3/files/inline-images/bfm1EA4.jpg?itok=xPH6zVO8

With the 7Y-Fed-Funds spread negative…

https://www.zerohedge.com/s3/files/inline-images/bfm2864.jpg?itok=HqnSx1RR

Bonds and stocks bid after Powell threw in the towell last week…

https://www.zerohedge.com/s3/files/inline-images/bfmA98E.jpg?itok=D4zUXHf3

But the message from the collapse in bond yields is too loud to ignore. 10Y yields have crashed below 2.50% for the first time since Jan 2018…

https://www.zerohedge.com/s3/files/inline-images/bfm5670.jpg?itok=rocy5sKV

Crushing the spread between 3-month and 10-year Treasury rates to just 2.4bps – a smidge away from flashing a big red recession warning…

https://www.zerohedge.com/s3/files/inline-images/bfm36A8.jpg?itok=3cfUyMJ1

Critically, as Jim Grant noted recently, the spread between the 10-year and three-month yields is an important indicator, James Bianco, president and eponym of Bianco Research LLC notes today. On six occasions over the past 50 years when the three-month yield exceeded that of the 10-year, economic recession invariably followed, commencing an average of 311 days after the initial signal. 

Bianco concludes that the market, like Trump, believes that the current Funds rate isn’t low enough:

While Powell stressed over and over that the Fed is at “neutral,” . . . the market is saying the rate hike cycle ended last December and the economy will weaken enough for the Fed to see a reason to cut in less than a year.

https://www.zerohedge.com/s3/files/inline-images/bfm1B73_0.jpg?itok=iZGfa7C7

Equity markets remain ignorant of this risk, seemingly banking it all on The Powell Put. We give the last word to DoubleLine’s Jeff Gundlach as a word of caution on the massive decoupling between bonds and stocks…

“Just because things seem invincible doesn’t mean they are invincible. There is kryptonite everywhere. Yesterday’s move created more uncertainty.”

Source: ZeroHedge

10Y Treasury Yield Tumbles Below 2.50% As 7Y Inverts

The bond bull market is alive and well with yesterday’s bond-bear-battering by The Fed extending this morning.

10Y Yields are back below 2.50% for the first time since Jan 2018…

https://www.zerohedge.com/s3/files/inline-images/bfmCA1F.jpg?itok=_jgnif7R

…completely decoupled from equity markets….

https://www.zerohedge.com/s3/files/inline-images/bfm51AD.jpg?itok=s4YZh3r-

The yield is now massively inverted to Fed Funds…

https://www.zerohedge.com/s3/files/inline-images/bfm8BAA.jpg?itok=hEx0M8LV

With 7Y yields now below effective fed funds rate…

https://www.zerohedge.com/s3/files/inline-images/bfm5F7C.jpg?itok=yYvetY6-

Source: ZeroHedge

Recession Signal Getting Louder: 5-Year Yield Inverts With 3-Month Yield

The yield curve is inverted in 11 different spots. The latest is 5-year to 3-month inversion.

https://www.zerohedge.com/s3/files/inline-images/2019-02-27_5-47-38.jpg?itok=PW46u5cc

The yield curve recession signal is louder and louder. Inversions are persistent and growing.

https://www.zerohedge.com/s3/files/inline-images/https___s3-us-west-2.amazonaws%20%2810%29_1.jpg?itok=a4nvYnOV

Let’s compare the spreads today to that of December 18, the start of the December 2018 FOMC meeting.

Yield Curve 2019-02-26 vs December and October 2018

https://www.zerohedge.com/s3/files/inline-images/https___s3-us-west-2.amazonaws%20%2811%29_1.jpg?itok=fBQyAcf-

Yield Curve Spread Analysis

https://www.zerohedge.com/s3/files/inline-images/https___s3-us-west-2.amazonaws%20%2812%29_1.jpg?itok=rSGh9O9m

Spread Changes

  • Yellow: Spreads Collapsed Since October (1 Month to 5 Years)
  • Pink: Spreads Remained Roughly the Same (7 Year)
  • Blue: Spreads Increased (30-Year and 10-Year)

Something Happening

Something is happening. What is it?

https://www.zerohedge.com/s3/files/inline-images/2019-02-27_5-51-51.jpg?itok=EnviRvls

Possibilities

  1. The bond market is staring to worry about trillion dollar deficits as far as the eye can see
  2. The bond market has stagflation worries
  3. The bond bull market is over or approaching

My take is number one and possibly all three.

An in regards to recession the economy is weakening fast.

Source: by Mike Shedlock via MishTalk| ZeroHedge

***

Core US Factory Orders Suffer Worst Slump In 3 Years

US core factory orders (ex transports) fell for the second month in a row in December. This is the worst sequential drop since Feb 2016.

New orders ex-trans fell 0.6% in Dec. after falling 1.3% the prior month.

https://www.zerohedge.com/s3/files/inline-images/2019-02-27_7-13-00.jpg?itok=bUbibSEj

The headline factory orders rose 0.1% MoM (well below the 0.6% MoM gain expected).

Capital goods non-defense ex aircraft new orders for Dec. fall 1% after falling 1.1% in Nov.

Non-durables shipments for Dec. fall 1% after falling 2% in Nov.

Not a pretty picture, but it was an 8.0% drop in Defense spending that triggered the weakness – so we’re gonna need moar war.

What Caused the Recession of 2019-2021?

The banquet of consequences is now being served, but the good seats have all been taken.

(Charles Hugh Smith) As I discussed in We’re Overdue for a Sell-Everything/No-Fed-Rescue Recession, recessions have a proximate cause and a structural cause. The proximate cause is often a spike in energy costs (1973, 1990) or a financial crisis triggered by excesses of speculation and debt (2000 and 2008) or inflation (1980).

Structural causes are imbalances that build up over time: imbalances in trade or currency flows, capital investment, debt, speculation, labor compensation, wealth-income inequality, energy supply and consumption, etc. These structural distortions and imbalances tend to interact in self-reinforcing dynamics that overlap with normal business / credit cycles.

The current recession has not yet been acknowledged, but this is standard operating procedure: recessions are only declared long after they actually start due to statistical reporting lags. Maybe the recession of 2019-21 will be declared at some point in the future to have begun in Q2 or Q3, but the actual date is not that meaningful; what matters is what caused the recession and how the structural imbalances are resolved.

So what caused the recession of 2019-21? Apparently nothing: oil costs are relatively low, U.S. banks are relatively well-capitalized, geopolitical issues are on the backburner and stocks, bonds and real estate are all well-bid (i.e. there is no liquidity crisis).

This lack of apparent trigger will mystify conventional economists who generally avoid the enormous structural imbalances in our economy because those imbalances are the only possible output of our Neofeudal Power Structure in which a New Nobility/Oligarchy dominates financial and political power and skims the vast majority of gains the economy generates.

The cause of the recession of 2019-21 is exhaustion: exhaustion of the pell-mell expansion of credit (i.e. credit exhaustion/saturation), exhaustion in the household and small business sectors as real-world price increases continue exceeding wage and revenue gains, exhaustion of margin expansion in stocks, and exhaustion of Corporate America’s policy of masking inflation by reducing quality and quantity: at some point, the toilet paper roll is so visibly diminished (i.e. stealth inflation) that companies can no longer reduce the quantity: at that point, they must raise prices to remain profitable, and this explains the recent surge in the sticker price of consumer staples.

Conventional economics has no answer for exhaustion: the only “solution” in a Keynesian universe is to goose borrowing by lowering interest rates and sluicing limitless liquidity into the financial system.

But if everyone who is qualified to borrow more has no interest in borrowing more, lenders turn to unqualified borrowers who will soon default. This sets up a destruction of debt, collateral and wealth that also has no policy answer. The credit impulse doesn’t expire, it simply fades away, along with “growth,” rising stock markets, higher tax revenues, etc.

The second “solution” is to substitute government spending for private spending. But in case nobody noticed, please observe that state/local and federal borrowing and spending has been soaring at insanely unsustainable rates since 2008.

https://www.oftwominds.com/photos2018/federal-debt2-19a.png

Exhaustion overtook the global economy in 2016, but central banks injected massive doses of financial adrenaline to shock the comatose patient. This “solution” continues to this day, as China’s central bank reportedly injected an unprecedented $1.2 trillion into credit markets in January alone.

The problem with financial adrenaline is that every dose reduces the impact of the next dose. At some point, the patient fails to respond. The positive effects of the stimulus become toxic, and attempts to increase dosage will only push the patient into collapse.

That’s where the global economy is today. The exhaustion that was taking hold in 2016 was stimulated away by unprecedented injections of monetary stimulus. The response to current massive injections is between tepid and zero. Adding debt to stimulate “growth” no longer works, and injecting the patient with higher doses of stimulus will only cause collapse.

https://www.oftwominds.com/photos2018/TCMDO3-18.png

The banquet of consequences is now being served, but the good seats have all been taken by those with no debt, unimpaired collateral and little dependence on central bank stimulus or central state legerdemain. All that’s left are the bad seats with horrendous consequences for perverse, distorting policies that refused to deal directly with painfully obvious imbalances.

Source: by Charles Hugh Smith | Of Two Minds

Zillow: The Next Recession is Two Years Away

The next U.S. recession is likely to begin in the first quarter of 2020

The next U.S. recession is likely to begin in the first quarter of 2020, according to a poll of 100 economists published Zillow’s Home Price Expectations Survey for the second quarter.

More than half of the survey respondents pointed to monetary policy as the likeliest cause for the next downturn, with only nine of the polled economists predicting that the housing market will be the cause of the next crash. Indeed, most of the economists predicted home values will rise 5.5 percent in 2018 to a median of $220,800. But if the Federal Reserve raises rates too quickly, the economists warned, the economy will start to slow and that could spur a new recession.

“As we close in on the longest economic expansion this country has ever seen, meaningfully higher interest rates should eventually slow the frenetic pace of home value appreciation that we have seen over the past few years, a welcome respite for would-be buyers,” said Zillow Senior Economist Aaron Terrazas. “Housing affordability is a critical issue in nearly every market across the country, and while much remains unknown about the precise path of the U.S. economy in the years ahead, another housing market crisis is unlikely to be a central protagonist in the next nationwide downturn.”

https://nationalmortgageprofessional.com/sites/default/files/Recession_Chart_05_22_18.png

Source: National Mortgage Professional Magazine

A Liquidity Crisis Of Biblical Proportions Is Upon Us


Authored by John Mauldin via MauldinEconomics.com,

Last week, I mentioned an insightful comment my friend Peter Boockvar—CIO of Bleakley Advisory Group—made at dinner in New York: “We now have credit cycles instead of economic cycles.”

That one sentence provoked numerous phone calls and emails, all seeking elaboration. What did Peter mean by that statement?

In an old-style economic cycle, recessions triggered bear markets. Economic contraction slowed consumer spending, corporate earnings fell, and stock prices dropped. That’s not how it works when the credit cycle is in control.

Lower asset prices aren’t the result of a recession. They cause the recession. That’s because access to credit drives consumer spending and business investment.

Take it away and they decline. Recession follows.

https://www.zerohedge.com/sites/default/files/inline-images/Image_1_20180516_ME_OP_JM_LiquidCrisis.jpg?itok=kM8j--Ei

The Debt/GDP ratio could go higher still, but I think not much more. Whenever it falls, lenders (including bond fund and ETF investors) will want to sell. Then comes the hard part: to whom?

You see, it’s not just borrowers who’ve become accustomed to easy credit. Many lenders assume they can exit at a moment’s notice. One reason for the Great Recession was so many borrowers had sold short-term commercial paper to buy long-term assets.

Things got worse when they couldn’t roll over the debt and some are now doing exactly the same thing again, except in much riskier high-yield debt. We have two related problems here.

  • Corporate debt and especially high-yield debt issuance has exploded since 2009.
  • Tighter regulations discouraged banks from making markets in corporate and HY debt.

Both are problems but the second is worse. Experts tell me that Dodd-Frank requirements have reduced major bank market-making abilities by around 90%. For now, bond market liquidity is fine because hedge funds and other non-bank lenders have filled the gap.

The problem is they are not true market makers. Nothing requires them to hold inventory or buy when you want to sell. That means all the bids can “magically” disappear just when you need them most.

These “shadow banks” are not in the business of protecting your assets. They are worried about their own profits and those of their clients.

Gavekal’s Louis Gave wrote a fascinating article on this last week titled, “The Illusion of Liquidity and Its Consequences.” He pulled the numbers on corporate bond ETFs and compared them to the inventory trading desks were holding—a rough measure of liquidity.

Louis found dealer inventory is not remotely enough to accommodate the selling he expects as higher rates bite more.

We now have a corporate bond market that has roughly doubled in size while the willingness and ability of bond dealers to provide liquidity into a stressed market has fallen by more than -80%. At the same time, this market has a brand-new class of investors, who are likely to expect daily liquidity if and when market behavior turns sour. At the very least, it is clear that this is a very different corporate bond market and history-based financial models will most likely be found wanting.

The “new class” of investors he mentions are corporate bond ETF and mutual fund shareholders. These funds have exploded in size (high yield alone is now around $2 trillion) and their design presumes a market with ample liquidity.

We barely have such a market right now, and we certainly won’t have one after rates jump another 50–100 basis points.

Worse, I don’t have enough exclamation points to describe the disaster when high-yield funds, often purchased by mom-and-pop investors in a reach for yield, all try to sell at once, and the funds sell anything they can at fire-sale prices to meet redemptions.

In a bear market you sell what you can, not what you want to. We will look at what happens to high-yield funds in bear markets in a later letter. The picture is not pretty.

Leverage, Leverage, Leverage

To make matters worse, many of these lenders are far more leveraged this time. They bought their corporate bonds with borrowed money, confident that low interest rates and defaults would keep risks manageable.

In fact, according to S&P Global Market Watch, 77% of corporate bonds that are leveraged are what’s known as “covenant-lite.” That means the borrower doesn’t have to repay by conventional means.

Somehow, lenders thought it was a good idea to buy those bonds. Maybe that made sense in good times. In bad times? It can precipitate a crisis. As the economy enters recession, many companies will lose their ability to service debt, especially now that the Fed is making it more expensive to roll over—as multiple trillions of dollars will need to do in the next few years.

Normally this would be the borrowers’ problem, but covenant-lite lenders took it on themselves.

The macroeconomic effects will spread even more widely. Companies that can’t service their debt have little choice but to shrink. They will do it via layoffs, reducing inventory and investment, or selling assets.

All those reduce growth and, if widespread enough, lead to recession.

Let’s look at this data and troubling chart from Bloomberg:

Companies will need to refinance an estimated $4 trillion of bonds over the next five years, about two-thirds of all their outstanding debt, according to Wells Fargo Securities.

https://www.zerohedge.com/sites/default/files/inline-images/debt_1.png?itok=tDF0bTIX

This has investors concerned because rising rates means it will cost more to pay for unprecedented amounts of borrowing, which could push balance sheets toward a tipping point. And on top of that, many see the economy slowing down at the same time the rollovers are peaking.

“If more of your cash flow is spent into servicing your debt and not trying to grow your company, that could, over time—if enough companies are doing that—lead to economic contraction,” said Zachary Chavis, a portfolio manager at Sage Advisory Services Ltd. in Austin, Texas. “A lot of people are worried that could happen in the next two years.”

The problem is that much of the $2 trillion in bond ETF and mutual funds isn’t owned by long-term investors who hold maturity. When the herd of investors calls up to redeem, there will be no bids for their “bad” bonds.

But they’re required to pay redemptions, so they’ll have to sell their “good” bonds. Remaining investors will be stuck with an increasingly poor-quality portfolio, which will drop even faster.

Wash, rinse, repeat. Those of us with a little gray hair have seen this before, but I think the coming one is potentially biblical in proportion.

Source: ZeroHedge

Recession: When You See It, It Will Be Too Late

https://i0.wp.com/realinvestmentadvice.com/wp-content/uploads/2018/03/Recession-Too-Late.png

“There are no signs of recession. Employment growth is strong. Jobless claims are low and the stock market is up.” 

This is heard almost daily from the media mainstream pablum.

The problem with a majority of the “analysis” done today is that it is primarily short-sighted and lazy, produced more for driving views and selling advertising rather than actually helping investors.

For example:

“The economy is currently growing at more than 2% annualized with current estimates near 2% as well.”

If you are growing at 2%, how could you have a recession anytime soon?

Let’s take a look at the data below of real economic growth rates:
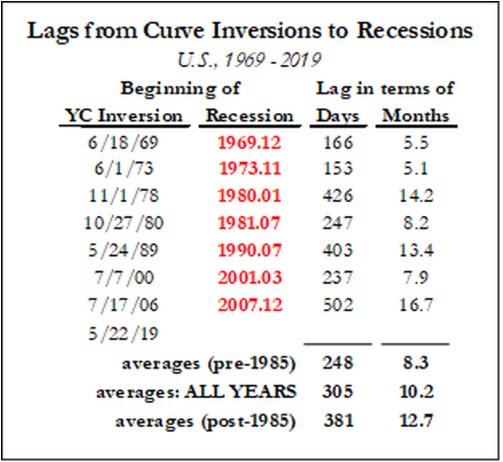
  • January 1980:        1.43%
  • July 1981:                4.39%
  • July 1990:                1.73%
  • March 2001:           2.30%
  • December 2007:    1.87%

If you look at each of those dates, the economy was clearly growing. But each of those dates is the growth rate of the economy immediately prior to the onset of a recession.

You will remember that during the entirety of 2007, the majority of the media, analyst, and economic community were proclaiming continued economic growth into the foreseeable future as there was “no sign of recession.”

I myself was rather brutally chastised in December of 2007 when I wrote that:

“We are now either in, or about to be in, the worst recession since the ‘Great Depression.’”

Of course, a full year later, after the annual data revisions had been released by the Bureau of Economic Analysis (BEA), the recession was officially revealed. Unfortunately, by then it was far too late to matter.

It is here the mainstream media should have learned their lesson. But unfortunately, they didn’t.

The chart below shows the S&P 500 index with recessions and when the National Bureau of Economic Research dated the start of the recession.

https://i0.wp.com/realinvestmentadvice.com/wp-content/uploads/2017/12/SP500-NBER-Recession-Dating-120817.png

There are three lessons that should be learned from this:

  1. The economic “number” reported today will not be the same when it is revised in the future.
  2. The trend and deviation of the data are far more important than the number itself.
  3. “Record” highs and lows are records for a reason as they denote historical turning points in the data.

For example, the level of jobless claims is one data series currently being touted as a clear example of why there is “no recession” in sight. As shown below, there is little argument that the data currently appears extremely “bullish” for the economy.

https://i0.wp.com/realinvestmentadvice.com/wp-content/uploads/2017/12/Jobless-Claims-120817.png

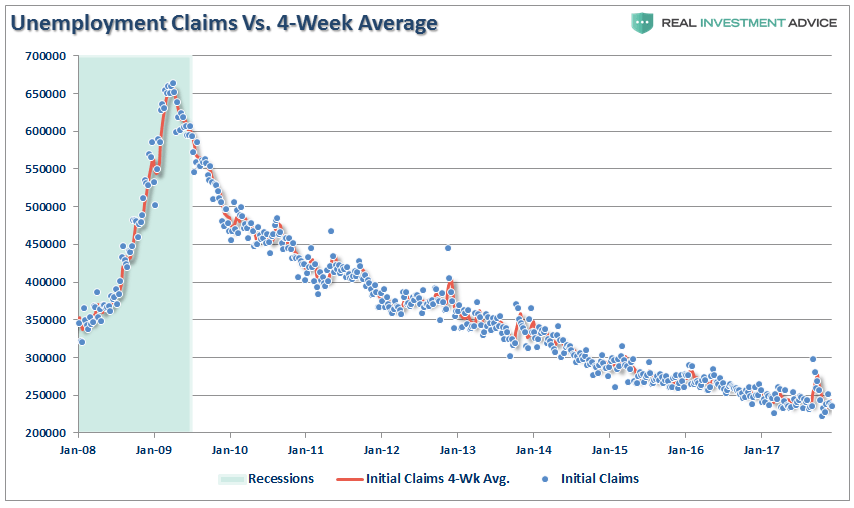
However, if we step back to a longer picture we find that such levels of jobless claims have historically noted the peak of economic growth and warned of a pending recession.

https://i0.wp.com/realinvestmentadvice.com/wp-content/uploads/2018/03/Claims-4mth-MA-vs-12mth-MA-031818.png

This makes complete sense as “jobless claims” fall to low levels when companies “hoard existing labor” to meet current levels of demand. In other words, companies reach a point of efficiency where they are no longer terminating individuals to align production to aggregate demand. Therefore, jobless claims naturally fall.

But there is more to this story.

Less Than Meets The Eye

The Trump Administration has taken a LOT of credit for the recent bumps in economic growth. We have warned this was not only dangerous, credibility-wise, but also an anomaly due to three massive hurricanes and two major wildfires that had the “broken window” fallacy working overtime.

“The fallacy of the ‘broken window’ narrative is that economic activity is only changed and not increased. The dollars used to pay for the window can no longer be used for their original intended purpose.”

If economic destruction led to long-term economic prosperity, then the U.S. should just regularly drop a “nuke” on a major city and then rebuild it. When you think about it in those terms, you realize just how silly the whole notion is.

However, in the short-term, natural disasters do “pull forward” consumption as individuals need to rebuild and replace what was previously lost. This activity does lead to a short-term boost in the economic data, but fades just as quickly.

A quick look at core retail sales over the last few months, following the hurricanes, shows the temporary bump now fading.

https://i0.wp.com/realinvestmentadvice.com/wp-content/uploads/2018/02/Retail-Sales-Core-021518.png

The other interesting aspect of this is the rise in consumer credit as a percent of disposable personal income. The chart below indexes both consumer credit to DPI and retail sales to 100 starting in 1993. What is interesting to note is the rising level of credit card debt required to sustain retail sales.

https://i0.wp.com/realinvestmentadvice.com/wp-content/uploads/2018/02/Consumer-Credit-DPI-RetailSales-Index-021518.png

Given that retail sales make up roughly 40% of personal consumption expenditures which in turn comprises roughly 70% of GDP, the impact to sustained economic growth is important to consider.

Furthermore, what the headlines miss is the growth in the population. The chart below shows retails sales divided by the current 16-and-over population. (If you are alive, you consume.) 

https://i0.wp.com/realinvestmentadvice.com/wp-content/uploads/2018/03/Retail-Sales-Per-Capita-031818.png

Retail sales per capita were previously on a 5% annualized growth trend beginning in 1992. However, after the financial crisis, the gap below that long-term trend has yet to be filled as there is a 23.2% deficit from the long-term trend. It is also worth noting the sharp drop in retail sales per capita over just the last couple of months in particular.

Since 1992, as shown below, there have only been 5-other times in which retail sales were negative 3-months in a row (which just occurred). Each time, the subsequent impact on the economy, and the stock market, was not good. 

https://i0.wp.com/realinvestmentadvice.com/wp-content/uploads/2018/03/Retail-Sales-Monthly-Change-031718.png

So, despite record low jobless claims, retail sales remain exceptionally weak. There are two reasons for this which are continually overlooked, or worse simply ignored, by the mainstream media and economists.

The first is that despite the “longest run of employment growth in U.S. history,” those who are finding jobs continues to grow at a substantially slower pace than the growth rate of the population.

https://i0.wp.com/realinvestmentadvice.com/wp-content/uploads/2018/03/Employment-Population-Growth-031718.png

If you don’t have a job, and are primarily living on government support (1-of-4 Americans receive some form of benefit) it is difficult to consume at higher levels to support economic growth.

Secondly, while tax cuts may provide a temporary boost to after-tax incomes, that income boost is simply being absorbed by higher energy, gasoline, health care and borrowing costs. This is why 80% of Americans continue to live paycheck-to-paycheck and have little saved in the bank. It is also why, as wages have continued to stagnate, the cost of living now exceeds what incomes and debt increases can sustain.

https://i0.wp.com/realinvestmentadvice.com/wp-content/uploads/2018/02/Gap-Income-Spending-Saving-022718.png

As I have discussed several times during the 4th-quarter of 2017:

Very likely, the next two quarters will be weaker than expected as the boost from hurricanes fade and higher interest rates take their toll on consumers. So, when mainstream media acts astonished that economic growth has once again slowed, you will already know why.”

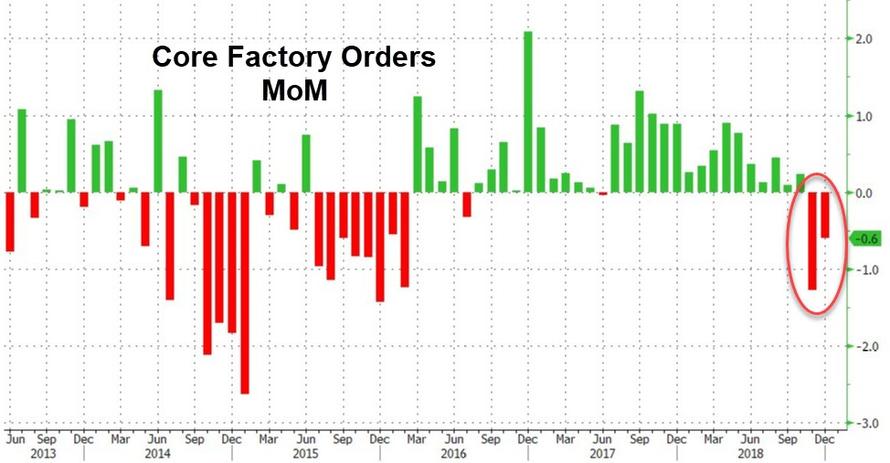
Not surprisingly the economic data rolling in has been exceptionally weak and the first quarter GDP growth is now targeted at less than 2% annualized growth.

https://i0.wp.com/realinvestmentadvice.com/wp-content/uploads/2018/03/GDP-NOW.png

However, it is not only in the U.S. the economic “bump” is fading, but globally as well as Central Banks have started to remove their monetary accommodations. As noted by the ECRI:

“Our prediction last year of a global growth downturn was based on our 20-Country Long Leading Index, which, in 2016, foresaw the synchronized global growth upturn that the consensus only started to recognize around the spring of 2017.

With the synchronized global growth upturn in the rear view mirror, the downturn is no longer a forecast, but is now a fact.

The chart below shows that quarter-over-quarter annualized gross domestic product growth rates in the three largest advanced economies — the U.S., the euro zone, and Japan — have turned down. In all three, GDP growth peaked in the second or third quarter of 2017, and fell in the fourth quarter. This is what the start of a synchronized global growth downswing looks like.”

https://i0.wp.com/realinvestmentadvice.com/wp-content/uploads/2018/03/GDP-Global-031818.gif

“Still, the groupthink on the synchronized global growth upturn is so pervasive that nobody seemed to notice that South Korea’s GDP contracted in the fourth quarter of 2017, partly due to the biggest drop in its exports in 33 years. And that news came as the country was in the spotlight as host of the winter Olympics.

Because it’s so export-dependent, South Korea is often a canary in the coal mine of global growth. So, when the Asian nation experiences slower growth — let alone negative growth — it’s a yellow flag for the global economy.

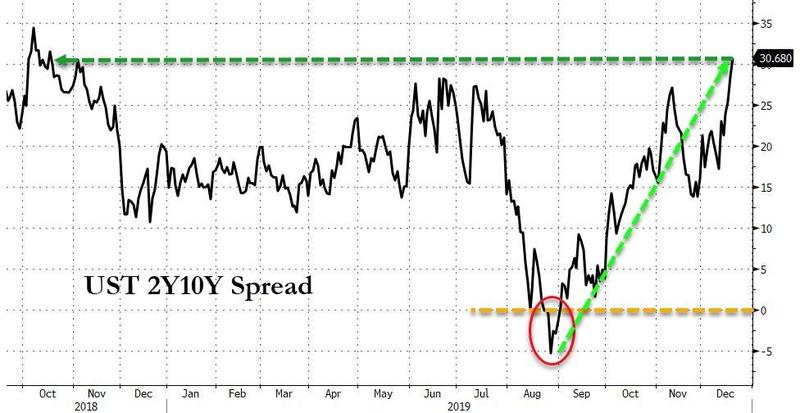
The international slowdown is becoming increasingly obvious from the widely followed economic indicators. The most popular U.S. measures seem to present more of a mixed bag. Yet, as we pointed out late last year, the bond market, following the U.S. Short Leading Index, started sniffing out the U.S. slowdown months ago.”

You can see the slowdown occurring “real time” by taking a look at Personal Consumption Expenditures (PCE) which comprises roughly 70% of U.S. economic growth. (It is also worth noting that PCE  growth rates have been declining since 2016 which belies the “economic growth recovery” story.)

https://i0.wp.com/realinvestmentadvice.com/wp-content/uploads/2018/03/Real-Retail-Sales-PCE-031818.png

The point here is this:

“Economic cycles are only sustainable for as long as excesses are being built. The natural law of reversions, while they can be suspended by artificial interventions, cannot be repealed.” 

While there may currently be “no sign of recession,” there are plenty of signs of “economic stress” such as:

The shift caused by the financial crisis, aging demographics, massive monetary interventions and the structural change in employment which has skewed the seasonal-adjustments in economic data. This makes every report from employment, retail sales, and manufacturing appear more robust than they would be otherwise. This is a problem mainstream analysis continues to overlook but will be used as an excuse when it reverses.

While the calls of a “recession” may seem far-fetched based on today’s economic data points, no one was calling for a recession in early 2000 or 2007 either. By the time the data is adjusted, and the eventual recession is revealed, it won’t matter as the damage will have already been done.

As Howard Marks once quipped:

“Being right, but early in the call, is the same as being wrong.” 

While being optimistic about the economy and the markets currently is far more entertaining than doom and gloom, it is the honest assessment of the data, along with the underlying trends, which are useful in protecting one’s wealth longer-term.

Is there a recession currently? No.

Will there be a recession in the not so distant future? Absolutely.

But if you wait to “see it,” it will be too late to do anything about it.

Whether it is a mild, or “massive,” recession will make little difference to individuals as the net destruction of personal wealth will be just as damaging. Such is the nature of recessions on the financial markets.

By Lance Roberts | Real Investment Advice

Fed Hints During Next Recession It Will Release Targeted ‘Universal Income’ and NIRP

In a moment of rare insight, two weeks ago in response to a question “Why is establishment media romanticizing communism? Authoritarianism, poverty, starvation, secret police, murder, mass incarceration? WTF?”, we said that this was simply a “prelude to central bank funded universal income”, or in other words, Fed-funded and guaranteed cash for everyone.

https://twitter.com/lizzie363/status/925314738044538880

On Thursday afternoon, in a stark warning of what’s to come, San Francisco Fed President John Williams confirmed our suspicions when he said that to fight the next recession, global central bankers will be forced to come up with a whole new toolkit of “solutions”, as simply cutting interest rates won’t well, cut it anymore, and in addition to more QE and forward guidance – both of which were used widely in the last recession – the Fed may have to use negative interest rates, as well as untried tools including so-called price-level targeting or nominal-income targeting.

This is a bold, tactical admission that as a result of the aging workforce and the dramatic slack which still remains in the labor force that the US central bank will have to take drastic steps to preserve social order and cohesion.

According to Williams’, Reuters reports, central bankers should take this moment of “relative economic calm” to rethink their approach to monetary policy. Others have echoed Williams’ implicit admission that as a result of 9 years of Fed attempts to stimulate the economy – yet merely ending up with the biggest asset bubble in history – the US finds itself in a dead economic end, such as Chicago Fed Bank President Charles Evans, who recently urged a strategy review at the Fed, but Williams’ call for a worldwide review is considerably more ambitious.

Among Williams’ other suggestions include not only negative interest rates but also raising the inflation target – to 3%, 4% or more, in an attempt to crush debt by making life unbearable for the majority of the population – as it considers new monetary policy frameworks. Still, even the most dovish Fed lunatic has to admit that such strategies would have costs, including those that diverge greatly from the Fed’s current approach. Or maybe not: “price-level targeting, he said, is advantageous because it fits “relatively easily” into the current framework.”

Considering that for the better part of a decade the Fed prescribed lower rates and ZIRP as the cure to the moribund US economy, only to flip and then propose higher rates as the solution to all problems. It is not surprising that even the most insane proposals are currently being contemplated because they fit “relatively easily” into the current framework.

Additionally, confirming that the Fed has learned nothing at all, during a Q&A in San Francisco, Williams said that “negative interest rates need to be on the list” of potential tools the Fed could use in a severe recession. He also said that QE remains more effective in terms of cost-benefit, but “would not exclude that as an option if the circumstances warranted it.”

“If all of us get stuck at the lower bound” then “policy spillovers are far more negative,” Williams said of global economic interconnectedness. “I’m not pushing for” some “United Nations of policy.”

And, touching on our post from mid-September, in which we pointed out that the BOC was preparing to revising its mandate, Williams also said that “the Fed and all central banks should have Canada-like practice of revisiting inflation target every 5 years.”

Meanwhile, the idea of Fed targeting, or funding, “income” is hardly new: back in July, Deutsche Bank was the first institution to admit that the Fed has created “universal basic income for the rich”:

The accommodation and QE have acted as a free insurance policy for the owners of risk, which, given the demographics of stock market participation, in effect has functioned as universal basic income for the rich. It is not difficult to see how disruptive unwind of stimulus could become. Clearly, in this context risk has become a binding constraint.

It is only “symmetric” that everyone else should also benefit from the Fed’s monetary generosity during the next recession. 

* * *

Finally, for those curious what will really happen after the next “great liquidity crisis”, JPM’s Marko Kolanovic laid out a comprehensive checklist one month ago. It predicted not only price targeting (i.e., stocks), but also negative income taxes, progressive corporate taxes, new taxes on tech companies, and, of course, hyperinflation. Here is the excerpt.

What will governments and central banks do in the scenario of a great liquidity crisis? If the standard rate cutting and bond purchases don’t suffice, central banks may more explicitly target asset prices (e.g., equities). This may be controversial in light of the potential impact of central bank actions in driving inequality between asset owners and labor. Other ‘out of the box’ solutions could include a negative income tax (one can call this ‘QE for labor’), progressive corporate tax, universal income and others. To address growing pressure on labor from AI, new taxes or settlements may be levied on Technology companies (for instance, they may be required to pick up the social tab for labor destruction brought by artificial intelligence, in an analogy to industrial companies addressing environmental impacts). While we think unlikely, a tail risk could be a backlash against central banks that prompts significant changes in the monetary system. In many possible outcomes, inflation is likely to pick up.

The next crisis is also likely to result in social tensions similar to those witnessed 50 years ago in 1968. In 1968, TV and investigative journalism provided a generation of baby boomers access to unfiltered information on social developments such as Vietnam and other proxy wars, Civil rights movements, income inequality, etc. Similar to 1968, the internet today (social media, leaked documents, etc.) provides millennials with unrestricted access to information on a surprisingly similar range of issues. In addition to information, the internet provides a platform for various social groups to become more self-aware, united and organized. Groups span various social dimensions based on differences in income/wealth, race, generation, political party affiliations, and independent stripes ranging from alt-left to alt-right movements. In fact, many recent developments such as the US presidential election, Brexit, independence movements in Europe, etc., already illustrate social tensions that are likely to be amplified in the next financial crisis. How did markets evolve in the aftermath of 1968? Monetary systems were completely revamped (Bretton Woods), inflation rapidly increased, and equities produced zero returns for a decade. The decade ended with a famously wrong Businessweek article ‘the death of equities’ in 1979.

Kolanovic’s warning may have sounded whimsical one month ago. Now, in light of Williams’ words, it appears that it may serve as a blueprint for what comes next.

Source: ZeroHedge

Yields Acting Like Economy Is Heading Into Recession

Treasury Yields and Rate Hike Odds Sink: Investigating the Yield Curve

The futures market is starting to question the June rate hike thesis. For its part, the bond market is behaving as if the Fed is hiking the economy into a recession. Here are some pictures.

June Rate Hike Odds

https://mishgea.files.wordpress.com/2017/05/fedwatch-2017-05-17.png?w=768&h=693

No Hike in June Odds

  • Month ago – 51%
  • Week Ago – 12.3%
  • Yesterday – 21.5%
  • Today – 35.4%

10-Year Treasury Note Yield

https://mishgea.files.wordpress.com/2017/05/10-year-2017-05-171.png

The yield on the 10-year treasury note doubled from the low of 1.32% during the week of July 2, 2016, to the high 2.64% during the week of December 10, 2016.

Since March 11, 2017, the yield on the 10-year treasury note declined 40 basis points to 2.24%.

30-Year Long Bond

https://mishgea.files.wordpress.com/2017/05/30-year-2017-05-17.png

The yield on the 30-year treasury bond rose from the low of 2.09% during the week of July 2, 2016, to the high of 3.21% during the week of March 11, 2017.

Since March 11, 2017, the yield on the 30-year treasury bond declined 29 basis points to 2.92%

1-Year Treasury Note Yield

https://mishgea.files.wordpress.com/2017/05/1-year-2017-05-17.png

The yield on the 1-year treasury more than doubled from the low of 0.43% during the week of July 2, 2016, to the high 1.14% during the week of May 6, 2017.

Since March 11, 2017, the yield curve has flattened considerably.

Action in the treasury yields is just what one would expect if the economy was headed into recession.

By Mike “Mish” Shedlock | MishTalk

A Near Certainty On The Next President’s Watch ● — ● Recession!

Talk about a poisoned chalice. No matter who is elected to the White House in November, the next president will probably face a recession.

The 83-month-old expansion is already the fourth-longest in more than 150 years and starting to show some signs of aging as corporate profits peak and wage pressures build. It also remains vulnerable to a shock because growth has been so feeble, averaging just about 2 percent since the last downturn ended in June 2009.

“If the next president is not going to have a recession, it will be a U.S. record,” said Gad Levanon, chief economist for North America at the Conference Board in New York. “The longest expansion we ever had was 10 years,” beginning in 1991.

-1x-1The history of cyclical fluctuations suggests that the “odds are significantly better than 50-50 that we will have a recession within the next three years,” according to former Treasury Secretary Lawrence Summers.

Michael Feroli, chief U.S. economist for JPMorgan Chase & Co. in New York, puts the probability of a downturn during that time frame at about two in three.

The U.S. doesn’t look all that well-equipped to handle a contraction should one occur during the next president’s term, former Federal Reserve Vice Chairman Alan Blinder said. Monetary policy is stretched near its limit while fiscal policy is hamstrung by ideological battles.

Previous Decade

This wouldn’t be the first time that a new president was forced to tackle a contraction in gross domestic product. The nation was in the midst of its deepest slump since the Great Depression when Barack Obama took office on January 20, 2009. His predecessor, George W. Bush, started his tenure as president in 2001 with the economy about to be mired in a downturn as well, albeit a much milder one than greeted Obama.

The biggest near-term threat comes from abroad. Former International Monetary Fund official Desmond Lachman said a June 23 vote by the U.K. to leave the European Union, a steeper-than-anticipated Chinese slowdown and a renewed recession in Japan are among potential developments that could upend financial markets and the global economy in the coming months.

“There’s a non-negligible risk that by the time the next president takes office in January you would have the world in a pretty bad place,” said Lachman, who put the odds of that happening at 30 percent to 40 percent.

Investors also might get spooked if billionaire Donald Trump looks likely to win the presidency, considering his staunchly protectionist stance on trade and a seemingly cavalier attitude toward the nation’s debt, added Lachman, now a resident fellow at the American Enterprise Institute in Washington.

Election-Year Jitters

Uncertainty about the election’s outcome may already be infecting the economy at the margin, with companies and consumers in surveys increasingly citing it as a source of concern.

“The views expressed by the various candidates have weighed down” consumer confidence, said Richard Curtin, director of the University of Michigan’s household survey, which saw sentiment slip for a fourth straight month in April.

-1x-1 (1)With growth so slow — it clocked in at a mere 0.5 percent on an annual basis in the first quarter — it wouldn’t take that much to tip the economy into a recession.

“It’s like a bicycle that’s going too slowly. All it takes is a little puff of wind to knock it over,” said Nariman Behravesh, chief economist for consultants IHS Inc. in Lexington, Massachusetts.

The economy still has some things going for it, leading Behravesh to conclude that the odds of a downturn over the next couple of years are at most 25 percent.

“Recoveries don’t die of old age,” he said. “They get killed off. And the three killers that we’ve had in the past don’t seem terribly frightening right now.”

The murderers’ row consists of a steep rise in interest rates engineered by the central bank, a sudden spike in oil prices and the bursting of an asset-price bubble. This time around, Fed policy makers have signaled they’re going to raise rates slowly, the oil market is still awash in excess supply and house prices by some measures remain below their 2007 highs.

“The expansion can continue for several more years,” Robert Gordon, a professor at Northwestern University in Evanston, Illinois, and a member of the committee of economists that determines the timing of recessions, said in an e-mail.

Balance Sheets

Consumers’ balance sheets are in much better shape than they were prior to the last economic contraction. Household debt as a share of disposable income stood at 105 percent in the fourth quarter, well below the 133 percent reached in the final three months of 2007.

Businesses seem more vulnerable. Corporate profits plunged 11.5 percent in the fourth quarter from the year-ago period, the biggest drop since a 31 percent collapse at the end of 2008 during the height of the financial crisis, according to data compiled by the Commerce Department.

History shows that when earnings decline, the economy often follows into a recession as profit-starved companies cut back on hiring and investment.

-1x-1 (2)“More and more employers are struggling with profits,” Levanon said. “That is resulting in some belt tightening.”

While he doesn’t see that pushing the U.S. into a recession, Levanon expects monthly payroll growth to slow to 150,000 to 180,000 over the balance of this year, compared to an average of 229,000 in 2015.

Though much of the weakness in earnings has been concentrated in the energy industry, companies in general have been struggling with rising labor costs as the tightening jobs market puts upward pressure on wages and worker productivity has lagged.

Peter Hooper, chief economist for Deutsche Bank Securities in New York, sees that leading to a possible recession a couple of years out as companies raise prices, inflation starts to accelerate and Fed policy makers have to jack up interest rates more aggressively in response.

“The slower they go in the near-term, the bigger the risk down the road,” he said of the Fed. “Looking out over the next four years, the chances of a two-quarter contraction are probably above 50 percent.”

Source: David Stockman’s Contra Corner | Rich Miller, Bloomberg

Welcome To The Revenue Recession


The “Revenue Recession” is alive and well, at least when it comes to the 30 companies of the Dow Jones Industrial Average. 

Every month we look at what brokerage analysts have in their financial models in terms of expected sales growth for the Dow constituents.  This year hasn’t been pretty, with Q1 down an average of 0.8% from last year and Q2 to be down 3.5% (WMT and HD still need to report to finish out the quarter).  The hits keep coming in Q3, down an expected 4.0% (1.4% less energy) and Q4 down 1.8% (flat less energy). 

The good news is that if markets discount 2 quarters ahead, we should be through the rough patch because Q1 2015 analyst numbers call for 1.9% sales growth, with or without the energy names of the Dow. The bad news is that analysts tend to be too optimistic: back in Q3 last year they thought Q2 2015 would be +2%, and that didn’t work out too well. 

Overall, the lack of revenue growth combined with full equity valuations (unless you think +17x is cheap) is all you need to know about the current market churn. And why it will likely continue.

The most successful guy I’ve ever worked for – and he has the billions to prove it – had the simplest mantra: “Don’t make things harder than they have to be”.  In the spirit of that sentiment, consider a simple question: which Dow stocks have done the best and worst this year, and why?  Here’s the answer:

The three best performing names are UnitedHealth (+19.3%), Visa (+18.2%) and Disney (14.2%).

The worst three names are Dupont (-28.3%), Chevron (-23.5%) and Wal-Mart (-16.0%).

Now, consider the old market aphorism that “Markets discount two quarters ahead” (remember, we’re keeping this simple).   What are analysts expecting for revenue growth in Q3 and Q4 that might have encouraged investors to reprice these stocks higher in the first 7 months of the year?


For the three best performing stocks, analysts expect second half revenues to climb an average of 14.1% versus last year. 

And for the worst three?  How about -22.1%. Don’t make things harder than they have to be.

That, in a nutshell, is why we look at the expected revenue growth for the 30 companies of the Dow every month.  Even though earnings and interest rates ultimately drive asset prices, revenues are the headwaters of the cash flow stream.  They also have the benefit of being easier for an analyst to quality control than earnings.  Not easy, mind you – just easier.  Units, price and mix are the only three drivers of revenues you have to worry about.  When those increase profitably the rest of the income statement – including the bottom line – tends to take care of itself.  

By both performance and revenue growth measures, 2015 has been tough on the Dow. It is the only one of the three major U.S. “Indexes” to be down on the year, with a 2.3% decline versus  +1.2% for the S&P 500 and +6.3% for the NASDAQ.  Ten names out of the 30 are lower by 10% or more, or a full 33%.  By comparison, we count 107 stocks in the S&P 500 that are lower by 10% or greater, or only 21% of that index.  

Looking at the average revenue growth for the Dow names tells a large part of the story, for the last time the Average enjoyed positive top line momentum was Q3 2014 and the next time brokerage analysts expect actual growth isn’t until Q1 2016. The two largest problems are well understood: declining oil and other commodity prices along with an increase in the value of the dollar. For a brief period there was some hope that declining energy company revenues would migrate to other companies’ top lines as consumers spent their energy savings elsewhere.  That, of course, didn’t quite work out.  

Still, we are at the crosswords of what could be a turn back to positive growth in 2016. Here’s how Street analysts currently expect that to play out:

At the moment, Wall Street analysts that cover the companies of the Dow expect Q3 2015 to be the trough quarter for revenue growth for the year.  On average, they expect the typical Dow name to print a 4.0% decline in revenues versus last year.  Exclude financials, and the comp gets a little worse: 4.4%.  Take out the 2 energy names, and the expected comp is still negative to the tune of 1.5%.

Things get a little better in Q4, presumably because we start to anniversary the declines in oil prices as well as the strength of the dollar.  These both began to kick in during Q4 2014, and as the old Wall Street adage goes “Don’t sweat a bad quarter – it just makes next year’s comp that much easier”.  That’s why analysts are looking for an average of -1.8% revenue comps for Q4, and essentially flat (-0.01%) when you take out the Dow’s energy names.

Go all the way out to Q1 2016, and analysts expect revenue growth to finally turn positive: 1.9% versus Q1 2015, whether you’re talking about the whole Average or excluding the energy names Better still, analysts are showing expected revenue growth for all of 2016 at 4.1%.  OK, that’s probably overly optimistic unless the dollar weakens next year.  But after 2015, even 1-3% growth would be welcome.

We’re still keeping it simple, so let’s wrap up.  What ails the Dow names also hamstrings the U.S. equity market as whole.  We need better revenue growth than the negative comps we’ve talked about here or the flattish top line progressions of the S&P 500 to get stocks moving again. The third quarter seems unlikely to provide much relief.  On a more optimistic note, our chances improve in Q4 and even more so in Q1 2016. Until we see the U.S. economy accelerate and/or the dollar weaken and/or oil prices stabilize, the chance that investors will pay even higher multiples for stagnant earnings appears remote.  That’s a recipe for more volatility – potentially a lot more.

Via Zero Hedge … Via ConvergEx’s Nick Colas

Chart Of The Day: Recession Dead Ahead?

By Tyler Durden

The chart below showing the annual increase, or rather, decrease in US factory orders which have now declined for 6 months in a row (so no one can’t blame either the west coast port strike or the weather) pretty much speaks for itself, and also which way the US “recovery” (whose GDP is about to crash to the 1.2% where the Atlanta Fed is modeling it, or even lower is headed.

https://i0.wp.com/www.zerohedge.com/sites/default/files/images/user5/imageroot/2015/03/Factory%20Orders%20YY.jpg

As the St Louis Fed so kindly reminds us, the two previous times US manufacturing orders declined at this rate on an unadjusted (or adjusted) basis, the US economy was already in a recession.

https://i0.wp.com/www.zerohedge.com/sites/default/files/images/user5/imageroot/2015/03/fed%20recession%20NSA.jpg

And now, time for consensus to be shocked once again when the Fed yanks the rug from under the feet of the rite-hike-istas.

Texas: Recession In 2015?

https://i0.wp.com/i.imwx.com/web/news/2012/january/snow-txdrillrig-iwit-mlallison-440x297-010911.jpgby Josh Young

Summary

  • Texas is by far the largest producer of oil in the US.
  • Oil production represents a disproportionate portion of Texas’s economy.
  • With oil prices down 45%, oil’s share of Texas GDP may fall 50% or more.
  • Unlike Russia and other countries, Texas cannot depreciate its own currency, magnifying the economic effect.

Texas is the largest oil producer in the US. And oil prices are down almost 50% in the past 4 months. Yet nowhere in the news do we hear about the risk of Texas entering a recession. The facts and figures below should concern investors in securities with economic exposure to the Texas economy. The risk is real.

As seen in the below chart by the EIA, Texas is the largest oil producing state in the US, producing 3x as much oil as the next largest producing state.

In September, Texas produced 3.23 million barrels of oil per day. This compares to 1.1 million barrels of oil per day produced in the second largest oil producing state, North Dakota, and much smaller quantities by other traditional oil producing states such as Alaska, California, and Oklahoma. And by comparison, Russia produces 10.9 million barrels per day.

Quantifying the value of this production, at $100 oil, that would be $323 million worth of oil produced per day, or $118 billion of oil produced per year. With the current price of oil hovering around $55 per barrel, that same oil production is only worth $178 million per day, or $65 billion. This is a loss of $53 billion of oil sales revenue just in the state of Texas.

This $53 billion in lost revenues compares to Texas’s GDP of $1.4 trillion in 2013 – it would be 3.8% of the State’s GDP, which is now “missing” due to oil prices having fallen. This is only the direct loss to the state – the indirect loss is likely several times as much. Direct oilfield activity is slowing down dramatically, as oil producing companies cut their capital expenditure budgets for 2015. Oilfield services stocks (NYSEARCA:OIH) are already down 37% from their peak earlier this year in anticipation of an activity slowdown. And for every job lost on a rig or in an oil company’s office, there are several additional jobs that may be lost, from the gas station manager to the sales clerk at a store to the front desk worker at a hotel.

The oil industry is unusual in that both the upstream independent producers and the service companies tend to outspend their cash flow, typically on local (to Texas) goods and services, on everything from drill pipe to rig manufacturing to catering. This means that for every dollar of lost oil sales from the lower oil price, there may be several dollars less spent across the Texas economy. This could be devastating for the Texas economy, and has not yet been widely discussed in the financial media.

To see an extreme example of the impact of lower oil prices on an economy tied to oil production, we can look at Russia (NYSEARCA:RSX). The Russian economy is more oil dependent than Texas’s. Russia’s GDP was $2.1 trillion in 2013. This compares to Texas’s GDP of $1.4 trillion. So Russia produces 3.3x as much oil as Texas, but only has 1.5x the GDP. So on a direct basis, assuming “ceteris paribus” conditions, a $1 decline in the price of oil would have 2.2x the impact to the economy of Russia as to the economy of Texas.

So what is happening in Russia? Already, the ruble has dropped in value by 50% in the past year. And numerous sources are calling for a severe recession in 2015. This would be expected, considering the high portion of the GDP that is attributable to oil production.

However, Russia has an advantage that Texas does not have. It has its own currency. While a 50% drop in a currency may not sound great if you’re looking to spend that currency elsewhere, it is crucial if you are an exporter and your primary export just dropped in price by 45%. The ruble denominated impact of the drop in the price of oil is a mere 10%. Unfortunately, for Texas, the dollar denominated drop in oil is 45%. So despite the lower economic exposure to oil, Texas does not have the benefit of a falling currency to buffer the blow of lower oil prices.

It may get even worse. With less drilling activity, oil production growth in Texas may slow, and eventually may decline. Depending on the speed of this slowdown, Texas could even see production decline by the end of 2015. This is because most of the new production has been coming from fracking unconventional wells, which can decline in production by as much as 80% in the first year. Production growth has required an increasing number of wells drilled, and has been funded with 100% of oil company cash flow along with hundreds of billions of dollars of equity and debt over the past few years. With the recent crash in oil stock prices (NYSEARCA: XOP) and in oil company bonds (NYSEARCA: JNK), oil drillers may be forced to spend within cash flow, and that cash flow will be down at least 45% in 2015 if the oil price stays on the path projected in the futures market.

All of this means that in 2015, Texas oil wells could be producing less than the 3.23 million barrels of oil per day it was producing in September 2014, and their owners could be receiving 45% less revenue per barrel produced. Again applying an economic multiplier, the results could be devastating. And without the cushion of a weak currency that benefits countries like Russia, it is hard to see how Texas could avoid a recession in 2015 if the price of oil stays near its current low levels.