Summary
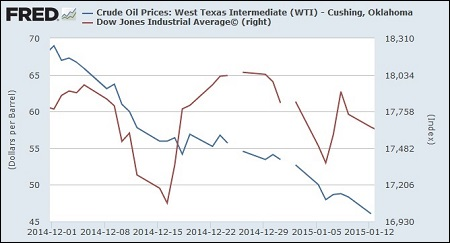
- The oil markets have hit multi-year lows on unsubstantiated theories about a supply glut and fears of cooling demand.
- Meanwhile, the geopolitical risks around the world have oddly disappeared in H2 2015.
- Nevertheless, the facts prove that the real thing is way too far from evaporating geopolitical risks or a material deterioration of the global supply-demand fundamentals that can justify a slump.
- The unprecedented downward pressure on oil prices is a headline-driven and sentiment-driven event.
- The oil price will definitely rise significantly in 2015.
Introduction
The stock market will always give the investors a chance to make a blunder, especially for those who allow emotions to overrule facts and factual thinking. The emotional blunders are part of the game in the stock market. And if you run your portfolio based on lame-thinking and emotion, you will most likely follow the herd mentality and sell at the wrong time, because lame-thinking and emotion will always cloud your judgment.
Things get worse for your portfolio when you allow the analysts and the opinion makers who show up daily on CNBC and Bloomberg, to tell you what is really going on with a sector. To me, many of these guys are not just incompetent. To me, they are dangerous because their advice can ruin your wealth in a record time. It is easy to throw out statements without backing them up with any math, and it is easy to make overly simplistic interpretations of the global supply/demand dynamics. “So easy even a caveman can do it,” as GEICO’s commercial states.
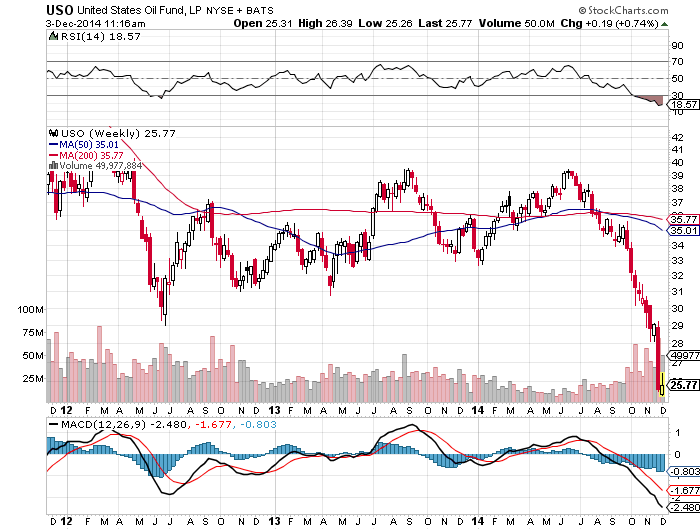
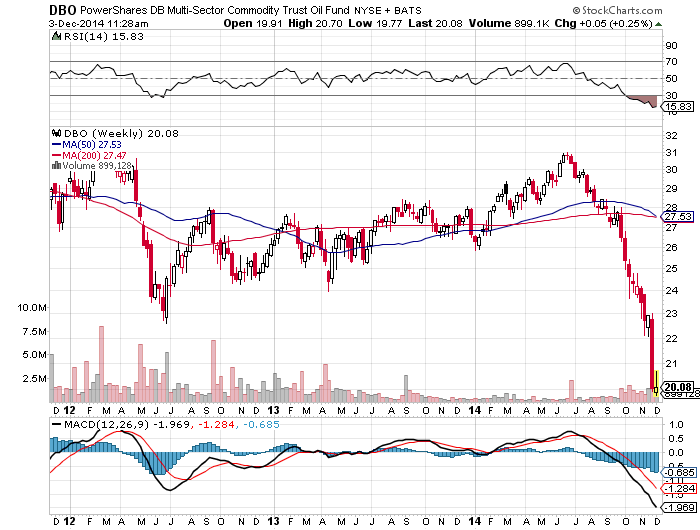
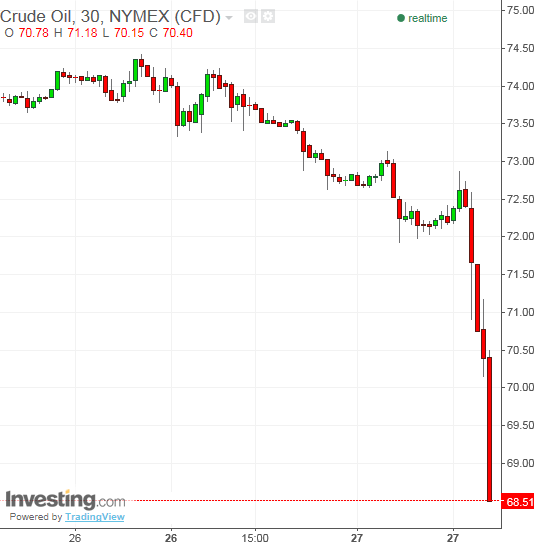
And as clearly illustrated by the following charts, insanity and panic are currently hovering over the oil markets, due to the fact that many incompetent oil prognosticators have flooded the media with their lame opinions over the last months. For instance, the charts for the bullish ETFs (NYSEARCA:USO), (NYSEARCA:DBO) and (NYSEARCA:OIL) that track WTI are below:
(click to enlarge)
and below:
(click to enlarge)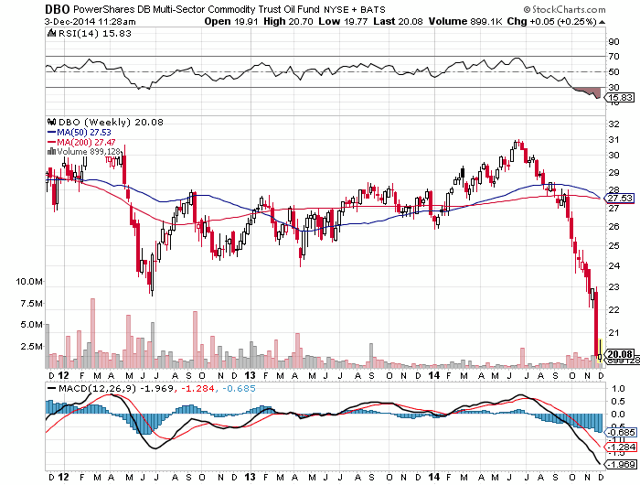
and below:
(click to enlarge)
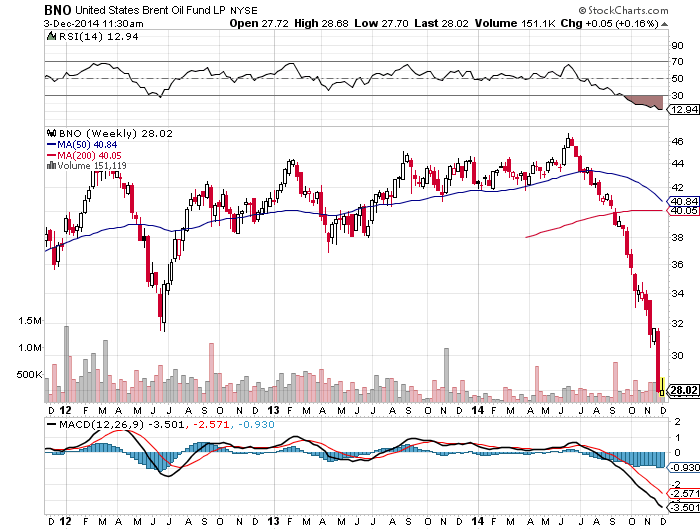
This is the chart for the bullish ETF (NYSEARCA:BNO) that tracks Brent:
(click to enlarge)
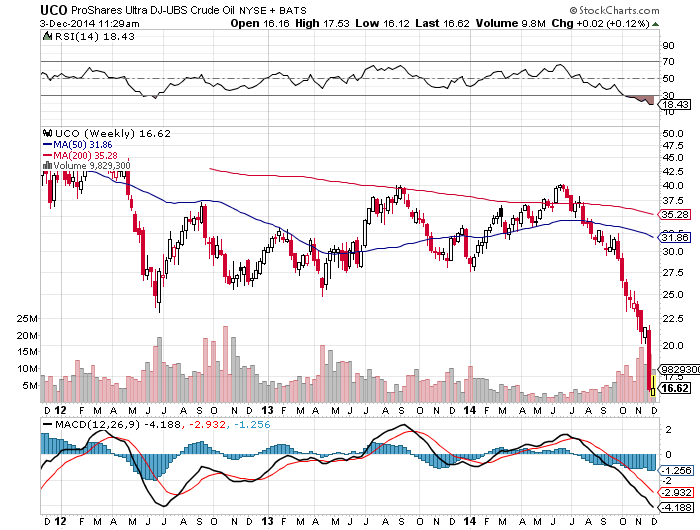
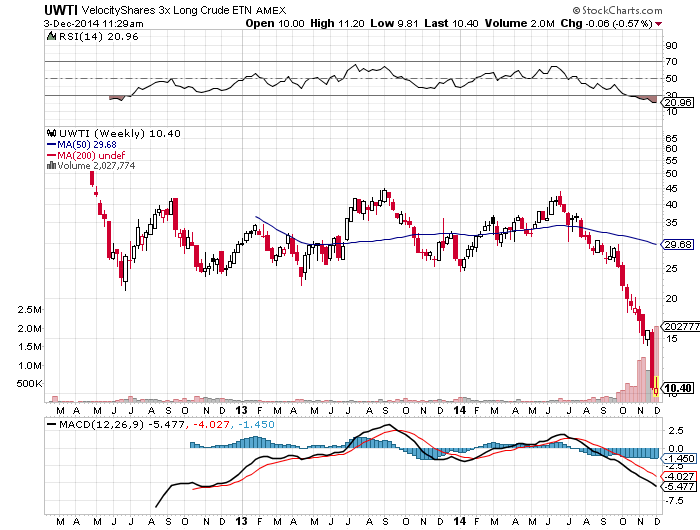
And the charts for the leveraged bullish ETFs (NYSEARCA:UCO) and (NYSEARCA:UWTI) are below:
(click to enlarge)
and below:
(click to enlarge)
All these bullish ETFs have returned back to their 2010 levels amid irrational fears for oversupply. But, these fears are completely unsubstantiated and they do not justify at all the sentiment-driven slump in the oil price over the last 4 months.
Andre Kostolany and The Oil Price
Obviously, all these sellers ignore Andre Kostolany who has said that:
“Imagine a man walking, one step at a time, on a country lane for a mile or so. He is accompanied by his dog, which follows the man like a dog follows his master: one step forward, one step backward. While the man is walking slowly, his dog is jumping around back and forth. There will be times when the man is ahead; he will wait for the dog and then there will be times when the dog is ahead and the dog will wait. In this example, the man represents the economy, and the dog the stock market.”
And for those who do not know Andre Kostolany, Kostolany is a stock market legend. Kostolany’s great quote describes what is going on with the oil price these days. The dog (oil price) currently is behind the man (oil supply/demand dynamics) and will catch him sooner rather than later.
In other words, I am a strong believer that Brent is not going to stay below $75/barrel for long, and the dubious Thomas are welcome to read the facts that will propel Brent higher than its current levels by early 2015.
What They Were Telling You In 2013 And H1 2014
Back in 2013 and H1 2014, when Brent was trading around $110/bbl, the analysts and several other opinion makers were calling for oil to hit $150 per barrel. Let’s see some more details and the reasons behind these calls:
1) In H1 2013, the U.S. Department of Energy reported that China overtook the U.S. as the world’s largest net oil importer. That was the time when a report from the Paris-based OECD (Organization for Economic Co-Operation and Development) came out and noted:
“Based on plausible demand and supply equations, there is a risk that prices could go up to anywhere between $150 and $270 per barrel in real terms by 2020, depending on the responsiveness of oil demand and supply and on the size of the temporary risk premium embedded in current prices due to fears about future supply shortages.”
OECD also noted in that report:
“There is a strong price increase needed despite this new oil production coming on stream.”
2) In H1 2013, Energy Aspects, an energy research consultancy, noted as linked above “All estimates point to Asian demand propelling growth.” It also said that the implications of the U.S. shale-oil boom could be overstated for the rest of the world if demand from Asia keeps up.
3) In H1 2013, some analysts from Goldman Sachs wrote that Brent crude oil prices could rise to $150 per barrel in H2 2013 because:
“Despite the boom in U.S. shale gas, the oil price remains high, which he attributed primarily to sanction-related supply disruptions in Iran. Trying to compensate for this, Saudi Arabia has already increased its oil production to a 30-year high this year.”
Mr. Currie added that:
“While global oil demand has increased at a slower pace, it is still higher than the production increases in non-OPEC countries. Upside risks for oil prices include low inventory levels, limited OPEC spare capacity, and geopolitical risks which are likely near an all-time high with production in a very large number of countries at risk, including Egypt, Iran, Iraq, Libya, Nigeria, Sudan, Syria and Venezuela. Europe still faces economic and policy headwinds, China just experienced a significant food inflation surprise (and the livestock impacts from last year’s agriculture price spike will only be felt this year) and the US still faces risks from the debt ceiling debate, the automatic spending cuts (or “sequestration”) and impending tax increases.”
4) In H2 2013, when Brent was still around $115/bbl, the French bank Societe Generale said:
“Brent crude is likely to rise towards $125 a barrel if the West launches airstrikes against Syria, and could go even higher if the conflict spills over into the rest of the Middle East.”
5) As linked above, another report from JBC Energy in Vienna said in H2 2013:
“Current developments such as low spare capacity in Saudi Arabia, stockpiles falling in the U.S., disappointing supply developments around the world and signs of an improving global economy are pointing to tighter markets.”
6) In late 2013, the analysts at the National Bank of Abu Dhabi in UAE noted:
“Average oil price was $112 per barrel in 2012. The average price of crude oil is forecast at $105 per barrel in 2013, $101 per barrel in 2014 and $100 per barrel in 2015. The base case is for oil prices to soften mildly, but remain close to $100 per barrel through 2018. Thereafter, prices rise by a few dollars each year in this scenario.”
7) Even a few months ago in June 2014, the analysts were telling you:
A) This is from Nordea Bank (OTCPK:NRBAY):
“If Iraq, accounting for 3.7% of the world’s total oil production, suffers a serious disruption to its oil supplies, we will see a sharp upswing in oil prices as the OPEC effective spare capacity buffer is low, making the global oil market highly sensitive to further supply disturbances. If Iraqi oil production would fall back to the low levels seen during the invasion of Iraq in 2003, oil prices could easily rise by up to $30 a barrel as this would push the global spare capacity back to the lows when oil prices reached $150 a barrel in July 2008. High oil prices would put the world economic recovery at risk.”
B) This is from PVM Oil Associates:
“The deteriorating situation in Iraq could be the source of an oil price and therefore a financial shock should be sending economic-growth forecasters back to the drawing board. There can be no doubt that if Iraq’s southern oil operations are impacted Brent could reach $125 a barrel and beyond. Saudi Arabia may have 2 million barrels a day of capacity it can turn on reasonably quickly but that leaves no spare capacity margin.”
C) This is from Commerzbank (OTCPK:CRZBY):
“It is hard to imagine that the oil production in northern Iraq will return to the market in the foreseeable future. So far, oil production in the south of Iraq, which accounts for 90% of Iraq’s oil exports, has been unaffected by the fighting in the north and center of the country. However, the sharp price rise in the last two days shows that this oil supply is no longer viewed as secure, either. Without the oil production from the south of Iraq, the market would be stripped of an estimated 2.5 million barrels per day.”
D) This is from the research consultancy Energy Aspects:
“Look at any forecast, they are calling for Iraqi production to be around 7-8 million barrels a day by 2018/2020 for oil prices to not rise substantially. And I think that’s the key, because that’s not going to happen. If this is contained within Iraq that’s one thing, but there’s a very different implication if it becomes a bigger regional conflict. That’s the biggest problem. Iraq’s at the heart of this big oil-producing region.”
What They Are Telling You In H2 2014
Let’s see now what the analysts and several other oil experts have been telling you lately:
1) In October 2014, Goldman Sachs slashed its 2015 oil price forecast. Goldman sees Q1 2015 WTI crude at $75/bbl versus $90/bbl previously and Q1 2015 Brent at $85/bbl versus $100/bbl previously. The U.S. investment bank said rising production will outstrip demand, joining other oil analysts who predict consumption will be dented by slower global economic growth and lead to a supply glut.
2) Other analysts who joined the bearish party lately, predict that the bear market in crude will continue with prices falling as low as $50 a barrel, in part because the global economy is slowing, pushing supply levels higher.
3) In late October 2014, fellow newsletter editor Dennis Gartman showed up and implied that oil could go to $40-$50 per barrel because among others, Lockheed Martin (NYSE:LMT) was working on a compact fusion reactor that could be ready within 10 years. He said:
“Fusion is going to be the great nuclear power of the next 150 years. And finally, we are driving less and less. We are using so much less gasoline than we ever have, in global terms, in national terms, in per capital terms. All of those things, I think, are going to be weighing heavily on crude oil. And where could it go? A lot lower, a lot lower.”
So within ten years from now, we will fit a nuclear fusion reactor on the back of our cars dumping our gas tanks. Let Star Trek come to life! Obviously, Gartman’s thesis also implies that Star Trek’s high-tech, innovative and game-changing tools will be on clearance, so all the people from China and India to Africa and America will not afford to overlook this irrationally cheap nuclear fusion reactor. I don’t even understand why an investor can take Gartman’s approach on oil seriously.
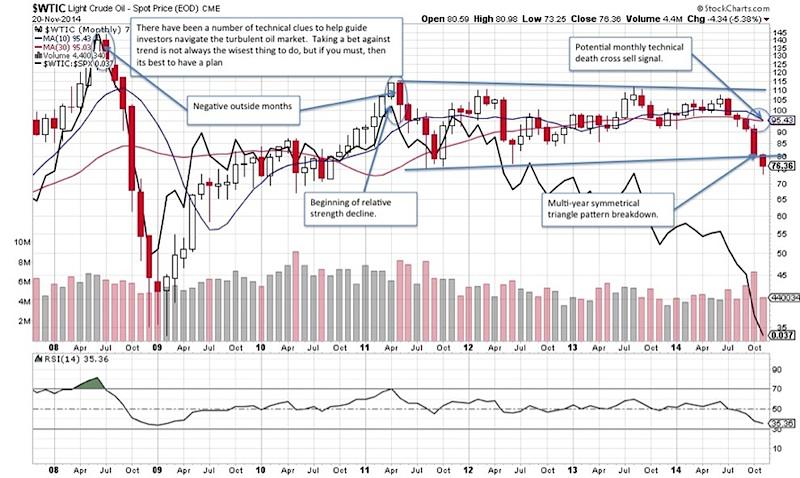
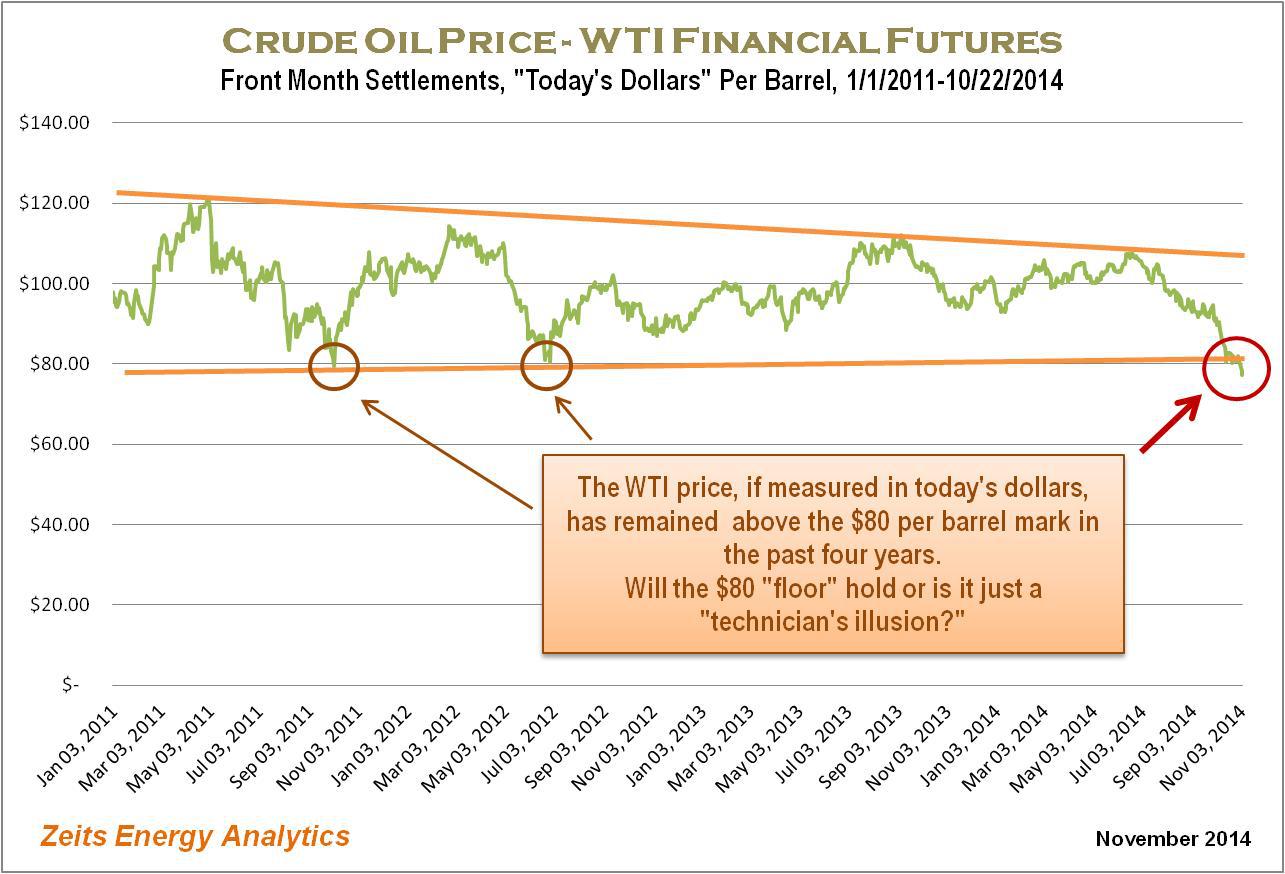
4) The technical traders also showed up a few weeks ago calling for $40/bbl, based on the following chart:
(click to enlarge)
2013/H1 2014 vs. H2 2014: No Major Fundamental Change While Geopolitical Risks Deteriorate
According to Forbes, these are the world’s biggest oil consumers today:
1) United States.
2) China.
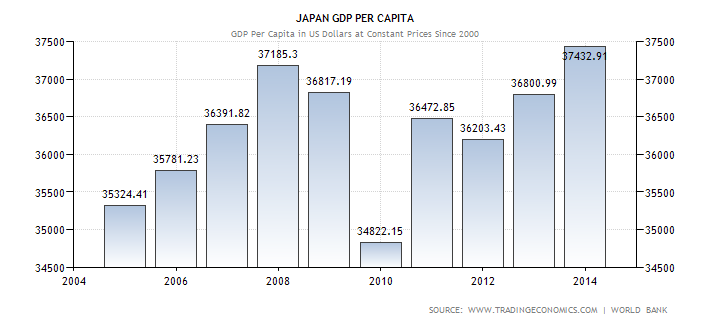
3) Japan.
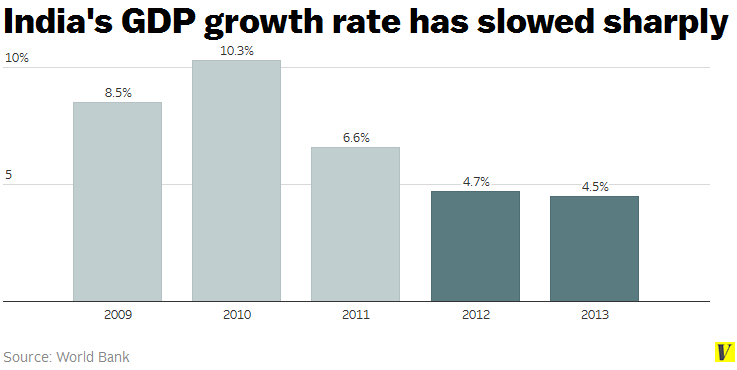
4) India.
5) Euro area.
As also shown in the previous paragraph, the calls in 2013 and H1 2014 for $150/bbl were based on the geopolitical tensions in the Middle East and the expectations about global growth with a focus on demand from the growing Asian markets, which are high in the list with the world’s biggest oil consumers.
And the facts below prove that nothing has changed over the last six months to justify a drop of 35% in the oil price that has occurred lately. In contrast, the geopolitical risks in the Middle East have deteriorated, and the security situation both in Iraq and in Libya has worsened recently. Even International Monetary Fund [IMF] admits that the geopolitical risks have worsened since H1 2014, according to its latest report.
Also, the world’s biggest oil consumers are growing at rates that either are in line with 2013 rates or exceed expectations. There is nothing to indicate that global supply and demand imbalance has fundamentally changed in the past six months. There is just too much speculation, emotion, panic and short-term lame thinking that have been used to determine the value of the oil price lately, and this slump in oil prices is clearly a result of sentiment and emotion.
Let’s proceed now with the facts:
1) Geopolitical risks deteriorate primarily due to ISIS, Iran and Libya: The extremist Islamic State of Iraq and Syria (ISIS) is still there, and the U.S. military and its allies hit ISIS forces with 15 air strikes in Iraq and Syria during a three-day period, The U.S. Central Command revealed a couple of days ago. Thirteen attacks were carried out in Iraq since last Wednesday and two more targeted Islamic State in Syria.
Meanwhile, ISIS keeps advancing in Iraq and Syria, after seizing Iraq’s second largest city Mosul on June 10th. The attacks have been escalating since 2013 and H1 2014, while American, British and Syrian soldiers were beheaded in October 2014 and November 2014, which is confirmed by Obama Administration. Apparently, there is no improvement compared to the situation in 2013 or H1 2014.
Furthermore, world powers failed to reach a nuclear agreement with Iran last week and extended talks for seven months. This means that the Western economic sanctions are not going to be lifted anytime soon, freezing the ability of Iranian banks to conduct international transactions while Iran’s daily oil export restrictions will remain too. This also means that Iran will continue working on its nuclear program by the summer of 2015, impacting negatively the destabilization risk in the region. And there is obviously no improvement compared to the situation in 2013 or H1 2014.
Also, there is no risk improvement in Libya compared to the situation in 2013 or H1 2014. In late August 2014, Libya’s ambassador to the United Nations warned of “full-blown civil war,” if the chaos and division in the North African country continue.
Libya currently has two competing parliaments and governments. The first government and elected House of Representatives relocated to Tobruk a few months ago after an armed group from the western city of Misrata seized the capital Tripoli and most government institutions, as well as the eastern city of Benghazi. The rival previous parliament remains in Tripoli and is backed by militias.
And just a couple of weeks ago, Libya’s political strife intensified as the rival government that has seized the capital took control of Libya’s largest oilfield (El Sharara), according to Reuters. Libya’s oil production rose above 900,000 bopd in September 2014, sharply above lows of 100,000 bopd in June 2014, but it has already fallen to around 500,000 bopd at most, as a recovery in Libya has faltered so far, according to Reuters. This translates into a material drop of approximately 400,000 bopd from Libya only.
2) GDP Growth Rates: Let’s take a look now at the GDP growth rates of the world’s biggest oil consumers:
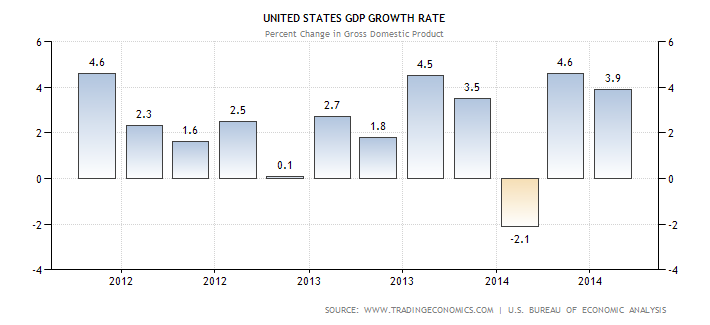
A) United States: According to the latest news of September 2014, the U.S. economy grew 4.6% in Q2 2014, exceeding earlier estimates. And according to the latest news of November 2014, the U.S. economy grew 3.9% in Q3 2014, exceeding once again the consensus estimate of 3.3%, as illustrated below:
(click to enlarge)
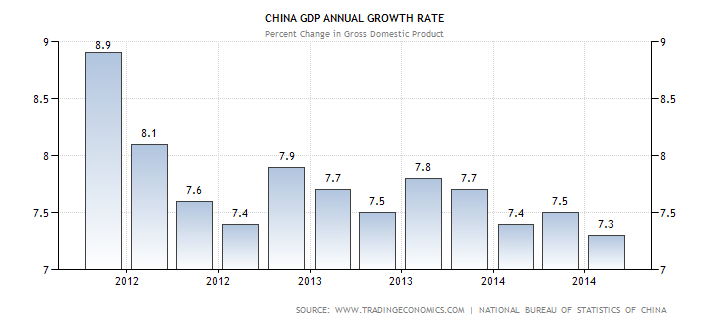
B) China: China grew 7.6% in 2013 and grows 7.4% (on average) to date, as shown below:
(click to enlarge)
Also, China’s GDP per capita continues growing in 2014 at the same pace it has been growing over the last couple of years, as illustrated below:
(click to enlarge)
On top of that, the Chinese central bank initiated an easing cycle just a few weeks ago. How can a serious investor ignore this initiative that will have material effects on China’s future growth and China’s oil consumption of course?
C) Japan: The Japanese economy grew in Q1 2014 and contracted in Q2 and Q3 2014, as illustrated below:
(click to enlarge)
But on average, Japan grew 1.52% in 2013 and grew 0.89% in 2014 too, based on the three quarterly GDP figures to date.
Additionally, Japan’s GDP per capita continues growing in 2014 compared to 2013, as illustrated below:
(click to enlarge)
D) India: As shown below, the Indian economy grew 4.5% in 2013:
(click to enlarge)
That was the time when the analysts were saying that these GDP numbers were below their expectations. Please see some analysts’ and officials’ statements about India’s GDP growth from late 2013:
i) “There is no light at the end of the tunnel visible in India’s GDP release.”
ii) “It was slightly below expectations but I feel the overall growth rate of 4.9% would be achieved this year (2014)” said C. Rangarajan, Chairman of the Prime Minister’s Economic Advisory Council.
iii) “These numbers clearly show that attaining a growth rate of 4.9% in 2014 is not possible.”
That was also the time when Brent was around $110/bbl and all the oil prognosticators were projecting $150/bbl, as shown in the previous paragraph.
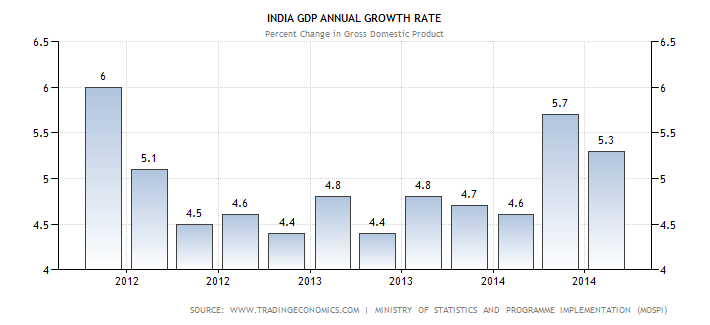
However, the Indian economy picked up steam and rebounded to a 5.7% rate in Q2 2014 from 4.6% in Q1 2014, led by a sharp recovery in industrial growth and gradual improvement in services.
And under the Modi government and thanks to a series of fundamental economic reforms, the Indian economy continued its growth and grew 5.3% in Q3 2014, as illustrated below:
(click to enlarge)
Needless to mention that these GDP rates in Q2 2014 and Q3 2014 were well above the analysts’ expectations.
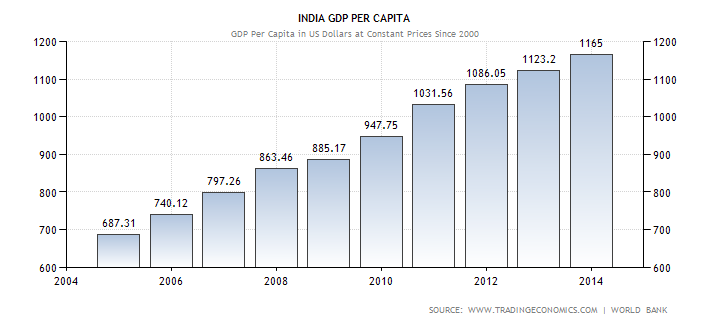
Additionally, India’s GDP per capita continues rising in 2014 compared to 2013, as illustrated below:
(click to enlarge)
And according to yesterday’s news from Reuters, Indian factory activity expanded at its fastest pace in nearly two years in November 2014. The HSBC Manufacturing Purchasing Managers’ Index (PMI) rose to 53.3 in November 2014 from 51.6 in October 2014, its highest since February 2013, and the thirteenth consecutive month of expansion in activity. The analysts had expected manufacturing activity to lose some steam and predicted the index would fall to 51.2.
On top of that, India overtook Japan as the world’s third-biggest crude oil importer in 2013 and the U.S. Energy Information Administration [EIA] projects that India will become the world’s largest oil importer by 2020.
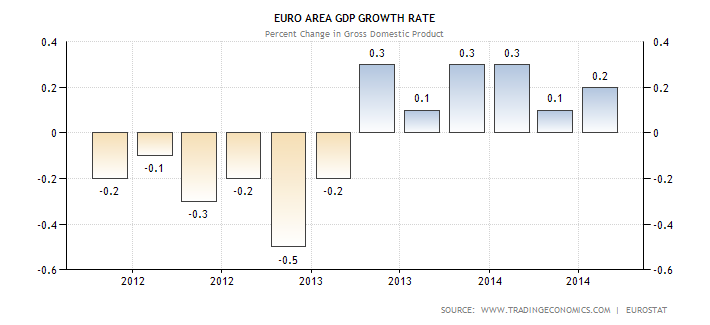
E) Europe: Europe continues growing in 2014 albeit in a slow rate, as illustrated below:
(click to enlarge)
But the current slow growth in Europe was there in 2013 too. In fact, Europe has been limping forward for years and this is nothing new, as clearly illustrated at the previous chart.
The Half-Truths And The Peak Oil
Given the fact that neither the geopolitical risks have declined since H1 2014 nor the average GDP growth rates in the world’s biggest oil consumers have dropped compared to 2013, the oil bears had to discover something else to strengthen their lame approach to oil and the supposedly supply glut.
Therefore, it does not surprise me the fact that I have seen the chart below more than 20 times in numerous online articles over the last weeks, given also that there are always willing authors who behave like parrots repeating what they hear:

The thing is that this chart itself tells you half-truths for the following three reasons that you will not find all together in any of the recent bearish articles about oil:
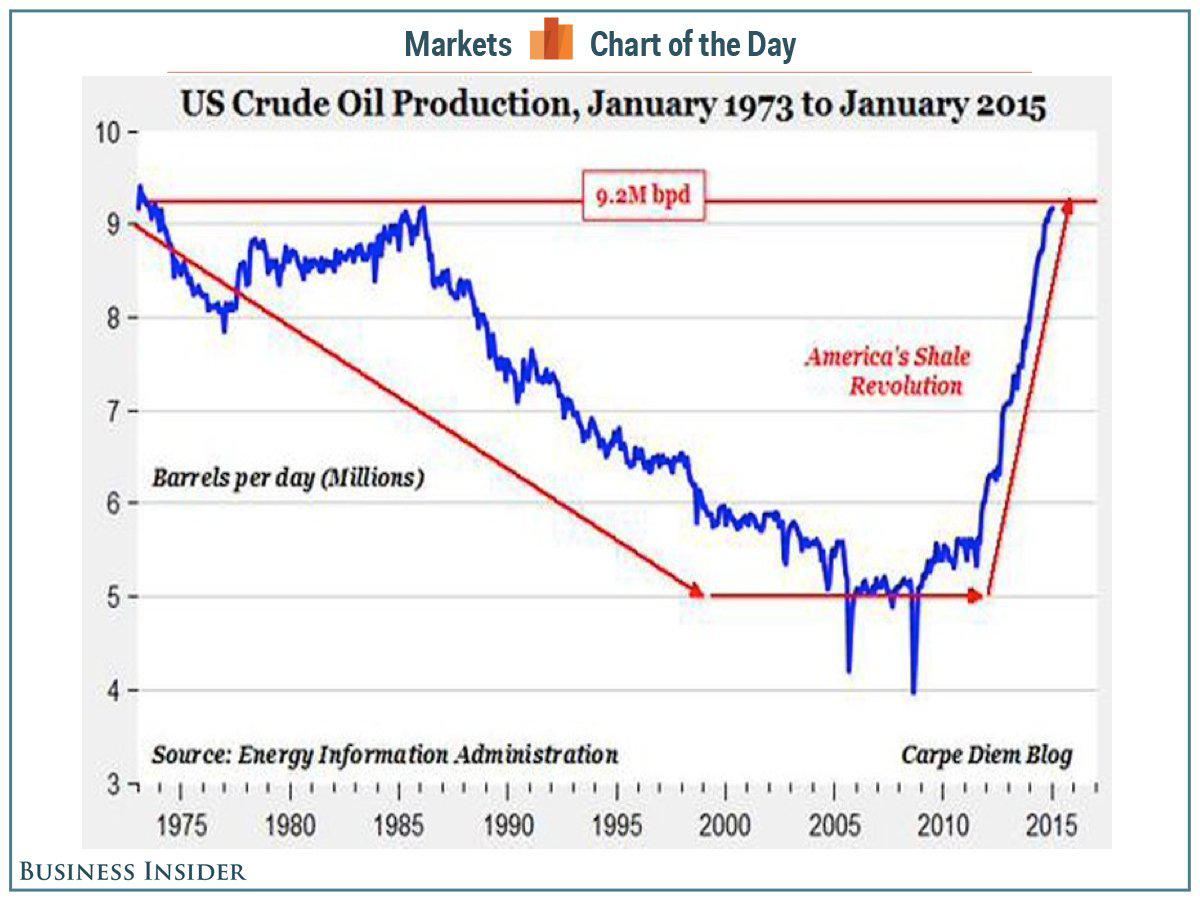
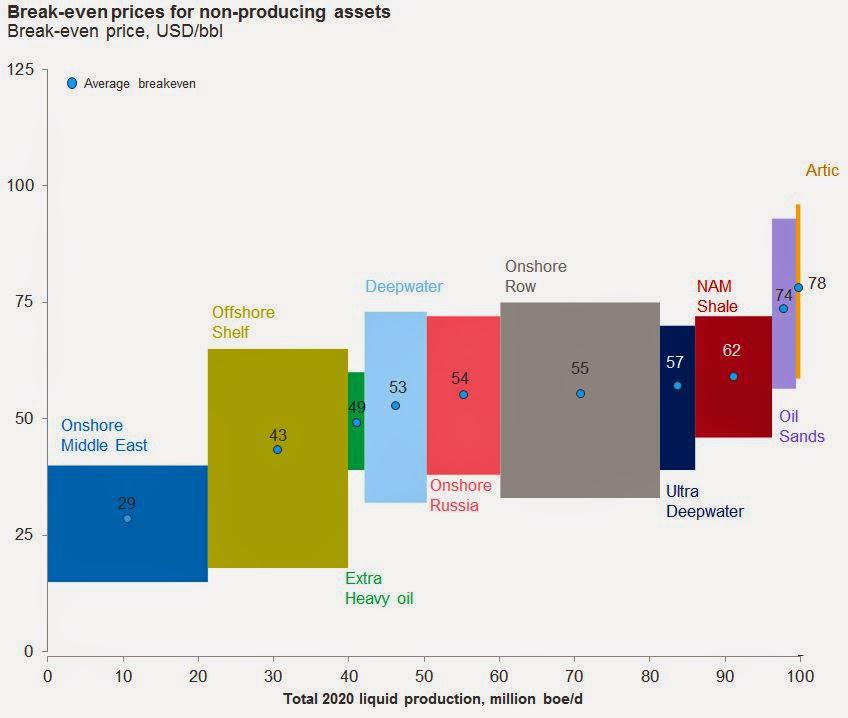
1) This chart above compares apple to oranges. It compares Saudi’s conventional production with U.S. oil production which is primarily a result of drilling unconventional shale wells that peter out quickly. The gap between the extraction cost in Saudi Arabia and the U.S. is approximately $60/bbl. Extracting oil from shale costs $60 to $100 a barrel, compared with $25 a barrel on average for conventional supplies from the Middle East, according to the International Energy Agency [IEA].
In other words, new oil is not cheap and the rising oil production in the U.S. over the last couple of years has been conditional upon the high oil price. Most of the wave of the U.S. production is currently unprofitable and the current low oil price discourages new drilling.
2) The U.S. shale players are on a steep rate treadmill because of the high decline rates of the unconventional wells, and an investor must be in denial to not see it.
3) The sweet spots and the spots with high productivity in the main oil basins in the U.S. (Williston, EF, Permian) cover a finite amount of land and eventually the number of the wells at the sweet spots is not infinite. The shale producers say that they have reserves [RLI] for approximately 10 years but this does not mean that their drilling locations are sweet spots.
The shale producers have already drilled in many of the best areas, or sweet spots. Once those areas have been drilled out completely, operators will have to move to more-marginal locations and well productivity will fall precipitously. Meanwhile, the advances in technology cannot make wonders to boost the recovery rates overnight.
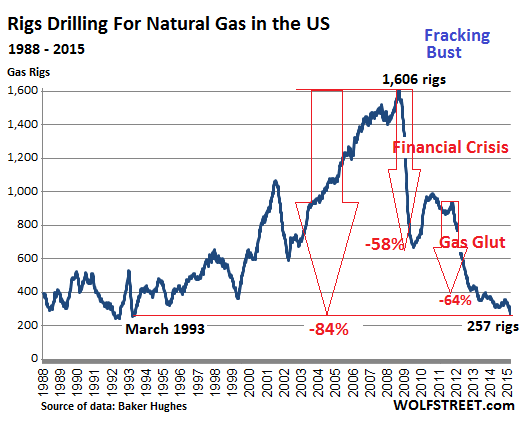
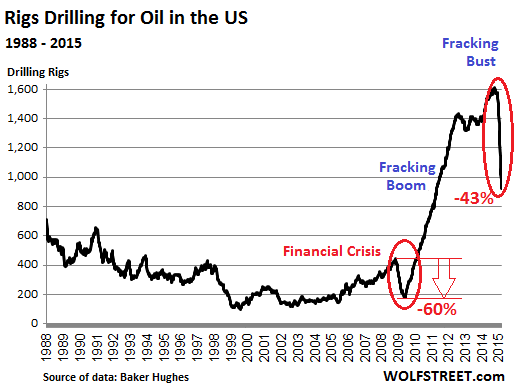
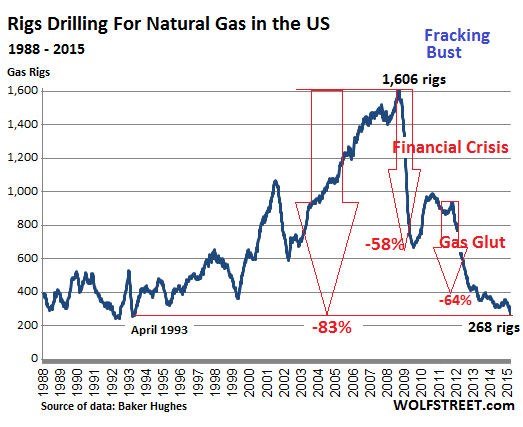
As such, it is imperative to keep in mind that the peak oil in the U.S. is not a myth. At the current oil price, the supply of the unconventional oil production in the U.S. will quickly prove self-correcting. Both the oil production and the crude inventories in the U.S. will stall soon and will go into a permanent decline effective H1 2015 as a result of the ongoing reduction in drilling activity, the high depletion rates of the unconventional wells and the finite number of the sweet spots.
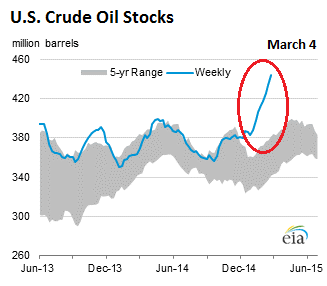
In fact, the rapid decline has already started. First, the Energy Information Administration said yesterday U.S. crude-oil supplies declined 3.7 million barrels on the week ended Nov. 28. Analysts surveyed by Platts had expected crude inventories to increase by 380,000 barrels on the week.
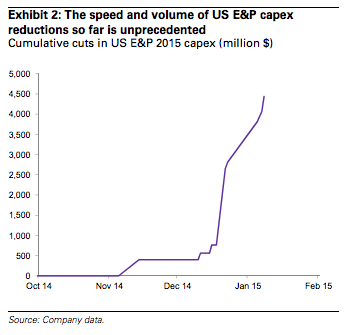
According also to today’s news from Seeking Alpha, new permits, which outline what drilling rigs will be doing 60-90 days in the future, showed heavy declines for the first time this year across the top three U.S. onshore fields: the Permian Basin, Eagle Ford and Bakken shale. Specifically, there is an almost 40% decline in new well permits issued across the U.S. in November 2014, with only 4,520 new well permits approved last month, down from 7,227 in October 2014.
These numbers indicate a sizable dent in U.S. production in the not too distant future. Most of that dent will come from the highly leverage players holding lower quality land.
The Oil Sector In 2015 And The Real Estate Analog
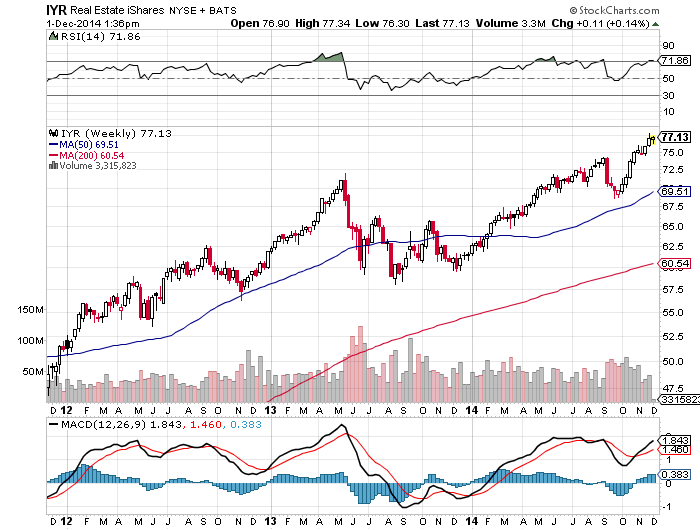
The ETFs (NYSEARCA:IYR) and (NYSEARCA:VNQ) measure the performance of the real estate sector of the U.S. equity market and include large-, mid- or small-capitalization companies known as real estate investment trusts (“REITs”). Their charts over the last couple of years are illustrated below:
(click to enlarge)
and below:
(click to enlarge)
All the investors know the fundamental problems behind the slump of the real estate sector in the U.S. a few years ago. Given that no fundamental improvement can take place overnight, it took the real estate sector in the U.S. a few years to recover from its lows in 2009.
I am sure now that many readers wonder why I talk about the real estate sector in an oil-related article. What is the relation between the real estate sector and the oil markets?
I mention this example because I strongly believe that the oil price will recover like the real estate sector has recovered from its bottom over the last three years. But, there is also a big difference here. The recovery of the oil price will be much quicker than the recovery of the real estate sector, given that this slump of the oil price has been driven by lame thinking, arbitrary speculation and sentiment, while having nothing to do with evaporating geopolitical risks around the world or a material deterioration of the global supply-demand fundamentals.
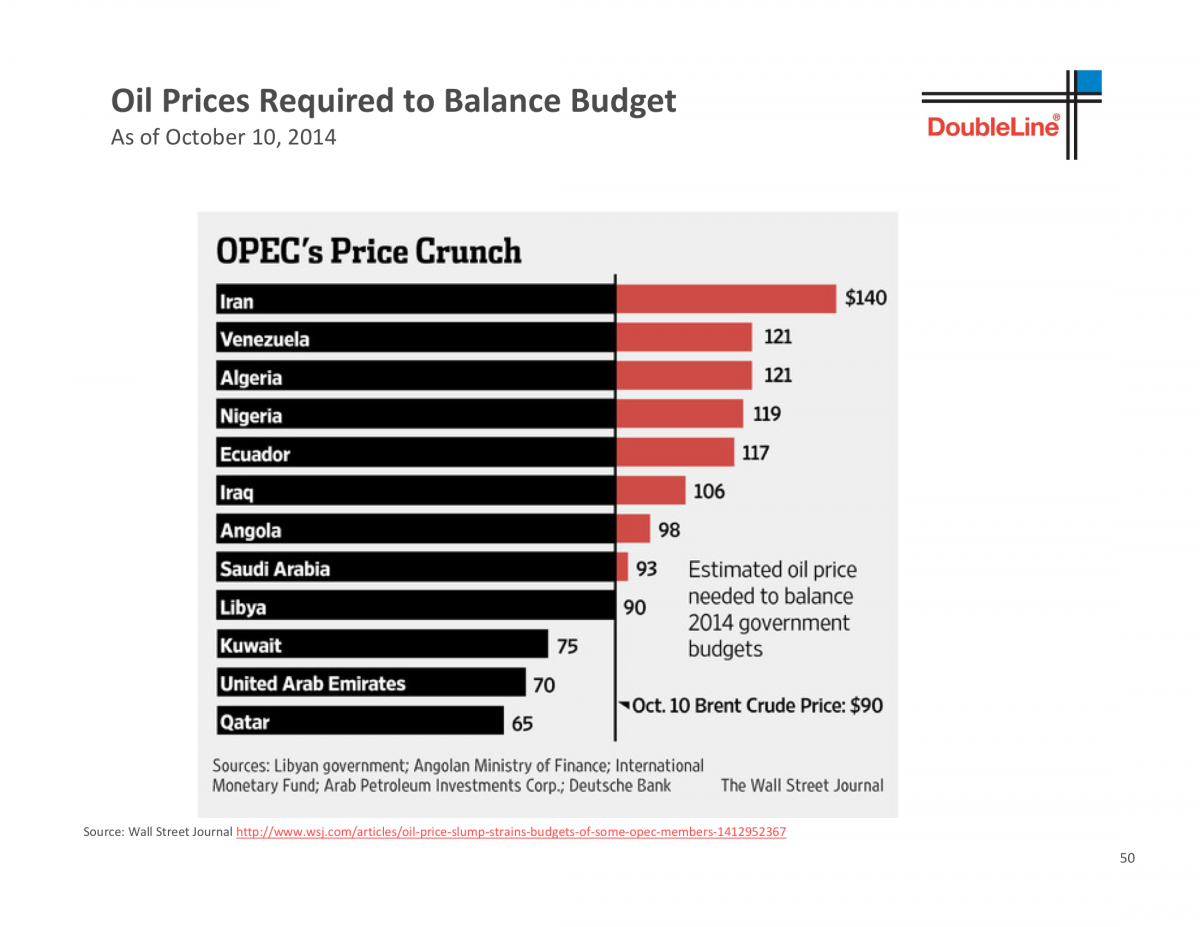
On top of that, there are some additional geopolitical clouds on the horizon that can make oil jump by H1 2015. For instance, the current low oil price has brought many OPEC members to their knees, while the holders of those countries’ sovereign debt are toast as long as oil stays at the current levels. Iran, Iraq, Libya, Algeria and Venezuela are not prepared to withstand low oil prices for long and they are now in serious danger of political upheaval at current prices. According to yesterday’s news from CNBC, the first signs of an escalating social unrest in Venezuela are already there, and things will definitely get worse over the next weeks.
Furthermore, Russia and Saudi Arabia will be anxiously watching the rapid depletion of their sovereign wealth funds, which will make the political situation in these two countries dicey over the next months.
In other words, I obviously agree with Andrew John Hall, who is known as the God of Crude Oil Trading. Although many investors and readers do not know this oil legend, Hall is secure in his view that the price of oil is destined to rise sooner rather than later, mocking those who are convinced that a U.S. shale boom will mean long-term cheap, abundant energy.
My Takeaway
Fellow investors, please educate yourselves for your own benefit. Everyone talks about buying low and selling high, but he often does the opposite. The typical investor often buys high because he feels good. And he sells low because of panic and lame thinking.
Therefore, this is the essence of my investment thesis. This oil price fall is a sentiment-driven slump. This is short term and sentiment-driven noise in the big picture story. Right now, oil has come to the point where it is unloved, which is exactly when you have to expose yourself to the sector. This oil downturn cannot last long and oil will bounce back by early 2015.
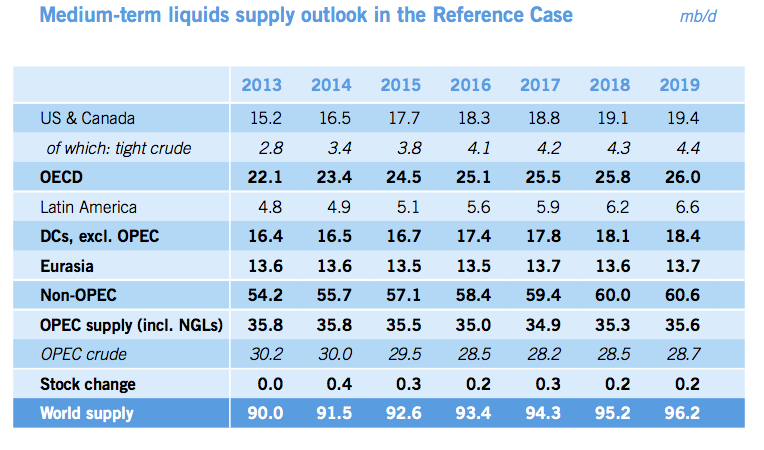
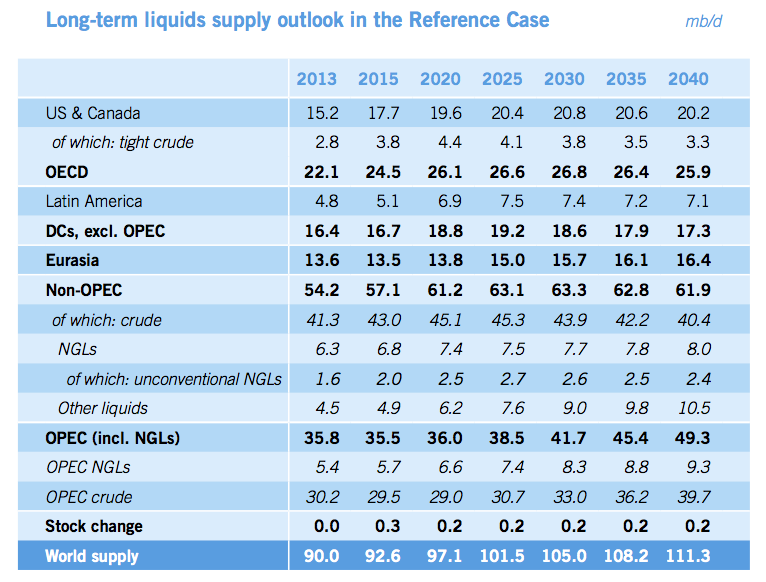
On the supply side, there are not any “elephant” conventional discoveries over the last years, and this is why the conventional oil production from the U.S., the North Sea, Mexico, North Africa and the Middle East has been falling over the last years. Cheap and easy oil is gone forever, and the global marginal barrel currently is in the $80 to $90 range.
Due to the current low oil price, oil supplies will become critically tight by early 2015, largely because production leader Saudi Arabia is not able to pump as much extra oil as many people believe. In fact, Saudi oil production has peaked at approximately 10 million bopd over the last years, as illustrated below:

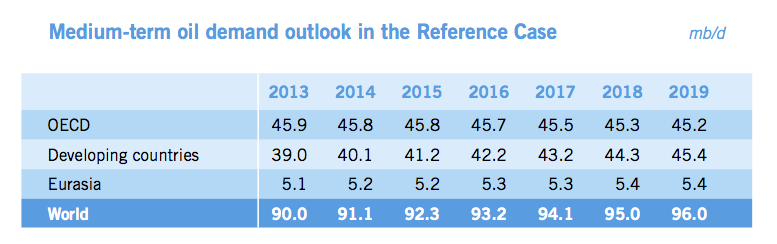
On the demand side, the investors must not ignore that world population keep growing at a satisfactory rate in an energy intensive world, as witnessed by the GDP growth rates and the GDP per capita for the world’s biggest oil consumers mentioned above. As a result, global oil demand continues growing unabated at average of 1 million barrels per year.
Meanwhile, the geopolitical tensions are escalating and the crude oil price is best proxy for geopolitical risk.
After all, how can the investors weather this temporary storm and benefit from this oil price shock? Well, big fortunes will be made to those with the patience and foresight to pick right and hold tight. Just pick quality oil stocks with low key metrics (i.e. EV/EBITDA, EV/Production, EV/Reserves), sit tight, and you are going to do very well given that the strong players will remain and the weak ones will vanish.
For instance, stay far from the heavily indebted companies with a high Net Debt to EBITDA ratio, because many highly leveraged U.S. shale producers will go broke over the next couple of years. The rising tide will not lift all boats. Even if WTI jumps at $85/bbl tomorrow, several U.S. shale oil producers will not avoid bankruptcy while others will be sold for pennies on the dollar. Beggars cannot be choosers.
And now you know why I sent out last Thursday a Market Update to the subscribers of “Nathan’s Bulletin,” urging them to load specific quality picks. And when Brent crests that $90 mark again, they will be glad they did.

 The price of crude oil has not looked this bad since March, when it made lows of $42.03, or on August 24, when it fell to $37.75. On Friday, November 20, active month January NYMEX crude oil settled at $41.90 per barrel. The expiring December contract traded down to lows of $38.99 on the session. There are very few positive things to say about the future prospects for the price of crude oil at this time. The fundamental structural state of the oil market is bearish for price.
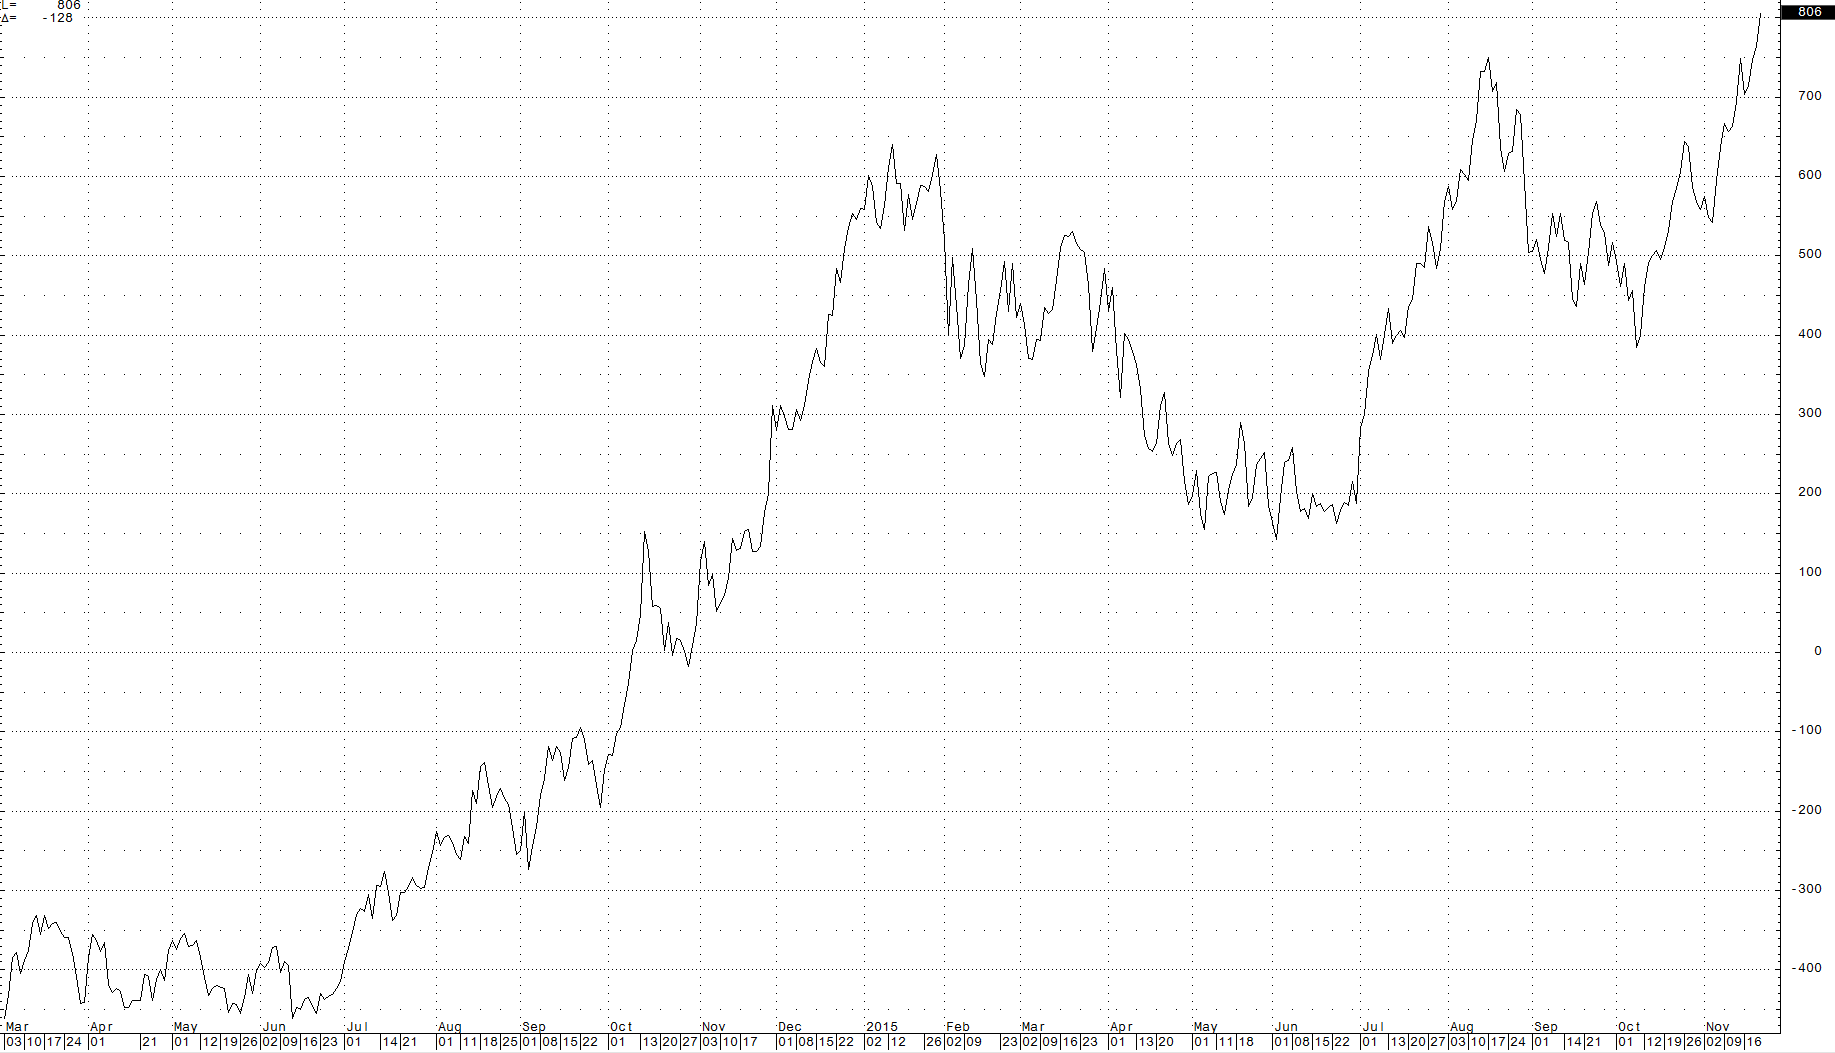 The December 2015 versus December 2016 NYMEX crude oil spread closed last week at over $8.00 per barrel. The contango has increased to 20.46%, the highest level yet for this spread. The January 2016 versus January 2017 NYMEX spread also made a new high and traded above the $7 level.

 The monthly chart of the gasoline crack highlights the recent strong action in this spread. Gasoline is a seasonal product; it tends to trade at the lows during this time of year. In 2014, the high in the gasoline crack at this time of year was $12.36. Therefore, compared to last year, gasoline prices are strong relative to the price of raw crude oil. This could be due to the current low level of gasoline futures – the December NYMEX gasoline futures contract closed last Friday at $1.2866 and the January futures closed at $1.2670 per gallon. The current low level of gasoline prices has increased demand from drivers as refineries work to process heating oil as the winter is only a few weeks ahead. In September U.S. drivers set a record for miles traveled by automobile.
 Last Friday, the January heating oil processing spread closed at around the $17.50 per barrel level. Last year at this time, the low in this spread was $22.73. In 2013, the low was $24.53 and in 2012, the low was $37.75 per barrel. The current level of the heating oil crack spread is seasonally the lowest since November 2010 when it traded down to $12.35 per barrel. In November 2010, crude oil was trading above $84 per barrel.


 Source:


 by
by


 by
by


The reason oil stayed as high as it did was the fact that India and China subsidized it. The fact that China passed the US in imports misses the point. China uses 36mm boe in coal every year. They manufacture 700 million tons of steel versus 40 in the US. This is due largely to $5 trillion in QE. In the process of this absurd borrowing, they have wiped out most of their neighbors.
Earnest and Young estimates that there is 300 million tons of excess steel capacity in the world and China is STILL building new capacity. That 300 million tons is assuming China continues to use 640 million tons internally. Once countries start to protect their steel producers, China is going to collapse. Steel requires 11 BOE of energy per ton. 300 million tons is the equivalent of 10 million BOE of energy per day. If there’s a recession, you could see total energy use drop by 15-20 million BOE per day.
Demand isn’t what people want, demand is what they can pay for. Once the wold starts defaulting on this junk corporate debt, petroleum demand is going to collapse. The last time we went through a shock like this was 1982 and 6 million BPD of demand came of the market. This one is going to be far far worse. You could easily see oil go to $50 and stay there for a decade. According to Evans-Ambrose Prichard, Jim Chanos and Kyle Bass, China is going to collapse.
” The recovery of the oil price will be much quicker than the recovery of the real estate sector, given that this slump of the oil price has been driven by lame thinking, arbitrary speculation and sentiment, while having nothing to do with evaporating geopolitical risks around the world or a material deterioration of the global supply-demand fundamentals”.
and this one:
” In fact, the rapid decline has already started. First, the Energy Information Administration said yesterday U.S. crude-oil supplies declined 3.7 million barrels on the week ended Nov. 28. Analysts surveyed by Platts had expected crude inventories to increase by 380,000 barrels on the week.
According also to today’s news from Seeking Alpha, new permits, which outline what drilling rigs will be doing 60-90 days in the future, showed heavy declines for the first time this year across the top three U.S. onshore fields: the Permian Basin, Eagle Ford and Bakken shale. Specifically, there is an almost 40% decline in new well permits issued across the U.S. in November 2014, with only 4,520 new well permits approved last month, down from 7,227 in October 2014. “
I did not actually expect such big declines so soon. Both declines really surprised me. How long can an investor remain in denial?
“China is going to collapse.”
People have been saying that for around, well, forever.
How many people world-wide have been sitting on the proverbial sidelines at $100+ oil? Waiting to start or expand a biz. Waiting to buy a car?
All of a sudden, poof, 40% off on the COGS!
Possibly a big demand shock coming.
Answer: None.
Most people (Americans) can’t even tell you who Ben Franklin was, much less tell you the price of oil.
They can’t even remember how much their last tattoo cost them, or their boyfriend.
Nonetheless, I don’t buy some of the talk I’m reading on the internet that “the US shale drillers will keep right on going with oil at $65”. That idea is just totally ridiculous. The operating cash flow generated by US shale producers will decline dramatically if oil stays below $80 and they won’t be able to raise nearly as much capital because of lower stock prices and substantially higher yields required to sell bonds. So US shale drillers will be forced to cut back on drilling activity because of a simple lack of capital and cash flow to pay for horizontal drilling, which is expensive. This big drop in drilling activity, which will happen for sure if oil stays below $80, should cause US oil production growth to drop sharply in the first half of next year and that drop will probably cause the oil market to correct back up into the 80s by the second half of next year.
I’ve been surprised that the Saudis have been willing to let oil prices fall all the way below $70. I’m starting to wonder if anyone really knows what oil price they need to balance their national budget. Same thing with the Russians–it’s difficult to get good credible information from the Middle East, South America, and Russia about national budgets and other subjects like what kind of oil production technology they’re using today and what their marginal cost of production is today. Do Wall Street analysts and those sleepy international agencies in Europe really know what’s going on in the Middle East and Russia? I’m starting to wonder.
Thank you for your compliments. The huge divergence between the reality and the market perception is more than apparent in the oil markets now.
The geopolitical risks have worsened compared to 2013 and H1 2014, the GDP growth rates in 2014 are at or above expectations in the world’s largest oil consumers compared to 2013, while the crude inventories and the new permits have already started to drop rapidly. We talk for a 40% decline here.
To me, this is the definition of: THEATER OF THE ABSURD.
Let’s see how long this THEATER OF THE ABSURD will go on.
Regards,
VD
Thank you for your compliments. As mentioned above, what is going on now in the oil markets is the definition of the: THEATER OF THE ABSURD.
Let’s see how long the oil bears will keep behaving in this irrational manner trying to make money at the bottom although the facts are not there.
Regards,
VD
Re: “I don’t buy some of the talk I’m reading on the internet that “the US shale drillers will keep right on going with oil at $65″. That idea is just totally ridiculous. The operating cash flow generated by US shale producers will decline dramatically if oil stays below $80 and they won’t be able to raise nearly as much capital because of lower stock prices and substantially higher yields required to sell bonds”
If oil price keeps going down, and I’m a shale driller with sunk cost already, wouldn’t I want to try to keep pumping MUCH, MUCH more first to try to keep my fixed costs even lower, to try my best to survive, before the inevitable happens? In other words, I think we might just be seeing the beginning of the price fall … sure, 6-12 months down the road, we’ll see some real bust happening (not all producers have enough liquidity to last 6-12 months), but the time from today to the next 3-6 months could be really painful for longs … before they cut production, I think, they’ll try to produce a heck of a lot more to try to survive, before the financial constraints starts to work – remember, financials have many avenues, some will still pump more, borrow from banks to suvive, etc. i.e. we could be looking at 6-12 months pain before recovery, before the banks finally say enough is enough, before capital markets starts to rate the bonds as junk, etc. These process could last a long time, and until then, we might be seeing continued increased weekly production which will keep depressing crude oil prices …
Originally, I plan to go long on crude oil stocks, but I’m now thinking of holding back my longs until I see a real bottom in prices. I like to see US production slows down for 2 to 3 weeks in a row, and right now, we are just not seeing this happening at all – US producers keep producing more oil every week, and with Saudis not cutting down, the supply of oil on a weekly basis keeps going up, and prices inevitably must come down … I have a feeling, $65 will not be the immediate bottom yet … but let’s see …
I do think there is a temporary glut of supply that triggered the decline, coupled with the obligatory unwinding of long positions…crude prices may capitulate further, but they won’t stay down for long. The tricky part is staying patient and waiting for a tradeable bottom, and separating the long term winners from the ones with excess leverage and poor fundamentals. We know the hedge funds are herd animals so expect more piling on of short positions to drive crude lower.
I am getting sick when I see how quickly all these highly paid “gurus” change their mind depending on which way the wind blows, while ignoring the facts. And they behave like parrots repeating the words and imitating the actions of another.
This is why, I felt the need to write this factual article that clearly demonstrates what these “gurus” were telling us in 2013 and H1 2014, and what could drive prices at $150/bbl.
Also, separating the wheat from the chaff is something that ALL the investors must do now. They must NOT make the mistake to load the heavily indebted energy companies because it will be a “dead cat bounce”, if these companies ever bounce back.
Regards,
VD
I greatly value your research, time and effort put into you articles.
However, timing is everything. This piece feels desperate. I have read a lot of details on the subject of late and there were many signs of this slump in prices coming that were not accounted for by those who only see oil prices as going up.
Prices go up and they go down. I don’t see the compelling evidence that it will suddenly go up soon.
Just pull up the price charts of crude oil over the past 20 years.
You’ll see this current price drop is the 2nd longest drop over that period.
The only time when crude had a bigger drop was back in 2008, from a peak of $147, down to a low of $33, near the 200 month MA. Today, we are near the 200 month MA as well which is currently around $60-$65 … we can’t time it precisely, but over the next few months, I feel we are close to the current bottom, and it makes sense to pick good quality issues relating to crude oil, and slowly work your way inside. Never go on margin, this is really Value Investing at its finest, and if you are not scared, you are not doing Value Investing properly – I won’t bat an eyelid if the purchases made this week drops by 50% more at the bottom, because history has shown that they will rise much, much more. I’m looking at +100% gains over the next 1-3 years at the least …
Demand for oil in the six segments that simply cannot stop are impervious to economic slowdown (plastics, oceangoing freight, train freight, fertilizer, aviation, modern armies). Regardless of consumer slowdowns, these six segments represent 80% of oil and net gas consumed around the world. When economies slow down, the food, freight, aviation and military segments do not, they continue on. A recession in Europe or China would only slow the rise in demand, not reverse it. Look at the demand trend of the past year and understand that even if demand only rises at one half the slope is has followed from 2004 until now, it will still outstrip current expected global production for Q1 2015. Oil price strip is highly elastic to tiny percentage changes in the supply-demand balance. Current situation is creating the coiled spring and that coiled spring WILL unwind before the end of 2015.
We just hope it is a measured controlled unwind throughout the year, otherwise we will have the $140 spike we saw in 2008 for a month or two before settling down to something in the $90 – $100 brent range.
Set your DCF and NAV models for $90 brent / $85 WTI. This is going to get ugly before the weather gets cold again in 2015. I’m willing to go out on a limb and say you can quote me on this one.
Here is the reality when Brent is $70/bbl for more than one or two months…
1. Venezuela is cash flow negative and cannot make coupon payments on its foreign debt. Venezuela WILL default on its debt before end of 2015 in this price regime.
2. Iran cannot feed its army at this price. The mullahs depend on the support of their army to maintain power. Kicking this leg out from under the government stool makes their continued existence precarious. Martial law kind of precarious.
3. The government in Tripoli cannot feed their guard at these prices. If the government in Tripoli cannot do this, they cannot protect the pipes that carry crude to their northern port. When that happens the other government in the west breaks through and shuts the pipe down to prevent revenue from reaching the Tripoli government and thereby trying to strangle it. 800,000 bbl/day go off stream.
4. Saudi Arabia is burning $2b/month from their sovereign wealth fund. At that burn rate, the ENTIRE sovereign wealth fund runs dry in 60 months. They need to turn the boat around long before that happens because if they burn through more than about 25% of it, angry men with beards and automatic rifles start to hang around the palace gates. Not a stable internal situation. Riyadh has made major financial promises to its citizens in return for peace and their support. And in Saudi Arabia, the citizens do not have peaceful protest marches when they are aggrieved.
5. Russia is burning $2.5b/month form their sovereign wealth fund. At that burn rate, the ENTIRE sovereign wealth fund runs dry in 48 months. They will tighten their belts, suffer, freeze, grit their teeth and tough it out. BUT! (and this is a big one) understand that at the back of the mind of every strategist in the Kremlin is the nagging thought that all they have to do to cause a global geopolitical crisis and force the price of energy to whipsaw back up to $100/bbl in the course of a week is to kick the hornets nest: Roll the tanks into Donetsk and Lukhansk. Overnight crisis and EU buckles because it is now winter and Germany will freeze without the Ukrainian transit gas (Nordstream can only supply about one third of what Europe needs to stay warm).
6. I can’t even begin to fathom what the dynamics going on in Syria / Iraq are right now, but it can’t be good. I’m sure Baghdad had to guarantee Kurdistan a minimum cut in the negotiation to let them export. Well, either Baghdad or Kurdistan is not going to get that minimum cut agreed in that negotiation. How do you think things are panning out in their relations now?
This situation has the makings of a new Arab Spring / Cold War settling in… and it cannot remain in equilibrium for a whole 12 months.
Thank you for your comment. But, my article is full of facts as always. If you disagree with the facts, it is your choice.
Regards,
VD
Thank you for your compliments. Good luck with your investments.
Regards,
VD
Oil Bears and Analysts are driving the oil price down with their unrealistic attitude towards:
a) Negative growth;
b) India’s energy appetite; and
c) The fallacy of Nirvana in the Middle East.
Not to mention that Pick-Ups and large SUVs are back in vogue in North America…
I also believe that Putin will rattle his sabre and agitate conflict somewhere, to raise uncertainty and thus prices – if the drought in Oil prices remains lower much longer. After all, the fall in the price of crude in the mid 80’s (and Reagan) brought the USSR to its knees. He will not repeat that. Guaranteed.
Waiting for a firm bottom – then backing up the truck for more PTA.
No one will know the absolute bottom, at the “Hard Right Edge” of the charts. Bottoms are only know once some time are passed, and by then, you won’t be able to buy at the bottom price. That’s the reality of prices. The key is Money Management – always make sure to have enough cash to buy at lower prices when bargains avails themselves. For highly cyclical stocks, a rough yardstick is 75% fall in prices from the peak for decent names. E.g. SDRL is one that I think could be interesting – peak price was $48 in 2013, and is now trading near $12, or 75% fall. I would allocate around 4% of my portfolio to this, to be split into 4 bullets, and have actually deployed first bullet at $13.50. I’ll be looking for a final buy price of around $7 (approximately 50% fall from my first entry), and these types of buys are just put into the drawer and forget. When the drawer is opened in 1-3 year’s time, you will most likely earn anywhere from 50% to 100% gains or more.
Meanwhile, have the stomach to see the value of what you bought dropped by 50% from what you purchased. Don’t ever think about selling then, because the Reward to Risk of holding is much, much better.
And diversify into 3 issues at the very least, so that total exposure to crude oil is no more than say 12% trading capital. I am just very cautious, but of course, at the very bottom, for the 4th buy, you could double or triple the buy size and raise the 12% up to say 15%-20% capital … but these type of substantial increase must show capitulation, i.e. big price drops with big volumes …. (SDRL has shown the first capitulation last week and this week, and usually, there’s more than 1 capitulation). And if you are a nimble trader, you would also consider adding on the way up, e.g. when Weekly RSI(14) crossed above 20 and Daily RSI(14) dropped back down to around 30-40 or so ie. dipping on the way up, if you are worried that you only have 3% capital in this during the bottom.
PS. SDRL falls into my screen, because at $13.50, it is trading at NAV, and well below Replacement Cost. So, if it falls to $7, that would be trading at 50% NAV approximately, and is good enough for me.
Thank you for your compliments. Also, good luck with PTA (Petroamerica Oil) which is debt free with a pristine balance sheet, as shown in my previous articles.
Regards,
VD
Warren Buffett has said more than once that he has NEVER managed to buy at the bottom and sell at the top. Nevertheless, he is a billionaire.
Regards,
VD
– more and more suppliers will go out of business or reduce supply
– consumption and hence demand will rise if oil is that cheap.
There are a lot of factors at play as you well demonstrated – geopolitical, GDP growth, but also competing energy sources (and I’m not talking nuclear fission, but renewables). But the overriding factors appear to be speculation and herd behaviour. And we all know they can only go for so long into one direction.
Thank you for your compliments.
Regards,
VD
Also, not all shale formations are so thin as to horizontally support only single laterals. Some, like the Wolfcamp, are very thick, and the first wells drilled are really only the first of many stacked laterals.
Back to innovation and knowledge, that is not limited to shale plays, either. Not all of the new oil production is shale production. At least some if not much of it is from new horizontal development of non-shale assets. For example, look at the Spraberry in W TX.
Also, the shale wells that are drilled and produced typically hold under the leases of unsophisticated lessors other zones that have not yet been tapped.
There is more to be squeezed out of these formations than most people realize, and with advances in cost savings along the way, there still remains quite a bit of money to be made.
If it is “not fully understood” then you cannot say anything about future shale production. Currently, the author is correct. Until production is realized, such as current retrievable shale oil, for investment purposes, it doesn’t exist.
What it is going to take to send men to Mars is not fully understood, either. But that does not mean that we cannot say anything about sending men to Mars at some point in the future.
Thank you for your kind words.
In terms of the shale oil and the technology, I believe that the technology cannot make wonders overnight. And more importantly, the current technology cannot get a lot better overnight, given that it took us (George Mitchell) many years to improve this shale process and bring it to the point where we are now.
If the oil price remains at the current levels for long, the peak oil event will occur in 2015, in my view.
Regards,
VD
———————-…
Please let me know when the majority of oil newsletter writers turn bearish, that is when I’ll be a buyer.
best,
-samberpax
You are NOT a subscriber of my newsletter that was out just 3 months ago, in September 2014, when the oil price was already falling.
If you were a subscriber, you could check my picks and the recommended entry prices.
And please let me know and I will gladly send you the returns from my picks in H1 2015, based on the recommended entry prices.
Regards,
VD
I buy the long case for Oil, long term. But the question is that of how long it will take to come back.
The political unrest in the middle east ist not necessarily a cause for less supplies: the ISIS for instance uses Oil to finance their war. The anarchy actually can dislocate the production discipline and lead to lower prices. But agreed with you, anarchy is not sustainable and Oil prices will eventually move up again.
Rgeards,
VD
The author seeks to discount the additional 3.5 million barrels the US produces that were not available 5 years ago by saying the wells dry up fast and the production cost are too high. That is the true “lame thinking” here. I heard estimates that some production cost in the Bakken are as low as $29 dollars and that $70 is actually on the high end. His cost estimates are from years ago. Good ole American ingenuity drives down the cost of recovering this oil daily.
The author doesn’t deal with the death spiral that OPEC currently finds itself in. The more profligate members need a high oil price in order to maintain their spending. If I can’t make my revenue with a high oil price what is my alternative? That’s right pump more. Their state goal at this last meeting was to keep the production quotas in place. What was unsaid and the real reason oil took another dive is cheating on production quotas will reach an all time high over the coming months as these governments seek to shore up their finances.
Finally, the author displays several charts but proceeds to ignore what the charts say. We have firmly broken all uptrends and any recovery will be very difficult. I would further break his argument down but that would just give more credence to yesterday’s theory about the state of energy supplies in the world.
So whats the max production capacity for the rest of OPEC for them to keep ‘pumping more’ to make budgets meet?
Secondly, just like in October when everybody “woke up!!” and sent the market down 10%, because NOW the world is going into recession, good call btw. I highly doubt you bears are any more correct on your reactionary projections after crude fell from $90, you must be rich predicting this stuff.
As an aside Gartman has been one of the best contrarian indicators of the past 2 years.
And just to put my money where it counts, not that seeking alpha isn’t awesome.I recently sold multiple strike puts on EOG, NOV, PXD, XOM, CLR. Implied volatility is ridiculously high, and if history is any indicator its a very high probability trade.
Edmund
Yes, that would be Dennis “Marty McFly” Gartman. To be honest, I would rather have the sports almanac than my oil stocks right now.
Thank you for the compliments. And when it comes to the nuclear fusion reactor, I do not disagree with you. We can definitely see it both ways.
Regards,
VD
Both oil and oil stocks have a lot further to fall in upcoming months. There will be a far better entry point for both later in 2015. Investors would be wise to exercise some patience here and let things play out for a while. Buying the first sharp break is rarely a good idea, particularly not when there are so many signals indicating that the global economy is losing momentum.
Oil prices will ultimately come back, until then focus on the myriad of economic sectors that benefit from cheaper energy. It should also present a great buying opportunity for a whole host of energy stocks.
This piece has too much emotion embedded in it for my liking.
I am not a professional analyst who is living from this analysis.
I am an investor instead.
Regards,
VD
Thank you for your compliments.
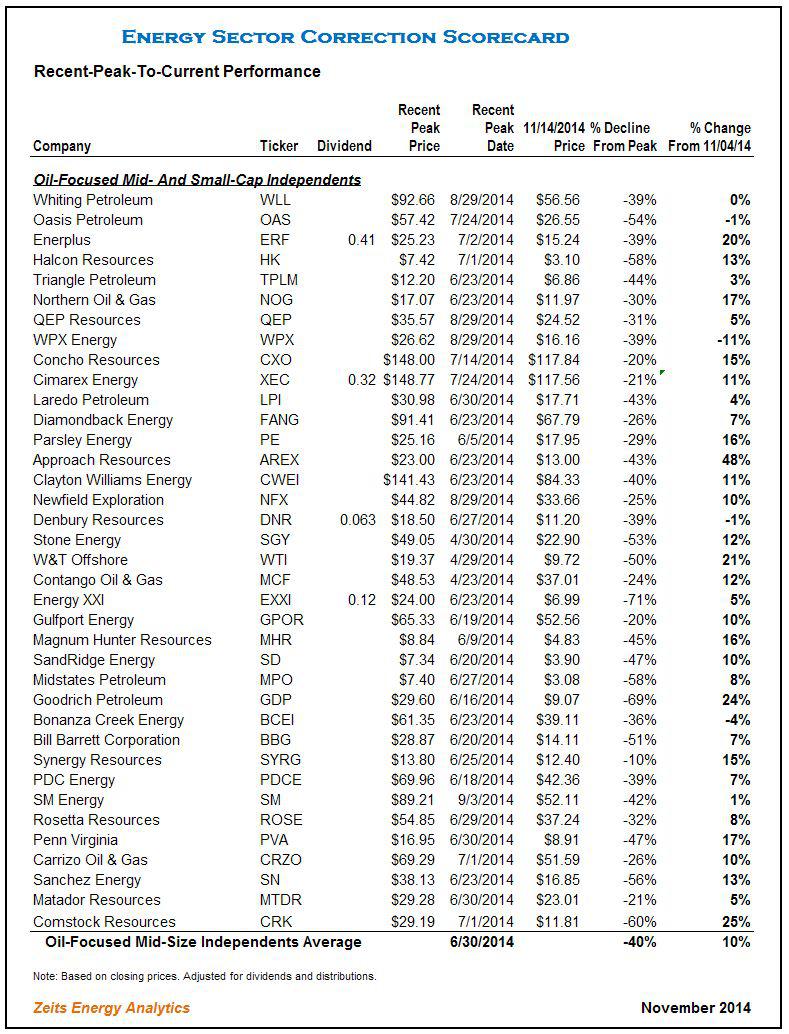
Please see my previous articles and comments to find my bearish calls on several energy stocks over the last months i.e. Halcon Resources (HK), Goodrich Petroleum (GDP), Cobalt International (CIE), GMX Resources (GMXRQ), ATP Oil and Gas (ATPGQ), CAMAC Energy (CAK), Pinecrest Energy (PRY.V), Midstates Petroleum (MPO) etc.
Regards,
VD
The title really sums up how stupid investors are being now. The current daily correlation between a 50 cent or $1 move in oil taking down oil stocks by a few percent is ridiculous. Dennis Gartman has no credibility, I don’t understand why CNBC has him on regularly.
Thanks again for the article!
They have Jim Cramer on, so why not Dennis Gartman? They both change their minds on a daily basis and do it with conviction.
Right now, small cap oil stocks should be bought for a year end rally, stocks like MDR, WG, etc could see huge gains from current levels.
Thank you for your compliments.
Regards,
VD
I think investors need to pull the trigger on stocks they wanted lower instead of watching tv for a buying signal.
What you describe is the definition of “HERD MENTALITY” that has brought the oil price at the current ridiculously low levels.
But Einstein has said: “Two things are infinite: the Universe and human stupidity. And I am not sure about the Universe.”
Regards,
VD
However, the claim that $80-$100 is the breakeven for shale seems unfounded – I think it was the IEA that said that only 4% of production uneconomic under $70?
I also read a very interesting article today, I think on CNBC (apologies for the lack of sources), that discussed how transportation costs have plummeted in the past years.
It mentioned that in 2011, companies were paying up to $28 a barrel in transport costs. It is now $1-$3 because of pipeline construction.
If that is indeed the case, it is clear that a lot of shale is economic way below $70.
Gartman and his nuclear fusion. What a tool. I made the exact same point elsewhere that unless engines are replaced with fusion reactors and someone discovers how to make plastic from ‘fusion’ we will be using oil for some time to come…
I think the plummeting oil prices are the result of speculation more than any other factor but, as always, the market can remain irrational for longer than most of us can remain solvent.
GL
Saudi only produces 10M bbl out of 30M bbl. I predict NOCs can only withstand the pain for 6 months. after that, they can elect to exit OPEC, and form a non-Saudi cartel to sell at $80-$90 band. Saudi can sell their 10M bbl cheap if they elect to, but that’s not enough to meet global demand, so buyers will have to pay non-Saudi price.
Regards, VD
He is betting that the price of oil will increase. He is correct in this assertion. Everyone knows the price of oil is going to go up, eventually.
““When you believe something, facts become inconvenient obstacles,” Hall wrote in April, taking issue with an analyst who predicted a shale renaissance could result in $75-a-barrel oil over the next five years.”
He should listen to his own advice, it seems.
Here is one article where the “5 year” buzz line comes from:
http://bit.ly/1viOe43
“The team acknowledges that the project is in its earliest stages, and many key challenges remain before a viable prototype can be built. However, McGuire expects swift progress. The Skunk Works mind-set and “the pace that people work at here is ridiculously fast,” he says. “We would like to get to a prototype in five generations. If we can meet our plan of doing a design-build-test generation every year, that will put us at about five years, and we’ve already shown we can do that in the lab” . . . . An initial production version could follow five years after that.”
And then ramping up commercialization of fusion power, another decade? we’re looking at 15-20 years best case scenario before fusion has any affect on fossil fuel prices. This just goes to support the author’s conclusion that oil prices are low due to “lame thinking.”
No chart of the relationship between the strength of the dollar and the price of oil. Is it relevant?
Good luck with your picks.
To all those investors who believe operators in the unconventional reservoirs can keep producing while oil prices are dropping, check out their H1 budget forecasts for negative changes in CAPEX. That will remove much of the guess work and hand waving on how profitable they expect their operations to be. They know better than the analysts and economists on when to turn the taps off.
gartman is the worst of the worst in my opinion. he really is clueless. I dont know why they keep having him on every other day on fast money and the like.
Its funny how media affect sentiment changes on a dime that makes everyone forget the bigger picture as you referenced above.
remember ebola and the airline stocks in october? ignore the noise.
Regards,
VD
I think at some point sooner than the media and herd thinks that oil will bounce hard upward. OPEC made a good move to instigate a needed correction and put the industry in check. Now I think (in the short term) we will see a scary drop lower fueled by more moves by OPEC such as todays move to cut prices from SA to Asia/India and USA. SA sees India as growing and needs to subdue the fact that demand is growing. I would not be surprised if massive amounts of capital is also used to force the commodity down further to keep the herd moving ion that direction. OPEC knows that they can turn it around very quickly (just tell the world they are cutting production and the herd reverses quickly) when they need to so they are in the drivers seat for sure.
Thank you for the compliments.
A LOT of people and greedy oil speculators will be burned by shorting at the current levels. They have to pay for their mistakes and their greed, as always.
Regards,
VD
There is nothing about ego here. You misunderstood it. I have a clear opinion that I support it with facts and links. If you have a different opinion, you are welcome to present it coupled with facts in another article. If you present speculation only, it will not help, I think.
Regards,
VD
when you started quoting your” gods ” and casting scorn on any who disagree i lost interest.
ps mr market is always right no matter how much fundamentalist cry.
Another paradigm changing event already mentioned is China. The enormous real estate debt bubble and steel production bubble also fueled by debt has to come to a head soon. Yes, the collapse of China has been forecasted “forever” but so was the 2007 US recession which also was belittled for years right up to the edge. So was the collapse of the Soviet Union. The Chinese Govmnt has been able to keep the ball in the air because they control most of the economy but the Piper stands at the door. A Chinese economic collapse which WILL come will also collapse the oil price. Maybe it will recover some first but no energy investor can afford to ignore this.
Caveat Emptor!
position, firmly. [until I change it]
What I am sure of, is that this situation will change, and that change
is inevitable.
NO, I am not an analyst.
What I want to know is a chart from the EIA on Zero Hedge showing retail gasoline sales in the USA have declined almost 75%!!!! since 2004. Then Bloomberg showed a photo of the first gas station in America selling gas for below $ 2.00. Weird that below the gas price it showed Diesel selling for $3.39 plus! The EIA does not explain that stuff well why diesel is much more expensive than gasoline.(a six cents higher tax from the Feds. low suphur costs and “demand” globally????) Then the EIA shows gasoline production in the USA has risen!!! OK that tells me big oil is exporting refined petroleum products to other countries to make tons of money off us. Killing diesel over environmental EPA type stuff for political reasons because gasoline costs more to make than Diesel even with the other factors and six cent tax, and Exxon is back in Green River developing their shale oil in situ electro-fracking method for the largest oil play on earth-TRILLIONS of BARRELS in AMERICA. All comes down to costs, the big boys games, and ignorance of the average US citizen willing to be played and fleeced.
Yes overall your article was good but there’s a lot more going on the secret weird world of big oil than any of us will understand like how in the 70’s the US “government” supposedly allowed Saudi Arabia to shut down our nation in the WINTER and I froze waiting in gas lines? The USA??? Biggest army on earth plus Standard Oil of California developed the Saudi oil???? Or that their lawyer, John J. McCloy told at least seven US “presidents” what to do and say through Reagan and HW Bush? Heck he even ran the Warren Commission with Dulles and World War 11. Harold Hamm says he can drill existing wells in the “Scoop” at 99 cents a barrel and tried to sue OPEC. He is not going to shut down next year and plans on ramping up oil production big no matter what the price is. He wants to ream OPEC and make them blink unlike the 1986 oil bust when we went broke.
All highly interesting and I am watching and going to buy back when I think oil has hit the low-could be next year though?
why are you looking at GDP growth rates when talking about oil demand when oil demand figures for those same countries are available?
I dislike articles that spend their time making fun of other oracles and then turn around and make their own guesses of what the future holds. It’s an emotional argument.
Actually, I like that part – in my nearly 2 decade experience, I’ve seen far too many investors put too much faith on analysts and it’s important to show actual real life examples where analysts are fallible also.
For example, take a look at SDRL. When SDRL was above $40, there were not many analysts telling investors to sell, the prevailing tone was “crude oil is going up, up, up, and buy, buy, buy”.. But when SDRL cuts dividends to zero at $15-$20, they are now downgrading SDRL. Buy at $40, sell at $20? I think you can go to the poorhouse very fast following these “anal-ysts”.
SDRL is not an isolated example. Today, after massive price falls, I see Zacks now telling investors to sell their energy mutual funds after these funds have massive falls …
As for the future, no one knows what is going to happen, you have to follow your own investing/trading thesis. For me, I think SDRL has fallen 75% from peak, cut dividends to zero, so, I am slowly starting to accumulate SDRL, looking to spend up to 4% capital when it finally gets down to say $7. Yes, no guarantee it will fall down that far when today is only $12, but I like the fact that it has fallen from a peak of $48 down to $12 … that’s my unsubstantiated opinion also, and probably emotional as well 🙂 And yes, I’m starting to think of accumulating when analysts consensus is to sell … it worked very well for me over the past decade ….
———————-…
Exactly so! I am elevating my standard by lowering theirs. Sad, very sad indeed.
Best,
-samberpax
http://bloom.bg/12CBfjp
Here is the link to Lockheed-Martin’s compact fusion announcement. These researchers/engineers are the best of the best, I would think, so if they’re making an announcement, they must have something legitimate up their sleeve, I would think:
http://lmt.co/1yJEu5x
Interesting article on Fusion, nice read.
However, the recent crude oil price fall down to $66 is most likely unrelated to Lockheed-Martin’s fusion piece, as that piece seems more about promoting Lockheed-Martin in research and what they think they could achieve in 5 years time, and still not yet confirmed …. but good to cast a quick glance from time to time on these sort of things ….
If Lockheed-Martin managed to bring this to commercial production at small enough sizes at reasonable prices (that’s a BIG IF), then, I think we first see Lockheed-Martin’s stock price zooms up first a lot more than what we’ve seen so far, before we see global crude oil prices comes down significantly … that’s just my gut feel …
There is no guarantee we’ve seen bottom in crude yet, but I feel we are now entering a period where Value Investors should start to feel excited on some of the high quality issues that are beaten up hugely, to trade below NAV and trade well below Replacement Costs …
Cheers,
TF
I haven’t sold any of my oil stocks, but I haven’t added yet, either. Would love to buy some LNCO to bring down my cost basis, but I’m concerned they’ll have to cut, or pull a Seadrill and eliminate, their dividend.
I have been waiting for a follow-up and this seems to be the one.
Again I am impressed by your knowledge and your reasoning but I’m a bit disappointed too. Especially by not addressing points 3 and 4 of these 8 major reasons.
———————-
Just to refresh, points 3 and 4 of these 8 major reasons:
3) The weakening of the U.S. dollar.
4) OPEC’s decision to cut supply in November 2014.
Best,
-samberpax
Please bear in mind that the HERD MENTALITY is like the TITANIC cruise ship. The big ships need a couple of miles to turn….
Regards,
VD
Agree this is very much a TITANIC cruise ship that will take a few miles to turn … apparently, the weekly US Oil production figure need to show 2 to 3 consecutive week of decline at the very least first. Until then, odds are crude oil will keep falling (short term momentum). I now feel we may be close to bottom, but we are not confirmed there yet, and I won’t be surprised if crude makes $30 very briefly, before a strong and fast recovery once a few of these marginal producers are out of the picture …
Just as Saudis and US are stubborn right now to curtail production, in a year’s time when a few of the US producers goes bust, the Saudis will have achieved their objective and cut production, and just as quick, I see crude oil could rise back to $100 very fast … the US production numbers are always a surprise to markets, I expect the Saudi’s response to also be a surprise to the market when they cut back production in 6-12 months time – those looking for signs will not find it, I believe it will be a surprise to the market when it happen anytime within the next 12 months …
Whilst I agree with your base thesis and believe that the price of oil is going back up to what are more “normal” levels, some of the biggest consumers of oil on the planet are likely going to use less-and-less of it as time goes on. For example, there are pretty strict rules in place for future vehicle mileage requirements in the US, the EU has been clamping down hard on emissions for a pretty long time and lots of companies are now involved in the business of making energy efficient equipment and machinery. The list is long – GE, Siemens, Caterpillar, Deere, Hitachi, Volvo, Komatsu…..and so on.
The historical environment for oil consumption is becoming more-and-more dated when compared to what the oil consumption environment will look like going forward. It’s hard if not impossible to use the past as an accurate guide to the future.
The future oil consumption environment in two words – different and lower.
If you are short on crude oil, I don’t see a reason why you need to close your shorts now as crude keeps falling. You should only close it when you see a confirmed uptrend, at least, that’s my view.
Value Investors though are a different breed – they ease their way in specific value stocks, and now, many oil related stocks are trading at below NAV and well below Replacement Costs with strong cashflows during the last oil crisis … these stocks could still fall by another 25%-50% or close to bottom, no one really knows and so, they start to accumulate a little bit at a time … history has shown that crude oil will eventually recover, and they could be looking at +100% returns in 1-3 years time … the Value approach does not require market timing, and crude oil being highly cyclical in nature means we will definitely see $80-$100 crude oil again eventually over the next 1-3 years, we just don’t know exactly when. If it goes back to $100, you can be sure many of these crude related counters will go back up to their former levels, potentially 100%-300% gains …
Mr Market has presented a compelling opportunity, the key is Money Management, accumulate a few high quality counters, and once bought, lock them up in a drawer and don’t worry about the daily price volatilities. In 1-3 years time, the gains of +100%-300% can be had … know the strategies in advance, never allocate more than 15%-20% portfolio to oil related counters at the bottom, and certainly, never go on margins. I have been staying cash majority of my portfolio, I just recently allocate 2% capital on oil counters, and plan to slowly work my way to 15%-20% assuming these stocks could fall up to 50% from current levels … This is a no-brainer approach, I just don’t care about the daily price volatilities.
Cheers,
TF.
i am heavily long on oil and hurting badly but i keep buying as price drops. i am in your camp
Oil futures, stocks or options? I hope it is not leveraged instruments? The trend is still down …
I’m eyeing SDRL – originally, I plan to go in with 4 bullets, at $13.50 (already done), $11, $9 and $7 very roughly speaking, but now, I will most likely try to take advantage of the short term down momentum (I am a trader) to cut loss some and take wait to pick it up at lower prices, and wait for a better technical signal. Allocating just 4% capital for SDRL.
The other 2 counters are HP (this is a Dividend Aristocrat that keeps paying higher dividends every year for over 25 years) and NE (this is a nice Value play), but I haven’t triggered any buys in either yet as Crude keeps falling and the counters keep falling … Again, 4 bullets each, total 12% capital when I’m done all the 3 buys at the bottom.
Originally, I plan to make a “simple” buy approach of just buying at set levels, but the more I study the crude markets fundamentally, the more I realize that I can fine-tune my entry better, so, let’s see if this is successful or not …
How about you? What counters are you looking at?
Glad you didn’t go for futures / options with time expiries – I just don’t know how long these crude oil price can fall – it can keep falling and falling, and the bottom and recovery I believe will be a huge surprise to me.
Personally, I prefer safer, large caps, very liquid stocks that institutional buys with average daily volume greater than 500k to 1000k shares, and try to buy using a combination of writing puts and directly, and sell covered calls also.
Whilst my current list is SDRL, HP and NE, if I find something else better, I’ll most likely drop one for that …
Good luck.
Cheers,
TF
Oil company stock valuation is based on EV/B/D; EV/EBITDA and EV/Reserve; It does not matter whether large cap or debt; In case of low rev they can always curtail drilling and be very liquid to pay down debt. Worse come worse they will sell their reserves for better price than current valuation. We just bid on various leases offered by Chevron and we did not get it as there are numerous buyers willing to pay higher price.
raj
One could make educated guesses based on the geopolitical actions/goals of the major oil producing countries, changes in demand, etc.
I’d rather see oil stay around these levels for a while as I accumulate.
Looking at Venezuela and Iran for example – the oil price before the crash, at it’s peak…was nowhere near the quoted figures given for these countries to approach break even; so who goes broke first…small shale producers in the USA or the countries that need $150 oil to just break even, or do they just continue to go broke forever?
I don’t think the OPEC decision is targeted solely at US shale plays…there’s others that are in far more pain over this, the rest of the global economy benefits while oil producers suffer a small but probably needed shakeout: I’ve got investments in oil but it’s ok to lose paper money on one part of the portfolio if another part benefits… I think sovereign default would be a lot worse for everyone involved. Oil will go back up in price eventually, and the median price will rise over time as the asset depletes. When is actually not that important unless you need your money tomorrow.
Please see the excerpt below:
” On top of that, there are some additional geopolitical clouds on the horizon that can make oil jump by H1 2015. For instance, the current low oil price has brought many OPEC members to their knees, while the holders of those countries’ sovereign debt are toast as long as oil stays at the current levels. Iran, Iraq, Libya, Algeria and Venezuela are not prepared to withstand low oil prices for long and they are now in serious danger of political upheaval at current prices.
According to yesterday’s news from CNBC, the first signs of an escalating social unrest in Venezuela are already there, and things will definitely get worse over the next weeks.
Furthermore, Russia and Saudi Arabia will be anxiously watching the rapid depletion of their sovereign wealth funds, which will make the political situation in these two countries dicey over the next months. “
Regards,
VD
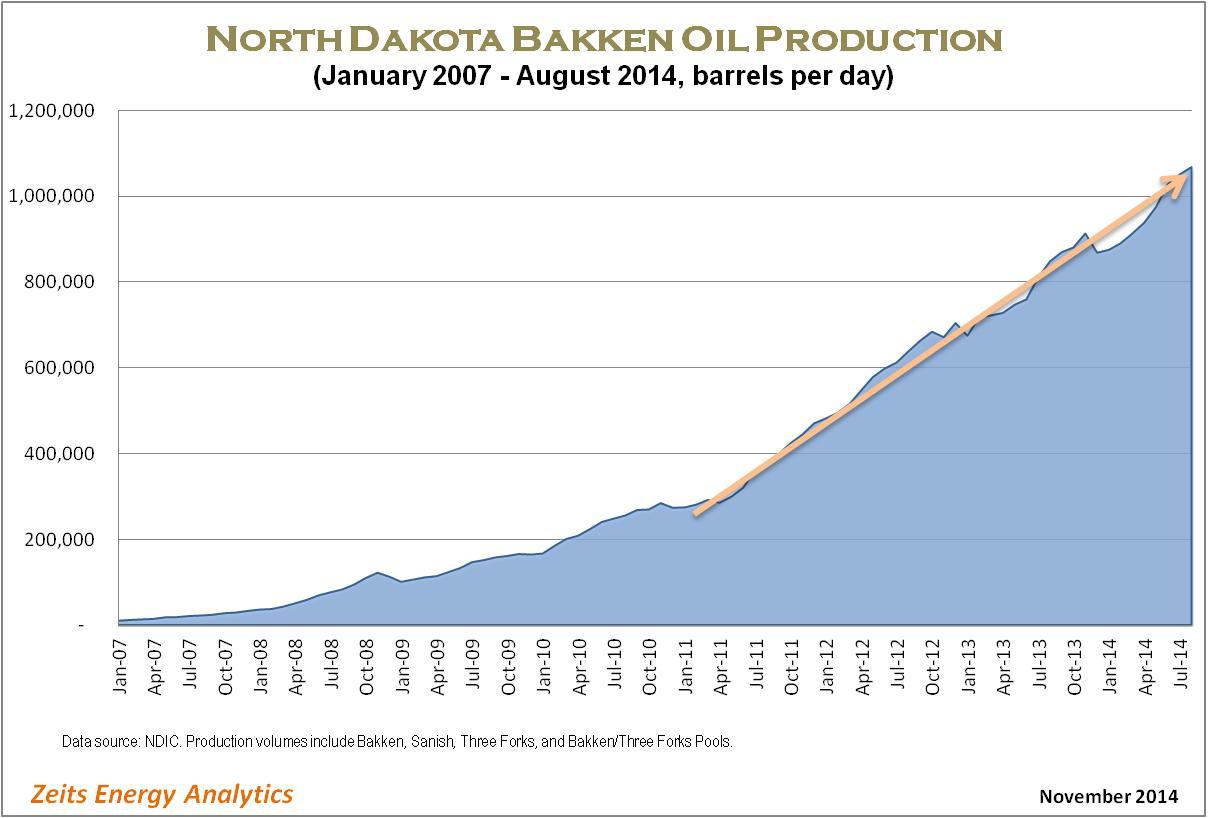
The sharp increase in production in the US over the past 5 years is simply amazing, however, it would be interesting to see what the overall average decline rate is for the US over the same time period.
I’m inclined to believe that the decline rate is substantially higher in part due to the tremendous number of unconventional wells that have been drilled in the past few years and the fact that they are in the steep part of the decline curve. So, while production has been climbing, it seems that the Saudi’s are hoping to curb drilling and therefore let the decline curve catch up with the industry. With a sustained drop in prices, eventually borrowing base redeterminations will result in at least a moderate decrease in drilling, perhaps even drilling within cash flow!
Also, while my opinions mean very little, I think it is important to point out somewhat misleading comments about certain plays being profitable at $40 or whatever they want to insert. Yes, if lease operating expenses and field level costs, transportation, ad valorem etc are $25-$40 per barrel, then those wells will be cash flow positive as long as pricing remains above that price.
However $25-$40 oil will not provide a decent IRR for new wells. Remember most of these shale wells exhibit very high initial production and have sharp hyperbolic type declines. Producers need to get full payout in the first 12-24 months. Wells might decline 60-70% within the first 24 months. Look at the NPV of many of the Bakken wells at $60/bbl. Not nearly as attractive as when they were $100.
I don’t know what oil pricing will do in the next few months, nor do I know what OPEC and the Saudi’s will do in 6 months. I do however believe that US oil producers will eventually have to reign in drilling budgets as cash flow wanes. I don’t know if that will mean production growth will taper, if production will hold steady with new production offsetting natural decline or if total US production will slowly decrease. I do know that it will be interesting to see it unfold.
And while my opinion isn’t worth much, I believe that we will eventually find some happy medium where US producers can achieve decent IRRs and production can grow modestly. My guess is $75-$80 bbl.
While VD is great at pointing out value, guessing what will happen to the price of oil will always be speculation. I like the argument given here, but the truth is that no one really knows.
Investors in oil-producing companies should do so because they believe that their fundamentals will allow them to be successful and profitable in any environment of oil pricing.
– The recommended entry price for my picks, given that timing matters when it comes to investing. Buying a good company is not enough.
– The investment horizon, given that I am not a day trader.
Regards,
VD
Thanks for your reply. One of the things I appreciate about your articles is always standing by your track record. Given that, here are some of your picks from this year:
CAZFF Recommended 5/15/14 – market price $0.30, currently at $0.14.
PTAXF Recommended 8/26/14 – Market price $0.38, currently at $0.14
LNREF Recommended 6/7/14 – Market price $0.35, currently at $0.19
They have all experienced significant losses (on average 52%). However, I agree that I am not a day trader so if I liked these companies enough to buy them, I would still hold on as long as the fundamentals have not changed. As Buffet said, if you aren’t willing to lose half of your investment in the market, you shouldn’t be there.
I remain long, but the simple fact is that there have been some significant losses in the short term.
I was wondering why you did not mention:
AEI.T recommended at C$4.95, now at C$6.85, up 40% despite the slump of the energy stocks.
CKE.T recommended at C$0.82, now at C$1.25, up 50% despite the slump of the energy stocks.
CAZ.T was recommended at C$0.24 in May 2014.
LNR was recommended at $0.32 in June 2014.
PTA.V was recommended at C$0.39 AND C$0.25 in October 2014:
http://seekingalpha.co…
and for reference, Oasis (OAS) has dropped from $55 to $14,
Sandridge (SD) from $7 to $2.4
Magnum (MHR) from $8.6 to $3.9
Penn Virginia (PVA) from $17 to $4.8
Quicksilver (KWK) from $3 to $0.40
and many many other producers have returned back to their 2010 levels. I can continue if you want. This might help you see the big picture.
Regards,
VD
My view is some new tight oil wells would still be drilled if oil stayed below $70, but likely not enough to overcome the rapid depletion from existing wells. I believe we will start to see US production drop sometime in H2 2015, but until then US production keeps going up. Think it will take maybe 6 months for wells already committed to be drilled and completed. After that market should at some point get back to $80-$85, maybe 12 months. But likely to be a volatile ride along the way. I personally think we have not seen bottom yet. Too much downward momentum, global oil production likely to keep increasing for the near term.
Best to prepare for the volatility and try to recognize the opportunities as they play out, IMO. So many things could intervene ( geopolitics, global economic activity, China credit, etc)!
Take care
http://bit.ly/12EquNo
Regards,
Nawar
Thank you for your compliments and your insightful comment. Yes, the news you mention is another very strong bullish indicator.
Regards,
VD
If this 5 million BOEPD were not on the world market today, where would we be?
We would be short on oil.
Instead, we are long on barrels because every dumba** American oilman that drills a good well immediately turns around and puts all of the cash flow from his good well into ANOTHER well. Plus he borrows a few million bucks to drill a few more wells.
How else can you explain the unprecedented exponential oil production growth in this country?
I wish these geniuses would spend their profits on wine, women, song, jet airplanes, country houses or something, besides plowing every single dollar of profit back into the ground.
You make a statement in your piece that sums up your whole thesis: “new oil is not cheap.”
Any way we look at the supply situation, most new production will continue to come from expensive unconventional means such as shale or tar sands. Surely there are new conventional pockets of crude to be found, but they won’t be Elephants and will probably be expensive “deep water” reservoirs.
Petroleum remains a key product for Global Energy & Industrial production and current low prices will NOT allow future demand to be satisfied.
Us reserves….
http://bit.ly/1vYF4uf
china oil reserves
http://bit.ly/1vYF4ug
I agree with much of what you wrote.
In a recent interview with Jim Cramer, Boone Pickens stated that the Saudis will eventually have to cut production. (my comments: OPEC will not survive if the Saudis let Venezuela, Iran, Algeria, Nigeria, Libya, as well as Russia descend into chaos. Not to mention destabilizing an already fragile world economic situation. When the Saudis cut, oil will soar.) B.P. also stated that the producers will be forced to cut CapEx. As they do US production will come down. Based on this, B.P. thought oil would rebound to $100 by mid-2015. Most people will dismiss Boone Picken’s comments. But when a wise old billionaire oilman speaks, I pay attention.
I think most oil services companies will have a rough 2015 (buying opportunity for HAL, SLB). Also, highly leveraged small producers may be forced into bankruptcy, but stronger producers will benefit by picking up their producing acreage and reserves for pennies on the dollar.
Regarding Syria, it seems clear the US has opted to fight a war of attrition in northern Iraq rather than cut the head off the snake in Syria. This approach takes care of a number of problems (high casualties on both sides) and is training a whole new generation of US pilots and drone operators.
I take your comments regarding portable fusion to be light hearted because the neutron flux off such reactors would kill everyone in the car.
The greatest proof against Fleischmann–Pons knuckleheaded claims of nuclear fusion at room temperature was that they were alive at the announcement. The thought that Fleischmann & Pons conducted such an experiment in an occupied building should have been grounds for dismissal or incarceration.
LMT is relying on plasma (not room temperature). This compounds the problems with having some random drunk driving around with a nuclear fusion device. Perhaps LMT can make electricity that is too cheap to meter, which would be big, but it is just speculation and not 5 years away.
In the end, the House of Saud is still in control of the price of oil. Thank God the Iranians are not in that seat.
By the way, in 1938, the US producers predicted the US has a 10 year supply of oil. I think producers can only see ten years ahead.
Thanks for your article!
It confirms what I have been thinking, although without the sources that you cite!
Geo-politically, the world is a much more uncertain place at present! As for the pace of economic activity in the U. S. and elsewhere, the numbers are always after the fact! Can’t measure what hasn’t happened yet! Prognostication is fine for what it is, but it is just that- a guess, however educated!
Oil prices may have further to decline, I don’t know, but the value of some of the oil stocks, I find compelling at these levels.