by Richard Zeits
Summary
- The presumption that North American shale oil production is the “swing” component of global supply may be incorrect.
- Supply cutbacks from other sources may come first.
- Growth momentum in North American unconventional oil production will likely carry on into 2015, with little impact from lower oil prices on the next two quarters’ volumes.
- The current oil price does not represent a structural “economic floor” for North American unconventional oil production.
The recent pull back in crude oil prices is often portrayed as being a consequence of the rapid growth of North American shale oil production.
The thesis is often further extrapolated to suggest that a major slowdown in North American unconventional oil production growth, induced by the oil price decline, will be the corrective mechanism that will bring oil supply and demand back in equilibrium (given that OPEC’s cost to produce is low).
Both views would be, in my opinion, overly simplistic interpretations of the global supply/demand dynamics and are not supported by historical statistical data.
Oil Price – The Economic Signal Is Both Loud and Clear
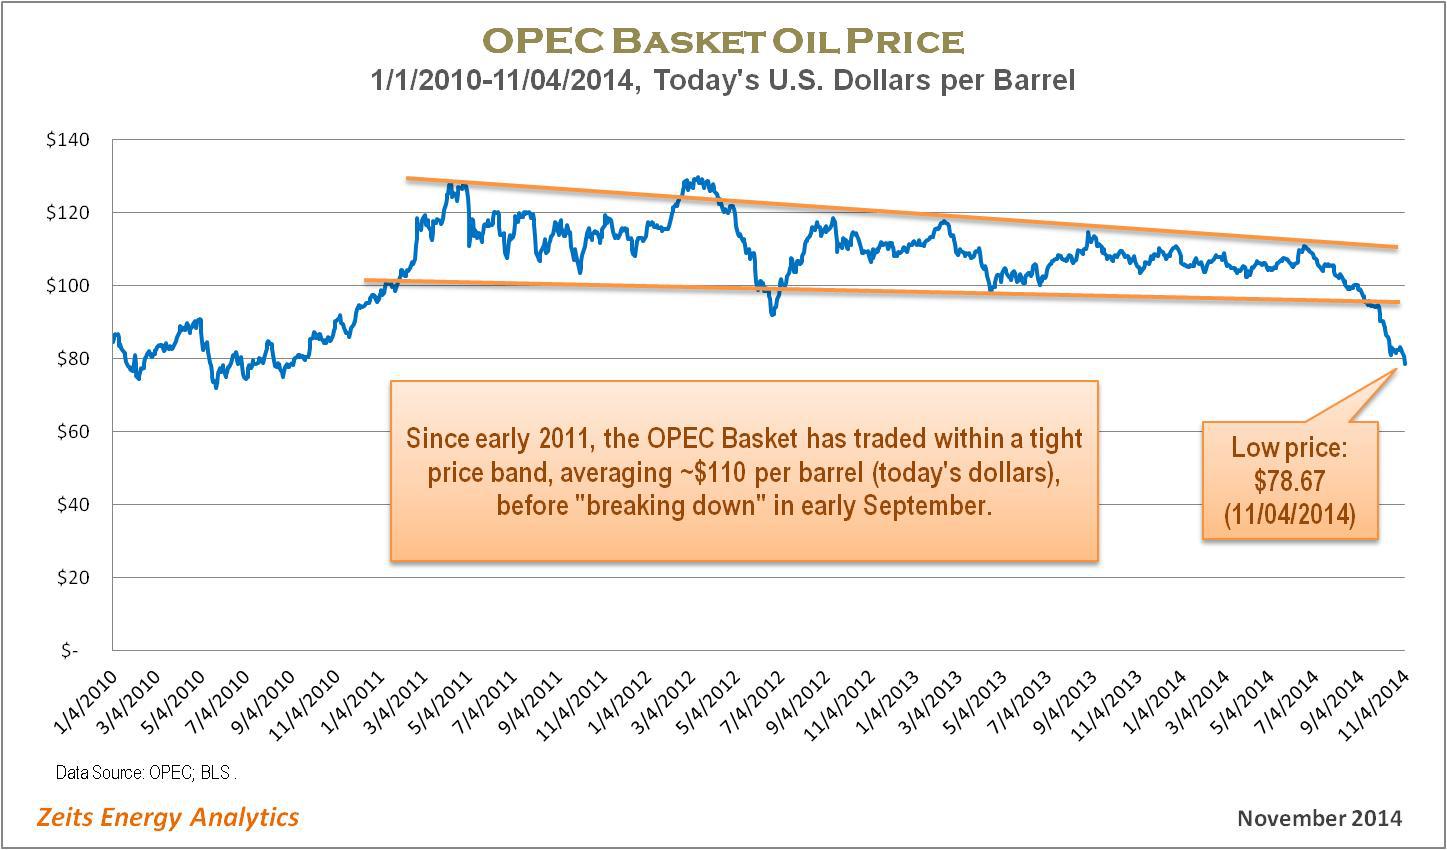
The current oil price correction is, arguably, the most pronounced since the global financial crisis of 2008-2009. The following chart illustrates very vividly that the price of the OPEC Basket (which represents waterborne grades of oil) has moved far outside the “stability band” that seems to have worked well for both consumers and producers over the past four years. (It is important, in my opinion, to measure historical prices in “today’s dollars.”)
 (Source: Zeits Energy Analytics, November 2014)
Given the sheer magnitude of the recent oil price move, the economic signal to the world’s largest oil suppliers is, arguably, quite powerful already. A case can be made that it goes beyond what could be interpreted as “ordinary volatility,” giving the hope that the current price level may be sufficient to induce some supply response from the largest producers – in the event a supply cut back is indeed needed to eliminate a transitory supply/demand imbalance.
Are The U.S. Oil Shales The Culprit?
It is debatable, in my opinion, if the continued growth of the U.S. onshore oil production can be identified as the primary cause of the current correction in the oil price. Most likely, North American shale oil is just one of several powerful factors, on both supply and demand sides, that came together to cause the price decline.
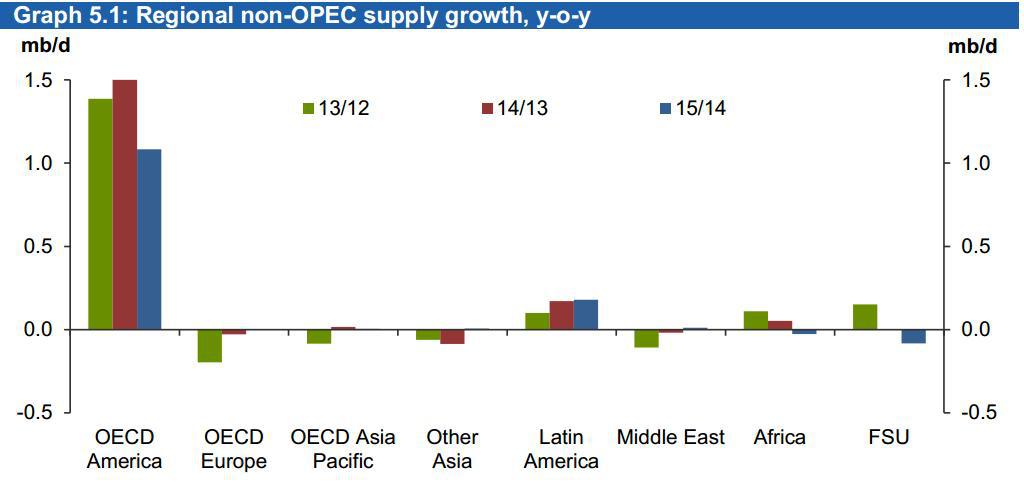
The history of oil production increases from North America in the past three years shows that the OPEC Basket price remained within the fairly tight band, as highlighted on the graph above, during 2012-2013, the period when such increases were the largest. Global oil prices “broke down” in September of 2014, when North American oil production was growing at a lower rate than in 2012-2013.
 (Source: OPEC, October 2014)
If the supply growth from North America was indeed the primary “disruptive” factor causing the imbalance, one would expect the impact on oil prices to become visible at the time when incremental volumes from North America were the highest, i.e., in 2012-2013.
Should One Expect A Strong Slowdown in North American Oil Production Growth?
There is no question that the sharp pullback in the price of oil will impact operating margins and cash flows of North American shale oil producers. However, a major slowdown in North American unconventional oil production growth is a lot less obvious.
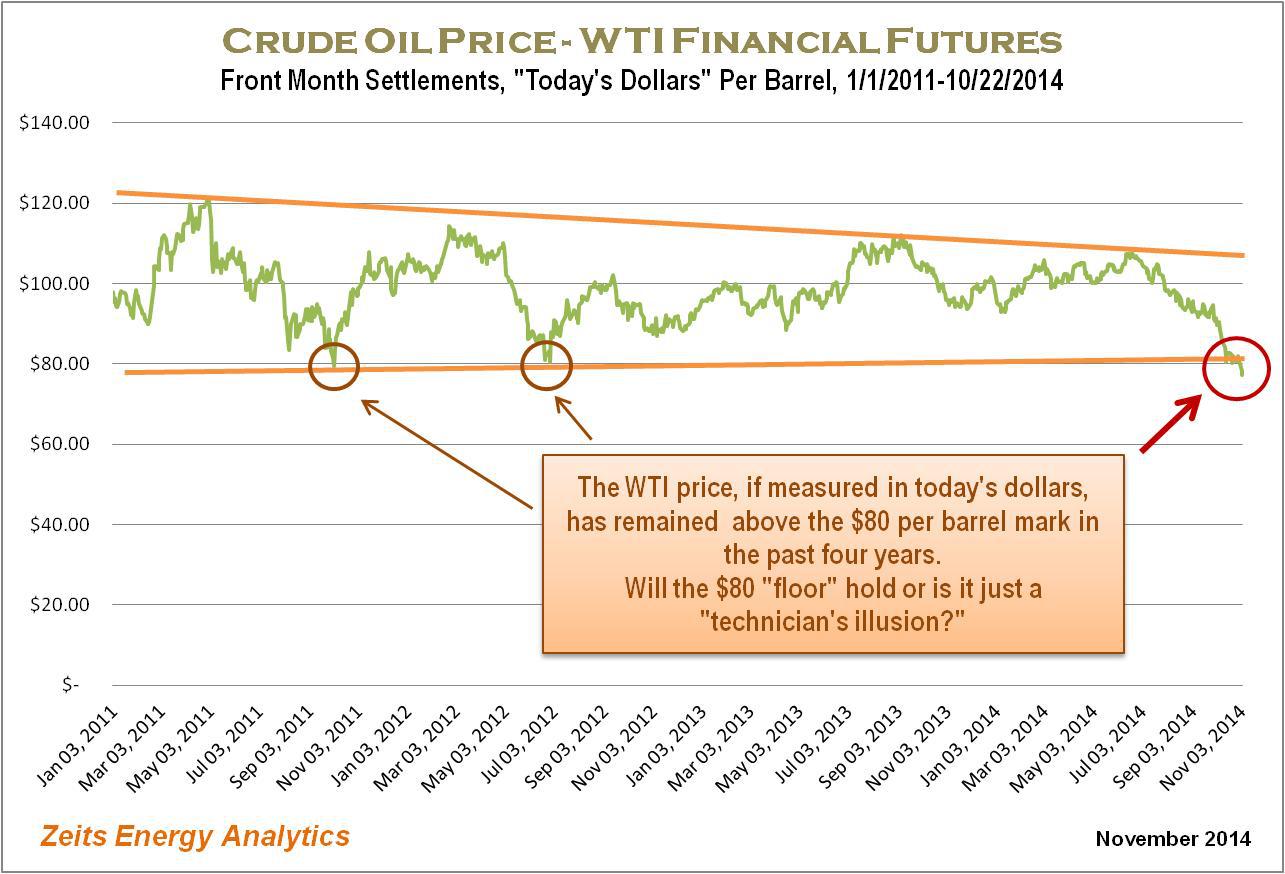
First, the oil price correction being seen by North American shale oil producers is less pronounced than the oil price correction experienced by OPEC exporters. It is sufficient to look at the WTI historical price graph below (which is also presented in “today’s dollars”) to realize that the current WTI price decline is not dissimilar to those seen in 2012 and 2013 and therefore represents a signal of lesser magnitude than the one sent to international exporters (the OPEC Basket price).
 (Source: Zeits Energy Analytics, November 2014)
Furthermore, among all the sources of global oil supply, North American oil shales are the least established category. Their cost structure is evolving rapidly. Given the strong productivity gains in North American shale oil plays, what was a below-breakeven price just two-three years ago, may have become a price stimulating growth going into 2015.
Therefore, the signal sent by the recent oil price decline may not be punitive enough for North American shale oil producers and may not be able to starve the industry of external capital.
Most importantly, review of historical operating statistics provides an indication that the previous similar WTI price corrections – seen in 2012 and 2013 – did not result in meaningful slowdowns in the North American shale oil production.
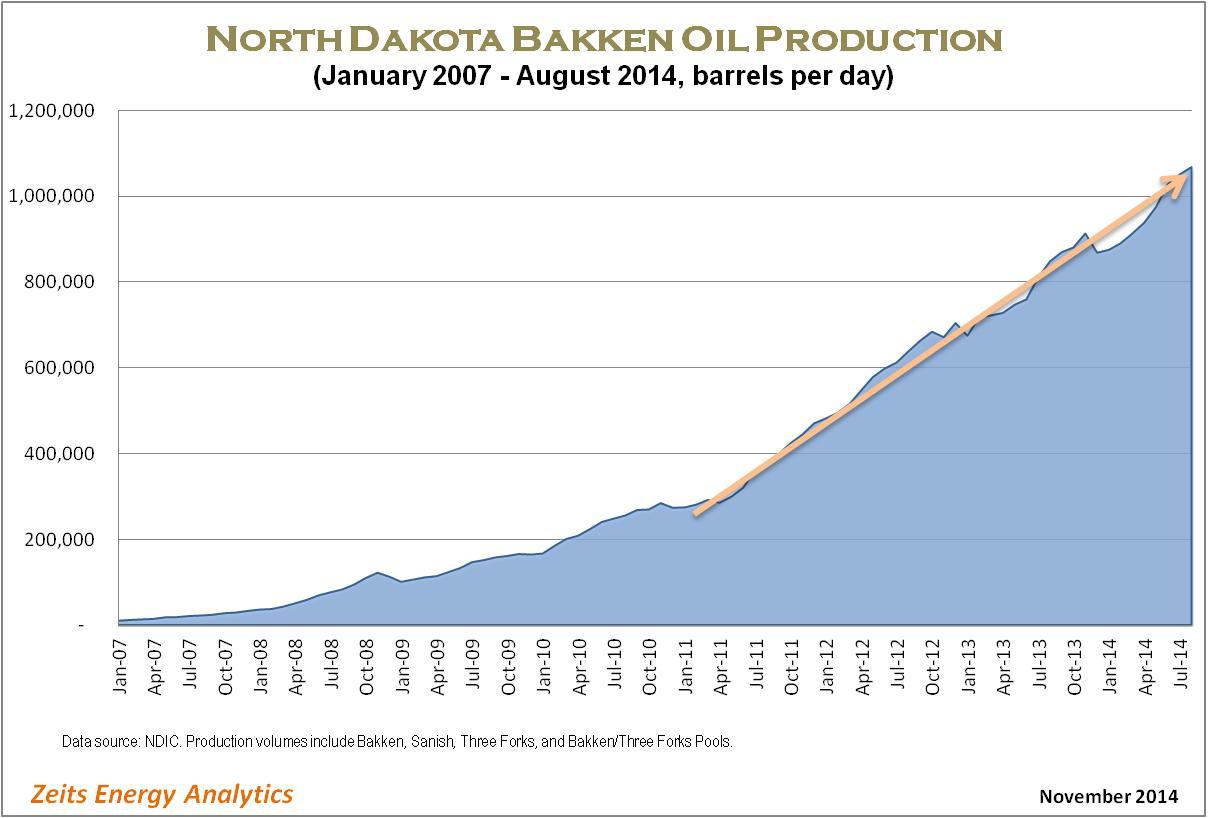
The following graph shows the trajectory of oil production in the Bakken play. From this graph, it is difficult to discern any significant impact from the 2012 and 2013 WTI price corrections on the play’s aggregate production volumes. While a positive correlation between these two price corrections and the pace of production growth in the Bakken exists, there are other factors – such as takeaway capacity availability and local differentials – that appear to have played a greater role. I should also note that the impact of the lower oil prices on production volumes was not visible in the production growth rate for more than half a year after the onset of the correction.
 (Source: Zeits Energy Analytics, November 2014)
Leading U.S. Independents Will Likely Continue to Grow Production At A Rapid Pace
Production growth track record by several leading shale oil players suggests that U.S. shale oil production will likely remain strong even in the $80 per barrel WTI price environment. Several examples provide an illustration.
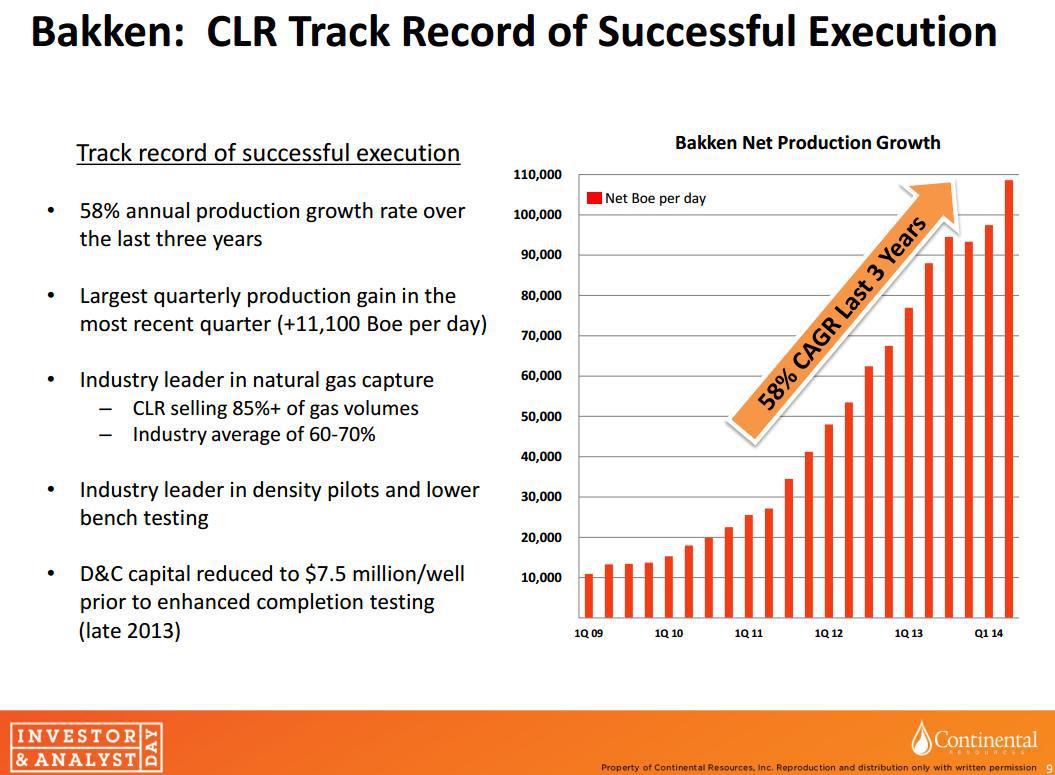
Continental Resources (NYSE:CLR) grew its Bakken production volumes at a 58% CAGR over the past three years (slide below). By looking at the company’s historical production, it would be difficult to identify any impact from the 2012 and 2013 oil price corrections on the company’s production growth rate. Continental just announced a reduction to its capital budget in 2015 in response to lower oil prices, to $4.6 billion from $5.2 billion planned initially. The company still expects to grow its total production in 2015 by 23%-29% year-on-year.
 (Source: Continental Resources, October 2014)
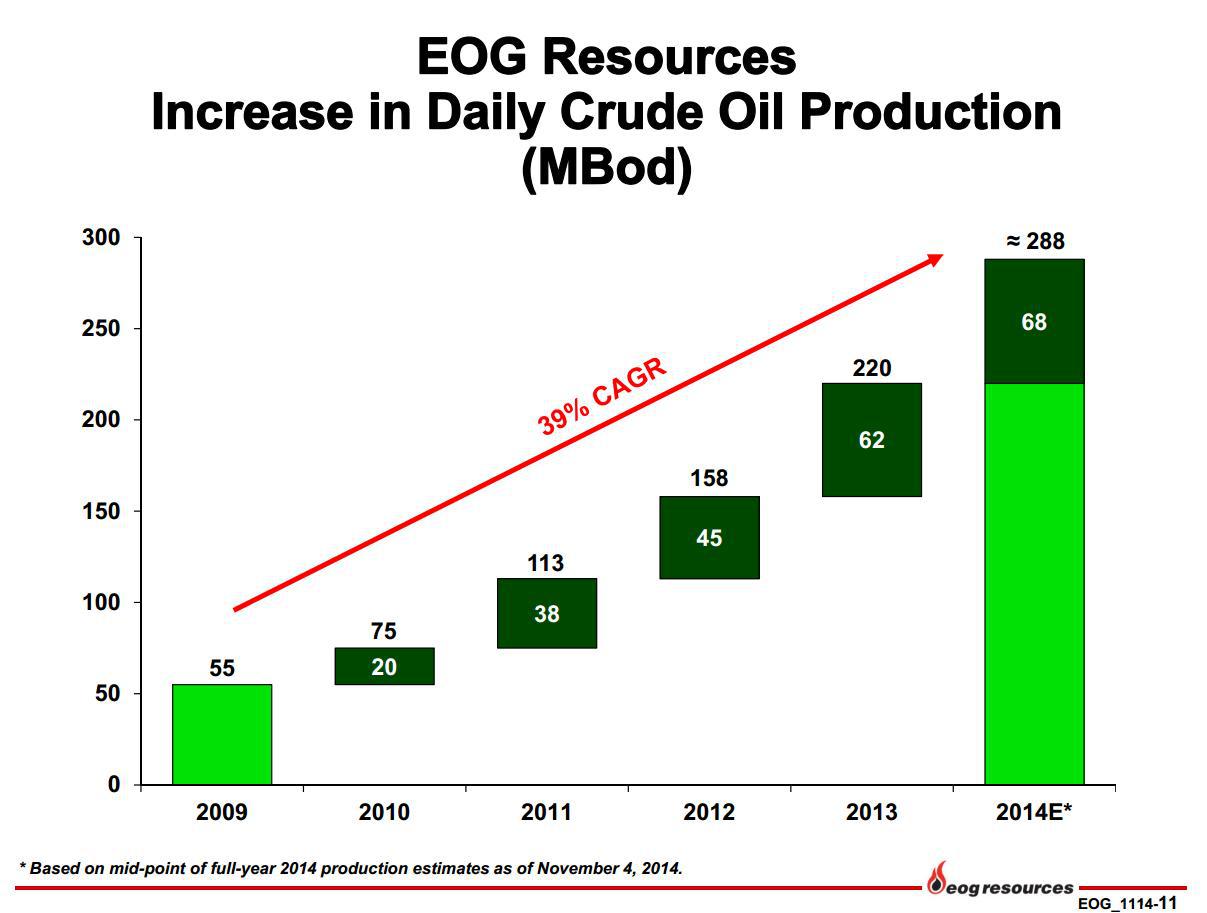
EOG Resources (NYSE:EOG) expects that its largest core plays (Eagle Ford, Bakken and Delaware Basin) will generate after-tax rates of return in excess of 100% in 2015 at $80 per barrel wellhead price. EOG went further to suggest that these plays may remain economically viable (10% well-level returns) at oil prices as low as $40 per barrel. The company expects to continue to grow its oil production at a double-digit rate in 2015 while spending within its cash flow. EOG achieved ~40% oil production growth in 2012-2013 and expects 31% growth for 2014. While a slowdown is visible, it is important to take into consideration that EOG’s oil production base has increased dramatically in the past three years and requires significant capital just to be maintained flat. Again, one would not notice much impact from prior years’ oil price corrections on EOG’s production growth trajectory.
 (Source: EOG Resources, November 2014)
Anadarko Petroleum’s (NYSE:APC) U.S. onshore oil production growth story is similar. Anadarko increased its U.S. crude oil and NLS production from 100,000 barrels per day in 2010 to close to almost 300,000 barrels per day expected in Q4 2014. Anadarko has not yet provided growth guidance for 2015, but indicated that the company’s exploration and development strategies remain intact. While recognizing a very steep decline in the oil price, Anadarko stated that it wants “to watch this environment a little longer” before reaching conclusions with regard to the impact on its future spending plans.
 (Source: Anadarko Petroleum, October 2014)
Devon Energy (NYSE:DVN) posted company-wide oil production of 216,000 barrels per day in Q3 2014. While Devon will provide detailed production and capital guidance at a later date, the company has indicated that it sees 20% to 25% oil production growth and mid‐single digit top‐line growth “on a retained‐property basis” (pro forma for divestitures) in 2015.
The list can continue on.
In Conclusion…
Based on preliminary 2015 growth indications from large shale oil operators, North American oil production growth in 2015 will likely remain strong, barring further strong decline in the price of oil.
No slowdown effect from lower oil prices will be seen for at least six months from the time operators received the “price signal” (August-September 2014).
Given the effects of the technical learning curve in oil shales and continuously improving drilling economics, the current ~$77 per barrel WTI price is unlikely to be sufficient to eliminate North American unconventional production growth.
North American shale oil production remains a very small and highly fragmented component of the global oil supply.
The global oil “central bank” (Saudi Arabia and its close allies in OPEC) remain best positioned to quickly re-instate stability of oil price in the event further significant decline occurred.