Tag Archives: America

Throttle Up America

“For a successful technology, reality must take precedence over public relations, for Nature cannot be fooled.” – Richard Feynman – Rogers Commission

“It appears that there are enormous differences of opinion as to the probability of a failure with loss of vehicle and of human life. The estimates range from roughly 1 in 100 to 1 in 100,000. The higher figures come from the working engineers, and the very low figures from management. What are the causes and consequences of this lack of agreement? Since 1 part in 100,000 would imply that one could put a Shuttle up each day for 300 years expecting to lose only one, we could properly ask “What is the cause of management’s fantastic faith in the machinery? … It would appear that, for whatever purpose, be it for internal or external consumption, the management of NASA exaggerates the reliability of its product, to the point of fantasy.” – Richard Feynman – Rogers Commission

(Jim Quinn) The phrase “Throttle Up” jumped into my consciousness in the last week when Trump and his coronavirus task force of government hacks and bureaucrat lackeys announced the guidelines for re-opening America, as if a formerly $22 trillion economy, tied to a $90 trillion global economy, could be turned off and on like a light switch. Clap off, clap on. It just doesn’t work that way. The arrogance and hubris of people who think they can declare a global shut down for a virus and think they can easily deal with the intended and unintended consequences of doing so, is breathtaking in its outrageous recklessness and egotistical belief in their own infallibility.

This contemptible belief in their own superiority has permeated every fiber of those who rule over us, particularly among captured central bankers, corrupt politicians, bought off scientists, and billionaire oligarchs. It is the same groupthink, purposeful failure to address risks, and willfully ignoring those in the trenches that murdered seven astronauts on January 28, 1986 and has created the 2nd Great Depression of today. “Throttle Up” is going to result in the same outcome as it did in 1986.

Thirty-four years ago, on a cold January morning, Space Shuttle Challenger thundered into a crystal-clear blue Florida sky on its 10th voyage into space. The seven astronauts, including civilian Christa McAuliffe, put their trust in the “experts” from NASA, Thiokol, and Rockwell that the shuttle was safe and launching when the temperature was 30 degrees would not pose any added risks. When Richard Covey in Mission Control informed the crew to “go at throttle up”, they expected what their training told them would happen.

Instead, Space Shuttle Challenger exploded in a horrific display witnessed live on TV by 17% of the American population. School children all over the country were watching in their classrooms because McAuliffe was a school teacher chosen from thousands to go into space. It was a tragedy that shook the nation and led to one of Reagan’s better speeches that night, where he addressed the nation’s school children.

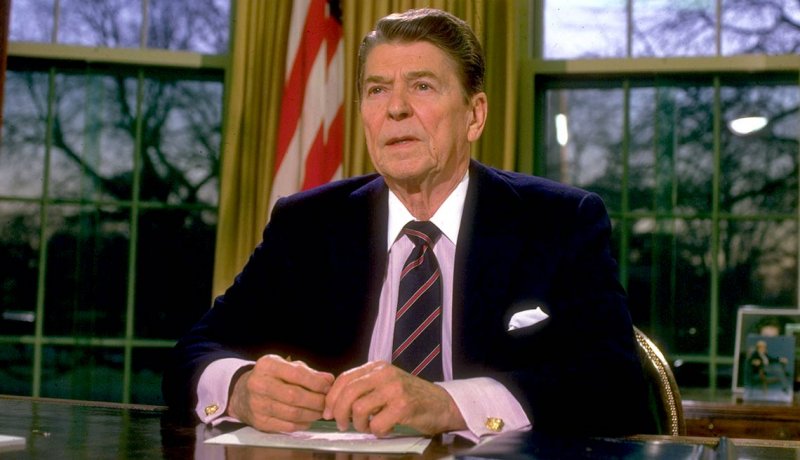
“I want to say something to the schoolchildren of America who were watching the live coverage of the shuttle’s takeoff. I know it is hard to understand, but sometimes painful things like this happen. It’s all part of the process of exploration and discovery. It’s all part of taking a chance and expanding man’s horizons. The future doesn’t belong to the fainthearted; it belongs to the brave. The Challenger crew was pulling us into the future, and we’ll continue to follow them.”

And he ended with this line from the poem ‘High Flight’:

“We will never forget them, nor the last time we saw them, this morning, as they prepared for their journey and waved goodbye and ‘slipped the surly bonds of Earth’ to ‘touch the face of God.’”  

Thus, began the politician’s use of death to create heroes when human error, hubris, and recklessness is the true cause of avoidable tragedy and despair. Those seven astronauts were not heroes, they were victims. Just as we are all victims of the incompetency, arrogance, corruption and greed of those who lead our government, financial system, and corporate fascist oligarchy passing for capitalism in this globalist-controlled fraud of a former republic.

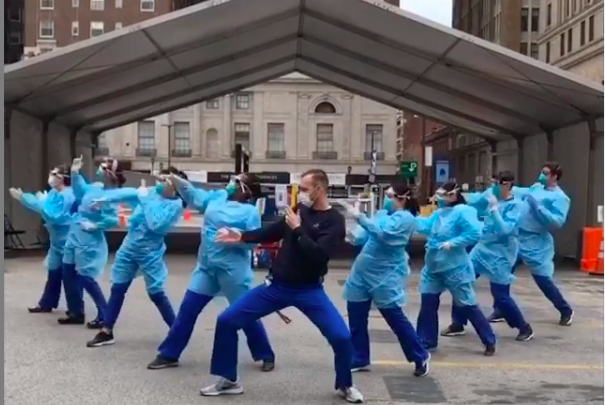
Using victims to create false heroes has now been elevated to an art form by politicians, the corporate media and mega-corporations to push whatever agenda supports their narrative. The propaganda machine is their most useful tool, as decades of dumbing down the public through government school indoctrination has created millions of pliable useful idiots who will believe anything presented by “experts” on the boob tube. The fear and panic created by politicians and the media about a virus only marginally more dangerous than the common flu is the perfect representation of this power over reality.

The Space Shuttle Challenger disaster is a perfect analogy for the current debacle being perpetrated on the American people by fecklessly corrupt authoritarian politicians, IYI medical “experts”, and fear mongering fake news media pushing the narrative in whatever direction benefits their bottom line. There is the simple technical reason why the Challenger blew up and then there is the real reason – the truthful explanation. What we must understand from history and experience is, if we don’t accept the narratives pushed by “experts” and think critically based upon facts, the truth will eventually be revealed.

The immediate cause of the explosion was a failure in the O-rings sealing the aft field joint on the right solid rocket booster, causing pressurized hot gases and eventually flame to “blow by” the O-ring and contact the adjacent external tank, causing structural failure. The truth is, decisions made and not made over years sealed the fate of those victims, just as we are facing today with this man-made global catastrophe.

After the shuttle disaster, politicians do what they do best, create a commission to cover-up the true cause and protect the establishment from blame. It was led by William Rogers, a government bureaucrat for decades, along with numerous other people with a vested interest in protecting NASA, the massive defense corporations sucking off the government teat, and the crooked politicians supporting NASA.

There were a couple of members from the trenches, like Sally Ride and Chuck Yeager, but the thorn in the side of the establishment was theoretical physicist and Nobel Prize winner Richard Feynman. Despite being racked by cancer, Feynman reluctantly agreed to join the commission, knowing he was going to be out of his element in the swamp of Washington D.C.   The nation’s capital, he told his wife, was “a great big world of mystery to me, with tremendous forces.”

Feynman immediately created problems by thinking outside the box and having the gall to ignore the excuses and lies of high-level managers at NASA, Thiokol and Rockwell, while seeking the opinions of the actual engineers who did the real work. His unwillingness to toe the company line irritated the old guard looking to cover up the truth.  During a break in one hearing, Rogers told commission member Neil Armstrong, “Feynman is becoming a pain in the ass.”

The establishment always thinks anyone who questions their authority or expertise is a pain in the ass, at best. Often, they treat anyone with an opposing viewpoint as the enemy, and will undertake any means to shut them up and destroy them. Witness how YouTube and Google are currently memory holing anything questioning the establishment narrative about this virus or Joe Biden’s sexual assault on a young woman as a Senator. Feynman embarrassed the “experts” on national TV when he conducted a simple demonstration of why the shuttle blew up.

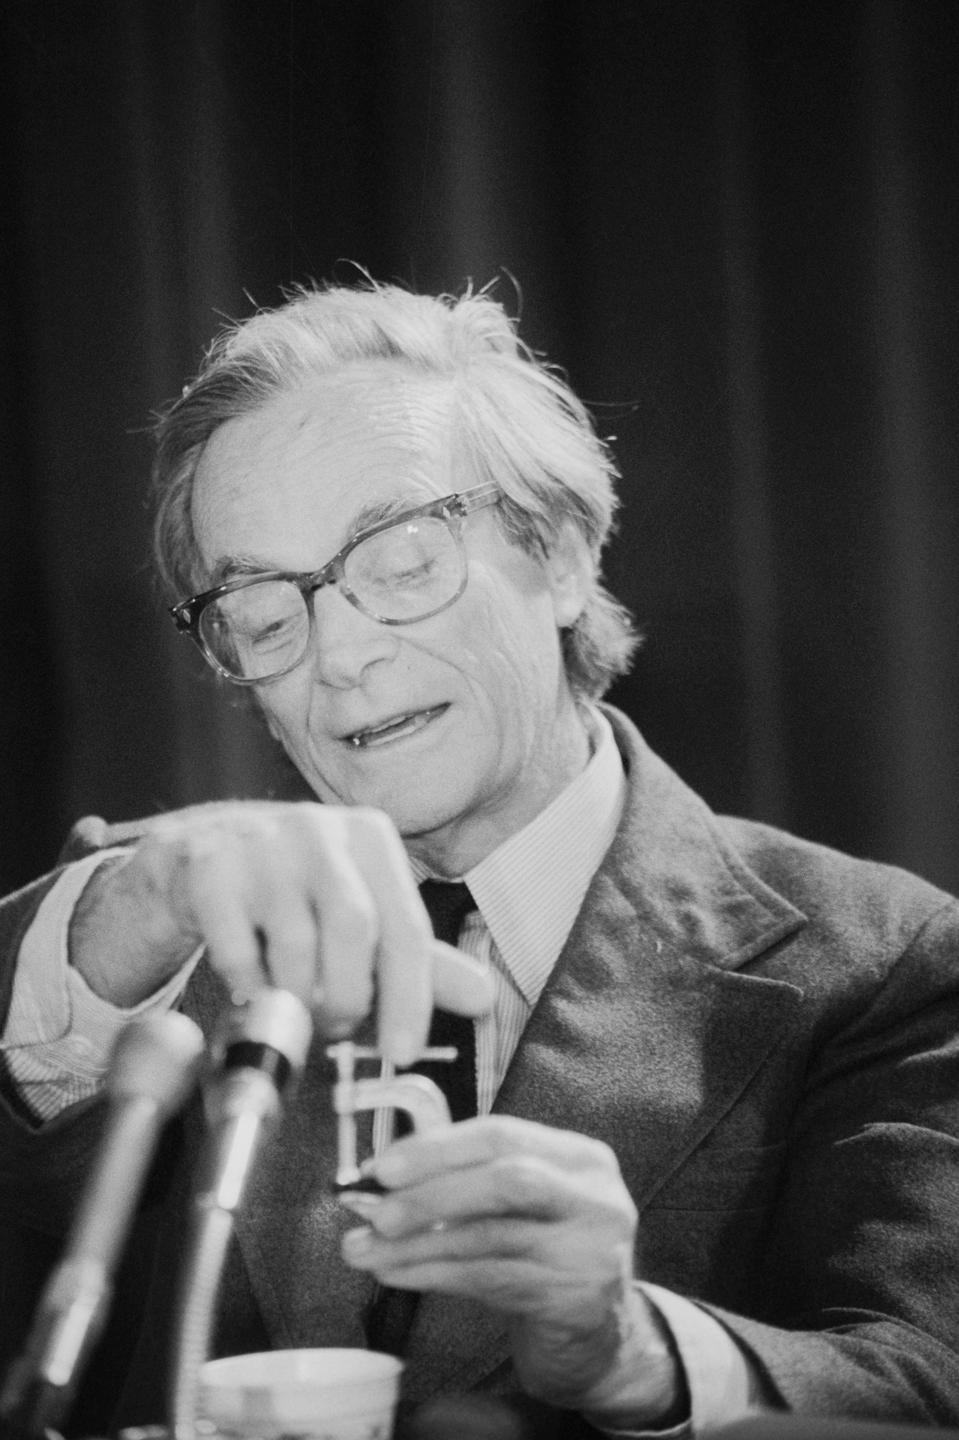
“I took this stuff I got out of your [O-ring] seal and I put it in ice water, and I discovered that when you put some pressure on it for a while and then undo it, it doesn’t stretch back. It stays the same dimension. In other words, for a few seconds at least, and more seconds than that, there is no resilience in this particular material when it is at a temperature of 32 degrees. I believe that has some significance for our problem.” – Richard Feynman

The truth is top management at NASA knew the O-rings were defective in 1977 and contained a potentially catastrophic flaw. NASA managers also disregarded warnings from engineers about the dangers of launching posed by the low temperatures of that morning, and failed to adequately report these technical concerns to their superiors. Thiokol engineer Bob Ebeling in October 1985 wrote a memo—titled “Help!” so others would read it—of concerns regarding low temperatures and O-rings.

There were numerous teleconferences on the 27th of January where Ebeling and other engineers argued against the launch due to the freezing temperatures. According to Ebeling, a second conference call was scheduled with only NASA and Thiokol management, excluding the engineers. Thiokol management disregarded its own engineers’ warnings and now recommended the launch proceed as scheduled. Ebeling told his wife that night Challenger would blow up. He was right.

The Commission attempted to let NASA’s culture off the hook with no recommended sanctions against the deeply flawed organization. Feynman could not in good conscience recommend NASA should continue without a suspension of operations and a major overhaul. His fellow commission members were alarmed by Feynman’s dissent. Feynman was so critical of flaws in NASA’s “safety culture” that he threatened to remove his name from the report unless it included his personal observations on the reliability of the shuttle, which appeared as Appendix F.

The quote at the beginning of this article about upper management believing there was only a 1 in 100,000 chance of disaster, when the odds were really 1 in 100 or less, came from Feynman’s dissent in Appendix F. The fools at NASA and on the Commission didn’t understand or willfully ignored Feynman’s first principle:

“The first principle is that you must not fool yourself — and you are the easiest person to fool.” – Richard Feynman

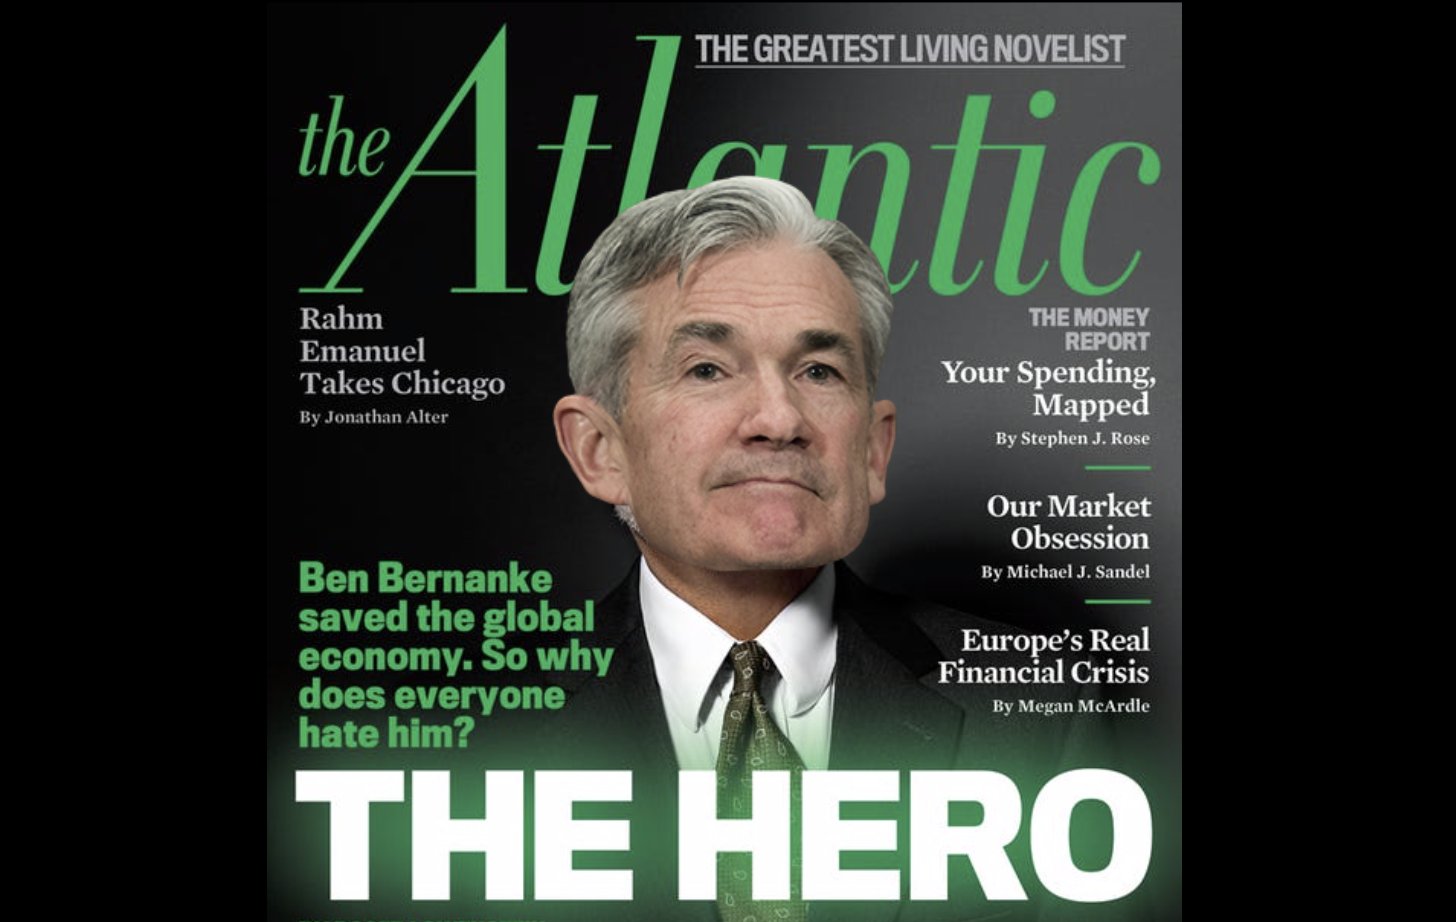
The truth stands on its own and is self-evident. Feynman is an example of an actual hero, not an MSM touted hero like Bernanke, Paulson, Geithner, Powell and the dozens of other psychopaths in suits who have been portrayed in the press as brilliant financial minds that saved the world. Real heroes take a singular stand for the truth, when everyone else goes along with mistruths, half-truths, and false narratives of those with a subversive self-serving agenda. The world is inundated in a blizzard of lies, designed to further the plans of those who control the levers of power and wealth.

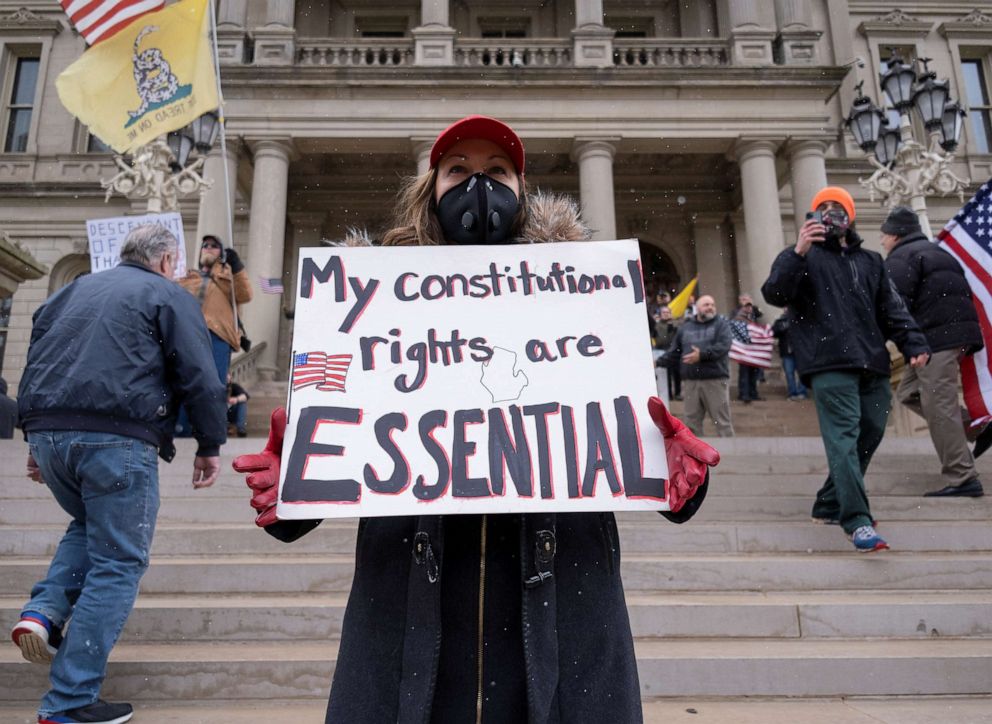
Lies, backed by an unceasing stream of propaganda and fear, are being used to panic the masses into willingly abandon their freedoms, liberties and rights for the chains of false safety, security, and state control over every aspect of their lives. It is astonishing to watch in real time as a vast swath of America cowers in their homes, as demanded by their authoritarian elected leaders, while their livelihoods and net worth are purposely destroyed to benefit the .1% ruling class.

I see multiple analogies today with the shuttle disaster and the lessons learned and not learned. The leadership of NASA did not learn, as the same disregard for facts and data led to the Space Shuttle Columbia disaster seventeen years later.

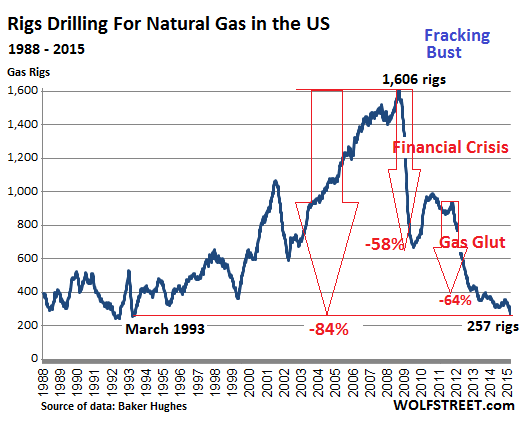
Just as the mid-level engineers at Thiokol warned of imminent disaster for years before the tragedy, there have been voices in the wilderness (scorned and ridiculed as conspiracy theorists) warning about the reckless arrogance of the Federal Reserve and their Wall Street owners, as they pumped up the largest financial bubble in world history as their solution for the catastrophe created by their previous monetary disaster in 2008. Just as the hubristic out of touch leadership of NASA murdered fourteen innocent astronauts, the Fed has now twice destroyed millions of lives in the last twelve years.

These self-proclaimed experts have known the financial system was going to explode since the middle of 2019 when they began a series of desperate ruses, behind the curtain of the debt saturated Ponzi scheme, to keep the Wall Street cabal and hedge fund billionaires from facing the consequences of their fraudulent monetary machinations.

The surprise cutting of interest rates and emergency repo operations every night as we entered 2020 covered up the imminent disaster, as the mindless Harvard and Wharton MBAs programmed their high frequency trading computers to buy, buy, buy. Best economy ever. Greatest in the history of the world. Stock market at all-time highs. Then the China flu arrived, just in time. A quick 30% plunge in the stock market was all the Fed needed to rescue their true constituents – Wall Street and billionaire hedge funds – with $6 trillion, under the guise of saving the financial system for the little people.

If you want to figure out who benefits from a man-made crisis, just follow the money. The Federal government has committed at least $3 trillion of your grandchildren’s money to the crisis thus far, with the Federal Reserve announcing another $6 trillion of monetary support. That’s $9 trillion, or $70,000 per household. The average household size is 2.5. If we assume each household got their $1,200 Covid-19 rebate (actually just giving them back the taxes they already pay), that’s $3,000 per household.

A critical thinking individual might wonder who got the other $67,000 of stimulus, or 95.7% of the money allocated to “save America”. It certainly hasn’t made its way to small business owners who are going out of business faster than burning gas through a defective O-ring. If only $400 billion is making its way into the pockets of formerly working Americans, where did the other $8.6 trillion go?

It went directly into the pockets of Wall Street bankers, hedge fund managers, and the biggest corporations on the planet. The Fed has used this faux crisis to further enrich and bailout the richest men on the planet, while again dropping interest rates to zero and throwing grandma under the bus again. Let her eat cat food, declares Jerome Powell, champion and hero of downtrodden bankers. He’ll be “earning” $25 million a year from Wall Street as his payoff, the minute he saunters out of the Eccles Building in a couple years.

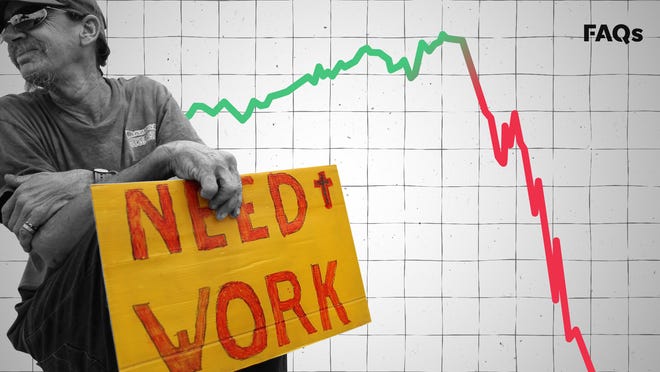
As unemployment approaches 20%, GDP plunges by 30%, food banks are running out of food, citizens remain locked in their homes under threat of arrest, and human misery approaches 1930 Great Depression levels, the Fed has managed to buy enough toxic debt and artificially rig the stock market, to engineer a 27% surge from its March lows. We should all applaud the brilliance of Powell and his fellow sycophants, as they have saved the asses of the .1%, for now.

The fate of this country was sealed well before this overblown hyped coronavirus appeared, to accelerate our demise. The warnings about too much debt, rigged financial markets, unrestrained politicians running trillion dollar deficits, silicon valley giants conspiring with the Deep State to turn the country into a surveillance state, a military industrial complex creating conflict around the globe, and a state media propaganda machine providing false information to the masses, were dismissed by those who could have acted.

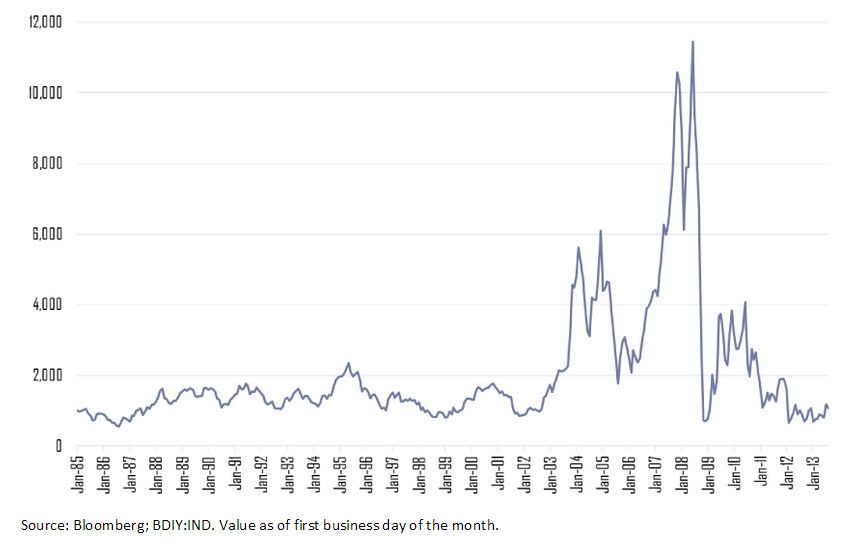
The deficit is now expected to hit $3.7 trillion in 2020, pushing the national debt to $27 trillion. This country is 231 years old and 85% of our debt has been taken on in the last 23 years. The Fed’s balance sheet was $800 billion in 2008. It will shortly surpass $10 trillion, just a mere 1,250% increase in 12 years. Do you understand the analogy with the Space Shuttle Challenger yet?

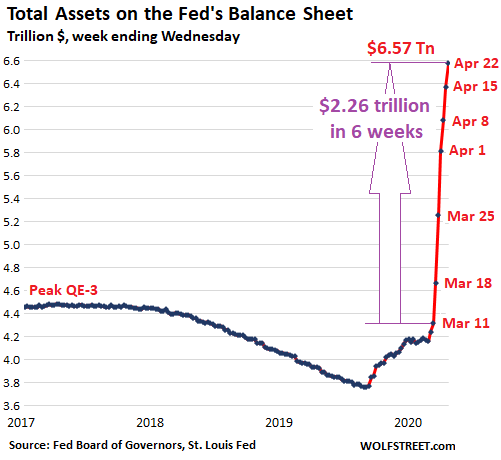
We’ve left the launchpad at the same rate and angle as the Fed balance sheet. Those in charge assure us they have everything under control, but the coronavirus will prove to be our frozen O-ring. It has been decades of mismanagement, corruption, bad decisions, horrible leadership, delusional thinking, herd mentality, and an inability to summon the courage to deal with critical problems before they blew our country into a million smoking pieces of debris.

Average Americans are trapped in the crew cabin relying on Trump, Powell, Mnuchin, and a myriad of other “experts” to safely launch the American economy back into space. Trump has convened a re-opening task force consisting of dozens of CEOs from the biggest mega-corporations on earth. I know because I watched him read their names for fifteen minutes during one of his daily mind-numbing press conferences. If you had any doubt about who your leaders work for, that list tells you all you need to know. No one from your local steak shop, butcher or candlestick maker are represented on this task force. It reminded me of the list of prominent people chosen for the Rogers Commission.

The belief by those in charge that things can just go on as if nothing has happened are as delusional as the NASA administrators who were willfully blind to the truth of an impending disaster. The actions taken by the political and financial arms of the Deep State have guaranteed this malfunction will prove fatal for our country. The only question is how many seconds we have before our throttle up moment. I tend to be a pessimist, so I am leaning towards an explosion before the November election.  The forthcoming financial catastrophic detonation will set off a chain of events considered impossible just a few short months ago.

The core elements of this Fourth Turning (debt, civic decay, global disorder) are going to juxtapose and connect, accelerating into a chain reaction of chaos, civil uprising, global war, mass casualties, the fall of empires, and ultimately the destruction of the existing social order (aka Deep State). Hopefully, heroes of Feynman’s stature will arise to help rebuild our country based upon common sense, truthfulness, factual assessment of our situation, and honoring the essential principles of our Constitution. Reality must take precedence over delusions, propaganda, and lies for us to regain our nation. Are we capable of learning the lessons from this major malfunction?

“Flight controllers here looking very carefully at the situation. Obviously, a major malfunction.” – Steve Nesbitt – NASA Mission Control

Source: by Jim Quinn | The Burning Platform

BRICS Bombshell Exposed: A “Fair Multipolar World” Where Oil Trade Bypasses The Dollar

Putin reveals ‘fair multipolar world’ concept in which oil contracts could bypass the US dollar and be traded with oil, yuan and gold…

https://i0.wp.com/www.zerohedge.com/sites/default/files/images/user3303/imageroot/2017/09/06/20170906_brics.jpg

The annual BRICS summit in Xiamen – where President Xi Jinping was once mayor – could not intervene in a more incandescent geopolitical context.

Once again, it’s essential to keep in mind that the current core of BRICS is “RC”; the Russia-China strategic partnership. So in the Korean peninsula chessboard, RC context – with both nations sharing borders with the DPRK – is primordial.

Beijing has imposed a definitive veto on war – of which the Pentagon is very much aware.

Pyongyang’s sixth nuclear test, although planned way in advance, happened only three days after two nuclear-capable US B-1B strategic bombers conducted their own “test” alongside four F-35Bs and a few Japanese F-15s.

Everyone familiar with the Korean peninsula chessboard knew there would be a DPRK response to these barely disguised “decapitation” tests.

So it’s back to the only sound proposition on the table: the RC “double freeze”. Freeze on US/Japan/South Korea military drills; freeze on North Korea’s nuclear program; diplomacy takes over.

The White House, instead, has evoked ominous “nuclear capabilities” as a conflict resolution mechanism.

Gold mining in the Amazon, anyone?

On the Doklam plateau front, at least New Delhi and Beijing decided, after two tense months, on “expeditious disengagement” of their border troops. This decision was directly linked to the approaching BRICS summit – where both India and China were set to lose face big time.

Indian Prime Minister Narendra Modi had already tried a similar disruption gambit prior to the BRICS Goa summit last year. Then, he was adamant that Pakistan should be declared a “terrorist state”. The RC duly vetoed it.

Modi also ostensively boycotted the Belt and Road Initiative (BRI) summit in Hangzhou last May, essentially because of the China-Pakistan Economic Corridor (CPEC).

India and Japan are dreaming of countering BRI with a semblance of connectivity project; the Asia-Africa Growth Corridor (AAGC). To believe that the AAGC – with a fraction of the reach, breath, scope and funds available to BRI – may steal its thunder, is to enter prime wishful-thinking territory.

Still, Modi emitted some positive signs in Xiamen; “We are in mission-mode to eradicate poverty; to ensure health, sanitation, skills, food security, gender equality, energy, education.” Without this mammoth effort, India’s lofty geopolitical dreams are D.O.A.

Brazil, for its part, is immersed in a larger-than-life socio-political tragedy, “led” by a Dracula-esque, corrupt non-entity; Temer The Usurper. Brazil’s President, Michel Temer, hit Xiamen eager to peddle “his” 57 major, ongoing privatizations to Chinese investors – complete with corporate gold mining in an Amazon nature reserve the size of Denmark. Add to it massive social spending austerity and hardcore anti-labor legislation, and one’s got the picture of Brazil currently being run by Wall Street. The name of the game is to profit from the loot, fast.

The BRICS’ New Development Bank (NDB) – a counterpart to the World Bank – is predictably derided all across the Beltway. Xiamen showed how the NDB is only starting to finance BRICS projects. It’s misguided to compare it with the Asian Infrastructure Investment Bank (AIIB). They will be investing in different types of projects – with the AIIB more focused on BRI. Their aim is complementary.

‘BRICS Plus’ or bust

On the global stage, the BRICS are already a major nuisance to the unipolar order. Xi politely put it in Xiamen as “we five countries [should] play a more active part in global governance”.

And right on cue Xiamen introduced “dialogues” with Mexico, Egypt, Thailand, Guinea and Tajikistan; that’s part of the road map for  “BRICS Plus” – Beijing’s conceptualization, proposed last March by Foreign Minister Wang Yi, for expanding partnership/cooperation.

A further instance of “BRICS Plus” can be detected in the possible launch, before the end of 2017, of the Regional Comprehensive Economic Partnership (RCEP) – in the wake of the death of TPP.

Contrary to a torrent of Western spin, RCEP is not “led” by China.

Japan is part of it – and so is India and Australia alongside the 10 ASEAN members. The burning question is what kind of games New Delhi may be playing to stall RCEP in parallel to boycotting BRI.

Patrick Bond in Johannesburg has developed an important critique, arguing that “centrifugal economic forces” are breaking up the BRICS, thanks to over-production, excessive debt and de-globalization. He interprets the process as “the failure of Xi’s desired centripetal capitalism.”

It doesn’t have to be this way. Never underestimate the power of Chinese centripetal capitalism – especially when BRI hits a higher gear.

Meet the oil/yuan/gold triad

It’s when President Putin starts talking that the BRICS reveal their true bombshell. Geopolitically and geo-economically, Putin’s emphasis is on a “fair multipolar world”, and “against protectionism and new barriers in global trade.” The message is straight to the point.

The Syria game-changer – where Beijing silently but firmly supported Moscow – had to be evoked; “It was largely thanks to the efforts of Russia and other concerned countries that conditions have been created to improve the situation in Syria.”

On the Korean peninsula, it’s clear how RC think in unison; “The situation is balancing on the brink of a large-scale conflict.”

Putin’s judgment is as scathing as the – RC-proposed – possible solution is sound; “Putting pressure on Pyongyang to stop its nuclear missile program is misguided and futile. The region’s problems should only be settled through a direct dialogue of all the parties concerned without any preconditions.”

Putin’s – and Xi’s – concept of multilateral order is clearly visible in the wide-ranging Xiamen Declaration, which proposes an “Afghan-led and Afghan-owned” peace and national reconciliation process, “including the Moscow Format of consultations” and the “Heart of Asia-Istanbul process”.

That’s code for an all-Asian (and not Western) Afghan solution brokered by the Shanghai Cooperation Organization (SCO), led by RC, and of which Afghanistan is an observer and future full member.

And then, Putin delivers the clincher;

“Russia shares the BRICS countries’ concerns over the unfairness of the global financial and economic architecture, which does not give due regard to the growing weight of the emerging economies. We are ready to work together with our partners to promote international financial regulation reforms and to overcome the excessive domination of the limited number of reserve currencies.”

“To overcome the excessive domination of the limited number of reserve currencies” is the politest way of stating what the BRICS have been discussing for years now; how to bypass the US dollar, as well as the petrodollar.

Beijing is ready to step up the game. Soon China will launch a crude oil futures contract priced in yuan and convertible into gold.

This means that Russia – as well as Iran, the other key node of Eurasia integration – may bypass US sanctions by trading energy in their own currencies, or in yuan.

Inbuilt in the move is a true Chinese win-win; the yuan will be fully convertible into gold on both the Shanghai and Hong Kong exchanges.

The new triad of oil, yuan and gold is actually a win-win-win. No problem at all if energy providers prefer to be paid in physical gold instead of yuan. The key message is the US dollar being bypassed.

RC – via the Russian Central Bank and the People’s Bank of China – have been developing ruble-yuan swaps for quite a while now.

Once that moves beyond the BRICS to aspiring “BRICS Plus” members and then all across the Global South, Washington’s reaction is bound to be nuclear (hopefully, not literally).

Washington’s strategic doctrine rules RC should not be allowed by any means to be preponderant along the Eurasian landmass. Yet what the BRICS have in store geo-economically does not concern only Eurasia – but the whole Global South.

Sections of the War Party in Washington bent on instrumentalizing  India against China – or against RC – may be in for a rude awakening. As much as the BRICS may be currently facing varied waves of economic turmoil, the daring long-term road map, way beyond the Xiamen Declaration, is very much in place.

Punch Line: The U.S. Dollar Index (DXY) Chart

By Pepe Escobar | ZeroHedge

‘Housing Bubble 2’ Has Bloomed Into Full Magnificence

The current housing boom has Dallas solidly in its grip. As in many cities around the US, prices are soaring, buyers are going nuts, sellers run the show, realtors are laughing all the way to the bank, and the media are having a field day. Nationwide, the median price of existing homes, at $236,400, as the National Association of Realtors sees it, is now 2.7% higher than it was even in July 2006, the insane peak of the crazy housing bubble that blew up with such spectacular results.

Housing Bubble 2 has bloomed into full magnificence: In many cities, the median price today is far higher, not just a little higher, than it was during the prior housing bubble, and excitement is once again palpable. Buy now, or miss out forever! A buying panic has set in.

And so the July edition of D Magazine – “Making Dallas Even Better,” is its motto – had this enticing cover, sent to me by David in Texas, titled, “The Great Dallas Land Rush”:

Dallas Land Rush

“Dallas Real Estate 2015: The Hottest Market Ever,” the subtitle says.

That’s true for many cities, including San Francisco. The “Boom Town,” as it’s now called, is where the housing market has gone completely out of whack, with a median condo price at $1.13 million and the median house price at $1.35 million. This entails some consequences [read… The San Francisco “Housing Crisis” Gets Ugly].

The fact that Housing Bubble 2 is now even more magnificent than the prior housing bubble, even while real incomes have stagnated or declined for all but the top earners, is another sign that the Fed, in its infinite wisdom, has succeeded elegantly in pumping up nearly all asset prices to achieve its “wealth effect.” And it continues to do so, come heck or high water. It has in this ingenious manner “healed” the housing market.

But despite the current “buying panic,” the soaring prices, and all the hoopla round them, there is a fly in the ointment: overall home ownership is plunging.

The home ownership rate dropped to 63.4% in the second quarter, not seasonally adjusted, according to a new report by the Census Bureau, down 1.3 percentage points from a year ago. The lowest since 1967!

home ownershipWolf Street

The process has been accelerating, instead of slowing down. The 1.2 percentage point plunge in 2014 was the largest annual drop in the history of the data series going back to 1965. And this year is on track to match this record: the drop over the first two quarters so far amounts to 0.6 percentage points. This accelerated drop in home ownership rates coincides with a sharp increase in home prices. Go figure.

The plunge in home ownership rates has spread across all age groups, but to differing degrees. Younger households have been hit the hardest. In the age group under 35, the home ownership rate in Q2 saw a slight uptick to 34.8%, from the dismal record low of 34.6% in the prior quarter. Either a feeble ray of hope or just one of the brief upticks, as in the past, to be succeeded by more down ticks on the way to lower lows.

This chart by the Economics and Strategy folks at National Bank Financial shows the different rates of home ownership by age group. The 35-year and under group is where the first-time buyers are concentrated; and they’re being sidelined, whether they have no interest in buying, or simply don’t make enough money to buy (represented by the sharply descending solid black line, left scale). Note how the oldest age group (dotted blue line, right scale) has recently started to cave as well:

homeownership ratesWolf Street

The bitter irony? In the same breath, the Census Bureau also reported that the rental vacancy rate dropped to 6.8%, from 7.5% a year ago, the lowest since 1985. America is turning into a country of renters.

This chart shows the dynamics between home ownership rates (black line, left scale) and rental vacancy rates (red line, right scale) over time: they essentially rise and dive together. It makes sense on an intuitive basis: as people abandon the idea of owning a home, they turn into renters, and the rental market tightens up, and vacancy rates decline.

homeownership rate v rental vacancy rateWolf Street

This too has been by design, it seems. Since 2012, private equity firms bought several hundred thousand vacant single-family homes in key markets, drove up prices in the process, and started to rent them out. Thousands of smaller investors have jumped into the fray, buying homes, driving up prices, and trying to rent them out. This explains the record median home price across the country, and the totally crazy price increases in some key markets, even as regular Americans are trying to figure out how to pay for a basic roof over their heads.

This has worked out well. By every measure, rents have jumped. According to the Census Bureau’s report, the median asking rent in the US rose 6.2% from a year ago, and 17.6% since 2011. So inflation bites. But the Fed is still desperately looking for signs of inflation and simply cannot find any.

And how much have incomes risen over these years to allow renters to meet these rising rents? OK, that was a rhetorical question. We already know what has been happening to incomes.

That’s what it always boils down to in the Fed’s salvation of the economy: people who can’t afford to pay the rising rents with their stagnant or declining incomes should borrow the money to make up the difference and then spend even more on consumer goods. After us, the deluge.

How to Zombie-Proof Your Home (Just in Case)

by Michael Park

https://i0.wp.com/rdcnewscdn.realtor.com/wp-content/uploads/2015/02/zombie-proof-house-1.jpg

It’s only natural to make hypothetical plans for fortifying your home—just in case the human dead rise from their graves and wander the earth, feasting on the flesh of the living. Totally normal.

https://i0.wp.com/media-cache-ak0.pinimg.com/736x/c5/1a/4f/c51a4ff7845e34c481369fa37feb9efa.jpg

OK, it’s not all that normal, but it’s fun. But of course your spouse is freaking out when he or she sees you drawing up blueprints for a moat surrounding your house. And he or she has a good point: How much would zombie fortifications cost? And what would they do for the value of your home?

Well, let’s take a look. We’ll consider the most critical zombie-proofing improvements you can make for your home, keeping in mind that CONOP 8888, the Pentagon’s zombie-invasion plan (seriously, it made a zombie-invasion plan—don’t worry, more as a thought exercise than for fear of an actual undead uprising … we hope), estimates that any zombie outbreak wouldn’t last more than 40 days. We’re also assuming that we’re dealing with slow, dumb “classic” George Romero-type zombies, rather than fast Danny Boyle-style zombies.

Doors

https://i0.wp.com/web-images.chacha.com/images/galleryimage521904060-jul-16-2012-600x619.jpg

The first thing you’re going to want to do to shore up your zombie defenses is to strengthen the most obvious points of entry: outside doors. At the lowest end of the scale, you can follow the lead of 99% of your zombie-movie victims and board up your doors with a series of two-by-fours, four-by-eight sheets of plywood, and long nails, essentially barricading yourself inside your home till the cavalry comes. That’ll set you back little more than the cost of a nail gun, wood, and nails ($200–$300), and it’s not a permanent addition to the house, so you won’t affect the price of the home—unless you’re really horrible at using a nail gun. The downside is that your defenses will be as strong as your carpentry, and as soon as that first zombie gets its fingers into a weak point, your entire home is compromised.

An intermediate step is a security bar or security gate on the doors, which is a permanent addition to the home that frees you up to spend your first zombie-outbreak hours on quickie weapons training and other pressing needs instead of noisily hammering a bunch of wood planks to the walls. Security bars and security gates can run anywhere from $100 to several thousand dollars before installation costs (you’ll want to get them professionally installed, so that they’re anchored securely), and they probably won’t affect the value of your home for good or ill. But, as the inimitable zombie expert Max Brooks points out in “The Zombie Survival Guide,” “Experience has shown that as few as three walking dead can tear them down in less than twenty-four hours.”

Your best bet, and not necessarily your most expensive, is installing high-end steel doors at entry points, with steel frames and heavy-duty locks (remember to get secure bolt-style locks for the bottom of the door, too). A big plus is that steel doors generally run cheaper than wooden doors. But they tend to show more wear and need to be replaced more often, because they don’t weather the elements well (the salt air of homes near the oceans, for example, can quickly corrode steel doors). Expect the cost of an exterior steel door, with installation fees, to start at about $500 at the lowest end. But this may be the easiest zombie-proofing improvement to sell to a more practical-minded spouse: According to remodeling.hw.net, which tracks the cost of home improvements vs. their resale value, replacing an existing front door with a midrange 20-gauge steel door is worth 117% more than the money you put into it (an average cost of $1,230 vs. an average value of $1,446).

Windows

https://i0.wp.com/www.zombieagency.org/wp-content/uploads/2013/04/Window-Protection-1170x877.jpg

For some reason, Hollywood zombies seem to prefer trying to get to living people through the windows rather than the front door. Hollywood heroes tend to respond by dragging flimsy furniture in front of the bay windows and then hoping for the best. But you can do better!

If you want to keep things as cheap as possible, go the two-by-four route again. Assuming you already bought a nail gun for the door and still have a bucket of nails to dig into, you’ll have only to shell out for a few more two-by-fours for first-floor and basement windows—a couple of bucks per plank, or $15 or so for a four-by-eight sheet of 5/8-inch plywood. Reinforcing all the windows of, say a six-window first floor might run as little as $100.

https://i0.wp.com/media-cache-ec0.pinimg.com/236x/73/6d/c3/736dc34ba38d5ec486e35b07b7c191da.jpg

A better, but vastly more expensive, bet would be to install hurricane shutters on all your first-floor windows—essentially the same kind of roll-down steel gates that city shopkeepers pull down to secure their stores at the end of the night. They’re easy to operate, offer the best protection for existing windows against both zombies and storms, and, depending on where you live, could greatly increase the value of your home.

“In a place like Florida, which sees a lot of storms, hurricane shutters would be very positive,” says Bill Lublin, CEO of Century 21 Advantage Gold. “And they roll up and go out of the way, so even in the Northeast, you’d probably see some slight improvement, or they’d be revenue-neutral.”

The downside? Price. Hurricane shutters cost a pretty penny—around $55 per square foot.

Rooftop and basement defenses

https://i0.wp.com/i.dailymail.co.uk/i/pix/2013/01/28/article-2269371-17346A47000005DC-430_634x350.jpg

If you’ve watched any zombie movie, you know you’ll be spending a lot of your time waiting out the undead apocalypse on rooftops and in basements. So it makes sense that you prepare by getting those two locations shipshape now.

Rooftops are an ideal location to serve as a lookout for incoming zombie hordes, as a sniper’s nest for reanimated attackers, and to enjoy sunshine in relative safety—classic zombies aren’t big climbers, after all. The roof could easily end up being your command-and-control headquarters. All you really need to make your roof a usable perch is some cushions from the couch, a thermos of coffee, and an extra ladder that you can use to escape in case the house itself is compromised (a two-story escape ladder runs about $60).

But, if you don’t already have one, a roof deck could be a much more comfortable and functional space. First, check with your local zoning laws about whether you’re allowed to put up a roof deck. Then make sure your house can actually support a deck up there—a deck isn’t going to do much good if all it does is add a gaping hole to your roof. From that point, you should count on a roof deck running you at least $3,000 (depending on the materials you use, size, and circumstances of your home) and likely more in the $10,000 range or higher (keep in mind that you might have to put in stairs and pay for an additional safety assessment). The great thing about roof decks, though, is that they can be great for property value.

“If you’re down the Jersey shore and you’ve got a rooftop view of the ocean, or a skyline view of Center City, Philadelphia, a rooftop deck provides good value,” Lublin says. “If there’s good interior egress to it, it’s a great place to drop that deck.”

https://i0.wp.com/stagetecture.com/wp-content/uploads/2012/09/basement-mancave.jpg

Though Brooks advises strongly against relying on basements (his primary advice for people besieged in houses is to get to the second floor and destroy the staircase), 40 days is a long time to spend hanging out in your sister’s bedroom. If you’re confident the windows and doors are secure, it might be worthwhile turning the basement into a place to keep not just necessary supplies but also recreational material—as long as the undead outside can’t see or hear you, of course. With a home generator and a decent library of DVDs, a finished basement can help survivors fend off cabin fever or worse till help comes—and as we all know from watching “The Walking Dead,” living human beings are their own worst enemies. Plus: excellent excuse to finally get that man cave you wanted!

“A finished basement, maybe with a nice kitchen or alternative food-preparation area and home theater with recliners and good video or audio media, would be beneficial for the zombie apocalypse and add to value,” Lublin says.

Border security

https://c2.staticflickr.com/4/3288/2899691306_a14057d13c_z.jpg?zz=1

What about keeping the zombies away from your home in the first place? If you want to go full medieval, you could rent a backhoe and dig a moat that’s at least six feet deep and 10 feet wide around your home, then fill it with water. (You’d want to make sure it’s deep and steep enough that zombies can’t simply walk over one another to get to you.) Renting a full-size backhoe can cost between $200 and $350 a day, but you might consider just buying a used backhoe starting at around $7,000. That all, of course, is assuming that your town allows you to build a moat (it’s a good bet no), and not factoring in any additional costs for water bills, maintenance, the inevitable cleanup for when everyone in your area starts using it as a trash dump, and the permanent ill will of your neighbors. As for how much value a moat adds to your home, well…

“I don’t know—I’ve never sold a house with a moat,” Lublin says.

Common sense, of course, says that a gaping ring of stagnant water around your home is going to turn more home buyers off than on. Lublin says the best analogy might be with swimming pools in the North.

“Swimming pools sometimes have a negative impact on the value of a property, especially if the next person isn’t looking for one, and the geography means it’s only used so much for the year,” he says.

And remember, a moat is basically a giant, dirty swimming pool that no one wants and that no one gets to swim in, ever.

https://i0.wp.com/wallpaper.pickywallpapers.com/2560x1440/the-walking-dead-zombies-behind-the-fence.jpg

A better choice might be a much more conventional chain-link fence, as Brooks suggests: “A good ten-foot, chain-link fence can hold dozens of zombies for weeks, even months, provided their numbers remain at Class 1.” A commercial-grade chain-link fence can run around $40 a foot, which can quickly add up if you’re trying to enclose your entire home. (That’s $100,000 off the bat to cover a lot that’s 100 feet by 25 feet, for example.) And 10-foot-high chain-link fences around a house make home buyers immediately assume that there are serious security concerns in the area, making the house that much harder to sell.

Brooks recommends a steel-rod-reinforced, concrete-filled cinder-block wall if you’re concerned about more serious “Class 2″ zombie outbreaks, but it’s much pricier, and walls topping eight feet require specialized machinery—don’t be surprised if your contractor quotes you a price of at least $200 per linear foot for a wall of 10 feet or higher. Your town officials and neighbors are almost certainly going to have a problem with this, and if you think a chain-link fence is going to put off potential home buyers, imagine what a 10-foot concrete wall will make them think.

Additional improvements

https://i0.wp.com/image.made-in-china.com/2f0j00wMKTkHdsPAbP/Natural-Gas-Generator-Set-NG5500H-E-.jpg

A backup home generator could keep food and medical supplies from perishing, keep the lights, heat, and radios on, and help maintain sanity by letting everyone watch back seasons of “Mad Men.” And because it actually serves a genuine purpose in the real world, Lublin says it’s “a real plus” in any part of the country that’s ever experienced a blackout—which is probably all of them. Expect to pay between $3,000 and $7,000 for a natural-gas-powered backup generator for whole-home use, not including fuel and installation costs.

https://i0.wp.com/media-cache-ec0.pinimg.com/736x/35/93/e6/3593e6cd18faabccd95049cd4c601915.jpg

Inexpensive security-camera systems are now also available that can help you keep tabs on zombie lurkers at blind points around the house—or errant kids and pets when there isn’t an undead uprising going on—Nest’s Dropcams run $150 a pop and stream wirelessly to your generator-powered computer.

Ultimately, though, Lublin recommends making the improvements you want for your home regardless of the zombie situation.

“I wouldn’t spend too much time worrying about zombies, though it never does hurt to be prepared,” he says. “Consulting a Realtor® is always a good idea to ensure that an improvement is actually going to add to the value of your home.

Junk-Rated Oil & Gas Companies in a “Liquidity Death Spiral”

by Wolf Richter

https://ashwinikumar007.files.wordpress.com/2011/06/blackmoney.jpg

On the face of it, the oil price appears to be stabilizing. What a precarious balance it is, however.

Behind the facade of stability, the re-balancing triggered by the price collapse has yet to run its course, and it might be overly optimistic to expect it to proceed smoothly. Steep drops in the US rig count have been a key driver of the price rebound. Yet US supply so far shows precious little sign of slowing down. Quite to the contrary, it continues to defy expectations.

So said the International Energy Agency in its Oil Market Report on Friday. West Texas Intermediate plunged over 4% to $45 a barrel.

The boom in US oil production will continue “to defy expectations” and wreak havoc on the price of oil until the power behind the boom dries up: money borrowed from yield-chasing investors driven to near insanity by the Fed’s interest rate repression. But that money isn’t drying up yet – except at the margins.

Companies have raked in 14% more money from high-grade bond sales so far this year than over the same period in 2014, according to LCD. And in 2014 at this time, they were 27% ahead of the same period in 2013. You get the idea.

Even energy companies got to top off their money reservoirs. Among high-grade issuers over just the last few days were BP Capital, Valero Energy, Sempra Energy, Noble, and Helmerich & Payne. They’re all furiously bringing in liquidity before it gets more expensive.

In the junk-bond market, bond-fund managers are chasing yield with gusto. Last week alone, pro-forma junk bond issuance “ballooned to $16.48 billion, the largest weekly tally in two years,” the LCD HY Weekly reported. Year-to-date, $79.2 billion in junk bonds have been sold, 36% more than in the same period last year.

But despite this drunken investor enthusiasm, the bottom of the energy sector – junk-rated smaller companies – is falling out.

Standard & Poor’s rates 170 bond issuers that are engaged in oil and gas exploration & production, oil field services, and contract drilling. Of them, 81% are junk rated – many of them deep junk. The oil bust is now picking off the smaller junk-rated companies, one after the other, three of them so far in March.

On March 3, offshore oil-and-gas contractor CalDive that in 2013 still had 1,550 employees filed for bankruptcy. It’s focused on maintaining offshore production platforms. But some projects were suspended last year, and lenders shut off the spigot.

On March 8, Dune Energy filed for bankruptcy in Austin, TX, after its merger with Eos Petro collapsed. It listed $144 million in debt. Dune said that it received $10 million Debtor in Possession financing, on the condition that the company puts itself up for auction.

On March 9, BPZ Resources traipsed to the courthouse in Houston to file for bankruptcy, four days after I’d written about its travails; it had skipped a $60 million payment to its bondholders [read… “Default Monday”: Oil & Gas Companies Face Their Creditors].

And more companies are “in the pipeline to be restructured,” LCD reported. They all face the same issues: low oil and gas prices, newly skittish bond investors, and banks that have their eyes riveted on the revolving lines of credit with which these companies fund their capital expenditures. Being forever cash-flow negative, these companies periodically issue bonds and use the proceeds to pay down their revolver when it approaches the limit. In many cases, the bank uses the value of the company’s oil and gas reserves to determine that limit.

If the prices of oil and gas are high, those reserves have a high value. It those prices plunge, the borrowing base for their revolving lines of credit plunges. S&P Capital IQ explained it this way in its report, “Waiting for the Spring… Will it Recoil”:

Typically, banks do their credit facility redeterminations in April and November with one random redetermination if needed. With oil prices plummeting, we expect banks to lower their price decks, which will then lead to lower reserves and thus, reduced borrowing-base availability.

April is coming up soon. These companies would then have to issue bonds to pay down their credit lines. But with bond fund managers losing their appetite for junk-rated oil & gas bonds, and with shares nearly worthless, these companies are blocked from the capital markets and can neither pay back the banks nor fund their cash-flow negative operations. For many companies, according to S&P Capital IQ, these redeterminations of their credit facilities could lead to a “liquidity death spiral.”

Alan Holtz, Managing Director in AlixPartners’ Turnaround and Restructuring group told LCD in an interview:

We are already starting to see companies that on the one hand are trying to work out their operational problems and are looking for financing or a way out through the capital markets, while on the other hand are preparing for the events of contingency planning or bankruptcy.

Look at BPZ Resources. It wasn’t able to raise more money and ended up filing for bankruptcy. “I think that is going to be a pattern for many other companies out there as well,” Holtz said.

When it trickled out on Tuesday that Hercules Offshore, which I last wrote about on March 3, had retained Lazard to explore options for its capital structure, its bonds plunged as low as 28 cents on the dollar. By Friday, its stock closed at $0.41 a share.

When Midstates Petroleum announced that it had hired an interim CEO and put a restructuring specialist on its board of directors, its bonds got knocked down, and its shares plummeted 33% during the week, closing at $0.77 a share on Friday.

When news emerged that Walter Energy hired legal counsel Paul Weiss to explore restructuring options, its first-lien notes – whose investors thought they’d see a reasonable recovery in case of bankruptcy – dropped to 64.5 cents on the dollar by Thursday. Its stock plunged 63% during the week to close at $0.33 a share on Friday.

Numerous other oil and gas companies are heading down that path as the oil bust is working its way from smaller more vulnerable companies to larger ones. In the process, stockholders get wiped out. Bondholders get to fight with other creditors over the scraps. But restructuring firms are licking their chops, after a Fed-induced dry spell that had lasted for years.

Investors Crushed as US Natural Gas Drillers Blow Up

by Wolf Richter

The Fed speaks, the dollar crashes. The dollar was ripe. The entire world had been bullish on it. Down nearly 3% against the euro, before recovering some. The biggest drop since March 2009. Everything else jumped. Stocks, Treasuries, gold, even oil.

West Texas Intermediate had been experiencing its biggest weekly plunge since January, trading at just above $42 a barrel, a new low in the current oil bust. When the Fed released its magic words, WTI soared to $45.34 a barrel before re-sagging some. Even natural gas rose 1.8%. Energy related bonds had been drowning in red ink; they too rose when oil roared higher. It was one heck of a party.

But it was too late for some players mired in the oil and gas bust where the series of Chapter 11 bankruptcy filings continues. Next in line was Quicksilver Resources.

It had focused on producing natural gas. Natural gas was where the fracking boom got started. Fracking has a special characteristic. After a well is fracked, it produces a terrific surge of hydrocarbons during first few months, and particularly on the first day. Many drillers used the first-day production numbers, which some of them enhanced in various ways, in their investor materials. Investors drooled and threw more money at these companies that then drilled this money into the ground.

But the impressive initial production soon declines sharply. Two years later, only a fraction is coming out of the ground. So these companies had to drill more just to cover up the decline rates, and in order to drill more, they needed to borrow more money, and it triggered a junk-rated energy boom on Wall Street.

At the time, the price of natural gas was soaring. It hit $13 per million Btu at the Henry Hub in June 2008. About 1,600 rigs were drilling for gas. It was the game in town. And Wall Street firms were greasing it with other people’s money. Production soared. And the US became the largest gas producer in the world.

https://martinhladyniuk.files.wordpress.com/2015/03/be197-deathspiral2.jpg

But then the price began to plunge. It recovered a little after the Financial Crisis but re-plunged during the gas “glut.” By April 2012, natural gas had crashed 85% from June 2008, to $1.92/mmBtu. With the exception of a few short periods, it has remained below $4/mmBtu – trading at $2.91/mmBtu today.

Throughout, gas drillers had to go back to Wall Street to borrow more money to feed the fracking orgy. They were cash-flow negative. They lost money on wells that produced mostly dry gas. Yet they kept up the charade. They aced investor presentations with fancy charts. They raved about new technologies that were performing miracles and bringing down costs. The theme was that they would make their investors rich at these gas prices.

The saving grace was that oil and natural-gas liquids, which were selling for much higher prices, also occur in many shale plays along with dry gas. So drillers began to emphasize that they were drilling for liquids, not dry gas, and they tried to switch production to liquids-rich plays. In that vein, Quicksilver ventured into the oil-rich Permian Basin in Texas. But it was too little, too late for the amount of borrowed money it had already burned through over the years by fracking for gas below cost.

During the terrible years of 2011 and 2012, drillers began reclassifying gas rigs as rigs drilling for oil. It was a judgement call, since most wells produce both. The gas rig count plummeted further, and the oil rig count skyrocketed by about the same amount. But gas production has continued to rise since, even as the gas rig count has continued to drop. On Friday, the rig count was down to 257 gas rigs, the lowest since March 1993, down 84% from its peak in 2008.

US-rig-count_1988_2015-03-13=gas

Quicksilver’s bankruptcy is a consequence of this fracking environment. It listed $2.35 billion in debts. That’s what is left from its borrowing binge that covered its negative cash flows. It listed only $1.21 billion in assets. The rest has gone up in smoke.

Its shares are worthless. Stockholders got wiped out. Creditors get to fight over the scraps.

Its leveraged loan was holding up better: the $625 million covenant-lite second-lien term loan traded at 56 cents on the dollar this morning, according to S&P Capital IQ LCD. But its junk bonds have gotten eviscerated over time. Its 9.125% senior notes due 2019 traded at 17.6 cents on the dollar; its 7.125% subordinated notes due 2016 traded at around 2 cents on the dollar.

Among its creditors, according to the Star Telegram: the Wilmington Trust National Association ($361.6 million), Delaware Trust Co. ($332.6 million), US Bank National Association ($312.7 million), and several pipeline companies, including Oasis Pipeline and Energy Transfer Fuel.

Last year, it hired restructuring advisers. On February 17, it announced that it would not make a $13.6 million interest payment on its senior notes and invoked the possibility of filing for Chapter 11. It said it would use its 30-day grace period to haggle with its creditors over the “company’s options.”

Now, those 30 days are up. But there were no other “viable options,” the company said in the statement. Its Canadian subsidiary was not included in the bankruptcy filing; it reached a forbearance agreement with its first lien secured lenders and has some breathing room until June 16.

Quicksilver isn’t alone in its travails. Samson Resources and other natural gas drillers are stuck neck-deep in the same frack mud.

A group of private equity firms, led by KKR, had acquired Samson in 2011 for $7.2 billion. Since then, Samson has lost $3 billion. It too hired restructuring advisers to deal with its $3.75 billion in debt. On March 2, Moody’s downgraded Samson to Caa3, pointing at “chronically low natural gas prices,” “suddenly weaker crude oil prices,” the “stressed liquidity position,” and delays in asset sales. It invoked the possibility of “a debt restructuring” and “a high risk of default.”

But maybe not just yet. The New York Post reported today that, according to sources, a JPMorgan-led group, which holds a $1 billion revolving line of credit, is granting Samson a waiver for an expected covenant breach. This would avert default for the moment. Under the deal, the group will reduce the size of the revolver. Last year, the same JPMorgan-led group already reduced the credit line from $1.8 billion to $1 billion and waived a covenant breach.

By curtailing access to funding, they’re driving Samson deeper into what S&P Capital IQ called the “liquidity death spiral.” According to the New York Post’s sources, in August the company has to make an interest payment to its more junior creditors, “and may run out of money later this year.”

Industry soothsayers claimed vociferously over the years that natural gas drillers can make money at these prices due to new technologies and efficiencies. They said this to attract more money. But Quicksilver along with Samson Resources and others are proof that these drillers had been drilling below the cost of production for years. And they’d been bleeding every step along the way. A business model that lasts only as long as new investors are willing to bail out old investors.

But it was the crash in the price of “liquids” that made investors finally squeamish, and they began to look beyond the hype. In doing so, they’re triggering the very bloodletting amongst each other that ever more new money had delayed for years. Only now, it’s a lot more expensive for them than it would have been three years ago. While the companies will get through it in restructured form, investors get crushed.


25 Percent of all U.S. Foreclosures Are Zombie Homes

https://i0.wp.com/www.csmonitor.com/var/ezflow_site/storage/images/media/content/2013/0110-zombie-foreclosures.jpg/14727985-1-eng-US/0110-zombie-foreclosures.jpg_full_600.jpgby Michael Gerrity

RealtyTrac’s Q1 2015 Zombie Foreclosure Report, found that as of the end of January 2015, 142,462 homes actively in the foreclosure process had been vacated by the homeowners prior to the bank repossessing the property, representing 25 percent of all active foreclosures.

The total number of zombie foreclosures was down 6 percent from a year ago, but the 25 percent share of total foreclosures represented by zombies was up from 21 percent a year ago.

“While the number of vacated zombie foreclosures is down from a year ago, they represent an increasing share of all foreclosures because they tend to be the problem cases still stuck in the pipeline,” said Daren Blomquist vice president at RealtyTrac. “Additionally, the states where overall foreclosure activity has been increasing over the past year — counter to the national trend — tend to be states with a longer foreclosure process more susceptible to the zombie problem.”

“In states with a bloated foreclosure process, the increase in zombie foreclosures is actually a good sign that banks and courts are finally moving forward with a resolution on these properties that may have been sitting in foreclosure limbo for years,” Blomquist continued. “In many markets there is plenty of demand from buyers and investors to snatch up these distressed properties as soon as they become available to purchase.”

Florida, New Jersey, New York have most zombie foreclosures

https://www.homevalueleads.com/wp-content/uploads/crazy.jpg

Despite a 35 percent decrease in zombie foreclosures compared to a year ago, Florida had the highest number of any state with 35,903 — down from 54,908 in the first quarter of 2014. Zombie foreclosures accounted for 26 percent of all foreclosures in Florida.

Zombie foreclosures increased 109 percent from a year ago in New Jersey, and the state posted the second highest total of any state with 17,983 — 23 percent of all properties in foreclosure.

New York zombie foreclosures increased 54 percent from a year ago to 16,777, the third highest state total and representing 19 percent of all residential properties in foreclosure.

Illinois had 9,358 zombie foreclosures at the end of January, down 40 percent from a year ago but still the fourth highest state total, while California had 7,370 zombie foreclosures at the end of January, up 24 percent from a year ago and the fifth highest state total. 

“We are now in the final cycle of the foreclosure crisis cleanup, in which we are witnessing a large final wave of walkaways,” said Mark Hughes, Chief Operating Officer at First Team Real Estate, covering the Southern California market. “This has created an uptick in vacated or ‘zombie’ foreclosures and the intrinsic neighborhood issues most of them create.

“A much longer recovery, a largely veiled underemployment issue, and growing examples of faster bad debt forgiveness have most likely fueled this last wave of owners who have finally just walked away from their American dream,” Hughes added.

Other states among the top 10 for most zombie foreclosures were Ohio (7,360), Indiana (5,217), Pennsylvania (4,937), Maryland (3,363) and North Carolina (3,177).

“Rising home prices in Ohio are motivating lending servicers to commence foreclosure actions more quickly and with fewer workout options offered to delinquent homeowners, creating immediate vacancies earlier in the foreclosure process,” said Michael Mahon, executive vice president at HER Realtors, covering the Ohio housing markets of Cincinnati, Dayton and Columbus. “Delinquent homeowners need to understand how prices have increased in recent months, and how this increase in equity may provide positive options for them to avoid foreclosure.”

https://martinhladyniuk.files.wordpress.com/2015/03/f9c9a-zombie1.jpg

Metros with most zombie foreclosures: New York, Miami, Chicago, Tampa and Philadelphia. The greater New York metro area had by far the highest number of zombie foreclosures of any metropolitan statistical area nationwide, with 19,177 — 17 percent of all properties in foreclosure and up 73 percent from a year ago.

Zombie foreclosures decreased from a year ago in Miami, Chicago and Tampa, but the three metros still posted the second, third and fourth highest number of zombie foreclosures among metro areas nationwide: Miami had 9,580 zombie foreclosures,19 percent of all foreclosures but down 34 percent from a year ago; Chicago had 8,384 zombie foreclosures, 21 percent of all foreclosures but down 35 percent from a year ago; and Tampa had 7,838 zombie foreclosures, 34 percent of all foreclosures but down 25 percent from a year ago.

Zombie foreclosures increased 53 percent from a year ago in the Philadelphia metro area, giving it the fifth highest number of any metro nationwide in the first quarter of 2015. There were 7,554 zombie foreclosures in the Philadelphia metro area as of the end of January, 27 percent of all foreclosures.

Other metro areas among the top 10 for most zombie foreclosures were Orlando (3,718), Jacksonville, Florida (2,368), Los Angeles (2,074), Las Vegas (1,832), and Baltimore, Maryland (1,722).

Metros with highest share of zombie foreclosures: St. Louis, Portland, Las Vegas

Among metro areas with a population of 200,000 or more and at least 500 zombie foreclosures as of the end of January, those with the highest share of zombie foreclosures as a percentage of all foreclosures were St. Louis (51 percent), Portland (40 percent) and Las Vegas (36 percent).

Metros with biggest increase in zombie foreclosures: Atlantic City, Trenton, New York

Among metro areas with a population of 200,000 or more and at least 500 zombie foreclosures as of the end of January, those with the biggest year-over-year increase in zombie foreclosures were Atlantic City, New Jersey (up 133 percent), Trenton-Ewing, New Jersey (up 110 percent), and New York (up 73 percent).

https://i0.wp.com/www.worldpropertyjournal.com/news-assets/Metros-with-Most-Zombie-Foreclosures.jpg
https://i0.wp.com/www.worldpropertyjournal.com/news-assets/Metros-with-Highest-Share-of-Zombie-Foreclosures.jpg
https://i0.wp.com/www.worldpropertyjournal.com/news-assets/US-States-with-Most-Zombie-Foreclosures.jpg
https://i0.wp.com/www.worldpropertyjournal.com/news-assets/Metros-with-Biggest-Increases-in-Zombie-Foreclosures.jpg

This Chart Shows the True Collapse of Fracking in the US

by Wolf Richter
https://feww.files.wordpress.com/2009/08/rex-wtillerson-exxon.jpg

Rex Tillerson, Exxon Mobile CEO

“People need to kinda settle in for a while.” That’s what Exxon Mobil CEO Rex Tillerson said about the low price of oil at the company’s investor conference. “I see a lot of supply out there.”

So Exxon is going to do its darnedest to add to this supply: 16 new production projects will start pumping oil and gas through 2017. Production will rise from 4 million barrels per day to 4.3 million. But it will spend less money to get there, largely because suppliers have had to cut their prices.

That’s the global oil story. In the US, a similar scenario is playing out. Drillers are laying some people off, not massive numbers yet. Like Exxon, they’re shoving big price cuts down the throats of their suppliers. They’re cutting back on drilling by idling the least efficient rigs in the least productive plays – and they’re not kidding about that.

In the latest week, they idled a 64 rigs drilling for oil, according to Baker Hughes, which publishes the data every Friday. Only 922 rigs were still active, down 42.7% from October, when they’d peaked. Within 21 weeks, they’ve taken out 687 rigs, the most terrific, vertigo-inducing oil-rig nose dive in the data series, and possibly in history:

US-rig-count_1988_2015-03-06=oilAs Exxon and other drillers are overeager to explain: just because we’re cutting capex, and just because the rig count plunges, doesn’t mean our production is going down. And it may not for a long time. Drillers, loaded up with debt, must have the cash flow from production to survive.

But with demand languishing, US crude oil inventories are building up further. Excluding the Strategic Petroleum Reserve, crude oil stocks rose by another 10.3 million barrels to 444.4 million barrels as of March 4, the highest level in the data series going back to 1982, according to the Energy Information Administration. Crude oil stocks were 22% (80.6 million barrels) higher than at the same time last year.

“When you have that much storage out there, it takes a long time to work that off,” said BP CEO Bob Dudley, possibly with one eye on this chart:

US-crude-oil-stocks-2015-03-04So now there is a lot of discussion when exactly storage facilities will be full, or nearly full, or full in some regions. In theory, once overproduction hits used-up storage capacity, the price of oil will plummet to whatever level short sellers envision in their wildest dreams. Because: what are you going to do with all this oil coming out of the ground with no place to go?

A couple of days ago, the EIA estimated that crude oil stock levels nationwide on February 20 (when they were a lot lower than today) used up 60% of the “working storage capacity,” up from 48% last year at that time. It varied by region:

Capacity is about 67% full in Cushing, Oklahoma (the delivery point for West Texas Intermediate futures contracts), compared with 50% at this point last year. Working capacity in Cushing alone is about 71 million barrels, or … about 14% of the national total.

As of September 2014, storage capacity in the US was 521 million barrels. So if weekly increases amount to an average of 6 million barrels, it would take about 13 weeks to fill the 77 million barrels of remaining capacity. Then all kinds of operational issues would arise. Along with a dizzying plunge in price.

In early 2012, when natural gas hit a decade low of $1.92 per million Btu, they predicted the same: storage would be full, and excess production would have to be flared, that is burned, because there would be no takers, and what else are you going to do with it? So its price would drop to zero.

They actually proffered that, and the media picked it up, and regular folks began shorting natural gas like crazy and got burned themselves, because it didn’t take long for the price to jump 50% and then 100%.

Oil is a different animal. The driving season will start soon. American SUVs and pickups are designed to burn fuel in prodigious quantities. People will be eager to drive them a little more, now that gas is cheaper, and they’ll get busy shortly and fix that inventory problem, at least for this year. But if production continues to rise at this rate, all bets are off for next year.

Natural gas, though it refused to go to zero, nevertheless got re-crushed, and the price remains below the cost of production at most wells. Drilling activity has dwindled. Drillers idled 12 gas rigs in the latest week. Now only 268 rigs are drilling for gas, the lowest since April 1993, and down 83.4% from its peak in 2008! This is what the natural gas fracking boom-and-bust cycle looks like:

US-rig-count_1988_2015-03-06=gasYet production has continued to rise. Over the last 12 months, it soared about 9%, which is why the price got re-crushed.

Producing gas at a loss year after year has consequences. For the longest time, drillers were able to paper over their losses on natural gas wells with a variety of means and go back to the big trough and feed on more money that investors were throwing at them, because money is what fracking drills into the ground.

But that trough is no longer being refilled for some companies. And they’re running out. “Restructuring” and “bankruptcy” are suddenly the operative terms.


“Default Monday”: Oil & Gas Face Their Creditors

by Wolf Richter

https://i0.wp.com/www.macleans.ca/wp-content/uploads/2013/02/MAC04_OILSANDS01-wide.jpg

Debt funded the fracking boom. Now oil and gas prices have collapsed, and so has the ability to service that debt. The oil bust of the 1980s took down 700 banks, including 9 of the 10 largest in Texas. But this time, it’s different. This time, bondholders are on the hook.

And these bonds – they’re called “junk bonds” for a reason – are already cracking. Busts start with small companies and proceed to larger ones. “Bankruptcy” and “restructuring” are the terms that wipe out stockholders and leave bondholders and other creditors to tussle over the scraps.

https://martinhladyniuk.files.wordpress.com/2015/03/27560-bankruptcy.jpg

Early January, WBH Energy, a fracking outfit in Texas, kicked off the series by filing for bankruptcy protection. It listed assets and liabilities of $10 million to $50 million. Small fry.

A week later, GASFRAC filed for bankruptcy in Alberta, where it’s based, and in Texas – under Chapter 15 for cross-border bankruptcies. Not long ago, it was a highly touted IPO, whose “waterless fracking” technology would change a parched world. Instead of water, the system pumps liquid propane gel (similar to Napalm) into the ground; much of it can be recaptured, in theory.

Ironically, it went bankrupt for other reasons: operating losses, “reduced industry activity,” the inability to find a buyer that would have paid enough to bail out its creditors, and “limited access to capital markets.” The endless source of money without which fracking doesn’t work had dried up.

https://i0.wp.com/fm.cnbc.com/applications/cnbc.com/resources/img/editorial/2013/09/03/101003666-89cb3e34560372ba5382f629569eaecb4db09256.530x298.jpg

On February 17, Quicksilver Resources announced that it would not make a $13.6 million interest payment on its senior notes due in 2019. It invoked the possibility of filing for Chapter 11 bankruptcy to “restructure its capital structure.” Stockholders don’t have much to lose; the stock is already worthless. The question is what the creditors will get.

It has hired Houlihan Lokey Capital, Deloitte Transactions and Business Analytics, “and other advisors.” During its 30-day grace period before this turns into an outright default, it will haggle with its creditors over the “company’s options.”

On February 27, Hercules Offshore had its share-price target slashed to zero, from $4 a share, at Deutsche Bank, which finally downgraded the stock to “sell.” If you wait till Deutsche Bank tells you to sell, you’re ruined!

When I wrote about Hercules on October 15, HERO was trading at $1.47 a share, down 81% since July. Those who followed the hype to “buy the most hated stocks” that day lost another 44% by the time I wrote about it on January 16, when HERO was at $0.82 a share. Wednesday, shares closed at $0.60.

Deutsche Bank was right, if late. HERO is headed for zero (what a trip to have a stock symbol that rhymes with zero). It’s going to restructure its junk debt. Stockholders will end up holding the bag.

https://i0.wp.com/bloximages.newyork1.vip.townnews.com/tulsaworld.com/content/tncms/assets/v3/editorial/f/d8/fd890ea6-d8e7-59fc-b849-cf74b6c4a4cd/527b48bba3b05.preview-300.jpg

On Monday, due to “chronically low natural gas prices exacerbated by suddenly weaker crude oil prices,” Moody’s downgraded gas-driller Samson Resources, to Caa3, invoking “a high risk of default.”

It was the second time in three months that Moody’s downgraded the company. The tempo is picking up. Moody’s:

The company’s stressed liquidity position, delays in reaching agreements on potential asset sales and its retention of restructuring advisors increases the possibility that the company may pursue a debt restructuring that Moody’s would view as a default.

Moody’s was late to the party. On February 26, it was leaked that Samson had hired restructuring advisers Kirkland & Ellis and Blackstone’s restructuring group to figure out how to deal with its $3.75 billion in debt. A group of private equity firms, led by KKR, had acquired Samson in 2011 for $7.2 billion. Since then, Samson has lost $3 billion. KKR has written down its equity investment to 5 cents on the dollar.

This is no longer small fry.

https://i0.wp.com/www.yourindustrynews.com/upload_images/BPZ_Energy.jpg

Also on Monday, oil-and-gas exploration and production company BPZ Resources announced that it would not pay $62 million in principal and interest on convertible notes that were due on March 1. It will use its grace period of 10 days on the principal and of 30 days on the interest to figure out how to approach the rest of its existence. It invoked Chapter 11 bankruptcy as one of the options.

If it fails to make the payments within the grace period, it would also automatically be in default of its 2017 convertible bonds, which would push the default to $229 million.

BPZ tried to refinance the 2015 convertible notes in October and get some extra cash. Fracking devours prodigious amounts of cash. But there’d been no takers for the $150 million offering. Even bond fund managers, driven to sheer madness by the Fed’s policies, had lost their appetite. And its stock is worthless.

https://i0.wp.com/b.vimeocdn.com/ts/433/407/433407397_640.jpg

Also on Monday – it was “default Monday” or something – American Eagle Energy announced that it would not make a $9.8 million interest payment on $175 million in bonds due that day. It will use its 30-day grace period to hash out its future with its creditors. And it hired two additional advisory firms.

One thing we know already: after years in the desert, restructuring advisers are licking their chops.

The company has $13.6 million in negative working capital, only $25.9 million in cash, and its $60 million revolving credit line has been maxed out.

But here is the thing: the company sold these bonds last August! And this was supposed to be its first interest payment.

That’s what a real credit bubble looks like. In the Fed’s environment of near-zero yield on reasonable investments, bond fund managers are roving the land chasing whatever yield they can discern. And they’re holding their nose while they pick up this stuff to jam it into bond funds that other folks have in their retirement portfolio.

Not even a single interest payment!

Borrowed money fueled the fracking boom. The old money has been drilled into the ground. The new money is starting to dry up. Fracked wells, due to their horrendous decline rates, produce most of their oil and gas over the first two years. And if prices are low during that time, producers will never recuperate their investment in those wells, even if prices shoot up afterwards. And they’ll never be able to pay off the debt from the cash flow of those wells. A chilling scenario that creditors were blind to before, but are now increasingly forced to contemplate.

Dreaming Big: Americans Still Yearning for Larger Homes

by Ralph McLaughlin | Trulia

https://i0.wp.com/media-cache-ec0.pinimg.com/736x/4e/db/ef/4edbef39bc7ca7378eb266f56b71a350.jpg

43% of adults would prefer homes bigger than where they currently live, but attitudes differ by age. Baby boomers would prefer to upsize rather than downsize by only a small margin, while the gap among millennials is much wider, with GenXers falling in between. Would-be downsizers outnumber upsizers only among households living in the largest homes.

Last year, we found that Baby Boomers were especially unlikely to live in multi-unit housing. At the same time, we noted that the share of seniors living in multi-unit housing rather than single-family homes has been shrinking for decades. These findings got us thinking about how the generations vary in house-size preference. So we surveyed over 2000 people at the end of last year to figure out if boomers have different house-size preferences than their younger counterparts. And that led us to ask: What size homes do Americans really want?

Image 1

Most Americans are not living in the size home they want

https://i0.wp.com/tinyhouseblog.com/wp-content/uploads/2011/06/Rustic-guest-cottage-8.jpg

As a whole, Americans are living in a world of mismatch – only 40% of our respondents said they are living in the size home that’s ideal. Furthermore, over 43% answered that the size of their ideal residence is somewhat or much larger than their current digs. Only 16% told us that their ideal residence is smaller than their existing home. However, these overall figures mask what is going on within different generations.

It’s natural to think that baby boomers are the generation most likely to downsize.  After all, their nests are emptying and they may move when they retire.  As it turns out though, more boomers would prefer to live in a larger home than a smaller one: 21% said their ideal residence is smaller than their current home, while 26% wanted a larger home – a 5-percentage-point difference. Clearly, boomers don’t feel a massive yearn to downsize. On the contrary, just over half (53%) said they’re already living in their ideally sized home. Nonetheless, members of this generation are more likely to want to downsize than millennials and GenXers.

In fact, those younger generations want some elbow room. First, the millennials. They’re looking to move on up by a big margin: just over 60% told us their ideal residence is larger than where they live now – the largest proportion among the generations in our sample. By contrast, only a little over 13% of millennials said they’d rather have a smaller home than their existing one – which is also the smallest among the generations in our sample. The results are clear: millennials are much more likely to want to upsize than downsize.

The next generation up the ladder, the GenXers, are hitting their peak earning years and many in this group may be in a position to trade up. Many aren’t living in their ideally sized home. Just 38% said where they live now is dream sized. Nearly a majority (48%) said their dream home is larger, while only 14% of GenXers would rather have a smaller home.  This is the generation that bore the brunt of the foreclosure crisis. So, some of this mismatch could be because a significant number of GenXers lost homes during the housing bust and may now be living in smaller-than-desired quarters. But a much more probable reason is that many GenXers are in their peak child-rearing years. With kids bouncing off the walls, the place may be feeling a tad crowded.

Even the groups that seem ripe for downsizing don’t want smaller homes

Of course, age doesn’t tell the whole story about why people might want to downsize. It could be that certain kinds of households, – such as those without children, and living in the suburbs or in affordable areas – might be more likely to live in larger homes than they need. But our survey shows that households in these categories are about twice as likely to want a larger than a smaller home. For those with kids especially, the desire to upsize is strong: 39% preferred a larger home versus 18% who liked a smaller home.  For those living in the suburbs, the disparity is even greater – 42% to 16%. And even among those living in the most affordable zip codes, where ideally-sized homes might be within the budgets of households, 40% of our respondents preferred larger homes versus 20% who said smaller.

Image 2

Are all households more likely to upsize than downsize?

At this point you might be asking, “Are there any types of households that want to downsize?” The answer is yes. But only one kind of household falls into this category – those living in homes larger than 3,200 square feet.  Of this group, 26% wanted to downsize versus 25% that wanted to upsize – a slight difference. But, when we looked overall at survey responses based on the size of current residence, households wanting a larger home kicked up as current home size went down. We can see this clearly when we divide households into six groups based on the size of the home they’re living in now. Among households living in 2,600-3,200 square foot homes, 37% prefer a larger home versus 16% a smaller home; in 2,000–2,600 square foot homes, its 34% to 18%; 38% to 18% in 1,400–2,000 square foot homes; 55% to 13% in 800–1,400 square foot homes; and 66% to 13% in homes less than 800 square feet. This makes intuitive sense.  Those living in the biggest homes are most likely to have gotten a home larger than their ideal size. And those in the smallest homes are probably the ones feeling most squeezed.

Image 3 (2)

The responses to our survey show significantly more demand for larger homes than for smaller ones. But the reality, of course, is that households must make tradeoffs between things like accessibility, amenities, and affordability when choosing what size homes to get. The “ideal” sized home for most Americans may be larger than where they’re living now. But that spacious dream home may not be practical.  As result, the mismatch between what Americans say they want and what best suits their circumstances may persist.

Chart Of The Day: Recession Dead Ahead?

By Tyler Durden

The chart below showing the annual increase, or rather, decrease in US factory orders which have now declined for 6 months in a row (so no one can’t blame either the west coast port strike or the weather) pretty much speaks for itself, and also which way the US “recovery” (whose GDP is about to crash to the 1.2% where the Atlanta Fed is modeling it, or even lower is headed.

https://i0.wp.com/www.zerohedge.com/sites/default/files/images/user5/imageroot/2015/03/Factory%20Orders%20YY.jpg

As the St Louis Fed so kindly reminds us, the two previous times US manufacturing orders declined at this rate on an unadjusted (or adjusted) basis, the US economy was already in a recession.

https://i0.wp.com/www.zerohedge.com/sites/default/files/images/user5/imageroot/2015/03/fed%20recession%20NSA.jpg

And now, time for consensus to be shocked once again when the Fed yanks the rug from under the feet of the rite-hike-istas.

How The Baltic Dry Index Predicted 3 Market Crashes: Will It Do It Again?

Summary

  • The BDI as a precursor to three different stock market corrections.
  • Is it really causation or is it correlation?
  • A look at the current level of the index as it hits new lows.
 by Jonathan Fishman

The Baltic Dry Index, usually referred to as the BDI, is making historical lows in recent weeks, almost every week.

The index is a composition of four sub-indexes that follow shipping freight rates. Each of the four sub-indexes follows a different ship size category and the BDI mixes them all together to get a sense of global shipping freight rates.

The index follows dry bulk shipping rates, which represent the trade of various raw materials: iron, cement, copper, etc.

The main argument for looking at the Baltic Dry Index as an economic indicator is that end demand for those raw materials is tightly tied to economic activity. If demand for those raw materials is weak, one of the first places that will be evident is in shipping prices.

The supply of ships is not very flexible, so changes to the index are more likely to be caused by changes in demand.

Let’s first look at the three cases where the Baltic Dry Index predicted a stock market crash, as well as a recession.

1986 – The Baltic Dry Index Hits Its first All-time Low.

In late 1986, the newly formed BDI (which replaced an older index) hit its first all-time low.

Other than predicting the late 80s-early 90s recession itself, the index was a precursor to the 1987 stock market crash.

(click to enlarge)

1999 – The Baltic Dry Index Takes a Dive

In 1999, the BDI hit a 12-year low. After a short recovery, it almost hit that low point again two years later. The index was predicting the recession of the early 2000s and the dot-com market crash.

(click to enlarge)

2008 – The Sharpest Decline in The History of the BDI

In 2008, the BDI almost hit its all-time low from 1986 in a free fall from around 11,000 points to around 780.

(click to enlarge)

You already know what happened next. The 2008 stock market crash and a long recession that many parts of the global economy is still trying to get out of.

Is It Real Causation?

One of the pitfalls that affects many investors is to confuse correlation and causation. Just because two metrics seem to behave in a certain relationship, doesn’t tell us if A caused B or vice versa.

When trying to navigate your portfolio ahead, correctly making the distinction between causation and correlation is crucial.

Without doing so, you can find yourself selling when there is no reason to, or buying when you should be selling.

So let’s think critically about the BDI.

Is it the BDI itself that predicts stock market crashes? Is it a magical omen of things to come?

My view is that no. The BDI is not sufficient to determine if a stock market crash is coming or not. That said, the index does tells us many important things about the global economy.

Each and every time the BDI hit its lows, it predicted a real-world recession. That is no surprise as the index follows a fundamental precursor, which is shipping rates. It’s very intuitive; as manufacturers see demand for end products start to slow down, they start to wind-down production and inventory, which immediately affects their orders for raw materials.

Manufacturers are the ultimate indicator to follow, because they are the ones that see end demand most closely and have the best sense of where it’s going.

But does an economic slowdown necessarily bring about a full-blown market crash?

Only if the stock market valuation is not reflecting that coming economic downturn. When these two conditions align, chances are a sharp market correction is around the corner.

2010-2015 – The BDI Hits All-time Low, Again

In recent weeks, the BDI has hit an all-time low that is even lower than the 1986 low point. That comes after a few years of depressed prices.

(click to enlarge)

Source: Bloomberg

What does that tell us?

  1. The global economy, excluding the U.S., is still struggling. Numerous signs for that are the strengthening dollar, the crisis in Russia and Eastern Europe, a slowdown in China, and new uncertainties concerning Greece.
  2. The U.S. is almost the sole bright spot in the landscape of the global economy, although it’s starting to be affected by the global turmoil. A strong dollar hits exporters and lower oil prices hit the American oil industry hard.

Looking at stock prices, we are at the peak of a 6-year long bull market, although earnings seem to be at all-time highs as well.

(click to enlarge)

Source: Yardeni

What the BDI might tell us is that the disconnect between the global economy’s struggle and great American business performance across the board might be coming to an end.

More than that, China could be a significant reason for why the index has taken such a dive, as serious slowdowns on the real-estate market in China and tremendous real estate inventory accumulation are disrupting the imports of steel, cement and other raw materials.

Conclusion

The BDI tells us that a global economic slowdown is well underway. The source of that downturn seems to be outside of the U.S., and is more concentrated in China and the E.U.

The performance of the U.S. economy can’t be disconnected from the global economy for too long.

The BDI is a precursor for recessions, not stock market crashes. It’s not a sufficient condition to base a decision upon, but it’s one you can’t afford to ignore.

Going forward, this is a time to make sure you know the companies you invest in inside and out, and make sure end demand for their products is bound for continued growth and success despite overall headwinds.

We Live In An Era Of Dangerous Imbalances

by Tyler Durden

The intervention by the world’s central banks has resulted in today’s bizarro financial markets, where “bad news is good” because it may lead to more (sorry, moar) thin-air stimulus to goose asset prices even higher.

The result is a world addicted to debt and the phony stimulus now essential to sustaining it. In the process, a tremendous wealth gap has been created, one still expanding at an exponential rate.

History is very clear what happens with dangerous imbalances like this. They correct painfully. Through class warfare. Through currency crises. Through wealth destruction.

Is that really the path we want? Because we’re for sure headed for it.

Global Capital Will Continue to Flow into Real Estate in 2015

Global Capital to Continue to Flow into Real Estate in 2015
By Michael Gerrity
According to LaSalle Investment Management’s new 2015 Investment Strategy Annual (ISA) report, money will continue to flow into real estate from across the capital markets worldwide, but investors should be increasingly concerned about getting caught late in the cycle and should anticipate  the next cyclical downturn in a few years.
 
ISA report states that different regions of the world will be growing at different speeds in 2015, investors need to prepare their portfolios for world where interest rates begin to rise more quickly in some parts than others.
 
Jacques Gordon, LaSalle’s Global Head of Research and Strategy said, “Where we are in the real estate cycle is one of the most commonly asked questions of real estate investment managers and with good reason. Investors are concerned about what might happen if capital markets turn away from property.  Timing strategies are difficult to apply to a relatively illiquid asset class like real estate. Nevertheless, adjusting portfolios as assets and markets move through their respective cycles can improve performance by enhancing returns and reducing risk.”ISA Investor Advice Includes:

  • Diversify their holdings across a number of countries that are in different stages of the capital market cycle.
  • Anticipate different interest rate environments by allocating to real estate assets with income streams that keep pace with rising inflation or debt costs in growing economies like the U.K or the U.S. Also, focus on high quality properties and locations in markets where growth/interest rates will stay “lower for longer”, such as Japan or Western Europe.
  • Invest in secular trends, rather than cyclical ones, that will be less exposed to a downturn. The ISA found that investments linked to Demographics, Technology and Urbanization (DTU) – first identified last year – are likely to be key in helping investors to identify such trends.
  • Continue to place a high emphasis on sustainability factors, like energy efficiency and recycling, when buying, improving and operating buildings. Tenants and the capital markets will be paying much more attention to environmental standards in the years ahead.

Gordon also noted that markets around the world are at very different stages in terms of market fundamentals and capital markets, and hence future performance. Thus, it makes sense to have an investment program that takes advantage of real estate cycles. Examples of cycle-sensitive strategies include: Harvesting gains and selling properties in frothy capital markets, taking advantage of higher levels of leasing/rental growth in growth markets, and focusing on locations/sectors that are positioned to qualify as mainstream “core” assets in a few years.
 
Other themes for 2015 identified by the ISA include:

  • Money is likely to continue to flow into real estate as long as the yields on property continue to offer a premium to investment-grade bonds.
  • The debt markets are also embracing real estate, although lending is not yet as aggressive as it was during the peak of the credit bubble.
  • Taken together, this is likely to keep pushing prices up, while continuing to lower the expected future returns on real estate.
  • It could also lead to an escalation in new development. After many years of low levels of new construction in nearly all G-20 countries, most major markets can easily absorb moderate additions to inventory without creating an oversupply problem.


Key Trends in The United States

 
Overall, North America is in a good position for 2015 with healthy real estate markets and economic growth. Despite global headwinds, the U.S. economy and real estate markets will improve at a faster pace over the next three years, a welcome trend after five years of below average recovery. Capital flows to real estate will remain very strong next year, with overall real estate transaction levels close to or surpassing the pre-recession peak. Both equity and debt will be plentiful, and lenders will become increasingly aggressive in deploying capital.
 
In addition, occupancy rates will continue to improve for industrial, retail and most notably office in 2015. However, occupancy rates will be stable in the apartment sector as new supply matches demand, while rental rates in select markets such as San Francisco, New York City and Portland will outpace the national average.
 
The Investment Strategy Annual also predicts that many firms will be willing to pay higher rents in 2015 for properties located in Central Business Districts, because these locations greatly improve the ability to recruit talented Millennials. Moreover, E-commerce will continue to take market share in the retail sector, although new fashion trends, convenience, services, and out-of-home dining will keep the best shopping centers full and able to raise rents. Urban retail will continue to outperform due to strong tenant demand and little new supply.
 
Key Trends in Canada
 
The Investment Strategy Annual predicts that Canada’s near-term economic growth in 2015 will trail the United States, yet remain ahead of most other G7 countries. While slower global growth could impact demand in Canada’s resources sector, improvement in the U.S. economy will benefit Canada in the form of stronger export volumes in 2015 and beyond. Private consumption is forecast to grow more slowly in 2015 given elevated housing prices and high household debt levels. Stronger business investment and government expenditures should partially offset this.
 
Growth in the Alberta oil sands will slow in 2015 as oil prices face downward pressure and U.S. production escalates. However, traditional oil and gas drilling is re-emerging as fracking technology improves and pipeline expansion delays have been alleviated by significant growth in rail transport. Consequently, economic growth and real estate demand in cities in Western Canada will continue to outpace the nation.
 
In addition, e-commerce adoption will continue to grow as a share of overall retail trade and drive further changes among retailers and distribution chains in Canada. Retailers with a proven, established e-commerce platform will grow at the expense of those with less efficient or no models.
 
Key Trends in Mexico
 
Given its close links to the U.S., Mexico’s economy should outperform many other emerging markets in 2015 and beyond. Economic growth should accelerate in 2015, led by export-oriented manufacturing. In addition, the negative effects of the 2014 tax reforms will fade out and the government will implement a more expansive fiscal policy for large infrastructure projects.

Falling Oil Prices Threaten Houston Building Boom

One-Sixth of U.S. Office Space Under Construction Is Here, but Need Is Waning

Construction giant Skanska AB is developing two office buildings in Houston’s “Energy Corridor.” The one that is nearly complete is mostly leased; the other building doesn’t yet have any tenants. Photo: Michael Stravato for Wall Street Journal. Article by Eliot Brown

HOUSTON—The jagged skyline of this oil-rich city is poised to be the latest victim of falling crude prices.

As the energy sector boomed in recent years, developers flocked to Houston, so much so that one-sixth of all the office space under construction in the entire U.S. is in the metropolitan area of the Texas city.

But now, the need for more offices is drying up, thanks to a drop in oil prices that has spun energy companies from an outlook of optimism and growth to anxiety and cutbacks. Oil prices have fallen by more than 50% since June.

Demand for office space is “going to basically stop,” said Walter Page, director of office research at property data firm CoStar Group Inc. “It hurts a lot more when you have a lot of construction.”

By the end of 2014, construction had started on about 80 buildings with about 18 million square feet of office space in the greater Houston area, according to CoStar. Many of the buildings were planned or started when oil was above $100 a barrel. On Tuesday, oil futures traded around $50. The amount under construction is equal to Kansas City, Mo.’s entire downtown office market and is 16% of all U.S. office development under way.

The rush of building has created thousands of jobs—not only at building sites, but also at window manufacturers, concrete companies and restaurants that feed the workers.

But just as the wave of office-space supply approaches, energy companies, including Halliburton Co. , Baker Hughes Inc., Weatherford International and BP PLC, have collectively announced that more than 23,000 jobs would be cut, with many of them expected to be in Houston.

Fewer workers, of course, means less need for office space. Employers have rushed to sublease space in recent months, with 5.2 million square feet of space on the market as of last month, up about 1 million square feet from mid-2014, according to brokerage firm Savills Studley. BP, for example, is trying to sublet 240,000 square feet of space at its campus in the Westlake neighborhood, which represents about 11% of BP’s space at the campus, according to CoStar. A BP spokesman said the company is “consolidating” its footprint.

Conditions could improve if oil prices rise. The International Energy Agency on Tuesday said oil companies’ recent cutbacks in production will likely slow the growth of U.S. oil output, which in turn would lead to a rebound in prices.

But the current building boom is Houston’s biggest since the 1980s, when an oil bust, coupled with a rash of empty skyscrapers, made Houston a national symbol of overbuilding. Then, armed with debt from a banking sector eager to lend, developers brought a tidal wave of building to Houston, in some years increasing the office stock by well over 10%. Vacancy rates shot up past 30% from single digits, property values plummeted and landlords defaulted on mortgages.

That contributed to a wave of failures for banks stuffed with commercial-property loans. More than 425 Texas institutions between 1980 and 1989 failed, including nine of the state’s 10 largest banks.

Few are predicting a shock near that scale this time. Even if oil prices stay low, the local economy is more diversified than in the 1980s with sectors such as health care and higher education comprising a larger share of the workforce. In addition, new construction represents about 6.3% all the area’s total office stock, and there is far less speculative construction done before a tenant is signed up.

“Everybody here in Houston is waiting to exhale,” said Michael Scheurich, chief executive of general contractor Arch-Con Corp., which currently is building two midsize office projects in the area. Mr. Scheurich said his company has grown to about 80 employees from fewer than 25 in 2011 amid the construction boom. Now he is hoping the local economy will have “a soft landing.”

Still, cranes abound throughout Houston, thanks to publicly traded real-estate companies, pension funds and other interests like Swedish construction giant Skanska AB, which are funding construction without as much reliance on debt as in the 1980s.

Everybody here in Houston is waiting to exhale.

—Michael Scheurich, chief executive at Arch-Con Corp.


Running west from the downtown along Interstate 10, numerous midsize construction projects aimed at the “upstream” companies focused on energy extraction are being built in the so-called Energy Corridor.

Analysts say this shows how the sector is highly susceptible to booms and busts because of the long lag time between when buildings are started and when they are delivered, compounded by the tendency of developers and financiers to start projects en masse, late in cycles.

Developers are often victims of “herding and group think,” said Rachel Weber, an urban planning professor at the University of Illinois at Chicago who is writing a book about office over development in Chicago. “There is a sense that if everybody is moving in the same direction and acting the same way, that you do better to mimic that kind of behavior.”

Many of those building are bracing for a sting in the short-term. It could be even more painful if oil prices stay low.

It “is going to be a soft year—it’s hard not to see that,” said Mike Mair, an executive vice president in charge of Houston-area development for Skanska. The company is putting the finishing touches on a new 12-story tower in the Energy Corridor that is 62% leased. Construction is under way on a nearly identical building next door for which it doesn’t have any tenants.

Still, Mr. Mair said he believes in the city’s economic strength in the mid- and long-term, giving him confidence to finish work on the second tower. “I’m not afraid of ’16 and ’17,” he said.

Of course, higher vacancy rates would mean lower rents, which is good for anyone signing a lease. Rents at top-quality buildings averaged $34.51 a square foot at the end of 2014, up about 15% from early 2012, according to CoStar. But brokers say landlord incentives have grown, and rents typically follow the direction of oil prices, with a lag of one or two quarters. Still, the rents are a bargain compared with other major cities such as New York, where top-quality offices rent for an average $59 a square foot.

The city of Houston, for one, could be a beneficiary of lower rents. The government had been planning to build a new police department headquarters at an estimated cost of between $750 million and $1 billion.

Late last month, the mayor’s office said it was examining the possibility of leasing the building that Exxon Mobil is leaving, which would cost far less than the city’s original plan.

Inaccurate Zillow ‘Zestimates’ A Source Of Conflict Over Home Prices

https://i0.wp.com/ei.marketwatch.com/Multimedia/2013/05/14/Photos/ME/MW-BC704_zillow_20130514170200_ME.jpg

By Kenneth R. Harney

When “CBS This Morning” co-host Norah O’Donnell asked the chief executive of Zillow recently about the accuracy of the website’s automated property value estimates — known as Zestimates — she touched on one of the most sensitive perception gaps in American real estate.

Zillow is the most popular online real estate information site, with 73 million unique visitors in December. Along with active listings of properties for sale, it also provides information on houses that are not on the market. You can enter the address or general location in a database of millions of homes and probably pull up key information — square footage, lot size, number of bedrooms and baths, photos, taxes — plus a Zestimate.

Shoppers, sellers and buyers routinely quote Zestimates to realty agents — and to one another — as gauges of market value. If a house for sale has a Zestimate of $350,000, a buyer might challenge the sellers’ list price of $425,000. Or a seller might demand to know from potential listing brokers why they say a property should sell for just $595,000 when Zillow has it at $685,000.

Disparities like these are daily occurrences and, in the words of one realty agent who posted on the industry blog ActiveRain, they are “the bane of my existence.” Consumers often take Zestimates “as gospel,” said Tim Freund, an agent with Dilbeck Real Estate in Westlake Village. If either the buyer or the seller won’t budge off Zillow’s estimated value, he told me, “that will kill a deal.”

Back to the question posed by O’Donnell: Are Zestimates accurate? And if they’re off the mark, how far off? Zillow CEO Spencer Rascoff answered that they’re “a good starting point” but that nationwide Zestimates have a “median error rate” of about 8%.

Whoa. That sounds high. On a $500,000 house, that would be a $40,000 disparity — a lot of money on the table — and could create problems. But here’s something Rascoff was not asked about: Localized median error rates on Zestimates sometimes far exceed the national median, which raises the odds that sellers and buyers will have conflicts over pricing. Though it’s not prominently featured on the website, at the bottom of Zillow’s home page in small type is the word “Zestimates.” This section provides helpful background information along with valuation error rates by state and county — some of which are stunners.

For example, in New York County — Manhattan — the median valuation error rate is 19.9%. In Brooklyn, it’s 12.9%. In Somerset County, Md., the rate is an astounding 42%. In some rural counties in California, error rates range as high as 26%. In San Francisco it’s 11.6%. With a median home value of $1,000,800 in San Francisco, according to Zillow estimates as of December, a median error rate at this level translates into a price disparity of $116,093.

Some real estate agents have done their own studies of accuracy levels of Zillow in their local markets.

Last July, Robert Earl, an agent with Choice Homes Team in the Charlottesville, Va., area, examined selling prices and Zestimates of all 21 homes sold that month in the nearby community of Lake Monticello. On 17 sales Zillow overestimated values, including two houses that sold for 61% below the Zestimate.

In Carlsbad, Calif., Jeff Dowler, an agent with Solutions Real Estate, did a similar analysis on sales in two ZIP Codes. He found that Zestimates came in below the selling price 70% of the time, with disparities ranging as high as $70,000. In 25% of the sales, Zestimates were higher than the contract price. In 95% of the cases, he said, “Zestimates were wrong. That does not inspire a lot of confidence, at least not for me.” In a second ZIP Code, Dowler found that 100% of Zestimates were inaccurate and that disparities were as large as $190,000.

So what do you do now that you’ve got the scoop on Zestimate accuracy? Most important, take Rascoff’s advice: Look at them as no more than starting points in pricing discussions with the real authorities on local real estate values — experienced agents and appraisers. Zestimates are hardly gospel — often far from it.

kenharney@earthlink.net Distributed by Washington Post Writers Group.

Millennials Are Finally Entering The Home Buying Market

First-time buyers Kellen and Ben Goldsmith are shown in their new town home, which they purchased for $620,000 in Seattle’s Eastlake neighborhood. (Ken Lambert / Tribune News Service.  Authored by Kenneth R. Harney

Call them the prodigal millennials: Statistical measures and anecdotal reports suggest that young couples and singles in their late 20s and early 30s have begun making a belated entry into the home-buying market, pushed by mortgage rates in the mid-3% range, government efforts to ease credit requirements and deep frustrations at having to pay rising rents without creating equity.

Listen to Kathleen Hart, who just bought a condo unit with her husband, Devin Wall, that looks out on the Columbia River in Wenatchee, Wash.: “We were just tired of renting, tired of sharing with roommates and not having a place of our own. Finally the numbers added up.”

Erin Beasley and her fiance closed on a condo in the Capitol Hill area of Washington, D.C., in January. “With the way rents kept on going,” she said, “we realized it was time” after five years as tenants. “With renting, at some point you get really tired of it — you want to own, be able to make changes” that suit you, not some landlord.

Hart and Beasley are part of the leading edge of the massive millennial demographic bulge that has been missing in action on home buying since the end of the Great Recession. Instead of representing the 38% to 40% of purchases that real estate industry economists say would have been expected for first-timers, they’ve lagged behind in market share, sometimes by as much as 10 percentage points. But new signs are emerging that hint that maybe the conditions finally are right for them to shop and buy:

• Redfin, a national real estate brokerage, said that first-time buyers accounted for 57% of home tours conducted by its agents mid-month — the highest rate in recent years. Home-purchase education class requests, typically dominated by first-timers, jumped 27% in January over a year earlier. “I think it is significant,” Redfin chief economist Nela Richardson said. “They are sticking a toe in the water.”

• The Campbell/Inside Mortgage Finance HousingPulse Tracking Survey, which monthly polls 2,000 realty agents nationwide, reported that first-time buyer activity has started to increase much earlier than is typical seasonally. First-timers accounted for 36.3% of home purchases in December, according to the survey.

• Anecdotal reports from realty brokers around the country also point to exceptional activity in the last few weeks. Gary Kassan, an agent with Pinnacle Estate Properties in the Los Angeles area, says nearly half of his current clients are first-time buyers. Martha Floyd, an agent with McEnearney Associates Inc. Realtors in McLean, Va., said she is working with “an unusually high” number of young, first-time buyers. “I think there are green shoots here,” she said, especially in contrast with a year ago.

Assuming these early impressions could point to a trend, what’s driving the action? The decline in interest rates, high rents and sheer pent-up demand play major roles.

But there are other factors that could be at work. In the last few weeks, key sources of financing for entry-level buyers — the Federal Housing Administration and giant investors Fannie Mae and Freddie Mac — have announced consumer-friendly improvements to their rules. The FHA cut its punitively high upfront mortgage insurance premiums and Fannie and Freddie reduced minimum down payments to 3% from 5%.

Price increases on homes also have moderated in many areas, improving affordability. Plus many younger buyers have discovered the wide spectrum of special financing assistance programs open to them through state and local housing agencies.

Hart and her husband made use of one of the Washington State Housing Finance Commission’s buyer assistance programs, which provides second-mortgage loans with zero interest rates to help with down payments and closing costs. Dozens of state agencies across the country offer help for first-timers, often with generous qualifying income limits.

Bottom line: Nobody knows yet whether or how long the uptick in first-time buyer activity will last, but there’s no question that market conditions are encouraging. It just might be the right time.

kenharney@earthlink.net Distributed by Washington Post Writers Group. Copyright © 2015, LA Times

Millions of Boomerang Buyers Poised to Re-Enter Housing Market

Millions of Boomerang Buyers Poised to Re-Enter Housing Marketby WPJ

According to RealtyTrac, the first wave of 7.3 million homeowners who lost their home to foreclosure or short sale during the foreclosure crisis are now past the seven-year window they conservatively need to repair their credit and qualify to buy a home as we begin 2015.

In addition, more waves of these potential boomerang buyers will be moving past that seven-year window over the next eight years corresponding to the eight years of above-normal foreclosure activity from 2007 to 2014.

Potential-Boomerang-Buyers-Nationwide-1.png

“The housing crisis certainly hit home the fact that home ownership is not for everyone, but those burned during the crisis should not immediately throw the baby out with the bathwater when it comes to their second chance at home ownership,” said Chris Pollinger, senior vice president of sales at First Team Real Estate, covering the Southern California market which has more than 260,000 potential boomerang buyers. “Home ownership done responsibly is still one of the best disciplined wealth-building strategies, and there is much more data available for home buyers than there was five years ago to help them make an informed decision about a home purchase.”

  • Nearly 7.3 million potential boomerang buyers nationwide will be in a position to buy again from a credit repair perspective over the next eight years.
  • Markets with the most potential boomerang buyers over the next eight years among metropolitan statistical areas with a population of at least 250,000.
  • Markets with the highest rate of potential boomerang buyers as a percentage of total housing units over the next eight years among metro areas with at least 250,000 people.
  • Markets most likely to see the boomerang buyers materialize are those where there are a high percentage of housing units lost to foreclosure but where current home prices are still affordable for median income earners and where the population of Gen Xers and Baby Boomers — the two generations most likely to be boomerang buyers — have held steady or increased during the Great Recession.
  • There were 22 metros among those with at least 250,000 people where this trifecta of market conditions is in place, making these metros the most likely nationwide to see a large number of boomerang buyers materialize in 2015 and beyond.

Potential-Boomerang-Buyers-Nationwide-2.png

Potential-Boomerang-Buyers-Nationwide-3.png

Potential-Boomerang-Buyers-Nationwide-4.png


20 Stunning Facts About Energy Jobs In The US

https://i0.wp.com/www.paradinerecruiting.com/wp-content/uploads/2014/07/oil-jobs.jpgby Tyler Durden

For all those who think the upcoming carnage to the shale industry will be “contained” we refer to the following research report from the Manhattan Institute for Policy Research:

  • The United States is now the world’s largest and fastest-growing producer of hydrocarbons. It has surpassed Saudi Arabia in combined oil and natural gas liquids output and has now surpassed Russia, formerly the top producer, in natural gas. [ZH: that’s about to change]
  • The increased production of domestic hydrocarbons not only employs people directly but also radically reduces the drag on growth and job formation associated with America’s trade deficit.
  • As the White House Council of Economic Advisers noted this past summer: “Every barrel of oil or cubic foot of gas that we produce at home instead of importing abroad means more jobs, faster growth, and a lower trade deficit.” [the focus now is not on the oil produced at home, which is set to plunge, but the consumer “tax cut” from plunging oil prices]
  • Since 2003, more than 400,000 jobs have been created in the direct production of oil & gas and some 2 million more in indirect employment in industries such as transportation, construction, and information services associated with finding, transporting, and storing fuels from the new shale bounty.
  • All told, about 10 million Americans are employed directly and indirectly in a broad range of businesses associated with hydrocarbons.
  • There are 16 states with more than 150,000 people employed in hydrocarbon-related activities. Even New York, which continues to ban the production of shale oil & gas, is seeing job benefits in a range of support and service industries associated with shale development in adjacent Pennsylvania.

  • Direct employment in the oil & gas industry had been declining for 30 years but has recently reversed course, with the availability of new technologies to develop shale fields. Nearly 300,000 direct oil & gas jobs have been created following the 2003 nadir in that sector’s direct employment.
  • The five super-major oil companies—Exxon, BP, Chevron, Shell, Conoco—that operate in the U.S. account for only 10 percent of Americans working directly in the oil & gas business.
  • Meanwhile, more than 20,000 other firms are directly involved in the oil & gas industry, and they produce over 75 percent of America’s oil & gas output. The median independent oil & gas firm has fewer than 15 employees. (Note that these data exclude gasoline stations, which employ nearly 1 million people and are overwhelmingly owned by individuals or small businesses.)
  • As in the oil & gas industry, most Americans are employed by firms with fewer than 500 employees. Small businesses not only employ half of all American workers but also generate nearly half the nation’s economic output. Young firms tend to be small firms; and young firms tend to emerge disproportionately in areas of rapid growth or new opportunities—such as in and around America’s shale fields.

  • A broad array of small and midsize oil & gas companies are propelling record economic and jobs gains—not just in the oil fields but across the economy. The enormous expansion in employment, exports, and tax revenues from the domestic oil & gas revolution is largely attributable to a core and defining feature of America: small businesses.
  • The oil & gas sector boom creates “induced” and energy-related jobs. For every direct job, there are, on average, three jobs created in industries such as housing, retail, education, health care, food services, manufacturing, and construction.
  • In the 10 states at the epicenter of oil & gas growth, overall statewide employment gains have greatly outpaced the national average. There we see the ripple-out effect on overall (not just oil & gas) employment. The shale boom’s broad jobs benefits are most visible in North Dakota and Texas, of course, where overall state employment growth in all sectors has vastly outpaced U.S. job recovery. Similarly, in the other states that have experienced recent growth in hydrocarbon production—notably, Pennsylvania, Colorado, Louisiana, Oklahoma, Wyoming—statewide overall (again, not just oil & gas) employment growth has also outpaced the U.S. recovery.
  • In addition to the direct and induced jobs, America is beginning to see the economic and jobs impact of a renaissance in energy-intensive parts of the manufacturing sector, from plastics and chemicals to fertilizers. Examples include an Egyptian firm planning a $1 billion fertilizer plant in Iowa and a South Korean tire company with an $800 million plan for a Tennessee plant. Germany’s BASF recently announced expansion of its American investments, including production and research. BASF calculated that its German operations’ energy bill would be $700 million a year lower if it could pay American prices for energy
  • The Marcellus shale fields in Pennsylvania were responsible for enabling statewide double-digit job growth in 2010 and 2011 and now account for more than one-fifth of that state’s manufacturing jobs. For every $1 that the Marcellus industry spends in the state, $1.90 of total economic output is generated.
  • The typical wage effect of the oil & gas revolution is most clearly visible in Texas. In the 23 counties atop the Eagle Ford shale, average wages for all citizens have grown by 14.6 percent annually since 2005, compared with the 6.8 and 6.3 percent average for Texas and the U.S., respectively, over the same period. The top five counties in the Eagle Ford shale have experienced an average 63 percent annual rate of wage growth. These are the kinds of wage effects sought in every state and by every worker.

  • Given the persistent, slow job recovery from the Great Recession, there could not be a more important time in modern history to find ways to foster more small businesses of all kinds, given that they are not only the core engine for growth but also frequently grow rapidly.

Punchline #1:

  • The $300–$400 billion overall annual economic gain from the oil & gas boom has been greater than the average annual GDP growth of $200–$300 billion in recent years—in other words, the economy would have continued in recession if it were not for the unplanned expansion of the oil & gas sector.

Punchline #2:

  • Hydrocarbon jobs have provided a greater single boost to the U.S. economy than any other sector, without requiring any special taxpayer subsidies—instead generating tax receipts from individual incomes and business growth.

And the final punchline:

  • The National Association of Manufacturers estimated that the shale revolution will lead to 1 million manufacturing jobs over the coming decade. Manufacturing jobs pay nearly 30 percent more than the industrial average and generate $1.48 of economic activity for every $1 spent, making manufacturing the highest economic multiplier of all industrial sectors.

Sorry, not anymore.

Now, thanks to John Kerry’s “secret pact“, and America’s close “ally” in the middle-east, Saudi Arabia whose “mission” it no longer to bankrupt Russia but to crush America’s shale industry, the only question surround the only bright spot for America’s economy over the past 6 years is how long before most of the marginal producers file Chapter 11, or 7.

Texas: Recession In 2015?

https://i0.wp.com/i.imwx.com/web/news/2012/january/snow-txdrillrig-iwit-mlallison-440x297-010911.jpgby Josh Young

Summary

  • Texas is by far the largest producer of oil in the US.
  • Oil production represents a disproportionate portion of Texas’s economy.
  • With oil prices down 45%, oil’s share of Texas GDP may fall 50% or more.
  • Unlike Russia and other countries, Texas cannot depreciate its own currency, magnifying the economic effect.

Texas is the largest oil producer in the US. And oil prices are down almost 50% in the past 4 months. Yet nowhere in the news do we hear about the risk of Texas entering a recession. The facts and figures below should concern investors in securities with economic exposure to the Texas economy. The risk is real.

As seen in the below chart by the EIA, Texas is the largest oil producing state in the US, producing 3x as much oil as the next largest producing state.

In September, Texas produced 3.23 million barrels of oil per day. This compares to 1.1 million barrels of oil per day produced in the second largest oil producing state, North Dakota, and much smaller quantities by other traditional oil producing states such as Alaska, California, and Oklahoma. And by comparison, Russia produces 10.9 million barrels per day.

Quantifying the value of this production, at $100 oil, that would be $323 million worth of oil produced per day, or $118 billion of oil produced per year. With the current price of oil hovering around $55 per barrel, that same oil production is only worth $178 million per day, or $65 billion. This is a loss of $53 billion of oil sales revenue just in the state of Texas.

This $53 billion in lost revenues compares to Texas’s GDP of $1.4 trillion in 2013 – it would be 3.8% of the State’s GDP, which is now “missing” due to oil prices having fallen. This is only the direct loss to the state – the indirect loss is likely several times as much. Direct oilfield activity is slowing down dramatically, as oil producing companies cut their capital expenditure budgets for 2015. Oilfield services stocks (NYSEARCA:OIH) are already down 37% from their peak earlier this year in anticipation of an activity slowdown. And for every job lost on a rig or in an oil company’s office, there are several additional jobs that may be lost, from the gas station manager to the sales clerk at a store to the front desk worker at a hotel.

The oil industry is unusual in that both the upstream independent producers and the service companies tend to outspend their cash flow, typically on local (to Texas) goods and services, on everything from drill pipe to rig manufacturing to catering. This means that for every dollar of lost oil sales from the lower oil price, there may be several dollars less spent across the Texas economy. This could be devastating for the Texas economy, and has not yet been widely discussed in the financial media.

To see an extreme example of the impact of lower oil prices on an economy tied to oil production, we can look at Russia (NYSEARCA:RSX). The Russian economy is more oil dependent than Texas’s. Russia’s GDP was $2.1 trillion in 2013. This compares to Texas’s GDP of $1.4 trillion. So Russia produces 3.3x as much oil as Texas, but only has 1.5x the GDP. So on a direct basis, assuming “ceteris paribus” conditions, a $1 decline in the price of oil would have 2.2x the impact to the economy of Russia as to the economy of Texas.

So what is happening in Russia? Already, the ruble has dropped in value by 50% in the past year. And numerous sources are calling for a severe recession in 2015. This would be expected, considering the high portion of the GDP that is attributable to oil production.

However, Russia has an advantage that Texas does not have. It has its own currency. While a 50% drop in a currency may not sound great if you’re looking to spend that currency elsewhere, it is crucial if you are an exporter and your primary export just dropped in price by 45%. The ruble denominated impact of the drop in the price of oil is a mere 10%. Unfortunately, for Texas, the dollar denominated drop in oil is 45%. So despite the lower economic exposure to oil, Texas does not have the benefit of a falling currency to buffer the blow of lower oil prices.

It may get even worse. With less drilling activity, oil production growth in Texas may slow, and eventually may decline. Depending on the speed of this slowdown, Texas could even see production decline by the end of 2015. This is because most of the new production has been coming from fracking unconventional wells, which can decline in production by as much as 80% in the first year. Production growth has required an increasing number of wells drilled, and has been funded with 100% of oil company cash flow along with hundreds of billions of dollars of equity and debt over the past few years. With the recent crash in oil stock prices (NYSEARCA: XOP) and in oil company bonds (NYSEARCA: JNK), oil drillers may be forced to spend within cash flow, and that cash flow will be down at least 45% in 2015 if the oil price stays on the path projected in the futures market.

All of this means that in 2015, Texas oil wells could be producing less than the 3.23 million barrels of oil per day it was producing in September 2014, and their owners could be receiving 45% less revenue per barrel produced. Again applying an economic multiplier, the results could be devastating. And without the cushion of a weak currency that benefits countries like Russia, it is hard to see how Texas could avoid a recession in 2015 if the price of oil stays near its current low levels.

Remembering Christmas, 1776

https://i0.wp.com/en.academic.ru/pictures/enwiki/87/Washington_Crossing_the_Delaware_by_Emanuel_Leutze,_MMA-NYC,_1851.jpg

The American Revolution and its ultimate victory was hinged on a pivotal time in history, Christmas 1776, and it was all due to George Washington…

This Christmas, remember this lesson from history when Patriot George Washington gave the greatest Christmas present to the United States. The gift of hope. The gift of victory. The gift of America.

The Continental Army and the American Revolution was all but over in December 1776 and on the American side, despair and hopelessness were the order of the day.. The United States of America was finished.

It appeared that New York and New Jersey would be firmly back under King George’s “protection” within just a few months. They had already humiliated the Continentals out of New York, inflicting heavy damage on Washington’s army. The Continental Army was disintegrating. Unpaid, ill-equipped, cold, and hungry, soldiers in the Continental Army were deserting or walking away as soon as their enlistments expired.

There was no reason for the British to mess up their Christmas in 1776. Everything was going their way.

In those days, it was customary that armies rest and refit in the winter months in preparation for the campaign seasons of spring and summer. And the British were all about custom and tradition.

The situation was worse than grim for the Americans and the cause was all but over. Except for one man, that is – a man who refused to give up. George Washington.

In spite of countless setbacks and up against incredible odds, Washington never threw in the towel. He never gave up.

In a display of desperation and determination, on Christmas night 1776, General George Washington led the rag-tag Continental Army across the Delaware River to attack the outpost at Trenton, New Jersey.

Washington’s army commenced its crossing of the half-frozen river at three locations. The 2,400 soldiers led by Washington successfully braved the icy and freezing river and reached the New Jersey side of the Delaware just before dawn.

Washington’s force, separated into two columns, and reached the outskirts of Trenton. Trenton’s 1,400 defenders were groggy from the previous evening’s festivities and underestimated the Patriot threat after months of decisive British victories throughout New York. Washington’s men quickly overwhelmed their defenses, and surrounded the town. Several hundred escaped, and nearly 1,000 were captured at the cost of only four American lives.

It was a brilliant victory for George Washington – and a tremendous morale boost for the Americans. Within a few days, Washington followed up his victory with another at Princeton, and then quartered his troops at Morristown. The British were forced to redeploy in a way that gave up most of New Jersey and limited their reach in New York. It was a masterful campaign that stabilized the American Revolution and made victory possible.

The lesson learned…
Unconventional warfare, thinking outside the box, and a surprise attack when the enemy was most vulnerable – all made the difference in the ultimate victory. One battle, although itself not extremely significant, made all the difference for the eventual outcome. It boosted moral. It gave hope to those on the fence… You see, one person can make a difference. It could even be you…

“Houston, You Have A Problem” – Texas Is Headed For A Recession Due To Oil Crash, JPM Warns

https://i0.wp.com/i.qkme.me/3rq0zl.jpg
by
Tyler Durden

It was back in August 2013, when there was nothing but clear skies ahead of the US shale industry that we asked “How Much Is Oil Supporting U.S. Employment Gains?” The answer we gave:

The American Petroleum Institute said last week the U.S. oil and natural gas sector was an engine driving job growth. Eight percent of the U.S. economy is supported by the energy sector, the industry’s lobbying group said, up from the 7.7 percent recorded the last time the API examined the issue. The employment assessment came as the Energy Department said oil and gas production continued to make gains across the board. With the right energy policies in place, API said the economy could grow even more. But with oil and gas production already at record levels, the narrative over the jobs prospects may be failing on its own accord…. The API’s report said each of the direct jobs in the oil and natural gas industry translated to 2.8 jobs in other sectors of the U.S. economy. That in turn translates to a total impact on U.S. gross domestic product of $1.2 trillion, the study found.

Two weeks ago we followed up with an article looking at “Jobs: Shale States vs Non-Shale States” in which we showed the following chart:

And added the following:

According to a new study, investments in oil and gas exploration and production generate substantial economic gains, as well as other benefits such as increased energy independence.  The Perryman Group estimates that the industry as a whole generates an economic stimulus of almost $1.2 trillion in gross product each year, as well as more than 9.3 million permanent jobs across the nation. 

The ripple effects are everywhere. If you think about the role of oil in your life, it is not only the primary source of many of our fuels, but is also critical to our lubricants, chemicals, synthetic fibers, pharmaceuticals, plastics, and many other items we come into contact with every day. The industry supports almost 1.3 million jobs in manufacturing alone and is responsible for almost $1.2 trillion in annual gross domestic product. If you think about the law, accounting, and engineering firms that serve the industry, the pipe, drilling equipment, and other manufactured goods that it requires, and the large payrolls and their effects on consumer spending, you will begin to get a picture of the enormity of the industry.


Another way of visualizing the impact of the shale industry on the US economy comes courtesy of this chart from the Manhattan Institute which really needs no commentary:

The Institute had this commentary to add:

The jobs recovery since the 2008 recession has been the slowest of any post recession recovery in the U.S. since World War II. The number of people employed has yet to return to the 2007 level. The country has suffered a deeper and longer-lasting period of job loss than has followed any of the ten other recessions since 1945.

There has, however, been one employment bright spot: jobs in America’s oil & gas sector and related industries. Since 2003, more than 400,000 jobs have been created in the direct production of oil & gas and some 2 million more in indirect employment in industries such as transportation, construction, and information services associated with finding, transporting, and storing fuels from the new shale bounty.

In addition, America is seeing revitalized growth and jobs in previously stagnant sectors of the economy, from chemicals production and manufacturing to steel and even textiles because of access to lower cost and reliable energy.

The surge in American oil & gas production has become reasonably well-known; far less appreciated are two key features, which are the focus of this paper: the widespread geographic dispersion of the jobs created; and the fact that the majority of the jobs have been created not in the ranks of the Big Oil companies but in small businesses, even more widely dispersed.

Fast forward to today when we are about to learn that Newton’s third law of Keynesian economics states that every boom, has an equal and opposite bust.

Which brings us to Texas, the one state that more than any other, has benefited over the past 5 years from the Shale miracle. And now with crude sinking by the day, it is time to unwind all those gains, and give back all those jobs. Did we mention: highly compensated, very well-paying jobs, not the restaurant, clerical, waiter, retail, part-time minimum-wage jobs the “recovery” has been flooded with.

Here is JPM’s Michael Feroli explaining why Houston suddenly has a very big problem.

  • In less than five years Texas’ share of US oil production has gone from around 25% to over 40%
  • By some measures, the oil intensity of the Texas economy looks similar to what it was in the mid-1980s
  • The 1986 collapse in oil prices led to a painful regional recession in Texas
  • While the rest of the country looks to benefit from cheap oil, Texas could be headed for recession

The collapse in oil prices will create winners and losers, both globally and here in the US. While we expect the country, overall, will be a net beneficiary from falling oil prices, two states look like they will bear the brunt of the pain: North Dakota and Texas. Given its much larger size, the prospect of a recession in Texas could have some broader reverberations. 

By now, most people are familiar with the growth of the fossil fuel industry in places like Pennsylvania and Ohio. However, that has primarily been a natural gas story. The renaissance of US crude oil production has been much more concentrated: over 90% of the growth in the past five years has been in North Dakota and Texas; with Texas alone accounting for 67% of the increase in the nation’s crude output over that period.

In the first half of 1986, crude oil prices fell just over 50%. At the end of 1985, the unemployment rate in Texas was equal to that in the nation as a whole; at the end of 1986 it was 2.6%- points higher than the national rate. There are some reasons to think that it may not be as bad this time around, but there are even better reasons not to be complacent about the risk of a regional recession in Texas.

Geography of a boom

The well-known energy renaissance in the US has occurred in both the oil and natural gas sectors. Some states that are huge natural gas producers have limited oil production: Pennsylvania is the second largest gas producing state but 19th largest oil producer. The converse is also true: North Dakota is the second largest crude producer but 14th largest gas producer. However, most of the economic data as it relates to the energy sector, employment, GDP, etc, often lump together the oil and gas extraction industries. Yet oil prices have collapsed while natural gas prices have held fairly steady. To understand who is vulnerable to the decline in oil prices  specifically we turn to the EIA’s state-level crude oil production data.

The first point, mentioned at the outset, is that Texas, already a giant, has become a behemoth crude producer in the past few years, and now accounts for over 40% of US production. However, there are a few states for which oil is a relatively larger sector (as measured by crude production relative to Gross State Product): North Dakota, Alaska, Wyoming, and New Mexico. For two other states, Oklahoma and Montana, crude production is important, though somewhat less so than for Texas. Note, however, that these are all pretty small states: the four states where oil is more important to the local economy than Texas have a combined GSP that is only 16% of the Texas GSP. Finally, there is one large oil producer, California, which is dwarfed by such a huge economy that its oil intensity is actually below the national average, and we would expect it, like the country as a whole, to benefit from lower oil prices.

Texas-sized challenges

As discussed above, Texas is unique in the country as a huge economy and a huge oil producer. When thinking about the challenges facing the Texas economy in 2015 it may be useful, as a starting point, to begin with the oil price collapse of 1986. Then, like now, crude oil prices collapsed around 50% in the space of a few short months. As noted in the introduction, the labor market response was severe and swift, with the Texas unemployment rate rising 2.0%-points in the first three months of 1986 alone. Following the hit to the labor market, the real estate market suffered a longer, slower, burn, and by the end of 1988 Texas house prices were down over 14% from their peak in early 1986 (over the same period national house prices were up just over 14%). The last act of this tragedy was a banking crisis, as several hundred Texas banks failed, with peak failures occurring in 1988 and 1989.

How appropriate is it to compare the challenges Texas faces today to the ones they faced in 1986? The natural place to begin is by getting a sense of the relative energy industry intensity of Texas today versus 1986. Unfortunately, the GSP-by-industry data have a definitional break in 1997, but splicing the data would suggest a similar share of the oil and gas sector in Texas GSP now and in 1985: around 11%. Employment in the mining and logging sector (which, in Texas, is overwhelmingly dominated by the oil and gas sector) was around 3.7% in 1985 and is 2.7% now. This is consistent with a point we have been making in the national context: the oil and gas sector is very capital-intensive, and increasingly so. Even so, as the 1986 episode demonstrated, there do seem to be sizable multiplier effects on non-energy employment. Finally, there does not exist capital spending by state data, but at the national level we can see the flip side of the increasing capital intensive nature of energy: oil and gas related cap-ex was 0.58% of GDP in 4Q85, and is 0.98% of GDP now.

Given this, what is the case for arguing that this time is different, and the impact will be smaller than in 1986? One is that now, unlike in 1986, natural gas prices haven’t moved down in sympathy with crude oil prices, and the Texas recession in 1986 may have owed in part also to the decline in gas prices. Another is that, as noted above, the employment share is somewhat lower, and thus the income hit will be felt more by capital-holders – i.e. investors around the country and the world. Finally, unlike 1986, the energy industry is experiencing rapid technological gains, pushing down the energy extraction cost curve.

While these are all valid, they are not so strong as to signal smooth sailing for the Texas economy. Financially, oil is a fair bit more important than gas for Texas, both now and in 1986, with a dollar value two to three times as large. Moreover, while energy employment may be somewhat smaller now, we are not talking about night and day. The current share is about 3/4ths what it was in 1986. (Given the higher capital intensity, there are some reasons to think employment may be greater now in sectors outside the traditional oil and gas sectors, such as pipeline and heavy engineering construction).

As we weigh the evidence, we think Texas will, at the least, have a rough 2015 ahead, and is at risk of slipping into a regional recession. Such an outcome could bring with it the usual collateral damage that occurs in a slowdown. Housing markets have been hot in Texas. Although affordability in Texas looks good compared to the national average, it always does; compared to its own history, housing in some major Texas metro areas looks quite dear, suggesting a risk of a pull-back in the real estate market.

The national economy performed quite well in 1986, in spite of the Texas recession. We expect the US economy will perform well next year too , though some  regions – most notably Texas – could significantly under perform the national average.

* * *
So perhaps it is finally time to add that footnote to the “unambiguously good” qualified when pundits describe the oil crash: it may be good for everyone… except Texas which is about to enter a recession. And then Pennsylvania. And then North Dakota. And then Colorado. And then West Virginia. And then Alaska. And then Wyoming. And then Oklahoma. And then Montana, and so on, until finally we find just where the new equilibrium is following the exodus of hundreds of thousands of the best-paying jobs created during the “recovery” offset by minimum-wage waiters, bartenders, retail workers and temps.

BofA Analyst Credits Falling Oil Prices for Lower Mortgage Rates

https://i0.wp.com/www.syntheticoilchangeprice.com/wp-content/gallery/cheap-oil-change/cheap_oil_change_hero.jpgby Phil Hall

The precipitous drop in global oil prices has created a domino effect that led to a new decline in lower mortgage rates, according to a report by Chris Flanagan, a mortgage rate specialist at Bank of America Merrill Lynch.

“The oil collapse of 2014 appears to have been a key driver [in declining mortgage rates],” stated Flanagan in his report, which was obtained by CBS Moneywatch. “Further oil price declines could lead the way to sub-3.5 percent mortgage rates.”

Flanagan applauded this development, noting that the reversal of mortgage rates might propel housing to a stronger recovery.

“We have maintained the view that 4 percent mortgage rates are too high to allow for sustainable recovery in housing,” he wrote. Flanagan also theorized that if rates fell into 3.25 percent to 3.5 percent range, it would boost “supply from both refinancing and purchase mortgage channels.”

Flanagan’s report echoes the sentiments expressed by Frank Nothaft, Freddie Mac’s chief economist, who earlier this week identified the link between oil prices and housing.

“The recent drop in oil prices has been an unexpected boon for consumers’ pocketbooks and most businesses,” Nothaft stated. “Economic growth has picked up over the final nine months of 2014 and lower energy costs are expected to support growth of about 3 percent for the U.S. in 2015. Therefore we expect the housing market to continue to strengthen with home sales rising to their best sales pace in eight years, national house price indexes up, and rental markets continuing to display low vacancy rates and the highest level of new apartment completions in 25 years.”

But not everyone is expected to benefit from this development. A report issued last week by the Houston Association of Realtors forecast a 10 percent to 12 percent drop in home sales over the next year, owing to a potential slowdown in job growth for the Houston market’s energy industry if oil prices continue to plummet.

Why Cheap Oil May Be Here To Stay

https://i0.wp.com/m.wsj.net/video/20141212/121214table3/121214table3_1280x720.jpg
By
Kyle Spencer

Summary

  • Many investors are still skeptical that Saudi Arabia will hold firm on oil production.
  • Increased global consumption due to falling prices is unlikely to offset North American production.
  • US consumption is in a secular, structural decline due to increased efficiency and demographic changes. That’s unlikely to change any time soon.
  • The floor may not be where the Saudis think it is.

Investors are slowly waking up to the fact that Saudi Arabia is willing to take OPEC hostage to defend its market share, with Oil Minister Ali Al-Naimi declaring that –

In a situation like this, it is difficult, if not impossible, that the kingdom or OPEC would carry out any action that may result in a reduction of its share in market and an increase of others’ shares.

Alas, rather than embrace the cheap petroleum paradigm that has dominated most of the 20th century, many investors continue to cling to old shibboleths. Case in point: Brian Hicks, a portfolio manager at US Global Investors, recently noted that

The theme going into 2015 is mean reversion. Oil prices are below where they should be (emphasis mine), and hopefully they will start gravitating back to the equilibrium price of between $US80 and $US85 a barrel.

I emphasize the words “below where they should be” because the notion that oil (NYSEARCA:USO) prices belong somewhere – and it’s always higher, somehow – is the linchpin of the bullish thesis. But the question of why a high price regime should prevail over a low price regime is never satisfactorily explained.

Higher extraction costs? A sizable chunk of those costs are sunk costs that can simply be ignored in production decisions and lowering the effective breakeven price. A tighter focus on already drilled wells in areas with mature infrastructure could lower costs even further. Moreover, service sector costs fall as rigs are idled. Depleted reserves? Most resource-producing basins are experiencing an increasing yield over time despite the rapid depletion of individual wells. A lot of that is due to extraction efficiency, which is increasing at a phenomenal rate; in fact, one rig today brings on four times the amount of gas in the Barnett Shale than it did in 2006. Drill times in the Bakken are also falling, while new well production per rig is steadily rising since 2011.

Drill Times (Spud to Rig) 2004-2013

(SOURCE: ITG Research)

Technically oversold? Good luck catching that knife. Traders have been pounding the table on “oversold conditions” since $80. Proponents of the Oversold Hypothesis who like to point historical examples of oil’s extreme short-term volatility for validation are conveniently ignoring the vast number of counter-examples like this TIME Magazine headline from June, 1981, which almost reads as if it could have been written yesterday:

(Source: TIME Archives)

1981 is an intriguing date for another reason: It marked the first time in over a decade that Non-OPEC nations countries outproduced OPEC. Despite repeated cuts by OPEC, it took five years for capitulation to set in. Nor are lower prices guaranteed to lead to cuts. Indeed, when oil prices plummeted from $4/bbl to 35 cents in 1862, the Cleveland wildcatters didn’t idle their pumps; they pumped faster to pay the interest on their debt.

Don’t Iran and Venezuela require higher oil prices in order to balance their budgets and head off domestic upheaval? Please. The Saudis don’t care about Iran’s budget problems. Venezuela is a non-entity despite it’s immense reserves. In fact, Venezuela’s hell-in-a-handbasket status was one of the major reasons for Cuba’s recent defection to the US.

Asian stimulus? The only reason that Japanese consumers know that oil prices are lower is from Western news headlines. The share of a day’s wages to buy a single gallon of gas in Japan is 5.59% vs. 2.45% in the US. Nevertheless, the Japanese are riding high compared to the BRICS: In Brazil, it’s 17.62%; in Russia, 7.95%; in India it’s 114.92%; in China it’s 23.54%. Not the most fertile ground for a demand-side revolution; especially since oil is priced in dollars rather than yen, reals, rubles, or rupees.

What about the US? Won’t lower prices lead to higher consumption? Despite what you read about our “insatiable thirst” for oil, Americans don’t actually drink the stuff. Our machines do, and those machines are becoming more and more efficient due to CAFE standards and new transportation technologies, especially NGVs. Demographic changes are also leading a secular decline in consumption. Fig. 2 below highlights the steady march down for miles traveled per capita as the Baby Boomers retire to slower paced lives.

(Source: Citigroup, Census, CIRA)

The reality is that there’s little that an uptick in demand can do to offset oil’s continuing price collapse if the Saudis aren’t prepared to cut to the bone. The wildcatters certainly aren’t going to; on the contrary, they have every incentive (and no real alternative at this point) to pump like crazy to pay down debt and break OPEC’s back. Most doom and gloom prognostications for North American shale use full-cycle breakeven estimates like the ones presented in Figure 2.

Full-Cycle Breakeven Costs by Resource (Assuming Zero Efficiency Gains)

Unfortunately for the bulls, all-in sustaining cost (full-cycle capex) is a totally irrelevant metric for establishing a floor on commodity prices. Commodities prices are based on the marginal cost of production of the most prolific producers, not the full-cycle costs of marginal, high cost producers lopped in with the market leaders. As Seth Kleinman’s group at Citi has pointed out

…what counts at this stage is half-cycle costs, which are in the significantly lower band of $37 to $45 a barrel. This means that the floor is falling and may not be nearly as firm as the Saudi view assume(s).

Bank of America Sees $50 Oil As OPEC Dies

“Our biggest worry is the end of the liquidity cycle. The Fed is done. The reach for yield that we have seen since 2009 is going into reverse”, said Bank of America.

https://i0.wp.com/media0.faz.net/ppmedia/aktuell/wirtschaft/759001933/1.2727518/article_multimedia_overview/umweltpolitisch-hoch-umstritten-hilft-fracking-hier-in-colorado-amerika-dabei-unabhaengiger-von-den-opec-mitgliedern-zu-werden.jpgBy Ambrose Evans-Pritchard

The OPEC oil cartel no longer exists in any meaningful sense and crude prices will slump to $50 a barrel over the coming months as market forces shake out the weakest producers, Bank of America has warned.

Revolutionary changes sweeping the world’s energy industry will drive down the price of liquefied natural gas (LNG), creating a “multi-year” glut and a much cheaper source of gas for Europe.

Francisco Blanch, the bank’s commodity chief, said OPEC is “effectively dissolved” after it failed to stabilize prices at its last meeting. “The consequences are profound and long-lasting,“ he said.

The free market will now set the global cost of oil, leading to a new era of wild price swings and disorderly trading that benefits only the Mid-East petro-states with deepest pockets such as Saudi Arabia. If so, the weaker peripheral members such as Venezuela and Nigeria are being thrown to the wolves.

The bank said in its year-end report that at least 15pc of US shale producers are losing money at current prices, and more than half will be under water if US crude falls below $55. The high-cost producers in the Permian basin will be the first to “feel the pain” and may soon have to cut back on production.

The claims pit Bank of America against its arch-rival Citigroup, which insists that the US shale industry is far more resilient than widely supposed, with marginal costs for existing rigs nearer $40, and much of its output hedged on the futures markets.

Bank of America said the current slump will choke off shale projects in Argentina and Mexico, and will force retrenchment in Canadian oil sands and some of Russia’s remote fields. The major oil companies will have to cut back on projects with a break-even cost below $80 for Brent crude.

It will take six months or so to whittle away the 1m barrels a day of excess oil on the market – with US crude falling to $50 – given that supply and demand are both “inelastic” in the short-run. That will create the beginnings of the next shortage. “We expect a pretty sharp rebound to the high $80s or even $90 in the second half of next year,” said Sabine Schels, the bank’s energy expert.

Mrs Schels said the global market for (LNG) will “change drastically” in 2015, going into a “bear market” lasting years as a surge of supply from Australia compounds the global effects of the US gas saga.

If the forecast is correct, the LNG flood could have powerful political effects, giving Europe a source of mass supply that can undercut pipeline gas from Russia. The EU already has enough LNG terminals to cover most of its gas needs. It has not been able to use this asset as a geostrategic bargaining chip with the Kremlin because LGN itself has been in scarce supply, mostly diverted to Japan and Korea. Much of Europe may not need Russian gas at all within a couple of years.

Bank of America said the oil price crash is worth $1 trillion of stimulus for the global economy, equal to a $730bn “tax cut” in 2015. Yet the effects are complex, with winners and losers. The benefits diminish the further it falls. Academic studies suggest that oil crashes can ultimately turn negative if they trigger systemic financial crises in commodity states.

Barnaby Martin, the bank’s European credit chief, said world asset markets may face a stress test as the US Federal Reserve starts to tighten afters year of largesse. “Our biggest worry is the end of the liquidity cycle. The Fed is done and it is preparing to raise rates. The reach for yield that we have seen since 2009 is going into reverse”, he said.

Mr Martin flagged warnings by William Dudley, the head of the New York Fed, that the US authorities had tightened too gently in 2004 and might do better to adopt the strategy of 1994 when they raised rates fast and hard, sending tremors through global bond markets.

Bank of America said quantitative easing in Europe and Japan will cover just 35pc of the global stimulus lost as the Fed pulls back, creating a treacherous hiatus for markets. It warned that the full effect of Fed tapering had yet to be felt. From now on the markets cannot expect to be rescued every time there is a squall. “The threshold for the Fed to return to QE will be high. This is why we believe we are entering a phase in which bad news will be bad news and volatility will likely rise,” it said.

What is clear is that the world has become addicted to central bank stimulus. Bank of America said 56pc of global GDP is currently supported by zero interest rates, and so are 83pc of the free-floating equities on global bourses. Half of all government bonds in the world yield less that 1pc. Roughly 1.4bn people are experiencing negative rates in one form or another.

These are astonishing figures, evidence of a 1930s-style depression, albeit one that is still contained. Nobody knows what will happen as the Fed tries to break out of the stimulus trap, including Fed officials themselves.

Retail Disaster: Holiday Sales Crater by 11%, Online Spending Declines: NRF Blames Shopping Fiasco On “Stronger Economy”

Last year was bad. This year is an outright disaster.  By Tyler Durden

As we reported earlier using ShopperTrak data, the first two days of the holiday shopping season were already showing a -0.5% decline across bricks-and-mortar stores, following a “cash for clunkers”-like jump in early promotions which pulled demand forward with little follow through in the remaining shopping days. However, not even we predicted the shocker just released from the National Retail Federation, the traditionally cheery industry organization, which just reported absolutely abysmal numbers: sales during the four-day Thanksgiving holiday period crashed by a whopping 11% from $57.4 billion to $50.9 billion, confirming what everyone but the Fed knows by now: the US middle class is being obliterated, and that key driver of 70% of US economic growth is in the worst shape it has been since the Lehman collapse, courtesy of 6 years of Fed’s ruinous central planning. 

Demonstrating the sad state of America’s “economic dynamo”, shoppers spent an average only $380.95, down 6.4% from $407.02 a year earlier. In fact, as the NRF charts below demonstrate, there was a decline across virtually every tracked spending category (source):

As the WSJ reports, NRF’s CEO Matt Shay attributed the drop to a combination of factors, including the fact that retailers moved promotions earlier this year in attempt to get people out sooner and avoid what happened last year when people didn’t finish their shopping because of bad weather.

Also did we mention the NRF is perpetually cheery and always desperate to put a metric ton of lipstick on a pig? Well, hold on to your hats folks:

He also attributed the declines to better online offerings and an improving economy where “people don’t feel the same psychological need to rush out and get the great deal that weekend, particularly if they expected to be more deals,” he said.

And of course the sprint vs marathon comparisons, such as this one: “The holiday season and the weekend are a marathon not a sprint,” NRF Chief Executive Officer Matthew Shay said on a conference call. Odd how that metaphor is never used when the (seasonally-adjusted) sprint beats the marathoners.

So there you have it: a 11% collapse in retail spending has just been spun as super bullish for the US economy, whereby US consumers aren’t spending because the economy is simply too strong, and the only reason they don’t spend is because they will spend much more later. Or something.

Apparently the plunge in Americans who even care about bargains is also an indication of an economic resurgence:

The retail trade group said the number of people who went shopping over the four-day weekend declined by 5.2% to 134 million, from 141 million last year.

Finally, what we said earlier about a surge in online sales, well forget it – it was a lie based on the now traditional skewed perspectives from a few self-serving industry organizations:

Despite many retailers offering the same discounts on the Web as they offered in stores, the Internet didn’t attract more shoppers or more spending than last year. Online sales accounted for 42% of sales racked up over the four-day period, the same percentage as last year, though up from 26% in 2006, the trade group said.

In fact, it was worse: “Shoppers spent an average $159.55 online, down 10.2% from $177.67 last year.”

But the propaganda piece de resistance is without doubt the following:

“A highly competitive environment, early promotions and the ability to shop 24/7 online all contributed to the shift witnessed this weekend,” Mr. Shay said.

So to summarize: holiday sales plunged, and Americans refused to shop because the economy is “stronger than ever” and because Americans have the option of shopping whenever, which is why they didn’t shop in the first place. That, and of course plunging gasoline prices leading to… plunging retail sales, just as all the economists “correctly” predicted.

U.S. Median Home Price in October Increases to Highest Level Since September 2008, Still 19 Percent Below Peak

https://i0.wp.com/assets.urbanturf.com/dc/images/blog/2014/10/caphillhomesaleresize.jpg

– Price Appreciation Slowing in More than Half of Major U.S. Markets –
  – 20 Major Metros Reach New Post-Recession Price Peaks in 2013 or 2014 –
  – REO and Short Sales Down from a Year Ago, Foreclosure Auction Sales Increase –

IRVINE, Calif. – Nov. 26, 2014 — RealtyTrac® (www.realtytrac.com), the nation’s leading source for comprehensive housing data, today released its October 2014 Residential & Foreclosure Sales Report, which shows the median sales price of U.S. single family homes and condos in October was $193,000, up 2 percent from the previous month and up 16 percent from a year ago to the highest level since September 2008 — a 73-month high.

“This U.S. recovery is largely being driven by investors, and as the lower-priced, often distressed inventory most appealing to investors dries up in a given market, investor activity will slow down in that market and move to other markets with more ideal inventory available,” said Daren Blomquist, vice president at RealtyTrac. “This has created a ripple-effect recovery moving out from traditional investor hot spots such as Phoenix, Atlanta and many California markets and into markets such as Charlotte, Columbus, Ohio, Dallas and Oklahoma City.

“More than 32 percent of all single family homes and condos purchased so far in 2014 are non-owner occupied compared to 68 percent that are owner-occupied,” Blomquist added. “That is the highest share of investor purchases since we began tracking in 2001.”

The October median sales price — which included both distressed sales of homes in some stage of foreclosure and non-distressed sales — was up 37 percent from a trough of $141,000 in March 2012 but still 19 percent below the previous peak of $237,537 in August 2006. Among 97 metropolitan statistical areas with a population of 500,000 or more with sufficient home price data, 20 have reached new post-recession median sales price peaks in 2013 or 2014, including Denver, Pittsburgh, Columbus, Ohio, and Charlotte.

“Home prices have risen substantially in the lower price ranges — generally under $400,000.  That has led most underwater properties out of trouble,” said Phil Shell, Managing Broker of RE/MAX Alliance, covering the Denver market, where median home prices reached a new post-recession peak in July 2014.  “We are seeing a ‘compression’ in the market because we are experiencing record low inventories.  Prices on the low end are coming up, and while the high end is not necessarily coming down, it has flat-lined.  So we are seeing prices compress in the middle.  A homeowner wanting to move up into the market at $550,000 or above will find substantial value and a terrific opportunity.”
 
 The median sales price of distressed homes — those in the foreclosure process or bank-owned — was $128,701 nationwide in October, 36 percent below the median sales price of non-distressed properties, $200,000. But distressed home prices increased at a faster pace, up 18 percent from a year ago while non-distressed home prices were up 11 percent during the same time period.

“The demand is strong for a lessening distressed inventory and pushing prices to their highest level since 2008,” said Mike Pappas, CEO and president of the Keyes Company, covering the South Florida market. “Additionally, due to the long delay in our judicial foreclosure system we are now seeing a higher quality of distressed inventory being liquidated, although overall home prices have begun to gradually level off over the past few months as the market normalizes.”

Markets with highest home price appreciation
Among metro areas with a population of 500,000 or more and sufficient home price data, those with the biggest annual increase in median sales price were Toledo, Ohio (up 33 percent), Detroit (up 27 percent), Cleveland (up 21 percent), McAllen-Edinburg-Mission, Texas (up 21 percent), and Dayton, Ohio (up 20 percent).

Other major markets with double-digit appreciation compared to a year ago included Memphis, Tenn. (up 18 percent), Austin, Texas (up 17 percent), Miami (up 16 percent), Houston (up 16 percent), Cincinnati (up 15 percent), and Chicago (up 15 percent).

“While price appreciation has leveled off month to month, home prices have increased significantly from a year ago and we expect this trend to continue,” said Craig King, COO of Chase International, covering the Lake Tahoe and Reno, Nev., markets.  The median sales price in Reno was unchanged from September to October but up 15 percent from a year ago — the 29th consecutive month with a year-over-year increase in the market.

“A number of things have lined up regionally to provide game changing growth as we look forward,” continued King. “The world is aware that Tesla is making a move in to Northern Nevada with their Giga factory, but there are other huge projects on tap as well.  Collectively, these projects could account for population gains of 20 to 25 percent in the region over the next four to five years. With limited inventory the demand for housing will be unprecedented.”

Markets with accelerating home price appreciation
Home price appreciation accelerated in 45 of the 97 (46 percent) metro areas nationwide with a population of half a million or more and with sufficient home price data.

Markets with the fastest-accelerating appreciation included Cincinnati (15 percent annual appreciation this year compared to 4 percent annual depreciation last year), Cleveland (21 percent annual appreciation this year compared to 2 percent annual appreciation last year), Nashville (13 percent annual appreciation this year compared to 1 percent annual appreciation last year), Charlotte (10 percent annual appreciation this year compared to 1 percent annual depreciation last year), and Columbus, Ohio (14 percent annual appreciation this year compared to 3 percent annual appreciation last year.

Other major markets with accelerating home price appreciation were Chicago (15 percent annual appreciation this year compared to 11 percent a year ago), Dallas (11 percent annual appreciation this year compared to 7 percent a year ago), Pittsburgh (8 percent annual appreciation compared to 5 percent a year ago), Seattle (10 percent annual appreciation this year compared to 7 percent a year ago), Tampa (15 percent annual appreciation this year compared to 12 percent a year ago) and  Baltimore (2 percent annual appreciation this year compared to 0 percent a year ago).

“The continued rise in Seattle median home prices is largely a result of a strong local economy, low housing supply, and high buyer demand,” said OB Jacobi, president of Windermere Real Estate, covering the Seattle market. The percentage of distressed home sales in Seattle has returned to pre-mortgage crisis levels, with activity being driven by the hardships that have always instigated short sales, such as job loss, divorce, illness, and job relocation. Most of the distressed properties have shifted into the outlying areas around Seattle and are selling for well under the median home price.” 

Markets with slowing home price appreciation
Home price appreciation slowed compared to a year ago in 52 of the 97 (54 percent) metro areas nationwide with a population of half a million or more and with sufficient home price data.

Some of the fastest-appreciating markets in 2013 have seen substantial slowdowns in price appreciation this year, including Phoenix (6 percent annual appreciation in October 2014 compared to 25 percent a year ago), Los Angeles (9 percent annual appreciation this year compared to 24 percent a year ago), Oxnard-Thousand Oaks-Ventura in Southern California (7 percent annual appreciation this year compared to 24 percent a year ago), Jacksonville, Fla. (4 percent annual appreciation this year compared to 23 percent a year ago), Boston (3 percent annual appreciation this year compared to 21 percent a year ago), and San Diego (8 percent this year compared to 19 percent a year ago).

Other major markets with decelerating home price appreciation in October were New York (1 percent annual appreciation this year compared to 4 percent a year ago), Philadelphia (4 percent annual depreciation this  year compared to 5 percent annual appreciation a year ago), Houston (16 percent annual appreciation this year compared to 27 percent a year ago), Miami (16 percent annual appreciation this year compared to 20 percent a year ago), Atlanta (13 percent annual appreciation this year compared to 25 percent a year ago), and San Francisco (12 percent annual appreciation this year compared to 34 percent a year ago).

Las Vegas, Central California and Central Florida post highest distressed sale share
Short sales and distressed sales — in foreclosure or bank-owned — combined accounted for 13.8 percent of all residential property sales in October, up slightly from 13.7 percent the previous month, but down from 14.7 percent in October 2013.

Markets with the highest percentage of distressed and short sales combined were Las Vegas (33.6 percent), Stockton, Calif., (33.6 percent), Modesto, Calif., (31.7 percent), Lakeland, Fla., (28.9 percent), and Orlando (28.4 percent).

Short sales share close to pre-recession levels nationwide, up from a year ago in 12 states
Short sales accounted for 5.0 percent of all residential property sales in October, unchanged from the previous month and a year ago and not far above the pre-recession average of 4.5 percent a month in 2006.

Markets with the highest percentage of short sales were in Orlando (14.2 percent), Lakeland, Fla., (13.0 percent), Palm bay-Melbourne-Titusville, Fla., (11.8 percent), Cape Coral-Fort Myers, Fla., (11.8 percent), and Las Vegas (11.5 percent).

Twelve states saw an increase in short sales share compared to a year ago, including New Jersey (7.1 percent compared to 4.6 percent a year ago), Illinois (9.9 percent compared to 6.6 percent a year ago), Maryland (9.3 percent compared to 7.2 percent a year ago), Ohio (5.4 percent compared to 4.7 percent a year ago), Nevada (10.8 percent compared to 9.8 percent a year ago), California (4.6 percent compared to 4.3 percent a year ago), Michigan (6.5 percent compared to 6.2 percent a year ago) and Arizona (5.8 percent compared to 5.6 percent a year ago).

Bank-owned sales share matches lowest level since January 2011
Sales of bank-owned properties nationwide accounted for 7.5 percent of all U.S. residential sales in October, the same as previous month but down from 9.1 percent a year ago. The share of bank-owned sales in September and October was the lowest share since January 2011.

Markets with the highest percentage of bank-owned sales were in Stockton, Calif. (23.5 percent), Modesto, Calif., (19.3 percent), Bakersfield, Calif., (18.8 percent), Las Vegas (18.6 percent), Riverside-San Bernardino, Calif., (18.3 percent), and Phoenix (16.4 percent).

“Distressed sales remain a small percentage of the overall marketplace in Southern California as prices stabilize and market health continues to improve,” said Chris Pollinger, senior vice president of sales at First Team Real Estate, covering the Southern California market.

Foreclosure auction sales share increases most in Midwest, Rust Belt cities
Sales at the public foreclosure auction accounted for 1.3 percent of all U.S. residential property sales in October, up from 1.2 percent in September and up from 0.7 percent in October 2013.

Markets with the highest percentage of sales at foreclosure auction were Lakeland, Fla. (5.4 percent), Orlando (4.2 percent), Palm Bay-Melbourne-Titusville (4.1 percent), Miami (4.1 percent), Tampa (4.0 percent) and Las Vegas (3.5 percent).

Markets with the biggest annual increases in share of foreclosure auctions were Des Moines (1.9 percent compared to 0.1 percent a year ago), Akron, Ohio (2.1 percent compared to 0.1 percent a year ago), Philadelphia (1.9 percent compared to 0.1 percent a year ago), Chattanooga, Tenn., (1.3 percent compared to 0.1 percent a year ago), and Fresno, Calif., (0.9 percent compared to 0.1 percent a year ago).

Major metros with an annual increase in share of foreclosure auction sales included Dallas (1.8 percent compared to 0.4 percent a year ago), Cincinnati (1.2 percent compared to 0.3 percent a year ago), Columbus (3.0 percent compared to 0.7 percent a year ago), San Antonio (1.5 percent compared to 0.4 percent a year ago), Cleveland (2.2 percent compared to 0.6 percent a year ago), Houston (1.6 percent compared to 0.6 percent a year ago), Jacksonville, Fla., (3.5 percent compared to 1.4 percent a year ago), Oklahoma City (1.3 percent compared to 0.8 percent a year ago), Virginia Beach (1.4 percent compared to 0.8 percent a year ago), and Atlanta (2.3 percent compared to 3.3 percent a year ago).

Report methodology
The RealtyTrac U.S. Residential Sales Report provides counts and median prices for sales of residential properties nationwide, by state and metropolitan statistical areas with a population of 500,000 or more. Data is also available at the county level upon request. The report also provides a breakdown of short sales, bank-owned sales and foreclosure auction sales to third parties. The data is derived from recorded sales deeds and loan data, which is used to determine cash sales and short sales. Sales counts for recent months are projected based on seasonality and expected number of sales records for those months that are not yet available from public record sources but will be in the future given historical patterns. Statistics for previous months are revised when each new monthly report is issued as more deed data becomes available for those previous months.

Definitions
Residential property sales: sales of single family homes, condominiums/town homes, and co-ops, not including multi-family properties.

Annualized sales: an annualized estimate of the number of residential property sales based on the actual number of sales deeds received for the month, accounting for expected sales records for that month that will be received in future months as well as seasonality.

Distressed sales: sale of a residential property that is actively in the foreclosure process or bank-owned when the sale is recorded.

Distressed discount: percentage difference between the median distressed sales price and the median non-distressed sales price in a given geographic area.

Bank-Owned sales: sales of residential properties that have been foreclosed on and are owned by the foreclosing lender (bank).

Short sales: sales of residential properties where the sale price is below the combined total of outstanding mortgages secured by the property.

Foreclosure Auction sales: sale of a property at the public foreclosure auction to a third party buyer that is not the foreclosing lender.

Report License
The RealtyTrac U.S. Residential & Foreclosure Sales report is the result of a proprietary evaluation of information compiled by RealtyTrac; the report and any of the information in whole or in part can only be quoted, copied, published, re-published, distributed and/or re-distributed or used in any manner if the user specifically references RealtyTrac as the source for said report and/or any of the information set forth within the report.

Data Licensing and Custom Report Order
Investors, businesses and government institutions can contact RealtyTrac to license bulk foreclosure and neighborhood data or purchase customized reports. For more information contact our Data Licensing Department at 800.462.5193800.462.5193 or datasales@realtytrac.com.

About RealtyTrac
RealtyTrac is a leading supplier of U.S. real estate data, with nationwide parcel-level records for more than 129 million U.S. parcels that include property characteristics, tax assessor data, sales and mortgage deed records, Automated Valuation Models (AVMs) and 20 million active and historical default, foreclosure auction and bank-owned properties. RealtyTrac’s housing data and foreclosure reports are relied on by the Federal Reserve, U.S. Treasury Department, HUD, numerous state housing and banking departments, investment funds as well as millions of real estate professionals and consumers, to help evaluate housing trends and make informed decisions about real estate.

Media Contacts:
Jennifer von Pohlmann
949.502.8300949.502.8300, ext. 139
jennifer.vonpohlmann@realtytrac.com

Ginny Walker
949.502.8300949.502.8300, ext. 268
Ginny.walker@realtytrac.com

Data and Report Licensing:
800.462.5193800.462.5193
datasales@realtytrac.com

Housing Price Gains Slow For 9th Straight Month, Says S&P/Case-Shiller

https://i0.wp.com/www.fortunebuilders.com/wp-content/uploads/2014/11/detroit-housing-market-summary.jpgby Erin Carlyle

Growth in home sales prices continued to slow across the nation in September, marking nine straight months of deceleration, data from S&P/Case-Shiller showed Tuesday.

U.S. single-family home prices gained just 4.8% (on a seasonally-adjusted basis) over prices one year earlier, down from a 5.1% annual increase in August, the S&P/Case-Shiller National Home Price Index shows. The measure covers all nine Census divisions. Significantly, September also marked the first month that the National Index decreased (by 0.1%) on a month-over-month basis since November 2013.

“The overall trend in home price increases continues to slow down,” says David M. Blitzer, chairman of the Index Committee at S&P Dow Jones Indices. “The only region showing any sustained strength is the Southeast led by Florida; price gains are also evident in Atlanta and Charlotte.”

Price gains have been steadily slowing since December after a streak of double-digit annual price increases in late 2013 and early 2014. Eighteen of the 20 cities Case-Shiller tracks reported slower annual price gains in September than in August, with Charlotte and Dallas the only cities where annual price gains increased. Miami (10.3%) was the only city to report double-digit annual price gains.
CaseShiller

The chart above depicts the annual returns of the U.S. National, the 10-City Composite and the 20-City Composite Home Price Indices. The S&P/Case-Shiller U.S. National Home Price Index, which covers all nine U.S. census divisions, recorded a 4.8% annual gain in September 2014. The 10- and 20-City Composites posted year-over-year increases of 4.8% and 4.9%, compared to 5.5% and 5.6% in August.

National Index, year-over-year change in prices (seasonally adjusted):

June 2013: 9.2%
July 2013: 9.7%
August 2013: 10.2%
September 2013: 10.7%
October 2013: 10.9%
November 2013: 10.8%
December 2013: 10.8%
January 2014: 10.5%
February 2014: 10.2%
March 2014: 9.0%
April 2014: 8.0%
May 2014: 7.1%
June 2014: 6.3%
July 2014: 5.6%
August 2014: 5.1%
September 2014: 4.8%

“Other housing statistics paint a mixed to slightly positive picture,” Blitzer said. “Housing starts held above one million at annual rates on gains in single family homes, sales of existing homes are gaining, builders’ sentiment is improving, foreclosures continue to be worked off and mortgage default rates are at precrisis levels. With the economy looking better than a year ago, the housing outlook for 2015 is stable to slightly better.”

Blitzer is referring to a report last week that showed housing starts (groundbreakings on new homes) down 2.8% in October, but still at a stronger pace than one year earlier. What’s more, single-family starts showed a 4.2% increase over the prior month. Also, in October existing (or previously-owned) home sales hit their fastest pace in more than one year. (Both reports are one month ahead of the S&P/Case-Shiller report, the industry standard but unfortunately with a two-month lag time.) Taken together, the data suggest that the rapid price gains seen late last year and in the first part of this year are mostly behind us.

https://i0.wp.com/www.housingwire.com/ext/resources/images/editorial/Places/Phoenix.jpg

“The days of double-digit home value appreciation continue to rapidly fade away as more inventory comes on line, and the market is becoming more balanced between buyers and sellers,” said Stan Humphries, Zillow’s chief economist. “Like a perfectly prepared Thanksgiving turkey, it’s important for things to cool off a bit in the housing market, because too-fast appreciation risks burning both buyers and sellers. In this more sedate environment, buyers can take more time to find the right deal for them, and sellers can rest assured they won’t be left without a seat at the table when they turn around and become buyers. This slowdown is a critical step on the road back to a normal housing market, and as we approach the end of 2014, the housing market has plenty to be thankful for.”

As of September 2014, average home prices across the U.S. are back to their spring 2005 levels for the National Index (which covers 70% of the U.S. housing market), while both the 10-City and 20-City Composites are back to their autumn 2004 levels. For the city Composite indices, prices are still off their mid-summer 2006 peaks by about 15% to 17%. Prices have bounced back from their March 2012 lows by 28.8% and 29.6% for the 10-City and 20-City composites.

S&P/Case-Shiller is now releasing its National Home Price Index each month. Previously, it was published quarterly, while the 10-City and 20-City Composites were published monthly. The “July” numbers above for the National Index above reflect a roll-up of data for the three-month average of May, June and July prices.

Oil & Gas Stocks: ‘Stability At The Bottom’ May Be A Positive Sign

https://i0.wp.com/www.avidtrader.com/wordpress/wp-content/uploads/2012/10/oil_and_gas.jpgby Richard Zeits

Summary:

  • The article provides “correction scorecards” by stock and by group versus commodities.
  • In the past two weeks, oil & gas stocks firmed up, despite the continued slide in the price of oil.
  • Small- and mid-capitalization oil-focused E&Ps were the strongest winners.
  • Emerging markets Oil Majors and Upstream MLPs were the worst performers.

During the two weeks since my previous update, stocks in the Oil & Gas sector demonstrated what an optimist might interpret as “stability at the bottom.” The net effect of another sequence of high-amplitude intraday moves was a slight recovery from the two weeks ago levels across the vast majority of segments and stock groups, as shown on the chart below. It should be no surprise that those groups that had declined the most were also the biggest gainers in the past two weeks.

Most notable is the fact that the descend trend in the Oil & Gas stocks was interrupted (and even marginally reversed) in spite of the new lows posted by the price of oil. One could try to interpret this performance as an indication that the current price levels already discount the market’s fear that the oil price paradigm has shifted. This stability may also indicate that the wave of forced liquidations by hedge funds and in individual margin accounts has run its course and the worst part of this correction may be already behind us.

Even though this recent stock price “stability” is a welcome development, it provides little consolation to investors in the Oil & Gas sector who still see their positions trading far below the peak levels achieved last summer. The correction scorecard graph below summarizes average “peak-to-current” performance by individual stocks that are grouped together by sector and size. Individual stock performance is provided in full detail in the spreadsheets at the end of this note.

Mid- and small-capitalization stocks, in both Upstream and Oil Service segments, remain the worst performing groups, now trading at an average discount to each individual stock’s recent peak price of over 40%, a staggering decline. Large-capitalization E&P independents and large-capitalization oil service stocks are trading at a 20%-24% average discount.

Emerging Markets Oil Majors Post A Strong Decline:

Emerging markets Oil Majors were one of the worst performing categories during the past two weeks:

Petrobras (NYSE:PBR) continued to slide down, moving 12% down since my previous update. Petrobras stands out as one of the most disappointing Oil Majors in terms of stock performance in the past five years, having lost a staggering three-quarters of its value during that period. The company’s market capitalization currently stands at only $62 billion.

· Lukoil (OTCPK:LUKOY) and Petrochina (NYSE:PTR) are other examples of strong declines in the past two weeks, with the stocks losing 8% and 7%, respectively. Lukoil’s performance may in fact be interpreted as “solid,” given the continued deterioration of Russia’s political and credit risk.

A strong contrast is the performance of the three oil super-majors – Exxon (NYSE:XOM), Chevron (NYSE:CVX) and Shell (NYSE:RDS.A) – that gained ~2% during the past two weeks and remain the best performing group in the Oil & Gas sector. I have argued in my earlier notes that, given the combined $0.9 trillion market capitalization of these three stocks, the resilient performance by the Super-majors has effectively isolated the correction in the Oil & Gas sector from the broader markets. From a fundamental perspective, the Super-majors are characterized by very low financial leverage, high proportion of counter-cyclical production sharing contracts (“PSAs”) and the effective hedge from downstream assets, which limits their exposure to the oil price decline.

Small-Capitalization E&P Stocks Bounce Back:

After a dramatic underperformance, small- and mid-capitalization E&P stocks posted meaningful gains in the past two weeks. However, in most cases the recovery is “a drop in the bucket,” given that high-percentage moves are measured off price levels that sometimes are a fraction of recent peak prices. The sector remains a menu of bargains for those investors who believe in a recovery in oil prices.

  • Enerplus (NYSE:ERF): +20%
  • Northern Oil & Gas (NYSEMKT:NOG): +17%
  • Concho Resources (NYSE:CXO): +15%
  • Approach Resources (NASDAQ:AREX): +48%
  • Goodrich Petroleum (NYSE:GDP): +24%
  • Synergy Resources (NYSEMKT:SYRG): +15%
  • Penn Virginia (NYSE:PVA): +17%
  • Comstock Resources (NYSE:CRK): +25%

E&P MLPs Retreat:

Upstream MLPs were one of the exceptions in the E&P sector, declining by an average of 4% in the past two weeks. The largest Upstream MLP, Linn Energy (NASDAQ:LINE) and its sister entity LinnCo(NASDAQ:LNCO), are again trading close to their lows, after having enjoyed a strong bounce a month ago. The previously very wide gap in relative performance between Upstream MLPs and other Upstream equities has contracted substantially which, arguably, makes sense given that both categories of companies participate in the same business, irrespective of the corporate envelope.

Oil & Gas Sector Correction Scorecards:


The Cruel Injustice of the Fed’s Bubbles in Housing


by Charles Hugh Smith

As the generational war heats up, we should all remember the source of all the bubbles and all the policies that could only result in generational poverty: The Federal Reserve.

Federal Reserve chair Janet Yellen recently treated the nation to an astonishing lecture on the solution to rising wealth inequality–according to Yellen, low-income households should save capital and buy assets such as stocks and housing.

It’s difficult to know which is more insulting: her oily sanctimony or her callous disregard for facts. What Yellen and the rest of the Fed Mafia have done is inflate bubbles in credit and assets that have made housing unaffordable to all but the wealthiest households.

Fed policy has been especially destructive to young households: not only is it difficult to save capital when your income is declining in real terms, housing has soared out of reach as the direct consequence of Fed policies.

Two charts reflect this reality. The first is of median household income, the second is the Case-Shiller Index of housing prices for the San Francisco Bay Area.

I have marked the wage chart with the actual price of a modest 900 square foot suburban house in the S.F. Bay Area whose price history mirrors the Case-Shiller Index, with one difference: this house (and many others) are actually worth more now than they were at the top of the national bubble in 2006-7.

But that is a mere quibble. The main point is that housing exploded from 3 times median income to 12 times median income as a direct result of Fed policies. Lowering interest rates doesn’t make assets any more affordable–it pushes them higher.

The only winners in the housing bubble are those who bought in 1998 or earlier. The extraordinary gains reaped since the late 1990s have not been available to younger households. The popping of the housing bubble did lower prices from nosebleed heights, but in most locales price did not return to 1996 levels.

As a multiple of real (inflation-adjusted) income, in many areas housing is more expensive than it was at the top of the 2006 bubble.

While Yellen and the rest of the Fed Mafia have been enormously successful in blowing bubbles that crash with devastating consequences, they failed to move the needle on household income. Median income has actually declined since 2000.

Inflating asset bubbles shovels unearned gains into the pockets of those who own assets prior to the bubble, but it inflates those assets out of reach of those who don’t own assets–for example, people who were too young to buy assets at pre-bubble prices.

Inflating housing out of reach of young households as a matter of Fed policy isn’t simply unjust–it’s cruel. Fed policies designed to goose asset valuations as a theater-of-the-absurd measure of “prosperity” overlooked that it is only the older generations who bought all these assets at pre-bubble prices who have gained.

In the good old days, a 20% down payment was standard. How long will it take a young family to save $130,000 for a $650,000 house? How much of their income will be squandered in interest and property taxes for the privilege of owning a bubblicious-priced house?

If we scrape away the toxic sludge of sanctimony and misrepresentation from Yellen’s absurd lecture, we divine her true message: if you want a house, make sure you’re born to rich parents who bought at pre-bubble prices.

As the generational war heats up, we should all remember the source of all the bubbles and all the policies that could only result in generational poverty: The Federal Reserve.

How Low Can the Price of Oil Plunge?

https://i0.wp.com/www.gulf-times.com/NewsImages/2014/10/27/30d677e0-63da-4004-ac67-2ce174ec36a9.jpgby Wolf Richter

It is possible that a miracle intervenes and that the price of oil bounces off and zooms skyward. We’ve seen stocks perform these sorts of miracles on a routine basis, but when it comes to oil, miracles have become rare. As I’m writing this, US light sweet crude trades at $76.90 a barrel, down 26% from June, a price last seen in the summer of 2010.

But this price isn’t what drillers get paid at the wellhead. Grades of oil vary. In the Bakken, the shale-oil paradise in North Dakota, wellhead prices are significantly lower not only because the Bakken blend isn’t as valuable to refiners as the benchmark West Texas Intermediate, but also because take-away capacity by pipeline is limited. Crude-by-rail has become the dominant – but more costly – way to get the oil from the Northern Rockies to refineries on the Gulf Coast or the East Coast.

These additional transportation costs come out of the wellhead price. So for a particular well, a driller might get less than $60/bbl – and not the $76.90/bbl that WTI traded for at the New York Mercantile Exchange.

Fracking is expensive, capital intensive, and characterized by steep decline rates. Much of the production occurs over the first two years – and much of the cash flow. If prices are low during those two years, the well might never be profitable.

Meanwhile, North Sea Brent has dropped to $79.85 a barrel, last seen in September 2010.

So the US Energy Information Administration, in its monthly short-term energy outlook a week ago, chopped down its forecast of the average price in 2015: WTI from $94.58/bbl to $77.55/bbl and Brent from $101.67/bbl to $83.24/bbl.

Independent exploration and production companies have gotten mauled. For example, Goodrich Petroleum plunged 71% and Comstock Resources 58% from their 52-week highs in June while Rex Energy plunged 65% and Stone Energy 54% from their highs in April.

Integrated oil majors have fared better, so far. Exxon Mobil is down “only” 9% from its July high. On a broader scale, the SPDR S&P Oil & Gas Exploration & Production ETF (XOP) is down 28% from June – even as the S&P 500 set a new record.

https://i0.wp.com/maxspeak.net/wp-content/uploads/2014/08/34852468Rick-Santelli-380x190.jpg

So how low can oil drop, and how long can this go on?

The theory is being propagated that the price won’t drop much below the breakeven point in higher-cost areas, such as the tar sands in Canada or the Bakken in the US. At that price, rather than lose money, drillers would stop fracking and tar-sands operators would shut down their tar pits. And soon, supplies would tighten up, inventories would be drawn down, and prices would jump.

But that’s not what happened in natural gas. US drillers didn’t stop fracking when the price of natural gas plunged below the cost of production and kept plunging for years. In April 2012, it reached not a four-year low but a decade-low of about $1.90 per million Btu at the Henry hub. At the time, shorts were vociferously proclaiming that gas storage would be full by fall, that the remaining gas would have to be flared, and that the price would then drop to zero.

But drillers were still drilling, and production continues to rise to this day, though the low price also caused an uptick in consumption that coincided with a harsh winter, leaving storage levels below the five-year minimum for this time of the year.

The gas glut has disappeared. The price at the Henry hub has since more than doubled, but it remains below breakeven for many wells. And when natural gas was selling for $4/MM Btu at the Henry hub, it was selling for $2/MM Btu at the Appalachian hubs, where the wondrous production from the Marcellus shale comes to market. No one can make money at that price.

And they’re still drilling in the Marcellus.

Natural gas drillers had a cover: a well that also produced a lot of oil and natural gas liquids was profitable because they fetched a much higher price. But this too has been obviated by events: on top of the rout in oil, the inevitable glut in natural gas liquids has caused their prices to swoon too (chart).

Yet, they’re still drilling, and production is still rising. And they will continue to drill as long as they can get the moolah to do so. They might pick and choose where they drill, and they might back off a smidgen, but as long as they get the money, they’ll drill.

Money has been flowing into the oil and gas business like a tsunami unleashed by yield-desperate investors who, driven to near insanity by the Fed’s policies, do what the Fed has been telling them to do: close their eyes and hold their noses and disregard risk and hand over their money, and borrow money for nearly free and hand over that money too.

Oil and gas companies have issued record amounts of junk bonds. They’ve raised record amounts of money via a record number of IPOs. They’ve raised money by spinning off assets into publicly traded MLPs. They’ve borrowed from banks that then packaged these loans into securities that were then sold. The industry has taken this cheap money and has drilled it into the ground.

This is one of the consequences of the Fed’s decision to flood the land with free liquidity. When the cost of capital is near zero, and when returns on low-risk investments are near zero as well, or even below zero, investors go into a sort of coma. But when they come out of it and realize that “sunk capital” has taken on a literal meaning, they’ll shut off the spigot.

Only then will drilling and production decline. As with natural gas, it can take years. And as with natural gas, the price might plunge through a four-year low and hit a decade low – which would be near $40/bbl, a price last seen in 2009. The bloodletting would be epic. To see where this is going, watch the money.

https://i0.wp.com/www.independent.co.uk/incoming/article9783416.ece/alternates/w620/pg-58-oil-getty.jpg

OPEC Forecasts $110 Nominal Price Through End Of This Decade:

OPEC’s World Oil Outlook And Pivot To Asia

https://i0.wp.com/www.sweetcrudereports.com/wp-content/uploads/2013/06/OPEC-conference.jpgby Jennifer Warren

Summary

  • OPEC published its recent global oil market outlook, which offers a slightly different and instructional viewpoint.
  • OPEC sees its share of crude oil/liquids production reducing in light of increases in U.S. and Canada production.
  • OPEC also indicates a pivot toward Asia, where it sees the greatest demand for its primary exports in the future.

In perusing through OPEC’s recently released “World Oil Outlook,” several viewpoints are noteworthy. According to OPEC, demand grows mainly from developing countries and U.S. supply slows its run up after 2019. After 2019, OPEC begins to pick up the slack, supplying its products more readily. In OPEC’s view, Asia becomes a center of gravity given global population growth, up nearly 2 billion by 2040, and economic prosperity. The world economy grows by 260% versus that of 2013 on a purchasing power parity basis.

During the period 2013-2040, OPEC says oil demand is expected to increase by just over 21 million barrels per day (mb/d), reaching 111.1 mb/d by 2040. Developing countries alone will account for growth of 28 mb/d and demand in the OECD will fall by over 7 mb/d (p.1). On the supply side, “in the long-term, OPEC will supply the majority of the additional required barrels, with the OPEC liquids supply forecast increasing by over 13 mb/d in the Reference Case from 2020-2040,” they offer (p.1). OPEC shaved off 0.5 million barrels from their last year’s forecast to 2035. Asian oil demand accounts for 71% of the growth of oil demand.

Morgan Stanley pulled out the following items:

The oil cartel released its World Oil Outlook last week, showing OPEC crude production falling to 29.5 million barrels per day in 2015 and 28.5 million barrels per day in 2016. This year’s average of 30 million barrels per day has helped flood the market and push oil prices to multi-year lows.

In the period to 2019, this chart illustrates where the barrels will flow:

Prices

With regard to price, OPEC acknowledges that the marginal cost to supply barrels continues to be a factor in expectations in the medium and long term. This sentiment has been echoed by other E&P CEOs in various communiques this year. OPEC forecasts a nominal price of $110 to the end of this decade:

On this evidence, a similar price assumption is made for the OPEC Reference Basket (ORB) price in the Reference Case compared to that presented in the WOO 2013: a constant nominal price of $110/b is assumed for the rest of the decade, corresponding to a small decline in real values.

Real values are assumed to approach $100/b in 2013 prices by 2035, with a slight further increase to $102/b by 2040. Nominal prices reach $124/b by 2025 and $177/b by 2040. These values are not to be taken as targets, according to OPEC. They acknowledge the challenge of predicting the world economy as well as non-OPEC supply. The Energy Information Administration (EIA) forecast a price for Brent averaging over $101 in 2015 and West Texas Intermediate (WTI) of over $94 as of their October 7th forecast. (This will have likely changed as of November 12th after the steep declines of October are weighed into their equations.) WTI averaged around the $97 range for 2013 and 2014. Importantly, U.S. supply may ratchet down slightly (green broken line) in response to price declines, if they continue.

It’s also the cars, globally

In 2013, OPEC says gasoline and diesel engines comprised 97% of the passenger cars total in 2013, and will hold 92% of the road in 2040. The diesel share for autos rises from 14% in 2013 to 21% in 2040. Basically, the number of cars buzzing on roads doubles from now to 2040. And 68% of the increase in cars comes from developing countries. China comprises the lion’s share of car volume growing by more than 470 million between 2011-2040, followed by India, then OPEC members will attribute 110 million new cars on the road. These increases assume levels similar to advanced economy (OECD) car volumes of the 1990s. In spite of efficiency and fuel economy, oil use per vehicle is expected to decline by 2.2%.

Commercial vehicles gain 300 million by 2040 from about 200 million in 2011. There are now more commercial vehicles in developing countries than developed.

U.S. Supply and OPEC

According to OPEC, U.S. and Canada supply increases through the period to 2019, the medium term. After 2017, they believe U.S. supply tempers from 1.2 million barrels of tight oil increases between 2013 and 2014 to 0.4 million in 2015, and less incremental increases thereafter. This acknowledges shale oil’s contribution to supply, with other supply sources declining, i.e., conventional and offshore.

OPEC Suggests:

The amount of OPEC crude required will fall from just over 30 mb/d in 2013 to 28.2 mb/d in 2017, and will start to rise again in 2018. By 2019, OPEC crude supply, at 28.7 mb/d, is still lower than in 2013.

However, the OPEC requirements are expected to ramp back up after 2019. By 2040, they expect to be supplying the world with 39 mb/d, a 9 million barrel/d increase from 2013. OPEC’s global share of crude oil supply is then 36%, above 2013 levels of about 30%. A select few firms like Pioneer Natural Resources (NYSE:PXD), Occidental Petroleum (NYSE:OXY), Chevron (NYSE:CVX) and even small-cap RSP Permian (NYSE:RSPP) are staying the course on shale oil production in the Permian for the present. After the first of the year, they will evaluate the price environment.

How does this outlook by OPEC inform the future? From the appearances in its forecasts, OPEC has slightly lower production in the medium term (to 2019), a decline of 1.3 million b/d in 2019 from the 2014 production of 30 million b/d. Thus, the main lever for an increase in prices for oil markets is for OPEC to restrict production, or encourage other members to keep to the current quota of 30 million b/d. Better economic indicators also could help. However, Saudi Arabia, the swing producer, has shown interest in maintaining its market share vis-à-vis the price cuts it has offered China, first, and then the U.S. more recently.

The global state of crude oil and liquids and prices has fundamentally changed with the addition of tight oil or shale oil, particularly from the U.S. While demand particulars have dominated the price regime recently, the upcoming decisions by OPEC at the late November meeting will have an influence on price expectations. In an environment of softer perceived demand now because of global economics and in the future because of non-OPEC supply, it would seem rational for OPEC to indicate some type of discipline among members’ production.

Source: OPEC “2014 World Oil Outlook,” mainly from the executive summary.

The Next Housing Crisis May Be Sooner Than You Think

How we could fall into another housing crisis before we’ve fully pulled out of the 2008 one.

https://i0.wp.com/cdn.citylab.com/media/img/citylab/2014/11/RTR2LDPC/lead_large.jpgby Richard Florida

When it comes to housing, sometimes it seems we never learn. Just when America appeared to be recovering from the last housing crisis—the trigger, in many ways, for 2008’s grand financial meltdown and the beginning of a three-year recession—another one may be looming on the horizon.

There are at several big red flags.

For one, the housing market never truly recovered from the recession. Trulia Chief Economist Jed Kolko points out that, while the third quarter of 2014 saw improvement in a number of housing key barometers, none have returned to normal, pre-recession levels. Existing home sales are now 80 percent of the way back to normal, while home prices are stuck at 75 percent back, remaining undervalued by 3.4 percent. More troubling, new construction is less than halfway (49 percent) back to normal. Kolko also notes that the fundamental building blocks of the economy, including employment levels, income and household formation, have also been slow to improve. “In this recovery, jobs and housing can’t get what they need from each other,” he writes.

Americans are spending more than 33 percent of their income on housing.

Second, Americans continue to overspend on housing. Even as the economy drags itself out of its recession, a spate of reports show that families are having a harder and harder time paying for housing. Part of the problem is that Americans continue to want more space in bigger homes, and not just in the suburbs but in urban areas, as well. Americans more than 33 percent of their income on housing in 2013, up nearly 13 percent from two decades ago, according to newly released data from the Bureau of Labor Statistics (BLS). The graph below plots the trend by age.

Over-spending on housing is far worse in some places than others; the housing market and its recovery remain highly uneven. Another BLS report released last month showed that households in Washington, D.C., spent nearly twice as much on housing ($17,603) as those in Cleveland, Ohio ($9,061). The chart below, from the BLS report, shows average annual expenses on housing related items:

(Bureau of Labor Statistics)

The result, of course, is that more and more American households, especially middle- and working-class people, are having a harder time affording housing. This is particularly the case in reviving urban centers, as more affluent, highly educated and creative-class workers snap up the best spaces, particularly those along convenient transit, pushing the service and working class further out.

Last but certainly not least, the rate of home ownership continues to fall, and dramatically. Home ownership has reached its lowest level in two decades—64.4 percent (as of the third quarter of 2014). Here’s the data, from the U.S. Census Bureau:

(Data from U.S. Census Bureau)

Home ownership currently hovers from the mid-50 to low-60 percent range in some of the most highly productive and innovative metros in this country—places like San Francisco, New York, and Los Angeles. This range seems “to provide the flexibility of rental and ownership options required for a fast-paced, rapidly changing knowledge economy. Widespread home ownership is no longer the key to a thriving economy,” I’ve written.

What we are going through is much more than a generational shift or simple lifestyle change. It’s a deep economic shift—I’ve called it the Great Reset. It entails a shift away from the economic system, population patterns and geographic layout of the old suburban growth model, which was deeply connected to old industrial economy, toward a new kind of denser, more urban growth more in line with today’s knowledge economy. We remain in the early stages of this reset. If history is any guide, the complete shift will take a generation or so.

It’s time to impose stricter underwriting standards and encourage the dense, mixed-use, more flexible housing options that the knowledge economy requires.

The upshot, as the Nobel Prize winner Edmund Phelps has written, is that it is time for Americans to get over their house passion. The new knowledge economy requires we spend less on housing and cars, and more on education, human capital and innovation—exactly those inputs that fuel the new economic and social system.

But we’re not moving in that direction; in fact, we appear to be going the other way. This past weekend, Peter J. Wallison pointed out in a New York Times op-ed that federal regulators moved back off tougher mortgage-underwriting standards brought on by 2010’s Dodd-Frank Act and instead relaxed them. Regulators are hoping to encourage more home ownership, but they’re essentially recreating the conditions that led to 2008’s crash.

Wallison notes that this amounts to “underwriting the next housing crisis.” He’s right: It’s time to impose stricter underwriting standards and encourage the dense, mixed-use, more flexible housing options that the knowledge economy requires.

During the depression and after World War II, this country’s leaders pioneered a series of purposeful and ultimately game-changing polices that set in motion the old suburban growth model, helping propel the industrial economy and creating a middle class of workers and owners. Now that our economy has changed again, we need to do the same for the denser urban growth model, creating more flexible housing system that can help bolster today’s economy.

https://i0.wp.com/www.thefifthestate.com.au/wp-content/uploads/2012/10/High_Density_Housing_____20120101_800x600.jpg
Dream housing for new economy workers
?

Energy Workforce Projected To Grow 39% Through 2022

The dramatic resurgence of the oil industry over the past few years has been a notable factor in the national economic recovery. Production levels have reached totals not seen since the late 1980s and continue to increase, and rig counts are in the 1,900 range. While prices have dipped recently, it will take more than that to markedly slow the level of activity. Cycles are inevitable, but activity is forecast to remain at relatively high levels.  

An outgrowth of oil and gas activity strength is a need for additional workers. At the same time, the industry workforce is aging, and shortages are likely to emerge in key fields ranging from petroleum engineers to experienced drilling crews. I was recently asked to comment on the topic at a gathering of energy workforce professionals. Because the industry is so important to many parts of Texas, it’s an issue with relevance to future prosperity.  


Although direct employment in the energy industry is a small percentage of total jobs in the state, the work is often well paying. Moreover, the ripple effects through the economy of this high value-added industry are large, especially in areas which have a substantial concentration of support services.  

Petroleum Engineer

Employment in oil and gas extraction has expanded rapidly, up from 119,800 in January 2004 to 213,500 in September 2014. Strong demand for key occupations is evidenced by the high salaries; for example, median pay was $130,280 for petroleum engineers in 2012 according to the Bureau of Labor Statistics (BLS).  

Due to expansion in the industry alone, the BLS estimates employment growth of 39 percent through 2022 for petroleum engineers, which comprised 11 percent of total employment in oil and gas extraction in 2012. Other key categories (such as geoscientists, wellhead pumpers, and roustabouts) are also expected to see employment gains exceeding 15 percent. In high-activity regions, shortages are emerging in secondary fields such as welders, electricians, and truck drivers.  

The fact that the industry workforce is aging is widely recognized. The cyclical nature of the energy industry contributes to uneven entry into fields such as petroleum engineering and others which support oil and gas activity. For example, the current surge has pushed up wages, and enrollment in related fields has increased sharply. Past downturns, however, led to relatively low enrollments, and therefore relatively lower numbers of workers in some age cohorts. The loss of the large baby boom generation of experienced workers to retirement will affect all industries. This problem is compounded in the energy sector because of the long stagnation of the industry in the 1980s and 1990s resulting in a generation of workers with little incentive to enter the industry. As a result, the projected need for workers due to replacement is particularly high for key fields.

The BLS estimates that 9,800 petroleum engineers (25.5 percent of the total) working in 2012 will need to be replaced by 2022 because they retire or permanently leave the field. Replacement rates are also projected to be high for other crucial occupations including petroleum pump system operators, refinery operators, and gaugers (37.1 percent); derrick, rotary drill, and service unit operators, oil, gas, and mining (40.4 percent).  

http://jobdiagnosis.files.wordpress.com/2010/03/petroleum-engineer.jpg

Putting together the needs from industry expansion and replacement, most critical occupations will require new workers equal to 40 percent or more of the current employment levels. The total need for petroleum engineers is estimated to equal approximately 64.5 percent of the current workforce. Clearly, it will be a major challenge to deal with this rapid turnover.

Potential solutions which have been attempted or discussed present problems, and it will require cooperative efforts between the industry and higher education and training institutions to adequately deal with future workforce shortages. Universities have had problems filling open teaching positions, because private-sector jobs are more lucrative for qualified candidates. Given budget constraints and other considerations, it is not feasible for universities to compete on the basis of salary. Without additional teaching and research staff, it will be difficult to continue to expand enrollment while maintaining education quality. At the same time, high-paying jobs are enticing students into the workforce, and fewer are entering doctoral programs.  

Another option which has been suggested is for engineers who are experienced in the workplace to spend some of their time teaching. However, busy companies are naturally resistant to allowing employees to take time away from their regular duties. Innovative training and associate degree and certification programs blending classroom and hands-on experience show promise for helping deal with current and potential shortages in support occupations. Such programs can prepare students for well-paying technical jobs in the industry. Encouraging experienced professionals to work past retirement, using flexible hours and locations to appeal to Millennials, and other innovative approaches must be part of the mix, as well as encouraging the entry of females into the field (only 20 percent of the current workforce is female, but over 40 percent of the new entries).

Industry observers have long been aware of the coming “changing of the guard” in the oil and gas business. We are now approaching the crucial time period for ensuring the availability of the workers needed to fill future jobs. Cooperative efforts between the industry and higher education/training institutions will likely be required, and it’s time to act.

https://i0.wp.com/oilandcareers.com/wp-content/uploads/2013/04/Petroleum-Engineer.jpg

$195 Million ‘Palazzo di Amore’ Is America’s New Most Expensive Home For Sale

https://i0.wp.com/specials-images.forbesimg.com/imageserve/afbd94a32b6cab843fa03cbcefe1b886/0x495.jpgby Erin Carlyle, Forbes staff.

Billionaire  real estate investor Jeff Greene’s massive Palazzo di Amore in Beverly Hills hit the market today for $195 million, making it America’s new most expensive home for sale.

Set on 25 acres overlooking Los Angeles about five to seven minutes by car to Rodeo Drive, the estate includes a 35,000-square-foot main home plus a 15,000-square-foot entertainment center and a separate guest home, containing a total of 12 bedrooms and 23 bathrooms across the various structures. The massive Mediterranean-style spread also comes with a working vineyard that produces six types of wine. Joyce Rey and Stacy Gottula, both of Coldwell Banker Previews International, are the listing agents.

https://i0.wp.com/specials-images.forbesimg.com/imageserve/da6b52ab92ee65bc95b551adaddcee5b/0x495.jpg

Building the Palazzo was a seven-and-a-half-year labor of love for Greene. In 2007 the real estate investor, who has a net worth of $3 billion, according to Forbes, purchased the home out of bankruptcy proceedings from the previous owners–a Middle Eastern businessman and his wife–paying a reported $35 million. “I have no logical explanation for why we spent the next seven-and-a-half years building this house,” Greene told Forbes. “But that’s the world of building very detailed custom homes.”

Greene hired mega-mansion builder Mohamed Hadid to do the lion’s share of the design, but remained intimately involved in nearly every decision (along with his wife), pouring in tens of millions to complete the estate. (Finishing touches were just put on last month.) At one point, a Peruvian woodcarver was on site for four months to hand-carve the fireplace mantels, Greene says.

Because the property was purchased out of bankrutpcy, Greene got the deed but not the house plans, he says. The partially-finished palazzo had no driveways, so Greene and Hadid had to design and build one. Same for the swimming pool. The land also came with a curious concrete foundation with nothing on it. At first, Greene and his wife planned to tear it out. Then they changed course to: ”Let’s just build an entertainment complex,” Greene says. Today, that space houses a bowling alley, a 50-seat private screening room, and a ballroom with a DJ booth and a revolving dance floor

Palazzo di Amore would make the ideal setting for some grand entertaining. The first floor of the main house features a chef’s kitchen with a commercial size walk-in refrigerator, plus a secondary staff kitchen, butler’s pantry, two staff rooms, a three-car attached garage and two private offices with separate entry. The living room, dining room, breakfast room, game room, office and family room all open onto grounds that face a waterfall set into the hillside. A separate guest house brings the total livable square footage to 53,000. And the property features garage parking for 27 cars and can accommodate up to 150 cars on site.

https://i0.wp.com/specials-images.forbesimg.com/imageserve/4494de06adb7d19df526268da6fd3bc1/0x495.jpg

Plus, what better way to impress all these hypothetical guests than with your own private wine? When Greene purchased the land in 2007, the vineyards were producing grapes but hadn’t yet been turned into wine. So the billionaire hired three full-time people to turn make the vineyards productive. Now, “Beverly Hills Vineyards” produces between 350 and 500 cases a year of six varietals: Sangiovese, Syrah, Cabernet, Merlot, Rose, and Sauvignon Blanc. “We drink it all the time,” Greene says.

The estate also features facilities for showing off that home-grown wine, with a 3,000-bottle wine cellar as well as a tasting room in the main house; as well as lower-level space for an additional 10,000 bottles (plus barrels) in a temperature-controlled room, flanked by an additional tasting room.

https://i0.wp.com/specials-images.forbesimg.com/imageserve/ea8f1ee5a82fa1cbef79c64c2066d705/0x495.jpg

Of course, the home would also make a fabulous private retreat. The private living space on the second floor of the main home contains two wings, one with a guest suite and the 5,000-square-foot master suite, with hand-carved fireplace mantel, Juliet balconies, and his-and-hers baths. The ‘his’ bath features a Turkish-style spa with hand-painted wood panels, a fireplace, and floor-to-ceiling Moroccan tiles. On the opposite wing, there are four additional bedroom suites, including one VIP suite with silk-upholstered walls and a full kitchen. The grounds surrounding the home contain a 128-foot reflecting pool and fountain. Also, a swimming pool, a spa, a barbecue area and a tennis court.

The massive Mediterranean-style spread was originally designed by architect Bob Ray Offenhauser and designer Alberto Pinto. Rey, the listing agent, says she expects the home to sell to a foreign buyer, since all the Los Angeles area homes over $50 million sold this year have gone to foreigners.

https://i0.wp.com/specials-images.forbesimg.com/imageserve/626d24250c327f246c73a5bf989714c6/0x495.jpg

To date, the most expensive home sold in the U.S. is the $147 million East Hampton spread picked up by Jana Partners founder Barry Rosenstein earlier this year. The record-setting price tag is based on nation-wide sales of major properties priced around $100 million, Rey says. She cited Copper Beech Farm, the $120 million Greenwich, Conn., property that sold earlier this year, as well as the penthouse at One57, the new luxury condominium towers in Midtown Manhattan, that billionaire Bill Ackman and a group of investors reportedly purchased for north of $90 million. “None of those properties had the land, the amenities that we’re offering here,” Rey says.

As for Greene, who lives in Florida and has a home in Malibu and another house in the Hamptons, he’s simply ready to move on with his life. ”I’m a control freak, and that’s why these projects aren’t good for me,” he says. “It’s just too many years, too long. But hopefully the buyer will come along who will appreciate the fruits of our labor.”

https://i0.wp.com/specials-images.forbesimg.com/imageserve/c94a76947dbc4790f54948cac33f2b4c/0x495.jpg

Today’s Hottest Trend In Residential Real Estate

The practice of multigenerational housing has been on the rise the past few years, and now experts are saying that it is adding value to properties.
by Lauren Mennenas

The practice of multigenerational housing has been on the rise the past few years, and now experts are saying that it is adding value to properties.

In a recent Wall Street Journal article, several couples across the country are quoted saying that instead of downsizing to a new home, they are choosing to live with their adult children.

This is what many families across the country are doing for both a “peace of mind” and for “higher property values.”

“For both domestic and foreign buyers, the hottest amenity in real estate these days is an in-law unit, an apartment carved out of an existing home or a stand-alone dwelling built on the homeowners’ property,” writes Katy McLaughlin of the WSJ. “While the adult children get the peace of mind of having mom and dad nearby, real-estate agents say the in-law accommodations are adding value to their homes.”

And how much more are these homes worth? In an analysis by Zillow, the homes with this type of living accommodations were priced about 60 percent higher than regular single-family homes.

Local builders are noticing the trend, too. Horsham based Toll Brothers are building more communities that include both large, single-family homes and smaller homes for empty nesters, the company’s chief marketing officer, Kira Sterling, told the WSJ.

https://i0.wp.com/media-cache-ec0.pinimg.com/736x/88/da/9b/88da9b983c6165c6ecfde072e1c7876f.jpg

New RICO-Fraud Class Action Against Ocwen For Abusive Fee Schemes Against Home Loans Serviced

https://i0.wp.com/poncie.com/wp-content/uploads/2011/08/ocwen-reo-appl-banner.jpg
by
Reclaim Our Republic

This new class action against Ocwen addresses the marked-up default services fees that Ocwen is charging homeowners, particularly distressed homeowners, as part of a scheme of self-dealing with companies such as Altisource, and with the involvement of William C. Erbey, Executive Chairman, who has a leadership role on the Board of Ocwen and Altisource:

Weiner v Ocwen Financial Corporation a Florida Corporation COMPLAINT.
Weiner v. Ocwen Fin. Corp. and Ocwen Loan Servicing, LLC, No 2:14-cv-02597 (E.D.Cal.), filed Nov. 5, 2014.

52. Ocwen’s scheme works as follows: Ocwen directs Altisource to order and coordinate default-related services, and, in turn, Altisource places orders for such services with third-party vendors. The third-party vendors charge Altisource for the performance of the default-related services, Altisource then marks up the price of the vendors’ services, in numerous instances by 100% or more, before “charging” the services to Ocwen. In turn, Ocwen bills the marked-up fees to homeowners.

58.Thus, the mortgage contract discloses to homeowners that the servicer will pay for default-related services when reasonably necessary, and will be reimbursed or “paid back” by the homeowner for amounts “disbursed.” Nowhere is it disclosed to borrowers that the servicer may engage in self-dealing to mark up the actual cost of those services to make a profit. Nevertheless, that is exactly what Ocwen does.

[Ed.: Explanation of Modern Relationship Between Loan Servicers and Home Loan Borrowers]

America’s Lending Industry Has Divorced itself from the Borrowers it Once Served

18. Ocwen’s unlawful loan servicing practices exemplify how America’s lending industry has run off the rails.

19. Traditionally, when people wanted to borrow money, they went to a bank or a “savings and loan.” Banks loaned money and homeowners promised to repay the bank, with interest, over a specific period of time. The originating bank kept the loan on its balance sheet, and serviced the loan — processing payments, and sending out applicable notices and other information — until the loan was repaid. The originating bank had a financial interest in ensuring that the borrower was able to repay the loan.

20. Today, however, the process has changed. Mortgages are now packaged, bundled, and sold to investors on Wall Street through what is referred to in the financial industry as mortgage backed securities or MBS. This process is called securitization. Securitization of mortgage loans provides financial institutions with the benefit of immediately being able to recover the amounts loaned. It also effectively eliminates the financial institution’s risk from potential default. But, by eliminating the risk of default, mortgage backed securities have disassociated the lending community from homeowners.

21. Numerous unexpected consequences have resulted from the divide between lenders and homeowners. Among other things, securitization has led to the development of an industry of companies which make money primarily through servicing mortgages for the hedge funds and investment houses who own the loans.

22. Loan servicers do not profit directly from interest payments made by homeowners. Instead, these companies are paid a set fee for their loan administration services. Servicing fees are usually earned as a percentage of the unpaid principal balance of the mortgages that are being serviced. A typical servicing fee is approximately 0.50% per year.

23. Additionally, under pooling and servicing agreements (“PSAs”) with investors and note holders, loan servicers assess fees on borrowers’ accounts for default-related services. These fees include, inter alia, Broker’s Price Opinion (“BPO”) fees, appraisal fees, and title examination fees.

24. Under this arrangement, a loan servicer’s primary concern is not ensuring that homeowners stay current on their loans. Instead, they are focused on minimizing any costs that would reduce profit from the set servicing fee, and generating as much revenue as possible from fees assessed against the mortgage accounts they service. As such, their “business model . . . encourages them to cut costs wherever possible, even if [that] involves cutting corners on legal requirements, and to lard on junk fees and in-sourced expenses at inflated prices.”3

25. As one Member of the Board of Governors of the Federal Reserve System has explained:
While an investor’s financial interests are tied more or less directly to the performance of a loan, the interests of a third-party servicer are tied to it only indirectly, at best. The servicer makes money, to oversimplify it a bit, by maximizing fees earned and minimizing expenses while performing the actions spelled out in its contract with the investor. . . . The broad grant of delegated authority that servicers enjoy under pooling and servicing agreements (PSAs), combined with an effective lack of choice on the part of consumers, creates an environment ripe for abuse.4 (citing See Sarah Bloom Raskin, Member Board of Governors of the Federal Reserve System, Remarks at the National Consumer Law Center’s Consumer Rights Litigation Conference, Boston Massachusetts, Nov. 12, 2010, available at http://www.federalreserve.gov/newsevents/speech/raskin20101112a.htm (last visited Jan. 23, 2012).

Don’t Count On A Major Slowdown In U.S. Oil Production Growth

https://i0.wp.com/upachaya.com/wp-content/uploads/2014/05/fracking.jpgby Richard Zeits

Summary

  • The presumption that North American shale oil production is the “swing” component of global supply may be incorrect.
  • Supply cutbacks from other sources may come first.
  • Growth momentum in North American unconventional oil production will likely carry on into 2015, with little impact from lower oil prices on the next two quarters’ volumes.
  • The current oil price does not represent a structural “economic floor” for North American unconventional oil production.

The recent pull back in crude oil prices is often portrayed as being a consequence of the rapid growth of North American shale oil production.

The thesis is often further extrapolated to suggest that a major slowdown in North American unconventional oil production growth, induced by the oil price decline, will be the corrective mechanism that will bring oil supply and demand back in equilibrium (given that OPEC’s cost to produce is low).

Both views would be, in my opinion, overly simplistic interpretations of the global supply/demand dynamics and are not supported by historical statistical data.

Oil Price – The Economic Signal Is Both Loud and Clear

The current oil price correction is, arguably, the most pronounced since the global financial crisis of 2008-2009. The following chart illustrates very vividly that the price of the OPEC Basket (which represents waterborne grades of oil) has moved far outside the “stability band” that seems to have worked well for both consumers and producers over the past four years. (It is important, in my opinion, to measure historical prices in “today’s dollars.”)

(Source: Zeits Energy Analytics, November 2014)

Given the sheer magnitude of the recent oil price move, the economic signal to the world’s largest oil suppliers is, arguably, quite powerful already. A case can be made that it goes beyond what could be interpreted as “ordinary volatility,” giving the hope that the current price level may be sufficient to induce some supply response from the largest producers – in the event a supply cut back is indeed needed to eliminate a transitory supply/demand imbalance.

Are The U.S. Oil Shales The Culprit?

It is debatable, in my opinion, if the continued growth of the U.S. onshore oil production can be identified as the primary cause of the current correction in the oil price. Most likely, North American shale oil is just one of several powerful factors, on both supply and demand sides, that came together to cause the price decline.

The history of oil production increases from North America in the past three years shows that the OPEC Basket price remained within the fairly tight band, as highlighted on the graph above, during 2012-2013, the period when such increases were the largest. Global oil prices “broke down” in September of 2014, when North American oil production was growing at a lower rate than in 2012-2013.

(Source: OPEC, October 2014)

If the supply growth from North America was indeed the primary “disruptive” factor causing the imbalance, one would expect the impact on oil prices to become visible at the time when incremental volumes from North America were the highest, i.e., in 2012-2013.

Should One Expect A Strong Slowdown in North American Oil Production Growth?

There is no question that the sharp pullback in the price of oil will impact operating margins and cash flows of North American shale oil producers. However, a major slowdown in North American unconventional oil production growth is a lot less obvious.

First, the oil price correction being seen by North American shale oil producers is less pronounced than the oil price correction experienced by OPEC exporters. It is sufficient to look at the WTI historical price graph below (which is also presented in “today’s dollars”) to realize that the current WTI price decline is not dissimilar to those seen in 2012 and 2013 and therefore represents a signal of lesser magnitude than the one sent to international exporters (the OPEC Basket price).

(Source: Zeits Energy Analytics, November 2014)

Furthermore, among all the sources of global oil supply, North American oil shales are the least established category. Their cost structure is evolving rapidly. Given the strong productivity gains in North American shale oil plays, what was a below-breakeven price just two-three years ago, may have become a price stimulating growth going into 2015.

Therefore, the signal sent by the recent oil price decline may not be punitive enough for North American shale oil producers and may not be able to starve the industry of external capital.

Most importantly, review of historical operating statistics provides an indication that the previous similar WTI price corrections – seen in 2012 and 2013 – did not result in meaningful slowdowns in the North American shale oil production.

The following graph shows the trajectory of oil production in the Bakken play. From this graph, it is difficult to discern any significant impact from the 2012 and 2013 WTI price corrections on the play’s aggregate production volumes. While a positive correlation between these two price corrections and the pace of production growth in the Bakken exists, there are other factors – such as takeaway capacity availability and local differentials – that appear to have played a greater role. I should also note that the impact of the lower oil prices on production volumes was not visible in the production growth rate for more than half a year after the onset of the correction.

(Source: Zeits Energy Analytics, November 2014)

Leading U.S. Independents Will Likely Continue to Grow Production At A Rapid Pace

Production growth track record by several leading shale oil players suggests that U.S. shale oil production will likely remain strong even in the $80 per barrel WTI price environment. Several examples provide an illustration.

Continental Resources (NYSE:CLR) grew its Bakken production volumes at a 58% CAGR over the past three years (slide below). By looking at the company’s historical production, it would be difficult to identify any impact from the 2012 and 2013 oil price corrections on the company’s production growth rate. Continental just announced a reduction to its capital budget in 2015 in response to lower oil prices, to $4.6 billion from $5.2 billion planned initially. The company still expects to grow its total production in 2015 by 23%-29% year-on-year.

(Source: Continental Resources, October 2014)

EOG Resources (NYSE:EOG) expects that its largest core plays (Eagle Ford, Bakken and Delaware Basin) will generate after-tax rates of return in excess of 100% in 2015 at $80 per barrel wellhead price. EOG went further to suggest that these plays may remain economically viable (10% well-level returns) at oil prices as low as $40 per barrel. The company expects to continue to grow its oil production at a double-digit rate in 2015 while spending within its cash flow. EOG achieved ~40% oil production growth in 2012-2013 and expects 31% growth for 2014. While a slowdown is visible, it is important to take into consideration that EOG’s oil production base has increased dramatically in the past three years and requires significant capital just to be maintained flat. Again, one would not notice much impact from prior years’ oil price corrections on EOG’s production growth trajectory.

(Source: EOG Resources, November 2014)

Anadarko Petroleum’s (NYSE:APC) U.S. onshore oil production growth story is similar. Anadarko increased its U.S. crude oil and NLS production from 100,000 barrels per day in 2010 to close to almost 300,000 barrels per day expected in Q4 2014. Anadarko has not yet provided growth guidance for 2015, but indicated that the company’s exploration and development strategies remain intact. While recognizing a very steep decline in the oil price, Anadarko stated that it wants “to watch this environment a little longer” before reaching conclusions with regard to the impact on its future spending plans.

(Source: Anadarko Petroleum, October 2014)

Devon Energy (NYSE:DVN) posted company-wide oil production of 216,000 barrels per day in Q3 2014. While Devon will provide detailed production and capital guidance at a later date, the company has indicated that it sees 20% to 25% oil production growth and mid‐single digit top‐line growth “on a retained‐property basis” (pro forma for divestitures) in 2015.

The list can continue on.

In Conclusion…

Based on preliminary 2015 growth indications from large shale oil operators, North American oil production growth in 2015 will likely remain strong, barring further strong decline in the price of oil.

No slowdown effect from lower oil prices will be seen for at least six months from the time operators received the “price signal” (August-September 2014).

Given the effects of the technical learning curve in oil shales and continuously improving drilling economics, the current ~$77 per barrel WTI price is unlikely to be sufficient to eliminate North American unconventional production growth.

North American shale oil production remains a very small and highly fragmented component of the global oil supply.

The global oil “central bank” (Saudi Arabia and its close allies in OPEC) remain best positioned to quickly re-instate stability of oil price in the event further significant decline occurred.

High Stakes in Dracula’s Transylvania

House hunters are turning to Romania’s central region of Transylvania, popularized by the tale of Count Dracula. Restrictions were lifted this year on local purchases of local real estate by European Union nationals. Bran Castle, above, in Bran, Brasov county, is marketed as the home of Count Dracula, but in reality it was a residence of Romanian Queen Marie in the early 20th century.Romania draws foreign buyers looking for historic mansions and modern villas in resort areas

Count Dracula, the central character of Irish author Bram Stoker’s classic vampire novel, eagerly left for England in search of new blood, in a story that popularized the Romanian region of Transylvania. Today, house hunters are invited to make the reverse journey now that Romania is a member of the European Union and that restrictions were lifted this year on purchases of local real estate by the bloc’s nationals.

Britain’s Prince Charles, for one, unwinds every year in Zalanpatak. The mud road leading to the remote village stretches for miles, with the clanging of cow bells accompanying tourists making the trek.

Elsewhere in the world, the heir to the British throne occupies great castles and sprawling mansions. In rural Romania, he resides in a small old cottage. His involvement, since 2006, in the restoration of a few local farmhouses has given the hamlet global popularity and added a sense of excitement about Transylvania living.

A living room in Bran Castle, a Transylvania property marketed as Count Dracula’s castle. The home is for sale, initially listed for $78 million.A living room in Bran Castle, a Transylvania property marketed as Count Dracula’s castle. The home is for sale, initially listed for $78 million.

Transylvania, with a population of more than seven million in the central part of Romania, has a number of high-end homes on the market. And, yes, one is a castle. Bran Castle in Brasov county is marketed as the home of Count Dracula. In reality it was a residence of Romanian Queen Marie in the early 20th century. In 2007, the home was available for $78 million. The sellers are no longer listing a price, said Mark A. Meyer, of Herzfeld and Rubin, the New York attorneys representing the queen’s descendants, but will entertain offers.

Foreign buyers had been focused on Bucharest, where there was speculative buying of apartments after the country joined the EU in 2007. But Transylvania has been luring house hunters away from the capital city.

A guesthouse on the property in Zalanpatak, Transylvania, that is owned by Britain’s Prince Charles. His presence has boosted interest in Romanian real estate.A guesthouse on the property in Zalanpatak, Transylvania, that is owned by Britain’s Prince Charles. His presence has boosted interest in Romanian real estate.

Transylvania means “the land beyond the forest” and the region is famous for its scenic mountain routes. Brasov, an elegant mountain resort and the closest Transylvanian city to the capital, has many big villas built in the 19th century by wealthy merchants. A 10-room townhouse from that period in the historic city center is listed for $2.7 million. For $500,000, a 2,200-square-foot apartment offers rooftop views of the city and the surrounding mountains.

A seven-bedroom mansion in the nearby village of Halchiu, close to popular skiing resorts, is on the market for $2.4 million. The modern villa features two huge living rooms, a swimming pool, a tennis court and spectacular views of the Carpathian Mountains.

The village, founded by Saxons in the 12th century, has rows of historic houses across the street. Four such buildings were demolished to make way for the mansion, completed in 2010.

A $2.4 million mansion is for sale in Halchiu village.A $2.4 million mansion is for sale in Halchiu village.

“Rather than invest a million or more to buy an existing house, the wealthy prefer to build on their own because construction materials and work is cheaper,” said Raluca Plavita, senior consultant at real-estate firm DTZ Echinox in Bucharest.

Non-EU nationals can’t purchase land outright—although they may use locally registered companies to circumvent the restriction—but they can buy buildings freely, said Razvan Popa, real-estate partner at law firm Kinstellar. High-end properties are out of reach for many Romanians, who make an average of $500 in monthly take-home pay.

The country saw a rapid inflation of real-estate prices before 2008, on prospects of Romania’s entry to the EU and the North Atlantic Treaty Organization, as well as aggressive lending by banks. Values then fell by half during the global financial crisis.

The economy is stronger now, with the International Monetary Fund estimating 2.4% growth this year. But the country is still among Europe’s poorest. Its isolation during the dictatorship of Nicolae Ceausescu gave it a bad image.

The interior of the seven-bedroom Halchiu mansion, which was built on the site of four traditional Saxon homes.The interior of the seven-bedroom Halchiu mansion, which was built on the site of four traditional Saxon homes.

“Interest in Romania isn’t comparable with Prague or Budapest where some may be looking to buy a small apartment with a view of Charles Bridge or the Danube,” said Mr. Popa, the real-estate lawyer.

The international publicity around Prince Charles’s properties offers a counterbalance to some of the negative press Romania has received in Western Europe, which is worried about well-educated Romanians moving to other countries to provide inexpensive labor.

The Zalanpatak property is looked after by Tibor Kalnoky, a descendant of a Hungarian aristocratic family. The 47-year-old studied in Germany to be a veterinarian and, after reclaiming family assets in Romania, has managed the prince’s property and has hosted him during his visits.

These occasional visits are enough to attract scores of tourists throughout the year to the formerly obscure village in a Transylvanian valley. The fact that few street signs lead there, that the property offers no Internet or TV and that cellphone signals are absent for miles, seems only to add to the mystery of the place.

Single Family Construction Expected to Boom in 2015

https://i0.wp.com/s3.amazonaws.com/static.texastribune.org/media/images/Foster_Jerod-9762.jpgKenny DeLaGarza, a building inspector for the city of Midland, at a 600-home Betenbough development.

Single-family home construction is expected to increase 26 percent in 2015, the National Association of Home Builders reported Oct. 31. NAHB expects single-family production to total 802,000 units next year and reach 1.1 million by 2016.

Economists participating in the NAHB’s 2014 Fall Construction Forecast Webinar said that a growing economy, increased household formation, low interest rates and pent-up demand should help drive the market next year. They also said they expect continued growth in multifamily starts given the nation’s rental demand.

The NAHB called the 2000-03 period a benchmark for normal housing activity; during those years, single-family production averaged 1.3 million units a year. The organization said it expects single-family starts to be at 90 percent of normal by the fourth quarter 2016.

NAHB Chief Economist David Crowe said multifamily starts currently are at normal production levels and are projected to increase 15 percent to 365,000 by the end of the year and hold steady into next year.

The NAHB Remodeling Market Index also showed increased activity, although it’s expected to be down 3.4 percent compared to last year because of sluggish activity in the first quarter 2014. Remodeling activity will continue to increase gradually in 2015 and 2016.

Moody’s Analytics Chief Economist Mark Zandi told the NAHB that he expects an undersupply of housing given increasing job growth. Currently, the nation’s supply stands at just over 1 million units annually, well below what’s considered normal; in a normal year, there should be demand for 1.7 million units.

Zandi noted that increasing housing stock by 700,000 units should help meet demand and create 2.1 million jobs. He also noted that things should level off by the end of 2017, when mortgage rates probably will  rise to around 6 percent.

“The housing market will be fine because of better employment, higher wages and solid economic growth, which will trump the effect of higher mortgage rates,” Zandi told the NAHB.

Robert Denk, NAHB assistant vice president for forecasting and analysis, said that he expects housing recovery to vary by state and region, noting that states with higher levels of payroll employment or labor market recovery are associated with healthier housing markets

States with the healthiest job growth include Louisiana, Montana, North Dakota, Texas and Wyoming, as well as farm belt states like Iowa.

Meanwhile Alabama, Arizona, Nevada, New Jersey, New Mexico and Rhode Island continue to have weaker markets.

Number of U.S. First-Time Homebuyers Plummets

https://i0.wp.com/www.oregonmortgageblog.com/wp-content/uploads/homedream.png

by National Mortgage Professional Magazine

Despite an improving job market and low interest rates, the share of first-time homebuyers fell to its lowest point in nearly three decades and is preventing a healthier housing market from reaching its full potential, according to an annual survey released by the National Association of Realtors (NAR). The survey additionally found that an overwhelming majority of buyers search for homes online and then purchase their home through a real estate agent. 

The 2014 NAR Profile of Home Buyers and Sellers continues a long-running series of large national NAR surveys evaluating the demographics, preferences, motivations, plans and experiences of recent home buyers and sellers; the series dates back to 1981. Results are representative of owner-occupants and do not include investors or vacation homes.

The long-term average in this survey, dating back to 1981, shows that four out of 10 purchases are from first-time home buyers. In this year’s survey, the share of first-time home  buyers dropped five percentage points from a year ago to 33 percent, representing the lowest share since 1987 (30 percent).

“Rising rents and repaying student loan debt makes saving for a down payment more difficult, especially for young adults who’ve experienced limited job prospects and flat wage growth since entering the workforce,” said Lawrence Yun, NAR chief economist. “Adding more bumps in the road, is that those finally in a position to buy have had to overcome low inventory levels in their price range, competition from investors, tight credit conditions and high mortgage insurance premiums.”

Yun added, “Stronger job growth should eventually support higher wages, but nearly half (47 percent) of first-time buyers in this year’s survey (43 percent in 2013) said the mortgage application and approval process was much more or somewhat more difficult than expected. Less stringent credit standards and mortgage insurance premiums commensurate with current buyer risk profiles are needed to boost first-time buyer participation, especially with interest rates likely rising in upcoming years.” 

The household composition of buyers responding to the survey was mostly unchanged from a year ago. Sixty-five percent of buyers were married couples, 16 percent single women, nine percent single men and eight percent unmarried couples.

In 2009, 60 percent of buyers were married, 21 percent were single women, 10 percent single men and 8 percent unmarried couples. Thirteen percent of survey respondents were multi-generational households, including adult children, parents and/or grandparents.

The median age of first-time buyers was 31, unchanged from the last two years, and the median income was $68,300 ($67,400 in 2013). The typical first-time buyer purchased a 1,570 square-foot home costing $169,000, while the typical repeat buyer was 53 years old and earned $95,000. Repeat buyers purchased a median 2,030-square foot home costing $240,000.

When asked about the primary reason for purchasing, 53 percent of first-time buyers cited a desire to own a home of their own. For repeat buyers, 12 percent had a job-related move, 11 percent wanted a home in a better area, and another 10 percent said they wanted a larger home. Responses for other reasons were in the single digits.

According to the survey, 79 percent of recent buyers said their home is a good investment, and 40 percent believe it’s better than stocks.

Financing the purchase
Nearly nine out of 10 buyers (88 percent) financed their purchase. Younger buyers were more likely to finance (97 percent) compared to buyers aged 65 years and older (64 percent). The median down payment ranged from six percent for first-time buyers to 13 percent for repeat buyers. Among 23 percent of first-time buyers who said saving for a down payment was difficult, more than half (57 percent) said student loans delayed saving, up from 54 percent a year ago.

In addition to tapping into their own savings (81 percent), first-time homebuyers used a variety of outside resources for their loan downpayment. Twenty-six percent received a gift from a friend or relative—most likely their parents—and six percent received a loan from a relative or friend. Ten percent of buyers sold stocks or bonds and tapped into a 401(k) fund.

Ninety-three percent of entry-level buyers chose a fixed-rate mortgage, with 35 percent financing their purchase with a low-down payment Federal Housing Administration-backed mortgage (39 percent in 2013), and nine percent using the Veterans Affairs loan program with no downpayment requirements.

“FHA premiums are too high in relation to default rates and have likely dissuaded some prospective first-time buyers from entering the market,” said Yun. “To put it in perspective, 56 percent of first-time buyers used a FHA loan in 2010. The current high mortgage insurance added to their monthly payment is likely causing some young adults to forgo taking out a loan.”  

Buyers used a wide variety of resources in searching for a home, with the Internet (92 percent) and real estate agents (87 percent) leading the way. Other noteworthy results included mobile or tablet applications (50 percent), mobile or tablet search engines (48 percent), yard signs (48 percent) and open houses (44 percent). 

According to NAR President Steve Brown, co-owner of Irongate, Inc., Realtors® in Dayton, Ohio, although more buyers used the Internet as the first step of their search than any other option (43 percent), the Internet hasn’t replaced the real estate agent’s role in a transaction.

“Ninety percent of home buyers who searched for homes online ended up purchasing their home through an agent,” Brown said. “In fact, buyers who used the Internet were more likely to purchase their home through an agent than those who didn’t (67 percent). Realtors are not only the source of online real estate data, they also use their unparalleled local market knowledge and resources to close the deal for buyers and sellers.” 

When buyers were asked where they first learned about the home they purchased, 43 percent said the Internet (unchanged from last year, but up from 36 percent in 2009); 33 percent from a real estate agent; 9 percent a yard sign or open house; six percent from a friend, neighbor or relative; five percent from home builders; three percent directly from the seller; and one percent a print or newspaper ad.

Likely highlighting the low inventory levels seen earlier in 2014, buyers visited 10 homes and typically found the one they eventually purchased two weeks quicker than last year (10 weeks compared to 12 in 2013). Overall, 89 percent were satisfied with the buying process.

First-time home buyers plan to stay in their home for 10 years and repeat buyers plan to hold their property for 15 years; sellers in this year’s survey had been in their previous home for a median of 10 years.

The biggest factors influencing neighborhood choice were quality of the neighborhood (69 percent), convenience to jobs (52 percent), overall affordability of homes (47 percent), and convenience to family and friends (43 percent). Other factors with relatively high responses included convenience to shopping (31 percent), quality of the school district (30 percent), neighborhood design (28 percent) and convenience to entertainment or leisure activities (25 percent).

This year’s survey also highlighted the significant role transportation costs and “green” features have in the purchase decision process. Seventy percent of buyers said transportation costs were important, while 86 percent said heating and cooling costs were important. Over two-thirds said energy efficient appliances and lighting were important (68 and 66 percent, respectively). 

Seventy-nine percent of respondents purchased a detached single-family home, eight percent a townhouse or row house, 8 percent a condo and six percent some other kind of housing. First-time home buyers were slightly more likely (10 percent) to purchase a townhouse or a condo than repeat buyers (seven percent). The typical home had three bedrooms and two bathrooms.

The majority of buyers surveyed purchased in a suburb or subdivision (50 percent). The remaining bought in a small town (20 percent), urban area (16 percent), rural area (11 percent) or resort/recreation area (three percent). Buyers’ median distance from their previous residence was 12 miles.

Characteristics of sellers
The typical seller over the past year was 54 years old (53 in 2013; 46 in 2009), was married (74 percent), had a household income of $96,700, and was in their home for 10 years before selling—a new high for tenure in home. Seventeen percent of sellers wanted to sell earlier but were stalled because their home had been worth less than their mortgage (13 percent in 2013).

“Faster price appreciation this past year finally allowed more previously stuck homeowners with little or no equity the ability to sell after waiting the last few years,” Yun said.

Sellers realized a median equity gain of $30,100 ($25,000 in 2013)—a 17 percent increase (13 percent last year) over the original purchase price. Sellers who owned a home for one year to five years typically reported higher gains than those who owned a home for six to 10 years, underlining the price swings since the recession.

The median time on the market for recently sold homes dropped to four weeks in this year’s report compared to five weeks last year, indicating tight inventory in many local markets. Sellers moved a median distance of 20 miles and approximately 71 percent moved to a larger or comparably sized home.

A combined 60 percent of responding sellers found a real estate agent through a referral by a friend, neighbor or relative, or used their agent from a previous transaction. Eighty-three percent are likely to use the agent again or recommend to others.

For the past three years, 88 percent of sellers have sold with the assistance of an agent and only nine percent of sales have been for-sale-by-owner, or FSBO sales.

For-sale-by-owner transactions accounted for 9 percent of sales, unchanged from a year ago and matching the record lows set in 2010 and 2012; the record high was 20 percent in 1987. The share of homes sold without professional representation has trended lower since reaching a cyclical peak of 18 percent in 1997.

Factoring out private sales between parties who knew each other in advance, the actual number of homes sold on the open market without professional assistance was 5 percent. The most difficult tasks reported by FSBOs are getting the right price, selling within the length of time planned, preparing or fixing up the home for sale, and understanding and completing paperwork.

NAR mailed a 127-question survey in July 2014 using a random sample weighted to be representative of sales on a geographic basis. A total of 6,572 responses were received from primary residence buyers. After accounting for undeliverable questionnaires, the survey had an adjusted response rate of 9.4 percent. The recent home buyers had to have purchased a home between July of 2013 and June of 2014. Because of rounding and omissions for space, percentage distributions for some findings may not add up to 100 percent. All information is characteristic of the 12-month period ending in June 2014 with the exception of income data, which are for 2013.

Update: The FBI Is Looking Into American Realty Capital Properties

https://i0.wp.com/static.cdn-seekingalpha.com/uploads/2014/2/17/15103192-139263037610315-Achilles-Research_origin.png

About: American Realty Capital Properties Inc (ARCP)  by Albert Alfonso

Summary:

  • According to a Reuters report, the FBI has opened a criminal probe of American Realty Capital Properties.
  • This follows the disclosure of accounting errors by the company.
  • This investigation is in addition to a SEC inquiry.

American Realty Capital Properties (NASDAQ:ARCP) just cannot catch a break. Reuters reported that the Federal Bureau of Investigation has opened a criminal investigation into ARCP, according to their sources. The FBI is conducting the investigation along with prosecutors from U.S. Attorney Preet Bharara’s office in New York, according to the Reuters report.

This news comes just days after the company announced a series of accounting errors which had been intentionally not corrected and thus concealed from the public. The amount of money involved, roughly $9.24 million GAAP and $13.60 million AFFO, was relatively small. However, these accounting errors resulted in the resignation of two senior executives, chief financial officer, Brian Block, and chief accounting officer, Lisa McAlister.

Shares of ARCP were trading for as low as $7.85 each on Wednesday, before recovering to $10 per share after CEO David Kay held fairly well received conference call explaining what happened. In the call, Mr. Kay stressed that ARCP’s key metrics were sound. He reaffirmed that the dividend policy will not change, noting that the operating metrics were not impacted and that the NAV is unchanged at $13.25. Nevertheless, the stock continued to fall, closing the week at below $9 per share. In total, ARCP’s stock has fallen 30% since news of the accounting errors first arose, wiping out $4 billion in market value.

Conclusion:

This is quite the shocking development. Not only is the FBI looking into ARCP, but also the Securities and Exchange Commission, which announced its own investigation of the accounting errors late last week. Furthermore, the company was placed on CreditWatch with negative implications by S&P, which risks putting the credit rating into junk territory.

As I noted in my earlier article, accounting issues equal an automatic sell in my book. I sold most of my ARCP holdings on Wednesday, though I still kept some shares, opting instead to sell calls on the remaining position. I now lament that choice as I fear the stock can fall further. An FBI criminal probe is no small matter and represents a clear material risk. What an absolute disaster.

Update: American Realty Capital Properties: The Turmoil Is Only Getting Worse

by Achilles Research

Summary

  • ARCP sent shock waves through the analyst community last week after the REIT said its financials should no longer be relied upon and said goodbye to the CFO and CAO.
  • ARCP is now also attracting heat from the FBI.
  • In addition, RCS Capital Corporation cancels Cole Capital transaction.

Investors in American Realty Capital Properties (NASDAQ:ARCP) need to demonstrate that they have nerves of steel at the moment. After the company reported that it overstated its AFFO last week, and that its Chief Financial Officer and Chief Accounting Officer departed as a result of the accounting scandal, more bad news are seeing the light of day.

First of all, as various news outlets reported, the Federal Bureau of Investigation is putting up some additional heat on ARCP. As Reuters reported:

(Reuters) – U.S. authorities have opened a criminal probe of American Realty Capital Properties in the wake of the real estate investment trust’s disclosure that it had uncovered accounting errors, two sources familiar with the matter said on Friday.

The Federal Bureau of Investigation is conducting the investigation along with prosecutors from U.S. Attorney Preet Bharara’s office in New York, the sources said. Further details of the probe could not be learned.

The involvement of the New York U.S. Attorney’s office is particularly bad news as Preet Bharara takes a tough stance with companies that break the law or push its limits too far. While the criminal probe certainly is bad news and comes in addition to the involvement of the SEC, something else caused massive irritation among ARCP shareholders today: The Cole Capital deal with RCS Capital Corporation (NYSE: RCAP) is in real danger.

According to ARCP’s latest (and angry) press release:

In the middle of the night, we received a letter from RCS Capital Corporation purporting to terminate the equity purchase agreement, dated September 30, 2014, between RCS and an affiliate of ARCP. As we informed RCS orally and in writing over the weekend, RCS has no right and there is absolutely no basis for RCS to terminate the agreement. Therefore, RCS’s attempt to terminate the agreement constitutes a breach of the agreement. In addition, we believe that RCS’s unilateral public announcement is a violation of its agreement with ARCP. The independent members of the ARCP Board of Directors and ARCP management are evaluating all alternatives under the agreement and with respect to the Cole Capital® business, generally. ARCP management and the independent members of the ARCP Board of Directors are committed to doing what is in the best interests of ARCP stockholders and its business, including Cole Capital.

That’s right. Since the FBI now has its fingers in the pie, and the SEC, management at RCS Capital has informed ARCP that it is terminating the deal. Whatever side you are one, you’ve got to admit: American Realty Capital Properties is just falling apart.

The once mighty real estate investment trust has lost a staggering 36% of its market capitalization since shares closed at $12.38 on October 28, 2014, which is a tough pill to swallow for those investors who pledged allegiance to American Realty Capital Properties, despite the turbulence that erupted a week ago.

Technical picture
Shares of American Realty Capital Properties are trading extremely weakly today in light of the new information, and I continue to see further downside potential for this REIT in the near term.

It seems as if all the forces of the universe are conspiring to bring American Realty Capital Properties down to its knees, and an investment in this REIT is not recommendable at the moment.

Source: StockCharts.com

Bottom Line:
The American Realty Capital Properties’ story has gotten significantly worse today: In addition to two of the most important executives abruptly leaving the company amid an accounting scandal, the SEC and the FBI are investigating the company, lawyers are very likely going to hit ARCP with litigation, and the latest transaction is in the process of collapsing.

Bulls must either have nerves of steel or clinging to hope. In any case, ARCP’s prospects have gotten much worse today, and I continue to expect further downside potential driven by litigation concerns, potential fines and extremely negative investor sentiment.

American Realty Capital Comes Clean, And I Feel Dirty

by Adam Aloisi

Summary:

  • American Realty Capital’s restatement has created rampant volatility in a stock already under the gun.
  • Why I decided to sell half of my position in the company.
  • Important portfolio takeaways for investors of all kinds.

This is one of the tougher articles I’ve written for Seeking Alpha. Asset allocation and portfolio strategy for income investors has been my focal point of writing over the past three years. I’ve always been of the opinion that talking about how to fish trumps simply giving someone fish to chew on.

Still, I mention equity-income stocks all the time in articles, but it’s rare that I write focus articles. On October third, I wrote, “American Realty Capital Properties: 30% Total Return Next Year“. Less than a month later, I find that post in an inverse position, with American Realty Capital (NASDAQ:ARCP) having dropped around 30% in market value.

First, I will tell readers that I sold a bit more than half of my position as a result of ARCP’s restatement, and still retain shares. However, it is now one of my smallest income portfolio positions and one that I have lost a majority of my conviction in. ARCP, in my mind, has transitioned from being a higher-risk investment into now becoming day-trader fodder, and at least for the near term, highly speculative. I would have been all over this thing during my trading days, but having become more conservative today with less portfolio churn, it has little room in my portfolio.

I considered all options here. I thought about increasing my position, extinguishing it altogether, selling put options at attractive premiums, or potentially doing nothing. Being so supportive of this story over the past year, I was mostly disappointed that I had to put any thought into the matter at all. For a variety of reasons, I came to the conclusion that halving the position — taking a loss, which I needed to do anyway for taxes — was a prudent near-term choice. I will revisit the decision in a month, and could conceivably buy back those shares once wash sale rules have passed.

Though selling during a period of fear and volatility is not typically in my playbook, following this restatement, I have lost confidence in this story. If you follow me, you know that I certainly identified the elevated risk that ARCP brought to real estate investors. Over the past six months, here are some comments that I made in regard to ARCP in several articles:

If you invest in ARCP today, you should expect the unexpected.

Given all the deals and potential for a misstep, there is heightened risk in owning ARCP.

But with the baggage it continues to drag along with it…..it may not necessarily be appropriate for more conservative investors

I do not consider the stock a table pounding buy.

I even compared Nick Schorsch to Monty Hall from “Let’s Make A Deal,” following the Red Lobster purchase and flip-flop on the strip mall IPO-then-sale.

As the year wore on, however, my convictions rose, since the company did not materially change its guidance to investors, despite all the acquisition activity. I figured if there were a stumble, it would have been disclosed earlier this year as the various acquisitions had time to be absorbed into operations.

While there was much criticism over the Cole quasi-divestiture to RCS and lowered guidance, I remained resolute, thinking there wasn’t another buyer, and this at least got Cole out from under the ARCP umbrella.

Of course as we now know, some financial disclosures were not to be relied upon and guidance should have been changed. If there were not so much other controversy with regard to this company, I doubt the stock would have tanked as much as it has. When you have a managerial crisis of confidence already in place and make a restatement announcement, you create panic. If we take this on face value, it does not appear to be a huge restatement, but taken in totality, this is a monumental, perhaps insurmountable, credibility problem. It’s now all aboard for the ambulance-chasing lawyers.

At this point I have decided that it is in my best interest to rip the towel in half and throw it in. I see it as a hedge against further deterioration in this story that I would not necessarily rule out given the loose management style that I and every ARCP investor knew existed.

We’re not talking about some low level accounting bean counter or paper pusher that seems to have perpetrated this; we’re talking about CFO Brian Block, assumedly someone that David Kay and Nick Schorsch had drinks with regularly. So when Kay defended the culture at ARCP on the conference call by uttering, “We don’t have bad people, we had some bad judgment there,” forgive me if I now wonder if he really has a clue how good, sweet, and honest his executives and rank-and-file workers really are. Although the restatements appear isolated to this year’s AFFO, we’ll have to see if anything turns up in 2013. While I’d like to give this company the benefit of the doubt once again, I’m finding myself staring at a slippery slope of hope that another shoe will not drop.

Still, I did not jettison the entire position because these are emotional times, and the glass-is-half-full part of me says the market is overreacting. We are, keep in mind, still talking about a high-quality portfolio of real estate, not a biotech company whose sole drug was deemed inefficacious by the FDA. In the end, however, I had to make a decision for my own portfolio that I deemed appropriate. This was it.

Meanwhile, I would not criticize nor blame someone for selling out here and moving on to more stable pastures. Fellow REIT writer Brad Thomas apparently has. On the flip side, I could see the more adventurous or those with continued conviction buying in now or upping exposure. The “right” thing to do for many investors may be to simply hold through the volatility. As I opined in a past article on ARCP:

But with the considerable sentiment overhang and “show me” attitude of the market, it could take some time and a strong stomach to see it through.

The sentiment “overhang” has basically become something much worse. And at this point I wouldn’t even want to predict how much time it could take for a rebound. Your stomach constitution will need to be stronger than I first suspected.

Portfolio Takeaways

I’ve had more than one reader tell me that the various risks I identified made them conclude that ARCP was not a stock they should own. And given what has happened here, at least for the near-term, that was obviously a prudent decision. We must all come to personal conclusions as to how much risk we are willing to take to attain income and capital growth goals.

For investors of all types, the most important thing to take away from this near-term “disaster” is that diversification and limiting position size is critical. If ARCP amounted to a couple of percent, or less, of a portfolio, the stock’s tank may not be all that impacting. If it was a more concentrated portion of the overall pie, it becomes a more painful near-term event and makes various portfolio maneuver decisions more challenging to come to.

In the end, portfolio management is a personal endeavor that amounts to an inexact science. Whether you think what I’ve done with my ARCP position is right or not is not really all important. The more important thing is whether you are comfortable with the personal portfolio decisions you make or not, why you make them, and whether they are right for your situation.

I’ve used the word “I” more than I normally would in an article. This one was indeed about me and owning up to putting wholesale trust in a management team that apparently I shouldn’t have. And it was a about a decision I really didn’t want to make as a result. Unfortunately, we have to take the bad with the good in the investment world, brush ourselves off, move on, and continue to make personal decisions that are right for our portfolios.

BofA Banker Arrested In Hong Kong For Double Murder Of Two Prostitutes

Rurick Jutting, a Cambridge University graduate, has been named as the suspect of the double murder

by Tyler Durden

The excesses of 1980s New York investment banking as captured best (and with just a dose of hyperbole) by Bret Easton Ellis’s American Psycho may be long gone in the US, but they certainly are alive and well in other banking meccas, such as the one place where every financier wants to work these days (thanks to the Chinese government making it rain credit): Hong Kong. It is here that yesterday a 29-year-old British banker, Rurik Jutting, a Cambridge University grad and current Bank of America Merrill Lynch, former Barclays employee, was arrested in connection with the grisly murder of two prostitutes. One of the two victims had been hidden in a suitcase on a balcony, while the other, a foreign woman of between 25 and 30, was found lying inside the apartment with wounds to her neck and buttocks, the police said in a statement.
|
A spokesman for Bank of America Merrill Lynch told Reuters on Sunday that the U.S. bank had, until recently, an employee bearing the same name as a man Hong Kong media have described as the chief suspect in the double murder case. Bank of America Merrill Lynch would not give more details nor clarify when the person had left the bank.

Britain’s Foreign Office in London said on Saturday a British national had been arrested in Hong Kong, without specifying the nature of any suspected crime.

The details of the crime are straight out of American Psycho 2: the Hong Kong Sequel. One of the murdered women was aged between 25 and 30 and had cut wounds to her neck and buttock, according to a police statement. The second woman’s body, also with neck injuries, was discovered in a suitcase on the apartment’s balcony, the police said. A knife was seized at the scene.

According to the WSJ, the arrested suspect, who called police to the apartment in the early hours of Nov. 1, was until recently a Hong Kong-based employee of Bank of America Merrill Lynch.


Filings with Hong Kong’s securities regulator show that the suspect was an employee with the bank as recently as Oct. 31.The man had called police in the early hours of Saturday and asked them to investigate the case, police said.

Hong Kong’s Apple Daily newspaper said the suspect had taken about 2,000 photographs and some video footage of the victims after the killings including close-ups of their wounds. Local media said the two women were prostitutes.

The apartment where the bodies were found is on the 31st floor in a building popular with financial professionals, where average rents are about HK$30,000 (nearly $4,000) a month.

According to the Telegraph the suspect, who had previously worked at Barclays from 2008 until 2010 before moving to BofA, and specifically its Hong Kong office in July last year, had apparently vanished from his workplace a week ago. It has also been reported that he resigned from his post days before news of the murders emerged.

And as usual in situations like these, the UK’s Daily Mail has the granular details. It reports that the British banker arrested on suspicion of a double murder in Hong Kong has been identified as 29-year-old Rurik Jutting. 


Mr Jutting, who attended Cambridge University, is being held by police after the bodies of two prostitutes were discovered in his up-market apartment in the early hours of yesterday morning.

Officers found the women, thought to be a 25-year-old from Indonesia and a 30-year-old from the Philippines, after Mr Jutting allegedly called police to the address, which is located near the city’s red light district. The naked body of the Filipina victim, who had suffered a series of knife wounds, was found inside the 31st-floor apartment in J Residence – a development of exclusive properties in the city’s Wan Chai district that are popular with young expatriate executives.

The second woman was reportedly discovered naked and partially decapitated in a suitcase on the balcony of the apartment. She is believed to have been tied up and to have been left there for around a week. 

Sex toys and cocaine were also reportedly found, along with a knife which was seized by officers.

Mr Jutting’s phone is today being examined by police in a bid to identify possible further victims, according to the South China Morning Post. 

It is understood that photos of the woman who was found in the suitcase, apparently taken after she died, were among roughly 2,000 that officers found on the device.

Mr Jutting attended Winchester College, an independent boys school in Hampshire, before continuing his studies in history and law at Pembroke College, Cambridge, where he became secretary of the history society.  

He appears to have worked at Barclays in London between 2008 and 2010, when he took a job with Bank of America Merrill Lynch. He was moved to the bank’s Hong Kong office in July last year. 

A spokesman for Bank of America Merrill Lynch confirmed that it had previously employed a man by the same name but would not give more details nor clarify when the person had left the bank.

CCTV footage from the apartment block, located near Hong Kong’s red light district, showed the banker and the Filipina woman returning to the 31st floor shortly after midnight local time yesterday.

He allegedly called police to his home at 3.42am, shortly after the woman he was seen with is believed to have been killed.

She was found with two wounds to her neck and her throat had been slashed. She was pronounced dead at the scene.

The body on the balcony, wrapped in a carpet and inside a black suitcase, which measured about three feet by 18 inches, was not found by police until eight hours later. 

A police source quoted by the South China Morning Post said: ‘She was nearly decapitated and her hands and legs were bound with ropes. ‘She was naked and wrapped in a towel before being stuffed into the suitcase. Her passport was found at the scene.’

Wan Chai, the district where the apartment is located, is known for its bustling nightclub scene of ‘girly bars,’ popular with expatriate men and staffed by sex workers from South East Asia.  Police have today been contacting nearby bars in an attempt to find out more about the background of the two murdered women.  

One resident in the 40-storey block, where most of the residents are expatriates, said he had noticed an unusual smell in recent days. He told the South China Morning Post that there had been ‘a stink in the building like a dead animal’.

And just like that, the worst excesses of the “peak banking” days from 1980, when sad scenes like these were a frequent occurrence, are back.


Government workers remove the body of a woman who was found dead at a flat in Hong Kong’s Wan chai district in the early hours of this morning. A British man was been arrested in connection with the murders.

A second victim was found stuffed inside a suitcase on the balcony of the residential flat in Hong Kong

The 40-storey J Residence is reportedly a high-end development favored by junior expatriate bankers

Update

Bank Of America Psycho Killer Was Busy Helping Hedge Funds Avoid Taxes During His Business Hours

The most bizarre story of the weekend was that of Bank of America’s 29-year-old banker Rurik Jutting, who shortly after allegedly killing two prostitutes (and stuffing one in a suitcase), called the cops on himself and effectively admitted to the crime having left a quite clear autoreply email message, namely “For urgent inquiries, or indeed any inquiries, please contact someone who is not an insane psychopath. For escalation please contact God, though suspect the devil will have custody. [Last line only really worked if I had followed through..]”

But while his attempt to imitate Patrick Bateman did not go unnoticed, even if it will be promptly forgotten until the next grotesquely insane banker shocks the world for another 15 minutes, the question that has remained unanswered is what did young Master Jutting do when not chopping women up.

The answer, as the WSJ has revealed, is just as unsavory: “he had been part of a Bank of America team that specialized in tax-minimization trades that are under scrutiny from prosecutors, regulators, tax collectors and the bank’s own compliance department, according to people familiar with the matter and documents reviewed by The Wall Street Journal.”

Basically, when not acting as a homicidal psychopath, Jutting was facilitating full-blown tax evasion, just the activity that every developed, and thus broke, government around the globe is desperately cracking down on, and why every single Swiss bank is non-grata in the US and may be arrested immediately upon arrival on US soil.

More from the WSJ:

Mr. Jutting, a U.K. native and a competitive poker player, worked in Bank of America Merrill Lynch’s Structured Equity Finance and Trading group, first in London and then in Hong Kong, according to these people and regulatory filings. Mr. Jutting resigned from the bank sometime before Oct. 27, which police say was the date of the first murder, according to a person familiar with the matter.

 The trading group, known as SEFT, employs about three dozen people globally, one of these people said. It helps hedge funds and other clients manage their stock portfolios, often through the use of derivatives, according to the people and internal bank documents.

Mr. Jutting joined Bank of America in 2010 and worked three years in its London office, the bank’s hub for dividend-arbitrage trades, the people familiar with the matter say. He moved to Bank of America’s Hong Kong office in July 2013.

Ironic, because it was just this summer that a Congressional panel headed by Carl Levin was tearing foreign banks Deutsche Bank and Barclays a new one for providing structures such as MAPS and COLT, which did precisely this: give clients a derivative-based means of avoiding taxation (as described in “How Rentec Made More Than 34 Billion In Profits Since 1998 “Fictional Derivatives“).

As it turns out not only did a US-based bank – Bank of America – have an entire group dedicated to precisely the same type of hedge fund, and other Ultra High Net Worth, clients tax evasion advice, but it also housed a homicidal psychopath.

Perhaps if instead Levin had been grandstanding and seeking to punish foreign banks, he had cracked down on everyone who was providing this service, Jutting’s group would have been disbanded long ago, and two innocent lives could have been saved, instead allowing the alleged cocaine-snorting murderer to engage in far more wholesome, banker-approrpriate activities:

During his time in Asia, Mr. Jutting’s pastimes apparently included gambling. In a Sept. 14 Facebook post, he boasted of winning thousands of dollars playing poker at a tournament in the Philippines. He signed off the post: “God I love Manila.” The comment drew eight “likes.”

Alas one will never know “what if.”

But we are certain that with none other than America’s most prominent bank, the one carrying its name, has now been busted for aiding and abetting hedge fund tax evasion around the globe, it will get the same treatment as evil foreign banks Barclays and Deutsche Bank, right Carl Levin?

Americans Pay More For Slower Internet

internet speeds

When it comes to Internet speeds, the U.S. lags behind much of the developed world.

That’s one of the conclusions from a new report by the Open Technology Institute at the New America Foundation, which looked at the cost and speed of Internet access in two dozen cities around the world.

Clocking in at the top of the list was Seoul, South Korea, where Internet users can get ultra-fast connections of roughly 1000 megabits per second for just $30 a month. The same speeds can be found in Hong Kong and Tokyo for $37 and $39 per month, respectively.

For comparison’s sake, the average U.S. connection speed stood at 9.8 megabits per second as of late last year, according to Akamai Technologies.

Residents of New York, Los Angeles and Washington, D.C. can get 500-megabit connections thanks to Verizon, though they come at a cost of $300 a month.

There are a few cities in the U.S. where you can find 1000-megabit connections. Chattanooga, Tenn., and Lafayette, La. have community-owned fiber networks, and Google has deployed a fiber network in Kansas City. High-speed Internet users in Chattanooga and Kansas City pay $70, while in Lafayette, it’s $110.

The problem with fiber networks is that they’re hugely expensive to install and maintain, requiring operators to lay new wiring underground and link it to individual homes. Many smaller countries with higher population density have faster average speeds than the United States.

“Especially in the U.S., many of the improved plans are at the higher speed tiers, which generally are the most expensive plans available,” the report says. “The lower speed packages—which are often more affordable for the average consumer—have not seen as much of an improvement.”

Google is exploring plans to bring high-speed fiber networks to a handful of other cities, and AT&T has also built them out in a few places, but it will be a long time before 1000-megabit speeds are an option for most Americans.

BLS: Midland Texas Again Posts Third Lowest Jobless Rate In Nation

https://i0.wp.com/www.eaglefordshalephotos.com/wp-content/uploads/2012/07/night-photo-pumpjack-and-power-lines-1024x653.jpg

Midland Reporter-Telegram

For the second straight month, Midland posted the third lowest unemployment rate in the nation, according to figures released Wednesday by the Bureau of Labor Statistics.

Bismarck, North Dakota, topped the list for the fourth straight month with a jobless rate of 2.1 percent. Fargo, North Dakota, was second at 2.3. Midland and Logan, Utah, tied for third at 2.6.


A total of 10 metropolitan statistical areas around the nation posted unemployment rates of 3.0 percent or lower. Midland was the lone MSA in Texas at or below 3.0.

Midland again ranked near the top of the list of MSAs in the nation when it came to percentage gain in employment. Midland’s 6.4 percent growth ranked second to Muncie, Indiana (8.9 percent). In September, Midland showed a work force 100,100, an increase of nearly 5,000 from September 2013.

The following are the lowest unemployment rates in the nation during the month of September, according to the Bureau of Labor Statistics.

Bismarck, North Dakota 2.1

Fargo, North Dakota 2.3

Midland 2.6

Logan, Utah 2.6

Sioux Falls, South Dakota 2.7

Grand Forks, North Dakota 2.8

Lincoln, Nebraska 2.8

Mankato, Minnesota 2.9

Rapid City, South Dakota 2.9

Billings, Montana 3.0

Lowest rates from August

Bismarck, North Dakota 2.2, Fargo North Dakota 2.4; Midland 2.8. Also: Odessa 3.4

July

Bismarck, North Dakota, 2.4; Sioux Falls, South Dakota, 2.7; Fargo, North Dakota, 2.8; Midland 2.9. Also: Odessa 3.6

June

Bismarck, North Dakota, 2.6, Midland 2.9, Fargo, North Dakota, 3.0. Also: Odessa 3.6

May

Bismarck, North Dakota, 2.2, Fargo, North Dakota, 2.5, Logan, Utah, 2.5, Midland 2.6. Also: Odessa 3.2

April

Midland 2.3, Logan, Utah 2.5, Bismarck, North Dakota 2.6, Ames, Iowa 2.7. Also: Odessa 2.9

March

Midland 2.7, Houma-Bayou Cane-Thibodaux, La. 3.1, Bismarck, N.D. 3.1, Odessa 3.3, Fargo, N.D. 3.3, Ames, Iowa 3.3, Burlington, Vt. 3.3

February

Houma-Bayou Cane-Thibodaux, La. 2.8; Midland 3.0; Lafayette, La. 3.1

January

Midland 2.9; Logan, Utah 3.3; Bismarck, N.D. 3.4

December

Bismarck, N.D. 2.8; Logan, Utah 2.8; Midland 2.8

OCWEN Fakes foreclosure Notices To Steal Homes – Downgrade Putting RMBS at Risk

foreclosure for sale

by Carole VanSickle Ellis

If you really would rather own the property than the note, take a few lessons in fraud from Owen Financial Corp. According to allegations from New York’s financial regulator, Benjamin Lawsky, the lender sent “thousands” of foreclosure “warnings” to borrowers months after the window of time had lapsed during which they could have saved their homes[1]. Lawskey alleges that many of the letters were even back-dated to give the impression that they had been sent in a timely fashion. “In many cases, borrowers received a letter denying a mortgage loan modification, and the letter was dated more than 30 days prior to the date that Ocwen mailed the letter.”

The correspondence gave borrowers 30 days from the date of the denial letter to appeal, but the borrowers received the letters after more than 30 days had passed. The issue is not a small one, either. Lawskey says that a mortgage servicing review at Ocwen revealed “more than 7,000” back-dated letters.”

In addition to the letters, Ocwen only sent correspondence concerning default cures after the cure date for delinquent borrowers had passed and ignored employee concerns that “letter-dating processes were inaccurate and misrepresented the severity of the problem.” While Lawskey accused Ocwen of cultivating a “culture that disregards the needs of struggling borrowers,” Ocwen itself blamed “software errors” for the improperly-dated letters[2]. This is just the latest in a series of troubles for the Atlanta-based mortgage servicer; The company was also part the foreclosure fraud settlement with 49 of 50 state attorneys general and recently agreed to reduce many borrowers’ loan balances by $2 billion total.

Most people do not realize that Ocwen, although the fourth-largest mortgage servicer in the country, is not actually a bank. The company specializes specifically in servicing high-risk mortgages, such as subprime mortgages. At the start of 2014, it managed $106 billion in subprime loans. Ocwen has only acknowledged that 283 New York borrowers actually received improperly dated letters, but did announce publicly in response to Lawskey’s letter that it is “investigating two other cases” and cooperating with the New York financial regulator.

WHAT WE THINK: While it’s tempting to think that this is part of an overarching conspiracy to steal homes in a state (and, when possible, a certain enormous city) where real estate is scarce, in reality the truth of the matter could be even more disturbing: Ocwen and its employees just plain didn’t care. There was a huge, problematic error that could have prevented homeowners from keeping their homes, but the loan servicer had already written off the homeowners as losers in the mortgage game. A company that services high-risk loans likely has a jaded view of borrowers, but that does not mean that the entire culture of the company should be based on ignoring borrowers’ rights and the vast majority of borrowers who want to keep their homes and pay their loans. Sure, if you took out a mortgage then you have the obligation to pay even if you don’t like the terms anymore. On the other side of the coin, however, your mortgage servicer has the obligation to treat you like someone who will fulfill their obligations rather than rigging the process so that you are doomed to fail.

Do you think Lawskey is right about Ocwen’s “culture?” What should be done to remedy this situation so that note investors and homeowners come out of it okay?

Thank you for reading the Bryan Ellis Investing Letter!

Your comments and questions are welcomed below.


[1] http://dsnews.com/news/10-23-2014/new-york-regulator-accuses-lender-sending-backdated-foreclosure-notices

[2] http://realestate.aol.com/blog/2014/10/22/ocwen-mortgage-alleged-foreclosure-abuse/

http://investing.bryanellis.com/11703/lender-fakes-foreclosure-notices-to-steal-homes/


Ocwen posts open letter and apology to borrowers
Pledges independent investigation and rectification
October 27, 2014 10:37AM

Ocwen Financial (OCN) has taken a beating after the New York Department of Financial Services sent a letter to the company on Oct. 21 alleging that the company had been backdating letters to borrowers, and now Ocwen is posting an open letter to homeowners.

Ocwen CEO Ron Faris writes to its clients explaining what happened and what steps the company is taking to investigate the issue, identify any problems, and rectify the situation.

Click here to read the full text of the letter.

“At Ocwen, we take our mission of helping struggling borrowers very seriously, and if you received one of these incorrectly-dated letters, we apologize. I am writing to clarify what happened, to explain the actions we have taken to address it, and to commit to ensuring that no borrower suffers as a result of our mistakes,” he writes.

“Historically letters were dated when the decision was made to create the letter versus when the letter was actually created. In most instances, the gap between these dates was three days or less,” Faris writes. “In certain instances, however, there was a significant gap between the date on the face of the letter and the date it was actually generated.”

Faris says that Ocwen is investigating all correspondence to determine whether any of it has been inadvertently misdated; how this happened in the first place; and why it took so long to fix it. He notes that Ocwen is hiring an independent firm to conduct the investigation, and that it will use its advisory council comprised of 15 nationally recognized community advocates and housing counselors.

“We apologize to all borrowers who received misdated letters. We believe that our backup checks and controls have prevented any borrowers from experiencing a foreclosure as a result of letter-dating errors. We will confirm this with rigorous testing and the verification of the independent firm,” Faris writes. “It is worth noting that under our current process, no borrower goes through a foreclosure without a thorough review of his or her loan file by a second set of eyes. We accept appeals for modification denials whenever we receive them and will not begin foreclosure proceedings or complete a foreclosure that is underway without first addressing the appeal.”

Faris ends by saying that Ocwen is committed to keeping borrowers in their homes.

“Having potentially caused inadvertent harm to struggling borrowers is particularly painful to us because we work so hard to help them keep their homes and improve their financial situations. We recognize our mistake. We are doing everything in our power to make things right for any borrowers who were harmed as a result of misdated letters and to ensure that this does not happen again,” he writes.

Last week the fallout from the “Lawsky event” – so called because of NYDFS Superintendent Benjamin Lawsky – came hard and fast.

Compass Point downgraded Ocwen affiliate Home Loan Servicing Solutions (HLSS) from Buy to Neutral with a price target of $18.

Meanwhile, Moody’s Investors Service downgraded Ocwen Loan Servicing LLC’s servicer quality assessments as a primary servicer of subprime residential mortgage loans to SQ3 from SQ3+ and as a special servicer of residential mortgage loans to SQ3 from SQ3+.

Standard & Poor’s Ratings Services lowered its long-term issuer credit rating to ‘B’ from ‘B+’ on Ocwen on Wednesday and the outlook is negative.

http://www.housingwire.com/articles/31846-ocwen-posts-open-letter-and-apology-to-borrowers

—-
Ocwen Writes Open Letter to Homeowners Concerning Letter Dating Issues
October 24, 2014

Dear Homeowners,

In recent days you may have heard about an investigation by the New York Department of Financial Services’ (DFS) into letters Ocwen sent to borrowers which were inadvertently misdated. At Ocwen, we take our mission of helping struggling borrowers very seriously, and if you received one of these incorrectly-dated letters, we apologize. I am writing to clarify what happened, to explain the actions we have taken to address it, and to commit to ensuring that no borrower suffers as a result of our mistakes.

What Happened
Historically letters were dated when the decision was made to create the letter versus when the letter was actually created. In most instances, the gap between these dates was three days or less. In certain instances, however, there was a significant gap between the date on the face of the letter and the date it was actually generated.

What We Are Doing
We are continuing to investigate all correspondence to determine whether any of it has been inadvertently misdated; how this happened in the first place; and why it took us so long to fix it. At the end of this exhaustive investigation, we want to be absolutely certain that we have fixed every problem with our letters. We are hiring an independent firm to investigate and to help us ensure that all necessary fixes have been made.

Ocwen has an advisory council made up of fifteen nationally recognized community advocates and housing counsellors. The council was created to improve our borrower outreach to keep more people in their homes. We will engage with council members to get additional guidance on making things right for any borrowers who may have been affected in any way by this error.

We apologize to all borrowers who received misdated letters. We believe that our backup checks and controls have prevented any borrowers from experiencing a foreclosure as a result of letter-dating errors. We will confirm this with rigorous testing and the verification of the independent firm. It is worth noting that under our current process, no borrower goes through a foreclosure without a thorough review of his or her loan file by a second set of eyes. We accept appeals for modification denials whenever we receive them and will not begin foreclosure proceedings or complete a foreclosure that is underway without first addressing the appeal.

In addition to these efforts we are committed to cooperating with DFS and all regulatory agencies.

We Are Committed to Keeping Borrowers in Their Homes
Having potentially caused inadvertent harm to struggling borrowers is particularly painful to us because we work so hard to help them keep their homes and improve their financial situations. We recognize our mistake. We are doing everything in our power to make things right for any borrowers who were harmed as a result of misdated letters and to ensure that this does not happen again. We remain deeply committed to keeping borrowers in their homes because we believe it is the right thing to do and a win/win for all of our stakeholders.

We will be in further communication with you on this matter.

Sincerely,
Ron Faris
CEO

YOU DECIDE

Ocwen Downgrade Puts RMBS at Risk

Moody’s and S&P downgraded Ocwen’s servicer quality rating last week after the New York Department of Financial Services made “backdating” allegations. Barclays says the downgrades could put some RMBS at risk of a servicer-driven default.

http://findsenlaw.wordpress.com/2014/10/29/ocwen-downgraded-in-response-to-ny-dept-of-financial-services-backdating-allegations-against-ocwen/

Home Ownership Rate Since 2005

https://i0.wp.com/lifeinbeta.com/wp-content/uploads/2011/07/CuteHouse-473x580.jpg

by Wolf Richter

The quintessential ingredient in the stew that makes up a thriving housing market has been evaporating in America. And a recent phenomenon has taken over: private equity firms, REITs, and other Wall-Street funded institutional investors have plowed the nearly free money the Fed has graciously made available to them since 2008 into tens of thousands of vacant single-family homes to rent them out. And an apartment building boom has offered alternatives too.

Since the Fed has done its handiwork, institutional investors have driven up home prices and pushed them out of reach for many first-time buyers, and these potential first-time buyers are now renting homes from investors instead. Given the high home prices, in many cases it may be a better deal. And apartments are often centrally located, rather than in some distant suburb, cutting transportation time and expenses, and allowing people to live where the urban excitement is. Millennials have figured it out too, as America is gradually converting to a country of renters.

So in its inexorable manner, home ownership has continued to slide in the third quarter, according to the Commerce Department. Seasonally adjusted, the rate dropped to 64.3% from 64.7 in the prior quarter. It was the lowest rate since Q4 1994 (not seasonally adjusted, the rate dropped to 64.4%, the lowest since Q1 1995).

This is what that relentless slide looks like:

US-quarterly-homeownership-rates-1995-2014

Home ownership since 2008 dropped across all age groups. But the largest drops occurred in the youngest age groups. In the under-35 age group, where first-time buyers are typically concentrated, home ownership has plunged from 41.3% in 2008 to 36.0%; and in the 35-44 age group, from 66.7% to 59.1%, with a drop of over a full percentage point just in the last quarter – by far the steepest.

Home ownership, however, didn’t peak at the end of the last housing bubble just before the financial crisis, but in 2004 when it reached 69.2%. Already during the housing bubble, speculative buying drove prices beyond the reach of many potential buyers who were still clinging by their fingernails to the status of the American middle class … unless lenders pushed them into liar loans, a convenient solution many lenders perfected to an art.

It was during these early stages of the housing bubble that the concept of “home” transitioned from a place where people lived and thrived or fought with each other and dealt with onerous expenses and responsibilities to a highly leveraged asset for speculators inebriated with optimism, an asset to be flipped willy-nilly and laddered ad infinitum with endless amounts of cheaply borrowed money. And for some, including the Fed it seems, that has become the next American dream.

Despite low and skidding home ownership rates, home prices have been skyrocketing in recent years, and new home prices have reached ever more unaffordable all-time highs.

https://i0.wp.com/lostworld.pair.com/trips/uk2007/edinburgh/IMG_0610.jpg

Assisted-Living Complexes for Young People

https://i0.wp.com/www.cenozoico.com/wp-content/uploads/2013/12/Balcony-Appartment-Outdoor-Living-Room-Ideas-1024x681.jpg

by Dionne Searcey

One of the most surprising developments in the aftermath of the housing crisis is the sharp rise in apartment building construction. Evidently post-recession Americans would rather rent apartments than buy new houses.

When I noticed this trend, I wanted to see what was behind the numbers.

Is it possible Americans are giving up on the idea of home ownership, the very staple of the American dream? Now that would be a good story.

What I found was less extreme but still interesting: The American dream appears merely to be on hold.

Economists told me that many potential home buyers can’t get a down payment together because the recession forced them to chip away at their savings. Others have credit stains from foreclosures that will keep them out of the mortgage market for several years.

More surprisingly, it turns out that the millennial generation is a driving force behind the rental boom. Young adults who would have been prime candidates for first-time home ownership are busy delaying everything that has to do with becoming a grown-up. Many even still live at home, but some data shows they are slowly beginning to branch out and find their own lodgings — in rental apartments.

A quick Internet search for new apartment complexes suggests that developers across the country are seizing on this trend and doing all they can to appeal to millennials. To get a better idea of what was happening, I arranged a tour of a new apartment complex in suburban Washington that is meant to cater to the generation.

What I found made me wish I was 25 again. Scented lobbies crammed with funky antiques that led to roof decks with outdoor theaters and fire pits. The complex I visited offered Zumba classes, wine tastings, virtual golf and celebrity chefs who stop by to offer cooking lessons.

“It’s like an assisted-living facility for young people,” the photographer accompanying me said.

Economists believe that the young people currently filling up high-amenity rental apartments will eventually buy homes, and every young person I spoke with confirmed that this, in fact, was the plan. So what happens to the modern complexes when the 20-somethings start to buy homes? It’s tempting to envision ghost towns of metal and pipe wood structures with tumbleweeds blowing through the lobbies. But I’m sure developers will rehabilitate them for a new demographic looking for a renter’s lifestyle.

Hillary: “Business Does Not Create Jobs”, Washington Does

Hillary_Clinton_2016_president_bid_confirmed by Tyler Durden

We have a very serious problem with Hillary. I was asked years ago to review Hillary’s Commodity Trading to explain what went on. Effectively, they did trades and simply put winners in her account and the losers in her lawyer’s. This way she gets money that is laundered through the markets – something that would get her 25 years today. People forget, but Hillary was really President – not Bill. Just 4 days after taking office, Hillary was given the authority to start a task force for healthcare reform. The problem was, her vision was unbelievable. The costs upon business were oppressive so much so that not even the Democrats could support her. When asked how was a small business mom and pop going to pay for healthcare she said “if they could not afford it they should not be in business.” From that moment on, my respect for her collapsed. She revealed herself as a real Marxist. Now, that she can taste the power of Washington, and I dare say she will not be a yes person as Obama and Bush seem to be, therein lies the real danger. Giving her the power of dictator, which is the power of executive orders, I think I have to leave the USA just to be safe. Hillary has stated when she ran the White House before regarding her idea of healthcare, “We can’t afford to have that money go to the private sector. The money has to go to the federal government because the federal government will spend that money better than the private sector will spend it.” When has that ever happened?

Hillary believes in government at the expense of the people. I do not say this lightly, because here she goes again. She just appeared at a Boston rally for Democrat gubernatorial candidate Martha Coakley on Friday. She was off the hook and amazingly told the crowd gathered at the Park Plaza Hotel not to listen to anybody who says that “businesses create jobs.” “Don’t let anybody tell you it’s corporations and businesses that create jobs,” Clinton said. “You know that old theory, ‘trickle-down economics,’” she continued. “That has been tried, that has failed. It has failed rather spectacularly.” “You know, one of the things my husband says when people say ‘Well, what did you bring to Washington,’ he said, ‘Well, I brought arithmetic,” Hillary said.

I wrote an Op-Ed for the Wall Street Journal on Clinton’s Balanced Budget. It was smoke and mirrors. Long-term interest rates were sharply higher than short-term. Clinton shifted the national debt to save interest expenditures. He also inherited a up-cycle in the economy that always produces more taxes. Yet she sees no problem with the math of perpetually borrowing. Perhaps she would get to the point of being unable to sell debt and just confiscate all wealth since government knows better. 

* * * * * * * * * * * * * * * * * * * * * * * * * * * * * * * * * * * * * * * * * * * * * * * * * * * * * * * *

Here’s a shocker or is it? Take the quiz and then check your answers at the bottom. Then take action!!!

And, no, the answers to these questions aren’t all “Barack Obama”!

1) “We’re going to take things away from you on behalf
of the common good.”
A. Karl Marx
B. Adolph Hitler
C. Joseph Stalin

D. Barack Obama
E. None of the above

2) “It’s time for a new beginning, for an end to government
of the few, by the few, and for the few…… And to replace it
with shared responsibility, for shared prosperity.”
A. Lenin
B. Mussolini
C. Idi Amin
D. Barack Obama

E. None of the above

3) “(We)…..can’t just let business as usual go on, and that
means something has to be taken away from some people.”
A. Nikita Khrushchev
B. Joseph Goebbels
C. Boris Yeltsin

D. Barack Obama
E. None of the above

4) “We have to build a political consensus and that requires
people to give up a little bit of their own … in order to create
this common ground.”
A. Mao Tse Tung
B. Hugo Chavez
C. Kim Jong II

D. Barack Obama
E. None of the above

5) “I certainly think the free-market has failed.”
A. Karl Marx
B. Lenin
C. Molotov
D. Barack Obama

E. None of the above

6) “I think it’s time to send a clear message to what
has become the most profitable sector in (the) entire
economy that they are being watched.”
A. Pinochet
B. Milosevic
C. Saddam Hussein

D. Barack Obama
E. None of the above

and the answers are ~~~~~~~~~~~~~

(1) E. None of the above. Statement was made by Hillary Clinton 6/29/2004
(2) E. None of the above. Statement was made by Hillary Clinton 5/29/2007
(3) E. None of the above. Statement was made by Hillary Clinton 6/4/2007
(4) E. None of the above. Statement was made by Hillary Clinton 6/4/2007
(5) E. None of the above. Statement was made by Hillary Clinton 6/4/2007
(6) E. None of the above. Statement was made by Hillary Clinton 9/2/2005

Want to know something scary? She may be the next POTUS.

https://i0.wp.com/glossynews.com/wp-content/uploads/2013/01/clintonAP1712_468x5921.jpg

FHA Is Set To Return To Anti-House-Flipping Restrictions


House flippers buy run-down properties, fix them up and resell them quickly at a higher price. Above, a home under renovation in Amsterdam, N.Y. (Mike Groll / Associated Press)

Can you still do a short-term house flip using federally insured, low-down payment mortgage money? That’s an important question for buyers, sellers, investors and realty agents who’ve taken part in a nationwide wave of renovations and quick resales using Federal Housing Administration-backed loans during the last four years.

The answer is yes: You can still flip and finance short term. But get your rehabs done soon. The federal agency whose policy change in 2010 made tens of thousands of quick flips possible — and helped large numbers of first-time and minority buyers with moderate incomes acquire a home — is about to shut down the program, FHA officials confirmed to me.

In an effort to stimulate repairs and sales in neighborhoods hard hit by the mortgage crisis and recession, the FHA waived its standard prohibition against financing short-term house flips. Before the policy change, if you were an investor or property rehab specialist, you had to own a house for at least 90 days before reselling — flipping it — to a new buyer at a higher price using FHA financing. Under the waiver of the rule, you could buy a house, fix it up and resell it as quickly as possible to a buyer using an FHA mortgage — provided that you followed guidelines designed to protect consumers from being ripped off with hyper-inflated prices and shoddy construction.

Since then, according to FHA estimates, about 102,000 homes have been renovated and resold using the waiver. The reason for the upcoming termination: The program has done its job, stimulated billions of dollars of investments, stabilized prices and provided homes for families who were often newcomers to ownership.

However, even though the waiver program has functioned well, officials say, inherent dangers exist when there are no minimum ownership periods for flippers. In the 1990s, the FHA witnessed this firsthand when teams of con artists began buying run-down houses, slapped a little paint on the exterior and resold them within days — using fraudulent appraisals — for hyper-inflated prices and profits. Their buyers, who obtained FHA-backed mortgages, often couldn’t afford the payments and defaulted. Sometimes the buyers were themselves part of the scam and never made any payments on their loans — leaving the FHA, a government-owned insurer, with steep losses.

For these reasons, officials say, it’s time to revert to the more restrictive anti-quick-flip rules that prevailed before the waiver: The 90-day standard will come back into effect after Dec. 31.

But not everybody thinks that’s a great idea. Clem Ziroli Jr., president of First Mortgage Corp., an FHA lender in Ontario, says reversion to the 90-day rule will hurt moderate-income buyers who found the program helpful in opening the door to home ownership.

“The sad part,” Ziroli said in an email, “is the majority of these properties were improved and [located] in underserved areas. Having a rehabilitated house available to these borrowers” helped them acquire houses that had been in poor physical shape but now were repaired, inspected and safe to occupy.

Paul Skeens, president of Colonial Mortgage in Waldorf, Md., and an active rehab investor in the suburbs outside Washington, D.C., said the upcoming policy change will cost him money and inevitably raise the prices of the homes he sells after completing repairs and improvements. Efficient renovators, Skeens told me in an interview, can substantially improve a house within 45 days, at which point the property is ready to list and resell. By extending the mandatory ownership period to 90 days, the FHA will increase Skeens’ holding costs — financing expenses, taxes, maintenance and utilities — all of which will need to be added onto the price to a new buyer.

Paul Wylie, a member of an investor group in the Los Angeles area, says he sees “more harm than good by not extending the waiver. There are protections built into the program that have served [the FHA] well,” he said in an email. If the government reimposes the 90-day requirement, “it will harm those [buyers] that FHA intends to help” with its 3.5% minimum-down-payment loans. “Investors will adapt and sell to non-FHA-financed buyers. Entry-level consumers will be harmed unnecessarily.”

Bottom line: Whether fix-up investors like it or not, the FHA seems dead set on reverting to its pre-bust flipping restrictions. Financing will still be available, but selling prices of the end product — rehabbed houses for moderate-income buyers — are almost certain to be more expensive.

kenharney@earthlink.net. Distributed by Washington Post Writers Group. Copyright © 2014, Los Angeles Times

8 Major Reasons Why The Current Low Oil Price Is Not Here To Stay

https://i0.wp.com/media-cache-ak0.pinimg.com/736x/6b/92/8f/6b928fc7417ebd67ee2f64b26be053af.jpg

by Nathan’s Bulletin

Summary:

  • The slump in the oil price is primarily a result of extreme short positioning, a headline-driven anxiety and overblown fears about the global economy.
  • This is a temporary dip and the oil markets will recover significantly by H1 2015.
  • Now is the time to pick the gold nuggets out of the ashes and wait to see them shine again.
  • Nevertheless, the sky is not blue for several energy companies and the drop of the oil price will spell serious trouble for the heavily indebted oil producers.

Introduction:

It has been a very tough market out there over the last weeks. And the energy stocks have been hit the hardest over the last five months, given that most of them have returned back to their H2 2013 levels while many have dropped even lower down to their H1 2013 levels.

But one of my favorite quotes is Napoleon’s definition of a military genius: “The man who can do the average thing when all those around him are going crazy.” To me, you don’t have to be a genius to do well in investing. You just have to not go crazy when everyone else is.

In my view, this slump of the energy stocks is a deja-vu situation, that reminded me of the natural gas frenzy back in early 2014, when some fellow newsletter editors and opinion makers with appearances on the media (i.e. CNBC, Bloomberg) were calling for $8 and $10 per MMbtu, trapping many investors on the wrong side of the trade. In contrast, I wrote a heavily bearish article on natural gas in February 2014, when it was at $6.2/MMbtu, presenting twelve reasons why that sky high price was a temporary anomaly and would plunge very soon. I also put my money where my mouth was and bought both bearish ETFs (NYSEARCA:DGAZ) and (NYSEARCA:KOLD), as shown in the disclosure of that bearish article. Thanks to these ETFs, my profits from shorting the natural gas were quick and significant.

This slump of the energy stocks also reminded me of those analysts and investors who were calling for $120/bbl and $150/bbl in H1 2014. Even T. Boone Pickens, founder of BP Capital Management, told CNBC in June 2014 that if Iraq’s oil supply goes offline, crude prices could hit $150-$200 a barrel.

But people often go to the extremes because this is the human nature. But shrewd investors must exploit this inherent weakness of human nature to make easy money, because factory work has never been easy.

Let The Charts And The Facts Speak For Themselves

The chart for the bullish ETF (NYSEARCA:BNO) that tracks Brent is illustrated below:

And the charts for the bullish ETFs (NYSEARCA:USO), (NYSEARCA:DBO) and (NYSEARCA:OIL) that track WTI are below:

and below:

and below:

For the risky investors, there is the leveraged bullish ETF (NYSEARCA:UCO), as illustrated below:

It is clear that these ETFs have returned back to their early 2011 levels amid fears for oversupply and global economy worries. Nevertheless, the recent growth data from the major global economies do not look bad at all.

In China, things look really good. The Chinese economy grew 7.3% in Q3 2014, which is way far from a hard-landing scenario that some analysts had predicted, and more importantly the Chinese authorities seem to be ready to step in with major stimulus measures such as interest rate cuts, if needed. Let’s see some more details about the Chinese economy:

1) Exports rose 15.3% in September from a year earlier, beating a median forecast in a Reuters poll for a rise of 11.8% and quickening from August’s 9.4% rise.

2) Imports rose 7% in terms of value, compared with a Reuters estimate for a 2.7% fall.

3) Iron ore imports rebounded to the second highest this year and monthly crude oil imports rose to the second highest on record.

4) China posted a trade surplus of $31.0 billion in September, down from $49.8 billion in August.

Beyond the encouraging growth data coming from China (the second largest oil consumer worldwide), the US economy grew at a surprising 4.6% rate in Q2 2014, which is the fastest pace in more than two years.

Meanwhile, the Indian economy picked up steam and rebounded to a 5.7% rate in Q2 2014 from 4.6% in Q1, led by a sharp recovery in industrial growth and gradual improvement in services. And after overtaking Japan as the world’s third-biggest crude oil importer in 2013, India will also become the world’s largest oil importer by 2020, according to the US Energy Information Administration (EIA).

The weakness in Europe remains, but this is nothing new over the last years. And there is a good chance Europe will announce new economic policies to boost the economy over the next months. For instance and based on the latest news, the European Central Bank is considering buying corporate bonds, which is seen as helping banks free up more of their balance sheets for lending.

All in all, and considering the recent growth data from the three biggest oil consumers worldwide, I get the impression that the global economy is in a better shape than it was in early 2011. On top of that, EIA forecasts that WTI and Brent will average $94.58 and $101.67 respectively in 2015, and obviously I do not have any substantial reasons to disagree with this estimate.

The Reasons To Be Bullish On Oil Now

When it comes to investing, timing matters. In other words, a lucrative investment results from a great entry price. And based on the current price, I am bullish on oil for the following reasons:

1) Expiration of the oil contracts: They expired last Thursday and the shorts closed their bearish positions and locked their profits.

2) Restrictions on US oil exports: Over the past three years, the average price of WTI oil has been $13 per barrel cheaper than the international benchmark, Brent crude. That gives large consumers of oil such as refiners and chemical companies a big cost advantage over foreign rivals and has helped the U.S. become the world’s top exporter of refined oil products.

Given that the restrictions on US oil exports do not seem to be lifted anytime soon, the shale oil produced in the US will not be exported to impact the international supply/demand and lower Brent price in the short-to-medium term.

3) The weakening of the U.S. dollar: The U.S. dollar rose significantly against the Euro over the last months because of a potential interest rate hike.

However, U.S. retail sales declined in September 2014 and prices paid by businesses also fell. Another report showed that both ISM indices weakened in September 2014, although the overall economic growth remained very strong in Q3 2014.

The ISM manufacturing survey showed that the reading fell back from 59.0 in August 2014 to 56.6 in September 2014. The composite non-manufacturing index dropped back as well, moving down from 59.6 in August 2014 to 58.6 in September 2014.

(click to enlarge)

Source: Pictet Bank website

These reports coupled with a weak growth in Europe and a potential slowdown in China could hurt U.S. exports, which could in turn put some pressure on the U.S. economy.

These are reasons for caution and will most likely deepen concerns at the U.S. Federal Reserve. A rate hike too soon could cause problems to the fragile U.S. economy which is gradually recovering. “If foreign growth is weaker than anticipated, the consequences for the U.S. economy could lead the Fed to remove accommodation more slowly than otherwise,” the U.S. central bank’s vice chairman, Stanley Fischer, said.

That being said, the US Federal Reserve will most likely defer to hike the interest rate planned to begin in H1 2015. A delay in expected interest rate hikes will soften the dollar over the next months, which will lift pressure off the oil price and will push Brent higher.

4) OPEC’s decision to cut supply in November 2014: Many OPEC members need the price of oil to rise significantly from the current levels to keep their house in fiscal order. If Brent remains at $85-$90, these countries will either be forced to borrow more to cover the shortfall in oil tax revenues or cut their promises to their citizens. However, tapping bond markets for financing is very expensive for the vast majority of the OPEC members, given their high geopolitical risk. As such, a cut on promises and social welfare programs is not out of the question, which will likely result in protests, social unrest and a new “Arab Spring-like” revolution in some of these countries.

This is why both Iran and Venezuela are calling for an urgent OPEC meeting, given that Venezuela needs a price of $121/bbl, according to Deutsche Bank, making it one of the highest break-even prices in OPEC. Venezuela is suffering rampant inflation which is currently around 50%, and the government currency controls have created a booming black currency market, leading to severe shortages in the shops.

Bahrain, Oman and Nigeria have not called for an urgent OPEC meeting yet, although they need between $100/bbl and $136/bbl to meet their budgeted levels. Qatar and UAE also belong to this group, although hydrocarbon revenues in Qatar and UAE account for close to 60% of the total revenues of the countries, while in Kuwait, the figure is close to 93%.

The Gulf producers such as the UAE, Qatar and Kuwait are more resilient than Venezuela or Iran to the drop of the oil price because they have amassed considerable foreign currency reserves, which means that they could run deficits for a few years, if necessary. However, other OPEC members such as Iran, Iraq and Nigeria, with greater domestic budgetary demands because of their large population sizes in relation to their oil revenues, have less room to maneuver to fund their budgets.

And now let’s see what is going on with Saudi Arabia. Saudi Arabia is too reliant on oil, with oil accounting for 80% of export revenue and 90% of the country’s budget revenue. Obviously, Saudi Arabia is not a well-diversified economy to withstand low Brent prices for many months, although the country’s existing sovereign wealth fund, SAMA Foreign Holdings, run by the country’s central bank, consisting mainly of oil surpluses, is the world’s third-largest, with assets totaling 737.6 billion US dollars.

This is why Prince Alwaleed bin Talal, billionaire investor and chairman of Kingdom Holding, said back in 2013: “It’s dangerous that our income is 92% dependent on oil revenue alone. If the price of oil decline was to decline to $78 a barrel there will be a gap in our budget and we will either have to borrow or tap our reserves. Saudi Arabia has SAR2.5 trillion in external reserves and unfortunately the return on this is 1 to 1.5%. We are still a nation that depends on the oil and this is wrong and dangerous. Saudi Arabia’s economic dependence on oil and lack of a diverse revenue stream makes the country vulnerable to oil shocks.”

And here are some additional key factors that the oil investors need to know about Saudi Arabia to place their bets accordingly:

a) Saudi Arabia’s most high-profile billionaire and foreign investor, Prince Alwaleed bin Talal, has launched an extraordinary attack on the country’s oil minister for allowing prices to fall. In a recent letter in Arabic addressed to ministers and posted on his website, Prince Alwaleed described the idea of the kingdom tolerating lower prices below $100 per barrel as potentially “catastrophic” for the economy of the desert kingdom. The letter is a significant attack on Saudi’s highly respected 79-year-old oil minister Ali bin Ibrahim Al-Naimi who has the most powerful voice within the OPEC.

b) Back in June 2014, Saudi Arabia was preparing to launch its first sovereign wealth fund to manage budget surpluses from a rise in crude prices estimated at hundreds of billions of dollars. The fund would be tasked with investing state reserves to “assure the kingdom’s financial stability,” Shura Council financial affairs committee Saad Mareq told Saudi daily Asharq Al-Awsat back then. The newspaper said the fund would start with capital representing 30% of budgetary surpluses accumulated over the years in the kingdom. The thing is that Saudi Arabia is not going to have any surpluses if Brent remains below $90/bbl for months.

c) Saudi Arabia took immediate action in late 2011 and early 2012, under the fear of contagion and the destabilisation of Gulf monarchies. Saudi Arabia funded those emergency measures, thanks to Brent which was much higher than $100/bbl back then. It would be difficult for Saudi Arabia to fund these billion dollar initiatives if Brent remained at $85-$90 for long.

d) Saudi Arabia and the US currently have a common enemy which is called ISIS. Moreover, the American presence in the kingdom’s oil production has been dominant for decades, given that U.S. petroleum engineers and geologists developed the kingdom’s oil industry throughout the 1940s, 1950s and 1960s.

From a political perspective, the U.S. has had a discreet military presence since 1950s and the two countries were close allies throughout the Cold War in order to prevent the communists from expanding to the Middle East. The two countries were also allies throughout the Iran-Iraq war and the Gulf War.

5) Geopolitical Risk: Right now, Brent price carries a zero risk premium. Nevertheless, the geopolitical risk in the major OPEC exporters (i.e. Nigeria, Algeria, Libya, South Sudan, Iraq, Iran) is highly volatile, and several things can change overnight, leading to an elevated level of geopolitical risk anytime.

For instance, the Levant has a new bogeyman. ISIS, the Islamic State of Iraq, emerged from the chaos of the Syrian civil war and has swept across Iraq, making huge territorial gains. Abu Bakr al-Baghdadi, the group’s figurehead, has claimed that its goal is to establish a Caliphate across the whole of the Levant and that Jordan is next in line.

At least 435 people have been killed in Iraq in car and suicide bombings since the beginning of the month, with an uptick in the number of these attacks since the beginning of September 2014, according to Iraq Body Count, a monitoring group tracking civilian deaths. Most of those attacks occurred in Baghdad and are the work of Islamic State militants. According to the latest news, ISIS fighters are now encamped on the outskirts of Baghdad, and appear to be able to target important installations with relative ease.

Furthermore, Libya is on the brink of a new civil war and finding a peaceful solution to the ongoing Libyan crisis will not be easy. According to the latest news, Sudan and Egypt agreed to coordinate efforts to achieve stability in Libya through supporting state institutions, primarily the military who is fighting against Islamic militants. It remains to be see how effective these actions will be.

On top of that, the social unrest in Nigeria is going on. Nigeria’s army and Boko Haram militants have engaged in a fierce gun battle in the north-eastern Borno state, reportedly leaving scores dead on either side. Several thousand people have been killed since Boko Haram launched its insurgency in 2009, seeking to create an Islamic state in the mainly Muslim north of Nigeria.

6) Seasonality And Production Disruptions: Given that winter is coming in the Northern Hemisphere, the global oil demand will most likely rise effective November 2014.

Also, U.S. refineries enter planned seasonal maintenance from September to October every year as the federal government requires different mixtures in the summer and winter to minimize environmental damage. They transition to winter-grade fuel from summer-grade fuels. U.S. crude oil refinery inputs averaged 15.2 million bopd during the week ending October 17. Input levels were 113,000 bopd less than the previous week’s average. Actually, the week ending October 17 was the eighth week in a row of declines in crude oil runs, and these rates were the lowest since March 2014. After all and given that the refineries demand less crude during this period of the year, the price of WTI remains depressed.

On top of that, the production disruptions primarily in the North Sea and the Gulf of Mexico are not out of the question during the winter months. Even Saudi Arabia currently faces production disruptions. For instance, production was halted just a few days ago for environmental reasons at the Saudi-Kuwait Khafji oilfield, which has output of 280,000 to 300,000 bopd.

7) Sentiment: To me, the recent sell off in BNO is overdone and mostly speculative. To me, the recent sell-off is primarily a result of a headline-fueled anxiety and bearish sentiment.

8) Jobs versus Russia: According to Olga Kryshtanovskaya, a sociologist studying the country’s elite at the Russian Academy of Sciences in Moscow, top Kremlin officials said after the annexation of Crimea that they expected the U.S. to artificially push oil prices down in collaboration with Saudi Arabia in order to damage Russia.

And Russia is stuck with being a resource-based economy and the cheap oil chokes the Russian economy, putting pressure on Vladimir Putin’s regime, which is overwhelmingly reliant on energy, with oil and gas accounting for 70% of its revenues. This is an indisputable fact.

The current oil price is less than the $104/bbl on average written into the 2014 Russian budget. As linked above, the Russian budget will fall into deficit next year if Brent is less than $104/bbl, according to the Russian investment bank Sberbank CIB. At $90/bbl, Russia will have a shortfall of 1.2% of gross domestic product. Against a backdrop of falling revenue, finance minister Anton Siluanov warned last week that the country’s ambitious plans to raise defense spending had become unaffordable.

Meanwhile, a low oil price is also helping U.S. consumers in the short term. However, WTI has always been priced in relation to Brent, so the current low price of WTI is actually putting pressure on the US consumers in the midterm, given that the number one Job Creating industry in the US (shale oil) will collapse and many companies will lay off thousands of people over the next few months. The producers will cut back their growth plans significantly, and the explorers cannot fund the development of their discoveries. This is another indisputable fact too.

For instance, sliding global oil prices put projects under heavy pressure, executives at Chevron (NYSE:CVX) and Statoil (NYSE:STO) told an oil industry conference in Venezuela. Statoil Venezuela official Luisa Cipollitti said at the conference that mega-projects globally are under threat, and estimates that more than half the world’s biggest 163 oil projects require a $120 Brent price for crude.

Actually, even before the recent fall of the oil price, the oil companies had been cutting back on significant spending, in a move towards capital discipline. And they had been making changes that improve the economies of shale, like drilling multiple wells from a single pad and drilling longer horizontal wells, because the “fracking party” was very expensive. Therefore, the drop of the oil price just made things much worse, because:

a) Shale Oil: Back in July 2014, Goldman Sachs estimated that U.S. shale producers needed $85/bbl to break even.

b) Offshore Oil Discoveries: Aside Petr’s (NYSE: PBR) pre-salt discoveries in Brazil, Kosmos Energy’s (NYSE: KOS) Jubilee oilfield in Ghana and Jonas Sverdrup oilfield in Norway, there have not been any oil discoveries offshore that move the needle over the last decade, while depleting North Sea fields have resulted in rising costs and falling production.

The pre-salt hype offshore Namibia and offshore Angola has faded after multiple dry or sub-commercial wells in the area, while several major players have failed to unlock new big oil resources in the Arctic Ocean. For instance, Shell abandoned its plans in the offshore Alaskan Arctic, and Statoil is preparing to drill a final exploration well in the Barents Sea this year after disappointing results in its efforts to unlock Arctic resources.

Meanwhile, the average breakeven cost for the Top 400 offshore projects currently is approximately $80/bbl (Brent), as illustrated below:

(click to enlarge)

Source: Kosmos Energy website

c) Oil sands: The Canadian oil sands have an average breakeven cost that ranges between $65/bbl (old projects) and $100/bbl (new projects).

In fact, the Canadian Energy Research Institute forecasts that new mined bitumen projects requires US$100 per barrel to breakeven, whereas new SAGD projects need US$85 per barrel. And only one in four new Canadian oil projects could be vulnerable if oil prices fall below US$80 per barrel for an extended period of time, according to the International Energy Agency.

“Given that the low-bearing fruit have already been developed, the next wave of oil sands project are coming from areas where geology might not be as uniform,” said Dinara Millington, senior vice president at the Canadian Energy Research Institute.

So it is not surprising that Suncor Energy (NYSE:SU) announced a billion-dollar cut for the rest of the year even though the company raised its oil price forecast. Also, Suncor took a $718-million charge related to a decision to shelve the Joslyn oilsands mine, which would have been operated by the Canadian unit of France’s Total (NYSE:TOT). The partners decided the project would not be economically feasible in today’s environment.

As linked above, others such as Athabasca Oil (OTCPK: ATHOF), PennWest Exploration (NYSE: PWE), Talisman Energy (NYSE: TLM) and Sunshine Oil Sands (OTC: SUNYF) are also cutting back due to a mix of internal corporate issues and project uncertainty. Cenovus Energy (NYSE:CVE) is also facing cost pressures at its Foster Creek oil sands facility.

And as linked above: “Oil sands are economically challenging in terms of returns,” said Jeff Lyons, a partner at Deloitte Canada. “Cost escalation is causing oil sands participants to rethink the economics of projects. That’s why you’re not seeing a lot of new capital flowing into oil sands.”

After all, helping the US consumer spend more on cute clothes today does not make any sense, when he does not have a job tomorrow. Helping the US consumer drive down the street and spend more at a fancy restaurant today does not make any sense, if he is unemployed tomorrow.

Moreover, Putin managed to avoid mass unemployment during the 2008 financial crisis, when the price of oil dropped further and faster than currently. If Russia faces an extended slump now, Putin’s handling of the last crisis could serve as a template.

In short, I believe that the U.S. will not let everything collapse that easily just because the Saudis woke up one day and do not want to pump less. I believe that the U.S. economy has more things to lose (i.e. jobs) than to win (i.e. hurt Russia or help the US consumer in the short term), in case the current low WTI price remains for months.

My Takeaway

I am not saying that an investor can take the plunge lightly, given that the weaker oil prices squeeze profitability. Also, I am not saying that Brent will return back to $110/bbl overnight. I am just saying that the slump of the oil price is primarily a result from extreme short positioning and overblown fears about the global economy.

To me, this is a temporary dip and I believe that oil markets will recover significantly by the first half of 2015. This is why, I bought BNO at an average price of $33.15 last Thursday, and I will add if BNO drops down to $30. My investment horizon is 6-8 months.

Nevertheless, all fingers are not the same. All energy companies are not the same either. The rising tide lifted many of the leveraged duds over the last two years. Some will regain quickly their lost ground, some will keep falling and some will cover only half of the lost ground.

I am saying this because the drop of the oil price will spell serious trouble for a lot of oil producers, many of whom are laden with debt. I do believe that too much credit has been extended too fast amid America’s shale boom, and a wave of bankruptcy that spreads across the oil patch will not surprise me. On the debt front, here is some indicative data according to Bloomberg:

1) Speculative-grade bond deals from energy companies have made up at least 16% of total junk issuance in the U.S. the past two years as the firms piled on debt to fund exploration projects. Typically the average since 2002 has been 11%.

2) Junk bonds issued by energy companies, which have made up a record 17% of the $294 billion of high-yield debt sold in the U.S. this year, have on average lost more than 4% of their market value since issuance.

3) Hercules Offshore’s (NASDAQ:HERO) $300 million of 6.75% notes due in 2022 plunged to 57 cents a few days ago after being issued at par, with the yield climbing to 17.2%.

4) In July 2014, Aubrey McClendon’s American Energy Partners LP tapped the market for unsecured debt to fund exploration projects in the Permian Basin. Moody’s Investors Service graded the bonds Caa1, which is a level seven steps below investment-grade and indicative of “very high credit risk.” The yield on the company’s $650 million of 7.125% notes maturing in November 2020 reached 11.4% a couple of days ago, as the price plunged to 81.5 cents on the dollar, according to Trace, the Financial Industry Regulatory Authority’s bond-price reporting system.

Due to this debt pile, I have been very bearish on several energy companies like Halcon Resources (NYSE:HK), Goodrich Petroleum (NYSE:GDP), Vantage Drilling (NYSEMKT: VTG), Midstates Petroleum (NYSE: MPO), SandRidge Energy (NYSE:SD), Quicksilver Resources (NYSE: KWK) and Magnum Hunter Resources (NYSE:MHR). All these companies have returned back to their H1 2013 levels or even lower, as shown at their charts.

But thanks also to this correction of the market, a shrewd investor can separate the wheat from the chaff and pick only the winners. The shrewd investor currently has the unique opportunity to back up the truck on the best energy stocks in town. This is the time to pick the gold nuggets out of the ashes and wait to see them shine again. On that front, I recommended Petroamerica Oil (OTCPK: PTAXF) which currently is the cheapest oil-weighted producer worldwide with a pristine balance sheet.

Last but not least, I am watching closely the situation in Russia. With economic growth slipping close to zero, Russia is reeling from sanctions by the U.S. and the European Union. The sanctions are having an across-the-board impact, resulting in a worsening investment climate, rising capital flight and a slide in the ruble which is at a record low. And things in Russia have deteriorated lately due to the slump of the oil price.

Obviously, this is the perfect storm and the current situation in Russia reminds me of the situation in Egypt back in 2013. Those investors who bought the bullish ETF (NYSEARCA: EGPT) at approximately $40 in late 2013, have been rewarded handsomely over the last twelve months because EGPT currently lies at $66. Therefore, I will be watching closely both the fluctuations of the oil price and several other moving parts that I am not going to disclose now, in order to find the best entry price for the Russian ETFs (NYSEARCA: RSX) and (NYSEARCA:RUSL) over the next months.

https://i0.wp.com/www.notevena.com/artwork/GICLEE/tn_TwoHeadsAreBetterThanOne.jpg

The Boom-and-bust Fed’s Rental Society

https://farm6.staticflickr.com/5477/10625414354_3f92ab4979.jpg

by Reuven Brenner

Now, as during World War II and up to 1951, the US Federal Reserve practiced what is now called quantitative easing (QE). Then, as now, nominal interest rates were low and the real ones negative: The Fed’s policy did not so much induce investments as it allowed the government to accumulate debts, and prevent default.

Marriner Eccles, the Fed chairman during the 1940s, stated explicitly that “we agreed with the Treasury at the time of the war [that the low rates were] the basis upon which the Federal Reserve would assure the Government financing” – the Fed thus carrying out fiscal policy. Real wages stagnated then as now, and global savings poured into the US.

With the centrally controlled war economy, there was no sacrifice buying Treasuries. Extensive price controls, whose administration was gradually dismantled after 1948 only, did not induce investments. Citizens backed this war, and consumer oriented production was not a priority. Black markets thrived, and the real inflation was significantly higher than the official one computed from the controlled prices.

Still, even the official cumulative rate of inflation was 70% between 1940-7. Yet interest rates during those years hovered around 0.5% for three-months Treasuries and 2.5% for the 30-year ones – similar to today’s.

When the Allies won the War, there were many unknowns, among them the future of Europe, Russia, Asia, and there was much uncertainty about domestic policies in the US too: how fast the US’s centralized “war economy” would be dismantled being one of them. As noted, the dismantling started in 1948, but the Fed gained independence and ceased carrying out fiscal policy in 1951 only.

Mark Twain said history rhymes but does not repeat itself. Though now the West is not fighting wars on the scale of World War II, there is uncertainty again in Southeast Asia and the Middle East, in Europe, in Russia and in Latin America. Savings continue to pour in the US, into Treasuries in particular, much criticism of US fiscal and monetary policies notwithstanding.

In the land of the blind, the one-eyed person – the US – committing fewer mistakes and expected to correct them faster than other countries, can still do reasonably. And although domestically, the US is not as much subject to wage and price controls as it was during and after World War II, large sectors, such as education and health, among others, are subject to direct and indirect controls by an ever more complex bureaucracy, the regulatory and fiscal environment, both domestic and international is uncertain, whether linked to climate, corporate taxes, what differential tax rates would be labeled “state aid”, and others.

Many societies are in the midst of unprecedented experiments, with no model of society being perceived as clearly worth emulation.

In such uncertain worlds, the best thing investors can do is be prepared for mobility – be nimble and able to become “liquid” on moments’ notice. This means investing in deeper bond and stock markets, but even in them for shorter periods of time – “renting” them, rather than buying into the businesses underlying them, and less so in immobile assets. Among the consequence of such actions are low velocity of money (with less confidence, money flows more slowly) and less capital spending, in “immobile assets” in particular.

As to in- and outflows to gold, its price fluctuations post-crisis suggest that its main feature is being a global reserve currency, a substitute to the dollar. As the euro’s and the yen’s credibility to be reserve currencies first weakened since 2008, and the yuan, a communist party-ruled country’s currency is not fit to play such role, by 2011 the dollar’s dominant status as reserve currency even strengthened.

First the price of gold rose steadily from US$600 per ounce in 2005 to $1,900 in 2011, dropping to $1,200 these days. And much sound and fury notwithstanding, the exchange rate between the dollar, euro and yen are now exactly where they were in 2005, with the price of an ounce of gold doubling since.

The stagnant real wages in Main Street’s immobile sectors are consistent with the rising stock prices and low interest rates. Not only are investors less willing to deploy capital in relatively illiquid assets, but also that critical mass of talented people, I often call the “vital few”, has been moving toward the occupations of the “mobile” sector, such as technology, finance and media.

Such moves put caps on wages within the immobile sectors. Just as “stars” quitting a talented team in sports lower the compensation of teammates left behind, so is the case when “stars” in business or technology make their moves away from the “immobile” sectors. Add to these the impact due to heightened competition of tens of millions of “ordinary talents” from around the world, and the stagnant wages in the US’s immobile sectors are not surprising.

This is one respect in which our world differs from the one of post-World War II, when talent poured into the US’s “immobile” sectors, freed from the constraints of the war economy. It differs too in terms of rising inequality of wealth. The Western populations were young then, hungry to restore normalcy, and able to do that in the dozen Western countries only, the rest of the world having closed behind dictatorial curtains.

This is not the case now: the West’s aging boomers and its poorer segments saw the evaporation of equities in homes and increased uncertainty about their pensions in 2008. They went into capital preservation mode with Treasuries, not stocks. At the age of 50-55 and above, people cannot risk their capital, as they do not have time and opportunities to recoup.

However, those for whom losing more would not significantly alter their standards of living did put the money back in stock markets after the crisis. As markets recovered after 2008, wealth disparities increased. This did not happen after World War II; even though stock markets did well, they were in their infancy then. Even in 1952, only 6.5 million Americans owned common stock (about 4% of the US population then). The hoarding during the war did not find its outlet after its end in stock markets, as happened since 2008 for the relatively well to do.

The parallels in terms of monetary and fiscal policies between World War II and today, and the non-parallels in terms of demography and global trade, shed light on the major trends since the crisis: there are no “conundrums.” This does not mean that solutions are straightforward or can be done unilaterally. The post -World War II world needed Bretton-Woods, and today agreement to stabilize currencies is needed too.

This has not been done. Instead central banks have improvised, though there is no proof that central banks can do well much more than keep an eye on stable prices. The recent improvised venturing into undefined “financial stability”, undefined “cooperation” and “coordination”, and the Fed carrying out, as during World War II, fiscal rather than monetary policy, add to fiscal, regulatory and foreign policy uncertainties, all punish long-term investments and drive money into liquid ones, and society becoming a “rental”, one, with shortened horizons.

Jumps in stock prices with each announcement that the Fed will continue with its present policies and favor devaluation (as Stan Fisher, vice chairman of the Fed just advocated) – does not suggest that things are on the right track, but quite the opposite, that the Fed has not solved any problem, and neither has Washington dealt with fundamentals. Instead, with devaluations, they have avoided domestic fiscal and regulatory adjustments – and hope for the resulting increased exports, that is, relying on other countries making policy adjustments.

Reuven Brenner holds the Repap Chair at McGill University’s Desautels Faculty of Management. The article draws on his Force of Finance (2002).

(Copyright 2014 Reuven Brenner)


U.S. To Ease Repurchase Demands On Bad Mortgages

Mel WattMelvin Watt, director of the Federal Housing Finance Agency, outlined ways in which his agency would clarify actions it takes against bankers on loans that go bad. (Jacquelyn Martin / Associated Press).

by E. Scott Reckard, John Glionna & Tim Logan

Hoping to boost mortgage approvals for more borrowers, the federal regulator of Fannie Mae and Freddie Mac told lenders that the home financing giants would ease up on demands that banks buy back loans that go delinquent.

Addressing a lending conference here Monday, Melvin Watt, director of the Federal Housing Finance Agency, outlined ways in which his agency would clarify actions it takes against bankers on loans that go bad after being sold to Freddie and Fannie.

The agency’s idea is to foster an environment in which lenders would fund mortgages to a wider group of borrowers, particularly first-time home buyers and those without conventional pay records.

To date, though, the agency’s demands that lenders repurchase bad loans made with shoddy underwriting standards have resulted in bankers imposing tougher criteria on borrowers than Fannie and Freddie require.

A lot of good loans don’t get done because of silly regulations that are not necessary. – Jeff Lazerson, a mortgage broker from Orange County

Those so-called overlays in lending standards, in turn, have contributed to sluggish home sales, a drag on the economic recovery and lower profits on mortgages as banks reduced sales to Fannie and Freddie and focused mainly on borrowers with excellent credit.

Watt acknowledged to the Mortgage Bankers Assn. audience that his agency in the past “did not provide enough clarity to enable lenders to understand when Fannie Mae or Freddie Mac would exercise their remedy to require repurchase of a loan.”

Going forward, Watt said, Fannie and Freddie would not force repurchases of mortgages found to have minor flaws if the borrowers have near-perfect payment histories for 36 months.

He also said flaws in reporting borrowers’ finances, debt loads and down payments would not trigger buy-back demands so long as the borrowers would have qualified for loans had the information been reported accurately.  And he said that the agency would release guidelines “in the coming weeks” to allow increased lending to borrowers with down payments as low as 3% by considering “compensating factors.”

The mortgage trade group’s chief executive, David Stevens, said Watt’s remarks “represent significant progress in the ongoing dialogue” among the industry, regulators and Fannie and Freddie. Several banks released positive statements that echoed his remarks.

Others at the convention, however, said Watt’s speech lacked specifics and did little to reassure mortgage lenders that the nation’s housing market would soon be back on track.

“The speech was horribly disappointing,” said Jeff Lazerson, a mortgage broker from Orange County, calling Watt’s delivery and message “robotic.”

“They’ve been teasing us, hinting that things were going to get better, but nothing new came out,” Lazerson said. “A lot of good loans don’t get done because of silly regulations that are not necessary.”

Philip Stein, a lawyer from Miami who represents regional banks and mortgage companies in loan repurchase cases, said the situation was far from returning to a “responsible state of normalcy,” as Watt described it.

“When the government talked of modifications in the process, I thought, ‘Oh, this could be good,'” Stein said. “But I don’t feel good about what I heard today.”

Despite overall improvements in the economy and interest rates still near historic lows, the number of home sales is on pace to fall this year for the first time since 2010 as would-be buyers struggle with higher prices and tight lending conditions

Loose underwriting standards–scratch that, non-existent underwriting standards–caused the mortgage meltdown. If borrowers are willing to put down just 3% for their down payment, their note rate should be 0.50% higher and 1 buy-down point. The best rates should go to 20% down payments.

Once-torrid price gains have cooled, too, as demand has subsided. The nation’s home ownership rate is at a 19-year low.

First-time buyers, in particular, have stayed on the sidelines. Surveys by the National Assn. of Realtors have found first-time owners making up a significantly smaller share of the housing market than the 40% they typically do.

There are reasons for this, economists said, including record-high student debt levels, young adults delaying marriage, and the still-soft job market. But many experts agree that higher down-payment requirements and tougher lending restrictions are playing a role.

Stuart Gabriel, director of the Ziman Center for Real Estate at UCLA, said he’s of a “mixed mind” about the changes.

On one hand, Gabriel said, tight underwriting rules are clearly making it harder for many would-be buyers to get a loan, perhaps harder than it should be.

“If they loosen the rules a bit, they’ll see more qualified applicants and more applicants getting into mortgages,” he said. “That would be a good thing.”

But, he said, a down payment of just 3% doesn’t leave borrowers with much of a cushion. If prices fall, he said, it risks a repeat of what happened before the downturn.

“We saw that down payments at that level were inadequate to withstand even a minor storm in the housing market,” he said. “It lets borrowers have very little skin in the game, and it becomes easy for those borrowers to walk away.”

Selma Hepp, senior economist at the California Assn. of Realtors, said lenders will welcome clarification of the rules over repurchase demands.

But in a market in which many buyers struggle to afford a house even if they can get a mortgage, she wasn’t sure the changes would have much effect on sales.

“We’re still unclear if we’re having a demand issue or a supply issue here,” said Hepp, whose group recently said it expects home sales to fall in California this year. “It may not have an immediate effect. But in the long term, I think it’s very positive news.”

Watt’s agency has recovered billions of dollars from banks that misrepresented borrowers’ finances and home values when they sold loans during the housing boom. The settlements have helped stabilize Fannie and Freddie, which were taken over by the government in 2008, and led many bankers to clamp down on new loans.

Fannie and Freddie buy bundles of home loans from lenders and sell securities backed by the mortgages, guaranteeing payment to investors if the borrowers default.

scott.reckard@latimes.com

john.glionna@latimes.com

tim.logan@latimes.com

Reckard and Logan reported from Los Angeles; Glionna from Las Vegas

Petroamerica Oil: Welcome To The Cheapest Oil Producer Worldwide (Part 1)

By Nathan’s Bulletin in Seeking Alpha

Summary

  • Petroamerica was a fantastic buying opportunity at C$0.39 in August 2014.
  • The stock trades less than 1 times its 2014 EBITDA at the current price of C$0.25.
  • An once-in-a-lifetime buying opportunity is an understatement, and I do pound the table on the value this stock currently represents.

Introduction

Petroamerica Oil (OTCPK:PTAXF) was an exploration company a few years ago that managed to become a well-established oil producer in Colombia. Petroamerica is the definition of a cash cow with a rock solid balance sheet and working capital surplus of US$74 million (see Q2 2014 report) that can withstand any short-term and mid-term volatility of the oil price, as mentioned in my “Top Idea” article in late August 2014.

Aside the consistent production growth on a YOY basis, the company also managed to diversify its asset base while increasing significantly its RLI (reserves life index) pro forma the recent transformative acquisition of Suroco Energy. But this deal coincided with the overall correction of the energy sector and the market did not pay attention to it. So Petroamerica remained a grossly undervalued company at C$0.39 per share in late August 2014.

But Albert Einstein has said: “Two things are infinite: the universe and human stupidity. But I’m not sure about the former”. Einstein could not describe better the reason why Petroamerica has dropped over the last weeks, despite the fact it was already a fantastic buying opportunity at C$0.39. The stock was beaten out primarily by the herd mentality, and the fools abandoned the ship, creating an once-in-a-lifetime buying opportunity.

And believe it or not, the phrase “once-in-a-lifetime buying opportunity” is a vast understatement, because Petroamerica trades below 1 times its 2014 EBITDA at the current price of C$0.25 per share.

As such, I decided to pound the table on the value this company currently represents. Given that I compared Petroamerica primarily to its Colombian, Peruvian, Chilean and Brazilian peers in my “Top Idea” article, this time I will compare Petroamerica to other junior oil-weighted competitors (production up to 10,000 boepd) with onshore production and properties in Argentina, Africa and Middle East.

In Part 1, the peers are from Argentina, Nigeria and Kurdistan. In Part 2, the peers will be from other countries which are equally high risk jurisdictions. All these regions carry much higher geopolitical risk than Colombia’s, while the energy companies there receive Brent pricing.

The Irrational Valuation Is Beyond Any Comprehension

As mentioned above, Argentina, Kurdistan and Nigeria carry much higher geopolitical risk than Colombia’s. And there is no question about this, given the continued headwinds all the energy companies have been facing in these three countries on a permanent basis.

The nationalization fears always linger over Argentina during the last years primarily due to YPF’s (NYSE:YPF) nationalization by the Argentinean Government. These fears coupled with a non-business friendly environment have made several big energy companies dump their Argentinean assets to the local producers and exit Argentina. For instance, both Apache (NYSE:APA) and Gran Tierra Energy (NYSEMKT:GTE) sold their Argentinean assets recently and decided to focus their resources to safer areas. The deal will allow Gran Tierra to further focus on Colombia, Peru and Brazil, Gran Tierra’s CEO Dana Coffield said.

Also, Repsol (OTCQX:REPYY) sold its remaining Argentinean assets in May 2014 and exited Argentina too.

Kurdistan has been in the center of violence in the Middle East over the last ten years, let alone now due to the existence of ISIS (Islamic State of Iraq).

Meanwhile, the piracy and the illegal bunkering coupled with the frequent shutdowns, field pipeline and export facility losses have been hampering for years the smooth execution of the business plans of the Nigerian oil producers. This is why, several major players have sold their assets and have left Nigeria during the last years. They went to greener pastures because they were not able to handle all these headwinds anymore.

In contrast, a huge land rush is happening in the energy sector in Colombia, which is undergoing an evolution over the last years. The number of majors coming in Colombia has been increasing, thanks to several reasons that were analyzed in my latest “Top Idea” article (i.e. improved political and security climate with the funding help of the US).

After all, let’s see now Petroamerica’s peers from Argentina, Nigeria and Kurdistan:

1) Mart Resources (OTCPK:MAUXF).

2) Oryx Petroleum (OTC:ORXPF).

3) Eland Oil and Gas (OTC:ELOGF).

4) Apco Oil and Gas (NASDAQ:APAGF).

5) Americas Petrogas (OTCPK:APEOF).

6) Andes Energia (OTCPK:ANEGY).

7) President Energy (OTC:PPCGF).

I am a strong believer that many investors have never heard about most of these companies. And I am also absolutely sure that Petroamerica’s sellers over the last days are definitely among the investors who see most of these companies for the first time in their life.

Well, this does not surprise me and the ignorance has always been one of the primary factors leading to market inefficiency. As such, some more information about Petroamerica’s competitors is more than necessary:

1) Oryx Petroleum’s single producing asset is in Kurdistan, as shown below:

(click to enlarge)

“Source: Oryx website”

Oryx also has non-producing assets in Nigeria, Senegal and Congo, as shown below:

“Source: Oryx website”

“Source: Oryx website”

“Source: Oryx website”

2) Mart’s single-producing asset is the Umusadege field situated in Nigeria, as shown below:

“Source: Mart website”

3) Eland’s producing properties are in Nigeria, as illustrated below:

4) Apco’s producing properties are in Argentina (Neuquen Basin, Northwest Basin, San Jorge Basin, Austral Basin) and Colombia, as illustrated below:

(click to enlarge)

“Source: Apco website”

5) Americas Petrogas’ producing properties are in Argentina, as illustrated below:

“Source: Americas Petrogas website”

6) Andes’ producing properties are in Argentina while the company also has non-producing assets in Colombia, Brazil and Paraguay, as illustrated below:

(click to enlarge)

“Source: Andes website:

7) President’s main producing properties are in Argentina, where the company gets most of its production, as illustrated below:

“Source: President website”

President has also a small producing asset in the US and non-producing assets in Paraguay, as illustrated below:

“Source: President website”

and below:

“Source: President website”

I must also point out that:

1) I took into account the working capital surplus or deficiency to calculate the Net Debt and thereby the Enterprise Value accurately ($1 = C$1.11, 1GBP=$1.61).

2) I excluded the EV/2P Reserves key ratio. I did this because this is a backward-looking ratio referring to the companies’ reserves as of December 2013, while we are already in Q4 2014 and the companies have completed a significant part of their drilling programs.

3) The EBITDA estimates are based on a $90/bbl (Brent) scenario by year end.

That being said, I will proceed with the calculations on these two key metrics:

1) Per EV/Production: Here is the table with the first key metric:

Company EV($ million) Q4 2014Production

(boepd) (*)

EV———

Q4 2014

Production (*)

($/boepd)

AndesEnergia 350 1,600(100% light oil) 218,750
PresidentEnergy 90 600(~80% light oil & NGLs) 150,000
OryxPetroleum 880 (**) 10,000(100% light oil) 88,000
AmericasPetrogas 95 1,100(100% light oil) 86,364
MartResources 460 5,500(100% light oil) 83,636
Eland Oiland Gas 210 3,000(100% light oil) 70,000
Apco Oiland Gas 420 7,300(56% light oil & NGLs) 57,534
PetroamericaOil 125 7,400+(97% light/medium oil & NGLs) 16,892

(*): Estimate, based on the latest corporate guidance.

(**): Pro forma the offering of July 2014.

2) Per EV/EBITDA: Let’s check out now the table below with the second key metric:

Company EV($ million) 2014 EBITDA($ million) (*) EV———

2014 EBITDA

AndesEnergia 350 10 35
OryxPetroleum 880 (**) 35 25.14
Eland Oiland Gas 210 10 21
PresidentEnergy 90 10 9
AmericasPetrogas 95 15 6.33
Apco Oiland Gas 420 75 5.6
MartResources 460 140 3.29
PetroamericaOil 125 130 0.96

(*): Estimate, based on the latest production guidance.

(**): Pro forma the offering of July 2014.

My Takeaway

Hamsters and gerbills have short-term memories lasting a few hours. I think that the average investor’s memory is better than hamster’s. Reptiles and amphibians have memories lasting few months. And I believe that often the average investor’s memory is hardly better than reptiles’. As such, he forgets quickly without learning from his previous mistakes, and is always ready to throw again and again the baby out with the bath water. This is the case with Petroamerica, since I recommended it at C$0.39 per share in late August 2014.

Since late August 2014, the stock has dropped due to a combination of these reasons:

1) A temporary production disruption in the Putumayo Basin, where Suroco Energy has its producing property (Suroriente Block). As a result of this temporary production restriction, the updated guidance of 7,460 boepd in Q4 2014 was below original 2014 expectations. Nevertheless, it must be pointed out:

a) This temporary disruption did not take place in the Llanos Basin, where Petroamerica has its core producing properties.

b) Suroco’s properties were producing less than 30% of the total Petroamerica’s production.

c) Petroamerica has clearly stated that the production has resumed and normal production operations along with oil evacuation were restored in the Putumayo properties as of October 1, 2014.

d) The YOY production growth is still here, given that Petroamerica was producing 4,390 boepd in Q1 2013 and 6,400 boepd in Q1 2014. Based on the updated guidance of 7,460 boepd, the YOY production growth between Q1 2014 and Q4 2014 is almost 20%.

2) The correction of the oil price and the energy stocks.

3) A dwindling amount of 20 cent warrants holders sold. According to the presentation of September 2013 (slide 29), there were 32.85 million warrants as of August 2013, and according to the latest presentation (slide 23), there were only 9.15 million warrants left as of August 2014.

These warrants were issued as a sweetener for the 2015 note offering, when Petroamerica was a start-up business a few years ago. Those warrant holders have been exercising and cashing out over the last years.

4) The weak hands, the ignorant investors and the short-term traders sold too, running for the hills, so the drop accelerated. Most of them bought on the “Top Idea” article about Petroamerica and were getting shaken out.

The thing is that none of the sellers has realized why he is selling Petroamerica and whether there is a better value out there. None of the sellers has realized the big picture associated with Petroamerica’s peers in Colombia, as described in my “Top Idea” article. None of the sellers has realized the big picture associated with Petroamerica’s peers in Argentina, Africa, and Kurdistan, as described above.

And I am determined to present again the big picture with the help of another article (Part 2) over the next days, because Petroamerica currently is the cheapest oil-weighted producer among all the publicly-traded energy companies in the international markets.

There is not another oil producer that currently trades below 1 times its 2014 EBITDA, while having a pristine balance sheet. And given that my database includes all the publicly-traded energy companies in the US, Canada, Europe, Asia and Australia, I challenge all to write an article about a cheaper energy company with a better balance sheet than Petroamerica’s.

Last but not least:

1) My articles about Petroamerica (Top Idea, Part 1) are based on a relative valuation analysis. In other words, if Brent drops and remains at $90/bbl for many months, it will affect all Petroamerica’s peers that receive Brent pricing. If Brent drops and remains below $90/bbl for many months, it will not affect only Petroamerica’s top and bottom lines.

Based on this easy to understand fact, the current mind-blowing valuation gap between Petroamerica and its peers (Latin American, African, Middle East) is completely unjustifiable, no matter what the Brent pricing is. It does not play one single role whether Brent is at $100/bbl or at $90/bbl.

Petroamerica’s peers currently trade between 4 and 35 times their 2014 EBITDA, while Petroamerica currently trades below 1 times its EBITDA, at the current price of C$0.25 per share. And to be fair, Petroamerica deserves a premium compared to many of its peers, given that many of its peers are leveraged with worse balance sheets and operations in highly risky juridictions, as shown in both my Petroamerica-related articles.

To say it differently, while Petroamerica’s peers have been dropping over the last couple of weeks, Petroamerica should have risen all these days to catch up with its peers’ valuation, closing the tremendous valuation gap.

2) All my previous five energy picks from Colombia (C&C Energia, Petrominerales, Parex, Canacol, Suroco Energy) have risen between 70% and 160% since I recommended them. And Petroamerica Oil at C$0.39 per share was fundamentally better and cheaper than these five companies, let alone now at C$0.25 per share.

3) Three of my previous Colombian picks (C&C Energia, Petrominerales, Suroco Energy) were acquired between 4 and 6 times their EBITDA.

4) Just a few days ago, privately held Pluspetrol Resources agreed to buy Apco Oil and Gas for $427 million, which is 5.6 times its 2014 EBITDA. Apco operates primarily in Argentina and also has some producing Blocks in Colombia, as shown in the previous paragraph.

Apparently, the blindingly obvious is not blindingly obvious for the average investor, and this is why he is always doomed to lose in the stock market. Thanks to the average investor, the smart money makes easy money.

Disclaimer: This article covers a stock trading at less than $1 per share and/or with less than a $100 million market cap. Please be aware of the risks associated with these stocks.

Excluding Oil, The US Trade Deficit Has Never Been Worse

By Tyler Durden, Zero Hedge

Remember when in January 2010 Obama promised that he should double US exports in five years in a bid to collapse the US trade deficit? Not only that, but in his 2010 SOTU address, Obama doubled down by saying “It’s time to finally slash the tax breaks for companies that ship our jobs overseas and give those tax breaks to companies that create jobs in the United States of America.”

Back then, Jennifer R. Psaki who was still a simple White House spokesperson, said that the White House “had been working for several months on a policy to increase exports. She said the plans included the creation of an export promotion cabinet and steps to help small and medium-size businesses tap markets in other countries. ”

Well, it isn’t quite five years later (he still has six months), but we doubt that anyone would have expected what the outcome of Obama’s export boosting campaign would be. We show it below in the following chart which captures the US trade deficit, excluding oil.


What this chart shows is that when it comes to core manufacturing and service trade, that which excludes petroleum, the US trade deficit hit some $49 billion dollars in the month of May, the highest real trade deficit ever recorded!

In other words, far from doubling US exports, Obama is on pace to make the export segment of the US economy the weakest it has ever been, leading to millions of export-producing jobs gone for ever (but fear not, they will be promptly replaced by part-time jobs). It also means that the collapse in Q1 GDP, much of which was driven by tumbling net exports, will continue as America appear largely unable to pull itself out of its international trade funk, much less doubling its exports.

What’s perhaps just as bad, is that the chart above shows that global trade continues to collapse: just recall the near standstill in Chinese trade, both exports and imports, that took place earlier this year. We wonder: is the fact that the world is trading with each other at the slowest pace since the Lehman collapse also due to harsh winter weather?

Yet while core trade is the worst ever, overall US trade is not all that bad. Why? Because of the shale revolution of course, and the fact that net US petroleum imports have plunged.


Note, the above chart does not imply the US is a net exporter of petroleum, especially considering the recent news surrounding the easing of the oil export ban. That simply won’t happen as was explained previously. What it does show is that oil imports as a percentage of the total US trade deficit continue to decline, even if the US still remains a net oil importer.  Which is curious because as Bloomberg reports, “the U.S. will remain the world’s biggest oil producer this year after overtaking Saudi Arabia and Russia as extraction of energy from shale rock spurs…  U.S. production of crude oil, along with liquids separated from natural gas, surpassed all other countries this year with daily output exceeding 11 million barrels in the first quarter, the bank said in a report today. The country became the world’s largest natural gas producer in 2010. The International Energy Agency said in June that the U.S. was the biggest producer of oil and natural gas liquids.”

So even with the world’s biggest crude production, the US still needs to import nearly $9 billion in petroleum goods every month? That is hardly enough to offset the massive loss of jobs experienced in other non-energy sectors of the economy which unlike oil, have never seen a worse trade deficit.

Furthermore, even as the energy sector soaks up some $200 billion in capex or some 20% of the total private fixed-structure spending, the US shale renaissance will only persist for another 5 or so years before the output rates peak and resume their downward direction:

U.S. oil output will surge to 13.1 million barrels a day in 2019 and plateau thereafter, according to the IEA, a Paris-based adviser to 29 nations. The country will lose its top-producer ranking at the start of the 2030s, the agency said in its World Energy Outlook in November.

Or sooner. Or later. The funny thing about petroleum production is how dependant on extraction technology it is. Still, while the shale revolution has been a blessing since the Lehman collapse, it may be on the verge of some serious disappointments: recall back in March when the Monterey Shale, whose reserves were said to account for two-thirds of all recoverable US shale oil resources, saw the EIA cuts these estimates by a whopping 96% overnight!

Furthermore, as we also reported back in March, the US may well have hit the tipping ROI point, as shale costs have exploded in recent months. In fact, the one thing that may be masking the increasing unprofitability of shale production in the US is that old standby: debt. Some of the choice fragments from the indepth look at the shale industry, from Shale Boom Goes Bust As Costs Soar:

The U.S. shale patch is facing a shakeout as drillers struggle to keep pace with the relentless spending needed to get oil and gas out of the ground.

Shale debt has almost doubled over the last four years while revenue has gained just 5.6 percent, according to a Bloomberg News analysis of 61 shale drillers. A dozen of those wildcatters are spending at least 10 percent of their sales on interest compared with Exxon Mobil Corp.’s 0.1 percent.

“The list of companies that are financially stressed is considerable,” said Benjamin Dell, managing partner of Kimmeridge Energy, a New York-based alternative asset manager focused on energy. “Not everyone is going to survive. We’ve seen it before.”

In a measure of the shale industry’s financial burden, debt hit $163.6 billion in the first quarter… companies including Forest Oil Corp. , Goodrich Petroleum Corp. and Quicksilver Resources Inc. racked up interest expense of more than 20 percent.

Drillers are caught in a bind. They must keep borrowing to pay for exploration needed to offset the steep production declines typical of shale wells. At the same time, investors have been pushing companies to cut back. Spending tumbled at 26 of the 61 firms examined. For companies that can’t afford to keep drilling, less oil coming out means less money coming in, accelerating the financial tailspin.

But one doesn’t need to look at the shale driller’s balance sheets to know that something is afoot: a quick glimpse at recent Bakken shale dynamics, shows that the well efficiency has topped out and the only offset is the exponentially rising number of wells: an exponential line which as the excerpt above shows is only sustainable courtesy of ZIRP and ultra cheap debt. If and when the Fed’s generosity ends, watch out as the shale day of reckoning finally arrives .

In any event, the above shale discussion is tangential – perhaps the US will uncover new technologies to tap even more oil, at lower prices and higher efficiencies. But probably not, as even the E&P industry is increasingly more focused on buybacks and cashing out here and now, than on capex and R&D spending.

Ironically, it is precisely the oil industry in general, and shale in particular, that Obama blasted as recently as 2011. As the NRO helps us recall, it was back in 2007, Obama said he wanted to free America from “the tyranny of oil.” In 2011, he called oil “yesterday’s energy.” He also decried the profits being made by the oil and gas sector and declared that it was time to repeal the tax preferences given to it (which cost taxpayers about $4 billion per year), calling them “oil-company giveaways.” How ironic is it, then, that it is precisely the oil companies which prevent the soaring US trade gap in all other goods and services to disintegrate the US economy completely.

In any event, in a world in which trade increasingly does not matter (because central banks supposedly can and will merely print “prosperity” to offset the lost wealth that comes with international trade and comparative advantage, a concept that has been around since the late 1700s), it is becoming clear that America has certainly adhered to the Fed’s mission of forcing capital misallocation worse than ever, by focusing not on being competitive in an increasingly more technological and sophisticated world, but merely pretending that an economy can achieve escape velocity almost exclusively through stock buybacks.

And yet somehow there are those who still vouch for 3% GDP growth any minute now, a renaissance in capital spending also any minute now, just, well, never now, and who believe that some 285K jobs can be created at a time when the US economy is free falling and the M&A bubble is laying off tens of thousands every month left and right all in the name of the almighty EPS beat.

But then again, Obama still has 6 months to make good on his promise to “double US exports in 5 years.” We are confident that in retrospect, just like in all of his other public appearances, he will have spoken nothing but the truth…

Shocking Facts About The Deindustrialization Of America That Everyone Should Know

How long can America continue to burn up wealth?  How long can this nation continue to consume far more wealth than it produces?  The trade deficit is one of the biggest reasons for the steady decline of the U.S. economy, but many Americans don’t even understand what it is.  Basically, we are buying far more stuff from the rest of the world than they are buying from us.  That means that far more money is constantly leaving the country than is coming into the country.  In order to keep the game going, we have to go to the people that we bought all of that stuff from and ask them to lend our money back to us.  Or lately, we just have the Federal Reserve create new money out of thin air.  This is called “quantitative easing”.  Our current debt-fueled lifestyle is dependent on this cycle continuing.  In order to live like we do, we must consume far more wealth than we produce.  If someday we are forced to only live on the wealth that we create, it will require a massive adjustment in our standard of living.  We have become great at consuming wealth but not so great at creating it.  But as a result of running gigantic trade deficits year after year, we have lost tens of thousands of businesses, millions upon millions of jobs, and America is being deindustrialized at a staggering pace.

Click here to read the rest of this article in The Economic Collapse