Yes, the rushed-to-market Covid “spike protein” vaccine means an unpredictable, genetically engineered and mutated virus fragment is being injected into your blood
(Natural News) Clinical trial geeks posing as journalists manipulate the language around the dirty and experimental methods used today to manufacture vaccines. Online, all the vaccine hucksters are trying to convince everyone that this sped-up hustle to produce a Covid-19 vaccine is still ‘safe and efficacious,’ and not to worry your little head a bit about the fact that it takes 7 to 10 years to even come close to developing a vaccine that works (even though they still have horrific side effects).
(ZeroHedge) Sir Richard Branson once said that the quickest way to become a millionaire was to take a billion dollars and buy an airline. But, as EnerVest Ltd, a Houston-based private equity firm that focuses on energy investments, recently found out, there’s more than one way to go broke investing in extremely volatile sectors.
As theWall Street Journalpoints out today, EnerVest is a $2 billion private-equity fund that borrowed heavily at the height of the oil boom to scoop up oil and gas wells. Unfortunately, shortly after those purchases were made, energy prices plunged leaving the fund’s equity, supplied primarily by pensions, endowments and charitable foundations, worth essentially nothing.
The outcome will leave investors in the 2013 fund with, at most, pennies for every dollar they invested, the people said. At least one investor, the Orange County Employees Retirement System, already has marked its investment down to zero, according to a pension document.
Though private-equity investments regularly flop, industry consultants and fund investors say this situation could mark the first time that a fund larger than $1 billion has lost essentially all of its value.
EnerVest’s collapse shows how debt taken on during the drilling boom continues to haunt energy investors three years after a glut of fuel sent prices spiraling down.
But, at least John Walker, EnerVest’s co-founder and chief executive, expressed some remorse for investors by confirming to the WSJ that they “are not proud of the result.”
All of which leaves EnerVest with the rather unflattering honor of being perhaps the only private equity fund in history to ever raise over $1 billion in capital from investors and subsequently lose pretty much 100% of it.
Only seven private-equity funds larger than $1 billion have ever lost money for investors, according to investment firm Cambridge Associates LLC. Among those of any size to end in the red, losses greater than 25% or so are almost unheard of, though there are several energy-focused funds in danger of doing so, according to public pension records.
EnerVest has attempted to restructure the fund, as well as another raised in 2010 that has struggled with losses, to meet repayment demands from lenders who were themselves writing down the value of assets used as collateral, according to public pension documents and people familiar with the efforts.
So, who’s getting wiped out? Oh, the usual list of pension funds, charities and university endowments.
A number of prominent institutional investors are at risk of having their investments wiped out, including Caisse de dépôt et placement du Québec, Canada’s second-largest pension, which invested more than $100 million. Florida’s largest pension fund manager and the Western Conference of Teamsters Pension Plan, a manager of retirement savings for union members in nearly 30 states, each invested $100 million, according to public records.
The fund was popular among charitable organizations as well. The J. Paul Getty Trust, John D. and Catherine T. MacArthur and Fletcher Jones foundations each invested millions in the fund, according to their tax filings.
Michigan State University and a foundation that supports Arizona State University also have disclosed investments in the fund.
Luckily, we’re somewhat confident that at least the losses accrued by U.S.-based pension funds will be ultimately be backstopped by taxpayers…so no harm no foul.
It seems the end really is nigh for the U.S. dollar.
And the mudfight for global dominance and currency war couldn’t be more ugly or dramatic.
The Saudis are now openly threatening to take down the U.S. economy in the ongoing fallout over collapsing oil prices and tense geopolitical events involving the 9/11 cover-up. The New York Times reports:
Saudi Arabia has told the Obama administration and members of Congress that it will sell off hundreds of billions of dollars’ worth of American assets held by the kingdom if Congress passes a bill that would allow the Saudi government to be held responsible in American courts for any role in the Sept. 11, 2001, attacks.
China’s shift to an official local-currency-based gold fixing is “the culmination of a two-year plan to move away from a US-centric monetary system,” according to Bocom strategist Hao Hong. In an insightfully honest Bloomberg TV interview, Hong admits that “by trading physical gold in renminbi, China is slowly chipping away at the dominance of US dollars.”
Putin also waits in the shadows, making similar moves and creating alliances to out-balance the United States with a growing Asian economy on the global stage.
Luke Rudkowski of WeAreChange asks “Is This The End of the U.S. Dollar?” in the video below.
He writes:
In this video Luke Rudkowski reports on the breaking news of both China and Saudi Arabia making geopolitical moves that could cause a U.S economic collapse and obliteration of the U.S hegemony petrodollar. We go over China’s new gold backed yuan that cannot be traded in U.S dollars and rising tension with Saudi Arabia threatening economic blackmail if their role in 911 is exposed.
Visit WeAreChange.org where this video report was first published.
The Federal Reserve, Henry Kissinger, the Rockefellers and their allies created the petrodollar and insisted upon the world using the U.S. dollar to buy oil, placing debt in American currency and entire countries under the yoke of the West.
But that paradigm has been crumbling as world order shifts away from U.S. hegemony.
It is a matter of when – not if – these events will change the U.S. financial landscape forever.
As SHTF has warned, major events are taking place, and no one can say if stability will be here tomorrow.
Stay vigilant, and prepare yourself and your family as best as you can.
The Russian central bank sees several catalysts that could stop the oil rally in its tracks.
Bearish rig count report from Baker Hughes could signal a reverse in direction.
Supply will continue to increase rather than slow down in 2016 – even if there is a decline in shale production.
Battle for market share is one of the major catalysts not being considered.
I believe it’s very clear this oil rally is running on fumes and was never the result of an improvement in fundamentals. That means to me this rally is going to quickly run out of steam if it isn’t able to run up quicker on existing momentum. I don’t see that happening, and it could pull back dramatically, catching a lot of investors by surprise. The Russian central bank agrees, saying it doesn’t believe the price of oil is sustainable under existing market conditions.
Cited by CNBC, the Russian central bank said, “the current oil market still features a continued oversupply, on the backdrop of a slowdown in the Chinese economy, more supplies originating from Iran and tighter competition for market share.”
In other words, most things in the market that should be improving to support the price of oil aren’t. That can only mean one thing: a violent pullback that could easily push the price of oil back down to the $30 to $32 range. If the price starts to fall quickly, we could see panic selling driving the price down even further.
I think most investors understand this is not a legitimate rally when looking at the lack of change in fundamentals. I’ll be glad when the production freeze hoax is seen for what it is: a manipulation of the price of oil by staggered press releases meant to pull investors along for the ride. The purpose is to buy some time to give the market more time to rebalance. Once this is seen for what it really is, oil will plummet. It could happen at any time in my opinion.
Rig count increases for first time in three months
For the first time in three months, the U.S. rig count was up, increasing by one to 387. By itself this isn’t that important, but when combined with the probability that more shale supply may be coming to the market in 2016, it definitely could be an early sign of the process beginning.
EOG Resources (NYSE:EOG) has stated it plans on starting up to 270 wells in 2016. We don’t know yet how much additional supply it represents, but it’s going to offset some of the decline from other companies that can’t continue to produce at these price levels. There are other low-cost shale producers that may be doing the same, although I think the price of oil will have to climb further to make it profitable for them, probably around $45 per barrel.
It’s impossible to know at this time if the increase in the price of oil was a catalyst, or we’ve seen the bottom of the drop in rig counts. The next round of earnings reports will give a glimpse into that.
Fundamentals remain weak
Most of the recent strength of the price of oil has been the continual reporting on the proposed production freeze from OPEC and Russia. This is light of the fact there really won’t be a freeze, even if a piece of paper is signed saying there is.
We know Iran isn’t going to agree to a freeze, and with Russia producing at post-Soviet highs and Iraq producing at record levels, what would a freeze mean anyway? It would simply lock in output levels the countries were going to operate at with or without an agreement.
The idea is the freeze is having an effect on the market and this will lead to a production cut. That simply isn’t going to happen. There is zero chance of that being the outcome of a freeze, if that ever comes about.
And a freeze without Iran isn’t a freeze. To even call it that defies reality. How can there be a freeze when the one country that would make a difference isn’t part of it? If Iran doesn’t freeze production, it means more supply will be added to the market until it reaches pre-sanction levels. At that time, all Iran has promised is it may consider the idea.
What does that have to do with fundamentals? Absolutely nothing. That’s the point.
Analysis and decisions need to be based on supply and demand. Right now that doesn’t look good. The other major catalyst pushing up oil prices has been the belief that U.S. shale production will decline significantly in 2016, which would help support oil. The truth is we have no idea to what level production will drop. It seems every time a report comes out it’s revised in a way that points to shale production remaining more resilient than believed.
I have no doubt there will be some production loss in the U.S., but to what degree there will be a decline, when considering new supply from low-cost shale companies, has yet to be determined. I believe it’s not going to be near to what was originally estimated, and that will be another element weakening support over the next year.
Competing for market share
One part of the oil market that has been largely ignored has been the competition for market share itself. When U.S. shale supply flooded the market, the response from Saudi Arabia was to not cede market share in any way. That is the primary reason for the plunge in oil prices.
There has been no declaration by the Saudis that they are going to change their strategy in relationship to market share and have said numerous times they are going to let the market sort it out, as far as finding a balance between supply and demand. So the idea they are now heading in a different direction is a fiction created by those trying to find anything to push up the price of oil.
It is apparent some of the reason for increased U.S. imports comes from Saudi Arabia in particular lowering its prices to nudge out domestic supply. It’s also why the idea of inventory being reduced in conjunction with lower U.S. production can’t be counted on. It looks like imports will continue to climb while shale production declines.
More competition means lower prices, although in this case, Saudi Arabia is selling its oil at different price points to different markets. It’s the average that matters there, and we simply don’t have the data available to know what that is.
In the midst of all of this, Russia is battling the Saudis for share in China, while the two also battle it out in parts of Europe, with Saudi Arabia looking to take share away from Russia. Some of Europe has opened up to competitors because it doesn’t want to rely too much on Russia as its major energy source.
For this and other competitive reasons, I could never trust a production freeze agreement if it ever came to fruition. They haven’t been adhered to in the past, and they won’t be if it happens again. Saudi Arabia has stated several times that it feels the same way.
Conclusion
To me the Russian central bank is spot on in saying the chance of a sustainable oil rally is slim. It also accurately pointed out the reasons for that: it’s about the lack of the fundamentals changing.
With U.S. inventory increasing, rig counts probably at or near a bottom, no end in sight to oversupply continuing, and competition for a low-demand market heating up, there is nothing I see that can justify an ongoing upward price move. I don’t even see it being able to hold.
A weaker U.S. dollar has legitimately helped some, but it can’t support the price of oil on its own. When all the other factors come together in the minds of investors, and the price of oil starts to reverse direction, there is a very strong chance a lot of bullish investors are going to get crushed hard. It is probably time to take some profits and run for the exit if you’re in the oil market for the short term.
Irrational Oil Optimists About To Experience Some Panic Selling Pain
Summary
Short-term positions in oil getting more risky.
U.S. production will outperform estimates as shale producers add supply to the market.
Inventory will come under more strain as key U.S. storage facilities approach full capacity.
Dollar weakness isn’t enough to maintain oil price momentum.
The longer the price of oil has upward momentum, and the higher it goes, the more risky it becomes for investors because there is nothing outside of a weakening U.S. dollar to justify any kind of move we’ve seen the price of oil make recently.
The falling dollar isn’t enough to keep the oil price from falling to where it belongs, and that means when the selloff begins, it’s likely to gravitate into full-panic mode, with sellers running for the exits before they get burned.
This is especially risky for those looking to make a quick windfall from the upward movement of oil. I’m not concerned about those taking long-term positions in quality energy companies with significant oil exposure, since they’ve probably enjoyed some great entry points. There is, of course, dividend risk, along with the strong probability of further share erosion before there is a real recovery that has legs to stand on because it’s based on fundamentals.
For that reason, investors should seriously consider taking profits off the table and wait for better conditions to re-enter.
Oil has become a fear play. Not the fear of losing money, but the fear of not getting in on the fast-moving action associated with the quick-rising price of oil. Whenever there is a fear play, it is ruled by emotion, and no amount of data will convince investors to abandon their giddy profits until they lose much, if not all, of what they gained. Don’t be one of them.
Having been a financial adviser in the past, I know what a lot of people are thinking at this time in response to what I just said. I’ve heard it many times before. It usually goes something like this: “What if the price of oil continues to rise and I lose a lot of money because of leaving the market too soon?” That’s a question arising from a fear mentality. The better question is this: “What if the oil price plunges and panic selling sets in?”
Oil is quickly becoming a casino play on the upside, and the longer investors stay in, the higher the probability they’ll lose the gains they’ve enjoyed. Worse, too much optimism could result in losses if preventative action isn’t taken quickly enough.
What needs to be considered is why one should stay in this market. What is so convincing it warrants this type of increasing risk, which offers much less in the way of reward than even a week ago? What fundamentals are in place that suggest a sustainable upward movement in the price of oil? The answer to those questions will determine how oil investors fare in the near future.
U.S. shale production
The more I think on the estimates associated with U.S. shale production in 2016, measured against the statements made by stronger producers that they’re going to boost supply from premium wells this year, the more I’m convinced it isn’t going to fall as much as expected. New supply will offset a lot of the less productive and higher cost wells being shuttered. I do believe there will be some loss of production from that, but not as much as is being suggested.
There are various predictions on how much production is going to be lost, but the general consensus is from 300,000 bpd to 600,000 bpd. It could come in on the lower side of that estimate, but I don’t think it’ll be close to the upper end of the estimate.
What is unknown because we don’t have an historical guideline to go by is, the amount of oil these premium wells will add to supply. We also don’t know if the stated goals will be followed up on. I think they will, but we won’t know for certain until the next couple of earnings reports give a clearer picture.
When combined with the added supply coming from Iran, and the ongoing high levels of production from Saudi Arabia, Russia and Iraq, I don’t see how the current support for the price of oil can continue on for any length of time.
There is no way of knowing exactly when the price of oil will once again collapse, but the longer it stays high without a change in the fundamentals, the higher the risk becomes, and the more chance it could swing the other way on momentum, even if it isn’t warranted. It could easily test the $30 mark again under those conditions.
Inventory challenges
What many investors don’t understand about storage and inventory is it definitely matters where the challenges are located. That’s why Cushing being over 90 percent capacity and Gulf storage only a little under 90 percent capacity means more than if other facilities were under similar pressure. Together, they account for over 60 percent of U.S. storage.
With the imbalance of supply and demand driving storage capacity levels, the idea of oil staying above $40 per barrel for any period of time is highly unlikely. A lower U.S. dollar and the highly irrelevant proposed production freeze talks can’t balance it off.
Once the market digests this, which could happen at any time, we’ll quickly enter bear mode again. The problem is the price of oil is straining against its upper limits, and if momentum starts to deflate, the race to sell positions will become a sprint and not a marathon.
Uncertainty about shale is the wild card
As already mentioned, U.S. shale production continues to be the major catalyst to watch. The problem is we have no way of knowing what has already been unfolding in the first quarter. If investors start to abandon their positions, and we find shale supply is stronger than projected, it’ll put further downward pressure on oil after it has already corrected.
What I mean by that is we should experience some fleeing from oil before the next earnings reports from shale producers are released. If the industry continues to surprise on the upside of supply, it’ll cause the price of oil to further deteriorate, making the outlook over the next couple of months potentially ominous.
This isn’t just something that has a small chance of happening; it’s something that has a very strong probability of happening. Agencies like IEA have already upwardly revised their outlook for shale supply in 2016, and if that’s how it plays out, the entire expected performance for the year will have to be adjusted.
Conclusion
Taking into account the more important variables surrounding what will move the price of oil, shale production remains the most important information to follow. Not much else will matter if supply continues to exceed expectations. It will obliterate all the models and force analysts to admit this has little to do with prior supply cycles and everything to do with a complete market disruption. Many are still in denial of this. They’ll learn the reality soon enough.
That doesn’t mean there won’t eventually be a time when demand finally catches up with supply, but within the parameters of this weak global economy and oil supply that continues to grow, it’s going to take a lot longer to realize than many thought.
For several months, it has been understood that the market underestimated the expertise and efficiency of U.S. shale producers, and to this day they continue to do so. We will find out if that remains in play in the first half of 2016, and by then, whether it’ll extend further into 2017.
As for how it will impact the price of oil now, if we start to have some panic selling before the earnings reports, and the earnings reports of the important shale producers exceed expectations on the supply side, with it being reflected in an increase in the overall output estimates for the year, it will put more downward pressure on oil.
The other scenario is oil lingers around $40 per barrel until the earnings reports come out. There will still be a decline in the price of oil, the level of which would depend on how much more supply shale producers brought to the market in the first quarter than expected.
My thought is we’re going to experience a drop in the price of oil before earnings reports, which then could trigger a secondary exodus from investors in it for short-term gains.
For those having already generated some decent returns, it may be time to take it off the table. I don’t see how the shrinking reward can justify the growing risk.
The residents of West Texas are accustomed to a life dependent on hydrocarbons. As Bloomberg reports, the small communities built into the flat West Texas desert are dotted with oil pumps and rigs, and the chemical smell of an oil field hangs in the air.
Here the economy rises and falls on drilling.
When the drilling is good, everyone in the town benefits. When it’s bad, most of West Texas feels the pinch.
Oil prices have plunged as much as 75 percent since June 2014. That drop has dismal consequences for residents, and not just the ones working in oil fields. Bloomberg spoke with some of the people trying to endure the historic dip in oil prices. This video tells some of their stories….
In sharp contrast, click the following to enjoy this bitter sweet October, 2013 oil boom report by (CNN Money) titled ‘Moving in droves’ to Midland, Texas
Last week, during the peak of the commodity short squeeze, we pointed out how this default cycle is shaping up to be vastly different from previous one: recovery rates for both secured and unsecured debts are at record low levels. More importantly, we noted how this notable variance is impacting lender behavior, explaining that banks – aware that the next leg lower in commodities is imminent – are not only forcing the squeeze in the most trashed stocks (by pulling borrow) but are doing everything in their power to “assist” energy companies to sell equity, and use the proceeds to take out as much of the banks’ balance sheet exposure as possible, so that when the default tsunami finally arrives, banks will be as far away as possible from the carnage. All of this was predicated on prior lender conversations with the Dallas Fed and the OCC, discussions which the Dallas Fed vocally denied accusing us of lying, yet which the WSJ confirmed, confirming the Dallas Fed was openly lying.
This was the punchline:
[Record low] recovery rate explain what we discussed earlier, namely the desire of banks to force an equity short squeeze in energy stocks, so these distressed names are able to issue equity with which to repay secured loans to banks who are scrambling to get out of the capital structure of distressed E&P names. Or as MatlinPatterson’s Michael Lipsky put it: “we always assume that secured lenders would roll into the bankruptcy become the DIP (debtor in possession) lenders, emerge from bankruptcy as the new secured debt of the company. But they don’t want to be there, so you are buying the debt behind them and you could find yourself in a situation where you could lose 100% of your money.“
And so, one by one the pieces of the puzzle fall into place: banks, well aware that they are facing paltry recoveries in bankruptcy on their secured exposure (and unsecured creditors looking at 10 cents on the dollar), have engineered an oil short squeeze via oil ETFs…
… to take advantage of panicked investors some of whom are desperate to cover their shorts, and others who are just as desperate to buy the new equity issued. Those proceeds, however, will not go to organic growth or even to shore liquidity but straight to the bank to refi loan facilities and let banks, currently on the hook, leave silently by the back door. Meanwhile, the new investors have no security claims and zero liens, are at the very bottom of the capital structure, and face near certain wipe outs.
In short, once the current short squeeze is over, expect everyone to start paying far more attention to recovery rates and the true value of “fundamentals.”
Going back to what Lipsky said, “the banks do not want to be there.” So where do they want to be? As far away as possible from the shale carnage when it does hit.
Today, courtesy of The New York Shock Exchange, we present just the case study demonstrating how this takes place in the real world. Here the story of troubled energy company “Lower oil prices for longer” Weatherford, its secured lender JPM, the incestuous relationship between the two, and how the latter can’t wait to get as far from the former as possible, in…
I am on record saying that Weatherford International is so highly-leveraged that it needs equity to stay afloat. With debt/EBITDA at 8x and $1 billion in principal payments coming due over the next year, the oilfield services giant is in dire straits. Weatherford has been in talks with JP Morgan Chase to re-negotiate its revolving credit facility — the only thing keeping the company afloat. However, in a move that shocked the financial markets, JP Morgan led an equity offering that raised $565 million for Weatherford. Based on liquidation value Weatherford is insolvent. The question remains, why would JP Morgan risk its reputation by selling shares in an insolvent company?
According to the prospectus, at Q4 2015 Weatherford had cash of $467 million debt of $7.5 billion. It debt was broken down as follows: [i] revolving credit facility ($967 million), [ii] other short-term loans ($214 million), [iii] current portion of long-term debt of $401 million and [iv] long-term debt of $5.9 billion. JP Morgan is head of a banking syndicate that has the revolving credit facility.
Even in an optimistic scenario I estimate Weatherford’s liquidation value is about $6.7 billion less than its stated book value. The lion’s share of the mark-downs are related to inventory ($1.1B), PP&E ($1.9B), intangibles and non-current assets ($3.5B). The write-offs would reduce Weatherford’s stated book value of $4.4 billion to – $2.2 billion. After the equity offering the liquidation value would rise to -$1.6 billion.
JP Morgan and Morgan Stanley also happen to be lead underwriters on the equity offering. The proceeds from the offering are expected to be used to repay the revolving credit facility.
In effect, JP Morgan is raising equity in a company with questionable prospects and using the funds to repay debt the company owes JP Morgan. The arrangement allows JP Morgan to get its money out prior to lenders subordinated to it get their $401 million payment. That’s smart in a way. What’s the point of having a priority position if you can’t use that leverage to get cashed out first before the ship sinks? The rub is that [i] it might represent a conflict of interest and [ii] would JP Morgan think it would be a good idea to hawk shares in an insolvent company if said insolvent company didn’t owe JP Morgan money?
The answer? JP Morgan doesn’t care how it looks; JP Morgan wants out and is happy to do it while algos and momentum chasing day traders are bidding up the stock because this time oil has finally bottomed… we promise.
So here’s the good news: as a result of this coordinated lender collusion to prop up the energy sector long enough for the affected companies to sell equity and repay secured debt, the squeeze may last a while; as for the bad news: the only reason the squeeze is taking place is because banks are looking to get as far from the shale patch and the companies on it, as possible.
We leave it up to readers to decide which “news” is more relevant to their investing strategy.
We grow up being taught a very specific set of principles.
One plus one equals two. I before E, except after C.
As we grow older, the principles become more complex.
Take economics for example.
The law of supply states that the quantity of a good supplied rises as the market price rises, and falls as the price falls. Conversely, the law of demand states that the quantity of a good demanded falls as the price rises, and vice versa.
These basic laws of supply and demand are the fundamental building blocks of how we arrive at a given price for a given product.
At least, that’s how it’s supposed to work.
But what if I told you that the principles you grew up learning is wrong?
With today’s “creative” financial instruments, much of what you learned no longer applies in the real world.
Especially when it comes to oil.
The Law of Oil
Long time readers of this Letter will have read many of my blogs regarding commodities manipulation.
With oil, price manipulation couldn’t be more obvious.
“…While agencies have found innovative ways to explain declining oil demand, the world has never consumed more oil.
In 2010, the world consumed a record 87.4 million barrels per day. This year (2014), the world is expected to consume a new record of 92.7 million barrels per day.
Global oil demand is still expected to climb to new highs.
If the price of oil is a true reflection of supply and demand, as the headlines tell us, it should reflect the discrepancy between supply and demand.
Since we know that demand is actually growing, that can’t be the reason for oil’s dramatic drop.
So does that mean it’s a supply issue? Did the world all of a sudden gain 40% more oil? Obviously not.
So no, the reason behind oil’s fall is not the causality of supply and demand.
The reason is manipulation. The question is why.
I go on to talk about the geopolitical reasons of why the price of oil is manipulated.
“On September 11, Saudi Arabia finally inked a deal with the U.S. to drop bombs on Syria.
But why?
Saudi Arabia possesses 18 per cent of the world’s proven petroleum reserves and ranks as the largest exporter of petroleum.
Syria is home to a pipeline route that can bring gas from the great Qatar natural gas fields into Europe, making billions of dollars for Saudi Arabia as the gas moves through while removing Russia’s energy stronghold on Europe.
Could the U.S. have persuaded Saudi Arabia, during their September 11 meeting, to lower the price of oil in order to hurt Russia, while stimulating the American economy?
… On October 1, 2014, shortly after the U.S. dropped bombs on Syria on September 26 as part of the September 11 agreement, Saudi Arabia announced it would be slashing prices to Asian nations in order to “compete” for crude market share. It also slashed prices to Europe and the United States.”
Following Saudi Arabia’s announcement, oil prices have plunged to a level not seen in more than five years.
Is it a “coincidence” that shortly after the Saudi Arabia-U.S. meeting on the coincidental date of 9-11, the two nations inked a deal to drop billions of dollars worth of bombs on Syria? Then just a few days later, Saudi Arabia announces a massive price cut to its oil.
Coincidence?
There are many other factors – and conspiracies – in oil price manipulation, such as geopolitical attacks on Russia and Iran, whose economies rely heavily on oil. Saudi Arabia is also flooding the market with oil – and I would suggest that it’s because they are rushing to trade their oil for weapons to lead an attack or beef up their defense against the next major power in the Middle East, Iran.
However, all of the reasons, strategies or theories of oil price manipulation could only make sense if they were allowed by these two major players: the regulators and the Big Banks.
How Oil is Priced
On any given day, if you were to look at the spot price of oil, you’d likely be looking at a quote from the NYMEX in New York or the ICE Futures in London. Together, these two institutions trade most of the oil that creates the global benchmark for oil prices via oil futures contracts on West Texas Intermediate (WTI) and North Sea Brent (Brent).
What you may not see, however, is who is trading this oil, and how it is being traded.
Up until 2006, the price of oil traded within reason. But all of a sudden, we saw these major price movements. Why?
“Until recently, U.S. energy futures were traded exclusively on regulated exchanges within the United States, like the NYMEX, which are subject to extensive oversight by the CFTC, including ongoing monitoring to detect and prevent price manipulation or fraud.
In recent years, however, there has been a tremendous growth in the trading of contracts that look and are structured just like futures contracts, but which are traded on unregulated OTC electronic markets. Because of their similarity to futures contracts they are often called ”futures look-a likes.”
The only practical difference between futures look-alike contracts and futures contracts is that the look-a likes are traded in unregulated markets whereas futures are traded on regulated exchanges.
The trading of energy commodities by large firms on OTC electronic exchanges was exempted from CFTC oversight by a provision inserted at the behest of Enron and other large energy traders into the Commodity Futures Modernization Act of 2000 in the waning hours of the 106th Congress.
The impact on market oversight has been substantial.
NYMEX traders, for example, are required to keep records of all trades and report large trades to the CFTC. These Large Trader Reports (LTR), together with daily trading data providing price and volume information, are the CFTC’s primary tools to gauge the extent of speculation in the markets and to detect, prevent, and prosecute price manipulation.
…In contrast to trades conducted on the NYMEX, traders on unregulated OTC electronic exchanges are not required to keep records or file Large Trader Reports with the CFTC, and these trades are exempt from routine CFTC oversight.
In contrast to trades conducted on regulated futures exchanges, there is no limit on the number of contracts a speculator may hold on an unregulated OTC electronic exchange, no monitoring of trading by the exchange itself, and no reporting of the amount of outstanding contracts (”open interest”) at the end of each day.
The CFTC’s ability to monitor the U.S. energy commodity markets was further eroded when, in January of this year (2006), the CFTC permitted the Intercontinental Exchange (ICE), the leading operator of electronic energy exchanges, to use its trading terminals in the United States for the trading of U.S. crude oil futures on the ICE futures exchange in London-called ”ICE Futures.”
Previously, the ICE Futures exchange in London had traded only in European energy commodities-Brent crude oil and United Kingdom natural gas. As a United Kingdom futures market, the ICE Futures exchange is regulated solely by the United Kingdom Financial Services rooority. In 1999, the London exchange obtained the CFTC’s permission to install computer terminals in the United States to permit traders here to trade European energy commodities through that exchange.
Then, in January of this year, ICE Futures in London began trading a futures contract for West Texas Intermediate (WTI) crude oil, a type of crude oil that is produced and delivered in the United States. ICE Futures also notified the CFTC that it would be permitting traders in the United States to use ICE terminals in the United States to trade its new WTI contract on the ICE Futures London exchange.
Beginning in April, ICE Futures similarly allowed traders in the United States to trade U.S. gasoline and heating oil futures on the ICE Futures exchange in London. Despite the use by U.S. traders of trading terminals within the United States to trade U.S. oil, gasoline, and heating oil futures contracts, the CFTC has not asserted any jurisdiction over the trading of these contracts.
Persons within the United States seeking to trade key U.S. energy commodities-U.S. crude oil, gasoline, and heating oil futures-now can avoid all U.S. market oversight or reporting requirements by routing their trades through the ICE Futures exchange in London instead of the NYMEX in New York.
As an increasing number of U.S. energy trades occurs on unregulated, OTC electronic exchanges or through foreign exchanges, the CFTC’s large trading reporting system becomes less and less accurate, the trading data becomes less and less useful, and its market oversight program becomes less comprehensive.
The absence of large trader information from the electronic exchanges makes it more difficult for the CFTC to monitor speculative activity and to detect and prevent price manipulation. The absence of this information not only obscures the CFTC’s view of that portion of the energy commodity markets, but it also degrades the quality of information that is reported.
A trader may take a position on an unregulated electronic exchange or on a foreign exchange that is either in addition to or opposite from the positions the trader has taken on the NYMEX, and thereby avoid and distort the large trader reporting system.
Not only can the CFTC be misled by these trading practices, but these trading practices could render the CFTC weekly publication of energy market trading data, intended to be used by the public, as incomplete and misleading.”
Simply put, any one can now speculate and avoid being tagged with illegal price. The more speculative trading that occurs, the less “real” price discovery via true supply and demand become.
With that in mind, you can now see how the big banks have gained control and cornered the oil market.
Continued from the Report:
“…Over the past few years, large financial institutions, hedge funds, pension funds, and other investment funds have been pouring billions of dollars into the energy commodities markets…to try to take advantage of price changes or to hedge against them.
Because much of this additional investment has come from financial institutions and investment funds that do not use the commodity as part of their business, it is defined as ”speculation” by the Commodity Futures Trading Commission (CFTC).
…Reports indicate that, in the past couple of years, some speculators have made tens and perhaps hundreds of millions of dollars in profits trading in energy commodities.
This speculative trading has occurred both on the regulated New York Mercantile Exchange (NYMEX) and on the over-the-counter (OTC) markets.
The large purchases of crude oil futures contracts by speculators have, in effect, created an additional demand for oil, driving up the price of oil to be delivered in the future in the same manner that additional demand for the immediate delivery of a physical barrel of oil drives up the price on the spot market.
As far as the market is concerned, the demand for a barrel of oil that results from the purchase of a futures contract by a speculator is just as real as the demand for a barrel that results from the purchase of a futures contract by a refiner or other user of petroleum.
Although it is difficult to quantify the effect of speculation on prices, there is substantial evidence that the large amount of speculation in the current market has significantly increased prices.
Several analysts have estimated that speculative purchases of oil futures have added as much as $20-$25 per barrel to the current price of crude oil, thereby pushing up the price of oil from $50 to approximately $70 per barrel.”
The biggest banks in the world, such as Goldman Sachs, Morgan Stanley, Citigroup, JP Morgan, are now also the biggest energy traders; together, they not only participate in oil trades, but also fund numerous hedge funds that trade in oil.
Knowing how easy it is to force the price of oil upwards, the same strategies can be done in reverse to force the price of oil down.
All it takes is for some media-conjured “report” to tell us that Saudi Arabia is flooding the market with oil, OPEC is lowering prices, or that China is slowing, for oil to collapse.
Traders would then go short oil, kicking algo-traders into high gear, and immediately sending oil down further. The fact that oil consumption is actually growing really doesn’t matter anymore.
In reality, oil price isn’t dictated by supply and demand – or OPEC, or Russia, or China – it is dictated by the Western financial institutions that trade it.
“For years, I have been talking about how the banks have taken control of our civilization.
…With oil prices are falling, economies around the world are beginning to feel the pain causing a huge wave of panic throughout the financial industry. That’s because the last time oil dropped like this – more than US$40 in less than six months – was during the financial crisis of 2008.
…Let’s look at the energy market to gain a better perspective.
The energy sector represents around 17-18 percent of the high-yield bond market valued at around $2 trillion.
Over the last few years, energy producers have raised more than a whopping half a trillion dollars in new bonds and loans with next to zero borrowing costs – courtesy of the Fed.
This low-borrowing cost environment, along with deregulation, has been the goose that laid the golden egg for every single energy producer. Because of this easy money, however, energy producers have become more leveraged than ever; leveraging themselves at much higher oil prices.
But with oil suddenly dropping so sharply, many of these energy producers are now at serious risk of going under.
In a recent report by Goldman Sachs, nearly $1 trillion of investments in future oil projects are at risk.
…It’s no wonder the costs of borrowing for energy producers have skyrocketed over the last six months.
…many of the companies are already on the brink of default, and unable to make even the interest payments on their loans.
…If oil continues in this low price environment, many producers will have a hard time meeting their debt obligations – meaning many of them could default on their loans. This alone will cause a wave of financial and corporate destruction. Not to mention the loss of hundreds of thousands of jobs across North America.”
You may be thinking, “if oil’s fall is causing a wave of financial disaster, why would the banks push the price of oil down? Wouldn’t they also suffer from the loss?”
Great question. But the banks never lose. Continued from my letter:
“If you control the world’s reserve currency, but slowly losing that status as a result of devaluation and competition from other nations (see When Nations Unite Against the West: The BRICS Development Bank), what would you do to protect yourself?
You buy assets. Because real hard assets protect you from monetary inflation.
With the banks now holding record amounts of highly leveraged paper from the Fed, why would they not use that paper to buy hard assets?
Bankers may be greedy, but they’re not stupid.
The price of hard physical assets is the true representation of inflation.
Therefore, if you control these hard assets in large quantities, you could also control their price.
This, in turn, means you can maintain control of your currency against monetary inflation.
And that is exactly what the banks have done.
The True World Power
Last month, the U.S. Senate’s Permanent Subcommittee on Investigations published a 403-page report on how Wall Street’s biggest banks, such as Goldman Sachs, Morgan Stanley, and JP Morgan, have gained ownership of a massive amount of commodities, food, and energy resources.
The report stated that “the current level of bank involvement with critical raw materials, power generation, and the food supply appears to be unprecedented in U.S. history.”
For example:
“…Until recently, Morgan Stanley controlled over 55 million barrels of oil storage capacity, 100 oil tankers, and 6,000 miles of pipeline. JPMorgan built a copper inventory that peaked at $2.7 billion, and, at one point, included at least 213,000 metric tons of copper, comprising nearly 60% of the available physical copper on the world’s premier copper trading exchange, the LME.
In 2012, Goldman owned 1.5 million metric tons of aluminum worth $3 billion, about 25% of the entire U.S. annual consumption. Goldman also owned warehouses which, in 2014, controlled 85% of the LME aluminum storage business in the United States.” – Wall Street Bank Involvement with Physical Commodities, United States Senate Permanent Subcommittee on Investigations
From pipelines to power plants, from agriculture to jet fuel, these too-big-to-fail banks have amassed – and may have manipulated the prices – of some of the world’s most important resources.
The above examples clearly show just how much influence the Big Banks have over our commodities through a “wide range of risky physical commodity activities which included, at times, producing, transporting, storing, processing, supplying, or trading energy, industrial metals, or agricultural commodities.”
With practically an unlimited supply of cheap capital from the Federal Reserve, the Big Banks have turned into much more than lenders and facilitators. They have become direct commerce competitors with an unfair monetary advantage: free money from the Fed.
Of course, that’s not their only advantage.
According to the report, the Big Banks are engaging in risky activities (such as ownership in power plants and coal mining), mixing banking and commerce, affecting prices, and gaining significant trading advantages.
Just think about how easily it would be for JP Morgan to manipulate the price of copper when they – at one point – controlled 60% of the available physical copper on the world’s premier copper trading exchange, the LME.
How easy would it be for Goldman to control the price of aluminum when they owned warehouses – at one point – that controlled 85% of the LME aluminum storage business in the United States?
And if they could so easily control such vast quantities of hard assets, how easy would it be for them to profit from going either short or long on these commodities?
Always a Winner
But if, for some reason, the bankers’ bets didn’t work out, they still wouldn’t lose.
That’s because these banks are holders of trillions of dollars in FDIC insured deposits.
In other words, if any of the banks’ pipelines rupture, power plants explode, oil tankers spill, or coal mines collapse, taxpayers may once again be on the hook for yet another too-big-to-fail bailout.
If you think that there’s no way that the government or the Fed would allow this to happen again after 2008, think again.
Via the Guardian:
“In a small provision in the budget bill, Congress agreed to allow banks to house their trading of swaps and derivatives alongside customer deposits, which are insured by the federal government against losses.
The budget move repeals a portion of the Dodd-Frank financial reform act and, some say, lays the groundwork for future bailouts of banks who make irresponsibly risky trades.”
Recall from my past letters where I said that the Fed wants to engulf you in their dollars. If yet another bailout is required, then the Fed would once again be the lender of last resort, and Americans will pile on the debt it owes to the Fed.
It’s no wonder that in the report, it actually notes that the Fed was the facilitator of this sprawl by the banks:
“Without the complementary orders and letters issued by the Federal Reserve, many of those physical commodity activities would not otherwise have been permissible ‘financial’ activities under federal banking law. By issuing those complementary orders, the Federal Reserve directly facilitated the expansion of financial holding companies into new physical commodity activities.”
The Big Banks have risked tons of cash lending and facilitating in oil business. But in reality they haven’t risked anything. They get free money from the Fed, and since they aren’t supposed to be directly involved in natural resources, they obtain control in other ways.
Remember, the big banks – and ultimately the Fed who controls them – are the ones who truly control the world. Their monetary actions are the cause of many of the world’s issues and have been used for many years to maintain control of other nations and the world’s resources.
But they can’t simply go into a country, put troops on the ground and take over. No, that would be inhumane.
“Currency manipulation allows developed countries to print and lend to other developing countries at will.
A rich nation might go into a developing nation and lend them millions of dollars to build bridges, schools, housing, and expand their military efforts. The rich nation convinces the developing nation that by borrowing money, their nation will grow and prosper.
However, these deals are often negotiated at a very specific and hefty cost; the lending nation might demand resources or military and political access. Of course, developing nations often take the loans, but never really have the chance to pay it back.
When the developing nations realize they can’t pay back the loans, they’re at the mercy of the lending nations.
The trick here is that the lending nations can print as much money as they want, and in turn, control the resources of developing nations. In other words, the loans come at a hefty cost to the borrower, but at no cost to the lender.”
This brings us back to oil.
We know that oil’s crash has put a heavy burden on many debt facilities that are associated with oil. We also know that the big banks are all heavily leveraged within the sector.
If that is the case, why are the big banks so calm?
The answer is simple.
Asset-Backed Lending
Most of the loans associated with oil are done through asset-backed loans, or reserve-based financing.
It means that the loans are backed by the underlying asset itself: the oil reserves.
So if the loans go south, guess who ends up with the oil?
According to Reuters, JP Morgan is the number one U.S. bank by assets. And despite its energy exposure assumed at only 1.6 percent of total loans, the bank could own reserves of up to $750 million!
“If oil reaches $30 a barrel – and here we are – and stayed there for, call it, 18 months, you could expect to see (JPMorgan’s) reserve builds of up to $750 million.”
No wonder the banks aren’t worried about a oil financial contagion – especially not Jamie Dimon, JP Morgan’s Chairman, CEO and President:
“…Remember, these are asset-backed loans, so a bankruptcy doesn’t necessarily mean your loan is bad.” – Jamie Dimon
As oil collapses and defaults arise, the banks have not only traded dollars for assets on the cheap, but gained massive oil reserves for pennies on the dollar to back the underlying contracts of the oil that they so heavily trade.
The argument to this would be that many emerging markets have laws in place that prevent their national resources from being turned over to foreign entities in the case of corporate defaults.
Which, of course, the U.S. and its banks have already prepared for.
“…If the Fed raises interest rates, many emerging market economies will suffer the consequence of debt defaults. Which, historically means that asset fire sales – often commodity-based assets such as oil and gas – are next.
Historically, if you wanted to seize the assets of another country, you would have to go to war and fight for territory. But today, there are other less bloody ways to do that.
Take, for example, Petrobras – a semi-public Brazilian multinational energy corporation.
…Brazil is in one of the worst debt positions in the world with much of its debt denominated in US dollars.
Earlier this year (2015), Petrobras announced that it is attempting to sell $58 billion of assets – an unprecedented number in the oil industry.
Guess who will likely be leading the sale of Petrobras assets? Yup, American banks.
“…JPMorgan would be tasked with wooing the largest number of bidders possible for the assets and then structure the sales.”
As history has shown, emerging market fire sales due to debt defaults are often won by the US or its allies. Thus far, it appears the Petrobras fire sale may be headed that way.
‘Brazilian state-run oil company Petróleo Brasileiro SA said Tuesday (September 22, 2015) it is closing a deal to sell natural-gas distribution assets to a local subsidiary of Japan’s Mitsui & Co.’
The combination of monetary policy and commodities manipulation allows Western banks and allies to accumulate hard assets at the expense of emerging markets. And this has been exactly the plan since day one.
As the Fed hints of raising rates, financial risks among emerging markets will continue to build. This will trigger a reappraisal of sovereign and corporate risks leading to big swings in capital flows.”
Not only are many of the big banks’ practices protected by government and Fed policies, but they’re also protected by the underlying asset itself. If things go south, the bank could end up owning a lot of oil reserves.
No wonder they’re not worried.
And since the banks ultimately control the price of oil anyway, it could easily bring the price back up when they’re ready.
Controlling the price of oil gives U.S. and its banks many advantages.
For example, the U.S. could tell the Iranians, the Saudis, or other OPEC nations, whose economies heavily rely on oil, “Hey, if you want higher oil prices, we can make that happen. But first, you have to do this…”
You see how much control the U.S., and its big banks, actually have?
At least, for now anyway.
Don’t think for one second that nations around the world don’t understand this.
Just ask Venezuela, and many of the other countries that have succumbed to the power of the U.S. Many of these countries are now turning to China because they feel they have been screwed.
The World Shift
The diversification away from the U.S. dollar is the first step in the uprising against the U.S. by other nations.
As the power of the U.S. dollar diminishes, through international currency swaps and loans, other trading platforms that control the price of commodities (such as the new Shanghai Oil Exchange) will become more prominent in global trade; thus, bringing some price equilibrium back to the market.
And this is happening much faster than you expect.
Chinese President Xi Jinping returned home Sunday after wrapping up a historic trip to Saudi Arabia, Egypt, and Iran with a broad consensus and 52 cooperation agreements set to deepen Beijing’s constructive engagement with the struggling yet promising region.
During Xi’s trip, China upgraded its relationship with both Saudi Arabia and Iran to a comprehensive strategic partnership and vowed to work together with Egypt to add more values to their comprehensive strategic partnership.
Regional organizations, including the Organization of Islamic Cooperation (OIC), the Cooperation Council for the Arab States of the Gulf (GCC) and the Arab League (AL), also applauded Xi’s visit and voiced their readiness to cement mutual trust and broaden win-win cooperation with China.
AL Secretary General Nabil al-Arabi said China has always stood with the developing world, adding that the Arab world is willing to work closely with China in political, economic as well as other sectors for mutual benefit.
The Belt and Road Initiative, an ambitious vision Xi put forward in 2013 to boost inter-connectivity and common development along the ancient land and maritime Silk Roads, has gained more support and popularity during Xi’s trip.
…Xi and leaders of the three nations agreed to align their countries’ development blueprints and pursue mutually beneficial cooperation under the framework of the Belt and Road Initiative, which comprises the Silk Road Economic Belt and the 21st Century Maritime Silk Road.
The initiative, reiterated the Chinese president, is by no means China’s solo, but a symphony of all countries along the routes, including half of the OIC members.
During Xi’s stay in Saudi Arabia, China, and the GCC resumed their free trade talks and “substantively concluded in principle the negotiations on trade in goods.” A comprehensive deal will be made within this year.”
In other words, the big power players in the Middle East – who produce the majority of the world’s oil – are now moving closer to cooperation with China, and away from the U.S.
As this progresses, it means the role of the U.S. dollar, and its value in world trade, will diminish.
And the big banks, which hold trillions of dollars in U.S. assets, aren’t concerned.
Earlier this week, before first JPM and then Wells Fargo revealed that not all is well when it comes to bank energy loan exposure, a small Tulsa-based lender, BOK Financial, said that its fourth-quarter earnings would miss analysts’ expectationsbecause its loan-loss provisions would be higher than expected as a result of a single unidentified energy-industry borrower. This is what the bank said:
“A single borrower reported steeper than expected production declines and higher lease operating expenses, leading to an impairment on the loan. In addition, as we noted at the start of the commodities downturn in late 2014, we expected credit migration in the energy portfolio throughout the cycle and an increased risk of loss if commodity prices did not recover to a normalized level within one year. As we are now into the second year of the downturn, during the fourth quarter we continued to see credit grade migration and increased impairment in our energy portfolio. The combination of factors necessitated a higher level of provision expense.”
Another bank, this time the far larger Regions Financial, said its fourth-quarter charge-offs jumped $18 million from the prior quarter to $78 million, largely because of problems with a single unspecified energy borrower. More than one-quarter of Regions’ energy loans were classified as “criticized” at the end of the fourth quarter.
It didn’t stop there and as the WSJ added, “It’s starting to spread” according to William Demchak, chief executive of PNC Financial Services Group Inc. on a conference call after the bank’s earnings were announced. Credit issues from low energy prices are affecting “anybody who was in the game as the oil boom started,” he said. PNC said charge-offs rose in the fourth quarter from the prior quarter but didn’t specify whether that was due to issues in its relatively small $2.6 billion oil-and-gas portfolio.
Then, on Friday, U.S. Bancorp disclosed the specific level of reserves it holds against its $3.2 billion energy portfolio for the first time. “The reason we did that is that oil is under $30” said Andrew Cecere, the bank’s chief operating officer. What else will Bancorp disclose if oil drops below $20… or $10?
It wasn’t just the small or regional banks either: as we first reported, on Thursday JPMorgan did something it hasn’t done in 22 quarter: its net loan loss reserve increased as a result of a jump in energy loss reserves. On the earnings call, Jamie Dimon said that while he is not worried about big oil companies, his bank has started to increase provisions against smaller energy firms.
Then yesterday it was the turn of the one bank everyone had been waiting for, the one which according to many has the greatest exposure toward energy: Wells Fargo. To be sure, in order not to spook its investors, among whom most famously one Warren Buffet can be found, for Wells it was mostly “roses”, although even Wells had no choice but to set aside $831 million for bad loans in the period, almost double the amount a year ago and the largest since the first quarter of 2013.
What was laughable is that the losses included $118 million from the bank’s oil and gas portfolio, an increase of $90 million from the third quarter. Why laughable? Because that $90 million in higher oil-and-gas loan losses was on a total of $17 billion in oil and gas loans, suggesting the bank has seen a roughly 0.5% impairment across its loan book in the past quarter.
How could this be? Needless to say, this struck us as very suspicious because it clearly suggests that something is going on for Wells (and all of its other peer banks), to rep and warrant a pristine balance sheet, at least until a “digital” moment arrives when just like BOK Financial, banks can no longer hide the accruing losses and has to charge them off, leading to a stock price collapse.
Which brings us to the focus of this post: earlier this week, before the start of bank earnings season, before BOK’s startling announcement, we reported we had heard of a rumor that Dallas Fed members had met with banks in Houston and explicitly “told them not to force energy bankruptcies” and to demand asset sales instead.
Rumor Houston office of Dallas Fed met with banks, told them not to force energy bankruptcies; demand asset sales instead
We can now make it official, because moments ago we got confirmation from a second source who reports that according to an energy analyst who had recently met Houston funds to give his 1H16e update, one of his clients indicated that his firm was invited to a lunch attended by the Dallas Fed, which had previously instructed lenders to open up their entire loan books for Fed oversight; the Fed was shocked by what it had found in the non-public facing records. The lunch was also confirmed by employees at a reputable Swiss investment bank operating in Houston.
This is what took place: the Dallas Fed met with the banks a week ago and effectively suspended mark-to-market on energy debts and as a result no impairments are being written down. Furthermore, as we reported earlier this week, the Fed indicated “under the table” that banks were to work with the energy companies on delivering without a markdown on worry that a backstop, or bail-in, was needed after reviewing loan losses which would exceed the current tier 1 capital tranches.
In other words, the Fed has advised banks to cover up major energy-related losses.
Why the reason for such unprecedented measures by the Dallas Fed? Our source notes that having run the numbers, it looks like at least 18% of some banks commercial loan book are impaired, and that’s based on just applying the 3Q marks for public debt to their syndicate sums.
In other words, the ridiculously low increase in loss provisions by the likes of Wells and JPM suggest two things: i) the real losses are vastly higher, and ii) it is the Fed’s involvement that is pressuring banks to not disclose the true state of their energy “books.”
Naturally, once this becomes public, the Fed risks a stampeded out of energy exposure because for the Fed to intervene in such a dramatic fashion it suggests that the US energy industry is on the verge of a subprime-like blow up.
Putting this all together, a source who wishes to remain anonymous, adds that equity has been levitating only because energy funds are confident the syndicates will remain in size to meet net working capital deficits. Which is a big gamble considering that as we first showed ten days ago, over the past several weeks banks have already quietly reduced their credit facility exposure to at least 25 deeply distressed (and soon to be even deeper distressed) names.
However, the big wildcard here is the Fed: what we do not know is whether as part of the Fed’s latest “intervention”, it has also promised to backstop bank loan losses. Keep in mind that according to Wolfe Research and many other prominent investors, as many as one-third of American oil-and-gas producers face bankruptcy and restructuring by mid-2017 unless oil rebounds dramatically from current levels.
However, the reflexive paradox embedded in this problem was laid out yesterday by Goldman who explainedthat oil could well soar from here but only if massive excess supply is first taken out of the market, aka the “inflection phase.” In other words, for oil prices to surge, there would have to be a default wave across the US shale space, which would mean massive energy loan book losses, which may or may not mean another Fed-funded bailout of US and international banks with exposure to shale.
What does it all mean? Here is the conclusion courtesy of our source:
If revolvers are not being marked anymore, then it’s basically early days of subprime when mbs payback schedules started to fall behind. My question for bank eps is if you issued terms in 2013 (2012 reserves) at 110/bbl, and redetermined that revolver in 2014 at 86, how can you be still in compliance with that same rating and estimate in 2016 (knowing 2015 ffo and shut ins have led to mechanically 40pc ffo decreases year over year and at least 20pc rebooting of pud and pdnp to 2p via suspended or cancelled programs). At what point in next 12 months does interest payments to that syndicate start to unmask the fact that tranch is never being recovered, which I think is what pva and mhr was all about.
Beyond just the immediate cash flow and stock price implications and fears that the situation with US energy is much more serious if it merits such an intimate involvement by the Fed, a far bigger question is why is the Fed once again in the a la carte bank bailout game, and how does it once again select which banks should mark their energy books to market (and suffer major losses), and which ones are allowed to squeeze by with fabricated marks and no impairment at all? Wasn’t the purpose behind Yellen’s rate hike to burst a bubble? Or is the Fed less than “macro prudential” when it realizes that pulling away the curtain on of the biggest bubbles it has created would result in another major financial crisis?
The Dallas Fed, whose new president Robert Steven Kaplan previouslyworked at Goldman Sachs for 22 years rising to the rank of vice chairman of investment banking, has not responded to our request for a comment as of this writing. ( source: ZeroHedge )
Fed Response
Over the weekend, we gave the Dallas Fed a chance to respond to a Zero Hedge story corroborated by at least two independent sources, in which we reported that Federal Reserve members had met with bank lenders with distressed loan exposure to the US oil and gas sector and, after parsing through the complete bank books, had advised banks to i) not urge creditor counterparties into default, ii) urge asset sales instead, and iii) ultimately suspend mark to market in various instances.
Moments ago the Dallas Fed, whose president since September 2015 is Robert Steven Kaplan, a former Goldman Sachs career banker who after 22 years at the bank rose to the rank of vice chairman of its investment bank group – an odd background for a regional Fed president – took the time away from its holiday schedule to respond to Zero Hedge.
We thank the Dallas Fed for their prompt attention to this important matter. After all, as one of our sources commented, “If revolvers are not being marked anymore, then it’s basically early days of subprime when MBS payback schedules started to fall behind.” Surely there is nothing that can grab the public’s attention more than a rerun of the mortgage crisis, especially if confirmed by the highest institution.
As such we understand the Dallas Fed’s desire to avoid a public reaction and preserve semantic neutrality by refuting “such guidance.”
That said, we fully stand by our story, and now that we have engaged the Dallas Fed we would like to ask several very important follow up questions, to probe deeper into a matter that is of significant public interest as well as to clear up any potential confusion as to just what “guidance” the Fed is referring to.
Has the Dallas Fed, or any other members and individuals of the Federal Reserve System, met with U.S. bank and other lender management teams in recent weeks/months and if so what was the purpose of such meetings?
Has the Dallas Fed, or any other members and individuals of the Federal Reserve System, requested that banks and other lenders present their internal energy loan books and loan marks for Fed inspection in recent weeks/months?
Has the Dallas Fed, or any other members and individuals of the Federal Reserve System, discussed options facing financial lenders, and other creditors, who have distressed credit exposure including but not limited to:
avoiding defaults on distressed debtor counter parties?
encouraging asset sales for distressed debtor counter parties?
advising banks to avoid the proper marking of loan exposure to market?
advising banks to mark loan exposure to a model framework, one created either by the creditors themselves or one presented by members of the Federal Reserve network?
avoiding the presentation of public filings with loan exposure marked to market values of counter party debt?
Was the Dallas Fed, or any other members and individuals of the Federal Reserve System, consulted before the January 15, 2016 Citigroup Q4 earnings call during which the bank refused to disclose to the public the full extent of its reserves related to its oil and gas loan exposure, as quoted from CFO John Gerspach:
“while we are taking what we believe to be the appropriate reserves for that, I’m just not prepared to give you a specific number right now as far as the amount of reserves that we have on that particular book of business. That’s just not something that we’ve traditionally done in the past.”
Furthermore, if the Dallas Fed, or any other members and individuals of the Federal Reserve system, were not consulted when Citigroup made the decision to withhold such relevant information on potential energy loan losses, does the Federal Reserve System believe that Citigroup is in compliance with its public disclosure requirements by withholding such information from its shareholders and the public?
If the Dallas Fed does not issue “such” guidance to banks, then what precisely guidance does the Dallas Fed issue to banks?
Since the Fed is an entity tasked with serving the public, and since it took the opportunity to reply in broad terms to our previous article, we are confident that Mr. Kaplan and his subordinates will promptly address these follow up concerns.
Finally, in light of this official refutation by the Dallas Fed, we are confident that disclosing the Fed’s internal meeting schedules is something the Fed will not object to, and we hereby request that Mr. Kaplan disclose all of his personal meetings with members of the U.S. and international financial system since coming to office, both through this article, and through a FOIA request we are submitting concurrently. (source: ZeroHedge)
Fed Scrambles as Oil ETN Premium Soars to New Highs
Over the weekend, Zero Hedge reported exclusively how the Dallas Fed is pulling strings behind the scenes to conceal the fallout from the oil market crash. By suspending mark-to-market on energy loans and distorting the accounting, they are postponing the inevitable as long as possible. The current situation is eerily reminiscent to the heyday of the mortgage market in 2007, when mortgage defaults started to pick up, and yet the credit default swaps that tracked them continued to decline, bringing losses to those brave enough to trade against the crowd.
Amidst the market chaos on Friday, a trader brought something strange to my attention. He asked me exactly what the hell was going on with this ETN he was watching. I took a closer look and was baffled. It took me awhile to put the pieces together. Then when I saw the story about mark-to-market being suspended, it all made sense.
Here is the daily premium for the last 6 months on the Barclays iPath ETN that tracks oil:
Initially, I thought this was merely a sign of retail desperation. As they faced devastating losses on their oil stocks, small investors turned to products like oil ETNs as they tried to grasp the elusive oil profits their financial adviser promised them a year ago. Oblivious to the cruel mechanics of ETNs, they piled in head first, in spite of the soaring premium to fair value. After all, Larry Fink is making the rounds to convince the small investor that ETFs are indeed safer than mutual funds. Because nothing says “safe” like buying an ETN that is 36% above its fair value.
Sure, there are differences between ETFs and ETNs, particularly regarding their solvency in the event of an issuer default, but the premium/discount problem plagues ETFs and ETNs alike. Nonetheless, widely trusted retail sources of investment information perpetuate the myth that ETNs do not have tracking errors.
I thought I had connected the dots on the Oil ETN story. It was just retail ignorance. Then I saw this comment from a Zero Hedge reader:
He had a point. On Friday, stocks were slammed, and the team known as 3:30 Ramp Capital was noticeably absent.
Collapse in crude oil prices is a huge blow to areas where oil extraction and associated industries are the bread and butter of the economy.
As petro-economies suffer from the bust in crude prices, the effects are showing up in the housing market.
Take North Dakota, for example, which was on the front lines of the oil boom between 2011 and 2014. In fact, North Dakota is probably the most vulnerable to a downturn in housing because of low oil prices. The economy is smaller and thus more dependent on the oil boom than other places, such as Texas. The state saw an influx of new workers over the past few years, looking for work in in the prolific Bakken Shale. A housing shortage quickly emerged, pushing up prices. With the inability to house all of the new people, rent spiked, as did hotel rates. The overflow led to a proliferation of “man camps.”
Now the boom has reversed. The state’s rig count is down to 53 as of January 13, about one-third of the level from one year ago. Drilling is quickly drying up and production is falling. “The jobs are leaving, and if an area gets depopulated, they can’t take the houses with them and that’s dangerous for the housing market,” Ralph DeFranco, senior director of risk analytics and pricing at Arch Mortgage Insurance Company, told CNN Money.
New home sales were down by 6.3 percent in North Dakota between January and October of 2015 compared to a year earlier. Housing prices have not crashed yet, but there tends to be a bit of a lag with housing prices. JP Ackerman of House Canary says that it typically takes 15 to 24 months before house prices start to show the negative effects of an oil downturn.
According to Arch Mortgage, homes in North Dakota are probably 20 percent overvalued at this point. They also estimate that the state has a 46 percent chance that house prices will decline over the next two years. But that is probably understating the risk since oil prices are not expected to rebound through most of 2016. Moreover, with some permanent damage to the balance sheets of U.S. shale companies, drilling won’t spring back to life immediately upon a rebound in oil prices.
There are some other states that are also at risk of a hit to their housing markets, including Wyoming, West Virginia and Alaska. Out of those three, only Alaska is a significant oil producer, but it is in the midst of a budget crisis because of the twin threats of falling production and rock bottom prices. Alaska’s oil fields are mature, and have been in decline for years. With a massive hole blown through the state’s budget, the Governor has floated the idea of instituting an income tax, a once unthinkable idea.
The downturn in Wyoming and West Virginia has more to do with the collapse in natural gas prices, which continues to hollow out their coal industries. Coal prices have plummeted in recent years, and coal production is now at its lowest level since the Reagan administration. Shale gas production, particularly in West Virginia, partially offsets the decline, but won’t be enough to come to the state’s rescue.
Texas is another place to keep an eye on. However, Arch Mortgage says the economy there is much larger and more diversified than other states, and also better equipped to handle the downturn than it was back in the 1980s during the last oil bust.
But Texas won’t escape unscathed. The Dallas Fed says job growth will turn negative in a few months if oil prices don’t move back to $40 or $50 per barrel. Texas is expected to see an additional 161,200 jobs this year if oil prices move back up into that range. But while that could be the best-case scenario, it would still only amount to one-third of the jobs created in 2014. “The biggest risk to the forecast is if oil prices are in the range of $20 to $30 for much of the year,” Keith Phillips, Dallas Fed Senior Economist, said in a written statement. “Then I expect job growth to slip into negative territory as Houston gets hit much harder and greater problems emerge in the financial sector.”
After 41 consecutive months of increases in house prices in Houston, prices started to decline in third quarter of 2015. In Odessa, TX, near the Permian Basin, home sales declined by 10.6 percent between January and October 2015 compared to a year earlier.
Most Americans will still welcome low prices at the pump. But in the oil boom towns of yesterday, the slowdown is very much being felt.
Term structure – contango says too much oil around.
Brent-WTI says Iran will flood the market.
Crack spreads could crack the recent lows for crude.
OPEC meeting is the next big event – signals are that these guys cannot agree on anything.
Crude oil and a turbulent world.
The price of crude oil has not looked this bad since March, when it made lows of $42.03, or on August 24, when it fell to $37.75. On Friday, November 20, active month January NYMEX crude oil settled at $41.90 per barrel. The expiring December contract traded down to lows of $38.99 on the session. There are very few positive things to say about the future prospects for the price of crude oil at this time. The fundamental structural state of the oil market is bearish for price.
Term Structure – contango says too much oil around
Two weeks ago, the IEA told us that the world is awash in crude oil. The international agency told us that worldwide inventories have swelled to 3 billion barrels.
When crude oil was trading over $100 per barrel on the active month NYMEX futures contract during the summer of 2014, the market was in backwardation. Deferred futures prices were lower than nearby prices. This condition tells us that a market is tight, or there is a supply deficit. As the price of oil began to fall, term structure moved from backwardation to contango. This told us that the market moved from deficit to a condition of oversupply. This past week, the contango on the nearby versus one-year oil spread once again validated the glut condition in crude oil.
(click to enlarge)The December 2015 versus December 2016 NYMEX crude oil spread closed last week at over $8.00 per barrel. The contango has increased to 20.46%, the highest level yet for this spread. The January 2016 versus January 2017 NYMEX spread also made a new high and traded above the $7 level.
Brent crude oil futures have rolled from December to January. The January 2016 versus January 2017 Brent crude oil spread was trading around the $7.62 or 17% level last Friday. Market structure is telling us that huge inventories of crude oil will weigh on the price in the weeks ahead. At their current levels, a new low below the current support at $37.75 seems likely. Meanwhile, a location/quality spread in crude oil is also telling us that prospects for the oil price are currently bleak.
Brent-WTI says Iran will flood the market
The benchmark for pricing North American crude is the NYMEX West Texas Intermediate (WTI) price. When it comes to European, African and Middle Eastern crudes, Brent is the benchmark pricing mechanism. For many years, Brent crude traded at a small discount to WTI. That is because WTI is sweeter crude; it has lower sulfur content. This makes WTI more efficient when it comes to processing the oil into the most ubiquitously consumed oil product, gasoline.
That changed in 2010. The Arab Spring caused uncertainty in the Middle East to rise. As the majority of the world’s oil reserves are located in this region, the price of Brent crude rose relative to the price of WTI. Brent crude included a political premium. Additionally, increasing production from the United States, due to the extraction of oil from shale, exacerbated the price differential between the two crudes. In 2011, the price of Brent traded at over a $25 premium to the price of WTI. Recently, the spread between these two crudes has been converging. While the spread on January futures was trading at a premium of $2.40 for the Brent futures as of last Friday, it had moved much lower during the week.
The premium of Brent over WTI has evaporated over the course of 2015. The reason is two-fold. First, the number of operating oil rigs in the United States has fallen dramatically over the past year, indicating that production of the energy commodity will fall. Last Friday, Baker Hughes reported that the total number of oil rigs in operation as of November 20 stands at 564 down from 1,574 at this time last year. While lower U.S. production is one reason for a decline in the spread, increased production of Iranian crude oil has had a more powerful effect on the spread.
The nuclear nonproliferation agreement with Iran means that sanctions will ease and Iran will pump and export more crude oil in the weeks and months ahead. Iran has stated that their production will initially rise by 500,000 barrels per day and it will eventually rise to over one million. These two factors have caused the Brent-WTI spread to converge. The price trend in this spread is a negative for the price of crude at this time.
Crack spreads could crack the recent lows for crude
Recently, we have seen divergence emerging in crude oil processing spreads. Gasoline cracks have been outperforming crude oil, while heating oil crack spreads continue to trade at the weakest level in years.
Last Friday, the NYMEX gasoline crack spread closed at just over $14 per barrel.
The monthly chart of the gasoline crack highlights the recent strong action in this spread. Gasoline is a seasonal product; it tends to trade at the lows during this time of year. In 2014, the high in the gasoline crack at this time of year was $12.36. Therefore, compared to last year, gasoline prices are strong relative to the price of raw crude oil. This could be due to the current low level of gasoline futures – the December NYMEX gasoline futures contract closed last Friday at $1.2866 and the January futures closed at $1.2670 per gallon. The current low level of gasoline prices has increased demand from drivers as refineries work to process heating oil as the winter is only a few weeks ahead. In September U.S. drivers set a record for miles traveled by automobile.
The heating oil processing spread is a very different story. While the gasoline crack is relatively strong, the heating oil crack is very weak.
(click to enlarge)Last Friday, the January heating oil processing spread closed at around the $17.50 per barrel level. Last year at this time, the low in this spread was $22.73. In 2013, the low was $24.53 and in 2012, the low was $37.75 per barrel. The current level of the heating oil crack spread is seasonally the lowest since November 2010 when it traded down to $12.35 per barrel. In November 2010, crude oil was trading above $84 per barrel.
One of the many reasons that the crude oil price is weak these days is that demand for seasonal products, heating oil and diesel fuel, is low and inventories of distillates are high. As you can see, there are very few bullish signs in the fundamental structure for the crude oil market these days. In two weeks, the oil cartel will sit down to decide what to do now that the commodity they seek to “control” is awash in a sea of bearishness.
OPEC meeting is the next big event – Signals are that these guys cannot agree on anything
When OPEC met in November 2014, the price of crude was around the $75 per barrel level. When they met late last spring, the price had recovered to around $60. In both cases, the cartel left production levels unchanged. The stated production ceiling for the members of OPEC is 30 million barrels per day. The member nations are currently producing over 31.5 million barrels per day and increasing Iranian production means that OPEC output will likely rise. As the price of oil falls, the members need to sell more to try to recoup revenue. For the weaker members, the oil revenue is an imperative. Even the stronger members are under pressure. Saudi Arabia recently began selling bonds; they are borrowing money from the markets to replace lost income due to the lower crude oil price.
Meanwhile, OPEC’s current strategy is to continue to produce to flush high cost producers out of the market and build market share for the cartel members. However, OPEC did not count on a global economic slowdown, particularly in China. At the December 4 meeting of oil ministers in Vienna, it is likely that demand for crude oil will be an important consideration.
Dominant members of the cartel remain at odds. Saudi Arabia and Iran are on opposite sides and are involved in a proxy war in Yemen. The weaker members of OPEC want the stronger members to shoulder the burden of production cuts, and that is not likely to happen any time soon. In a hint of the discord between the member nations, on November 17, OPEC’s board of governors was unable to agree on the cartel’s long-term strategy plan and they tabled the issue until 2016. The issues revolve around ceiling output, setting production quotas and methods of maximizing member profits.
This tells us that unless the cartel is planning a giant spoof on the market, there is probably going to be no change in production policy. The current level of cheating or daily sales above the production ceiling may even increase. At this point, I doubt whether OPEC members could agree on whether it is sunny or cloudy outside given vast political, economic and cultural divergences among member nations. This means that selling will continue and even increase over the months ahead.
Crude oil and a turbulent world
All of the news, fundamentals and technicals for crude oil point to new lows and a challenge of the December 2008 lows of $32.48 per barrel. Last week, Goldman Sachs came out with a prediction that oil could fall to $20 per barrel. This is not such a bold call given the current state of the oil market, the strength of the dollar and the overall bear market for raw material prices. Last week, copper put in another multi-year low, iron ore fell to new lows and the Baltic Shipping Index fell to the lowest level since 1985.
However, all of the bad news for crude oil is currently in the price. We have seen this before. In March when crude oil traded to lows, there were calls for crude oil to fall – Dennis Gartman, the respected commodity analyst, went on CNBC and said that crude oil could fall to $10 per barrel as the energy commodity could go the way of “whale oil.” In late August, when oil fell to recent lows at $37.75, there were multiple calls for oil to fall to the low $30s and $20s. In both cases, powerful recovery rallies followed these bearish market calls. Following the March 2015 lows, oil rallied for over two months and gained 48.9%. In August of this year, a seven-week rally took oil 35% higher. The bearish prediction by Goldman Sachs last week could just turn out to be a contrarian’s dream.
There are a number of issues, big issues, going on in the world that can turn crude oil on a dime. First, Brent has fallen relative to WTI and the political premium for oil has evaporated. In 1990, when Saddam Hussein invaded Kuwait, the price of crude oil doubled in a matter of minutes. While the Middle East has always been a turbulent and dangerous part of the world, I would argue that today, it is far more turbulent and far more violent. The odds of attacks against oil fields and refineries in the Middle East have increased exponentially particularly given the recent ISIS attacks in France and around the world. At the same time, all of the bearish fundamental news about crude oil has decreased the political premium, and it is politics and war that could turn out to outweigh all of the current fundamentals.
Moreover, a surprise from outside of the Middle East could foster an increase in the price of oil. The world is now almost counting on Chinese economic weakness. Last week, Jamie Dimon, the Chairman of JPMorgan Chase, said that he is bullish on Chinese growth. If China does begin to show signs of growth, this could turn out to be supportive of crude oil and commodities in general, which remain mired in a bear market. Right now, the price of crude oil looks awful and fundamentals support a new low. However, all of that bearish data is in the price, and any surprise, in a world that always seems be full of surprises, could ignite the price once again. We saw this in March and again in August. As oil makes new lows, keep in mind that crude oil is a complicated puzzle. It is the unknown that will likely dictate the next big price move in oil. I am watching crude oil now and wondering whether Goldman Sachs called the turn in the market with their bearish forecast.
As a bonus, I have prepared a video on my website Commodix that provides a more in-depth and detailed analysis of the current state of the oil market to illustrate the real value implications and opportunities.
The moon was a waning crescent sliver Sept. 9 when a man emerged from an oil tanker, sidled up to a well outside Cotulla, Texas, and siphoned off almost 200 barrels. Then, he drove two hours to a town where he sold his load on the black market for $10 a barrel, about a quarter of what West Texas Intermediate currently fetches.
“This is like a drug organization,” said Mike Peters, global security manager of San Antonio-based Lewis Energy Group, who recounted the heist at a Texas legislative hearing. “You’ve got your mules that go out to steal the oil in trucks, you’ve got the next level of organization that’s actually taking the oil in, and you’ve got a gathering site — it’s always a criminal organization that’s involved with this.”
From raw crude sucked from wells to expensive machinery that disappears out the back door, drillers from Texas to Colorado are struggling to stop theft that has only worsened amid the industry’s biggest slowdown in a generation. Losses reached almost $1 billion in 2013 and likely have grown since, according to estimates from the Energy Security Council, an industry trade group in Houston. The situation has been fostered by idled trucks, abandoned drilling sites and tens of thousands of lost jobs.
“You’ve got unemployed oilfield workers that unfortunately are resorting to stealing,” said John Chamberlain, executive director of the Energy Security Council.
In Texas, unemployment insurance claims from energy workers more than doubled over the past year to about 110,000, according to the Workforce Commission. In North Dakota, average weekly wages in the Bakken oil patch decreased nearly 10 percent in the first quarter of 2015, compared with the previous quarter, according to the Federal Reserve Bank of Minneapolis.
With dismissals hitting every corner of the industry, security guards hired during boom times are receiving pink slips. That’s leaving sites unprotected.
“There are a lot less eyes out there for security,” said John Esquivel, an analyst at security consulting firm Butchko Inc. in Tomball, Texas, and a former chief executive of the U.S. Border Patrol in Laredo. “The drilling activity may be quieter, but I don’t think criminal activity is.”
Special Charges
States are trying to get a handle on the theft, which can include anything from drill bits that can fetch thousands on the resale market, to copper wiring that can be melted down, to the crude itself. Texas lawmakers met earlier this month in Austin to craft a bill that would increase penalties related to the crime. A similar measure passed both houses of the legislature this year, but Republican Governor Greg Abbott vetoed it, saying it was “overly broad.” Lawmakers, at the urging of industry, are hoping to revive it next legislative session.
In Oklahoma, law-enforcement officers recently teamed with the Federal Bureau of Investigation to intensify their effort. In North Dakota, the FBI earlier this year opened an office in the heart of oil country to combat crimes including theft, drug trafficking and prostitution.
The lull in drilling has given oil companies more time to scrutinize their operations — and their losses.
During booms “they are moving at such a rapid pace there’s not a lot of auditing and inventorying going on,” said Gary Painter, sheriff in Midland County, Texas, in the oil-rich Permian Basin. “Whenever it slows down, they start looking for stuff and find out it never got delivered or it got delivered and it’s gone.”
Oil theft is as old as Spindletop, the East Texas oilfield that spewed black gold in 1901 and began the modern oil era. In the early 1900s, Texas Rangers were often deployed to carry out “town taming” in oil fields rife with roughnecks, prostitutes, gamblers and thieves. In 1932, 18 men were indicted for their role in a Mexia ring that included prominent politicians and executives and resulted in the theft of 1 million barrels.
The allure of ill-gotten oil money remains strong.
In April, the Weld County Sheriff’s office in Colorado recovered almost $300,000 worth of stolen drill bits. In January, a Texas man pleaded guilty to stealing three truckloads of oil worth nearly $60,000 after an investigation by the FBI and local law-enforcement officers. Robert Butler, a sergeant at the Texas Attorney General’s Office whose primary job is to investigate oil theft, said in the legislative hearing that he is investigating a case of 470,000 barrels stolen and sold over the past three years worth about $40 million.
In Texas, oilfield theft has become entangled with Mexican drug trafficking, as the state’s newest and biggest production area, the Eagle Ford Shale region, lies along traditional smuggling routes. That’s thrust oil workers in the middle of cartel activity, and made it even more difficult to track stolen goods across the U.S.-Mexico border, said Esquivel, the retired Border Patrol agent.
Trickling Away
Oil thieves are a slippery bunch. Criminals sand off serial numbers of stolen goods to evade detection or melt them for scrap. Tracking raw crude is even trickier, since tracing it to its originating well is almost impossible once it’s mixed with other oil. Many companies fail to report the crime, making it difficult for investigators to trace the origins of stolen goods.
Many of the crimes are inside jobs, with thieves doubling as gate guards, tank drivers or well servicers. Last year, a federal grand jury indicted three Texas men in connection with the theft of $1.5 million worth of oil from their employers, including Houston’s Anadarko Petroleum Corp.
“Your average person wouldn’t know the value of a drill bit or a piece of tubing or a gas meter,” said Chamberlain. “It’d be like breaking into a jewelry store; unless you know what’s valuable, you wouldn’t know what to steal.”
After some initial excitement, November has seen crude oil prices collapse back towards cycle lows amid demand doubts (e.g. slumping China oil imports, overflowing Chinese oil capacity, plunging China Industrial Production) and supply concerns (e.g. inventories soaring). However, an even bigger problem looms that few are talking about. As Iraq – the fastest-growing member of OPEC – has unleashed a two-mile long, 3 million metric ton barrage of 19 million barrel excess supply directly to US ports in November.
Crude prices are already falling:
But OPEC has another trick up its sleeve to crush US Shale oil producers. As Bloomberg reports,
Iraq, the fastest-growing producer within the 12-nation group, loaded as many as 10 tankers in the past several weeks to deliver crude to U.S. ports in November, ship-tracking and charters compiled by Bloomberg show.
Assuming they arrive as scheduled, the 19 million barrels being hauled would mark the biggest monthly influx from Iraq since June 2012, according to Energy Information Administration figures.
The cargoes show how competition for sales among members of the Organization of Petroleum Exporting Countries is spilling out into global markets, intensifying competition with U.S. producers whose own output has retreated since summer. For tanker owners, it means rates for their ships are headed for the best quarter in seven years, fueled partly by the surge in one of the industry’s longest trade routes.
Worst still, they are slashing prices…
Iraq, pumping the most since at least 1962 amid competition among OPEC nations to find buyers, is discounting prices to woo customers.
The Middle East country sells its crude at premiums or discounts to global benchmarks, competing for buyers with suppliers such as Saudi Arabia, the world’s biggest exporter. Iraq sold its Heavy grade at a discount of $5.85 a barrel to the appropriate benchmark for November, the biggest discount since it split the grade from Iraqi Light in May. Saudi Arabia sold at $1.25 below benchmark for November, cutting by a further 20 cents in December.
“It’s being priced much more aggressively,” said Dominic Haywood, an oil analyst at Energy Aspects Ltd. in London. “It’s being discounted so U.S. Gulf Coast refiners are more incentivized to take it.”
So when does The Obama Administration ban crude imports?
And now, we get more news from Iraq:
*IRAQ CUTS DECEMBER CRUDE OIL OSPS TO EUROPE: TRADERS
So taking on the Russians?
* * *
Finally, as we noted previously, it appears Iraq (and Russia) are more than happy to compete on price.. and have been successful – for now – at gaining significant market share…
Even as both Iran and Saudi Arabia are losing Asian market share to Russia and Iraq, Tehran is closely allied with Baghdad and Moscow while Riyadh is not. That certainly seems to suggest that in the long run, the Saudis are going to end up with the short end of the stick.
Once again, it’s the intersection of geopolitics and energy, and you’re reminded that at the end of the day, that’s what it usually comes down to.
WTI Tumbles To $43 Handle After API Confirms Huge Inventory Build
API reported a huge 6.3 million barrel inventory build (notably larger than expected) extending the series of build to seven weeks. Even more worrying was the massive 2.5 million barrel build at Cushing, even as gasoline inventories fell 3.2mm. WTI immediately dropped 35c, breaking back to a $43 handle after-hours.
Four US Firms With $4.8 Billion In Debt Warned This Week They May Default Any Minute
The last 3 days have seen the biggest surge in US energy credit risk since December 2014, blasting back above 1000bps. This should not be a total surprise since underlying oil prices continue to languish in “not cash-flow positive” territory for many shale producers, but, as Bloomberg reports, the industry is bracing for a wave of failures as investors that were stung by bets on an improving market earlier this year try to stay away from the sector. “It’s been eerily silent,” in energy credit markets, warns one bond manager, “no one is putting up new capital here.”
The market is starting to reprice dramatically for a surge in defaults...
Eleven months of depressed oil prices are threatening to topple more companies in the energy industry. As Bloomberg details,
Four firms owing a combined $4.8 billion warned this week that they may be at the brink, with Penn Virginia Corp., Paragon Offshore Plc, Magnum Hunter Resources Corp. and Emerald Oil Inc. saying their auditors have expressed doubts that they can continue as going concerns. Falling oil prices are squeezing access to credit, they said. And everyone from Morgan Stanley to Goldman Sachs Group Inc. is predicting that energy prices won’t rebound anytime soon.
The industry is bracing for a wave of failures as investors that were stung by bets on an improving market earlier this year try to stay away from the sector. Barclays Plc analysts say that will cause the default rate among speculative-grade companies to double in the next year. Marathon Asset Management is predicting default rates among high-yield energy companies will balloon to as high as 25 percent cumulatively in the next two to three years if oil remains below $60 a barrel.
“No one is putting up new capital here,” said Bruce Richards, co-founder of Marathon, which manages $12.5 billion of assets. “It’s been eerily silent in the whole high-yield energy sector, including oil, gas, services and coal.”
That’s partly because investors who plowed about $14 billion into high-yield energy bonds sold in the past six months are sitting on about $2 billion of losses, according to data compiled by Bloomberg.
And the energy sector accounts for more than a quarter of high-yield bonds that are trading at distressed levels, according to data compiled by Bloomberg.
Barclays said in a Nov. 6 research note that the market is anticipating “a near-term wave of defaults” among energy companies. Those can’t be avoided unless commodity prices make “a very large” and “unexpected” resurgence.
“Everybody’s liquidity is worse than it was at this time last year,” said Jason Mudrick, founder of Mudrick Capital Management. “It’s a much more dire situation than it was 12 months ago.”
While the crude oil tanker backlog in Houston reaches an almost unprecedented 39 (with combined capacity of 28.4 million barrels), as The FT reports that from China to the Gulf of Mexico, the growing flotilla of stationary supertankers is evidence that the oil price crash may still have further to run, as more than 100m barrels of crude oil and heavy fuels are being held on ships at sea (as the year-long supply glut fills up available storage on land). The storage problems are so severe in fact, that traders asking ships to go slow, and that is where we see something very strange occurring off the coast near Galveston, TX.
FT reports that “the amount of oil at sea is at least double the levels of earlier this year and is equivalent to more than a day of global oil supply. The numbers of vessels has been compiled by the Financial Times from satellite tracking data and industry sources.”
The storage glut is unprecedented:
Off Indonesia, Malaysia and Singapore, Asia’s main oil hub, around 35m barrels of crude and shipping fuel are being stored on 14 VLCCs.
“A lot of the storage off Singapore is fuel oil as the contango is stronger,” said Petromatrix analyst Olivier Jakob. Fuel oil is mainly used in shipping and power generation.
Off China, which is on course to overtake the US as the world’s largest crude importer, five heavily laden VLCCs — each capable of carrying more than 2m barrels of oil — are parked near the ports of Qingdao, Dalian and Tianjin.
In Europe, a number of smaller tankers are facing short-term delays at Rotterdam and in the North Sea, where output is near a two-year high. In the Mediterranean a VLCC has been parked off Malta since September.
On the US Gulf Coast, tankers carrying around 20m barrels of oil are waiting to unload, Reuters reported. Crude inventories on the US Gulf Coast are at record levels.
A further 8m barrels of oil are being held off the UAE, while Iran — awaiting the end of sanctions to ramp up exports — has almost 40m barrels of fuel on its fleet of supertankers near the Strait of Hormuz. Much of this is believed to be condensate, a type of ultralight oil.
And unlike the last oil price collapse during the financial crisis only half of the oil held on the water has been put there specifically by traders looking to cash in by storing the fuel until prices recover. Instead, sky-high supertanker rates have prevented them from putting more oil into so-called floating storage, shutting off one of the safety valves that could prevent oil prices from falling further.
A widening oil market structure known as contango — where future prices are higher than spot prices — could make floating storage possible.
The difference between Brent for delivery in six months’ time and now rose to $4.50 last week, up from $1.50 in May. Traders estimate it may need to reach $6 to make sea storage viable.
JBC Energy, a consultancy, said in many regions onshore oil storage is approaching capacity, arguing oil prices may have to fall to allow more to be stored profitably at sea.
“Onshore storage is not quite full but it is at historically high levels globally,” said David Wech, managing director of JBC Energy.
“As we move closer to capacity that is creating more infrastructure hiccups and delays in the oil market, leading to more oil being backed out on to the water.”
Patrick Rodgers, the chief executive of Euronav, one of the world’s biggest listed tanker companies, said oil glut was so severe traders were asking ships to go slow to help them manage storage levels.
“We are being kept at relatively low speeds. The owners of the oil are not in a hurry to get their cargoes. They are managing their storage capacity by keeping ships at a certain speed.”
As a result of all this, something very unusual going on off the coast of Galveston, where more than 39 crude tankers w/ combined cargo capacity of 28.4 million bbls wait near Galveston (Galveston is area where tankers can anchor before taking cargoes to refineries at Houston and other nearby plants), vessel tracking data compiled by Bloomberg show, which compares w/ 30 vessels, 21 million bbls of capacity in May. Vessels wait avg of 5 days, compared w/ 3 days May.
As AP puts it, “a traffic jam of oil tankers is the latest sign of an unyielding global supply glut.”
More than 50 commercial vessels were anchored outside ports in the Houston area at the end of last week, of which 41 were tankers, according to Houston Pilots, an organization that assists in navigation of larger vessels. Normally, there are 30 to 40 vessels, of which two-thirds are tankers, according to the group.
Although the channel has been shut intermittently in recent weeks because of fog or flooding, oil traders pointed to everything from capacity constraints to a lack of buyers.
“It appears that the glut of supply in the global market is only getting worse,” said Matt Smith, director of commodity research at ClipperData. Several traders said some ships might have arrived without a buyer, which can be hard to find as ample supply and end-of-year taxes push refiners to draw down inventories.
Crude Jumps After API Reports Modest Inventory Draw (First In 8 Weeks) Despite Another Big Build At Cushing
11/17/2015: After seven straight weeks of significant inventory builds, API reported a modest 482k draw. That was all the algos needed and WTI immediately ramped back above $41.00. However, what they likely missed was the 2nd weekly (huge) build in Cushing (1.5mm barrels) as we warned earlier on land storage starting to really fill…
In short: “The US is the last place with significant onshore crude storage space left.”
Which leads directly to Citi’s conclusion: “‘Sell the rally’ near-term as fundamentals remain very sloppy and inventory constraints are becoming increasingly more binding.”
Saudis want Big Oil to win – have predictable working relationship with them.
Big Oil is waiting on the sidelines until the price of properties drop.
Those with DUC wells and enough reserves will be able to survive the onslaught.
U.S. shale oil remains viable, but the players are going to change.
As the strategy of Saudi Arabia becomes clearer, along with the response of shale producers to low oil prices, the question now has to be asked as to whether or not the big oil companies support the decision by Saudi Arabia to crush frackers until they have to offer their various plays at fire sale prices.
With the emergence of frackers came a significant number of new competitors in the market that didn’t have an interest in playing nice with OPEC and Saudi Arabia, as major oil companies have in the past. This was a real threat as other OPEC members and shale companies started to take share away from Saudi Arabia.
The general consensus is Saudi Arabia isn’t interested in crushing any particular competitor, rather it’ll keep production at high levels until the weakest producers capitulate. I have thought that as well until recently.
What changed my thinking was analyzing who was the biggest threat to OPEC and Saudi Arabia, and in fact it is the shale industry in the U.S. The reason I draw that conclusion is the energy industry had its traditional competitors in place for many years, and other than occasional moves to impact the price of oil using production levels as the weapon, it has been a relatively stable industry. Shale changed all that.
I think what bothered Saudi Arabia in particular was it didn’t have a working relationship with many of these new competitors, who have been very aggressive with expanding production capacity over the last few years. They were in fact real competitors who were working to take market share away from existing players. And with Saudi Arabia being the low-cost producer with the highest reserves in the world, it was without a doubt a direct assault on its authority and leverage it historically has had on the oil market. Its response to frackers is obvious: it isn’t willing to give up share for any reason.
Where the challenge for Saudi Arabia now is it has started to have to draw on its own reserves and issue bonds to make up for budget shortfalls. It has plenty of reserves, but it appears we now have a clear picture on when it would really come under pressure, which is within a four to five year period. That’s the time it has to devastate its shale competitors.
The other problem for the country is it could take down some members of OPEC in the process, where there are already significant problems they’re facing, which could lead to unrest.
From a pure oil perspective, it seems to be an easy read. Saudi Arabia can outlast the small shale producers with no problem. I think that’s its goal. But it is putting enormous pressure on other countries as well, and there will be increasing pressure for them to slow production in order to support oil prices.
This even extends to Russia, which produces more oil than any other country.
My belief is Saudi Arabia is attempting to force consolidation in the shale industry, so it can resume its dealings with big oil players it has worked with for many years. I believe it’s also what big oil players want. All they have to do is sit back and experience some temporary pain and wait for some of the attractive plays to come onto the market at low prices.
So far the price is still high in the U.S., but as time goes on, the smaller companies will be forced to sell, one way or another. That’s the big opportunity for investors. Identifying those companies with the resources and desire to acquire these properties is the key. That and evaluating the plays with the most potential for those buying them up.
At what price can Saudi crush shale oil?
There are analysts predicting oil price levels that are all over the board. I’ve seen those that believe it’s going to shoot up to over $100 per barrel again, and those that have estimated it could fall to as low as $15 per barrel.
The best way to analyze this is to consider what Saudi Arabia can handle over the longest period of time without destroying its own economy and industry, meaning at what price it can remain fairly healthy and outlast its competitors.
Looking at the price movement of oil and the range it’s now settled into, I think it’s close to what the Saudi have been looking for.
Most smaller shale producers will struggle to make it, if the price of oil remains under $60 per barrel, which it will probably do until Saudi Arabia cuts back on production. There will be occasional moves above that, and probably below $50 per barrel again as well, but I think we can now look to somewhere in the $50 per barrel area as the target being sought. We’ll probably see this be the price range oil will move in for the next couple of years, with $50 being the desired low and $60 being the desired high.
I don’t mean by this Saudi Arabia can absolutely control the price of oil, but it can influence the range it operates in, and I think that’s where we are now.
For that reason oil investors should be safe in investing under these assumptions, understanding there will be occasional price moves outside of that range because of usual trading momentum.
Response from shale oil companies
Some may question why the price of oil got slammed not too long ago, falling below $40 per barrel, if the probable price range for oil is about $10 to $20 per barrel higher.
As mentioned above, some of that was simply from trading momentum. It didn’t take long for it to rebound soon afterward.
The other element was the response by shale companies to the new price of oil, which threatened their ability to pay interest on loans that were due.
Frackers weren’t boosting production because they believed they could outlast Saudi Arabia; they kept production levels high because they had to continue to sell even into that low-price environment or default on their payments. This was a major factor in why prices dropped so far over the short term.
With the bulk of the over $5 trillion spent on shale exploration and development coming from companies operating in the U.S., that is also where the bulk of the risk is.
Much of the efficiencies have been wrung out of operations, and moving to higher producing wells that are less costly to operate can only last so long. I believe efficiencies will position some in the industry to survive the current competitive environment, but they will also have to have enough reserves to tap into in order to do so.
Top producing shale wells are at their highest level of productivity in the first 6 months it goes into operation. It gradually fades after that.
Larger players like EOG Resources (NYSE:EOG) have continued to drill, but they are stopping short of production, with approximately 320 DUC wells ready to bring online when the price of oil reaches desired levels. Its smaller competitors don’t have the resources to wait out existing production levels, which is what will again offer the opportunity for patient investors.
In other words, most of what can be done has been or is currently being done, and from now on it’s simply a waiting game to see how long the Saudis are willing to keep the oil flowing.
Most shale producers believed the lowest oil prices would sustainably fall and would be about $70 per barrel. Decisions were made based upon that assumption.
Big oil and Saudi Arabia
Saudi Arabia and big international energy companies have had close relationships a long time via Saudi Aramco, the state-owned firm.
Those relationships, while competitive, still operated within parameters most agreed upon. Shale producers weren’t playing that game, as they invested trillions and aggressively went after market share. If Saudi Arabia wanted to maintain market share, it had to respond.
If the smaller shale producers thought their strategy though, they must have underestimated the will of Saudi Arabia to fight back against them. Either that or they became overly optimistic and started to believe their own press about the shale revolution.
It’s a revolution for sure, but the majority of those that helped launch it won’t be finishing it.
My point is big oil, in my opinion, doesn’t mind quietly standing on the sidelines as their somewhat friendly competitors destroys their competition and prepares the way for them to acquire shale properties at extremely attractive prices.
I’ve said for some time the shale revolution will go on. The oil isn’t going anywhere. What is changing is who the players will end up being, and what properties they’ll end up acquiring.
With EOG, the strongest shale player, it said the prices of those plays now for sale are still too high; that means the smaller players still think they have some leverage.
My only thought is they are hoping for the large players to enter a bidding war and they can at least recoup some of their capital. I think they’re going to wait until they’re desperate and have no more options.
Sure, some big players may lose out on a desirable property or two, but everyone will get a piece of the action. It appears once the prices move down to levels they’re looking for, at that time they’ll swoop in and make their bids. At that time it’s going to be a buyer’s market.
Big oil companies are the preferable players Saudi Arabia wants to do business with and compete against. They will play the game with them, and there won’t be a lot of surprises.
Some of the companies to watch
Some of the larger companies that have already filed for bankruptcy this year include Hercules Offshore (NASDAQ:HERO), Sabine Oil & Gas (SOGC) and Quicksilver Resources (OTCPK:KWKAQ).
Companies known to have hired advisers for that purpose are Swift Energy (NYSE:SFY) and Energy XXI Ltd. (NASDAQ:EXXI).
Some under heavy pressure include Halcón Resources Corporation (NYSE:HK), SandRidge Energy, Inc. (NYSE:SD) and Rex Energy Corporation (NASDAQ:REXX).
There are more in each category, but I included only those that had at least a decent market cap, with the exception of those that already declared bankruptcy.
Here are a couple of other companies to look at going forward, which can be used for the purpose of analyzing ongoing low prices.
Stone Energy’s credit facility of $500 million is reaffirmed, but may not be liquid enough to endure the next couple of years, even though in the short term it does have decent liquidity. If Saudi Arabia keeps up the pressure, it’s doubtful it will be able to survive on its own. There are quite a few companies falling under these parameters, including Laredo (NYSE:LPI). The basic practice of all of them was to limit the amount of leverage they have in place in order not to have paying off interest as the priority use of their capital, while maintaining a strong credit facility.
I’m not saying these companies will survive, but they will survive if the price of oil stays low, but it will take a lot more to root them up than their highly leveraged peers.
Clayton Williams (NYSE:CWEI) recently put itself up for sale because it can’t afford to continue operating at these prices. It has approximately 340,000 acres under its control, and two of the most productive shale basins in the U.S.
Once it announced it was open to selling, the share price skyrocketed, but since it’s struggling to afford extracting the oil, it’s puzzling as to why some believe it’s going to attract a premium price. It’s possible because of the quality of assets, but it would make more sense for larger companies to wait.
This will be a good test on how big oil companies are going to respond. It’s possible they may be willing to pay for the higher quality shale plays, but under these conditions shareholders would resist paying a significant premium.
If Clayton Williams does go for a premium, it doesn’t in any way mean that’s how it’ll work out for most of the shale companies.
There would have to be a significant reason they would pay such a high price. In the case of CWEI, the catalyst would be high production.
Conclusion
All of this sounds neatly packaged, and if all things proceed as planned, this is how it will play out.
Where there could be some risk is if the Middle East explodes and oil production is interrupted. That would change this entire scenario, and if it were to happen soon, shale companies still in operation would not only survive, but thrive.
Barring that level of disruption, which would have to be something huge, this is how it will play out. After all, with everything going on there now, it hasn’t done anything to disrupt Middle East oil. It would take a big event or a series of events to bring it about. That’s definitely a possibility, but it’s one that is unlikely.
Once all of this plays out, there is no doubt in my mind the bigger oil companies will be much stronger and able to produce a lot more oil.
What we’ll probably see happen is for them to cut back on production to levels where everyone is happy, including the Saudi.
That’s what this war is all about, because shale oil deposits remain in the ground. While some companies can quickly resume production because of the nature of shale oil, which can ramp up production fast, it depends on the will and determination of Saudi Arabia and whether or not the geopolitical situation remains under control.
I don’t care too much about the number of rig counts in shale plays because production can be resumed or initiated quick. The risk is how leveraged the shale companies are, and whether or not they have to continue production at a loss in order to pay off their interest on loans in hopes the price of oil will rise.
What I’m looking for with existing plays is for companies like EOG Resources, which continues to develop wells, but does so without the idea of completing them and bringing them into production until the price of oil rebounds.
Shale oil in the U.S. is alive and well, but those companies overextended and few resources are going to be forced to sell at bargain prices. That will produce a lot of added value to the big oil companies waiting on the sidelines watching it all unfold.
When Whiting Petroleum needed cash earlier this year as oil prices plummeted, JPMorgan Chase, its lead lender, found investors willing to step in. The bank helped Whiting sell $3.1 billion in stocks and bonds in March. Whiting used almost all the money to repay the $2.9 billion it owed JPMorgan and its 25 other lenders. The proceeds also covered the $45 million in fees Whiting paid to get the deal done, regulatory filings show.
Analysts expect Whiting, one of the largest producers in North Dakota’s Bakken shale basin, to spend almost $1 billion more than it earns from oil and gas this year. The company has sold $300 million in assets, reduced the number of rigs drilling for oil to eight from a high of 24, and announced plans to cut spending by $1 billion next year. Eric Hagen, a Whiting spokesman, says the company has “demonstrated that it is taking appropriate steps to manage within the current oil price environment.” Whiting has said it will be in a position next year to have its capital spending of $1 billion equal its cash flows with an oil price of $50 a barrel.
As for Whiting’s investors, the stock is down 36 percent, as of Oct. 14, since the March issue, and the new bonds are trading at 94¢ on the dollar. More than 73 percent of the stocks and bonds issued this year by oil and gas producers are worth less today than when they were sold, data compiled by Bloomberg show.
Banks’ sell-the-risk strategy underpins the shale oil boom. Lenders extended low interest credit to wildcatters desperate for cash, then—perhaps remembering the 1980s oil bust—wheeled the debt off their books by selling new stocks and bonds to investors, earning sizable fees along the way. “Everyone in the chain was making money in the short term,” says Louis Meyer, a special situations analyst at Oscar Gruss & Son. “And no one was thinking long term about what they’re going to do if prices fall.”
North American oil and gas producers have sold $61.5 billion in equity and debt since January, paying more than $700 million in fees, according to data compiled by Bloomberg. Half the money was raised to repay loans or restructure debt, the data show. “Being there for our clients in all market environments, particularly the tough ones, is something we feel very strongly about,” says Brian Marchiony, a JPMorgan spokesman. “During challenging periods, companies typically look to strengthen their balance sheets and increase liquidity, and we have helped many do just that.”
Lenders have been setting aside cash to cover potential energy losses. JPMorgan bolstered its reserves by $160 million in the third quarter. Bank of America’s at-risk loans increased 15 percent from a year ago as a result of the deteriorating finances of some of its oil and gas borrowers. Still, the oil bust has left banks relatively unscathed. Asked why lenders weren’t seeing more losses from energy defaults, BofA Chief Executive Officer Brian Moynihan said in a conference call, “A lot of that risk is distributed out to investors.”
Citigroup, Bank of America, and JPMorgan were among the banks that courted fast-growing shale drillers in the hope that an initial loan would lead to investment banking business. Citigroup’s energy portfolio, including loans and unfunded commitments, swelled to $59.7 billion as of June 30, Bank of America’s to $47.3 billion, and JPMorgan’s to $43.6 billion, according to company filings. “They loan money at cheap rates, and the banks get the fees from the bond and share sales,” says Jason Wangler, an analyst with Wunderlich Securities. “When things are going well, it’s mutually beneficial. Now it’s a different conversation.”
When crude prices plummeted in the early 1980s, hundreds of banks failed across such oil-rich states as Louisiana, Oklahoma, and Texas. This time around, banks were keen to limit their exposure to a boom-and-bust industry. Every year since 2009, about half the debt and equity sold by North American exploration and production companies was intended, at least in part, to restructure debt or repay loans, data compiled by Bloomberg show. Often the banks selling the securities were the ones getting repaid. “The bankers have gone through this before,” says Oscar Gruss’s Meyer. “They know how it works out in the end, and it’s not pretty. Most of the lenders have been more on top of things this time. They are not going to get caught short in the ways they got caught short before.”
The bottom line: Oil companies have sold $61.5 billion in stocks and bonds since January as oil prices have tumbled.
As the housing boom of the 2000’s minted new millionaires every second Tuesday. So, too, the shale oil boom minted wealth faster than McDonald’s mints new diabetics.
Estimates by the UND Center for Innovation Foundation in Grand Forks, are that the North Dakota shale oil boom was creating 2,000 millionaires per year. For instance, the average income in Montrail County has more than doubled since the boom started.
Despite the Great Recession, the oil boom resulted in enough jobs to provide North Dakota with the lowest unemployment rate in the United States. The boom has given the state of North Dakota, a state with a 2013 population of about 725,000, a billion-dollar budget surplus. North Dakota, which ranked 38th in per capita gross domestic product (GDP) in 2001, rose steadily with the Bakken boom, and now has per capita GDP 29% above the national average.
I wonder how many North Dakotan’s have any idea the effect low oil prices are going exert on their living standards, freshly elevated house prices, employment stats, and government revenues.
We’re all about to find out. Here is the last piece in our 5-part series by Harris Kupperman exploring what this means for the fracking industry, oil in general, and the one topic nobody is paying much attention to: the petrodollar.
Enjoy!
——————————
Date: 27 September 2015
Subject: There Will Be Blood – Part V
Starting at the end of 2014, I wrote a number of pieces detailing how QE was facilitating the production of certain real assets like oil where the production decision was no longer being tied to profitability. For instance, shale producers could borrow cheaply, produce at a loss and debt investors would simply look the other way because of the attractive yields that were offered on the debt. The overriding theme of these pieces was that the eventual crack-up in the energy sector would precipitate a crisis that was much larger than the great subprime crisis of last decade as waves of shale defaults would serve as the catalyst for investors to stop reaching for yield and once again try to understand what exactly they owned.
Fast forward 9 months from the last piece and most of these shale producers are mere shells of themselves. If you got out of the way—good for you. Amazingly, these companies can still find creative ways to tap the debt markets, stay alive and flood the market with oil. Eventually, most won’t make it and I believe that the ultimate global debt write-off is in the hundreds of billions of dollars—maybe even a trillion depending on which larger players stumble. That doesn’t even include the service companies or the employees who have their own consumer and mortgage debt.
I believe that shale producers are the “sub-prime” of this decade. As they vaporize hundreds of billions in investor capital, thus far, there has been a collective shrug as everyone ignores the obvious – until suddenly it begins to matter. By way of timelines, I think we are now getting to the early summer of 2008 – suddenly the smart people are beginning to realize that something is wrong. Credit spreads are the life-line of the global financial world. They’re screaming danger. I think the equity markets are about to listen.
High-yield – 10-year spread is blowing out
Then again, a few hundred billion is a rounding error in our QE world. There is a much bigger animal and no one is talking about it yet – the petrodollar.
Roughly defined, petrodollars are the dollars earned by oil exporting countries that are either spent on goods or more often tucked away in central bank war chests or sovereign wealth funds to be invested. I’ve read dozens of research reports on the topic and depending on how its calculated, this flow of capital has averaged between $500 billion and $1 trillion per year for most of the past decade. This is money that has been going into financial assets around the world – mainly in the US. This flow of reinvested capital is now effectively shut off. Since many of these countries are now running huge budget deficits, it seems only natural that if oil stays at these prices, this flow of capital will go in reverse as countries are forced to sell foreign assets to cover these deficits.
Over the past year, the carnage in the emerging markets has been severe. Barring another dose of QE, I think this carnage is about to come to the more developed world as the petrodollar flow unwinds and two decades of central bank inspired lunacy erupts.
We agree with Harris, and not coincidentally the petrodollar unwind forms a part of the global USD carry trade unwind I’ve been harping on about recently.
Capitalist Exploits subscribers will receive a free report on 3 actionable trades in the oil and gas sector later this week. Leave us your email address here to get the report.
– Chris
“So, ladies and gentlemen… if I say I’m an oil man you will agree. You have a great chance here, but bear in mind, you can lose it all if you’re not careful.” – Daniel Day-Lewis, There Will Be Blood
According to Realtor.com’s ‘Advance Read of September Trends‘, with month-over-month declining prices and increased time on market, the September 2015 housing market has transitioned into a buyer’s market. This means that it is now easier for buyers to purchase a home than it has been any time so far this year.
“The spring and summer home-buying seasons were especially tough on potential buyers this year with increasing prices and limited supply,” said Jonathan Smoke, chief economist for Realtor.com. “Buyers who are open to a fall or winter purchase should find some relief with lower prices and less competition from other buyers. However, year-over-year comparisons show that fall buyers will have it tougher than last year as the housing market continues to show improvement.”
Housing demand is in its seasonally weaker period and as a result, median list prices are continuing to decline from July’s peak. Likewise, inventory has also peaked for 2015, so buyers will see fewer choices through the end of the year. Top line findings of the monthly report that draws on residential inventory and demand trends over the first three weeks of the month include:
National median list price is $230,000 down decreased 1 percent over August and up 6 percent year-over-year.
Median age of inventory is now 80 days, up 6.7 percent from August, but down 5 percent year-over-year, reflecting the seasonal trend for fall listings to stay longer on the market as the day becomes shorter.
Listings inventory will likely end the month down 0.5 percent from August.
Realtor.com September 2015 Market Hotness Data
The 20 hottest markets in the country, ranked by number of views per listing on Realtor.com and the median age of inventory in each market, in September 2015 are:
Key takeaway from Realtor.com September Hotness Index:
California maintains 11 cities on the Hotness Index due to continued tight supply and turbo charged economy. Markets in the state have been characterized as having extremely tight supply all year, so frustrated buyers who have not been able to find a home so far remain active, supporting continued strength in sales across much of Northern and Southern California.
Texas and Michigan also continue to feature multiple markets also driven by job growth, but compared especially to the California markets have more affordable inventory attracting a broader base of potential buyers.
Fort Wayne, Ind., and Modesto, Calif., both entered the top 20 list in September having just missed in August. Both markets benefit from strong housing affordability for their regions.
“The hottest markets are little changed in September as supply remains tight and demand remains strong,” Smoke commented. “Sellers across all these markets continue to see listings move much more quickly than the rest of the country in September, and the seasonal slow-down is not as strong in these markets.”
West Texas Intermediate crude oil is at a 6-year low of $43 a barrel.
And back in December 2014, “Bond King” Jeff Gundlach had a serious warning for the world if oil prices got to $40 a barrel.
“I hope it does not go to $40,” Gundlach said in a presentation, “because then something is very, very wrong with the world, not just the economy. The geopolitical consequences could be — to put it bluntly — terrifying.”
Writing in The Telegraph last week, Ambrose Evans-Pritchard noted that with Brent crude oil prices — the international benchmark — below $50 a barrel, only Norway’s government is bringing in enough revenue to balance their budget this year.
And so in addition to the potential global instability created by low oil prices, Gundlach added that, “If oil falls to around $40 a barrel then I think the yield on ten year Treasury note is going to 1%.” The 10-year note, for its part, closed near 2.14% on Tuesday.
On December 9, 2014, WTI was trading near $65 a barrel and Gundlach said oil looked like it was going lower, quipping that oil would find a bottom when it starts going up.
WTI eventually bottomed at $43 in mid-March and spend most all of the spring and early summer trading near $60.
On Tuesday, WTI hit a fresh 6-year low, plunging more than 4% and trading below $43 a barrel.
In the last month, crude and the entire commodity complex have rolled over again as the market battles oversupply and a Chinese economy that is slowing.
And all this as the Federal Reserve makes noise about raising interest rates, having some in the market asking if these external factors — what the Fed would call “exogenous” factors — will stop the Fed from changing its interest rate policy for the first time in over almost 7 years.
In an afternoon email, Russ Certo, a rate strategist at Brean Capital, highlighted Gundlach’s comments and said that the linkages between the run-up, and now collapse, in commodity prices since the financial crisis have made, quite simply, for an extremely complex market environment right now.
“There is a global de-leveraging occurring in front of our eyes,” Certo wrote. “And, I suppose, the smart folks will determine the exact causes and translate what that means for FUTURE investment thesis. Today it may not matter other than accurately anticipating a myriad of global price movements in relation to each other.”
“On current trajectory, this downturn could become worse than 1986: An additional +1.5 mb/d [of OPEC supply] is roughly one year of oil demand growth. If sustained, this could delay the rebalancing of oil markets by a year as well. The forward curve has started to price this in: as the chart shows, the forward curve currently points towards a recovery in prices that is far worse than in 1986. This means the industrial downturn could also be worse. In that case, there would be little in analysable history that could be a guide to this cycle,” the bank wrote, presaging even tougher times ahead for the O&G space.
If Morgan Stanley is correct, we’re likely to see tremendous pressure on the sector’s highly indebted names, many of whom have been kept afloat thus far by easy access to capital markets courtesy of ZIRP.
With a rate hike cycle on the horizon, with hedges set to roll off, and with investors less willing to throw good money after bad on secondaries and new HY issuance, banks are likely to rein in credit lines in October when the next assessment is due. At that point, it will be game over in the absence of a sharp recovery in crude prices.
Against this challenging backdrop, we bring you the following commentary from Emanuel Grillo, partner at Baker Botts’s bankruptcy and restructuring practice who spoke to Bloomberg Brief last week.
How does the second half of this year look when it comes to energy bankruptcies?
A: People are coming to realize that the market is not likely to improve. At the end of September, companies will know about their bank loan redeterminations and you’ll see a bunch of restructurings. And, as the last of the hedges start to burn off and you can’t buy them for $80 a barrel any longer, then you’re in a tough place.
The bottom line is that if oil prices don’t increase, it could very well be that the next six months to nine months will be worse than the last six months. Some had an ability to borrow, and you saw other people go out and restructure. But the options are going to become fewer and smaller the longer you wait.
Are there good deals on the horizon for distressed investors?
A: The markets are awash in capital, but you still have a disconnect between buyers and sellers. Sellers, the guys who operate these companies, are hoping they can hang on. Buyers want to pay bargain-basement prices. There’s not enough pressure on the sellers yet. But I think that’s coming.
Banks will be redetermining their borrowing bases again in October. Will they be as lenient this time around as they were in April?
A: I don’t know if you’ll get the same slack in October as in April, absent a turnaround in the market price for oil. It’s going to be that ‘come-to-Jesus’ point in time where it’s about how much longer can they let it play. If the banks get too aggressive, they’re going to hurt the value for themselves and their ability to exit. So they’re playing a balancing act.
They know what pressure they’re facing from a regulatory perspective. At the same time, if they push too far in that direction, toward complying with the regulatory side and getting out, then they’re going to hurt themselves in terms of what their own recovery is going to be. All of the banks have these loans under very close scrutiny right now. They’d all get out tomorrow if they could. That’s the sense they’re giving off to the marketplace, because the numbers are just not supporting what they need to have from a regulatory perspective.
Recent oil crashes show you the hard floor for gauging value oil company equities.
Properly understood, the crashes lend an insight into the concept of Peak Oil.
All oil equity investors should understand the overarching upward trend on display here.
Note: ALL prices used in this article are using current 2015 dollars, inflation adjusted using the US BLS inflation calculator.
Generally, when I invest, I try to keep my thesis very simple. Find good companies, with good balance sheets and some kind of specific catalytic event on the horizon. But when one starts to concentrate their holdings in a sector, as I have recently in energy (see my recent articles on RMP Energy (OTCPK:OEXFF) and DeeThree Energy (OTCQX:DTHRF), you need to also get a good handle on the particular tail or headwinds that are affecting it. Sometimes a sector like oil (NYSEARCA:USO) can be subjected to such forces, like the recent oil price crash, where almost no company specific data mattered.
One of the biggest arguments, normally used by proponents of owning oil stocks as core holdings, in the energy sector is “Peak Oil.” For the unfamiliar, it is a theory forwarded first by M. King Hubbert in the 1950s regarding U.S. oil production. Essentially, the theory stated that the U.S. would reach a point where the oil reserves would become so depleted that it would be impossible to increase oil production further, or even maintain it at a given level, regardless of effort. This would inevitably lead to oil price rises of extreme magnitudes.
Since those early beginnings, the details have been argued over in an ever-evolving fashion. The argument has shifted with global events, technological developments, and grown to encompass nearly every basin in the world (even best-selling books have been written about peak oil like Twilight in the Desert: The Coming Saudi Oil Shock and the World Economy by Matt Simmons about a decade ago) consuming endless bytes of the Internet in every kind of investment forum and medium of exchange.
In general, I believe that the term “peak oil” is a highly flawed one. Some picture peak oil in a Mad Max fashion, with oil supplies running out like a science fiction disaster movie. Others simply dismiss peak oil as having failed to predict these so-called peaks repeatedly (the world is producing a record amount of oil right now, so all previous absolute “Peak Oil” calls below these amounts are obviously wrong). But what people should be stating when they use these terms is a Peak OilPrice.
Using my own thinking and phrasing, I believe civilization has probably passed $25 Peak Oil. This means that if you set the oil price to $25 a barrel, there is no method available to humanity to provide enough oil to meet demand over any period of time that’s really relevant. I also believe we are in the middle of proving that we have also passed $50 Peak Oil. My final conjecture here is that we will prove in the near-term future to have reached $75 Peak Oil. I don’t believe we are quite at $100 Peak Oil.
Notice that in my formulation the term Peak Oil is always stated as a peak price. Oil is not consumed in a vacuum. The price affects the demand the world has for the product and simultaneously changes the ability of all sorts of entities (businesses and governments) to retrieve deposits of it. This is what I hope to prove in this article.
So what data could I bring to this crowded table?
Well we have one thing we now have that previous entrants into the Peak Oil melee didn’t, which is the recent price crash in oil. Peak oil is often falsely portrayed as a failed idea since it hasn’t resulted in a super squeeze to ultra high prices. These spike prices are viewed as the really critical element by energy investors since they are trying to find the best case. After all, who doesn’t want to own an oil producer if they can identify a spot in which oil prices will rise to some enormous number.
But that is the wrong way to go about it for your oil investments over the long haul. Because what $50 Peak Oil really provides is afloor. In a world where we have passed $25 Peak Oil, it should be impossible, without exogenous events of enormous magnitude (world war, etc.), to press the price of the product below that price. If you could do so, you would immediately disprove the thesis. You would then know the floor provided by whichever peak oil price level you selected was wrong. The same idea seems to hold true for $50 Peak Oil now.
To prove this “floor” we need to choose times of extreme stress in the oil markets, and look at those oil prices and see what the bottoms were. For these examples, let’s select WTI oil, whose weekly average prices are reported all the way back to 1986 by the EIA.
Let’s take the three big crashes in the oil markets. I will use a full year’s average to try to smooth out the various difficulties presented by weather, seasonal effects, or various one-off events (outages, etc.). The first crash I will use as a benchmark is The 1986 Oil Crash. The 1986 breakdown was a supply crash, caused by supply swamping demand. How big a disaster was it for the oil industry?
In 1986, the Saudis opened the spigot and sparked a four-month, 67 percent plunge that left oil just above $10 a barrel. The U.S. industry collapsed, triggering almost a quarter-century of production declines, and the Saudis regained their leading role in the world’s oil market.
This was quite a crash obviously. Triggering a 25 year decline? Not going to find a lot worse than this. So in inflation adjusted dollars what was WTI oil at for the year of 1986? It sold for around $32 a barrel. Now let’s note that at this time WTI crude was actually at a higher price vs. Brent and other world prices. On a Brent basis, crude would have been just around $25 for the year. This will prove to be an important point in a short while.
The next crash we will use to benchmark was the 2008 Financial Crisis. On this website, I should hope that this world crisis will need no introduction and little explanation. This crash in oil prices (and just about every other thing priced by human beings) was a demand crash. The financial disintegration across the world led to massive drops in demand, as jobs were lost across the world by the millions. So with this demand crash what was the average price of WTI crude in the year 2009? It sold in that year for a little over $60.
The last crash I will add is the current drop, starting sometime around October by my reckoning. I would find it hard to imagine any reader of this article is unfamiliar with the current situation in North America or the world regarding oil, at least in a headline sense. This seems to be a supply crash again, where North American-led tight oil drillers have caused an increase in production that the world’s demand couldn’t handle at the $100 price level. Since then, prices have dropped down to a level that suppresses the production of oil and enhances demand.
In the first four months of 2015, the North American oil rig count has already dropped by more than 50% as compared to last year and the demand for oil has begun to increase according to EIA statistics. The current price of WTI oil has been just over $49 as an average for the year 2015. However, let us note that WTI oil now sells for a large discount to world prices, and during the previous two crashes, WTI sold for a premium.
Now we have three data points. Each one is a fairly long period of time, not just a single week. We know that the world in 1986 nearly ended for the oil industry, yet in current dollars, WTI oil was unable to trade for a year below $30 a barrel. Then we had in 2008 and 2009 an economic crisis which was widely described as being the most dire financial disaster since WWII. In 2009, WTI oil still ended up trading well over the 1986 low. In fact it was nearly double that price. This shows just how hard it can be using almost any technique to push oil prices below a true peak number.
Now we have another supply led crunch. One that is widely described as the worst oil crash since 1986, a nearly 30 year time gap. We are attacking the oil price from the supply side instead of 2008’s demand side. Yet thus far, in 2015, oil is still trading more than 50%higher than the 1986 year average, inflation adjusted. In fact, WTI, when adjusted for its current discount to world prices, is trading close to its 2009 average price. Again, nearly double the price of the 1986 crash.
What does this all mean for investing? It means to me that $25 Peak Oil is behind us. You couldn’t really hit and maintain that number in the 1986 crash when many more virgin conventional reservoirs of oil were available. Despite the last three oil crises, not one of them could get WTI oil to $25 and keep it there. Now, using much more expensive oil resources (shale fracing, deep water drilling, arctic development, etc.), it doesn’t seem like the last two disasters have been able to press WTI oil much below $50 for a material length of time. In this recent crash, the $50 floor was able to be reached only with several years of hyper-investment made possible by the twin forces of sustained high prices and access to ultra-cheap capital. Both of these forces are no longer present in the oil markets.
Therefore, I think using a $50 Peak Oil number is a very reasonable hard floor to use when stress testing your oil stocks. It means that when I am choosing a stock that produces oil, it can survive both from supply and the demand led crashes using the worst the world can throw at it.
Some will say this reasoning is simplistic. One could claim any number of variables in the future (technology, peace in the Middle East, etc.) could change all the points I am relying on here. But we have throwneverything at the oil complex between 2008 and now; both from the supply side and the demand sides; breakdowns of the whole world economy, wars, sanctions, natural disasters, hugely stupid governmental policies, OPEC’s seeming fade to irrelevance, biofuels, periods of ultra-high prices, technological progress, electric cars, etc. Yet, here we stand with these numbers staring us in the face.
In conclusion, I feel these price points prove the reality of $50 Peak Oil (WTI). If WTI oil averages more than $50 in 2015 (which I strongly feel the data shows will happen), then it will confirm my thesis that no matter what happens in the world, human beings cannot seem to produce the amount of oil they require for less than that number. Therefore, one will know what the hard floor for petroleum is provided by the hugely complex interplay of geology, politics, economics, and technology by simply measuring those effects on one easy-to-measure point of data, namely price. This version of peak oil also means I have a minimum to test my selections on. I can buy companies that can at least deal with that floor, then make large profits as the prices rise from that hard floor. All oil fields deplete, and for the past twenty years, the solution has universally been to add more expensive technological solutions, exploit smaller or more physically difficult deposits, or use more expensive alternatives. The oil market does not have the same options available to it like it did 1986. Large, cheap conventional oil deposits are no longer available in sufficient supply, which is likely what the oil price is telling us by having higher Peak Floors during crashes. Without the magic of sustained ultra high prices, the investment levels that made this run at the $50 Peak Oil level will not exist going into the future. This means that the Peak Oil floor price should be creeping higher as a sector tailwind, giving a patient and selective investor a tremendous advantage for themselves.
The fall in U.S. rigs drilling for oil quickened a bit this week, data showed on Friday, suggesting a recent slowdown in the decline in drilling was temporary, after slumping oil prices caused energy companies to idle half the country’s rigs since October.
Drillers idled 31 oil rigs this week, leaving 703 rigs active, after taking 26 and 42 rigs out of service in the previous two weeks, oil services firm Baker Hughes Inc said in its closely watched report.
With the oil rig decline this week, the number of active rigs has fallen for a record 20 weeks in a row to the lowest since 2010, according to Baker Hughes data going back to 1987. Since the number of oil rigs peaked at 1,609 in October, energy producers have responded quickly to the steep 60 percent drop in oil prices since last summer by cutting spending, eliminating jobs and idling rigs.
After its precipitous drop since October, the U.S. oil rig count is nearing a pivotal level that experts say could dent production, bolster prices and even coax oil companies back to the well pad in the coming months.
Pioneer Natural Resources Co, a top oil producer in the Permian Basin of West Texas, said this week it will start adding rigs in June as long as market conditions are favorable. U.S. crude futures this week climbed to over $58 a barrel, the highest level this year, as a Saudi-led coalition continued bombings in Yemen.
That was up 38 percent from a six-year low near $42 set in mid March on oversupply concerns and lackluster demand, in part on expectations the lower rig count will start reducing U.S. oil output.
After rising mostly steadily since 2009, U.S. oil production has stalled near 9.4 million barrels a day since early March, the highest level since the early 1970s, according to government data.
The Permian Basin in West Texas and eastern New Mexico, the nation’s biggest and fastest-growing shale oil basin, lost the most oil rigs, down 13 to 242, the lowest on record, according to data going back to 2011.
Texas was the state with the biggest rig decline, down 19 to 392, the least since 2009. In Canada, active oil rigs fell by four to 16, the lowest since 2009.U.S. natural gas rigs, meanwhile, climbed by eight to 225, the same as two weeks ago.
Crude oil has already bounced back by 30 percent over the past month. But according to Richard Ross of Evercore ISI, currency market moves are predicting more upside for the battered commodity.
Over the past week, oil-exposed currencies such as the Canadian dollar, the Norwegian krone and the Australian dollar have surged in value against the U.S. dollar. And since these currencies tend to be correlated with crude, Ross extrapolates that oil has more upside.
Crude-exposed currencies “are really firming here, and they have been firming over the past month or so along with crude oil itself, and I think that holds bullish implications,” Ross said.
Looking at the Canadian currency in particular, Ross predicts that “the Canadian dollar continues to firm against the U.S. dollar, and this should be supportive of crude.”
Even the crumbling Russian ruble has had a great run over the past month, Ross points out.
“Earlier this year, the ruble was staring into the abyss,” he said in a Thursday “Trading Nation” segment. “Strength in the Russian ruble, once again, has a positive read-through for crude oil.”
However, not everyone buys the thesis.
Referring to the commodity currencies, Boris Schlossberg of BK Asset Management said that “they’re kind of reactive. It’s hard to make that case completely.”
In other words, crude is driving currencies like the Canadian dollar, and not the other way around.
Back in early 2007, just as the first cracks of the bursting housing and credit bubble were becoming visible, one of the primary harbingers of impending doom was banks slowly but surely yanking availability (aka “dry powder”) under secured revolving credit facilities to companies across America. This also was the first snowflake in what would ultimately become the lack of liquidity avalanche that swept away Lehman and AIG and unleashed the biggest bailout of capitalism in history. Back then, analysts had a pet name for banks calling CFOs and telling them “so sorry, but your secured credit availability has been cut by 50%, 75% or worse” – revolver raids.Well, the infamous revolver raids are back. And unlike 7 years ago when they initially focused on retail companies as a result of the collapse in consumption burdened by trillions in debt, it should come as no surprise this time the sector hit first and foremost is energy, whose “borrowing availability” just went poof as a result of the very much collapse in oil prices.
As Bloomberg reports, “lenders are preparing to cut the credit lines to a group of junk-rated shale oil companies by as much as 30 percent in the coming days, dealing another blow as they struggle with a slump in crude prices, according to people familiar with the matter.
Sabine Oil & Gas Corp. became one of the first companies to warn investors that it faces a cash shortage from a reduced credit line, saying Tuesday that it raises “substantial doubt” about the company’s ability to continue as a going concern.
It’s going to get worse: “About 10 firms are having trouble finding backup financing, said the people familiar with the matter, who asked not to be named because the information hasn’t been announced.”
Why now? Bloomberg explains that “April is a crucial month for the industry because it’s when lenders are due to recalculate the value of properties that energy companies staked as loan collateral. With those assets in decline along with oil prices, banks are preparing to cut the amount they’re willing to lend. And that will only squeeze companies’ ability to produce more oil.
Those loans are typically reset in April and October based on the average price of oil over the previous 12 months. That measure has dropped to about $80, down from $99 when credit lines were last reset.
That represents billions of dollars in reduced funding for dozens of companies that relied on debt to fund drilling operations in U.S. shale basins, according to data compiled by Bloomberg.
“If they can’t drill, they can’t make money,” said Kristen Campana, a New York-based partner in Bracewell & Giuliani LLP’s finance and financial restructuring groups. “It’s a downward spiral.”
As warned here months ago, now that shale companies having exhausted their ZIRP reserves which are largely unsecured funding, it means that once the secured capital crunch arrives – as it now has – it is truly game over, and it is just a matter of months if not weeks before the current stakeholders hand over the keys to the building, or oil well as the case may be, over to either the secured lenders or bondholders.
The good news is that unlike almost a decade ago, this time the news of impending corporate doom will come nearly in real time: “Publicly traded firms are required to disclose such news to investors within four business days, under U.S. Securities and Exchange Commission rules. Some of the companies facing liquidity shortfalls will also disclose that they have fully drawn down their revolving credit lines like Sabine, according to one of the people.”
Speaking of Sabine, its day of reckoning has arrived
Sabine, the Houston-based exploration and production company that merged with Forest Oil Corp. last year, told investors Tuesday that it’s at risk of defaulting on $2 billion of loans and other debt if its banks don’t grant a waiver.
Another company is Samson Resource, which said in a filing on Tuesday that it might have to file for a Chapter 11 bankruptcy protection if the company is unable to refinance its debt obligations. And unless oil soars in the coming days, it won’t.
Its borrowing base may be reduced due to weak oil and gas prices, requiring the company to repay a portion of its credit line, according to a regulatory filing on Tuesday. That could “result in an event of default,” Tulsa, Oklahoma-based Samson said in the filing.
Indicatively, Samson Resources, which was acquired in a $7.2-billion deal in 2011 by a team of investors led by KKR & Co, had a total debt of $3.9 billion as of Dec. 31. It is unlikely that its sponsors will agree to throw in more good money after bad in hopes of delaying the inevitable.
The revolver raids explain the surge in equity and bond issuance seen in recent weeks:
Many producers have been raising money in recent weeks in anticipation of the credit squeeze, selling shares or raising longer-term debt in the form of junk bonds or loans.
Energy companies issued more than $11 billion in stock in the first quarter, more than 10 times the amount from the first three months of last year, Bloomberg data show. That’s the fastest pace in more than a decade.
Breitburn Energy Partners LP announced a $1 billion deal with EIG Global Energy Partners earlier this week to help repay borrowings on its credit line. EIG, an energy-focused private equity investor in Washington, agreed to buy $350 million of Breitburn’s convertible preferred equity and $650 million of notes, Breitburn said in a March 29 statement.
Unfortunately, absent an increase in the all important price of oil, at this point any incremental dollar thrown at US shale companies is a dollar that will never be repaid.
The shale oil revolutionaries are retreating in disarray, and cheap foreign oil may banish them to the margins of the market.
As oil and natural gas move into a period of low prices, new data shows that North American drillers may not have the wherewithal to keep producing shale wells, which make up 90 percent of new drilling. In fact, if prices remain low for years to come, which is a real possibility, then investors may never see a return on the money spent to drill shale wells in the first place.
The full cost of producing oil and natural gas at a representative sample of U.S. companies, including capital spent to build the company and buy assets, is about $80 per barrel of oil equivalent, according to a study from the Bureau of Economic Geology’s Center for Energy Economics at the University of Texas.
The analysis of 2014 corporate financial data from 15 of the top publicly traded producers, which I got an exclusive look at before it’s published this week, determined that companies will have a hard time recovering the capital spent that year and maintaining production unless prices rise above $80 a barrel.
The price for West Texas Intermediate has spent most of the year below $50 a barrel.
Low prices, though, won’t mean that producers will shut in existing wells. Many of these same companies can keep pumping to keep cash coming into the company, and they can still collect a 10 percent return above the well’s operating costs at $50 a barrel of oil. They just won’t make enough money to invest in new wells or recover the capital already spent.
This harsh reality of what it will take to keep the shale revolution going shows how vulnerable it is to competition from cheap overseas oil.
“Everyone walks around thinking that they know how much this stuff costs because they see published information on what people spend to just drill wells,” explained Michelle Foss, who leads the Houston-based research center. “That is not what it takes for a company to build these businesses, to recover your capital and to make money.” The bureau was founded in 1909 and functions as the state geological agency.
Low oil prices will also exacerbate the economic impact of low natural gas prices. For years natural gas has kept flowing despite prices below $4 for a million British thermal units because about 50 percent of wells produced both gas and liquids, such as crude oil and condensate.
True natural gas costs
High oil prices have helped companies subsidize natural gas wells, but lower oil prices mean natural gas wells that don’t produce liquids will need to stand on their own economics.
The center’s analysis found that among the sample companies focused primarily on gas, prices will need to top $6 a million BTUs just to cover full costs and rise above $12 a million BTUs to recover the capital expended to develop the wells.
“We have important resources, but people have to be realistic about the challenges of developing them,” Foss told me. “There will have to be higher prices.”
Everyone predicts prices will rise again. The only questions are how quickly and to what price. Some experts predict WTI prices will reach $70 a barrel by the end of 2015, while others see $60. The soonest most expect to see $80 a barrel oil is in 2017. Saudi Arabian officials have said they believe the price has stabilized and don’t see oil returning to $100 a barrel for the next five years.
High prices and shale
The Saudi opinion is particularly important because that nation can produce oil cheaper than any other country and can produce more oil than any other country. As the informal leader of the Organization of the Petroleum Exporting Countries, Saudi Arabia kept the price of oil inside a band between $80 and $100 a barrel for years. Now, the Saudis appear ready to keep the price low.
That’s because high prices inspired the shale revolution, where American companies figured out how to economically drill horizontally into tight rocks and then hydraulically fracture them to release oil and natural gas. Since OPEC countries rely on high oil prices to finance their governments, everyone assumed OPEC would cut production and keep revenues high.
Arab leaders, though, were more concerned about holding on to market share and allowed prices to fall below levels that make most shale wells economic. Foss, who recently returned from meetings in the United Arab Emirates, said OPEC is unlikely to change course because developing countries are seeking alternatives to oil and reducing demand.
“The Saudis and their partners see pressures on oil use everywhere they look, and what they want is their production, in particular their share of the global supply pie, to be as competitive as it can be to ensure they’ve got revenue coming into the kingdom for future generations,” she said.
OPEC is afraid rich countries like the U.S. are losing their addiction to oil, and by lowering prices hope to keep us hooked. And OPEC has plenty of product.
“There’s 9 million barrels a day in current and potential production capacity in Iraq and Iran that is tied up by political conflicts, and if you sort that out enough, that’s a flood of cheap oil onto the market,” Foss said.
On the losing end
If prices remain low, the big losers will be the bond holders and shareholders of indebted, small and medium-size companies that drill primarily in North America. Since these companies are not getting high enough prices to pay off capital expenditures through higher share prices or interest payments , they are in serious trouble.
The inability of Denver-based Whiting Petroleum to sell itself is an example. The board of the North Dakota-focused company was forced to issue new shares, reducing the company’s value by 20 percent, and take on more expensive debt. Quicksilver Resources, based in Fort Worth, filed for Chapter 11 bankruptcy on March 17 because it couldn’t make the interest payments on its debt and no one was willing to invest more capital.
Until one of these companies is bought, we won’t know the true value of the shale producers at the current oil and natural gas prices.
But as more data reaches the market, there is a real danger that these companies are worth even less than investors fear, even though they may have high-quality assets.
Oil production continues to eclipse record highs on a weekly basis despite the oil rig count declining 49% since October.
A single oil-well declines exponentially up to 75% in its first year of production. However, in a process known as Convolution, older wells buffer the rapid decline from new rigs.
This article provides a comprehensive analysis of principles behind oil drilling and production, applies it to the current crude oil climate, and predicts future production, rig counts, and oil price.
Based on my analysis, I remain short-term bearish but long-term bullish on the commodity. My trading strategy based on this analysis is discussed in detail.
On Friday, March 20, Baker Hughes (NYSE:BHI) reported that the crude oil rig count had fallen an additional 41 rigs to 825 active rigs. This was the 15th straight week and 25th out of 26 weeks that the rig count has declined. Active oil rigs are now at the lowest level since the week ending March 18th, 2011 and total drilling rigs (oil + natural gas) are the fewest since October 2009. Overall, the oil rig count is down 49% in the 23 weeks since peaking in October. Nevertheless, in its weekly Petroleum Report, the EIA announced last Wednesday that domestic oil production set yet another record high of 9.42 million barrels per day. Since the rig count peaked the week of October 10, 2014 and began its subsequent collapse, oil production has climbed 460,000 barrels per day, or 5.2%. This continued increase in production in the face of a plummeting rig count has confounded journalists, flummoxed investors, and inflated supplies to record highs leading to a continued slump in oil prices.
The two main questions on traders’ minds are 1) why is oil production still at record highs five months after the rig count started dropping? And 2) when, if at all, will oil production begin to fall and how far will it fall? This article provides a comprehensive analysis of the principles behind the relationship between oil drilling and production, applies it to the current crude oil climate, and predicts where both production and the rig count will go in the coming year.
Before we discuss the real-world oil production and drilling situation – an extremely complex picture with over 1 million rigs producing oil – let’s look at a simple, hypothetical situation. The first key point is that once an oil well is drilled, its production is not constant. In fact, production not only begins to decline almost immediately, it does so in an exponential fashion. After analyzing production curves from multiple wells, I will be estimating weekly oil production from a single oil well by the following equation:
Equation 1:
Daily Oil Production From Single Well = (Initial Daily Production)/(1+ (Week # from start of production*K)
Where K is a constant equal to 0.06
When graphed using a well that initially produces 1000 barrels of oil per week this equation is represented by Figure 1 below:
Figure 1: Crude oil production curve of single, hypothetical well showing exponential decay.
There are two take home points to note from this chart. First, initial decay is very rapid, with weekly production declining by about 75% after 1 year. Second, after the initial rapid decay, production declines much slower and becomes approximately linear with decay rates of 5-10% per year. Although this graph ends after 2 years or 104 weeks, production continues slowly and steadily beyond 5 years.
Figure 1 represents production from a single well. What happens when we add multiple wells over a period of time? The process by which multiple functions – in this case, oil wells – are added over time is known as Convolution. As noted before, even after an oil well has been active for many years, it is still producing a small volume of oil, a fraction of its initial output. However, there are a LOT of these old, low-output rigs – over 1.1 million in fact. When the number of drilling rigs decreases – thus reducing the number of new wells that come into the service – the old, stable wells plus the production from the declining number of new wells is initially enough to buffer the decline in rig count and net output will continue to rise.
Let’s illustrate this with a simple example. Imagine a new oil field monopolized with a single company that owns 30 oil rigs. The company adds five new rigs each month. Each rig is able to drill 1 new well per month. After six months, the company has deployed all of its rigs to the field. Unfortunately, shortly thereafter the company encounters financial difficulties and is forced to withdraw rigs at a rate of 5 per month until zero remain drilling. Figure 2 below compares active drilling rigs and total wells in this field.
Figure 2: Rig count and total well count of hypothetical oil field
Note that after the rig count peaks and begins to decline, total wells continue to increase before ultimately peaking at 180, where it remains for the remainder of the 20-month period.
Each well initially produces 200 barrels of oil per day and declines according to Equation 1 and the chart in Figure 1. Figure 3 below shows total oil field production overlaid with the total rig count of the field.
Figure 3: Oil Production from hypothetical oil field illustrating how crude oil production can continue to climb despite a sharp reduction in the rig count due to convolution.
Oil production initially climbs rapidly as more rigs are added to the field, reaching 500,000 barrels per month by the time the rig count peaks after 6 months. However, even though the rig count declines to zero six months later, total production continues to increase and peaks at 770,000 barrels per month in month 10 – 4 months after the rig count peaked. Production then begins to decline, but slowly. Even by month 20 after the rig count has been at zero for eight months, production has only declined by 33%.
This is obviously a simply, insular example, but it illustrates several important points. First, there is a delay between when the rig count peaks and when production begins to decline as the combination of old, accumulated oil wells and the continued addition of new wells by the declining rigs is sufficient to coast production higher initially. Second, even when production begins to decline, it is blunted, with production declining a fraction of the actual reduction in rig count. For those interested, the Following Article delves into these principles further and provides useful insight.
Let’s now apply these principles to actual domestic oil production. Before we can set up the model, there are three baseline metrics that need to be established: 1) Rate that rigs drill a well, 2) Time between initial spudding of a well and when it begins production, and 3) Initial production rate of new oil wells.
The EIA has released well counts on a quarterly basis for the past two years. Their data shows that the ratio of new wells to rigs has increased slowly from around 4.75 per quarter in 2012 to 5.3 per quarter in 2014. This equates to about 0.4 wells per week per rig presently. For the model, I used a linear reduction in drilling efficiency with drilling rates down to 0.3 wells per week per rig in 2006.
It takes 15-30 days to drill a new oil well. Once the hole is dug, the well must be completed. It typically takes another week for the rig to be removed and new equipment to be set up. A further week is devoted to hydraulic fracturing. Initial flow back and priming of production takes place over the next 3-4 days. Over the final week, the well is primed for continuous production including installation of tank batteries, the pump jack, and assorted power connections. The well is then connected to the pipeline and permanent production begins. Thus, it takes roughly two months from initial spudding of the well to when it begins production. However, once a well is completed it does not always begin to produce immediately and may not do so for up to six months.
Initial oil production rates have increased markedly over the past decade as drilling technology has improved. The EIA released the chart shown below in Figure 4 showing yearly initial production rates in the Eagleford Shale.
Figure 4: Yearly production rates in Eagleford Shale Formation showing rapidly increased initial rates of production 2009-2014. (Source:EIA)
Initial rates increased from less than 50 barrels per day (or 350 per week) in 2009 to nearly 400 barrels per day (or 2800 per week) in 2014. Note that the decay rate has also increased such that by 2-3 years, all wells are approaching the same output despite the significant differences in increased production. This is a relatively new oil formation and older formations produced more oil initially prior to 2010. For my model, I assumed initial production of 2625 barrels of oil per well per week in 2014-2015 with initial production declining to 1400 barrels per well per week in 2006.
Using this data and the methodology discussed in the example above, a modeled projection of U.S. oil production is created dating back to 2006. This data is shown in Figure 5 below and is compared to actual oil production, calculated on a weekly basis. My preferred unit of time is 1 week as this is the frequency that both the rig count and oil production numbers are released.
Figure 5: Projected oil production based on my model vs. observed crude oil production vs. Baker Hughes Rig Count [Sources: Baker Hughes, EIA]
Overall, this model accurately projects oil production based on active drilling rigs. Between 2006 and 2015, the average error was 88,000 barrels per day, or 1.2%. Over the past six months, this error has averaged just 44,000 barrels per day. The model correctly shows production continuing to increase despite the sharp reduction in active drilling rigs. It is interesting to note that the largest deviation between projected oil production and observed production occurred in late 2009 and early 2010, or shortly after the rig count bottomed out from the previous oil price collapse. The model predicted that oil production would decline somewhat while actual production actually just leveled off before beginning a new rally once the rig count rebounded later in 2010.
This model can be used to project how oil production might behave heading into the future. To do so, we must make assumptions about how the rig count might behave heading into the future. First, let’s pretend that the rig count stays unchanged at 825 active oil rigs for the next 1 year. Figure 6 below projects crude oil production to 1 year.
Figure 6:Projected oil production based the rig count remaining unchanged at 825 [Sources: Baker Hughes, EIA]
Using this projection, crude oil production will peak during the week ending April 10 at 9.51 million barrels per day and then begin declining. By next March 2016, production will have declined to 8.68 million barrels per day, down 9.5% from the projected peak. Again, this goes to show the buffering capacity of older rigs, given that a sustained 50% reduction in the rig count results in a comparatively small <10% decrease in output.
Two qualifying notes are necessary. This model shows a relatively short period of time between production plateauing and production beginning its decline. 1) Given that this model assumes all completed wells are producing oil within 3 months of spudding, it is certainly possible that the production curve may flatten out for a longer period of time due to additional completed wells that have been idle are slowly hooked up to pipelines over the next several months. 2) This model also makes the assumption that all rigs produce oil equally. If rigs drilling less-productive oil fields have been selectively retired while those drilling richer fields have remained active, the rate of decline will similarly be slower and less than projected.
The most recent historical comparison to the events currently unfolding took place in 2008-2009 following the collapse of oil from record highs during the great recession from a high of $146/barrel to near $30/barrel. The rig count during that event was likewise slashed by 50% before rapidly recovering when prices rebounded. However, this is not an apples-to-apples comparison since drilling technology has changed substantially – decline rates are much more rapid, initial production is nearly double that in 2008, etc – and inferences cannot necessarily be made about the future of production. However, let’s assume that the current rig count follows a similar trend. If so, the rig count will slow its descent and bottom out in roughly six weeks near 760-780. If the rig count follows the trend seen in 2009, the count will then rapidly rise and will reach 1330 by this time next year. Production will again peak during the week of April 10, before declining. Production will bottom out in late October near 8.9 million barrels per day, down just 6.3% from its peak before again increasing late in the year.
However, the decline in oil in 2008-2009 was based more on the combination of a bubble bursting and a slumping economy than fundamental forces while the current slump is predicated on a supply/demand mismatch. I expect this will keep prices and rigs down significantly longer than in 2008-2009. Let’s amplify the 2008-2009 rig count curve and project instead that rigs bottom out near 730-750 and that the rate of recovery is roughly half that of 2008-2009 with total rigs at just 950 this time next year. Using this model, production will continue to slowly decline through the New Year and flatten out near 8.7 million barrels per day by March 2016, down 8.4% from the peak. I believe that this is a more realistic model for crude oil production. This projection is shown below in Figure 7.
Figure 7:Projected oil production based on 2008-2009 rig count [Sources: Baker Hughes, EIA]
What does this mean for the supply/demand situation? As I have discussed in my previous articles, crude oil supply and demand are severely mismatched. This has led to oil inventories skyrocketing to a record high of 458 million barrels, a huge 98.7 million barrels above the five-year mean for March. Applying the projected production curve shown in Figure 7 to crude oil storage yields some surprising results. Even with just an 8.7% reduction in supply, the inventory surplus will narrow markedly. These results are shown below in Figure 8, which compares the five-year average storage level and current and projected storage levels. Note: These projections assume that total imports will remain flat and that total demand will follow the five-year average.
Figure 8: Projected crude oil storage based on projected oil production data vs. 5-year average [Source: EIA]
While the rig count continues to climb and then plateaus, I expect that the storage surplus will continue to widen with total inventories approaching 500 million barrels by early May. However, as production drops off, the inventory surplus begins to decline. By the last week of 2015, total supply has declined by 4.7 million barrels per week and projected inventory levels cross the five-year average for the first time since October 2014. Should the rig count begin the slow rise that is projected, by March of 2016, total storage levels will be 50 million barrels BELOW the five-year average. Even if the two qualifying statements discussed above verify or the rig count rises more rapidly than projected, I expect that, based on the drop in rig count already, crude oil inventories will be at or below average this time next year.
What does this mean for crude oil prices? There is a chicken and egg situation going on here. This article makes references to the rebound in rig count after bottoming out in the next month or two. This, of course, is predicated on a rise in price to make drilling again profitable. Without a rally, the count will continue to fall or, at the very least NOT rise, putting further pressure on supply and down-shifting the projected production curve further, making it more likely that prices will THEN rally. Until they finally do. One way or another, I do not see how crude oil can remain priced at under $45/barrel for longer than a few months. Something has to give. Drilling technology is simply not yet to the point where this is a profitable price range for the majority of companies.
Given that these projections show production increasing through early April, I would not be surprised to see continued short-term pressure on oil prices. As I discussed in My Article Last Week, storage at Cushing, the closely watched oil pipeline hub, continues to fill rapidly and threatens to reach capacity by early May. I would welcome such an event, as crude oil would likely drop under $40/barrel presenting an even better buying opportunity. I therefore maintain a short-term bearish, long-term bullish stance on oil.
My favorite way to play a rally in oil is to short the VelocityShares 3x Inverse Crude Oil ETN (NYSEARCA:DWTI) to gain long exposure. This takes advantage of leverage-induced decay to at least partially negate the impact of contango on the ETF. The United States Oil ETF USO), on the other hand, is intended to track 1x the price of oil and leaves an investor directly exposed to contango, which is now 15% over the next six months. The same applies to the VelocityShares 3x Long Crude Oil ETN (NYSEARCA:UWTI), except that exposure to contango is now tripled to 45%.
The advantage to USO is in its safety. A short position in DWTI theoretically leaves an investor open to infinite losses should the price of oil continue to drop. Further, shares must be borrowed to short, which can cost 3-5% annually depending on the broker. And if, once a trader has a position, these shares are no longer available, the position can be forcibly closed at an inopportune time. A slightly less risky position would be the ProShares UltraShort Bloomberg Crude Oil ETF (NYSEARCA:SCO) that is more liquid and less volatile.
For this reason, I started a small position in USO on Thursday at $16.05 when oil erased its post-Fed Remarks gains from Wednesday. This position is equal to just 2% of my portfolio. I will add to my USO position once oil breaks $45/barrel and then again should the commodity break $42/barrel for a total exposure of 6% of my portfolio. Should oil continue to decline to under $40/barrel, I will begin to sell short DWTI at what I assume to be a safer entry point until 10% of my portfolio is allocated to oil ETFs.
Should oil rebound, I will look to take profits. Once the rig count bottoms, I will begin taking profits once oil reaches $50/barrel. I will selectively sell USO initially. I prefer to close out the position most exposed to contango initially in the event that oil reverses and I would otherwise be stuck holding it for an extended period of time. I will then close out DWTI if and when crude oil again reaches $60/barrel. While I believe that oil may ultimately see higher prices, I am concerned at the speed at which rigs may be re-deployed once drilling again becomes profitable. I believe that this will keep oil under $70/barrel for the foreseeable future and will look to exit prior to this level.
In conclusion, an oil production model based on 9 years of domestic production and rig count data is used to project oil production for the past 1 year. This model suggests that oil will bottom around the week ending April 10. However, this is just a modeled projection and the actual peak in production will depend on nuances in drilling discussed above. Nevertheless, I believe that the peak in oil production will represent a significant psychological inflection point and that crude oil is poised for a rally once production begins to roll over.
While much of America struggled during the last financial crisis, Texas grew in greater economic stature on a number of levels. Fueled by a thriving energy economy, strong tech sector and job market, one strong growth area was real estate development.
Texans have always had a strong affinity to golf so it’s no surprise real estate communities, resorts and private clubs feature golf as a central component. Two top leisure properties in Texas are 72-hole Horseshoe Bay Resort in Texas Hill Country and TPC Four Seasons at Las Colinas, home to the AT&T Byron Nelson Championship.
On the private club front, the “Big D” features a collection of renowned golf clubs, including Brook Hollow Country Club, Dallas National and Preston Trail Golf Club, where initiation fees start at $125,000.
The following is a handful of golf and resort-style communities leading the Lone Star State’s leisure real estate sector today.
Vaquero Club, Westlake, Texas
When it comes to country club living, this Dallas-area private club is as luxurious as they come. Originally developed by Discovery Land Company, the Beverly Hills, Calif.-based company known for creating such elite clubs as Estancia in Scottsdale, Ariz. the Madison Club in La Quinta, Calif., and Kukio on the Big Island of Hawaii, Vaquero Club is now member-owned and fresh off an extensive $2.8 million renovation to its Tom Fazio-designed golf course.
According to club executives, part of the motivation behind the project was to enhance real estate vistas and create a more core-golf experience. A perfect example of this took place on the club’s drivable par-4 fourth hole, where new tee boxes were added, as well as on nine other holes.
This means resident members inside Vaquero’s stately manors have even more beautiful views to enjoy. Of an estimated dozen listings by the Jeff Watson Group of Briggs Freeman Sotheby’s International Realty, Vaquero’s most affordable home is currently listed at $1.295 million for a 4-bedroom, 4 1/2 -bath residence and it goes up to $5.995 million for a 5-bedroom estate on 3.8 acres featuring a 5-car garage and wine cellar with 1,500-bottle capacity.
The Vaquero Club consists of 385 equity memberships with an initiation fee approaching $200,000. Besides world-class golf, the club also offers a family-friendly Fish Camp, wine programs and other member amenities and services.
Cordillera Ranch, Boerne, Texas
Located 30 minutes northwest of San Antonio, Cordillera Ranch is a debt-free 8,700-acre master-planned residential community in the Texas Hill Country. The family-owned and operated development is not short on activities, considering residents of the gated community can join The Clubs of Cordillera Ranch that feature seven resort-style clubs in one location: The Golf Club, The Social Club, The Tennis and Swim Club, The Equestrian Club, The Rod and Gun Club, The Spa and Athletic Club and The River Club.
Opened in 2007, the community’s Jack Nicklaus Signature golf course has consistently been ranked among the best in Texas, most recently placing fifth on the Dallas Morning News‘ annual poll. Its par-3 16th has claimed the No. 1 spot as “Most Beautiful Hole” by the same publication for the past five years.
Among the community’s newest real estate offerings are golf course frontage lots, villas and an entirely new section aimed at young families. Overall, Cordillera Ranch boasts ¼-acre villa homes, valley-view and Guadalupe River-front homes, hilltop home sites and 1-to-10-acre estate residences.
According to the developer, 2014 was a banner year in both real estate and membership sales. For instance, Cordillera Ranch sold 33 homes at an average of $886,000 and total lot sales increased by 32 percent.
Trending in 2015: 46 new homes are under construction totaling more than $60 million in new starts – easily the highest total of any upscale community in the San Antonio area, according to the developer. Another 39 homes are in the architectural review approval process – a 65 percent increase over 2013.
Since its inception in 1997, more than 1,200 lots have been sold and approximately 700 homes have been completed. At final build-out, this low-density Hill Country community will total approximately 2,500 homes and preserve approximately 80 percent of the land in its natural vegetation. More than 70 new members were added in 2014, bucking the national trend of private club membership attrition.
“We’re excited and humbled to be a leader in the luxury lifestyle category,” says Charlie Hill, Vice President of Development at Cordillera Ranch. “With the economy thriving and the San Antonio area continuing to prosper, we expect the upward trend in real estate sales to continue in 2015.”
Cordillera Ranch credits much of its growth to being in the highly acclaimed Boerne School District, which is regarded as one of the best in Texas and boasts schools ranked in numerous national-best lists. The community is also benefitting from being in the prosperous Eagle Ford Shale. While other oil-rich areas have struggled with the drop in oil prices, the Eagle Ford Shale has continued to produce. That has attracted oil and gas executives to come to the Texas Hill Country and settle down in communities like Cordillera Ranch.
Boot Ranch, Fredericksburg, Texas
Three years after being put up for sale, the once-bankrupt Boot Ranch community has kicked back into high sales gear. This posh 2,051-acre master-planned golf community in Texas Hill Country’s Gillespie County started selling luxury lots in 2005 and opened a golf course designed by PGA Tour star Hal Sutton in 2006.
But sales were sluggish as the real estate market started to collapse worldwide and Lehman Brothers eventually foreclosed on the property in 2010. Then, the Municipal Police Employees Retirement System of Louisiana, one of Sutton’s original backers and a past partner on the project, sued a number of Boot Ranch partnerships and corporations, putting the project under further stress.
With all of these financial and legal troubles behind them, Boot Ranch is now able to focus on a revitalized real estate market and the renewed life is paying off for this private golf and family community near the popular town of Fredericksburg.
Case in point is Boot Ranch is coming off an eight-year record high for home and property sales, highlighted last year by $13.781 million in year-to-date sales through Sept. 30. Of the $13.781 million in sales, $9.057 million came from estate home sites; another $1.524 million was from Overlook Cabin home sites and $2.825 million were sales of fractional shares of the club’s Sunday Houses.
Overall, Boot Ranch sold 135 lots last year and had 16 homes completed with another 20 under construction or in the planning stages. Boot Ranch real estate options range from fractional ownership shares of 4,500-square-foot Sunday Houses to large Overlook Cabins priced from the $800,000s to estate home sites from $300,000 to $2.5 million for 2-18 acres.
“The booming demand for luxury ranch living is a byproduct of the successful Texas economy, particularly the energy business,” says Sean Gioffre, Boot Ranch director of marketing and sales. “The advent of hydraulic fracturing and the achievements of prized shale formations, like the Eagle Ford, Permian and Bakken, have pushed oil and gas production to record highs. With low interest rates, many people are looking to second homes as a hedge against inflation and as a tangible asset in which to put their money.”
Five miles north of the historic town of Fredericksburg, Boot Ranch is a master-planned retreat featuring one of the rare Sutton-designed courses, and a 34-acre practice park comprised of a short game range and executive par-three course. Other amenities at Boot Ranch include access to the 55,000-square-foot Clubhouse Village, casual and fine dining, a fully-stocked wine cellar, golf shop, ReStore Spa & Fitness Center, the 4.5-acre Ranch Club with pavilion, pools, tennis and sports courts, 10 member/guest lodge suites, a trap and skeet range overlooking Longhorn Lake, hiking, mountain biking, canoeing and fishing.
Construction is under way on a fishing pier and comfort station near Boot Ranch’s signature tenth hole on the golf course.
“We call Boot Ranch the ‘American Dream Texas Style,'” says co-director of marketing and sales Andrew Ball. “The motivation for buyers seems to be for recreational property – somewhere where owners can golf, fish, dine, swim, relax and generally enjoy the Texas outdoors. Many people say they just want to get their kids and grandkids out of the city, even if for only a few days or weeks at a time.”
Traditions Club and Community, Bryan, TX
This new upscale golf and country club development gives Texas A&M loyalists something else to brag about in Aggieland. Located less than 10 minutes from 10 minutes from a bustling college town and burgeoning health and research center, it’s no surprise why this is shaping up to be another successful Texas real estate project.
Traditions Club and Community is the private golf and residential community in “Aggieland” and home to the Texas A&M men’s and women’s golf teams. Located in Bryan-College Station, the club rests in the shadow of the university and in the heart of The Research Valley’s “One Health Plus Biocorridor.”
From custom-garden homes to large estate lots, Traditions Club has a wide range of developments that cater to many buyers. Future plans to attract even more residents call for a multi-use retail, entertainment and health/fitness complex to be built within the neighboring Biocorridor area that would mirror one of the top suburbs in Houston, The Woodlands.
Traditions’ tournament-caliber, Jack Nicklaus/Jack Nicklaus II-designed golf course hosts many high-profile junior, collegiate and amateur events. Other amenities include a 21,000-square foot, four-building clubhouse with men’s and women’s locker rooms; 25-meter junior Olympic lap and sport-leisure pools; family swim center with beach-like wading pool; and fully-equipped fitness center.
Casual fare is offered at the Poole Grille and fine dining at the clubhouse, home to an impressive wine cellar. Overnight accommodations are available in two-, three- and four-bedroom cottages and casitas located just walking distance from all the club’s amenities.
Overlooking stately oak trees, gently rolling terrain and the lush green fairways of the golf course, the Traditions Club and Community is an enclave of custom estates, Game Day Cottages, cozy casitas, villas, garden homes and luxurious condominiums. Home sites range from .25 acres up to an acre, with homes spanning 1,800 to 8,000 square feet.
Traditions Clubhouse
The newest phase being marketed is the Blue Belle home sites, a collection of 34 lots designed for two and three-bedroom custom homes. Overlooking a heavily wooded and rolling landscape in a peaceful and quiet enclave, the home sites encompass up to one-third of an acre and are priced with the home. The residences range from 2,200 to 3,500 square-feet and start in the low $400,000s.
Blue Belle residents can enjoy the outdoors without having to worry about extensive home and yard maintenance. Creative landscaped patios open up to peaceful settings that exemplify private community living. A multi-use trail meandering around a small lake is perfect for short walks and hikes
Interiors exude Texas Hill County elegance, with hardwood flooring, granite countertops, gourmet kitchens, high ceilings and open living area. The floor plans are highly personalized, providing a rich, distinguished selection of upscale finishes and features.
“Real estate sales in vibrant college towns like Bryan/College Station continue to thrive as master-planned communities like Traditions build to suit an array of buyers,” says Spencer Clements, Traditions Club Principal. “Empty-nesters or those seeking a second home with minimal maintenance will find Blue Belle offers the square-footages, relaxing setting and customized features catering to their needs and lifestyle.”
Tribute, The Colony, Texas
The Tribute, a Matthews Southwest, Wynne/Jackson master-planned community on the shores of Lake Lewisville, is one of the more ambitious golf and country club developments in the Dallas-Fort Worth metroplex.
Located just 23 miles from Dallas-Fort Worth International Airport, the Tribute is a 36-hbole upscale semi-private facility whose original plans call for 1,150 single-family homes, 160 golf villas, 183 townhomes, and 700 European condominium units.
The community’s newest course, Old American Golf Club, opened in the summer of 2009 and was designed by Tripp Davis and PGA Tour player and native son Justin Leonard. When Old American opened (it was originally called the New Course), the developers offered premium lake-view, golf course-fronting lots in the Balmerino Village.
This initial phase of lots, located adjacent to the No. 5 green and the No. 6 tee box featured unobstructed views of Lake Lewisville and ranged in price from $135,000 to $275,000 for little more than 1/3 of an acre.
What makes the Tribute so unique it its Scottish links-inspired setting. For instance, the Tribute’s namesake layout, or “Old Course” as it’s often called, is patterned after the legendary courses of Scotland and the Open Championship what with its wind-swept dunes and fescue grasses.
The first and 18th holes share the same broad fairway, just the Old Course at St. Andrews, and you’ll also find a likeness of Royal Troon’s Postage Stamp hole and experience replica holes from Prestwick, Muirfield, Western Gailes and Royal Dornoch. For a special treat, make sure to stay in one of the overnight guest suites above the clubhouse that overlook the course.
The Tribute’s newest course pays homage to famed golf course architects such as Donald Ross and A.W. Tillinghast, many of whom came to the United States from Great Britain around the turn of the century.
According to an Old American spokesman, the new course currently has about 58 resident members of the club, which represents approximately 25 percent of the overall membership. Among the other amenities enjoyed by members are first-class amenity centers, pools, parks, playgrounds, on-site schools, hike-and-bike trails, landscaped canals and hundreds of acres of accessible open space reminiscent of the Scottish Highlands.
On the face of it, the oil price appears to be stabilizing. What a precarious balance it is, however.
Behind the facade of stability, the re-balancing triggered by the price collapse has yet to run its course, and it might be overly optimistic to expect it to proceed smoothly. Steep drops in the US rig count have been a key driver of the price rebound. Yet US supply so far shows precious little sign of slowing down. Quite to the contrary, it continues to defy expectations.
So said the International Energy Agency in its Oil Market Report on Friday. West Texas Intermediate plunged over 4% to $45 a barrel.
The boom in US oil production will continue “to defy expectations” and wreak havoc on the price of oil until the power behind the boom dries up: money borrowed from yield-chasing investors driven to near insanity by the Fed’s interest rate repression. But that money isn’t drying up yet – except at the margins.
Companies have raked in 14% more money from high-grade bond sales so far this year than over the same period in 2014, according to LCD. And in 2014 at this time, they were 27% ahead of the same period in 2013. You get the idea.
Even energy companies got to top off their money reservoirs. Among high-grade issuers over just the last few days were BP Capital, Valero Energy, Sempra Energy, Noble, and Helmerich & Payne. They’re all furiously bringing in liquidity before it gets more expensive.
In the junk-bond market, bond-fund managers are chasing yield with gusto. Last week alone, pro-forma junk bond issuance “ballooned to $16.48 billion, the largest weekly tally in two years,” the LCD HY Weekly reported. Year-to-date, $79.2 billion in junk bonds have been sold, 36% more than in the same period last year.
But despite this drunken investor enthusiasm, the bottom of the energy sector – junk-rated smaller companies – is falling out.
Standard & Poor’s rates 170 bond issuers that are engaged in oil and gas exploration & production, oil field services, and contract drilling. Of them, 81% are junk rated – many of them deep junk. The oil bust is now picking off the smaller junk-rated companies, one after the other, three of them so far in March.
On March 3, offshore oil-and-gas contractor CalDive that in 2013 still had 1,550 employees filed for bankruptcy. It’s focused on maintaining offshore production platforms. But some projects were suspended last year, and lenders shut off the spigot.
On March 8, Dune Energy filed for bankruptcy in Austin, TX, after its merger with Eos Petro collapsed. It listed $144 million in debt. Dune said that it received $10 million Debtor in Possession financing, on the condition that the company puts itself up for auction.
On March 9, BPZ Resources traipsed to the courthouse in Houston to file for bankruptcy, four days after I’d written about its travails; it had skipped a $60 million payment to its bondholders [read… “Default Monday”: Oil & Gas Companies Face Their Creditors].
And more companies are “in the pipeline to be restructured,” LCD reported. They all face the same issues: low oil and gas prices, newly skittish bond investors, and banks that have their eyes riveted on the revolving lines of credit with which these companies fund their capital expenditures. Being forever cash-flow negative, these companies periodically issue bonds and use the proceeds to pay down their revolver when it approaches the limit. In many cases, the bank uses the value of the company’s oil and gas reserves to determine that limit.
If the prices of oil and gas are high, those reserves have a high value. It those prices plunge, the borrowing base for their revolving lines of credit plunges. S&P Capital IQ explained it this way in its report, “Waiting for the Spring… Will it Recoil”:
Typically, banks do their credit facility redeterminations in April and November with one random redetermination if needed. With oil prices plummeting, we expect banks to lower their price decks, which will then lead to lower reserves and thus, reduced borrowing-base availability.
April is coming up soon. These companies would then have to issue bonds to pay down their credit lines. But with bond fund managers losing their appetite for junk-rated oil & gas bonds, and with shares nearly worthless, these companies are blocked from the capital markets and can neither pay back the banks nor fund their cash-flow negative operations. For many companies, according to S&P Capital IQ, these redeterminations of their credit facilities could lead to a “liquidity death spiral.”
Alan Holtz, Managing Director in AlixPartners’ Turnaround and Restructuring group told LCD in an interview:
We are already starting to see companies that on the one hand are trying to work out their operational problems and are looking for financing or a way out through the capital markets, while on the other hand are preparing for the events of contingency planning or bankruptcy.
Look at BPZ Resources. It wasn’t able to raise more money and ended up filing for bankruptcy. “I think that is going to be a pattern for many other companies out there as well,” Holtz said.
When it trickled out on Tuesday that Hercules Offshore, which I last wrote about on March 3, had retained Lazard to explore options for its capital structure, its bonds plunged as low as 28 cents on the dollar. By Friday, its stock closed at $0.41 a share.
When Midstates Petroleum announced that it had hired an interim CEO and put a restructuring specialist on its board of directors, its bonds got knocked down, and its shares plummeted 33% during the week, closing at $0.77 a share on Friday.
When news emerged that Walter Energy hired legal counsel Paul Weiss to explore restructuring options, its first-lien notes – whose investors thought they’d see a reasonable recovery in case of bankruptcy – dropped to 64.5 cents on the dollar by Thursday. Its stock plunged 63% during the week to close at $0.33 a share on Friday.
Numerous other oil and gas companies are heading down that path as the oil bust is working its way from smaller more vulnerable companies to larger ones. In the process, stockholders get wiped out. Bondholders get to fight with other creditors over the scraps. But restructuring firms are licking their chops, after a Fed-induced dry spell that had lasted for years.
Investors Crushed as US Natural Gas Drillers Blow Up
The Fed speaks, the dollar crashes. The dollar was ripe. The entire world had been bullish on it. Down nearly 3% against the euro, before recovering some. The biggest drop since March 2009. Everything else jumped. Stocks, Treasuries, gold, even oil.
West Texas Intermediate had been experiencing its biggest weekly plunge since January, trading at just above $42 a barrel, a new low in the current oil bust. When the Fed released its magic words, WTI soared to $45.34 a barrel before re-sagging some. Even natural gas rose 1.8%. Energy related bonds had been drowning in red ink; they too rose when oil roared higher. It was one heck of a party.
But it was too late for some players mired in the oil and gas bust where the series of Chapter 11 bankruptcy filings continues. Next in line was Quicksilver Resources.
It had focused on producing natural gas. Natural gas was where the fracking boom got started. Fracking has a special characteristic. After a well is fracked, it produces a terrific surge of hydrocarbons during first few months, and particularly on the first day. Many drillers used the first-day production numbers, which some of them enhanced in various ways, in their investor materials. Investors drooled and threw more money at these companies that then drilled this money into the ground.
But the impressive initial production soon declines sharply. Two years later, only a fraction is coming out of the ground. So these companies had to drill more just to cover up the decline rates, and in order to drill more, they needed to borrow more money, and it triggered a junk-rated energy boom on Wall Street.
At the time, the price of natural gas was soaring. It hit $13 per million Btu at the Henry Hub in June 2008. About 1,600 rigs were drilling for gas. It was the game in town. And Wall Street firms were greasing it with other people’s money. Production soared. And the US became the largest gas producer in the world.
But then the price began to plunge. It recovered a little after the Financial Crisis but re-plunged during the gas “glut.” By April 2012, natural gas had crashed 85% from June 2008, to $1.92/mmBtu. With the exception of a few short periods, it has remained below $4/mmBtu – trading at $2.91/mmBtu today.
Throughout, gas drillers had to go back to Wall Street to borrow more money to feed the fracking orgy. They were cash-flow negative. They lost money on wells that produced mostly dry gas. Yet they kept up the charade. They aced investor presentations with fancy charts. They raved about new technologies that were performing miracles and bringing down costs. The theme was that they would make their investors rich at these gas prices.
The saving grace was that oil and natural-gas liquids, which were selling for much higher prices, also occur in many shale plays along with dry gas. So drillers began to emphasize that they were drilling for liquids, not dry gas, and they tried to switch production to liquids-rich plays. In that vein, Quicksilver ventured into the oil-rich Permian Basin in Texas. But it was too little, too late for the amount of borrowed money it had already burned through over the years by fracking for gas below cost.
During the terrible years of 2011 and 2012, drillers began reclassifying gas rigs as rigs drilling for oil. It was a judgement call, since most wells produce both. The gas rig count plummeted further, and the oil rig count skyrocketed by about the same amount. But gas production has continued to rise since, even as the gas rig count has continued to drop. On Friday, the rig count was down to 257 gas rigs, the lowest since March 1993, down 84% from its peak in 2008.
Quicksilver’s bankruptcy is a consequence of this fracking environment. It listed $2.35 billion in debts. That’s what is left from its borrowing binge that covered its negative cash flows. It listed only $1.21 billion in assets. The rest has gone up in smoke.
Its shares are worthless. Stockholders got wiped out. Creditors get to fight over the scraps.
Its leveraged loan was holding up better: the $625 million covenant-lite second-lien term loan traded at 56 cents on the dollar this morning, according to S&P Capital IQ LCD. But its junk bonds have gotten eviscerated over time. Its 9.125% senior notes due 2019 traded at 17.6 cents on the dollar; its 7.125% subordinated notes due 2016 traded at around 2 cents on the dollar.
Among its creditors, according to the Star Telegram: the Wilmington Trust National Association ($361.6 million), Delaware Trust Co. ($332.6 million), US Bank National Association ($312.7 million), and several pipeline companies, including Oasis Pipeline and Energy Transfer Fuel.
Last year, it hired restructuring advisers. On February 17, it announced that it would not make a $13.6 million interest payment on its senior notes and invoked the possibility of filing for Chapter 11. It said it would use its 30-day grace period to haggle with its creditors over the “company’s options.”
Now, those 30 days are up. But there were no other “viable options,” the company said in the statement. Its Canadian subsidiary was not included in the bankruptcy filing; it reached a forbearance agreement with its first lien secured lenders and has some breathing room until June 16.
Quicksilver isn’t alone in its travails. Samson Resources and other natural gas drillers are stuck neck-deep in the same frack mud.
A group of private equity firms, led by KKR, had acquired Samson in 2011 for $7.2 billion. Since then, Samson has lost $3 billion. It too hired restructuring advisers to deal with its $3.75 billion in debt. On March 2, Moody’s downgraded Samson to Caa3, pointing at “chronically low natural gas prices,” “suddenly weaker crude oil prices,” the “stressed liquidity position,” and delays in asset sales. It invoked the possibility of “a debt restructuring” and “a high risk of default.”
But maybe not just yet. The New York Post reported today that, according to sources, a JPMorgan-led group, which holds a $1 billion revolving line of credit, is granting Samson a waiver for an expected covenant breach. This would avert default for the moment. Under the deal, the group will reduce the size of the revolver. Last year, the same JPMorgan-led group already reduced the credit line from $1.8 billion to $1 billion and waived a covenant breach.
By curtailing access to funding, they’re driving Samson deeper into what S&P Capital IQ called the “liquidity death spiral.” According to the New York Post’s sources, in August the company has to make an interest payment to its more junior creditors, “and may run out of money later this year.”
Industry soothsayers claimed vociferously over the years that natural gas drillers can make money at these prices due to new technologies and efficiencies. They said this to attract more money. But Quicksilver along with Samson Resources and others are proof that these drillers had been drilling below the cost of production for years. And they’d been bleeding every step along the way. A business model that lasts only as long as new investors are willing to bail out old investors.
But it was the crash in the price of “liquids” that made investors finally squeamish, and they began to look beyond the hype. In doing so, they’re triggering the very bloodletting amongst each other that ever more new money had delayed for years. Only now, it’s a lot more expensive for them than it would have been three years ago. While the companies will get through it in restructured form, investors get crushed.
HOUSTON – It’s official: The shale oil boom is starting to waver.
And, in a way, it may have souped-up rigs and more efficient drilling technologies to thank for that.
Crude production at three major U.S. shale oil fields is projected to fall this month for the first time in six years, the U.S. Energy Information Administration said Tuesday.
It’s one of the first signs that idling hundreds of drilling rigs and billions of dollars in corporate cutbacks are starting to crimp the nation’s surging oil patch.
But it also shows that drilling technology and techniques have advanced to the point that productivity gains may be negligible in some shale plays where horizontal drilling and hydraulic fracturing have been used together for the past several years.
Because some plays are already full of souped-up horizontal rigs, oil companies don’t have as many options to become more efficient and stem production losses, as they did in the 2008-2009 downturn, the EIA said.
The EIA’s monthly drilling productivity report indicates that rapid production declines from older wells in three shale plays are starting to overtake new output, as oil companies drill fewer wells.
In the recession six years ago, the falling rig count didn’t lead to declining production because new technologies boosted how fast rigs could drill wells.
But now that oil firms have figured out how to drill much more efficiently, “it is not clear that productivity gains will offset rig count declines to the same degree as in 2008-09,” the EIA said.
Overall, U.S. oil production is set to increase slightly from March to April to 5.6 million barrels a day in six major fields, according to the EIA.
But output is falling in the Eagle Ford Shale in South Texas, North Dakota’s Bakken Shale and the Niobrara Shale in Colorado, Wyoming, Nebraska and Kansas.
In those three fields, net production is expected to drop by a combined 24,000 barrels a day.
The losses were masked by production gains in the Permian Basin in West Texas and other regions.
Efficiency improvements are still emerging in the Permian, faster than in other oil fields because the region was largely a vertical-drilling zone as recently as December 2013, the EIA said.
Net crude output in the Bakken is expected to decline by 8,000 barrels a day from March to April. In the Eagle Ford, it’s slated to fall by 10,000 barrels a day. And in the Niobrara, production will dip by roughly 5,000 barrels a day.
But daily crude output jumped by 21,000 barrels in the Permian and by 3,000 barrels in the Utica Shale in Ohio and Pennsylvania.
“People need to kinda settle in for a while.” That’s what Exxon Mobil CEO Rex Tillerson said about the low price of oil at the company’s investor conference. “I see a lot of supply out there.”
So Exxon is going to do its darnedest to add to this supply: 16 new production projects will start pumping oil and gas through 2017. Production will rise from 4 million barrels per day to 4.3 million. But it will spend less money to get there, largely because suppliers have had to cut their prices.
That’s the global oil story. In the US, a similar scenario is playing out. Drillers are laying some people off, not massive numbers yet. Like Exxon, they’re shoving big price cuts down the throats of their suppliers. They’re cutting back on drilling by idling the least efficient rigs in the least productive plays – and they’re not kidding about that.
In the latest week, they idled a 64 rigs drilling for oil, according to Baker Hughes, which publishes the data every Friday. Only 922 rigs were still active, down 42.7% from October, when they’d peaked. Within 21 weeks, they’ve taken out 687 rigs, the most terrific, vertigo-inducing oil-rig nose dive in the data series, and possibly in history:
As Exxon and other drillers are overeager to explain: just because we’re cutting capex, and just because the rig count plunges, doesn’t mean our production is going down. And it may not for a long time. Drillers, loaded up with debt, must have the cash flow from production to survive.
But with demand languishing, US crude oil inventories are building up further. Excluding the Strategic Petroleum Reserve, crude oil stocks rose by another 10.3 million barrels to 444.4 million barrels as of March 4, the highest level in the data series going back to 1982, according to the Energy Information Administration. Crude oil stocks were 22% (80.6 million barrels) higher than at the same time last year.
“When you have that much storage out there, it takes a long time to work that off,” said BP CEO Bob Dudley, possibly with one eye on this chart:
So now there is a lot of discussion when exactly storage facilities will be full, or nearly full, or full in some regions. In theory, once overproduction hits used-up storage capacity, the price of oil will plummet to whatever level short sellers envision in their wildest dreams. Because: what are you going to do with all this oil coming out of the ground with no place to go?
A couple of days ago, the EIA estimated that crude oil stock levels nationwide on February 20 (when they were a lot lower than today) used up 60% of the “working storage capacity,” up from 48% last year at that time. It varied by region:
Capacity is about 67% full in Cushing, Oklahoma (the delivery point for West Texas Intermediate futures contracts), compared with 50% at this point last year. Working capacity in Cushing alone is about 71 million barrels, or … about 14% of the national total.
As of September 2014, storage capacity in the US was 521 million barrels. So if weekly increases amount to an average of 6 million barrels, it would take about 13 weeks to fill the 77 million barrels of remaining capacity. Then all kinds of operational issues would arise. Along with a dizzying plunge in price.
In early 2012, when natural gas hit a decade low of $1.92 per million Btu, they predicted the same: storage would be full, and excess production would have to be flared, that is burned, because there would be no takers, and what else are you going to do with it? So its price would drop to zero.
They actually proffered that, and the media picked it up, and regular folks began shorting natural gas like crazy and got burned themselves, because it didn’t take long for the price to jump 50% and then 100%.
Oil is a different animal. The driving season will start soon. American SUVs and pickups are designed to burn fuel in prodigious quantities. People will be eager to drive them a little more, now that gas is cheaper, and they’ll get busy shortly and fix that inventory problem, at least for this year. But if production continues to rise at this rate, all bets are off for next year.
Natural gas, though it refused to go to zero, nevertheless got re-crushed, and the price remains below the cost of production at most wells. Drilling activity has dwindled. Drillers idled 12 gas rigs in the latest week. Now only 268 rigs are drilling for gas, the lowest since April 1993, and down 83.4% from its peak in 2008! This is what the natural gas fracking boom-and-bust cycle looks like:
Yet production has continued to rise. Over the last 12 months, it soared about 9%, which is why the price got re-crushed.
Producing gas at a loss year after year has consequences. For the longest time, drillers were able to paper over their losses on natural gas wells with a variety of means and go back to the big trough and feed on more money that investors were throwing at them, because money is what fracking drills into the ground.
But that trough is no longer being refilled for some companies. And they’re running out. “Restructuring” and “bankruptcy” are suddenly the operative terms.
Debt funded the fracking boom. Now oil and gas prices have collapsed, and so has the ability to service that debt. The oil bust of the 1980s took down 700 banks, including 9 of the 10 largest in Texas. But this time, it’s different. This time, bondholders are on the hook.
And these bonds – they’re called “junk bonds” for a reason – are already cracking. Busts start with small companies and proceed to larger ones. “Bankruptcy” and “restructuring” are the terms that wipe out stockholders and leave bondholders and other creditors to tussle over the scraps.
Early January, WBH Energy, a fracking outfit in Texas, kicked off the series by filing for bankruptcy protection. It listed assets and liabilities of $10 million to $50 million. Small fry.
A week later, GASFRAC filed for bankruptcy in Alberta, where it’s based, and in Texas – under Chapter 15 for cross-border bankruptcies. Not long ago, it was a highly touted IPO, whose “waterless fracking” technology would change a parched world. Instead of water, the system pumps liquid propane gel (similar to Napalm) into the ground; much of it can be recaptured, in theory.
Ironically, it went bankrupt for other reasons: operating losses, “reduced industry activity,” the inability to find a buyer that would have paid enough to bail out its creditors, and “limited access to capital markets.” The endless source of money without which fracking doesn’t work had dried up.
On February 17, Quicksilver Resources announced that it would not make a $13.6 million interest payment on its senior notes due in 2019. It invoked the possibility of filing for Chapter 11 bankruptcy to “restructure its capital structure.” Stockholders don’t have much to lose; the stock is already worthless. The question is what the creditors will get.
It has hired Houlihan Lokey Capital, Deloitte Transactions and Business Analytics, “and other advisors.” During its 30-day grace period before this turns into an outright default, it will haggle with its creditors over the “company’s options.”
On February 27, Hercules Offshore had its share-price target slashed to zero, from $4 a share, at Deutsche Bank, which finally downgraded the stock to “sell.” If you wait till Deutsche Bank tells you to sell, you’re ruined!
When I wrote about Hercules on October 15, HERO was trading at $1.47 a share, down 81% since July. Those who followed the hype to “buy the most hated stocks” that day lost another 44% by the time I wrote about it on January 16, when HERO was at $0.82 a share. Wednesday, shares closed at $0.60.
Deutsche Bank was right, if late. HERO is headed for zero (what a trip to have a stock symbol that rhymes with zero). It’s going to restructure its junk debt. Stockholders will end up holding the bag.
On Monday, due to “chronically low natural gas prices exacerbated by suddenly weaker crude oil prices,” Moody’s downgraded gas-driller Samson Resources, to Caa3, invoking “a high risk of default.”
It was the second time in three months that Moody’s downgraded the company. The tempo is picking up. Moody’s:
The company’s stressed liquidity position, delays in reaching agreements on potential asset sales and its retention of restructuring advisors increases the possibility that the company may pursue a debt restructuring that Moody’s would view as a default.
Moody’s was late to the party. On February 26, it was leaked that Samson had hired restructuring advisers Kirkland & Ellis and Blackstone’s restructuring group to figure out how to deal with its $3.75 billion in debt. A group of private equity firms, led by KKR, had acquired Samson in 2011 for $7.2 billion. Since then, Samson has lost $3 billion. KKR has written down its equity investment to 5 cents on the dollar.
This is no longer small fry.
Also on Monday, oil-and-gas exploration and production company BPZ Resources announced that it would not pay $62 million in principal and interest on convertible notes that were due on March 1. It will use its grace period of 10 days on the principal and of 30 days on the interest to figure out how to approach the rest of its existence. It invoked Chapter 11 bankruptcy as one of the options.
If it fails to make the payments within the grace period, it would also automatically be in default of its 2017 convertible bonds, which would push the default to $229 million.
BPZ tried to refinance the 2015 convertible notes in October and get some extra cash. Fracking devours prodigious amounts of cash. But there’d been no takers for the $150 million offering. Even bond fund managers, driven to sheer madness by the Fed’s policies, had lost their appetite. And its stock is worthless.
Also on Monday – it was “default Monday” or something – American Eagle Energy announced that it would not make a $9.8 million interest payment on $175 million in bonds due that day. It will use its 30-day grace period to hash out its future with its creditors. And it hired two additional advisory firms.
One thing we know already: after years in the desert, restructuring advisers are licking their chops.
The company has $13.6 million in negative working capital, only $25.9 million in cash, and its $60 million revolving credit line has been maxed out.
But here is the thing: the company sold these bonds last August! And this was supposed to be its first interest payment.
That’s what a real credit bubble looks like. In the Fed’s environment of near-zero yield on reasonable investments, bond fund managers are roving the land chasing whatever yield they can discern. And they’re holding their nose while they pick up this stuff to jam it into bond funds that other folks have in their retirement portfolio.
Not even a single interest payment!
Borrowed money fueled the fracking boom. The old money has been drilled into the ground. The new money is starting to dry up. Fracked wells, due to their horrendous decline rates, produce most of their oil and gas over the first two years. And if prices are low during that time, producers will never recuperate their investment in those wells, even if prices shoot up afterwards. And they’ll never be able to pay off the debt from the cash flow of those wells. A chilling scenario that creditors were blind to before, but are now increasingly forced to contemplate.
According to the payroll jobs report today (March 6) the economy created 295,000 new jobs in February, dropping the rate of unemployment to 5.5%. However, the BLS also reported that the labor force participation rate fell and the number of people not in the labor force rose by 354,000.
In other words, the unemployment rate dropped because the labor force shrunk.
If the economy was in recovery, the labor force would be growing and the labor force participation rate would be rising.
The 295,000 claimed new jobs are highly suspect. For example, the report claims 32,000 new retail jobs, but the Census Bureau reports that retail sales declined in December and January. Why would retailers experiencing declining sales hire more employees?
Construction spending declined 1.1% in January, but the payroll jobs report says 29,000 construction jobs were added in February.
There is no sign in the payroll jobs report of the large lay-offs by IBM and Hewlett Packard.
These and other inconsistencies do not inspire confidence.
By ignoring the inconsistencies the financial press does not inspire confidence.
Let’s now look at where the BLS says the payroll jobs are.
All of the goods producing jobs are accounted for by the 29,000 claimed construction jobs. The remaining 259,000 new jobs–90%–of the total–are service sector jobs. Three categories account for 70% of these jobs. Wholesale and retail trade, transportation and utilities account. for 62,000 of the jobs. Education and health services account for 54,000 of which ambulatory health care services accounts for 19,900. Leisure and hospitality account for 66,000 jobs of which waitresses and bartenders account for 58,700 jobs.
These are the domestic service jobs of a turd world country.
John Williams (shadowstats.com) reports: “As of February, the level of full-time employment still was 1.0 million shy of its pre-recession peak.”
Paul Craig Roberts was Assistant Secretary of the Treasury for Economic Policy and associate editor of the Wall Street Journal. He was columnist for Business Week, Scripps Howard News Service, and Creators Syndicate. He has had many university appointments. His internet columns have attracted a worldwide following. His latest book, The Failure of Laissez Faire Capitalism and Economic Dissolution of the West is now available.
The March 2015 Texas Home buyers and Sellers Report from the Texas Association of Realtors shows that between July 2013 and June 2014 median household income for Texas home buyers increased 5.9 percent year-over-year compared with a national increase of only 1.4 percent.
The study shows that between July 2013 and June 2014 median household income for Texas home buyers increased 5.9 percent year-over-year compared with a national increase of only 1.4 percent. However, the percentage of first-time home buyers in Texas fell 4 points to 29 percent, compared to a 5 percent decline nationally to 33 percent.
Home buyers in Texas are also two years older compared to the previous period, edging up to 45 years of age, and 72 percent of home buyers are married, compared to 65 percent nationally.
Texans are also buying larger and newer homes than other buyers across the U.S. In Texas, the typical three-bedroom, two-bathroom home had 2,100 square feet and was built in 2002, compared to the typical national home built in 1993 with 1,870 square feet.
Forty-seven percent of first-time home buyers in Texas said that finding the right property was the most difficult step in buying a home, as did 48 percent of repeat home buyers.
For Texans selling homes, 21 percent said that the reason for selling was because of job relocation, followed by 16 percent who said that their home was too small. The median household income for a Texas home seller was $120,800, compared with a national media income of $96,700 among home sellers.
Texas home buyers (overall): July 2013 – June 2014
Median household income: +5.9% to $97,500
Percent of homes bought that were new: 28% (-1% from July 2012 – June
2013)
Percentage of first-time home buyers: 29% (-4% from July 2012 – June
2013)
Age of typical home buyer: 45 years old (+2 years from July 2012 – June 2013)
Average age of first-time home buyer: 32 years old (+1 year from July
2012 – June 2013)
Average age of repeat home buyer: 50 years old (unchanged from July 2012 – June 2013)
Median household income for first-time home buyers: +5.8% to $72,000 (compared to July 2012 – June 2013)
Median household income for repeat home buyers: -8.9% to $97,500 (compared to July 2012 – June 2013)
Percent of married home buyers: 72% (+1% from July 2012 – June 2013)
New homes purchased: 28% (-2% from July 2012 – June 2013)
Median household income for home sellers: $120,800
Age of average home seller: 49 years
National home buyers (overall): June 2013 – July 2014
Median household income: +1.4% to $84,500
Percent of homes bought that were new: 16% (constant from July 2012 – June 2013)
Percentage of first-time home buyers: 33% (-5% from July 2012 – June 2013)
Age of typical home buyer: 44 years old (+2 years from July 2012 – June
2013)
Average age of first-time home buyer: 31 years old (unchanged from July
2012 – June 2013)
Average age of repeat home buyer: 53 years old (+1 year from July 2012 – June 2013)
Median household income for first-time home buyers: +2.3% to $68,300 (compared to July 2012 – June 2013)
Median household income for repeat home buyers: -1% to $95,000 (compared to July 2012 – June 2013)
Percent of married home buyers: 65% (-1% from July 2012 – June 2013)
New homes purchased: 16% (unchanged from July 2012 – June 2013)
The Fed should reject its inclination to raise rates, according to Jeffrey Gundlach. It’s rare that he agrees with Larry Summers, but in this case the two believe that the fundamentals in the U.S. economy do not justify higher interest rates.
Gundlach, the founder and chief investment officer of Los Angeles-based Doubleline Capital, spoke to investors in a conference call on February 17. The call was focused on the release of the new DoubleLine Long Duration Fund, but Gundlach also discussed a number of developments in the economy and the bond market.
Signals of an impending rate increase have come from comments by Fed governors that the word “patient” should be dropped from the Fed meeting notes, according to Gundlach. That word has taken on special significance, he explained, since Janet Yellen attached a two-month time horizon to it.
“If they drop that word,” Gundlach said, “it would be a strong signal that rates would rise in the following two months.”
The Fed seems “philosophically” inclined to raise rates, Gundlach said, even though the fundamentals do not justify such a move. Strong disinflationary pressure coming from the collapse in oil prices should caution the Fed against raising rates, he said.
Gundlach was asked about comments by Gary Shilling that oil prices might go as low at $10/barrel. “We better all hope we don’t get $10,” he said, “because something very deflationary would be happening in this world.” If that is the case, Gundlach said investors should flock to long-term Treasury bonds.
“I’d like to think that the world is not in that kind of deflationary precipice,” he said.
Oil will break below its previous $44 low, Gundlach said. But he did not put a price target on oil.
Gundlach warned that by mid-year, if the Fed does raise rates, “the sinister side of low oil may raise its head.” At that time, lack of hiring or layoffs in the fracking industry could cripple the economy, according to Gundlach.
In the short term, Gundlach said that the recent rise in interest rates is a signal that the “huge deflationary scare” –which was partly because of Greece – has dissipated. Investors should monitor Spanish and Italian yields, he said. If they remain low, it is a signal that Greece is not leaving the Eurozone or that, if it does, “it is not a big deal.”
OPEC is supposedly out to beat, or at least curtail the growth of American shale oil production.
For a host of reasons, especially the much shorter capex cycle for shale, they will not succeed unless they are willing to accept permanent low oil prices.
But, permanent low oil prices will do too much damage to OPEC economies for this to be a credible threat.
We’re sure by now you are familiar with the main narrative behind the oil price crash. First, while oil production outside of North America is basically stagnant since 2005.
The shale revolution has dramatically increased supply in America.
(click to enlarge)
The resulting oversupply has threatened OPEC and the de-facto leader Saudi Arabia has chosen a confrontational strategy not to make way for the new kid on the block, but instead trying to crush, or at least contain it. Can they achieve this aim, provided it indeed is their aim?
Breakeven price At first, one is inclined to say yes, for the simple reason that Saudi (and most OPEC) oil is significantly cheaper to get out of the ground.
(click to enlarge)
This suggests that all OPEC has to do is to keep output high and sooner or later the oversupply will work itself off the market, and expensive oil is more likely to see cutbacks than cheaper oil, although this critically depends on incentives facing individual producers.
Capex decline It is therefore no wonder that we’ve seen significant declines in rig counts and numerous companies have announced considerable capex declines. While this needs time to work out into supply cutbacks, these will eventually come.
For instance BP (NYSE:BP) cutting capex from $22.9B in 2014 to $20B in 2015, or Conoco (NYSE:COP) reducing expenditures by more than 30% to $11.5B this year on drilling projects from Colorado to Indonesia. There are even companies, like SandRidge (NYSE:SD), that are shutting 75% of their rigs.
Leverage It is often argued that the significant leverage of many American shale companies could accelerate the decline, although it doesn’t necessarily have to be like that.
While many leveraged companies will make sharp cutbacks in spending, which has a relatively rapid effect on production (see below), others have strong incentives to generate as much income as possible, so they might keep producing.
Even the companies that go belly up under a weight of leverage will be forced to relinquish their licenses or sell them off at pennies to the dollar, significantly lowering the fixed cost for new producers to take their place.
Hedging Many shale companies have actually hedged much of their production, so they are shielded from much of the downside (at a cost) at least for some time. And they keep doing this:
Rather than wait for their price insurance to run out, many companies are racing to revamp their policies, cashing in well-placed hedges to increase the number of future barrels hedged, according to industry consultants, bankers and analysts familiar with the deals. [Reuters]
Economics Being expensive is not necessarily a sufficient reason for being first in line for production cuts. For instance, we know that oil from the Canadian tar sands is at the high end of cost, but simple economics can explain why production cuts are unlikely for quite some time to come.
The tar sands involve a much higher fraction as fixed cost:
Oil-sands projects are multibillion-dollar investments made upfront to allow many years of output, unlike competing U.S. shale wells that require constant injections of capital. It’s future expansion that’s at risk. “Once you start a project it’s like a freight train: you can’t stop it,” said Laura Lau, a Toronto-based portfolio manager at Brompton Funds. Current oil prices will have producers considering “whether they want to sanction a new one.” [Worldoil]
So, once these up-front costs are made, these are basically sunk, and production will only decline if price falls below marginal cost. As long as the oil price stays above that, companies can still recoup part of their fixed (sunk) cost and they have no incentive to cut back production.
But, of course, you have tar sand companies that have not yet invested all required up-front capital and new capex expenditures will be discouraged with low oil prices. So, there is still the usual economic upward sloping supply curve operative here.
Swing producer The funny thing is American shale oil is at the opposite end of this fixed (and sunk) cost universe, apart from acquiring the licenses. As wells have steep decline curves, production needs constant injection of capital for developing new wells.
Production can therefore be wound down pretty quickly should the economics require, and it can also be wound back up relatively quickly, which we think is enough reason why American shale is becoming the new (passive) swing producer. This has very important implications:
The relevant oil price to look at isn’t necessarily the spot price, but the 12-24 months future price, the time frame between capex and production.
OPEC will not only need to produce a low oil price today, that price needs to be low for a prolonged period of time in order to see cutbacks in production of American shale oil. Basically, OPEC needs the present oil price to continue indefinitely, as soon as it allows the price to rise again, shale oil capex will rebound and production will increase fairly soon afterwards.
So basically, shale is the proverbial toy duck which OPEC needs to submerge in the bathtub, but as soon as it releases the pressure, the duck will emerge again.
Declining cost curves The shale revolution caught many by surprise, especially the speed of the increase in production. While technology and learning curves are still improving, witness how production cost curves have been pushed out in the last years:
There is little reason this advancement will come to a sudden halt, even if capex is winding down. In fact, some observers are arguing that producers shift production from marginal fields to fields with better production economics, and the relatively steep production decline curves allow them to make this shift pretty rapidly.
Others point out that even the rapid decline in rig count will not have an immediate impact on production, as the proportion of horizontal wells and platforms where multiple wells are drilled from the same location are increasing, all of which is increasing output per rig.
Another shift that is going on is to re-frack existing wells, instead of new wells. The first is significantly cheaper:
Beset by falling prices, the oil industry is looking at about 50,000 existing wells in the U.S. that may be candidates for a second wave of fracking, using techniques that didn’t exist when they were first drilled. New wells can cost as much as $8 million, while re-fracking costs about $2 million, significant savings when the price of crude is hovering close to $50 a barrel, according to Halliburton Co., the world’s biggest provider of hydraulic fracturing services. [Bloomberg]
Production cuts will take time The hedging and shift to fields with better economics is only a few of the reasons why so far there has been little in the way of actual production cuts in American shale production, the overall oil market still remains close to record oversupply. The International Energy Agency (IEA) argues:
It is not unusual in a market correction for such a gap to emerge between market expectations and current trends. Such is the cyclical nature of the oil market that the full physical impact of demand and supply responses can take months, if not years, to be felt [CNBC].
In fact, the IEA also has explicit expectations for American shale oil itself:
The United States will remain the world’s top source of oil supply growth up to 2020, even after the recent collapse in prices, the International Energy Agency said, defying expectations of a more dramatic slowdown in shale growth [Yahoo].
OPEC vulnerable itself Basically, the picture we’re painting above is that American shale will be remarkably resilient. Yes, individual companies will struggle, sharp cutbacks in capex are already underway, and some companies will go under, but the basic fact is that as quick as capex and production can fall, they can rise as quickly again when the oil price recovers.
How much of OPEC can the storm of the oil price crash, very much remains to be seen. There is pain all around, which isn’t surprising as one considers that most OPEC countries have budgeted for much higher oil prices for their public finances.
(click to enlarge) You’ll notice that these prices are all significantly, sometimes dramatically, higher than what’s needed to balance their budgets. Now, many of these countries also have very generous energy subsidies on domestic oil use, supposedly to share the benefits of their resource wealth (and/or provide industry with a cost advantage).
So, there is a buffer as these subsidies can be wound down relatively painless. Some of these countries also have other buffers, like sovereign wealth funds or foreign currency reserves. And there is often no immediate reason for public budgets to be balanced.
But to suggest, as this article is doing, that OPEC is winning the war is short-sighted.
Conclusion While doing damage to individual American shale oil producers and limiting its expansion, the simple reality is that for a host of reasons discussed above, OPEC can’t beat American shale oil production unless it is willing to accept $40 oil indefinitely. While some OPEC countries might still produce profitably at these levels, the damage to all OPEC economies will be immense, so, we can’t really see this as a realistic scenario in any way.
One-Sixth of U.S. Office Space Under Construction Is Here, but Need Is Waning
Construction giant Skanska AB is developing two office buildings in Houston’s “Energy Corridor.” The one that is nearly complete is mostly leased; the other building doesn’t yet have any tenants. Photo: Michael Stravato for Wall Street Journal. Article byEliot Brown
HOUSTON—The jagged skyline of this oil-rich city is poised to be the latest victim of falling crude prices.
As the energy sector boomed in recent years, developers flocked to Houston, so much so that one-sixth of all the office space under construction in the entire U.S. is in the metropolitan area of the Texas city.
But now, the need for more offices is drying up, thanks to a drop in oil prices that has spun energy companies from an outlook of optimism and growth to anxiety and cutbacks. Oil prices have fallen by more than 50% since June.
Demand for office space is “going to basically stop,” said Walter Page, director of office research at property data firm CoStar Group Inc. “It hurts a lot more when you have a lot of construction.”
By the end of 2014, construction had started on about 80 buildings with about 18 million square feet of office space in the greater Houston area, according to CoStar. Many of the buildings were planned or started when oil was above $100 a barrel. On Tuesday, oil futures traded around $50. The amount under construction is equal to Kansas City, Mo.’s entire downtown office market and is 16% of all U.S. office development under way.
The rush of building has created thousands of jobs—not only at building sites, but also at window manufacturers, concrete companies and restaurants that feed the workers.
But just as the wave of office-space supply approaches, energy companies, including Halliburton Co. , Baker Hughes Inc., Weatherford International and BP PLC, have collectively announced that more than 23,000 jobs would be cut, with many of them expected to be in Houston.
Fewer workers, of course, means less need for office space. Employers have rushed to sublease space in recent months, with 5.2 million square feet of space on the market as of last month, up about 1 million square feet from mid-2014, according to brokerage firm Savills Studley. BP, for example, is trying to sublet 240,000 square feet of space at its campus in the Westlake neighborhood, which represents about 11% of BP’s space at the campus, according to CoStar. A BP spokesman said the company is “consolidating” its footprint.
But the current building boom is Houston’s biggest since the 1980s, when an oil bust, coupled with a rash of empty skyscrapers, made Houston a national symbol of overbuilding. Then, armed with debt from a banking sector eager to lend, developers brought a tidal wave of building to Houston, in some years increasing the office stock by well over 10%. Vacancy rates shot up past 30% from single digits, property values plummeted and landlords defaulted on mortgages.
That contributed to a wave of failures for banks stuffed with commercial-property loans. More than 425 Texas institutions between 1980 and 1989 failed, including nine of the state’s 10 largest banks.
Few are predicting a shock near that scale this time. Even if oil prices stay low, the local economy is more diversified than in the 1980s with sectors such as health care and higher education comprising a larger share of the workforce. In addition, new construction represents about 6.3% all the area’s total office stock, and there is far less speculative construction done before a tenant is signed up.
“Everybody here in Houston is waiting to exhale,” said Michael Scheurich, chief executive of general contractor Arch-Con Corp., which currently is building two midsize office projects in the area. Mr. Scheurich said his company has grown to about 80 employees from fewer than 25 in 2011 amid the construction boom. Now he is hoping the local economy will have “a soft landing.”
Still, cranes abound throughout Houston, thanks to publicly traded real-estate companies, pension funds and other interests like Swedish construction giant Skanska AB, which are funding construction without as much reliance on debt as in the 1980s.
‘Everybody here in Houston is waiting to exhale.’
—Michael Scheurich, chief executive at Arch-Con Corp.
Running west from the downtown along Interstate 10, numerous midsize construction projects aimed at the “upstream” companies focused on energy extraction are being built in the so-called Energy Corridor.
Analysts say this shows how the sector is highly susceptible to booms and busts because of the long lag time between when buildings are started and when they are delivered, compounded by the tendency of developers and financiers to start projects en masse, late in cycles.
Developers are often victims of “herding and group think,” said Rachel Weber, an urban planning professor at the University of Illinois at Chicago who is writing a book about office over development in Chicago. “There is a sense that if everybody is moving in the same direction and acting the same way, that you do better to mimic that kind of behavior.”
Many of those building are bracing for a sting in the short-term. It could be even more painful if oil prices stay low.
It “is going to be a soft year—it’s hard not to see that,” said Mike Mair, an executive vice president in charge of Houston-area development for Skanska. The company is putting the finishing touches on a new 12-story tower in the Energy Corridor that is 62% leased. Construction is under way on a nearly identical building next door for which it doesn’t have any tenants.
Still, Mr. Mair said he believes in the city’s economic strength in the mid- and long-term, giving him confidence to finish work on the second tower. “I’m not afraid of ’16 and ’17,” he said.
Of course, higher vacancy rates would mean lower rents, which is good for anyone signing a lease. Rents at top-quality buildings averaged $34.51 a square foot at the end of 2014, up about 15% from early 2012, according to CoStar. But brokers say landlord incentives have grown, and rents typically follow the direction of oil prices, with a lag of one or two quarters. Still, the rents are a bargain compared with other major cities such as New York, where top-quality offices rent for an average $59 a square foot.
The city of Houston, for one, could be a beneficiary of lower rents. The government had been planning to build a new police department headquarters at an estimated cost of between $750 million and $1 billion.
Late last month, the mayor’s office said it was examining the possibility of leasing the building that Exxon Mobil is leaving, which would cost far less than the city’s original plan.
February 4th, 2015: Crude oil had rallied 20% in three days, with West Texas Intermediate jumping $9 a barrel since Friday morning, from $44.51 a barrel to $53.56 at its peak on Tuesday. “Bull market” was what we read Tuesday night. The trigger had been the Baker Hughes report of active rigs drilling for oil in the US, which had plummeted by the most ever during the latest week. It caused a bout of short covering that accelerated the gains. It was a truly phenomenal rally!
But the weekly rig count hasn’t dropped nearly enough to make a dent into production. It’s down 24% from its peak in October. During the last oil bust, it had dropped 60%. It’s way too soon to tell what impact it will have because for now, production of oil is still rising.
And that phenomenal three-day 20% rally imploded today when it came in contact with another reality: rising production, slack demand, and soaring crude oil inventories in the US.
The Energy Information Administration reported that these inventories (excluding the Strategic Petroleum Reserve) rose by another 6.3 million barrels last week to 413.1 million barrels – the highest level in the weekly data going back to 1982. Note the increasingly scary upward trajectory that is making a mockery of the 5-year range and seasonal fluctuations:
And there is still no respite in sight.
Oil production in the US is still increasing and now runs at a multi-decade high of 9.2 million barrels a day. But demand for petroleum products, such as gasoline, dropped last week, according to the EIA, and so gasoline inventories jumped by 2.3 million barrels. Disappointed analysts, who’d hoped for a drop of 300,000 barrels, blamed the winter weather in the East that had kept people from driving (though in California, the weather has been gorgeous). And inventories of distillate, such as heating oil and diesel, rose by 1.8 million barrels. Analysts had hoped for a drop of 2.2 million barrels.
In response to this ugly data, WTI plunged $4.50 per barrel, or 8.5%, to $48.54 as I’m writing this. It gave up half of the phenomenal three-day rally in a single day.
In our experience, oil markets rarely exhibit V-shaped recoveries and we would be surprised if an oversupply situation as severe as the current one was resolved this soon. In fact, our balances indicate the absolute oversupply is set to become more severe heading into 2Q15.
Those hoping for a quick end to the oil glut in the US, and elsewhere in the world, may be disappointed because there is another principle at work – and that principle has already kicked in.
As the price has crashed, oil companies aren’t going to just exit the industry. Producing oil is what they do, and they’re not going to switch to selling diapers online. They’re going to continue to produce oil, and in order to survive in this brutal pricing environment, they have to adjust in a myriad ways.
“Efficiency and innovation, when price falls, it accelerates, because necessity is the mother of invention,” Michael Masters, CEO of Masters Capital Management, explained to FT Alphaville on Monday, in the middle of the three-day rally. “Even if the investment only spits out quarters, or even nickels, you don’t turn it off.”
Crude has been overvalued for over five years, he said. “Whenever the return on capital is in the high double digits, that’s not sustainable in nature.” And the industry has gotten fat during those years.
Now, the fat is getting trimmed off. To survive, companies are cutting operating costs and capital expenditures, and they’re shifting the remaining funds to the most productive plays, and they’re pushing 20% or even 30% price concessions on their suppliers, and the damage spreads in all directions, but they’ll keep producing oil, maybe more of it than before, but more efficiently.
This is where American firms excel: using ingenuity to survive. The exploration and production sector has been through this before. And those whose debts overwhelm them – and there will be a slew of them – will default and restructure, wiping out stockholders and perhaps junior debt holders, and those who hold the senior debt will own the company, minus much of the debt. The groundwork is already being done, as private equity firms and hedge funds offer credit to teetering oil companies at exorbitant rates, with an eye on the assets in case of default.
And these restructured companies will continue to produce oil, even if the price drops further.
So Masters said that, “in our view, production will not decrease but increase,” and that increased production “will be around a lot longer than people are forecasting right now.”
After the industry goes through its adjustment process, focused on running highly efficient operations, it can still scrape by with oil at $45 a barrel, he estimated, which would keep production flowing and the glut intact. And the market has to appreciate that possibility.
Rigs Down By 21% Since Start Of 2015 Permian Basin loses 37 rigs first week in February
The number of rigs exploring for oil and natural gas in the Permian Basin fell 37 this week to 417, according to the weekly rotary rig count released Friday by Houston-based oilfield service company Baker Hughes.
This week’s count marked the ninth-consecutive decrease for the Permian Basin. The last time Baker Hughes reported a positive rig-count change was Dec. 5, when 568 rigs were reported. Since then, the Permian Basin has shed 151 rigs, a decrease of 26.58 percent.
For the year, the Permian Basin has shed 113 rigs, or 21.32 percent.
In District 8, which includes Midland and Ector counties, the rig count fell 19 this week to 256. District 8 has shed 58 rigs, 18.47 percent, this year.
Texas lost 41 rigs this week for a statewide total of 654. The Lone Star State has 186 fewer rigs since the beginning of the year, a decrease of 22.14 percent.
In other major Texas basins, there were 168 rigs in the Eagle Ford, down 10; 43 in the Haynesville, unchanged; 39 in the Granite Wash, down one; and 19 in the Barnett, unchanged.
The Haynesville shale is the only major play in Texas to have added rigs this year. The East Texas play started 2015 with 40 rigs.
At this time last year, there were 483 rigs in the Permian Basin and 845 in Texas.
In the U.S., there were 1,456 rigs this week, a decrease of 87. There were 1,140 oil rigs, down 83; 314 natural gas rigs, down five; and two rigs listed as miscellaneous, up one.
By trajectory, there were 233 vertical drilling rigs, down two; 1,088 horizontal drilling rigs, down 80; and 135 directional drilling rigs, down five.
The top five states by rig count this week were Texas; Oklahoma with 176, down seven; North Dakota with 132, down 11; Louisiana with 107, down one; and New Mexico with 78, down nine.
The top five basins were the Permian; the Eagle Ford; the Williston with 137, down 11; the Marcellus with 71, down four; and the Mississippian with 53, down one.
In the U.S., there were 1,397 rigs on land, down 85; nine in inland waters, down three; and 50 offshore, up one. There were 48 rigs in the Gulf of Mexico, up one.
Canada’s rig count fell 13 this week to 381. There were 184 oil rigs, down 16; 197 natural gas rigs, up three; and zero rigs listed as miscellaneous, unchanged. Canada had 621 rigs a year ago this week, a difference of 240 rigs compared to this week’s count.
The number of rigs exploring for oil and natural gas in the North America region, which includes the U.S. and Canada, fell 100 this week to 1,837. There were 2,392 rigs in North America last year.
Rigs worldwide
On Friday, Baker Hughes released its monthly international rig count for January. The worldwide total was 3,309 rigs. The U.S. ended January with 1,683 rigs, just more than half of all rigs worldwide.
The following are January’s rig counts by region, with the top three nations in each region in parentheses:
The oil boom that lifted home prices in Texas, Oklahoma and Louisiana is coming to an end.
Crude oil prices have crashed since June, falling by more than 54 percent to less than $50 a barrel. That swift drop has started to cripple job growth in oil country, creating a slow wave that in the years ahead may devastate what has been a thriving real estate market, according to new analysis by the real estate firm Trulia.
“Oil prices won’t tank home prices immediately,” Trulia chief economist Jed Kolko explained. “Rather, falling oil prices in the second half of 2014 might not have their biggest impact on home prices until late 2015 or in 2016.”
History shows it takes time for home prices in oil country to change course.
Kolko looked at the 100 largest housing markets where the oil industry accounted for at least 2 percent of all jobs. Asking prices in those cities rose 10.5 percent over the past year, compared with an average of 7.7 percent around the country.
Prices climbed 13.4 percent in Houston, where 5.6 percent of all jobs are in oil-related industries. The city is headquarters to energy heavyweights such as Phillips 66, Halliburton and Marathon Oil. Asking prices surged 10.2 percent in Fort Worth and 10.1 percent in Tulsa, Oklahoma. In some smaller markets, oil is overwhelmingly dominant — responsible for more than 30 percent of the jobs in Midland for instance.
The closest parallel to the Texas housing market might have occurred in the mid-1980s, when CBS was airing the prime-time soap opera “Dallas” about a family of oil tycoons.
In the first half of 1986, oil prices plunged more than 50 percent, to about $12 a barrel, according to a report by the Brookings Institution, a Washington-based think tank.
Job losses mounted in late 1986 around Houston. The loss of salaries eventually caused home prices to fall in the second half of 1987.
That led Kolko to conclude that since 1980, it takes roughly two years for changes in oil prices to hit home prices.
Of course, there is positive news for people living outside oil country, Kolko notes.
Falling oil prices lead to cheaper gasoline costs that reduce family expenses, freeing up more cash to spend.
“In the Northeast and Midwest especially, home prices tend to rise after oil prices fall,” he writes in the analysis.
Oilfield worker on a rig Active pumping rig located on Highway 385 south of Odessa, photographed Tuesday, Sept. 24, 2014. James Durbin/Reporter-Telegram. Source: MRT.com
MIDLAND — With oil prices plummeting by more than 50 percent since June, the gleeful mood of recent years has turned glum here in West Texas as the frenzy of shale oil drilling has come to a screeching halt.
Every day, oil companies are decommissioning rigs and announcing layoffs. Small firms that lease equipment have fallen behind in their payments.
In response, businesses and workers are getting ready for the worst. A Mexican restaurant has started a Sunday brunch to expand its revenues beyond dinner. A Mercedes dealer, anticipating reduced demand, is prepared to emphasize repairs and sales of used cars. And people are cutting back at home, rethinking their vacation plans and cutting the hours of their housemaids and gardeners.
Dexter Allred, the general manager of a local oil field service company, began farming alfalfa hay on the side some years ago in the event that oil prices declined and work dried up. He was taking a cue from his grandfather, Homer Alf Swinson, an oil field mechanic, who opened a coin-operated carwash in 1968 — just in case.
“We all have backup plans,” Allfred said with a laugh. “You can be sure oil will go up and down, the only question is when.”
Indeed, to residents here in the heart of the oil patch, booms and busts go with the territory.
“This is Midland and it’s just a way of life,” said David Cristiani, owner of a downtown jewelry store, who keeps a graph charting oil prices since the late 1990s on his desk to remind him that the good times do not last forever. “We are always prepared for slowdowns. We just hunker down. They wrote off the Permian Basin in 1984, but the oil will always be here.”
It is at times like these that Midland residents recall the wild swings of the 1980s, a decade that began with parties where people drank Dom Pérignon out of their cowboy boots. Rolls-Royce opened a dealership, and the local airport had trouble finding space to park all the private jets.
By the end of the decade, the Rolls-Royce dealership was shut and replaced by a tortilla factory, and three banks had failed.
There has been nothing like that kind of excess over the past five years, despite the frenzy of drilling across the Permian Basin, the granddaddy of U.S. oil fields. Set in a forsaken desert where tumbleweed drifts through long-forgotten towns, the region has undergone a renaissance in the last four years, with horizontal drilling and fracking reaching through multiple layers of shale stacked one over the other like a birthday cake.
But since the Permian Basin rig count peaked at around 570 last September, it has fallen to below 490, and local oil executives say the count will probably go down to as low as 300 by April unless prices rebound.
The last time the rig count declined as rapidly was in late 2008 and early 2009, when the price of oil fell from more than $140 to under $40 a barrel because of the financial crisis.
Unlike traditional oil wells, which cannot be turned on and off so easily, shale production can be cut back quickly, and so the field’s output should slow considerably by the end of the year.
The Dallas Federal Reserve recently estimated that the falling oil prices and other factors will reduce job growth in Texas overall from 3.6 percent in 2014 to as low as 2 percent this year, or a reduction of about 149,000 jobs created.
Midland’s recent good fortune is plain to see. The city has grown in population from 108,000 in 2010 to 140,000 today, and there has been an explosion of hotel and apartment construction. Companies like Chevron and Occidental are building new local headquarters. Real estate values have roughly doubled during the past five years, according to Mayor Jerry Morales.
The city has built a new fire station and recruited new police officers with the infusion of new tax receipts, which increased by 19 percent from 2013 to 2014 alone. A new $14 million court building is scheduled to break ground next month.
But the city has also put away $39 million in a rainy-day fund for the inevitable oil bust.
“This is just a cooling-off period,” Morales said. “We will prevail again.”
Expensive restaurants are still full and traffic around the city can be brutal. Still, everyone seems to sense that the pain is coming, and they are preparing for it.
“We are responding to survive, so that we may once again thrive when we come out the other side,” said Steven H. Pruett, president and chief executive of Elevation Resources, a Midland-based oil exploration and production company. “Six months ago there was a swagger in Midland and now that swagger is gone.”
Pruett’s company had six rigs running in early December but now has only three. It will go down to one by the end of the month, even though he must continue to pay a service company for two of the rigs because of a long-term contract.
The other day Pruett drove to a rig outside of Odessa he feels compelled to park to save cash, and he expressed concern that as many as 50 service workers could eventually lose their jobs.
But the workers themselves seemed stoic about their fortunes, if not upbeat.
“It’s always in the back of your mind — being laid off and not having the security of a regular job,” said Randy Perry, a tool-pusher who makes $115,000 a year, plus bonuses, managing the rig crews. But Perry said he always has a backup plan because layoffs are so common — even inevitable.
Since graduating from high school a decade ago, he has bought several houses in East Texas and fixed them up, doing the plumbing and electrical work himself. At age 29 with a wife and three children, he currently has three houses, and if he is let go, he says he could sell one for a profit he estimates at $50,000 to $100,000.
Just a few weeks ago, he and other employees received a note from Trent Latshaw, the head of his company, Latshaw Drilling, saying that layoffs may be necessary this year.
“The people of the older generation tell the young guys to save and invest the money you make and have cash flow just in case,” Perry said during a work break. “I feel like everything is going to be OK. This is not going to last forever.”
The most nervous people in Midland seem to be the oil executives who say busts may be inevitable, but how long they last is anybody’s guess.
Over a lavish buffet lunch recently at the Petroleum Club of Midland, the talk was woeful and full of conspiracy theories about how the Saudis were refusing to cut supplies to vanquish the surging U.S. oil industry.
“At $45 a barrel, it shuts down nearly every project,” Steve J. McCoy, Latshaw Drilling’s director of business development, told Pruett and his guests. “The Saudis understand and they are killing us.”
Pruett nodded in agreement, adding, “They are trash-talking the price of oil down.”
“Everyone has been saying ‘Happy New Year,’” Pruett continued. “Yeah, some happy new year.”
NEW YORK (Reuters) – DoubleLine Capital’s Jeffrey Gundlach said on Tuesday there is a possibility of a “true collapse” in U.S. capital expenditures and hiring if the price of oil stays at its current level.
Gundlach, who correctly predicted government bond yields would plunge in 2014, said on his annual outlook webcast that 35 percent of Standard & Poor’s capital expenditures comes from the energy sector and if oil remains around the $45-plus level or drops further, growth in capital expenditures could likely “fall to zero.”
Gundlach, the co-founder of Los Angeles-based DoubleLine, which oversees $64 billion in assets, noted that “all of the job growth in the (economic) recovery can be attributed to the shale renaissance.” He added that if low oil prices remain, the U.S. could see a wave of bankruptcies from some leveraged energy companies.
Brent crude approached a near six-year low on Tuesday as the United Arab Emirates defended OPEC’s decision not to cut output and traders wondered when a six-month price rout might end.
Brent has fallen as low as just above $45 a barrel, near a six-year low, having averaged $110 between 2011 and 2013.
Gundlach said oil prices have to stop going down so “don’t be bottom-fishing in oil” stocks and bonds. “There is no hurry here.”
Energy bonds, for example, have been beaten up and appear attractive on a risk-reward basis, but investors need to hedge them by purchasing “a lot, lot of long-term Treasuries. I’m in no hurry to do it.”
High-yield junk bonds have also been under severe selling pressure. Gundlach said his firm bought some junk in November but warned that investors need to “go slow” and pointed out “we are still underweight.”
Gundlach said U.S. stocks could outperform other countries’ equities as the economic recovery looks stronger than its counterparts, though double-digit gains cannot be repeated.
He also reiterated that it’s possible yields on the benchmark 10-year Treasury note could drop to 1 percent in 2015. The 10-year yield traded around 1.91 percent on Tuesday, little changed from late on Monday after hitting 20-month low of 1.8640 percent.
“The 10-year Treasury could join the Europeans and go to 1 percent. Why not?” Gundlach told Reuters last month. “If oil goes to $40, then the 10-year could be going to 1 percent.”
The yield on 10-year German Bunds stood at 0.47 percent on Tuesday.
This is the title of the latest webcast from DoubleLine Capital’s Jeffrey Gundlach, who just wrapped up a webcast giving his outlook for 2015.
We last heard from Gundlach in December when he held a presentation called “This Time It’s Different,” in which he talked about the oil markets, the dollar, and how the 10-year Treasury bond could get to 1%.
Among the things Gundlach believes 2015 has in store for the market is more volatility, lower Treasury yields, and a Federal Reserve rate hike, “just to see if they can do it.”
Gundlach spent a good chunk of his open talking about the effects that the decline in oil will have on jobs growth and capital investment in the US, noting that 35% of capital investment from the S&P 500 is related to the energy sector.
The bull case for the US in 2015, Gundlach said, is predicated primarily on the strength of the US labor market. Meanwhile the chart of the year so far is the US 10-year yield against other major economies, with the US clearly having space to converge towards the super-low yields seen on 10-year bonds in Japan, Germany, and Switzerland.
We’ve broken out a number of Gundlach’s slides below and added commentary taken as he spoke live on Tuesday.
Gundlach says of the title that it stands for the fifth year that he’s being these webcasts, but also has a market theme. “Most risk markets have gone into a V since about June.”
Says that the “touchdown” part of the drop in oil is that consumers get more money in their pocket. “I think that’s one of the reasons, rightly, that people view the oil decline as somewhat positive.”
Gundlach says that there is a sinister side to the oil decline, which is potential impacts on employment in the US, particularly in the energy space.
Gundlach says “all of the job growth” from the recession until today can be attributed to the shale oil boom.
“It wasn’t the US of A in 2014, but the US of Only.”
US stocks were the only really strong equity markets among major developed economies. Chinese and Indian stocks were big winners among emerging markets.
Gundlach says he’s been positive on the US dollar since 2011. This was a huge consensus trade in 2014, and Gundlach says sometimes the consensus is right.
“It looks to me like the dollar is headed higher.”
Gundlach says he knows long dollar is a crowded trade, but the fundamentals bolstering a strong dollar remain in tact.
Additionally, Gundlach thinks the Fed will raise rates with a few more months of strong payrolls gains, which will only make the dollar stronger.
Oil prices have been correlated with GDP growth 18 months forward.
And so this chart implies 3+% global growth going forward.
“On balance this should be viewed as an encouraging indicator.”
Gundlach doesn’t think, however that global growth is going to be upgraded in 2015, and like the last several years will be downgraded as the year goes along.
Gundlach says US outperformance “isn’t really a great sign.” But says US is probably the preferred place to invest against the rest of the world, however.
“It’s almost impossible for the gains from June 2014 to now to be repeated this year.”
“I’ll bet you dollars to donuts the red line goes down.”
Gundlach says that oil just can’t stop going down. Last year, Treasury yields couldn’t stop going down, and this year oil can’t seem to stop going down.
Adds that contrarianism is dagnerous in commodities and stocks, says that contrarian investing is tempting, but oil is just a dangerous trade right now.
Gundlach says that once oil broke $70, it would create acceptance that oil isn’t going back to $95, causing producers to increase production because they need the revenue, not cut production to boost prices.
Gundlach says the bond chart of the year is part of the argument about why oil at $40, weighing on inflation, could bring the 10-year below its 2012 lows.
Gundlach says that with online sales at 9% of retail sales coming online, it seems low. But consider that you can’t buy gasoline online, you don’t really buy groceries online.
“I think of all the car companies, Tesla is less of a car company than any other.”
“I’m surprised that anyone would change their car buying habits based on the six-month price of oil. Tesla isn’t so much a play on cars being sold, but on batteries being transformative in many phases of life.”
Gundlach again talking about potential for Tesla’s batteries to get homes entirely off the grid.
“Tesla has as good a chance as anybody to develop a battery that can change the world.”
Says that the stock is hugely overvalued if you just look at the auto sales.
Texas is by far the largest producer of oil in the US.
Oil production represents a disproportionate portion of Texas’s economy.
With oil prices down 45%, oil’s share of Texas GDP may fall 50% or more.
Unlike Russia and other countries, Texas cannot depreciate its own currency, magnifying the economic effect.
Texas is the largest oil producer in the US. And oil prices are down almost 50% in the past 4 months. Yet nowhere in the news do we hear about the risk of Texas entering a recession. The facts and figures below should concern investors in securities with economic exposure to the Texas economy. The risk is real.
As seen in the below chart by the EIA, Texas is the largest oil producing state in the US, producing 3x as much oil as the next largest producing state.
In September, Texas produced 3.23 million barrels of oil per day. This compares to 1.1 million barrels of oil per day produced in the second largest oil producing state, North Dakota, and much smaller quantities by other traditional oil producing states such as Alaska, California, and Oklahoma. And by comparison, Russia produces 10.9 million barrels per day.
Quantifying the value of this production, at $100 oil, that would be $323 million worth of oil produced per day, or $118 billion of oil produced per year. With the current price of oil hovering around $55 per barrel, that same oil production is only worth $178 million per day, or $65 billion. This is a loss of $53 billion of oil sales revenue just in the state of Texas.
This $53 billion in lost revenues compares to Texas’s GDP of $1.4 trillion in 2013 – it would be 3.8% of the State’s GDP, which is now “missing” due to oil prices having fallen. This is only the direct loss to the state – the indirect loss is likely several times as much. Direct oilfield activity is slowing down dramatically, as oil producing companies cut their capital expenditure budgets for 2015. Oilfield services stocks (NYSEARCA:OIH) are already down 37% from their peak earlier this year in anticipation of an activity slowdown. And for every job lost on a rig or in an oil company’s office, there are several additional jobs that may be lost, from the gas station manager to the sales clerk at a store to the front desk worker at a hotel.
The oil industry is unusual in that both the upstream independent producers and the service companies tend to outspend their cash flow, typically on local (to Texas) goods and services, on everything from drill pipe to rig manufacturing to catering. This means that for every dollar of lost oil sales from the lower oil price, there may be several dollars less spent across the Texas economy. This could be devastating for the Texas economy, and has not yet been widely discussed in the financial media.
To see an extreme example of the impact of lower oil prices on an economy tied to oil production, we can look at Russia (NYSEARCA:RSX). The Russian economy is more oil dependent than Texas’s. Russia’s GDP was $2.1 trillion in 2013. This compares to Texas’s GDP of $1.4 trillion. So Russia produces 3.3x as much oil as Texas, but only has 1.5x the GDP. So on a direct basis, assuming “ceteris paribus” conditions, a $1 decline in the price of oil would have 2.2x the impact to the economy of Russia as to the economy of Texas.
So what is happening in Russia? Already, the ruble has dropped in value by 50% in the past year. And numerous sources are calling for a severe recession in 2015. This would be expected, considering the high portion of the GDP that is attributable to oil production.
However, Russia has an advantage that Texas does not have. It has its own currency. While a 50% drop in a currency may not sound great if you’re looking to spend that currency elsewhere, it is crucial if you are an exporter and your primary export just dropped in price by 45%. The ruble denominated impact of the drop in the price of oil is a mere 10%. Unfortunately, for Texas, the dollar denominated drop in oil is 45%. So despite the lower economic exposure to oil, Texas does not have the benefit of a falling currency to buffer the blow of lower oil prices.
It may get even worse. With less drilling activity, oil production growth in Texas may slow, and eventually may decline. Depending on the speed of this slowdown, Texas could even see production decline by the end of 2015. This is because most of the new production has been coming from fracking unconventional wells, which can decline in production by as much as 80% in the first year. Production growth has required an increasing number of wells drilled, and has been funded with 100% of oil company cash flow along with hundreds of billions of dollars of equity and debt over the past few years. With the recent crash in oil stock prices (NYSEARCA: XOP) and in oil company bonds (NYSEARCA: JNK), oil drillers may be forced to spend within cash flow, and that cash flow will be down at least 45% in 2015 if the oil price stays on the path projected in the futures market.
All of this means that in 2015, Texas oil wells could be producing less than the 3.23 million barrels of oil per day it was producing in September 2014, and their owners could be receiving 45% less revenue per barrel produced. Again applying an economic multiplier, the results could be devastating. And without the cushion of a weak currency that benefits countries like Russia, it is hard to see how Texas could avoid a recession in 2015 if the price of oil stays near its current low levels.


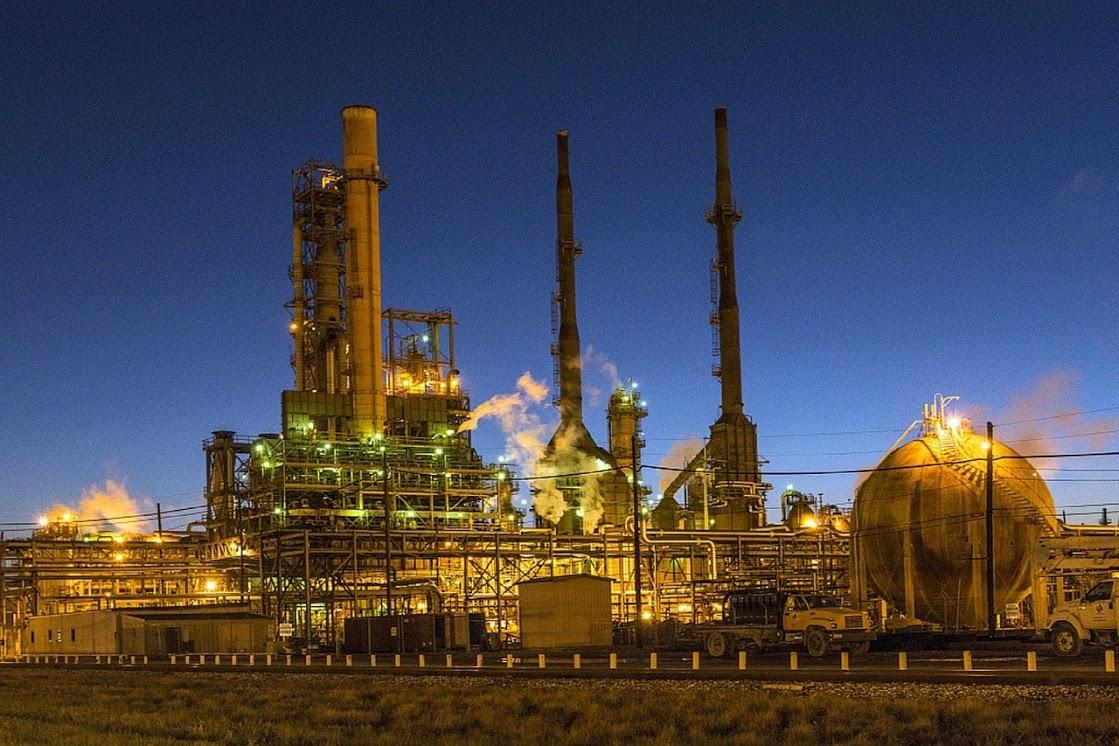
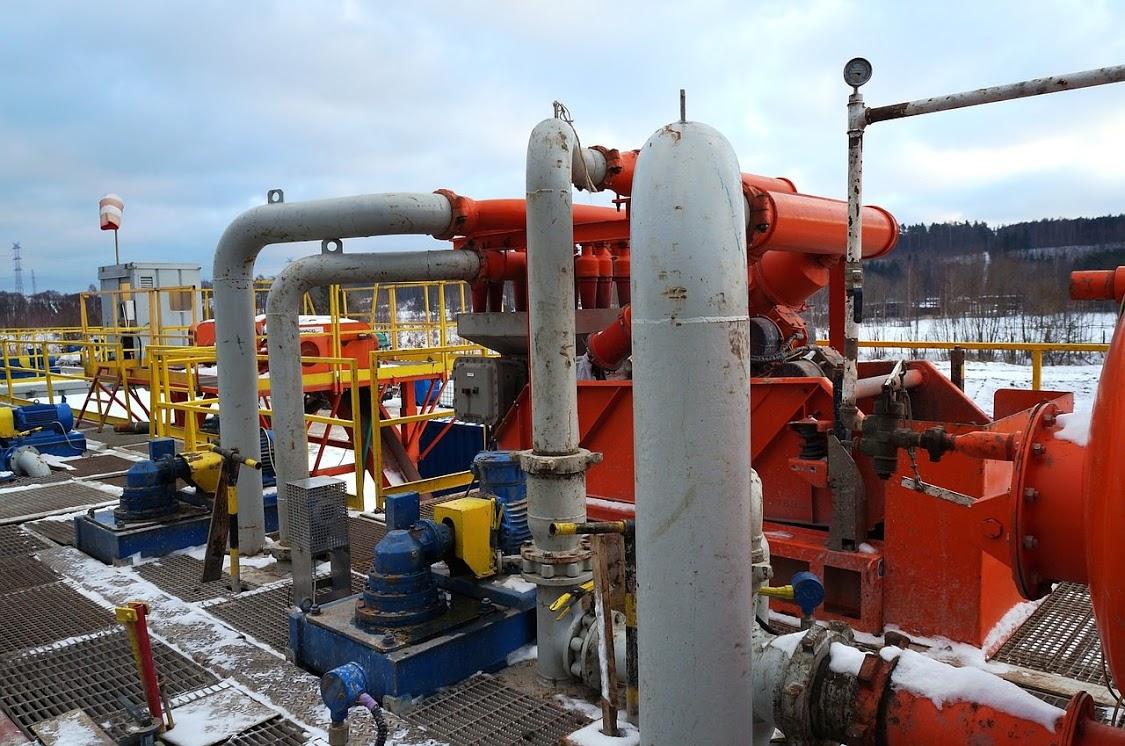


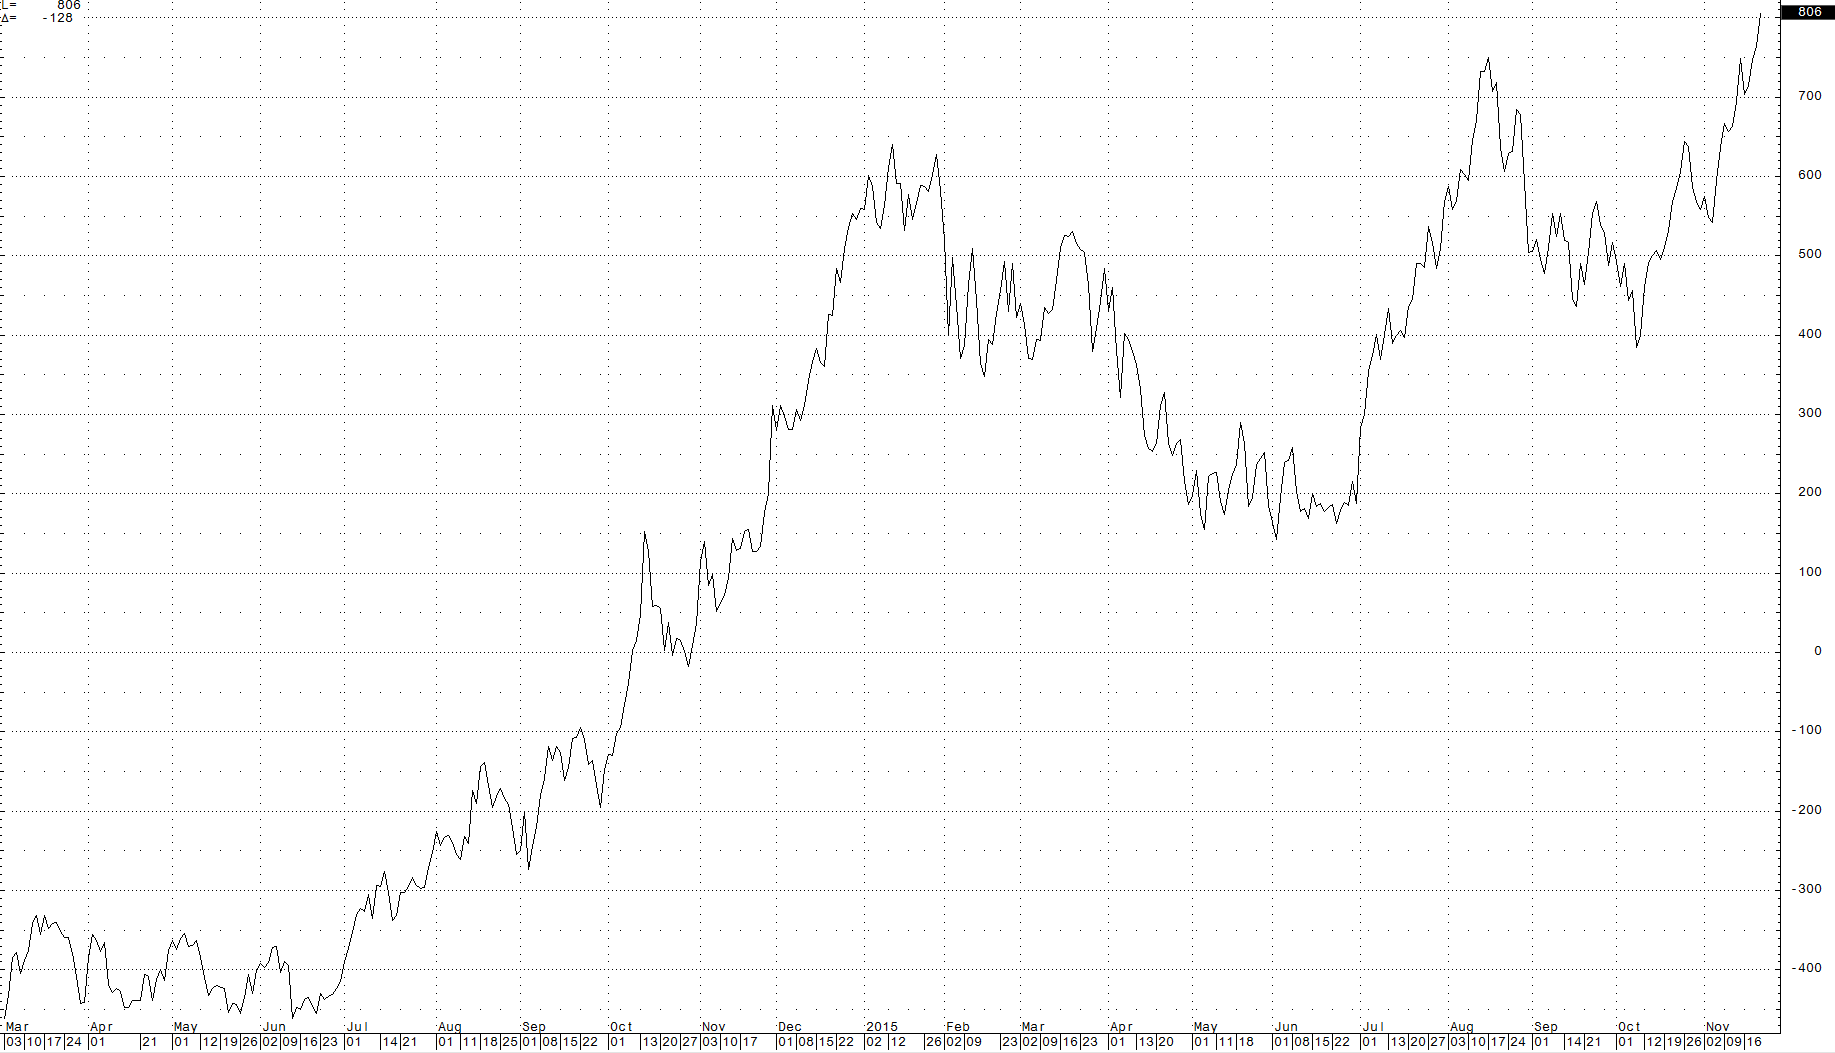


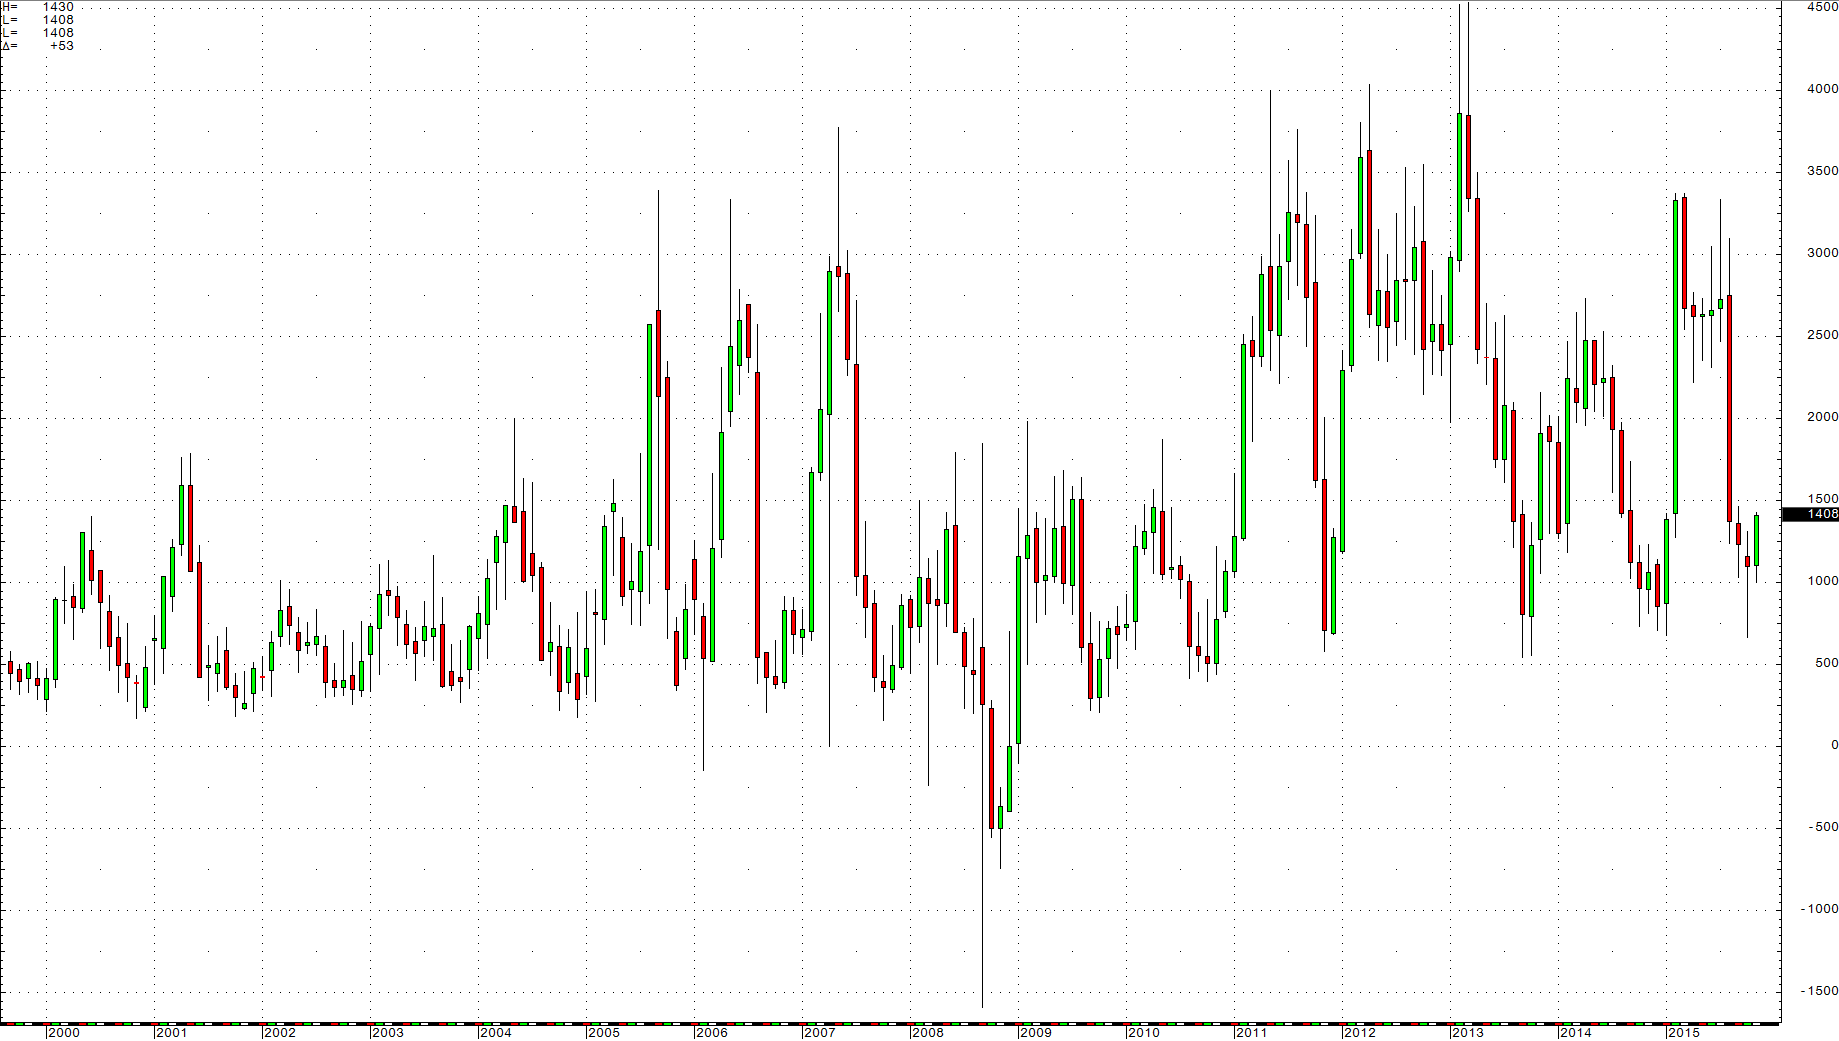
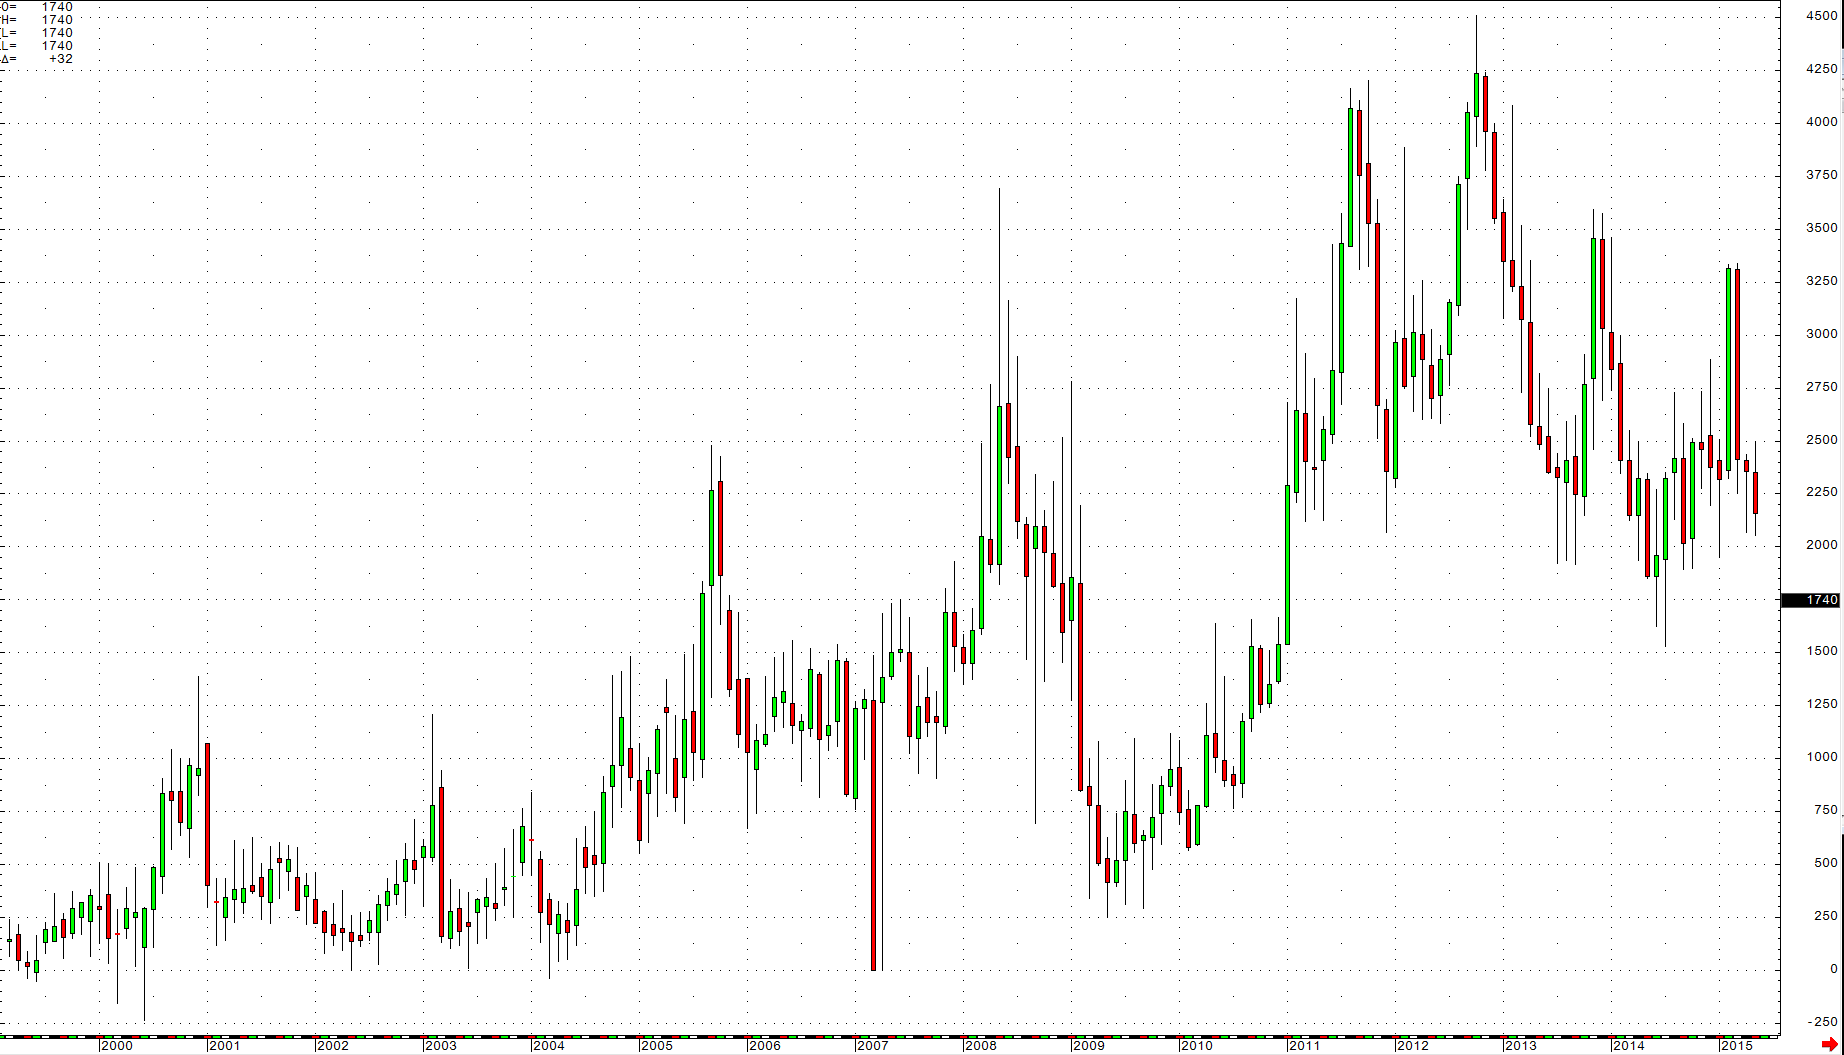


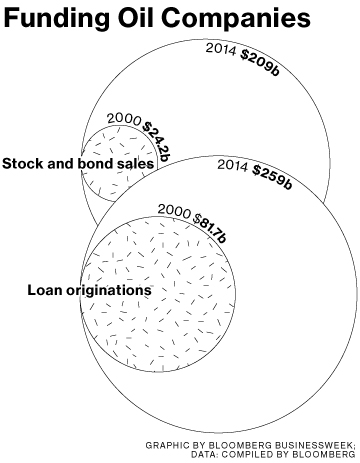


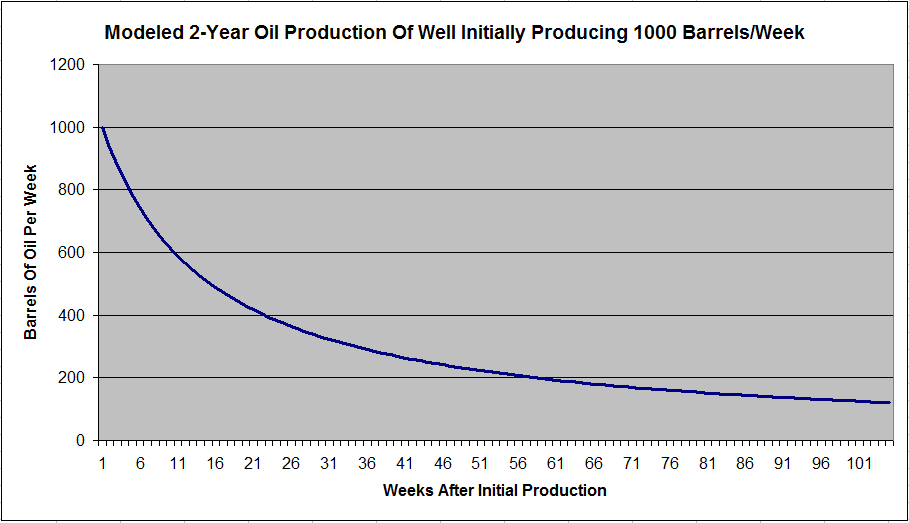
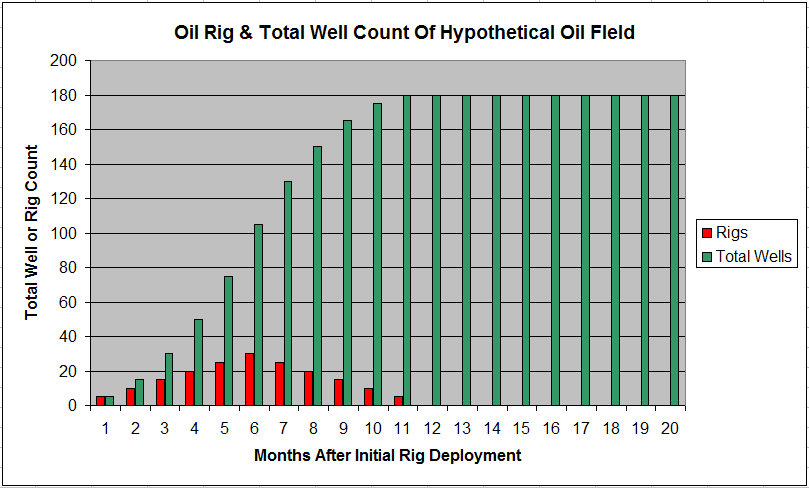


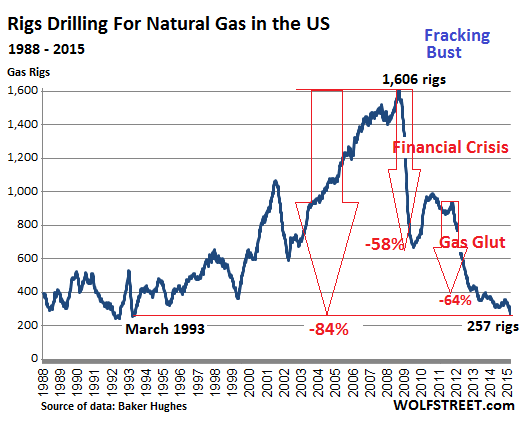


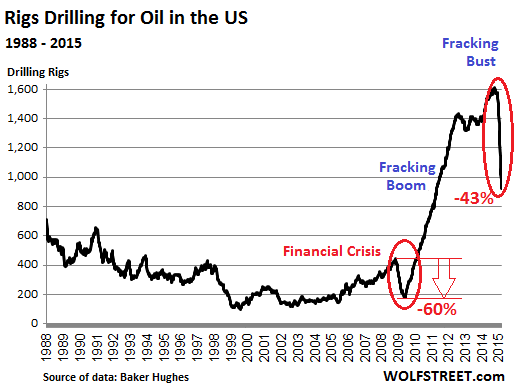
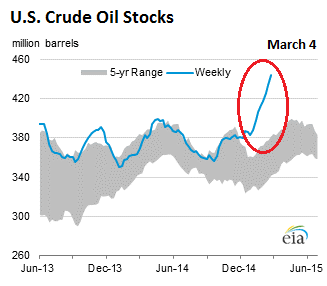
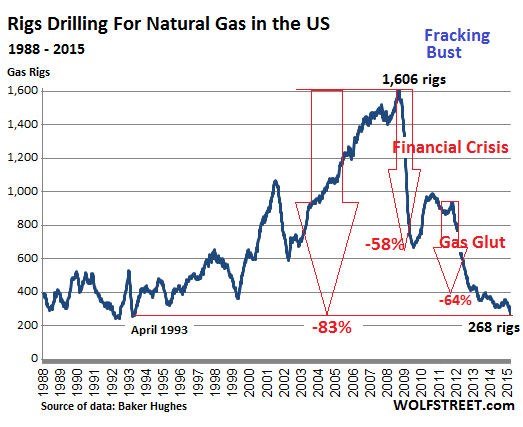


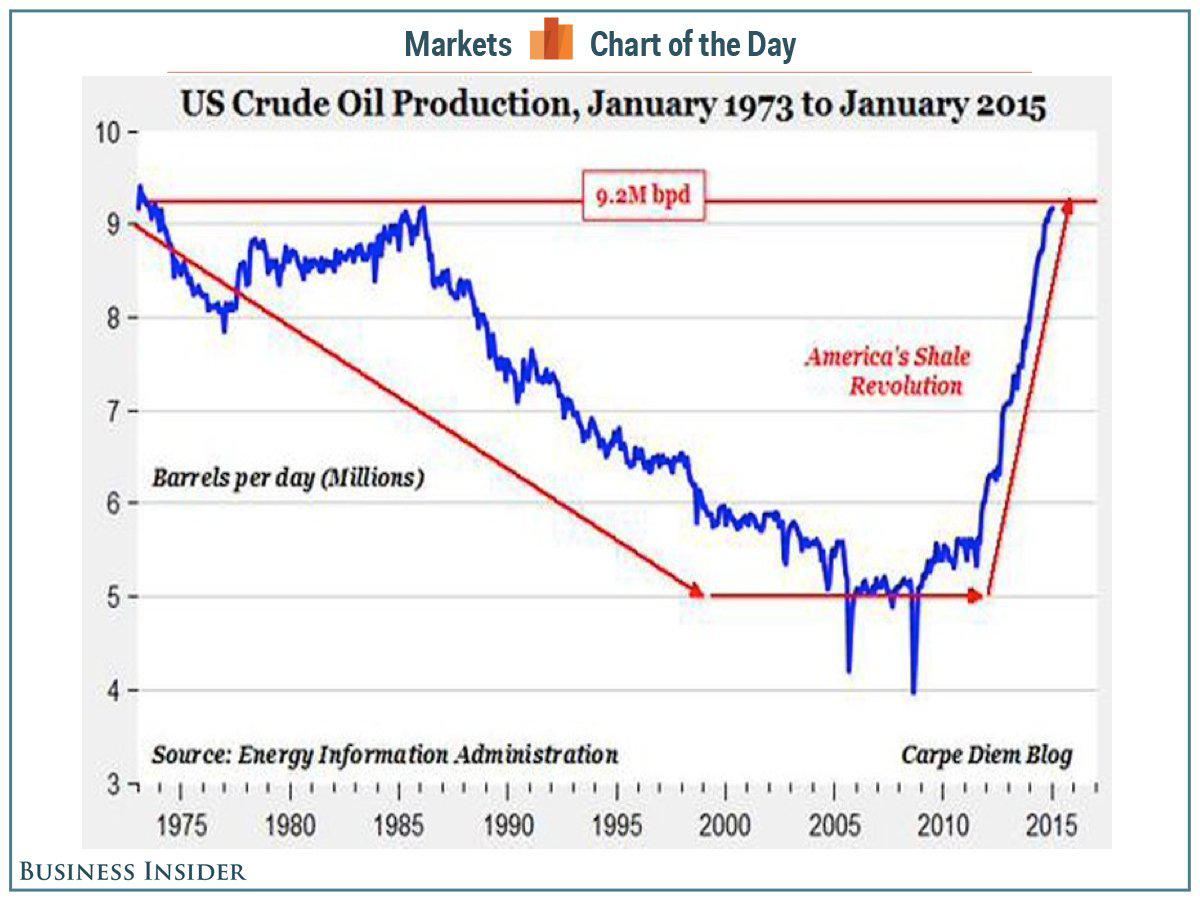
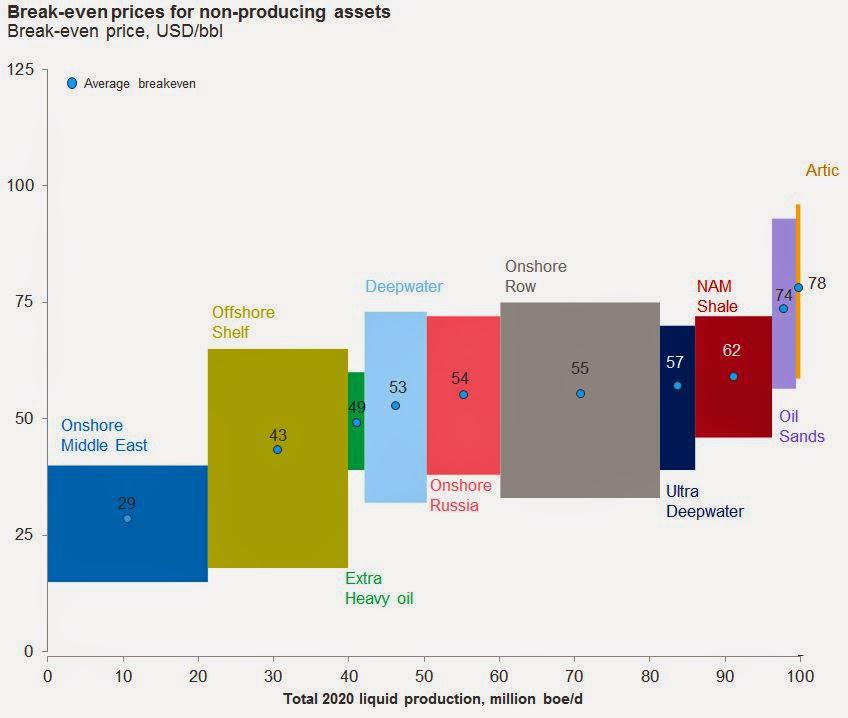

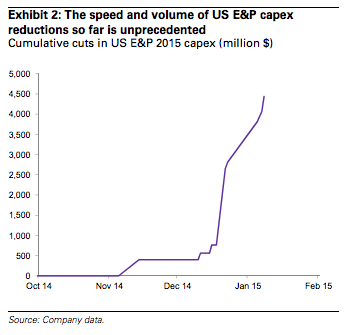

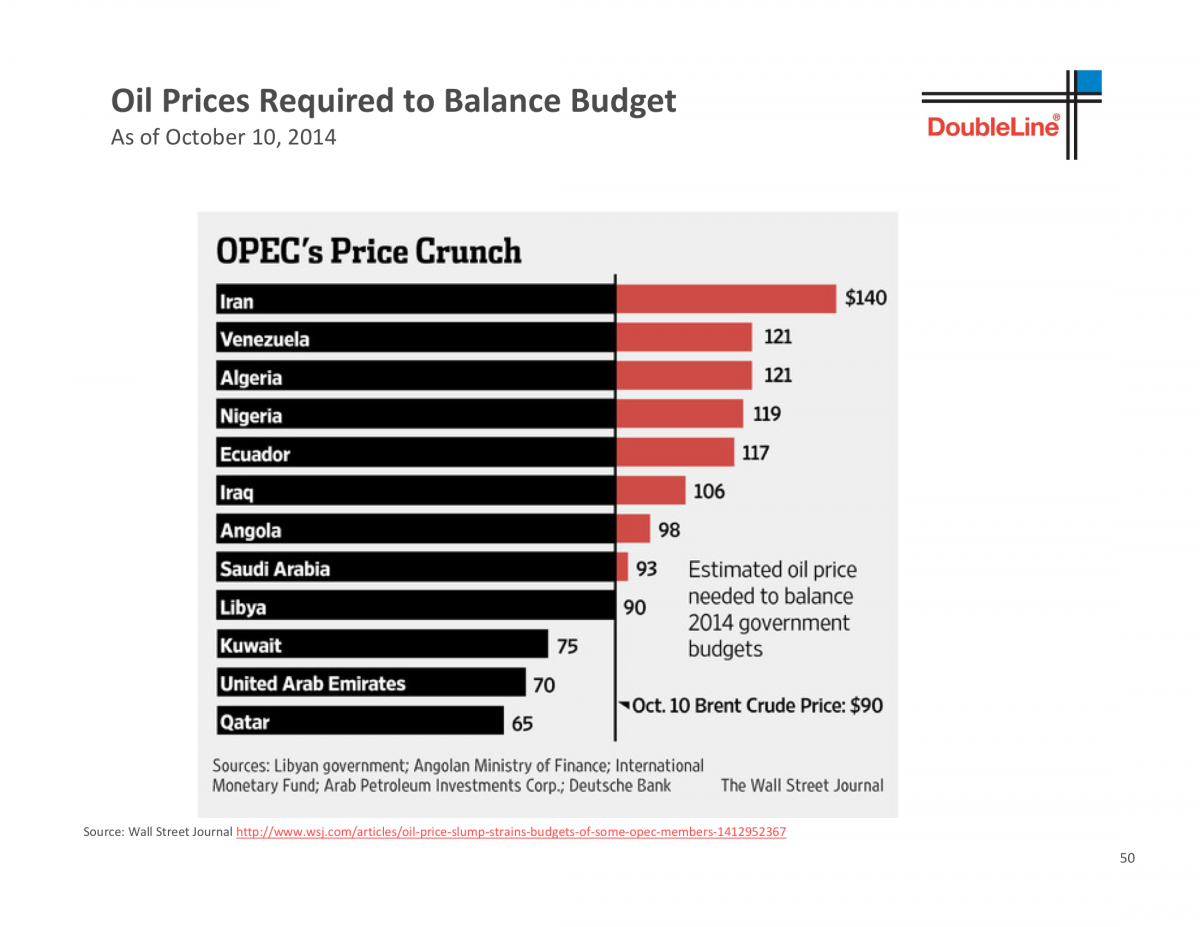


 Oilfield worker on a rig


 by
by

You must be logged in to post a comment.