
Summary
- US production remains high due to high-grading, well design, cost efficiencies, and lower oil service contracts.
- High-grading from marginal to core areas can increase per well production from 200% to 500% depending on area, which means one core well can equate to several marginal producers.
- Shorter stages, increased proppant and frac fluids increase production and flatten the depletion curve.
- EOG’s work in Antelope field provides a framework for other operators to increase production while completing fewer wells.
- Few operators are currently developing Mega-fracs, this provides significant upside to US shale production as others start producing more resource per foot.
by Michael Filloon, Split Rock Private Trading and Wealth Management
US Oil production remains at volumes seen when WTI was at $100/bbl. Many analysts believed operators couldn’t survive, but $60/bbl may be good enough for operators to drill economic wells. Oil prices have decreased significantly, and the US Oil ETF (NYSEARCA:USO) with it. Many were wrong about US production, and the belief $60/bbl oil would decrease US production. Although completions have been deferred, high-grading and mega-fracs have made up for fewer producing wells. When calculating US production going forward, it is important to account for the number of new completions. If more wells are completed, the higher the influx of production should be. We are finding the quality of geology and well design have a greater effect on total production than originally thought.
(click to enlarge)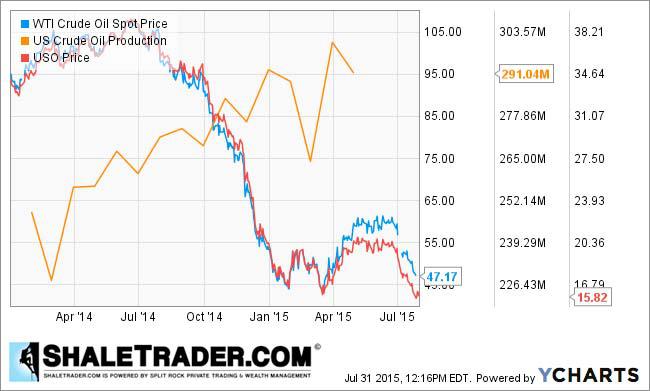
(Source: Shaletrader.com)
There are several factors influencing US production. Operators have moved existing rigs to core areas. This decreases its ability getting acreage held by production. In the Bakken, rigs have moved near the Nesson Anticline.
In the Eagle Ford, Karnes seems to be the area of interest. Midland County in the Permian has also been attractive. Operators have decided to complete wells with better geology. When an operator completes wells in core acreage versus marginal leasehold, we see increased production per location. This is just part of the reason US production remains high.
The average investor does not understand the significance. Most think wells have like production, but areas are much different. When oil was at a $100/bbl, it allowed operators to get acreage held by production, although payback times were not as good. Marginal acreage was more attractive, even at lower IRRs. Operators have a significant investment in acreage, and do not want to lose it. Because of this, many would operate in the red expecting future rewards. Just because E&Ps lose money, does not mean the business isn’t economic. It is the way business is done in the short term as oil is an income stream. Wells produce for 35 to 40 years, and once well costs are paid back there are steady revenues. Changes in oil prices have changed this, as now operators will have to focus on better acreage.
Re-fracs are starting to influence production. Although most operators have not begun programs, interest is high. Re-fracs may not be a game changer, but could be an excellent way to increase production at a lower cost. This is not as significant with well designs of today, but older designs left a significant amount of resource. More importantly, when operators began, it was drilling the best acreage. Archaic well designs could leave some stages completely untouched. Current seismic can now identify this, and provide for a better re-frac. We expect to see some very good results in 2016. In conjunction with high-grading, well design continues to be the main reason production has maintained. Changes to well design have been significant, and the resulting production increases much better than anticipated.
No operator is better than EOG Resources (NYSE:EOG) at well design. From the Bakken, to the Eagle Ford and Permian it continues to outperform the competition.
The following map courtesy of ShaleMapsPro.com does a good job of illustrating EOG’s exposure in the Eagle Ford.

(Source: Shalemapspro.com)
EOG’s focusing of frac jobs closer to the well bore has provided for much better source rock stimulation (fraccing). Since more fractures are created, there is a greater void in the shale. This means more producing rock has contact with the well. EOG continues to push more sand and fluids in the attempt to recover more resource per foot. To evaluate production, it must be broken into days over 6 to 12 months. To evaluate well design, locations must be close to one another and by the same operator. This consistency allows us to see advantages to well design changes. Lastly, we compare marginal acreage it is no longer working to the high-grading program. This is how operators are spending less and producing more.
EOG is working in the Antelope field of northeast McKenzie County. This is Bakken core acreage and considered excellent in both the middle Bakken and upper Three Forks.
(click to enlarge)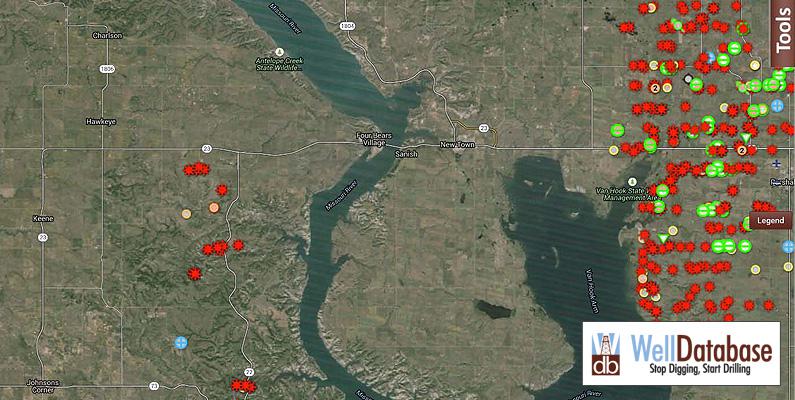
(Source: Welldatabase.com)
The center of the above map is the location of both its Riverview and Hawkeye wells. These six wells are located in two adjacent sections. The pad is just west of New Town in North Dakota. Riverview 100-3031H was completed in 6/12. It is an upper Three Forks well. 39 stages were used on an approximate 9000 foot lateral. 5.7 million pounds of sand were used with 85000 barrels of fluids.
(click to enlarge)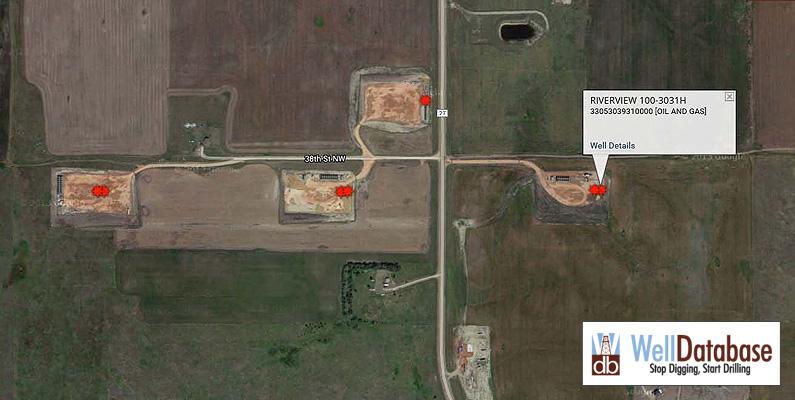
(Source: Welldatabase.com)
| Date | Oil (BBL) | Gas ((NYSEMKT:MCF)) | BOE |
| 6/1/2012 | 4,384.00 | 3,972.00 | 3972 |
| 7/1/2012 | 27,133.00 | 15,337.00 | 15337 |
| 8/1/2012 | 24,465.00 | 17,223.00 | 17223 |
| 9/1/2012 | 21,457.00 | 9,190.00 | 9190 |
| 10/1/2012 | 18,040.00 | 12,601.00 | 12601 |
| 11/1/2012 | 19,924.00 | 13,366.00 | 13366 |
| 12/1/2012 | 28,134.00 | 22,259.00 | 22259 |
| 1/1/2013 | 15,382.00 | 12,661.00 | 12661 |
| 2/1/2013 | 3,429.00 | 2,451.00 | 2451 |
| 3/1/2013 | 15,242.00 | 22,774.00 | 22774 |
| 4/1/2013 | 15,761.00 | 8,479.00 | 8479 |
| 5/1/2013 | 13,786.00 | 18,372.00 | 18372 |
| 6/1/2013 | 14,485.00 | 18,555.00 | 18555 |
| 7/1/2013 | 15,668.00 | 27,250.00 | 27250 |
| 8/1/2013 | 12,084.00 | 23,876.00 | 23876 |
| 9/1/2013 | 13,841.00 | 46,815.00 | 46815 |
| 10/1/2013 | 11,388.00 | 45,800.00 | 45800 |
| 11/1/2013 | 2,711.00 | 10,533.00 | 10533 |
| 12/1/2013 | 0 | 0 | 0 |
| 1/1/2014 | 5,953.00 | 35 | 35 |
| 2/1/2014 | 11,368.00 | 20,851.00 | 20851 |
| 3/1/2014 | 8,784.00 | 11,179.00 | 11179 |
| 4/1/2014 | 5,607.00 | 8,479.00 | 8479 |
| 5/1/2014 | 4,727.00 | 5,663.00 | 5663 |
| 6/1/2014 | 8,359.00 | 12,726.00 | 12726 |
| 7/1/2014 | 8,799.00 | 22,957.00 | 22957 |
| 8/1/2014 | 7,958.00 | 31,621.00 | 31621 |
| 9/1/2014 | 7,218.00 | 44,318.00 | 44318 |
| 10/1/2014 | 3,778.00 | 14,058.00 | 14058 |
| 11/1/2014 | 3,701.00 | 9,951.00 | 9951 |
| 12/1/2014 | 6,612.00 | 18,435.00 | 18435 |
| 1/1/2015 | 6,181.00 | 24,142.00 | 24142 |
| 2/1/2015 | 3,517.00 | 10,722.00 | 10722 |
| 3/1/2015 | 5,218.00 | 24,175.00 | 24175 |
| 4/1/2015 | 4,275.00 | 24,233.00 | 24233 |
(Source: Welldatabase.com)
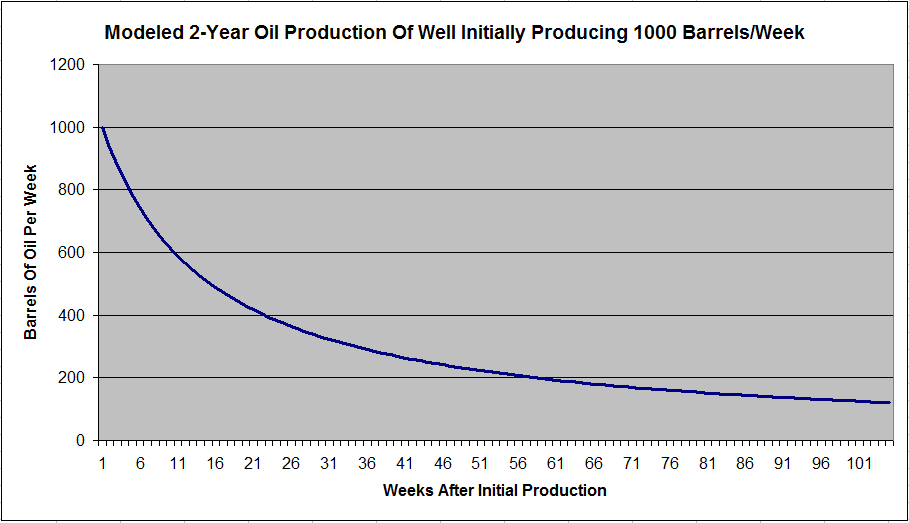
Riverview 100-3031H was a progressive well design for 2012. It produced well. To date it has produced 379 thousand bbls of crude and 615 thousand Mcf of natural gas. This equates to $24 million in revenues. Over the first 360 days (using the true number of production days) it produced 240,036 bbls of crude. The month of December 2013, this well was shut in for the completion of an adjacent well. There was a return to production but no significant jump in production from pressure generated by the new locations. This well declined 42% over 12 months. This is much lower than estimates shown through other well models. The next year we see a 35% decline. 10 months later we see an additional decline of approximately 55%. The decline curve of a well is very specific to geology and well design. Keep in mind averages are just that, and do not provide specific data. These averages should not be used to evaluation acreage and operator as there are wide average swings. Also, averages are generally over a long time frame. Production in the Bakken began in 2004 (first horizontal well completed). Wells in 2004 produce nothing like wells today. Updated averages based on year (IP 360) are more useful. Riverview 100-3031H was part of a two well pad. A middle Bakken well was also completed.
Riverview 4-3031H began producing a month after Riverview 100-3031H. It was a 38 stage 9000 foot lateral. 4.3 million lbs of sand were used and 69000 bbls of fluids.
(click to enlarge)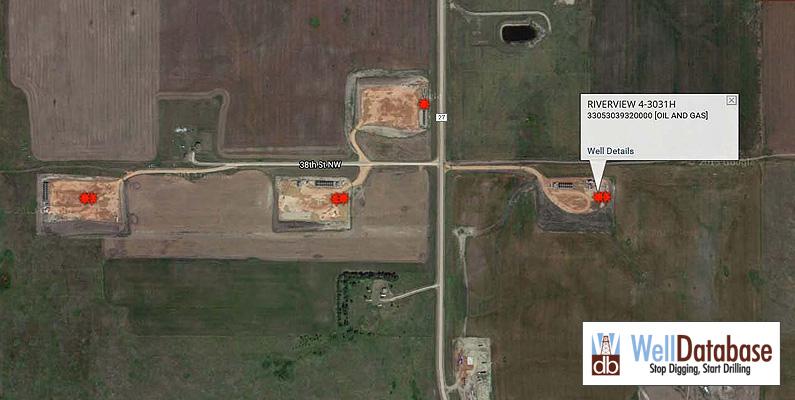
(Source: Welldatabase.com)
The Riverview and Hawkeye wells analyzed in this article were drilled in a southern fashion.
| Date | Oil | Gas | BOE |
| 7/1/2012 | 20,529.00 | 12,537.00 | 12537 |
| 8/1/2012 | 16,553.00 | 16,903.00 | 16903 |
| 9/1/2012 | 17,096.00 | 10,148.00 | 10148 |
| 10/1/2012 | 23,197.00 | 17,914.00 | 17914 |
| 11/1/2012 | 20,122.00 | 14,402.00 | 14402 |
| 12/1/2012 | 27,340.00 | 33,217.00 | 33217 |
| 1/1/2013 | 16,044.00 | 24,394.00 | 24394 |
| 2/1/2013 | 4,267.00 | 4,946.00 | 4946 |
| 3/1/2013 | 27,516.00 | 26,219.00 | 26219 |
| 4/1/2013 | 20,792.00 | 7,940.00 | 7940 |
| 5/1/2013 | 17,516.00 | 35,948.00 | 35948 |
| 6/1/2013 | 15,457.00 | 50,500.00 | 50500 |
| 7/1/2013 | 13,480.00 | 50,807.00 | 50807 |
| 8/1/2013 | 11,254.00 | 42,300.00 | 42300 |
| 9/1/2013 | 9,319.00 | 40,341.00 | 40341 |
| 10/1/2013 | 8,559.00 | 33,116.00 | 33116 |
| 11/1/2013 | 2,190.00 | 40 | 40 |
| 12/1/2013 | 0 | 0 | 0 |
| 1/1/2014 | 1,124.00 | 11 | 11 |
| 2/1/2014 | 5,271.00 | 81 | 81 |
| 3/1/2014 | 8,931.00 | 9,827.00 | 9827 |
| 4/1/2014 | 5,469.00 | 7,940.00 | 7940 |
| 5/1/2014 | 4,807.00 | 5,748.00 | 5748 |
| 6/1/2014 | 8,522.00 | 13,819.00 | 13819 |
| 7/1/2014 | 7,982.00 | 17,983.00 | 17983 |
| 8/1/2014 | 7,169.00 | 26,755.00 | 26755 |
| 9/1/2014 | 5,750.00 | 22,586.00 | 22586 |
| 10/1/2014 | 1,349.00 | 3,194.00 | 3194 |
| 11/1/2014 | 6,495.00 | 15,947.00 | 15947 |
| 12/1/2014 | 6,442.00 | 18,806.00 | 18806 |
| 1/1/2015 | 5,840.00 | 22,126.00 | 22126 |
| 2/1/2015 | 4,171.00 | 18,682.00 | 18682 |
| 3/1/2015 | 4,221.00 | 18,539.00 | 18539 |
| 4/1/2015 | 3,878.00 | 19,725.00 | 19725 |
(Source: Welldatabase.com)
Riverview 4-3031H has produced 361 thousand bbls of crude and 657 thousand Mcf of natural gas. It under produced Riverview 100-3031H, but this is consistent with well design. 360 day production totaled 237,735 bbls of oil. We do not know if the Three Forks is a better pay zone than the middle Bakken as the well design was not consistent. Most operators have reported better results from the middle Bakken. The Three Forks well used one more stage (less feet per stage should mean better fracturing). It also used significantly more sand and fluids. Either way both wells were good results. Riverview 4-3031H only declined approximately 36% in a comparison of the first month to month 12. This was 7% better than 100-3031H. It declined another 41% in year two on a month to month comparison. This was 6% greater. 56% was seen when compared to adjusted production for 5/15. The Three Forks well declines slower in later production than 4-3031H. This may be due to well design. The well with more stages, proppant and fluids continues to out produce the Bakken well. It is possible the source rock is better. There are many other variables to look at, but this data provides why EOG continues to push ahead with more complex locations.
In September of 2012, EOG drilled its next well in this area. Hawkeye 100-2501H is a 13700 foot lateral targeting the upper Three Forks. It is a 47 stage frac. 14 million pounds of sand were used with 158000 bbls of fluids.
(click to enlarge)
(Source: Welldatabase.com)
Of the three pads, this well is located in the center. It was an interesting design, given the length of the lateral.
| Date | Oil | Gas | BOE |
| 9/1/2012 | 21,959.00 | 444 | 444 |
| 10/1/2012 | 54,927.00 | 155 | 155 |
| 11/1/2012 | 47,557.00 | 57,300.00 | 57300 |
| 12/1/2012 | 55,367.00 | 92,144.00 | 92144 |
| 1/1/2013 | 33,396.00 | 55,877.00 | 55877 |
| 2/1/2013 | 22,100.00 | 32,810.00 | 32810 |
| 3/1/2013 | 36,631.00 | 57,544.00 | 57544 |
| 4/1/2013 | 29,075.00 | 32,696.00 | 32696 |
| 5/1/2013 | 22,210.00 | 33,351.00 | 33351 |
| 6/1/2013 | 17,544.00 | 25,794.00 | 25794 |
| 7/1/2013 | 15,872.00 | 23,600.00 | 23600 |
| 8/1/2013 | 19,647.00 | 28,746.00 | 28746 |
| 9/1/2013 | 15,486.00 | 22,352.00 | 22352 |
| 10/1/2013 | 21,325.00 | 31,678.00 | 31678 |
| 11/1/2013 | 6,418.00 | 9,214.00 | 9214 |
| 12/1/2013 | 0 | 0 | 0 |
| 1/1/2014 | 0 | 0 | 0 |
| 2/1/2014 | 0 | 0 | 0 |
| 3/1/2014 | 29,699.00 | 23,822.00 | 23822 |
| 4/1/2014 | 39,782.00 | 32,696.00 | 32696 |
| 5/1/2014 | 35,267.00 | 61,543.00 | 61543 |
| 6/1/2014 | 27,554.00 | 49,551.00 | 49551 |
| 7/1/2014 | 7,229.00 | 12,565.00 | 12565 |
| 8/1/2014 | 31,155.00 | 98,086.00 | 98086 |
| 9/1/2014 | 12,617.00 | 32,742.00 | 32742 |
| 10/1/2014 | 2 | 4 | 4 |
| 11/1/2014 | 7,769.00 | 15,996.00 | 15996 |
| 12/1/2014 | 15,487.00 | 49,147.00 | 49147 |
| 1/1/2015 | 4,427.00 | 9,918.00 | 9918 |
| 2/1/2015 | 9,344.00 | 20,654.00 | 20654 |
| 3/1/2015 | 8,459.00 | 25,171.00 | 25171 |
| 4/1/2015 | 7,235.00 | 24,752.00 | 24752 |
(Source: Welldatabase.com)
Hawkeye 100-2501H had some excellent early production numbers. From that perspective, it is one of the best wells to date in the Bakken. It has already produced 655,000 bbls of crude and 960,000 Mcf of natural gas. It has revenues in excess of $42 million to date. This includes roughly four non-producing or unproductive months. Crude production over the first 360 days was 389,835 bbls. Over the first 12 months, this well produced crude revenues in excess of $23 million. Decline rates were higher, as the first full month of production declined 65% over the first year. This isn’t important as early production rates were some of the highest seen in North Dakota. It is important to note, decline rates are emphasized but higher pressured wells may deplete faster depending on choke and how quickly production is propelled up and out of the wellbore. Any well that produces very well initially will have higher decline rates, but this does not lessen the value of the well. This specific well is depleting faster, but no one is complaining about payback times well under a year. Decline rates decrease significantly in year two at 11%. This well saw a marked increase in production when adjacent wells were turned to sales. The additional pressure associated with well communication increased production from 20,000 bbls/month to 35,000 bbls/month on average. This occurred over a 6 month period.
(click to enlarge)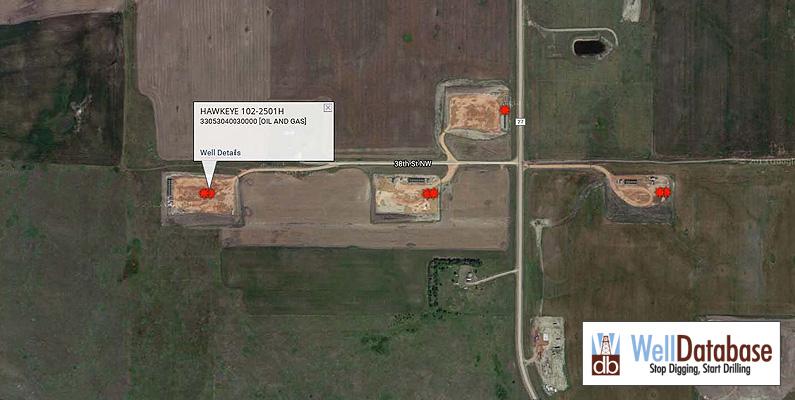
(Source: Welldatabase.com)
Hawkeye 102-2501H was the fourth completion. This 14,000 foot 62 stage lateral targeted the upper Three Forks. It used 14.5 million pounds of sand and 164,000 bbls of fluids.
| Date | Oil | Gas | BOE |
| 1/1/2013 | 18,486.00 | 41 | 41 |
| 2/1/2013 | 27,120.00 | 8,705.00 | 8705 |
| 3/1/2013 | 39,702.00 | 15,748.00 | 15748 |
| 4/1/2013 | 17,714.00 | 30,501.00 | 30501 |
| 5/1/2013 | 41,368.00 | 57,489.00 | 57489 |
| 6/1/2013 | 26,602.00 | 34,399.00 | 34399 |
| 7/1/2013 | 0 | 0 | 0 |
| 8/1/2013 | 133 | 0 | 0 |
| 9/1/2013 | 0 | 0 | 0 |
| 10/1/2013 | 0 | 0 | 0 |
| 11/1/2013 | 0 | 0 | 0 |
| 12/1/2013 | 0 | 0 | 0 |
| 1/1/2014 | 5,163.00 | 6,403.00 | 6403 |
| 2/1/2014 | 41,917.00 | 74,353.00 | 74353 |
| 3/1/2014 | 36,439.00 | 18,111.00 | 18111 |
| 4/1/2014 | 19,477.00 | 30,501.00 | 30501 |
| 5/1/2014 | 26,388.00 | 43,071.00 | 43071 |
| 6/1/2014 | 27,480.00 | 49,456.00 | 49456 |
| 7/1/2014 | 14,529.00 | 33,072.00 | 33072 |
| 8/1/2014 | 24,542.00 | 62,753.00 | 62753 |
| 9/1/2014 | 17,613.00 | 53,460.00 | 53460 |
| 10/1/2014 | 17,451.00 | 66,544.00 | 66544 |
| 11/1/2014 | 9,634.00 | 33,366.00 | 33366 |
| 12/1/2014 | 16,338.00 | 76,547.00 | 76547 |
| 1/1/2015 | 11,450.00 | 65,277.00 | 65277 |
| 2/1/2015 | 8,971.00 | 50,919.00 | 50919 |
| 3/1/2015 | 3,177.00 | 14,820.00 | 14820 |
| 4/1/2015 | 6,495.00 | 13,616.00 | 13616 |
(Source: Welldatabase.com)
It has produced 458,000 bbls of crude and 839,000 Mcf to date. This equates to roughly $30 million over well life. 360 day production was 394,673 bbls of crude. Production was interesting as initial production was outstanding. The big production numbers were hindered as many of the early months had missed production days. We don’t know if there were production problems, but do know the well was shut when adjacent wells were turned to sales. Production was over 1000 bbls/d over the first six months. It was shut in for another six months. After this production jumped, but this is misleading. Given the fewer days of production per month, there wasn’t much of an increase when the new wells were turned to sales. The decline over the first year on a monthly basis is 20%. The second year is much greater at 80%. We have seen recent production decrease significantly, and is something to watch. Lower decline rates initially are more important. This is because production rates are higher. It equates to greater total production.
Hawkeye 01-2501H was completed in January of 2013.
(click to enlarge)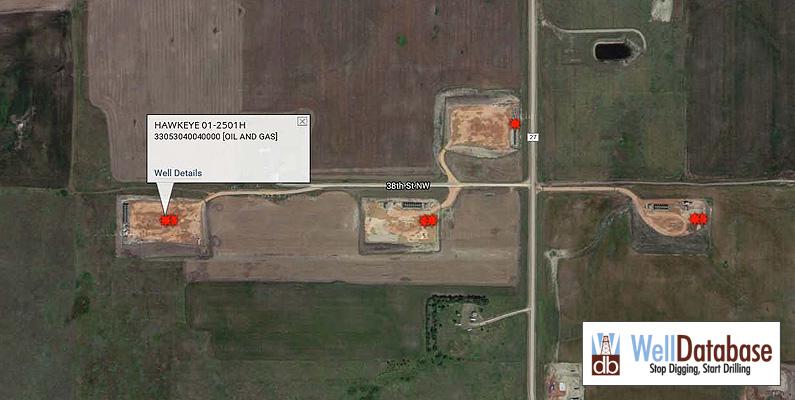
(Source: Welldatabase.com)
It is a 64 stage, 15000 foot lateral targeting the middle Bakken. This well used 172,000 bbls of fluids and 15 million pounds of sand.
| Date | Oil | Gas | BOE |
| 1/1/2013 | 18,792.00 | 43 | 43 |
| 2/1/2013 | 30,211.00 | 13,879.00 | 13879 |
| 3/1/2013 | 42,037.00 | 17,648.00 | 17648 |
| 4/1/2013 | 17,433.00 | 36,881.00 | 36881 |
| 5/1/2013 | 38,754.00 | 63,501.00 | 63501 |
| 6/1/2013 | 28,602.00 | 48,817.00 | 48817 |
| 7/1/2013 | 0 | 0 | 0 |
| 8/1/2013 | 134 | 1 | 1 |
| 9/1/2013 | 0 | 0 | 0 |
| 10/1/2013 | 0 | 0 | 0 |
| 11/1/2013 | 0 | 0 | 0 |
| 12/1/2013 | 0 | 0 | 0 |
| 1/1/2014 | 6,311.00 | 7,186.00 | 7186 |
| 2/1/2014 | 43,713.00 | 74,099.00 | 74099 |
| 3/1/2014 | 39,156.00 | 18,492.00 | 18492 |
| 4/1/2014 | 23,408.00 | 36,881.00 | 36881 |
| 5/1/2014 | 21,681.00 | 33,498.00 | 33498 |
| 6/1/2014 | 28,502.00 | 51,543.00 | 51543 |
| 7/1/2014 | 18,795.00 | 45,017.00 | 45017 |
| 8/1/2014 | 25,512.00 | 58,837.00 | 58837 |
| 9/1/2014 | 20,522.00 | 60,662.00 | 60662 |
| 10/1/2014 | 19,137.00 | 68,576.00 | 68576 |
| 11/1/2014 | 12,093.00 | 37,043.00 | 37043 |
| 12/1/2014 | 16,587.00 | 45,980.00 | 45980 |
| 1/1/2015 | 14,246.00 | 62,819.00 | 62819 |
| 2/1/2015 | 9,220.00 | 35,931.00 | 35931 |
| 3/1/2015 | 3,617.00 | 6,634.00 | 6634 |
| 4/1/2015 | 13,702.00 | 42,551.00 | 42551 |
(Source: Welldatabase.com)
It has produced 492,170 bbls of crude and 866,520 Mcf of natural gas. 360 day production was 412,072 bbls of oil.
(click to enlarge)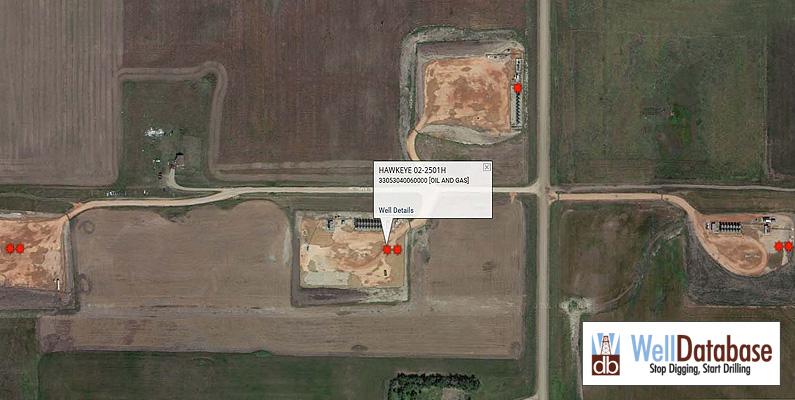
(Source: Welldatabase.com)
This is an excellent well, but the location of focus is Hawkeye 02-2501H. It was completed last in this group. This well provides the link between changes in well design to production improvements.
| Date | Oil | Gas | BOE |
| 12/1/2013 | 3,022.00 | 6,533.00 | 6533 |
| 1/1/2014 | 37,385.00 | 75,940.00 | 75940 |
| 2/1/2014 | 30,066.00 | 58,949.00 | 58949 |
| 3/1/2014 | 22,876.00 | 50,690.00 | 50690 |
| 4/1/2014 | 26,703.00 | 43,926.00 | 43926 |
| 5/1/2014 | 31,987.00 | 55,124.00 | 55124 |
| 6/1/2014 | 27,777.00 | 47,166.00 | 47166 |
| 7/1/2014 | 31,500.00 | 50,279.00 | 50279 |
| 8/1/2014 | 51,709.00 | 99,583.00 | 99583 |
| 9/1/2014 | 43,292.00 | 98,069.00 | 98069 |
| 10/1/2014 | 40,143.00 | 98,927.00 | 98927 |
| 11/1/2014 | 24,064.00 | 50,495.00 | 50495 |
| 12/1/2014 | 31,488.00 | 99,684.00 | 99684 |
| 1/1/2015 | 27,087.00 | 94,621.00 | 94621 |
| 2/1/2015 | 22,207.00 | 94,490.00 | 94490 |
| 3/1/2015 | 22,590.00 | 125,634.00 | 125634 |
| 4/1/2015 | 17,707.00 | 94,910.00 | 94910 |
(Source: Welldatabase.com)
The production numbers are significant. In less than a year and a half, it has produced 490,000 bbls of crude and 1.25 Bcf of natural gas. Revenues to date are $33.2 million. Its 360 day crude production was 427,663 bbls. The production is impressive but the decline curve is more important. This Hawkeye well has a steady production rate with only a slight decline. This is where the analysts may be getting it wrong, as decline curves change significantly by area and well design. What EOG has done is not only increased production significantly, but also flattened the curve. Initial production is interesting as we don’t see peak production until nine months. This means our best month is August of 2014, and not the first full month. When we analyze the production after one full year of production, there is no drop off.
This 12800 foot 69 stage lateral is a very good middle Bakken design. EOG decided to pull back some of the lateral length. There are several possible reasons for this. We think it is possible EOG has discovered it was having difficulty in getting proppant to the toe of the well. But this is why operators test the length. More importantly, the increase in stages in conjunction with a shorter lateral provides for shorter stages. This means the operator will probably do a better job of stimulating the source rock. This well also used massive volumes of fluids and sand. 460,000 bbls of fluids were used with over 27 million lbs of proppant. I don’t normally break down the types of sand, as it can be trivial to some but in this case I have as the design seems somewhat unique. This well used approximately 16 million lbs of 100 mesh sand, 7 million lbs of 30/70 and 4 million 40/70. The large volumes of mesh sand are interesting. It would seem EOG is trying to push the finest sand deep into the fractures to maintain deeper shale production.
| Well | Date | Lateral Ft. | Stages | Proppant Lbs. | Fluids Bbls. | 12 mo. Oil Production Bbls. | Production/Ft. |
| Riverview 100-3031H | 6/12 | 9,000 | 39 | 5.7M | 85,000 | 240,036 | 26.67 |
| Riverview 4-3031H | 7/12 | 9,000 | 38 | 4.3M | 69,000 | 237,735 | 26.42 |
| Hawkeye 100-2501H | 9/12 | 13,700 | 47 | 14M | 158,000 | 389,835 | 28.46 |
| Hawkeye 102-2501H | 1/13 | 14,000 | 62 | 14.5M | 164,000 | 394,673 | 28.19 |
| Hawkeye 01-2501H | 1/13 | 15,000 | 64 | 15M | 172,000 | 412,072 | 27.47 |
| Hawkeye 02-2501H | 12/13 | 12,800 | 69 | 27M | 460,000 | 427,663 | 33.41 |
I completed the above table for several reasons. The first was to show well design’s effect on one year total production. We used 360 days as a base. We didn’t use 12 months as that will skew data, as some wells don’t produce every day of every month. Wells are shut in for service or more importantly when new production from adjacent locations are turned to sales. So these are a specific number of days and not estimates. We also broke down production per foot of lateral. This may be more important than any other factor. Production per well is important, but lateral length is a key as it shows how well the source rock was stimulated. In reality, production per foot matters more at longer lateral lengths. Many operators don’t like to do laterals longer than 10,000 feet, as production per foot decreases sharply. When looking at well production data, it is obvious that production per foot suffers as the toe of the lateral gets farther from the vertical.
There are several other ETFs that focus on U.S. and world crude prices:
- iPath S&P Crude Oil Total Return Index ETN (NYSEARCA:OIL)
- ProShares Ultra Bloomberg Crude Oil ETF (NYSEARCA:UCO)
- VelocityShares 3x Long Crude Oil ETN (NYSEARCA:UWTI)
- ProShares Ultrashort Bloomberg Crude Oil ETF (NYSEARCA:SCO)
- U.S. Brent Oil ETF (NYSEARCA:BNO)
- PowerShares DB Oil ETF (NYSEARCA:DBO)
- VelocityShares 3x Inverse Crude Oil ETN (NYSEARCA:DWTI)
- PowerShares DB Crude Oil Double Short ETN (NYSEARCA:DTO)
- U.S. 12 Month Oil ETF (NYSEARCA:USL)
- U.S. Short Oil ETF (NYSEARCA:DNO)
- PowerShares DB Crude Oil Long ETN (NYSEARCA:OLO)
- PowerShares DB Crude Oil Short ETN (NYSEARCA:SZO)
- iPath Pure Beta Crude Oil ETN (NYSEARCA:OLEM)
All six wells had fantastic results. The first two Riverview wells are still considered sand heavy fracs and produced almost a quarter of a million barrels of oil. This does not include natural gas in the estimates, but EURs for these wells are approximately 1200 MBo. We don’t put much emphasis on EURs other than an indicator of how good production is in comparison. Since locations will produce from 35 to 40 years, we are more inclined to emphasize one year production. Although the Hawkeye wells drilled on 9/12 and 1/13 didn’t show a large uptick in production per foot, it is still quite impressive considering the lateral length. Overall production uplift was exceptional, and these wells produce decent payback times at current oil price realizations.
There is no doubt this area has superior geology. It is definitely a core area, but may not be as good as Parshall field. Because of this, we know other areas would not produce as well, but still it provides a decent comparison for the upside to well design. Geology is still key and this is probably why EOG recently drilled a 15 well pad in the same general area. These wells are still in confidential status, so we do not know the outcome. Given the results in this area, these wells could be very interesting. The most important reason to focus on these Mega-Fracs is repeatability. If EOG can do this, so can other operators. Our expectations are many operators will be able to complete wells this good within the next 12 to 24 months. If this occurs we could see production maintained at much lower prices and fewer completions.


