Tag Archives: oil prices

GUNDLACH: If oil goes to $40 a barrel something is ‘very, very wrong with the world’

Jeffrey Gundlach

Jeff Gundlach – bond trader

West Texas Intermediate crude oil is at a 6-year low of $43 a barrel. 

And back in December 2014, “Bond King” Jeff Gundlach had a serious warning for the world if oil prices got to $40 a barrel.

“I hope it does not go to $40,” Gundlach said in a presentation, “because then something is very, very wrong with the world, not just the economy. The geopolitical consequences could be — to put it bluntly — terrifying.”

Writing in The Telegraph last week, Ambrose Evans-Pritchard noted that with Brent crude oil prices — the international benchmark — below $50 a barrel, only Norway’s government is bringing in enough revenue to balance their budget this year. 

And so in addition to the potential global instability created by low oil prices, Gundlach added that, “If oil falls to around $40 a barrel then I think the yield on ten year Treasury note is going to 1%.” The 10-year note, for its part, closed near 2.14% on Tuesday. 

On December 9, 2014, WTI was trading near $65 a barrel and Gundlach said oil looked like it was going lower, quipping that oil would find a bottom when it starts going up. 

WTI eventually bottomed at $43 in mid-March and spend most all of the spring and early summer trading near $60. 

On Tuesday, WTI hit a fresh 6-year low, plunging more than 4% and trading below $43 a barrel. 

WTI

In the last month, crude and the entire commodity complex have rolled over again as the market battles oversupply and a Chinese economy that is slowing.

And all this as the Federal Reserve makes noise about raising interest rates, having some in the market asking if these external factors — what the Fed would call “exogenous” factors — will stop the Fed from changing its interest rate policy for the first time in over almost 7 years. 

In an afternoon email, Russ Certo, a rate strategist at Brean Capital, highlighted Gundlach’s comments and said that the linkages between the run-up, and now collapse, in commodity prices since the financial crisis have made, quite simply, for an extremely complex market environment right now. 

“There is a global de-leveraging occurring in front of our eyes,” Certo wrote. “And, I suppose, the smart folks will determine the exact causes and translate what that means for FUTURE investment thesis. Today it may not matter other than accurately anticipating a myriad of global price movements in relation to each other.”

CRB commodity price index

Why U.S. Oil Production Remains High While Prices Tank – Bakken Update

Summary

  • US production remains high due to high-grading, well design, cost efficiencies, and lower oil service contracts.
  • High-grading from marginal to core areas can increase per well production from 200% to 500% depending on area, which means one core well can equate to several marginal producers.
  • Shorter stages, increased proppant and frac fluids increase production and flatten the depletion curve.
  • EOG’s work in Antelope field provides a framework for other operators to increase production while completing fewer wells.
  • Few operators are currently developing Mega-fracs, this provides significant upside to US shale production as others start producing more resource per foot.
by Michael Filloon, Split Rock Private Trading and Wealth Management

US Oil production remains at volumes seen when WTI was at $100/bbl. Many analysts believed operators couldn’t survive, but $60/bbl may be good enough for operators to drill economic wells. Oil prices have decreased significantly, and the US Oil ETF (NYSEARCA:USO) with it. Many were wrong about US production, and the belief $60/bbl oil would decrease US production. Although completions have been deferred, high-grading and mega-fracs have made up for fewer producing wells. When calculating US production going forward, it is important to account for the number of new completions. If more wells are completed, the higher the influx of production should be. We are finding the quality of geology and well design have a greater effect on total production than originally thought.

(click to enlarge)

(Source: Shaletrader.com)

There are several factors influencing US production. Operators have moved existing rigs to core areas. This decreases its ability getting acreage held by production. In the Bakken, rigs have moved near the Nesson Anticline.

In the Eagle Ford, Karnes seems to be the area of interest. Midland County in the Permian has also been attractive. Operators have decided to complete wells with better geology. When an operator completes wells in core acreage versus marginal leasehold, we see increased production per location. This is just part of the reason US production remains high.

The average investor does not understand the significance. Most think wells have like production, but areas are much different. When oil was at a $100/bbl, it allowed operators to get acreage held by production, although payback times were not as good. Marginal acreage was more attractive, even at lower IRRs. Operators have a significant investment in acreage, and do not want to lose it. Because of this, many would operate in the red expecting future rewards. Just because E&Ps lose money, does not mean the business isn’t economic. It is the way business is done in the short term as oil is an income stream. Wells produce for 35 to 40 years, and once well costs are paid back there are steady revenues. Changes in oil prices have changed this, as now operators will have to focus on better acreage.

Re-fracs are starting to influence production. Although most operators have not begun programs, interest is high. Re-fracs may not be a game changer, but could be an excellent way to increase production at a lower cost. This is not as significant with well designs of today, but older designs left a significant amount of resource. More importantly, when operators began, it was drilling the best acreage. Archaic well designs could leave some stages completely untouched. Current seismic can now identify this, and provide for a better re-frac. We expect to see some very good results in 2016. In conjunction with high-grading, well design continues to be the main reason production has maintained. Changes to well design have been significant, and the resulting production increases much better than anticipated.

No operator is better than EOG Resources (NYSE:EOG) at well design. From the Bakken, to the Eagle Ford and Permian it continues to outperform the competition.

The following map courtesy of ShaleMapsPro.com does a good job of illustrating EOG’s exposure in the Eagle Ford.

EagleFord.SeekingAlpha

(Source: Shalemapspro.com)

EOG’s focusing of frac jobs closer to the well bore has provided for much better source rock stimulation (fraccing). Since more fractures are created, there is a greater void in the shale. This means more producing rock has contact with the well. EOG continues to push more sand and fluids in the attempt to recover more resource per foot. To evaluate production, it must be broken into days over 6 to 12 months. To evaluate well design, locations must be close to one another and by the same operator. This consistency allows us to see advantages to well design changes. Lastly, we compare marginal acreage it is no longer working to the high-grading program. This is how operators are spending less and producing more.

EOG is working in the Antelope field of northeast McKenzie County. This is Bakken core acreage and considered excellent in both the middle Bakken and upper Three Forks.

(click to enlarge)
(Source: Welldatabase.com)

The center of the above map is the location of both its Riverview and Hawkeye wells. These six wells are located in two adjacent sections. The pad is just west of New Town in North Dakota. Riverview 100-3031H was completed in 6/12. It is an upper Three Forks well. 39 stages were used on an approximate 9000 foot lateral. 5.7 million pounds of sand were used with 85000 barrels of fluids.

(click to enlarge)
(Source: Welldatabase.com)

Date Oil (BBL) Gas ((NYSEMKT:MCF)) BOE
6/1/2012 4,384.00 3,972.00 3972
7/1/2012 27,133.00 15,337.00 15337
8/1/2012 24,465.00 17,223.00 17223
9/1/2012 21,457.00 9,190.00 9190
10/1/2012 18,040.00 12,601.00 12601
11/1/2012 19,924.00 13,366.00 13366
12/1/2012 28,134.00 22,259.00 22259
1/1/2013 15,382.00 12,661.00 12661
2/1/2013 3,429.00 2,451.00 2451
3/1/2013 15,242.00 22,774.00 22774
4/1/2013 15,761.00 8,479.00 8479
5/1/2013 13,786.00 18,372.00 18372
6/1/2013 14,485.00 18,555.00 18555
7/1/2013 15,668.00 27,250.00 27250
8/1/2013 12,084.00 23,876.00 23876
9/1/2013 13,841.00 46,815.00 46815
10/1/2013 11,388.00 45,800.00 45800
11/1/2013 2,711.00 10,533.00 10533
12/1/2013 0 0 0
1/1/2014 5,953.00 35 35
2/1/2014 11,368.00 20,851.00 20851
3/1/2014 8,784.00 11,179.00 11179
4/1/2014 5,607.00 8,479.00 8479
5/1/2014 4,727.00 5,663.00 5663
6/1/2014 8,359.00 12,726.00 12726
7/1/2014 8,799.00 22,957.00 22957
8/1/2014 7,958.00 31,621.00 31621
9/1/2014 7,218.00 44,318.00 44318
10/1/2014 3,778.00 14,058.00 14058
11/1/2014 3,701.00 9,951.00 9951
12/1/2014 6,612.00 18,435.00 18435
1/1/2015 6,181.00 24,142.00 24142
2/1/2015 3,517.00 10,722.00 10722
3/1/2015 5,218.00 24,175.00 24175
4/1/2015 4,275.00 24,233.00 24233

(Source: Welldatabase.com)

Riverview 100-3031H was a progressive well design for 2012. It produced well. To date it has produced 379 thousand bbls of crude and 615 thousand Mcf of natural gas. This equates to $24 million in revenues. Over the first 360 days (using the true number of production days) it produced 240,036 bbls of crude. The month of December 2013, this well was shut in for the completion of an adjacent well. There was a return to production but no significant jump in production from pressure generated by the new locations. This well declined 42% over 12 months. This is much lower than estimates shown through other well models. The next year we see a 35% decline. 10 months later we see an additional decline of approximately 55%. The decline curve of a well is very specific to geology and well design. Keep in mind averages are just that, and do not provide specific data. These averages should not be used to evaluation acreage and operator as there are wide average swings. Also, averages are generally over a long time frame. Production in the Bakken began in 2004 (first horizontal well completed). Wells in 2004 produce nothing like wells today. Updated averages based on year (IP 360) are more useful. Riverview 100-3031H was part of a two well pad. A middle Bakken well was also completed.

Riverview 4-3031H began producing a month after Riverview 100-3031H. It was a 38 stage 9000 foot lateral. 4.3 million lbs of sand were used and 69000 bbls of fluids.

(click to enlarge)
(Source: Welldatabase.com)

The Riverview and Hawkeye wells analyzed in this article were drilled in a southern fashion.

Date Oil Gas BOE
7/1/2012 20,529.00 12,537.00 12537
8/1/2012 16,553.00 16,903.00 16903
9/1/2012 17,096.00 10,148.00 10148
10/1/2012 23,197.00 17,914.00 17914
11/1/2012 20,122.00 14,402.00 14402
12/1/2012 27,340.00 33,217.00 33217
1/1/2013 16,044.00 24,394.00 24394
2/1/2013 4,267.00 4,946.00 4946
3/1/2013 27,516.00 26,219.00 26219
4/1/2013 20,792.00 7,940.00 7940
5/1/2013 17,516.00 35,948.00 35948
6/1/2013 15,457.00 50,500.00 50500
7/1/2013 13,480.00 50,807.00 50807
8/1/2013 11,254.00 42,300.00 42300
9/1/2013 9,319.00 40,341.00 40341
10/1/2013 8,559.00 33,116.00 33116
11/1/2013 2,190.00 40 40
12/1/2013 0 0 0
1/1/2014 1,124.00 11 11
2/1/2014 5,271.00 81 81
3/1/2014 8,931.00 9,827.00 9827
4/1/2014 5,469.00 7,940.00 7940
5/1/2014 4,807.00 5,748.00 5748
6/1/2014 8,522.00 13,819.00 13819
7/1/2014 7,982.00 17,983.00 17983
8/1/2014 7,169.00 26,755.00 26755
9/1/2014 5,750.00 22,586.00 22586
10/1/2014 1,349.00 3,194.00 3194
11/1/2014 6,495.00 15,947.00 15947
12/1/2014 6,442.00 18,806.00 18806
1/1/2015 5,840.00 22,126.00 22126
2/1/2015 4,171.00 18,682.00 18682
3/1/2015 4,221.00 18,539.00 18539
4/1/2015 3,878.00 19,725.00 19725

(Source: Welldatabase.com)

Riverview 4-3031H has produced 361 thousand bbls of crude and 657 thousand Mcf of natural gas. It under produced Riverview 100-3031H, but this is consistent with well design. 360 day production totaled 237,735 bbls of oil. We do not know if the Three Forks is a better pay zone than the middle Bakken as the well design was not consistent. Most operators have reported better results from the middle Bakken. The Three Forks well used one more stage (less feet per stage should mean better fracturing). It also used significantly more sand and fluids. Either way both wells were good results. Riverview 4-3031H only declined approximately 36% in a comparison of the first month to month 12. This was 7% better than 100-3031H. It declined another 41% in year two on a month to month comparison. This was 6% greater. 56% was seen when compared to adjusted production for 5/15. The Three Forks well declines slower in later production than 4-3031H. This may be due to well design. The well with more stages, proppant and fluids continues to out produce the Bakken well. It is possible the source rock is better. There are many other variables to look at, but this data provides why EOG continues to push ahead with more complex locations.

In September of 2012, EOG drilled its next well in this area. Hawkeye 100-2501H is a 13700 foot lateral targeting the upper Three Forks. It is a 47 stage frac. 14 million pounds of sand were used with 158000 bbls of fluids.

(click to enlarge)
(Source: Welldatabase.com)

Of the three pads, this well is located in the center. It was an interesting design, given the length of the lateral.

Date Oil Gas BOE
9/1/2012 21,959.00 444 444
10/1/2012 54,927.00 155 155
11/1/2012 47,557.00 57,300.00 57300
12/1/2012 55,367.00 92,144.00 92144
1/1/2013 33,396.00 55,877.00 55877
2/1/2013 22,100.00 32,810.00 32810
3/1/2013 36,631.00 57,544.00 57544
4/1/2013 29,075.00 32,696.00 32696
5/1/2013 22,210.00 33,351.00 33351
6/1/2013 17,544.00 25,794.00 25794
7/1/2013 15,872.00 23,600.00 23600
8/1/2013 19,647.00 28,746.00 28746
9/1/2013 15,486.00 22,352.00 22352
10/1/2013 21,325.00 31,678.00 31678
11/1/2013 6,418.00 9,214.00 9214
12/1/2013 0 0 0
1/1/2014 0 0 0
2/1/2014 0 0 0
3/1/2014 29,699.00 23,822.00 23822
4/1/2014 39,782.00 32,696.00 32696
5/1/2014 35,267.00 61,543.00 61543
6/1/2014 27,554.00 49,551.00 49551
7/1/2014 7,229.00 12,565.00 12565
8/1/2014 31,155.00 98,086.00 98086
9/1/2014 12,617.00 32,742.00 32742
10/1/2014 2 4 4
11/1/2014 7,769.00 15,996.00 15996
12/1/2014 15,487.00 49,147.00 49147
1/1/2015 4,427.00 9,918.00 9918
2/1/2015 9,344.00 20,654.00 20654
3/1/2015 8,459.00 25,171.00 25171
4/1/2015 7,235.00 24,752.00 24752

(Source: Welldatabase.com)

Hawkeye 100-2501H had some excellent early production numbers. From that perspective, it is one of the best wells to date in the Bakken. It has already produced 655,000 bbls of crude and 960,000 Mcf of natural gas. It has revenues in excess of $42 million to date. This includes roughly four non-producing or unproductive months. Crude production over the first 360 days was 389,835 bbls. Over the first 12 months, this well produced crude revenues in excess of $23 million. Decline rates were higher, as the first full month of production declined 65% over the first year. This isn’t important as early production rates were some of the highest seen in North Dakota. It is important to note, decline rates are emphasized but higher pressured wells may deplete faster depending on choke and how quickly production is propelled up and out of the wellbore. Any well that produces very well initially will have higher decline rates, but this does not lessen the value of the well. This specific well is depleting faster, but no one is complaining about payback times well under a year. Decline rates decrease significantly in year two at 11%. This well saw a marked increase in production when adjacent wells were turned to sales. The additional pressure associated with well communication increased production from 20,000 bbls/month to 35,000 bbls/month on average. This occurred over a 6 month period.

(click to enlarge)
(Source: Welldatabase.com)

Hawkeye 102-2501H was the fourth completion. This 14,000 foot 62 stage lateral targeted the upper Three Forks. It used 14.5 million pounds of sand and 164,000 bbls of fluids.

Date Oil Gas BOE
1/1/2013 18,486.00 41 41
2/1/2013 27,120.00 8,705.00 8705
3/1/2013 39,702.00 15,748.00 15748
4/1/2013 17,714.00 30,501.00 30501
5/1/2013 41,368.00 57,489.00 57489
6/1/2013 26,602.00 34,399.00 34399
7/1/2013 0 0 0
8/1/2013 133 0 0
9/1/2013 0 0 0
10/1/2013 0 0 0
11/1/2013 0 0 0
12/1/2013 0 0 0
1/1/2014 5,163.00 6,403.00 6403
2/1/2014 41,917.00 74,353.00 74353
3/1/2014 36,439.00 18,111.00 18111
4/1/2014 19,477.00 30,501.00 30501
5/1/2014 26,388.00 43,071.00 43071
6/1/2014 27,480.00 49,456.00 49456
7/1/2014 14,529.00 33,072.00 33072
8/1/2014 24,542.00 62,753.00 62753
9/1/2014 17,613.00 53,460.00 53460
10/1/2014 17,451.00 66,544.00 66544
11/1/2014 9,634.00 33,366.00 33366
12/1/2014 16,338.00 76,547.00 76547
1/1/2015 11,450.00 65,277.00 65277
2/1/2015 8,971.00 50,919.00 50919
3/1/2015 3,177.00 14,820.00 14820
4/1/2015 6,495.00 13,616.00 13616

(Source: Welldatabase.com)

It has produced 458,000 bbls of crude and 839,000 Mcf to date. This equates to roughly $30 million over well life. 360 day production was 394,673 bbls of crude. Production was interesting as initial production was outstanding. The big production numbers were hindered as many of the early months had missed production days. We don’t know if there were production problems, but do know the well was shut when adjacent wells were turned to sales. Production was over 1000 bbls/d over the first six months. It was shut in for another six months. After this production jumped, but this is misleading. Given the fewer days of production per month, there wasn’t much of an increase when the new wells were turned to sales. The decline over the first year on a monthly basis is 20%. The second year is much greater at 80%. We have seen recent production decrease significantly, and is something to watch. Lower decline rates initially are more important. This is because production rates are higher. It equates to greater total production.

Hawkeye 01-2501H was completed in January of 2013.

(click to enlarge)
(Source: Welldatabase.com)

It is a 64 stage, 15000 foot lateral targeting the middle Bakken. This well used 172,000 bbls of fluids and 15 million pounds of sand.

Date Oil Gas BOE
1/1/2013 18,792.00 43 43
2/1/2013 30,211.00 13,879.00 13879
3/1/2013 42,037.00 17,648.00 17648
4/1/2013 17,433.00 36,881.00 36881
5/1/2013 38,754.00 63,501.00 63501
6/1/2013 28,602.00 48,817.00 48817
7/1/2013 0 0 0
8/1/2013 134 1 1
9/1/2013 0 0 0
10/1/2013 0 0 0
11/1/2013 0 0 0
12/1/2013 0 0 0
1/1/2014 6,311.00 7,186.00 7186
2/1/2014 43,713.00 74,099.00 74099
3/1/2014 39,156.00 18,492.00 18492
4/1/2014 23,408.00 36,881.00 36881
5/1/2014 21,681.00 33,498.00 33498
6/1/2014 28,502.00 51,543.00 51543
7/1/2014 18,795.00 45,017.00 45017
8/1/2014 25,512.00 58,837.00 58837
9/1/2014 20,522.00 60,662.00 60662
10/1/2014 19,137.00 68,576.00 68576
11/1/2014 12,093.00 37,043.00 37043
12/1/2014 16,587.00 45,980.00 45980
1/1/2015 14,246.00 62,819.00 62819
2/1/2015 9,220.00 35,931.00 35931
3/1/2015 3,617.00 6,634.00 6634
4/1/2015 13,702.00 42,551.00 42551

(Source: Welldatabase.com)

It has produced 492,170 bbls of crude and 866,520 Mcf of natural gas. 360 day production was 412,072 bbls of oil.

(click to enlarge)
(Source: Welldatabase.com)

This is an excellent well, but the location of focus is Hawkeye 02-2501H. It was completed last in this group. This well provides the link between changes in well design to production improvements.

Date Oil Gas BOE
12/1/2013 3,022.00 6,533.00 6533
1/1/2014 37,385.00 75,940.00 75940
2/1/2014 30,066.00 58,949.00 58949
3/1/2014 22,876.00 50,690.00 50690
4/1/2014 26,703.00 43,926.00 43926
5/1/2014 31,987.00 55,124.00 55124
6/1/2014 27,777.00 47,166.00 47166
7/1/2014 31,500.00 50,279.00 50279
8/1/2014 51,709.00 99,583.00 99583
9/1/2014 43,292.00 98,069.00 98069
10/1/2014 40,143.00 98,927.00 98927
11/1/2014 24,064.00 50,495.00 50495
12/1/2014 31,488.00 99,684.00 99684
1/1/2015 27,087.00 94,621.00 94621
2/1/2015 22,207.00 94,490.00 94490
3/1/2015 22,590.00 125,634.00 125634
4/1/2015 17,707.00 94,910.00 94910

(Source: Welldatabase.com)

The production numbers are significant. In less than a year and a half, it has produced 490,000 bbls of crude and 1.25 Bcf of natural gas. Revenues to date are $33.2 million. Its 360 day crude production was 427,663 bbls. The production is impressive but the decline curve is more important. This Hawkeye well has a steady production rate with only a slight decline. This is where the analysts may be getting it wrong, as decline curves change significantly by area and well design. What EOG has done is not only increased production significantly, but also flattened the curve. Initial production is interesting as we don’t see peak production until nine months. This means our best month is August of 2014, and not the first full month. When we analyze the production after one full year of production, there is no drop off.

This 12800 foot 69 stage lateral is a very good middle Bakken design. EOG decided to pull back some of the lateral length. There are several possible reasons for this. We think it is possible EOG has discovered it was having difficulty in getting proppant to the toe of the well. But this is why operators test the length. More importantly, the increase in stages in conjunction with a shorter lateral provides for shorter stages. This means the operator will probably do a better job of stimulating the source rock. This well also used massive volumes of fluids and sand. 460,000 bbls of fluids were used with over 27 million lbs of proppant. I don’t normally break down the types of sand, as it can be trivial to some but in this case I have as the design seems somewhat unique. This well used approximately 16 million lbs of 100 mesh sand, 7 million lbs of 30/70 and 4 million 40/70. The large volumes of mesh sand are interesting. It would seem EOG is trying to push the finest sand deep into the fractures to maintain deeper shale production.

Well Date Lateral Ft. Stages Proppant Lbs. Fluids Bbls. 12 mo. Oil Production Bbls. Production/Ft.
Riverview 100-3031H 6/12 9,000 39 5.7M 85,000 240,036 26.67
Riverview 4-3031H 7/12 9,000 38 4.3M 69,000 237,735 26.42
Hawkeye 100-2501H 9/12 13,700 47 14M 158,000 389,835 28.46
Hawkeye 102-2501H 1/13 14,000 62 14.5M 164,000 394,673 28.19
Hawkeye 01-2501H 1/13 15,000 64 15M 172,000 412,072 27.47
Hawkeye 02-2501H 12/13 12,800 69 27M 460,000 427,663 33.41

I completed the above table for several reasons. The first was to show well design’s effect on one year total production. We used 360 days as a base. We didn’t use 12 months as that will skew data, as some wells don’t produce every day of every month. Wells are shut in for service or more importantly when new production from adjacent locations are turned to sales. So these are a specific number of days and not estimates. We also broke down production per foot of lateral. This may be more important than any other factor. Production per well is important, but lateral length is a key as it shows how well the source rock was stimulated. In reality, production per foot matters more at longer lateral lengths. Many operators don’t like to do laterals longer than 10,000 feet, as production per foot decreases sharply. When looking at well production data, it is obvious that production per foot suffers as the toe of the lateral gets farther from the vertical.

There are several other ETFs that focus on U.S. and world crude prices:

  • iPath S&P Crude Oil Total Return Index ETN (NYSEARCA:OIL)
  • ProShares Ultra Bloomberg Crude Oil ETF (NYSEARCA:UCO)
  • VelocityShares 3x Long Crude Oil ETN (NYSEARCA:UWTI)
  • ProShares Ultrashort Bloomberg Crude Oil ETF (NYSEARCA:SCO)
  • U.S. Brent Oil ETF (NYSEARCA:BNO)
  • PowerShares DB Oil ETF (NYSEARCA:DBO)
  • VelocityShares 3x Inverse Crude Oil ETN (NYSEARCA:DWTI)
  • PowerShares DB Crude Oil Double Short ETN (NYSEARCA:DTO)
  • U.S. 12 Month Oil ETF (NYSEARCA:USL)
  • U.S. Short Oil ETF (NYSEARCA:DNO)
  • PowerShares DB Crude Oil Long ETN (NYSEARCA:OLO)
  • PowerShares DB Crude Oil Short ETN (NYSEARCA:SZO)
  • iPath Pure Beta Crude Oil ETN (NYSEARCA:OLEM)

All six wells had fantastic results. The first two Riverview wells are still considered sand heavy fracs and produced almost a quarter of a million barrels of oil. This does not include natural gas in the estimates, but EURs for these wells are approximately 1200 MBo. We don’t put much emphasis on EURs other than an indicator of how good production is in comparison. Since locations will produce from 35 to 40 years, we are more inclined to emphasize one year production. Although the Hawkeye wells drilled on 9/12 and 1/13 didn’t show a large uptick in production per foot, it is still quite impressive considering the lateral length. Overall production uplift was exceptional, and these wells produce decent payback times at current oil price realizations.

There is no doubt this area has superior geology. It is definitely a core area, but may not be as good as Parshall field. Because of this, we know other areas would not produce as well, but still it provides a decent comparison for the upside to well design. Geology is still key and this is probably why EOG recently drilled a 15 well pad in the same general area. These wells are still in confidential status, so we do not know the outcome. Given the results in this area, these wells could be very interesting. The most important reason to focus on these Mega-Fracs is repeatability. If EOG can do this, so can other operators. Our expectations are many operators will be able to complete wells this good within the next 12 to 24 months. If this occurs we could see production maintained at much lower prices and fewer completions.

US Oil Rig Count Decline Quickened This Week

Idle rigs in Helmerich & Payne International Drilling Co.'s yard in Ector County, Texas. North Dakota has also been hit hard, forcing gains in technology.

Source: Rigzone

The fall in U.S. rigs drilling for oil quickened a bit this week, data showed on Friday, suggesting a recent slowdown in the decline in drilling was temporary, after slumping oil prices caused energy companies to idle half the country’s rigs since October.

Drillers idled 31 oil rigs this week, leaving 703 rigs active, after taking 26 and 42 rigs out of service in the previous two weeks, oil services firm Baker Hughes Inc said in its closely watched report.

With the oil rig decline this week, the number of active rigs has fallen for a record 20 weeks in a row to the lowest since 2010, according to Baker Hughes data going back to 1987.
Since the number of oil rigs peaked at 1,609 in October, energy producers have responded quickly to the steep 60 percent drop in oil prices since last summer by cutting spending, eliminating jobs and idling rigs.

After its precipitous drop since October, the U.S. oil rig count is nearing a pivotal level that experts say could dent production, bolster prices and even coax oil companies back to the well pad in the coming months.

https://jafrianews.files.wordpress.com/2015/04/shia-houthi-threatens-to-attack-saudi-arabia-it-air-strikes-continue.jpg

Pioneer Natural Resources Co, a top oil producer in the Permian Basin of West Texas, said this week it will start adding rigs in June as long as market conditions are favorable. U.S. crude futures this week climbed to over $58 a barrel, the highest level this year, as a Saudi-led coalition continued bombings in Yemen.

That was up 38 percent from a six-year low near $42 set in mid March on oversupply concerns and lackluster demand, in part on expectations the lower rig count will start reducing U.S. oil output.

After rising mostly steadily since 2009, U.S. oil production has stalled near 9.4 million barrels a day since early March, the highest level since the early 1970s, according to government data.

The Permian Basin in West Texas and eastern New Mexico, the nation’s biggest and fastest-growing shale oil basin, lost the most oil rigs, down 13 to 242, the lowest on record, according to data going back to 2011.

Texas was the state with the biggest rig decline, down 19 to 392, the least since 2009.
In Canada, active oil rigs fell by four to 16, the lowest since 2009. U.S. natural gas rigs, meanwhile, climbed by eight to 225, the same as two weeks ago.

One Third Of U.S. Companies’ Q1 Job Cuts Due To Oil Prices

https://i0.wp.com/www.jobcutnews.com/wp-content/uploads/2011/10/pink-slips.jpgby Olivia Pulsinelli

Oil prices caused one-third of the job cuts that U.S.-based companies announced in the first quarter, according to a new report. March was the fourth month in a row to record a year-over-year increase in job cuts, Chicago-based outplacement consultancy Challenger, Gray & Christmas Inc. reports. And 47,610 of the 140,214 job cuts announced between January and March were directly attributed to falling oil prices. Not surprisingly, the energy sector accounted for 37,811 of the job cuts — up a staggering 3,900 percent from the same quarter a year earlier, when 940 energy jobs were cut. However, U.S. energy firms only announced 1,279 job cuts in March, down about 92 percent from the 16,339 announced in February and down nearly 94 percent from the 20,193 announced in January. The trend held true in Houston, where several energy employers announced job cuts in January and February, while fewer cuts were announced in March. Overall job-cut announcements are declining, as well. U.S. employers announced 36,594 job cuts in March, down 27.6 percent from the 50,579 announced in February and down 31 percent from the 53,041 announced in January. In December, 32,640 job cuts were announced. “Without these oil related cuts, we could have been looking one of lowest quarters for job-cutting since the mid-90s when three-month tallies totaled fewer than 100,000. However, the drop in the price of oil has taken a significant toll on oil field services, energy providers, pipelines, and related manufacturing this year,” John Challenger, CEO of Challenger, Gray & Christmas, said in a statement.

The U.S. Oil Boom Is Moving To A Level Not Seen In 45 Years

by Myra P. Saefong

Peak U.S. oil production is a ‘moving target’

SAN FRANCISCO (MarketWatch) — U.S. oil production is on track to reach an annual all-time high by September of this year, according to Rystad Energy. If production does indeed top out, then supply levels may soon hit a peak as well. That, in turn, could lead to shrinking supplies. The oil-and-gas consulting-services firm estimates an average 2015 output of 9.65 million barrels a day will be reached in five months — topping the previous peak annual reading of 9.64 million barrels a day in 1970. Coincidentally, the nation’s crude inventories stand at a record 471.4 million barrels, based on data from U.S. Energy Information Administration, also going back to the 1970s. The staggering pace of production from shale drilling and hydraulic fracturing have been blamed for the 46% drop in crude prices CLK5, -1.08% last year. But reaching so-called peak production may translate into a return to higher oil prices as supplies begin to thin.

Rystad Energy’s estimate includes crude oil and lease condensate (liquid hydrocarbons that enter the crude-oil stream after production), and assumes an average price of $55 for West Texas Intermediate crude oil. May WTI crude settled at $49.14 a barrel on Friday. The forecast peak production level in September is also dependent on horizontal oil rig counts for Bakken, Eagle Ford and Permian shale plays stabilizing at 400 rigs, notes Per Magnus Nysveen, senior partner and head of analysis at Rystad. Of course, in this case, hitting peak production isn’t assured. “Some will be debating whether the U.S. has reached its peak production for the current boom, without addressing the question of what level will U.S. production climb to in any future booms,” said Charles Perry, head of energy consultant Perry Management. “So one might also say U.S. peak production is a moving target.” James Williams, an energy economist at WTRG Economics, said that by his calculations, peak production may have already happened or may occur this month, since the market has seen a decline in North Dakota production, with Texas expected to follow.

Permian Basin Idles Five Rigs This Week

by Trevor Hawes

Drilling rig

The number of rigs exploring for oil and natural gas in the Permian Basin decreased five this week to 285, according to the weekly rotary rig count released Thursday by Houston-based oilfield services company Baker Hughes.

The North American rig count was released a day early this week because of the Good Friday holiday, according to the Baker Hughes website.

District 8 — which includes Midland and Ector counties — shed four rigs, bringing the total to 180. The district’s rig count is down 42.68 percent on the year. The Permian Basin is down 46.23 percent.

At this time last year, the Permian Basin had 524 rigs.

TEXAS

Texas’ count fell six this week, leaving 456 rigs statewide.

In other major Texas basins, there were 137 rigs in the Eagle Ford, unchanged; 29 in the Haynesville, down three; 23 in the Granite Wash, down one; and six in the Barnett, unchanged.

Texas had 877 rigs a year ago this week.

UNITED STATES

The number of rigs in the U.S. decreased 20 this week, bringing the nationwide total to 1,028.

There were 802 oil rigs, down 11; 222 natural gas rigs, down 11; and four rigs listed as miscellaneous, up two.

By trajectory, there were 136 vertical rigs, down eight; 799 horizontal rigs, down 13; and 93 directional rigs, up one. The last time the horizontal rig count fell below 800 was the week ending June 4, 2010, when Baker Hughes reported 798 rigs.

There were 993 rigs on land, down 17; four in inland waters, unchanged; and 31 offshore, down three. There were 29 rigs in the Gulf of Mexico, down four.

The U.S. had 1,818 rigs at this time last year.

TOP 5s

The top five states by rig count this week were Texas; Oklahoma with 129, down four; North Dakota with 90, down six; Louisiana with 67, down five; and New Mexico with 51, unchanged.

The top five rig counts by basin were the Permian; the Eagle Ford; the Williston with 91, down six; the Marcellus with 70, unchanged; and the Cana Woodford and Mississippian with 40 each. The Mississippian idled three rigs, while the Cana Woodford was unchanged. The Cana Woodford shale play is located in central Oklahoma.

CANADA AND NORTH AMERICA

The number of rigs operating in Canada fell 20 this week to 100. There were 20 oil rigs, up two; 80 natural gas rigs, down 22; and zero rigs listed as miscellaneous, unchanged.

The last time Canada’s rig count dipped below 100 was the week ending May 29, 2009, when 90 rigs were reported.

Canada had 235 rigs at this time last year.

The total number of rigs in the North America region fell 40 this week to 1,128. North America had 2,083 rigs a year ago this week.

The “Revolver Raid” Arrives: A Wave Of Shale Bankruptcies Has Just Been Unleashed

by Tyler Durden

Back in early 2007, just as the first cracks of the bursting housing and credit bubble were becoming visible, one of the primary harbingers of impending doom was banks slowly but surely yanking availability (aka “dry powder”) under secured revolving credit facilities to companies across America. This also was the first snowflake in what would ultimately become the lack of liquidity avalanche that swept away Lehman and AIG and unleashed the biggest bailout of capitalism in history. Back then, analysts had a pet name for banks calling CFOs and telling them “so sorry, but your secured credit availability has been cut by 50%, 75% or worse” – revolver raids.Well, the infamous revolver raids are back. And unlike 7 years ago when they initially focused on retail companies as a result of the collapse in consumption burdened by trillions in debt, it should come as no surprise this time the sector hit first and foremost is energy, whose “borrowing availability” just went poof as a result of the very much collapse in oil prices.
As Bloomberg reports, “lenders are preparing to cut the credit lines to a group of junk-rated shale oil companies by as much as 30 percent in the coming days, dealing another blow as they struggle with a slump in crude prices, according to people familiar with the matter.


Sabine Oil & Gas Corp. became one of the first companies to warn investors that it faces a cash shortage from a reduced credit line, saying Tuesday that it raises “substantial doubt” about the company’s ability to continue as a going concern.

It’s going to get worse: “About 10 firms are having trouble finding backup financing, said the people familiar with the matter, who asked not to be named because the information hasn’t been announced.”

Why now? Bloomberg explains that “April is a crucial month for the industry because it’s when lenders are due to recalculate the value of properties that energy companies staked as loan collateral. With those assets in decline along with oil prices, banks are preparing to cut the amount they’re willing to lend. And that will only squeeze companies’ ability to produce more oil.

Those loans are typically reset in April and October based on the average price of oil over the previous 12 months. That measure has dropped to about $80, down from $99 when credit lines were last reset.

That represents billions of dollars in reduced funding for dozens of companies that relied on debt to fund drilling operations in U.S. shale basins, according to data compiled by Bloomberg.

“If they can’t drill, they can’t make money,” said Kristen Campana, a New York-based partner in Bracewell & Giuliani LLP’s finance and financial restructuring groups. “It’s a downward spiral.”

As warned here months ago, now that shale companies having exhausted their ZIRP reserves which are largely unsecured funding, it means that once the secured capital crunch arrives – as it now has – it is truly game over, and it is just a matter of months if not weeks before the current stakeholders hand over the keys to the building, or oil well as the case may be, over to either the secured lenders or bondholders.

The good news is that unlike almost a decade ago, this time the news of impending corporate doom will come nearly in real time: “Publicly traded firms are required to disclose such news to investors within four business days, under U.S. Securities and Exchange Commission rules. Some of the companies facing liquidity shortfalls will also disclose that they have fully drawn down their revolving credit lines like Sabine, according to one of the people.”

Speaking of Sabine, its day of reckoning has arrived

Sabine, the Houston-based exploration and production company that merged with Forest Oil Corp. last year, told investors Tuesday that it’s at risk of defaulting on $2 billion of loans and other debt if its banks don’t grant a waiver.

Another company is Samson Resource, which said in a filing on Tuesday that it might have to file for a Chapter 11 bankruptcy protection if the company is unable to refinance its debt obligations. And unless oil soars in the coming days, it won’t. 


Its borrowing base may be reduced due to weak oil and gas prices, requiring the company to repay a portion of its credit line, according to a regulatory filing on Tuesday. That could “result in an event of default,” Tulsa, Oklahoma-based Samson said in the filing.

Indicatively, Samson Resources, which was acquired in a $7.2-billion deal in 2011 by a team of investors led by KKR & Co, had a total debt of $3.9 billion as of Dec. 31. It is unlikely that its sponsors will agree to throw in more good money after bad in hopes of delaying the inevitable.

The revolver raids explain the surge in equity and bond issuance seen in recent weeks:

Many producers have been raising money in recent weeks in anticipation of the credit squeeze, selling shares or raising longer-term debt in the form of junk bonds or loans.

Energy companies issued more than $11 billion in stock in the first quarter, more than 10 times the amount from the first three months of last year, Bloomberg data show. That’s the fastest pace in more than a decade.

Breitburn Energy Partners LP announced a $1 billion deal with EIG Global Energy Partners earlier this week to help repay borrowings on its credit line. EIG, an energy-focused private equity investor in Washington, agreed to buy $350 million of Breitburn’s convertible preferred equity and $650 million of notes, Breitburn said in a March 29 statement.

Unfortunately, absent an increase in the all important price of oil, at this point any incremental dollar thrown at US shale companies is a dollar that will never be repaid.

Finally, speaking of Samson, its imminent bankruptcy should not come as a surprise. Back in January we laid out the shale companies which will file for bankruptcy first. The recent KKR LBO was one of them.

Many more to come as the countdown to the day of reckoning for the US shale sector has just about run out.

Junk-Rated Oil & Gas Companies in a “Liquidity Death Spiral”

by Wolf Richter

https://ashwinikumar007.files.wordpress.com/2011/06/blackmoney.jpg

On the face of it, the oil price appears to be stabilizing. What a precarious balance it is, however.

Behind the facade of stability, the re-balancing triggered by the price collapse has yet to run its course, and it might be overly optimistic to expect it to proceed smoothly. Steep drops in the US rig count have been a key driver of the price rebound. Yet US supply so far shows precious little sign of slowing down. Quite to the contrary, it continues to defy expectations.

So said the International Energy Agency in its Oil Market Report on Friday. West Texas Intermediate plunged over 4% to $45 a barrel.

The boom in US oil production will continue “to defy expectations” and wreak havoc on the price of oil until the power behind the boom dries up: money borrowed from yield-chasing investors driven to near insanity by the Fed’s interest rate repression. But that money isn’t drying up yet – except at the margins.

Companies have raked in 14% more money from high-grade bond sales so far this year than over the same period in 2014, according to LCD. And in 2014 at this time, they were 27% ahead of the same period in 2013. You get the idea.

Even energy companies got to top off their money reservoirs. Among high-grade issuers over just the last few days were BP Capital, Valero Energy, Sempra Energy, Noble, and Helmerich & Payne. They’re all furiously bringing in liquidity before it gets more expensive.

In the junk-bond market, bond-fund managers are chasing yield with gusto. Last week alone, pro-forma junk bond issuance “ballooned to $16.48 billion, the largest weekly tally in two years,” the LCD HY Weekly reported. Year-to-date, $79.2 billion in junk bonds have been sold, 36% more than in the same period last year.

But despite this drunken investor enthusiasm, the bottom of the energy sector – junk-rated smaller companies – is falling out.

Standard & Poor’s rates 170 bond issuers that are engaged in oil and gas exploration & production, oil field services, and contract drilling. Of them, 81% are junk rated – many of them deep junk. The oil bust is now picking off the smaller junk-rated companies, one after the other, three of them so far in March.

On March 3, offshore oil-and-gas contractor CalDive that in 2013 still had 1,550 employees filed for bankruptcy. It’s focused on maintaining offshore production platforms. But some projects were suspended last year, and lenders shut off the spigot.

On March 8, Dune Energy filed for bankruptcy in Austin, TX, after its merger with Eos Petro collapsed. It listed $144 million in debt. Dune said that it received $10 million Debtor in Possession financing, on the condition that the company puts itself up for auction.

On March 9, BPZ Resources traipsed to the courthouse in Houston to file for bankruptcy, four days after I’d written about its travails; it had skipped a $60 million payment to its bondholders [read… “Default Monday”: Oil & Gas Companies Face Their Creditors].

And more companies are “in the pipeline to be restructured,” LCD reported. They all face the same issues: low oil and gas prices, newly skittish bond investors, and banks that have their eyes riveted on the revolving lines of credit with which these companies fund their capital expenditures. Being forever cash-flow negative, these companies periodically issue bonds and use the proceeds to pay down their revolver when it approaches the limit. In many cases, the bank uses the value of the company’s oil and gas reserves to determine that limit.

If the prices of oil and gas are high, those reserves have a high value. It those prices plunge, the borrowing base for their revolving lines of credit plunges. S&P Capital IQ explained it this way in its report, “Waiting for the Spring… Will it Recoil”:

Typically, banks do their credit facility redeterminations in April and November with one random redetermination if needed. With oil prices plummeting, we expect banks to lower their price decks, which will then lead to lower reserves and thus, reduced borrowing-base availability.

April is coming up soon. These companies would then have to issue bonds to pay down their credit lines. But with bond fund managers losing their appetite for junk-rated oil & gas bonds, and with shares nearly worthless, these companies are blocked from the capital markets and can neither pay back the banks nor fund their cash-flow negative operations. For many companies, according to S&P Capital IQ, these redeterminations of their credit facilities could lead to a “liquidity death spiral.”

Alan Holtz, Managing Director in AlixPartners’ Turnaround and Restructuring group told LCD in an interview:

We are already starting to see companies that on the one hand are trying to work out their operational problems and are looking for financing or a way out through the capital markets, while on the other hand are preparing for the events of contingency planning or bankruptcy.

Look at BPZ Resources. It wasn’t able to raise more money and ended up filing for bankruptcy. “I think that is going to be a pattern for many other companies out there as well,” Holtz said.

When it trickled out on Tuesday that Hercules Offshore, which I last wrote about on March 3, had retained Lazard to explore options for its capital structure, its bonds plunged as low as 28 cents on the dollar. By Friday, its stock closed at $0.41 a share.

When Midstates Petroleum announced that it had hired an interim CEO and put a restructuring specialist on its board of directors, its bonds got knocked down, and its shares plummeted 33% during the week, closing at $0.77 a share on Friday.

When news emerged that Walter Energy hired legal counsel Paul Weiss to explore restructuring options, its first-lien notes – whose investors thought they’d see a reasonable recovery in case of bankruptcy – dropped to 64.5 cents on the dollar by Thursday. Its stock plunged 63% during the week to close at $0.33 a share on Friday.

Numerous other oil and gas companies are heading down that path as the oil bust is working its way from smaller more vulnerable companies to larger ones. In the process, stockholders get wiped out. Bondholders get to fight with other creditors over the scraps. But restructuring firms are licking their chops, after a Fed-induced dry spell that had lasted for years.

Investors Crushed as US Natural Gas Drillers Blow Up

by Wolf Richter

The Fed speaks, the dollar crashes. The dollar was ripe. The entire world had been bullish on it. Down nearly 3% against the euro, before recovering some. The biggest drop since March 2009. Everything else jumped. Stocks, Treasuries, gold, even oil.

West Texas Intermediate had been experiencing its biggest weekly plunge since January, trading at just above $42 a barrel, a new low in the current oil bust. When the Fed released its magic words, WTI soared to $45.34 a barrel before re-sagging some. Even natural gas rose 1.8%. Energy related bonds had been drowning in red ink; they too rose when oil roared higher. It was one heck of a party.

But it was too late for some players mired in the oil and gas bust where the series of Chapter 11 bankruptcy filings continues. Next in line was Quicksilver Resources.

It had focused on producing natural gas. Natural gas was where the fracking boom got started. Fracking has a special characteristic. After a well is fracked, it produces a terrific surge of hydrocarbons during first few months, and particularly on the first day. Many drillers used the first-day production numbers, which some of them enhanced in various ways, in their investor materials. Investors drooled and threw more money at these companies that then drilled this money into the ground.

But the impressive initial production soon declines sharply. Two years later, only a fraction is coming out of the ground. So these companies had to drill more just to cover up the decline rates, and in order to drill more, they needed to borrow more money, and it triggered a junk-rated energy boom on Wall Street.

At the time, the price of natural gas was soaring. It hit $13 per million Btu at the Henry Hub in June 2008. About 1,600 rigs were drilling for gas. It was the game in town. And Wall Street firms were greasing it with other people’s money. Production soared. And the US became the largest gas producer in the world.

https://martinhladyniuk.files.wordpress.com/2015/03/be197-deathspiral2.jpg

But then the price began to plunge. It recovered a little after the Financial Crisis but re-plunged during the gas “glut.” By April 2012, natural gas had crashed 85% from June 2008, to $1.92/mmBtu. With the exception of a few short periods, it has remained below $4/mmBtu – trading at $2.91/mmBtu today.

Throughout, gas drillers had to go back to Wall Street to borrow more money to feed the fracking orgy. They were cash-flow negative. They lost money on wells that produced mostly dry gas. Yet they kept up the charade. They aced investor presentations with fancy charts. They raved about new technologies that were performing miracles and bringing down costs. The theme was that they would make their investors rich at these gas prices.

The saving grace was that oil and natural-gas liquids, which were selling for much higher prices, also occur in many shale plays along with dry gas. So drillers began to emphasize that they were drilling for liquids, not dry gas, and they tried to switch production to liquids-rich plays. In that vein, Quicksilver ventured into the oil-rich Permian Basin in Texas. But it was too little, too late for the amount of borrowed money it had already burned through over the years by fracking for gas below cost.

During the terrible years of 2011 and 2012, drillers began reclassifying gas rigs as rigs drilling for oil. It was a judgement call, since most wells produce both. The gas rig count plummeted further, and the oil rig count skyrocketed by about the same amount. But gas production has continued to rise since, even as the gas rig count has continued to drop. On Friday, the rig count was down to 257 gas rigs, the lowest since March 1993, down 84% from its peak in 2008.

US-rig-count_1988_2015-03-13=gas

Quicksilver’s bankruptcy is a consequence of this fracking environment. It listed $2.35 billion in debts. That’s what is left from its borrowing binge that covered its negative cash flows. It listed only $1.21 billion in assets. The rest has gone up in smoke.

Its shares are worthless. Stockholders got wiped out. Creditors get to fight over the scraps.

Its leveraged loan was holding up better: the $625 million covenant-lite second-lien term loan traded at 56 cents on the dollar this morning, according to S&P Capital IQ LCD. But its junk bonds have gotten eviscerated over time. Its 9.125% senior notes due 2019 traded at 17.6 cents on the dollar; its 7.125% subordinated notes due 2016 traded at around 2 cents on the dollar.

Among its creditors, according to the Star Telegram: the Wilmington Trust National Association ($361.6 million), Delaware Trust Co. ($332.6 million), US Bank National Association ($312.7 million), and several pipeline companies, including Oasis Pipeline and Energy Transfer Fuel.

Last year, it hired restructuring advisers. On February 17, it announced that it would not make a $13.6 million interest payment on its senior notes and invoked the possibility of filing for Chapter 11. It said it would use its 30-day grace period to haggle with its creditors over the “company’s options.”

Now, those 30 days are up. But there were no other “viable options,” the company said in the statement. Its Canadian subsidiary was not included in the bankruptcy filing; it reached a forbearance agreement with its first lien secured lenders and has some breathing room until June 16.

Quicksilver isn’t alone in its travails. Samson Resources and other natural gas drillers are stuck neck-deep in the same frack mud.

A group of private equity firms, led by KKR, had acquired Samson in 2011 for $7.2 billion. Since then, Samson has lost $3 billion. It too hired restructuring advisers to deal with its $3.75 billion in debt. On March 2, Moody’s downgraded Samson to Caa3, pointing at “chronically low natural gas prices,” “suddenly weaker crude oil prices,” the “stressed liquidity position,” and delays in asset sales. It invoked the possibility of “a debt restructuring” and “a high risk of default.”

But maybe not just yet. The New York Post reported today that, according to sources, a JPMorgan-led group, which holds a $1 billion revolving line of credit, is granting Samson a waiver for an expected covenant breach. This would avert default for the moment. Under the deal, the group will reduce the size of the revolver. Last year, the same JPMorgan-led group already reduced the credit line from $1.8 billion to $1 billion and waived a covenant breach.

By curtailing access to funding, they’re driving Samson deeper into what S&P Capital IQ called the “liquidity death spiral.” According to the New York Post’s sources, in August the company has to make an interest payment to its more junior creditors, “and may run out of money later this year.”

Industry soothsayers claimed vociferously over the years that natural gas drillers can make money at these prices due to new technologies and efficiencies. They said this to attract more money. But Quicksilver along with Samson Resources and others are proof that these drillers had been drilling below the cost of production for years. And they’d been bleeding every step along the way. A business model that lasts only as long as new investors are willing to bail out old investors.

But it was the crash in the price of “liquids” that made investors finally squeamish, and they began to look beyond the hype. In doing so, they’re triggering the very bloodletting amongst each other that ever more new money had delayed for years. Only now, it’s a lot more expensive for them than it would have been three years ago. While the companies will get through it in restructured form, investors get crushed.


Oil Production Falling In Three Big Shale Plays, EIA Says

HOUSTON – It’s official: The shale oil boom is starting to waver.

And, in a way, it may have souped-up rigs and more efficient drilling technologies to thank for that.

Crude production at three major U.S. shale oil fields is projected to fall this month for the first time in six years, the U.S. Energy Information Administration said Tuesday.

It’s one of the first signs that idling hundreds of drilling rigs and billions of dollars in corporate cutbacks are starting to crimp the nation’s surging oil patch.

But it also shows that drilling technology and techniques have advanced to the point that productivity gains may be negligible in some shale plays where horizontal drilling and hydraulic fracturing have been used together for the past several years.

Because some plays are already full of souped-up horizontal rigs, oil companies don’t have as many options to become more efficient and stem production losses, as they did in the 2008-2009 downturn, the EIA said.

The EIA’s monthly drilling productivity report indicates that rapid production declines from older wells in three shale plays are starting to overtake new output, as oil companies drill fewer wells.

In the recession six years ago, the falling rig count didn’t lead to declining production because new technologies boosted how fast rigs could drill wells.

But now that oil firms have figured out how to drill much more efficiently, “it is not clear that productivity gains will offset rig count declines to the same degree as in 2008-09,” the EIA said.

Energy Information Agency

Overall, U.S. oil production is set to increase slightly from March to April to 5.6 million barrels a day in six major fields, according to the EIA.

But output is falling in the Eagle Ford Shale in South Texas, North Dakota’s Bakken Shale and the Niobrara Shale in Colorado, Wyoming, Nebraska and Kansas.

In those three fields, net production is expected to drop by a combined 24,000 barrels a day.

The losses were masked by production gains in the Permian Basin in West Texas and other regions.

Efficiency improvements are still emerging in the Permian, faster than in other oil fields because the region was largely a vertical-drilling zone as recently as December 2013, the EIA said.

Net crude output in the Bakken is expected to decline by 8,000 barrels a day from March to April. In the Eagle Ford, it’s slated to fall by 10,000 barrels a day. And in the Niobrara, production will dip by roughly 5,000 barrels a day.

But daily crude output jumped by 21,000 barrels in the Permian and by 3,000 barrels in the Utica Shale in Ohio and Pennsylvania.

Read more at MRT.com

This Chart Shows the True Collapse of Fracking in the US

by Wolf Richter
https://feww.files.wordpress.com/2009/08/rex-wtillerson-exxon.jpg

Rex Tillerson, Exxon Mobile CEO

“People need to kinda settle in for a while.” That’s what Exxon Mobil CEO Rex Tillerson said about the low price of oil at the company’s investor conference. “I see a lot of supply out there.”

So Exxon is going to do its darnedest to add to this supply: 16 new production projects will start pumping oil and gas through 2017. Production will rise from 4 million barrels per day to 4.3 million. But it will spend less money to get there, largely because suppliers have had to cut their prices.

That’s the global oil story. In the US, a similar scenario is playing out. Drillers are laying some people off, not massive numbers yet. Like Exxon, they’re shoving big price cuts down the throats of their suppliers. They’re cutting back on drilling by idling the least efficient rigs in the least productive plays – and they’re not kidding about that.

In the latest week, they idled a 64 rigs drilling for oil, according to Baker Hughes, which publishes the data every Friday. Only 922 rigs were still active, down 42.7% from October, when they’d peaked. Within 21 weeks, they’ve taken out 687 rigs, the most terrific, vertigo-inducing oil-rig nose dive in the data series, and possibly in history:

US-rig-count_1988_2015-03-06=oilAs Exxon and other drillers are overeager to explain: just because we’re cutting capex, and just because the rig count plunges, doesn’t mean our production is going down. And it may not for a long time. Drillers, loaded up with debt, must have the cash flow from production to survive.

But with demand languishing, US crude oil inventories are building up further. Excluding the Strategic Petroleum Reserve, crude oil stocks rose by another 10.3 million barrels to 444.4 million barrels as of March 4, the highest level in the data series going back to 1982, according to the Energy Information Administration. Crude oil stocks were 22% (80.6 million barrels) higher than at the same time last year.

“When you have that much storage out there, it takes a long time to work that off,” said BP CEO Bob Dudley, possibly with one eye on this chart:

US-crude-oil-stocks-2015-03-04So now there is a lot of discussion when exactly storage facilities will be full, or nearly full, or full in some regions. In theory, once overproduction hits used-up storage capacity, the price of oil will plummet to whatever level short sellers envision in their wildest dreams. Because: what are you going to do with all this oil coming out of the ground with no place to go?

A couple of days ago, the EIA estimated that crude oil stock levels nationwide on February 20 (when they were a lot lower than today) used up 60% of the “working storage capacity,” up from 48% last year at that time. It varied by region:

Capacity is about 67% full in Cushing, Oklahoma (the delivery point for West Texas Intermediate futures contracts), compared with 50% at this point last year. Working capacity in Cushing alone is about 71 million barrels, or … about 14% of the national total.

As of September 2014, storage capacity in the US was 521 million barrels. So if weekly increases amount to an average of 6 million barrels, it would take about 13 weeks to fill the 77 million barrels of remaining capacity. Then all kinds of operational issues would arise. Along with a dizzying plunge in price.

In early 2012, when natural gas hit a decade low of $1.92 per million Btu, they predicted the same: storage would be full, and excess production would have to be flared, that is burned, because there would be no takers, and what else are you going to do with it? So its price would drop to zero.

They actually proffered that, and the media picked it up, and regular folks began shorting natural gas like crazy and got burned themselves, because it didn’t take long for the price to jump 50% and then 100%.

Oil is a different animal. The driving season will start soon. American SUVs and pickups are designed to burn fuel in prodigious quantities. People will be eager to drive them a little more, now that gas is cheaper, and they’ll get busy shortly and fix that inventory problem, at least for this year. But if production continues to rise at this rate, all bets are off for next year.

Natural gas, though it refused to go to zero, nevertheless got re-crushed, and the price remains below the cost of production at most wells. Drilling activity has dwindled. Drillers idled 12 gas rigs in the latest week. Now only 268 rigs are drilling for gas, the lowest since April 1993, and down 83.4% from its peak in 2008! This is what the natural gas fracking boom-and-bust cycle looks like:

US-rig-count_1988_2015-03-06=gasYet production has continued to rise. Over the last 12 months, it soared about 9%, which is why the price got re-crushed.

Producing gas at a loss year after year has consequences. For the longest time, drillers were able to paper over their losses on natural gas wells with a variety of means and go back to the big trough and feed on more money that investors were throwing at them, because money is what fracking drills into the ground.

But that trough is no longer being refilled for some companies. And they’re running out. “Restructuring” and “bankruptcy” are suddenly the operative terms.


“Default Monday”: Oil & Gas Face Their Creditors

by Wolf Richter

https://i0.wp.com/www.macleans.ca/wp-content/uploads/2013/02/MAC04_OILSANDS01-wide.jpg

Debt funded the fracking boom. Now oil and gas prices have collapsed, and so has the ability to service that debt. The oil bust of the 1980s took down 700 banks, including 9 of the 10 largest in Texas. But this time, it’s different. This time, bondholders are on the hook.

And these bonds – they’re called “junk bonds” for a reason – are already cracking. Busts start with small companies and proceed to larger ones. “Bankruptcy” and “restructuring” are the terms that wipe out stockholders and leave bondholders and other creditors to tussle over the scraps.

https://martinhladyniuk.files.wordpress.com/2015/03/27560-bankruptcy.jpg

Early January, WBH Energy, a fracking outfit in Texas, kicked off the series by filing for bankruptcy protection. It listed assets and liabilities of $10 million to $50 million. Small fry.

A week later, GASFRAC filed for bankruptcy in Alberta, where it’s based, and in Texas – under Chapter 15 for cross-border bankruptcies. Not long ago, it was a highly touted IPO, whose “waterless fracking” technology would change a parched world. Instead of water, the system pumps liquid propane gel (similar to Napalm) into the ground; much of it can be recaptured, in theory.

Ironically, it went bankrupt for other reasons: operating losses, “reduced industry activity,” the inability to find a buyer that would have paid enough to bail out its creditors, and “limited access to capital markets.” The endless source of money without which fracking doesn’t work had dried up.

https://i0.wp.com/fm.cnbc.com/applications/cnbc.com/resources/img/editorial/2013/09/03/101003666-89cb3e34560372ba5382f629569eaecb4db09256.530x298.jpg

On February 17, Quicksilver Resources announced that it would not make a $13.6 million interest payment on its senior notes due in 2019. It invoked the possibility of filing for Chapter 11 bankruptcy to “restructure its capital structure.” Stockholders don’t have much to lose; the stock is already worthless. The question is what the creditors will get.

It has hired Houlihan Lokey Capital, Deloitte Transactions and Business Analytics, “and other advisors.” During its 30-day grace period before this turns into an outright default, it will haggle with its creditors over the “company’s options.”

On February 27, Hercules Offshore had its share-price target slashed to zero, from $4 a share, at Deutsche Bank, which finally downgraded the stock to “sell.” If you wait till Deutsche Bank tells you to sell, you’re ruined!

When I wrote about Hercules on October 15, HERO was trading at $1.47 a share, down 81% since July. Those who followed the hype to “buy the most hated stocks” that day lost another 44% by the time I wrote about it on January 16, when HERO was at $0.82 a share. Wednesday, shares closed at $0.60.

Deutsche Bank was right, if late. HERO is headed for zero (what a trip to have a stock symbol that rhymes with zero). It’s going to restructure its junk debt. Stockholders will end up holding the bag.

https://i0.wp.com/bloximages.newyork1.vip.townnews.com/tulsaworld.com/content/tncms/assets/v3/editorial/f/d8/fd890ea6-d8e7-59fc-b849-cf74b6c4a4cd/527b48bba3b05.preview-300.jpg

On Monday, due to “chronically low natural gas prices exacerbated by suddenly weaker crude oil prices,” Moody’s downgraded gas-driller Samson Resources, to Caa3, invoking “a high risk of default.”

It was the second time in three months that Moody’s downgraded the company. The tempo is picking up. Moody’s:

The company’s stressed liquidity position, delays in reaching agreements on potential asset sales and its retention of restructuring advisors increases the possibility that the company may pursue a debt restructuring that Moody’s would view as a default.

Moody’s was late to the party. On February 26, it was leaked that Samson had hired restructuring advisers Kirkland & Ellis and Blackstone’s restructuring group to figure out how to deal with its $3.75 billion in debt. A group of private equity firms, led by KKR, had acquired Samson in 2011 for $7.2 billion. Since then, Samson has lost $3 billion. KKR has written down its equity investment to 5 cents on the dollar.

This is no longer small fry.

https://i0.wp.com/www.yourindustrynews.com/upload_images/BPZ_Energy.jpg

Also on Monday, oil-and-gas exploration and production company BPZ Resources announced that it would not pay $62 million in principal and interest on convertible notes that were due on March 1. It will use its grace period of 10 days on the principal and of 30 days on the interest to figure out how to approach the rest of its existence. It invoked Chapter 11 bankruptcy as one of the options.

If it fails to make the payments within the grace period, it would also automatically be in default of its 2017 convertible bonds, which would push the default to $229 million.

BPZ tried to refinance the 2015 convertible notes in October and get some extra cash. Fracking devours prodigious amounts of cash. But there’d been no takers for the $150 million offering. Even bond fund managers, driven to sheer madness by the Fed’s policies, had lost their appetite. And its stock is worthless.

https://i0.wp.com/b.vimeocdn.com/ts/433/407/433407397_640.jpg

Also on Monday – it was “default Monday” or something – American Eagle Energy announced that it would not make a $9.8 million interest payment on $175 million in bonds due that day. It will use its 30-day grace period to hash out its future with its creditors. And it hired two additional advisory firms.

One thing we know already: after years in the desert, restructuring advisers are licking their chops.

The company has $13.6 million in negative working capital, only $25.9 million in cash, and its $60 million revolving credit line has been maxed out.

But here is the thing: the company sold these bonds last August! And this was supposed to be its first interest payment.

That’s what a real credit bubble looks like. In the Fed’s environment of near-zero yield on reasonable investments, bond fund managers are roving the land chasing whatever yield they can discern. And they’re holding their nose while they pick up this stuff to jam it into bond funds that other folks have in their retirement portfolio.

Not even a single interest payment!

Borrowed money fueled the fracking boom. The old money has been drilled into the ground. The new money is starting to dry up. Fracked wells, due to their horrendous decline rates, produce most of their oil and gas over the first two years. And if prices are low during that time, producers will never recuperate their investment in those wells, even if prices shoot up afterwards. And they’ll never be able to pay off the debt from the cash flow of those wells. A chilling scenario that creditors were blind to before, but are now increasingly forced to contemplate.

Study: Government’s Control of Land Is Hurting Oil Production, Job Growth

by Ben Smith

Current government regulations imposed by the Bureau of Land Management are harming energy production and holding back the U.S. economy, a new study reveals.

“While federally owned lands are also full of energy potential, a bureaucratic regulatory regime has mismanaged land use for decades,” write The Heritage Foundation’s Katie Tubb and Nicolas Loris.

The report focuses on the Federal Lands Freedom Act, introduced by Rep. Diane Black, R-Tenn., and Sen. James Inhofe, R-Okla. It is designed to empower states to regain control of their lands from the federal government in order to pursue their own energy goals. That is a challenge in an oil-rich state like Colorado.

“We need to streamline the process as there are very real consequences to poor [or nonexistent] management,” Tubb, a Heritage research associate, told The Daily Signal.

“Empowering the states is the best solution. The people who benefit have a say and can share in the benefits. If there are consequences, they can address them locally with state and local governments that are much more responsive to elections and budgets than the federal government.”

Emphasizing the need to streamline the process, Tubb pointed to the findings in the new report.

“The Bureau of Land Management estimates that it took an average of 227 days simply to complete a drill application,” Tubb said.

That’s more than the average of 154 days in 2005 and more than seven times the state average of 30 days, according to the report.

The report blames this increase in the application process on the drop in drilling on federal lands.

“Since 2009,” Tubb and Loris write, “oil production on federal lands has fallen by nine percent, even as production on state and private lands has increased by 61 percent over the same period.”

Despite almost “43 percent of crude oil coming from federal lands,” government-owned lands have seen a 13-point drop in oil production, from 36 percent to 23 percent.

The report also examines the recent oil-related job boom.

“Job creation in the oil and gas industry bucked the slow economic recovery and grew by 40 percent from 2007 to 2012, in comparison to one percent in the private sector over the same period,” according to the report.

That boom has had a big impact on jobs.

Map: John Fleming

“Energy-abundant states like Colorado and Alaska would stand to benefit tremendously. We’ve seen oil and natural gas production increase substantially in Colorado over the past eight years, bringing jobs and economic activity to the state,” said Loris, an economist who is Heritage’s Herbert and Joyce Morgan fellow.

Tubb cautioned that any change will happen slowly. “The federal government likely will not release the land that easily.”

Loris agreed, noting the long-running debate about the Arctic National Wildlife Refuge.

“It was no surprise that the Alaskan delegation was up in arms when the administration proposed to permanently put ANWR off limits to energy exploration,” Loris told The Daily Signal. “Many in the Alaskan delegation and Alaskan natives, including village of Kaktovik—the only town in the coastal plain of ANWR, support energy development.”

“We are putting power to the people,” Tubb concluded.

OPEC Can’t Kill American Shale

https://i0.wp.com/static3.businessinsider.com/image/542c5b786da8118e288b4570/morgan-stanley-here-are-the-16-best-stocks-for-playing-the-american-shale-boom.jpgby Shareholdersunite

Summary

  • OPEC is supposedly out to beat, or at least curtail the growth of American shale oil production.
  • For a host of reasons, especially the much shorter capex cycle for shale, they will not succeed unless they are willing to accept permanent low oil prices.
  • But, permanent low oil prices will do too much damage to OPEC economies for this to be a credible threat.

We’re sure by now you are familiar with the main narrative behind the oil price crash. First, while oil production outside of North America is basically stagnant since 2005.

The shale revolution has dramatically increased supply in America.

(click to enlarge)

The resulting oversupply has threatened OPEC and the de-facto leader Saudi Arabia has chosen a confrontational strategy not to make way for the new kid on the block, but instead trying to crush, or at least contain it. Can they achieve this aim, provided it indeed is their aim?

Breakeven price
At first, one is inclined to say yes, for the simple reason that Saudi (and most OPEC) oil is significantly cheaper to get out of the ground.

(click to enlarge)

This suggests that all OPEC has to do is to keep output high and sooner or later the oversupply will work itself off the market, and expensive oil is more likely to see cutbacks than cheaper oil, although this critically depends on incentives facing individual producers.

Capex decline
It is therefore no wonder that we’ve seen significant declines in rig counts and numerous companies have announced considerable capex declines. While this needs time to work out into supply cutbacks, these will eventually come.

For instance BP (NYSE:BP) cutting capex from $22.9B in 2014 to $20B in 2015, or Conoco (NYSE:COP) reducing expenditures by more than 30% to $11.5B this year on drilling projects from Colorado to Indonesia. There are even companies, like SandRidge (NYSE:SD), that are shutting 75% of their rigs.

Leverage
It is often argued that the significant leverage of many American shale companies could accelerate the decline, although it doesn’t necessarily have to be like that.

While many leveraged companies will make sharp cutbacks in spending, which has a relatively rapid effect on production (see below), others have strong incentives to generate as much income as possible, so they might keep producing.

Even the companies that go belly up under a weight of leverage will be forced to relinquish their licenses or sell them off at pennies to the dollar, significantly lowering the fixed cost for new producers to take their place.

Hedging
Many shale companies have actually hedged much of their production, so they are shielded from much of the downside (at a cost) at least for some time. And they keep doing this:

Rather than wait for their price insurance to run out, many companies are racing to revamp their policies, cashing in well-placed hedges to increase the number of future barrels hedged, according to industry consultants, bankers and analysts familiar with the deals. [Reuters]

Economics
Being expensive is not necessarily a sufficient reason for being first in line for production cuts. For instance, we know that oil from the Canadian tar sands is at the high end of cost, but simple economics can explain why production cuts are unlikely for quite some time to come.

The tar sands involve a much higher fraction as fixed cost:

Oil-sands projects are multibillion-dollar investments made upfront to allow many years of output, unlike competing U.S. shale wells that require constant injections of capital. It’s future expansion that’s at risk. “Once you start a project it’s like a freight train: you can’t stop it,” said Laura Lau, a Toronto-based portfolio manager at Brompton Funds. Current oil prices will have producers considering “whether they want to sanction a new one.” [Worldoil]

So, once these up-front costs are made, these are basically sunk, and production will only decline if price falls below marginal cost. As long as the oil price stays above that, companies can still recoup part of their fixed (sunk) cost and they have no incentive to cut back production.

But, of course, you have tar sand companies that have not yet invested all required up-front capital and new capex expenditures will be discouraged with low oil prices. So, there is still the usual economic upward sloping supply curve operative here.

Swing producer
The funny thing is American shale oil is at the opposite end of this fixed (and sunk) cost universe, apart from acquiring the licenses. As wells have steep decline curves, production needs constant injection of capital for developing new wells.

Production can therefore be wound down pretty quickly should the economics require, and it can also be wound back up relatively quickly, which we think is enough reason why American shale is becoming the new (passive) swing producer. This has very important implications:

  • The relevant oil price to look at isn’t necessarily the spot price, but the 12-24 months future price, the time frame between capex and production.
  • OPEC will not only need to produce a low oil price today, that price needs to be low for a prolonged period of time in order to see cutbacks in production of American shale oil. Basically, OPEC needs the present oil price to continue indefinitely, as soon as it allows the price to rise again, shale oil capex will rebound and production will increase fairly soon afterwards.

So basically, shale is the proverbial toy duck which OPEC needs to submerge in the bathtub, but as soon as it releases the pressure, the duck will emerge again.

Declining cost curves
The shale revolution caught many by surprise, especially the speed of the increase in production. While technology and learning curves are still improving, witness how production cost curves have been pushed out in the last years:

There is little reason this advancement will come to a sudden halt, even if capex is winding down. In fact, some observers are arguing that producers shift production from marginal fields to fields with better production economics, and the relatively steep production decline curves allow them to make this shift pretty rapidly.

Others point out that even the rapid decline in rig count will not have an immediate impact on production, as the proportion of horizontal wells and platforms where multiple wells are drilled from the same location are increasing, all of which is increasing output per rig.

Another shift that is going on is to re-frack existing wells, instead of new wells. The first is significantly cheaper:

Beset by falling prices, the oil industry is looking at about 50,000 existing wells in the U.S. that may be candidates for a second wave of fracking, using techniques that didn’t exist when they were first drilled. New wells can cost as much as $8 million, while re-fracking costs about $2 million, significant savings when the price of crude is hovering close to $50 a barrel, according to Halliburton Co., the world’s biggest provider of hydraulic fracturing services. [Bloomberg]

Production cuts will take time
The hedging and shift to fields with better economics is only a few of the reasons why so far there has been little in the way of actual production cuts in American shale production, the overall oil market still remains close to record oversupply. The International Energy Agency (IEA) argues:

It is not unusual in a market correction for such a gap to emerge between market expectations and current trends. Such is the cyclical nature of the oil market that the full physical impact of demand and supply responses can take months, if not years, to be felt [CNBC].

In fact, the IEA also has explicit expectations for American shale oil itself:

The United States will remain the world’s top source of oil supply growth up to 2020, even after the recent collapse in prices, the International Energy Agency said, defying expectations of a more dramatic slowdown in shale growth [Yahoo].

OPEC vulnerable itself
Basically, the picture we’re painting above is that American shale will be remarkably resilient. Yes, individual companies will struggle, sharp cutbacks in capex are already underway, and some companies will go under, but the basic fact is that as quick as capex and production can fall, they can rise as quickly again when the oil price recovers.

How much of OPEC can the storm of the oil price crash, very much remains to be seen. There is pain all around, which isn’t surprising as one considers that most OPEC countries have budgeted for much higher oil prices for their public finances.

(click to enlarge)
You’ll notice that these prices are all significantly, sometimes dramatically, higher than what’s needed to balance their budgets. Now, many of these countries also have very generous energy subsidies on domestic oil use, supposedly to share the benefits of their resource wealth (and/or provide industry with a cost advantage).

So, there is a buffer as these subsidies can be wound down relatively painless. Some of these countries also have other buffers, like sovereign wealth funds or foreign currency reserves. And there is often no immediate reason for public budgets to be balanced.

But to suggest, as this article is doing, that OPEC is winning the war is short-sighted.

Conclusion
While doing damage to individual American shale oil producers and limiting its expansion, the simple reality is that for a host of reasons discussed above, OPEC can’t beat American shale oil production unless it is willing to accept $40 oil indefinitely. While some OPEC countries might still produce profitably at these levels, the damage to all OPEC economies will be immense, so, we can’t really see this as a realistic scenario in any way.

Falling Oil Prices Threaten Houston Building Boom

One-Sixth of U.S. Office Space Under Construction Is Here, but Need Is Waning

Construction giant Skanska AB is developing two office buildings in Houston’s “Energy Corridor.” The one that is nearly complete is mostly leased; the other building doesn’t yet have any tenants. Photo: Michael Stravato for Wall Street Journal. Article by Eliot Brown

HOUSTON—The jagged skyline of this oil-rich city is poised to be the latest victim of falling crude prices.

As the energy sector boomed in recent years, developers flocked to Houston, so much so that one-sixth of all the office space under construction in the entire U.S. is in the metropolitan area of the Texas city.

But now, the need for more offices is drying up, thanks to a drop in oil prices that has spun energy companies from an outlook of optimism and growth to anxiety and cutbacks. Oil prices have fallen by more than 50% since June.

Demand for office space is “going to basically stop,” said Walter Page, director of office research at property data firm CoStar Group Inc. “It hurts a lot more when you have a lot of construction.”

By the end of 2014, construction had started on about 80 buildings with about 18 million square feet of office space in the greater Houston area, according to CoStar. Many of the buildings were planned or started when oil was above $100 a barrel. On Tuesday, oil futures traded around $50. The amount under construction is equal to Kansas City, Mo.’s entire downtown office market and is 16% of all U.S. office development under way.

The rush of building has created thousands of jobs—not only at building sites, but also at window manufacturers, concrete companies and restaurants that feed the workers.

But just as the wave of office-space supply approaches, energy companies, including Halliburton Co. , Baker Hughes Inc., Weatherford International and BP PLC, have collectively announced that more than 23,000 jobs would be cut, with many of them expected to be in Houston.

Fewer workers, of course, means less need for office space. Employers have rushed to sublease space in recent months, with 5.2 million square feet of space on the market as of last month, up about 1 million square feet from mid-2014, according to brokerage firm Savills Studley. BP, for example, is trying to sublet 240,000 square feet of space at its campus in the Westlake neighborhood, which represents about 11% of BP’s space at the campus, according to CoStar. A BP spokesman said the company is “consolidating” its footprint.

Conditions could improve if oil prices rise. The International Energy Agency on Tuesday said oil companies’ recent cutbacks in production will likely slow the growth of U.S. oil output, which in turn would lead to a rebound in prices.

But the current building boom is Houston’s biggest since the 1980s, when an oil bust, coupled with a rash of empty skyscrapers, made Houston a national symbol of overbuilding. Then, armed with debt from a banking sector eager to lend, developers brought a tidal wave of building to Houston, in some years increasing the office stock by well over 10%. Vacancy rates shot up past 30% from single digits, property values plummeted and landlords defaulted on mortgages.

That contributed to a wave of failures for banks stuffed with commercial-property loans. More than 425 Texas institutions between 1980 and 1989 failed, including nine of the state’s 10 largest banks.

Few are predicting a shock near that scale this time. Even if oil prices stay low, the local economy is more diversified than in the 1980s with sectors such as health care and higher education comprising a larger share of the workforce. In addition, new construction represents about 6.3% all the area’s total office stock, and there is far less speculative construction done before a tenant is signed up.

“Everybody here in Houston is waiting to exhale,” said Michael Scheurich, chief executive of general contractor Arch-Con Corp., which currently is building two midsize office projects in the area. Mr. Scheurich said his company has grown to about 80 employees from fewer than 25 in 2011 amid the construction boom. Now he is hoping the local economy will have “a soft landing.”

Still, cranes abound throughout Houston, thanks to publicly traded real-estate companies, pension funds and other interests like Swedish construction giant Skanska AB, which are funding construction without as much reliance on debt as in the 1980s.

Everybody here in Houston is waiting to exhale.

—Michael Scheurich, chief executive at Arch-Con Corp.


Running west from the downtown along Interstate 10, numerous midsize construction projects aimed at the “upstream” companies focused on energy extraction are being built in the so-called Energy Corridor.

Analysts say this shows how the sector is highly susceptible to booms and busts because of the long lag time between when buildings are started and when they are delivered, compounded by the tendency of developers and financiers to start projects en masse, late in cycles.

Developers are often victims of “herding and group think,” said Rachel Weber, an urban planning professor at the University of Illinois at Chicago who is writing a book about office over development in Chicago. “There is a sense that if everybody is moving in the same direction and acting the same way, that you do better to mimic that kind of behavior.”

Many of those building are bracing for a sting in the short-term. It could be even more painful if oil prices stay low.

It “is going to be a soft year—it’s hard not to see that,” said Mike Mair, an executive vice president in charge of Houston-area development for Skanska. The company is putting the finishing touches on a new 12-story tower in the Energy Corridor that is 62% leased. Construction is under way on a nearly identical building next door for which it doesn’t have any tenants.

Still, Mr. Mair said he believes in the city’s economic strength in the mid- and long-term, giving him confidence to finish work on the second tower. “I’m not afraid of ’16 and ’17,” he said.

Of course, higher vacancy rates would mean lower rents, which is good for anyone signing a lease. Rents at top-quality buildings averaged $34.51 a square foot at the end of 2014, up about 15% from early 2012, according to CoStar. But brokers say landlord incentives have grown, and rents typically follow the direction of oil prices, with a lag of one or two quarters. Still, the rents are a bargain compared with other major cities such as New York, where top-quality offices rent for an average $59 a square foot.

The city of Houston, for one, could be a beneficiary of lower rents. The government had been planning to build a new police department headquarters at an estimated cost of between $750 million and $1 billion.

Late last month, the mayor’s office said it was examining the possibility of leasing the building that Exxon Mobil is leaving, which would cost far less than the city’s original plan.

Why The Energy Selloff Is So Dangerous To The US Economy

https://i0.wp.com/www.topnews.in/files/job_losses.jpg
By Pam and Russ Martens:

Summary:

  • The global economy is producing far to much supply of most things, chasing to-little-demand from cash strapped consumers.
  • Prices of other industrial commodities are in steep decline.
  • Billions of dollars in investment capital are “risk off”.
  • An untold number of jobs spread across America are at risk.

Television pundits and business writers who are relentlessly pounding the table on how cheaper home heating oil and gas at the pump is going to provide a consumer windfall and ramp up economic activity have a simplistic view of how things work.

Oil-related companies in the U.S. now account for between 35 to 40 percent of all capital spending. Announcements of sharp cutbacks in capital spending and job reductions by these companies create big ripples, forcing related companies to trim their own budgets, revenue assumptions, and payrolls accordingly.

The announcements coming out of the oil patch are picking up steam and it’s not a pretty picture. Last week Schlumberger said it would eliminate 9,000 jobs, approximately 7 percent of its workforce, and trim capital spending by about $1 billion. Yesterday, Baker Hughes, the oilfield services company, announced 7,000 in job cuts, roughly 11 percent of its workforce, and expects the cuts to all come in the first quarter. Baker Hughes also announced a 20 percent reduction in capital spending. This morning, the BBC is reporting that BHP Billiton will cut 40 percent of its U.S. shale operations, reducing its number of rigs from 26 to 16 by the end of June.

When Big Oil cuts capital spending, we’re not talking about millions of dollars or even hundreds of millions of dollars; we’re talking billions. Last month, ConocoPhillips announced it had set its capital budget for 2015 at $13.5 billion, a reduction of 20 percent. Smaller players are also announcing serious cutbacks. Yesterday Bonanza Creek Energy said it would cut its capital spending by 36 to 38 percent.

Other big industrial companies in the U.S. are also impacted by the sharp slump in oil, which has shaved almost 60 percent off the price of crude in just six months. As the oil majors scale back, it reduces the need for steel pipes. U.S. Steel has announced that it will lay off approximately 750 workers at two of its pipe plants.

On January 15, the Federal Reserve Bank of Kansas City released a dire survey of what’s ahead in its “Fourth Quarter Energy Survey.” The survey found: “The future capital spending index fell sharply, from 40 to -59, as contacts expected oil prices to keep falling. Access to credit also weakened compared to the third quarter and a year ago.  Credit availability was expected to tighten further in the first half of 2015.” About half of the survey respondents said they were planning to cut spending by more than 20 percent while about one quarter of respondents expect cuts of 10 to 20 percent.

The impact of all of this retrenchment is not going unnoticed by sophisticated stock investors, as reflected in the major U.S. stock indices. On days when there is a notable plunge in the price of crude, the markets are following in lockstep during intraday trading. Yes, the broader stock averages continued to set new highs during the early months of the crude oil price decline in 2014 but that was likely due to the happy talk coming out of the Fed. It is also useful to recall that the Dow Jones Industrial Average traveled from 12,000 to 13,000 between March and May 2008 before entering a plunge that would take it into the 6500 range by March 2009.

Both the Federal Open Market Committee (FOMC) and Fed Chair Janet Yellen have assessed the plunge in oil prices as not of long duration. The December 17, 2014 statement from the FOMC and Yellen in her press conference the same day, characterized the collapse in energy prices as “transitory.” The FOMC statement said: “The Committee expects inflation to rise gradually toward 2 percent as the labor market improves further and the transitory effects of lower energy prices and other factors dissipate.”

If oil were the only industrial commodity collapsing in price, the Fed’s view might be more credible. Iron ore slumped 47 percent in 2014; copper has slumped to prices last seen during the height of the financial crisis in 2009. Other industrial commodities are also in decline.

A slowdown in both U.S. and global economic activity is also consistent with global interest rates on sovereign debt hitting historic lows as deflation takes root in a growing number of our trading partners. Despite the persistent chatter from the Fed that it plans to hike rates at some point this year, the yield on the U.S. 10-year Treasury note, a closely watched indicator of future economic activity, has been falling instead of rising. The 10-year Treasury has moved from a yield of 3 percent in January of last year to a yield of 1.79 percent this morning.

All of these indicators point to a global economy with far too much supply and too little demand from cash-strapped consumers. These are conditions completely consistent with a report out this week from Oxfam, which found the following:

“In 2014, the richest 1% of people in the world owned 48% of global wealth, leaving just 52% to be shared between the other 99% of adults on the planet. Almost all of that 52% is owned by those included in the richest 20%, leaving just 5.5% for the remaining 80% of people in the world. If this trend continues of an increasing wealth share to the richest, the top 1% will have more wealth than the remaining 99% of people in just two years.”

Crude Oil (WTI) Trading Versus the Dow Jones Industrial Average, December 1, 2014 Through January 12, 2015

Oil Bust will hurt housing in Texas, Oklahoma and Louisiana

https://i0.wp.com/eaglefordtexas.com/wp-content/uploads/sites/9/2015/01/gas-prices-620x330.jpg

Source: MRT.com

The oil boom that lifted home prices in Texas, Oklahoma and Louisiana is coming to an end.

Crude oil prices have crashed since June, falling by more than 54 percent to less than $50 a barrel. That swift drop has started to cripple job growth in oil country, creating a slow wave that in the years ahead may devastate what has been a thriving real estate market, according to new analysis by the real estate firm Trulia.

“Oil prices won’t tank home prices immediately,” Trulia chief economist Jed Kolko explained. “Rather, falling oil prices in the second half of 2014 might not have their biggest impact on home prices until late 2015 or in 2016.”

History shows it takes time for home prices in oil country to change course.

Kolko looked at the 100 largest housing markets where the oil industry accounted for at least 2 percent of all jobs. Asking prices in those cities rose 10.5 percent over the past year, compared with an average of 7.7 percent around the country.

Prices climbed 13.4 percent in Houston, where 5.6 percent of all jobs are in oil-related industries. The city is headquarters to energy heavyweights such as Phillips 66, Halliburton and Marathon Oil. Asking prices surged 10.2 percent in Fort Worth and 10.1 percent in Tulsa, Oklahoma. In some smaller markets, oil is overwhelmingly dominant — responsible for more than 30 percent of the jobs in Midland for instance.

The closest parallel to the Texas housing market might have occurred in the mid-1980s, when CBS was airing the prime-time soap opera “Dallas” about a family of oil tycoons.

In the first half of 1986, oil prices plunged more than 50 percent, to about $12 a barrel, according to a report by the Brookings Institution, a Washington-based think tank.

Job losses mounted in late 1986 around Houston. The loss of salaries eventually caused home prices to fall in the second half of 1987.

That led Kolko to conclude that since 1980, it takes roughly two years for changes in oil prices to hit home prices.

Of course, there is positive news for people living outside oil country, Kolko notes.

Falling oil prices lead to cheaper gasoline costs that reduce family expenses, freeing up more cash to spend.

“In the Northeast and Midwest especially, home prices tend to rise after oil prices fall,” he writes in the analysis.

Bill Gross Sees No Rate Increase Until Late 2015 ‘If at All’

Bill Gross

for Bloomberg News

Bill Gross, the former manager of the world’s largest bond fund, said the Federal Reserve won’t raise interest rates until late this year “if at all” as falling oil prices and a stronger U.S. dollar limit the central bank’s room to increase borrowing costs.

While the Fed has concluded its three rounds of asset purchases, known as quantitative easing, interest rates in almost all developed economies will remain near zero as central banks in Europe and Japan embark on similar projects, Gross said today in an outlook published on the website of Janus Capital Group Inc. (JNS:US), where he runs the $1.2 billion Janus Global Unconstrained Bond Fund.

“With the U.S. dollar strengthening and oil prices declining, it is hard to see even the Fed raising short rates until late in 2015, if at all,” he said. “With much of the benefit from loose monetary policies already priced into the markets, a more conservative investment approach may be warranted by maintaining some cash balances. Be prepared for low returns in almost all asset categories.”

Benchmark U.S. oil prices fell below $50 a barrel for the first time in more than five years today, as surging supply signaled that the global glut that drove crude into a bear market will persist. Gross, the former chief investment officer of Pacific Investment Management Co. who left that firm in September to join Janus, said in a Dec. 12 Bloomberg Surveillance interview with Tom Keene that the Fed has to take lower oil prices “into consideration” and take more of a “dovish” stance.

Yields on the 10-year U.S. Treasury note fell to 2.05 percent today, the lowest level since May 2013. Economists predict the U.S. 10-year yield will rise to 3.06 percent by end of 2015, according to a Bloomberg News survey with the most recent forecasts given the heaviest weightings.

Why Cheap Oil May Be Here To Stay

https://i0.wp.com/m.wsj.net/video/20141212/121214table3/121214table3_1280x720.jpg
By
Kyle Spencer

Summary

  • Many investors are still skeptical that Saudi Arabia will hold firm on oil production.
  • Increased global consumption due to falling prices is unlikely to offset North American production.
  • US consumption is in a secular, structural decline due to increased efficiency and demographic changes. That’s unlikely to change any time soon.
  • The floor may not be where the Saudis think it is.

Investors are slowly waking up to the fact that Saudi Arabia is willing to take OPEC hostage to defend its market share, with Oil Minister Ali Al-Naimi declaring that –

In a situation like this, it is difficult, if not impossible, that the kingdom or OPEC would carry out any action that may result in a reduction of its share in market and an increase of others’ shares.

Alas, rather than embrace the cheap petroleum paradigm that has dominated most of the 20th century, many investors continue to cling to old shibboleths. Case in point: Brian Hicks, a portfolio manager at US Global Investors, recently noted that

The theme going into 2015 is mean reversion. Oil prices are below where they should be (emphasis mine), and hopefully they will start gravitating back to the equilibrium price of between $US80 and $US85 a barrel.

I emphasize the words “below where they should be” because the notion that oil (NYSEARCA:USO) prices belong somewhere – and it’s always higher, somehow – is the linchpin of the bullish thesis. But the question of why a high price regime should prevail over a low price regime is never satisfactorily explained.

Higher extraction costs? A sizable chunk of those costs are sunk costs that can simply be ignored in production decisions and lowering the effective breakeven price. A tighter focus on already drilled wells in areas with mature infrastructure could lower costs even further. Moreover, service sector costs fall as rigs are idled. Depleted reserves? Most resource-producing basins are experiencing an increasing yield over time despite the rapid depletion of individual wells. A lot of that is due to extraction efficiency, which is increasing at a phenomenal rate; in fact, one rig today brings on four times the amount of gas in the Barnett Shale than it did in 2006. Drill times in the Bakken are also falling, while new well production per rig is steadily rising since 2011.

Drill Times (Spud to Rig) 2004-2013

(SOURCE: ITG Research)

Technically oversold? Good luck catching that knife. Traders have been pounding the table on “oversold conditions” since $80. Proponents of the Oversold Hypothesis who like to point historical examples of oil’s extreme short-term volatility for validation are conveniently ignoring the vast number of counter-examples like this TIME Magazine headline from June, 1981, which almost reads as if it could have been written yesterday:

(Source: TIME Archives)

1981 is an intriguing date for another reason: It marked the first time in over a decade that Non-OPEC nations countries outproduced OPEC. Despite repeated cuts by OPEC, it took five years for capitulation to set in. Nor are lower prices guaranteed to lead to cuts. Indeed, when oil prices plummeted from $4/bbl to 35 cents in 1862, the Cleveland wildcatters didn’t idle their pumps; they pumped faster to pay the interest on their debt.

Don’t Iran and Venezuela require higher oil prices in order to balance their budgets and head off domestic upheaval? Please. The Saudis don’t care about Iran’s budget problems. Venezuela is a non-entity despite it’s immense reserves. In fact, Venezuela’s hell-in-a-handbasket status was one of the major reasons for Cuba’s recent defection to the US.

Asian stimulus? The only reason that Japanese consumers know that oil prices are lower is from Western news headlines. The share of a day’s wages to buy a single gallon of gas in Japan is 5.59% vs. 2.45% in the US. Nevertheless, the Japanese are riding high compared to the BRICS: In Brazil, it’s 17.62%; in Russia, 7.95%; in India it’s 114.92%; in China it’s 23.54%. Not the most fertile ground for a demand-side revolution; especially since oil is priced in dollars rather than yen, reals, rubles, or rupees.

What about the US? Won’t lower prices lead to higher consumption? Despite what you read about our “insatiable thirst” for oil, Americans don’t actually drink the stuff. Our machines do, and those machines are becoming more and more efficient due to CAFE standards and new transportation technologies, especially NGVs. Demographic changes are also leading a secular decline in consumption. Fig. 2 below highlights the steady march down for miles traveled per capita as the Baby Boomers retire to slower paced lives.

(Source: Citigroup, Census, CIRA)

The reality is that there’s little that an uptick in demand can do to offset oil’s continuing price collapse if the Saudis aren’t prepared to cut to the bone. The wildcatters certainly aren’t going to; on the contrary, they have every incentive (and no real alternative at this point) to pump like crazy to pay down debt and break OPEC’s back. Most doom and gloom prognostications for North American shale use full-cycle breakeven estimates like the ones presented in Figure 2.

Full-Cycle Breakeven Costs by Resource (Assuming Zero Efficiency Gains)

Unfortunately for the bulls, all-in sustaining cost (full-cycle capex) is a totally irrelevant metric for establishing a floor on commodity prices. Commodities prices are based on the marginal cost of production of the most prolific producers, not the full-cycle costs of marginal, high cost producers lopped in with the market leaders. As Seth Kleinman’s group at Citi has pointed out

…what counts at this stage is half-cycle costs, which are in the significantly lower band of $37 to $45 a barrel. This means that the floor is falling and may not be nearly as firm as the Saudi view assume(s).

The Real Reason Saudis Didn’t Cut Oil Production

https://i0.wp.com/www.touristmaker.com/images/saudi-arabia/medina-saudi-arabia.jpgby Martin Vleck

Summary

  • There have been plenty of explanations why OPEC didn’t cut production quotas.
  • Most of them make sense. But they fail to explain the whole strategic long-term picture.
  • There is a rarely mentioned strategic reason why – counter intuitively – oil prices falling and staying low in 2015 is in the best long-term interest of most oil exporters.
  • Moreover, the current status threatens OPEC’s influence over oil prices. OPEC will need to reform and include virtually all major oil producers in quota negotiations. Otherwise, OPEC will become irrelevant.
  • There is also an unexpected historical parallel for the current oil slump.

The conventional explanations for OPEC not cutting the production

The OPEC leaving production quotas unchanged has naturally been the top news last week and most investors have spent at least some time over the weekend to reflect on the implications of the move on their portfolios. There have been several theories and explanations as to why the OPEC didn’t cut. The obvious reasons stretch from the lack of agreement between OPEC members on whether to cut, by how, and most importantly, how much production each country sacrifices. Other explanations include the strategy of the dominant OPEC member, Saudi Arabia, to let the prices fall in order to squeeze out high-cost oil producers, such as Canadian oil sands and U.S. shale oil. The explanations or speculations also include some supposed secret deal between the U.S. and Saudi Arabia to damage Russia, Iran, ISIS and other “rogue” regimes or interest groups around the world. There are certainly many more theories for why OPEC didn’t cut.

Saudis are most probably thinking long term, so any explanation needs to include a combination of short term and long-term strategic goals. And the question also lingers whether OPEC still has enough power over oil prices.

Is this the real reason why Saudis didn’t cut?

There have been plenty of explanations why the OPEC didn’t cut production quotas. But there is one very long-term strategic reason why the price fall may be welcome by OPEC. This explanation has not been discussed too much, at least I haven’t seen it mentioned. Yet over the very long, very strategic time horizon, this would be the most probable explanation for letting the price of oil to fall now.

Who is the biggest competitor for the Saudis, or OPEC countries? Is it Canada? Is it the U.S.? Russia? Offshore Africa? The answer is no. Let me give you a hint. What is the biggest threat to not just Saudi Arabia, or OPEC, but to all oil producers? The answer is simple:

The biggest threat to all oil producers of the world is the high oil price. (No, that’s not a typo).

Alternative energy sources are the true competitor of all participants in the oil and gas industry.

High price of oil spurs faster development and implementation of alternative energy technologies. It is just a matter of time before solar, wind and other alternative sources of energy will become competitive or cheaper than oil and gas in many applications. In some places they already are. Sometimes even without any subsidies and including the benefits that oil and gas industry receives in the form of free negative externalities, such as the damage to the water and environment in general. To be fair, the negative environmental impact of the solar panel production and disposition is rarely mentioned.

Moreover, the cost of generating alternative energy has been falling and there is no reason why the cost should stop falling as the technological process keeps leaping ahead. It will probably take centuries before the world runs out of good sunny or windy spots (Sahara, Saudi desert – interestingly, Southern U.S. for solar and plenty of shores for wind are just some examples), so the costs to extract additional alternative energy megawatts will not rise. Plus, the sun rises every day, so the source of this energy is almost infinite and doesn’t deplete or deteriorate. It is like a fixed cost which will never rise over time.

On the other hand, the reserves of oil and gas are finite and the cost of extracting an additional barrel of oil has been rising – and will most probably keep rising – due to cheap sources of oil being always extracted first as well as due to generally rising overall costs associated with oil production.

Alternative energy space is rapidly developing

The recent technical development in the area of electricity storage (batteries, etc.) and alternative energy is surprisingly fast. Panasonic, Tesla and many others are investing in cheaper and more efficient large-scale batteries for economically viable electricity storage. The sales of electric cars, while still tiny, grow at rapid annual rates globally. Hydrogen fuel cell powered cars are emerging (Honda, Hyundai and Toyota already sold/leased some hydrogen models to the public, Audi has a fully functional prototype, many other brands are at similar stages but the technology is evolving rapidly). Ironically, hydrogen is usually produced from natural gas or methane. However, the efficiency is roughly 80%, which is extremely high, much higher than conventional combustion engines. Natural gas also has a much lower value for the oil and gas producers than the oil (lots of it is still just burnt on the spot). So the overall revenue for the oil and gas industry will be significantly lower from a hydrogen-powered car than from a conventional gasoline car. The same holds true for electric cars of course. The hydrogen fueling stations infrastructure is in its infancy, and only a true fan would buy/rent a hydrogen car now, but judging from the hydrogen car mileage and activities of car manufacturers, fuel cell infrastructure may be just 2-3 years behind the electric vehicle infrastructure. If some favorable legislation chips in, the gap could actually close very soon.

But cars are just one of many examples of how alternative energy sources threaten to replace significant volumes of oil in the future. On the other end of the spectrum are speculative developments, such as the fusion power which has been a fata-morgana for many decades. Even a working solution now would probably take five to ten years to make it commercially available. However, Lockheed Martin now claims to have made a breakthrough in fusion technology, offering no details though. So their claim may easily be just part of a creative PR campaign. (I am not suggesting they are lying, but I have to discount the information because there is no way to prove it)

Oil is here to stay for decades

Of course lots of oil will still need to be consumed, for many decades to come. But the market will be shrinking or stagnant in dollar terms. Actual physical volumes may moderately rise. The improvements in power consumption efficiencies are not exactly going to help the price and volume. On the other hand, growing global population and rising buying power of a global consumer is a major positive factor. All in all, I believe the current oil price weakness will continue only in the short run. The prices of WTI crude should stabilize in the medium term of several months or quarters at the level of $60-$80 per barrel.

http://allsortsofposts.files.wordpress.com/2013/02/riyadh-saudi-arabia.jpg

The only way many oil and gas exporting countries can survive in the long run

Oil and gas revenues are often a dominant source of income for the producing countries. To say many are very dependent on oil and gas revenues is a gross understatement. Preserving at least some oil and gas revenue is a matter of life and death for these countries. Therefore, the only way to survive the next few decades for most oil and gas producing countries is to cut the price of oil drastically NOW. That is their only chance to at least slow down the development and implementation of alternative energy sources into widespread usage, before it is too late from their point of view. If they fail, the price of oil will get stuck at much lower levels almost permanently.

OPEC will lose relevance if it doesn’t manage to reform and include virtually all major oil producers in quota negotiations

Higher-cost producers are planning to increase their oil/oil products exports to global markets. For example, Canada prepares to sign a free trade agreement with South Korea “in the coming months” which will cut crude oil and LNG duties by 3% and by 8% on refined products virtually immediately upon signing the deal, and this deal would serve as a “gateway to the wider Asia-Pacific region”). Similarly, the U.S. has been warming up to the idea of looser oil export policies and discussing a free trade deal with the EU. The fact that Saudi Arabia recently cut price for its Asian customers while raising them for the U.S. would give some more support the theory that the North American market and its producers are the prime target of its strategy. And this is probably the medium-term goal of the Saudis, according to my opinion.

The fact that oil prices topped in the middle of June, almost exactly on the date when the message about the planned free trade agreement with South Korea was officially released (June 16, 2014), is certainly an interesting coincidence. Or is it? Additionally, it is likely that the Saudis see the waning pricing power of OPEC due to flexible production from the U.S. shale oil fields which can be quickly boosted or cut in order to influence the total world production. This ability takes away the power over oil from the Saudis which have possessed this power to adjust production until recently. Therefore, the Saudis probably try to reign in all OPEC members and force them to respect the set quotas and share any potential cuts among all members, without the Saudis bearing most of the quota cut. But the falling oil price has an interesting historical parallel and implications.

Lower price of oil serves as an inverse oil price shock (the opposite of the 70’s)

Besides the conventional explanations for the current oil price slump, there is a surprising inverse historical parallel – the first and second oil price shock in the 70’s (1973 and 1979). Back then, prices of oil spiked rapidly and remained high and the time was generally characterized by booming population growth, young population, rapid inflation, high interest rates which subsequently caused a supply-side shock and a recession. But this period also spurred unprecedented innovation around the world with advances in robotics, miniaturization, semiconductors, and other fields which radically improved efficiencies which decreased energy and material intensity of production, especially in Japan.

The current situation is almost exactly the opposite. The price of oil is not rising but falling rapidly. Inflation is extremely low (parts of the world already experience deflation), aggregate demand is sluggish amid falling real income, almost non-existent population growth and aging population (in the U.S. and other developed countries). All this discourages investments in energy innovation and energy efficiency (low interest rates help a lot, though).

Existing alternative energy solutions are becoming more and more uneconomical compared to falling price of oil and gas, and the opportunity cost of using subsidized “green” energy is rising relative to cheaper oil. Existing subsidies suddenly may not be high enough to cover the costs to install further alternative energy capacities. Investments into further alternative energy R&D will be hard to obtain due to low potential ROI of the innovations if the future price of oil is expected to remain low. This will help conserve the status quo or at least slow down alternative energy advances. For the current oil producers – from all around the world, not only for Saudi Arabia or OPEC – lower prices are great news in the long run, even though they are painful now.

My oil price outlook

In the short run (several months and quarters), I am very bearish on oil prices because the oil producers have motivation to keep the price low until the highly leveraged, high-cost oil producers go out of business or are bought for pennies by their stronger competitors. Also, oil producing countries would need to maintain at least several quarters of weak oil to discourage long-term investments into alternative energy innovation, possibly until the current round of alternative energy R&D companies and some solar energy companies go out of business or consolidate.

However, over the medium to long term (years and decades), I am neutral to moderately bullish on oil prices as I believe the markets and industry will find a decent equilibrium around $60-80 per barrel. However, I don’t expect long-lasting spikes above $90-100 per barrel (barring the global security situation getting out of hand) because the flexible U.S. shale producers currently hold a permanent “call option” on the oil market. Every time the price spikes, they will quickly add more production, balancing the market. It is quite similar to the Bernanke put option, just working the opposite way and in oil.

Investment implication

I opened a long position in United States Oil ETF (NYSEARCA:USO) (selling covered calls to help mitigate contango issues) and Seadrill (NYSE:SDRL) late last week. I am also considering establishing a long position in British Petroleum (NYSE:BP). Furthermore, for long-term investors with high risk tolerance, I recommend smaller positions in more speculative and risky oil and gas services small-cap stocks which I analyzed in the past few weeks. These include Tidewater (NYSE:TDW), TGC Industries (NASDAQ:TGE), Dawson Geophysical (NASDAQ:DWSN), GulfMark Offshore (NYSE:GLF), Ion Geophysical (NYSE:IO) and CGG Industries (NYSE:CGG). I don’t hold any positions in any of these due to my preference for a highly concentrated portfolio but may decide to open long positions depending on future situation.

OPEC’s Prisoner’s Dilemma Unfolding

https://i0.wp.com/www.econlife.com/wp-content/uploads/imported/16422_8.26_000005651286XSmall.jpg
by Marc Chandler

Summary

  • OPEC faces internal and external challenges.
  • A large cut in output is unlikely.
  • Prices may have to fall by another $10 a barrel or so to begin having impact on production.

Prisoner’s Dilemma Unfolding. The oil producing cartel will be 55 years old next year. It is not clear, but it may be experiencing an existential crisis. It’s share of the world oil production has fallen with the rise of non-OPEC sources, like Russia, Norway, the UK, Canada, and significantly in recent years, increasingly the US.

In addition to the external threat, OPEC faces internal challenges, There is a divergence of perceptions of national interest by the political elite. Indeed, Middle East politics is arguably incomprehensible without appreciating the tension between Saudi Arabia and Iran.

Generally speaking, OPEC countries have tended to fall into one of two groups. The first has greater oil reserves relative to population. Saudi Arabia and Kuwait are the obvious examples. The second have relatively less oil and more people. Iran and Iraq are examples. This has often created conflicting strategies. The former wants to protect the value of their reserves by discouraging alternatives, which means relatively low prices. The latter want to maximize their current value.

OPEC, like all cartels, have governance or enforcement challenges. It long faced difficulty ensuring that the production agreements and quotas are respected. By OPEC’s own reckoning, there is often production in excess of the prevailing agreement. Last month, while oil prices were falling, OPEC says that it produced 30.25 mln barrels a day, which is 250k barrels a day over the production agreement. This may under-estimate OPEC’s production. Iran, for example, appears to be selling greater amounts of (condensate) oil than the sanctions allow.

The prisoner’s dilemma is both within OPEC and without. For the Saudis to continue to act as the swing producer, it would mean the surrender of revenue and market share to its rival Iran. Iran would very likely use the proceeds for purposes that would frustrate Saudi Arabia’s strategic interest. In a similar vein, a substantial cut in OPEC output, even if it could be agreed up, would benefit non-OPEC producers and only encourage the expansion of US shale development.

https://i0.wp.com/static2.businessinsider.com/image/54748126ecad04c815222db7/russia-doesnt-have-a-great-reputation-with-opec.jpg

Putin with Igor Sechin (right)

Contrary to the some conspiracy theorists who claim Saudi Arabia is doing US bidding by allowing the price of oil to fall to squeeze Russia, it has its own reasons not to want do Russia favors. Putin’s support for Assad in Syria and the Iranian regime puts Russia in opposition to Saudi Arabia. If the Saudis pick up the mantle again as the swing producer, Russia would a beneficiary. A recovery in oil prices would allow Putin to replenish his coffers, which would make its foreign assistance program even more challenging.

Moreover, and this is a key point, given OPEC’s reduced leverage in the oil market, a large cut in the Middle East production of mostly heavy sour crude might not be sufficient to support prices. It could lead to a loss of both revenue and market share. It could also lead to new widening of the spread between Brent, the international benchmark, and WTI, the US benchmark.

The significant drop in oil prices over the last several months has not deterred the expansion of US output. In the week ending November 7, the US produced nine mln barrels a day, which was the most in more than two decades. Output slipped in the week through November 14 by less than 60k barrels a day, but we would not read much into that.

Industry estimates suggest that more than three-quarters of the new light oil production next year is expected to be profitable between $50 and $69 a barrel. The press reports that rather than be deterred by the decline in prices, some companies, like Encana (NYSE:ECA) plan to dramatically increase the number of wells in the US Permian Basin (Texas) next year.

https://i0.wp.com/oilindependents.org/wp-content/uploads/2013/05/Permian-Basin-drilling-info-5-1-13.jpg

Reports do suggest that parts of nearly 20 fields are no longer profitable at $75 a barrel. There has been a very modest reduction of oil rigs. However, this has been largely offset by the rise in productivity of the existing wells. For example, in the North Dakota Bakken area, the output per well has risen to a record. In addition, industry reports suggest that the costs of shale and horizontal drilling is falling.

Although the price of oil has fallen below budget levels for many oil producing countries, the situation is not particularly urgent. Seasonally this is a high demand period. Most countries have ample reserves to cover the shortfall in the coming months. Around March, the seasonal factors shift and demand typically eases. That is when some key decisions will have to be made. It may not sound like a significant tell, but when the next OPEC meeting is scheduled may be indicative of a sense of urgency. A meeting in the February-March period may indicate higher anxiety than say a meeting in the middle of next year.

One study by Bloomberg found that only two OPEC quota cuts have been for less than one million barrels. A Bloomberg’s survey found that the respondents were evenly split between expecting a cut and not, few seem to be actually anticipating a significant cut. This suggests the scope for disappointment may be limited. That said, there is gap risk on the US oil futures contract come Friday, when they re-open after Thursday’s holiday.

As a consequence of lower oil prices, some oil producers may have to draw down their financial reserves to close the funding gap. Some will assume this will translate into liquidation of US Treasuries. However, it is not as easy as that. According to US Treasury data, in the first nine months of this year, OPEC increased its holdings of US Treasuries by $41 bln. In some period last year, it had sold about $17 bln of Treasuries. Could OPEC countries also be unwinding the diversification of reserves into euros, with yields so low and officials explicitly seeking devaluation (something not seen in the US since Robert Rubin first articulated a “strong dollar” policy almost two decades ago).

There may be political fallout from a continued decline in oil prices. An agreement between Baghdad and Kurds may be more difficult. Pressure in Libya and Nigeria is bound to increase, for example.

Back in 2009 when some observers began warning that higher food prices were the result of the extremely easy and unorthodox monetary policy. We argued that the shock was more on the supply side than the demand side and that commercial farmers would respond to the price signal by boosting output. Oil is similar but opposite. Oil prices will bottom after producers respond to the price signal by cutting production because they have to, not because they want to. Fear not greed will be the driver. It does not look like this can happen until Brent falls below $70 a barrel and WTI is nearer $60-$65.

https://i0.wp.com/www.mapsofworld.com/images/world-opec-members-countries-map.jpg

8 Major Reasons Why The Current Low Oil Price Is Not Here To Stay

https://i0.wp.com/media-cache-ak0.pinimg.com/736x/6b/92/8f/6b928fc7417ebd67ee2f64b26be053af.jpg

by Nathan’s Bulletin

Summary:

  • The slump in the oil price is primarily a result of extreme short positioning, a headline-driven anxiety and overblown fears about the global economy.
  • This is a temporary dip and the oil markets will recover significantly by H1 2015.
  • Now is the time to pick the gold nuggets out of the ashes and wait to see them shine again.
  • Nevertheless, the sky is not blue for several energy companies and the drop of the oil price will spell serious trouble for the heavily indebted oil producers.

Introduction:

It has been a very tough market out there over the last weeks. And the energy stocks have been hit the hardest over the last five months, given that most of them have returned back to their H2 2013 levels while many have dropped even lower down to their H1 2013 levels.

But one of my favorite quotes is Napoleon’s definition of a military genius: “The man who can do the average thing when all those around him are going crazy.” To me, you don’t have to be a genius to do well in investing. You just have to not go crazy when everyone else is.

In my view, this slump of the energy stocks is a deja-vu situation, that reminded me of the natural gas frenzy back in early 2014, when some fellow newsletter editors and opinion makers with appearances on the media (i.e. CNBC, Bloomberg) were calling for $8 and $10 per MMbtu, trapping many investors on the wrong side of the trade. In contrast, I wrote a heavily bearish article on natural gas in February 2014, when it was at $6.2/MMbtu, presenting twelve reasons why that sky high price was a temporary anomaly and would plunge very soon. I also put my money where my mouth was and bought both bearish ETFs (NYSEARCA:DGAZ) and (NYSEARCA:KOLD), as shown in the disclosure of that bearish article. Thanks to these ETFs, my profits from shorting the natural gas were quick and significant.

This slump of the energy stocks also reminded me of those analysts and investors who were calling for $120/bbl and $150/bbl in H1 2014. Even T. Boone Pickens, founder of BP Capital Management, told CNBC in June 2014 that if Iraq’s oil supply goes offline, crude prices could hit $150-$200 a barrel.

But people often go to the extremes because this is the human nature. But shrewd investors must exploit this inherent weakness of human nature to make easy money, because factory work has never been easy.

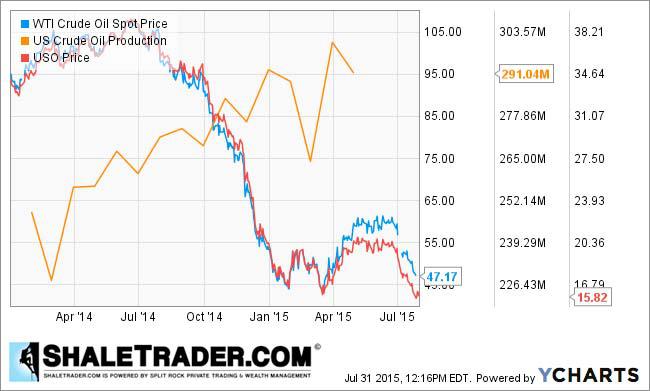
Let The Charts And The Facts Speak For Themselves

The chart for the bullish ETF (NYSEARCA:BNO) that tracks Brent is illustrated below:

And the charts for the bullish ETFs (NYSEARCA:USO), (NYSEARCA:DBO) and (NYSEARCA:OIL) that track WTI are below:

and below:

and below:

For the risky investors, there is the leveraged bullish ETF (NYSEARCA:UCO), as illustrated below:

It is clear that these ETFs have returned back to their early 2011 levels amid fears for oversupply and global economy worries. Nevertheless, the recent growth data from the major global economies do not look bad at all.

In China, things look really good. The Chinese economy grew 7.3% in Q3 2014, which is way far from a hard-landing scenario that some analysts had predicted, and more importantly the Chinese authorities seem to be ready to step in with major stimulus measures such as interest rate cuts, if needed. Let’s see some more details about the Chinese economy:

1) Exports rose 15.3% in September from a year earlier, beating a median forecast in a Reuters poll for a rise of 11.8% and quickening from August’s 9.4% rise.

2) Imports rose 7% in terms of value, compared with a Reuters estimate for a 2.7% fall.

3) Iron ore imports rebounded to the second highest this year and monthly crude oil imports rose to the second highest on record.

4) China posted a trade surplus of $31.0 billion in September, down from $49.8 billion in August.

Beyond the encouraging growth data coming from China (the second largest oil consumer worldwide), the US economy grew at a surprising 4.6% rate in Q2 2014, which is the fastest pace in more than two years.

Meanwhile, the Indian economy picked up steam and rebounded to a 5.7% rate in Q2 2014 from 4.6% in Q1, led by a sharp recovery in industrial growth and gradual improvement in services. And after overtaking Japan as the world’s third-biggest crude oil importer in 2013, India will also become the world’s largest oil importer by 2020, according to the US Energy Information Administration (EIA).

The weakness in Europe remains, but this is nothing new over the last years. And there is a good chance Europe will announce new economic policies to boost the economy over the next months. For instance and based on the latest news, the European Central Bank is considering buying corporate bonds, which is seen as helping banks free up more of their balance sheets for lending.

All in all, and considering the recent growth data from the three biggest oil consumers worldwide, I get the impression that the global economy is in a better shape than it was in early 2011. On top of that, EIA forecasts that WTI and Brent will average $94.58 and $101.67 respectively in 2015, and obviously I do not have any substantial reasons to disagree with this estimate.

The Reasons To Be Bullish On Oil Now

When it comes to investing, timing matters. In other words, a lucrative investment results from a great entry price. And based on the current price, I am bullish on oil for the following reasons:

1) Expiration of the oil contracts: They expired last Thursday and the shorts closed their bearish positions and locked their profits.

2) Restrictions on US oil exports: Over the past three years, the average price of WTI oil has been $13 per barrel cheaper than the international benchmark, Brent crude. That gives large consumers of oil such as refiners and chemical companies a big cost advantage over foreign rivals and has helped the U.S. become the world’s top exporter of refined oil products.

Given that the restrictions on US oil exports do not seem to be lifted anytime soon, the shale oil produced in the US will not be exported to impact the international supply/demand and lower Brent price in the short-to-medium term.

3) The weakening of the U.S. dollar: The U.S. dollar rose significantly against the Euro over the last months because of a potential interest rate hike.

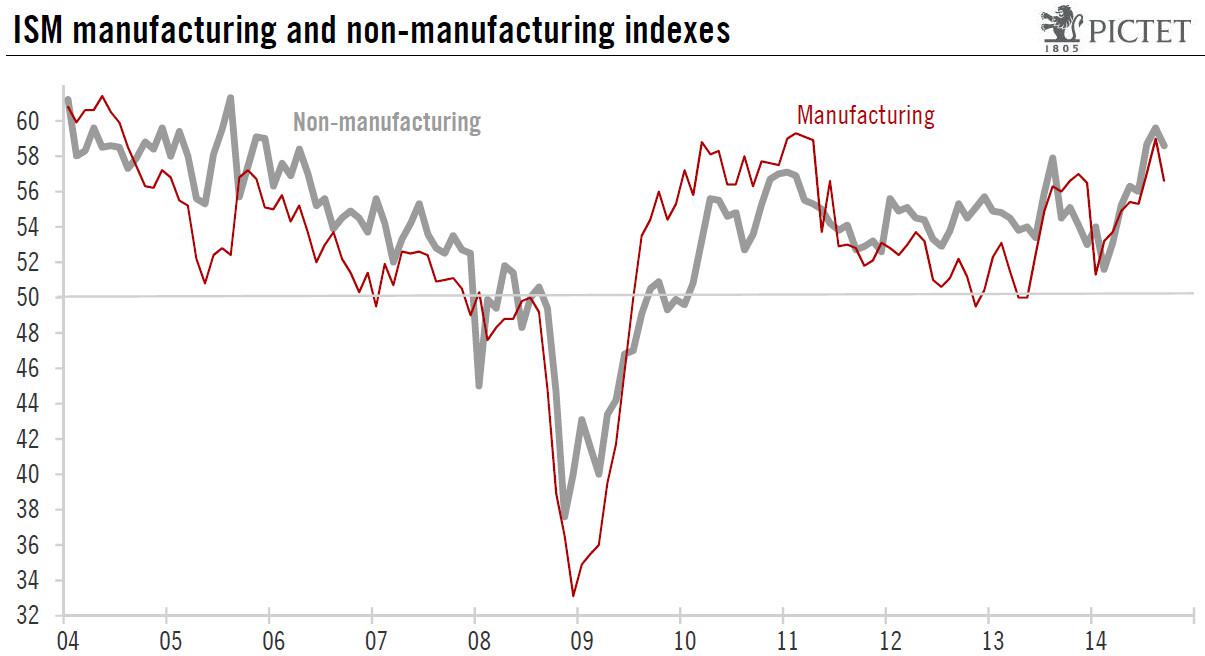
However, U.S. retail sales declined in September 2014 and prices paid by businesses also fell. Another report showed that both ISM indices weakened in September 2014, although the overall economic growth remained very strong in Q3 2014.

The ISM manufacturing survey showed that the reading fell back from 59.0 in August 2014 to 56.6 in September 2014. The composite non-manufacturing index dropped back as well, moving down from 59.6 in August 2014 to 58.6 in September 2014.

(click to enlarge)

Source: Pictet Bank website

These reports coupled with a weak growth in Europe and a potential slowdown in China could hurt U.S. exports, which could in turn put some pressure on the U.S. economy.

These are reasons for caution and will most likely deepen concerns at the U.S. Federal Reserve. A rate hike too soon could cause problems to the fragile U.S. economy which is gradually recovering. “If foreign growth is weaker than anticipated, the consequences for the U.S. economy could lead the Fed to remove accommodation more slowly than otherwise,” the U.S. central bank’s vice chairman, Stanley Fischer, said.

That being said, the US Federal Reserve will most likely defer to hike the interest rate planned to begin in H1 2015. A delay in expected interest rate hikes will soften the dollar over the next months, which will lift pressure off the oil price and will push Brent higher.

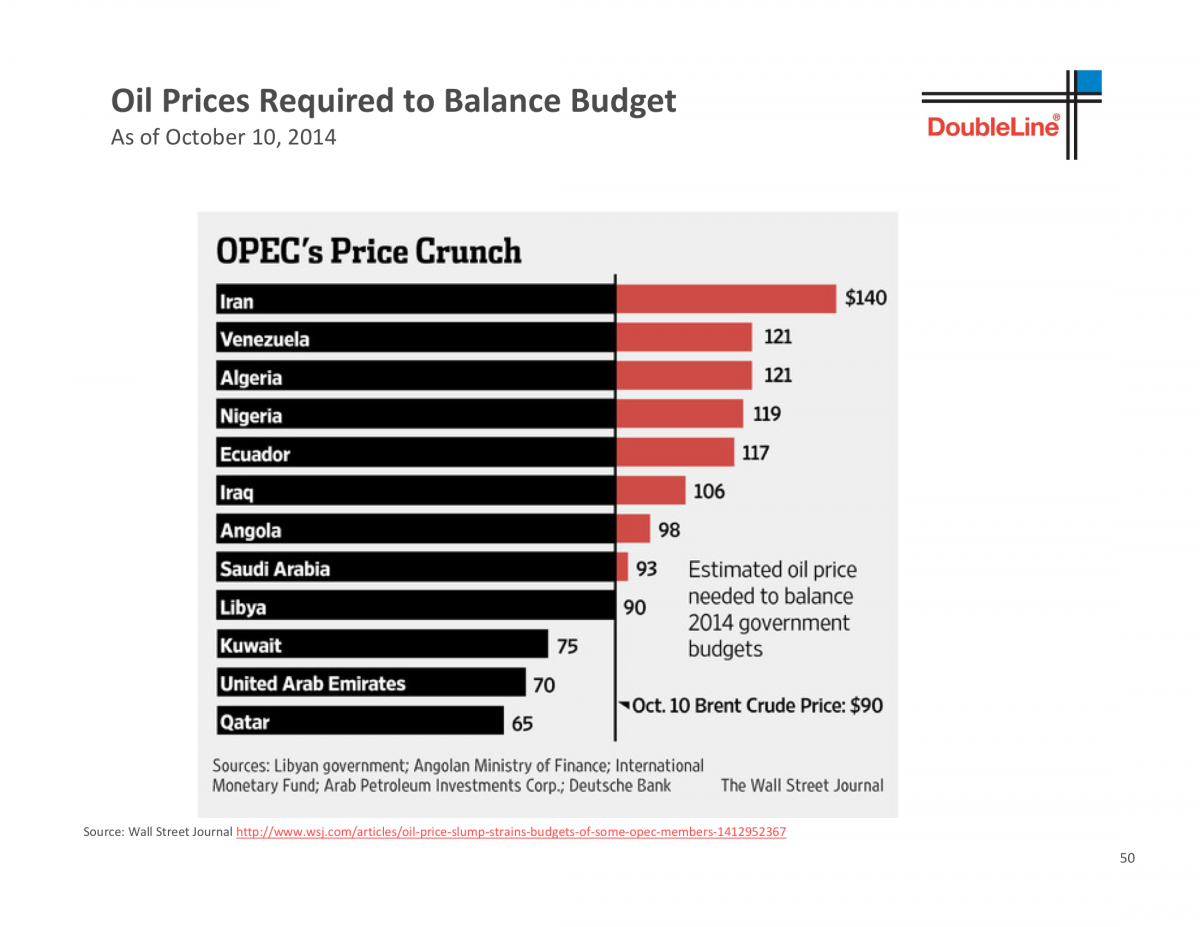
4) OPEC’s decision to cut supply in November 2014: Many OPEC members need the price of oil to rise significantly from the current levels to keep their house in fiscal order. If Brent remains at $85-$90, these countries will either be forced to borrow more to cover the shortfall in oil tax revenues or cut their promises to their citizens. However, tapping bond markets for financing is very expensive for the vast majority of the OPEC members, given their high geopolitical risk. As such, a cut on promises and social welfare programs is not out of the question, which will likely result in protests, social unrest and a new “Arab Spring-like” revolution in some of these countries.

This is why both Iran and Venezuela are calling for an urgent OPEC meeting, given that Venezuela needs a price of $121/bbl, according to Deutsche Bank, making it one of the highest break-even prices in OPEC. Venezuela is suffering rampant inflation which is currently around 50%, and the government currency controls have created a booming black currency market, leading to severe shortages in the shops.

Bahrain, Oman and Nigeria have not called for an urgent OPEC meeting yet, although they need between $100/bbl and $136/bbl to meet their budgeted levels. Qatar and UAE also belong to this group, although hydrocarbon revenues in Qatar and UAE account for close to 60% of the total revenues of the countries, while in Kuwait, the figure is close to 93%.

The Gulf producers such as the UAE, Qatar and Kuwait are more resilient than Venezuela or Iran to the drop of the oil price because they have amassed considerable foreign currency reserves, which means that they could run deficits for a few years, if necessary. However, other OPEC members such as Iran, Iraq and Nigeria, with greater domestic budgetary demands because of their large population sizes in relation to their oil revenues, have less room to maneuver to fund their budgets.

And now let’s see what is going on with Saudi Arabia. Saudi Arabia is too reliant on oil, with oil accounting for 80% of export revenue and 90% of the country’s budget revenue. Obviously, Saudi Arabia is not a well-diversified economy to withstand low Brent prices for many months, although the country’s existing sovereign wealth fund, SAMA Foreign Holdings, run by the country’s central bank, consisting mainly of oil surpluses, is the world’s third-largest, with assets totaling 737.6 billion US dollars.

This is why Prince Alwaleed bin Talal, billionaire investor and chairman of Kingdom Holding, said back in 2013: “It’s dangerous that our income is 92% dependent on oil revenue alone. If the price of oil decline was to decline to $78 a barrel there will be a gap in our budget and we will either have to borrow or tap our reserves. Saudi Arabia has SAR2.5 trillion in external reserves and unfortunately the return on this is 1 to 1.5%. We are still a nation that depends on the oil and this is wrong and dangerous. Saudi Arabia’s economic dependence on oil and lack of a diverse revenue stream makes the country vulnerable to oil shocks.”

And here are some additional key factors that the oil investors need to know about Saudi Arabia to place their bets accordingly:

a) Saudi Arabia’s most high-profile billionaire and foreign investor, Prince Alwaleed bin Talal, has launched an extraordinary attack on the country’s oil minister for allowing prices to fall. In a recent letter in Arabic addressed to ministers and posted on his website, Prince Alwaleed described the idea of the kingdom tolerating lower prices below $100 per barrel as potentially “catastrophic” for the economy of the desert kingdom. The letter is a significant attack on Saudi’s highly respected 79-year-old oil minister Ali bin Ibrahim Al-Naimi who has the most powerful voice within the OPEC.

b) Back in June 2014, Saudi Arabia was preparing to launch its first sovereign wealth fund to manage budget surpluses from a rise in crude prices estimated at hundreds of billions of dollars. The fund would be tasked with investing state reserves to “assure the kingdom’s financial stability,” Shura Council financial affairs committee Saad Mareq told Saudi daily Asharq Al-Awsat back then. The newspaper said the fund would start with capital representing 30% of budgetary surpluses accumulated over the years in the kingdom. The thing is that Saudi Arabia is not going to have any surpluses if Brent remains below $90/bbl for months.

c) Saudi Arabia took immediate action in late 2011 and early 2012, under the fear of contagion and the destabilisation of Gulf monarchies. Saudi Arabia funded those emergency measures, thanks to Brent which was much higher than $100/bbl back then. It would be difficult for Saudi Arabia to fund these billion dollar initiatives if Brent remained at $85-$90 for long.

d) Saudi Arabia and the US currently have a common enemy which is called ISIS. Moreover, the American presence in the kingdom’s oil production has been dominant for decades, given that U.S. petroleum engineers and geologists developed the kingdom’s oil industry throughout the 1940s, 1950s and 1960s.

From a political perspective, the U.S. has had a discreet military presence since 1950s and the two countries were close allies throughout the Cold War in order to prevent the communists from expanding to the Middle East. The two countries were also allies throughout the Iran-Iraq war and the Gulf War.

5) Geopolitical Risk: Right now, Brent price carries a zero risk premium. Nevertheless, the geopolitical risk in the major OPEC exporters (i.e. Nigeria, Algeria, Libya, South Sudan, Iraq, Iran) is highly volatile, and several things can change overnight, leading to an elevated level of geopolitical risk anytime.

For instance, the Levant has a new bogeyman. ISIS, the Islamic State of Iraq, emerged from the chaos of the Syrian civil war and has swept across Iraq, making huge territorial gains. Abu Bakr al-Baghdadi, the group’s figurehead, has claimed that its goal is to establish a Caliphate across the whole of the Levant and that Jordan is next in line.

At least 435 people have been killed in Iraq in car and suicide bombings since the beginning of the month, with an uptick in the number of these attacks since the beginning of September 2014, according to Iraq Body Count, a monitoring group tracking civilian deaths. Most of those attacks occurred in Baghdad and are the work of Islamic State militants. According to the latest news, ISIS fighters are now encamped on the outskirts of Baghdad, and appear to be able to target important installations with relative ease.

Furthermore, Libya is on the brink of a new civil war and finding a peaceful solution to the ongoing Libyan crisis will not be easy. According to the latest news, Sudan and Egypt agreed to coordinate efforts to achieve stability in Libya through supporting state institutions, primarily the military who is fighting against Islamic militants. It remains to be see how effective these actions will be.

On top of that, the social unrest in Nigeria is going on. Nigeria’s army and Boko Haram militants have engaged in a fierce gun battle in the north-eastern Borno state, reportedly leaving scores dead on either side. Several thousand people have been killed since Boko Haram launched its insurgency in 2009, seeking to create an Islamic state in the mainly Muslim north of Nigeria.

6) Seasonality And Production Disruptions: Given that winter is coming in the Northern Hemisphere, the global oil demand will most likely rise effective November 2014.

Also, U.S. refineries enter planned seasonal maintenance from September to October every year as the federal government requires different mixtures in the summer and winter to minimize environmental damage. They transition to winter-grade fuel from summer-grade fuels. U.S. crude oil refinery inputs averaged 15.2 million bopd during the week ending October 17. Input levels were 113,000 bopd less than the previous week’s average. Actually, the week ending October 17 was the eighth week in a row of declines in crude oil runs, and these rates were the lowest since March 2014. After all and given that the refineries demand less crude during this period of the year, the price of WTI remains depressed.

On top of that, the production disruptions primarily in the North Sea and the Gulf of Mexico are not out of the question during the winter months. Even Saudi Arabia currently faces production disruptions. For instance, production was halted just a few days ago for environmental reasons at the Saudi-Kuwait Khafji oilfield, which has output of 280,000 to 300,000 bopd.

7) Sentiment: To me, the recent sell off in BNO is overdone and mostly speculative. To me, the recent sell-off is primarily a result of a headline-fueled anxiety and bearish sentiment.

8) Jobs versus Russia: According to Olga Kryshtanovskaya, a sociologist studying the country’s elite at the Russian Academy of Sciences in Moscow, top Kremlin officials said after the annexation of Crimea that they expected the U.S. to artificially push oil prices down in collaboration with Saudi Arabia in order to damage Russia.

And Russia is stuck with being a resource-based economy and the cheap oil chokes the Russian economy, putting pressure on Vladimir Putin’s regime, which is overwhelmingly reliant on energy, with oil and gas accounting for 70% of its revenues. This is an indisputable fact.

The current oil price is less than the $104/bbl on average written into the 2014 Russian budget. As linked above, the Russian budget will fall into deficit next year if Brent is less than $104/bbl, according to the Russian investment bank Sberbank CIB. At $90/bbl, Russia will have a shortfall of 1.2% of gross domestic product. Against a backdrop of falling revenue, finance minister Anton Siluanov warned last week that the country’s ambitious plans to raise defense spending had become unaffordable.

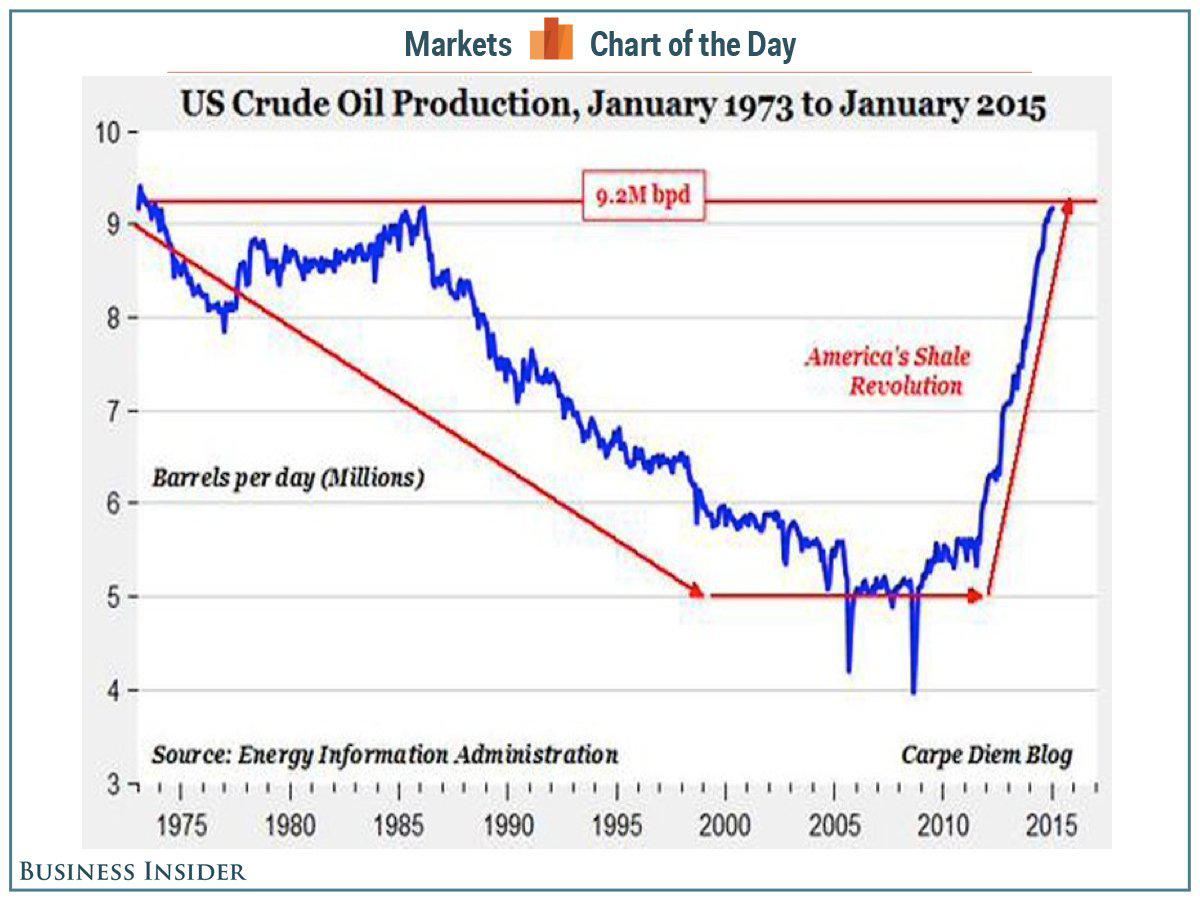
Meanwhile, a low oil price is also helping U.S. consumers in the short term. However, WTI has always been priced in relation to Brent, so the current low price of WTI is actually putting pressure on the US consumers in the midterm, given that the number one Job Creating industry in the US (shale oil) will collapse and many companies will lay off thousands of people over the next few months. The producers will cut back their growth plans significantly, and the explorers cannot fund the development of their discoveries. This is another indisputable fact too.

For instance, sliding global oil prices put projects under heavy pressure, executives at Chevron (NYSE:CVX) and Statoil (NYSE:STO) told an oil industry conference in Venezuela. Statoil Venezuela official Luisa Cipollitti said at the conference that mega-projects globally are under threat, and estimates that more than half the world’s biggest 163 oil projects require a $120 Brent price for crude.

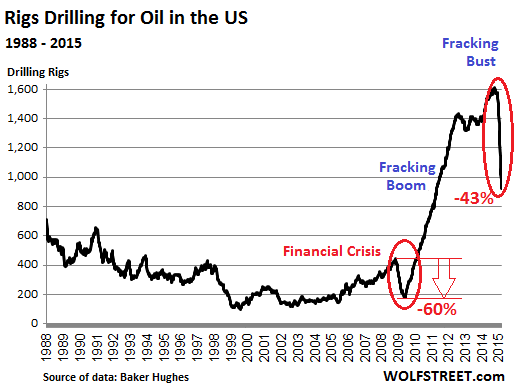
Actually, even before the recent fall of the oil price, the oil companies had been cutting back on significant spending, in a move towards capital discipline. And they had been making changes that improve the economies of shale, like drilling multiple wells from a single pad and drilling longer horizontal wells, because the “fracking party” was very expensive. Therefore, the drop of the oil price just made things much worse, because:

a) Shale Oil: Back in July 2014, Goldman Sachs estimated that U.S. shale producers needed $85/bbl to break even.

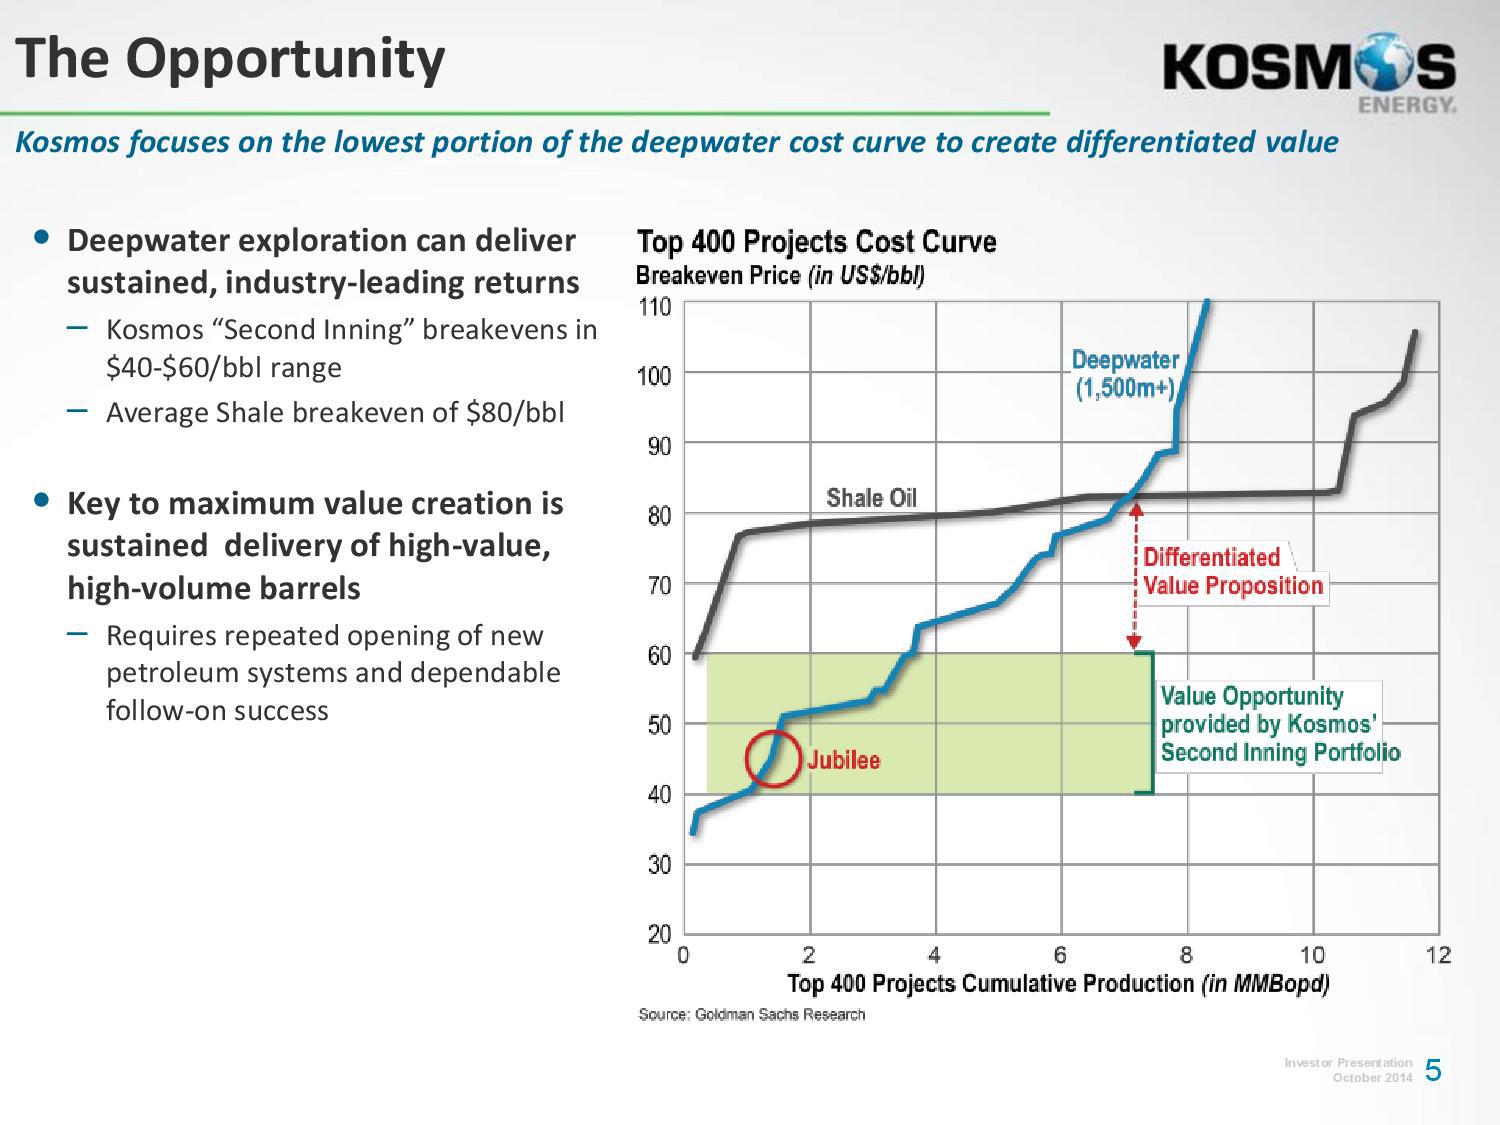
b) Offshore Oil Discoveries: Aside Petr’s (NYSE: PBR) pre-salt discoveries in Brazil, Kosmos Energy’s (NYSE: KOS) Jubilee oilfield in Ghana and Jonas Sverdrup oilfield in Norway, there have not been any oil discoveries offshore that move the needle over the last decade, while depleting North Sea fields have resulted in rising costs and falling production.

The pre-salt hype offshore Namibia and offshore Angola has faded after multiple dry or sub-commercial wells in the area, while several major players have failed to unlock new big oil resources in the Arctic Ocean. For instance, Shell abandoned its plans in the offshore Alaskan Arctic, and Statoil is preparing to drill a final exploration well in the Barents Sea this year after disappointing results in its efforts to unlock Arctic resources.

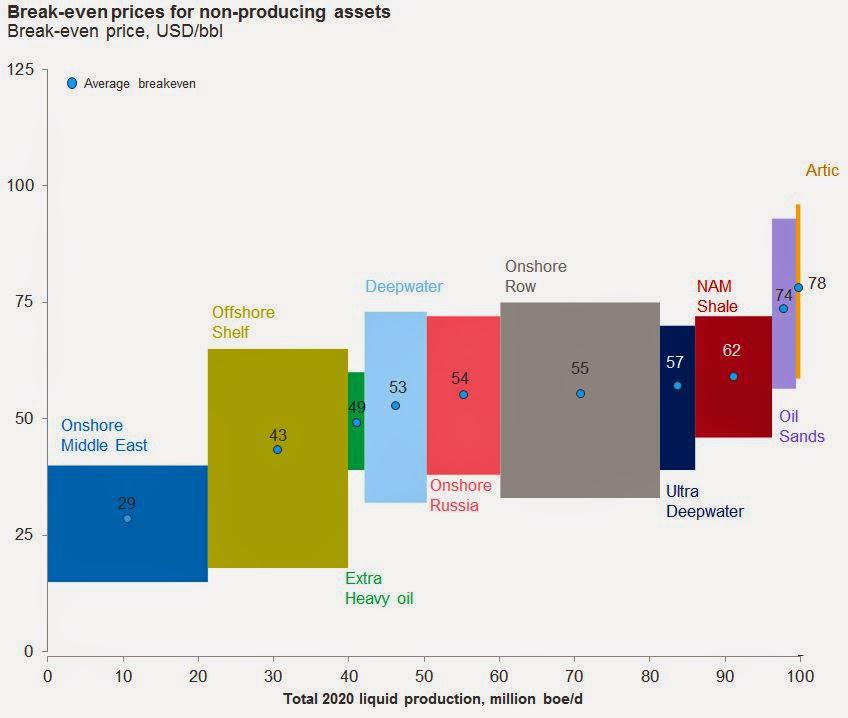
Meanwhile, the average breakeven cost for the Top 400 offshore projects currently is approximately $80/bbl (Brent), as illustrated below:

(click to enlarge)

Source: Kosmos Energy website

c) Oil sands: The Canadian oil sands have an average breakeven cost that ranges between $65/bbl (old projects) and $100/bbl (new projects).

In fact, the Canadian Energy Research Institute forecasts that new mined bitumen projects requires US$100 per barrel to breakeven, whereas new SAGD projects need US$85 per barrel. And only one in four new Canadian oil projects could be vulnerable if oil prices fall below US$80 per barrel for an extended period of time, according to the International Energy Agency.

“Given that the low-bearing fruit have already been developed, the next wave of oil sands project are coming from areas where geology might not be as uniform,” said Dinara Millington, senior vice president at the Canadian Energy Research Institute.

So it is not surprising that Suncor Energy (NYSE:SU) announced a billion-dollar cut for the rest of the year even though the company raised its oil price forecast. Also, Suncor took a $718-million charge related to a decision to shelve the Joslyn oilsands mine, which would have been operated by the Canadian unit of France’s Total (NYSE:TOT). The partners decided the project would not be economically feasible in today’s environment.

As linked above, others such as Athabasca Oil (OTCPK: ATHOF), PennWest Exploration (NYSE: PWE), Talisman Energy (NYSE: TLM) and Sunshine Oil Sands (OTC: SUNYF) are also cutting back due to a mix of internal corporate issues and project uncertainty. Cenovus Energy (NYSE:CVE) is also facing cost pressures at its Foster Creek oil sands facility.

And as linked above: “Oil sands are economically challenging in terms of returns,” said Jeff Lyons, a partner at Deloitte Canada. “Cost escalation is causing oil sands participants to rethink the economics of projects. That’s why you’re not seeing a lot of new capital flowing into oil sands.”

After all, helping the US consumer spend more on cute clothes today does not make any sense, when he does not have a job tomorrow. Helping the US consumer drive down the street and spend more at a fancy restaurant today does not make any sense, if he is unemployed tomorrow.

Moreover, Putin managed to avoid mass unemployment during the 2008 financial crisis, when the price of oil dropped further and faster than currently. If Russia faces an extended slump now, Putin’s handling of the last crisis could serve as a template.

In short, I believe that the U.S. will not let everything collapse that easily just because the Saudis woke up one day and do not want to pump less. I believe that the U.S. economy has more things to lose (i.e. jobs) than to win (i.e. hurt Russia or help the US consumer in the short term), in case the current low WTI price remains for months.

My Takeaway

I am not saying that an investor can take the plunge lightly, given that the weaker oil prices squeeze profitability. Also, I am not saying that Brent will return back to $110/bbl overnight. I am just saying that the slump of the oil price is primarily a result from extreme short positioning and overblown fears about the global economy.

To me, this is a temporary dip and I believe that oil markets will recover significantly by the first half of 2015. This is why, I bought BNO at an average price of $33.15 last Thursday, and I will add if BNO drops down to $30. My investment horizon is 6-8 months.

Nevertheless, all fingers are not the same. All energy companies are not the same either. The rising tide lifted many of the leveraged duds over the last two years. Some will regain quickly their lost ground, some will keep falling and some will cover only half of the lost ground.

I am saying this because the drop of the oil price will spell serious trouble for a lot of oil producers, many of whom are laden with debt. I do believe that too much credit has been extended too fast amid America’s shale boom, and a wave of bankruptcy that spreads across the oil patch will not surprise me. On the debt front, here is some indicative data according to Bloomberg:

1) Speculative-grade bond deals from energy companies have made up at least 16% of total junk issuance in the U.S. the past two years as the firms piled on debt to fund exploration projects. Typically the average since 2002 has been 11%.

2) Junk bonds issued by energy companies, which have made up a record 17% of the $294 billion of high-yield debt sold in the U.S. this year, have on average lost more than 4% of their market value since issuance.

3) Hercules Offshore’s (NASDAQ:HERO) $300 million of 6.75% notes due in 2022 plunged to 57 cents a few days ago after being issued at par, with the yield climbing to 17.2%.

4) In July 2014, Aubrey McClendon’s American Energy Partners LP tapped the market for unsecured debt to fund exploration projects in the Permian Basin. Moody’s Investors Service graded the bonds Caa1, which is a level seven steps below investment-grade and indicative of “very high credit risk.” The yield on the company’s $650 million of 7.125% notes maturing in November 2020 reached 11.4% a couple of days ago, as the price plunged to 81.5 cents on the dollar, according to Trace, the Financial Industry Regulatory Authority’s bond-price reporting system.

Due to this debt pile, I have been very bearish on several energy companies like Halcon Resources (NYSE:HK), Goodrich Petroleum (NYSE:GDP), Vantage Drilling (NYSEMKT: VTG), Midstates Petroleum (NYSE: MPO), SandRidge Energy (NYSE:SD), Quicksilver Resources (NYSE: KWK) and Magnum Hunter Resources (NYSE:MHR). All these companies have returned back to their H1 2013 levels or even lower, as shown at their charts.

But thanks also to this correction of the market, a shrewd investor can separate the wheat from the chaff and pick only the winners. The shrewd investor currently has the unique opportunity to back up the truck on the best energy stocks in town. This is the time to pick the gold nuggets out of the ashes and wait to see them shine again. On that front, I recommended Petroamerica Oil (OTCPK: PTAXF) which currently is the cheapest oil-weighted producer worldwide with a pristine balance sheet.

Last but not least, I am watching closely the situation in Russia. With economic growth slipping close to zero, Russia is reeling from sanctions by the U.S. and the European Union. The sanctions are having an across-the-board impact, resulting in a worsening investment climate, rising capital flight and a slide in the ruble which is at a record low. And things in Russia have deteriorated lately due to the slump of the oil price.

Obviously, this is the perfect storm and the current situation in Russia reminds me of the situation in Egypt back in 2013. Those investors who bought the bullish ETF (NYSEARCA: EGPT) at approximately $40 in late 2013, have been rewarded handsomely over the last twelve months because EGPT currently lies at $66. Therefore, I will be watching closely both the fluctuations of the oil price and several other moving parts that I am not going to disclose now, in order to find the best entry price for the Russian ETFs (NYSEARCA: RSX) and (NYSEARCA:RUSL) over the next months.

https://i0.wp.com/www.notevena.com/artwork/GICLEE/tn_TwoHeadsAreBetterThanOne.jpg

“Anti-Petrodollar” CEO Of French Energy Giant Total Dies In Freak Plane Crash In Moscow

View image on Twitter
by Tyler Durden

Three months ago, the CEO of Total, Christophe de Margerie, dared utter the phrase heard around the petrodollar world, “There is no reason to pay for oil in dollars,”  as we noted here. Today, RT reports the dreadful news that he was killed in a business jet crash at Vnukovo Airport in Moscow after the aircraft hit a snow-plough on take-off on 10/20/2014

The airport issued a statement confirming “a criminal investigation has been opened into the violation of safety regulations,” adding that along with 3 crew members on the plane, the snowplow driver was also killed.

As reported in Reuters on 7/5/2014:

Christophe de Margerie was responding to questions about calls by French policymakers to find ways at EU level to bolster the use of the euro in international business following a record U.S. fine for BNP.

”Doing without the (U.S.) dollar, that wouldn’t be realistic, but it would be good if the euro was used more,” he told reporters.

“There is no reason to pay for oil in dollars,” he said. He said the fact that oil prices are quoted in dollars per barrel did not mean that payments actually had to be made in that currency.

And of course, it had to happen in Russia!


Exclusive – Privately, Saudis tell oil market: get used to lower prices

By Ron Bousso and Joshua Schneyer

An employee pumps gas into a car at a gas station of the state oil company PDVSA in Caracas December 16, 2013. REUTERS/Carlos Garcia Rawlins

(Reuters) – Saudi Arabia is quietly telling oil market participants that Riyadh is comfortable with markedly lower oil prices for an extended period, a sharp shift in policy that may be aimed at slowing the expansion of rival producers including those in the U.S. shale patch.

Some OPEC members including Venezuela are clamoring for urgent production cuts to push global oil prices back up above $100 a barrel. But Saudi officials have telegraphed a different message in private meetings with oil market investors and analysts recently: the kingdom, OPEC’s largest producer, is ready to accept oil prices below $90 per barrel, and perhaps down to $80, for as long as a year or two, according to people who have been briefed on the recent conversations.

The discussions, some of which took place in New York over the past week, offer the clearest sign yet that the kingdom is setting aside its longstanding de facto strategy of holding prices at around $100 a barrel for Brent crude in favor of retaining market share in years to come.

The Saudis now appear to be betting that a period of lower prices – which could strain the finances of some members of the Organization of the Petroleum Exporting Countries – will be necessary to pave the way for higher revenue in the medium term, by curbing new investment and further increases in supply from places like the U.S. shale patch or ultra-deepwater, according to the sources, who declined to be identified due to the private nature of the discussions.

The conversations with Saudi officials did not offer any specific guidance on whether – or by how much – the kingdom might agree to cut output, a move many analysts are expecting in order to shore up a global market that is producing substantially more crude than it can consume. Saudi pumps around a third of OPEC’s oil, or some 9.7 million barrels a day.

Asked about coming Saudi output curbs, one Saudi official responded “What cuts?”, according to one of the sources.

Also uncertain is whether the Saudi briefings to oil market observers represent a new tack it is committed to, or a talking point meant to cajole other OPEC members to join Riyadh in eventually tightening the taps on supply.

One source not directly involved in the discussions said the kingdom does not necessarily want prices to slide further, but is unwilling to shoulder production cuts unilaterally and is prepared

OPEC ANGST

With most other members of the cartel unable or unwilling to reduce their own output, the group’s next meeting on Nov. 27 is set to be its most difficult in years. OPEC has agreed to cut production only a handful of times in the past decade, most recently in the aftermath of the 2008 financial crisis.

On Friday, Venezuela – one of the cartel’s most price-sensitive members – became the first to call openly for emergency action even earlier. Foreign Minister Rafael Ramirez said “it doesn’t suit anyone to have a price war, for the price to fall below $100 a barrel.”

On Sunday, Ali al-Omair, oil minister of Saudi Arabia’s core Gulf ally Kuwait, appeared to be the first to articulate the emerging view of OPEC’s most influential member, saying output cuts would do little to prop up prices in the face of rising production from Russia and the United States.

“I don’t think today there is a chance that (OPEC) countries would reduce their production,” state news agency KUNA quoted him as saying.

Omair said that prices should stop falling at around $76 to $77 a barrel, citing production costs in places like the United States, where a shale oil boom has unexpectedly reversed dwindling output and pushed production to its highest level since the 1980s.

Saudi oil officials have made no public comments on the deepening swoon in markets. Senior officials did not reply to questions from Reuters about recent briefings.

to tolerate lower prices until others in OPEC commit to action.

DON’T BE SURPRISED BELOW $90

Global benchmark Brent crude oil futures have fallen steadily for almost four months, dropping 23 percent from a June high of over $115 a barrel as fears of a Mideast supply disruption ebbed, U.S. shale production boomed and demand from Europe and China showed signs of flagging. [O/R]

Until recently, Gulf OPEC members have been saying that the price dip was a temporary phenomenon, betting on seasonal demand in winter to prop up prices. But a growing number of oil analysts now see the latest slide as something more than a seasonal downswing; some say it is the start of a pivotal shift to a prolonged period of relative abundance.

Rather than fight the decline in prices and cede market share in the face of growing competition, Saudi Arabia appears to be preparing traders for a sea change in prices.

The Saudis want the world to know that “nobody should be surprised” with oil under $90 a barrel, according to one of the people. Another source suggested that $80 a barrel may now be an acceptable floor for the kingdom, although several other analysts said that figure seemed too low. Brent has averaged around $103 since 2010, trading mostly between $100 and $120.

While the latest discussions are the bluntest efforts yet to signal the shift in Saudi strategy, early signs had already begun sending shivers through the oil market. In early October the kingdom cut its official selling prices more sharply than expected in a bid to maintain customers in Asia, widely seen as the opening shots in a price war for Asian customers.

“Riyadh’s political floor on oil prices is weakening,” Robert McNally, a White House adviser to former President George W. Bush and president of the Rapidan Group energy consultancy, wrote in a note to clients following a trip to Saudi last month.

McNally said he is not aware of any specific Saudi price or timing strategy, but told Reuters that Saudi Arabia “will accept a price decline necessary to sweat whatever supply cuts are needed to balance the market out of the U.S. shale oil sector.”

As that message began to dawn last week, the price rout quickened, with Brent lurching to its lowest level since 2010.

“Until about three days ago the absolute and total consensus in the market was the Saudis would cut,” said McNally. That is no longer a foregone conclusion, he said. “The market suddenly realizes it is operating without a net.”