(Autumn Spreademann) Attempting to further sequester Russia’s economy U.S. President Joe Biden announced on March 8 the ban of all Russian oil imports as part of a multi-faceted response to the eastern nation’s military invasion of Ukraine.
While strict sanctions on Russian exports remain a cornerstone of Western efforts to stop President Vladimir Putin’s attack, it comes with a hefty price tag already felt by global consumers.
Traders say that Cushing stockpiles might fall to critical levels within weeks; the last time that happened was in 2014.
(Devika Krishna Kumar) Stockpiles at the biggest U.S. crude depot are quickly approaching critically low levels. The last time that happened, crude cost more than $100 a barrel.
Now that the global energy crisis has slammed China’s economy, leading to the first contractionary PMI since March 2020 as a result of widespread shutdowns of factory and manufacturing, not to mention hundreds of millions of Chinese residents suffering from periodic blackouts, Bloomberg reports that China’s central government officials “ordered the country’s top state-owned energy companies to secure supplies for this winter at all costs.”
(John Hayward) Prince Abdulaziz bin Salman, Saudi Arabia’s energy minister, crowed at Thursday’s OPEC meeting that the American energy revolution is over, OPEC would soon regain control over oil markets, and “Drill, baby, drill is gone forever.”
“Drill, baby, drill” began as a Republican campaign slogan in 2008, popularized by vice-presidential candidate Sarah Palin, although it was coined by then-Lt. Governor of Maryland Michael Steele. The basic idea was that aggressively developing America’s energy resources would bring economic prosperity and make the United States less dependent on foreign oil.
Back in the late fall of 2014, when Saudi Arabia broke up OPEC for the first time and unleashed a torrent of crude oil on the world despite the protests of its fellow cartel members, oil prices crashed as a result of what then seemed to be a “calculated” move by Riyadh which hoped to put US shale out of business amid a flawed gamble betting that shale breakeven prices were around $60-80. They, however, turned out to be much lower, which coupled with Saudi misreading of the willingness of junk bond investors to keep funding US shale producers, meant that despite a 3 years stretch of low oil prices, US shale emerged stronger than ever before, with the US eventually eclipsing both Saudi Arabia and Russia as the world’s biggest crude oil producer.
Fast forward to March 2020, when Saudi Arabia doubled down in its attempt to crush shale, only to avoid angering long-time ally Donald Trump, the Crown Prince pretended that the latest flood of oil was an oil price war aimed at Moscow not Midland. And this time, unlike 2014, with the benefit of the global economic shutdown resulting from the coronavirus pandemic, the Saudis may have finally lucked out in the ongoing crusade against US oil, because as Bloomberg writes with “negative oil prices, ships dawdling at sea with unwanted cargoes, and traders getting creative about where to stash oil”, the next chapter in the oil crisis is now inevitable: “great swathes of the petroleum industry are about to start shutting down.”
As the recent OPEC summit so vividly demonstrated, the marginal price of oil is no longer determined by supply or cuts thereof (such as the recently announced agreement by OPEC+ for a 9.7mmb/d output cut), but rather by demand, or the lack thereof, which according to some estimate is as much as 36mmb/d lower, or roughly a third of the global oil market every day, as billions of people are stuck at home instead of driving, while major corporations mothball production in a world where major economies have ground to a halt.
The economic impact of the coronavirus has ripped through the oil industry in dramatic phases, Bloomberg’s Javier Blas writes. First it destroyed demand as lock downs shut factories and kept drivers at home. Then storage started filling up and traders resorted to ocean-going tankers to store crude in the hope of better prices ahead.
Now shipping prices are surging to stratospheric levels as the industry runs out of tankers, a sign of just how distorted the market has become.
Ironically, in its latest attempt to kill off shale, Saudi Arabia may have gone a step too far, as “the specter of production shut-downs – and the impact they will have on jobs, companies, their banks, and local economies – was one of the reasons that spurred world leaders to join forces to cut production in an orderly way. But as the scale of the crisis dwarfed their efforts, failing to stop prices diving below zero last week, shut-downs are now a reality. It’s the worst-case scenario for producers and refiners.“
In short, the entire oil production industry is shutting down, not because it wants to – of course – but because it has no choice. According to Goldman, in as little as three weeks there will be literally no place left on earth to store oil, and unless oil producers want to pay “buyers” to hold the oil as happened on that historic date of April 20, they have no choice but to shut in output.
Which brings us back to why in 2020 Riyadh has succeeded where it failed in 2014: as Bloomberg writes “in theory, the first oil output cuts should have come from the OPEC+ alliance, which earlier this month agreed to reduce production from May 1. Yet after the catastrophic price plunge on Monday, when West Texas Intermediate fell to -$40 a barrel, it’s the U.S. shale patch that is leading”
The best indicator of how the shale industry is reacting is the sudden collapse in the number of oil rigs in operation, which last week fell to a four-year low: “Before the coronavirus crisis hit, oil companies ran about 650 rigs in the US. By Friday, more than 40% of them had stopped working, with only 378 left.”
And while there is a delay between total US oil production and the rig count, it is now obvious that US production is set to collapse next:
“Monday really focused people’s minds that production needs to slow down,” said the co-head of oil trading at commodity merchant Trafigura. “It’s the smack in the face the market needed to realize this is serious.” Incidentally, Trafigura, one of the largest exporters of US crude from the U.S. Gulf of Mexico, believes that output in Texas, New Mexico, North Dakota and other states will now fall much faster than expected as companies react to negative prices…
Until prices collapsed on Monday, the consensus was that output would drop by about 1.5MM barrels a day by December. Now market watchers see that loss by late June. “The severity of the price pressure is likely to act as a catalyst for the immediate turn down in activity and shut-ins,” said Roger Diwan, oil analyst at consultant IHS Markit Ltd.
As detailed last week, this price shock has been especially acute in the physical market where producers of crude streams such as South Texas Sour and Eastern Kansas Common had to pay more than $50 a barrel to offload their output last week.
And so the US industry is finally shutting down as ConocoPhillips and shale producer Continental Resources have all announced plans to shut in output. Regulators in Oklahoma voted to allow oil drillers to shut wells without losing leases; New Mexico made a similar decision. Even North Dakota, which for years was synonymous with the U.S. shale revolution, is witnessing a rapid retrenchment, as Bloomberg notes that “oil producers have already closed more than 6,000 wells, curtailing about 405,000 barrels a day in production, or about 30% of the state’s total.”
However, it won’t be just the US: output cuts can be seen from Chad, a poor and landlocked country in Africa, to Vietnam and Brazil, producers are now either reducing output or making plans to do so. “I wouldn’t want to get sensational about it but yes, clearly there must be a risk of shut-ins,” Mitch Flegg, the head of North Sea oil company Serica Energy, said in an interview. “In certain parts of the world it is a real and present risk.”
In emergency board meetings last week, oil companies small and large discussed an outlook that’s the most somber any oil executive has ever witnessed. For the small firms, the next few weeks will be all about staying afloat. But even for the bigger ones, like Exxon Mobil Corp. and BP Plc, it’s a challenge. Big Oil will offer an insight into the crisis when companies report earnings this week.
Then on Friday, May 1, Saudi Arabia, Russia and the rest of OPEC+ will join the output cuts, slashing their output by 23%, or 9.7 million barrels a day. Saudi Aramco, the state-owned company has already cut production, and Russian oil companies have announced exports of their flagship Urals crude would drop in May to a 10-year low.
And yet, as warned here repeatedly, it may still not be enough, as every week, another 50 million barrels of crude are going into storage, enough to fuel Germany, France, Italy, Spain, and the U.K. combined, with estimates that the world will run out of land-based storage some time in late May or early June. Meanwhile, what’s not stored onshore, is stashed in tankers. As Bloomberg’s Blas points out, the U.S. Coast Guard on Friday said there were so many tankers at anchor off California that it was keeping an eye on the situation.
VIDEO: US Coast Guard says it’s keeping an eye on 27 oil tankers anchored off the coast of Southern California. Another great example of floating storage build-up as demand for oil and refined products plunge | #OOTT#Contango video via @USCGLosAngeles pic.twitter.com/B7pjWIsdnp
But if the two dozen or so tankers piled up off the coast of California is bad…
… and those next to Galveston, TX is worse…
… what is going on in that tanker parking lot off of Singapore is absolutely insane.
There is some good news: oil traders say after plunging by a third, US oil consumption has probably hit a bottom, and will start a very gentle recovery, although that also depends on how fast the US economy can reopen from the coronavirus coma.
But before even a modest recovery takes hold, the great shutdown will spread through oil refining too. Over the past week, Marathon Petroleum, one of the biggest U.S. refiners, announced it would stop production at a plant near San Francisco. Royal Dutch Shell has idled several units in three U.S. refineries in Alabama and Louisiana. And across Europe and Asia, many refineries are running at half rate. U.S. oil refiners processed just 12.45 million barrels a day on the week to April 17, the lowest amount in at least 30 years, except for hurricane-related closures.
The closures have already sent thousands packing: the oil and gas industry shed nearly 51,000 drilling and refining jobs in March, a 9% reduction that will only get worse in April. March’s job losses rise by 15,000 when ancillary jobs such as construction, manufacturing of drilling equipment and shipping are included, according to BW Research Partnership, a research consultancy, which analyzed Department of Labor data combined with the firm’s own survey data of about 30,000 energy companies.
“We’re looking at anywhere between five and seven years of job growth wiped out in a month,” Philip Jordan, the company’s vice president said in an interview. “What makes it sort of scary is this really is just the beginning. April is not looking good for oil and gas.”
And so, as the oil industry shuts down – at least for a few weeks (or perhaps months) – more refinery shutdowns are coming, oil traders and consultants said, particularly in the U.S. where lockdowns started later than in Europe and demand is still contracting. Steve Sawyer, director of refining at Facts Global Energy, said that global refineries could halt as much as 25% of total capacity in May.
“No one is going to be able to dodge this bullet.”
A historic crash in crude prices is driving U.S. shale into full-on retreat with operators halting new drilling and shutting in old wells, moves that could cut output by 20% for the world’s biggest producer of oil and leave thousands of workers unemployed.
For shale companies, the price of West Texas Intermediate crude went from hunker-down-and-ride-it-out mode to crisis mode in just a few days, with many now unsure whether there will even be a market for their oil. Some 1.75 million barrels a day is at immediate risk of shutting down while the number of new wells being brought online is forecast to plunge almost 90% by the end of the year, according to IHS Markit Ltd.
In short, it’s a swift and brutal end to the shale revolution, which only last year had President Donald Trump proclaiming “American Energy Dominance.”
West Texas Intermediate crude prices turned negative for the first time in history on Monday, meaning at one point sellers had to pay buyers to take it away. Then, the financial squeeze on the May contract spilled over to June and into the wider market, with prices now trading around $14 a barrel, well below the daily pumping cost in large swaths of America’s oil industry.
Even at $15, “everything back in the field, except the newest and most productive wells, is losing money on a cash-cost basis,” said Raoul LeBlanc, a Houston-based analyst at IHS Markit. “At this price you’ll start shutting in large amounts of production.”
It’s a bloodbath whichever way you look.
Operators are switching off wells, retiring one in three drill rigs, abandoning fracking, laying off 51,000 workers, slashing salaries and even going bankrupt just six weeks after the latest price plunge began. Now, with the coronavirus pandemic destroying demand, storage is just weeks away from filling up, a further factor choking back output.
Publicly-traded companies have axed more than $31 billion from drilling budgets, while distressed debt in the U.S. energy sector has jumped to $190 billion, up more than $11 billion in less than a week. Oil companies made up five of the top 10 issuers with the most distressed debt as of Tuesday. Evercore ISI reckons 5 million barrels a day, or around 40% of U.S. production, could be temporarily shut in by the end of June to help balance the market.
The potential for next to no revenue in the second and third quarters this year may mean that large U.S. oil explorers burn through $7 billion in cash, according Evercore. By the end of it all, as many as 30% of publicly traded shale explorers could be forced to exit the market one way or another, the Evercore analysts said.
For Gene Ames, an 85-year-old, fourth-generation oilman who was born in the East Texas oil rush during the Great Depression, when crude traded for 5 cents a barrel, it’s the worst crash he’s ever seen. “I’ve been through about six major busts and so far this is going to be the worst,” he said by telephone. “It’s the most intense, quickest and deepest collapse.”
The Saudi-Russia price war, which accelerated the price drop due to Covid-19, “has succeeded in hammering the last nail in the coffin of U.S. shale production and posed a major threat to the national security of the United States,” he said. He’s pushing the Texas Railroad Commission to impose mandatory production cuts. The commission deferred a decision on whether to do so on Tuesday.
Houston Economy
In Houston, America’s oil capital, the pain is set to reverberate across the broader economy.
The industry is far and away the “best paid” in the city, said Patrick Jankowski, an economist at the Greater Houston Partnership. “Someone who works on the blue-collar side can make $100,000 a year, so when those jobs go away it has a disproportionate impact on the economy.”
Now, the region needs to find its next growth engine. “Energy will still be important, but it’s going to be less important than before,” Jankowski said.
There’s little chance of relief any time soon. Oil traders are on a desperate questto find somewhere — anywhere, really — to store their crude as tanks from Texas to Siberia fill to capacity. Virtually all commercial onshore storage in the U.S. has been booked since the end of February, according to people with knowledge of the matter.
It will likely take months to clear the oversupply, with no clear end in sight for the pandemic’s effects.
“We’re all having to anticipate revenues that are significantly cut or just completely cut for an unforeseen period of time,” said Kyle Armstrong, president of Armstrong Energy Inc., a closely held producer on the New Mexico side of the Permian Basin. “Whether it’s negative $37 or $5, to me it doesn’t matter,” he added. “It’s effectively zero because I can’t operate wells productively at those prices.”
The first taps to be turned off will likely be the 1.75 million barrels a day from older, conventional U.S. wells that produce just a few dozen barrels a day each, according to IHS Markit’s LeBlanc. Producers will seek to ride out the storm with more productive wells providing some cash flow, even if made at a loss, in part due to the costs associated with shut-ins.
“The U.S. oil market actually gets worse fundamentally over the next month,” said Paul Sankey, a veteran oil analyst, in a note to clients. Producers have “nowhere to go with the inexorable production that takes weeks and months to reduce to zero.”
But the bigger problem for the shale industry is the lack of new wells being drilled. Shale wells decline by more than 60% in the first year, meaning new ones are needed to replaced production from old ones.
With few new wells coming online, IHS sees U.S. oil production declining to 10.1 million barrels a day by the end of the year, from 12.8 million barrels a day at the start. That will likely drop further to somewhere around 8.5 million barrels a day in 2021 to 2022, according to Noah Barrett, a Denver-based energy analyst at Janus Henderson.
“A good portion of production, particularly areas of the Bakken and Oklahoma, will go away completely,” said Barrett, whose employer manages $356 billion. “Fresh capital will be needed to grow off that lower base. But there’s zero appetite for that in the foreseeable future.”
By now even the 165,727 “professional investors” who are long the USO ETF on the free, glitch-prone platform Robin Hood, are aware that the problem facing global oil production is that there is simply no storage where to put all the physical oil (as ZeroHedge warned in late March).
And if even the army of Robinhood-ers now know how impossible it is to find space for physical oil on the continental US, then Saudi Arabia – which sparked the current crude crisis and which will not stop until shale is completely crushed – is certainly aware.
Which is why with the US unable to store its own output, some 50 million barrels of Saudi oil are on their way to the United States and due to arrive in the coming weeks, piling even more pressure on markets already struggling to absorb a glut of stocks, Reuters and Marine Traffic reported.
Source: Marine Traffic
Shipping data showed the more than 20 supertankers – each capable of carrying 2 million barrels of oil – were sailing to key U.S. terminals, especially in the U.S. Gulf. Three separate tankers, also chartered by Saudi Arabia, were currently anchored outside U.S. Gulf ports.
According to Reuters sources, the kingdom had tried to seek storage options for the cargoes from tanker owners when the ships were chartered last month, but many pushed back given booming rates and not wanting tied up vessels.
The result was an outpouring of anger from the increasingly political hedge fund manager, Kyle Bass, who tweeted earlier that “the Saudis and Russians have declared war against US shale energy companies. It seems they weren’t happy with American energy independence. Storage full..largest glut in history..Saudis are sending us a 50 million barrel oil bomb. How negative will June crude go?”
The Saudis and Russians have declared war against US shale energy companies. It seems they weren't happy with American energy independence. Storage full..largest glut in history..Saudis are sending us a 50 million barrel oil bomb. How negative will June crude go? #Oil#USOILhttps://t.co/oiNfkI2pfM
The anger at the incoming Saudi “bomb” has spread all the way to Washington, and U.S. officials said in recent days that Washington is considering blocking Saudi shipments of crude oil, or putting tariffs on those shipments, adding to difficulties for the cargoes now on the water.
U.S. senator Ted Cruz said on Twitter on Tuesday: “My message to the Saudis: TURN THE TANKERS THE HELL AROUND.”
20 tankers—filled w/ 40mm barrels of Saudi oil—are headed to the US. This is SEVEN TIMES the typical monthly flow. At the same time, oil futures are plummeting & millions of US jobs in jeopardy. My message to the Saudis: TURN THE TANKERS THE HELL AROUND. https://t.co/gYoQzvHAEQ
In response, two sources said Saudi Arabia was looking into whether it could re-route the cargoes elsewhere if the United States halted imports.
Oil traders active in European and Asian markets said there was expectation that the Saudis would look to divert the cargoes to other markets if a ban was imposed… which in turn would put huge pressure on storage tanks in those two regions, and depress local oil benchmarks.
“Europe looks full, but surely if the Saudis offer it at really cheap levels, buyers would take it,” a source with an international trading firm told Reuters. “Some still have storage spaces or may agree to float it for some time.” A source at a separate oil trading firm active in Asia said they expected many of the barrels that were bound for the United States to flow to the region if exports were blocked.
* * *
“This could prove to be a very expensive exercise for Saudi Arabia as whatever happens with the cargoes and the tanker owners will need to be paid demurrage (for the ships) and those costs would have been locked in when the market was higher to secure the charters,” a shipping source said. “While this is an expensive gamble for the Saudis, shutting off production would have been proved even more costly.”
Additional costs – or demurrage – were estimated at $250,000 a day based on rates last month when a lot of vessels were booked. Daily tanker rates soared to nearly $300,000 in the past month and though they have retreated to $150,000 a day this week, they are still significant and would be in addition to other costs including insurance if the ships are held up.
Even if the Saudi tankers make it to the US, it is not clear who would want their cargo. With the economy shut down, driving virtually non-existent and gasoline demand falling off a cliff, refiners have been absent from oil markets in the United States in recent days as they slash processing rates and as demand dries up, physical oil market sources said. “There is more reluctance now with fresh shipments as refiners in the U.S. have no homes for the oil,” another shipping source said.
Marathon Petroleum, Exxon Mobil, Chevron and Phillips 66, which traditionally among the biggest U.S. buyers of Saudi crude, have gone radio silent.
As Reuters adds, most of the large buyers of Saudi oil are along the West Coast. The region accounts for about half of all Saudi crude imports to the United States, according to the EIA. Storage there was already 65% full as of April 10; two weeks later and that number is approaching100%. The Gulf Coast – which is the second biggest US destination for Saudi oil – was about 55% full.
The imminent arrival of the Saudi tankers comes at a time when the main U.S. storage hub in Cushing, OK, is expected to be full within weeks.
The question reached the very top on Monday, when President Trump said he would “look at” possibly stopping Saudi shipments to the United States. While it wasn’t clear what Trump had in mind, last week, Frank Fannon, the U.S. assistant secretary of state for energy resources, said tariffs were a possibility.
After the bloodbath caused by Saudi Arabia’s decision to ramp up output, European oil companies at first blush look enticingly cheap.
The Johan Sverdrup oil field in the North Sea, west of Stavanger, Norway, Getty Images
The dividend yield in BP, for example, is a mouth-watering 9.35%, according to FactSet Research. For perspective, the yield on a British 10-year gilt is 0.27%.
But with oil prices so low, how could BP possibly afford to pay such a dividend?
In a note to clients with little in the way of commentary, Morgan Stanley ran the numbers on what European major oil companies would look like with Brent crude at $35 a barrel.
Probably the most jarring numbers are the dividend cover at that level.
Equinor this year could cover just 1% of its dividend versus its previous estimate of 93%, according to the Morgan Stanley calculation of life at $35 a barrel.
The best positioned is OMV, which can still cover 107% of its dividend at $35, down from an estimated 198%.
BP’s dividend cover falls to 54% from 107%; Shell’s drops to 72% from 115%; Total’s goes to 62% from 125%; Eni’s drops to 57% from 87%; Repsol’s falls to 79% from 123%; and Galp’s drops to 52% from 115%.
Stock buybacks for the European major oil companies would drop by two-thirds on the Morgan Stanley numbers.
This comes as demand has been slashed due to the coronavirus outbreak
Prince Abdulaziz, energy minister of Saudi Arabia
Saudi Arabia will increase its oil output next month to more than 10 million barrels per day, following talks between OPEC and its allies which failed to come to an agreement.
KSA has cut its oil prices drastically, more than it has in 20 years, with discounts to buyers in Europe, the Far East, and the US meant to draw more refiners to Saudi crude rather than other crude oil suppliers.
Bloomberg reported that Saudi Arabia has privately said it could raise production to 12 million barrels per day, citing anonymous sources.
This comes as demand is slashed due to the ongoing coronavirus outbreak.
The Russian central bank opened its first overseas office in Beijing on March 14, marking a step forward in forging a Beijing-Moscow alliance to bypass the US dollar in the global monetary system, and to phase-in a gold-backed standard of trade.
According to theSouth China Morning Postthe new office was part of agreements made between the two neighbours “to seek stronger economic ties” since the West brought in sanctions against Russia over the Ukraine crisis and the oil-price slump hit the Russian economy.
According to Dmitry Skobelkin, the deputy governor of the Central Bank of Russia, the opening of a Beijing representative office by the Central Bank of Russia was a “very timely” move to aid specific cooperation, including bond issuance, anti-money laundering and anti-terrorism measures between China and Russia.
The new central bank office was opened at a time when Russia is preparing to issue its first federal loan bonds denominated in Chinese yuan. Officials from China’s central bank and financial regulatory commissions attended the ceremony at the Russian embassy in Beijing, which was set up in October 1959 in the heyday of Sino-Soviet relations. Financial regulators from the two countries agreed last May to issue home currency-denominated bonds in each other’s markets, a move that was widely viewed as intended to eventually test the global reserve status of the US dollar.
Speaking on future ties with Russia, Chinese Premier Li Keqiang said in mid-March that Sino-Russian trade ties were affected by falling oil prices, but he added that he saw great potential in cooperation. Vladimir Shapovalov, a senior official at the Russian central bank, said the two central banks were drafting a memorandum of understanding to solve technical issues around China’s gold imports from Russia, and that details would be released soon.
If Russia – the world’s fourth largest gold producer after China, Japan and the US – is indeed set to become a major supplier of gold to China, the probability of a scenario hinted by many over the years, namely that Beijing is preparing to eventually unroll a gold-backed currency, increases by orders of magnitude.
* * *
Meanwhile, as the Russian central bank was getting closer to China, China was responding in kind with the establishment of a clearing bank in Moscow for handling transactions in Chinese yuan. The Industrial and Commercial Bank of China (ICBC) officially started operating as a Chinese renminbi clearing bank in Russia on Wednesday this past Wednesday.
“The financial regulatory authorities of China and Russia have signed a series of major agreements, which marks a new level of financial cooperation,” Dmitry Skobelkin, the abovementioned deputy head of the Russian Central Bank, said.
“The launching of renminbi clearing services in Russia will further expand local settlement business and promote financial cooperation between the two countries,” he added according to.
Irina Rogova, a Russian financial analysttold the Russian magazine Expertthat the clearing center could become a large financial hub for countries in the Eurasian Economic Union.
* * *
Bypassing the US dollar appears to be paying off: according to the Chinese State Administration of Taxation, trade turnover between China and Russia increased by 34% in January, in annual terms. Bilateral trade in January 2017 amounted to $6.55 billion. China’s exports to Russia grew 29.5% reaching $3.41 billion, while imports from Russia increased by 39.3%, to $3.14 billion. Just as many suspected, with Russian sanctions forcing Moscow to find other trading partners, chief among which China, this is precisely what has happened.
The creation of the clearing center enables the two countries to further increase bilateral trade and investment while decreasing their dependence on the US dollar. It will create a pool of yuan liquidity in Russia that enables transactions for trade and financial operations to run smoothly.
In expanding the use of national currencies for transactions, it could also potentially reduce the volatility of yuan and ruble exchange rates. The clearing center is one of a range of measures the People’s Bank of China and the Russian Central Bank have been looking at to deepen their co-operation,Sputnik reported.
One of the most significant measures under consideration is the previouslyreported push for joint organization of trade in gold. In recent years, China and Russia have been the world’s most active buyers of the precious metal. On a visit to China last year, the deputy head of the Russian Central Bank Sergey Shvetsov said that the two countries want to facilitate more transactions in gold between the two countries.
“We discussed the question of trade in gold. BRICS countries are large economies with large reserves of gold and an impressive volume of production and consumption of this precious metal. In China, the gold trade is conducted in Shanghai, in Russia it is in Moscow. Our idea is to create a link between the two cities in order to increase trade between the two markets,” First Deputy Governor of the Russian Central Bank Sergey Shvetsov toldRussia’s TASS news agency.
In other words, China and Russia are shifting away from dollar-based trade, to commerce which will eventually be backstopped by gold, or what is gradually emerging as an Eastern gold standard, one shared between Russia and China, and which may day backstop their respective currencies.
Meanwhile, the price of gold continues to reflect none of these potentially tectonic strategic shifts, just as China – which has been the biggest accumulator of gold in recent years – likes it.
The Russian central bank sees several catalysts that could stop the oil rally in its tracks.
Bearish rig count report from Baker Hughes could signal a reverse in direction.
Supply will continue to increase rather than slow down in 2016 – even if there is a decline in shale production.
Battle for market share is one of the major catalysts not being considered.
I believe it’s very clear this oil rally is running on fumes and was never the result of an improvement in fundamentals. That means to me this rally is going to quickly run out of steam if it isn’t able to run up quicker on existing momentum. I don’t see that happening, and it could pull back dramatically, catching a lot of investors by surprise. The Russian central bank agrees, saying it doesn’t believe the price of oil is sustainable under existing market conditions.
Cited by CNBC, the Russian central bank said, “the current oil market still features a continued oversupply, on the backdrop of a slowdown in the Chinese economy, more supplies originating from Iran and tighter competition for market share.”
In other words, most things in the market that should be improving to support the price of oil aren’t. That can only mean one thing: a violent pullback that could easily push the price of oil back down to the $30 to $32 range. If the price starts to fall quickly, we could see panic selling driving the price down even further.
I think most investors understand this is not a legitimate rally when looking at the lack of change in fundamentals. I’ll be glad when the production freeze hoax is seen for what it is: a manipulation of the price of oil by staggered press releases meant to pull investors along for the ride. The purpose is to buy some time to give the market more time to rebalance. Once this is seen for what it really is, oil will plummet. It could happen at any time in my opinion.
Rig count increases for first time in three months
For the first time in three months, the U.S. rig count was up, increasing by one to 387. By itself this isn’t that important, but when combined with the probability that more shale supply may be coming to the market in 2016, it definitely could be an early sign of the process beginning.
EOG Resources (NYSE:EOG) has stated it plans on starting up to 270 wells in 2016. We don’t know yet how much additional supply it represents, but it’s going to offset some of the decline from other companies that can’t continue to produce at these price levels. There are other low-cost shale producers that may be doing the same, although I think the price of oil will have to climb further to make it profitable for them, probably around $45 per barrel.
It’s impossible to know at this time if the increase in the price of oil was a catalyst, or we’ve seen the bottom of the drop in rig counts. The next round of earnings reports will give a glimpse into that.
Fundamentals remain weak
Most of the recent strength of the price of oil has been the continual reporting on the proposed production freeze from OPEC and Russia. This is light of the fact there really won’t be a freeze, even if a piece of paper is signed saying there is.
We know Iran isn’t going to agree to a freeze, and with Russia producing at post-Soviet highs and Iraq producing at record levels, what would a freeze mean anyway? It would simply lock in output levels the countries were going to operate at with or without an agreement.
The idea is the freeze is having an effect on the market and this will lead to a production cut. That simply isn’t going to happen. There is zero chance of that being the outcome of a freeze, if that ever comes about.
And a freeze without Iran isn’t a freeze. To even call it that defies reality. How can there be a freeze when the one country that would make a difference isn’t part of it? If Iran doesn’t freeze production, it means more supply will be added to the market until it reaches pre-sanction levels. At that time, all Iran has promised is it may consider the idea.
What does that have to do with fundamentals? Absolutely nothing. That’s the point.
Analysis and decisions need to be based on supply and demand. Right now that doesn’t look good. The other major catalyst pushing up oil prices has been the belief that U.S. shale production will decline significantly in 2016, which would help support oil. The truth is we have no idea to what level production will drop. It seems every time a report comes out it’s revised in a way that points to shale production remaining more resilient than believed.
I have no doubt there will be some production loss in the U.S., but to what degree there will be a decline, when considering new supply from low-cost shale companies, has yet to be determined. I believe it’s not going to be near to what was originally estimated, and that will be another element weakening support over the next year.
Competing for market share
One part of the oil market that has been largely ignored has been the competition for market share itself. When U.S. shale supply flooded the market, the response from Saudi Arabia was to not cede market share in any way. That is the primary reason for the plunge in oil prices.
There has been no declaration by the Saudis that they are going to change their strategy in relationship to market share and have said numerous times they are going to let the market sort it out, as far as finding a balance between supply and demand. So the idea they are now heading in a different direction is a fiction created by those trying to find anything to push up the price of oil.
It is apparent some of the reason for increased U.S. imports comes from Saudi Arabia in particular lowering its prices to nudge out domestic supply. It’s also why the idea of inventory being reduced in conjunction with lower U.S. production can’t be counted on. It looks like imports will continue to climb while shale production declines.
More competition means lower prices, although in this case, Saudi Arabia is selling its oil at different price points to different markets. It’s the average that matters there, and we simply don’t have the data available to know what that is.
In the midst of all of this, Russia is battling the Saudis for share in China, while the two also battle it out in parts of Europe, with Saudi Arabia looking to take share away from Russia. Some of Europe has opened up to competitors because it doesn’t want to rely too much on Russia as its major energy source.
For this and other competitive reasons, I could never trust a production freeze agreement if it ever came to fruition. They haven’t been adhered to in the past, and they won’t be if it happens again. Saudi Arabia has stated several times that it feels the same way.
Conclusion
To me the Russian central bank is spot on in saying the chance of a sustainable oil rally is slim. It also accurately pointed out the reasons for that: it’s about the lack of the fundamentals changing.
With U.S. inventory increasing, rig counts probably at or near a bottom, no end in sight to oversupply continuing, and competition for a low-demand market heating up, there is nothing I see that can justify an ongoing upward price move. I don’t even see it being able to hold.
A weaker U.S. dollar has legitimately helped some, but it can’t support the price of oil on its own. When all the other factors come together in the minds of investors, and the price of oil starts to reverse direction, there is a very strong chance a lot of bullish investors are going to get crushed hard. It is probably time to take some profits and run for the exit if you’re in the oil market for the short term.
Irrational Oil Optimists About To Experience Some Panic Selling Pain
Summary
Short-term positions in oil getting more risky.
U.S. production will outperform estimates as shale producers add supply to the market.
Inventory will come under more strain as key U.S. storage facilities approach full capacity.
Dollar weakness isn’t enough to maintain oil price momentum.
The longer the price of oil has upward momentum, and the higher it goes, the more risky it becomes for investors because there is nothing outside of a weakening U.S. dollar to justify any kind of move we’ve seen the price of oil make recently.
The falling dollar isn’t enough to keep the oil price from falling to where it belongs, and that means when the selloff begins, it’s likely to gravitate into full-panic mode, with sellers running for the exits before they get burned.
This is especially risky for those looking to make a quick windfall from the upward movement of oil. I’m not concerned about those taking long-term positions in quality energy companies with significant oil exposure, since they’ve probably enjoyed some great entry points. There is, of course, dividend risk, along with the strong probability of further share erosion before there is a real recovery that has legs to stand on because it’s based on fundamentals.
For that reason, investors should seriously consider taking profits off the table and wait for better conditions to re-enter.
Oil has become a fear play. Not the fear of losing money, but the fear of not getting in on the fast-moving action associated with the quick-rising price of oil. Whenever there is a fear play, it is ruled by emotion, and no amount of data will convince investors to abandon their giddy profits until they lose much, if not all, of what they gained. Don’t be one of them.
Having been a financial adviser in the past, I know what a lot of people are thinking at this time in response to what I just said. I’ve heard it many times before. It usually goes something like this: “What if the price of oil continues to rise and I lose a lot of money because of leaving the market too soon?” That’s a question arising from a fear mentality. The better question is this: “What if the oil price plunges and panic selling sets in?”
Oil is quickly becoming a casino play on the upside, and the longer investors stay in, the higher the probability they’ll lose the gains they’ve enjoyed. Worse, too much optimism could result in losses if preventative action isn’t taken quickly enough.
What needs to be considered is why one should stay in this market. What is so convincing it warrants this type of increasing risk, which offers much less in the way of reward than even a week ago? What fundamentals are in place that suggest a sustainable upward movement in the price of oil? The answer to those questions will determine how oil investors fare in the near future.
U.S. shale production
The more I think on the estimates associated with U.S. shale production in 2016, measured against the statements made by stronger producers that they’re going to boost supply from premium wells this year, the more I’m convinced it isn’t going to fall as much as expected. New supply will offset a lot of the less productive and higher cost wells being shuttered. I do believe there will be some loss of production from that, but not as much as is being suggested.
There are various predictions on how much production is going to be lost, but the general consensus is from 300,000 bpd to 600,000 bpd. It could come in on the lower side of that estimate, but I don’t think it’ll be close to the upper end of the estimate.
What is unknown because we don’t have an historical guideline to go by is, the amount of oil these premium wells will add to supply. We also don’t know if the stated goals will be followed up on. I think they will, but we won’t know for certain until the next couple of earnings reports give a clearer picture.
When combined with the added supply coming from Iran, and the ongoing high levels of production from Saudi Arabia, Russia and Iraq, I don’t see how the current support for the price of oil can continue on for any length of time.
There is no way of knowing exactly when the price of oil will once again collapse, but the longer it stays high without a change in the fundamentals, the higher the risk becomes, and the more chance it could swing the other way on momentum, even if it isn’t warranted. It could easily test the $30 mark again under those conditions.
Inventory challenges
What many investors don’t understand about storage and inventory is it definitely matters where the challenges are located. That’s why Cushing being over 90 percent capacity and Gulf storage only a little under 90 percent capacity means more than if other facilities were under similar pressure. Together, they account for over 60 percent of U.S. storage.
With the imbalance of supply and demand driving storage capacity levels, the idea of oil staying above $40 per barrel for any period of time is highly unlikely. A lower U.S. dollar and the highly irrelevant proposed production freeze talks can’t balance it off.
Once the market digests this, which could happen at any time, we’ll quickly enter bear mode again. The problem is the price of oil is straining against its upper limits, and if momentum starts to deflate, the race to sell positions will become a sprint and not a marathon.
Uncertainty about shale is the wild card
As already mentioned, U.S. shale production continues to be the major catalyst to watch. The problem is we have no way of knowing what has already been unfolding in the first quarter. If investors start to abandon their positions, and we find shale supply is stronger than projected, it’ll put further downward pressure on oil after it has already corrected.
What I mean by that is we should experience some fleeing from oil before the next earnings reports from shale producers are released. If the industry continues to surprise on the upside of supply, it’ll cause the price of oil to further deteriorate, making the outlook over the next couple of months potentially ominous.
This isn’t just something that has a small chance of happening; it’s something that has a very strong probability of happening. Agencies like IEA have already upwardly revised their outlook for shale supply in 2016, and if that’s how it plays out, the entire expected performance for the year will have to be adjusted.
Conclusion
Taking into account the more important variables surrounding what will move the price of oil, shale production remains the most important information to follow. Not much else will matter if supply continues to exceed expectations. It will obliterate all the models and force analysts to admit this has little to do with prior supply cycles and everything to do with a complete market disruption. Many are still in denial of this. They’ll learn the reality soon enough.
That doesn’t mean there won’t eventually be a time when demand finally catches up with supply, but within the parameters of this weak global economy and oil supply that continues to grow, it’s going to take a lot longer to realize than many thought.
For several months, it has been understood that the market underestimated the expertise and efficiency of U.S. shale producers, and to this day they continue to do so. We will find out if that remains in play in the first half of 2016, and by then, whether it’ll extend further into 2017.
As for how it will impact the price of oil now, if we start to have some panic selling before the earnings reports, and the earnings reports of the important shale producers exceed expectations on the supply side, with it being reflected in an increase in the overall output estimates for the year, it will put more downward pressure on oil.
The other scenario is oil lingers around $40 per barrel until the earnings reports come out. There will still be a decline in the price of oil, the level of which would depend on how much more supply shale producers brought to the market in the first quarter than expected.
My thought is we’re going to experience a drop in the price of oil before earnings reports, which then could trigger a secondary exodus from investors in it for short-term gains.
For those having already generated some decent returns, it may be time to take it off the table. I don’t see how the shrinking reward can justify the growing risk.
The Mosul Dam in Iraq could collapse at any time, causing massive flooding across the country.
Iraq produces over four million barrels of oil per day, a number which will drop immediately when this event occurs.
The destruction of oil production in Iraq will immediately decrease world supply, lifting oil prices.
The Oil Situation: Since 2014, the oil market has been in a tailspin due to a multitude of global factors. As of March 2016, prices seem to have stabilized, although the persistence of crude oversupply continues to hang over the market. For months, declining US production and a potential output freeze by OPEC have been putting a potential floor in place. However, I believe an event is on the horizon which will change the equilibrium of oil prices immediately… the collapse of the Mosul Dam.
The Mosul Dam:The Mosul Dam is the largest dam in Iraq. It is located on the Tigris River in the western governance of Ninawa, upstream of the city of Mosul. Constructed in 1981, the dam has had a history of structural issues, requiring perpetual maintenance in order to maintain its integrity. Since 1984, this consisted of 300 man crews, working 24 hours a day across three shifts, filling holes in the bedrock through a process called grouting. For 30 years, this process worked, although it was always considered to be a ticking time bomb, dubbed “the most dangerous dam in the world” by the US Army Corps of Engineers.
In August 2014, the Islamic State of Iraq and the Levant took control of the dam, halting the maintenance process until it was retaken by Iraqi, Kurdish and US Forces two weeks later. Unfortunately, the damage was already done… since then, the maintenance crews have been limited to 30 personnel or less, and the equipment is inadequate to continue patching holes. Per the dam’s former chief engineer, Nasrat Adamo, “The machines for grouting have been looted. There is no cement supply. They can do nothing. It is going from bad to worse, and it is urgent. All we can do is hold our hearts.” As winter snows melt, the water levels will rise to unsustainable levels, and while it has two pressure release gates to avoid this scenario, one has been non-functioning for years, and using the second one alone risks the stability of the structure.
The Event: When the Mosul Dam collapses (and without reconstruction measures being implemented quickly, this is considered a ‘when’, not an ‘if’), a wave 45-65 feet high is expected to flood the country, drowning Mosul in four hours and reaching Baghdad within two to four days.
Estimates range from 500,000 to 1,500,000 lives lost. In addition to flooding, there will be secondary and tertiary effects… as demonstrated in America during Hurricane Katrina, panic and lawlessness can be equally as dangerous as the flooding itself, but even worse, diseases such as malaria and West Nile fever will follow. A catastrophic event of this magnitude will immediately push the entire country into chaos, and Iraq does not have the capability to respond without global support. The closest comparison to make is Haiti, which with billions in global assistance has not returned to normalcy in five years. Overall, I anticipate this catastrophe will take years to overcome… in the meantime, it will have a significant effect on the world’s supply of oil today.
The Effects:As of winter 2015, Iraq was producing 4.3M barrels per day, with the southern fields producing 3.3M barrels and the remaining 1M coming from the north. The graphic below (left) is from 2014, but gives a picture of the oil field placements. To the right is a topographical map, which gives us an idea of how the floodwaters will progress. Based on the elevation of where the flood would initiate, everything between Mosul and Baghdad will be completely covered, and while the wave will dissipate over time, the fields between Baghdad and Basra will see enough water (and everything that comes with it, to include bodies, disease and unexploded ordinance) to temporarily disable operations. Additionally, the pipeline between Kirkuk and Ramadi will be underwater, and there is a potential for damage to the Iraq Strategic Pipeline, which runs parallel to the direction of the water’s progression.
The world’s oversupply of oil is estimated around one million barrels per day. Assume that the above happens, and in a best-case scenario, only northern production is affected. What would occur immediately is the elimination of one quarter of Iraq’s oil output, rapidly pushing supply and demand into equilibrium. In a worst-case scenario, where all of Iraq’s oil is temporarily eliminated, it will move the supply deficit to three million barrels per day, leading to large ramifications on the world’s crude oil surplus within weeks.
While the true answer lies somewhere between these possibilities, what is undeniable is that a catastrophe of this magnitude will immediately move the price of crude oil up, and depending on the timeline to return to today’s production levels, that move could be enormous. In late 2015, the world produced 97M barrels per day, causing the price to collapse to $26.00 per barrel. In 2014, while producing 93M barrels per day, the price averaged near $110.00 prior to its fall. Although the above is simple extrapolation, demand continues to grow, so I think we can all agree that the price shift north will be significant.
Conclusion: The subject of this article is admittedly morbid. The true fallout of this event is the loss of hundreds of thousands of Iraqi lives, and damage that would take years to erase. However, as informed investors, it would be irresponsible to not consider global events, and this has the potential to re-balance the oil market in a matter of days. When this occurs, over four million barrels per day can disappear from production, immediately shifting the direction of oil prices. Based on the above information, I believe a production cut decision by OPEC is irrelevant, as natural forces are preparing to address the oil oversupply on their own.
Last week, during the peak of the commodity short squeeze, we pointed out how this default cycle is shaping up to be vastly different from previous one: recovery rates for both secured and unsecured debts are at record low levels. More importantly, we noted how this notable variance is impacting lender behavior, explaining that banks – aware that the next leg lower in commodities is imminent – are not only forcing the squeeze in the most trashed stocks (by pulling borrow) but are doing everything in their power to “assist” energy companies to sell equity, and use the proceeds to take out as much of the banks’ balance sheet exposure as possible, so that when the default tsunami finally arrives, banks will be as far away as possible from the carnage. All of this was predicated on prior lender conversations with the Dallas Fed and the OCC, discussions which the Dallas Fed vocally denied accusing us of lying, yet which the WSJ confirmed, confirming the Dallas Fed was openly lying.
This was the punchline:
[Record low] recovery rate explain what we discussed earlier, namely the desire of banks to force an equity short squeeze in energy stocks, so these distressed names are able to issue equity with which to repay secured loans to banks who are scrambling to get out of the capital structure of distressed E&P names. Or as MatlinPatterson’s Michael Lipsky put it: “we always assume that secured lenders would roll into the bankruptcy become the DIP (debtor in possession) lenders, emerge from bankruptcy as the new secured debt of the company. But they don’t want to be there, so you are buying the debt behind them and you could find yourself in a situation where you could lose 100% of your money.“
And so, one by one the pieces of the puzzle fall into place: banks, well aware that they are facing paltry recoveries in bankruptcy on their secured exposure (and unsecured creditors looking at 10 cents on the dollar), have engineered an oil short squeeze via oil ETFs…
… to take advantage of panicked investors some of whom are desperate to cover their shorts, and others who are just as desperate to buy the new equity issued. Those proceeds, however, will not go to organic growth or even to shore liquidity but straight to the bank to refi loan facilities and let banks, currently on the hook, leave silently by the back door. Meanwhile, the new investors have no security claims and zero liens, are at the very bottom of the capital structure, and face near certain wipe outs.
In short, once the current short squeeze is over, expect everyone to start paying far more attention to recovery rates and the true value of “fundamentals.”
Going back to what Lipsky said, “the banks do not want to be there.” So where do they want to be? As far away as possible from the shale carnage when it does hit.
Today, courtesy of The New York Shock Exchange, we present just the case study demonstrating how this takes place in the real world. Here the story of troubled energy company “Lower oil prices for longer” Weatherford, its secured lender JPM, the incestuous relationship between the two, and how the latter can’t wait to get as far from the former as possible, in…
I am on record saying that Weatherford International is so highly-leveraged that it needs equity to stay afloat. With debt/EBITDA at 8x and $1 billion in principal payments coming due over the next year, the oilfield services giant is in dire straits. Weatherford has been in talks with JP Morgan Chase to re-negotiate its revolving credit facility — the only thing keeping the company afloat. However, in a move that shocked the financial markets, JP Morgan led an equity offering that raised $565 million for Weatherford. Based on liquidation value Weatherford is insolvent. The question remains, why would JP Morgan risk its reputation by selling shares in an insolvent company?
According to the prospectus, at Q4 2015 Weatherford had cash of $467 million debt of $7.5 billion. It debt was broken down as follows: [i] revolving credit facility ($967 million), [ii] other short-term loans ($214 million), [iii] current portion of long-term debt of $401 million and [iv] long-term debt of $5.9 billion. JP Morgan is head of a banking syndicate that has the revolving credit facility.
Even in an optimistic scenario I estimate Weatherford’s liquidation value is about $6.7 billion less than its stated book value. The lion’s share of the mark-downs are related to inventory ($1.1B), PP&E ($1.9B), intangibles and non-current assets ($3.5B). The write-offs would reduce Weatherford’s stated book value of $4.4 billion to – $2.2 billion. After the equity offering the liquidation value would rise to -$1.6 billion.
JP Morgan and Morgan Stanley also happen to be lead underwriters on the equity offering. The proceeds from the offering are expected to be used to repay the revolving credit facility.
In effect, JP Morgan is raising equity in a company with questionable prospects and using the funds to repay debt the company owes JP Morgan. The arrangement allows JP Morgan to get its money out prior to lenders subordinated to it get their $401 million payment. That’s smart in a way. What’s the point of having a priority position if you can’t use that leverage to get cashed out first before the ship sinks? The rub is that [i] it might represent a conflict of interest and [ii] would JP Morgan think it would be a good idea to hawk shares in an insolvent company if said insolvent company didn’t owe JP Morgan money?
The answer? JP Morgan doesn’t care how it looks; JP Morgan wants out and is happy to do it while algos and momentum chasing day traders are bidding up the stock because this time oil has finally bottomed… we promise.
So here’s the good news: as a result of this coordinated lender collusion to prop up the energy sector long enough for the affected companies to sell equity and repay secured debt, the squeeze may last a while; as for the bad news: the only reason the squeeze is taking place is because banks are looking to get as far from the shale patch and the companies on it, as possible.
We leave it up to readers to decide which “news” is more relevant to their investing strategy.
We grow up being taught a very specific set of principles.
One plus one equals two. I before E, except after C.
As we grow older, the principles become more complex.
Take economics for example.
The law of supply states that the quantity of a good supplied rises as the market price rises, and falls as the price falls. Conversely, the law of demand states that the quantity of a good demanded falls as the price rises, and vice versa.
These basic laws of supply and demand are the fundamental building blocks of how we arrive at a given price for a given product.
At least, that’s how it’s supposed to work.
But what if I told you that the principles you grew up learning is wrong?
With today’s “creative” financial instruments, much of what you learned no longer applies in the real world.
Especially when it comes to oil.
The Law of Oil
Long time readers of this Letter will have read many of my blogs regarding commodities manipulation.
With oil, price manipulation couldn’t be more obvious.
“…While agencies have found innovative ways to explain declining oil demand, the world has never consumed more oil.
In 2010, the world consumed a record 87.4 million barrels per day. This year (2014), the world is expected to consume a new record of 92.7 million barrels per day.
Global oil demand is still expected to climb to new highs.
If the price of oil is a true reflection of supply and demand, as the headlines tell us, it should reflect the discrepancy between supply and demand.
Since we know that demand is actually growing, that can’t be the reason for oil’s dramatic drop.
So does that mean it’s a supply issue? Did the world all of a sudden gain 40% more oil? Obviously not.
So no, the reason behind oil’s fall is not the causality of supply and demand.
The reason is manipulation. The question is why.
I go on to talk about the geopolitical reasons of why the price of oil is manipulated.
“On September 11, Saudi Arabia finally inked a deal with the U.S. to drop bombs on Syria.
But why?
Saudi Arabia possesses 18 per cent of the world’s proven petroleum reserves and ranks as the largest exporter of petroleum.
Syria is home to a pipeline route that can bring gas from the great Qatar natural gas fields into Europe, making billions of dollars for Saudi Arabia as the gas moves through while removing Russia’s energy stronghold on Europe.
Could the U.S. have persuaded Saudi Arabia, during their September 11 meeting, to lower the price of oil in order to hurt Russia, while stimulating the American economy?
… On October 1, 2014, shortly after the U.S. dropped bombs on Syria on September 26 as part of the September 11 agreement, Saudi Arabia announced it would be slashing prices to Asian nations in order to “compete” for crude market share. It also slashed prices to Europe and the United States.”
Following Saudi Arabia’s announcement, oil prices have plunged to a level not seen in more than five years.
Is it a “coincidence” that shortly after the Saudi Arabia-U.S. meeting on the coincidental date of 9-11, the two nations inked a deal to drop billions of dollars worth of bombs on Syria? Then just a few days later, Saudi Arabia announces a massive price cut to its oil.
Coincidence?
There are many other factors – and conspiracies – in oil price manipulation, such as geopolitical attacks on Russia and Iran, whose economies rely heavily on oil. Saudi Arabia is also flooding the market with oil – and I would suggest that it’s because they are rushing to trade their oil for weapons to lead an attack or beef up their defense against the next major power in the Middle East, Iran.
However, all of the reasons, strategies or theories of oil price manipulation could only make sense if they were allowed by these two major players: the regulators and the Big Banks.
How Oil is Priced
On any given day, if you were to look at the spot price of oil, you’d likely be looking at a quote from the NYMEX in New York or the ICE Futures in London. Together, these two institutions trade most of the oil that creates the global benchmark for oil prices via oil futures contracts on West Texas Intermediate (WTI) and North Sea Brent (Brent).
What you may not see, however, is who is trading this oil, and how it is being traded.
Up until 2006, the price of oil traded within reason. But all of a sudden, we saw these major price movements. Why?
“Until recently, U.S. energy futures were traded exclusively on regulated exchanges within the United States, like the NYMEX, which are subject to extensive oversight by the CFTC, including ongoing monitoring to detect and prevent price manipulation or fraud.
In recent years, however, there has been a tremendous growth in the trading of contracts that look and are structured just like futures contracts, but which are traded on unregulated OTC electronic markets. Because of their similarity to futures contracts they are often called ”futures look-a likes.”
The only practical difference between futures look-alike contracts and futures contracts is that the look-a likes are traded in unregulated markets whereas futures are traded on regulated exchanges.
The trading of energy commodities by large firms on OTC electronic exchanges was exempted from CFTC oversight by a provision inserted at the behest of Enron and other large energy traders into the Commodity Futures Modernization Act of 2000 in the waning hours of the 106th Congress.
The impact on market oversight has been substantial.
NYMEX traders, for example, are required to keep records of all trades and report large trades to the CFTC. These Large Trader Reports (LTR), together with daily trading data providing price and volume information, are the CFTC’s primary tools to gauge the extent of speculation in the markets and to detect, prevent, and prosecute price manipulation.
…In contrast to trades conducted on the NYMEX, traders on unregulated OTC electronic exchanges are not required to keep records or file Large Trader Reports with the CFTC, and these trades are exempt from routine CFTC oversight.
In contrast to trades conducted on regulated futures exchanges, there is no limit on the number of contracts a speculator may hold on an unregulated OTC electronic exchange, no monitoring of trading by the exchange itself, and no reporting of the amount of outstanding contracts (”open interest”) at the end of each day.
The CFTC’s ability to monitor the U.S. energy commodity markets was further eroded when, in January of this year (2006), the CFTC permitted the Intercontinental Exchange (ICE), the leading operator of electronic energy exchanges, to use its trading terminals in the United States for the trading of U.S. crude oil futures on the ICE futures exchange in London-called ”ICE Futures.”
Previously, the ICE Futures exchange in London had traded only in European energy commodities-Brent crude oil and United Kingdom natural gas. As a United Kingdom futures market, the ICE Futures exchange is regulated solely by the United Kingdom Financial Services rooority. In 1999, the London exchange obtained the CFTC’s permission to install computer terminals in the United States to permit traders here to trade European energy commodities through that exchange.
Then, in January of this year, ICE Futures in London began trading a futures contract for West Texas Intermediate (WTI) crude oil, a type of crude oil that is produced and delivered in the United States. ICE Futures also notified the CFTC that it would be permitting traders in the United States to use ICE terminals in the United States to trade its new WTI contract on the ICE Futures London exchange.
Beginning in April, ICE Futures similarly allowed traders in the United States to trade U.S. gasoline and heating oil futures on the ICE Futures exchange in London. Despite the use by U.S. traders of trading terminals within the United States to trade U.S. oil, gasoline, and heating oil futures contracts, the CFTC has not asserted any jurisdiction over the trading of these contracts.
Persons within the United States seeking to trade key U.S. energy commodities-U.S. crude oil, gasoline, and heating oil futures-now can avoid all U.S. market oversight or reporting requirements by routing their trades through the ICE Futures exchange in London instead of the NYMEX in New York.
As an increasing number of U.S. energy trades occurs on unregulated, OTC electronic exchanges or through foreign exchanges, the CFTC’s large trading reporting system becomes less and less accurate, the trading data becomes less and less useful, and its market oversight program becomes less comprehensive.
The absence of large trader information from the electronic exchanges makes it more difficult for the CFTC to monitor speculative activity and to detect and prevent price manipulation. The absence of this information not only obscures the CFTC’s view of that portion of the energy commodity markets, but it also degrades the quality of information that is reported.
A trader may take a position on an unregulated electronic exchange or on a foreign exchange that is either in addition to or opposite from the positions the trader has taken on the NYMEX, and thereby avoid and distort the large trader reporting system.
Not only can the CFTC be misled by these trading practices, but these trading practices could render the CFTC weekly publication of energy market trading data, intended to be used by the public, as incomplete and misleading.”
Simply put, any one can now speculate and avoid being tagged with illegal price. The more speculative trading that occurs, the less “real” price discovery via true supply and demand become.
With that in mind, you can now see how the big banks have gained control and cornered the oil market.
Continued from the Report:
“…Over the past few years, large financial institutions, hedge funds, pension funds, and other investment funds have been pouring billions of dollars into the energy commodities markets…to try to take advantage of price changes or to hedge against them.
Because much of this additional investment has come from financial institutions and investment funds that do not use the commodity as part of their business, it is defined as ”speculation” by the Commodity Futures Trading Commission (CFTC).
…Reports indicate that, in the past couple of years, some speculators have made tens and perhaps hundreds of millions of dollars in profits trading in energy commodities.
This speculative trading has occurred both on the regulated New York Mercantile Exchange (NYMEX) and on the over-the-counter (OTC) markets.
The large purchases of crude oil futures contracts by speculators have, in effect, created an additional demand for oil, driving up the price of oil to be delivered in the future in the same manner that additional demand for the immediate delivery of a physical barrel of oil drives up the price on the spot market.
As far as the market is concerned, the demand for a barrel of oil that results from the purchase of a futures contract by a speculator is just as real as the demand for a barrel that results from the purchase of a futures contract by a refiner or other user of petroleum.
Although it is difficult to quantify the effect of speculation on prices, there is substantial evidence that the large amount of speculation in the current market has significantly increased prices.
Several analysts have estimated that speculative purchases of oil futures have added as much as $20-$25 per barrel to the current price of crude oil, thereby pushing up the price of oil from $50 to approximately $70 per barrel.”
The biggest banks in the world, such as Goldman Sachs, Morgan Stanley, Citigroup, JP Morgan, are now also the biggest energy traders; together, they not only participate in oil trades, but also fund numerous hedge funds that trade in oil.
Knowing how easy it is to force the price of oil upwards, the same strategies can be done in reverse to force the price of oil down.
All it takes is for some media-conjured “report” to tell us that Saudi Arabia is flooding the market with oil, OPEC is lowering prices, or that China is slowing, for oil to collapse.
Traders would then go short oil, kicking algo-traders into high gear, and immediately sending oil down further. The fact that oil consumption is actually growing really doesn’t matter anymore.
In reality, oil price isn’t dictated by supply and demand – or OPEC, or Russia, or China – it is dictated by the Western financial institutions that trade it.
“For years, I have been talking about how the banks have taken control of our civilization.
…With oil prices are falling, economies around the world are beginning to feel the pain causing a huge wave of panic throughout the financial industry. That’s because the last time oil dropped like this – more than US$40 in less than six months – was during the financial crisis of 2008.
…Let’s look at the energy market to gain a better perspective.
The energy sector represents around 17-18 percent of the high-yield bond market valued at around $2 trillion.
Over the last few years, energy producers have raised more than a whopping half a trillion dollars in new bonds and loans with next to zero borrowing costs – courtesy of the Fed.
This low-borrowing cost environment, along with deregulation, has been the goose that laid the golden egg for every single energy producer. Because of this easy money, however, energy producers have become more leveraged than ever; leveraging themselves at much higher oil prices.
But with oil suddenly dropping so sharply, many of these energy producers are now at serious risk of going under.
In a recent report by Goldman Sachs, nearly $1 trillion of investments in future oil projects are at risk.
…It’s no wonder the costs of borrowing for energy producers have skyrocketed over the last six months.
…many of the companies are already on the brink of default, and unable to make even the interest payments on their loans.
…If oil continues in this low price environment, many producers will have a hard time meeting their debt obligations – meaning many of them could default on their loans. This alone will cause a wave of financial and corporate destruction. Not to mention the loss of hundreds of thousands of jobs across North America.”
You may be thinking, “if oil’s fall is causing a wave of financial disaster, why would the banks push the price of oil down? Wouldn’t they also suffer from the loss?”
Great question. But the banks never lose. Continued from my letter:
“If you control the world’s reserve currency, but slowly losing that status as a result of devaluation and competition from other nations (see When Nations Unite Against the West: The BRICS Development Bank), what would you do to protect yourself?
You buy assets. Because real hard assets protect you from monetary inflation.
With the banks now holding record amounts of highly leveraged paper from the Fed, why would they not use that paper to buy hard assets?
Bankers may be greedy, but they’re not stupid.
The price of hard physical assets is the true representation of inflation.
Therefore, if you control these hard assets in large quantities, you could also control their price.
This, in turn, means you can maintain control of your currency against monetary inflation.
And that is exactly what the banks have done.
The True World Power
Last month, the U.S. Senate’s Permanent Subcommittee on Investigations published a 403-page report on how Wall Street’s biggest banks, such as Goldman Sachs, Morgan Stanley, and JP Morgan, have gained ownership of a massive amount of commodities, food, and energy resources.
The report stated that “the current level of bank involvement with critical raw materials, power generation, and the food supply appears to be unprecedented in U.S. history.”
For example:
“…Until recently, Morgan Stanley controlled over 55 million barrels of oil storage capacity, 100 oil tankers, and 6,000 miles of pipeline. JPMorgan built a copper inventory that peaked at $2.7 billion, and, at one point, included at least 213,000 metric tons of copper, comprising nearly 60% of the available physical copper on the world’s premier copper trading exchange, the LME.
In 2012, Goldman owned 1.5 million metric tons of aluminum worth $3 billion, about 25% of the entire U.S. annual consumption. Goldman also owned warehouses which, in 2014, controlled 85% of the LME aluminum storage business in the United States.” – Wall Street Bank Involvement with Physical Commodities, United States Senate Permanent Subcommittee on Investigations
From pipelines to power plants, from agriculture to jet fuel, these too-big-to-fail banks have amassed – and may have manipulated the prices – of some of the world’s most important resources.
The above examples clearly show just how much influence the Big Banks have over our commodities through a “wide range of risky physical commodity activities which included, at times, producing, transporting, storing, processing, supplying, or trading energy, industrial metals, or agricultural commodities.”
With practically an unlimited supply of cheap capital from the Federal Reserve, the Big Banks have turned into much more than lenders and facilitators. They have become direct commerce competitors with an unfair monetary advantage: free money from the Fed.
Of course, that’s not their only advantage.
According to the report, the Big Banks are engaging in risky activities (such as ownership in power plants and coal mining), mixing banking and commerce, affecting prices, and gaining significant trading advantages.
Just think about how easily it would be for JP Morgan to manipulate the price of copper when they – at one point – controlled 60% of the available physical copper on the world’s premier copper trading exchange, the LME.
How easy would it be for Goldman to control the price of aluminum when they owned warehouses – at one point – that controlled 85% of the LME aluminum storage business in the United States?
And if they could so easily control such vast quantities of hard assets, how easy would it be for them to profit from going either short or long on these commodities?
Always a Winner
But if, for some reason, the bankers’ bets didn’t work out, they still wouldn’t lose.
That’s because these banks are holders of trillions of dollars in FDIC insured deposits.
In other words, if any of the banks’ pipelines rupture, power plants explode, oil tankers spill, or coal mines collapse, taxpayers may once again be on the hook for yet another too-big-to-fail bailout.
If you think that there’s no way that the government or the Fed would allow this to happen again after 2008, think again.
Via the Guardian:
“In a small provision in the budget bill, Congress agreed to allow banks to house their trading of swaps and derivatives alongside customer deposits, which are insured by the federal government against losses.
The budget move repeals a portion of the Dodd-Frank financial reform act and, some say, lays the groundwork for future bailouts of banks who make irresponsibly risky trades.”
Recall from my past letters where I said that the Fed wants to engulf you in their dollars. If yet another bailout is required, then the Fed would once again be the lender of last resort, and Americans will pile on the debt it owes to the Fed.
It’s no wonder that in the report, it actually notes that the Fed was the facilitator of this sprawl by the banks:
“Without the complementary orders and letters issued by the Federal Reserve, many of those physical commodity activities would not otherwise have been permissible ‘financial’ activities under federal banking law. By issuing those complementary orders, the Federal Reserve directly facilitated the expansion of financial holding companies into new physical commodity activities.”
The Big Banks have risked tons of cash lending and facilitating in oil business. But in reality they haven’t risked anything. They get free money from the Fed, and since they aren’t supposed to be directly involved in natural resources, they obtain control in other ways.
Remember, the big banks – and ultimately the Fed who controls them – are the ones who truly control the world. Their monetary actions are the cause of many of the world’s issues and have been used for many years to maintain control of other nations and the world’s resources.
But they can’t simply go into a country, put troops on the ground and take over. No, that would be inhumane.
“Currency manipulation allows developed countries to print and lend to other developing countries at will.
A rich nation might go into a developing nation and lend them millions of dollars to build bridges, schools, housing, and expand their military efforts. The rich nation convinces the developing nation that by borrowing money, their nation will grow and prosper.
However, these deals are often negotiated at a very specific and hefty cost; the lending nation might demand resources or military and political access. Of course, developing nations often take the loans, but never really have the chance to pay it back.
When the developing nations realize they can’t pay back the loans, they’re at the mercy of the lending nations.
The trick here is that the lending nations can print as much money as they want, and in turn, control the resources of developing nations. In other words, the loans come at a hefty cost to the borrower, but at no cost to the lender.”
This brings us back to oil.
We know that oil’s crash has put a heavy burden on many debt facilities that are associated with oil. We also know that the big banks are all heavily leveraged within the sector.
If that is the case, why are the big banks so calm?
The answer is simple.
Asset-Backed Lending
Most of the loans associated with oil are done through asset-backed loans, or reserve-based financing.
It means that the loans are backed by the underlying asset itself: the oil reserves.
So if the loans go south, guess who ends up with the oil?
According to Reuters, JP Morgan is the number one U.S. bank by assets. And despite its energy exposure assumed at only 1.6 percent of total loans, the bank could own reserves of up to $750 million!
“If oil reaches $30 a barrel – and here we are – and stayed there for, call it, 18 months, you could expect to see (JPMorgan’s) reserve builds of up to $750 million.”
No wonder the banks aren’t worried about a oil financial contagion – especially not Jamie Dimon, JP Morgan’s Chairman, CEO and President:
“…Remember, these are asset-backed loans, so a bankruptcy doesn’t necessarily mean your loan is bad.” – Jamie Dimon
As oil collapses and defaults arise, the banks have not only traded dollars for assets on the cheap, but gained massive oil reserves for pennies on the dollar to back the underlying contracts of the oil that they so heavily trade.
The argument to this would be that many emerging markets have laws in place that prevent their national resources from being turned over to foreign entities in the case of corporate defaults.
Which, of course, the U.S. and its banks have already prepared for.
“…If the Fed raises interest rates, many emerging market economies will suffer the consequence of debt defaults. Which, historically means that asset fire sales – often commodity-based assets such as oil and gas – are next.
Historically, if you wanted to seize the assets of another country, you would have to go to war and fight for territory. But today, there are other less bloody ways to do that.
Take, for example, Petrobras – a semi-public Brazilian multinational energy corporation.
…Brazil is in one of the worst debt positions in the world with much of its debt denominated in US dollars.
Earlier this year (2015), Petrobras announced that it is attempting to sell $58 billion of assets – an unprecedented number in the oil industry.
Guess who will likely be leading the sale of Petrobras assets? Yup, American banks.
“…JPMorgan would be tasked with wooing the largest number of bidders possible for the assets and then structure the sales.”
As history has shown, emerging market fire sales due to debt defaults are often won by the US or its allies. Thus far, it appears the Petrobras fire sale may be headed that way.
‘Brazilian state-run oil company Petróleo Brasileiro SA said Tuesday (September 22, 2015) it is closing a deal to sell natural-gas distribution assets to a local subsidiary of Japan’s Mitsui & Co.’
The combination of monetary policy and commodities manipulation allows Western banks and allies to accumulate hard assets at the expense of emerging markets. And this has been exactly the plan since day one.
As the Fed hints of raising rates, financial risks among emerging markets will continue to build. This will trigger a reappraisal of sovereign and corporate risks leading to big swings in capital flows.”
Not only are many of the big banks’ practices protected by government and Fed policies, but they’re also protected by the underlying asset itself. If things go south, the bank could end up owning a lot of oil reserves.
No wonder they’re not worried.
And since the banks ultimately control the price of oil anyway, it could easily bring the price back up when they’re ready.
Controlling the price of oil gives U.S. and its banks many advantages.
For example, the U.S. could tell the Iranians, the Saudis, or other OPEC nations, whose economies heavily rely on oil, “Hey, if you want higher oil prices, we can make that happen. But first, you have to do this…”
You see how much control the U.S., and its big banks, actually have?
At least, for now anyway.
Don’t think for one second that nations around the world don’t understand this.
Just ask Venezuela, and many of the other countries that have succumbed to the power of the U.S. Many of these countries are now turning to China because they feel they have been screwed.
The World Shift
The diversification away from the U.S. dollar is the first step in the uprising against the U.S. by other nations.
As the power of the U.S. dollar diminishes, through international currency swaps and loans, other trading platforms that control the price of commodities (such as the new Shanghai Oil Exchange) will become more prominent in global trade; thus, bringing some price equilibrium back to the market.
And this is happening much faster than you expect.
Chinese President Xi Jinping returned home Sunday after wrapping up a historic trip to Saudi Arabia, Egypt, and Iran with a broad consensus and 52 cooperation agreements set to deepen Beijing’s constructive engagement with the struggling yet promising region.
During Xi’s trip, China upgraded its relationship with both Saudi Arabia and Iran to a comprehensive strategic partnership and vowed to work together with Egypt to add more values to their comprehensive strategic partnership.
Regional organizations, including the Organization of Islamic Cooperation (OIC), the Cooperation Council for the Arab States of the Gulf (GCC) and the Arab League (AL), also applauded Xi’s visit and voiced their readiness to cement mutual trust and broaden win-win cooperation with China.
AL Secretary General Nabil al-Arabi said China has always stood with the developing world, adding that the Arab world is willing to work closely with China in political, economic as well as other sectors for mutual benefit.
The Belt and Road Initiative, an ambitious vision Xi put forward in 2013 to boost inter-connectivity and common development along the ancient land and maritime Silk Roads, has gained more support and popularity during Xi’s trip.
…Xi and leaders of the three nations agreed to align their countries’ development blueprints and pursue mutually beneficial cooperation under the framework of the Belt and Road Initiative, which comprises the Silk Road Economic Belt and the 21st Century Maritime Silk Road.
The initiative, reiterated the Chinese president, is by no means China’s solo, but a symphony of all countries along the routes, including half of the OIC members.
During Xi’s stay in Saudi Arabia, China, and the GCC resumed their free trade talks and “substantively concluded in principle the negotiations on trade in goods.” A comprehensive deal will be made within this year.”
In other words, the big power players in the Middle East – who produce the majority of the world’s oil – are now moving closer to cooperation with China, and away from the U.S.
As this progresses, it means the role of the U.S. dollar, and its value in world trade, will diminish.
And the big banks, which hold trillions of dollars in U.S. assets, aren’t concerned.
Earlier this week, before first JPM and then Wells Fargo revealed that not all is well when it comes to bank energy loan exposure, a small Tulsa-based lender, BOK Financial, said that its fourth-quarter earnings would miss analysts’ expectationsbecause its loan-loss provisions would be higher than expected as a result of a single unidentified energy-industry borrower. This is what the bank said:
“A single borrower reported steeper than expected production declines and higher lease operating expenses, leading to an impairment on the loan. In addition, as we noted at the start of the commodities downturn in late 2014, we expected credit migration in the energy portfolio throughout the cycle and an increased risk of loss if commodity prices did not recover to a normalized level within one year. As we are now into the second year of the downturn, during the fourth quarter we continued to see credit grade migration and increased impairment in our energy portfolio. The combination of factors necessitated a higher level of provision expense.”
Another bank, this time the far larger Regions Financial, said its fourth-quarter charge-offs jumped $18 million from the prior quarter to $78 million, largely because of problems with a single unspecified energy borrower. More than one-quarter of Regions’ energy loans were classified as “criticized” at the end of the fourth quarter.
It didn’t stop there and as the WSJ added, “It’s starting to spread” according to William Demchak, chief executive of PNC Financial Services Group Inc. on a conference call after the bank’s earnings were announced. Credit issues from low energy prices are affecting “anybody who was in the game as the oil boom started,” he said. PNC said charge-offs rose in the fourth quarter from the prior quarter but didn’t specify whether that was due to issues in its relatively small $2.6 billion oil-and-gas portfolio.
Then, on Friday, U.S. Bancorp disclosed the specific level of reserves it holds against its $3.2 billion energy portfolio for the first time. “The reason we did that is that oil is under $30” said Andrew Cecere, the bank’s chief operating officer. What else will Bancorp disclose if oil drops below $20… or $10?
It wasn’t just the small or regional banks either: as we first reported, on Thursday JPMorgan did something it hasn’t done in 22 quarter: its net loan loss reserve increased as a result of a jump in energy loss reserves. On the earnings call, Jamie Dimon said that while he is not worried about big oil companies, his bank has started to increase provisions against smaller energy firms.
Then yesterday it was the turn of the one bank everyone had been waiting for, the one which according to many has the greatest exposure toward energy: Wells Fargo. To be sure, in order not to spook its investors, among whom most famously one Warren Buffet can be found, for Wells it was mostly “roses”, although even Wells had no choice but to set aside $831 million for bad loans in the period, almost double the amount a year ago and the largest since the first quarter of 2013.
What was laughable is that the losses included $118 million from the bank’s oil and gas portfolio, an increase of $90 million from the third quarter. Why laughable? Because that $90 million in higher oil-and-gas loan losses was on a total of $17 billion in oil and gas loans, suggesting the bank has seen a roughly 0.5% impairment across its loan book in the past quarter.
How could this be? Needless to say, this struck us as very suspicious because it clearly suggests that something is going on for Wells (and all of its other peer banks), to rep and warrant a pristine balance sheet, at least until a “digital” moment arrives when just like BOK Financial, banks can no longer hide the accruing losses and has to charge them off, leading to a stock price collapse.
Which brings us to the focus of this post: earlier this week, before the start of bank earnings season, before BOK’s startling announcement, we reported we had heard of a rumor that Dallas Fed members had met with banks in Houston and explicitly “told them not to force energy bankruptcies” and to demand asset sales instead.
Rumor Houston office of Dallas Fed met with banks, told them not to force energy bankruptcies; demand asset sales instead
We can now make it official, because moments ago we got confirmation from a second source who reports that according to an energy analyst who had recently met Houston funds to give his 1H16e update, one of his clients indicated that his firm was invited to a lunch attended by the Dallas Fed, which had previously instructed lenders to open up their entire loan books for Fed oversight; the Fed was shocked by what it had found in the non-public facing records. The lunch was also confirmed by employees at a reputable Swiss investment bank operating in Houston.
This is what took place: the Dallas Fed met with the banks a week ago and effectively suspended mark-to-market on energy debts and as a result no impairments are being written down. Furthermore, as we reported earlier this week, the Fed indicated “under the table” that banks were to work with the energy companies on delivering without a markdown on worry that a backstop, or bail-in, was needed after reviewing loan losses which would exceed the current tier 1 capital tranches.
In other words, the Fed has advised banks to cover up major energy-related losses.
Why the reason for such unprecedented measures by the Dallas Fed? Our source notes that having run the numbers, it looks like at least 18% of some banks commercial loan book are impaired, and that’s based on just applying the 3Q marks for public debt to their syndicate sums.
In other words, the ridiculously low increase in loss provisions by the likes of Wells and JPM suggest two things: i) the real losses are vastly higher, and ii) it is the Fed’s involvement that is pressuring banks to not disclose the true state of their energy “books.”
Naturally, once this becomes public, the Fed risks a stampeded out of energy exposure because for the Fed to intervene in such a dramatic fashion it suggests that the US energy industry is on the verge of a subprime-like blow up.
Putting this all together, a source who wishes to remain anonymous, adds that equity has been levitating only because energy funds are confident the syndicates will remain in size to meet net working capital deficits. Which is a big gamble considering that as we first showed ten days ago, over the past several weeks banks have already quietly reduced their credit facility exposure to at least 25 deeply distressed (and soon to be even deeper distressed) names.
However, the big wildcard here is the Fed: what we do not know is whether as part of the Fed’s latest “intervention”, it has also promised to backstop bank loan losses. Keep in mind that according to Wolfe Research and many other prominent investors, as many as one-third of American oil-and-gas producers face bankruptcy and restructuring by mid-2017 unless oil rebounds dramatically from current levels.
However, the reflexive paradox embedded in this problem was laid out yesterday by Goldman who explainedthat oil could well soar from here but only if massive excess supply is first taken out of the market, aka the “inflection phase.” In other words, for oil prices to surge, there would have to be a default wave across the US shale space, which would mean massive energy loan book losses, which may or may not mean another Fed-funded bailout of US and international banks with exposure to shale.
What does it all mean? Here is the conclusion courtesy of our source:
If revolvers are not being marked anymore, then it’s basically early days of subprime when mbs payback schedules started to fall behind. My question for bank eps is if you issued terms in 2013 (2012 reserves) at 110/bbl, and redetermined that revolver in 2014 at 86, how can you be still in compliance with that same rating and estimate in 2016 (knowing 2015 ffo and shut ins have led to mechanically 40pc ffo decreases year over year and at least 20pc rebooting of pud and pdnp to 2p via suspended or cancelled programs). At what point in next 12 months does interest payments to that syndicate start to unmask the fact that tranch is never being recovered, which I think is what pva and mhr was all about.
Beyond just the immediate cash flow and stock price implications and fears that the situation with US energy is much more serious if it merits such an intimate involvement by the Fed, a far bigger question is why is the Fed once again in the a la carte bank bailout game, and how does it once again select which banks should mark their energy books to market (and suffer major losses), and which ones are allowed to squeeze by with fabricated marks and no impairment at all? Wasn’t the purpose behind Yellen’s rate hike to burst a bubble? Or is the Fed less than “macro prudential” when it realizes that pulling away the curtain on of the biggest bubbles it has created would result in another major financial crisis?
The Dallas Fed, whose new president Robert Steven Kaplan previouslyworked at Goldman Sachs for 22 years rising to the rank of vice chairman of investment banking, has not responded to our request for a comment as of this writing. ( source: ZeroHedge )
Fed Response
Over the weekend, we gave the Dallas Fed a chance to respond to a Zero Hedge story corroborated by at least two independent sources, in which we reported that Federal Reserve members had met with bank lenders with distressed loan exposure to the US oil and gas sector and, after parsing through the complete bank books, had advised banks to i) not urge creditor counterparties into default, ii) urge asset sales instead, and iii) ultimately suspend mark to market in various instances.
Moments ago the Dallas Fed, whose president since September 2015 is Robert Steven Kaplan, a former Goldman Sachs career banker who after 22 years at the bank rose to the rank of vice chairman of its investment bank group – an odd background for a regional Fed president – took the time away from its holiday schedule to respond to Zero Hedge.
We thank the Dallas Fed for their prompt attention to this important matter. After all, as one of our sources commented, “If revolvers are not being marked anymore, then it’s basically early days of subprime when MBS payback schedules started to fall behind.” Surely there is nothing that can grab the public’s attention more than a rerun of the mortgage crisis, especially if confirmed by the highest institution.
As such we understand the Dallas Fed’s desire to avoid a public reaction and preserve semantic neutrality by refuting “such guidance.”
That said, we fully stand by our story, and now that we have engaged the Dallas Fed we would like to ask several very important follow up questions, to probe deeper into a matter that is of significant public interest as well as to clear up any potential confusion as to just what “guidance” the Fed is referring to.
Has the Dallas Fed, or any other members and individuals of the Federal Reserve System, met with U.S. bank and other lender management teams in recent weeks/months and if so what was the purpose of such meetings?
Has the Dallas Fed, or any other members and individuals of the Federal Reserve System, requested that banks and other lenders present their internal energy loan books and loan marks for Fed inspection in recent weeks/months?
Has the Dallas Fed, or any other members and individuals of the Federal Reserve System, discussed options facing financial lenders, and other creditors, who have distressed credit exposure including but not limited to:
avoiding defaults on distressed debtor counter parties?
encouraging asset sales for distressed debtor counter parties?
advising banks to avoid the proper marking of loan exposure to market?
advising banks to mark loan exposure to a model framework, one created either by the creditors themselves or one presented by members of the Federal Reserve network?
avoiding the presentation of public filings with loan exposure marked to market values of counter party debt?
Was the Dallas Fed, or any other members and individuals of the Federal Reserve System, consulted before the January 15, 2016 Citigroup Q4 earnings call during which the bank refused to disclose to the public the full extent of its reserves related to its oil and gas loan exposure, as quoted from CFO John Gerspach:
“while we are taking what we believe to be the appropriate reserves for that, I’m just not prepared to give you a specific number right now as far as the amount of reserves that we have on that particular book of business. That’s just not something that we’ve traditionally done in the past.”
Furthermore, if the Dallas Fed, or any other members and individuals of the Federal Reserve system, were not consulted when Citigroup made the decision to withhold such relevant information on potential energy loan losses, does the Federal Reserve System believe that Citigroup is in compliance with its public disclosure requirements by withholding such information from its shareholders and the public?
If the Dallas Fed does not issue “such” guidance to banks, then what precisely guidance does the Dallas Fed issue to banks?
Since the Fed is an entity tasked with serving the public, and since it took the opportunity to reply in broad terms to our previous article, we are confident that Mr. Kaplan and his subordinates will promptly address these follow up concerns.
Finally, in light of this official refutation by the Dallas Fed, we are confident that disclosing the Fed’s internal meeting schedules is something the Fed will not object to, and we hereby request that Mr. Kaplan disclose all of his personal meetings with members of the U.S. and international financial system since coming to office, both through this article, and through a FOIA request we are submitting concurrently. (source: ZeroHedge)
Fed Scrambles as Oil ETN Premium Soars to New Highs
Over the weekend, Zero Hedge reported exclusively how the Dallas Fed is pulling strings behind the scenes to conceal the fallout from the oil market crash. By suspending mark-to-market on energy loans and distorting the accounting, they are postponing the inevitable as long as possible. The current situation is eerily reminiscent to the heyday of the mortgage market in 2007, when mortgage defaults started to pick up, and yet the credit default swaps that tracked them continued to decline, bringing losses to those brave enough to trade against the crowd.
Amidst the market chaos on Friday, a trader brought something strange to my attention. He asked me exactly what the hell was going on with this ETN he was watching. I took a closer look and was baffled. It took me awhile to put the pieces together. Then when I saw the story about mark-to-market being suspended, it all made sense.
Here is the daily premium for the last 6 months on the Barclays iPath ETN that tracks oil:
Initially, I thought this was merely a sign of retail desperation. As they faced devastating losses on their oil stocks, small investors turned to products like oil ETNs as they tried to grasp the elusive oil profits their financial adviser promised them a year ago. Oblivious to the cruel mechanics of ETNs, they piled in head first, in spite of the soaring premium to fair value. After all, Larry Fink is making the rounds to convince the small investor that ETFs are indeed safer than mutual funds. Because nothing says “safe” like buying an ETN that is 36% above its fair value.
Sure, there are differences between ETFs and ETNs, particularly regarding their solvency in the event of an issuer default, but the premium/discount problem plagues ETFs and ETNs alike. Nonetheless, widely trusted retail sources of investment information perpetuate the myth that ETNs do not have tracking errors.
I thought I had connected the dots on the Oil ETN story. It was just retail ignorance. Then I saw this comment from a Zero Hedge reader:
He had a point. On Friday, stocks were slammed, and the team known as 3:30 Ramp Capital was noticeably absent.
The current stock market decline began with transportation stocks and small capitalization stocks severely under-performing the market.
Weakness then spread to the energy complex and high-yield bonds.
Yield focused stocks were the next to fall, with Kinder Morgan being the most prominent example.
Stalwarts like Apple and Gilead lost their momentum with the August 2015 decline and never regained their mojo.
In 2016, a slow motion crash is occurring in the stock market, and the price action has finally impacted the leading FANG stocks.
“Hysteria is impossible without an audience. Panicking by yourself is the same as laughing alone in an empty room. You feel really silly.” – Chuck Palahniuk
“Life is ten percent what you experience and ninety percent how you respond to it.” – Dorothy M. Neddermeyer
Introduction:
The stock market decline has gained momentum in 2016, and much like a runaway train, the current decline will be hard to stop, until the persistent overvaluations plaguing the stock market over this current bull market are corrected.
The correction that has caused the average stock in the United States to correct over 25%, thus far, started as an innocuous move down in global equities, outside of the depression enveloping the downtrodden emerging markets and commodities stocks, and then spread from transportation stocks to market leaders like biotechnology companies. The first wave down culminated in a gut-wrenching August 2015 sell-off that saw the Dow Jones Industrial Average (NYSEARCA:DIA) fall 1000 points at the open on August 24th, 2015. The panic was quickly brushed aside, but not forgotten, as market leading stocks made new highs in the fall of 2015.
That optimism, has given way to the reality that global quantitative easing has not provided the boost that its biggest supporters claimed. Now, everything is falling in tandem, and there is not much hope with the Fed nearly out of bullets, other than perhaps lower energy prices, to spark a true recovery.
The financial markets have taken notice, and are repricing assets accordingly. Just like forays to the upside are not one way affairs, the move down will not be a one-way adjustment, and investors should be prepared for sharp counter-trend rallies, and the price action yesterday, Thursday, January 14th, 2016 is a perfect example. To close, with leading stocks now suffering sizable declines that suggest institutional liquidation, investors should have their respective defensive teams on the field, and be looking for opportunistic, out-of-favor investments that have already been discounted.
Thesis:
The market correction is gaining steam and will not be completed until leading stocks and market capitalization indexes correct materially.
Small-Caps & Transports Led The Downturn:
While U.S. stocks have outperformed international markets since 2011, 2014 and 2015 saw the development of material divergences. Specifically, smaller capitalization stocks, measured by the Russell 2000 Index, and represented by the iShares Russell 2000 ETF (NYSEARCA:IWM), began under performing in 2014. Importantly, small-caps went on to make a new high in 2015, but their negative divergence all the way back in 2014, planted the seeds for the current decline, as illustrated in the chart below.
Building on the negative divergences, transportation stocks began severely under performing the broader markets in 2015. To illustrate this, I have used the charts of two leading transportation stocks, American Airlines (NASDAQ:AAL) and Union Pacific Corporation (NYSE:UNP), which are depicted below. For the record, I have taken a fundamental interest in both companies as I believe they are leading operators in their industries.
The Next Dominoes – Oil Prices & High Yield Bonds:
Oil prices, as measured by the United States Oil Fund (NYSEARCA:USO) in the chart below, were actually one of the first shoes to drop, even prior to small-cap stocks, starting a sizable move down in June of 2014.
Industry stalwart Chevron Corporation (NYSE:CVX) peaked in July of 2014, and despite tremendous volatility since then, has been in a confirmed downtrend.
As the energy complex fell apart with declining oil prices, high-yield bonds, as measured by the iShares iBoxx High Yield Corporate Bond Fund (NYSEARCA:HYG), and by the SPDR Barclays High Yield Bond ETF (NYSEARCA:JNK), made material new lows.
Yield Focused Stocks Take It On The Chin
As the energy downturn intensified, many companies that had focused on providing attractive yields, to their yield starved investors, saw their business models questioned at best, and implode at worst. The most prominent example was shares of Kinder Morgan (NYSE:KMI).
The fallout did not stop with KMI, as many MLP s and other yield oriented stocks continue to see declines as 2015 has rolled into 2016. Williams Companies (NYSE:WMB) has been especially hard hit, showing extreme volatility over the past several weeks.
Leading GARP Stocks Never Recovered:
Even though I have been bearish on the markets for some time, I was not sure if the markets would melt-up or meltdown in December of 2015, as I articulated in a Seeking Alpha article at the time.
In hindsight, the under performance of growth-at-a-reasonable-price stocks, like Apple (NASDAQ:AAPL) and Gilead Sciences (NASDAQ:GILD), which had struggled ever since the August 2015 sell-off, should have been an ominous sign.
FANG Stocks, The Last Shoe To Drop:
Even as many divergences developed in the financial markets over the last year, many leading stocks made substantial new highs in the fall of 2015, led by the FANG stocks. Facebook (NASDAQ:FB), Amazon (NASDAQ:AMZN), Netflix (NASDAQ:NFLX), and Alphabet (NASDAQ:GOOG) (NASDAQ:GOOGL), along with NASDAQ stalwarts Microsoft (NASDAQ:MSFT) and Starbucks (NASDAQ:SBUX), attracted global capital as growth became an increasingly scarce commodity. The last two weeks have challenged the assumption that these companies are a safe-haven, immune from declines impacting the rest of the stock market, as the following charts show.
The PowerShares QQQ ETF (NASDAQ:QQQ), which is designed to track the performance of the NASDAQ 100 Index, and counts five of the world’s ten largest market capitalization companies among its largest holdings, Apple, Alphabet, Microsoft, Amazon, and Facebook, has outperformed the S&P 500 Index, as measured by the SPDRs S&P 500 ETF (NYSEARCA:SPY), for a majority of the current bull market, with a notable exception being the last week of 2015, and the first two weeks of 2016. Wholesale, sustained selling is now starting to grip the markets.
Conclusion – The Market Downturn Is Gaining Momentum:
The developing market correction is gaining momentum. Like an avalanche coming down a mountain, it is impacting everything it touches, and no sectors or companies, even the previously exalted FANG stocks, are immune from its reaches. Investors should have their respective defensive teams on the field, while looking for opportunities in undervalued, out-of-favor assets, as many stocks have been in their own bear markets for years.
Collapse in crude oil prices is a huge blow to areas where oil extraction and associated industries are the bread and butter of the economy.
As petro-economies suffer from the bust in crude prices, the effects are showing up in the housing market.
Take North Dakota, for example, which was on the front lines of the oil boom between 2011 and 2014. In fact, North Dakota is probably the most vulnerable to a downturn in housing because of low oil prices. The economy is smaller and thus more dependent on the oil boom than other places, such as Texas. The state saw an influx of new workers over the past few years, looking for work in in the prolific Bakken Shale. A housing shortage quickly emerged, pushing up prices. With the inability to house all of the new people, rent spiked, as did hotel rates. The overflow led to a proliferation of “man camps.”
Now the boom has reversed. The state’s rig count is down to 53 as of January 13, about one-third of the level from one year ago. Drilling is quickly drying up and production is falling. “The jobs are leaving, and if an area gets depopulated, they can’t take the houses with them and that’s dangerous for the housing market,” Ralph DeFranco, senior director of risk analytics and pricing at Arch Mortgage Insurance Company, told CNN Money.
New home sales were down by 6.3 percent in North Dakota between January and October of 2015 compared to a year earlier. Housing prices have not crashed yet, but there tends to be a bit of a lag with housing prices. JP Ackerman of House Canary says that it typically takes 15 to 24 months before house prices start to show the negative effects of an oil downturn.
According to Arch Mortgage, homes in North Dakota are probably 20 percent overvalued at this point. They also estimate that the state has a 46 percent chance that house prices will decline over the next two years. But that is probably understating the risk since oil prices are not expected to rebound through most of 2016. Moreover, with some permanent damage to the balance sheets of U.S. shale companies, drilling won’t spring back to life immediately upon a rebound in oil prices.
There are some other states that are also at risk of a hit to their housing markets, including Wyoming, West Virginia and Alaska. Out of those three, only Alaska is a significant oil producer, but it is in the midst of a budget crisis because of the twin threats of falling production and rock bottom prices. Alaska’s oil fields are mature, and have been in decline for years. With a massive hole blown through the state’s budget, the Governor has floated the idea of instituting an income tax, a once unthinkable idea.
The downturn in Wyoming and West Virginia has more to do with the collapse in natural gas prices, which continues to hollow out their coal industries. Coal prices have plummeted in recent years, and coal production is now at its lowest level since the Reagan administration. Shale gas production, particularly in West Virginia, partially offsets the decline, but won’t be enough to come to the state’s rescue.
Texas is another place to keep an eye on. However, Arch Mortgage says the economy there is much larger and more diversified than other states, and also better equipped to handle the downturn than it was back in the 1980s during the last oil bust.
But Texas won’t escape unscathed. The Dallas Fed says job growth will turn negative in a few months if oil prices don’t move back to $40 or $50 per barrel. Texas is expected to see an additional 161,200 jobs this year if oil prices move back up into that range. But while that could be the best-case scenario, it would still only amount to one-third of the jobs created in 2014. “The biggest risk to the forecast is if oil prices are in the range of $20 to $30 for much of the year,” Keith Phillips, Dallas Fed Senior Economist, said in a written statement. “Then I expect job growth to slip into negative territory as Houston gets hit much harder and greater problems emerge in the financial sector.”
After 41 consecutive months of increases in house prices in Houston, prices started to decline in third quarter of 2015. In Odessa, TX, near the Permian Basin, home sales declined by 10.6 percent between January and October 2015 compared to a year earlier.
Most Americans will still welcome low prices at the pump. But in the oil boom towns of yesterday, the slowdown is very much being felt.
Term structure – contango says too much oil around.
Brent-WTI says Iran will flood the market.
Crack spreads could crack the recent lows for crude.
OPEC meeting is the next big event – signals are that these guys cannot agree on anything.
Crude oil and a turbulent world.
The price of crude oil has not looked this bad since March, when it made lows of $42.03, or on August 24, when it fell to $37.75. On Friday, November 20, active month January NYMEX crude oil settled at $41.90 per barrel. The expiring December contract traded down to lows of $38.99 on the session. There are very few positive things to say about the future prospects for the price of crude oil at this time. The fundamental structural state of the oil market is bearish for price.
Term Structure – contango says too much oil around
Two weeks ago, the IEA told us that the world is awash in crude oil. The international agency told us that worldwide inventories have swelled to 3 billion barrels.
When crude oil was trading over $100 per barrel on the active month NYMEX futures contract during the summer of 2014, the market was in backwardation. Deferred futures prices were lower than nearby prices. This condition tells us that a market is tight, or there is a supply deficit. As the price of oil began to fall, term structure moved from backwardation to contango. This told us that the market moved from deficit to a condition of oversupply. This past week, the contango on the nearby versus one-year oil spread once again validated the glut condition in crude oil.
(click to enlarge)The December 2015 versus December 2016 NYMEX crude oil spread closed last week at over $8.00 per barrel. The contango has increased to 20.46%, the highest level yet for this spread. The January 2016 versus January 2017 NYMEX spread also made a new high and traded above the $7 level.
Brent crude oil futures have rolled from December to January. The January 2016 versus January 2017 Brent crude oil spread was trading around the $7.62 or 17% level last Friday. Market structure is telling us that huge inventories of crude oil will weigh on the price in the weeks ahead. At their current levels, a new low below the current support at $37.75 seems likely. Meanwhile, a location/quality spread in crude oil is also telling us that prospects for the oil price are currently bleak.
Brent-WTI says Iran will flood the market
The benchmark for pricing North American crude is the NYMEX West Texas Intermediate (WTI) price. When it comes to European, African and Middle Eastern crudes, Brent is the benchmark pricing mechanism. For many years, Brent crude traded at a small discount to WTI. That is because WTI is sweeter crude; it has lower sulfur content. This makes WTI more efficient when it comes to processing the oil into the most ubiquitously consumed oil product, gasoline.
That changed in 2010. The Arab Spring caused uncertainty in the Middle East to rise. As the majority of the world’s oil reserves are located in this region, the price of Brent crude rose relative to the price of WTI. Brent crude included a political premium. Additionally, increasing production from the United States, due to the extraction of oil from shale, exacerbated the price differential between the two crudes. In 2011, the price of Brent traded at over a $25 premium to the price of WTI. Recently, the spread between these two crudes has been converging. While the spread on January futures was trading at a premium of $2.40 for the Brent futures as of last Friday, it had moved much lower during the week.
The premium of Brent over WTI has evaporated over the course of 2015. The reason is two-fold. First, the number of operating oil rigs in the United States has fallen dramatically over the past year, indicating that production of the energy commodity will fall. Last Friday, Baker Hughes reported that the total number of oil rigs in operation as of November 20 stands at 564 down from 1,574 at this time last year. While lower U.S. production is one reason for a decline in the spread, increased production of Iranian crude oil has had a more powerful effect on the spread.
The nuclear nonproliferation agreement with Iran means that sanctions will ease and Iran will pump and export more crude oil in the weeks and months ahead. Iran has stated that their production will initially rise by 500,000 barrels per day and it will eventually rise to over one million. These two factors have caused the Brent-WTI spread to converge. The price trend in this spread is a negative for the price of crude at this time.
Crack spreads could crack the recent lows for crude
Recently, we have seen divergence emerging in crude oil processing spreads. Gasoline cracks have been outperforming crude oil, while heating oil crack spreads continue to trade at the weakest level in years.
Last Friday, the NYMEX gasoline crack spread closed at just over $14 per barrel.
The monthly chart of the gasoline crack highlights the recent strong action in this spread. Gasoline is a seasonal product; it tends to trade at the lows during this time of year. In 2014, the high in the gasoline crack at this time of year was $12.36. Therefore, compared to last year, gasoline prices are strong relative to the price of raw crude oil. This could be due to the current low level of gasoline futures – the December NYMEX gasoline futures contract closed last Friday at $1.2866 and the January futures closed at $1.2670 per gallon. The current low level of gasoline prices has increased demand from drivers as refineries work to process heating oil as the winter is only a few weeks ahead. In September U.S. drivers set a record for miles traveled by automobile.
The heating oil processing spread is a very different story. While the gasoline crack is relatively strong, the heating oil crack is very weak.
(click to enlarge)Last Friday, the January heating oil processing spread closed at around the $17.50 per barrel level. Last year at this time, the low in this spread was $22.73. In 2013, the low was $24.53 and in 2012, the low was $37.75 per barrel. The current level of the heating oil crack spread is seasonally the lowest since November 2010 when it traded down to $12.35 per barrel. In November 2010, crude oil was trading above $84 per barrel.
One of the many reasons that the crude oil price is weak these days is that demand for seasonal products, heating oil and diesel fuel, is low and inventories of distillates are high. As you can see, there are very few bullish signs in the fundamental structure for the crude oil market these days. In two weeks, the oil cartel will sit down to decide what to do now that the commodity they seek to “control” is awash in a sea of bearishness.
OPEC meeting is the next big event – Signals are that these guys cannot agree on anything
When OPEC met in November 2014, the price of crude was around the $75 per barrel level. When they met late last spring, the price had recovered to around $60. In both cases, the cartel left production levels unchanged. The stated production ceiling for the members of OPEC is 30 million barrels per day. The member nations are currently producing over 31.5 million barrels per day and increasing Iranian production means that OPEC output will likely rise. As the price of oil falls, the members need to sell more to try to recoup revenue. For the weaker members, the oil revenue is an imperative. Even the stronger members are under pressure. Saudi Arabia recently began selling bonds; they are borrowing money from the markets to replace lost income due to the lower crude oil price.
Meanwhile, OPEC’s current strategy is to continue to produce to flush high cost producers out of the market and build market share for the cartel members. However, OPEC did not count on a global economic slowdown, particularly in China. At the December 4 meeting of oil ministers in Vienna, it is likely that demand for crude oil will be an important consideration.
Dominant members of the cartel remain at odds. Saudi Arabia and Iran are on opposite sides and are involved in a proxy war in Yemen. The weaker members of OPEC want the stronger members to shoulder the burden of production cuts, and that is not likely to happen any time soon. In a hint of the discord between the member nations, on November 17, OPEC’s board of governors was unable to agree on the cartel’s long-term strategy plan and they tabled the issue until 2016. The issues revolve around ceiling output, setting production quotas and methods of maximizing member profits.
This tells us that unless the cartel is planning a giant spoof on the market, there is probably going to be no change in production policy. The current level of cheating or daily sales above the production ceiling may even increase. At this point, I doubt whether OPEC members could agree on whether it is sunny or cloudy outside given vast political, economic and cultural divergences among member nations. This means that selling will continue and even increase over the months ahead.
Crude oil and a turbulent world
All of the news, fundamentals and technicals for crude oil point to new lows and a challenge of the December 2008 lows of $32.48 per barrel. Last week, Goldman Sachs came out with a prediction that oil could fall to $20 per barrel. This is not such a bold call given the current state of the oil market, the strength of the dollar and the overall bear market for raw material prices. Last week, copper put in another multi-year low, iron ore fell to new lows and the Baltic Shipping Index fell to the lowest level since 1985.
However, all of the bad news for crude oil is currently in the price. We have seen this before. In March when crude oil traded to lows, there were calls for crude oil to fall – Dennis Gartman, the respected commodity analyst, went on CNBC and said that crude oil could fall to $10 per barrel as the energy commodity could go the way of “whale oil.” In late August, when oil fell to recent lows at $37.75, there were multiple calls for oil to fall to the low $30s and $20s. In both cases, powerful recovery rallies followed these bearish market calls. Following the March 2015 lows, oil rallied for over two months and gained 48.9%. In August of this year, a seven-week rally took oil 35% higher. The bearish prediction by Goldman Sachs last week could just turn out to be a contrarian’s dream.
There are a number of issues, big issues, going on in the world that can turn crude oil on a dime. First, Brent has fallen relative to WTI and the political premium for oil has evaporated. In 1990, when Saddam Hussein invaded Kuwait, the price of crude oil doubled in a matter of minutes. While the Middle East has always been a turbulent and dangerous part of the world, I would argue that today, it is far more turbulent and far more violent. The odds of attacks against oil fields and refineries in the Middle East have increased exponentially particularly given the recent ISIS attacks in France and around the world. At the same time, all of the bearish fundamental news about crude oil has decreased the political premium, and it is politics and war that could turn out to outweigh all of the current fundamentals.
Moreover, a surprise from outside of the Middle East could foster an increase in the price of oil. The world is now almost counting on Chinese economic weakness. Last week, Jamie Dimon, the Chairman of JPMorgan Chase, said that he is bullish on Chinese growth. If China does begin to show signs of growth, this could turn out to be supportive of crude oil and commodities in general, which remain mired in a bear market. Right now, the price of crude oil looks awful and fundamentals support a new low. However, all of that bearish data is in the price, and any surprise, in a world that always seems be full of surprises, could ignite the price once again. We saw this in March and again in August. As oil makes new lows, keep in mind that crude oil is a complicated puzzle. It is the unknown that will likely dictate the next big price move in oil. I am watching crude oil now and wondering whether Goldman Sachs called the turn in the market with their bearish forecast.
As a bonus, I have prepared a video on my website Commodix that provides a more in-depth and detailed analysis of the current state of the oil market to illustrate the real value implications and opportunities.
The moon was a waning crescent sliver Sept. 9 when a man emerged from an oil tanker, sidled up to a well outside Cotulla, Texas, and siphoned off almost 200 barrels. Then, he drove two hours to a town where he sold his load on the black market for $10 a barrel, about a quarter of what West Texas Intermediate currently fetches.
“This is like a drug organization,” said Mike Peters, global security manager of San Antonio-based Lewis Energy Group, who recounted the heist at a Texas legislative hearing. “You’ve got your mules that go out to steal the oil in trucks, you’ve got the next level of organization that’s actually taking the oil in, and you’ve got a gathering site — it’s always a criminal organization that’s involved with this.”
From raw crude sucked from wells to expensive machinery that disappears out the back door, drillers from Texas to Colorado are struggling to stop theft that has only worsened amid the industry’s biggest slowdown in a generation. Losses reached almost $1 billion in 2013 and likely have grown since, according to estimates from the Energy Security Council, an industry trade group in Houston. The situation has been fostered by idled trucks, abandoned drilling sites and tens of thousands of lost jobs.
“You’ve got unemployed oilfield workers that unfortunately are resorting to stealing,” said John Chamberlain, executive director of the Energy Security Council.
In Texas, unemployment insurance claims from energy workers more than doubled over the past year to about 110,000, according to the Workforce Commission. In North Dakota, average weekly wages in the Bakken oil patch decreased nearly 10 percent in the first quarter of 2015, compared with the previous quarter, according to the Federal Reserve Bank of Minneapolis.
With dismissals hitting every corner of the industry, security guards hired during boom times are receiving pink slips. That’s leaving sites unprotected.
“There are a lot less eyes out there for security,” said John Esquivel, an analyst at security consulting firm Butchko Inc. in Tomball, Texas, and a former chief executive of the U.S. Border Patrol in Laredo. “The drilling activity may be quieter, but I don’t think criminal activity is.”
Special Charges
States are trying to get a handle on the theft, which can include anything from drill bits that can fetch thousands on the resale market, to copper wiring that can be melted down, to the crude itself. Texas lawmakers met earlier this month in Austin to craft a bill that would increase penalties related to the crime. A similar measure passed both houses of the legislature this year, but Republican Governor Greg Abbott vetoed it, saying it was “overly broad.” Lawmakers, at the urging of industry, are hoping to revive it next legislative session.
In Oklahoma, law-enforcement officers recently teamed with the Federal Bureau of Investigation to intensify their effort. In North Dakota, the FBI earlier this year opened an office in the heart of oil country to combat crimes including theft, drug trafficking and prostitution.
The lull in drilling has given oil companies more time to scrutinize their operations — and their losses.
During booms “they are moving at such a rapid pace there’s not a lot of auditing and inventorying going on,” said Gary Painter, sheriff in Midland County, Texas, in the oil-rich Permian Basin. “Whenever it slows down, they start looking for stuff and find out it never got delivered or it got delivered and it’s gone.”
Oil theft is as old as Spindletop, the East Texas oilfield that spewed black gold in 1901 and began the modern oil era. In the early 1900s, Texas Rangers were often deployed to carry out “town taming” in oil fields rife with roughnecks, prostitutes, gamblers and thieves. In 1932, 18 men were indicted for their role in a Mexia ring that included prominent politicians and executives and resulted in the theft of 1 million barrels.
The allure of ill-gotten oil money remains strong.
In April, the Weld County Sheriff’s office in Colorado recovered almost $300,000 worth of stolen drill bits. In January, a Texas man pleaded guilty to stealing three truckloads of oil worth nearly $60,000 after an investigation by the FBI and local law-enforcement officers. Robert Butler, a sergeant at the Texas Attorney General’s Office whose primary job is to investigate oil theft, said in the legislative hearing that he is investigating a case of 470,000 barrels stolen and sold over the past three years worth about $40 million.
In Texas, oilfield theft has become entangled with Mexican drug trafficking, as the state’s newest and biggest production area, the Eagle Ford Shale region, lies along traditional smuggling routes. That’s thrust oil workers in the middle of cartel activity, and made it even more difficult to track stolen goods across the U.S.-Mexico border, said Esquivel, the retired Border Patrol agent.
Trickling Away
Oil thieves are a slippery bunch. Criminals sand off serial numbers of stolen goods to evade detection or melt them for scrap. Tracking raw crude is even trickier, since tracing it to its originating well is almost impossible once it’s mixed with other oil. Many companies fail to report the crime, making it difficult for investigators to trace the origins of stolen goods.
Many of the crimes are inside jobs, with thieves doubling as gate guards, tank drivers or well servicers. Last year, a federal grand jury indicted three Texas men in connection with the theft of $1.5 million worth of oil from their employers, including Houston’s Anadarko Petroleum Corp.
“Your average person wouldn’t know the value of a drill bit or a piece of tubing or a gas meter,” said Chamberlain. “It’d be like breaking into a jewelry store; unless you know what’s valuable, you wouldn’t know what to steal.”
Crude oil prices closed down 4% yesterday, breaking through a 2-month support level at $57/barrel, after an EIA report showed an unexpected build in inventories.
I argue that the domestic supply/demand balance has not improved and is just as bearish now as it was last winter when oil was in free fall.
Based on my analysis of supply/demand data presented in this article, I believe crude oil has further to fall.
My trading strategy, including holdings, price targets, and entry/exit points are discussed in detail.
After trading tightly range-bound between $58/barrel and $61/barrel since mid-April, crude oil finally broke down yesterday, after an EIA Petroleum report showed that crude oil inventories increased more than expected. The commodity slid 4.2% – its largest single-day loss since April 8 – to a 9-week low closing price of $56.92/barrel. The commodity is down 6.6% since recording a peak of $61/barrel one week ago on Tuesday. Further weighing on prices were unclear reports of a draft of an Iranian nuclear deal that would relax sanctions and permit a resumption of exports, as well as continued fears over Greece’s exit from the eurozone. This article will discuss yesterday’s EIA inventory report and use this data to support my argument that crude oil supply and demand remain just as unbalanced presently as when oil was trading at $45 per share, justifying my continued bearish position on the commodity.
In yesterday’s Petroleum Report for the week ending June 26, the EIA announced that crude oil inventories increased by 2.4 million barrels, versus the analyst consensus for a 2-million barrel storage withdrawal. The storage build was also markedly bearish compared to last week’s 4.9 million barrel withdrawal, last year’s 3.2 million barrel withdrawal and the 5-year average 4.1 million barrel withdrawal. It was the first storage injection in 9 weeks since the week ending April 24. Storage injections during the final week of June are highly unusual, and last week’s build was the first storage injection during the last week of June since the week ending June 29, 2007, and only the third this millennium.
At 480 million barrels, total crude oil storage is 90 million barrels above the five-year average inventory level and 80 million barrels above last year’s level, versus a 84 and 75 million barrel surplus last week, respectively. The increase in crude oil surplus is a sharp departure from the past two months which had seen surpluses, versus the five-year average decline in 8 of the past 9 weeks from a peak of over 113 million barrels. Figure 1 below shows the storage surplus versus the five-year average and 2014 over the past year.
(click to enlarge)
Figure 1: Crude oil storage surplus versus 2014 and the 5-year average showing an increase in the surplus after several weeks of decline. [Source: Chart is my own, data from the EIA.]
What happened over the past week that led to such an abrupt change in crude oil supply/demand balance?
Not much, I argue. And that is the problem.
There are three components of US supply/demand balance – domestic production, demand (measured by refinery inputs), and imports.
Domestic production was largely unchanged last week, declining by 9,000 barrels per day, from 9.604 million barrels per day the previous week to 9.595 million barrels last week. Domestic production remains at record highs, despite an oil rig count that has fallen 60% since October. Production is up 1.2 million barrels year-over-year.
Crude oil demand was likewise flat week-over-week, declining a negligible 1,000 barrels per day last week to 16.531 million barrels per day. Demand is up 313,000 barrels per day year-over-year. Note that this is well shy of the 1.2 million barrel per day year-over-year increase in production. As a result, the purely domestic supply/demand picture – demand minus US production – is markedly loose compared to last year. Figure 2 below compares the purely domestic supply/demand picture for 2015 versus 2014.
(click to enlarge)
Figure 2: Purely domestic crude oil supply/demand balance equal to demand minus domestic production. Supply/demand remains loose to 2014 and has been flat over the past 2 months, indicating minimal tightening of the market. [Source: Chart is my own, data from the EIA.]
Note that last year at this time, demand exceeded domestic production by 7.8 million barrels per day, while last week, this spread was just 6.9 million barrels. Further, despite all of the hullabaloo over record demand and declining domestic production, this spread is sitting near the 2015-to-date average of 6.6 million barrels, and has been essentially flat since late April.
It is the third component of the US supply/demand picture – imports – that drove last week’s bearish storage build and had been masking the persistent supply/demand mismatch shown above in Figure 2 that allowed crude oil to rally more than 30% off the March lows. Imports increased by 748,000 barrels per day last week to 7.513 million barrels per day. It was the largest week-over-week increase since the week ending April 3rd and the largest daily average since the week of April 17th. Nevertheless, the 7.5 million barrel per day tally was a mere 170,000 barrels per day above the 1-year average import level. Figure 3 below plots crude oil imports versus the 1-year average over the last 12 months.
(click to enlarge)
Figure 3: Crude oil imports versus the 1-year average. After 2 months well below the 1-year average, crude oil demand rebounded last week. [Source: Chart is my own, data from the EIA.]
Note that after hovering in the 6.75-7.25 million barrel per day range since late April, last week’s imports were merely a return to the baseline. Furthermore, imports have room to go even higher. Figure 4 below shows the week-over-week change and the departure from 2015-to-date average imports by country.
(click to enlarge)
Figure 4: Crude oil imports by nation with week-over-week and departure versus the 2015 average included. While imports from Canada rebounded last week, large deficits versus the 2015 average remain in Canada, Saudi Arabia, and Mexico. [Source: Chart is my own, data from the EIA.]
Note that the second-largest weekly increase in imports last week came from our biggest oil trading partner, Canada, where imports increased by 142,000 barrels per day. However, thanks to persistent wildfires in Alberta’s prolific oil sands, imports are still 187,000 barrels per day below their 2015 average. As these wildfires have largely diminished, I expect Canadian imports will continue to increase, from 2.8 million barrels per day last week back to their 3.0 million barrel per day 2015 average in coming weeks. An even more impressive departure versus the 2015 average was seen in Saudi Arabia, where imports remained flat at 700,000 barrels per day last week, more than 250,000 barrels below their 2015 average of 992,000 barrels per day. Saudi Arabia is a country whose rig count is at record highs and which is spearheading the effort to destroy the US shale oil industry, so I expect these imports will recover rapidly over the next month. Finally, our third-largest trading partner, Mexico, saw its imports slide 290,000 barrels per day last week, and currently sit 215,000 barrels per day below its 2015 average – likely another short-term anomaly. Were just these three countries to have had their imports at 2015 baseline levels, last week’s storage build would have been a massive 7.1 million barrels. The gains seen in Venezuela, Kuwait, and other smaller trading partners that sent tallies above their 2015 averages may be at least partially attributable to a surge in Gulf Coast imports following delays caused by Tropical Storm Bill, and therefore, may decline in coming weeks. However, I expect the net change in imports to be upwards over the next month, putting further pressure on the supply/demand balance.
My rationale for emphasizing imports compared to US production and demand is that I believe that they have been artificially creating the appearance of a tightening supply/demand balance. Thanks to wildfires in Canada, Tropical Storm Bill interrupting shipments in the Gulf of Mexico, and unrest in the Middle East, imports during April, May, and early June (as shown in Figure 3) were depressed below the five-year average. This correlated strongly with a transition to storage withdrawals that helped to fuel the back-end of crude oil’s 30% rally from the March low of $43/barrel to $61/barrel. Figure 5 below compares crude oil weekly storage injections/withdrawals to imports.
(click to enlarge)
Figure 5: Crude oil storage changes versus imports. There is a strong correlation between storage withdrawals between May and late June and a decline in imports. Storage injections resumed last week, following a surge in imports. This supports imports being the major driver of the domestic supply/demand balance over the past few months. [Source: Chart is my own, data from the EIA.]
During this same period (as shown in Figure 2), domestic production and demand remained relatively unchanged. As a result, I firmly believe that the decline in imports hoodwinked many investors into thinking that the supply/demand balance was permanently tightening, due either to increasing demand from cheap oil or declining production from the declining rig count, when it was really a temporary drop in imports. Now that imports have returned to a baseline level, this “masking” of the supply/demand balance has been lifted, and the result was a bearish injection similar to those seen during oil’s springtime free fall – but during a time when the market expects withdrawals. It is therefore unsurprising that oil retreated to the tune of 4% yesterday.
What I believe to be even more concerning is that there is little room to go higher on the demand front. Refinery utilization – the percentage of US refinery capacity that is being utilized to convert crude oil to gasoline and other finished products – was at 95.0% last week. This is the highest refinery utilization during the final week of June over the last 10 years. Figure 6 below shows refinery utilization for the last week of June from 2006 to the present.
(click to enlarge)
Figure 6: Refinery utilization during the final week of June for the past 10 years showing that, at 95%, 2015’s utilization is the highest of the decade. [Source: Chart is my own, data from the EIA.]
Furthermore, the maximum refinery utilization during any week in the last 10 years was 95.4%, recorded several times, most recently last December. As a result, at 95.0% refinery, utilization is nearly at its maximum capacity. The fact that we saw a 2.4 million barrel storage injection, with demand near its maximal level pulling hard at crude oil inventories and with imports still with room to run higher, suggests to me that oil still has room to fall.
Oil’s 4% decline to under $57/barrel represented a major breakdown not only from a fundamental level, as discussed above, but from a technical level. During the 44-day period from April 29 to June 30, crude oil had traded within a tight $4.17 range between $61.43/barrel and $57.26/barrel, the narrowest range since March 2004. Oil broke out of that range yesterday. Figure 7 plots the price of crude oil over the last 3 months, showing the rally, range-bound action, and the breakdown yesterday.
(click to enlarge)
Figure 7: Crude oil prices over the last 2 months showing range-bound trading largely between $58/barrel and $61/barrel. followed by a breakdown yesterday. [Source: Chart is my own, data from the EIA.]
Now that oil has fallen below its 2-month support level, I would not be surprised if more investors head for the exits.
I continue to hold three positions betting on a continued downtrend in crude oil prices. I own a 10% short position in the popular United States Oil ETF (NYSEARCA:USO) – increased from 5% last week – a large 15% short position in the leveraged VelocityShares 3x Long Crude Oil ETN (NYSEARCA:UWTI), and a 5% short position in the Market Vectors Russia ETF (NYSEARCA:RSX). The latter provides short exposure to an oil-driven economy, as well as the turmoil encompassing Europe. The short UWTI position is a higher-risk play on leverage-induced decay due to choppy trading. USO, of course, is a safer direct play on declining oil prices.
Should oil drop to $55/barrel – which has long been my short-term price target – I will begin to aggressively cover my UWTI short position to protect profits in a highly volatile trade, which is currently up 20% and would likely be pushing 35% if oil reaches $55/barrel. I will likewise plan to close out my RSX short around the same level to lock in profits, should the European crisis appear to be resolving.
However, I plan to hold USO for the foreseeable future. Following yesterday’s decline, contango in the oil futures market is again rising, with the 4-month spread up to $1.21, or 2.2%, after bottoming out at $0.86 last week. Should oil continue to fall, the contango will likely widen further, and I could easily see contango-generated returns topping 5% on a position held through the Fall. I feel USO is a safer, less volatile long-term hold than UWTI (despite the fact that UWTI triples the contango-generated gains and also benefits from leverage-induced decay). My price target to close out my USO position is currently $50/barrel. Factors that would likely cause me to cover sooner would include any socioeconomic forces that look like they would suppress imports for an extended period, or if US production (finally) begins declining in a meaningful way. As a result, my “stop” is a fundamental stop, and I do not have a specific stop price. Should oil rally in the face of the current bearish fundamentals, I will even consider adding to my USO short position up to 15%. If I had no crude oil short exposure, I would be reluctant to open a position here with oil down 7% in a week. Rather, I would wait for a bounce before initiating any position.
In conclusion, I believe that US crude oil demand and production remain in a stable, bearish pattern. Instead, the fundamental supply/demand picture is, and has been, dictated by fluctuations in crude oil imports. I do not believe that the underlying fundamental picture has changed since March, and that a return to baseline import levels last week following months of temporary suppression unmasked this persistent supply/demand imbalance. With crude oil demand unlikely to go higher with refineries near peak capacity, domestic production stable, and crude oil imports with room to go even higher, particularly from Canada and Saudi Arabia, I expect continued weakness in crude oil in the months to come. Once the summer driving season fades and demand declines, I would not be surprised to see the domestic oil surplus climb back above 100 million barrels over the next 1-3 months. Further exacerbating bearish sentiment are the possible resumption of Iranian exports and continued anxiety over Greece and the eurozone, although I believe these fears to be secondary to the ongoing domestic storage glut. My 1-3 month price target is $55/barrel, with a potential to drop as low as $50/barrel during this time. As a result, I plan to hold my large basket of crude oil short positions in USO, UWTI, and RSX.
Additional disclosure: As noted in the article, I am also short RSX and UWTI.
“People need to kinda settle in for a while.” That’s what Exxon Mobil CEO Rex Tillerson said about the low price of oil at the company’s investor conference. “I see a lot of supply out there.”
So Exxon is going to do its darnedest to add to this supply: 16 new production projects will start pumping oil and gas through 2017. Production will rise from 4 million barrels per day to 4.3 million. But it will spend less money to get there, largely because suppliers have had to cut their prices.
That’s the global oil story. In the US, a similar scenario is playing out. Drillers are laying some people off, not massive numbers yet. Like Exxon, they’re shoving big price cuts down the throats of their suppliers. They’re cutting back on drilling by idling the least efficient rigs in the least productive plays – and they’re not kidding about that.
In the latest week, they idled a 64 rigs drilling for oil, according to Baker Hughes, which publishes the data every Friday. Only 922 rigs were still active, down 42.7% from October, when they’d peaked. Within 21 weeks, they’ve taken out 687 rigs, the most terrific, vertigo-inducing oil-rig nose dive in the data series, and possibly in history:
As Exxon and other drillers are overeager to explain: just because we’re cutting capex, and just because the rig count plunges, doesn’t mean our production is going down. And it may not for a long time. Drillers, loaded up with debt, must have the cash flow from production to survive.
But with demand languishing, US crude oil inventories are building up further. Excluding the Strategic Petroleum Reserve, crude oil stocks rose by another 10.3 million barrels to 444.4 million barrels as of March 4, the highest level in the data series going back to 1982, according to the Energy Information Administration. Crude oil stocks were 22% (80.6 million barrels) higher than at the same time last year.
“When you have that much storage out there, it takes a long time to work that off,” said BP CEO Bob Dudley, possibly with one eye on this chart:
So now there is a lot of discussion when exactly storage facilities will be full, or nearly full, or full in some regions. In theory, once overproduction hits used-up storage capacity, the price of oil will plummet to whatever level short sellers envision in their wildest dreams. Because: what are you going to do with all this oil coming out of the ground with no place to go?
A couple of days ago, the EIA estimated that crude oil stock levels nationwide on February 20 (when they were a lot lower than today) used up 60% of the “working storage capacity,” up from 48% last year at that time. It varied by region:
Capacity is about 67% full in Cushing, Oklahoma (the delivery point for West Texas Intermediate futures contracts), compared with 50% at this point last year. Working capacity in Cushing alone is about 71 million barrels, or … about 14% of the national total.
As of September 2014, storage capacity in the US was 521 million barrels. So if weekly increases amount to an average of 6 million barrels, it would take about 13 weeks to fill the 77 million barrels of remaining capacity. Then all kinds of operational issues would arise. Along with a dizzying plunge in price.
In early 2012, when natural gas hit a decade low of $1.92 per million Btu, they predicted the same: storage would be full, and excess production would have to be flared, that is burned, because there would be no takers, and what else are you going to do with it? So its price would drop to zero.
They actually proffered that, and the media picked it up, and regular folks began shorting natural gas like crazy and got burned themselves, because it didn’t take long for the price to jump 50% and then 100%.
Oil is a different animal. The driving season will start soon. American SUVs and pickups are designed to burn fuel in prodigious quantities. People will be eager to drive them a little more, now that gas is cheaper, and they’ll get busy shortly and fix that inventory problem, at least for this year. But if production continues to rise at this rate, all bets are off for next year.
Natural gas, though it refused to go to zero, nevertheless got re-crushed, and the price remains below the cost of production at most wells. Drilling activity has dwindled. Drillers idled 12 gas rigs in the latest week. Now only 268 rigs are drilling for gas, the lowest since April 1993, and down 83.4% from its peak in 2008! This is what the natural gas fracking boom-and-bust cycle looks like:
Yet production has continued to rise. Over the last 12 months, it soared about 9%, which is why the price got re-crushed.
Producing gas at a loss year after year has consequences. For the longest time, drillers were able to paper over their losses on natural gas wells with a variety of means and go back to the big trough and feed on more money that investors were throwing at them, because money is what fracking drills into the ground.
But that trough is no longer being refilled for some companies. And they’re running out. “Restructuring” and “bankruptcy” are suddenly the operative terms.
Debt funded the fracking boom. Now oil and gas prices have collapsed, and so has the ability to service that debt. The oil bust of the 1980s took down 700 banks, including 9 of the 10 largest in Texas. But this time, it’s different. This time, bondholders are on the hook.
And these bonds – they’re called “junk bonds” for a reason – are already cracking. Busts start with small companies and proceed to larger ones. “Bankruptcy” and “restructuring” are the terms that wipe out stockholders and leave bondholders and other creditors to tussle over the scraps.
Early January, WBH Energy, a fracking outfit in Texas, kicked off the series by filing for bankruptcy protection. It listed assets and liabilities of $10 million to $50 million. Small fry.
A week later, GASFRAC filed for bankruptcy in Alberta, where it’s based, and in Texas – under Chapter 15 for cross-border bankruptcies. Not long ago, it was a highly touted IPO, whose “waterless fracking” technology would change a parched world. Instead of water, the system pumps liquid propane gel (similar to Napalm) into the ground; much of it can be recaptured, in theory.
Ironically, it went bankrupt for other reasons: operating losses, “reduced industry activity,” the inability to find a buyer that would have paid enough to bail out its creditors, and “limited access to capital markets.” The endless source of money without which fracking doesn’t work had dried up.
On February 17, Quicksilver Resources announced that it would not make a $13.6 million interest payment on its senior notes due in 2019. It invoked the possibility of filing for Chapter 11 bankruptcy to “restructure its capital structure.” Stockholders don’t have much to lose; the stock is already worthless. The question is what the creditors will get.
It has hired Houlihan Lokey Capital, Deloitte Transactions and Business Analytics, “and other advisors.” During its 30-day grace period before this turns into an outright default, it will haggle with its creditors over the “company’s options.”
On February 27, Hercules Offshore had its share-price target slashed to zero, from $4 a share, at Deutsche Bank, which finally downgraded the stock to “sell.” If you wait till Deutsche Bank tells you to sell, you’re ruined!
When I wrote about Hercules on October 15, HERO was trading at $1.47 a share, down 81% since July. Those who followed the hype to “buy the most hated stocks” that day lost another 44% by the time I wrote about it on January 16, when HERO was at $0.82 a share. Wednesday, shares closed at $0.60.
Deutsche Bank was right, if late. HERO is headed for zero (what a trip to have a stock symbol that rhymes with zero). It’s going to restructure its junk debt. Stockholders will end up holding the bag.
On Monday, due to “chronically low natural gas prices exacerbated by suddenly weaker crude oil prices,” Moody’s downgraded gas-driller Samson Resources, to Caa3, invoking “a high risk of default.”
It was the second time in three months that Moody’s downgraded the company. The tempo is picking up. Moody’s:
The company’s stressed liquidity position, delays in reaching agreements on potential asset sales and its retention of restructuring advisors increases the possibility that the company may pursue a debt restructuring that Moody’s would view as a default.
Moody’s was late to the party. On February 26, it was leaked that Samson had hired restructuring advisers Kirkland & Ellis and Blackstone’s restructuring group to figure out how to deal with its $3.75 billion in debt. A group of private equity firms, led by KKR, had acquired Samson in 2011 for $7.2 billion. Since then, Samson has lost $3 billion. KKR has written down its equity investment to 5 cents on the dollar.
This is no longer small fry.
Also on Monday, oil-and-gas exploration and production company BPZ Resources announced that it would not pay $62 million in principal and interest on convertible notes that were due on March 1. It will use its grace period of 10 days on the principal and of 30 days on the interest to figure out how to approach the rest of its existence. It invoked Chapter 11 bankruptcy as one of the options.
If it fails to make the payments within the grace period, it would also automatically be in default of its 2017 convertible bonds, which would push the default to $229 million.
BPZ tried to refinance the 2015 convertible notes in October and get some extra cash. Fracking devours prodigious amounts of cash. But there’d been no takers for the $150 million offering. Even bond fund managers, driven to sheer madness by the Fed’s policies, had lost their appetite. And its stock is worthless.
Also on Monday – it was “default Monday” or something – American Eagle Energy announced that it would not make a $9.8 million interest payment on $175 million in bonds due that day. It will use its 30-day grace period to hash out its future with its creditors. And it hired two additional advisory firms.
One thing we know already: after years in the desert, restructuring advisers are licking their chops.
The company has $13.6 million in negative working capital, only $25.9 million in cash, and its $60 million revolving credit line has been maxed out.
But here is the thing: the company sold these bonds last August! And this was supposed to be its first interest payment.
That’s what a real credit bubble looks like. In the Fed’s environment of near-zero yield on reasonable investments, bond fund managers are roving the land chasing whatever yield they can discern. And they’re holding their nose while they pick up this stuff to jam it into bond funds that other folks have in their retirement portfolio.
Not even a single interest payment!
Borrowed money fueled the fracking boom. The old money has been drilled into the ground. The new money is starting to dry up. Fracked wells, due to their horrendous decline rates, produce most of their oil and gas over the first two years. And if prices are low during that time, producers will never recuperate their investment in those wells, even if prices shoot up afterwards. And they’ll never be able to pay off the debt from the cash flow of those wells. A chilling scenario that creditors were blind to before, but are now increasingly forced to contemplate.
OPEC published its recent global oil market outlook, which offers a slightly different and instructional viewpoint.
OPEC sees its share of crude oil/liquids production reducing in light of increases in U.S. and Canada production.
OPEC also indicates a pivot toward Asia, where it sees the greatest demand for its primary exports in the future.
In perusing through OPEC’s recently released “World Oil Outlook,” several viewpoints are noteworthy. According to OPEC, demand grows mainly from developing countries and U.S. supply slows its run up after 2019. After 2019, OPEC begins to pick up the slack, supplying its products more readily. In OPEC’s view, Asia becomes a center of gravity given global population growth, up nearly 2 billion by 2040, and economic prosperity. The world economy grows by 260% versus that of 2013 on a purchasing power parity basis.
During the period 2013-2040, OPEC says oil demand is expected to increase by just over 21 million barrels per day (mb/d), reaching 111.1 mb/d by 2040. Developing countries alone will account for growth of 28 mb/d and demand in the OECD will fall by over 7 mb/d (p.1). On the supply side, “in the long-term, OPEC will supply the majority of the additional required barrels, with the OPEC liquids supply forecast increasing by over 13 mb/d in the Reference Case from 2020-2040,” they offer (p.1). OPEC shaved off 0.5 million barrels from their last year’s forecast to 2035. Asian oil demand accounts for 71% of the growth of oil demand.
The oil cartel released its World Oil Outlook last week, showing OPEC crude production falling to 29.5 million barrels per day in 2015 and 28.5 million barrels per day in 2016. This year’s average of 30 million barrels per day has helped flood the market and push oil prices to multi-year lows.
In the period to 2019, this chart illustrates where the barrels will flow:
Prices
With regard to price, OPEC acknowledges that the marginal cost to supply barrels continues to be a factor in expectations in the medium and long term. This sentiment has been echoed by other E&P CEOs in various communiques this year. OPEC forecasts a nominal price of $110 to the end of this decade:
On this evidence, a similar price assumption is made for the OPEC Reference Basket (ORB) price in the Reference Case compared to that presented in the WOO 2013: a constant nominal price of $110/b is assumed for the rest of the decade, corresponding to a small decline in real values.
Real values are assumed to approach $100/b in 2013 prices by 2035, with a slight further increase to $102/b by 2040. Nominal prices reach $124/b by 2025 and $177/b by 2040. These values are not to be taken as targets, according to OPEC. They acknowledge the challenge of predicting the world economy as well as non-OPEC supply. The Energy Information Administration (EIA) forecast a price for Brent averaging over $101 in 2015 and West Texas Intermediate (WTI) of over $94 as of their October 7th forecast. (This will have likely changed as of November 12th after the steep declines of October are weighed into their equations.) WTI averaged around the $97 range for 2013 and 2014. Importantly, U.S. supply may ratchet down slightly (green broken line) in response to price declines, if they continue.
It’s also the cars, globally
In 2013, OPEC says gasoline and diesel engines comprised 97% of the passenger cars total in 2013, and will hold 92% of the road in 2040. The diesel share for autos rises from 14% in 2013 to 21% in 2040. Basically, the number of cars buzzing on roads doubles from now to 2040. And 68% of the increase in cars comes from developing countries. China comprises the lion’s share of car volume growing by more than 470 million between 2011-2040, followed by India, then OPEC members will attribute 110 million new cars on the road. These increases assume levels similar to advanced economy (OECD) car volumes of the 1990s. In spite of efficiency and fuel economy, oil use per vehicle is expected to decline by 2.2%.
Commercial vehicles gain 300 million by 2040 from about 200 million in 2011. There are now more commercial vehicles in developing countries than developed.
U.S. Supply and OPEC
According to OPEC, U.S. and Canada supply increases through the period to 2019, the medium term. After 2017, they believe U.S. supply tempers from 1.2 million barrels of tight oil increases between 2013 and 2014 to 0.4 million in 2015, and less incremental increases thereafter. This acknowledges shale oil’s contribution to supply, with other supply sources declining, i.e., conventional and offshore.
OPEC Suggests:
The amount of OPEC crude required will fall from just over 30 mb/d in 2013 to 28.2 mb/d in 2017, and will start to rise again in 2018. By 2019, OPEC crude supply, at 28.7 mb/d, is still lower than in 2013.
However, the OPEC requirements are expected to ramp back up after 2019. By 2040, they expect to be supplying the world with 39 mb/d, a 9 million barrel/d increase from 2013. OPEC’s global share of crude oil supply is then 36%, above 2013 levels of about 30%. A select few firms like Pioneer Natural Resources (NYSE:PXD), Occidental Petroleum (NYSE:OXY), Chevron (NYSE:CVX) and even small-cap RSP Permian (NYSE:RSPP) are staying the course on shale oil production in the Permian for the present. After the first of the year, they will evaluate the price environment.
How does this outlook by OPEC inform the future? From the appearances in its forecasts, OPEC has slightly lower production in the medium term (to 2019), a decline of 1.3 million b/d in 2019 from the 2014 production of 30 million b/d. Thus, the main lever for an increase in prices for oil markets is for OPEC to restrict production, or encourage other members to keep to the current quota of 30 million b/d. Better economic indicators also could help. However, Saudi Arabia, the swing producer, has shown interest in maintaining its market share vis-à-vis the price cuts it has offered China, first, and then the U.S. more recently.
The global state of crude oil and liquids and prices has fundamentally changed with the addition of tight oil or shale oil, particularly from the U.S. While demand particulars have dominated the price regime recently, the upcoming decisions by OPEC at the late November meeting will have an influence on price expectations. In an environment of softer perceived demand now because of global economics and in the future because of non-OPEC supply, it would seem rational for OPEC to indicate some type of discipline among members’ production.
Source: OPEC “2014 World Oil Outlook,” mainly from the executive summary.
The presumption that North American shale oil production is the “swing” component of global supply may be incorrect.
Supply cutbacks from other sources may come first.
Growth momentum in North American unconventional oil production will likely carry on into 2015, with little impact from lower oil prices on the next two quarters’ volumes.
The current oil price does not represent a structural “economic floor” for North American unconventional oil production.
The recent pull back in crude oil prices is often portrayed as being a consequence of the rapid growth of North American shale oil production.
The thesis is often further extrapolated to suggest that a major slowdown in North American unconventional oil production growth, induced by the oil price decline, will be the corrective mechanism that will bring oil supply and demand back in equilibrium (given that OPEC’s cost to produce is low).
Both views would be, in my opinion, overly simplistic interpretations of the global supply/demand dynamics and are not supported by historical statistical data.
Oil Price – The Economic Signal Is Both Loud and Clear
The current oil price correction is, arguably, the most pronounced since the global financial crisis of 2008-2009. The following chart illustrates very vividly that the price of the OPEC Basket (which represents waterborne grades of oil) has moved far outside the “stability band” that seems to have worked well for both consumers and producers over the past four years. (It is important, in my opinion, to measure historical prices in “today’s dollars.”)
(Source: Zeits Energy Analytics, November 2014)
Given the sheer magnitude of the recent oil price move, the economic signal to the world’s largest oil suppliers is, arguably, quite powerful already. A case can be made that it goes beyond what could be interpreted as “ordinary volatility,” giving the hope that the current price level may be sufficient to induce some supply response from the largest producers – in the event a supply cut back is indeed needed to eliminate a transitory supply/demand imbalance.
Are The U.S. Oil Shales The Culprit?
It is debatable, in my opinion, if the continued growth of the U.S. onshore oil production can be identified as the primary cause of the current correction in the oil price. Most likely, North American shale oil is just one of several powerful factors, on both supply and demand sides, that came together to cause the price decline.
The history of oil production increases from North America in the past three years shows that the OPEC Basket price remained within the fairly tight band, as highlighted on the graph above, during 2012-2013, the period when such increases were the largest. Global oil prices “broke down” in September of 2014, when North American oil production was growing at a lower rate than in 2012-2013.
(Source: OPEC, October 2014)
If the supply growth from North America was indeed the primary “disruptive” factor causing the imbalance, one would expect the impact on oil prices to become visible at the time when incremental volumes from North America were the highest, i.e., in 2012-2013.
Should One Expect A Strong Slowdown in North American Oil Production Growth?
There is no question that the sharp pullback in the price of oil will impact operating margins and cash flows of North American shale oil producers. However, a major slowdown in North American unconventional oil production growth is a lot less obvious.
First, the oil price correction being seen by North American shale oil producers is less pronounced than the oil price correction experienced by OPEC exporters. It is sufficient to look at the WTI historical price graph below (which is also presented in “today’s dollars”) to realize that the current WTI price decline is not dissimilar to those seen in 2012 and 2013 and therefore represents a signal of lesser magnitude than the one sent to international exporters (the OPEC Basket price).
(Source: Zeits Energy Analytics, November 2014)
Furthermore, among all the sources of global oil supply, North American oil shales are the least established category. Their cost structure is evolving rapidly. Given the strong productivity gains in North American shale oil plays, what was a below-breakeven price just two-three years ago, may have become a price stimulating growth going into 2015.
Therefore, the signal sent by the recent oil price decline may not be punitive enough for North American shale oil producers and may not be able to starve the industry of external capital.
Most importantly, review of historical operating statistics provides an indication that the previous similar WTI price corrections – seen in 2012 and 2013 – did not result in meaningful slowdowns in the North American shale oil production.
The following graph shows the trajectory of oil production in the Bakken play. From this graph, it is difficult to discern any significant impact from the 2012 and 2013 WTI price corrections on the play’s aggregate production volumes. While a positive correlation between these two price corrections and the pace of production growth in the Bakken exists, there are other factors – such as takeaway capacity availability and local differentials – that appear to have played a greater role. I should also note that the impact of the lower oil prices on production volumes was not visible in the production growth rate for more than half a year after the onset of the correction.
(Source: Zeits Energy Analytics, November 2014)
Leading U.S. Independents Will Likely Continue to Grow Production At A Rapid Pace
Production growth track record by several leading shale oil players suggests that U.S. shale oil production will likely remain strong even in the $80 per barrel WTI price environment. Several examples provide an illustration.
Continental Resources (NYSE:CLR) grew its Bakken production volumes at a 58% CAGR over the past three years (slide below). By looking at the company’s historical production, it would be difficult to identify any impact from the 2012 and 2013 oil price corrections on the company’s production growth rate. Continental just announced a reduction to its capital budget in 2015 in response to lower oil prices, to $4.6 billion from $5.2 billion planned initially. The company still expects to grow its total production in 2015 by 23%-29% year-on-year.
(Source: Continental Resources, October 2014)
EOG Resources (NYSE:EOG) expects that its largest core plays (Eagle Ford, Bakken and Delaware Basin) will generate after-tax rates of return in excess of 100% in 2015 at $80 per barrel wellhead price. EOG went further to suggest that these plays may remain economically viable (10% well-level returns) at oil prices as low as $40 per barrel. The company expects to continue to grow its oil production at a double-digit rate in 2015 while spending within its cash flow. EOG achieved ~40% oil production growth in 2012-2013 and expects 31% growth for 2014. While a slowdown is visible, it is important to take into consideration that EOG’s oil production base has increased dramatically in the past three years and requires significant capital just to be maintained flat. Again, one would not notice much impact from prior years’ oil price corrections on EOG’s production growth trajectory.
(Source: EOG Resources, November 2014)
Anadarko Petroleum’s (NYSE:APC) U.S. onshore oil production growth story is similar. Anadarko increased its U.S. crude oil and NLS production from 100,000 barrels per day in 2010 to close to almost 300,000 barrels per day expected in Q4 2014. Anadarko has not yet provided growth guidance for 2015, but indicated that the company’s exploration and development strategies remain intact. While recognizing a very steep decline in the oil price, Anadarko stated that it wants “to watch this environment a little longer” before reaching conclusions with regard to the impact on its future spending plans.
(Source: Anadarko Petroleum, October 2014)
Devon Energy (NYSE:DVN) posted company-wide oil production of 216,000 barrels per day in Q3 2014. While Devon will provide detailed production and capital guidance at a later date, the company has indicated that it sees 20% to 25% oil production growth and mid‐single digit top‐line growth “on a retained‐property basis” (pro forma for divestitures) in 2015.
The list can continue on.
In Conclusion…
Based on preliminary 2015 growth indications from large shale oil operators, North American oil production growth in 2015 will likely remain strong, barring further strong decline in the price of oil.
No slowdown effect from lower oil prices will be seen for at least six months from the time operators received the “price signal” (August-September 2014).
Given the effects of the technical learning curve in oil shales and continuously improving drilling economics, the current ~$77 per barrel WTI price is unlikely to be sufficient to eliminate North American unconventional production growth.
North American shale oil production remains a very small and highly fragmented component of the global oil supply.
The global oil “central bank” (Saudi Arabia and its close allies in OPEC) remain best positioned to quickly re-instate stability of oil price in the event further significant decline occurred.


/cloudfront-us-east-2.images.arcpublishing.com/reuters/ZRTUGWC57VJETDQH27TGNQRQWY.jpg)

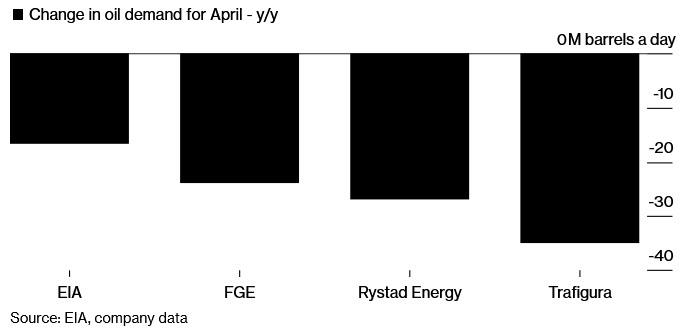
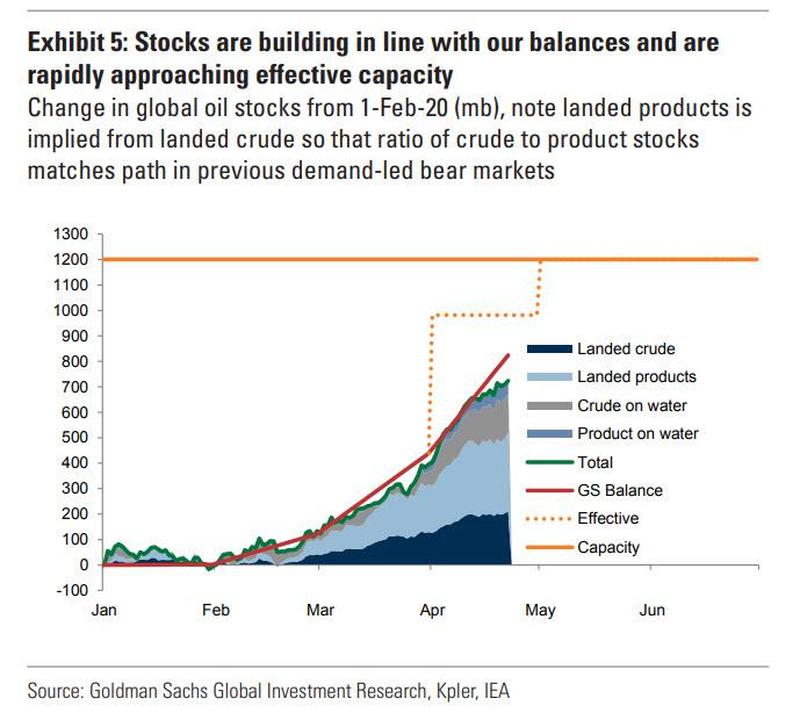
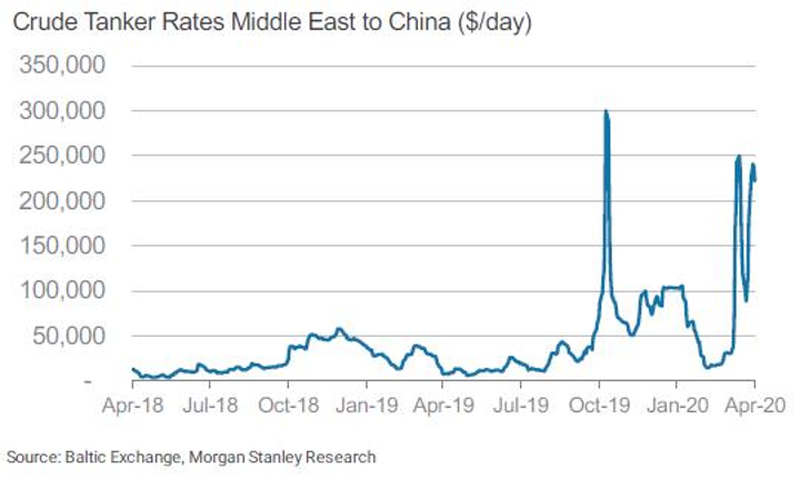
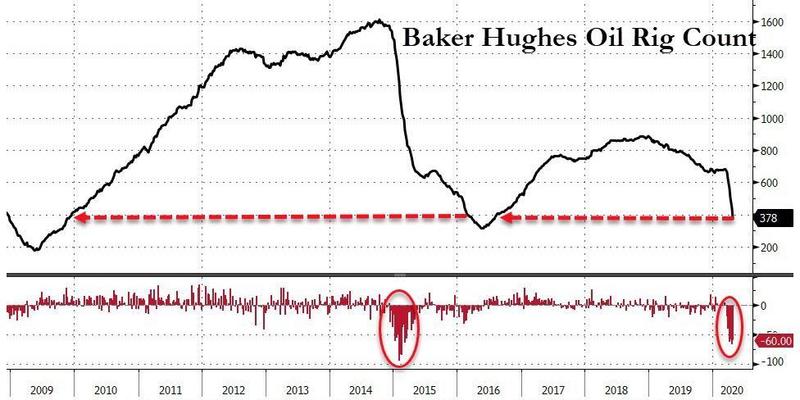
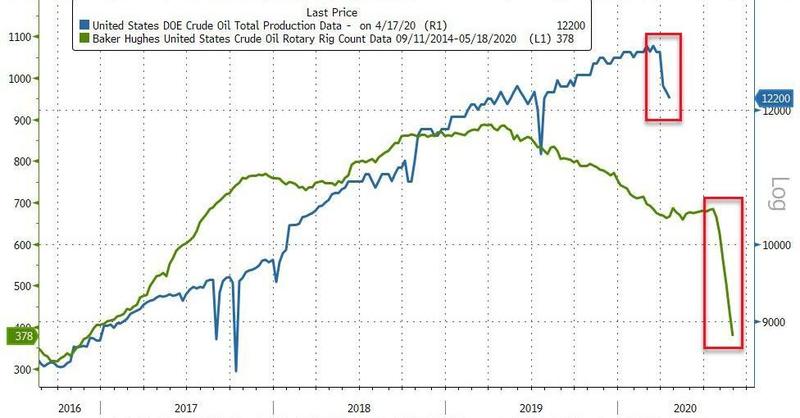
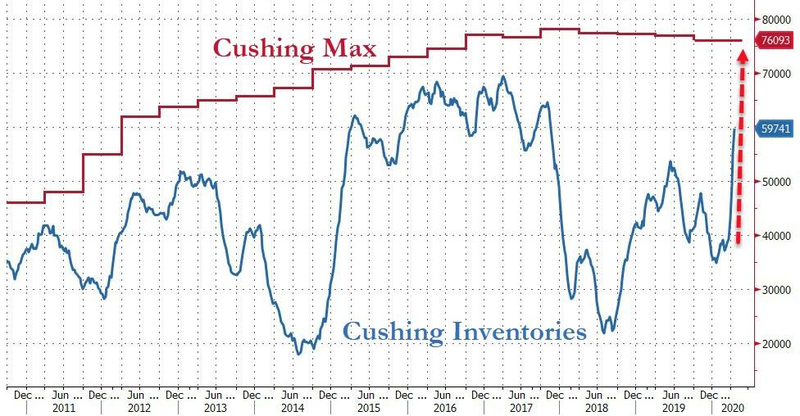


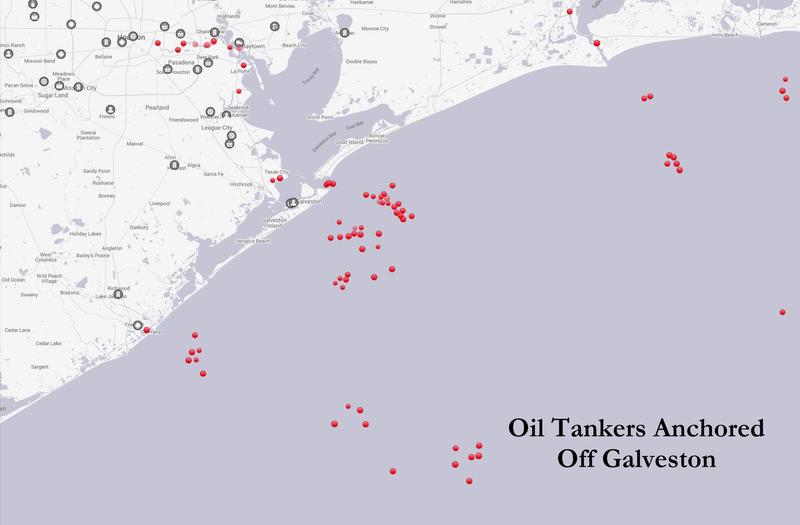
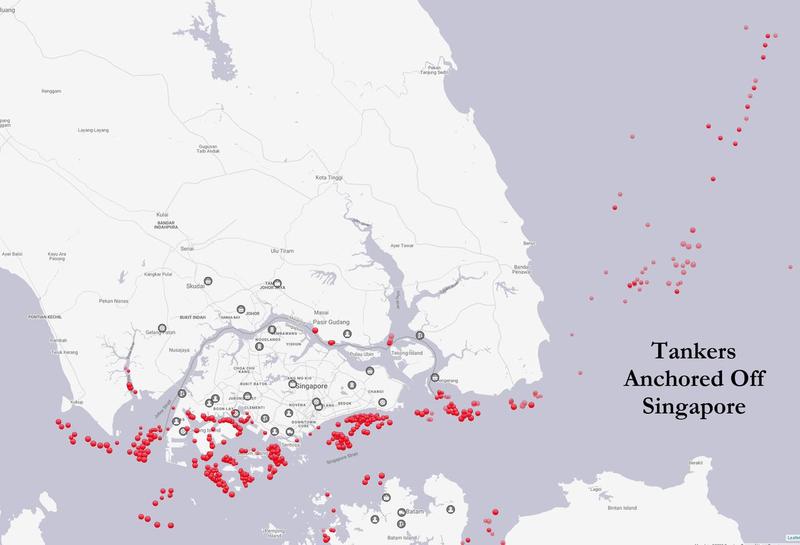
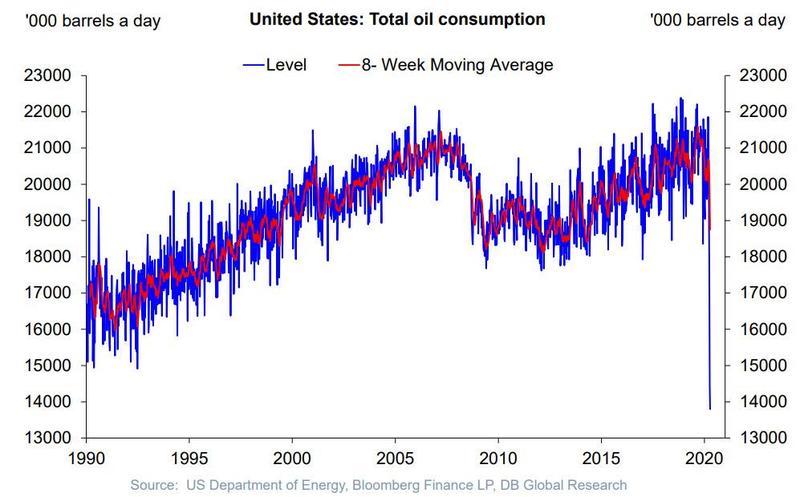

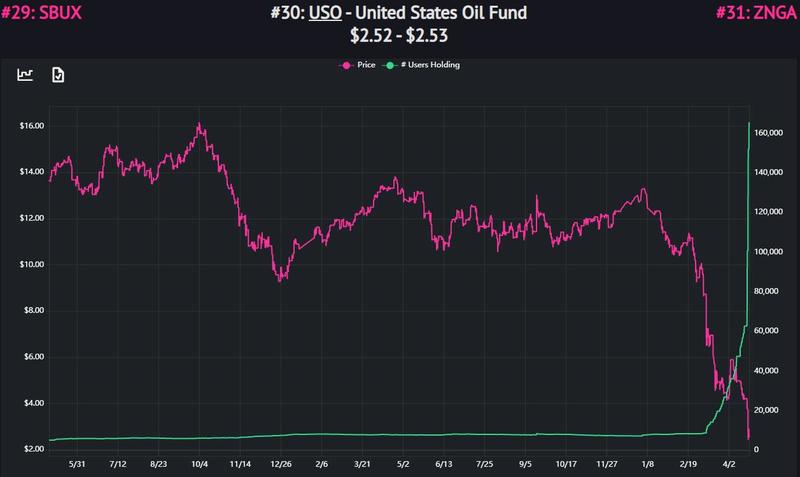


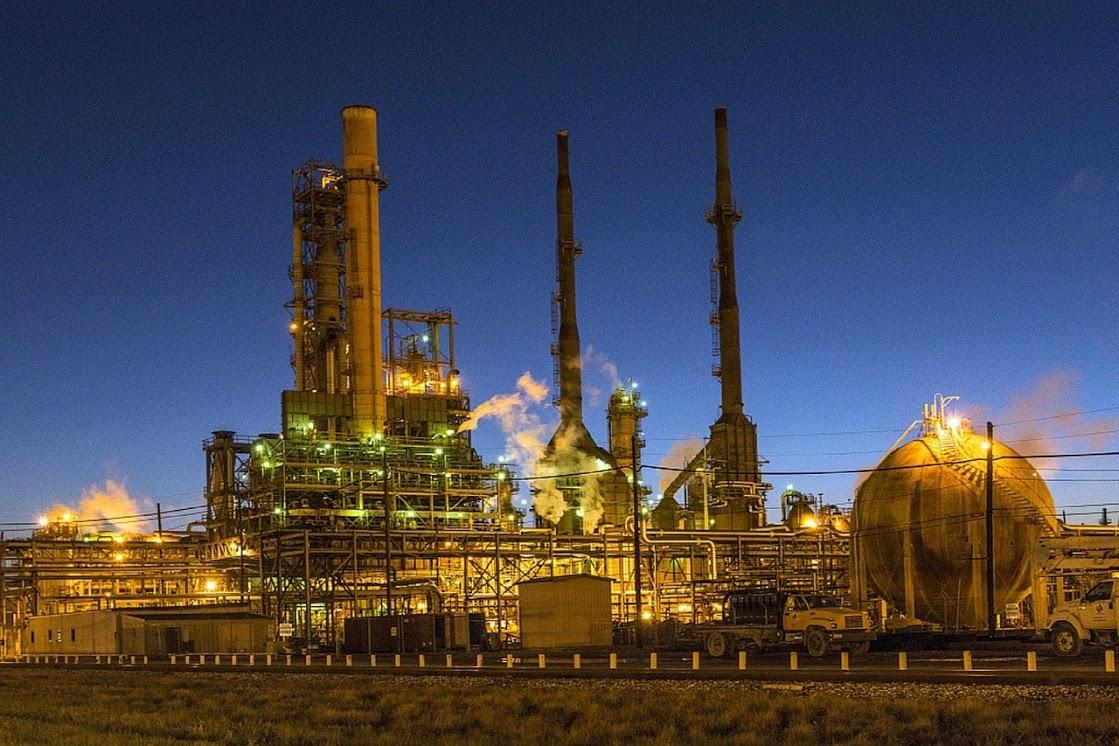
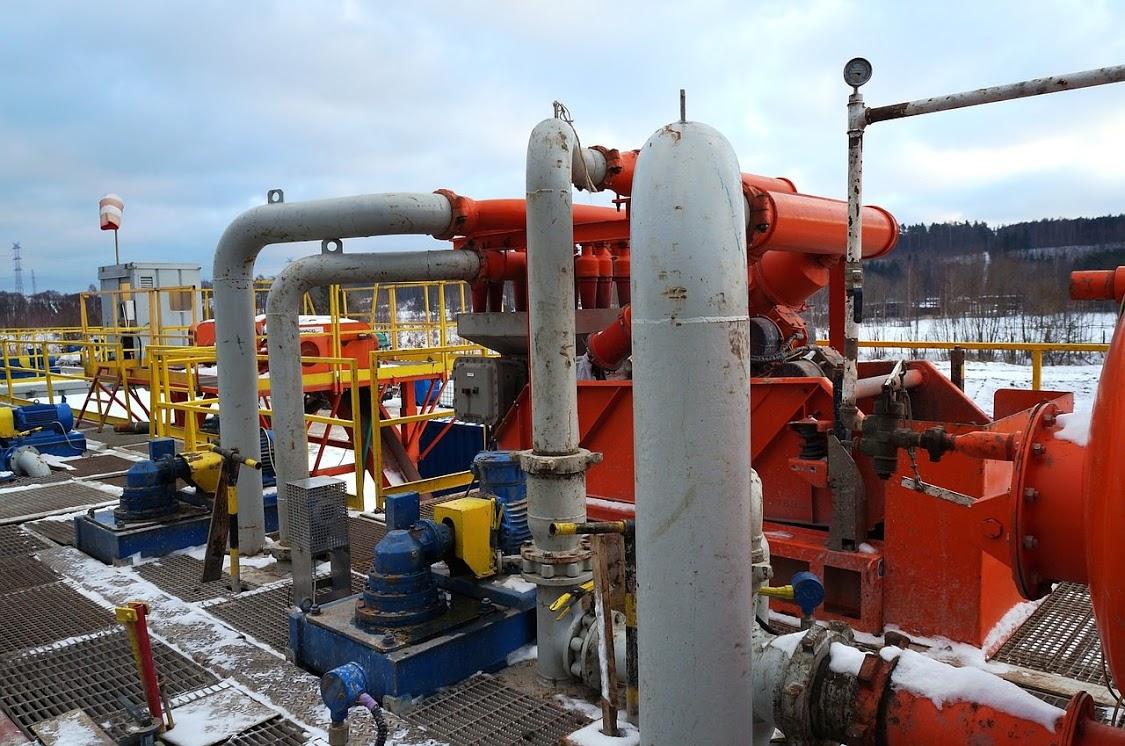


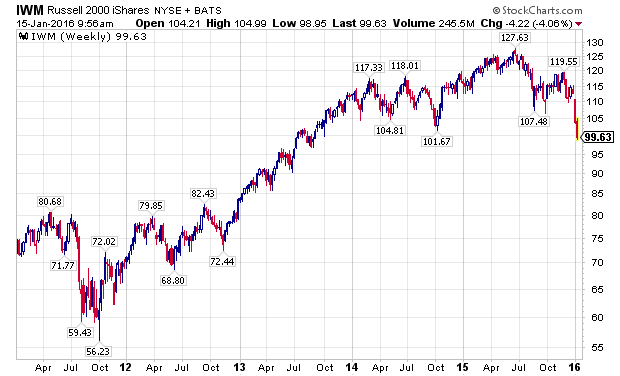
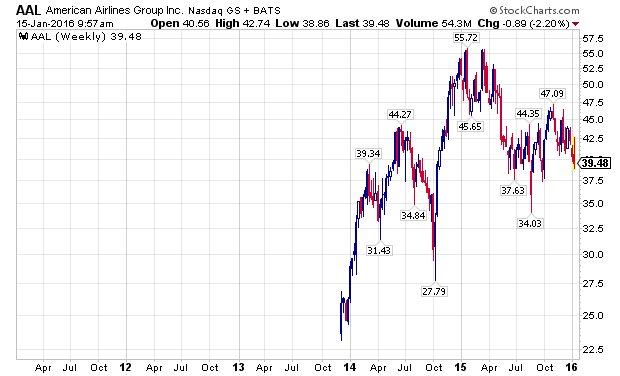
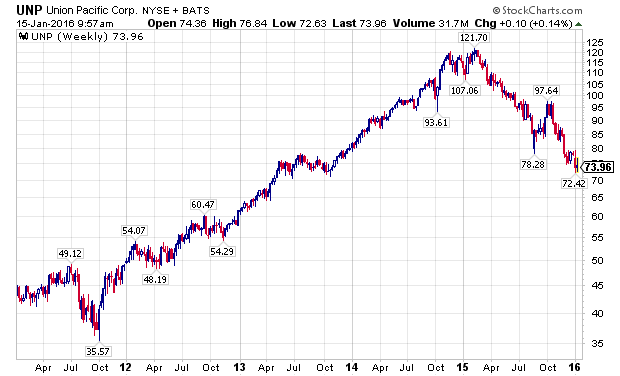
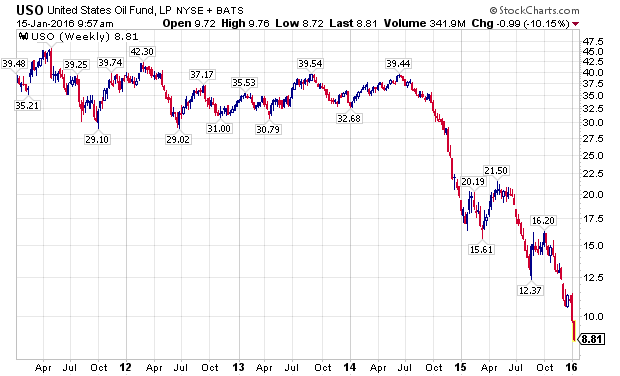
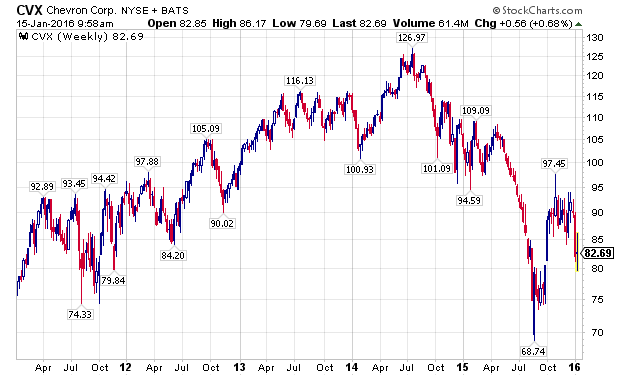
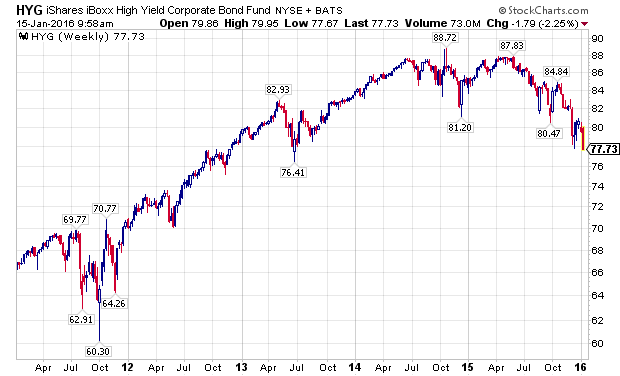

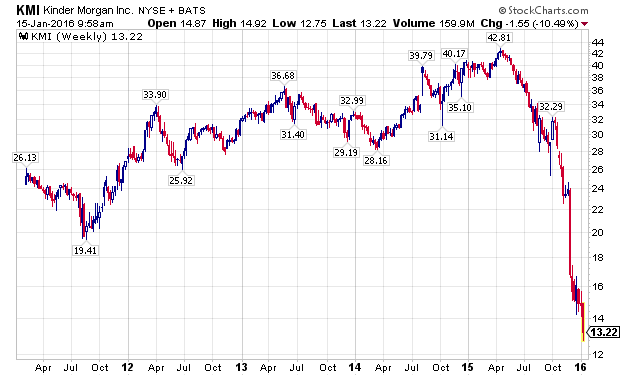

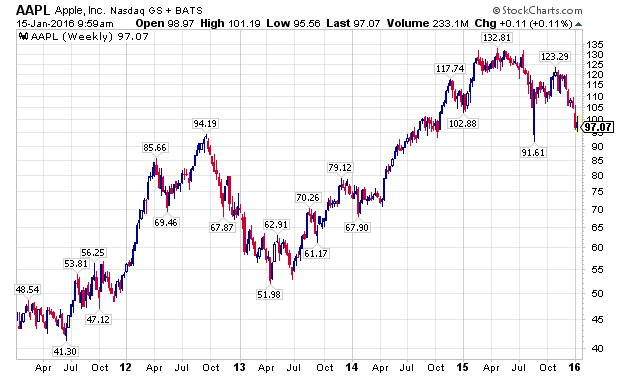

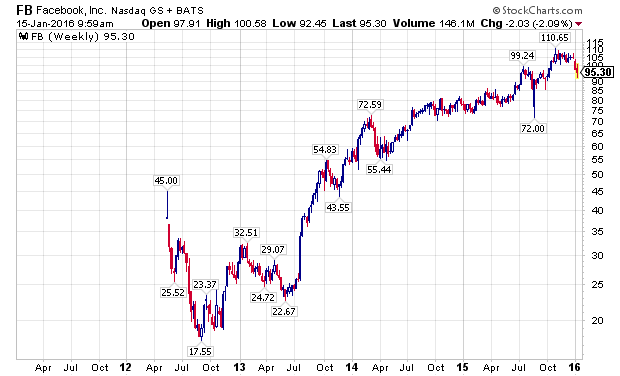

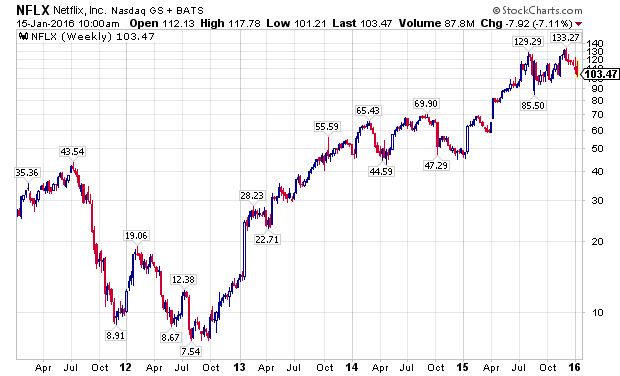
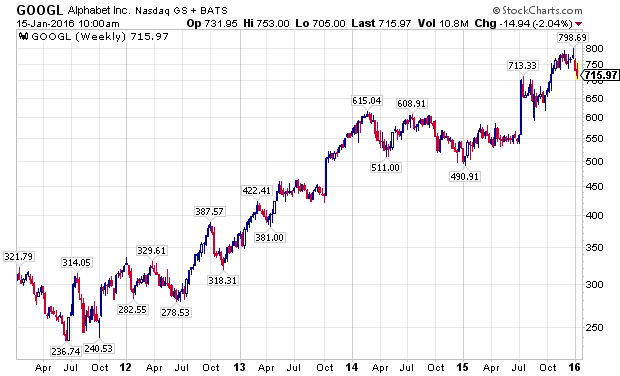
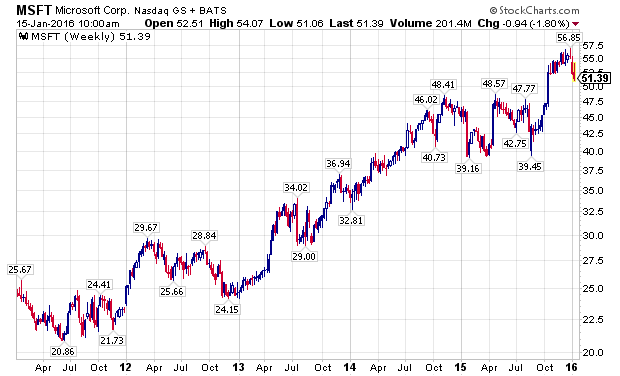
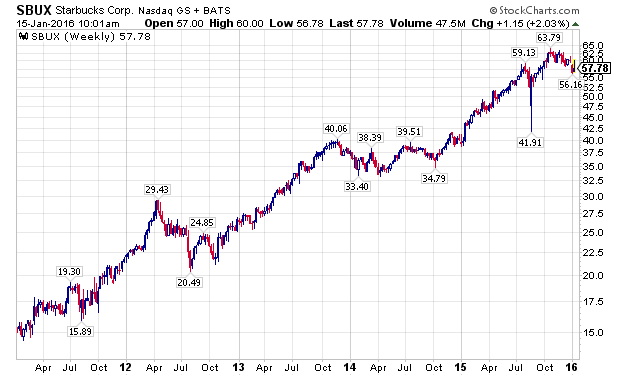


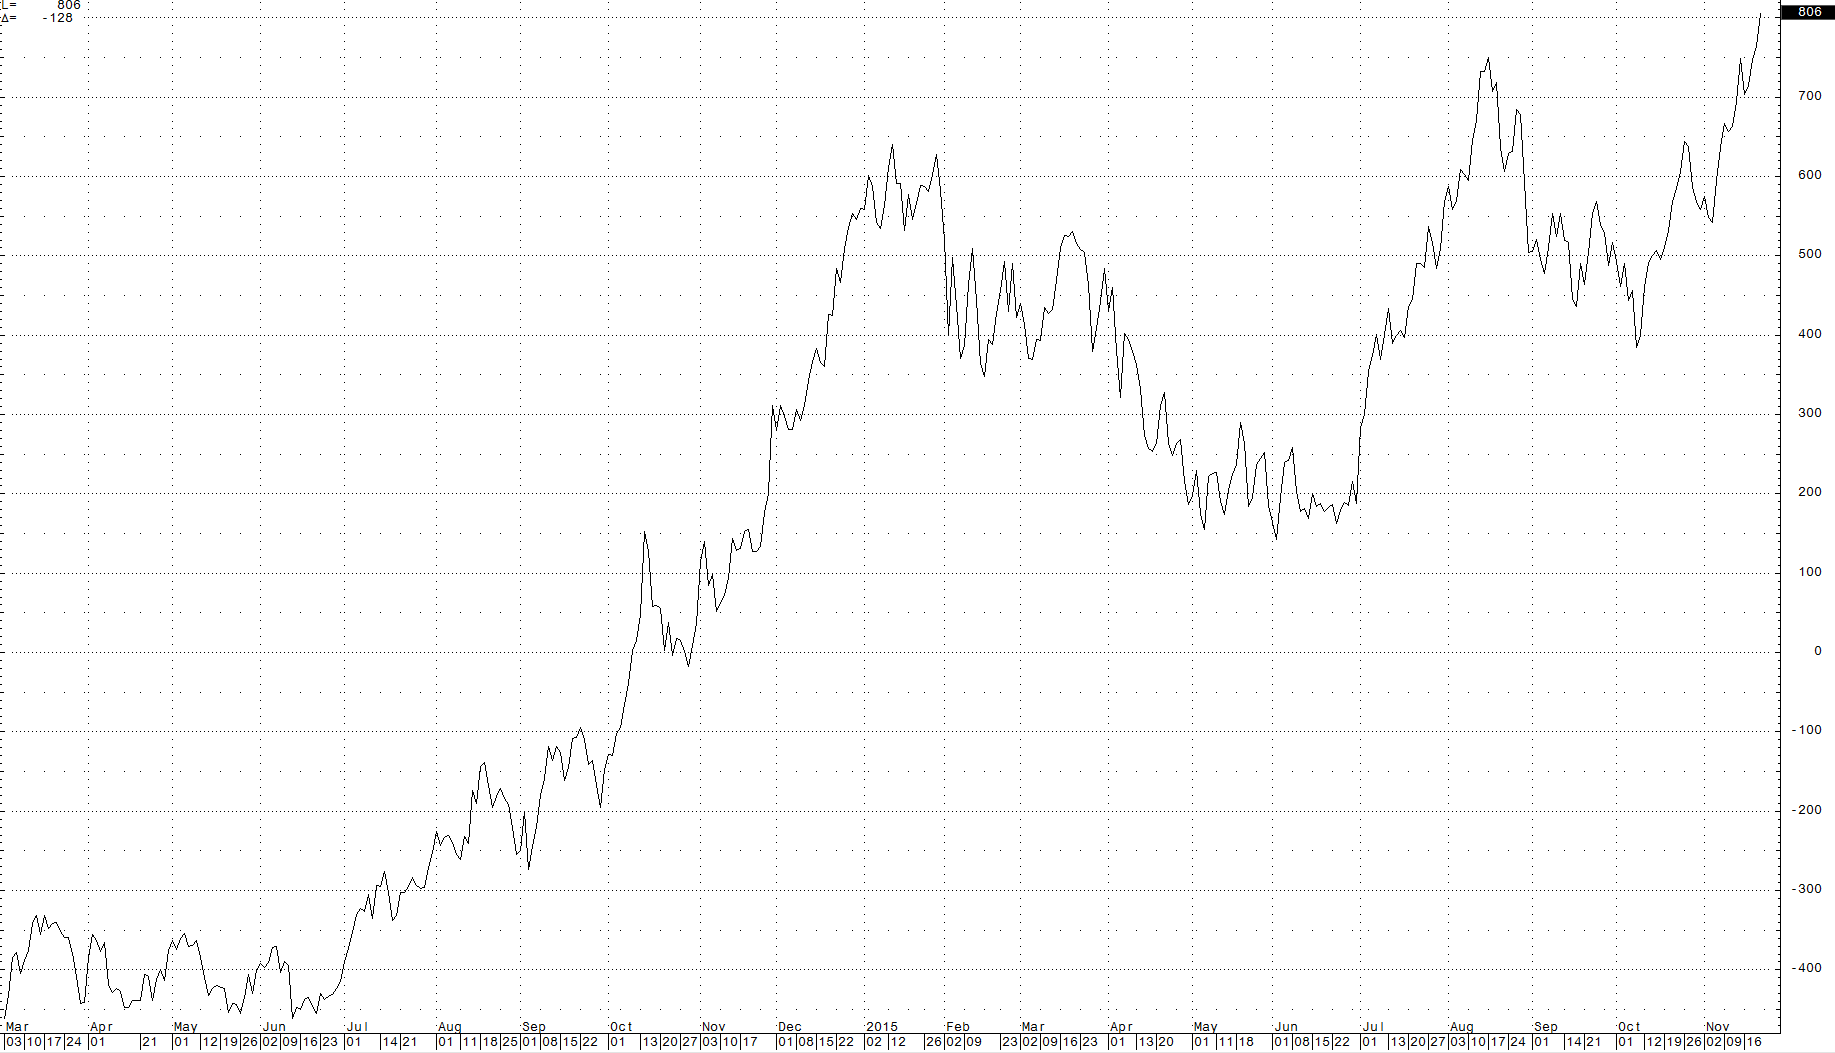


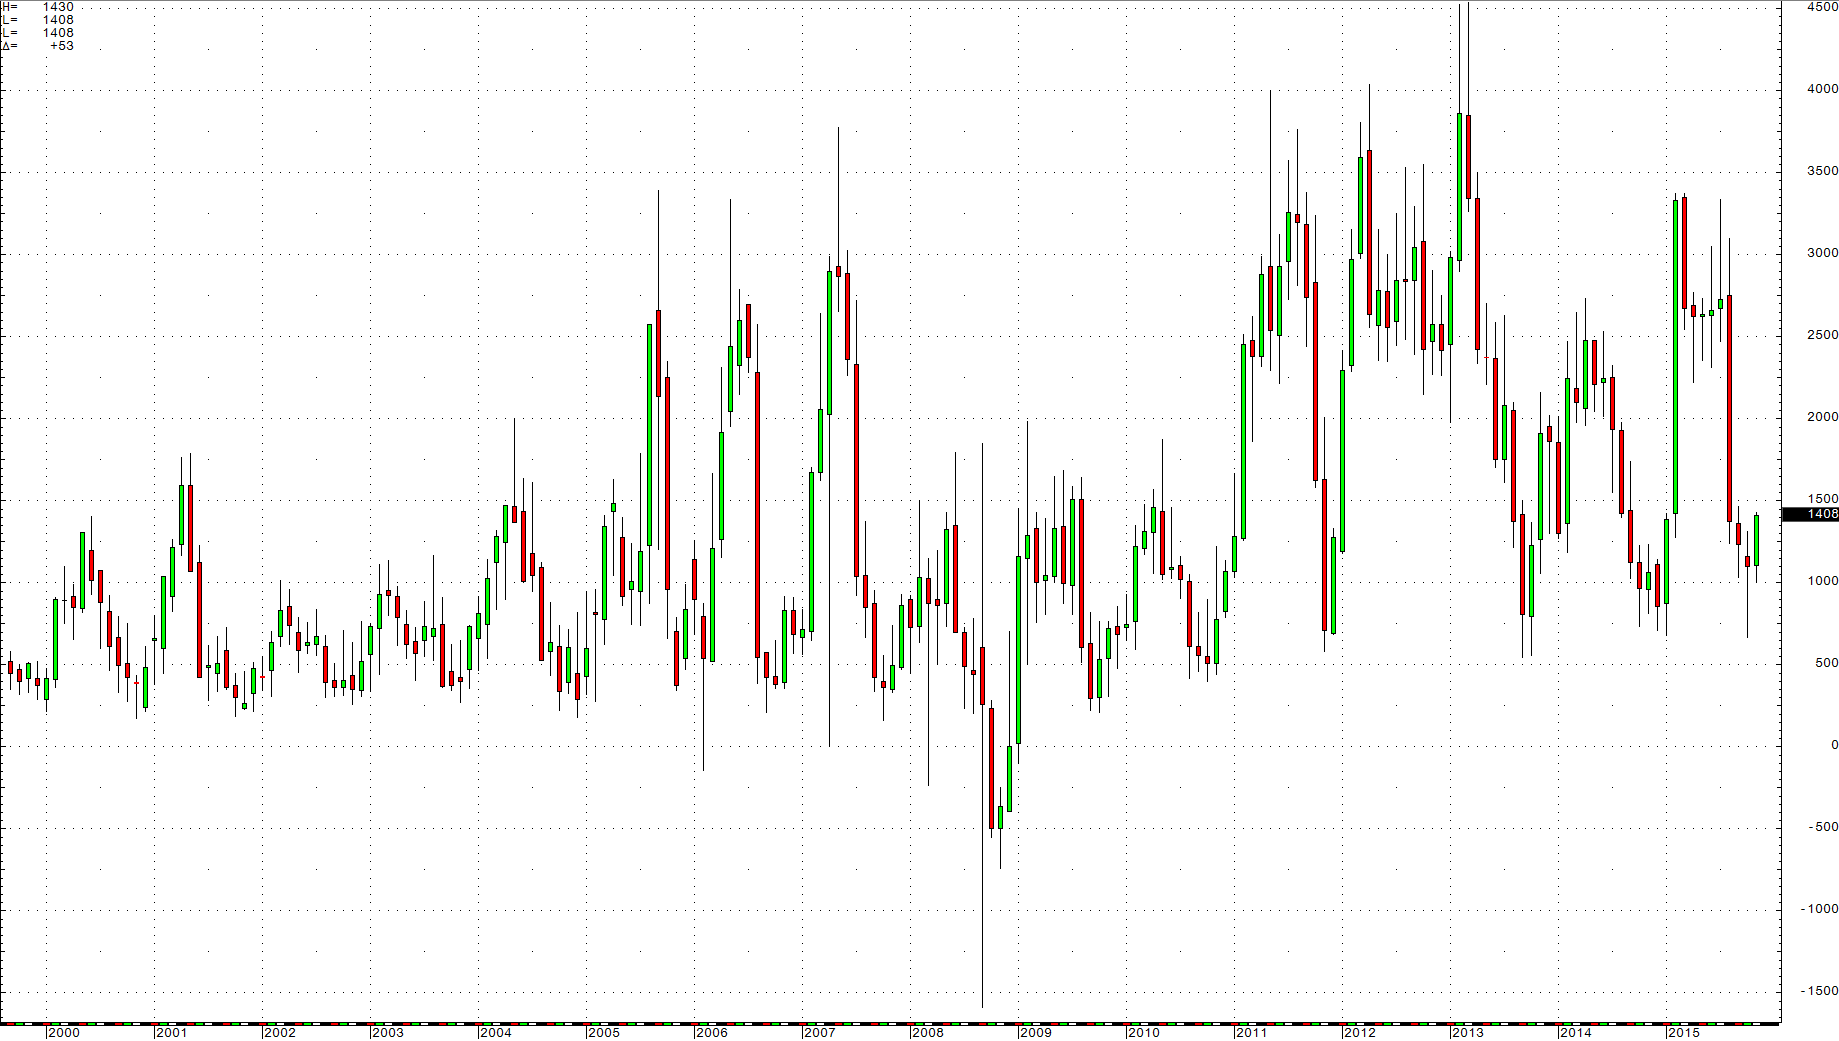
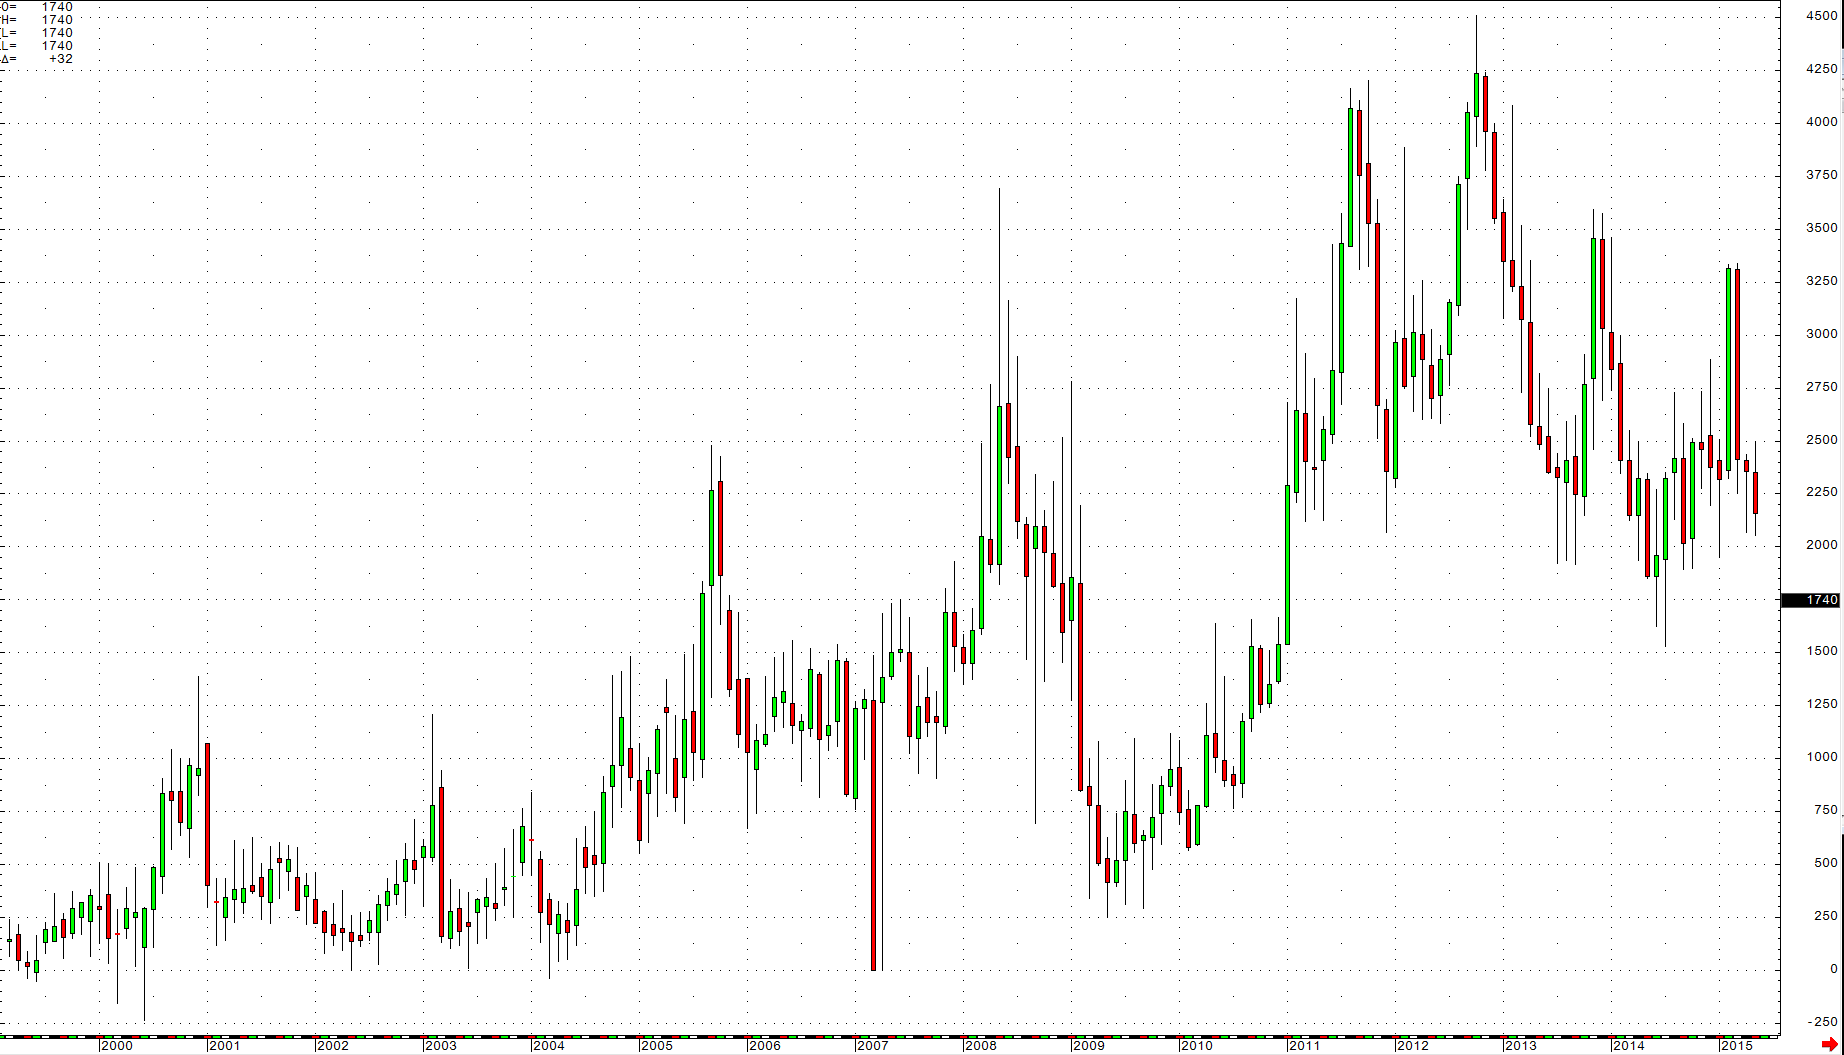


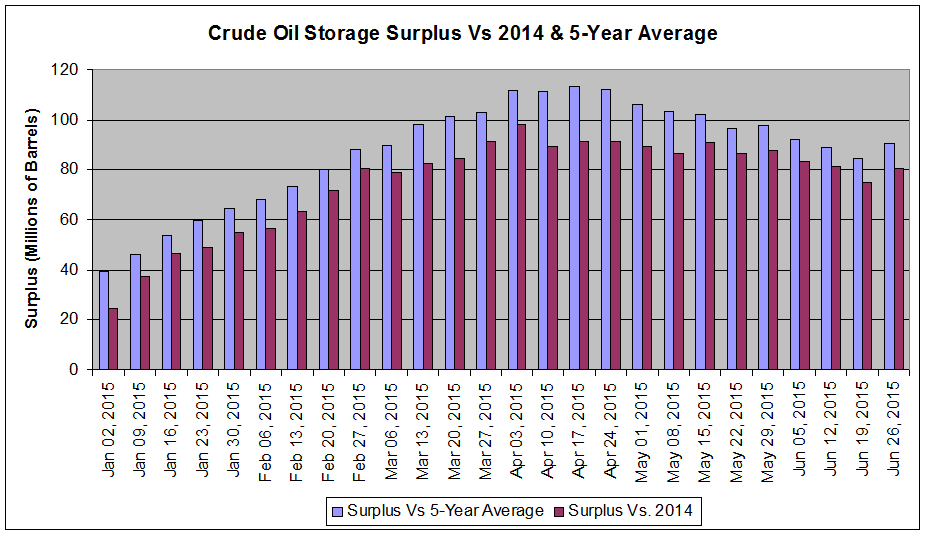
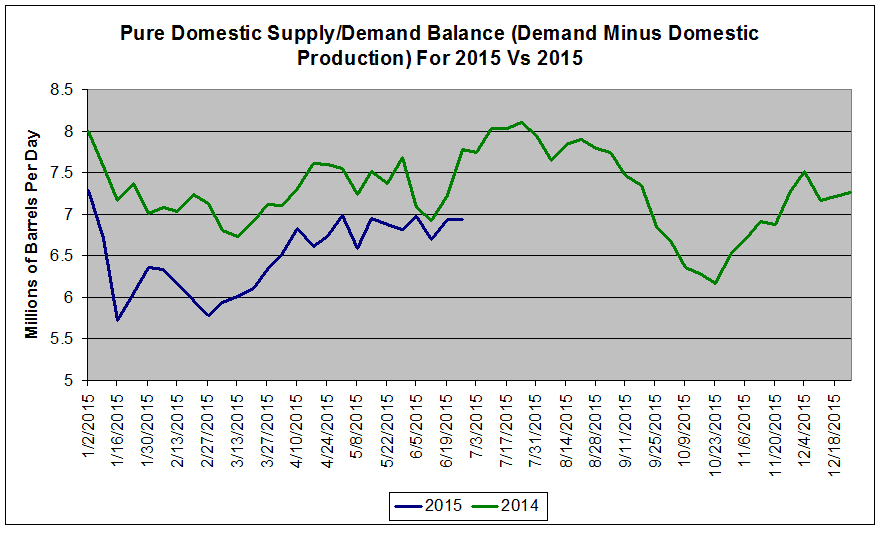


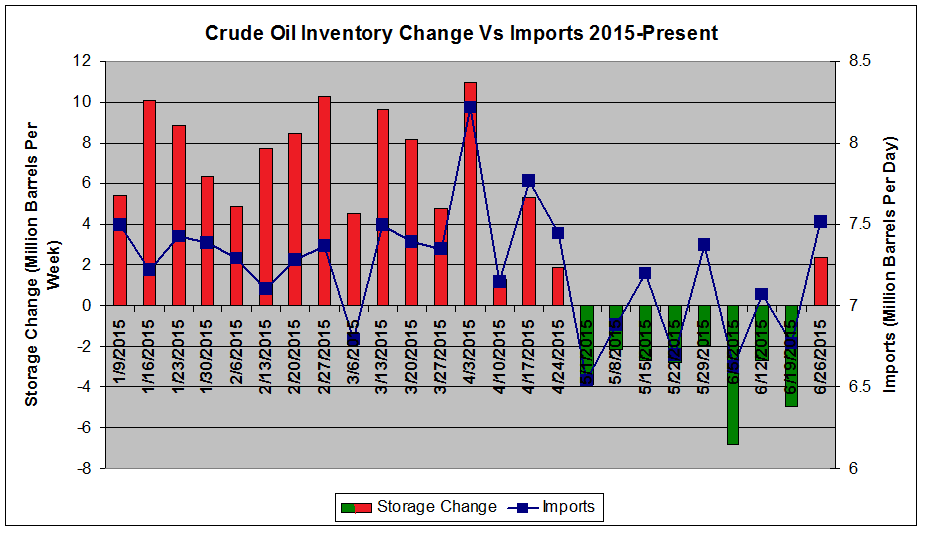
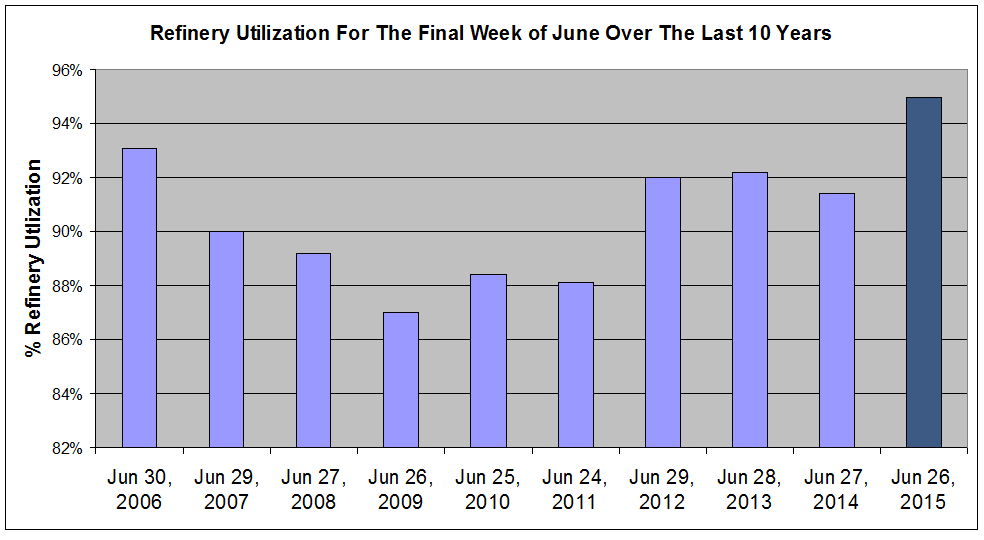
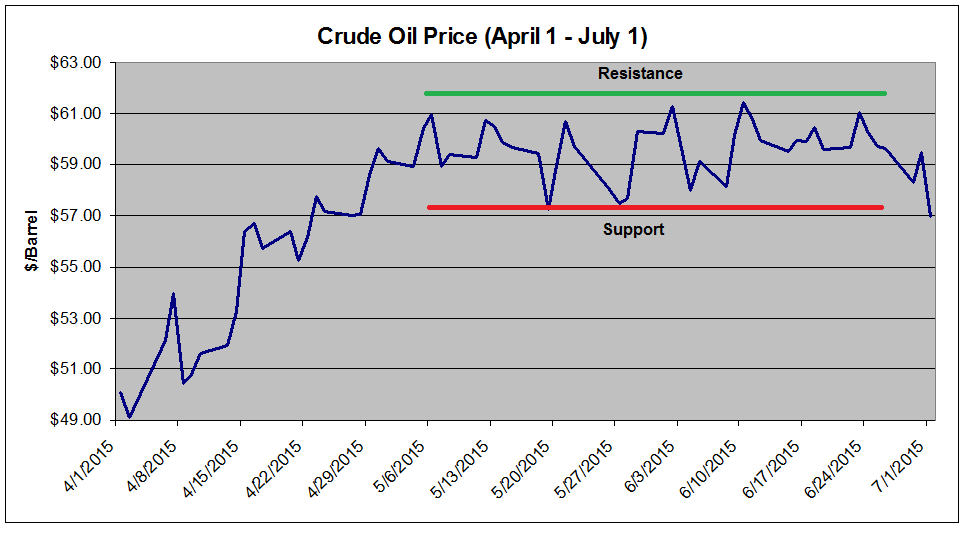

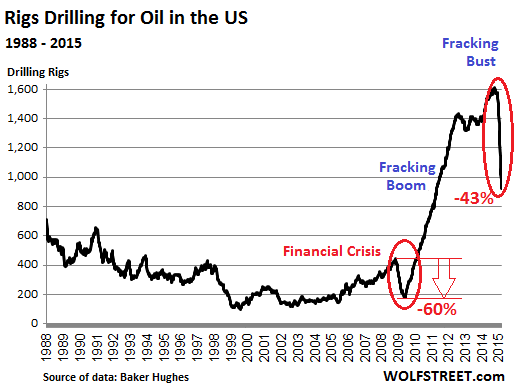
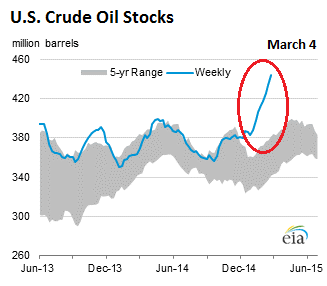
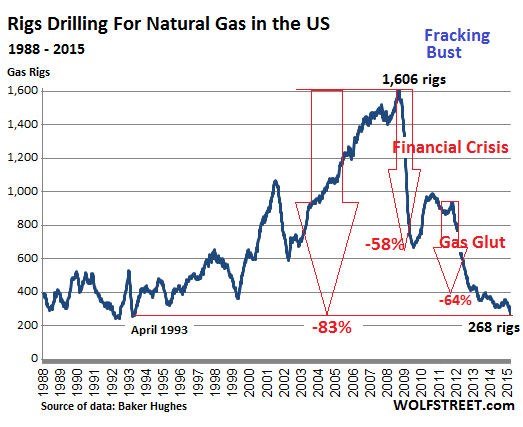


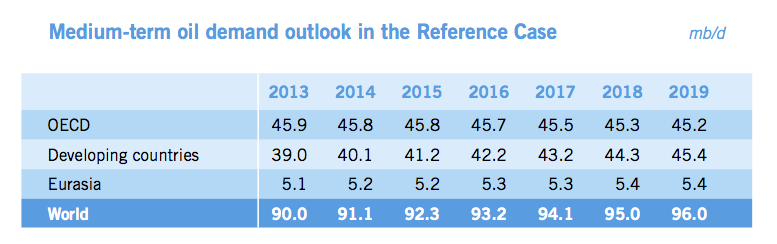


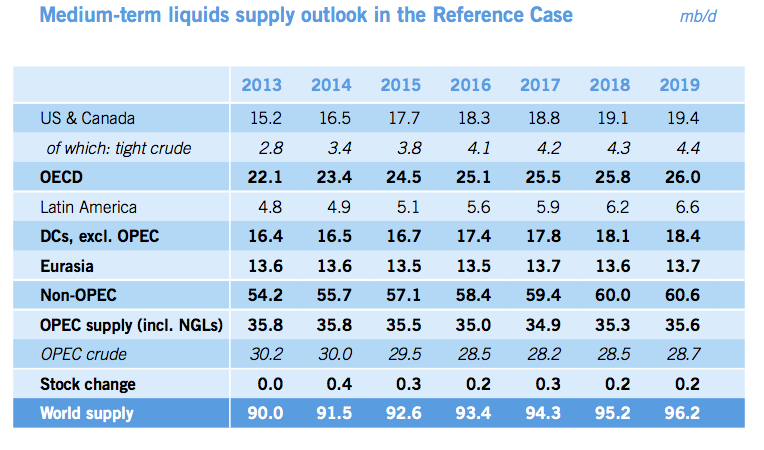
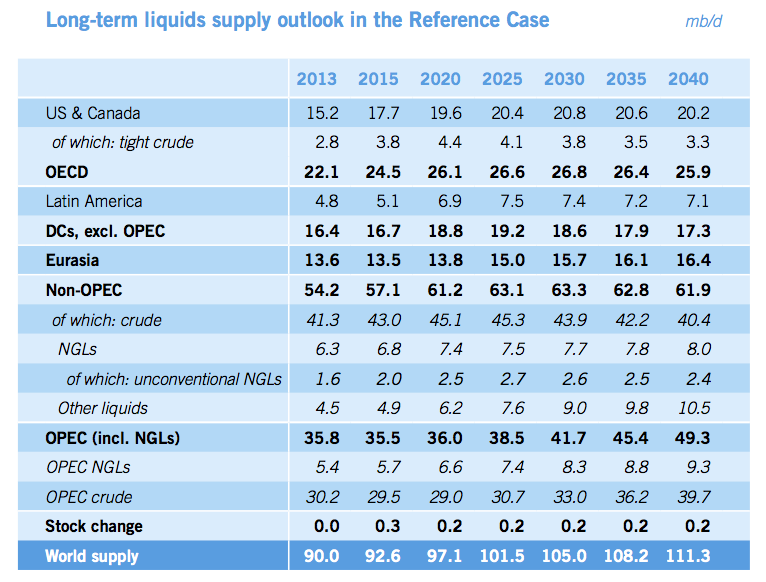

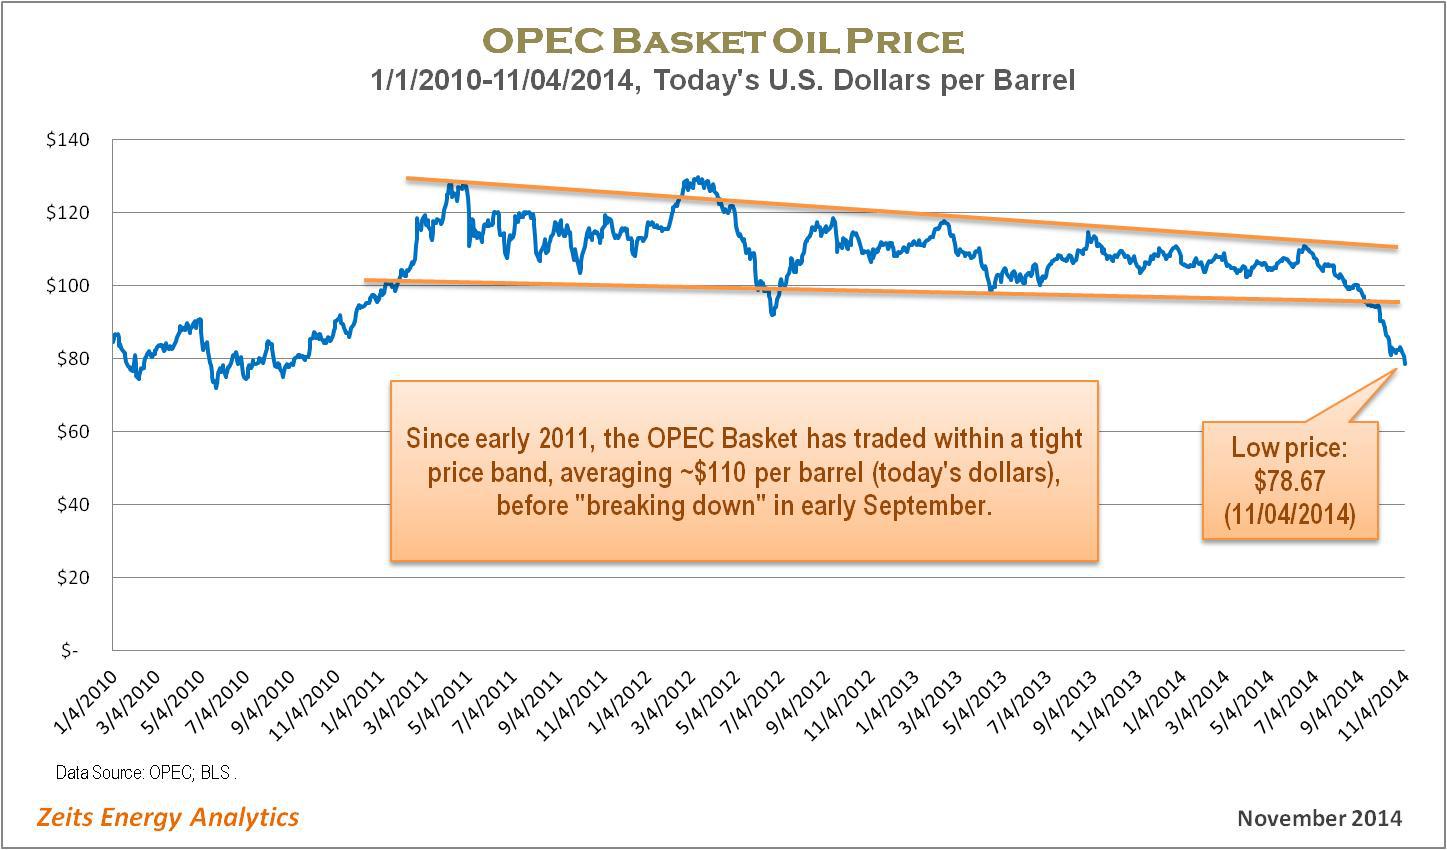
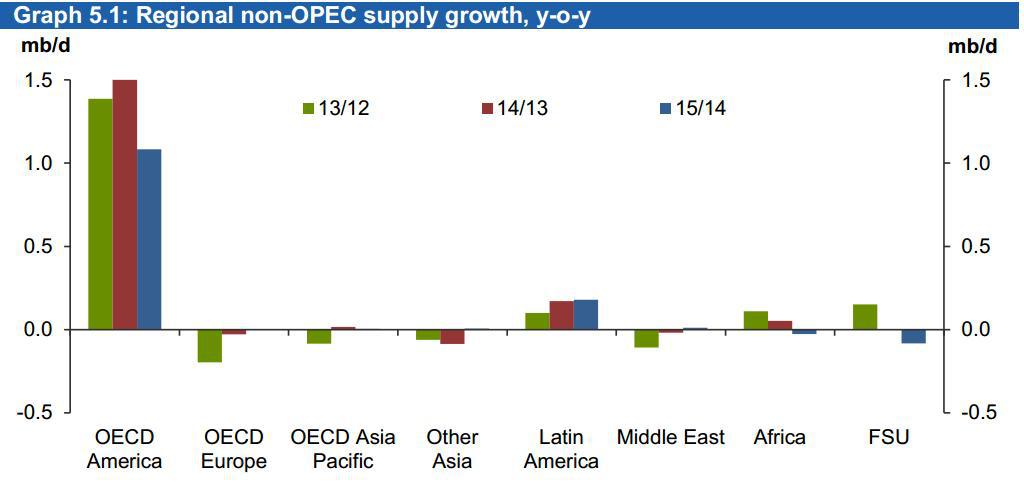
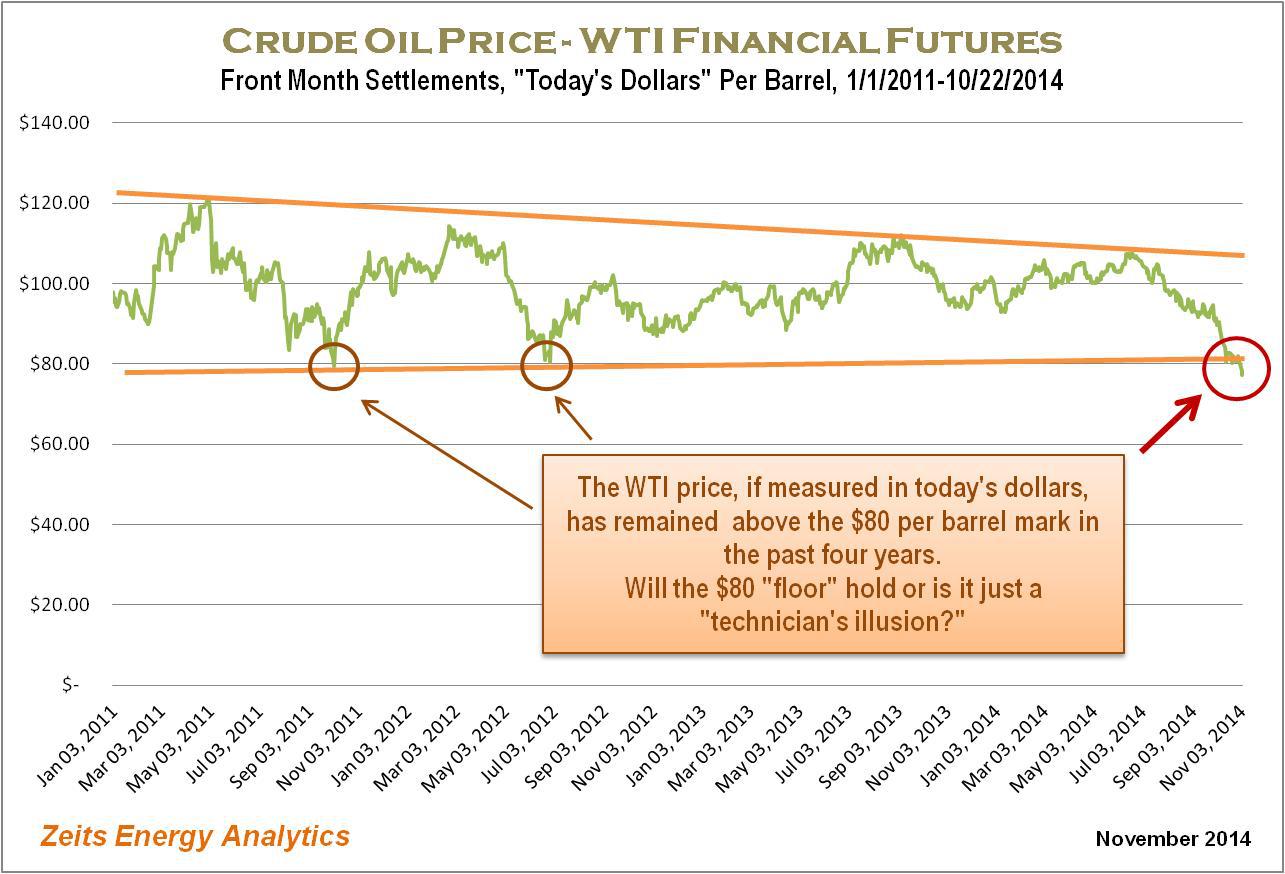
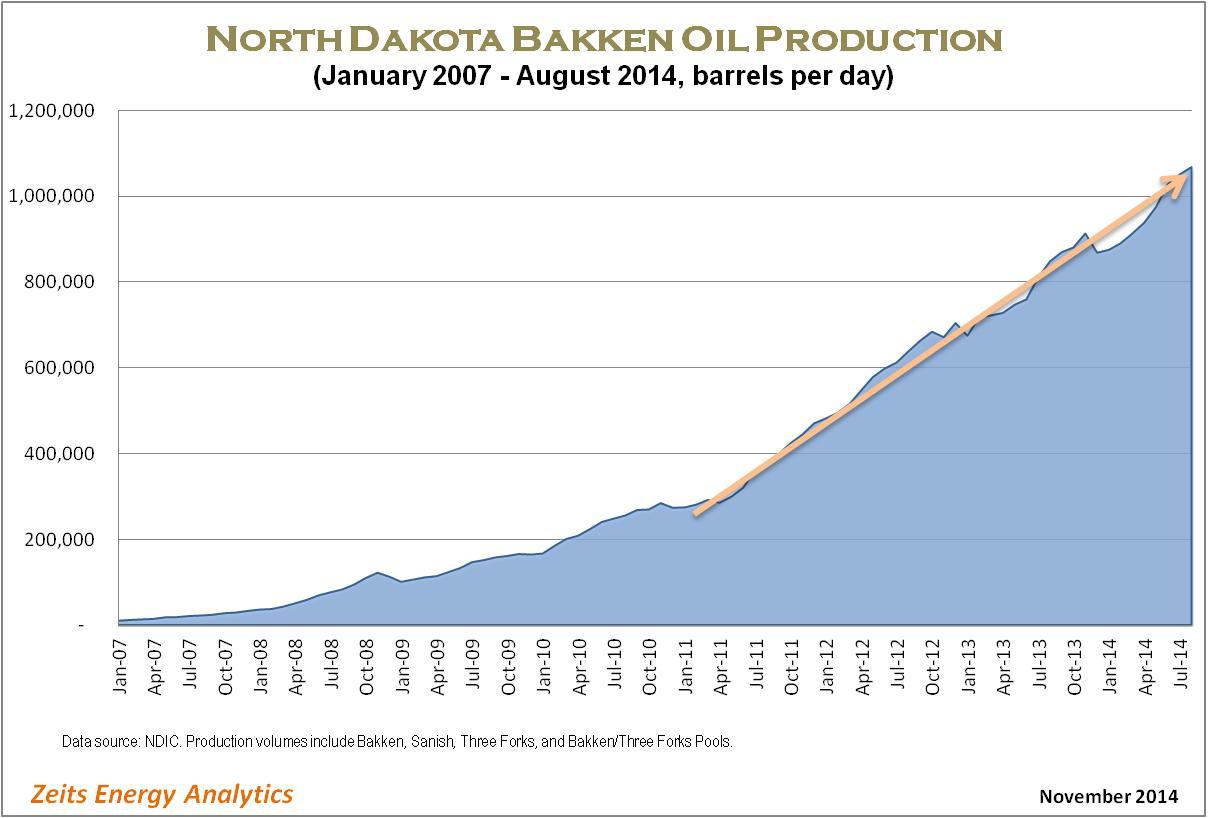
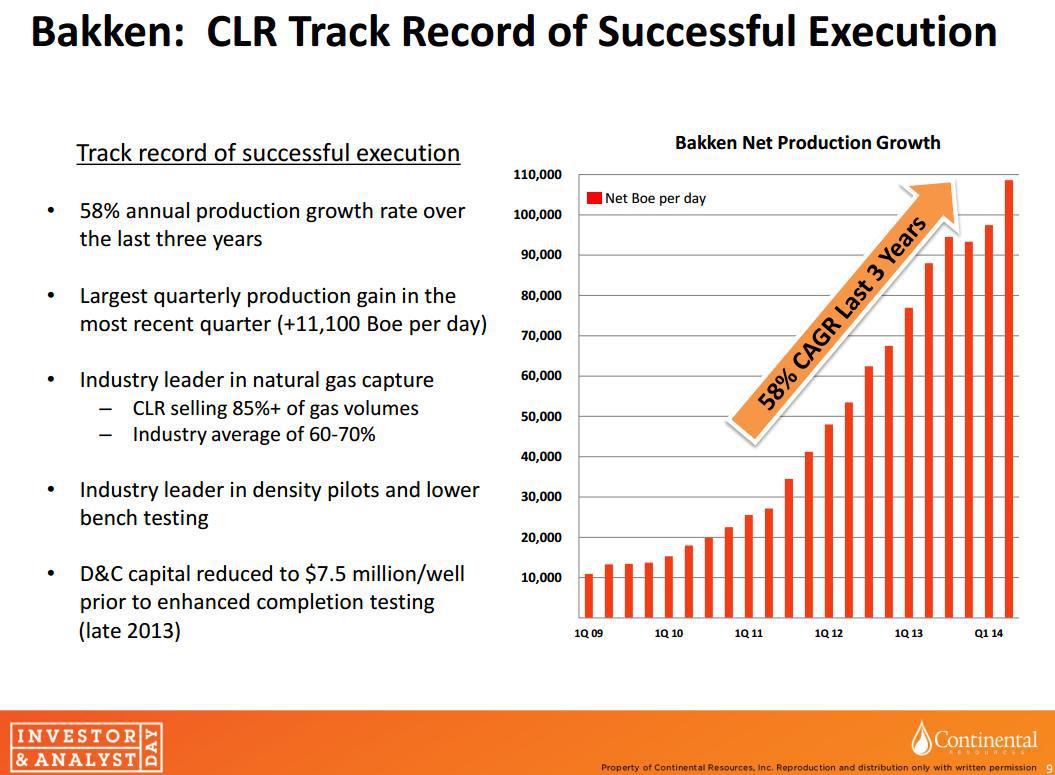
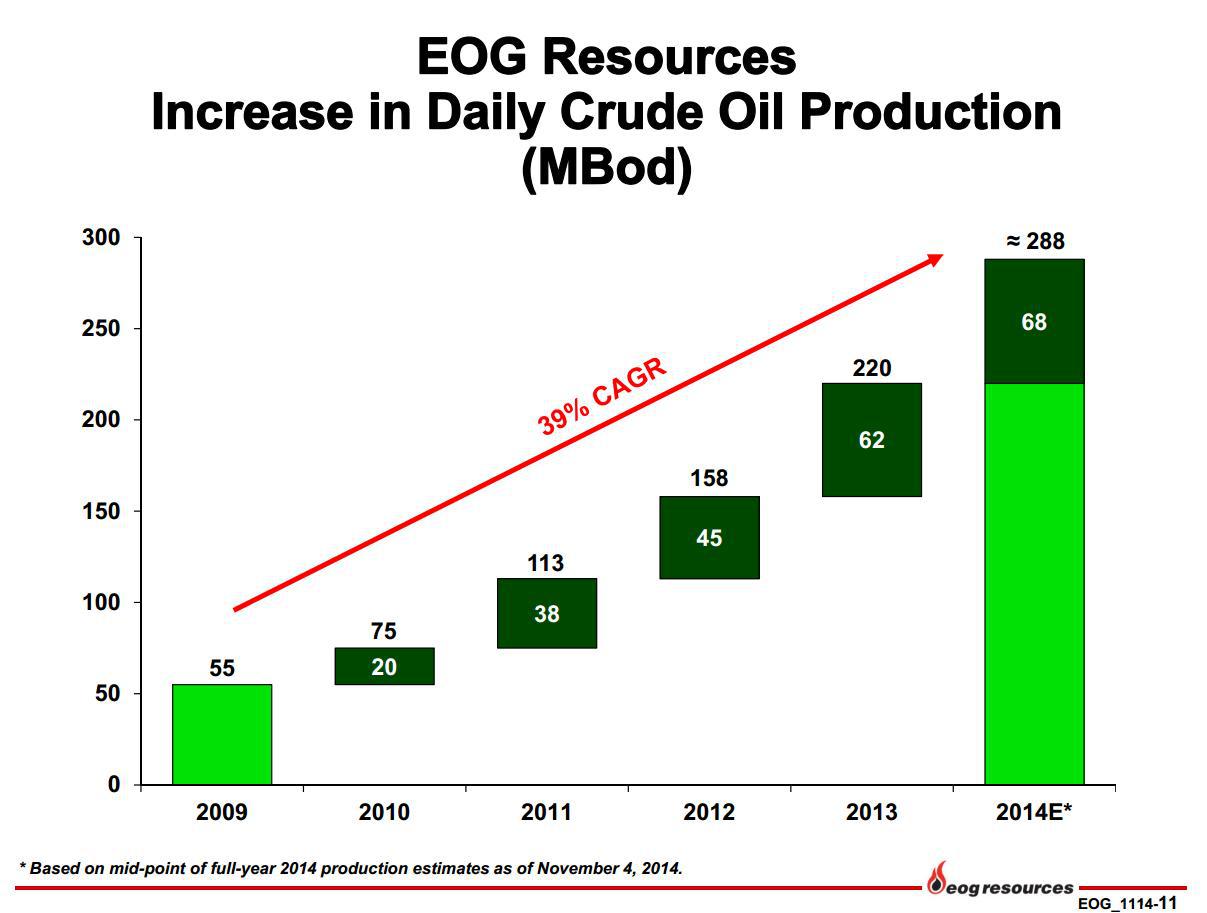


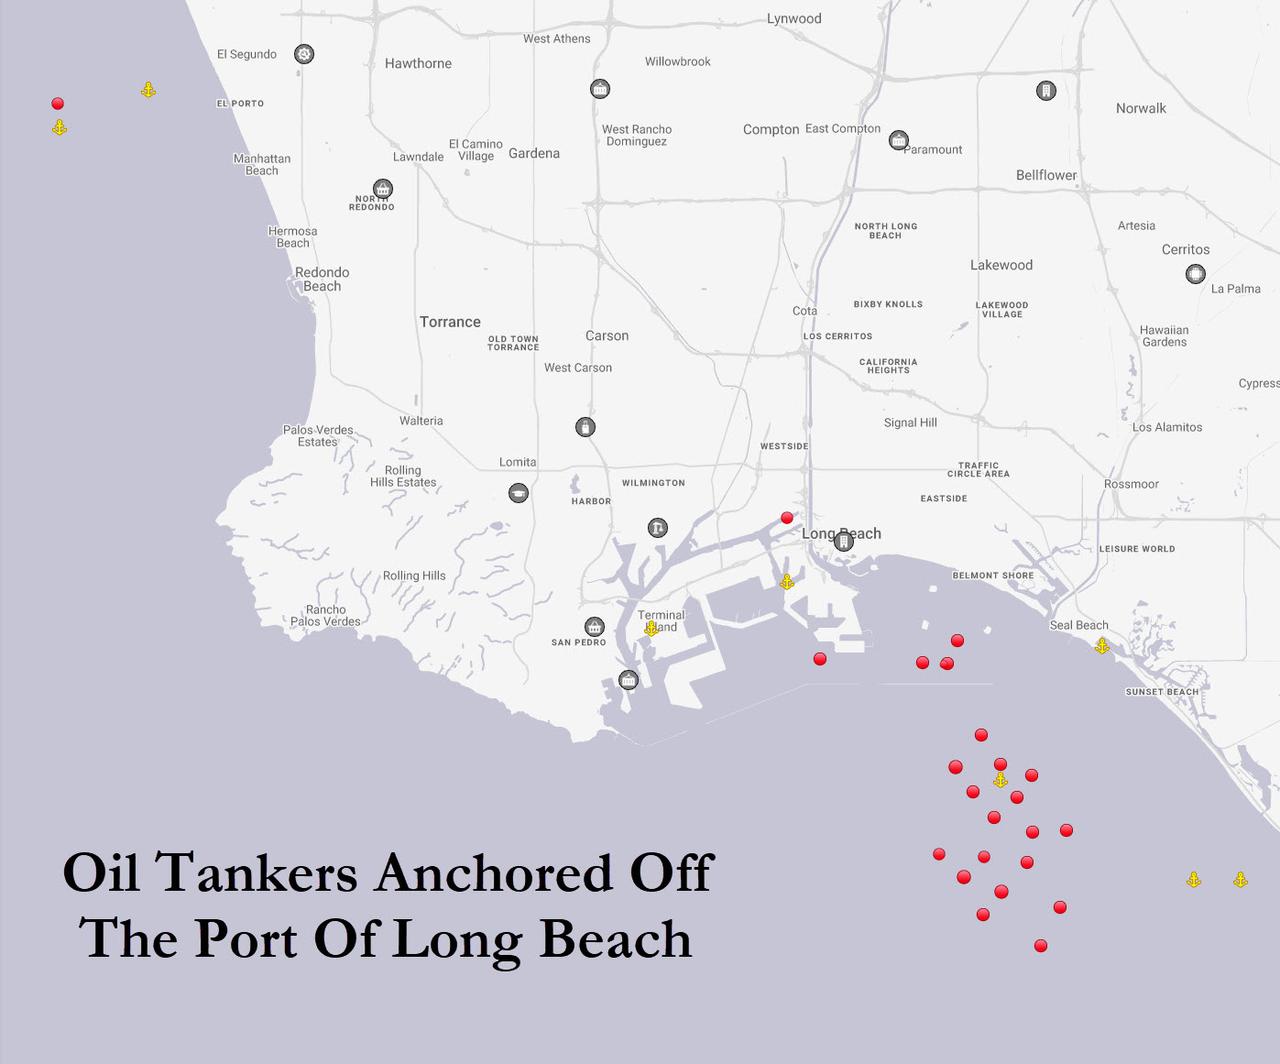
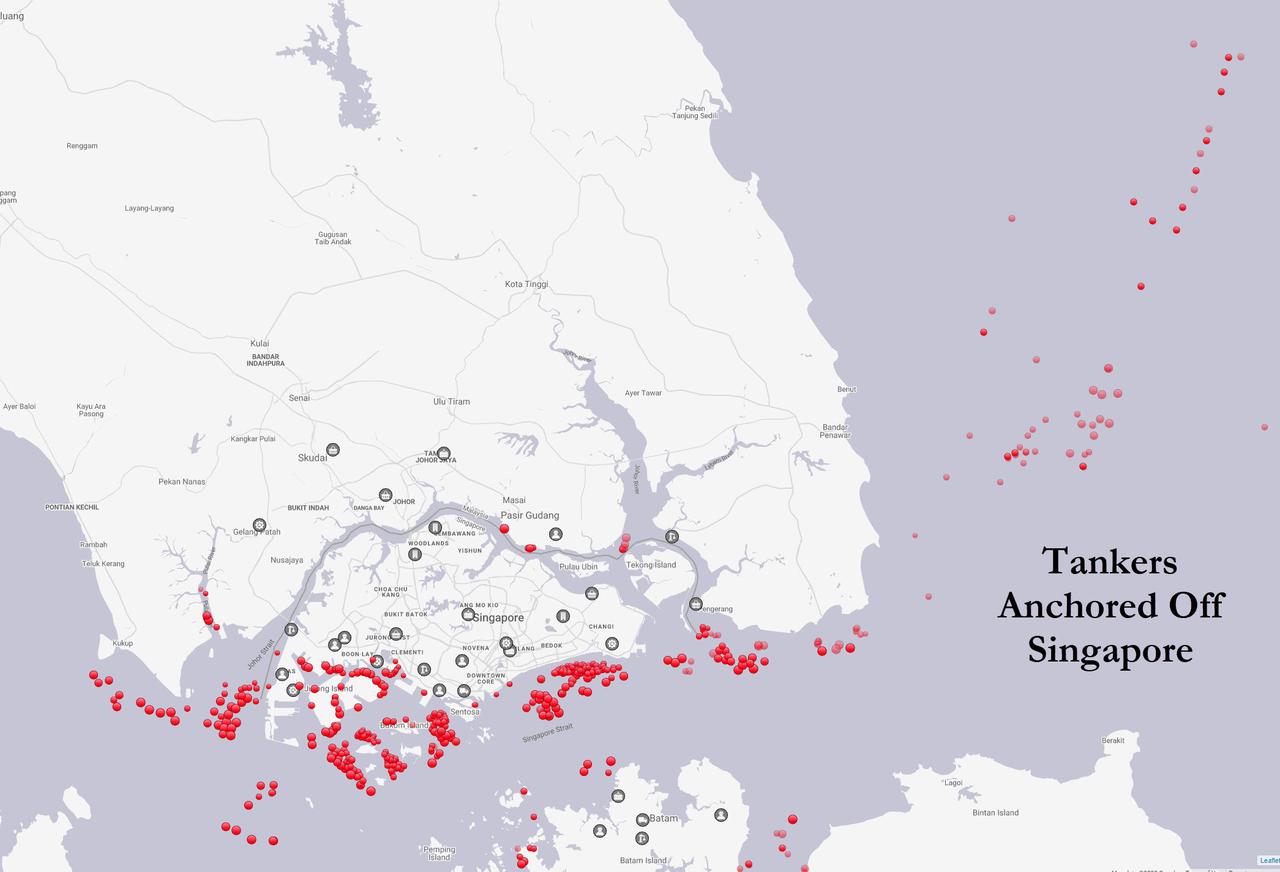
You must be logged in to post a comment.