Summary
- Term structure – contango says too much oil around.
- Brent-WTI says Iran will flood the market.
- Crack spreads could crack the recent lows for crude.
- OPEC meeting is the next big event – signals are that these guys cannot agree on anything.
- Crude oil and a turbulent world.
 The price of crude oil has not looked this bad since March, when it made lows of $42.03, or on August 24, when it fell to $37.75. On Friday, November 20, active month January NYMEX crude oil settled at $41.90 per barrel. The expiring December contract traded down to lows of $38.99 on the session. There are very few positive things to say about the future prospects for the price of crude oil at this time. The fundamental structural state of the oil market is bearish for price.
Term Structure – contango says too much oil around
Two weeks ago, the IEA told us that the world is awash in crude oil. The international agency told us that worldwide inventories have swelled to 3 billion barrels.
When crude oil was trading over $100 per barrel on the active month NYMEX futures contract during the summer of 2014, the market was in backwardation. Deferred futures prices were lower than nearby prices. This condition tells us that a market is tight, or there is a supply deficit. As the price of oil began to fall, term structure moved from backwardation to contango. This told us that the market moved from deficit to a condition of oversupply. This past week, the contango on the nearby versus one-year oil spread once again validated the glut condition in crude oil.
(click to enlarge)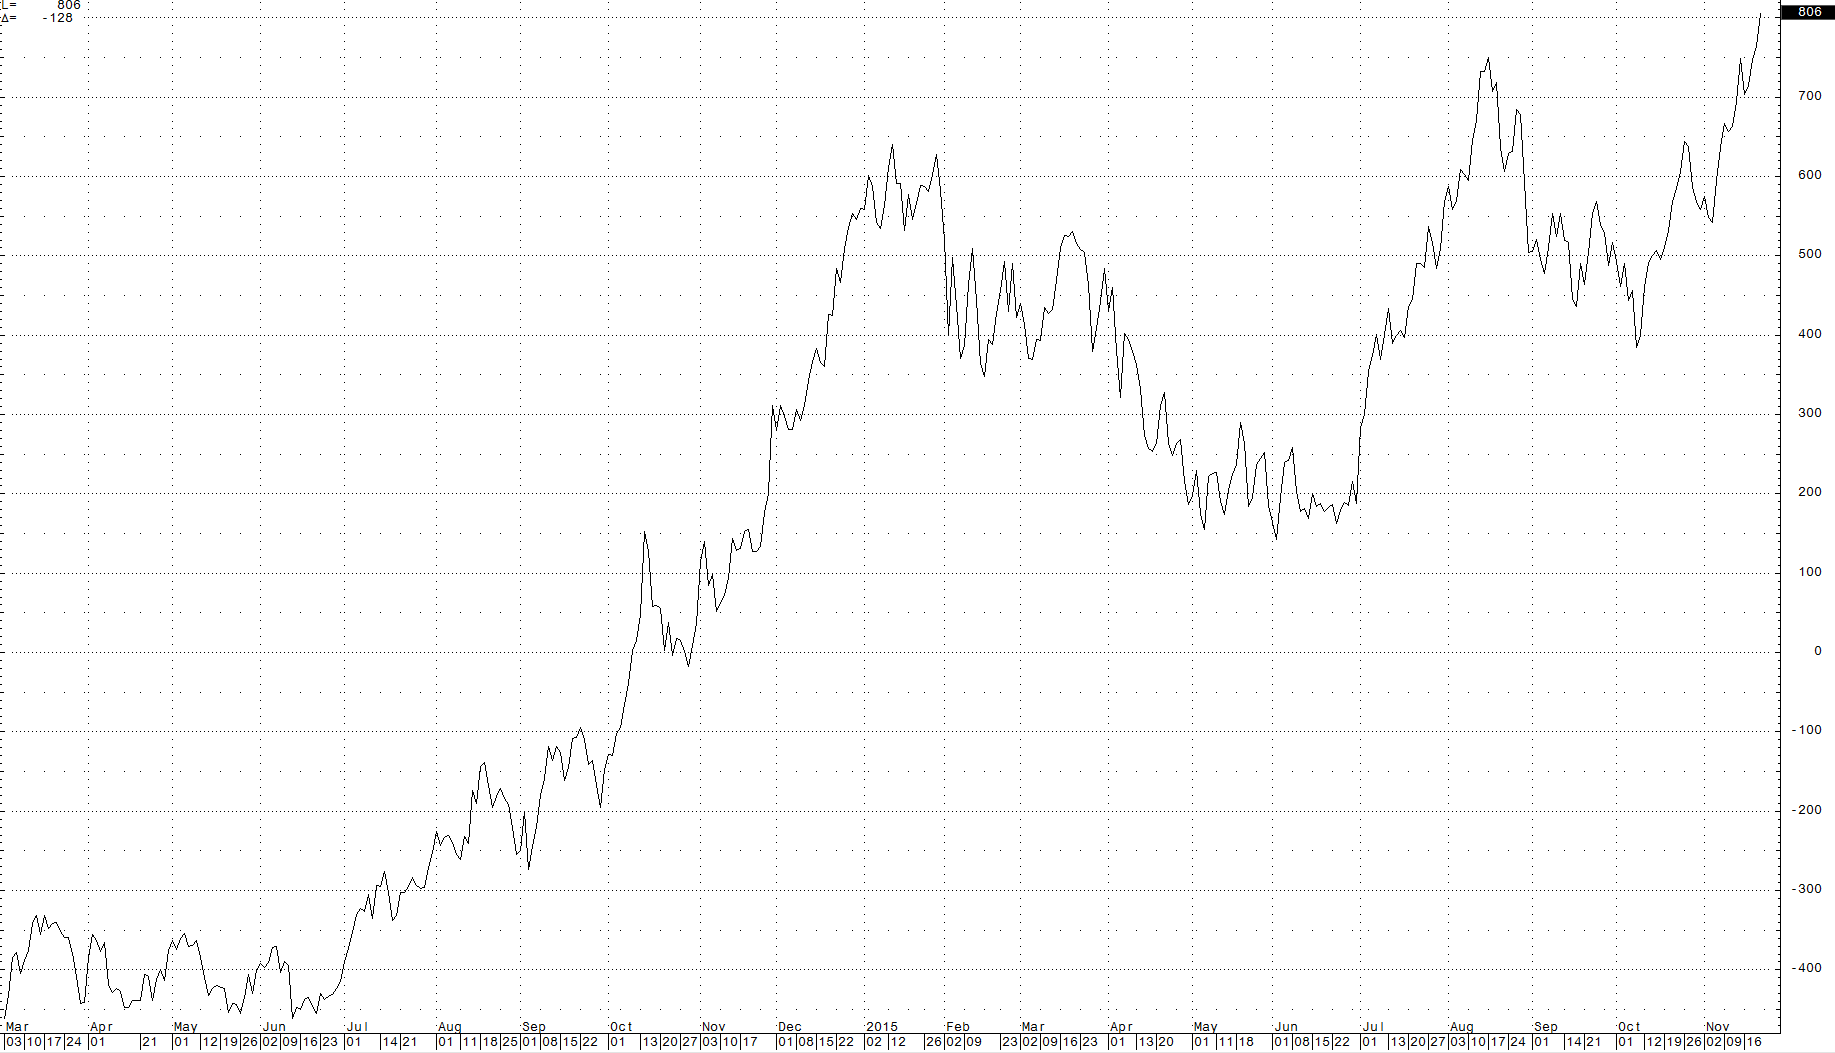 The December 2015 versus December 2016 NYMEX crude oil spread closed last week at over $8.00 per barrel. The contango has increased to 20.46%, the highest level yet for this spread. The January 2016 versus January 2017 NYMEX spread also made a new high and traded above the $7 level.
Brent crude oil futures have rolled from December to January. The January 2016 versus January 2017 Brent crude oil spread was trading around the $7.62 or 17% level last Friday. Market structure is telling us that huge inventories of crude oil will weigh on the price in the weeks ahead. At their current levels, a new low below the current support at $37.75 seems likely. Meanwhile, a location/quality spread in crude oil is also telling us that prospects for the oil price are currently bleak.
Brent-WTI says Iran will flood the market

The benchmark for pricing North American crude is the NYMEX West Texas Intermediate (WTI) price. When it comes to European, African and Middle Eastern crudes, Brent is the benchmark pricing mechanism. For many years, Brent crude traded at a small discount to WTI. That is because WTI is sweeter crude; it has lower sulfur content. This makes WTI more efficient when it comes to processing the oil into the most ubiquitously consumed oil product, gasoline.
That changed in 2010. The Arab Spring caused uncertainty in the Middle East to rise. As the majority of the world’s oil reserves are located in this region, the price of Brent crude rose relative to the price of WTI. Brent crude included a political premium. Additionally, increasing production from the United States, due to the extraction of oil from shale, exacerbated the price differential between the two crudes. In 2011, the price of Brent traded at over a $25 premium to the price of WTI. Recently, the spread between these two crudes has been converging. While the spread on January futures was trading at a premium of $2.40 for the Brent futures as of last Friday, it had moved much lower during the week.
The premium of Brent over WTI has evaporated over the course of 2015. The reason is two-fold. First, the number of operating oil rigs in the United States has fallen dramatically over the past year, indicating that production of the energy commodity will fall. Last Friday, Baker Hughes reported that the total number of oil rigs in operation as of November 20 stands at 564 down from 1,574 at this time last year. While lower U.S. production is one reason for a decline in the spread, increased production of Iranian crude oil has had a more powerful effect on the spread.
The nuclear nonproliferation agreement with Iran means that sanctions will ease and Iran will pump and export more crude oil in the weeks and months ahead. Iran has stated that their production will initially rise by 500,000 barrels per day and it will eventually rise to over one million. These two factors have caused the Brent-WTI spread to converge. The price trend in this spread is a negative for the price of crude at this time.
Crack spreads could crack the recent lows for crude

Recently, we have seen divergence emerging in crude oil processing spreads. Gasoline cracks have been outperforming crude oil, while heating oil crack spreads continue to trade at the weakest level in years.
Last Friday, the NYMEX gasoline crack spread closed at just over $14 per barrel.
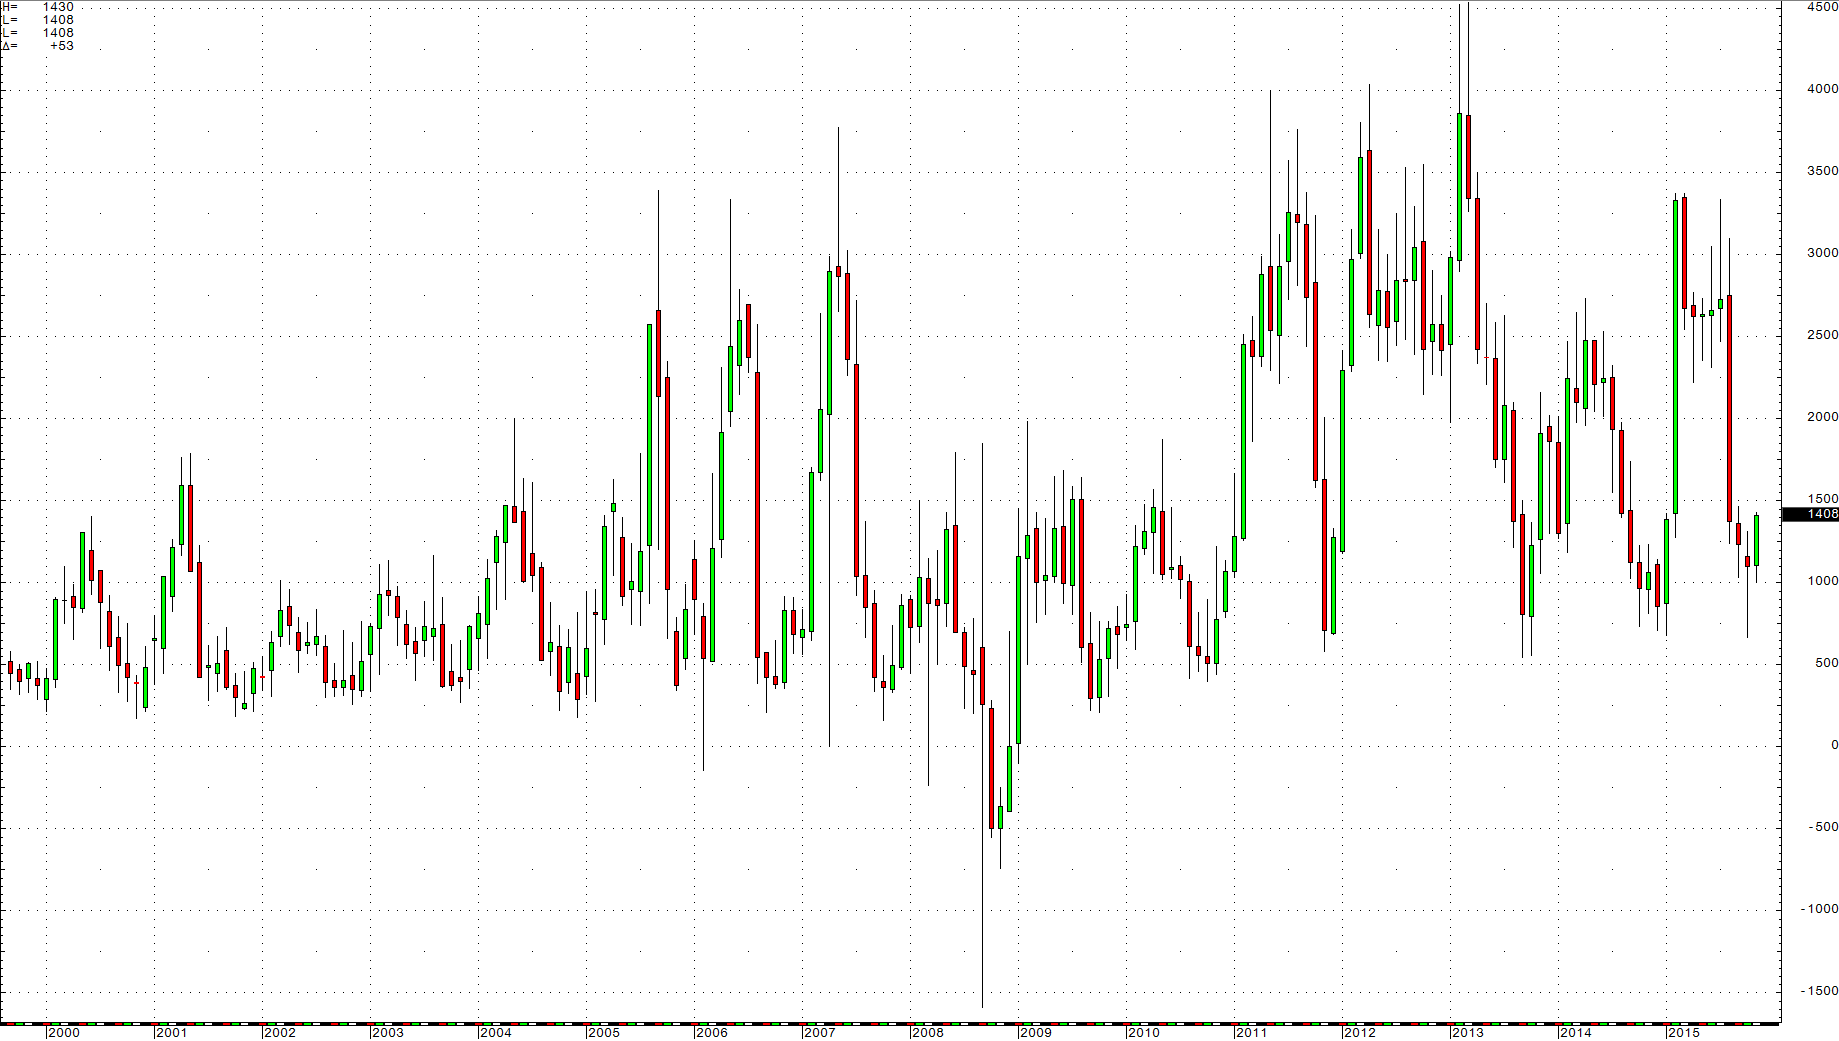 The monthly chart of the gasoline crack highlights the recent strong action in this spread. Gasoline is a seasonal product; it tends to trade at the lows during this time of year. In 2014, the high in the gasoline crack at this time of year was $12.36. Therefore, compared to last year, gasoline prices are strong relative to the price of raw crude oil. This could be due to the current low level of gasoline futures – the December NYMEX gasoline futures contract closed last Friday at $1.2866 and the January futures closed at $1.2670 per gallon. The current low level of gasoline prices has increased demand from drivers as refineries work to process heating oil as the winter is only a few weeks ahead. In September U.S. drivers set a record for miles traveled by automobile.
The heating oil processing spread is a very different story. While the gasoline crack is relatively strong, the heating oil crack is very weak.
(click to enlarge)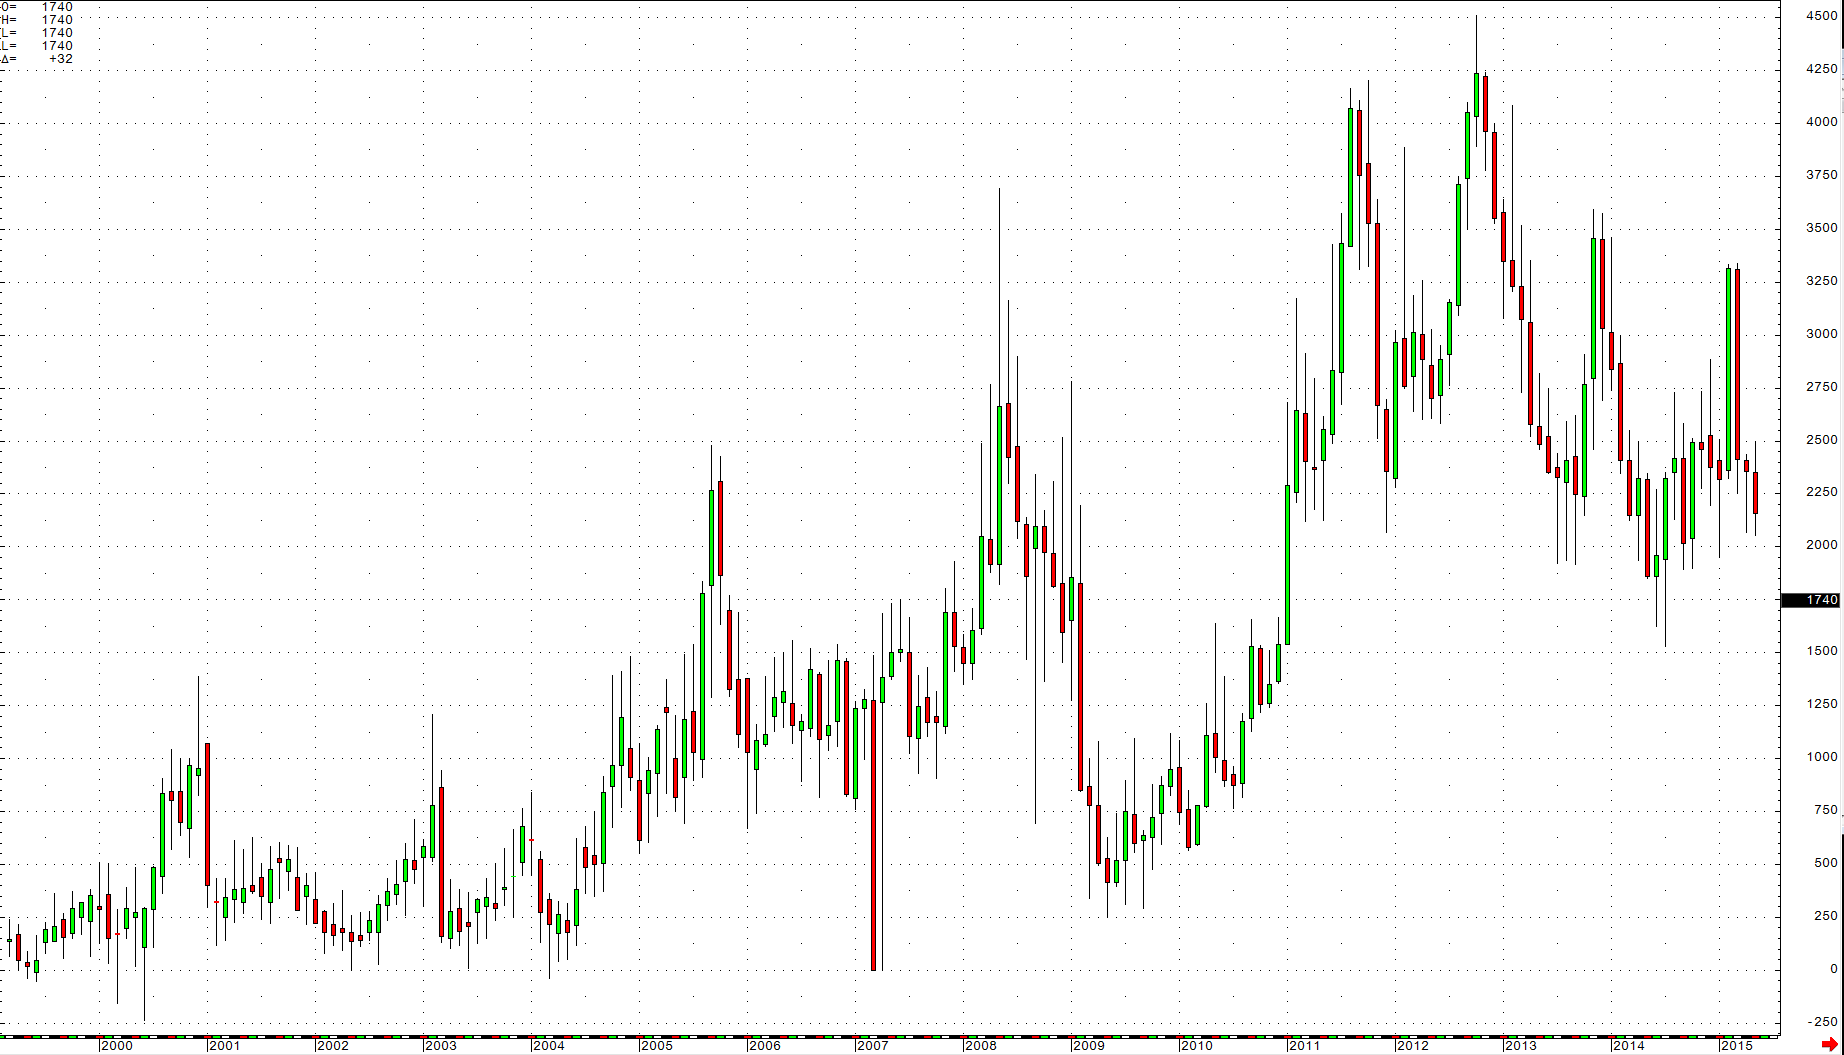 Last Friday, the January heating oil processing spread closed at around the $17.50 per barrel level. Last year at this time, the low in this spread was $22.73. In 2013, the low was $24.53 and in 2012, the low was $37.75 per barrel. The current level of the heating oil crack spread is seasonally the lowest since November 2010 when it traded down to $12.35 per barrel. In November 2010, crude oil was trading above $84 per barrel.
One of the many reasons that the crude oil price is weak these days is that demand for seasonal products, heating oil and diesel fuel, is low and inventories of distillates are high. As you can see, there are very few bullish signs in the fundamental structure for the crude oil market these days. In two weeks, the oil cartel will sit down to decide what to do now that the commodity they seek to “control” is awash in a sea of bearishness.
OPEC meeting is the next big event – Signals are that these guys cannot agree on anything

When OPEC met in November 2014, the price of crude was around the $75 per barrel level. When they met late last spring, the price had recovered to around $60. In both cases, the cartel left production levels unchanged. The stated production ceiling for the members of OPEC is 30 million barrels per day. The member nations are currently producing over 31.5 million barrels per day and increasing Iranian production means that OPEC output will likely rise. As the price of oil falls, the members need to sell more to try to recoup revenue. For the weaker members, the oil revenue is an imperative. Even the stronger members are under pressure. Saudi Arabia recently began selling bonds; they are borrowing money from the markets to replace lost income due to the lower crude oil price.
Meanwhile, OPEC’s current strategy is to continue to produce to flush high cost producers out of the market and build market share for the cartel members. However, OPEC did not count on a global economic slowdown, particularly in China. At the December 4 meeting of oil ministers in Vienna, it is likely that demand for crude oil will be an important consideration.
Dominant members of the cartel remain at odds. Saudi Arabia and Iran are on opposite sides and are involved in a proxy war in Yemen. The weaker members of OPEC want the stronger members to shoulder the burden of production cuts, and that is not likely to happen any time soon. In a hint of the discord between the member nations, on November 17, OPEC’s board of governors was unable to agree on the cartel’s long-term strategy plan and they tabled the issue until 2016. The issues revolve around ceiling output, setting production quotas and methods of maximizing member profits.
This tells us that unless the cartel is planning a giant spoof on the market, there is probably going to be no change in production policy. The current level of cheating or daily sales above the production ceiling may even increase. At this point, I doubt whether OPEC members could agree on whether it is sunny or cloudy outside given vast political, economic and cultural divergences among member nations. This means that selling will continue and even increase over the months ahead.
Crude oil and a turbulent world

All of the news, fundamentals and technicals for crude oil point to new lows and a challenge of the December 2008 lows of $32.48 per barrel. Last week, Goldman Sachs came out with a prediction that oil could fall to $20 per barrel. This is not such a bold call given the current state of the oil market, the strength of the dollar and the overall bear market for raw material prices. Last week, copper put in another multi-year low, iron ore fell to new lows and the Baltic Shipping Index fell to the lowest level since 1985.
However, all of the bad news for crude oil is currently in the price. We have seen this before. In March when crude oil traded to lows, there were calls for crude oil to fall – Dennis Gartman, the respected commodity analyst, went on CNBC and said that crude oil could fall to $10 per barrel as the energy commodity could go the way of “whale oil.” In late August, when oil fell to recent lows at $37.75, there were multiple calls for oil to fall to the low $30s and $20s. In both cases, powerful recovery rallies followed these bearish market calls. Following the March 2015 lows, oil rallied for over two months and gained 48.9%. In August of this year, a seven-week rally took oil 35% higher. The bearish prediction by Goldman Sachs last week could just turn out to be a contrarian’s dream.
There are a number of issues, big issues, going on in the world that can turn crude oil on a dime. First, Brent has fallen relative to WTI and the political premium for oil has evaporated. In 1990, when Saddam Hussein invaded Kuwait, the price of crude oil doubled in a matter of minutes. While the Middle East has always been a turbulent and dangerous part of the world, I would argue that today, it is far more turbulent and far more violent. The odds of attacks against oil fields and refineries in the Middle East have increased exponentially particularly given the recent ISIS attacks in France and around the world. At the same time, all of the bearish fundamental news about crude oil has decreased the political premium, and it is politics and war that could turn out to outweigh all of the current fundamentals.
Moreover, a surprise from outside of the Middle East could foster an increase in the price of oil. The world is now almost counting on Chinese economic weakness. Last week, Jamie Dimon, the Chairman of JPMorgan Chase, said that he is bullish on Chinese growth. If China does begin to show signs of growth, this could turn out to be supportive of crude oil and commodities in general, which remain mired in a bear market. Right now, the price of crude oil looks awful and fundamentals support a new low. However, all of that bearish data is in the price, and any surprise, in a world that always seems be full of surprises, could ignite the price once again. We saw this in March and again in August. As oil makes new lows, keep in mind that crude oil is a complicated puzzle. It is the unknown that will likely dictate the next big price move in oil. I am watching crude oil now and wondering whether Goldman Sachs called the turn in the market with their bearish forecast.
As a bonus, I have prepared a video on my website Commodix that provides a more in-depth and detailed analysis of the current state of the oil market to illustrate the real value implications and opportunities.
By Andrew Hecht in Seeking Alpha