
Crony Capitalism.
Tag Archives: Energy
Imagine That – Wall Street Journal Finally Admits Energy Inflation Will Keep Retail Food Prices High, Regardless of Commodity Price Market

Russia, In The Interim Agrees to Accept Euros for Energy Payment, Which Will be Transacted into Rubles by Gazprombank
(Sundance) Russian President Vladimir Putin and German Chancellor Olaf Scholz will hold further discussions on the purchase of Russian energy products in rubles according to TASS (Russian News) and western media. However, in the interim Russia will continue accepting payment in euros which will be exchanged for Rubles by Gazprom bank.
Cushing Storage Approaching Critical Low Level
Traders say that Cushing stockpiles might fall to critical levels within weeks; the last time that happened was in 2014.
/cloudfront-us-east-2.images.arcpublishing.com/reuters/ZRTUGWC57VJETDQH27TGNQRQWY.jpg)
(Devika Krishna Kumar) Stockpiles at the biggest U.S. crude depot are quickly approaching critically low levels. The last time that happened, crude cost more than $100 a barrel.
China Panics: Beijing Orders Energy Firms To “Secure Supplies At All Costs”, Oil Soars
China officially panicked.
Now that the global energy crisis has slammed China’s economy, leading to the first contractionary PMI since March 2020 as a result of widespread shutdowns of factory and manufacturing, not to mention hundreds of millions of Chinese residents suffering from periodic blackouts, Bloomberg reports that China’s central government officials “ordered the country’s top state-owned energy companies to secure supplies for this winter at all costs.”
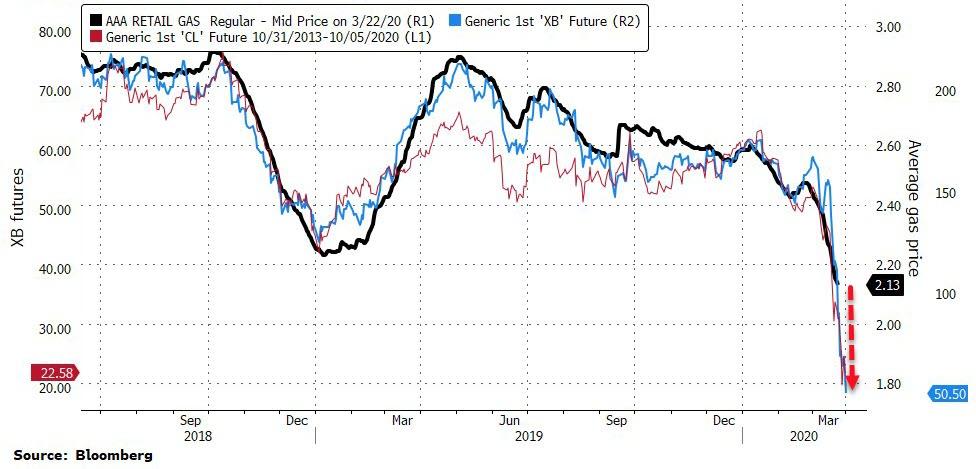
US Gasoline Crashes To 50c – Lowest Since 2001 – Amid “Unprecedented” Demand Collapse
Gasoline futures in New York fell as much as 13% to 50.00 cents a gallon, the lowest level since the current contract started trading in 2005.

The previous gasoline contract last traded that low in 2001…
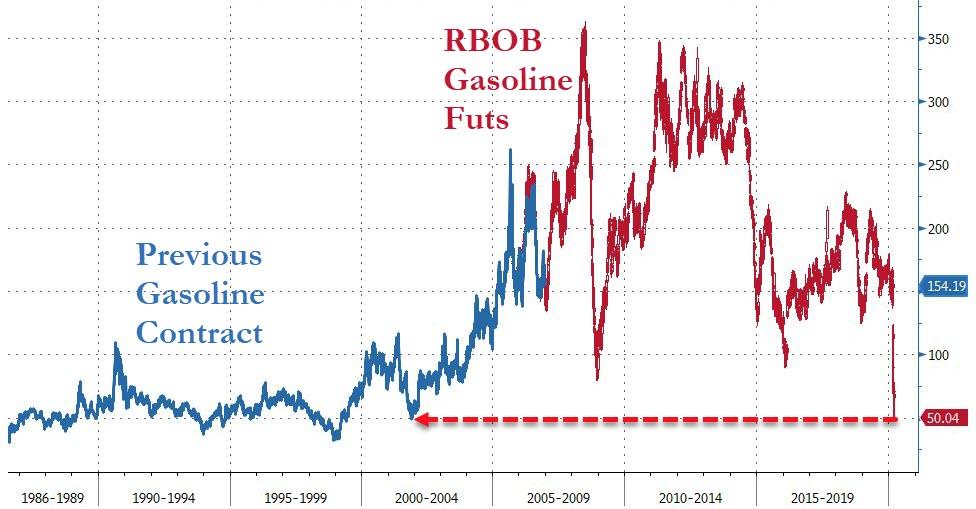
All of which means Americans – on average – except Californians – can expect gas-prices at the pump to plunge below $2/gallon very soon…
Energy prices slid toward this multi-decade low on plunging demand due to the economic fallout from the coronavirus crisis, and as prospects for a OPEC-Texas production deal faded.
“The government is taking a ‘whatever it takes’ approach,” said Marshall Steeves, an analyst at IHS Markit.
“That doesn’t change the fact that demand destruction is going to continue. There are still so many unknowns on the demand front. The duration of this economic shutdown is so uncertain that it’s making me believe the bottom may not be in yet.”
As Bloomberg notes, the prospects for the oil market remain bleak with more nations going into lockdown to tackle the virus. At the same time, supply is surging. The chance that either Saudi Arabia or Russia will back down from their price war seems remote, with President Vladimir Putin unlikely to submit to what he sees as the kingdom’s oil blackmail, according to Kremlin watchers.
Even if crude demand recovers to normal levels by the middle of the year, 2020 is still on course to suffer the biggest decline in consumption since reliable records started in the mid-1960s.
“We are now looking at a scale of surplus in the second quarter we probably never have seen before,” said Bjarne Schieldrop, chief commodities analyst at SEB.
Until now, the biggest annual contraction was recorded in 1980, when it tumbled by 2.6 million barrels a day as the global economy reeled under the impact of the second oil crisis.
Saudi To Grow Production, Starting A Price War
This comes as demand has been slashed due to the coronavirus outbreak

Prince Abdulaziz, energy minister of Saudi Arabia
Saudi Arabia will increase its oil output next month to more than 10 million barrels per day, following talks between OPEC and its allies which failed to come to an agreement.
KSA has cut its oil prices drastically, more than it has in 20 years, with discounts to buyers in Europe, the Far East, and the US meant to draw more refiners to Saudi crude rather than other crude oil suppliers.
Bloomberg reported that Saudi Arabia has privately said it could raise production to 12 million barrels per day, citing anonymous sources.
This comes as demand is slashed due to the ongoing coronavirus outbreak.
These Are The Banks With Most Energy Exposure
With energy junk bonds crashing…
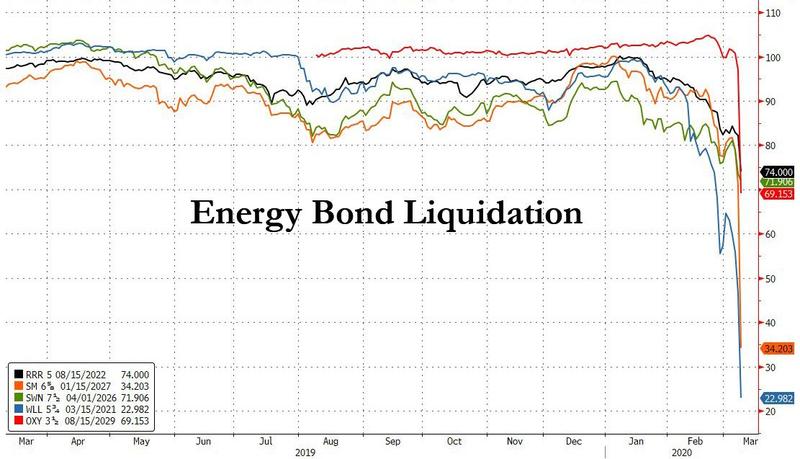
… amid a (long-overdue) investor revulsion to the highly levered energy sector, much of which is funded in the high yield market, as crashing oil prices bring front and center a doomsday scenario of mass defaults as shale companies are unable to meet their debt and interest payment obligations, investor focus is shifting up the funding chain, and after assessing which shale names are likely to be hit the hardest, with many filing for bankruptcy if oil remains at or below $30, the next question is which banks have the most exposure to the energy loans funding these same E&P companies.
Conveniently, in a note this morning looking at the impact of plunging interest rates on bank profitability, Morgan Stanley also lays out the US banks that have the highest exposure to energy in their Q4 loan books.
Coal Shipping In US Industrial Heartland Hits 35-Year Low
President Trump vowed to make “Coal Great Again” and restore the industrial heartland. But it seems as Trump’s many campaign promises to coal miners have been broken, as there’s hardly a peep from the administration about the imploding industry.
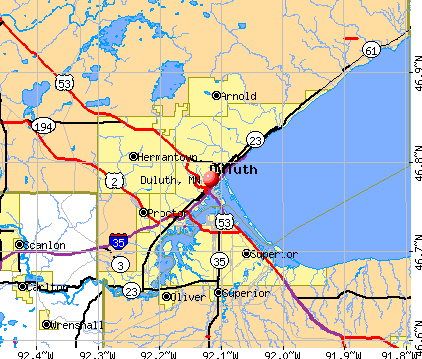
Take, for instance, a new report from A.P. News, that details how Twin Ports of Duluth-Superior, recorded its lowest coal cargo volumes in three decades during the 2019 shipping season.
Greg Nemet, a public affairs professor at the University of Wisconsin-Madison, said coal shipments in the port have plunged as the demand for renewable energy has soared in recent years.
“It’s really a competition between coal, natural gas, and renewables. It’s cheaper to make electricity with natural gas and with solar,” Nemet said. “Coal really can’t compete with either of those.”
A.P. said 8 million tons of coal moved through the Twin Ports, the lowest volume since 1985.
U.S. coal production has plunged from 1.2 billion tons in 2008 to 597 million last year. Despite Trump’s promises to revive the industry, production continues to decline.
Trump was silent last year after a significant bankruptcy wave devastated the industry.
Deteriorating coal industry fundamentals and escalating environmental, social and governance concerns, led to the recent bankruptcy of Peabody, the world’s largest coal producer.
Trump routinely pumped the coal industry, calling it “indestructible” and telling everyone on social media that “coal is back.” Here he is in 2017 famously telling people that “We are going to put our coal miners back to work.”
And to make matters worse for miners, the Trump administration isn’t about saving the industry:
“Coal as a percentage of U.S. electricity generation is declining and will probably continue to decline for some time,” Sec. Dan Brouillette told the Atlantic Council. “The effort that we’re undertaking is not to subsidize the industry and preserve their status, if you will, as a large electricity generator. It is simply to make the product cleaner and to look for alternative uses for this product.”
The hopes of a coal rebound were all for election purposes. The industry is imploding, as it’s clear that, according to Trump, the stock market is more important than the real economy.
California Energy Situation Bad And Getting Worse
The energy situation in California is bad and likely to get worse. Ronald Stein, Founder and Ambassador for Energy & Infrastructure of PTS Advance, sounds the alarm. Via Watts Up With That:
California has not even been able to generate enough of its own electricity in-state and imported 29% of its needs in 2018. … California households are already paying 50% more, and industrial users are paying more than double the national average for electricity.
Do the communists running the state actually believe that carbon emissions are somehow harmful? Apparently not, or they would support zero-emission and low-emission energy sources. The state’s last nuclear plant and the last three natural gas plants in Southern California are all closing. Nuclear and natural gas are no good because they are economically efficient.
But there are no plans for industrial wind or solar projects either. This means California will have to import ever more energy — some from overseas.
California is the only state in the union that currently imports most of its crude oil energy from foreign countries. The California Energy Commission (CEC) data demonstrates that this dependency on foreign sources of oil requires expenditures of $60 million dollars EVERY DAY to oil rich foreign countries to support the 5th largest economy in the world for it’s military, aviation, cruise ships, and merchant ships, just to make up for the States’ choice to continue decreasing in-state production.
Not all of these countries are friendly to the USA or to California.
Governor Gavin Newsom’s solution is to take a bad situation and make it worse. His…
…latest moves to reduce production and require larger setbacks for existing production wells will further decrease production and require the State to increase its monthly imports resulting in expenditures approaching a whopping $90 million EVERY DAY for foreign countries to support our infrastructures.
By now everyone knows that Trump is not in cahoots with Vladimir Putin, regardless of what the Democrat Party/establishment media told us for years. Maybe someone should investigate Newsom instead:
Both [Putin and Newsom] support California being more and more dependent on imported foreign oil, and both support anti-fracking in California as a successful fracking enterprise would lessen the states’ dependency on that foreign oil.
No wonder most of the moving vans are heading out of instead of into California. As those who leave are displaced by still more needy immigrants from the less successful parts of the world, expect the politics to veer ever further to the left. The Democrat Death Spiral is not inducive to energy production.
Cheap Oil Hits Housing In North Dakota, Texas, & Others
Collapse in crude oil prices is a huge blow to areas where oil extraction and associated industries are the bread and butter of the economy.
As petro-economies suffer from the bust in crude prices, the effects are showing up in the housing market.
Take North Dakota, for example, which was on the front lines of the oil boom between 2011 and 2014. In fact, North Dakota is probably the most vulnerable to a downturn in housing because of low oil prices. The economy is smaller and thus more dependent on the oil boom than other places, such as Texas. The state saw an influx of new workers over the past few years, looking for work in in the prolific Bakken Shale. A housing shortage quickly emerged, pushing up prices. With the inability to house all of the new people, rent spiked, as did hotel rates. The overflow led to a proliferation of “man camps.”
Now the boom has reversed. The state’s rig count is down to 53 as of January 13, about one-third of the level from one year ago. Drilling is quickly drying up and production is falling. “The jobs are leaving, and if an area gets depopulated, they can’t take the houses with them and that’s dangerous for the housing market,” Ralph DeFranco, senior director of risk analytics and pricing at Arch Mortgage Insurance Company, told CNN Money.
New home sales were down by 6.3 percent in North Dakota between January and October of 2015 compared to a year earlier. Housing prices have not crashed yet, but there tends to be a bit of a lag with housing prices. JP Ackerman of House Canary says that it typically takes 15 to 24 months before house prices start to show the negative effects of an oil downturn.
According to Arch Mortgage, homes in North Dakota are probably 20 percent overvalued at this point. They also estimate that the state has a 46 percent chance that house prices will decline over the next two years. But that is probably understating the risk since oil prices are not expected to rebound through most of 2016. Moreover, with some permanent damage to the balance sheets of U.S. shale companies, drilling won’t spring back to life immediately upon a rebound in oil prices.
There are some other states that are also at risk of a hit to their housing markets, including Wyoming, West Virginia and Alaska. Out of those three, only Alaska is a significant oil producer, but it is in the midst of a budget crisis because of the twin threats of falling production and rock bottom prices. Alaska’s oil fields are mature, and have been in decline for years. With a massive hole blown through the state’s budget, the Governor has floated the idea of instituting an income tax, a once unthinkable idea.
The downturn in Wyoming and West Virginia has more to do with the collapse in natural gas prices, which continues to hollow out their coal industries. Coal prices have plummeted in recent years, and coal production is now at its lowest level since the Reagan administration. Shale gas production, particularly in West Virginia, partially offsets the decline, but won’t be enough to come to the state’s rescue.
Texas is another place to keep an eye on. However, Arch Mortgage says the economy there is much larger and more diversified than other states, and also better equipped to handle the downturn than it was back in the 1980s during the last oil bust.
But Texas won’t escape unscathed. The Dallas Fed says job growth will turn negative in a few months if oil prices don’t move back to $40 or $50 per barrel. Texas is expected to see an additional 161,200 jobs this year if oil prices move back up into that range. But while that could be the best-case scenario, it would still only amount to one-third of the jobs created in 2014. “The biggest risk to the forecast is if oil prices are in the range of $20 to $30 for much of the year,” Keith Phillips, Dallas Fed Senior Economist, said in a written statement. “Then I expect job growth to slip into negative territory as Houston gets hit much harder and greater problems emerge in the financial sector.”
After 41 consecutive months of increases in house prices in Houston, prices started to decline in third quarter of 2015. In Odessa, TX, near the Permian Basin, home sales declined by 10.6 percent between January and October 2015 compared to a year earlier.
Most Americans will still welcome low prices at the pump. But in the oil boom towns of yesterday, the slowdown is very much being felt.
By Nick Cunningham in ZeroHedge
Crude Oil Market Structure Looks Weak, But It Is Only One Part Of A Complicated Puzzle
Summary
- Term structure – contango says too much oil around.
- Brent-WTI says Iran will flood the market.
- Crack spreads could crack the recent lows for crude.
- OPEC meeting is the next big event – signals are that these guys cannot agree on anything.
- Crude oil and a turbulent world.
 The price of crude oil has not looked this bad since March, when it made lows of $42.03, or on August 24, when it fell to $37.75. On Friday, November 20, active month January NYMEX crude oil settled at $41.90 per barrel. The expiring December contract traded down to lows of $38.99 on the session. There are very few positive things to say about the future prospects for the price of crude oil at this time. The fundamental structural state of the oil market is bearish for price.
Term Structure – contango says too much oil around
Two weeks ago, the IEA told us that the world is awash in crude oil. The international agency told us that worldwide inventories have swelled to 3 billion barrels.
When crude oil was trading over $100 per barrel on the active month NYMEX futures contract during the summer of 2014, the market was in backwardation. Deferred futures prices were lower than nearby prices. This condition tells us that a market is tight, or there is a supply deficit. As the price of oil began to fall, term structure moved from backwardation to contango. This told us that the market moved from deficit to a condition of oversupply. This past week, the contango on the nearby versus one-year oil spread once again validated the glut condition in crude oil.
(click to enlarge)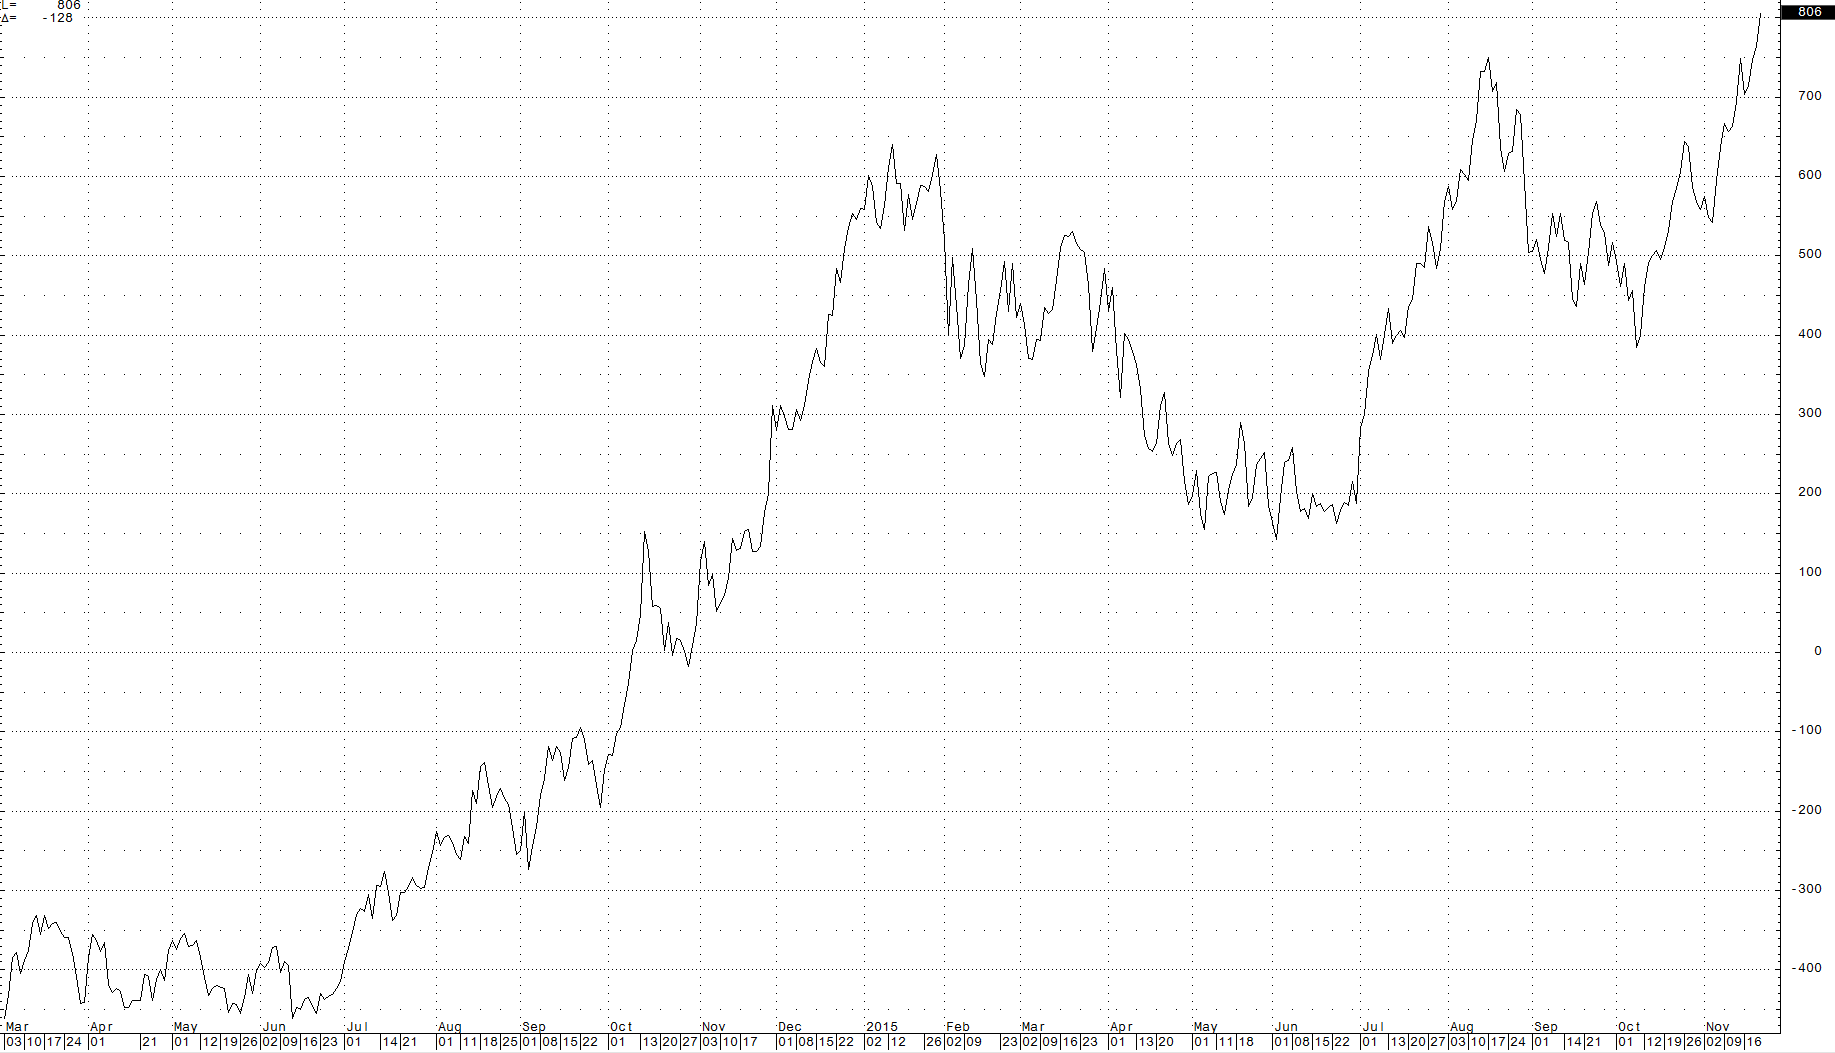 The December 2015 versus December 2016 NYMEX crude oil spread closed last week at over $8.00 per barrel. The contango has increased to 20.46%, the highest level yet for this spread. The January 2016 versus January 2017 NYMEX spread also made a new high and traded above the $7 level.
Brent crude oil futures have rolled from December to January. The January 2016 versus January 2017 Brent crude oil spread was trading around the $7.62 or 17% level last Friday. Market structure is telling us that huge inventories of crude oil will weigh on the price in the weeks ahead. At their current levels, a new low below the current support at $37.75 seems likely. Meanwhile, a location/quality spread in crude oil is also telling us that prospects for the oil price are currently bleak.
Brent-WTI says Iran will flood the market

The benchmark for pricing North American crude is the NYMEX West Texas Intermediate (WTI) price. When it comes to European, African and Middle Eastern crudes, Brent is the benchmark pricing mechanism. For many years, Brent crude traded at a small discount to WTI. That is because WTI is sweeter crude; it has lower sulfur content. This makes WTI more efficient when it comes to processing the oil into the most ubiquitously consumed oil product, gasoline.
That changed in 2010. The Arab Spring caused uncertainty in the Middle East to rise. As the majority of the world’s oil reserves are located in this region, the price of Brent crude rose relative to the price of WTI. Brent crude included a political premium. Additionally, increasing production from the United States, due to the extraction of oil from shale, exacerbated the price differential between the two crudes. In 2011, the price of Brent traded at over a $25 premium to the price of WTI. Recently, the spread between these two crudes has been converging. While the spread on January futures was trading at a premium of $2.40 for the Brent futures as of last Friday, it had moved much lower during the week.
The premium of Brent over WTI has evaporated over the course of 2015. The reason is two-fold. First, the number of operating oil rigs in the United States has fallen dramatically over the past year, indicating that production of the energy commodity will fall. Last Friday, Baker Hughes reported that the total number of oil rigs in operation as of November 20 stands at 564 down from 1,574 at this time last year. While lower U.S. production is one reason for a decline in the spread, increased production of Iranian crude oil has had a more powerful effect on the spread.
The nuclear nonproliferation agreement with Iran means that sanctions will ease and Iran will pump and export more crude oil in the weeks and months ahead. Iran has stated that their production will initially rise by 500,000 barrels per day and it will eventually rise to over one million. These two factors have caused the Brent-WTI spread to converge. The price trend in this spread is a negative for the price of crude at this time.
Crack spreads could crack the recent lows for crude

Recently, we have seen divergence emerging in crude oil processing spreads. Gasoline cracks have been outperforming crude oil, while heating oil crack spreads continue to trade at the weakest level in years.
Last Friday, the NYMEX gasoline crack spread closed at just over $14 per barrel.
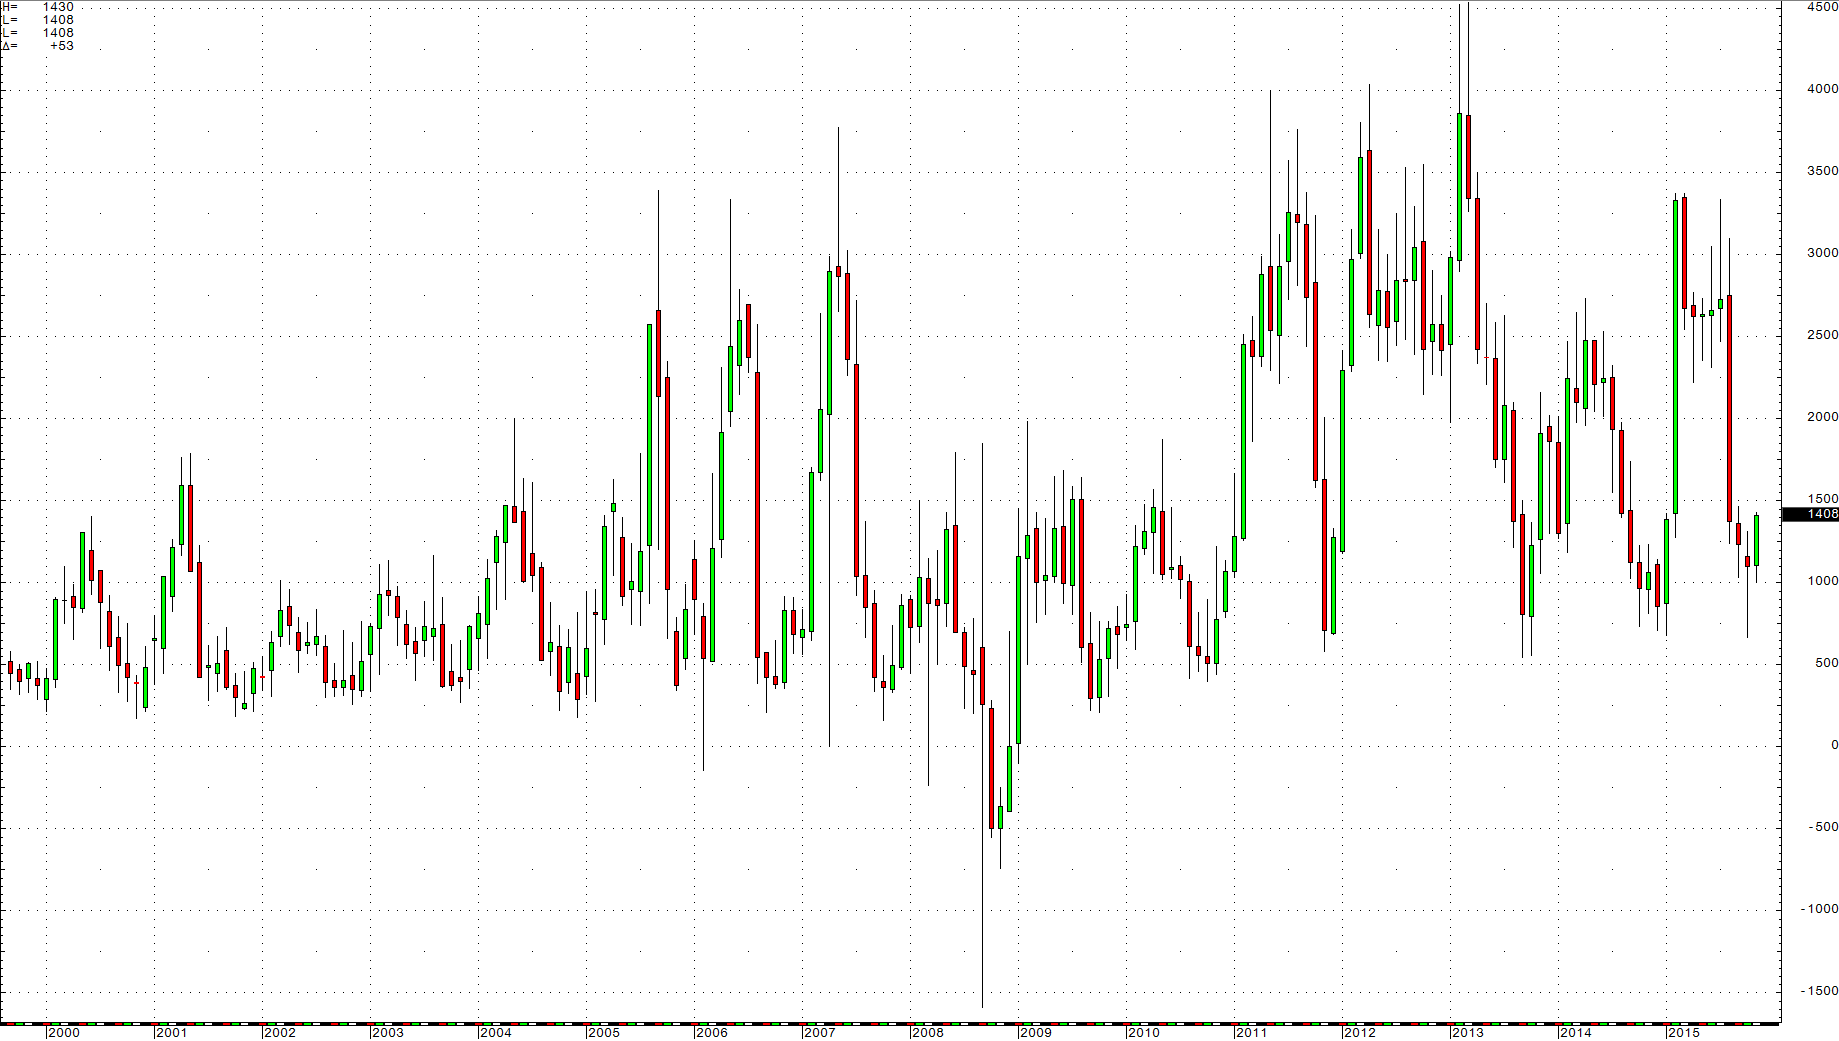 The monthly chart of the gasoline crack highlights the recent strong action in this spread. Gasoline is a seasonal product; it tends to trade at the lows during this time of year. In 2014, the high in the gasoline crack at this time of year was $12.36. Therefore, compared to last year, gasoline prices are strong relative to the price of raw crude oil. This could be due to the current low level of gasoline futures – the December NYMEX gasoline futures contract closed last Friday at $1.2866 and the January futures closed at $1.2670 per gallon. The current low level of gasoline prices has increased demand from drivers as refineries work to process heating oil as the winter is only a few weeks ahead. In September U.S. drivers set a record for miles traveled by automobile.
The heating oil processing spread is a very different story. While the gasoline crack is relatively strong, the heating oil crack is very weak.
(click to enlarge)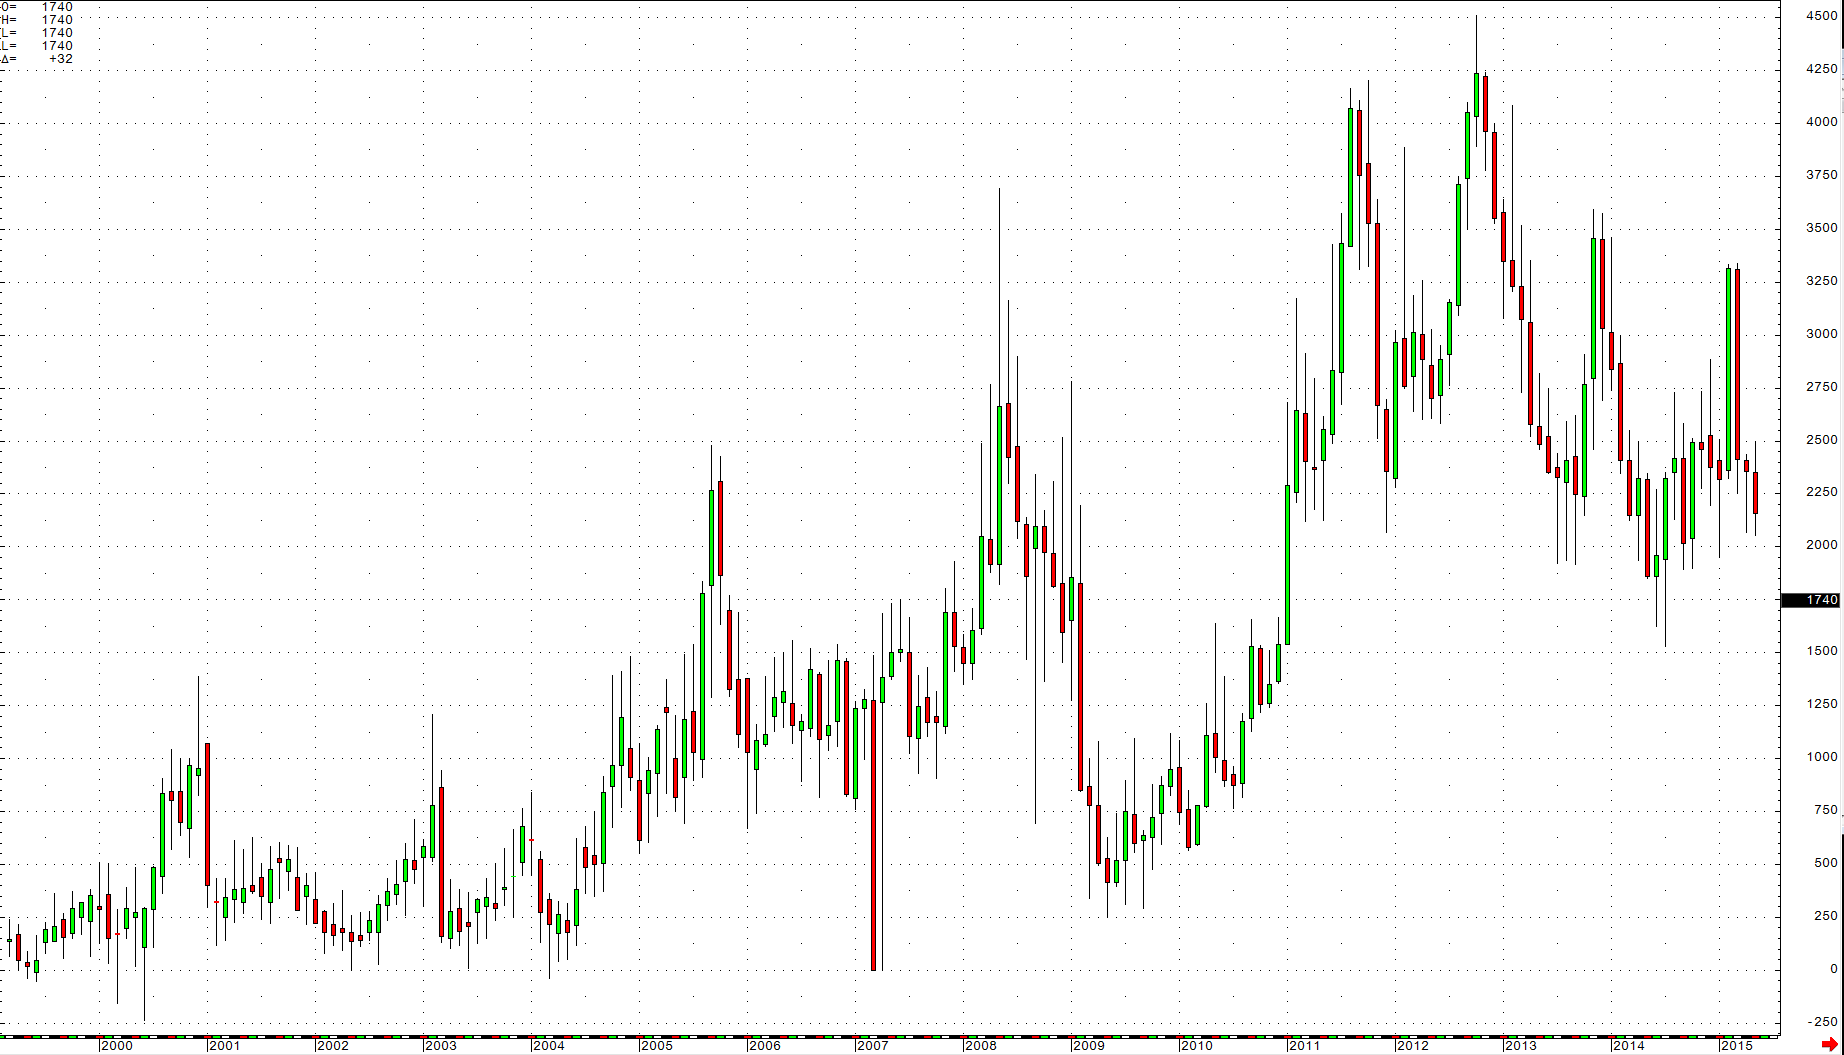 Last Friday, the January heating oil processing spread closed at around the $17.50 per barrel level. Last year at this time, the low in this spread was $22.73. In 2013, the low was $24.53 and in 2012, the low was $37.75 per barrel. The current level of the heating oil crack spread is seasonally the lowest since November 2010 when it traded down to $12.35 per barrel. In November 2010, crude oil was trading above $84 per barrel.
One of the many reasons that the crude oil price is weak these days is that demand for seasonal products, heating oil and diesel fuel, is low and inventories of distillates are high. As you can see, there are very few bullish signs in the fundamental structure for the crude oil market these days. In two weeks, the oil cartel will sit down to decide what to do now that the commodity they seek to “control” is awash in a sea of bearishness.
OPEC meeting is the next big event – Signals are that these guys cannot agree on anything

When OPEC met in November 2014, the price of crude was around the $75 per barrel level. When they met late last spring, the price had recovered to around $60. In both cases, the cartel left production levels unchanged. The stated production ceiling for the members of OPEC is 30 million barrels per day. The member nations are currently producing over 31.5 million barrels per day and increasing Iranian production means that OPEC output will likely rise. As the price of oil falls, the members need to sell more to try to recoup revenue. For the weaker members, the oil revenue is an imperative. Even the stronger members are under pressure. Saudi Arabia recently began selling bonds; they are borrowing money from the markets to replace lost income due to the lower crude oil price.
Meanwhile, OPEC’s current strategy is to continue to produce to flush high cost producers out of the market and build market share for the cartel members. However, OPEC did not count on a global economic slowdown, particularly in China. At the December 4 meeting of oil ministers in Vienna, it is likely that demand for crude oil will be an important consideration.
Dominant members of the cartel remain at odds. Saudi Arabia and Iran are on opposite sides and are involved in a proxy war in Yemen. The weaker members of OPEC want the stronger members to shoulder the burden of production cuts, and that is not likely to happen any time soon. In a hint of the discord between the member nations, on November 17, OPEC’s board of governors was unable to agree on the cartel’s long-term strategy plan and they tabled the issue until 2016. The issues revolve around ceiling output, setting production quotas and methods of maximizing member profits.
This tells us that unless the cartel is planning a giant spoof on the market, there is probably going to be no change in production policy. The current level of cheating or daily sales above the production ceiling may even increase. At this point, I doubt whether OPEC members could agree on whether it is sunny or cloudy outside given vast political, economic and cultural divergences among member nations. This means that selling will continue and even increase over the months ahead.
Crude oil and a turbulent world

All of the news, fundamentals and technicals for crude oil point to new lows and a challenge of the December 2008 lows of $32.48 per barrel. Last week, Goldman Sachs came out with a prediction that oil could fall to $20 per barrel. This is not such a bold call given the current state of the oil market, the strength of the dollar and the overall bear market for raw material prices. Last week, copper put in another multi-year low, iron ore fell to new lows and the Baltic Shipping Index fell to the lowest level since 1985.
However, all of the bad news for crude oil is currently in the price. We have seen this before. In March when crude oil traded to lows, there were calls for crude oil to fall – Dennis Gartman, the respected commodity analyst, went on CNBC and said that crude oil could fall to $10 per barrel as the energy commodity could go the way of “whale oil.” In late August, when oil fell to recent lows at $37.75, there were multiple calls for oil to fall to the low $30s and $20s. In both cases, powerful recovery rallies followed these bearish market calls. Following the March 2015 lows, oil rallied for over two months and gained 48.9%. In August of this year, a seven-week rally took oil 35% higher. The bearish prediction by Goldman Sachs last week could just turn out to be a contrarian’s dream.
There are a number of issues, big issues, going on in the world that can turn crude oil on a dime. First, Brent has fallen relative to WTI and the political premium for oil has evaporated. In 1990, when Saddam Hussein invaded Kuwait, the price of crude oil doubled in a matter of minutes. While the Middle East has always been a turbulent and dangerous part of the world, I would argue that today, it is far more turbulent and far more violent. The odds of attacks against oil fields and refineries in the Middle East have increased exponentially particularly given the recent ISIS attacks in France and around the world. At the same time, all of the bearish fundamental news about crude oil has decreased the political premium, and it is politics and war that could turn out to outweigh all of the current fundamentals.
Moreover, a surprise from outside of the Middle East could foster an increase in the price of oil. The world is now almost counting on Chinese economic weakness. Last week, Jamie Dimon, the Chairman of JPMorgan Chase, said that he is bullish on Chinese growth. If China does begin to show signs of growth, this could turn out to be supportive of crude oil and commodities in general, which remain mired in a bear market. Right now, the price of crude oil looks awful and fundamentals support a new low. However, all of that bearish data is in the price, and any surprise, in a world that always seems be full of surprises, could ignite the price once again. We saw this in March and again in August. As oil makes new lows, keep in mind that crude oil is a complicated puzzle. It is the unknown that will likely dictate the next big price move in oil. I am watching crude oil now and wondering whether Goldman Sachs called the turn in the market with their bearish forecast.
As a bonus, I have prepared a video on my website Commodix that provides a more in-depth and detailed analysis of the current state of the oil market to illustrate the real value implications and opportunities.
By Andrew Hecht in Seeking Alpha
Energy Companies Face “Come-To-Jesus” Point As Bankruptcies Loom
Last week, amid a renewed bout of crude carnage, Morgan Stanley made a rather disconcerting call on oil.
“On current trajectory, this downturn could become worse than 1986: An additional +1.5 mb/d [of OPEC supply] is roughly one year of oil demand growth. If sustained, this could delay the rebalancing of oil markets by a year as well. The forward curve has started to price this in: as the chart shows, the forward curve currently points towards a recovery in prices that is far worse than in 1986. This means the industrial downturn could also be worse. In that case, there would be little in analysable history that could be a guide to this cycle,” the bank wrote, presaging even tougher times ahead for the O&G space.
If Morgan Stanley is correct, we’re likely to see tremendous pressure on the sector’s highly indebted names, many of whom have been kept afloat thus far by easy access to capital markets courtesy of ZIRP.
With a rate hike cycle on the horizon, with hedges set to roll off, and with investors less willing to throw good money after bad on secondaries and new HY issuance, banks are likely to rein in credit lines in October when the next assessment is due. At that point, it will be game over in the absence of a sharp recovery in crude prices.
Against this challenging backdrop, we bring you the following commentary from Emanuel Grillo, partner at Baker Botts’s bankruptcy and restructuring practice who spoke to Bloomberg Brief last week.
* * *
Via Bloomberg Brief
How does the second half of this year look when it comes to energy bankruptcies?
A: People are coming to realize that the market is not likely to improve. At the end of September, companies will know about their bank loan redeterminations and you’ll see a bunch of restructurings. And, as the last of the hedges start to burn off and you can’t buy them for $80 a barrel any longer, then you’re in a tough place.
The bottom line is that if oil prices don’t increase, it could very well be that the next six months to nine months will be worse than the last six months. Some had an ability to borrow, and you saw other people go out and restructure. But the options are going to become fewer and smaller the longer you wait.
Are there good deals on the horizon for distressed investors?
A: The markets are awash in capital, but you still have a disconnect between buyers and sellers. Sellers, the guys who operate these companies, are hoping they can hang on. Buyers want to pay bargain-basement prices. There’s not enough pressure on the sellers yet. But I think that’s coming.
Banks will be redetermining their borrowing bases again in October. Will they be as lenient this time around as they were in April?
A: I don’t know if you’ll get the same slack in October as in April, absent a turnaround in the market price for oil. It’s going to be that ‘come-to-Jesus’ point in time where it’s about how much longer can they let it play. If the banks get too aggressive, they’re going to hurt the value for themselves and their ability to exit. So they’re playing a balancing act.
They know what pressure they’re facing from a regulatory perspective. At the same time, if they push too far in that direction, toward complying with the regulatory side and getting out, then they’re going to hurt themselves in terms of what their own recovery is going to be. All of the banks have these loans under very close scrutiny right now. They’d all get out tomorrow if they could. That’s the sense they’re giving off to the marketplace, because the numbers are just not supporting what they need to have from a regulatory perspective.
Oil & Gas Stocks: ‘Stability At The Bottom’ May Be A Positive Sign

Summary:
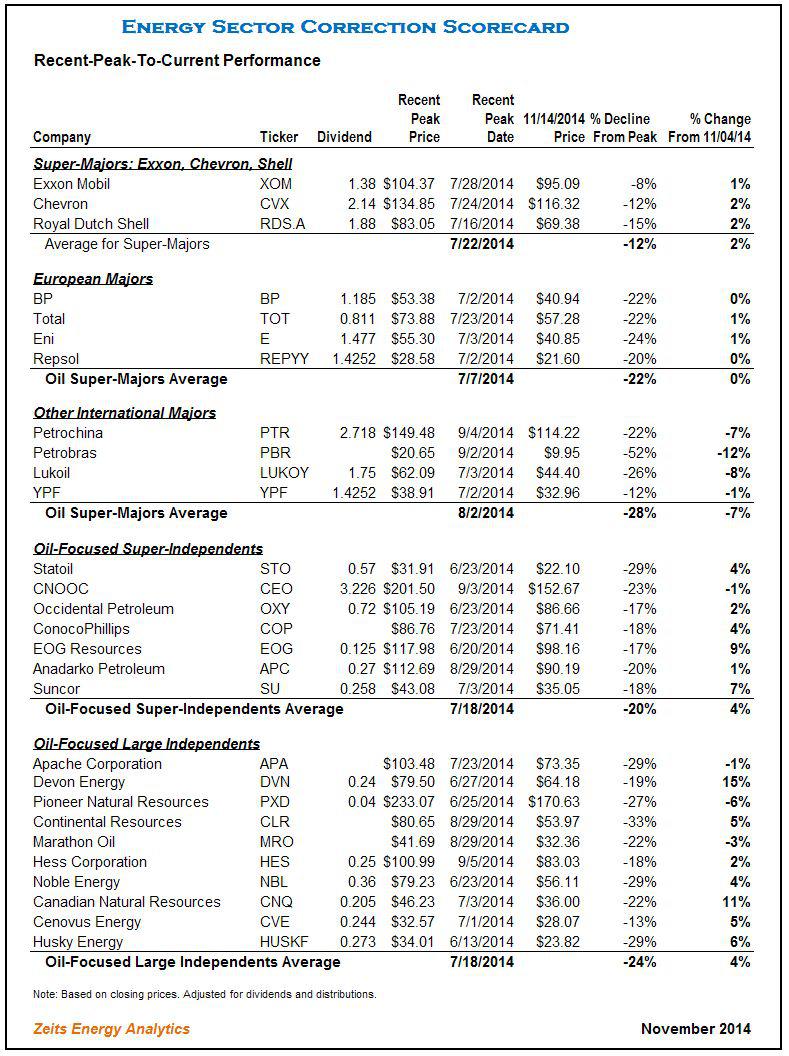
- The article provides “correction scorecards” by stock and by group versus commodities.
- In the past two weeks, oil & gas stocks firmed up, despite the continued slide in the price of oil.
- Small- and mid-capitalization oil-focused E&Ps were the strongest winners.
- Emerging markets Oil Majors and Upstream MLPs were the worst performers.
During the two weeks since my previous update, stocks in the Oil & Gas sector demonstrated what an optimist might interpret as “stability at the bottom.” The net effect of another sequence of high-amplitude intraday moves was a slight recovery from the two weeks ago levels across the vast majority of segments and stock groups, as shown on the chart below. It should be no surprise that those groups that had declined the most were also the biggest gainers in the past two weeks.
Most notable is the fact that the descend trend in the Oil & Gas stocks was interrupted (and even marginally reversed) in spite of the new lows posted by the price of oil. One could try to interpret this performance as an indication that the current price levels already discount the market’s fear that the oil price paradigm has shifted. This stability may also indicate that the wave of forced liquidations by hedge funds and in individual margin accounts has run its course and the worst part of this correction may be already behind us.
Even though this recent stock price “stability” is a welcome development, it provides little consolation to investors in the Oil & Gas sector who still see their positions trading far below the peak levels achieved last summer. The correction scorecard graph below summarizes average “peak-to-current” performance by individual stocks that are grouped together by sector and size. Individual stock performance is provided in full detail in the spreadsheets at the end of this note.
Mid- and small-capitalization stocks, in both Upstream and Oil Service segments, remain the worst performing groups, now trading at an average discount to each individual stock’s recent peak price of over 40%, a staggering decline. Large-capitalization E&P independents and large-capitalization oil service stocks are trading at a 20%-24% average discount.

Emerging Markets Oil Majors Post A Strong Decline:
Emerging markets Oil Majors were one of the worst performing categories during the past two weeks:
Petrobras (NYSE:PBR) continued to slide down, moving 12% down since my previous update. Petrobras stands out as one of the most disappointing Oil Majors in terms of stock performance in the past five years, having lost a staggering three-quarters of its value during that period. The company’s market capitalization currently stands at only $62 billion.
· Lukoil (OTCPK:LUKOY) and Petrochina (NYSE:PTR) are other examples of strong declines in the past two weeks, with the stocks losing 8% and 7%, respectively. Lukoil’s performance may in fact be interpreted as “solid,” given the continued deterioration of Russia’s political and credit risk.
A strong contrast is the performance of the three oil super-majors – Exxon (NYSE:XOM), Chevron (NYSE:CVX) and Shell (NYSE:RDS.A) – that gained ~2% during the past two weeks and remain the best performing group in the Oil & Gas sector. I have argued in my earlier notes that, given the combined $0.9 trillion market capitalization of these three stocks, the resilient performance by the Super-majors has effectively isolated the correction in the Oil & Gas sector from the broader markets. From a fundamental perspective, the Super-majors are characterized by very low financial leverage, high proportion of counter-cyclical production sharing contracts (“PSAs”) and the effective hedge from downstream assets, which limits their exposure to the oil price decline.
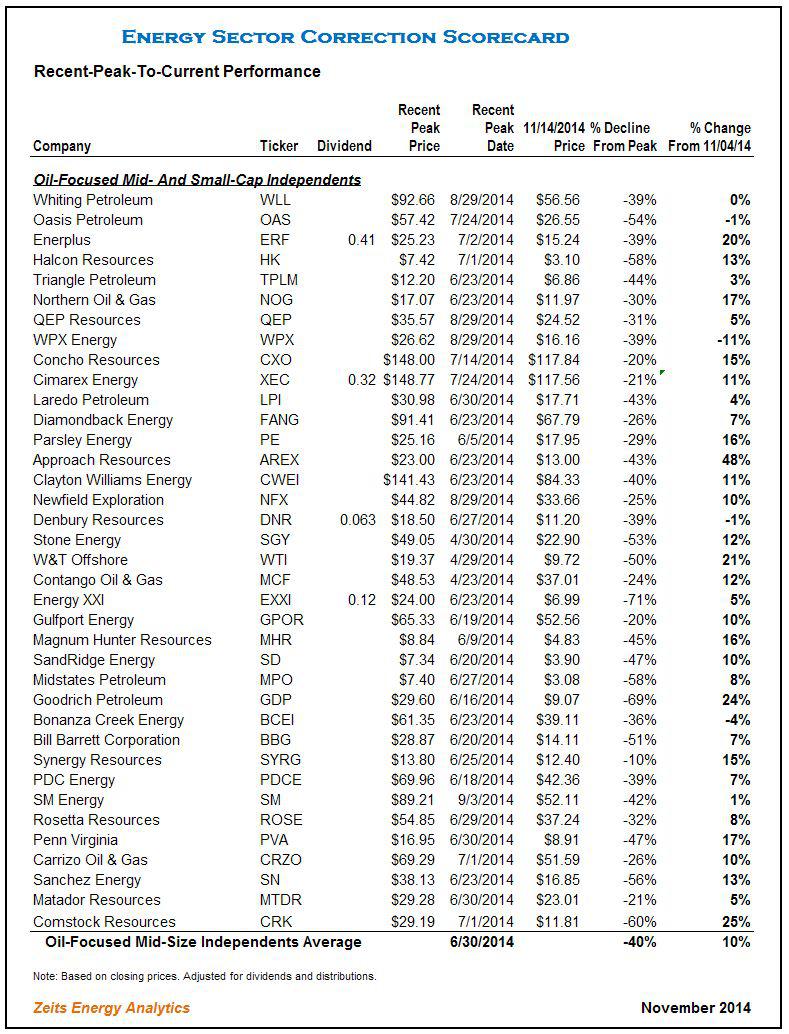
Small-Capitalization E&P Stocks Bounce Back:
After a dramatic underperformance, small- and mid-capitalization E&P stocks posted meaningful gains in the past two weeks. However, in most cases the recovery is “a drop in the bucket,” given that high-percentage moves are measured off price levels that sometimes are a fraction of recent peak prices. The sector remains a menu of bargains for those investors who believe in a recovery in oil prices.
- Enerplus (NYSE:ERF): +20%
- Northern Oil & Gas (NYSEMKT:NOG): +17%
- Concho Resources (NYSE:CXO): +15%
- Approach Resources (NASDAQ:AREX): +48%
- Goodrich Petroleum (NYSE:GDP): +24%
- Synergy Resources (NYSEMKT:SYRG): +15%
- Penn Virginia (NYSE:PVA): +17%
- Comstock Resources (NYSE:CRK): +25%
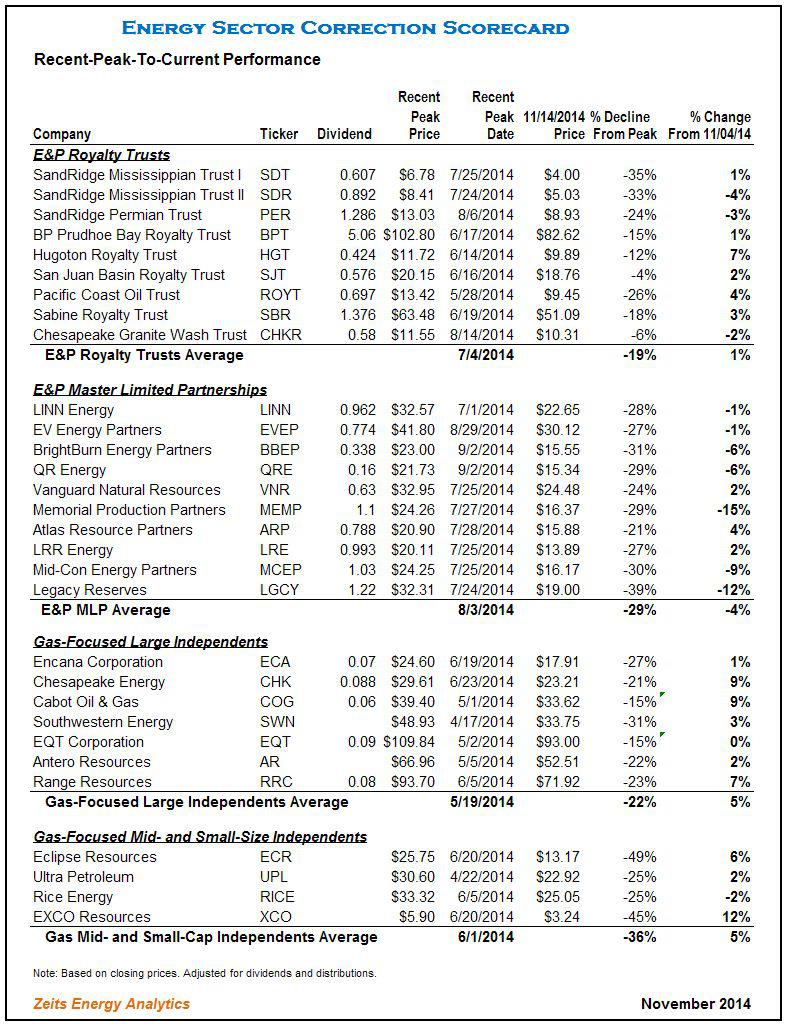
E&P MLPs Retreat:
Upstream MLPs were one of the exceptions in the E&P sector, declining by an average of 4% in the past two weeks. The largest Upstream MLP, Linn Energy (NASDAQ:LINE) and its sister entity LinnCo(NASDAQ:LNCO), are again trading close to their lows, after having enjoyed a strong bounce a month ago. The previously very wide gap in relative performance between Upstream MLPs and other Upstream equities has contracted substantially which, arguably, makes sense given that both categories of companies participate in the same business, irrespective of the corporate envelope.
Oil & Gas Sector Correction Scorecards:
OPEC Forecasts $110 Nominal Price Through End Of This Decade:
OPEC’s World Oil Outlook And Pivot To Asia

Summary
- OPEC published its recent global oil market outlook, which offers a slightly different and instructional viewpoint.
- OPEC sees its share of crude oil/liquids production reducing in light of increases in U.S. and Canada production.
- OPEC also indicates a pivot toward Asia, where it sees the greatest demand for its primary exports in the future.
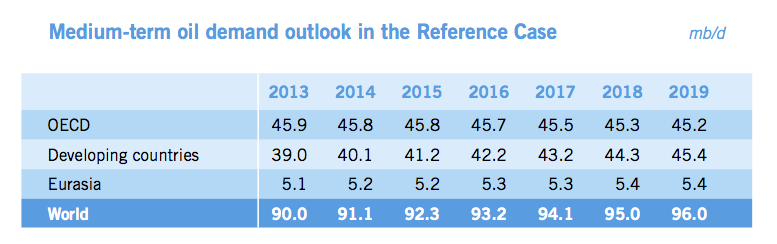
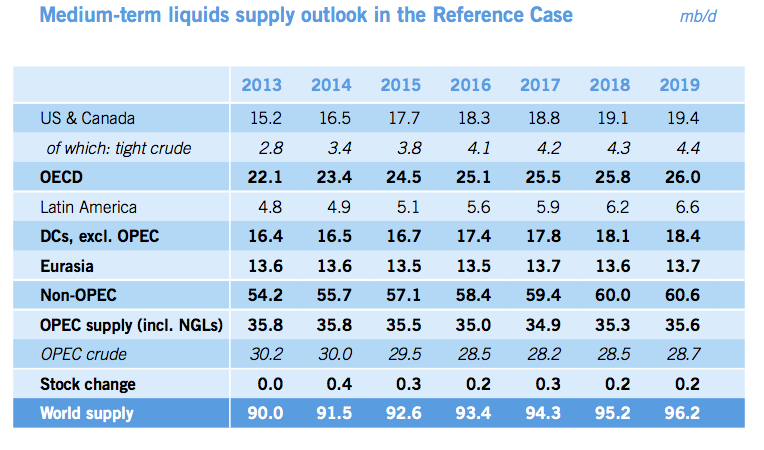
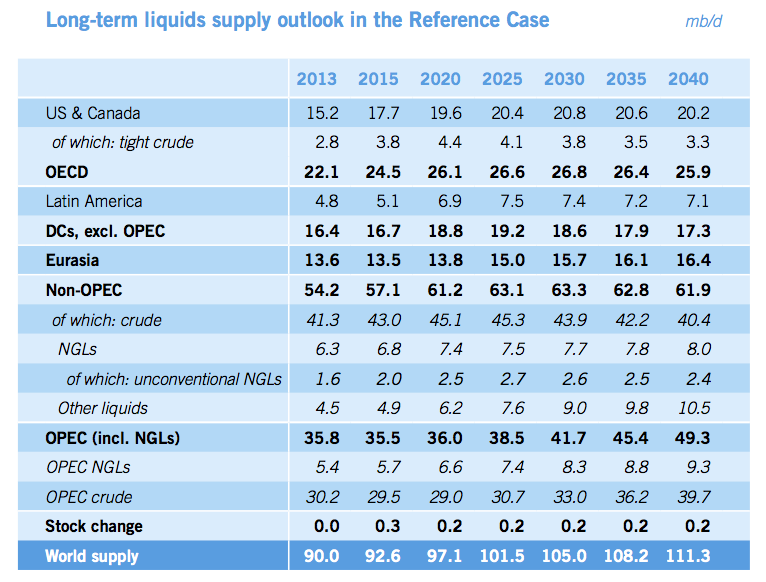
In perusing through OPEC’s recently released “World Oil Outlook,” several viewpoints are noteworthy. According to OPEC, demand grows mainly from developing countries and U.S. supply slows its run up after 2019. After 2019, OPEC begins to pick up the slack, supplying its products more readily. In OPEC’s view, Asia becomes a center of gravity given global population growth, up nearly 2 billion by 2040, and economic prosperity. The world economy grows by 260% versus that of 2013 on a purchasing power parity basis.

During the period 2013-2040, OPEC says oil demand is expected to increase by just over 21 million barrels per day (mb/d), reaching 111.1 mb/d by 2040. Developing countries alone will account for growth of 28 mb/d and demand in the OECD will fall by over 7 mb/d (p.1). On the supply side, “in the long-term, OPEC will supply the majority of the additional required barrels, with the OPEC liquids supply forecast increasing by over 13 mb/d in the Reference Case from 2020-2040,” they offer (p.1). OPEC shaved off 0.5 million barrels from their last year’s forecast to 2035. Asian oil demand accounts for 71% of the growth of oil demand.

Morgan Stanley pulled out the following items:
The oil cartel released its World Oil Outlook last week, showing OPEC crude production falling to 29.5 million barrels per day in 2015 and 28.5 million barrels per day in 2016. This year’s average of 30 million barrels per day has helped flood the market and push oil prices to multi-year lows.
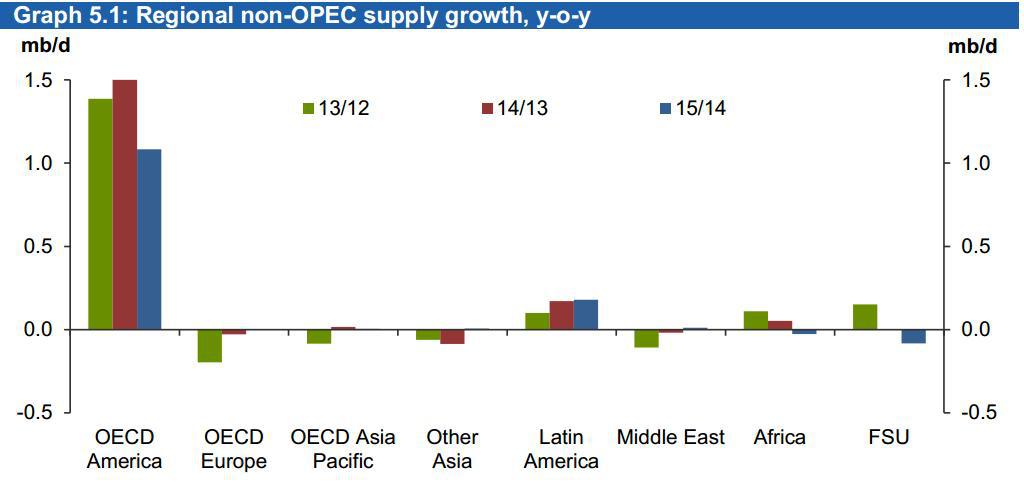
In the period to 2019, this chart illustrates where the barrels will flow:
Prices
With regard to price, OPEC acknowledges that the marginal cost to supply barrels continues to be a factor in expectations in the medium and long term. This sentiment has been echoed by other E&P CEOs in various communiques this year. OPEC forecasts a nominal price of $110 to the end of this decade:
On this evidence, a similar price assumption is made for the OPEC Reference Basket (ORB) price in the Reference Case compared to that presented in the WOO 2013: a constant nominal price of $110/b is assumed for the rest of the decade, corresponding to a small decline in real values.
Real values are assumed to approach $100/b in 2013 prices by 2035, with a slight further increase to $102/b by 2040. Nominal prices reach $124/b by 2025 and $177/b by 2040. These values are not to be taken as targets, according to OPEC. They acknowledge the challenge of predicting the world economy as well as non-OPEC supply. The Energy Information Administration (EIA) forecast a price for Brent averaging over $101 in 2015 and West Texas Intermediate (WTI) of over $94 as of their October 7th forecast. (This will have likely changed as of November 12th after the steep declines of October are weighed into their equations.) WTI averaged around the $97 range for 2013 and 2014. Importantly, U.S. supply may ratchet down slightly (green broken line) in response to price declines, if they continue.

It’s also the cars, globally
In 2013, OPEC says gasoline and diesel engines comprised 97% of the passenger cars total in 2013, and will hold 92% of the road in 2040. The diesel share for autos rises from 14% in 2013 to 21% in 2040. Basically, the number of cars buzzing on roads doubles from now to 2040. And 68% of the increase in cars comes from developing countries. China comprises the lion’s share of car volume growing by more than 470 million between 2011-2040, followed by India, then OPEC members will attribute 110 million new cars on the road. These increases assume levels similar to advanced economy (OECD) car volumes of the 1990s. In spite of efficiency and fuel economy, oil use per vehicle is expected to decline by 2.2%.

Commercial vehicles gain 300 million by 2040 from about 200 million in 2011. There are now more commercial vehicles in developing countries than developed.
U.S. Supply and OPEC
According to OPEC, U.S. and Canada supply increases through the period to 2019, the medium term. After 2017, they believe U.S. supply tempers from 1.2 million barrels of tight oil increases between 2013 and 2014 to 0.4 million in 2015, and less incremental increases thereafter. This acknowledges shale oil’s contribution to supply, with other supply sources declining, i.e., conventional and offshore.
OPEC Suggests:
The amount of OPEC crude required will fall from just over 30 mb/d in 2013 to 28.2 mb/d in 2017, and will start to rise again in 2018. By 2019, OPEC crude supply, at 28.7 mb/d, is still lower than in 2013.
However, the OPEC requirements are expected to ramp back up after 2019. By 2040, they expect to be supplying the world with 39 mb/d, a 9 million barrel/d increase from 2013. OPEC’s global share of crude oil supply is then 36%, above 2013 levels of about 30%. A select few firms like Pioneer Natural Resources (NYSE:PXD), Occidental Petroleum (NYSE:OXY), Chevron (NYSE:CVX) and even small-cap RSP Permian (NYSE:RSPP) are staying the course on shale oil production in the Permian for the present. After the first of the year, they will evaluate the price environment.
How does this outlook by OPEC inform the future? From the appearances in its forecasts, OPEC has slightly lower production in the medium term (to 2019), a decline of 1.3 million b/d in 2019 from the 2014 production of 30 million b/d. Thus, the main lever for an increase in prices for oil markets is for OPEC to restrict production, or encourage other members to keep to the current quota of 30 million b/d. Better economic indicators also could help. However, Saudi Arabia, the swing producer, has shown interest in maintaining its market share vis-à-vis the price cuts it has offered China, first, and then the U.S. more recently.
The global state of crude oil and liquids and prices has fundamentally changed with the addition of tight oil or shale oil, particularly from the U.S. While demand particulars have dominated the price regime recently, the upcoming decisions by OPEC at the late November meeting will have an influence on price expectations. In an environment of softer perceived demand now because of global economics and in the future because of non-OPEC supply, it would seem rational for OPEC to indicate some type of discipline among members’ production.
Source: OPEC “2014 World Oil Outlook,” mainly from the executive summary.
The Next Housing Crisis May Be Sooner Than You Think
How we could fall into another housing crisis before we’ve fully pulled out of the 2008 one.

When it comes to housing, sometimes it seems we never learn. Just when America appeared to be recovering from the last housing crisis—the trigger, in many ways, for 2008’s grand financial meltdown and the beginning of a three-year recession—another one may be looming on the horizon.
There are at several big red flags.
For one, the housing market never truly recovered from the recession. Trulia Chief Economist Jed Kolko points out that, while the third quarter of 2014 saw improvement in a number of housing key barometers, none have returned to normal, pre-recession levels. Existing home sales are now 80 percent of the way back to normal, while home prices are stuck at 75 percent back, remaining undervalued by 3.4 percent. More troubling, new construction is less than halfway (49 percent) back to normal. Kolko also notes that the fundamental building blocks of the economy, including employment levels, income and household formation, have also been slow to improve. “In this recovery, jobs and housing can’t get what they need from each other,” he writes.
Americans are spending more than 33 percent of their income on housing.
Second, Americans continue to overspend on housing. Even as the economy drags itself out of its recession, a spate of reports show that families are having a harder and harder time paying for housing. Part of the problem is that Americans continue to want more space in bigger homes, and not just in the suburbs but in urban areas, as well. Americans more than 33 percent of their income on housing in 2013, up nearly 13 percent from two decades ago, according to newly released data from the Bureau of Labor Statistics (BLS). The graph below plots the trend by age.
Over-spending on housing is far worse in some places than others; the housing market and its recovery remain highly uneven. Another BLS report released last month showed that households in Washington, D.C., spent nearly twice as much on housing ($17,603) as those in Cleveland, Ohio ($9,061). The chart below, from the BLS report, shows average annual expenses on housing related items:

The result, of course, is that more and more American households, especially middle- and working-class people, are having a harder time affording housing. This is particularly the case in reviving urban centers, as more affluent, highly educated and creative-class workers snap up the best spaces, particularly those along convenient transit, pushing the service and working class further out.
Last but certainly not least, the rate of home ownership continues to fall, and dramatically. Home ownership has reached its lowest level in two decades—64.4 percent (as of the third quarter of 2014). Here’s the data, from the U.S. Census Bureau:

Home ownership currently hovers from the mid-50 to low-60 percent range in some of the most highly productive and innovative metros in this country—places like San Francisco, New York, and Los Angeles. This range seems “to provide the flexibility of rental and ownership options required for a fast-paced, rapidly changing knowledge economy. Widespread home ownership is no longer the key to a thriving economy,” I’ve written.
What we are going through is much more than a generational shift or simple lifestyle change. It’s a deep economic shift—I’ve called it the Great Reset. It entails a shift away from the economic system, population patterns and geographic layout of the old suburban growth model, which was deeply connected to old industrial economy, toward a new kind of denser, more urban growth more in line with today’s knowledge economy. We remain in the early stages of this reset. If history is any guide, the complete shift will take a generation or so.
It’s time to impose stricter underwriting standards and encourage the dense, mixed-use, more flexible housing options that the knowledge economy requires.
The upshot, as the Nobel Prize winner Edmund Phelps has written, is that it is time for Americans to get over their house passion. The new knowledge economy requires we spend less on housing and cars, and more on education, human capital and innovation—exactly those inputs that fuel the new economic and social system.
But we’re not moving in that direction; in fact, we appear to be going the other way. This past weekend, Peter J. Wallison pointed out in a New York Times op-ed that federal regulators moved back off tougher mortgage-underwriting standards brought on by 2010’s Dodd-Frank Act and instead relaxed them. Regulators are hoping to encourage more home ownership, but they’re essentially recreating the conditions that led to 2008’s crash.
Wallison notes that this amounts to “underwriting the next housing crisis.” He’s right: It’s time to impose stricter underwriting standards and encourage the dense, mixed-use, more flexible housing options that the knowledge economy requires.
During the depression and after World War II, this country’s leaders pioneered a series of purposeful and ultimately game-changing polices that set in motion the old suburban growth model, helping propel the industrial economy and creating a middle class of workers and owners. Now that our economy has changed again, we need to do the same for the denser urban growth model, creating more flexible housing system that can help bolster today’s economy.

Dream housing for new economy workers?
Energy Workforce Projected To Grow 39% Through 2022
 b
b
The dramatic resurgence of the oil industry over the past few years has been a notable factor in the national economic recovery. Production levels have reached totals not seen since the late 1980s and continue to increase, and rig counts are in the 1,900 range. While prices have dipped recently, it will take more than that to markedly slow the level of activity. Cycles are inevitable, but activity is forecast to remain at relatively high levels.
An outgrowth of oil and gas activity strength is a need for additional workers. At the same time, the industry workforce is aging, and shortages are likely to emerge in key fields ranging from petroleum engineers to experienced drilling crews. I was recently asked to comment on the topic at a gathering of energy workforce professionals. Because the industry is so important to many parts of Texas, it’s an issue with relevance to future prosperity.
Although direct employment in the energy industry is a small percentage of total jobs in the state, the work is often well paying. Moreover, the ripple effects through the economy of this high value-added industry are large, especially in areas which have a substantial concentration of support services.

Employment in oil and gas extraction has expanded rapidly, up from 119,800 in January 2004 to 213,500 in September 2014. Strong demand for key occupations is evidenced by the high salaries; for example, median pay was $130,280 for petroleum engineers in 2012 according to the Bureau of Labor Statistics (BLS).
Due to expansion in the industry alone, the BLS estimates employment growth of 39 percent through 2022 for petroleum engineers, which comprised 11 percent of total employment in oil and gas extraction in 2012. Other key categories (such as geoscientists, wellhead pumpers, and roustabouts) are also expected to see employment gains exceeding 15 percent. In high-activity regions, shortages are emerging in secondary fields such as welders, electricians, and truck drivers.
The fact that the industry workforce is aging is widely recognized. The cyclical nature of the energy industry contributes to uneven entry into fields such as petroleum engineering and others which support oil and gas activity. For example, the current surge has pushed up wages, and enrollment in related fields has increased sharply. Past downturns, however, led to relatively low enrollments, and therefore relatively lower numbers of workers in some age cohorts. The loss of the large baby boom generation of experienced workers to retirement will affect all industries. This problem is compounded in the energy sector because of the long stagnation of the industry in the 1980s and 1990s resulting in a generation of workers with little incentive to enter the industry. As a result, the projected need for workers due to replacement is particularly high for key fields.
The BLS estimates that 9,800 petroleum engineers (25.5 percent of the total) working in 2012 will need to be replaced by 2022 because they retire or permanently leave the field. Replacement rates are also projected to be high for other crucial occupations including petroleum pump system operators, refinery operators, and gaugers (37.1 percent); derrick, rotary drill, and service unit operators, oil, gas, and mining (40.4 percent).

Putting together the needs from industry expansion and replacement, most critical occupations will require new workers equal to 40 percent or more of the current employment levels. The total need for petroleum engineers is estimated to equal approximately 64.5 percent of the current workforce. Clearly, it will be a major challenge to deal with this rapid turnover.
Potential solutions which have been attempted or discussed present problems, and it will require cooperative efforts between the industry and higher education and training institutions to adequately deal with future workforce shortages. Universities have had problems filling open teaching positions, because private-sector jobs are more lucrative for qualified candidates. Given budget constraints and other considerations, it is not feasible for universities to compete on the basis of salary. Without additional teaching and research staff, it will be difficult to continue to expand enrollment while maintaining education quality. At the same time, high-paying jobs are enticing students into the workforce, and fewer are entering doctoral programs.
Another option which has been suggested is for engineers who are experienced in the workplace to spend some of their time teaching. However, busy companies are naturally resistant to allowing employees to take time away from their regular duties. Innovative training and associate degree and certification programs blending classroom and hands-on experience show promise for helping deal with current and potential shortages in support occupations. Such programs can prepare students for well-paying technical jobs in the industry. Encouraging experienced professionals to work past retirement, using flexible hours and locations to appeal to Millennials, and other innovative approaches must be part of the mix, as well as encouraging the entry of females into the field (only 20 percent of the current workforce is female, but over 40 percent of the new entries).
Industry observers have long been aware of the coming “changing of the guard” in the oil and gas business. We are now approaching the crucial time period for ensuring the availability of the workers needed to fill future jobs. Cooperative efforts between the industry and higher education/training institutions will likely be required, and it’s time to act.

Don’t Count On A Major Slowdown In U.S. Oil Production Growth

Summary
- The presumption that North American shale oil production is the “swing” component of global supply may be incorrect.
- Supply cutbacks from other sources may come first.
- Growth momentum in North American unconventional oil production will likely carry on into 2015, with little impact from lower oil prices on the next two quarters’ volumes.
- The current oil price does not represent a structural “economic floor” for North American unconventional oil production.
The recent pull back in crude oil prices is often portrayed as being a consequence of the rapid growth of North American shale oil production.
The thesis is often further extrapolated to suggest that a major slowdown in North American unconventional oil production growth, induced by the oil price decline, will be the corrective mechanism that will bring oil supply and demand back in equilibrium (given that OPEC’s cost to produce is low).
Both views would be, in my opinion, overly simplistic interpretations of the global supply/demand dynamics and are not supported by historical statistical data.
Oil Price – The Economic Signal Is Both Loud and Clear
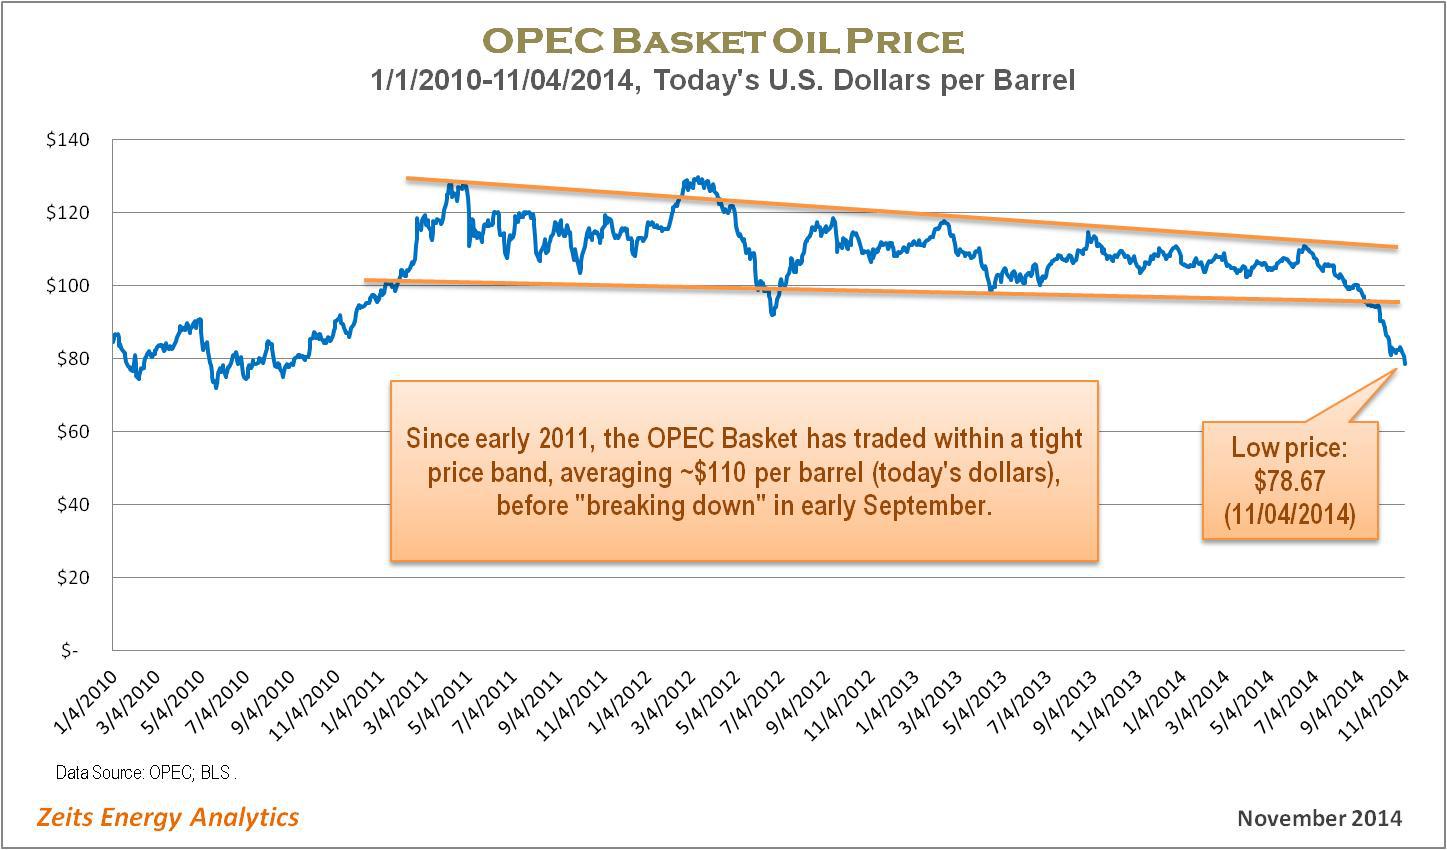
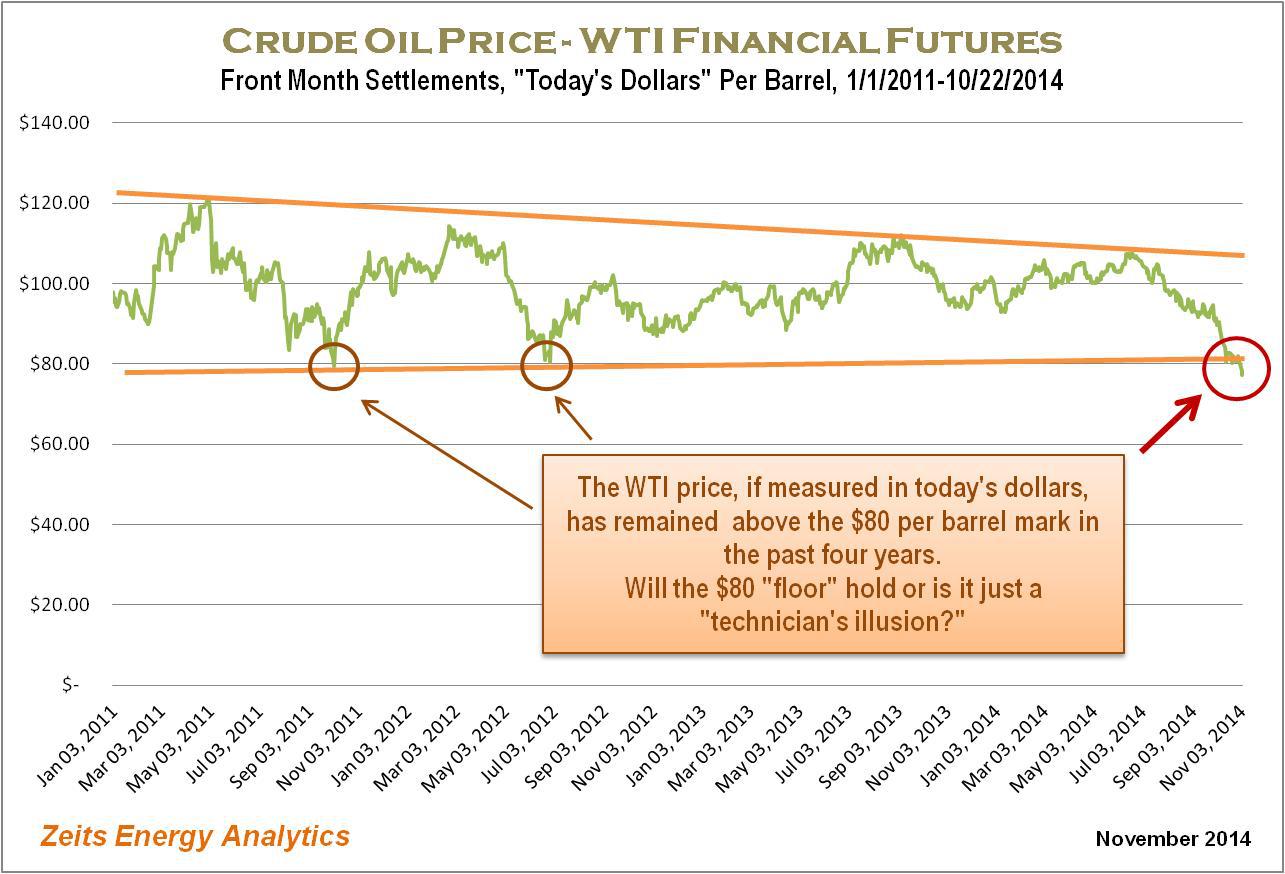
The current oil price correction is, arguably, the most pronounced since the global financial crisis of 2008-2009. The following chart illustrates very vividly that the price of the OPEC Basket (which represents waterborne grades of oil) has moved far outside the “stability band” that seems to have worked well for both consumers and producers over the past four years. (It is important, in my opinion, to measure historical prices in “today’s dollars.”)
 (Source: Zeits Energy Analytics, November 2014)
Given the sheer magnitude of the recent oil price move, the economic signal to the world’s largest oil suppliers is, arguably, quite powerful already. A case can be made that it goes beyond what could be interpreted as “ordinary volatility,” giving the hope that the current price level may be sufficient to induce some supply response from the largest producers – in the event a supply cut back is indeed needed to eliminate a transitory supply/demand imbalance.
Are The U.S. Oil Shales The Culprit?
It is debatable, in my opinion, if the continued growth of the U.S. onshore oil production can be identified as the primary cause of the current correction in the oil price. Most likely, North American shale oil is just one of several powerful factors, on both supply and demand sides, that came together to cause the price decline.
The history of oil production increases from North America in the past three years shows that the OPEC Basket price remained within the fairly tight band, as highlighted on the graph above, during 2012-2013, the period when such increases were the largest. Global oil prices “broke down” in September of 2014, when North American oil production was growing at a lower rate than in 2012-2013.
 (Source: OPEC, October 2014)
If the supply growth from North America was indeed the primary “disruptive” factor causing the imbalance, one would expect the impact on oil prices to become visible at the time when incremental volumes from North America were the highest, i.e., in 2012-2013.
Should One Expect A Strong Slowdown in North American Oil Production Growth?
There is no question that the sharp pullback in the price of oil will impact operating margins and cash flows of North American shale oil producers. However, a major slowdown in North American unconventional oil production growth is a lot less obvious.
First, the oil price correction being seen by North American shale oil producers is less pronounced than the oil price correction experienced by OPEC exporters. It is sufficient to look at the WTI historical price graph below (which is also presented in “today’s dollars”) to realize that the current WTI price decline is not dissimilar to those seen in 2012 and 2013 and therefore represents a signal of lesser magnitude than the one sent to international exporters (the OPEC Basket price).
 (Source: Zeits Energy Analytics, November 2014)
Furthermore, among all the sources of global oil supply, North American oil shales are the least established category. Their cost structure is evolving rapidly. Given the strong productivity gains in North American shale oil plays, what was a below-breakeven price just two-three years ago, may have become a price stimulating growth going into 2015.
Therefore, the signal sent by the recent oil price decline may not be punitive enough for North American shale oil producers and may not be able to starve the industry of external capital.
Most importantly, review of historical operating statistics provides an indication that the previous similar WTI price corrections – seen in 2012 and 2013 – did not result in meaningful slowdowns in the North American shale oil production.
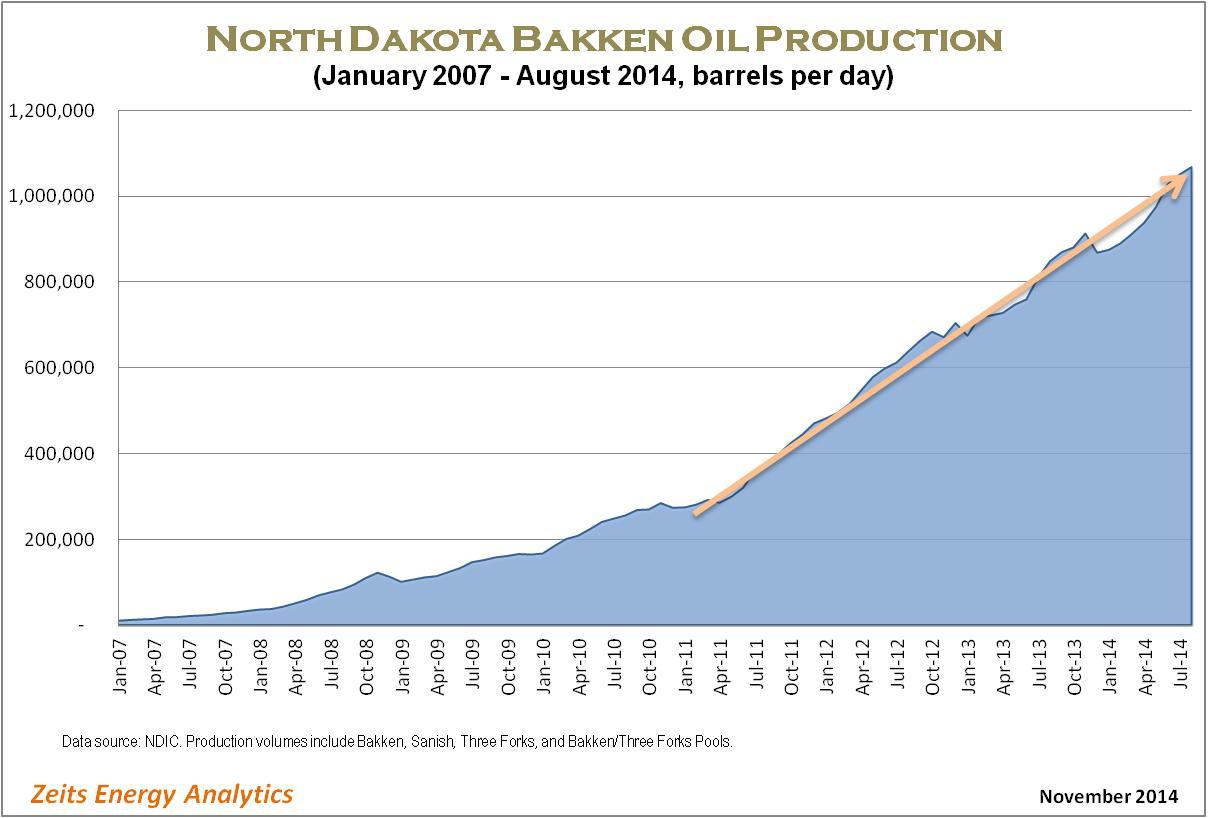
The following graph shows the trajectory of oil production in the Bakken play. From this graph, it is difficult to discern any significant impact from the 2012 and 2013 WTI price corrections on the play’s aggregate production volumes. While a positive correlation between these two price corrections and the pace of production growth in the Bakken exists, there are other factors – such as takeaway capacity availability and local differentials – that appear to have played a greater role. I should also note that the impact of the lower oil prices on production volumes was not visible in the production growth rate for more than half a year after the onset of the correction.
 (Source: Zeits Energy Analytics, November 2014)
Leading U.S. Independents Will Likely Continue to Grow Production At A Rapid Pace
Production growth track record by several leading shale oil players suggests that U.S. shale oil production will likely remain strong even in the $80 per barrel WTI price environment. Several examples provide an illustration.
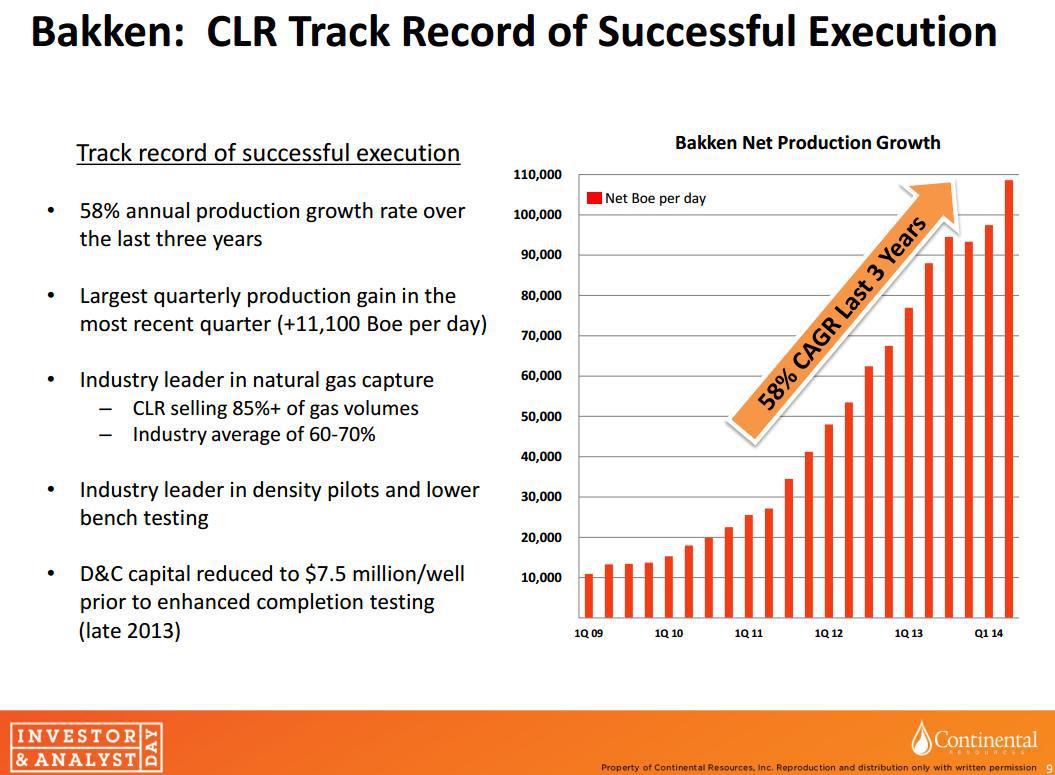
Continental Resources (NYSE:CLR) grew its Bakken production volumes at a 58% CAGR over the past three years (slide below). By looking at the company’s historical production, it would be difficult to identify any impact from the 2012 and 2013 oil price corrections on the company’s production growth rate. Continental just announced a reduction to its capital budget in 2015 in response to lower oil prices, to $4.6 billion from $5.2 billion planned initially. The company still expects to grow its total production in 2015 by 23%-29% year-on-year.
 (Source: Continental Resources, October 2014)
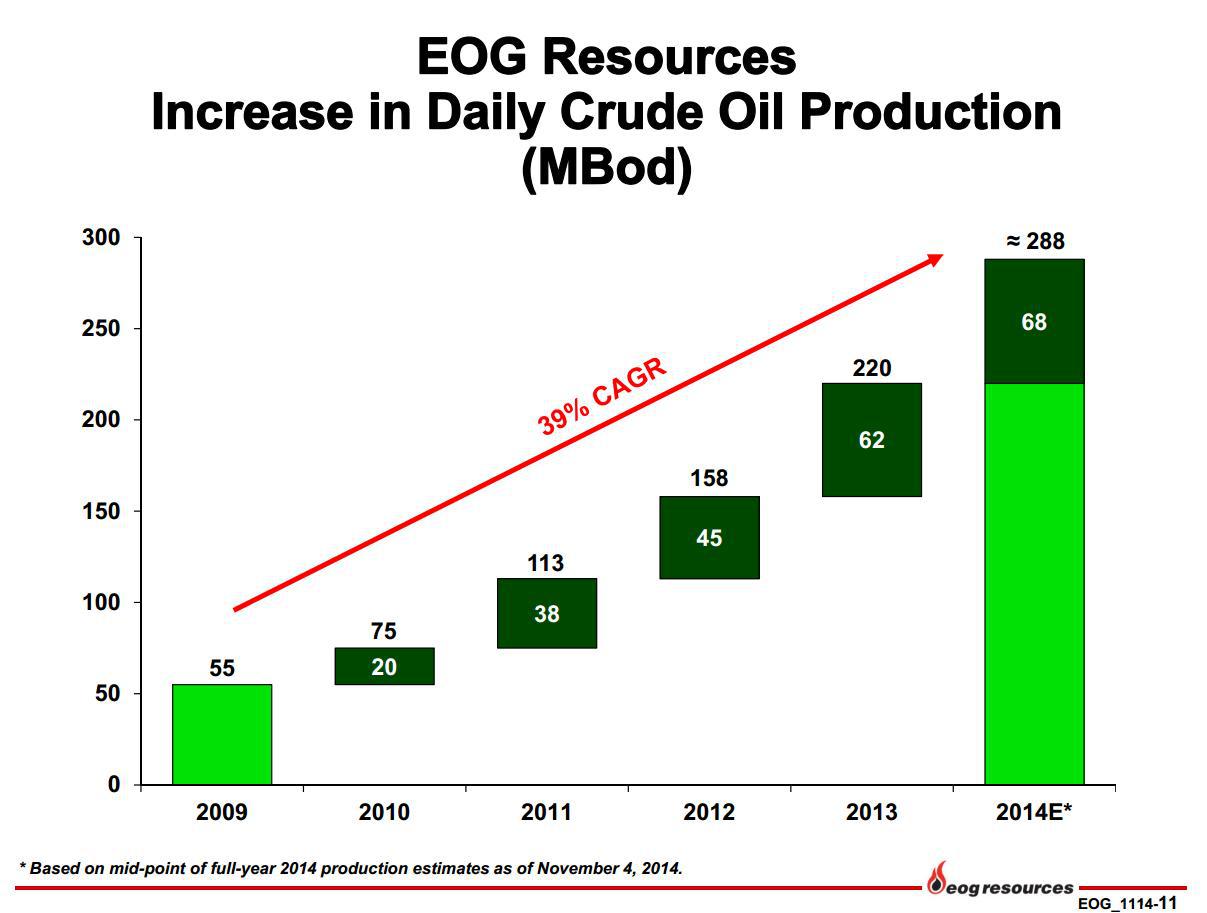
EOG Resources (NYSE:EOG) expects that its largest core plays (Eagle Ford, Bakken and Delaware Basin) will generate after-tax rates of return in excess of 100% in 2015 at $80 per barrel wellhead price. EOG went further to suggest that these plays may remain economically viable (10% well-level returns) at oil prices as low as $40 per barrel. The company expects to continue to grow its oil production at a double-digit rate in 2015 while spending within its cash flow. EOG achieved ~40% oil production growth in 2012-2013 and expects 31% growth for 2014. While a slowdown is visible, it is important to take into consideration that EOG’s oil production base has increased dramatically in the past three years and requires significant capital just to be maintained flat. Again, one would not notice much impact from prior years’ oil price corrections on EOG’s production growth trajectory.
 (Source: EOG Resources, November 2014)
Anadarko Petroleum’s (NYSE:APC) U.S. onshore oil production growth story is similar. Anadarko increased its U.S. crude oil and NLS production from 100,000 barrels per day in 2010 to close to almost 300,000 barrels per day expected in Q4 2014. Anadarko has not yet provided growth guidance for 2015, but indicated that the company’s exploration and development strategies remain intact. While recognizing a very steep decline in the oil price, Anadarko stated that it wants “to watch this environment a little longer” before reaching conclusions with regard to the impact on its future spending plans.
 (Source: Anadarko Petroleum, October 2014)
Devon Energy (NYSE:DVN) posted company-wide oil production of 216,000 barrels per day in Q3 2014. While Devon will provide detailed production and capital guidance at a later date, the company has indicated that it sees 20% to 25% oil production growth and mid‐single digit top‐line growth “on a retained‐property basis” (pro forma for divestitures) in 2015.
The list can continue on.
In Conclusion…
Based on preliminary 2015 growth indications from large shale oil operators, North American oil production growth in 2015 will likely remain strong, barring further strong decline in the price of oil.
No slowdown effect from lower oil prices will be seen for at least six months from the time operators received the “price signal” (August-September 2014).
Given the effects of the technical learning curve in oil shales and continuously improving drilling economics, the current ~$77 per barrel WTI price is unlikely to be sufficient to eliminate North American unconventional production growth.
North American shale oil production remains a very small and highly fragmented component of the global oil supply.
The global oil “central bank” (Saudi Arabia and its close allies in OPEC) remain best positioned to quickly re-instate stability of oil price in the event further significant decline occurred.
