
This couple left California due to the cost of living, crime, taxes, etc. etc. etc. But now they’re not so sure they can get used to living in Texas!
Tag Archives: Texas
Texas Ends All Medical Martial Law Restrictions On Freedom
Shortly after Gov. Abbott’s decision to follow the science and allow the people of his state to be ‘free’ to judge their own risks once again, none other than California Gov. Newsom – desperate to virtue-signal as he fights for political survival amid an imminent recall vote – had a two word response: “Absolutely reckless”

We have two words for Mr. Newsom… can you guess?
West Texas Bust – “We Never Expected The Good Times To End”
The residents of West Texas are accustomed to a life dependent on hydrocarbons. As Bloomberg reports, the small communities built into the flat West Texas desert are dotted with oil pumps and rigs, and the chemical smell of an oil field hangs in the air.

Here the economy rises and falls on drilling.

When the drilling is good, everyone in the town benefits. When it’s bad, most of West Texas feels the pinch.

Oil prices have plunged as much as 75 percent since June 2014. That drop has dismal consequences for residents, and not just the ones working in oil fields. Bloomberg spoke with some of the people trying to endure the historic dip in oil prices. This video tells some of their stories….
In sharp contrast, click the following to enjoy this bitter sweet October, 2013 oil boom report by (CNN Money) titled ‘Moving in droves’ to Midland, Texas
Oil Theft Soars as Downturn Casts U.S. Roughnecks Out of Work

The moon was a waning crescent sliver Sept. 9 when a man emerged from an oil tanker, sidled up to a well outside Cotulla, Texas, and siphoned off almost 200 barrels. Then, he drove two hours to a town where he sold his load on the black market for $10 a barrel, about a quarter of what West Texas Intermediate currently fetches.
“This is like a drug organization,” said Mike Peters, global security manager of San Antonio-based Lewis Energy Group, who recounted the heist at a Texas legislative hearing. “You’ve got your mules that go out to steal the oil in trucks, you’ve got the next level of organization that’s actually taking the oil in, and you’ve got a gathering site — it’s always a criminal organization that’s involved with this.”
From raw crude sucked from wells to expensive machinery that disappears out the back door, drillers from Texas to Colorado are struggling to stop theft that has only worsened amid the industry’s biggest slowdown in a generation. Losses reached almost $1 billion in 2013 and likely have grown since, according to estimates from the Energy Security Council, an industry trade group in Houston. The situation has been fostered by idled trucks, abandoned drilling sites and tens of thousands of lost jobs.
“You’ve got unemployed oilfield workers that unfortunately are resorting to stealing,” said John Chamberlain, executive director of the Energy Security Council.
In Texas, unemployment insurance claims from energy workers more than doubled over the past year to about 110,000, according to the Workforce Commission. In North Dakota, average weekly wages in the Bakken oil patch decreased nearly 10 percent in the first quarter of 2015, compared with the previous quarter, according to the Federal Reserve Bank of Minneapolis.
With dismissals hitting every corner of the industry, security guards hired during boom times are receiving pink slips. That’s leaving sites unprotected.
“There are a lot less eyes out there for security,” said John Esquivel, an analyst at security consulting firm Butchko Inc. in Tomball, Texas, and a former chief executive of the U.S. Border Patrol in Laredo. “The drilling activity may be quieter, but I don’t think criminal activity is.”
Special Charges
States are trying to get a handle on the theft, which can include anything from drill bits that can fetch thousands on the resale market, to copper wiring that can be melted down, to the crude itself. Texas lawmakers met earlier this month in Austin to craft a bill that would increase penalties related to the crime. A similar measure passed both houses of the legislature this year, but Republican Governor Greg Abbott vetoed it, saying it was “overly broad.” Lawmakers, at the urging of industry, are hoping to revive it next legislative session.
In Oklahoma, law-enforcement officers recently teamed with the Federal Bureau of Investigation to intensify their effort. In North Dakota, the FBI earlier this year opened an office in the heart of oil country to combat crimes including theft, drug trafficking and prostitution.
The lull in drilling has given oil companies more time to scrutinize their operations — and their losses.
During booms “they are moving at such a rapid pace there’s not a lot of auditing and inventorying going on,” said Gary Painter, sheriff in Midland County, Texas, in the oil-rich Permian Basin. “Whenever it slows down, they start looking for stuff and find out it never got delivered or it got delivered and it’s gone.”

Oil theft is as old as Spindletop, the East Texas oilfield that spewed black gold in 1901 and began the modern oil era. In the early 1900s, Texas Rangers were often deployed to carry out “town taming” in oil fields rife with roughnecks, prostitutes, gamblers and thieves. In 1932, 18 men were indicted for their role in a Mexia ring that included prominent politicians and executives and resulted in the theft of 1 million barrels.
The allure of ill-gotten oil money remains strong.
In April, the Weld County Sheriff’s office in Colorado recovered almost $300,000 worth of stolen drill bits. In January, a Texas man pleaded guilty to stealing three truckloads of oil worth nearly $60,000 after an investigation by the FBI and local law-enforcement officers. Robert Butler, a sergeant at the Texas Attorney General’s Office whose primary job is to investigate oil theft, said in the legislative hearing that he is investigating a case of 470,000 barrels stolen and sold over the past three years worth about $40 million.
In Texas, oilfield theft has become entangled with Mexican drug trafficking, as the state’s newest and biggest production area, the Eagle Ford Shale region, lies along traditional smuggling routes. That’s thrust oil workers in the middle of cartel activity, and made it even more difficult to track stolen goods across the U.S.-Mexico border, said Esquivel, the retired Border Patrol agent.
Trickling Away
Oil thieves are a slippery bunch. Criminals sand off serial numbers of stolen goods to evade detection or melt them for scrap. Tracking raw crude is even trickier, since tracing it to its originating well is almost impossible once it’s mixed with other oil. Many companies fail to report the crime, making it difficult for investigators to trace the origins of stolen goods.
Many of the crimes are inside jobs, with thieves doubling as gate guards, tank drivers or well servicers. Last year, a federal grand jury indicted three Texas men in connection with the theft of $1.5 million worth of oil from their employers, including Houston’s Anadarko Petroleum Corp.
“Your average person wouldn’t know the value of a drill bit or a piece of tubing or a gas meter,” said Chamberlain. “It’d be like breaking into a jewelry store; unless you know what’s valuable, you wouldn’t know what to steal.”
by Lauren Etter in Bloomberg Business
US Home Sales Surge In June To Fastest Pace In 8-Plus Years

WASHINGTON (AP) — Americans bought homes in June at the fastest rate in over eight years, pushing prices to record highs as buyer demand has eclipsed the availability of houses on the market.
The National Association of Realtors said Wednesday that sales of existing homes climbed 3.2 percent last month to a seasonally adjusted annual rate of 5.49 million, the highest rate since February 2007. Sales have jumped 9.6 percent over the past 12 months, while the number of listings has risen just 0.4 percent.
Median home prices climbed 6.5 percent over the past 12 months to $236,400, the highest level reported by the Realtors not adjusted for inflation.
Home-buying has recently surged as more buyers are flooding into the real estate market. Robust hiring over the past 21 months and an economic recovery now in its sixth year have enabled more Americans to set aside money for a down payment. But the rising demand has failed to draw more sellers into the market, causing tight inventories and escalating prices that could cap sales growth.
“The recent pace can’t be sustained, but it points clearly to upside potential,” said Ian Shepherdson, chief economist at Pantheon Macroeconomics.
A mere five months’ supply of homes was on the market in June, compared to 5.5 months a year ago and an average of six months in a healthy market.
Some markets are barely adding any listings. The condominium market in Massachusetts contains just 1.8 months’ supply, according to a Federal Reserve report this month. The majority of real estate agents in the Atlanta Fed region – which ranges from Alabama to Florida- said that inventories were flat or falling over the past year.
Some of the recent sales burst appears to come from the prospect of low mortgage rates beginning to rise as the Federal Reserve considers raising a key interest rate from its near-zero level later this year. That possibility is prompting buyers to finalize sales before higher rates make borrowing costs prohibitively expensive, noted Daren Blomquist, a vice president at RealtyTrac, a housing analytics firm.
The premiums that the Federal Housing Administration charges to insure mortgages are also lower this year, further fueling buying activity, Blomquist said.
It’s also possible that home buyers are checking the market for listings more aggressively, making it possible for them to act fast with offers despite the lack of new inventory.
“Buyers can more quickly be alerted of new listings and also more conveniently access real estate data to help them pre-search a potential purchase before they even step foot in the property,” Blomquist said. “That may mean we don’t need such a large supply of inventory to feed growing sales.”
Properties typically sold last month in 34 days, the shortest time since the Realtors began tracking the figure in May 2011. There were fewer all-cash, individual investor and distressed home sales in the market, as more traditional buyers have returned.
Sales improved in all four geographical regions: Northeast, Midwest, South and West.

Still, the limited supplies could eventually prove to be a drag on sales growth in the coming months.
Ever rising home values are stretching the budgets of first-time buyers and owners looking to upgrade. As homes become less affordable, the current demand will likely taper off.
Home prices have increased nearly four times faster than wages, as average hourly earnings have risen just 2 percent over the past 12 months to $24.95 an hour, according to the Labor Department.
Some buyers are also bristling at the few available options on the market. Tony Smith, a Charlotte, North Carolina real estate broker, said some renters shopping for homes are now choosing instead to re-sign their leases and wait until a better selection of properties comes onto the market.
New construction has yet to satisfy rising demand, as builders are increasingly focused on the growing rental market.
Approved building permits rose increased 7.4 percent to an annual rate of 1.34 million in June, the highest level since July 2007, the Commerce Department said last week. Almost all of the gains came for apartment complexes, while permits for houses last month rose only 0.9 percent.
The share of Americans owning homes has fallen this year to a seasonally adjusted 63.8 percent, the lowest level since 1989.
Real estate had until recently lagged much of the six-year rebound from the recession, hobbled by the wave of foreclosures that came after the burst housing bubble.
But the job market found new traction in early 2014. Employers added 3.1 million jobs last year and are on pace to add 2.5 million jobs this year. As millions more Americans have found work, their new paychecks are increasingly going to housing, both in terms of renting and owning.
Low mortgage rates have also helped, although rates are now starting to climb to levels that could slow buying activity.
Average 30-year fixed rates were 4.09 percent last week, according to the mortgage giant Freddie Mac. The average has risen from a 52-week low of 3.59 percent.
NAR Releases Mid-2015 U.S. Economic and Housing Forecast

According to the National Association of Realtors (NAR), the U.S. housing market will continue its gradual pace of recovery as more home buyers enter a tight housing market for the balance of 2015, being nudged by rising mortgage rates and improving consumer confidence.
NAR’s chef economist Lawrence Yun has released the following observations for the US economy at large, and for the U.S. housing market specifically:
The U.S. Economy
- GDP growth was slightly negative in the first quarter but will pick up in the second half. For the year as whole, GDP will expand at 2.1 percent. Not bad but not great. A slow hum.
- Consumer spending will open up because of lower gasoline prices. Personal consumption expenditure grew at 2.1 percent rate in the first quarter. Look for 3 percent growth rate in the second half.
- Auto sales dropped a bit in the first quarter because of heavy snow, but will ramp up nicely in the second half.
- Spending for household furnishing and equipment has been solid, growing 6 percent in the first quarter after clocking 6 percent in the prior. Recovering housing sector is the big reason for the nice numbers.
- Spending at restaurants was flat. That is why retail vacancy rates are not notching down.
- Online shopping is up solidly. That is why industrial and warehouse vacancy rates are coming down.
- Spending for health care grew at 5 percent in the first quarter, marking two consecutive quarters of fast growth. The Affordable Care Act has expanded health care demand. The important question for the future is will the supply of new doctors and nurses expand to meet this rising demand or will it lead to medical care shortage?
- Business spending was flat in the first quarter but will surely rise because of large cash holdings and high profits.
- Spending for business equipment rose by 3 percent in the first quarter. Positive and good, but nothing to shout about.
- Spending for business structures (building of office and retail shops, for example) fell by 18 percent. The freezing first-quarter weather halted some construction. This just means pent-up construction activity in the second half.
- In the past small business start-ups spent and invested. It was not uncommon to experience double-digit growth rates for 3 years running for business equipment. Not happening now. But business spending will inevitably grow because of much improved business financial conditions of lower debt and more profits and rising GDP.
- What has been missing is the “animal spirit” of entrepreneurship. The number of small business start-ups remains surprisingly low at this phase of economic expansion.
- Residential construction spending increased 6 percent in the first quarter. Housing starts are rising and therefore this component will pick up even at a faster pace in the second half.
- Government spending fell by 1 percent. At the federal level, non-defense spending grew by 2 percent, while national defense spending fell by 1 percent. At the state and local level, spending fell by 1 percent.
- The federal government is still running a deficit. Even though it is spending more than what it takes in from tax revenue, the overall deficit level has been falling to a sustainable level. It would be ideal to run a surplus, but a falling deficit nonetheless does provide the possibility of less severe sequestration.
- U.S. government finances are ugly. Interestingly though, they are less ugly than other countries. That is why the U.S. dollar has been strengthening against most other major currencies. It’s like finding the least dirty shirt from a laundry basket.
- Imports have been rising while exports have been falling. The strong dollar makes it so. Imports grew by 7 percent while exports fell by 6 percent. The net exports (at minus $548 billion) were the worst in seven years. Fortunately, with the West Coast longshoremen back at work, the foreign trade situation will not worsen, which means it will help GDP growth.
- All in all, GDP will growth by 2.5 to 3 percent in the second half. That translates into jobs. A total of 2.5 million net new jobs are likely to be created this year.
- Unemployment insurance filings have been rising in oil-producing states of Texas and North Dakota.
- Unemployment insurance filings for the country as a whole have been falling, which implies lower level of fresh layoffs and factory closings. That assures continuing solid job growth in the second half of the year.
- We have to acknowledge that not all is fine with the labor market. The part-time jobs remain elevated and wage growth remains sluggish with only 2 percent annual growth. There are signs of tightening labor supply and the bidding up of wages. Wages are to rise by 3 percent by early next year. The total income of the country and the total number of jobs are on the rise.
The U.S. Housing Market Mid-2015 Trends
- Existing home sales in May hit the highest mark since 2009, when there had been a homebuyer tax credit … remember, buy a home and get $8,000 from Uncle Sam. This tax credit is no longer available but the improving economy is providing the necessary incentive and financial capacity to buy. Meanwhile new home sales hit a seven-year high and housing permits to build new homes hit an eight-year high. Pending contracts to buy existing homes hit a nine-year high.
- Buyers are coming back in force. One factor for the recent surge could have been due to the rising mortgage rates. As nearly always happens, the initial phase of rising rates nudges people to make decision now rather than wait later when the rates could be higher still.
- The first-time buyers are scooping up properties with 32 percent of all buyers being as such compared to only 27 percent one year ago. A lower fee on FHA mortgages is helping.
- Investors are slowly stepping out. The high home prices are making the rate of return numbers less attractive.
- Buyers are back. What about sellers? Inventory remains low by historical standards in most markets. In places like Denver and Seattle, where a very strong job growth is the norm, the inventory condition is just unreal – less than one month supply.
- The principal reason for the inventory shortage is the cumulative impact of homebuilders not being in the market for well over five years. Homebuilders typically put up 1.5 million new homes annually. Here’s what they did from 2009 to 2014:
- 550,000
- 590,000
- 610,000
- 780,000
- 930,000
- 1.0 million
- Where is 1.5 million? Maybe by 2017.
- Building activity for apartments has largely come back to normal. The cumulative shortage is on the ownership side.
- Builders will construct more homes. By 1.1 million in 2015 and 1.4 million in 2016. New home sales will follow this trend. This rising trend will steadily relieve housing shortage.
- There is no massive shadow inventory that can disrupt the market. The number of distressed home sales has been steadily falling – now accounting for only 10 percent of all transactions. It will fall further in the upcoming months. There is simply far fewer mortgages in the serious delinquent stage (of not being current for 3 or more months). In fact, if one specializes in foreclosure or short sales, it is time to change the business model.
- In the meantime, there is still a housing shortage. The consequence is a stronger than normal home price growth. Home price gains are beating wage-income growths by at least three or four times in most markets. Few things in the world could be more frustrating and demoralizing than for renters to start a savings program but only to witness home prices and down payment requirements blowing past them by.
- Housing affordability is falling. Home prices rising too fast is one reason. The other reason is due to rising mortgage rates. Cash-buys have been coming down so rates will count for more in the future.
- The Federal Reserve will be raising short-term rates soon. September is a maybe, but it’s more likely to be in October. The Fed will also signal the continual raising of rates over the next two years. This sentiment has already pushed up mortgage rates. They are bound to rise further, particularly if inflation surprises on the upside.
- Inflation is likely to surprise on the upside. The influence of low gasoline prices in bringing down the overall consumer price inflation to essentially zero in recent months will be short-lasting. By November, the influence of low gasoline prices will no longer be there because it was in November of last year when the oil prices began their plunge. That is, by November, the year-over-year change in gasoline price will be neutral (and no longer big negative). Other items will then make their mark on inflation. Watch the rents. It’s already rising at near 8-year high with a 3.5 percent growth rate. The overall CPI inflation could cross the red line of above 3 percent by early next year. The bond market will not like it and the yields on all long-term borrowing will rise.
- Mortgage rates at 4.3% to 4.5% by the year end and easily surpassing 5% by the year end of 2016.
- The rising mortgage rates initially rush buyers to decide but a sustained rise will choke off as to who can qualify for a mortgage. Fortunately, there are few compensating factors to rising rates.
- Credit scores are not properly aligned with expected default rate. New scoring methodology is being tested and will be implemented. In short, credit scores will get boosted for many individuals after the new change.
- FHA mortgage premium has come down a notch thereby saving money for consumers. By the end of the year, FHA program will show healthier finances. That means, there could be additional reduction to premiums in 2016. Not certain, but plausible.
- Fannie and Freddie are owned by the taxpayers. And they are raking-in huge profits as mortgages have not been defaulting over the past several years. The very high profit is partly reflecting too-tight credit with no risk taking. There is a possibility to back a greater number of lower down payment mortgages to credit worthy borrowers without taking on much risk. In short, mortgage approvals should modestly improve next year.
- Portfolio lending and private mortgage-backed securities are slowly reviving. Why not? Mortgages are not defaulting and there is fat cash reserves held by financial institutions. Less conventional mortgages will therefore be more widely available.
- Improving credit available at a time of likely rising interest rates is highly welcome. Many would-be first-time buyers have been more focused about getting a mortgage (even at a higher rate) than with low rates.
- All in all, existing and new home sales will be rising. Combined, there will be 5.8 million home sales in 2015, up 7 percent from last year. Note the sales total will still be 25 percent below the decade ago level during the bubble year. Home prices will be rising at 7 percent. For the industry, the business revenue will be rising by 14 percent in 2015. The revenue growth in 2016 will be additional 7 to 10 percent.
US Oil Rig Count Decline Quickened This Week

Source: Rigzone
The fall in U.S. rigs drilling for oil quickened a bit this week, data showed on Friday, suggesting a recent slowdown in the decline in drilling was temporary, after slumping oil prices caused energy companies to idle half the country’s rigs since October.
Drillers idled 31 oil rigs this week, leaving 703 rigs active, after taking 26 and 42 rigs out of service in the previous two weeks, oil services firm Baker Hughes Inc said in its closely watched report.
With the oil rig decline this week, the number of active rigs has fallen for a record 20 weeks in a row to the lowest since 2010, according to Baker Hughes data going back to 1987.
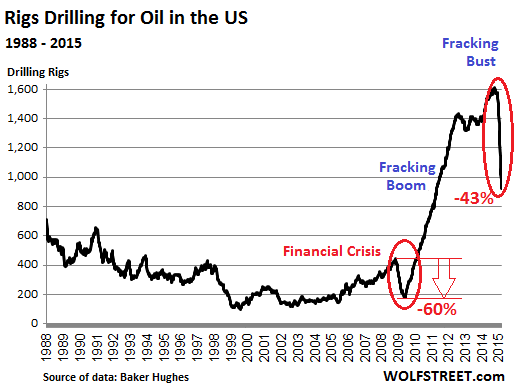
Since the number of oil rigs peaked at 1,609 in October, energy producers have responded quickly to the steep 60 percent drop in oil prices since last summer by cutting spending, eliminating jobs and idling rigs.
After its precipitous drop since October, the U.S. oil rig count is nearing a pivotal level that experts say could dent production, bolster prices and even coax oil companies back to the well pad in the coming months.

Pioneer Natural Resources Co, a top oil producer in the Permian Basin of West Texas, said this week it will start adding rigs in June as long as market conditions are favorable. U.S. crude futures this week climbed to over $58 a barrel, the highest level this year, as a Saudi-led coalition continued bombings in Yemen.
That was up 38 percent from a six-year low near $42 set in mid March on oversupply concerns and lackluster demand, in part on expectations the lower rig count will start reducing U.S. oil output.
After rising mostly steadily since 2009, U.S. oil production has stalled near 9.4 million barrels a day since early March, the highest level since the early 1970s, according to government data.
The Permian Basin in West Texas and eastern New Mexico, the nation’s biggest and fastest-growing shale oil basin, lost the most oil rigs, down 13 to 242, the lowest on record, according to data going back to 2011.
Texas was the state with the biggest rig decline, down 19 to 392, the least since 2009.
In Canada, active oil rigs fell by four to 16, the lowest since 2009. U.S. natural gas rigs, meanwhile, climbed by eight to 225, the same as two weeks ago.
Leading Texas Golf Resort Communities Revealed
By Scott Kauffman | World Property Journal

While much of America struggled during the last financial crisis, Texas grew in greater economic stature on a number of levels. Fueled by a thriving energy economy, strong tech sector and job market, one strong growth area was real estate development.
Texans have always had a strong affinity to golf so it’s no surprise real estate communities, resorts and private clubs feature golf as a central component. Two top leisure properties in Texas are 72-hole Horseshoe Bay Resort in Texas Hill Country and TPC Four Seasons at Las Colinas, home to the AT&T Byron Nelson Championship.
On the private club front, the “Big D” features a collection of renowned golf clubs, including Brook Hollow Country Club, Dallas National and Preston Trail Golf Club, where initiation fees start at $125,000.
The following is a handful of golf and resort-style communities leading the Lone Star State’s leisure real estate sector today.
Vaquero Club, Westlake, Texas
When it comes to country club living, this Dallas-area private club is as luxurious as they come. Originally developed by Discovery Land Company, the Beverly Hills, Calif.-based company known for creating such elite clubs as Estancia in Scottsdale, Ariz. the Madison Club in La Quinta, Calif., and Kukio on the Big Island of Hawaii, Vaquero Club is now member-owned and fresh off an extensive $2.8 million renovation to its Tom Fazio-designed golf course.
According to club executives, part of the motivation behind the project was to enhance real estate vistas and create a more core-golf experience. A perfect example of this took place on the club’s drivable par-4 fourth hole, where new tee boxes were added, as well as on nine other holes.
This means resident members inside Vaquero’s stately manors have even more beautiful views to enjoy. Of an estimated dozen listings by the Jeff Watson Group of Briggs Freeman Sotheby’s International Realty, Vaquero’s most affordable home is currently listed at $1.295 million for a 4-bedroom, 4 1/2 -bath residence and it goes up to $5.995 million for a 5-bedroom estate on 3.8 acres featuring a 5-car garage and wine cellar with 1,500-bottle capacity.
The Vaquero Club consists of 385 equity memberships with an initiation fee approaching $200,000. Besides world-class golf, the club also offers a family-friendly Fish Camp, wine programs and other member amenities and services.
Cordillera Ranch, Boerne, Texas

Located 30 minutes northwest of San Antonio, Cordillera Ranch is a debt-free 8,700-acre master-planned residential community in the Texas Hill Country. The family-owned and operated development is not short on activities, considering residents of the gated community can join The Clubs of Cordillera Ranch that feature seven resort-style clubs in one location: The Golf Club, The Social Club, The Tennis and Swim Club, The Equestrian Club, The Rod and Gun Club, The Spa and Athletic Club and The River Club.
Opened in 2007, the community’s Jack Nicklaus Signature golf course has consistently been ranked among the best in Texas, most recently placing fifth on the Dallas Morning News‘ annual poll. Its par-3 16th has claimed the No. 1 spot as “Most Beautiful Hole” by the same publication for the past five years.
Among the community’s newest real estate offerings are golf course frontage lots, villas and an entirely new section aimed at young families. Overall, Cordillera Ranch boasts ¼-acre villa homes, valley-view and Guadalupe River-front homes, hilltop home sites and 1-to-10-acre estate residences.
According to the developer, 2014 was a banner year in both real estate and membership sales. For instance, Cordillera Ranch sold 33 homes at an average of $886,000 and total lot sales increased by 32 percent.
Trending in 2015: 46 new homes are under construction totaling more than $60 million in new starts – easily the highest total of any upscale community in the San Antonio area, according to the developer. Another 39 homes are in the architectural review approval process – a 65 percent increase over 2013.
Since its inception in 1997, more than 1,200 lots have been sold and approximately 700 homes have been completed. At final build-out, this low-density Hill Country community will total approximately 2,500 homes and preserve approximately 80 percent of the land in its natural vegetation. More than 70 new members were added in 2014, bucking the national trend of private club membership attrition.
“We’re excited and humbled to be a leader in the luxury lifestyle category,” says Charlie Hill, Vice President of Development at Cordillera Ranch. “With the economy thriving and the San Antonio area continuing to prosper, we expect the upward trend in real estate sales to continue in 2015.”
Cordillera Ranch credits much of its growth to being in the highly acclaimed Boerne School District, which is regarded as one of the best in Texas and boasts schools ranked in numerous national-best lists. The community is also benefitting from being in the prosperous Eagle Ford Shale. While other oil-rich areas have struggled with the drop in oil prices, the Eagle Ford Shale has continued to produce. That has attracted oil and gas executives to come to the Texas Hill Country and settle down in communities like Cordillera Ranch.
Boot Ranch, Fredericksburg, Texas

Three years after being put up for sale, the once-bankrupt Boot Ranch community has kicked back into high sales gear. This posh 2,051-acre master-planned golf community in Texas Hill Country’s Gillespie County started selling luxury lots in 2005 and opened a golf course designed by PGA Tour star Hal Sutton in 2006.
But sales were sluggish as the real estate market started to collapse worldwide and Lehman Brothers eventually foreclosed on the property in 2010. Then, the Municipal Police Employees Retirement System of Louisiana, one of Sutton’s original backers and a past partner on the project, sued a number of Boot Ranch partnerships and corporations, putting the project under further stress.
With all of these financial and legal troubles behind them, Boot Ranch is now able to focus on a revitalized real estate market and the renewed life is paying off for this private golf and family community near the popular town of Fredericksburg.
Case in point is Boot Ranch is coming off an eight-year record high for home and property sales, highlighted last year by $13.781 million in year-to-date sales through Sept. 30. Of the $13.781 million in sales, $9.057 million came from estate home sites; another $1.524 million was from Overlook Cabin home sites and $2.825 million were sales of fractional shares of the club’s Sunday Houses.

Overall, Boot Ranch sold 135 lots last year and had 16 homes completed with another 20 under construction or in the planning stages. Boot Ranch real estate options range from fractional ownership shares of 4,500-square-foot Sunday Houses to large Overlook Cabins priced from the $800,000s to estate home sites from $300,000 to $2.5 million for 2-18 acres.
“The booming demand for luxury ranch living is a byproduct of the successful Texas economy, particularly the energy business,” says Sean Gioffre, Boot Ranch director of marketing and sales. “The advent of hydraulic fracturing and the achievements of prized shale formations, like the Eagle Ford, Permian and Bakken, have pushed oil and gas production to record highs. With low interest rates, many people are looking to second homes as a hedge against inflation and as a tangible asset in which to put their money.”
Five miles north of the historic town of Fredericksburg, Boot Ranch is a master-planned retreat featuring one of the rare Sutton-designed courses, and a 34-acre practice park comprised of a short game range and executive par-three course. Other amenities at Boot Ranch include access to the 55,000-square-foot Clubhouse Village, casual and fine dining, a fully-stocked wine cellar, golf shop, ReStore Spa & Fitness Center, the 4.5-acre Ranch Club with pavilion, pools, tennis and sports courts, 10 member/guest lodge suites, a trap and skeet range overlooking Longhorn Lake, hiking, mountain biking, canoeing and fishing.
Construction is under way on a fishing pier and comfort station near Boot Ranch’s signature tenth hole on the golf course.
“We call Boot Ranch the ‘American Dream Texas Style,'” says co-director of marketing and sales Andrew Ball. “The motivation for buyers seems to be for recreational property – somewhere where owners can golf, fish, dine, swim, relax and generally enjoy the Texas outdoors. Many people say they just want to get their kids and grandkids out of the city, even if for only a few days or weeks at a time.”
Traditions Club and Community, Bryan, TX

This new upscale golf and country club development gives Texas A&M loyalists something else to brag about in Aggieland. Located less than 10 minutes from 10 minutes from a bustling college town and burgeoning health and research center, it’s no surprise why this is shaping up to be another successful Texas real estate project.
Traditions Club and Community is the private golf and residential community in “Aggieland” and home to the Texas A&M men’s and women’s golf teams. Located in Bryan-College Station, the club rests in the shadow of the university and in the heart of The Research Valley’s “One Health Plus Biocorridor.”
From custom-garden homes to large estate lots, Traditions Club has a wide range of developments that cater to many buyers. Future plans to attract even more residents call for a multi-use retail, entertainment and health/fitness complex to be built within the neighboring Biocorridor area that would mirror one of the top suburbs in Houston, The Woodlands.
Traditions’ tournament-caliber, Jack Nicklaus/Jack Nicklaus II-designed golf course hosts many high-profile junior, collegiate and amateur events. Other amenities include a 21,000-square foot, four-building clubhouse with men’s and women’s locker rooms; 25-meter junior Olympic lap and sport-leisure pools; family swim center with beach-like wading pool; and fully-equipped fitness center.
Casual fare is offered at the Poole Grille and fine dining at the clubhouse, home to an impressive wine cellar. Overnight accommodations are available in two-, three- and four-bedroom cottages and casitas located just walking distance from all the club’s amenities.
Overlooking stately oak trees, gently rolling terrain and the lush green fairways of the golf course, the Traditions Club and Community is an enclave of custom estates, Game Day Cottages, cozy casitas, villas, garden homes and luxurious condominiums. Home sites range from .25 acres up to an acre, with homes spanning 1,800 to 8,000 square feet.

Traditions Clubhouse
The newest phase being marketed is the Blue Belle home sites, a collection of 34 lots designed for two and three-bedroom custom homes. Overlooking a heavily wooded and rolling landscape in a peaceful and quiet enclave, the home sites encompass up to one-third of an acre and are priced with the home. The residences range from 2,200 to 3,500 square-feet and start in the low $400,000s.
Blue Belle residents can enjoy the outdoors without having to worry about extensive home and yard maintenance. Creative landscaped patios open up to peaceful settings that exemplify private community living. A multi-use trail meandering around a small lake is perfect for short walks and hikes
Interiors exude Texas Hill County elegance, with hardwood flooring, granite countertops, gourmet kitchens, high ceilings and open living area. The floor plans are highly personalized, providing a rich, distinguished selection of upscale finishes and features.
“Real estate sales in vibrant college towns like Bryan/College Station continue to thrive as master-planned communities like Traditions build to suit an array of buyers,” says Spencer Clements, Traditions Club Principal. “Empty-nesters or those seeking a second home with minimal maintenance will find Blue Belle offers the square-footages, relaxing setting and customized features catering to their needs and lifestyle.”
Tribute, The Colony, Texas

The Tribute, a Matthews Southwest, Wynne/Jackson master-planned community on the shores of Lake Lewisville, is one of the more ambitious golf and country club developments in the Dallas-Fort Worth metroplex.
Located just 23 miles from Dallas-Fort Worth International Airport, the Tribute is a 36-hbole upscale semi-private facility whose original plans call for 1,150 single-family homes, 160 golf villas, 183 townhomes, and 700 European condominium units.
The community’s newest course, Old American Golf Club, opened in the summer of 2009 and was designed by Tripp Davis and PGA Tour player and native son Justin Leonard. When Old American opened (it was originally called the
New Course), the developers offered premium lake-view, golf course-fronting lots in the Balmerino Village.
This initial phase of lots, located adjacent to the No. 5 green and the No. 6 tee box featured unobstructed views of Lake Lewisville and ranged in price from $135,000 to $275,000 for little more than 1/3 of an acre.
What makes the Tribute so unique it its Scottish links-inspired setting. For instance, the Tribute’s namesake layout, or “Old Course” as it’s often called, is patterned after the legendary courses of Scotland and the Open Championship what with its wind-swept dunes and fescue grasses.
The first and 18th holes share the same broad fairway, just the Old Course at St. Andrews, and you’ll also find a likeness of Royal Troon’s Postage Stamp hole and experience replica holes from Prestwick, Muirfield, Western Gailes and Royal Dornoch. For a special treat, make sure to stay in one of the overnight guest suites above the clubhouse that overlook the course.
The Tribute’s newest course pays homage to famed golf course architects such as Donald Ross and A.W. Tillinghast, many of whom came to the United States from Great Britain around the turn of the century.
According to an Old American spokesman, the new course currently has about 58 resident members of the club, which represents approximately 25 percent of the overall membership. Among the other amenities enjoyed by members are first-class amenity centers, pools, parks, playgrounds, on-site schools, hike-and-bike trails, landscaped canals and hundreds of acres of accessible open space reminiscent of the Scottish Highlands.
Junk-Rated Oil & Gas Companies in a “Liquidity Death Spiral”

On the face of it, the oil price appears to be stabilizing. What a precarious balance it is, however.
Behind the facade of stability, the re-balancing triggered by the price collapse has yet to run its course, and it might be overly optimistic to expect it to proceed smoothly. Steep drops in the US rig count have been a key driver of the price rebound. Yet US supply so far shows precious little sign of slowing down. Quite to the contrary, it continues to defy expectations.
So said the International Energy Agency in its Oil Market Report on Friday. West Texas Intermediate plunged over 4% to $45 a barrel.
The boom in US oil production will continue “to defy expectations” and wreak havoc on the price of oil until the power behind the boom dries up: money borrowed from yield-chasing investors driven to near insanity by the Fed’s interest rate repression. But that money isn’t drying up yet – except at the margins.
Companies have raked in 14% more money from high-grade bond sales so far this year than over the same period in 2014, according to LCD. And in 2014 at this time, they were 27% ahead of the same period in 2013. You get the idea.
Even energy companies got to top off their money reservoirs. Among high-grade issuers over just the last few days were BP Capital, Valero Energy, Sempra Energy, Noble, and Helmerich & Payne. They’re all furiously bringing in liquidity before it gets more expensive.
In the junk-bond market, bond-fund managers are chasing yield with gusto. Last week alone, pro-forma junk bond issuance “ballooned to $16.48 billion, the largest weekly tally in two years,” the LCD HY Weekly reported. Year-to-date, $79.2 billion in junk bonds have been sold, 36% more than in the same period last year.
But despite this drunken investor enthusiasm, the bottom of the energy sector – junk-rated smaller companies – is falling out.
Standard & Poor’s rates 170 bond issuers that are engaged in oil and gas exploration & production, oil field services, and contract drilling. Of them, 81% are junk rated – many of them deep junk. The oil bust is now picking off the smaller junk-rated companies, one after the other, three of them so far in March.
On March 3, offshore oil-and-gas contractor CalDive that in 2013 still had 1,550 employees filed for bankruptcy. It’s focused on maintaining offshore production platforms. But some projects were suspended last year, and lenders shut off the spigot.
On March 8, Dune Energy filed for bankruptcy in Austin, TX, after its merger with Eos Petro collapsed. It listed $144 million in debt. Dune said that it received $10 million Debtor in Possession financing, on the condition that the company puts itself up for auction.
On March 9, BPZ Resources traipsed to the courthouse in Houston to file for bankruptcy, four days after I’d written about its travails; it had skipped a $60 million payment to its bondholders [read… “Default Monday”: Oil & Gas Companies Face Their Creditors].
And more companies are “in the pipeline to be restructured,” LCD reported. They all face the same issues: low oil and gas prices, newly skittish bond investors, and banks that have their eyes riveted on the revolving lines of credit with which these companies fund their capital expenditures. Being forever cash-flow negative, these companies periodically issue bonds and use the proceeds to pay down their revolver when it approaches the limit. In many cases, the bank uses the value of the company’s oil and gas reserves to determine that limit.
If the prices of oil and gas are high, those reserves have a high value. It those prices plunge, the borrowing base for their revolving lines of credit plunges. S&P Capital IQ explained it this way in its report, “Waiting for the Spring… Will it Recoil”:
Typically, banks do their credit facility redeterminations in April and November with one random redetermination if needed. With oil prices plummeting, we expect banks to lower their price decks, which will then lead to lower reserves and thus, reduced borrowing-base availability.
April is coming up soon. These companies would then have to issue bonds to pay down their credit lines. But with bond fund managers losing their appetite for junk-rated oil & gas bonds, and with shares nearly worthless, these companies are blocked from the capital markets and can neither pay back the banks nor fund their cash-flow negative operations. For many companies, according to S&P Capital IQ, these redeterminations of their credit facilities could lead to a “liquidity death spiral.”
Alan Holtz, Managing Director in AlixPartners’ Turnaround and Restructuring group told LCD in an interview:
We are already starting to see companies that on the one hand are trying to work out their operational problems and are looking for financing or a way out through the capital markets, while on the other hand are preparing for the events of contingency planning or bankruptcy.
Look at BPZ Resources. It wasn’t able to raise more money and ended up filing for bankruptcy. “I think that is going to be a pattern for many other companies out there as well,” Holtz said.
When it trickled out on Tuesday that Hercules Offshore, which I last wrote about on March 3, had retained Lazard to explore options for its capital structure, its bonds plunged as low as 28 cents on the dollar. By Friday, its stock closed at $0.41 a share.
When Midstates Petroleum announced that it had hired an interim CEO and put a restructuring specialist on its board of directors, its bonds got knocked down, and its shares plummeted 33% during the week, closing at $0.77 a share on Friday.
When news emerged that Walter Energy hired legal counsel Paul Weiss to explore restructuring options, its first-lien notes – whose investors thought they’d see a reasonable recovery in case of bankruptcy – dropped to 64.5 cents on the dollar by Thursday. Its stock plunged 63% during the week to close at $0.33 a share on Friday.
Numerous other oil and gas companies are heading down that path as the oil bust is working its way from smaller more vulnerable companies to larger ones. In the process, stockholders get wiped out. Bondholders get to fight with other creditors over the scraps. But restructuring firms are licking their chops, after a Fed-induced dry spell that had lasted for years.
Investors Crushed as US Natural Gas Drillers Blow Up
The Fed speaks, the dollar crashes. The dollar was ripe. The entire world had been bullish on it. Down nearly 3% against the euro, before recovering some. The biggest drop since March 2009. Everything else jumped. Stocks, Treasuries, gold, even oil.
West Texas Intermediate had been experiencing its biggest weekly plunge since January, trading at just above $42 a barrel, a new low in the current oil bust. When the Fed released its magic words, WTI soared to $45.34 a barrel before re-sagging some. Even natural gas rose 1.8%. Energy related bonds had been drowning in red ink; they too rose when oil roared higher. It was one heck of a party.
But it was too late for some players mired in the oil and gas bust where the series of Chapter 11 bankruptcy filings continues. Next in line was Quicksilver Resources.
It had focused on producing natural gas. Natural gas was where the fracking boom got started. Fracking has a special characteristic. After a well is fracked, it produces a terrific surge of hydrocarbons during first few months, and particularly on the first day. Many drillers used the first-day production numbers, which some of them enhanced in various ways, in their investor materials. Investors drooled and threw more money at these companies that then drilled this money into the ground.
But the impressive initial production soon declines sharply. Two years later, only a fraction is coming out of the ground. So these companies had to drill more just to cover up the decline rates, and in order to drill more, they needed to borrow more money, and it triggered a junk-rated energy boom on Wall Street.
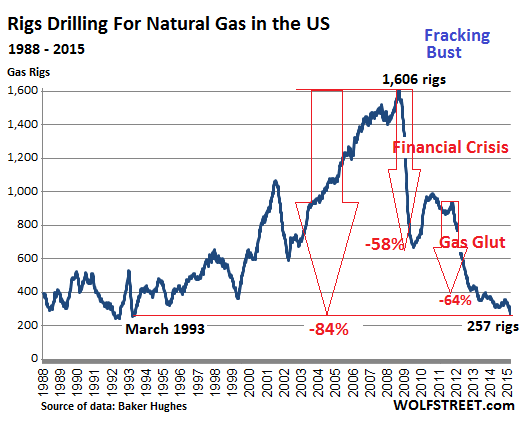
At the time, the price of natural gas was soaring. It hit $13 per million Btu at the Henry Hub in June 2008. About 1,600 rigs were drilling for gas. It was the game in town. And Wall Street firms were greasing it with other people’s money. Production soared. And the US became the largest gas producer in the world.

But then the price began to plunge. It recovered a little after the Financial Crisis but re-plunged during the gas “glut.” By April 2012, natural gas had crashed 85% from June 2008, to $1.92/mmBtu. With the exception of a few short periods, it has remained below $4/mmBtu – trading at $2.91/mmBtu today.
Throughout, gas drillers had to go back to Wall Street to borrow more money to feed the fracking orgy. They were cash-flow negative. They lost money on wells that produced mostly dry gas. Yet they kept up the charade. They aced investor presentations with fancy charts. They raved about new technologies that were performing miracles and bringing down costs. The theme was that they would make their investors rich at these gas prices.
The saving grace was that oil and natural-gas liquids, which were selling for much higher prices, also occur in many shale plays along with dry gas. So drillers began to emphasize that they were drilling for liquids, not dry gas, and they tried to switch production to liquids-rich plays. In that vein, Quicksilver ventured into the oil-rich Permian Basin in Texas. But it was too little, too late for the amount of borrowed money it had already burned through over the years by fracking for gas below cost.
During the terrible years of 2011 and 2012, drillers began reclassifying gas rigs as rigs drilling for oil. It was a judgement call, since most wells produce both. The gas rig count plummeted further, and the oil rig count skyrocketed by about the same amount. But gas production has continued to rise since, even as the gas rig count has continued to drop. On Friday, the rig count was down to 257 gas rigs, the lowest since March 1993, down 84% from its peak in 2008.
Quicksilver’s bankruptcy is a consequence of this fracking environment. It listed $2.35 billion in debts. That’s what is left from its borrowing binge that covered its negative cash flows. It listed only $1.21 billion in assets. The rest has gone up in smoke.
Its shares are worthless. Stockholders got wiped out. Creditors get to fight over the scraps.
Its leveraged loan was holding up better: the $625 million covenant-lite second-lien term loan traded at 56 cents on the dollar this morning, according to S&P Capital IQ LCD. But its junk bonds have gotten eviscerated over time. Its 9.125% senior notes due 2019 traded at 17.6 cents on the dollar; its 7.125% subordinated notes due 2016 traded at around 2 cents on the dollar.
Among its creditors, according to the Star Telegram: the Wilmington Trust National Association ($361.6 million), Delaware Trust Co. ($332.6 million), US Bank National Association ($312.7 million), and several pipeline companies, including Oasis Pipeline and Energy Transfer Fuel.
Last year, it hired restructuring advisers. On February 17, it announced that it would not make a $13.6 million interest payment on its senior notes and invoked the possibility of filing for Chapter 11. It said it would use its 30-day grace period to haggle with its creditors over the “company’s options.”
Now, those 30 days are up. But there were no other “viable options,” the company said in the statement. Its Canadian subsidiary was not included in the bankruptcy filing; it reached a forbearance agreement with its first lien secured lenders and has some breathing room until June 16.
Quicksilver isn’t alone in its travails. Samson Resources and other natural gas drillers are stuck neck-deep in the same frack mud.
A group of private equity firms, led by KKR, had acquired Samson in 2011 for $7.2 billion. Since then, Samson has lost $3 billion. It too hired restructuring advisers to deal with its $3.75 billion in debt. On March 2, Moody’s downgraded Samson to Caa3, pointing at “chronically low natural gas prices,” “suddenly weaker crude oil prices,” the “stressed liquidity position,” and delays in asset sales. It invoked the possibility of “a debt restructuring” and “a high risk of default.”
But maybe not just yet. The New York Post reported today that, according to sources, a JPMorgan-led group, which holds a $1 billion revolving line of credit, is granting Samson a waiver for an expected covenant breach. This would avert default for the moment. Under the deal, the group will reduce the size of the revolver. Last year, the same JPMorgan-led group already reduced the credit line from $1.8 billion to $1 billion and waived a covenant breach.
By curtailing access to funding, they’re driving Samson deeper into what S&P Capital IQ called the “liquidity death spiral.” According to the New York Post’s sources, in August the company has to make an interest payment to its more junior creditors, “and may run out of money later this year.”
Industry soothsayers claimed vociferously over the years that natural gas drillers can make money at these prices due to new technologies and efficiencies. They said this to attract more money. But Quicksilver along with Samson Resources and others are proof that these drillers had been drilling below the cost of production for years. And they’d been bleeding every step along the way. A business model that lasts only as long as new investors are willing to bail out old investors.
But it was the crash in the price of “liquids” that made investors finally squeamish, and they began to look beyond the hype. In doing so, they’re triggering the very bloodletting amongst each other that ever more new money had delayed for years. Only now, it’s a lot more expensive for them than it would have been three years ago. While the companies will get through it in restructured form, investors get crushed.
Oil Production Falling In Three Big Shale Plays, EIA Says

HOUSTON – It’s official: The shale oil boom is starting to waver.
And, in a way, it may have souped-up rigs and more efficient drilling technologies to thank for that.
Crude production at three major U.S. shale oil fields is projected to fall this month for the first time in six years, the U.S. Energy Information Administration said Tuesday.
It’s one of the first signs that idling hundreds of drilling rigs and billions of dollars in corporate cutbacks are starting to crimp the nation’s surging oil patch.
But it also shows that drilling technology and techniques have advanced to the point that productivity gains may be negligible in some shale plays where horizontal drilling and hydraulic fracturing have been used together for the past several years.
Because some plays are already full of souped-up horizontal rigs, oil companies don’t have as many options to become more efficient and stem production losses, as they did in the 2008-2009 downturn, the EIA said.
The EIA’s monthly drilling productivity report indicates that rapid production declines from older wells in three shale plays are starting to overtake new output, as oil companies drill fewer wells.
In the recession six years ago, the falling rig count didn’t lead to declining production because new technologies boosted how fast rigs could drill wells.
But now that oil firms have figured out how to drill much more efficiently, “it is not clear that productivity gains will offset rig count declines to the same degree as in 2008-09,” the EIA said.

Overall, U.S. oil production is set to increase slightly from March to April to 5.6 million barrels a day in six major fields, according to the EIA.
But output is falling in the Eagle Ford Shale in South Texas, North Dakota’s Bakken Shale and the Niobrara Shale in Colorado, Wyoming, Nebraska and Kansas.
In those three fields, net production is expected to drop by a combined 24,000 barrels a day.
The losses were masked by production gains in the Permian Basin in West Texas and other regions.
Efficiency improvements are still emerging in the Permian, faster than in other oil fields because the region was largely a vertical-drilling zone as recently as December 2013, the EIA said.
Net crude output in the Bakken is expected to decline by 8,000 barrels a day from March to April. In the Eagle Ford, it’s slated to fall by 10,000 barrels a day. And in the Niobrara, production will dip by roughly 5,000 barrels a day.
But daily crude output jumped by 21,000 barrels in the Permian and by 3,000 barrels in the Utica Shale in Ohio and Pennsylvania.
Tenants Benefit When Rent Payment Data Are Factored Into Credit Scores
by Kenneth R. Harney | LA Times
It’s the great credit divide in American housing: If you buy a home and pay your mortgage on time regularly, your credit score typically benefits. If you rent an apartment and pay the landlord on time every month, you get no boost to your score. Since most landlords aren’t set up or approved to report rent payments to the national credit bureaus, their tenants’ credit scores often suffer as a direct result.
All this has huge implications for renters who hope one day to buy a house. To qualify for a mortgage, they’ll need good credit scores. Young, first-time buyers are especially vulnerable — they often have “thin” credit files with few accounts and would greatly benefit by having their rent histories included in credit reports and factored into their scores. Without a major positive such as rent payments in their files, a missed payment on a credit card or auto loan could have significant negative effects on their credit scores.
You probably know folks like these — sons, daughters, neighbors, friends. Or you may be one of the casualties of the system yourself, a renter with a perfect payment history that creditors will never see when they pull your credit. Think of it this way and the great divide gets intensely personal.
But here’s some good news: Growing numbers of landlords are now reporting rent payments to the bureaus with the help of high-tech intermediaries who set up electronic rent-collection systems for tenants.
One of these, RentTrack, says it already has coverage in thousands of rental buildings nationwide, with a total of 100,000-plus apartment units, and expects to be reporting rent payments for more than 1 million tenants within the year. Two others, ClearNow Inc. and PayYourRent, also report to one of the national bureaus, Experian, which includes the data in consumer credit files. RentTrack reports to Experian and TransUnion.
Why does this matter? Two new studies illustrate what can happen when on-time rent payments are factored into consumers’ credit reports and scores. RentTrack examined a sample of the tenants in its database and found that 100% of renters who previously were rated as “unscoreable” — there wasn’t enough information in their credit files to evaluate — became scoreable once they had two months to six months of rental payments reported to the credit bureaus.

Tenants who had scores below 650 at the start of the sampling gained an average of 29 points with the inclusion of positive monthly payment data. Overall, residents in all score brackets saw an average gain of 9 points. The scores were computed using the VantageScore model, which competes with FICO scores and uses a similar 300 to 850 scoring scale, with high scores indicating low risk of nonpayment.
Experian, the first major credit bureau to begin integrating rental payment records into credit files, also completed a major study recently. Using a sample of 20,000 tenants who live in government-subsidized apartment buildings, Experian found that 100% of unscoreable tenants became scoreable, and that 97% of them had scores in the “prime” (average 688) and “non-prime” (average 649) categories. Among tenants who had scores before the start of the research, fully 75% saw increases after the addition of positive rental information, typically 11 points or higher.
Think about what these two studies are really saying: Tenants often would score higher — sometimes significantly higher — if rent payments were reported to the national credit bureaus. Many deserve higher credit scores but don’t get them.
Matt Briggs, chief executive and founder of RentTrack, says for many tenants, their steady rent payments “may be the only major positive thing in their credit report,” so including them can be crucial when lenders pull their scores.
Justin Yung, vice president of ClearNow, told me that “for most [tenants] the rent is the largest payment they make per month and yet it doesn’t appear on their credit report” unless their landlord has signed up with one of the electronic payment firms.
Is this something difficult or complicated? Not really. You, your landlord or property manager can go to one of the three companies’ websites (RentTrack.com, ClearNow.com and PayYourRent.com), check out the procedures and request coverage. Costs to tenants are either minimal or zero, and the benefits to the landlord of having tenants pay rents electronically appear to be attractive.
Everybody benefits. So why not?
kenharney@earthlink.net Distributed by Washington Post Writers Group. Copyright © 2015, Los Angeles Times
This Chart Shows the True Collapse of Fracking in the US
by Wolf Richter

Rex Tillerson, Exxon Mobile CEO
“People need to kinda settle in for a while.” That’s what Exxon Mobil CEO Rex Tillerson said about the low price of oil at the company’s investor conference. “I see a lot of supply out there.”
So Exxon is going to do its darnedest to add to this supply: 16 new production projects will start pumping oil and gas through 2017. Production will rise from 4 million barrels per day to 4.3 million. But it will spend less money to get there, largely because suppliers have had to cut their prices.
That’s the global oil story. In the US, a similar scenario is playing out. Drillers are laying some people off, not massive numbers yet. Like Exxon, they’re shoving big price cuts down the throats of their suppliers. They’re cutting back on drilling by idling the least efficient rigs in the least productive plays – and they’re not kidding about that.
In the latest week, they idled a 64 rigs drilling for oil, according to Baker Hughes, which publishes the data every Friday. Only 922 rigs were still active, down 42.7% from October, when they’d peaked. Within 21 weeks, they’ve taken out 687 rigs, the most terrific, vertigo-inducing oil-rig nose dive in the data series, and possibly in history:
 As Exxon and other drillers are overeager to explain: just because we’re cutting capex, and just because the rig count plunges, doesn’t mean our production is going down. And it may not for a long time. Drillers, loaded up with debt, must have the cash flow from production to survive.
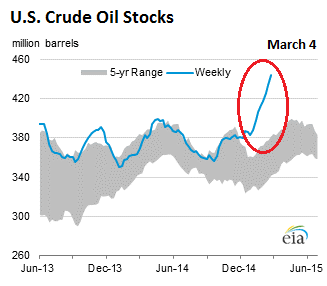
But with demand languishing, US crude oil inventories are building up further. Excluding the Strategic Petroleum Reserve, crude oil stocks rose by another 10.3 million barrels to 444.4 million barrels as of March 4, the highest level in the data series going back to 1982, according to the Energy Information Administration. Crude oil stocks were 22% (80.6 million barrels) higher than at the same time last year.
“When you have that much storage out there, it takes a long time to work that off,” said BP CEO Bob Dudley, possibly with one eye on this chart:
 So now there is a lot of discussion when exactly storage facilities will be full, or nearly full, or full in some regions. In theory, once overproduction hits used-up storage capacity, the price of oil will plummet to whatever level short sellers envision in their wildest dreams. Because: what are you going to do with all this oil coming out of the ground with no place to go?
A couple of days ago, the EIA estimated that crude oil stock levels nationwide on February 20 (when they were a lot lower than today) used up 60% of the “working storage capacity,” up from 48% last year at that time. It varied by region:
Capacity is about 67% full in Cushing, Oklahoma (the delivery point for West Texas Intermediate futures contracts), compared with 50% at this point last year. Working capacity in Cushing alone is about 71 million barrels, or … about 14% of the national total.
As of September 2014, storage capacity in the US was 521 million barrels. So if weekly increases amount to an average of 6 million barrels, it would take about 13 weeks to fill the 77 million barrels of remaining capacity. Then all kinds of operational issues would arise. Along with a dizzying plunge in price.
In early 2012, when natural gas hit a decade low of $1.92 per million Btu, they predicted the same: storage would be full, and excess production would have to be flared, that is burned, because there would be no takers, and what else are you going to do with it? So its price would drop to zero.
They actually proffered that, and the media picked it up, and regular folks began shorting natural gas like crazy and got burned themselves, because it didn’t take long for the price to jump 50% and then 100%.
Oil is a different animal. The driving season will start soon. American SUVs and pickups are designed to burn fuel in prodigious quantities. People will be eager to drive them a little more, now that gas is cheaper, and they’ll get busy shortly and fix that inventory problem, at least for this year. But if production continues to rise at this rate, all bets are off for next year.
Natural gas, though it refused to go to zero, nevertheless got re-crushed, and the price remains below the cost of production at most wells. Drilling activity has dwindled. Drillers idled 12 gas rigs in the latest week. Now only 268 rigs are drilling for gas, the lowest since April 1993, and down 83.4% from its peak in 2008! This is what the natural gas fracking boom-and-bust cycle looks like:
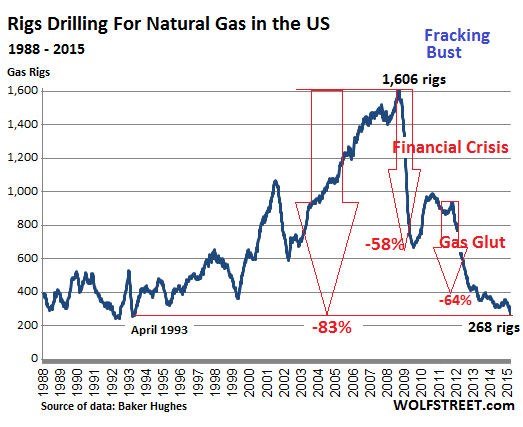 Yet production has continued to rise. Over the last 12 months, it soared about 9%, which is why the price got re-crushed.
Producing gas at a loss year after year has consequences. For the longest time, drillers were able to paper over their losses on natural gas wells with a variety of means and go back to the big trough and feed on more money that investors were throwing at them, because money is what fracking drills into the ground.
But that trough is no longer being refilled for some companies. And they’re running out. “Restructuring” and “bankruptcy” are suddenly the operative terms.
“Default Monday”: Oil & Gas Face Their Creditors
by Wolf Richter

Debt funded the fracking boom. Now oil and gas prices have collapsed, and so has the ability to service that debt. The oil bust of the 1980s took down 700 banks, including 9 of the 10 largest in Texas. But this time, it’s different. This time, bondholders are on the hook.
And these bonds – they’re called “junk bonds” for a reason – are already cracking. Busts start with small companies and proceed to larger ones. “Bankruptcy” and “restructuring” are the terms that wipe out stockholders and leave bondholders and other creditors to tussle over the scraps.

Early January, WBH Energy, a fracking outfit in Texas, kicked off the series by filing for bankruptcy protection. It listed assets and liabilities of $10 million to $50 million. Small fry.
A week later, GASFRAC filed for bankruptcy in Alberta, where it’s based, and in Texas – under Chapter 15 for cross-border bankruptcies. Not long ago, it was a highly touted IPO, whose “waterless fracking” technology would change a parched world. Instead of water, the system pumps liquid propane gel (similar to Napalm) into the ground; much of it can be recaptured, in theory.
Ironically, it went bankrupt for other reasons: operating losses, “reduced industry activity,” the inability to find a buyer that would have paid enough to bail out its creditors, and “limited access to capital markets.” The endless source of money without which fracking doesn’t work had dried up.

On February 17, Quicksilver Resources announced that it would not make a $13.6 million interest payment on its senior notes due in 2019. It invoked the possibility of filing for Chapter 11 bankruptcy to “restructure its capital structure.” Stockholders don’t have much to lose; the stock is already worthless. The question is what the creditors will get.
It has hired Houlihan Lokey Capital, Deloitte Transactions and Business Analytics, “and other advisors.” During its 30-day grace period before this turns into an outright default, it will haggle with its creditors over the “company’s options.”
![]()
On February 27, Hercules Offshore had its share-price target slashed to zero, from $4 a share, at Deutsche Bank, which finally downgraded the stock to “sell.” If you wait till Deutsche Bank tells you to sell, you’re ruined!
When I wrote about Hercules on October 15, HERO was trading at $1.47 a share, down 81% since July. Those who followed the hype to “buy the most hated stocks” that day lost another 44% by the time I wrote about it on January 16, when HERO was at $0.82 a share. Wednesday, shares closed at $0.60.
Deutsche Bank was right, if late. HERO is headed for zero (what a trip to have a stock symbol that rhymes with zero). It’s going to restructure its junk debt. Stockholders will end up holding the bag.

On Monday, due to “chronically low natural gas prices exacerbated by suddenly weaker crude oil prices,” Moody’s downgraded gas-driller Samson Resources, to Caa3, invoking “a high risk of default.”
It was the second time in three months that Moody’s downgraded the company. The tempo is picking up. Moody’s:
The company’s stressed liquidity position, delays in reaching agreements on potential asset sales and its retention of restructuring advisors increases the possibility that the company may pursue a debt restructuring that Moody’s would view as a default.
Moody’s was late to the party. On February 26, it was leaked that Samson had hired restructuring advisers Kirkland & Ellis and Blackstone’s restructuring group to figure out how to deal with its $3.75 billion in debt. A group of private equity firms, led by KKR, had acquired Samson in 2011 for $7.2 billion. Since then, Samson has lost $3 billion. KKR has written down its equity investment to 5 cents on the dollar.
This is no longer small fry.

Also on Monday, oil-and-gas exploration and production company BPZ Resources announced that it would not pay $62 million in principal and interest on convertible notes that were due on March 1. It will use its grace period of 10 days on the principal and of 30 days on the interest to figure out how to approach the rest of its existence. It invoked Chapter 11 bankruptcy as one of the options.
If it fails to make the payments within the grace period, it would also automatically be in default of its 2017 convertible bonds, which would push the default to $229 million.
BPZ tried to refinance the 2015 convertible notes in October and get some extra cash. Fracking devours prodigious amounts of cash. But there’d been no takers for the $150 million offering. Even bond fund managers, driven to sheer madness by the Fed’s policies, had lost their appetite. And its stock is worthless.

Also on Monday – it was “default Monday” or something – American Eagle Energy announced that it would not make a $9.8 million interest payment on $175 million in bonds due that day. It will use its 30-day grace period to hash out its future with its creditors. And it hired two additional advisory firms.
One thing we know already: after years in the desert, restructuring advisers are licking their chops.
The company has $13.6 million in negative working capital, only $25.9 million in cash, and its $60 million revolving credit line has been maxed out.
But here is the thing: the company sold these bonds last August! And this was supposed to be its first interest payment.
That’s what a real credit bubble looks like. In the Fed’s environment of near-zero yield on reasonable investments, bond fund managers are roving the land chasing whatever yield they can discern. And they’re holding their nose while they pick up this stuff to jam it into bond funds that other folks have in their retirement portfolio.
Not even a single interest payment!
Borrowed money fueled the fracking boom. The old money has been drilled into the ground. The new money is starting to dry up. Fracked wells, due to their horrendous decline rates, produce most of their oil and gas over the first two years. And if prices are low during that time, producers will never recuperate their investment in those wells, even if prices shoot up afterwards. And they’ll never be able to pay off the debt from the cash flow of those wells. A chilling scenario that creditors were blind to before, but are now increasingly forced to contemplate.
Another Dubious Jobs Report
Source: Prison Planet

According to the payroll jobs report today (March 6) the economy created 295,000 new jobs in February, dropping the rate of unemployment to 5.5%. However, the BLS also reported that the labor force participation rate fell and the number of people not in the labor force rose by 354,000.
In other words, the unemployment rate dropped because the labor force shrunk.
If the economy was in recovery, the labor force would be growing and the labor force participation rate would be rising.
The 295,000 claimed new jobs are highly suspect. For example, the report claims 32,000 new retail jobs, but the Census Bureau reports that retail sales declined in December and January. Why would retailers experiencing declining sales hire more employees?
Construction spending declined 1.1% in January, but the payroll jobs report says 29,000 construction jobs were added in February.
Zero Hedge reports that the decline in the oil price has resulted in almost 40,000 laid off workers during January and February, but the payroll jobs report only finds 2,900 lost jobs in oil for the two months.http://www.zerohedge.com/news/2015-03-06/did-bls-once-again-forget-count-tens-thousands-energy-job-losses
There is no sign in the payroll jobs report of the large lay-offs by IBM and Hewlett Packard.
These and other inconsistencies do not inspire confidence.
By ignoring the inconsistencies the financial press does not inspire confidence.
Let’s now look at where the BLS says the payroll jobs are.

All of the goods producing jobs are accounted for by the 29,000 claimed construction jobs. The remaining 259,000 new jobs–90%–of the total–are service sector jobs. Three categories account for 70% of these jobs. Wholesale and retail trade, transportation and utilities account. for 62,000 of the jobs. Education and health services account for 54,000 of which ambulatory health care services accounts for 19,900. Leisure and hospitality account for 66,000 jobs of which waitresses and bartenders account for 58,700 jobs.
These are the domestic service jobs of a turd world country.
John Williams (shadowstats.com) reports: “As of February, the level of full-time employment still was 1.0 million shy of its pre-recession peak.”
Paul Craig Roberts was Assistant Secretary of the Treasury for Economic Policy and associate editor of the Wall Street Journal. He was columnist for Business Week, Scripps Howard News Service, and Creators Syndicate. He has had many university appointments. His internet columns have attracted a worldwide following. His latest book, The Failure of Laissez Faire Capitalism and Economic Dissolution of the West is now available.
Chart Of The Day: Recession Dead Ahead?
The chart below showing the annual increase, or rather, decrease in US factory orders which have now declined for 6 months in a row (so no one can’t blame either the west coast port strike or the weather) pretty much speaks for itself, and also which way the US “recovery” (whose GDP is about to crash to the 1.2% where the Atlanta Fed is modeling it, or even lower is headed.

As the St Louis Fed so kindly reminds us, the two previous times US manufacturing orders declined at this rate on an unadjusted (or adjusted) basis, the US economy was already in a recession.

And now, time for consensus to be shocked once again when the Fed yanks the rug from under the feet of the rite-hike-istas.
Texas Home Buyers Are Better Off Than National Average

The March 2015 Texas Home buyers and Sellers Report from the Texas Association of Realtors shows that between July 2013 and June 2014 median household income for Texas home buyers increased 5.9 percent year-over-year compared with a national increase of only 1.4 percent.
Home buyers in Texas are older, more likely to be married and make more money than the national averages, according to the March 2015 Texas Home buyers and Sellers Report from the Texas Association of Realtors.
The study shows that between July 2013 and June 2014 median household income for Texas home buyers increased 5.9 percent year-over-year compared with a national increase of only 1.4 percent. However, the percentage of first-time home buyers in Texas fell 4 points to 29 percent, compared to a 5 percent decline nationally to 33 percent.
Home buyers in Texas are also two years older compared to the previous period, edging up to 45 years of age, and 72 percent of home buyers are married, compared to 65 percent nationally.
Texans are also buying larger and newer homes than other buyers across the U.S. In Texas, the typical three-bedroom, two-bathroom home had 2,100 square feet and was built in 2002, compared to the typical national home built in 1993 with 1,870 square feet.
Forty-seven percent of first-time home buyers in Texas said that finding the right property was the most difficult step in buying a home, as did 48 percent of repeat home buyers.
For Texans selling homes, 21 percent said that the reason for selling was because of job relocation, followed by 16 percent who said that their home was too small. The median household income for a Texas home seller was $120,800, compared with a national media income of $96,700 among home sellers.
Texas home buyers (overall): July 2013 – June 2014
- Median household income: +5.9% to $97,500
- Percent of homes bought that were new: 28% (-1% from July 2012 – June
- 2013)
- Percentage of first-time home buyers: 29% (-4% from July 2012 – June
- 2013)
- Age of typical home buyer: 45 years old (+2 years from July 2012 – June 2013)
- Average age of first-time home buyer: 32 years old (+1 year from July
- 2012 – June 2013)
- Average age of repeat home buyer: 50 years old (unchanged from July 2012 – June 2013)
- Median household income for first-time home buyers: +5.8% to $72,000 (compared to July 2012 – June 2013)
- Median household income for repeat home buyers: -8.9% to $97,500 (compared to July 2012 – June 2013)
- Percent of married home buyers: 72% (+1% from July 2012 – June 2013)
- New homes purchased: 28% (-2% from July 2012 – June 2013)
- Median household income for home sellers: $120,800
- Age of average home seller: 49 years
National home buyers (overall): June 2013 – July 2014
- Median household income: +1.4% to $84,500
- Percent of homes bought that were new: 16% (constant from July 2012 – June 2013)
- Percentage of first-time home buyers: 33% (-5% from July 2012 – June 2013)
- Age of typical home buyer: 44 years old (+2 years from July 2012 – June
- 2013)
- Average age of first-time home buyer: 31 years old (unchanged from July
- 2012 – June 2013)
- Average age of repeat home buyer: 53 years old (+1 year from July 2012 – June 2013)
- Median household income for first-time home buyers: +2.3% to $68,300 (compared to July 2012 – June 2013)
- Median household income for repeat home buyers: -1% to $95,000 (compared to July 2012 – June 2013)
- Percent of married home buyers: 65% (-1% from July 2012 – June 2013)
- New homes purchased: 16% (unchanged from July 2012 – June 2013)
- Median household income for home sellers: $96,700
- Age of average home seller: 54 years
Housing Industry Frets About the Next Brick to Drop

Stephen Schwarzman, CEO and co-founder of Blackstone Group, the world’s largest private-equity firm with $290 billion in assets under management, made $690 million for 2014 via a mix of dividends, compensation, and fund payouts, according to a regulatory filing. A 50% raise from last year.
The PE firm’s subsidiary Invitation Homes, doped with nearly free money the Fed’s policies have made available to Wall Street, has become America’s number one mega-landlord in the span of three years by buying up 46,000 vacant single-family homes in 14 metro areas, initially at a rate of $100 million per week, now reduced to $35 million per week.
As of September 30, Invitation Homes had $8.7 billion worth of homes on its balance sheet, followed by American Homes 4 Rent ($5.5 billion), Colony Financial ($3.4 billion), and Waypoint ($2.6 billion). Those are the top four. Countless smaller investors also jumped into the fray. Together they scooped up several hundred thousand single-family houses.
A “bet on America,” is what Schwarzman called the splurge two years ago.
The bet was to buy vacant homes out of foreclosure, outbidding potential homeowners who’d actually live in them, but who were hobbled by their need for mortgages in cash-only auctions. The PE firms were initially focused only on a handful of cities. Each wave of these concentrated purchases ratcheted up the prices of all other homes through the multiplier effect.
Homeowners at the time loved it as the price of their home re-soared. The effect rippled across the country and added about $7 trillion to homeowners’ wealth since 2011, doubling equity to $14 trillion.
But it pulled the rug out from under first-time buyers. Now, only the ludicrously low Fed-engineered interest rates allow regular people – the lucky ones – to buy a home at all. The rest are renting, in a world where rents are ballooning and wages are stagnating.
Thanks to the ratchet effect, whereby each PE firm helped drive up prices for the others, the top four landlords booked a 23% gain on equity so far, with Invitation Homes alone showing $523 million in gains, according to RealtyTrac. The “bet on America” has been an awesome ride.
But now what? PE firms need to exit their investments. It’s their business model. With home prices in certain markets exceeding the crazy bubble prices of 2006, it’s a great time to cash out. RealtyTrac VP Daren Blomquist told American Banker that small batches of investor-owned properties have already started to show up in the listings, and some investors might be preparing for larger liquidations.
“It is a very big concern for real estate professionals,” he said. “They are asking what the impact will be if investors liquidate directly onto the market.”
But larger firms might not dump these houses on the market unless they have to. American Banker reported that Blackstone will likely cash out of Invitation Homes by spinning it off to the public, according to “bankers close to the Industry.”
After less than two years in this business, Ellington Management Group exited by selling its portfolio of 900 houses to American Homes 4 Rent for a 26% premium over cost, after giving up on its earlier idea of an IPO. In July, Beazer Pre-Owned Rental Homes had exited the business by selling its 1,300 houses to American Homes 4 Rent, at the time still flush with cash from its IPO a year earlier.
Such portfolio sales maintain the homes as rentals. But smaller firms are more likely to cash out by putting their houses on the market, Blomquist said. And they have already started the process.
Now the industry is fretting that liquidations by investors could unravel the easy Fed-engineered gains of the last few years. Sure, it would help first-time buyers and perhaps put a halt to the plunging home ownership rates in the US [The American Dream Dissipates at Record Pace].
But the industry wants prices to rise. Period.

When large landlords start putting thousands of homes up for sale, it could get messy. It would leave tenants scrambling to find alternatives, and some might get stranded. A forest of for-sale signs would re-pop up in the very neighborhoods that these landlords had targeted during the buying binge. Each wave of selling would have the reverse ratchet effect. And the industry’s dream of forever rising prices would be threatened.
“What kind of impact will these large investors have on our communities?” wondered Rep. Mark Takano, D-California, in an email to American Banker. He represents Riverside in the Inland Empire, east of Los Angeles. During the housing bust, home prices in the area plunged. But recently, they have re-soared to where Fitch now considers Riverside the third-most overvalued metropolitan area in the US. So Takano fretted that “large sell-offs by investors will weaken our housing recovery in the very same communities, like mine, that were decimated by the sub prime mortgage crisis.”
PE firms have tried to exit via IPOs – which kept these houses in the rental market.
Silver Bay Realty Trust went public in December 2012 at $18.50 a share. On Friday, shares closed at $16.16, down 12.6% from their IPO price.
American Residential Properties went public in May 2013 at $21 a share, a price not seen since. “Although people look at this as a new industry, there’s really nothing new about renting single-family homes,” CEO Stephen Schmitz told Bloomberg at the time. “What’s new is that it’s being aggregated, we’re introducing professional management and we’re raising institutional capital.” Shares closed at $17.34 on Friday, down 17.4% from their IPO price.
American Homes 4 Rent went public in August 2013 at $16 a share. On Friday, shares closed at $16.69, barely above their IPO price. These performances occurred during a euphoric stock market!
So exiting this “bet on America,” as Schwarzman had put it so eloquently, by selling overpriced shares to the public is getting complicated. No doubt, Blackstone, as omnipotent as it is, will be able to pull off the IPO of Invitation Homes, regardless of what kind of bath investors end up taking on it.
Lesser firms might not be so lucky. If they can’t find a buyer like American Homes 4 Rent that is publicly traded and doesn’t mind overpaying, they’ll have to exit by selling their houses into the market.
But there’s a difference between homeowners who live in their homes and investors: when homeowners sell, they usually buy another home to live in. Investors cash out of the market. This is what the industry dreads. Investors were quick to jump in and inflated prices. But if they liquidate their holdings at these high prices, regular folks might not materialize in large enough numbers to buy tens of thousands of perhaps run-down single-family homes. And then, getting out of the “bet on America” would turn into a real mess.
A Raw Deal for Real-Estate Agents
Real estate can be risky for agents themselves. Fickle buyers, unforeseen structural issues, setbacks in financing can all scuttle a deal.

THE COMMITMENT-PHOBE Known for repeatedly pulling out of the purchase right before the contract is signed. Illustration: Laszlito Kovacs
By Nancy Keates | Wall Street Journal, Feb. 19, 2015
She saw a ghost. That was the excuse, anyway, for one buyer’s decision to back out at the last minute from closing on a $1.4 million house in San Francisco, losing a roughly $21,000 deposit in the process.
Her real-estate agent, Amanda Jones of Sotheby’s International Realty, estimates she spent about 250 hours over six months showing the prospective buyer about 130 houses in the Bay Area. In the end, she believes the woman just changed her mind. “It was horrible,” the agent says.
Few professions demand as much upfront time and legwork with the risk of zero return on the effort as real-estate sales. Fickle buyers, unforeseen structural issues, setbacks in financing can all scuttle a sale. Now, there’s another common deal breaker: an overheated housing market in which frenzied bidding wars lead to rash decisions—followed by buyers’ remorse.
“It’s such a fast-paced market right now. Buyers are expected to make offers after seeing a place once at a packed house, so they don’t have time to think things through,” says Kaitlin Adams, an agent with New York-based Compass.

THE NERVOUS NELLIE Spends countless hours to find the perfect home, but backs out at the last minute, saying it just doesn’t ‘feel right.
Nationally, median home prices in 2014 rose to their highest level since 2007, while housing inventory continued to drop—falling 0.5% lower than a year ago, according to the National Association of Realtors. The percentage of buyers backing out of contracts has gone up by about 8%—to 19.1% in the third quarter of 2014 from 17.76% in the third quarter of 2012, according to Evercore ISI, an investment-banking advisory firm.
The war stories come mostly at the high end in select markets, where affluent buyers are less affected by the prospect of losing thousands in earnest money or down payments. Cormac O’Herlihy of Sotheby’s International Realty in Los Angeles recently had buyers he calls “nervous nellies” back out on a $6 million house. “They enjoy an overabundance of financial ability,” Mr. O’Herlihy says.
Julie Zelman, a New York-based agent with Engel & Völkers, spent the past year searching for an apartment for a recently divorced client in his 40s who said he wanted to move from Manhattan’s Upper East Side to a building downtown—preferably one populated by celebrities. Twice the client was about to close when he changed his mind: The first time was at a building called Soho Mews—he’d read it was the home of an Oscar-nominated actress and a Grammy-winning musician. The man offered $2.8 million for a two-bedroom unit but then backed out. Another time, he walked away after offering $3.1 million on a two-bedroom unit in 1 Morton Square, where a popular TV actress once lived.
“He was wasting everyone’s time. It was humiliating for me,” says Ms. Zelman, who thinks the client wasn’t mentally ready for such a big change. The client ended up renting an apartment on the Upper East Side.

THE FAULT FINDER Cites microscopic flaws to quash the deal—and get the earnest money back.
When buyers change their minds before signing a contract, they don’t lose any money. Nataly Rothschild, a New York-based broker, says she thought she had finally closed a deal after a couple’s yearlong house hunt. Because there were five other offers pending, her clients offered $200,000 over the almost $2 million asking price on the three-bedroom, three-bathroom listed for $1.8 million on Manhattan’s Upper East Side. Then Ms. Rothschild, an agent at Engel & Völkers, got a call from the couple’s attorney saying the buyer, who was nine months pregnant, had broken down in tears, saying she just couldn’t sign because it didn’t feel right. “I felt miserable for her,” says Ms. Rothschild. “But we were all shocked.”
Buyers who change their minds after signing a contract typically lose their earnest money, a deposit that shows the offer was made in good faith. That money is often held by the title company or in an escrow account and later applied to down payment and closing costs. If the deal falls through, whoever holds the deposit determines who gets the earnest money. In standard contracts, the earnest money goes to the seller. If, however, a contingency spelled out in the contract emerges—the buyer’s financing falls through, for example—the buyer usually gets the earnest money back.
Vivian Ducat, an agent with Halstead Property in New York, had a client lose $55,000 in earnest money after a change of heart on a $550,000 co-op. The woman, who was living in California, had wanted to buy a place in New York because one of her children was living there. At the last minute she balked, emailing that she “couldn’t handle the New York lifestyle.” She’d signed the contract and even filled out all the paperwork for the co-op board.

THE OVER BIDDER. Gets caught up in the frenzy of the bidding war, then realizes he didn’t mean to spend so much.
In rare instances, buyers can get their earnest money back through arbitration if they can prove a valid cause. Ms. Adams, the Compass agent, represented the sellers of a one-bedroom apartment in Brooklyn Heights that was listed for just under $600,000. When a bidding war with five offers ensued, the unit went for $70,000 above asking price to a couple from the West Coast who wanted to use it as a part-time residence. After the contract was signed, the building’s co-op board enacted a new rule that owners had to live in the building full time. As a result, the West Coast couple got their earnest money back, and the unit sold to another buyer at about $80,000 above the asking price.
Even if the real reason is simply buyer’s remorse, real-estate agents say buyers can get back earnest money as long as they can find some valid-sounding reason for dissatisfaction. Ms. Jones in San Francisco had clients withdraw an offer on a $1.1 million house. They’d been looking for two years and when the house came up the wife was traveling abroad; the husband said he was sure she would love it. Turns out the wife didn’t like it at all. The couple used the excuse of a leak found in the inspection process and got their $33,000 deposit back.
And about that ghost. A buyer who put down $43,000 in earnest money pulled out after a neighbor told them the previous owner had died in the home, among other things. The matter went into arbitration, and the potential buyer got the entire deposit back.
Ever since then, Ms. Jones says she has sellers disclose in their contracts the possibility that there might be a ghost. “You have to prepare for anything,” she says.
How The Baltic Dry Index Predicted 3 Market Crashes: Will It Do It Again?
Summary
- The BDI as a precursor to three different stock market corrections.
- Is it really causation or is it correlation?
- A look at the current level of the index as it hits new lows.
by Jonathan Fishman
The Baltic Dry Index, usually referred to as the BDI, is making historical lows in recent weeks, almost every week.
The index is a composition of four sub-indexes that follow shipping freight rates. Each of the four sub-indexes follows a different ship size category and the BDI mixes them all together to get a sense of global shipping freight rates.
The index follows dry bulk shipping rates, which represent the trade of various raw materials: iron, cement, copper, etc.
The main argument for looking at the Baltic Dry Index as an economic indicator is that end demand for those raw materials is tightly tied to economic activity. If demand for those raw materials is weak, one of the first places that will be evident is in shipping prices.
The supply of ships is not very flexible, so changes to the index are more likely to be caused by changes in demand.
Let’s first look at the three cases where the Baltic Dry Index predicted a stock market crash, as well as a recession.
1986 – The Baltic Dry Index Hits Its first All-time Low.
In late 1986, the newly formed BDI (which replaced an older index) hit its first all-time low.
Other than predicting the late 80s-early 90s recession itself, the index was a precursor to the 1987 stock market crash.
(click to enlarge)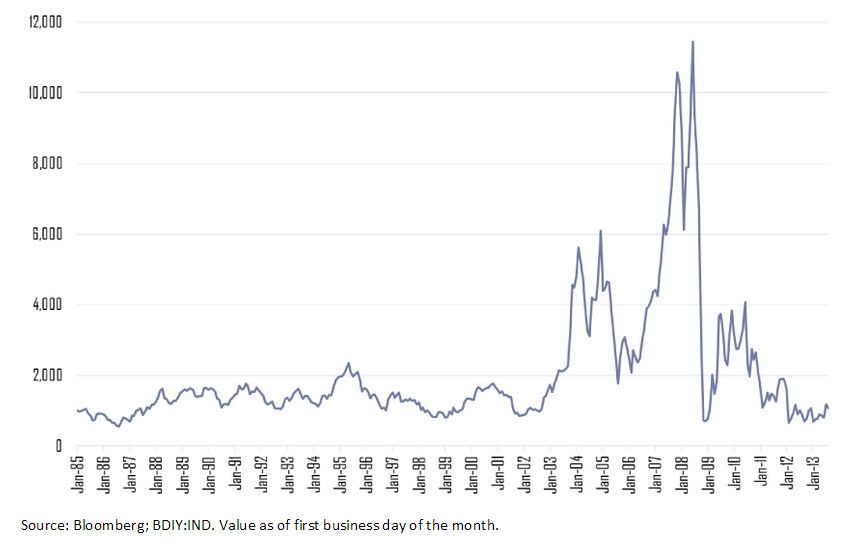
1999 – The Baltic Dry Index Takes a Dive
In 1999, the BDI hit a 12-year low. After a short recovery, it almost hit that low point again two years later. The index was predicting the recession of the early 2000s and the dot-com market crash.
(click to enlarge)
2008 – The Sharpest Decline in The History of the BDI
In 2008, the BDI almost hit its all-time low from 1986 in a free fall from around 11,000 points to around 780.
(click to enlarge)
You already know what happened next. The 2008 stock market crash and a long recession that many parts of the global economy is still trying to get out of.
Is It Real Causation?
One of the pitfalls that affects many investors is to confuse correlation and causation. Just because two metrics seem to behave in a certain relationship, doesn’t tell us if A caused B or vice versa.
When trying to navigate your portfolio ahead, correctly making the distinction between causation and correlation is crucial.
Without doing so, you can find yourself selling when there is no reason to, or buying when you should be selling.
So let’s think critically about the BDI.
Is it the BDI itself that predicts stock market crashes? Is it a magical omen of things to come?
My view is that no. The BDI is not sufficient to determine if a stock market crash is coming or not. That said, the index does tells us many important things about the global economy.
Each and every time the BDI hit its lows, it predicted a real-world recession. That is no surprise as the index follows a fundamental precursor, which is shipping rates. It’s very intuitive; as manufacturers see demand for end products start to slow down, they start to wind-down production and inventory, which immediately affects their orders for raw materials.
Manufacturers are the ultimate indicator to follow, because they are the ones that see end demand most closely and have the best sense of where it’s going.
But does an economic slowdown necessarily bring about a full-blown market crash?
Only if the stock market valuation is not reflecting that coming economic downturn. When these two conditions align, chances are a sharp market correction is around the corner.
2010-2015 – The BDI Hits All-time Low, Again
In recent weeks, the BDI has hit an all-time low that is even lower than the 1986 low point. That comes after a few years of depressed prices.
(click to enlarge)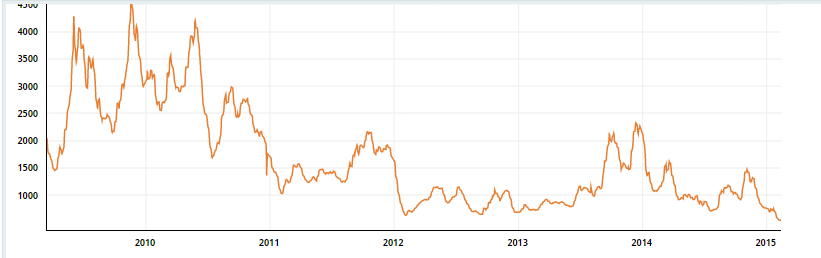
Source: Bloomberg
What does that tell us?
- The global economy, excluding the U.S., is still struggling. Numerous signs for that are the strengthening dollar, the crisis in Russia and Eastern Europe, a slowdown in China, and new uncertainties concerning Greece.
- The U.S. is almost the sole bright spot in the landscape of the global economy, although it’s starting to be affected by the global turmoil. A strong dollar hits exporters and lower oil prices hit the American oil industry hard.
Looking at stock prices, we are at the peak of a 6-year long bull market, although earnings seem to be at all-time highs as well.
(click to enlarge)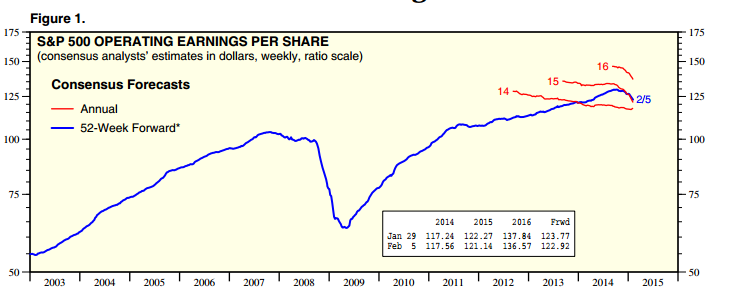
Source: Yardeni
What the BDI might tell us is that the disconnect between the global economy’s struggle and great American business performance across the board might be coming to an end.
More than that, China could be a significant reason for why the index has taken such a dive, as serious slowdowns on the real-estate market in China and tremendous real estate inventory accumulation are disrupting the imports of steel, cement and other raw materials.
Conclusion
The BDI tells us that a global economic slowdown is well underway. The source of that downturn seems to be outside of the U.S., and is more concentrated in China and the E.U.
The performance of the U.S. economy can’t be disconnected from the global economy for too long.
The BDI is a precursor for recessions, not stock market crashes. It’s not a sufficient condition to base a decision upon, but it’s one you can’t afford to ignore.
Going forward, this is a time to make sure you know the companies you invest in inside and out, and make sure end demand for their products is bound for continued growth and success despite overall headwinds.
We Live In An Era Of Dangerous Imbalances
by Tyler Durden
The intervention by the world’s central banks has resulted in today’s bizarro financial markets, where “bad news is good” because it may lead to more (sorry, moar) thin-air stimulus to goose asset prices even higher.
The result is a world addicted to debt and the phony stimulus now essential to sustaining it. In the process, a tremendous wealth gap has been created, one still expanding at an exponential rate.
History is very clear what happens with dangerous imbalances like this. They correct painfully. Through class warfare. Through currency crises. Through wealth destruction.
Is that really the path we want? Because we’re for sure headed for it.
OPEC Can’t Kill American Shale
 by Shareholdersunite
Summary
- OPEC is supposedly out to beat, or at least curtail the growth of American shale oil production.
- For a host of reasons, especially the much shorter capex cycle for shale, they will not succeed unless they are willing to accept permanent low oil prices.
- But, permanent low oil prices will do too much damage to OPEC economies for this to be a credible threat.
We’re sure by now you are familiar with the main narrative behind the oil price crash. First, while oil production outside of North America is basically stagnant since 2005.

The shale revolution has dramatically increased supply in America.
(click to enlarge)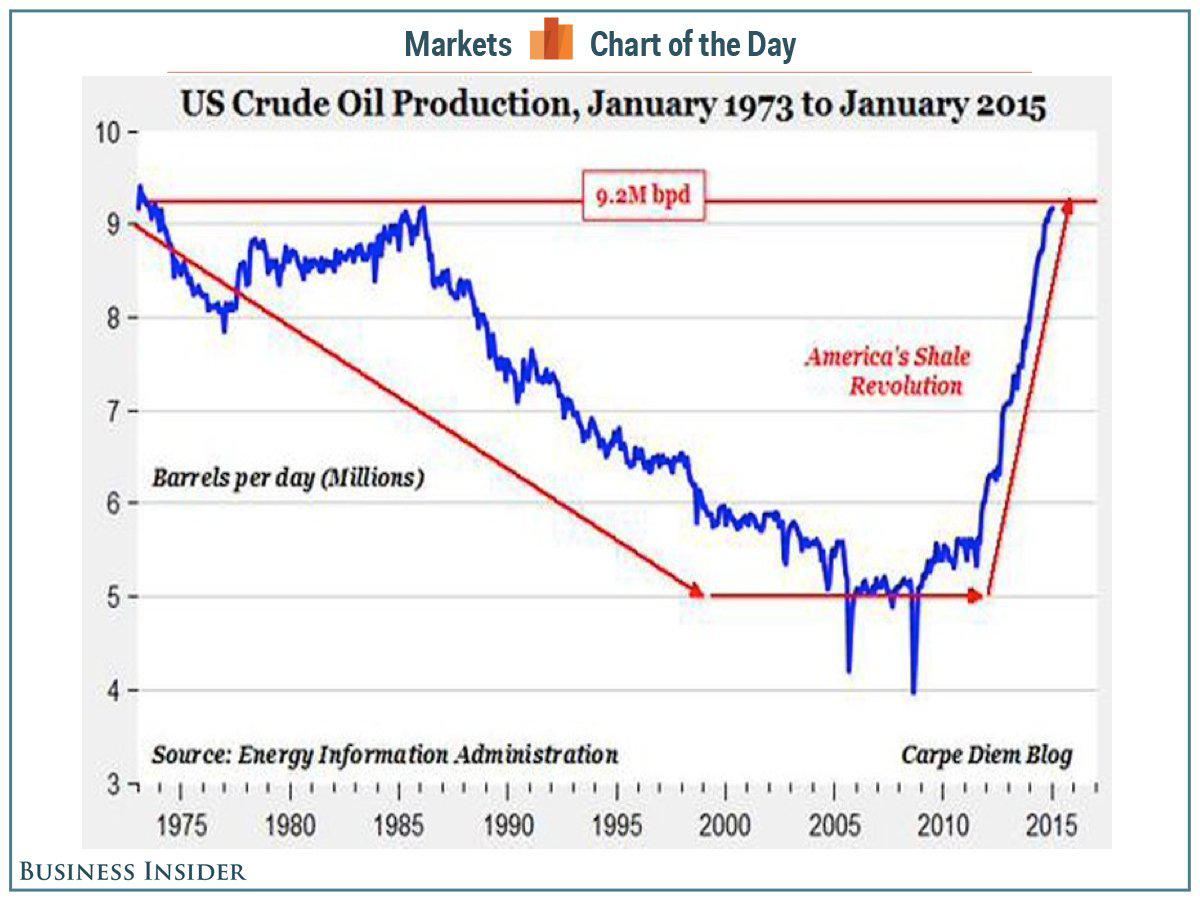
The resulting oversupply has threatened OPEC and the de-facto leader Saudi Arabia has chosen a confrontational strategy not to make way for the new kid on the block, but instead trying to crush, or at least contain it. Can they achieve this aim, provided it indeed is their aim?
Breakeven price
At first, one is inclined to say yes, for the simple reason that Saudi (and most OPEC) oil is significantly cheaper to get out of the ground.
(click to enlarge)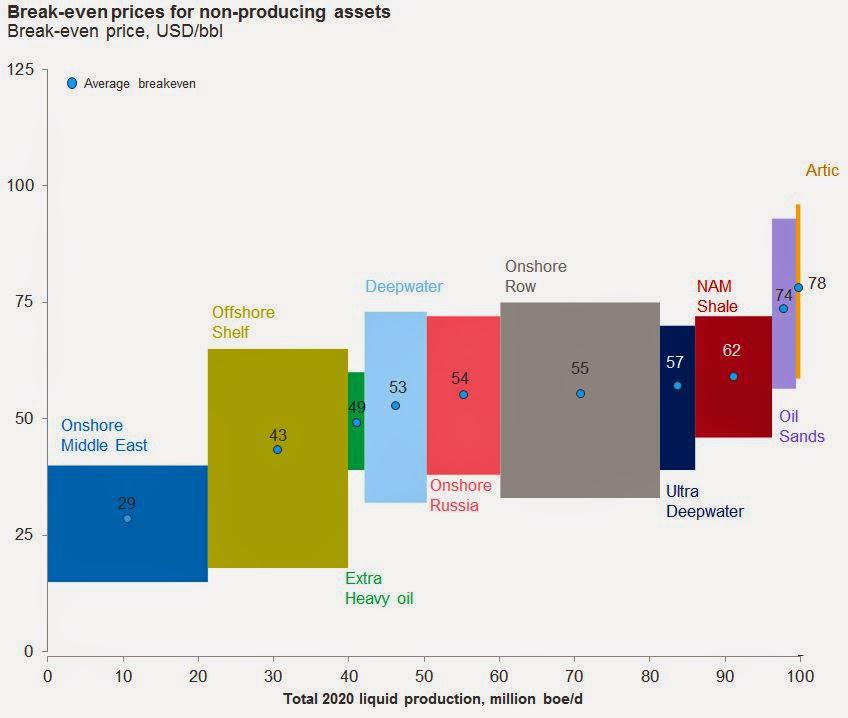
This suggests that all OPEC has to do is to keep output high and sooner or later the oversupply will work itself off the market, and expensive oil is more likely to see cutbacks than cheaper oil, although this critically depends on incentives facing individual producers.
Capex decline
It is therefore no wonder that we’ve seen significant declines in rig counts and numerous companies have announced considerable capex declines. While this needs time to work out into supply cutbacks, these will eventually come.

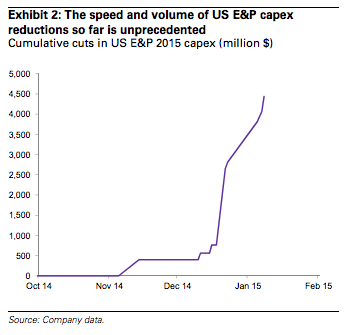
For instance BP (NYSE:BP) cutting capex from $22.9B in 2014 to $20B in 2015, or Conoco (NYSE:COP) reducing expenditures by more than 30% to $11.5B this year on drilling projects from Colorado to Indonesia. There are even companies, like SandRidge (NYSE:SD), that are shutting 75% of their rigs.
Leverage
It is often argued that the significant leverage of many American shale companies could accelerate the decline, although it doesn’t necessarily have to be like that.
While many leveraged companies will make sharp cutbacks in spending, which has a relatively rapid effect on production (see below), others have strong incentives to generate as much income as possible, so they might keep producing.
Even the companies that go belly up under a weight of leverage will be forced to relinquish their licenses or sell them off at pennies to the dollar, significantly lowering the fixed cost for new producers to take their place.
Hedging
Many shale companies have actually hedged much of their production, so they are shielded from much of the downside (at a cost) at least for some time. And they keep doing this:
Rather than wait for their price insurance to run out, many companies are racing to revamp their policies, cashing in well-placed hedges to increase the number of future barrels hedged, according to industry consultants, bankers and analysts familiar with the deals. [Reuters]
Economics
Being expensive is not necessarily a sufficient reason for being first in line for production cuts. For instance, we know that oil from the Canadian tar sands is at the high end of cost, but simple economics can explain why production cuts are unlikely for quite some time to come.
The tar sands involve a much higher fraction as fixed cost:
Oil-sands projects are multibillion-dollar investments made upfront to allow many years of output, unlike competing U.S. shale wells that require constant injections of capital. It’s future expansion that’s at risk. “Once you start a project it’s like a freight train: you can’t stop it,” said Laura Lau, a Toronto-based portfolio manager at Brompton Funds. Current oil prices will have producers considering “whether they want to sanction a new one.” [Worldoil]
So, once these up-front costs are made, these are basically sunk, and production will only decline if price falls below marginal cost. As long as the oil price stays above that, companies can still recoup part of their fixed (sunk) cost and they have no incentive to cut back production.
But, of course, you have tar sand companies that have not yet invested all required up-front capital and new capex expenditures will be discouraged with low oil prices. So, there is still the usual economic upward sloping supply curve operative here.
Swing producer
The funny thing is American shale oil is at the opposite end of this fixed (and sunk) cost universe, apart from acquiring the licenses. As wells have steep decline curves, production needs constant injection of capital for developing new wells.
Production can therefore be wound down pretty quickly should the economics require, and it can also be wound back up relatively quickly, which we think is enough reason why American shale is becoming the new (passive) swing producer. This has very important implications:
- The relevant oil price to look at isn’t necessarily the spot price, but the 12-24 months future price, the time frame between capex and production.
- OPEC will not only need to produce a low oil price today, that price needs to be low for a prolonged period of time in order to see cutbacks in production of American shale oil. Basically, OPEC needs the present oil price to continue indefinitely, as soon as it allows the price to rise again, shale oil capex will rebound and production will increase fairly soon afterwards.
So basically, shale is the proverbial toy duck which OPEC needs to submerge in the bathtub, but as soon as it releases the pressure, the duck will emerge again.
Declining cost curves
The shale revolution caught many by surprise, especially the speed of the increase in production. While technology and learning curves are still improving, witness how production cost curves have been pushed out in the last years:

There is little reason this advancement will come to a sudden halt, even if capex is winding down. In fact, some observers are arguing that producers shift production from marginal fields to fields with better production economics, and the relatively steep production decline curves allow them to make this shift pretty rapidly.
Others point out that even the rapid decline in rig count will not have an immediate impact on production, as the proportion of horizontal wells and platforms where multiple wells are drilled from the same location are increasing, all of which is increasing output per rig.
Another shift that is going on is to re-frack existing wells, instead of new wells. The first is significantly cheaper:
Beset by falling prices, the oil industry is looking at about 50,000 existing wells in the U.S. that may be candidates for a second wave of fracking, using techniques that didn’t exist when they were first drilled. New wells can cost as much as $8 million, while re-fracking costs about $2 million, significant savings when the price of crude is hovering close to $50 a barrel, according to Halliburton Co., the world’s biggest provider of hydraulic fracturing services. [Bloomberg]
Production cuts will take time
The hedging and shift to fields with better economics is only a few of the reasons why so far there has been little in the way of actual production cuts in American shale production, the overall oil market still remains close to record oversupply. The International Energy Agency (IEA) argues:
It is not unusual in a market correction for such a gap to emerge between market expectations and current trends. Such is the cyclical nature of the oil market that the full physical impact of demand and supply responses can take months, if not years, to be felt [CNBC].
In fact, the IEA also has explicit expectations for American shale oil itself:
The United States will remain the world’s top source of oil supply growth up to 2020, even after the recent collapse in prices, the International Energy Agency said, defying expectations of a more dramatic slowdown in shale growth [Yahoo].
OPEC vulnerable itself
Basically, the picture we’re painting above is that American shale will be remarkably resilient. Yes, individual companies will struggle, sharp cutbacks in capex are already underway, and some companies will go under, but the basic fact is that as quick as capex and production can fall, they can rise as quickly again when the oil price recovers.
How much of OPEC can the storm of the oil price crash, very much remains to be seen. There is pain all around, which isn’t surprising as one considers that most OPEC countries have budgeted for much higher oil prices for their public finances.
(click to enlarge)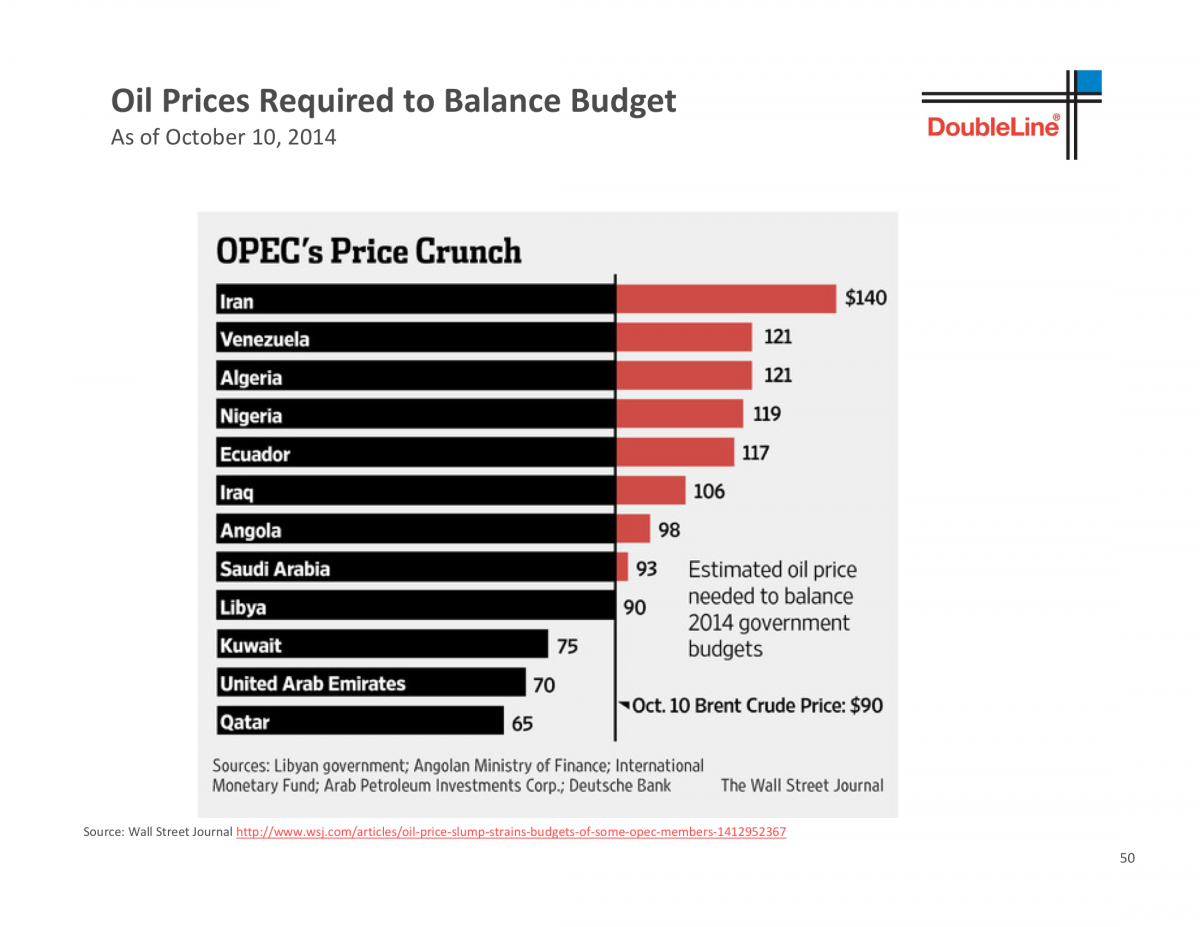
You’ll notice that these prices are all significantly, sometimes dramatically, higher than what’s needed to balance their budgets. Now, many of these countries also have very generous energy subsidies on domestic oil use, supposedly to share the benefits of their resource wealth (and/or provide industry with a cost advantage).
So, there is a buffer as these subsidies can be wound down relatively painless. Some of these countries also have other buffers, like sovereign wealth funds or foreign currency reserves. And there is often no immediate reason for public budgets to be balanced.
But to suggest, as this article is doing, that OPEC is winning the war is short-sighted.
Conclusion
While doing damage to individual American shale oil producers and limiting its expansion, the simple reality is that for a host of reasons discussed above, OPEC can’t beat American shale oil production unless it is willing to accept $40 oil indefinitely. While some OPEC countries might still produce profitably at these levels, the damage to all OPEC economies will be immense, so, we can’t really see this as a realistic scenario in any way.
Global Capital Will Continue to Flow into Real Estate in 2015

By Michael Gerrity
According to LaSalle Investment Management’s new 2015 Investment Strategy Annual (ISA) report, money will continue to flow into real estate from across the capital markets worldwide, but investors should be increasingly concerned about getting caught late in the cycle and should anticipate the next cyclical downturn in a few years.
ISA report states that different regions of the world will be growing at different speeds in 2015, investors need to prepare their portfolios for world where interest rates begin to rise more quickly in some parts than others.
Jacques Gordon, LaSalle’s Global Head of Research and Strategy said, “Where we are in the real estate cycle is one of the most commonly asked questions of real estate investment managers and with good reason. Investors are concerned about what might happen if capital markets turn away from property. Timing strategies are difficult to apply to a relatively illiquid asset class like real estate. Nevertheless, adjusting portfolios as assets and markets move through their respective cycles can improve performance by enhancing returns and reducing risk.”ISA Investor Advice Includes:
- Diversify their holdings across a number of countries that are in different stages of the capital market cycle.
- Anticipate different interest rate environments by allocating to real estate assets with income streams that keep pace with rising inflation or debt costs in growing economies like the U.K or the U.S. Also, focus on high quality properties and locations in markets where growth/interest rates will stay “lower for longer”, such as Japan or Western Europe.
- Invest in secular trends, rather than cyclical ones, that will be less exposed to a downturn. The ISA found that investments linked to Demographics, Technology and Urbanization (DTU) – first identified last year – are likely to be key in helping investors to identify such trends.
- Continue to place a high emphasis on sustainability factors, like energy efficiency and recycling, when buying, improving and operating buildings. Tenants and the capital markets will be paying much more attention to environmental standards in the years ahead.
Gordon also noted that markets around the world are at very different stages in terms of market fundamentals and capital markets, and hence future performance. Thus, it makes sense to have an investment program that takes advantage of real estate cycles. Examples of cycle-sensitive strategies include: Harvesting gains and selling properties in frothy capital markets, taking advantage of higher levels of leasing/rental growth in growth markets, and focusing on locations/sectors that are positioned to qualify as mainstream “core” assets in a few years.
Other themes for 2015 identified by the ISA include:
- Money is likely to continue to flow into real estate as long as the yields on property continue to offer a premium to investment-grade bonds.
- The debt markets are also embracing real estate, although lending is not yet as aggressive as it was during the peak of the credit bubble.
- Taken together, this is likely to keep pushing prices up, while continuing to lower the expected future returns on real estate.
- It could also lead to an escalation in new development. After many years of low levels of new construction in nearly all G-20 countries, most major markets can easily absorb moderate additions to inventory without creating an oversupply problem.
Key Trends in The United States
Overall, North America is in a good position for 2015 with healthy real estate markets and economic growth. Despite global headwinds, the U.S. economy and real estate markets will improve at a faster pace over the next three years, a welcome trend after five years of below average recovery. Capital flows to real estate will remain very strong next year, with overall real estate transaction levels close to or surpassing the pre-recession peak. Both equity and debt will be plentiful, and lenders will become increasingly aggressive in deploying capital.
In addition, occupancy rates will continue to improve for industrial, retail and most notably office in 2015. However, occupancy rates will be stable in the apartment sector as new supply matches demand, while rental rates in select markets such as San Francisco, New York City and Portland will outpace the national average.
The Investment Strategy Annual also predicts that many firms will be willing to pay higher rents in 2015 for properties located in Central Business Districts, because these locations greatly improve the ability to recruit talented Millennials. Moreover, E-commerce will continue to take market share in the retail sector, although new fashion trends, convenience, services, and out-of-home dining will keep the best shopping centers full and able to raise rents. Urban retail will continue to outperform due to strong tenant demand and little new supply.
Key Trends in Canada
The Investment Strategy Annual predicts that Canada’s near-term economic growth in 2015 will trail the United States, yet remain ahead of most other G7 countries. While slower global growth could impact demand in Canada’s resources sector, improvement in the U.S. economy will benefit Canada in the form of stronger export volumes in 2015 and beyond. Private consumption is forecast to grow more slowly in 2015 given elevated housing prices and high household debt levels. Stronger business investment and government expenditures should partially offset this.
Growth in the Alberta oil sands will slow in 2015 as oil prices face downward pressure and U.S. production escalates. However, traditional oil and gas drilling is re-emerging as fracking technology improves and pipeline expansion delays have been alleviated by significant growth in rail transport. Consequently, economic growth and real estate demand in cities in Western Canada will continue to outpace the nation.
In addition, e-commerce adoption will continue to grow as a share of overall retail trade and drive further changes among retailers and distribution chains in Canada. Retailers with a proven, established e-commerce platform will grow at the expense of those with less efficient or no models.
Key Trends in Mexico
Given its close links to the U.S., Mexico’s economy should outperform many other emerging markets in 2015 and beyond. Economic growth should accelerate in 2015, led by export-oriented manufacturing. In addition, the negative effects of the 2014 tax reforms will fade out and the government will implement a more expansive fiscal policy for large infrastructure projects.
Falling Oil Prices Threaten Houston Building Boom
One-Sixth of U.S. Office Space Under Construction Is Here, but Need Is Waning
 Construction giant Skanska AB is developing two office buildings in Houston’s “Energy Corridor.” The one that is nearly complete is mostly leased; the other building doesn’t yet have any tenants. Photo: Michael Stravato for Wall Street Journal. Article by Eliot Brown
HOUSTON—The jagged skyline of this oil-rich city is poised to be the latest victim of falling crude prices.
As the energy sector boomed in recent years, developers flocked to Houston, so much so that one-sixth of all the office space under construction in the entire U.S. is in the metropolitan area of the Texas city.
But now, the need for more offices is drying up, thanks to a drop in oil prices that has spun energy companies from an outlook of optimism and growth to anxiety and cutbacks. Oil prices have fallen by more than 50% since June.
Demand for office space is “going to basically stop,” said Walter Page, director of office research at property data firm CoStar Group Inc. “It hurts a lot more when you have a lot of construction.”
By the end of 2014, construction had started on about 80 buildings with about 18 million square feet of office space in the greater Houston area, according to CoStar. Many of the buildings were planned or started when oil was above $100 a barrel. On Tuesday, oil futures traded around $50. The amount under construction is equal to Kansas City, Mo.’s entire downtown office market and is 16% of all U.S. office development under way.
The rush of building has created thousands of jobs—not only at building sites, but also at window manufacturers, concrete companies and restaurants that feed the workers.
But just as the wave of office-space supply approaches, energy companies, including Halliburton Co. , Baker Hughes Inc., Weatherford International and BP PLC, have collectively announced that more than 23,000 jobs would be cut, with many of them expected to be in Houston.
Fewer workers, of course, means less need for office space. Employers have rushed to sublease space in recent months, with 5.2 million square feet of space on the market as of last month, up about 1 million square feet from mid-2014, according to brokerage firm Savills Studley. BP, for example, is trying to sublet 240,000 square feet of space at its campus in the Westlake neighborhood, which represents about 11% of BP’s space at the campus, according to CoStar. A BP spokesman said the company is “consolidating” its footprint.
Conditions could improve if oil prices rise. The International Energy Agency on Tuesday said oil companies’ recent cutbacks in production will likely slow the growth of U.S. oil output, which in turn would lead to a rebound in prices.
But the current building boom is Houston’s biggest since the 1980s, when an oil bust, coupled with a rash of empty skyscrapers, made Houston a national symbol of overbuilding. Then, armed with debt from a banking sector eager to lend, developers brought a tidal wave of building to Houston, in some years increasing the office stock by well over 10%. Vacancy rates shot up past 30% from single digits, property values plummeted and landlords defaulted on mortgages.
That contributed to a wave of failures for banks stuffed with commercial-property loans. More than 425 Texas institutions between 1980 and 1989 failed, including nine of the state’s 10 largest banks.
Few are predicting a shock near that scale this time. Even if oil prices stay low, the local economy is more diversified than in the 1980s with sectors such as health care and higher education comprising a larger share of the workforce. In addition, new construction represents about 6.3% all the area’s total office stock, and there is far less speculative construction done before a tenant is signed up.
“Everybody here in Houston is waiting to exhale,” said Michael Scheurich, chief executive of general contractor Arch-Con Corp., which currently is building two midsize office projects in the area. Mr. Scheurich said his company has grown to about 80 employees from fewer than 25 in 2011 amid the construction boom. Now he is hoping the local economy will have “a soft landing.”
Still, cranes abound throughout Houston, thanks to publicly traded real-estate companies, pension funds and other interests like Swedish construction giant Skanska AB, which are funding construction without as much reliance on debt as in the 1980s.
‘Everybody here in Houston is waiting to exhale.’

Running west from the downtown along Interstate 10, numerous midsize construction projects aimed at the “upstream” companies focused on energy extraction are being built in the so-called Energy Corridor.
Analysts say this shows how the sector is highly susceptible to booms and busts because of the long lag time between when buildings are started and when they are delivered, compounded by the tendency of developers and financiers to start projects en masse, late in cycles.
Developers are often victims of “herding and group think,” said Rachel Weber, an urban planning professor at the University of Illinois at Chicago who is writing a book about office over development in Chicago. “There is a sense that if everybody is moving in the same direction and acting the same way, that you do better to mimic that kind of behavior.”
Many of those building are bracing for a sting in the short-term. It could be even more painful if oil prices stay low.
It “is going to be a soft year—it’s hard not to see that,” said Mike Mair, an executive vice president in charge of Houston-area development for Skanska. The company is putting the finishing touches on a new 12-story tower in the Energy Corridor that is 62% leased. Construction is under way on a nearly identical building next door for which it doesn’t have any tenants.
Still, Mr. Mair said he believes in the city’s economic strength in the mid- and long-term, giving him confidence to finish work on the second tower. “I’m not afraid of ’16 and ’17,” he said.
Of course, higher vacancy rates would mean lower rents, which is good for anyone signing a lease. Rents at top-quality buildings averaged $34.51 a square foot at the end of 2014, up about 15% from early 2012, according to CoStar. But brokers say landlord incentives have grown, and rents typically follow the direction of oil prices, with a lag of one or two quarters. Still, the rents are a bargain compared with other major cities such as New York, where top-quality offices rent for an average $59 a square foot.
The city of Houston, for one, could be a beneficiary of lower rents. The government had been planning to build a new police department headquarters at an estimated cost of between $750 million and $1 billion.
Late last month, the mayor’s office said it was examining the possibility of leasing the building that Exxon Mobil is leaving, which would cost far less than the city’s original plan.
Oil Glut Gets Worse – Production, Inventories Soar to Record
 by Wolf Richter
February 4th, 2015: Crude oil had rallied 20% in three days, with West Texas Intermediate jumping $9 a barrel since Friday morning, from $44.51 a barrel to $53.56 at its peak on Tuesday. “Bull market” was what we read Tuesday night. The trigger had been the Baker Hughes report of active rigs drilling for oil in the US, which had plummeted by the most ever during the latest week. It caused a bout of short covering that accelerated the gains. It was a truly phenomenal rally!
But the weekly rig count hasn’t dropped nearly enough to make a dent into production. It’s down 24% from its peak in October. During the last oil bust, it had dropped 60%. It’s way too soon to tell what impact it will have because for now, production of oil is still rising.
And that phenomenal three-day 20% rally imploded today when it came in contact with another reality: rising production, slack demand, and soaring crude oil inventories in the US.
The Energy Information Administration reported that these inventories (excluding the Strategic Petroleum Reserve) rose by another 6.3 million barrels last week to 413.1 million barrels – the highest level in the weekly data going back to 1982. Note the increasingly scary upward trajectory that is making a mockery of the 5-year range and seasonal fluctuations:

And there is still no respite in sight.
Oil production in the US is still increasing and now runs at a multi-decade high of 9.2 million barrels a day. But demand for petroleum products, such as gasoline, dropped last week, according to the EIA, and so gasoline inventories jumped by 2.3 million barrels. Disappointed analysts, who’d hoped for a drop of 300,000 barrels, blamed the winter weather in the East that had kept people from driving (though in California, the weather has been gorgeous). And inventories of distillate, such as heating oil and diesel, rose by 1.8 million barrels. Analysts had hoped for a drop of 2.2 million barrels.
In response to this ugly data, WTI plunged $4.50 per barrel, or 8.5%, to $48.54 as I’m writing this. It gave up half of the phenomenal three-day rally in a single day.
Macquarie Research explained it this way:
In our experience, oil markets rarely exhibit V-shaped recoveries and we would be surprised if an oversupply situation as severe as the current one was resolved this soon. In fact, our balances indicate the absolute oversupply is set to become more severe heading into 2Q15.
Those hoping for a quick end to the oil glut in the US, and elsewhere in the world, may be disappointed because there is another principle at work – and that principle has already kicked in.
As the price has crashed, oil companies aren’t going to just exit the industry. Producing oil is what they do, and they’re not going to switch to selling diapers online. They’re going to continue to produce oil, and in order to survive in this brutal pricing environment, they have to adjust in a myriad ways.
“Efficiency and innovation, when price falls, it accelerates, because necessity is the mother of invention,” Michael Masters, CEO of Masters Capital Management, explained to FT Alphaville on Monday, in the middle of the three-day rally. “Even if the investment only spits out quarters, or even nickels, you don’t turn it off.”
Crude has been overvalued for over five years, he said. “Whenever the return on capital is in the high double digits, that’s not sustainable in nature.” And the industry has gotten fat during those years.
Now, the fat is getting trimmed off. To survive, companies are cutting operating costs and capital expenditures, and they’re shifting the remaining funds to the most productive plays, and they’re pushing 20% or even 30% price concessions on their suppliers, and the damage spreads in all directions, but they’ll keep producing oil, maybe more of it than before, but more efficiently.
This is where American firms excel: using ingenuity to survive. The exploration and production sector has been through this before. And those whose debts overwhelm them – and there will be a slew of them – will default and restructure, wiping out stockholders and perhaps junior debt holders, and those who hold the senior debt will own the company, minus much of the debt. The groundwork is already being done, as private equity firms and hedge funds offer credit to teetering oil companies at exorbitant rates, with an eye on the assets in case of default.
And these restructured companies will continue to produce oil, even if the price drops further.
So Masters said that, “in our view, production will not decrease but increase,” and that increased production “will be around a lot longer than people are forecasting right now.”
After the industry goes through its adjustment process, focused on running highly efficient operations, it can still scrape by with oil at $45 a barrel, he estimated, which would keep production flowing and the glut intact. And the market has to appreciate that possibility.
Rigs Down By 21% Since Start Of 2015
Permian Basin loses 37 rigs first week in February
by Trevor Hawes
The number of rigs exploring for oil and natural gas in the Permian Basin fell 37 this week to 417, according to the weekly rotary rig count released Friday by Houston-based oilfield service company Baker Hughes.
This week’s count marked the ninth-consecutive decrease for the Permian Basin. The last time Baker Hughes reported a positive rig-count change was Dec. 5, when 568 rigs were reported. Since then, the Permian Basin has shed 151 rigs, a decrease of 26.58 percent.
For the year, the Permian Basin has shed 113 rigs, or 21.32 percent.
In District 8, which includes Midland and Ector counties, the rig count fell 19 this week to 256. District 8 has shed 58 rigs, 18.47 percent, this year.
Texas lost 41 rigs this week for a statewide total of 654. The Lone Star State has 186 fewer rigs since the beginning of the year, a decrease of 22.14 percent.
In other major Texas basins, there were 168 rigs in the Eagle Ford, down 10; 43 in the Haynesville, unchanged; 39 in the Granite Wash, down one; and 19 in the Barnett, unchanged.
The Haynesville shale is the only major play in Texas to have added rigs this year. The East Texas play started 2015 with 40 rigs.
At this time last year, there were 483 rigs in the Permian Basin and 845 in Texas.
In the U.S., there were 1,456 rigs this week, a decrease of 87. There were 1,140 oil rigs, down 83; 314 natural gas rigs, down five; and two rigs listed as miscellaneous, up one.
By trajectory, there were 233 vertical drilling rigs, down two; 1,088 horizontal drilling rigs, down 80; and 135 directional drilling rigs, down five.
The top five states by rig count this week were Texas; Oklahoma with 176, down seven; North Dakota with 132, down 11; Louisiana with 107, down one; and New Mexico with 78, down nine.
The top five basins were the Permian; the Eagle Ford; the Williston with 137, down 11; the Marcellus with 71, down four; and the Mississippian with 53, down one.
In the U.S., there were 1,397 rigs on land, down 85; nine in inland waters, down three; and 50 offshore, up one. There were 48 rigs in the Gulf of Mexico, up one.
Canada’s rig count fell 13 this week to 381. There were 184 oil rigs, down 16; 197 natural gas rigs, up three; and zero rigs listed as miscellaneous, unchanged. Canada had 621 rigs a year ago this week, a difference of 240 rigs compared to this week’s count.
The number of rigs exploring for oil and natural gas in the North America region, which includes the U.S. and Canada, fell 100 this week to 1,837. There were 2,392 rigs in North America last year.
Rigs worldwide
On Friday, Baker Hughes released its monthly international rig count for January. The worldwide total was 3,309 rigs. The U.S. ended January with 1,683 rigs, just more than half of all rigs worldwide.
The following are January’s rig counts by region, with the top three nations in each region in parentheses:
— Africa: 132 (Algeria: 97; Nigeria: 19; Angola: 14)
— Asia-Pacific: 232 (India: 108; Indonesia: 36; China offshore: 33)
— Europe: 128 (Turkey: 37; United Kingdom offshore: 15; Norway: 13)
— Latin America: 351 (Argentina: 106; Mexico: 69; Venezuela: 64)
— Middle East: 415 (Saudi Arabia: 119; Oman: 61; Iraq: 60)

Migrant oil worker and wife near Odessa, Texas 1937
Photographer: Dorothea Lange Created: May 1937 Location: Odessa, Texas
Call Number: LC-USF34-016932 Source: MRT.com
Millions of Boomerang Buyers Poised to Re-Enter Housing Market
 by WPJ
According to RealtyTrac, the first wave of 7.3 million homeowners who lost their home to foreclosure or short sale during the foreclosure crisis are now past the seven-year window they conservatively need to repair their credit and qualify to buy a home as we begin 2015.
In addition, more waves of these potential boomerang buyers will be moving past that seven-year window over the next eight years corresponding to the eight years of above-normal foreclosure activity from 2007 to 2014.

“The housing crisis certainly hit home the fact that home ownership is not for everyone, but those burned during the crisis should not immediately throw the baby out with the bathwater when it comes to their second chance at home ownership,” said Chris Pollinger, senior vice president of sales at First Team Real Estate, covering the Southern California market which has more than 260,000 potential boomerang buyers. “Home ownership done responsibly is still one of the best disciplined wealth-building strategies, and there is much more data available for home buyers than there was five years ago to help them make an informed decision about a home purchase.”
- Nearly 7.3 million potential boomerang buyers nationwide will be in a position to buy again from a credit repair perspective over the next eight years.
- Markets with the most potential boomerang buyers over the next eight years among metropolitan statistical areas with a population of at least 250,000.
- Markets with the highest rate of potential boomerang buyers as a percentage of total housing units over the next eight years among metro areas with at least 250,000 people.
- Markets most likely to see the boomerang buyers materialize are those where there are a high percentage of housing units lost to foreclosure but where current home prices are still affordable for median income earners and where the population of Gen Xers and Baby Boomers — the two generations most likely to be boomerang buyers — have held steady or increased during the Great Recession.
- There were 22 metros among those with at least 250,000 people where this trifecta of market conditions is in place, making these metros the most likely nationwide to see a large number of boomerang buyers materialize in 2015 and beyond.


Why The Energy Selloff Is So Dangerous To The US Economy

By Pam and Russ Martens:
Summary:
- The global economy is producing far to much supply of most things, chasing to-little-demand from cash strapped consumers.
- Prices of other industrial commodities are in steep decline.
- Billions of dollars in investment capital are “risk off”.
- An untold number of jobs spread across America are at risk.
Television pundits and business writers who are relentlessly pounding the table on how cheaper home heating oil and gas at the pump is going to provide a consumer windfall and ramp up economic activity have a simplistic view of how things work.
Oil-related companies in the U.S. now account for between 35 to 40 percent of all capital spending. Announcements of sharp cutbacks in capital spending and job reductions by these companies create big ripples, forcing related companies to trim their own budgets, revenue assumptions, and payrolls accordingly.
The announcements coming out of the oil patch are picking up steam and it’s not a pretty picture. Last week Schlumberger said it would eliminate 9,000 jobs, approximately 7 percent of its workforce, and trim capital spending by about $1 billion. Yesterday, Baker Hughes, the oilfield services company, announced 7,000 in job cuts, roughly 11 percent of its workforce, and expects the cuts to all come in the first quarter. Baker Hughes also announced a 20 percent reduction in capital spending. This morning, the BBC is reporting that BHP Billiton will cut 40 percent of its U.S. shale operations, reducing its number of rigs from 26 to 16 by the end of June.
When Big Oil cuts capital spending, we’re not talking about millions of dollars or even hundreds of millions of dollars; we’re talking billions. Last month, ConocoPhillips announced it had set its capital budget for 2015 at $13.5 billion, a reduction of 20 percent. Smaller players are also announcing serious cutbacks. Yesterday Bonanza Creek Energy said it would cut its capital spending by 36 to 38 percent.
Other big industrial companies in the U.S. are also impacted by the sharp slump in oil, which has shaved almost 60 percent off the price of crude in just six months. As the oil majors scale back, it reduces the need for steel pipes. U.S. Steel has announced that it will lay off approximately 750 workers at two of its pipe plants.
On January 15, the Federal Reserve Bank of Kansas City released a dire survey of what’s ahead in its “Fourth Quarter Energy Survey.” The survey found: “The future capital spending index fell sharply, from 40 to -59, as contacts expected oil prices to keep falling. Access to credit also weakened compared to the third quarter and a year ago. Credit availability was expected to tighten further in the first half of 2015.” About half of the survey respondents said they were planning to cut spending by more than 20 percent while about one quarter of respondents expect cuts of 10 to 20 percent.
The impact of all of this retrenchment is not going unnoticed by sophisticated stock investors, as reflected in the major U.S. stock indices. On days when there is a notable plunge in the price of crude, the markets are following in lockstep during intraday trading. Yes, the broader stock averages continued to set new highs during the early months of the crude oil price decline in 2014 but that was likely due to the happy talk coming out of the Fed. It is also useful to recall that the Dow Jones Industrial Average traveled from 12,000 to 13,000 between March and May 2008 before entering a plunge that would take it into the 6500 range by March 2009.
Both the Federal Open Market Committee (FOMC) and Fed Chair Janet Yellen have assessed the plunge in oil prices as not of long duration. The December 17, 2014 statement from the FOMC and Yellen in her press conference the same day, characterized the collapse in energy prices as “transitory.” The FOMC statement said: “The Committee expects inflation to rise gradually toward 2 percent as the labor market improves further and the transitory effects of lower energy prices and other factors dissipate.”
If oil were the only industrial commodity collapsing in price, the Fed’s view might be more credible. Iron ore slumped 47 percent in 2014; copper has slumped to prices last seen during the height of the financial crisis in 2009. Other industrial commodities are also in decline.
A slowdown in both U.S. and global economic activity is also consistent with global interest rates on sovereign debt hitting historic lows as deflation takes root in a growing number of our trading partners. Despite the persistent chatter from the Fed that it plans to hike rates at some point this year, the yield on the U.S. 10-year Treasury note, a closely watched indicator of future economic activity, has been falling instead of rising. The 10-year Treasury has moved from a yield of 3 percent in January of last year to a yield of 1.79 percent this morning.
All of these indicators point to a global economy with far too much supply and too little demand from cash-strapped consumers. These are conditions completely consistent with a report out this week from Oxfam, which found the following:
“In 2014, the richest 1% of people in the world owned 48% of global wealth, leaving just 52% to be shared between the other 99% of adults on the planet. Almost all of that 52% is owned by those included in the richest 20%, leaving just 5.5% for the remaining 80% of people in the world. If this trend continues of an increasing wealth share to the richest, the top 1% will have more wealth than the remaining 99% of people in just two years.”
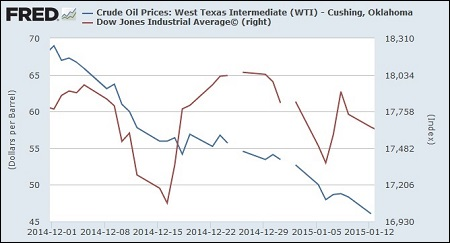
20 Stunning Facts About Energy Jobs In The US
 by Tyler Durden
For all those who think the upcoming carnage to the shale industry will be “contained” we refer to the following research report from the Manhattan Institute for Policy Research:
- The United States is now the world’s largest and fastest-growing producer of hydrocarbons. It has surpassed Saudi Arabia in combined oil and natural gas liquids output and has now surpassed Russia, formerly the top producer, in natural gas. [ZH: that’s about to change]
- The increased production of domestic hydrocarbons not only employs people directly but also radically reduces the drag on growth and job formation associated with America’s trade deficit.
- As the White House Council of Economic Advisers noted this past summer: “Every barrel of oil or cubic foot of gas that we produce at home instead of importing abroad means more jobs, faster growth, and a lower trade deficit.” [the focus now is not on the oil produced at home, which is set to plunge, but the consumer “tax cut” from plunging oil prices]
- Since 2003, more than 400,000 jobs have been created in the direct production of oil & gas and some 2 million more in indirect employment in industries such as transportation, construction, and information services associated with finding, transporting, and storing fuels from the new shale bounty.
- All told, about 10 million Americans are employed directly and indirectly in a broad range of businesses associated with hydrocarbons.
- There are 16 states with more than 150,000 people employed in hydrocarbon-related activities. Even New York, which continues to ban the production of shale oil & gas, is seeing job benefits in a range of support and service industries associated with shale development in adjacent Pennsylvania.

- Direct employment in the oil & gas industry had been declining for 30 years but has recently reversed course, with the availability of new technologies to develop shale fields. Nearly 300,000 direct oil & gas jobs have been created following the 2003 nadir in that sector’s direct employment.
- The five super-major oil companies—Exxon, BP, Chevron, Shell, Conoco—that operate in the U.S. account for only 10 percent of Americans working directly in the oil & gas business.
- Meanwhile, more than 20,000 other firms are directly involved in the oil & gas industry, and they produce over 75 percent of America’s oil & gas output. The median independent oil & gas firm has fewer than 15 employees. (Note that these data exclude gasoline stations, which employ nearly 1 million people and are overwhelmingly owned by individuals or small businesses.)
- As in the oil & gas industry, most Americans are employed by firms with fewer than 500 employees. Small businesses not only employ half of all American workers but also generate nearly half the nation’s economic output. Young firms tend to be small firms; and young firms tend to emerge disproportionately in areas of rapid growth or new opportunities—such as in and around America’s shale fields.

- A broad array of small and midsize oil & gas companies are propelling record economic and jobs gains—not just in the oil fields but across the economy. The enormous expansion in employment, exports, and tax revenues from the domestic oil & gas revolution is largely attributable to a core and defining feature of America: small businesses.
- The oil & gas sector boom creates “induced” and energy-related jobs. For every direct job, there are, on average, three jobs created in industries such as housing, retail, education, health care, food services, manufacturing, and construction.
- In the 10 states at the epicenter of oil & gas growth, overall statewide employment gains have greatly outpaced the national average. There we see the ripple-out effect on overall (not just oil & gas) employment. The shale boom’s broad jobs benefits are most visible in North Dakota and Texas, of course, where overall state employment growth in all sectors has vastly outpaced U.S. job recovery. Similarly, in the other states that have experienced recent growth in hydrocarbon production—notably, Pennsylvania, Colorado, Louisiana, Oklahoma, Wyoming—statewide overall (again, not just oil & gas) employment growth has also outpaced the U.S. recovery.
- In addition to the direct and induced jobs, America is beginning to see the economic and jobs impact of a renaissance in energy-intensive parts of the manufacturing sector, from plastics and chemicals to fertilizers. Examples include an Egyptian firm planning a $1 billion fertilizer plant in Iowa and a South Korean tire company with an $800 million plan for a Tennessee plant. Germany’s BASF recently announced expansion of its American investments, including production and research. BASF calculated that its German operations’ energy bill would be $700 million a year lower if it could pay American prices for energy
- The Marcellus shale fields in Pennsylvania were responsible for enabling statewide double-digit job growth in 2010 and 2011 and now account for more than one-fifth of that state’s manufacturing jobs. For every $1 that the Marcellus industry spends in the state, $1.90 of total economic output is generated.
- The typical wage effect of the oil & gas revolution is most clearly visible in Texas. In the 23 counties atop the Eagle Ford shale, average wages for all citizens have grown by 14.6 percent annually since 2005, compared with the 6.8 and 6.3 percent average for Texas and the U.S., respectively, over the same period. The top five counties in the Eagle Ford shale have experienced an average 63 percent annual rate of wage growth. These are the kinds of wage effects sought in every state and by every worker.

- Given the persistent, slow job recovery from the Great Recession, there could not be a more important time in modern history to find ways to foster more small businesses of all kinds, given that they are not only the core engine for growth but also frequently grow rapidly.

Punchline #1:
- The $300–$400 billion overall annual economic gain from the oil & gas boom has been greater than the average annual GDP growth of $200–$300 billion in recent years—in other words, the economy would have continued in recession if it were not for the unplanned expansion of the oil & gas sector.
Punchline #2:
- Hydrocarbon jobs have provided a greater single boost to the U.S. economy than any other sector, without requiring any special taxpayer subsidies—instead generating tax receipts from individual incomes and business growth.
And the final punchline:
- The National Association of Manufacturers estimated that the shale revolution will lead to 1 million manufacturing jobs over the coming decade. Manufacturing jobs pay nearly 30 percent more than the industrial average and generate $1.48 of economic activity for every $1 spent, making manufacturing the highest economic multiplier of all industrial sectors.
Sorry, not anymore.

Now, thanks to John Kerry’s “secret pact“, and America’s close “ally” in the middle-east, Saudi Arabia whose “mission” it no longer to bankrupt Russia but to crush America’s shale industry, the only question surround the only bright spot for America’s economy over the past 6 years is how long before most of the marginal producers file Chapter 11, or 7.
Texas: Recession In 2015?
 by Josh Young
Summary
- Texas is by far the largest producer of oil in the US.
- Oil production represents a disproportionate portion of Texas’s economy.
- With oil prices down 45%, oil’s share of Texas GDP may fall 50% or more.
- Unlike Russia and other countries, Texas cannot depreciate its own currency, magnifying the economic effect.
Texas is the largest oil producer in the US. And oil prices are down almost 50% in the past 4 months. Yet nowhere in the news do we hear about the risk of Texas entering a recession. The facts and figures below should concern investors in securities with economic exposure to the Texas economy. The risk is real.
As seen in the below chart by the EIA, Texas is the largest oil producing state in the US, producing 3x as much oil as the next largest producing state.

In September, Texas produced 3.23 million barrels of oil per day. This compares to 1.1 million barrels of oil per day produced in the second largest oil producing state, North Dakota, and much smaller quantities by other traditional oil producing states such as Alaska, California, and Oklahoma. And by comparison, Russia produces 10.9 million barrels per day.
Quantifying the value of this production, at $100 oil, that would be $323 million worth of oil produced per day, or $118 billion of oil produced per year. With the current price of oil hovering around $55 per barrel, that same oil production is only worth $178 million per day, or $65 billion. This is a loss of $53 billion of oil sales revenue just in the state of Texas.
This $53 billion in lost revenues compares to Texas’s GDP of $1.4 trillion in 2013 – it would be 3.8% of the State’s GDP, which is now “missing” due to oil prices having fallen. This is only the direct loss to the state – the indirect loss is likely several times as much. Direct oilfield activity is slowing down dramatically, as oil producing companies cut their capital expenditure budgets for 2015. Oilfield services stocks (NYSEARCA:OIH) are already down 37% from their peak earlier this year in anticipation of an activity slowdown. And for every job lost on a rig or in an oil company’s office, there are several additional jobs that may be lost, from the gas station manager to the sales clerk at a store to the front desk worker at a hotel.
The oil industry is unusual in that both the upstream independent producers and the service companies tend to outspend their cash flow, typically on local (to Texas) goods and services, on everything from drill pipe to rig manufacturing to catering. This means that for every dollar of lost oil sales from the lower oil price, there may be several dollars less spent across the Texas economy. This could be devastating for the Texas economy, and has not yet been widely discussed in the financial media.
To see an extreme example of the impact of lower oil prices on an economy tied to oil production, we can look at Russia (NYSEARCA:RSX). The Russian economy is more oil dependent than Texas’s. Russia’s GDP was $2.1 trillion in 2013. This compares to Texas’s GDP of $1.4 trillion. So Russia produces 3.3x as much oil as Texas, but only has 1.5x the GDP. So on a direct basis, assuming “ceteris paribus” conditions, a $1 decline in the price of oil would have 2.2x the impact to the economy of Russia as to the economy of Texas.
So what is happening in Russia? Already, the ruble has dropped in value by 50% in the past year. And numerous sources are calling for a severe recession in 2015. This would be expected, considering the high portion of the GDP that is attributable to oil production.
However, Russia has an advantage that Texas does not have. It has its own currency. While a 50% drop in a currency may not sound great if you’re looking to spend that currency elsewhere, it is crucial if you are an exporter and your primary export just dropped in price by 45%. The ruble denominated impact of the drop in the price of oil is a mere 10%. Unfortunately, for Texas, the dollar denominated drop in oil is 45%. So despite the lower economic exposure to oil, Texas does not have the benefit of a falling currency to buffer the blow of lower oil prices.
It may get even worse. With less drilling activity, oil production growth in Texas may slow, and eventually may decline. Depending on the speed of this slowdown, Texas could even see production decline by the end of 2015. This is because most of the new production has been coming from fracking unconventional wells, which can decline in production by as much as 80% in the first year. Production growth has required an increasing number of wells drilled, and has been funded with 100% of oil company cash flow along with hundreds of billions of dollars of equity and debt over the past few years. With the recent crash in oil stock prices (NYSEARCA: XOP) and in oil company bonds (NYSEARCA: JNK), oil drillers may be forced to spend within cash flow, and that cash flow will be down at least 45% in 2015 if the oil price stays on the path projected in the futures market.
All of this means that in 2015, Texas oil wells could be producing less than the 3.23 million barrels of oil per day it was producing in September 2014, and their owners could be receiving 45% less revenue per barrel produced. Again applying an economic multiplier, the results could be devastating. And without the cushion of a weak currency that benefits countries like Russia, it is hard to see how Texas could avoid a recession in 2015 if the price of oil stays near its current low levels.
“Houston, You Have A Problem” – Texas Is Headed For A Recession Due To Oil Crash, JPM Warns

by Tyler Durden
It was back in August 2013, when there was nothing but clear skies ahead of the US shale industry that we asked “How Much Is Oil Supporting U.S. Employment Gains?” The answer we gave:
The American Petroleum Institute said last week the U.S. oil and natural gas sector was an engine driving job growth. Eight percent of the U.S. economy is supported by the energy sector, the industry’s lobbying group said, up from the 7.7 percent recorded the last time the API examined the issue. The employment assessment came as the Energy Department said oil and gas production continued to make gains across the board. With the right energy policies in place, API said the economy could grow even more. But with oil and gas production already at record levels, the narrative over the jobs prospects may be failing on its own accord…. The API’s report said each of the direct jobs in the oil and natural gas industry translated to 2.8 jobs in other sectors of the U.S. economy. That in turn translates to a total impact on U.S. gross domestic product of $1.2 trillion, the study found.
Two weeks ago we followed up with an article looking at “Jobs: Shale States vs Non-Shale States” in which we showed the following chart:
And added the following:
According to a new study, investments in oil and gas exploration and production generate substantial economic gains, as well as other benefits such as increased energy independence. The Perryman Group estimates that the industry as a whole generates an economic stimulus of almost $1.2 trillion in gross product each year, as well as more than 9.3 million permanent jobs across the nation.
The ripple effects are everywhere. If you think about the role of oil in your life, it is not only the primary source of many of our fuels, but is also critical to our lubricants, chemicals, synthetic fibers, pharmaceuticals, plastics, and many other items we come into contact with every day. The industry supports almost 1.3 million jobs in manufacturing alone and is responsible for almost $1.2 trillion in annual gross domestic product. If you think about the law, accounting, and engineering firms that serve the industry, the pipe, drilling equipment, and other manufactured goods that it requires, and the large payrolls and their effects on consumer spending, you will begin to get a picture of the enormity of the industry.

Another way of visualizing the impact of the shale industry on the US economy comes courtesy of this chart from the Manhattan Institute which really needs no commentary:

The Institute had this commentary to add:
The jobs recovery since the 2008 recession has been the slowest of any post recession recovery in the U.S. since World War II. The number of people employed has yet to return to the 2007 level. The country has suffered a deeper and longer-lasting period of job loss than has followed any of the ten other recessions since 1945.
There has, however, been one employment bright spot: jobs in America’s oil & gas sector and related industries. Since 2003, more than 400,000 jobs have been created in the direct production of oil & gas and some 2 million more in indirect employment in industries such as transportation, construction, and information services associated with finding, transporting, and storing fuels from the new shale bounty.
In addition, America is seeing revitalized growth and jobs in previously stagnant sectors of the economy, from chemicals production and manufacturing to steel and even textiles because of access to lower cost and reliable energy.
The surge in American oil & gas production has become reasonably well-known; far less appreciated are two key features, which are the focus of this paper: the widespread geographic dispersion of the jobs created; and the fact that the majority of the jobs have been created not in the ranks of the Big Oil companies but in small businesses, even more widely dispersed.
Fast forward to today when we are about to learn that Newton’s third law of Keynesian economics states that every boom, has an equal and opposite bust.
Which brings us to Texas, the one state that more than any other, has benefited over the past 5 years from the Shale miracle. And now with crude sinking by the day, it is time to unwind all those gains, and give back all those jobs. Did we mention: highly compensated, very well-paying jobs, not the restaurant, clerical, waiter, retail, part-time minimum-wage jobs the “recovery” has been flooded with.
Here is JPM’s Michael Feroli explaining why Houston suddenly has a very big problem.
- In less than five years Texas’ share of US oil production has gone from around 25% to over 40%
- By some measures, the oil intensity of the Texas economy looks similar to what it was in the mid-1980s
- The 1986 collapse in oil prices led to a painful regional recession in Texas
- While the rest of the country looks to benefit from cheap oil, Texas could be headed for recession
The collapse in oil prices will create winners and losers, both globally and here in the US. While we expect the country, overall, will be a net beneficiary from falling oil prices, two states look like they will bear the brunt of the pain: North Dakota and Texas. Given its much larger size, the prospect of a recession in Texas could have some broader reverberations.
By now, most people are familiar with the growth of the fossil fuel industry in places like Pennsylvania and Ohio. However, that has primarily been a natural gas story. The renaissance of US crude oil production has been much more concentrated: over 90% of the growth in the past five years has been in North Dakota and Texas; with Texas alone accounting for 67% of the increase in the nation’s crude output over that period.
In the first half of 1986, crude oil prices fell just over 50%. At the end of 1985, the unemployment rate in Texas was equal to that in the nation as a whole; at the end of 1986 it was 2.6%- points higher than the national rate. There are some reasons to think that it may not be as bad this time around, but there are even better reasons not to be complacent about the risk of a regional recession in Texas.
Geography of a boom
The well-known energy renaissance in the US has occurred in both the oil and natural gas sectors. Some states that are huge natural gas producers have limited oil production: Pennsylvania is the second largest gas producing state but 19th largest oil producer. The converse is also true: North Dakota is the second largest crude producer but 14th largest gas producer. However, most of the economic data as it relates to the energy sector, employment, GDP, etc, often lump together the oil and gas extraction industries. Yet oil prices have collapsed while natural gas prices have held fairly steady. To understand who is vulnerable to the decline in oil prices specifically we turn to the EIA’s state-level crude oil production data.
The first point, mentioned at the outset, is that Texas, already a giant, has become a behemoth crude producer in the past few years, and now accounts for over 40% of US production. However, there are a few states for which oil is a relatively larger sector (as measured by crude production relative to Gross State Product): North Dakota, Alaska, Wyoming, and New Mexico. For two other states, Oklahoma and Montana, crude production is important, though somewhat less so than for Texas. Note, however, that these are all pretty small states: the four states where oil is more important to the local economy than Texas have a combined GSP that is only 16% of the Texas GSP. Finally, there is one large oil producer, California, which is dwarfed by such a huge economy that its oil intensity is actually below the national average, and we would expect it, like the country as a whole, to benefit from lower oil prices.
Texas-sized challenges
As discussed above, Texas is unique in the country as a huge economy and a huge oil producer. When thinking about the challenges facing the Texas economy in 2015 it may be useful, as a starting point, to begin with the oil price collapse of 1986. Then, like now, crude oil prices collapsed around 50% in the space of a few short months. As noted in the introduction, the labor market response was severe and swift, with the Texas unemployment rate rising 2.0%-points in the first three months of 1986 alone. Following the hit to the labor market, the real estate market suffered a longer, slower, burn, and by the end of 1988 Texas house prices were down over 14% from their peak in early 1986 (over the same period national house prices were up just over 14%). The last act of this tragedy was a banking crisis, as several hundred Texas banks failed, with peak failures occurring in 1988 and 1989.
How appropriate is it to compare the challenges Texas faces today to the ones they faced in 1986? The natural place to begin is by getting a sense of the relative energy industry intensity of Texas today versus 1986. Unfortunately, the GSP-by-industry data have a definitional break in 1997, but splicing the data would suggest a similar share of the oil and gas sector in Texas GSP now and in 1985: around 11%. Employment in the mining and logging sector (which, in Texas, is overwhelmingly dominated by the oil and gas sector) was around 3.7% in 1985 and is 2.7% now. This is consistent with a point we have been making in the national context: the oil and gas sector is very capital-intensive, and increasingly so. Even so, as the 1986 episode demonstrated, there do seem to be sizable multiplier effects on non-energy employment. Finally, there does not exist capital spending by state data, but at the national level we can see the flip side of the increasing capital intensive nature of energy: oil and gas related cap-ex was 0.58% of GDP in 4Q85, and is 0.98% of GDP now.
Given this, what is the case for arguing that this time is different, and the impact will be smaller than in 1986? One is that now, unlike in 1986, natural gas prices haven’t moved down in sympathy with crude oil prices, and the Texas recession in 1986 may have owed in part also to the decline in gas prices. Another is that, as noted above, the employment share is somewhat lower, and thus the income hit will be felt more by capital-holders – i.e. investors around the country and the world. Finally, unlike 1986, the energy industry is experiencing rapid technological gains, pushing down the energy extraction cost curve.
While these are all valid, they are not so strong as to signal smooth sailing for the Texas economy. Financially, oil is a fair bit more important than gas for Texas, both now and in 1986, with a dollar value two to three times as large. Moreover, while energy employment may be somewhat smaller now, we are not talking about night and day. The current share is about 3/4ths what it was in 1986. (Given the higher capital intensity, there are some reasons to think employment may be greater now in sectors outside the traditional oil and gas sectors, such as pipeline and heavy engineering construction).
As we weigh the evidence, we think Texas will, at the least, have a rough 2015 ahead, and is at risk of slipping into a regional recession. Such an outcome could bring with it the usual collateral damage that occurs in a slowdown. Housing markets have been hot in Texas. Although affordability in Texas looks good compared to the national average, it always does; compared to its own history, housing in some major Texas metro areas looks quite dear, suggesting a risk of a pull-back in the real estate market.
The national economy performed quite well in 1986, in spite of the Texas recession. We expect the US economy will perform well next year too , though some regions – most notably Texas – could significantly under perform the national average.

* * *
So perhaps it is finally time to add that footnote to the “unambiguously good” qualified when pundits describe the oil crash: it may be good for everyone… except Texas which is about to enter a recession. And then Pennsylvania. And then North Dakota. And then Colorado. And then West Virginia. And then Alaska. And then Wyoming. And then Oklahoma. And then Montana, and so on, until finally we find just where the new equilibrium is following the exodus of hundreds of thousands of the best-paying jobs created during the “recovery” offset by minimum-wage waiters, bartenders, retail workers and temps.
BofA Analyst Credits Falling Oil Prices for Lower Mortgage Rates
 by Phil Hall
The precipitous drop in global oil prices has created a domino effect that led to a new decline in lower mortgage rates, according to a report by Chris Flanagan, a mortgage rate specialist at Bank of America Merrill Lynch.
“The oil collapse of 2014 appears to have been a key driver [in declining mortgage rates],” stated Flanagan in his report, which was obtained by CBS Moneywatch. “Further oil price declines could lead the way to sub-3.5 percent mortgage rates.”
Flanagan applauded this development, noting that the reversal of mortgage rates might propel housing to a stronger recovery.
“We have maintained the view that 4 percent mortgage rates are too high to allow for sustainable recovery in housing,” he wrote. Flanagan also theorized that if rates fell into 3.25 percent to 3.5 percent range, it would boost “supply from both refinancing and purchase mortgage channels.”
Flanagan’s report echoes the sentiments expressed by Frank Nothaft, Freddie Mac’s chief economist, who earlier this week identified the link between oil prices and housing.
“The recent drop in oil prices has been an unexpected boon for consumers’ pocketbooks and most businesses,” Nothaft stated. “Economic growth has picked up over the final nine months of 2014 and lower energy costs are expected to support growth of about 3 percent for the U.S. in 2015. Therefore we expect the housing market to continue to strengthen with home sales rising to their best sales pace in eight years, national house price indexes up, and rental markets continuing to display low vacancy rates and the highest level of new apartment completions in 25 years.”
But not everyone is expected to benefit from this development. A report issued last week by the Houston Association of Realtors forecast a 10 percent to 12 percent drop in home sales over the next year, owing to a potential slowdown in job growth for the Houston market’s energy industry if oil prices continue to plummet.
Housing Price Gains Slow For 9th Straight Month, Says S&P/Case-Shiller
 by Erin Carlyle
Growth in home sales prices continued to slow across the nation in September, marking nine straight months of deceleration, data from S&P/Case-Shiller showed Tuesday.
U.S. single-family home prices gained just 4.8% (on a seasonally-adjusted basis) over prices one year earlier, down from a 5.1% annual increase in August, the S&P/Case-Shiller National Home Price Index shows. The measure covers all nine Census divisions. Significantly, September also marked the first month that the National Index decreased (by 0.1%) on a month-over-month basis since November 2013.
“The overall trend in home price increases continues to slow down,” says David M. Blitzer, chairman of the Index Committee at S&P Dow Jones Indices. “The only region showing any sustained strength is the Southeast led by Florida; price gains are also evident in Atlanta and Charlotte.”
Price gains have been steadily slowing since December after a streak of double-digit annual price increases in late 2013 and early 2014. Eighteen of the 20 cities Case-Shiller tracks reported slower annual price gains in September than in August, with Charlotte and Dallas the only cities where annual price gains increased. Miami (10.3%) was the only city to report double-digit annual price gains.

The chart above depicts the annual returns of the U.S. National, the 10-City Composite and the 20-City Composite Home Price Indices. The S&P/Case-Shiller U.S. National Home Price Index, which covers all nine U.S. census divisions, recorded a 4.8% annual gain in September 2014. The 10- and 20-City Composites posted year-over-year increases of 4.8% and 4.9%, compared to 5.5% and 5.6% in August.
National Index, year-over-year change in prices (seasonally adjusted):
June 2013: 9.2%
July 2013: 9.7%
August 2013: 10.2%
September 2013: 10.7%
October 2013: 10.9%
November 2013: 10.8%
December 2013: 10.8%
January 2014: 10.5%
February 2014: 10.2%
March 2014: 9.0%
April 2014: 8.0%
May 2014: 7.1%
June 2014: 6.3%
July 2014: 5.6%
August 2014: 5.1%
September 2014: 4.8%
“Other housing statistics paint a mixed to slightly positive picture,” Blitzer said. “Housing starts held above one million at annual rates on gains in single family homes, sales of existing homes are gaining, builders’ sentiment is improving, foreclosures continue to be worked off and mortgage default rates are at precrisis levels. With the economy looking better than a year ago, the housing outlook for 2015 is stable to slightly better.”
Blitzer is referring to a report last week that showed housing starts (groundbreakings on new homes) down 2.8% in October, but still at a stronger pace than one year earlier. What’s more, single-family starts showed a 4.2% increase over the prior month. Also, in October existing (or previously-owned) home sales hit their fastest pace in more than one year. (Both reports are one month ahead of the S&P/Case-Shiller report, the industry standard but unfortunately with a two-month lag time.) Taken together, the data suggest that the rapid price gains seen late last year and in the first part of this year are mostly behind us.

“The days of double-digit home value appreciation continue to rapidly fade away as more inventory comes on line, and the market is becoming more balanced between buyers and sellers,” said Stan Humphries, Zillow’s chief economist. “Like a perfectly prepared Thanksgiving turkey, it’s important for things to cool off a bit in the housing market, because too-fast appreciation risks burning both buyers and sellers. In this more sedate environment, buyers can take more time to find the right deal for them, and sellers can rest assured they won’t be left without a seat at the table when they turn around and become buyers. This slowdown is a critical step on the road back to a normal housing market, and as we approach the end of 2014, the housing market has plenty to be thankful for.”
As of September 2014, average home prices across the U.S. are back to their spring 2005 levels for the National Index (which covers 70% of the U.S. housing market), while both the 10-City and 20-City Composites are back to their autumn 2004 levels. For the city Composite indices, prices are still off their mid-summer 2006 peaks by about 15% to 17%. Prices have bounced back from their March 2012 lows by 28.8% and 29.6% for the 10-City and 20-City composites.
S&P/Case-Shiller is now releasing its National Home Price Index each month. Previously, it was published quarterly, while the 10-City and 20-City Composites were published monthly. The “July” numbers above for the National Index above reflect a roll-up of data for the three-month average of May, June and July prices.
Oil & Gas Stocks: ‘Stability At The Bottom’ May Be A Positive Sign

Summary:
- The article provides “correction scorecards” by stock and by group versus commodities.
- In the past two weeks, oil & gas stocks firmed up, despite the continued slide in the price of oil.
- Small- and mid-capitalization oil-focused E&Ps were the strongest winners.
- Emerging markets Oil Majors and Upstream MLPs were the worst performers.
During the two weeks since my previous update, stocks in the Oil & Gas sector demonstrated what an optimist might interpret as “stability at the bottom.” The net effect of another sequence of high-amplitude intraday moves was a slight recovery from the two weeks ago levels across the vast majority of segments and stock groups, as shown on the chart below. It should be no surprise that those groups that had declined the most were also the biggest gainers in the past two weeks.
Most notable is the fact that the descend trend in the Oil & Gas stocks was interrupted (and even marginally reversed) in spite of the new lows posted by the price of oil. One could try to interpret this performance as an indication that the current price levels already discount the market’s fear that the oil price paradigm has shifted. This stability may also indicate that the wave of forced liquidations by hedge funds and in individual margin accounts has run its course and the worst part of this correction may be already behind us.
Even though this recent stock price “stability” is a welcome development, it provides little consolation to investors in the Oil & Gas sector who still see their positions trading far below the peak levels achieved last summer. The correction scorecard graph below summarizes average “peak-to-current” performance by individual stocks that are grouped together by sector and size. Individual stock performance is provided in full detail in the spreadsheets at the end of this note.
Mid- and small-capitalization stocks, in both Upstream and Oil Service segments, remain the worst performing groups, now trading at an average discount to each individual stock’s recent peak price of over 40%, a staggering decline. Large-capitalization E&P independents and large-capitalization oil service stocks are trading at a 20%-24% average discount.

Emerging Markets Oil Majors Post A Strong Decline:
Emerging markets Oil Majors were one of the worst performing categories during the past two weeks:
Petrobras (NYSE:PBR) continued to slide down, moving 12% down since my previous update. Petrobras stands out as one of the most disappointing Oil Majors in terms of stock performance in the past five years, having lost a staggering three-quarters of its value during that period. The company’s market capitalization currently stands at only $62 billion.
· Lukoil (OTCPK:LUKOY) and Petrochina (NYSE:PTR) are other examples of strong declines in the past two weeks, with the stocks losing 8% and 7%, respectively. Lukoil’s performance may in fact be interpreted as “solid,” given the continued deterioration of Russia’s political and credit risk.
A strong contrast is the performance of the three oil super-majors – Exxon (NYSE:XOM), Chevron (NYSE:CVX) and Shell (NYSE:RDS.A) – that gained ~2% during the past two weeks and remain the best performing group in the Oil & Gas sector. I have argued in my earlier notes that, given the combined $0.9 trillion market capitalization of these three stocks, the resilient performance by the Super-majors has effectively isolated the correction in the Oil & Gas sector from the broader markets. From a fundamental perspective, the Super-majors are characterized by very low financial leverage, high proportion of counter-cyclical production sharing contracts (“PSAs”) and the effective hedge from downstream assets, which limits their exposure to the oil price decline.
Small-Capitalization E&P Stocks Bounce Back:
After a dramatic underperformance, small- and mid-capitalization E&P stocks posted meaningful gains in the past two weeks. However, in most cases the recovery is “a drop in the bucket,” given that high-percentage moves are measured off price levels that sometimes are a fraction of recent peak prices. The sector remains a menu of bargains for those investors who believe in a recovery in oil prices.
- Enerplus (NYSE:ERF): +20%
- Northern Oil & Gas (NYSEMKT:NOG): +17%
- Concho Resources (NYSE:CXO): +15%
- Approach Resources (NASDAQ:AREX): +48%
- Goodrich Petroleum (NYSE:GDP): +24%
- Synergy Resources (NYSEMKT:SYRG): +15%
- Penn Virginia (NYSE:PVA): +17%
- Comstock Resources (NYSE:CRK): +25%
E&P MLPs Retreat:
Upstream MLPs were one of the exceptions in the E&P sector, declining by an average of 4% in the past two weeks. The largest Upstream MLP, Linn Energy (NASDAQ:LINE) and its sister entity LinnCo(NASDAQ:LNCO), are again trading close to their lows, after having enjoyed a strong bounce a month ago. The previously very wide gap in relative performance between Upstream MLPs and other Upstream equities has contracted substantially which, arguably, makes sense given that both categories of companies participate in the same business, irrespective of the corporate envelope.
Oil & Gas Sector Correction Scorecards:
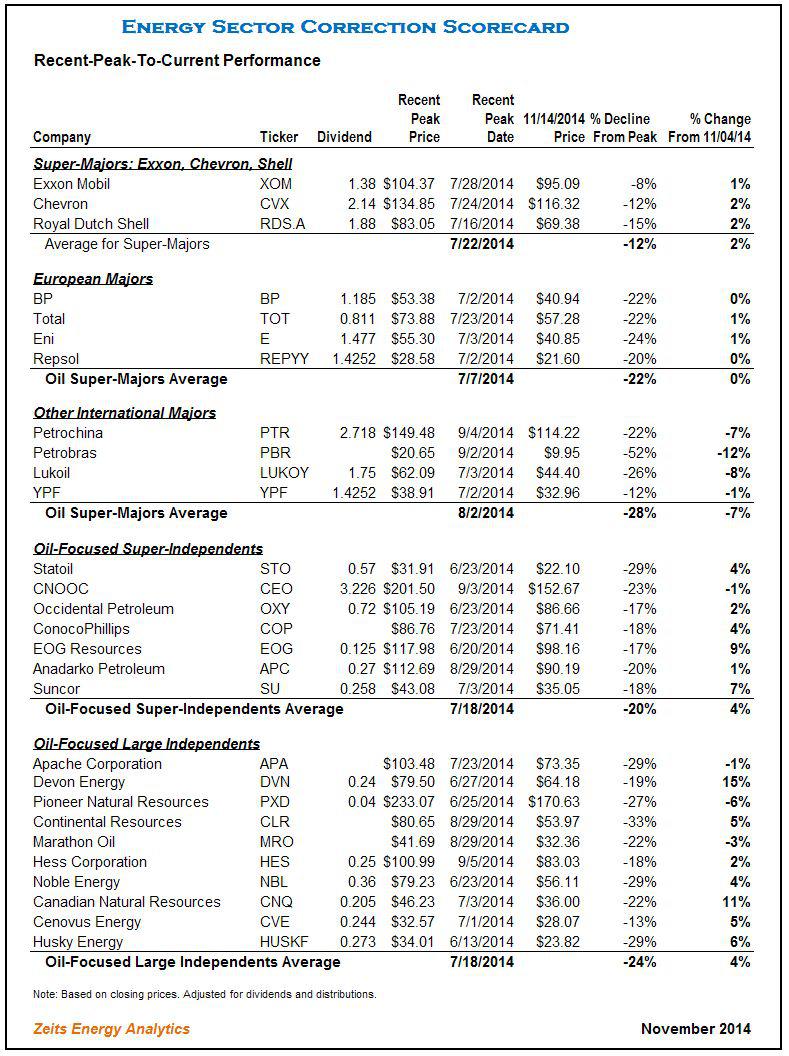
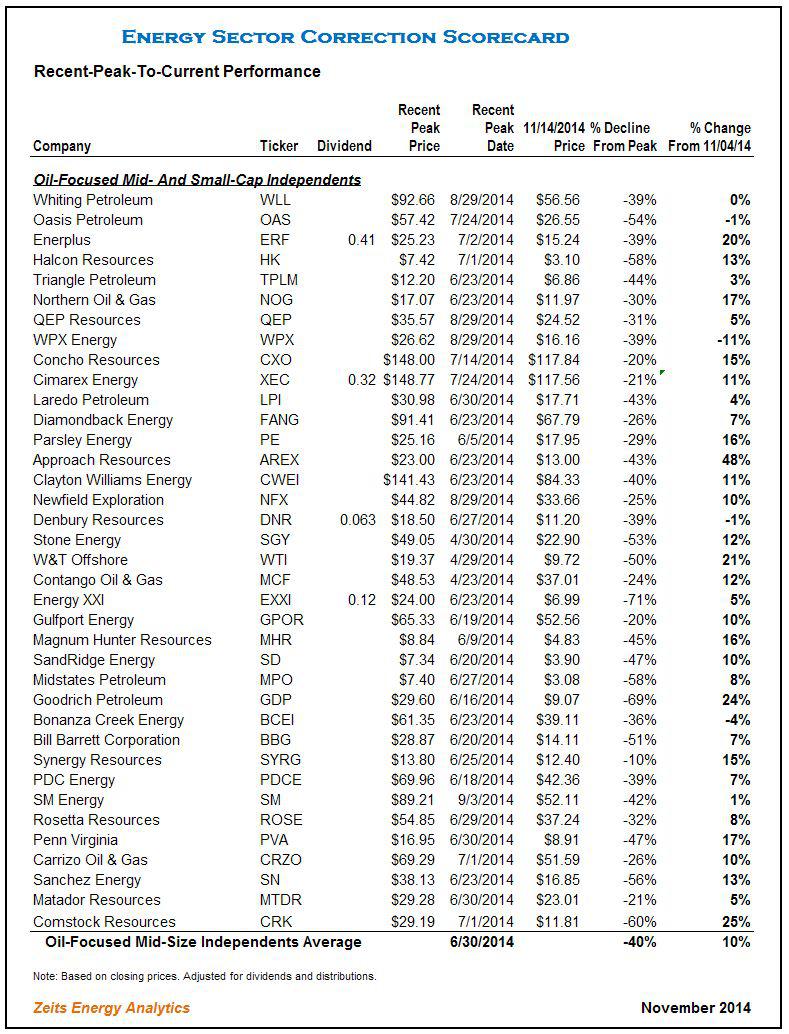
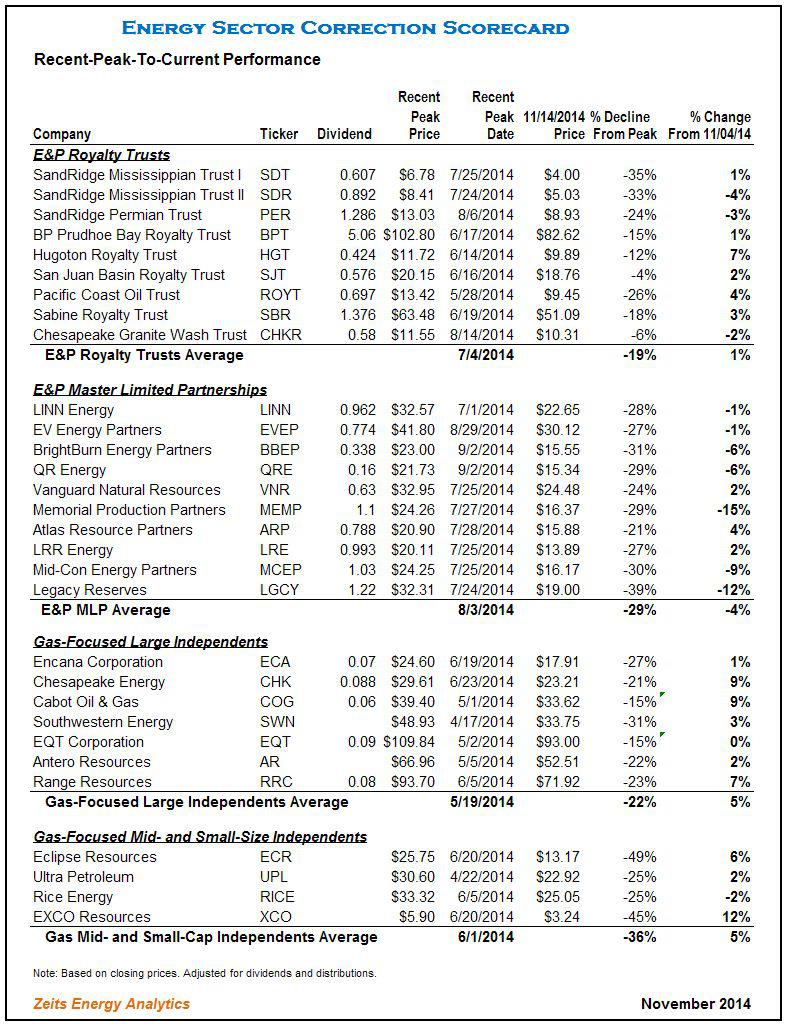
The Cruel Injustice of the Fed’s Bubbles in Housing

As the generational war heats up, we should all remember the source of all the bubbles and all the policies that could only result in generational poverty: The Federal Reserve.
Federal Reserve chair Janet Yellen recently treated the nation to an astonishing lecture on the solution to rising wealth inequality–according to Yellen, low-income households should save capital and buy assets such as stocks and housing.
It’s difficult to know which is more insulting: her oily sanctimony or her callous disregard for facts. What Yellen and the rest of the Fed Mafia have done is inflate bubbles in credit and assets that have made housing unaffordable to all but the wealthiest households.
Fed policy has been especially destructive to young households: not only is it difficult to save capital when your income is declining in real terms, housing has soared out of reach as the direct consequence of Fed policies.
Two charts reflect this reality. The first is of median household income, the second is the Case-Shiller Index of housing prices for the San Francisco Bay Area.
I have marked the wage chart with the actual price of a modest 900 square foot suburban house in the S.F. Bay Area whose price history mirrors the Case-Shiller Index, with one difference: this house (and many others) are actually worth more now than they were at the top of the national bubble in 2006-7.
But that is a mere quibble. The main point is that housing exploded from 3 times median income to 12 times median income as a direct result of Fed policies. Lowering interest rates doesn’t make assets any more affordable–it pushes them higher.
The only winners in the housing bubble are those who bought in 1998 or earlier. The extraordinary gains reaped since the late 1990s have not been available to younger households. The popping of the housing bubble did lower prices from nosebleed heights, but in most locales price did not return to 1996 levels.
As a multiple of real (inflation-adjusted) income, in many areas housing is more expensive than it was at the top of the 2006 bubble.
While Yellen and the rest of the Fed Mafia have been enormously successful in blowing bubbles that crash with devastating consequences, they failed to move the needle on household income. Median income has actually declined since 2000.

Inflating asset bubbles shovels unearned gains into the pockets of those who own assets prior to the bubble, but it inflates those assets out of reach of those who don’t own assets–for example, people who were too young to buy assets at pre-bubble prices.

Inflating housing out of reach of young households as a matter of Fed policy isn’t simply unjust–it’s cruel. Fed policies designed to goose asset valuations as a theater-of-the-absurd measure of “prosperity” overlooked that it is only the older generations who bought all these assets at pre-bubble prices who have gained.
In the good old days, a 20% down payment was standard. How long will it take a young family to save $130,000 for a $650,000 house? How much of their income will be squandered in interest and property taxes for the privilege of owning a bubblicious-priced house?
If we scrape away the toxic sludge of sanctimony and misrepresentation from Yellen’s absurd lecture, we divine her true message: if you want a house, make sure you’re born to rich parents who bought at pre-bubble prices.
As the generational war heats up, we should all remember the source of all the bubbles and all the policies that could only result in generational poverty: The Federal Reserve.
Consistency Is What Drives Your Success

I was out on the West Coast recently delivering a sales workshop for a group of about 40 loan originators. Our mission was to explore ideas for capitalizing on the summer home buying season and discover ways to increase their purchase loan application volume.
Early in the session, I handed out colored index cards and asked the participants to record their answers to this question: If a mortgage originator is serious about growing his or her purchase loan business over the next few months, what are three things he or she should be doing?
Everyone wrote down their best ideas, and I collected the cards so we could see their advice.
As you might imagine, we ended up with a lot of reoccurring themes and ideas. Overall, here are the top five suggestions they offered:
1. Work hard; put in the hours it takes.
2. Get out and see your Realtor and business partners.
3. Contact your database with cards and letters asking for referrals.
4. Attend local events and talk to people who might be in the market to buy.
5. Follow up on your pre-approvals, your leads and the contacts you make.
What do you notice about this list? There is nothing new! In all 40 index cards I collected, there was not a single suggestion that was original, earth-shattering or eye-popping. And that is exactly the point I wanted to make to that group and to you today: there is nothing new about success.
There are mortgage originators in the market today with 15 to 20 loans in their pipelines. There are originators closing $5 million a month and more.
Are they doing anything special? Absolutely not. Do they have “secrets” and strategies most others have never considered? Far from it. High producers and top performers have come to terms with the most important lesson about success—that success in this business is primarily caused by one enormously important factor: consistency.
Taking our cue from the list above, let’s apply this rule:
1. It’s not about working hard every so often, it’s about working a full eight- to nine-hour day, every day, five days a week. There’s no coming in late and no blowing out early on Friday afternoon. You can’t take two-hour lunch breaks and run personal errands on work time. You have to work hard at your job and put in a full day, every single day. Consistently.
2. It’s not about getting out to see your Realtor and other business partners when you can, when you are caught up, or when you feel like it. It’s about getting out to visit your Realtor and business partners every week, week after week. Consistently.
3. It’s not about contacting your database with an arbitrary email at accidental intervals. It’s about having a pre-determined marketing plan to contact your database with cards, letters and phone calls on an ongoing monthly basis. Consistently.
4. It’s not about attending a local community, networking or industry event once every few months or on the off-chance when the opportunity arises. It’s about getting out of the office once or twice a week to meet new people, make new contacts and generate potential prospects. Consistently.
5. It’s not about following up on your leads and pre-approvals when you get time (after you’ve read all your emails or once you have combed through your loan files for the 10th time today). It’s about following up on potential leads, referrals and pre-approvals every single day. Consistently.

“Success is not sexy,” a very successful loan originator once told me. “Success comes from doing the simple, basic, mundane things you need to do day after day after day.” His recommendation is right on.
Too many mortgage originators today are searching for that magic pill that will make them more successful without having to exert much effort. Guess what; it doesn’t exist. There is no easy road to success in this business—never has been, never will be. Success is the end result of doing the right things consistently over a long period of time.
As we discovered at my sales seminar, most of the loan originators in attendance knew what to do and most were doing all the right things.
But for many, their production volume wasn’t where they wanted it to be because they weren’t doing what they needed to do consistently. They were working hard, but not every day. They were connecting with their Realtors, but not all that often.
They were building and marketing a database, but only when they had time to get around to it. They were engaged in some networking events, but maybe only once every few months.
And they were following up on their pre-approvals and prospects in a haphazard, random sort of way.
Does that also describe how you are running your business right now? If so, perhaps the most effective strategy to growing your purchase loan business over the summer home buying season has less to do with adding new activities and more to do with doing what you are already doing, but with more (wait for it…) consistency.
You have a tremendous opportunity ahead of you over the upcoming months. Activity is picking up, buyers are out there looking at properties, homes are selling, and mortgages are being made.
If you are consistent in doing what you need to do you’ll score a lot of opportunities, take a lot of applications, help a lot of people, close a lot of loans, and make a lot of money. Isn’t that what this business is all about?

Doug Smith is a nationally known industry speaker, author and sales trainer. For more information, please visit http://www.DougSmithOnline.com or call Douglas Smith & Associates at 877-430-2329.
The Next Housing Crisis May Be Sooner Than You Think
How we could fall into another housing crisis before we’ve fully pulled out of the 2008 one.

When it comes to housing, sometimes it seems we never learn. Just when America appeared to be recovering from the last housing crisis—the trigger, in many ways, for 2008’s grand financial meltdown and the beginning of a three-year recession—another one may be looming on the horizon.
There are at several big red flags.
For one, the housing market never truly recovered from the recession. Trulia Chief Economist Jed Kolko points out that, while the third quarter of 2014 saw improvement in a number of housing key barometers, none have returned to normal, pre-recession levels. Existing home sales are now 80 percent of the way back to normal, while home prices are stuck at 75 percent back, remaining undervalued by 3.4 percent. More troubling, new construction is less than halfway (49 percent) back to normal. Kolko also notes that the fundamental building blocks of the economy, including employment levels, income and household formation, have also been slow to improve. “In this recovery, jobs and housing can’t get what they need from each other,” he writes.
Americans are spending more than 33 percent of their income on housing.
Second, Americans continue to overspend on housing. Even as the economy drags itself out of its recession, a spate of reports show that families are having a harder and harder time paying for housing. Part of the problem is that Americans continue to want more space in bigger homes, and not just in the suburbs but in urban areas, as well. Americans more than 33 percent of their income on housing in 2013, up nearly 13 percent from two decades ago, according to newly released data from the Bureau of Labor Statistics (BLS). The graph below plots the trend by age.
Over-spending on housing is far worse in some places than others; the housing market and its recovery remain highly uneven. Another BLS report released last month showed that households in Washington, D.C., spent nearly twice as much on housing ($17,603) as those in Cleveland, Ohio ($9,061). The chart below, from the BLS report, shows average annual expenses on housing related items:

The result, of course, is that more and more American households, especially middle- and working-class people, are having a harder time affording housing. This is particularly the case in reviving urban centers, as more affluent, highly educated and creative-class workers snap up the best spaces, particularly those along convenient transit, pushing the service and working class further out.
Last but certainly not least, the rate of home ownership continues to fall, and dramatically. Home ownership has reached its lowest level in two decades—64.4 percent (as of the third quarter of 2014). Here’s the data, from the U.S. Census Bureau:

Home ownership currently hovers from the mid-50 to low-60 percent range in some of the most highly productive and innovative metros in this country—places like San Francisco, New York, and Los Angeles. This range seems “to provide the flexibility of rental and ownership options required for a fast-paced, rapidly changing knowledge economy. Widespread home ownership is no longer the key to a thriving economy,” I’ve written.
What we are going through is much more than a generational shift or simple lifestyle change. It’s a deep economic shift—I’ve called it the Great Reset. It entails a shift away from the economic system, population patterns and geographic layout of the old suburban growth model, which was deeply connected to old industrial economy, toward a new kind of denser, more urban growth more in line with today’s knowledge economy. We remain in the early stages of this reset. If history is any guide, the complete shift will take a generation or so.
It’s time to impose stricter underwriting standards and encourage the dense, mixed-use, more flexible housing options that the knowledge economy requires.
The upshot, as the Nobel Prize winner Edmund Phelps has written, is that it is time for Americans to get over their house passion. The new knowledge economy requires we spend less on housing and cars, and more on education, human capital and innovation—exactly those inputs that fuel the new economic and social system.
But we’re not moving in that direction; in fact, we appear to be going the other way. This past weekend, Peter J. Wallison pointed out in a New York Times op-ed that federal regulators moved back off tougher mortgage-underwriting standards brought on by 2010’s Dodd-Frank Act and instead relaxed them. Regulators are hoping to encourage more home ownership, but they’re essentially recreating the conditions that led to 2008’s crash.
Wallison notes that this amounts to “underwriting the next housing crisis.” He’s right: It’s time to impose stricter underwriting standards and encourage the dense, mixed-use, more flexible housing options that the knowledge economy requires.
During the depression and after World War II, this country’s leaders pioneered a series of purposeful and ultimately game-changing polices that set in motion the old suburban growth model, helping propel the industrial economy and creating a middle class of workers and owners. Now that our economy has changed again, we need to do the same for the denser urban growth model, creating more flexible housing system that can help bolster today’s economy.

Dream housing for new economy workers?
Energy Workforce Projected To Grow 39% Through 2022
 b
b
The dramatic resurgence of the oil industry over the past few years has been a notable factor in the national economic recovery. Production levels have reached totals not seen since the late 1980s and continue to increase, and rig counts are in the 1,900 range. While prices have dipped recently, it will take more than that to markedly slow the level of activity. Cycles are inevitable, but activity is forecast to remain at relatively high levels.
An outgrowth of oil and gas activity strength is a need for additional workers. At the same time, the industry workforce is aging, and shortages are likely to emerge in key fields ranging from petroleum engineers to experienced drilling crews. I was recently asked to comment on the topic at a gathering of energy workforce professionals. Because the industry is so important to many parts of Texas, it’s an issue with relevance to future prosperity.
Although direct employment in the energy industry is a small percentage of total jobs in the state, the work is often well paying. Moreover, the ripple effects through the economy of this high value-added industry are large, especially in areas which have a substantial concentration of support services.

Employment in oil and gas extraction has expanded rapidly, up from 119,800 in January 2004 to 213,500 in September 2014. Strong demand for key occupations is evidenced by the high salaries; for example, median pay was $130,280 for petroleum engineers in 2012 according to the Bureau of Labor Statistics (BLS).
Due to expansion in the industry alone, the BLS estimates employment growth of 39 percent through 2022 for petroleum engineers, which comprised 11 percent of total employment in oil and gas extraction in 2012. Other key categories (such as geoscientists, wellhead pumpers, and roustabouts) are also expected to see employment gains exceeding 15 percent. In high-activity regions, shortages are emerging in secondary fields such as welders, electricians, and truck drivers.
The fact that the industry workforce is aging is widely recognized. The cyclical nature of the energy industry contributes to uneven entry into fields such as petroleum engineering and others which support oil and gas activity. For example, the current surge has pushed up wages, and enrollment in related fields has increased sharply. Past downturns, however, led to relatively low enrollments, and therefore relatively lower numbers of workers in some age cohorts. The loss of the large baby boom generation of experienced workers to retirement will affect all industries. This problem is compounded in the energy sector because of the long stagnation of the industry in the 1980s and 1990s resulting in a generation of workers with little incentive to enter the industry. As a result, the projected need for workers due to replacement is particularly high for key fields.
The BLS estimates that 9,800 petroleum engineers (25.5 percent of the total) working in 2012 will need to be replaced by 2022 because they retire or permanently leave the field. Replacement rates are also projected to be high for other crucial occupations including petroleum pump system operators, refinery operators, and gaugers (37.1 percent); derrick, rotary drill, and service unit operators, oil, gas, and mining (40.4 percent).

Putting together the needs from industry expansion and replacement, most critical occupations will require new workers equal to 40 percent or more of the current employment levels. The total need for petroleum engineers is estimated to equal approximately 64.5 percent of the current workforce. Clearly, it will be a major challenge to deal with this rapid turnover.
Potential solutions which have been attempted or discussed present problems, and it will require cooperative efforts between the industry and higher education and training institutions to adequately deal with future workforce shortages. Universities have had problems filling open teaching positions, because private-sector jobs are more lucrative for qualified candidates. Given budget constraints and other considerations, it is not feasible for universities to compete on the basis of salary. Without additional teaching and research staff, it will be difficult to continue to expand enrollment while maintaining education quality. At the same time, high-paying jobs are enticing students into the workforce, and fewer are entering doctoral programs.
Another option which has been suggested is for engineers who are experienced in the workplace to spend some of their time teaching. However, busy companies are naturally resistant to allowing employees to take time away from their regular duties. Innovative training and associate degree and certification programs blending classroom and hands-on experience show promise for helping deal with current and potential shortages in support occupations. Such programs can prepare students for well-paying technical jobs in the industry. Encouraging experienced professionals to work past retirement, using flexible hours and locations to appeal to Millennials, and other innovative approaches must be part of the mix, as well as encouraging the entry of females into the field (only 20 percent of the current workforce is female, but over 40 percent of the new entries).
Industry observers have long been aware of the coming “changing of the guard” in the oil and gas business. We are now approaching the crucial time period for ensuring the availability of the workers needed to fill future jobs. Cooperative efforts between the industry and higher education/training institutions will likely be required, and it’s time to act.

Today’s Hottest Trend In Residential Real Estate

The practice of multigenerational housing has been on the rise the past few years, and now experts are saying that it is adding value to properties.
In a recent Wall Street Journal article, several couples across the country are quoted saying that instead of downsizing to a new home, they are choosing to live with their adult children.
This is what many families across the country are doing for both a “peace of mind” and for “higher property values.”
“For both domestic and foreign buyers, the hottest amenity in real estate these days is an in-law unit, an apartment carved out of an existing home or a stand-alone dwelling built on the homeowners’ property,” writes Katy McLaughlin of the WSJ. “While the adult children get the peace of mind of having mom and dad nearby, real-estate agents say the in-law accommodations are adding value to their homes.”
And how much more are these homes worth? In an analysis by Zillow, the homes with this type of living accommodations were priced about 60 percent higher than regular single-family homes.
Local builders are noticing the trend, too. Horsham based Toll Brothers are building more communities that include both large, single-family homes and smaller homes for empty nesters, the company’s chief marketing officer, Kira Sterling, told the WSJ.

High Stakes in Dracula’s Transylvania
 Romania draws foreign buyers looking for historic mansions and modern villas in resort areas
Count Dracula, the central character of Irish author Bram Stoker’s classic vampire novel, eagerly left for England in search of new blood, in a story that popularized the Romanian region of Transylvania. Today, house hunters are invited to make the reverse journey now that Romania is a member of the European Union and that restrictions were lifted this year on purchases of local real estate by the bloc’s nationals.
Britain’s Prince Charles, for one, unwinds every year in Zalanpatak. The mud road leading to the remote village stretches for miles, with the clanging of cow bells accompanying tourists making the trek.
Elsewhere in the world, the heir to the British throne occupies great castles and sprawling mansions. In rural Romania, he resides in a small old cottage. His involvement, since 2006, in the restoration of a few local farmhouses has given the hamlet global popularity and added a sense of excitement about Transylvania living.
 A living room in Bran Castle, a Transylvania property marketed as Count Dracula’s castle. The home is for sale, initially listed for $78 million.
Transylvania, with a population of more than seven million in the central part of Romania, has a number of high-end homes on the market. And, yes, one is a castle. Bran Castle in Brasov county is marketed as the home of Count Dracula. In reality it was a residence of Romanian Queen Marie in the early 20th century. In 2007, the home was available for $78 million. The sellers are no longer listing a price, said Mark A. Meyer, of Herzfeld and Rubin, the New York attorneys representing the queen’s descendants, but will entertain offers.
Foreign buyers had been focused on Bucharest, where there was speculative buying of apartments after the country joined the EU in 2007. But Transylvania has been luring house hunters away from the capital city.
 A guesthouse on the property in Zalanpatak, Transylvania, that is owned by Britain’s Prince Charles. His presence has boosted interest in Romanian real estate.
Transylvania means “the land beyond the forest” and the region is famous for its scenic mountain routes. Brasov, an elegant mountain resort and the closest Transylvanian city to the capital, has many big villas built in the 19th century by wealthy merchants. A 10-room townhouse from that period in the historic city center is listed for $2.7 million. For $500,000, a 2,200-square-foot apartment offers rooftop views of the city and the surrounding mountains.
A seven-bedroom mansion in the nearby village of Halchiu, close to popular skiing resorts, is on the market for $2.4 million. The modern villa features two huge living rooms, a swimming pool, a tennis court and spectacular views of the Carpathian Mountains.
The village, founded by Saxons in the 12th century, has rows of historic houses across the street. Four such buildings were demolished to make way for the mansion, completed in 2010.
 A $2.4 million mansion is for sale in Halchiu village.
“Rather than invest a million or more to buy an existing house, the wealthy prefer to build on their own because construction materials and work is cheaper,” said Raluca Plavita, senior consultant at real-estate firm DTZ Echinox in Bucharest.
Non-EU nationals can’t purchase land outright—although they may use locally registered companies to circumvent the restriction—but they can buy buildings freely, said Razvan Popa, real-estate partner at law firm Kinstellar. High-end properties are out of reach for many Romanians, who make an average of $500 in monthly take-home pay.
The country saw a rapid inflation of real-estate prices before 2008, on prospects of Romania’s entry to the EU and the North Atlantic Treaty Organization, as well as aggressive lending by banks. Values then fell by half during the global financial crisis.
The economy is stronger now, with the International Monetary Fund estimating 2.4% growth this year. But the country is still among Europe’s poorest. Its isolation during the dictatorship of Nicolae Ceausescu gave it a bad image.
 The interior of the seven-bedroom Halchiu mansion, which was built on the site of four traditional Saxon homes.
“Interest in Romania isn’t comparable with Prague or Budapest where some may be looking to buy a small apartment with a view of Charles Bridge or the Danube,” said Mr. Popa, the real-estate lawyer.
The international publicity around Prince Charles’s properties offers a counterbalance to some of the negative press Romania has received in Western Europe, which is worried about well-educated Romanians moving to other countries to provide inexpensive labor.
The Zalanpatak property is looked after by Tibor Kalnoky, a descendant of a Hungarian aristocratic family. The 47-year-old studied in Germany to be a veterinarian and, after reclaiming family assets in Romania, has managed the prince’s property and has hosted him during his visits.
These occasional visits are enough to attract scores of tourists throughout the year to the formerly obscure village in a Transylvanian valley. The fact that few street signs lead there, that the property offers no Internet or TV and that cellphone signals are absent for miles, seems only to add to the mystery of the place.
Number of U.S. First-Time Homebuyers Plummets

by National Mortgage Professional Magazine
Despite an improving job market and low interest rates, the share of first-time homebuyers fell to its lowest point in nearly three decades and is preventing a healthier housing market from reaching its full potential, according to an annual survey released by the National Association of Realtors (NAR). The survey additionally found that an overwhelming majority of buyers search for homes online and then purchase their home through a real estate agent.
The 2014 NAR Profile of Home Buyers and Sellers continues a long-running series of large national NAR surveys evaluating the demographics, preferences, motivations, plans and experiences of recent home buyers and sellers; the series dates back to 1981. Results are representative of owner-occupants and do not include investors or vacation homes.
The long-term average in this survey, dating back to 1981, shows that four out of 10 purchases are from first-time home buyers. In this year’s survey, the share of first-time home buyers dropped five percentage points from a year ago to 33 percent, representing the lowest share since 1987 (30 percent).
“Rising rents and repaying student loan debt makes saving for a down payment more difficult, especially for young adults who’ve experienced limited job prospects and flat wage growth since entering the workforce,” said Lawrence Yun, NAR chief economist. “Adding more bumps in the road, is that those finally in a position to buy have had to overcome low inventory levels in their price range, competition from investors, tight credit conditions and high mortgage insurance premiums.”
Yun added, “Stronger job growth should eventually support higher wages, but nearly half (47 percent) of first-time buyers in this year’s survey (43 percent in 2013) said the mortgage application and approval process was much more or somewhat more difficult than expected. Less stringent credit standards and mortgage insurance premiums commensurate with current buyer risk profiles are needed to boost first-time buyer participation, especially with interest rates likely rising in upcoming years.”
The household composition of buyers responding to the survey was mostly unchanged from a year ago. Sixty-five percent of buyers were married couples, 16 percent single women, nine percent single men and eight percent unmarried couples.
 In 2009, 60 percent of buyers were married, 21 percent were single women, 10 percent single men and 8 percent unmarried couples. Thirteen percent of survey respondents were multi-generational households, including adult children, parents and/or grandparents.
The median age of first-time buyers was 31, unchanged from the last two years, and the median income was $68,300 ($67,400 in 2013). The typical first-time buyer purchased a 1,570 square-foot home costing $169,000, while the typical repeat buyer was 53 years old and earned $95,000. Repeat buyers purchased a median 2,030-square foot home costing $240,000.
When asked about the primary reason for purchasing, 53 percent of first-time buyers cited a desire to own a home of their own. For repeat buyers, 12 percent had a job-related move, 11 percent wanted a home in a better area, and another 10 percent said they wanted a larger home. Responses for other reasons were in the single digits.
According to the survey, 79 percent of recent buyers said their home is a good investment, and 40 percent believe it’s better than stocks.
Financing the purchase
Nearly nine out of 10 buyers (88 percent) financed their purchase. Younger buyers were more likely to finance (97 percent) compared to buyers aged 65 years and older (64 percent). The median down payment ranged from six percent for first-time buyers to 13 percent for repeat buyers. Among 23 percent of first-time buyers who said saving for a down payment was difficult, more than half (57 percent) said student loans delayed saving, up from 54 percent a year ago.
 In addition to tapping into their own savings (81 percent), first-time homebuyers used a variety of outside resources for their loan downpayment. Twenty-six percent received a gift from a friend or relative—most likely their parents—and six percent received a loan from a relative or friend. Ten percent of buyers sold stocks or bonds and tapped into a 401(k) fund.
Ninety-three percent of entry-level buyers chose a fixed-rate mortgage, with 35 percent financing their purchase with a low-down payment Federal Housing Administration-backed mortgage (39 percent in 2013), and nine percent using the Veterans Affairs loan program with no downpayment requirements.
“FHA premiums are too high in relation to default rates and have likely dissuaded some prospective first-time buyers from entering the market,” said Yun. “To put it in perspective, 56 percent of first-time buyers used a FHA loan in 2010. The current high mortgage insurance added to their monthly payment is likely causing some young adults to forgo taking out a loan.”
Buyers used a wide variety of resources in searching for a home, with the Internet (92 percent) and real estate agents (87 percent) leading the way. Other noteworthy results included mobile or tablet applications (50 percent), mobile or tablet search engines (48 percent), yard signs (48 percent) and open houses (44 percent).
According to NAR President Steve Brown, co-owner of Irongate, Inc., Realtors® in Dayton, Ohio, although more buyers used the Internet as the first step of their search than any other option (43 percent), the Internet hasn’t replaced the real estate agent’s role in a transaction.
“Ninety percent of home buyers who searched for homes online ended up purchasing their home through an agent,” Brown said. “In fact, buyers who used the Internet were more likely to purchase their home through an agent than those who didn’t (67 percent). Realtors are not only the source of online real estate data, they also use their unparalleled local market knowledge and resources to close the deal for buyers and sellers.”
When buyers were asked where they first learned about the home they purchased, 43 percent said the Internet (unchanged from last year, but up from 36 percent in 2009); 33 percent from a real estate agent; 9 percent a yard sign or open house; six percent from a friend, neighbor or relative; five percent from home builders; three percent directly from the seller; and one percent a print or newspaper ad.
Likely highlighting the low inventory levels seen earlier in 2014, buyers visited 10 homes and typically found the one they eventually purchased two weeks quicker than last year (10 weeks compared to 12 in 2013). Overall, 89 percent were satisfied with the buying process.
First-time home buyers plan to stay in their home for 10 years and repeat buyers plan to hold their property for 15 years; sellers in this year’s survey had been in their previous home for a median of 10 years.
 The biggest factors influencing neighborhood choice were quality of the neighborhood (69 percent), convenience to jobs (52 percent), overall affordability of homes (47 percent), and convenience to family and friends (43 percent). Other factors with relatively high responses included convenience to shopping (31 percent), quality of the school district (30 percent), neighborhood design (28 percent) and convenience to entertainment or leisure activities (25 percent).
This year’s survey also highlighted the significant role transportation costs and “green” features have in the purchase decision process. Seventy percent of buyers said transportation costs were important, while 86 percent said heating and cooling costs were important. Over two-thirds said energy efficient appliances and lighting were important (68 and 66 percent, respectively).
Seventy-nine percent of respondents purchased a detached single-family home, eight percent a townhouse or row house, 8 percent a condo and six percent some other kind of housing. First-time home buyers were slightly more likely (10 percent) to purchase a townhouse or a condo than repeat buyers (seven percent). The typical home had three bedrooms and two bathrooms.
The majority of buyers surveyed purchased in a suburb or subdivision (50 percent). The remaining bought in a small town (20 percent), urban area (16 percent), rural area (11 percent) or resort/recreation area (three percent). Buyers’ median distance from their previous residence was 12 miles.
Characteristics of sellers
The typical seller over the past year was 54 years old (53 in 2013; 46 in 2009), was married (74 percent), had a household income of $96,700, and was in their home for 10 years before selling—a new high for tenure in home. Seventeen percent of sellers wanted to sell earlier but were stalled because their home had been worth less than their mortgage (13 percent in 2013).
“Faster price appreciation this past year finally allowed more previously stuck homeowners with little or no equity the ability to sell after waiting the last few years,” Yun said.
Sellers realized a median equity gain of $30,100 ($25,000 in 2013)—a 17 percent increase (13 percent last year) over the original purchase price. Sellers who owned a home for one year to five years typically reported higher gains than those who owned a home for six to 10 years, underlining the price swings since the recession.
The median time on the market for recently sold homes dropped to four weeks in this year’s report compared to five weeks last year, indicating tight inventory in many local markets. Sellers moved a median distance of 20 miles and approximately 71 percent moved to a larger or comparably sized home.
A combined 60 percent of responding sellers found a real estate agent through a referral by a friend, neighbor or relative, or used their agent from a previous transaction. Eighty-three percent are likely to use the agent again or recommend to others.
For the past three years, 88 percent of sellers have sold with the assistance of an agent and only nine percent of sales have been for-sale-by-owner, or FSBO sales.
For-sale-by-owner transactions accounted for 9 percent of sales, unchanged from a year ago and matching the record lows set in 2010 and 2012; the record high was 20 percent in 1987. The share of homes sold without professional representation has trended lower since reaching a cyclical peak of 18 percent in 1997.
Factoring out private sales between parties who knew each other in advance, the actual number of homes sold on the open market without professional assistance was 5 percent. The most difficult tasks reported by FSBOs are getting the right price, selling within the length of time planned, preparing or fixing up the home for sale, and understanding and completing paperwork.
NAR mailed a 127-question survey in July 2014 using a random sample weighted to be representative of sales on a geographic basis. A total of 6,572 responses were received from primary residence buyers. After accounting for undeliverable questionnaires, the survey had an adjusted response rate of 9.4 percent. The recent home buyers had to have purchased a home between July of 2013 and June of 2014. Because of rounding and omissions for space, percentage distributions for some findings may not add up to 100 percent. All information is characteristic of the 12-month period ending in June 2014 with the exception of income data, which are for 2013.
Update: The FBI Is Looking Into American Realty Capital Properties

About: American Realty Capital Properties Inc (ARCP) by Albert Alfonso
Summary:
- According to a Reuters report, the FBI has opened a criminal probe of American Realty Capital Properties.
- This follows the disclosure of accounting errors by the company.
- This investigation is in addition to a SEC inquiry.
American Realty Capital Properties (NASDAQ:ARCP) just cannot catch a break. Reuters reported that the Federal Bureau of Investigation has opened a criminal investigation into ARCP, according to their sources. The FBI is conducting the investigation along with prosecutors from U.S. Attorney Preet Bharara’s office in New York, according to the Reuters report.
This news comes just days after the company announced a series of accounting errors which had been intentionally not corrected and thus concealed from the public. The amount of money involved, roughly $9.24 million GAAP and $13.60 million AFFO, was relatively small. However, these accounting errors resulted in the resignation of two senior executives, chief financial officer, Brian Block, and chief accounting officer, Lisa McAlister.
Shares of ARCP were trading for as low as $7.85 each on Wednesday, before recovering to $10 per share after CEO David Kay held fairly well received conference call explaining what happened. In the call, Mr. Kay stressed that ARCP’s key metrics were sound. He reaffirmed that the dividend policy will not change, noting that the operating metrics were not impacted and that the NAV is unchanged at $13.25. Nevertheless, the stock continued to fall, closing the week at below $9 per share. In total, ARCP’s stock has fallen 30% since news of the accounting errors first arose, wiping out $4 billion in market value.
Conclusion:
This is quite the shocking development. Not only is the FBI looking into ARCP, but also the Securities and Exchange Commission, which announced its own investigation of the accounting errors late last week. Furthermore, the company was placed on CreditWatch with negative implications by S&P, which risks putting the credit rating into junk territory.
As I noted in my earlier article, accounting issues equal an automatic sell in my book. I sold most of my ARCP holdings on Wednesday, though I still kept some shares, opting instead to sell calls on the remaining position. I now lament that choice as I fear the stock can fall further. An FBI criminal probe is no small matter and represents a clear material risk. What an absolute disaster.
Update: American Realty Capital Properties: The Turmoil Is Only Getting Worse
Summary
- ARCP sent shock waves through the analyst community last week after the REIT said its financials should no longer be relied upon and said goodbye to the CFO and CAO.
- ARCP is now also attracting heat from the FBI.
- In addition, RCS Capital Corporation cancels Cole Capital transaction.
Investors in American Realty Capital Properties (NASDAQ:ARCP) need to demonstrate that they have nerves of steel at the moment. After the company reported that it overstated its AFFO last week, and that its Chief Financial Officer and Chief Accounting Officer departed as a result of the accounting scandal, more bad news are seeing the light of day.
First of all, as various news outlets reported, the Federal Bureau of Investigation is putting up some additional heat on ARCP. As Reuters reported:
(Reuters) – U.S. authorities have opened a criminal probe of American Realty Capital Properties in the wake of the real estate investment trust’s disclosure that it had uncovered accounting errors, two sources familiar with the matter said on Friday.
The Federal Bureau of Investigation is conducting the investigation along with prosecutors from U.S. Attorney Preet Bharara’s office in New York, the sources said. Further details of the probe could not be learned.
The involvement of the New York U.S. Attorney’s office is particularly bad news as Preet Bharara takes a tough stance with companies that break the law or push its limits too far. While the criminal probe certainly is bad news and comes in addition to the involvement of the SEC, something else caused massive irritation among ARCP shareholders today: The Cole Capital deal with RCS Capital Corporation (NYSE: RCAP) is in real danger.
According to ARCP’s latest (and angry) press release:
In the middle of the night, we received a letter from RCS Capital Corporation purporting to terminate the equity purchase agreement, dated September 30, 2014, between RCS and an affiliate of ARCP. As we informed RCS orally and in writing over the weekend, RCS has no right and there is absolutely no basis for RCS to terminate the agreement. Therefore, RCS’s attempt to terminate the agreement constitutes a breach of the agreement. In addition, we believe that RCS’s unilateral public announcement is a violation of its agreement with ARCP. The independent members of the ARCP Board of Directors and ARCP management are evaluating all alternatives under the agreement and with respect to the Cole Capital® business, generally. ARCP management and the independent members of the ARCP Board of Directors are committed to doing what is in the best interests of ARCP stockholders and its business, including Cole Capital.
That’s right. Since the FBI now has its fingers in the pie, and the SEC, management at RCS Capital has informed ARCP that it is terminating the deal. Whatever side you are one, you’ve got to admit: American Realty Capital Properties is just falling apart.
The once mighty real estate investment trust has lost a staggering 36% of its market capitalization since shares closed at $12.38 on October 28, 2014, which is a tough pill to swallow for those investors who pledged allegiance to American Realty Capital Properties, despite the turbulence that erupted a week ago.
Technical picture
Shares of American Realty Capital Properties are trading extremely weakly today in light of the new information, and I continue to see further downside potential for this REIT in the near term.
It seems as if all the forces of the universe are conspiring to bring American Realty Capital Properties down to its knees, and an investment in this REIT is not recommendable at the moment.
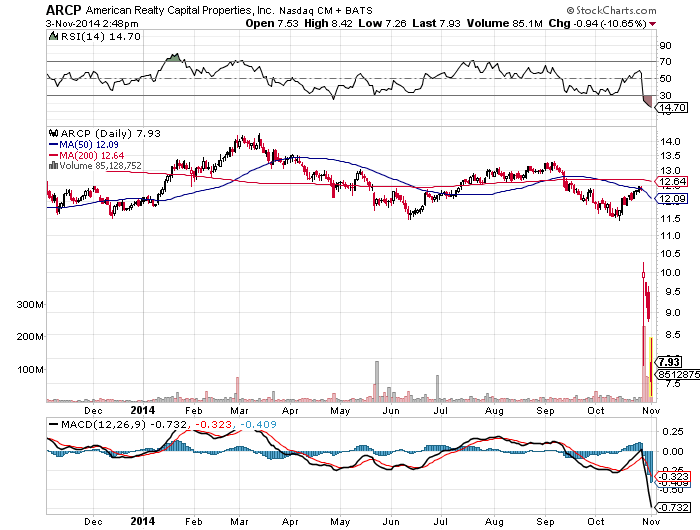
Source: StockCharts.com
Bottom Line:
The American Realty Capital Properties’ story has gotten significantly worse today: In addition to two of the most important executives abruptly leaving the company amid an accounting scandal, the SEC and the FBI are investigating the company, lawyers are very likely going to hit ARCP with litigation, and the latest transaction is in the process of collapsing.
Bulls must either have nerves of steel or clinging to hope. In any case, ARCP’s prospects have gotten much worse today, and I continue to expect further downside potential driven by litigation concerns, potential fines and extremely negative investor sentiment.
American Realty Capital Comes Clean, And I Feel Dirty
by Adam Aloisi
Summary:
- American Realty Capital’s restatement has created rampant volatility in a stock already under the gun.
- Why I decided to sell half of my position in the company.
- Important portfolio takeaways for investors of all kinds.
This is one of the tougher articles I’ve written for Seeking Alpha. Asset allocation and portfolio strategy for income investors has been my focal point of writing over the past three years. I’ve always been of the opinion that talking about how to fish trumps simply giving someone fish to chew on.
Still, I mention equity-income stocks all the time in articles, but it’s rare that I write focus articles. On October third, I wrote, “American Realty Capital Properties: 30% Total Return Next Year“. Less than a month later, I find that post in an inverse position, with American Realty Capital (NASDAQ:ARCP) having dropped around 30% in market value.
First, I will tell readers that I sold a bit more than half of my position as a result of ARCP’s restatement, and still retain shares. However, it is now one of my smallest income portfolio positions and one that I have lost a majority of my conviction in. ARCP, in my mind, has transitioned from being a higher-risk investment into now becoming day-trader fodder, and at least for the near term, highly speculative. I would have been all over this thing during my trading days, but having become more conservative today with less portfolio churn, it has little room in my portfolio.
I considered all options here. I thought about increasing my position, extinguishing it altogether, selling put options at attractive premiums, or potentially doing nothing. Being so supportive of this story over the past year, I was mostly disappointed that I had to put any thought into the matter at all. For a variety of reasons, I came to the conclusion that halving the position — taking a loss, which I needed to do anyway for taxes — was a prudent near-term choice. I will revisit the decision in a month, and could conceivably buy back those shares once wash sale rules have passed.
Though selling during a period of fear and volatility is not typically in my playbook, following this restatement, I have lost confidence in this story. If you follow me, you know that I certainly identified the elevated risk that ARCP brought to real estate investors. Over the past six months, here are some comments that I made in regard to ARCP in several articles:
If you invest in ARCP today, you should expect the unexpected.
Given all the deals and potential for a misstep, there is heightened risk in owning ARCP.
But with the baggage it continues to drag along with it…..it may not necessarily be appropriate for more conservative investors
I do not consider the stock a table pounding buy.
I even compared Nick Schorsch to Monty Hall from “Let’s Make A Deal,” following the Red Lobster purchase and flip-flop on the strip mall IPO-then-sale.
As the year wore on, however, my convictions rose, since the company did not materially change its guidance to investors, despite all the acquisition activity. I figured if there were a stumble, it would have been disclosed earlier this year as the various acquisitions had time to be absorbed into operations.
While there was much criticism over the Cole quasi-divestiture to RCS and lowered guidance, I remained resolute, thinking there wasn’t another buyer, and this at least got Cole out from under the ARCP umbrella.
Of course as we now know, some financial disclosures were not to be relied upon and guidance should have been changed. If there were not so much other controversy with regard to this company, I doubt the stock would have tanked as much as it has. When you have a managerial crisis of confidence already in place and make a restatement announcement, you create panic. If we take this on face value, it does not appear to be a huge restatement, but taken in totality, this is a monumental, perhaps insurmountable, credibility problem. It’s now all aboard for the ambulance-chasing lawyers.
At this point I have decided that it is in my best interest to rip the towel in half and throw it in. I see it as a hedge against further deterioration in this story that I would not necessarily rule out given the loose management style that I and every ARCP investor knew existed.
We’re not talking about some low level accounting bean counter or paper pusher that seems to have perpetrated this; we’re talking about CFO Brian Block, assumedly someone that David Kay and Nick Schorsch had drinks with regularly. So when Kay defended the culture at ARCP on the conference call by uttering, “We don’t have bad people, we had some bad judgment there,” forgive me if I now wonder if he really has a clue how good, sweet, and honest his executives and rank-and-file workers really are. Although the restatements appear isolated to this year’s AFFO, we’ll have to see if anything turns up in 2013. While I’d like to give this company the benefit of the doubt once again, I’m finding myself staring at a slippery slope of hope that another shoe will not drop.
Still, I did not jettison the entire position because these are emotional times, and the glass-is-half-full part of me says the market is overreacting. We are, keep in mind, still talking about a high-quality portfolio of real estate, not a biotech company whose sole drug was deemed inefficacious by the FDA. In the end, however, I had to make a decision for my own portfolio that I deemed appropriate. This was it.
Meanwhile, I would not criticize nor blame someone for selling out here and moving on to more stable pastures. Fellow REIT writer Brad Thomas apparently has. On the flip side, I could see the more adventurous or those with continued conviction buying in now or upping exposure. The “right” thing to do for many investors may be to simply hold through the volatility. As I opined in a past article on ARCP:
But with the considerable sentiment overhang and “show me” attitude of the market, it could take some time and a strong stomach to see it through.
The sentiment “overhang” has basically become something much worse. And at this point I wouldn’t even want to predict how much time it could take for a rebound. Your stomach constitution will need to be stronger than I first suspected.
Portfolio Takeaways
I’ve had more than one reader tell me that the various risks I identified made them conclude that ARCP was not a stock they should own. And given what has happened here, at least for the near-term, that was obviously a prudent decision. We must all come to personal conclusions as to how much risk we are willing to take to attain income and capital growth goals.
For investors of all types, the most important thing to take away from this near-term “disaster” is that diversification and limiting position size is critical. If ARCP amounted to a couple of percent, or less, of a portfolio, the stock’s tank may not be all that impacting. If it was a more concentrated portion of the overall pie, it becomes a more painful near-term event and makes various portfolio maneuver decisions more challenging to come to.
In the end, portfolio management is a personal endeavor that amounts to an inexact science. Whether you think what I’ve done with my ARCP position is right or not is not really all important. The more important thing is whether you are comfortable with the personal portfolio decisions you make or not, why you make them, and whether they are right for your situation.
I’ve used the word “I” more than I normally would in an article. This one was indeed about me and owning up to putting wholesale trust in a management team that apparently I shouldn’t have. And it was a about a decision I really didn’t want to make as a result. Unfortunately, we have to take the bad with the good in the investment world, brush ourselves off, move on, and continue to make personal decisions that are right for our portfolios.
BofA Banker Arrested In Hong Kong For Double Murder Of Two Prostitutes
 Rurick Jutting, a Cambridge University graduate, has been named as the suspect of the double murder
by Tyler Durden
The excesses of 1980s New York investment banking as captured best (and with just a dose of hyperbole) by Bret Easton Ellis’s American Psycho may be long gone in the US, but they certainly are alive and well in other banking meccas, such as the one place where every financier wants to work these days (thanks to the Chinese government making it rain credit): Hong Kong. It is here that yesterday a 29-year-old British banker, Rurik Jutting, a Cambridge University grad and current Bank of America Merrill Lynch, former Barclays employee, was arrested in connection with the grisly murder of two prostitutes. One of the two victims had been hidden in a suitcase on a balcony, while the other, a foreign woman of between 25 and 30, was found lying inside the apartment with wounds to her neck and buttocks, the police said in a statement.
|
A spokesman for Bank of America Merrill Lynch told Reuters on Sunday that the U.S. bank had, until recently, an employee bearing the same name as a man Hong Kong media have described as the chief suspect in the double murder case. Bank of America Merrill Lynch would not give more details nor clarify when the person had left the bank.
Britain’s Foreign Office in London said on Saturday a British national had been arrested in Hong Kong, without specifying the nature of any suspected crime.
The details of the crime are straight out of American Psycho 2: the Hong Kong Sequel. One of the murdered women was aged between 25 and 30 and had cut wounds to her neck and buttock, according to a police statement. The second woman’s body, also with neck injuries, was discovered in a suitcase on the apartment’s balcony, the police said. A knife was seized at the scene.
According to the WSJ, the arrested suspect, who called police to the apartment in the early hours of Nov. 1, was until recently a Hong Kong-based employee of Bank of America Merrill Lynch.
Filings with Hong Kong’s securities regulator show that the suspect was an employee with the bank as recently as Oct. 31.The man had called police in the early hours of Saturday and asked them to investigate the case, police said.
Hong Kong’s Apple Daily newspaper said the suspect had taken about 2,000 photographs and some video footage of the victims after the killings including close-ups of their wounds. Local media said the two women were prostitutes.
The apartment where the bodies were found is on the 31st floor in a building popular with financial professionals, where average rents are about HK$30,000 (nearly $4,000) a month.
According to the Telegraph the suspect, who had previously worked at Barclays from 2008 until 2010 before moving to BofA, and specifically its Hong Kong office in July last year, had apparently vanished from his workplace a week ago. It has also been reported that he resigned from his post days before news of the murders emerged.
And as usual in situations like these, the UK’s Daily Mail has the granular details. It reports that the British banker arrested on suspicion of a double murder in Hong Kong has been identified as 29-year-old Rurik Jutting.
Mr Jutting, who attended Cambridge University, is being held by police after the bodies of two prostitutes were discovered in his up-market apartment in the early hours of yesterday morning.
Officers found the women, thought to be a 25-year-old from Indonesia and a 30-year-old from the Philippines, after Mr Jutting allegedly called police to the address, which is located near the city’s red light district. The naked body of the Filipina victim, who had suffered a series of knife wounds, was found inside the 31st-floor apartment in J Residence – a development of exclusive properties in the city’s Wan Chai district that are popular with young expatriate executives.
The second woman was reportedly discovered naked and partially decapitated in a suitcase on the balcony of the apartment. She is believed to have been tied up and to have been left there for around a week.
Sex toys and cocaine were also reportedly found, along with a knife which was seized by officers.
Mr Jutting’s phone is today being examined by police in a bid to identify possible further victims, according to the South China Morning Post.
It is understood that photos of the woman who was found in the suitcase, apparently taken after she died, were among roughly 2,000 that officers found on the device.
Mr Jutting attended Winchester College, an independent boys school in Hampshire, before continuing his studies in history and law at Pembroke College, Cambridge, where he became secretary of the history society.
He appears to have worked at Barclays in London between 2008 and 2010, when he took a job with Bank of America Merrill Lynch. He was moved to the bank’s Hong Kong office in July last year.
A spokesman for Bank of America Merrill Lynch confirmed that it had previously employed a man by the same name but would not give more details nor clarify when the person had left the bank.
CCTV footage from the apartment block, located near Hong Kong’s red light district, showed the banker and the Filipina woman returning to the 31st floor shortly after midnight local time yesterday.
He allegedly called police to his home at 3.42am, shortly after the woman he was seen with is believed to have been killed.
She was found with two wounds to her neck and her throat had been slashed. She was pronounced dead at the scene.
The body on the balcony, wrapped in a carpet and inside a black suitcase, which measured about three feet by 18 inches, was not found by police until eight hours later.
A police source quoted by the South China Morning Post said: ‘She was nearly decapitated and her hands and legs were bound with ropes. ‘She was naked and wrapped in a towel before being stuffed into the suitcase. Her passport was found at the scene.’
Wan Chai, the district where the apartment is located, is known for its bustling nightclub scene of ‘girly bars,’ popular with expatriate men and staffed by sex workers from South East Asia. Police have today been contacting nearby bars in an attempt to find out more about the background of the two murdered women.
One resident in the 40-storey block, where most of the residents are expatriates, said he had noticed an unusual smell in recent days. He told the South China Morning Post that there had been ‘a stink in the building like a dead animal’.
And just like that, the worst excesses of the “peak banking” days from 1980, when sad scenes like these were a frequent occurrence, are back.

Government workers remove the body of a woman who was found dead at a flat in Hong Kong’s Wan chai district in the early hours of this morning. A British man was been arrested in connection with the murders.

A second victim was found stuffed inside a suitcase on the balcony of the residential flat in Hong Kong

The 40-storey J Residence is reportedly a high-end development favored by junior expatriate bankers
Update
Bank Of America Psycho Killer Was Busy Helping Hedge Funds Avoid Taxes During His Business Hours
The most bizarre story of the weekend was that of Bank of America’s 29-year-old banker Rurik Jutting, who shortly after allegedly killing two prostitutes (and stuffing one in a suitcase), called the cops on himself and effectively admitted to the crime having left a quite clear autoreply email message, namely “For urgent inquiries, or indeed any inquiries, please contact someone who is not an insane psychopath. For escalation please contact God, though suspect the devil will have custody. [Last line only really worked if I had followed through..]”
But while his attempt to imitate Patrick Bateman did not go unnoticed, even if it will be promptly forgotten until the next grotesquely insane banker shocks the world for another 15 minutes, the question that has remained unanswered is what did young Master Jutting do when not chopping women up.
The answer, as the WSJ has revealed, is just as unsavory: “he had been part of a Bank of America team that specialized in tax-minimization trades that are under scrutiny from prosecutors, regulators, tax collectors and the bank’s own compliance department, according to people familiar with the matter and documents reviewed by The Wall Street Journal.”
Basically, when not acting as a homicidal psychopath, Jutting was facilitating full-blown tax evasion, just the activity that every developed, and thus broke, government around the globe is desperately cracking down on, and why every single Swiss bank is non-grata in the US and may be arrested immediately upon arrival on US soil.
Mr. Jutting, a U.K. native and a competitive poker player, worked in Bank of America Merrill Lynch’s Structured Equity Finance and Trading group, first in London and then in Hong Kong, according to these people and regulatory filings. Mr. Jutting resigned from the bank sometime before Oct. 27, which police say was the date of the first murder, according to a person familiar with the matter.
The trading group, known as SEFT, employs about three dozen people globally, one of these people said. It helps hedge funds and other clients manage their stock portfolios, often through the use of derivatives, according to the people and internal bank documents.
Mr. Jutting joined Bank of America in 2010 and worked three years in its London office, the bank’s hub for dividend-arbitrage trades, the people familiar with the matter say. He moved to Bank of America’s Hong Kong office in July 2013.
Ironic, because it was just this summer that a Congressional panel headed by Carl Levin was tearing foreign banks Deutsche Bank and Barclays a new one for providing structures such as MAPS and COLT, which did precisely this: give clients a derivative-based means of avoiding taxation (as described in “How Rentec Made More Than 34 Billion In Profits Since 1998 “Fictional Derivatives“).
As it turns out not only did a US-based bank – Bank of America – have an entire group dedicated to precisely the same type of hedge fund, and other Ultra High Net Worth, clients tax evasion advice, but it also housed a homicidal psychopath.
Perhaps if instead Levin had been grandstanding and seeking to punish foreign banks, he had cracked down on everyone who was providing this service, Jutting’s group would have been disbanded long ago, and two innocent lives could have been saved, instead allowing the alleged cocaine-snorting murderer to engage in far more wholesome, banker-approrpriate activities:
During his time in Asia, Mr. Jutting’s pastimes apparently included gambling. In a Sept. 14 Facebook post, he boasted of winning thousands of dollars playing poker at a tournament in the Philippines. He signed off the post: “God I love Manila.” The comment drew eight “likes.”
Alas one will never know “what if.”
But we are certain that with none other than America’s most prominent bank, the one carrying its name, has now been busted for aiding and abetting hedge fund tax evasion around the globe, it will get the same treatment as evil foreign banks Barclays and Deutsche Bank, right Carl Levin?
BLS: Midland Texas Again Posts Third Lowest Jobless Rate In Nation

For the second straight month, Midland posted the third lowest unemployment rate in the nation, according to figures released Wednesday by the Bureau of Labor Statistics.
Bismarck, North Dakota, topped the list for the fourth straight month with a jobless rate of 2.1 percent. Fargo, North Dakota, was second at 2.3. Midland and Logan, Utah, tied for third at 2.6.
A total of 10 metropolitan statistical areas around the nation posted unemployment rates of 3.0 percent or lower. Midland was the lone MSA in Texas at or below 3.0.
Midland again ranked near the top of the list of MSAs in the nation when it came to percentage gain in employment. Midland’s 6.4 percent growth ranked second to Muncie, Indiana (8.9 percent). In September, Midland showed a work force 100,100, an increase of nearly 5,000 from September 2013.
The following are the lowest unemployment rates in the nation during the month of September, according to the Bureau of Labor Statistics.
Bismarck, North Dakota 2.1
Fargo, North Dakota 2.3
Midland 2.6
Logan, Utah 2.6
Sioux Falls, South Dakota 2.7
Grand Forks, North Dakota 2.8
Lincoln, Nebraska 2.8
Mankato, Minnesota 2.9
Rapid City, South Dakota 2.9
Billings, Montana 3.0
Lowest rates from August
Bismarck, North Dakota 2.2, Fargo North Dakota 2.4; Midland 2.8. Also: Odessa 3.4
July
Bismarck, North Dakota, 2.4; Sioux Falls, South Dakota, 2.7; Fargo, North Dakota, 2.8; Midland 2.9. Also: Odessa 3.6
June
Bismarck, North Dakota, 2.6, Midland 2.9, Fargo, North Dakota, 3.0. Also: Odessa 3.6
May
Bismarck, North Dakota, 2.2, Fargo, North Dakota, 2.5, Logan, Utah, 2.5, Midland 2.6. Also: Odessa 3.2
April
Midland 2.3, Logan, Utah 2.5, Bismarck, North Dakota 2.6, Ames, Iowa 2.7. Also: Odessa 2.9
March
Midland 2.7, Houma-Bayou Cane-Thibodaux, La. 3.1, Bismarck, N.D. 3.1, Odessa 3.3, Fargo, N.D. 3.3, Ames, Iowa 3.3, Burlington, Vt. 3.3
February
Houma-Bayou Cane-Thibodaux, La. 2.8; Midland 3.0; Lafayette, La. 3.1
January
Midland 2.9; Logan, Utah 3.3; Bismarck, N.D. 3.4
December
Bismarck, N.D. 2.8; Logan, Utah 2.8; Midland 2.8
OCWEN Fakes foreclosure Notices To Steal Homes – Downgrade Putting RMBS at Risk

If you really would rather own the property than the note, take a few lessons in fraud from Owen Financial Corp. According to allegations from New York’s financial regulator, Benjamin Lawsky, the lender sent “thousands” of foreclosure “warnings” to borrowers months after the window of time had lapsed during which they could have saved their homes[1]. Lawskey alleges that many of the letters were even back-dated to give the impression that they had been sent in a timely fashion. “In many cases, borrowers received a letter denying a mortgage loan modification, and the letter was dated more than 30 days prior to the date that Ocwen mailed the letter.”
The correspondence gave borrowers 30 days from the date of the denial letter to appeal, but the borrowers received the letters after more than 30 days had passed. The issue is not a small one, either. Lawskey says that a mortgage servicing review at Ocwen revealed “more than 7,000” back-dated letters.”
In addition to the letters, Ocwen only sent correspondence concerning default cures after the cure date for delinquent borrowers had passed and ignored employee concerns that “letter-dating processes were inaccurate and misrepresented the severity of the problem.” While Lawskey accused Ocwen of cultivating a “culture that disregards the needs of struggling borrowers,” Ocwen itself blamed “software errors” for the improperly-dated letters[2]. This is just the latest in a series of troubles for the Atlanta-based mortgage servicer; The company was also part the foreclosure fraud settlement with 49 of 50 state attorneys general and recently agreed to reduce many borrowers’ loan balances by $2 billion total.
Most people do not realize that Ocwen, although the fourth-largest mortgage servicer in the country, is not actually a bank. The company specializes specifically in servicing high-risk mortgages, such as subprime mortgages. At the start of 2014, it managed $106 billion in subprime loans. Ocwen has only acknowledged that 283 New York borrowers actually received improperly dated letters, but did announce publicly in response to Lawskey’s letter that it is “investigating two other cases” and cooperating with the New York financial regulator.
WHAT WE THINK: While it’s tempting to think that this is part of an overarching conspiracy to steal homes in a state (and, when possible, a certain enormous city) where real estate is scarce, in reality the truth of the matter could be even more disturbing: Ocwen and its employees just plain didn’t care. There was a huge, problematic error that could have prevented homeowners from keeping their homes, but the loan servicer had already written off the homeowners as losers in the mortgage game. A company that services high-risk loans likely has a jaded view of borrowers, but that does not mean that the entire culture of the company should be based on ignoring borrowers’ rights and the vast majority of borrowers who want to keep their homes and pay their loans. Sure, if you took out a mortgage then you have the obligation to pay even if you don’t like the terms anymore. On the other side of the coin, however, your mortgage servicer has the obligation to treat you like someone who will fulfill their obligations rather than rigging the process so that you are doomed to fail.
Do you think Lawskey is right about Ocwen’s “culture?” What should be done to remedy this situation so that note investors and homeowners come out of it okay?
Thank you for reading the Bryan Ellis Investing Letter!
Your comments and questions are welcomed below.
[2] http://realestate.aol.com/blog/2014/10/22/ocwen-mortgage-alleged-foreclosure-abuse/
http://investing.bryanellis.com/11703/lender-fakes-foreclosure-notices-to-steal-homes/
—
Ocwen posts open letter and apology to borrowers
Pledges independent investigation and rectification
October 27, 2014 10:37AM
Ocwen Financial (OCN) has taken a beating after the New York Department of Financial Services sent a letter to the company on Oct. 21 alleging that the company had been backdating letters to borrowers, and now Ocwen is posting an open letter to homeowners.
Ocwen CEO Ron Faris writes to its clients explaining what happened and what steps the company is taking to investigate the issue, identify any problems, and rectify the situation.
Click here to read the full text of the letter.
“At Ocwen, we take our mission of helping struggling borrowers very seriously, and if you received one of these incorrectly-dated letters, we apologize. I am writing to clarify what happened, to explain the actions we have taken to address it, and to commit to ensuring that no borrower suffers as a result of our mistakes,” he writes.
“Historically letters were dated when the decision was made to create the letter versus when the letter was actually created. In most instances, the gap between these dates was three days or less,” Faris writes. “In certain instances, however, there was a significant gap between the date on the face of the letter and the date it was actually generated.”
Faris says that Ocwen is investigating all correspondence to determine whether any of it has been inadvertently misdated; how this happened in the first place; and why it took so long to fix it. He notes that Ocwen is hiring an independent firm to conduct the investigation, and that it will use its advisory council comprised of 15 nationally recognized community advocates and housing counselors.
“We apologize to all borrowers who received misdated letters. We believe that our backup checks and controls have prevented any borrowers from experiencing a foreclosure as a result of letter-dating errors. We will confirm this with rigorous testing and the verification of the independent firm,” Faris writes. “It is worth noting that under our current process, no borrower goes through a foreclosure without a thorough review of his or her loan file by a second set of eyes. We accept appeals for modification denials whenever we receive them and will not begin foreclosure proceedings or complete a foreclosure that is underway without first addressing the appeal.”
Faris ends by saying that Ocwen is committed to keeping borrowers in their homes.
“Having potentially caused inadvertent harm to struggling borrowers is particularly painful to us because we work so hard to help them keep their homes and improve their financial situations. We recognize our mistake. We are doing everything in our power to make things right for any borrowers who were harmed as a result of misdated letters and to ensure that this does not happen again,” he writes.
Last week the fallout from the “Lawsky event” – so called because of NYDFS Superintendent Benjamin Lawsky – came hard and fast.
Compass Point downgraded Ocwen affiliate Home Loan Servicing Solutions (HLSS) from Buy to Neutral with a price target of $18.
Meanwhile, Moody’s Investors Service downgraded Ocwen Loan Servicing LLC’s servicer quality assessments as a primary servicer of subprime residential mortgage loans to SQ3 from SQ3+ and as a special servicer of residential mortgage loans to SQ3 from SQ3+.
Standard & Poor’s Ratings Services lowered its long-term issuer credit rating to ‘B’ from ‘B+’ on Ocwen on Wednesday and the outlook is negative.
http://www.housingwire.com/articles/31846-ocwen-posts-open-letter-and-apology-to-borrowers
—-
Ocwen Writes Open Letter to Homeowners Concerning Letter Dating Issues
October 24, 2014
Dear Homeowners,
In recent days you may have heard about an investigation by the New York Department of Financial Services’ (DFS) into letters Ocwen sent to borrowers which were inadvertently misdated. At Ocwen, we take our mission of helping struggling borrowers very seriously, and if you received one of these incorrectly-dated letters, we apologize. I am writing to clarify what happened, to explain the actions we have taken to address it, and to commit to ensuring that no borrower suffers as a result of our mistakes.
What Happened
Historically letters were dated when the decision was made to create the letter versus when the letter was actually created. In most instances, the gap between these dates was three days or less. In certain instances, however, there was a significant gap between the date on the face of the letter and the date it was actually generated.
What We Are Doing
We are continuing to investigate all correspondence to determine whether any of it has been inadvertently misdated; how this happened in the first place; and why it took us so long to fix it. At the end of this exhaustive investigation, we want to be absolutely certain that we have fixed every problem with our letters. We are hiring an independent firm to investigate and to help us ensure that all necessary fixes have been made.
Ocwen has an advisory council made up of fifteen nationally recognized community advocates and housing counsellors. The council was created to improve our borrower outreach to keep more people in their homes. We will engage with council members to get additional guidance on making things right for any borrowers who may have been affected in any way by this error.
We apologize to all borrowers who received misdated letters. We believe that our backup checks and controls have prevented any borrowers from experiencing a foreclosure as a result of letter-dating errors. We will confirm this with rigorous testing and the verification of the independent firm. It is worth noting that under our current process, no borrower goes through a foreclosure without a thorough review of his or her loan file by a second set of eyes. We accept appeals for modification denials whenever we receive them and will not begin foreclosure proceedings or complete a foreclosure that is underway without first addressing the appeal.
In addition to these efforts we are committed to cooperating with DFS and all regulatory agencies.
We Are Committed to Keeping Borrowers in Their Homes
Having potentially caused inadvertent harm to struggling borrowers is particularly painful to us because we work so hard to help them keep their homes and improve their financial situations. We recognize our mistake. We are doing everything in our power to make things right for any borrowers who were harmed as a result of misdated letters and to ensure that this does not happen again. We remain deeply committed to keeping borrowers in their homes because we believe it is the right thing to do and a win/win for all of our stakeholders.
We will be in further communication with you on this matter.
Sincerely,
Ron Faris
CEO
YOU DECIDE
—
Ocwen Downgrade Puts RMBS at Risk
Moody’s and S&P downgraded Ocwen’s servicer quality rating last week after the New York Department of Financial Services made “backdating” allegations. Barclays says the downgrades could put some RMBS at risk of a servicer-driven default.
FHA Is Set To Return To Anti-House-Flipping Restrictions

House flippers buy run-down properties, fix them up and resell them quickly at a higher price. Above, a home under renovation in Amsterdam, N.Y. (Mike Groll / Associated Press)
Can you still do a short-term house flip using federally insured, low-down payment mortgage money? That’s an important question for buyers, sellers, investors and realty agents who’ve taken part in a nationwide wave of renovations and quick resales using Federal Housing Administration-backed loans during the last four years.
The answer is yes: You can still flip and finance short term. But get your rehabs done soon. The federal agency whose policy change in 2010 made tens of thousands of quick flips possible — and helped large numbers of first-time and minority buyers with moderate incomes acquire a home — is about to shut down the program, FHA officials confirmed to me.
In an effort to stimulate repairs and sales in neighborhoods hard hit by the mortgage crisis and recession, the FHA waived its standard prohibition against financing short-term house flips. Before the policy change, if you were an investor or property rehab specialist, you had to own a house for at least 90 days before reselling — flipping it — to a new buyer at a higher price using FHA financing. Under the waiver of the rule, you could buy a house, fix it up and resell it as quickly as possible to a buyer using an FHA mortgage — provided that you followed guidelines designed to protect consumers from being ripped off with hyper-inflated prices and shoddy construction.
Since then, according to FHA estimates, about 102,000 homes have been renovated and resold using the waiver. The reason for the upcoming termination: The program has done its job, stimulated billions of dollars of investments, stabilized prices and provided homes for families who were often newcomers to ownership.
However, even though the waiver program has functioned well, officials say, inherent dangers exist when there are no minimum ownership periods for flippers. In the 1990s, the FHA witnessed this firsthand when teams of con artists began buying run-down houses, slapped a little paint on the exterior and resold them within days — using fraudulent appraisals — for hyper-inflated prices and profits. Their buyers, who obtained FHA-backed mortgages, often couldn’t afford the payments and defaulted. Sometimes the buyers were themselves part of the scam and never made any payments on their loans — leaving the FHA, a government-owned insurer, with steep losses.
For these reasons, officials say, it’s time to revert to the more restrictive anti-quick-flip rules that prevailed before the waiver: The 90-day standard will come back into effect after Dec. 31.
But not everybody thinks that’s a great idea. Clem Ziroli Jr., president of First Mortgage Corp., an FHA lender in Ontario, says reversion to the 90-day rule will hurt moderate-income buyers who found the program helpful in opening the door to home ownership.
“The sad part,” Ziroli said in an email, “is the majority of these properties were improved and [located] in underserved areas. Having a rehabilitated house available to these borrowers” helped them acquire houses that had been in poor physical shape but now were repaired, inspected and safe to occupy.
Paul Skeens, president of Colonial Mortgage in Waldorf, Md., and an active rehab investor in the suburbs outside Washington, D.C., said the upcoming policy change will cost him money and inevitably raise the prices of the homes he sells after completing repairs and improvements. Efficient renovators, Skeens told me in an interview, can substantially improve a house within 45 days, at which point the property is ready to list and resell. By extending the mandatory ownership period to 90 days, the FHA will increase Skeens’ holding costs — financing expenses, taxes, maintenance and utilities — all of which will need to be added onto the price to a new buyer.
Paul Wylie, a member of an investor group in the Los Angeles area, says he sees “more harm than good by not extending the waiver. There are protections built into the program that have served [the FHA] well,” he said in an email. If the government reimposes the 90-day requirement, “it will harm those [buyers] that FHA intends to help” with its 3.5% minimum-down-payment loans. “Investors will adapt and sell to non-FHA-financed buyers. Entry-level consumers will be harmed unnecessarily.”
Bottom line: Whether fix-up investors like it or not, the FHA seems dead set on reverting to its pre-bust flipping restrictions. Financing will still be available, but selling prices of the end product — rehabbed houses for moderate-income buyers — are almost certain to be more expensive.
kenharney@earthlink.net. Distributed by Washington Post Writers Group. Copyright © 2014, Los Angeles Times
Pipelines In Texas – How Landowners Without Minerals are Profiting from the Boom
 by Tim Stinson
Many owners of mineral rights in Texas have become the recipients of hundreds of thousands—or even millions—of dollars as a result of the oil boom that has struck the state. With areas such as the Permian Basin and Eagle Ford Shale in Texas producing more oil than ever before, those who own mineral rights have often times been fortunate when it comes to cashing in on their rights.
However, those without mineral rights have benefited from the oil boom in numerous ways as well. Thousands of people within the state who simply own land have made huge profits through other means connected to oil and natural gas. One such way that landowners have become rich quick has been through profiting by the means of payouts for pipeline development in Texas.
Pipelines Companies Paying More than Ever Before
Pipelines In Texas – How Landowners Without Minerals are Profiting from the Boom In order to retrieve and transport oil and natural gas, pipeline, and lots of it, is needed in the Eagle Ford Shale and Permian Basin areas. As such, pipeline companies have been paying landowners for years for the rights to lay pipeline across the landowners’ property. As the oil boom continues to surge, though, pipeline companies are paying landowners more than ever before.
Take, for example, the 2014 case set in Johnson County in Texas, where Peregrine Pipeline Co. offered $80,000 to a landowner for the rights to lay pipeline across one mile of vacant land. When the landowner stated that he believed the price to be much too low, the case went to court. The outcome? The Johnson County jury agreed with the landowner—the price was too low. As a result, the landowner was awarded a higher offer, a much higher offer: $1.6 million, plus interest, to be exact.
But the example of Peregrine isn’t the only one in the state; juries awarded $650,000 in 2010 to a family in McMullen County, and nearly $800,000 to a family in Denton County in the same year.
Why the High Payouts?
Like any basic case of supply and demand, both landowners and pipeline companies in Texas have realized that the demand for land is worth more than it has ever been before. As the production of oil and natural gas continues to increase to almost unheard of rates, the oil and gas industry is struggling to lay pipelines quickly enough to keep up with the surge. As such, in order to operate as quickly and efficiently as possible, they’re offering big payouts to landowners. And if they don’t, the landowners are countering with higher offers, when understanding the value of their property. Plus, because of the high costs of going to court—both financially and in relation to time—pipeline companies are more and more willing to pay higher amounts to landowners to avoid a courtroom debacle.
Texas and Colorado Triumph as Havens for First-Time Homebuyers
By Phil Hall
As the Labor Day weekend marked the unofficial end to summer, the latest mortgage application data reaffirmed a continuing sense of stagnation. But while many mortgage professionals view the fall months as a prime season for new housing activity, one key concern arises on whether first-time home buyers will be able to participate in the market. In a recent survey, it seemed that Texas and Colorado have taken the lead as the nation’s top states for attracting first-time home buyers.
First, let’s consider how summer wrapped in housing. According to data from the Mortgage Bankers Association’s (MBA) Weekly Mortgage Application Survey for the week ending Aug. 29, the Market Composite Index increased 0.2 percent on a seasonally adjusted basis, but decreased one percent on an unadjusted basis from one week earlier. The seasonally adjusted Purchase Index decreased two percent from one week earlier, while the unadjusted Purchase Index decreased four percent compared with the previous week and was 12 percent lower than the same week one year ago.
In comparison, the Refinance Index increased one percent from the previous week and the refinance share of mortgage activity increased to 57 percent of total applications, the highest level since March 2014, from 56 percent the previous week.
The challenge of attracting first-time home buyers to the market has perplexed many across the industry, especially in view of the macroeconomic challenges that impact the U.S. population. However, there are certain slices of the national picture that appear to be enjoying much more first-time home buyer activity than others.
In a survey recently released by WalletHub, 11 of the top 20 markets considered to be the best for first-time homebuyers are located in Texas, while six of the top 20 markets can be found in Colorado. Oklahoma ranked at number one (with Broken Arrow) and number three (with Norman).
On the flip side, the 20 markets considered to be the least-friendly for first-time homebuyers were divided primarily between California, New Jersey, Connecticut and Massachusetts. The city of Richmond, Calif., ranked dead last on WalletHub’s list, which covered 300 local markets, while California cities monopolized the bottom-five rungs for both lowest housing affordability and highest price to rent ratio (Santa Barbara came in dead last in both categories). The one area where California outpaced the rest of the nation came in lowest property crime rate per capita, with Mission Viejo taking the first spot; Miami Beach had the highest property crime rate per capita.
Richie Bernardo, a WalletHub financial writer who presented the data, noted that the determination for these finds were based on a variety of factors, ranging from housing-related factors (including affordability, price to rent ratios, real estate taxes and home price appreciation) and standard of living considerations (including median annual income rates, property crime statistics and home energy costs).
“Those markets at the top of the list tend to have the highest incomes and lowest costs of living,” said Bernardo, adding that the inclusion of non-housing data was included to provide “a well-rounded perspective” on the national picture.
 For Texas-focused mortgage professionals, the Lone Star State’s dominance came as no surprise.
“Texas has a thriving economy,” said Mark Greco, president of Austin-based 360 Mortgage Group LLC. “Gov. Rick Perry did an incredible job in getting the word out about how great Texas is. In terms of land mass, the state has a tremendous amount of potential for builders. There is also no state income tax–and we have a huge amount of people moving into Texas from California. Compared to California, Texas is a bargain.”
Greco added that he has been a witness to the bold expansion of the Texas residential markets. “I’ve been here pretty much all of my life,” Greco continued. “I’ve seen Austin grow from 350,000 to just under two million people. A lot of corporations have moved here, and a lot of young talent that commerce has attracted to Austin and central Texas.”
Greco noted, with a laugh, that there was one downside to this boom.
“From an economic perspective, there has been great growth–but from a personal perspective, I wish everyone would get off the road so we would have less traffic,” noted Greco.
Todd Potter, senior vice president and national sales manager for Houston-based Envoy Mortgage, observed that the ethnic and racial demographics in Texas are also helping to encourage first-time home buyers.
“In looking at statistics from the MBA, the minority home ownership percentage has been growing at a much faster pace than other segments of the marketplace,” said Potter. “The MBA projects that about 40 percent of the mortgage market by the end of 2020. Texas, of course, is north of Mexico, and the pride of home ownership for the Hispanic population is very strong. I wouldn’t think that New England or the Northeast or the upper-Northwest would see that sort of growth.”
 As for the Colorado market, Erick Strobel, owner and operator of Johnstown, Colo.-based Strobel Financial LLC, was not the least bit surprised by its strong showing in the WalletHub top 20.
“Colorado cities have scored well as the best places to live and best markets for first-time homebuyers as a result of job opportunities, family safety, beauty, space to build and moderate weather,” Strobel said. “As a resident for 30 years, I can say it has been an ideal place to raise a family and own a home. Opportunity continues to be available through the many universities, biotech companies, Denver International Airport and military bases. Families here take refuge in healthy lifestyles, organic foods and beautiful places to visit. The big secret is the weather–moderate winters, and mild, mostly sunny, days convince people to stay.”
However, the WalletHub list had a couple of anomalies: Detroit ranked first for lowest price to rent ratio and second for highest housing affordability, but last for lowest median home price appreciation. Honolulu ranked first for lowest real estate tax rate, but came in last for highest total home energy costs.
Midland Unemployment Remains Below 3%
City’s labor force passes 100,000 for first time.

Stability continues to dominate Midland’s labor market as summer progresses.
Midland’s unemployment rate inched up to 2.9 percent in July from 2.8 percent in June but is well below the 3.6 percent reported last July, the Texas Workforce Commission said Friday. Midland continues to report the state’s lowest unemployment, followed by Odessa at 3.6 percent.
For the first time, Midland’s civilian labor force crossed the 100,000 mark, with the commission putting the labor force at 100,121, up from 98,462 in June.
Midland Mayor Jerry Morales said Midlanders need to understand the city’s population is growing at a 3.5 percent to 4 percent annual rate. Normal growth rate for communities Midland’s size is 1 percent to 1.5 percent, he said.
With more than 100,000 residents at work, “we really need to work on housing, road infrastructure and annexing more land,” he said.
He said he is excited to see so many people working in the community and pleased that Midland has plentiful jobs.
“All industries are looking for all kinds of workers,” he said.
Willie Taylor, chief executive officer of Workforce Solutions Permian Basin, said there is a demand for a wide variety of jobs, from teachers to medical workers to truck drivers. The Permian Basin is “definitely” a job-seeker’s market, he said.
He said he is amazed at the continued growth, given the intense competition for workers.
“Look at the pipeline of potential workforce and work with our schools, our colleges, retired residents returning to the workforce, those recruited from the military,” Taylor said. “There’s a lot of competition and for us to grow as we have is amazing.
“Our biggest concern is making sure we have an adequate workforce.”
Job creation in Midland grew significantly, with 900 jobs being added from June to July for a 1 percent growth rate. Midland’s dominant industrial sector — mining, logging and transportation — continued to dominate job growth, adding 600 jobs from June to July for a 2.2 percent growth rate. Trade, transportation and utilities, financial activities, professional and business services and other services added 100 jobs each. The only loss was 100 jobs in leisure and hospitality. The remaining industrial sectors were unchanged.
For the 12 months between July 2013 and July 2014, Midland added 5,300 new jobs for a growth rate of 6.2 percent. Mining, logging and construction added 3,400 new jobs for a 13.9 percent growth rate. Trade, transportation and utilities added 700 new jobs during that time, followed by leisure and hospitality with 500 new jobs. The only job losses were in education and health services, down 300 jobs, and information, down 100 jobs.
Statewide, the unemployment rate was 5.1 percent, unchanged for the third consecutive month. The state added 46,600 seasonally adjusted non-farm jobs, the commission reported.
“Texas employers continue to propel the Texas economy’s expansion by adding 396,200 jobs over the last year, a 3.5 percent annual growth rate,” said Andres Alcantar, TWC chairman. “The Texas economic engine is strong, with every major industry posting positive annual growth in July.”
All major industries in Texas expanded last month, with professional and business services leading the way by adding 10,600 jobs in July.
“The professional and business services industry is thriving, with opportunities that range from legal advice and representation to security guards to landscaping,” said Commissioner Ronny Congleton. “Industries across the board are hiring, and that is good news for job seekers in Texas.”
Private employers added 42,400 jobs in July, said Commissioner Hope Andrade.
“Mining and logging posted an annual growth rate of 7.8 percent in July, which marked the 51st consecutive month of positive annual growth and underscored the industry’s role in the state’s overall economic success,” Andrade said.
While Midland had the state’s lowest unemployment, the highest was in McAllen-Edinburg-Mission at 9.9 percent.
Just The Facts:
Preliminary local jobless rates for July with June numbers in parentheses:
Preliminary local jobless rates for July with June numbers in parentheses:
Midland 2.9 (2.8)
Odessa 3.6 (3.5)
Amarillo 4.1 (4.0)
Abilene 4.5 (4.4)
San Angelo 4.5 (4.3)
Austin-Round Rock-San Marcos 4.6 (4.4)
Victoria 4.6 (4.5)
College Station-Bryan 4.7 (4.6)
Lubbock 4.7 (4.5)
Longview 4.9 (4.8)
San Antonio-New Braunfels 5.2 (5.1)
Corpus Christi 5.4 (5.3)
Fort Worth-Arlington 5.4 (5.3)
Sherman-Denison 5.4 (5.3)
Dallas-Plano-Irving 5.5 (5.4)
Houston-Sugar Land-Baytown 5.5 (5.4)
Tyler 5.5 (5.4)
Wichita Falls 5.6 (5.4)
Waco 5.8 (5.6)
Laredo 6.3 (6.2)
Killeen-Temple-Fort Hood 6.4 (6.2)
Texarkana 6.5 (6.3)
El Paso 7.7 (7.6)
Beaumont-Port Arthur 8.3 (7.8)
Brownsville-Harlingen 8.9 (8.8)
McAllen-Edinburg-Mission 9.9 (9.6)

You must be logged in to post a comment.