Tag Archives: real estate market

Real Estate Just Did It

Home prices cool at a record pace as real estate sales grind down further every week across America. While some people are still wondering when real estate prices will go down, I am here to explain how the housing crash has already begun!

Referenced In The Video: Home prices cooled at a record pace in June, according to housing data firm

Continue reading

From Ice-Cold to Hot: Daily Pending Home Sales in May so Far, 15 Cities Around the US

A near-real-time roller-coaster of home sales during the pandemic via charts.

(Wolf Richter) On May 28, I reported how the National Association of Realtors’ Pending Home Sales Index for the US had plunged 34% in April. These are sales where contracts were signed in April, and were expected to close over the next month or two. The index gives a preview of what closed sales in May might look like. In the comments, some people said that sales in their bailiwick were jumping while others said that sales were slow. Real estate is local.

So here are pending sales – with contracts reported as signed in May through May 24th, for 15 big metro areas in the US, computed daily and shown as a 7-day moving average. The data is compiled by real-estate brokerage Redfin, from local multiple listing service (MLS) and Redfin’s own data, and was released at the end of the week. The charts are also from Redfin. However, the data is not available for every major city. The percentage in red indicates the change of the 7-day moving average through May 24 this year compared to the same period last year.

And let me assure you that real estate is local, that “nothing goes to heck in a straight line,” as it says on our WOLF STREET beer mugs, and that sales are headed in astonishingly different directions depending on the local market, from red-hot to ice-cold, with whiplash effect, sometimes in the same state as in Texas.

WTF?!? Did pent-up demand from people who’d gotten stir-crazy suddenly collide with the oil bust? Will Houston show a similar phenomenon in a week or two? A mystery for now.

I couldn’t find Miami data in the Redfin data base, so Tampa will do.

I couldn’t pull up the pending sales data for New York City. So here is Nassau County, on Long Island:

I couldn’t get the data for Boston, so west we go. 

I couldn’t get Redfin data on Nashville, St. Louis, Detroit, and Kansas City. But here is Minneapolis.

So this was the grand tour of the pending home-sales roller-coaster during the pandemic, with whiplash and all.

Source: by Wolf Richter | Wolf Street 

Real Estate Outperforms Amid Broader Selloff

Summary

  • Amid rising trade and political tensions, US equities dipped nearly 6% this week, the worst weekly performance in two years. REITs fell 5% while home builders declined 3%.
  • A flurry of headlines reignited volatility this week including a Fed rate hike, retaliatory tariffs from China, a major data breach at Facebook, and a $1.3 trillion spending bill.
  • Investors are increasingly anxious that protectionism threatens to upend the best period of global economic growth in a decade. Real estate sectors are relatively immune from these negative effects.
  • Yield-sensitive equity sectors, including REITs and home builders, have outperformed during the past month as interest rates and inflation expectations have retreated.
  • The effects of tax reform and rising mortgage rates are beginning to impact housing markets. Existing home sales are higher by just 1% as first-time buyers remain on the sidelines.

Real Estate Weekly Review

https://static.seekingalpha.com/uploads/2018/3/1723581_15218546978091_rId7.png

2017 was a year of remarkable tranquility in financial markets, but 2018 has been quite the opposite. After going an entire year without a 2% weekly move, the S&P 500 (SPY) has recorded eight such weekly moves through the first twelve weeks of 2018. This week, volatility was reignited by a flurry of headlines centering around US trade policy, a political “data breach” at Facebook (NASDAQ:FB), a “hawkish hike” by the Federal Reserve, and a $1.3 trillion spending bill.

This week, the S&P 500 (SPY) dipped nearly 6%, which was the worst week for US stocks in more than two years. Investors are increasingly anxious that rising protectionism threatens to upend the best period of global economic growth in a decade. Others, however, remain confident that the Trump administration’s hard-line stance on trade is a negotiating tactic that will inevitably result in lower overall trade barriers. Real estate sectors are relatively immune from these effects. REITs (VNQ and IYR) and home builders (XHB and ITB) outperformed this week, dropping 5% and 3%, respectively. Yield-sensitive equity sectors, including REITs and home builders, have outperformed over the past month as interest rates and inflation expectations retreated.

https://static.seekingalpha.com/uploads/2018/3/1723581_15218546978091_rId8.png

(Hoya Capital Real Estate, Performance as of 4pm Friday)

The 10-Year Yield ended the week 2bps lower at 2.83% after climbing to 2.90% following the Federal Reserve’s “hawkish hike.” The Fed hiked short-term rates by 25bps, as expected, but compared to the last meeting, more Fed officials now expect four rate hikes in 2018. Since inflation remains relatively subdued, investors fear that a rate-hike plan this aggressive may be unnecessarily restrictive and slow the US economy, indicated by the flattening yield curve.

Across other areas of the real estate sector, mortgage REITs (REM) declined by nearly 4% while international real estate (VNQI) fell roughly 3%. Within the Equity Income categories, we note the performance and current income yield of the Utilities, Telecom, Consumer Staples, Financials, and Energy. Within the Fixed Income categories, we look at Short-, Medium-, and Long-Term Treasuries, as well as Investment Grade and High Yield Corporates, Municipal Bonds, and Global Bonds.

https://static.seekingalpha.com/uploads/2018/3/1723581_15218546978091_rId9.png

Cell towers, manufactured housing, malls, self-storage were the best performing sectors of the week. Winners this week included Washington Prime (WPG), Crown Castle (CCI), SBA Communications (SBAC), Tanger (SKT), American Homes (AMH), and Taubman (TCO). Growth REIT sectors including hotels, office, and industrials were among the weakest-performing. DiamondRock (DRH), Brandywine (BDN), Pebblebrook (PEB), and QTS (QTS) each dropped more than 9% this week.

https://static.seekingalpha.com/uploads/2018/3/24/1723581-15219040216662648_origin.png

REITs are now lower by nearly 12% YTD, under performing the 4% rise in the S&P 500. Home builders are off by 11%. REITs remain more than 20% off their all-time highs in 2016. The 10-Year Yield has climbed 43 basis points since the start of the year.

https://static.seekingalpha.com/uploads/2018/3/1723581_15218546978091_rId11.png

REITs ended 2017 with a total return of roughly 5%, lower than the 20-year average annual return of 12%. Going forward, absent continued cap-rate compression, it is reasonable to expect REITs to return an average of 6-8% per year with an annual standard deviation averaging 5-15%. This risk/return profile is roughly in line with large-cap US equities.

https://static.seekingalpha.com/uploads/2018/3/1723581_15218546978091_rId12.png

Real Estate Economic Data

https://static.seekingalpha.com/uploads/2018/3/1723581_15218546978091_rId13.png

(Hoya Capital Real Estate, HousingWire)

New and Existing Home Sales Continue to Be Soft

Last week, we analyzed February housing starts data, which indicated that housing construction activity has slowed in recent quarters, dragged down by a sustained pullback in multifamily building. Single-family construction remains relatively solid, but rising mortgage rates and changes to the tax code threaten to stall the plodding housing recovery. Total housing starts have grown just 2.0% over the past twelve months, the slowest rate of growth since 2011.

https://static.seekingalpha.com/uploads/2018/3/1723581_15218546978091_rId14.png

This week, new and existing home sales data was released. Both new and existing home sales were strong in early 2017 but faded into year-end, likely due to rising mortgage rates, unaffordability issues, and continued tight supply levels. Existing homes were sold at a 5.54m seasonally adjusted annualized rate in February, slightly missing expectations. Existing sales have risen just 1% over the past year, the weakest rate of growth since early 2015.

New homes were sold at a 618k rate, which was roughly in line with expectations after upward revisions to past months. New home sales, which are primarily comprised of single-family homes, have been the relative bright spot, growing 7.5% on a TTM basis. This rate of growth, however, is also the second slowest since early 2015.

https://static.seekingalpha.com/uploads/2018/3/1723581_15218546978091_rId15.png

At roughly 600k per year, the rate of new home sales remains well below pre-recession levels and remains low by historical standards. The period between 1970 and 2000 saw an average of 650k home sales per year while the average population during that time was 30-40% below current levels. The rate of existing home sales, however, remains relatively healthy. At around 7% per year, the turnover rate of existing homes is roughly in line with pre-2000 levels. A number of factors have contributed to the “wide bottom” in new single-family housing construction: the lingering effects of overbuilding in the run-up to the housing bubble, a generational shift to renting, restrictive zoning restrictions, and lower investment returns from home building.

https://static.seekingalpha.com/uploads/2018/3/1723581_15218546978091_rId16.png

Existing home inventory remains near historically low levels, primarily a result of this “wide bottom” in new single-family housing construction. Existing housing supply was just 3.4 months in February, down from 3.8 months in February 2017. Other effects are at play, too, including the increased institutional presence in the single-family rental markets and the rising rate of home ownership among the older demographics. First-time home buyers made up 29% of total existing home sales, down from the 32% in February 2017. The rate of first-time home buyers remains stubbornly below the pre-bubble level of 40-45% and the bubble-peak of 52%. We have yet to see the younger demographics enter the home ownership markets in any significant numbers.

https://static.seekingalpha.com/uploads/2018/3/1723581_15218546978091_rId17.png

Real Estate Earnings Update

Last week, we published our Real Estate Earnings Review for 4Q17. Earnings season concluded last week in the real estate sector. Overall, 4Q17 results were slightly better than expected (80% beat or met estimates), but REITs raised caution heading into 2018. As supply growth has intensified, fundamentals continue to moderate across the real estate sector as rental markets approach supply/demand equilibrium after nearly a decade of above-trend rent growth. Same-store NOI grew 2.6% in 2017, the slowest rate of growth since 2011. Occupancy levels remain near record highs, however, as real estate demand growth continues to be robust.

https://static.seekingalpha.com/uploads/2018/3/1723581_15212187010916_rId25.jpg

Bottom Line

Amid rising trade and political tensions, US equities dipped nearly 6% this week, the worst weekly performance in two years. REITs fell 5% while home builders declined 3%. A flurry of headlines reignited volatility this week including a Fed rate hike, retaliatory tariffs from China, a major data breach at Facebook, and a $1.3 trillion spending bill. Investors are increasingly anxious that protectionism threatens to upend the best period of global economic growth in a decade. Real estate sectors are relatively immune from these negative effects.

Yield-sensitive equity sectors, including REITs and home builders, have outperformed during the past month as interest rates and inflation expectations have retreated. The effects of tax reform and rising mortgage rates are beginning to impact housing markets. Existing home sales are higher by just 1% as first-time buyers remain on the sidelines.

Last week, we published our quarterly update on the cell tower sector: Cell Tower REITs Shrug Off SpaceX Launch. Cell towers were the best performing REIT sector in 2017. After strong 4Q17 earnings results, cell towers remain the lone REIT sector in positive territory so far in 2018. The enormous spectacle of the SpaceX launch and the grand ambitions of Elon Musk to launch a competing satellite-based internet service temporarily jolted investor confidence in the sector. Despite potential competition from small-cells and satellite, macro towers continue to be the most economical way to provide comprehensive coverage. The risk of technological obsolescence is often overstated. Positive catalysts are on the horizon for 2018.

We also published our quarterly update on the industrial sector: Industrial REITs: Only A Trade War Can Spoil The Good Times. Over the past five years, industrial REITs have emerged as the hottest real estate sector. Booming global trade and the growth of e-commerce have boosted demand for warehouse distribution space. While supply growth has picked up in recent years, markets remain tight. Occupancy is near record highs, rent growth is relentless, and demand indicators suggest that there’s further room to run. Fears of a “trade war” have escalated after the US enacted tariffs on steel and aluminum imports. Uncertainty over trade policy could disrupt supply chains and weaken industrial REIT fundamentals.


So far, we have updated up REIT Rankings on the Industrial, Single Family Rental, Cell Tower, Apartment, Net Lease, Data Center, Mall, Manufactured Housing, Student Housing, and Storage sectors. We will continue our updates over the coming weeks.

Please add your comments if you have additional insight or opinions. We encourage readers to follow our Seeking Alpha page (click “Follow” at the top) to continue to stay up to date on our REIT rankings, weekly recaps, and analysis on the real estate and income sectors.

Source: Hoya Capital Real Estate | Seeking Alpha

US Home Sales Surge In June To Fastest Pace In 8-Plus Years

WASHINGTON (AP) — Americans bought homes in June at the fastest rate in over eight years, pushing prices to record highs as buyer demand has eclipsed the availability of houses on the market.

The National Association of Realtors said Wednesday that sales of existing homes climbed 3.2 percent last month to a seasonally adjusted annual rate of 5.49 million, the highest rate since February 2007. Sales have jumped 9.6 percent over the past 12 months, while the number of listings has risen just 0.4 percent.

Median home prices climbed 6.5 percent over the past 12 months to $236,400, the highest level reported by the Realtors not adjusted for inflation.

Home-buying has recently surged as more buyers are flooding into the real estate market. Robust hiring over the past 21 months and an economic recovery now in its sixth year have enabled more Americans to set aside money for a down payment. But the rising demand has failed to draw more sellers into the market, causing tight inventories and escalating prices that could cap sales growth.

“The recent pace can’t be sustained, but it points clearly to upside potential,” said Ian Shepherdson, chief economist at Pantheon Macroeconomics.

A mere five months’ supply of homes was on the market in June, compared to 5.5 months a year ago and an average of six months in a healthy market.

Some markets are barely adding any listings. The condominium market in Massachusetts contains just 1.8 months’ supply, according to a Federal Reserve report this month. The majority of real estate agents in the Atlanta Fed region – which ranges from Alabama to Florida- said that inventories were flat or falling over the past year.

Some of the recent sales burst appears to come from the prospect of low mortgage rates beginning to rise as the Federal Reserve considers raising a key interest rate from its near-zero level later this year. That possibility is prompting buyers to finalize sales before higher rates make borrowing costs prohibitively expensive, noted Daren Blomquist, a vice president at RealtyTrac, a housing analytics firm.

The premiums that the Federal Housing Administration charges to insure mortgages are also lower this year, further fueling buying activity, Blomquist said.

It’s also possible that home buyers are checking the market for listings more aggressively, making it possible for them to act fast with offers despite the lack of new inventory.

“Buyers can more quickly be alerted of new listings and also more conveniently access real estate data to help them pre-search a potential purchase before they even step foot in the property,” Blomquist said. “That may mean we don’t need such a large supply of inventory to feed growing sales.”

Properties typically sold last month in 34 days, the shortest time since the Realtors began tracking the figure in May 2011. There were fewer all-cash, individual investor and distressed home sales in the market, as more traditional buyers have returned.

Sales improved in all four geographical regions: Northeast, Midwest, South and West.

Still, the limited supplies could eventually prove to be a drag on sales growth in the coming months.

Ever rising home values are stretching the budgets of first-time buyers and owners looking to upgrade. As homes become less affordable, the current demand will likely taper off.

Home prices have increased nearly four times faster than wages, as average hourly earnings have risen just 2 percent over the past 12 months to $24.95 an hour, according to the Labor Department.

Some buyers are also bristling at the few available options on the market. Tony Smith, a Charlotte, North Carolina real estate broker, said some renters shopping for homes are now choosing instead to re-sign their leases and wait until a better selection of properties comes onto the market.

New construction has yet to satisfy rising demand, as builders are increasingly focused on the growing rental market.

Approved building permits rose increased 7.4 percent to an annual rate of 1.34 million in June, the highest level since July 2007, the Commerce Department said last week. Almost all of the gains came for apartment complexes, while permits for houses last month rose only 0.9 percent.

The share of Americans owning homes has fallen this year to a seasonally adjusted 63.8 percent, the lowest level since 1989.

Real estate had until recently lagged much of the six-year rebound from the recession, hobbled by the wave of foreclosures that came after the burst housing bubble.

But the job market found new traction in early 2014. Employers added 3.1 million jobs last year and are on pace to add 2.5 million jobs this year. As millions more Americans have found work, their new paychecks are increasingly going to housing, both in terms of renting and owning.

Low mortgage rates have also helped, although rates are now starting to climb to levels that could slow buying activity.

Average 30-year fixed rates were 4.09 percent last week, according to the mortgage giant Freddie Mac. The average has risen from a 52-week low of 3.59 percent.

for AP News

5 Real Estate Trusts To Outperform In 2015

by Morgan Myro

Summary

  • Economic conditions are ripe for real estate trusts with short-term leases to improve, while longer lease duration REIT types will advance at a reduced rate.
  • A presentation that suggests storage REITs are expensive and as such, other short-term lease property sectors are more desirable.
  • A review of 5 U.S. REITs set to outperform, specifically in the apartment and hotel spaces.

“Strength does not come from winning. Your struggles develop your strengths. When you go through hardships and decide not to surrender, that is strength.” – Arnold Schwarzenegger

One of the most popular long-term holdings for income investors involves the real estate market. While single-property investments carry returns through a landlord-type management system, whether personally attained or through a management company, REITs (real estate investment trusts) offer professionally managed real estate portfolios that operate property, manage an ideal portfolio and use leverage to grow.

An investor with an after-debt market value of $1 MM in a personal real estate book could offer between one and several properties depending on market value, as well as income which investors call the “nut.” While is well known, these mom-and-pop type investors could fare much better in terms of growth and reduced risk to trade their entire real estate portfolio (save their own home) for a slice of several multi-million and billion-dollar, professionally managed REITs that pay dividends.

With the U.S. economy expanding and rates set to rise, major implications signal that the environment exists now to favor REITs with short-term leases, especially in terms of single-family and longer-term lease holdings in the real estate market.

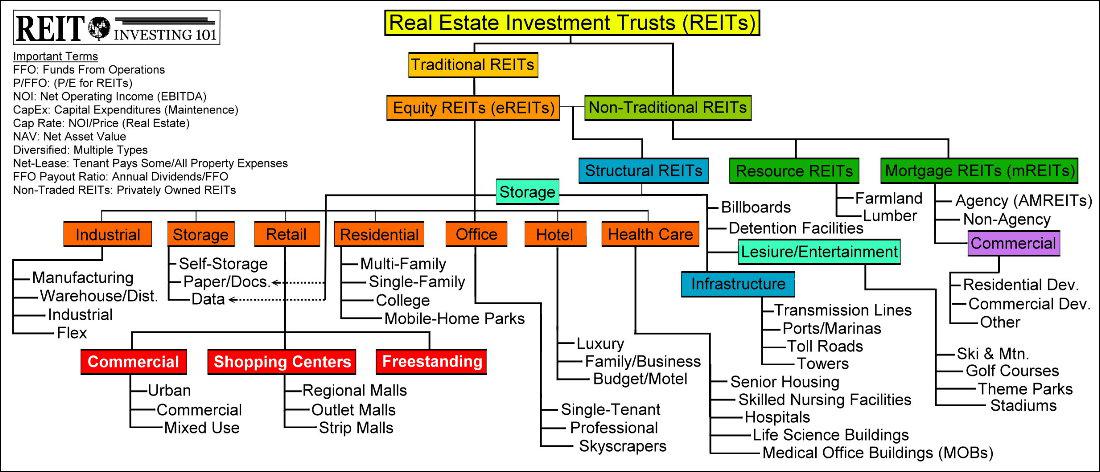
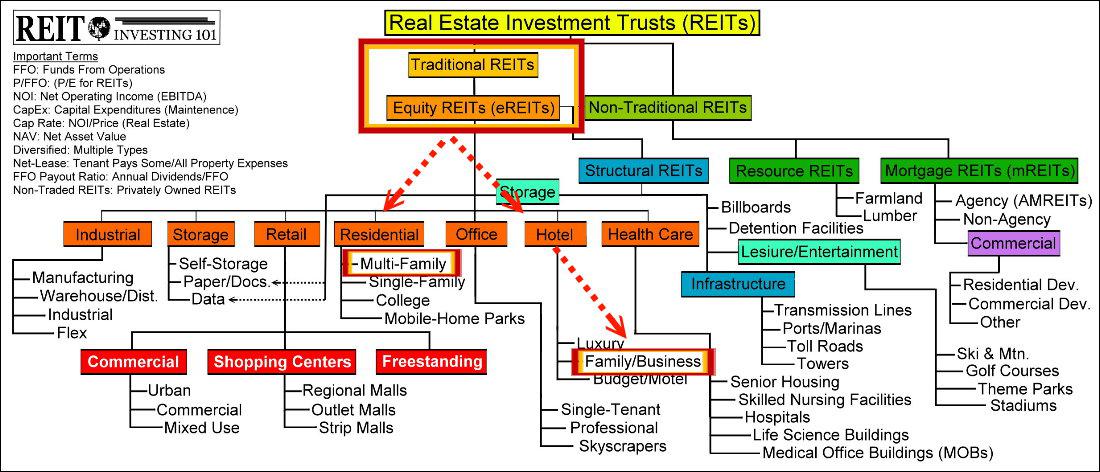
The U.S. REIT Market Sub-Sectors

The REIT market is heavily divided into several sub-sectors, such as hotels, apartments and healthcare. While there are non-traditional categories as well, such as resource, mortgage (mREITs) and structural REITs (such as cell phone towers, golf courses, etc…), this article focuses on what is known as traditional, equity REITs (eREITs).

The following map is a guide to discovering the wonderful world of REITs.

REIT Categories Set To Outperform Today

When it comes to REIT diversification, most investors classify their REIT portfolio in a traditional sense and avoid the non-traditional areas such as resource and mREITs. Income investors who do use mREITs to boost portfolio yield would be smart to categorize them as dividend stocks, as they do not generally own real estate.

Today the U.S. economy is fascinating investors as it continues to grow in the face of global turbulence, albeit at a slower post-recessionary recovery rate than normal. While this fact has caused concern, the economic trade-off is potentially very lucrative: slower long-term growth versus higher short-term growth followed by a recession.

In times of recession, short-term leases are not generally favorable as there is a general decline in demand for real estate. Those with long-term leases in stable sectors would be preferred, as companies such as Wal-Mart Stores, Inc. (NYSE:WMT) and other stable, long-term leaseholders would continue to operate.

In times of economic improvement, short-term leases are favored as there is a general uptick in demand for real estate. More people are working in upturns, which increases the supply of those looking to spend on all sorts of goods and services, of which real estate benefits.

Where Is The U.S. Economy Headed?

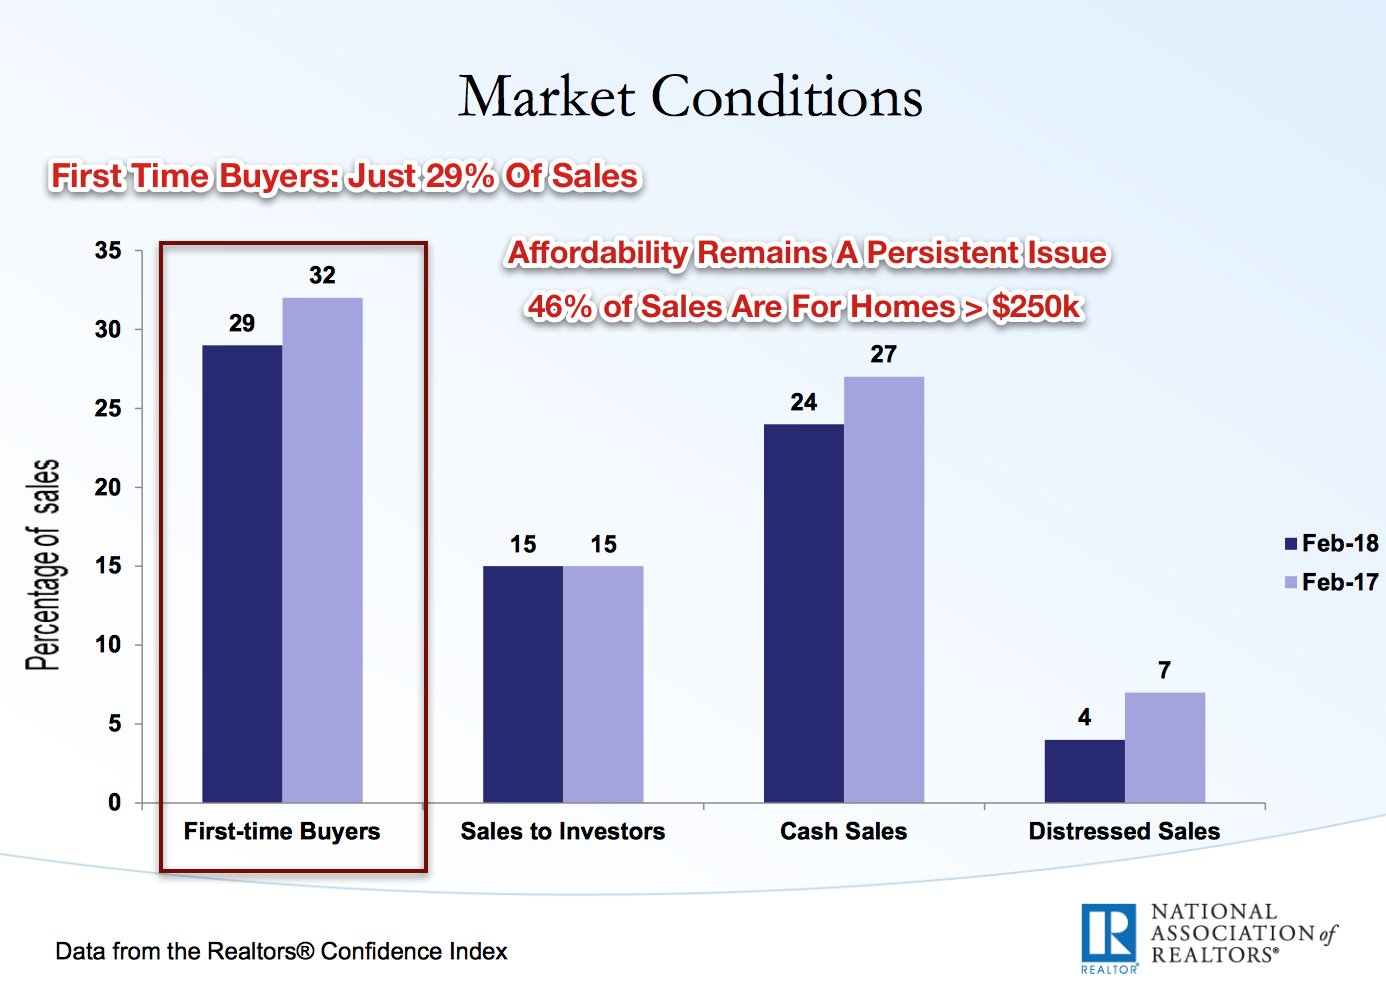
In looking at the U.S. unemployment rate, the clear trend is that more workers are entering the workforce (source: BLS) and that this trend will continue into 2015 with an estimated year-end unemployment rate of 5.2-5.3% (source: FOMC).

In addition to a trend of higher U.S. employment, U.S. GDP growth is also expected to continue to trend higher in 2015. The real GDP growth of 2.4% in 2014 is expected to increase to a range of 2.6% to 3.0% according to the Fed (central tendency), while Goldman Sachs (NYSE:GS) anticipates 3.1% growth on the heels of world GDP growth of 3.4%.

(click to enlarge)

In addition to favorable U.S. macroeconomic conditions, the U.S. dollar has trended higher in terms of both the U.S. dollar index versus leading currencies as well as in terms of emerging market and commodity nation currencies.

Termed currency risk, the flight to U.S. dollars increases the value of U.S. assets in terms of other global currencies while promoting the U.S. in terms of lowered-borrowing costs and an increase in investment demand.

All of these circumstances favor the U.S. real estate market and as such, the conditions for short-term lease operators in diversified publicly traded REITs are favorable for success.

5 Short-Term Lease REITs Set To Outperform

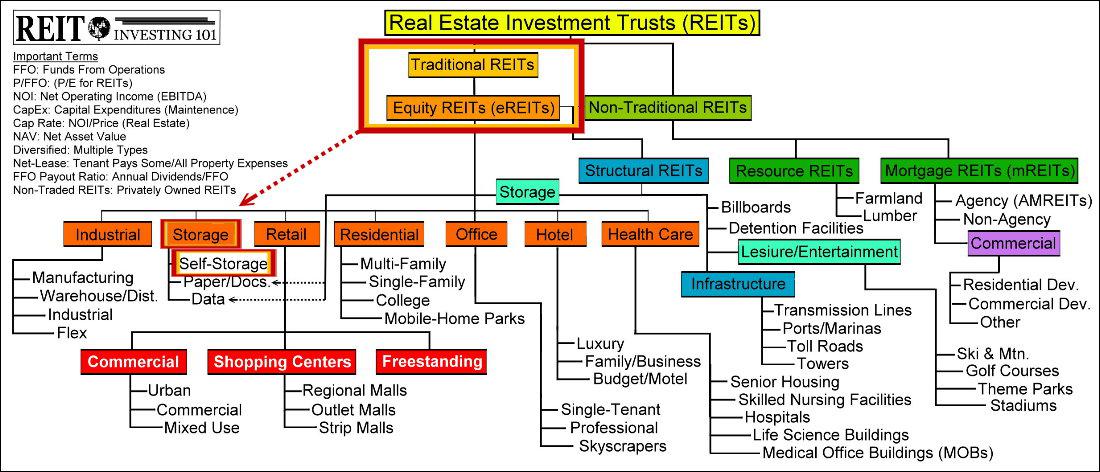
There are a few short-term lease operator types that may do well, which includes the residential, storage and hotel categories of the traditional REIT class.

While the self-storage outlook remains bright as this property sector has a short duration and a lower economic sensitivity to the business cycle, the aggregate sector valuation is high and the accompanying yields are relatively low with modest growth prospects.

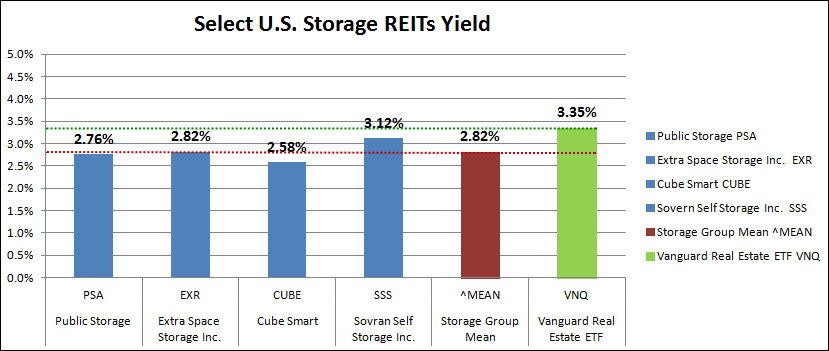
In addition to the high valuations and low yields, the top U.S. storage REITs have increased on average 26% in the past six months. The following charts include Public Storage (NYSE:PSA), Extra Space Storage Inc. (NYSE:EXR), Cube Smart (NYSE:CUBE), and Sovran Self Storage Inc. (NYSE:SSS).

These companies are all large players in the self-storage segment of the traditional, equity REIT class.

(click to enlarge)

There has been a huge run-up in the self-storage REITs over the past six months, with annualized returns of 52.89% on an equal-weighted average. When compared to the U.S. traditional equity REIT market as represented by the Vanguard REIT ETF (NYSEARCA:VNQ), self-storage has significantly outperformed.

(click to enlarge)

In looking at the average yield in the self-storage property sector versus the VNQ, self-storage is more expensive.

(click to enlarge)

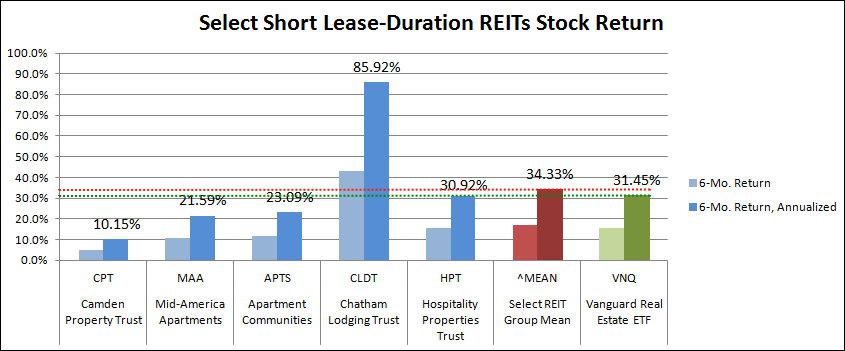
With the apartment and hotel sectors, there are companies that offer above-average yields while taking advantage of the short lease-durations that should outperform in conjunction with U.S. economic growth.

(click to enlarge)

To refocus on the lease durations, hotels are able to raise prices very quickly, while apartment landlords may increase rents after a year. Also, to note, the barriers to entry are constrained in a construction/approval cycle of two years for hotels and 1 to 1.5 years for the hotel and apartment landlords, respectively. Finally, the economic sensitivity is highest here, which equates to a faster uptick in demand during economic booms.

Hotel & Apartment Landlords To Outperform

The larger REITs in any property sector are generally more expensive versus smaller peers, which equates to a lower dividend and much larger acquisitions or developments needed (relative to smaller peers) to move the growth needle.

As seen by the average annualized six-month return of the five hotel and apartment REITs selected for this portfolio versus the VNQ, there hasn’t been such a dramatic over-performance versus the traditional equity REIT index.

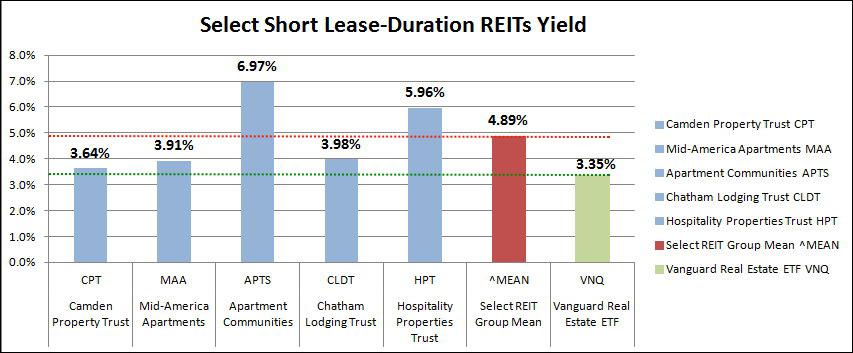
In terms of yield, the group here easily outperforms the VNQ as well, with an average yield of 4.89%, versus 3.35% for VNQ. This represents 46% more income for investors of this select REIT portfolio versus the VNQ.

1. Camden Property Trust (NYSE:CPT)

Camden is the top under $10 billion apartment community landlord that focuses on high-growth markets in the sun-belt states.

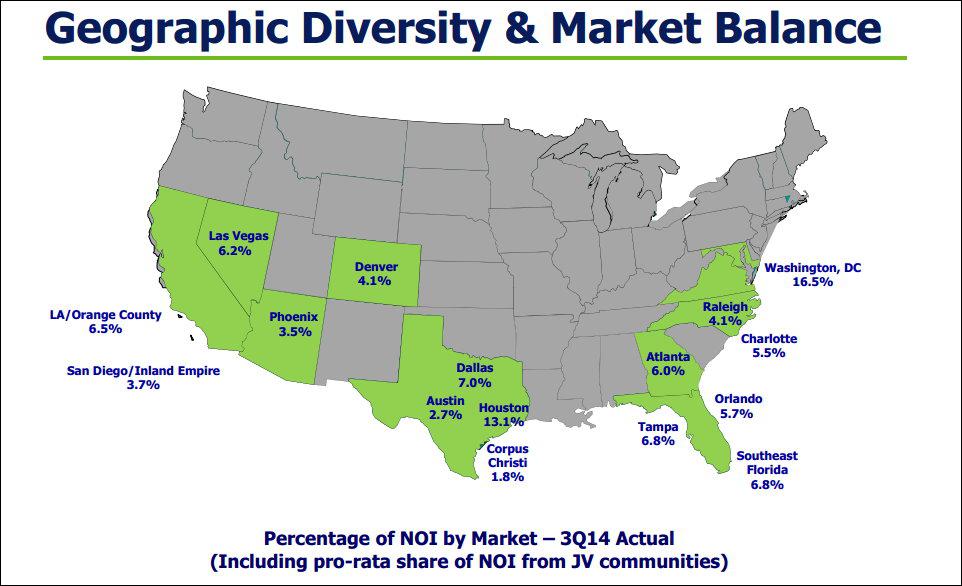
Camden’s Diversified Portfolio As Of 11/5/14

The company recently announced a raise to their quarterly dividend by 6.1% and as such, their 5-year CAGR (compound annual growth rate) of their dividend is an impressive 9.24%.

The company also has $1 billion in development projects that are currently in construction and has $684 million in the pipeline for future development. Using the midpoint of 2015 FFO guidance of $4.46 per share and a share price of $76.99, the company has a FWD P/FFO ratio of 17.26, or a FWD FFO yield of 5.8%.

2. Mid-America Apartment Communities (NYSE:MAA)

Mid-America Apartment Communities is slightly smaller than CPT with a market capitalization of $5.92 billion versus CPT’s $6.83 billion. MAA is also a takeover candidate, as the company is valued at much less than CPT (16.1x 2014 FFO versus CPT 18.3x 2014 FFO) but has a very similar and overlapping portfolio.

MAA raised their dividend 5.5% this year and over the past five years, the company has a dividend CAGR of 4.6%.

3. Preferred Apartment Communities (NYSEMKT:APTS)

APTS is a new player to the U.S. REIT market; however, it is only valued at 9.69x 2014 FFO and is run by John Williams, the founder of Post Properties Inc. (NYSE:PPS), a $3.3 billion apartment landlord and developer.

APTS Property Map

The company recently traded at $10.05 per share, just above the 2011 IPO price of $10. Regarding the dividend, the quarterly payout was raised 9.4% in December 2014.

From their first December payout of $0.125 in 2011 to the recent December 2014 payout of $0.175 (due to short operating history), the company has a three-year dividend CAGR of 11.87%, which is higher than both CPT and MAA’s 5-year CAGR.

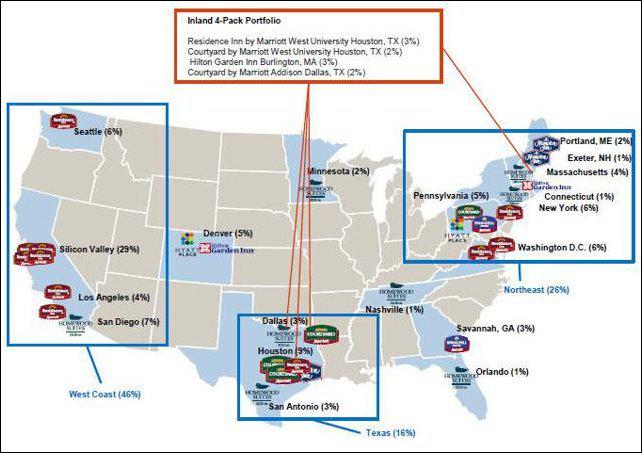
4. Chatham Lodging Trust (NYSE:CLDT)

Chatham is a small-cap hotel operator that has shown significant growth over the past year. They have converted the dividend to monthly distributions, which is sure to appease income investors. Since going public in 2010, the dividend has increased by an average of 11.38% per year.

Chatham is an owner of the business/family segment of the hotel properties. Name brands include Residence at Marriott, Courtyard by Marriott, Homewood Suites by Hilton, Hyatt Place and Hampton Inn. While diversified, the company has a major interest in Silicon Valley, CA, home of several major U.S. technology companies.

The company just financed a secondary offering that raised ~$120 million in gross proceeds, which surely will help fuel future growth in same-store sales as well as property acquisitions.

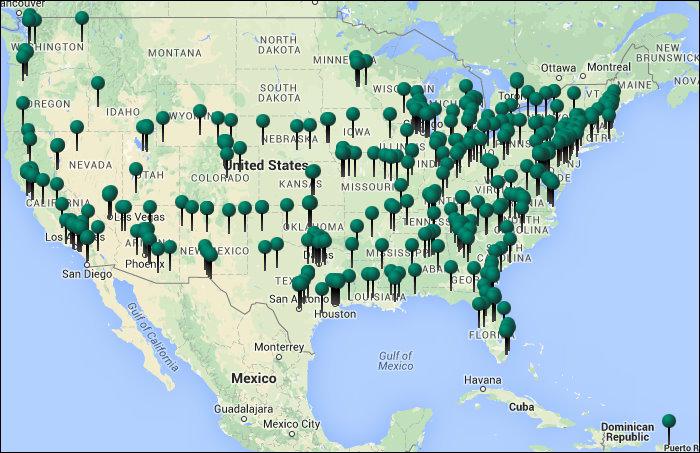
5. Hospitality Properties Trust (NYSE:HPT)

Hospitality Properties Trust is the owner of hotels as well as travel centers throughout the U.S. They own mid-tier hotels in a similar fashion to Chatham, including similarly branded properties such as Courtyard by Marriott and Residence Inn by Marriott.

HPT Property Map

With gas prices down and the economy up, both car travel and commercial trucking should have strong demand this year. As such, the travel center aspect of the business should do well.

The company offers a high-yield of ~6% currently, however the five-year dividend CAGR is less impressive at 1.72%. Investors should look at this company to operate in more of a bond-like fashion, with limited dividend increases and a slow increase in the value of the stock.

Conclusion

While many investors have suffered losses from the energy sector as well as many foreign holdings over the past year, one can only look forward to succeed. With the economic conditions ripe for short lease-duration U.S. REITs to advance, the potential return within this area of investment is too alluring to ignore.

When considering hotels, apartments and storage, storage looks expensive with a huge recent run-up while hotels and apartments look appealing. Rather than surrender to index investing, smart investors may choose to strengthen their portfolio with hotel and apartment REITs that are positioned today for continued growth and above-average dividend distributions.

To learn more about CPT, MAA and APTS, please read “Currency Risk: The New Normal,” published February 3, 2015.

To learn more about CLDT and HPT, please read Chatham Lodging Trust: Still An Attractive Yield PlayandHospitality Properties Trust: High-Yield Play Continues To Deliver,” both published by Bret Jensen on December 11, 2014 and August 12, 2014, respectively.

To learn more about property sector lease durations and characteristics of these sectors, please read Cohen & Steers July 2014 Viewpoint report, “What History Tells Us About REITs And Rising Rates.”

Farm Mortgage Lending Faces Leaner Times After Run-Up

Source: National Mortgage News

No, it’s not the national real estate market. U.S. home values are still 9% lower than the last cyclical peak, according to the Mortgage Bankers Association. (Though that last peak deflated with a bang, so keep an eye out.) I’m talking about a niche market, though it is a sizeable one, with $3 trillion in assets and more than $300 billion in outstanding loans.

The farm mortgage market is a funny animal, dominated by a hybrid residential-commercial mortgage (though much more like commercial) along with a sizeable amount (about 40% now) of non-real estate production loans. Still, according to the U.S. Department of Agriculture, farm debt will reach $316 million this year, with $187 billion of that in real estate loans. And that $187 billion is an amount that has jumped 20% since 2010.

Farmers have been benefiting from steady increases in the prices of commodities in recent years, some of it driven by extreme weather. But the underpinnings of that growth seem to be on the wane now. The USDA is projecting a 22% drop in farm cash income for this year, to $102 billion from $130 billion. And crop receipts are projected to fall by 12%. “The average prices for corn, wheat, soybeans, cotton, vegetables and melons are expected to decline in 2014,” says the American Bankers Association.

That’s bad news for farm real estate, where the land becomes more valuable the higher the prices it yields on crops, and it bodes poorly for lending against such property. The USDA predicts such debt will grow by 3.2% this year, about a third less than it did last year.
Consultant Bert Ely, who writes about Farm Credit System issues for the ABA, agrees with me that the market is “getting a little frothy. But it’s not going to be as bad as it was in the early 1980s,” he says, referring to the last big farm disaster. “Whatever dropoff there is isn’t going to be as much.”

The ABA’s performance report on farm banks (it counts 2,152 of them) for 2013 agrees. “One area of concern for farm bankers and their regulators has been the rapid appreciation of farmland values in some areas of the country,” it says. “However, the run up in farmland values so far is not a credit driven event. Farm banks are actively managing risk associated with agricultural lending and underwriting standards on farm real estate loans are very conservative.”

Farm lenders commenting in a video discussion of ABA’s report see no immediate need to worry. “I’m pretty optimistic [on the outlook for 2014] even though prices are reduced from what they were,” says Kreg Denton, a senior vice president at First Community Bank in Fancy Farm, Ky. “Farmers in our area have gotten themselves in pretty good shape as far as finances are concerned.”

Nate Franzen, the ag division president at First Dakota National Bank in Yankton, S.D., says credit quality is “strong,” though he admits “there’s a little more stress than in the past.” Still, “It’s not any type of disaster at this point.” Is there potential turbulence ahead? “Ag is cyclical,” Franzen says. “We need to plan for tougher times. As long as we do that, everything will be fine.”

How big has the run up in prices been? The USDA says farm real estate values hit $2,900 an acre in 2013, up 9% from 2012. Cropland popped 13%, to $4,000 an acre. That seems pretty frothy, indeed.

Some areas of the country are also looking overheated for farm debt. The Northeast region saw farmland loans increase 30% last year, ABA finds. Of course, the Northeast isn’t the biggest farming sector in the country. But all other sectors saw healthy jumps, with the South up 5%, the Corn Belt up 8%, the West 9% and the Plains 10%.

Just as farm mortgages are quite a bit different than residential ones, the lenders in the area are a bit of a different cohort as well. The share leader is the Farm Credit System associations, specialized farm lenders funded by an arm of the country’s oldest government-sponsored enterprise, the Farm Credit Administration. The Farm Credit System lenders, which lend but do not take deposits, have a little less than half of the farm real estate loans outstanding. Commercial banks have about a third of the market, and are followed by life insurance companies and individuals, which together have more than $25 billion in farm real estate debt.

Commercial banks, however, are smarting over what they see as unfair advantages enjoyed by Farm Credit System lenders, including funding costs. “GSEs borrow very cheaply and at the long end of the yield curve,” Ely says, noting that spreads for farm debt recently came to 54 basis points over the 10-year Treasury and 33 basis points for seven years. And, Farm Credit System lenders’ profits from real estate lending are exempt from all taxation.

Taking a look at some typical FCS lenders, New Mexico has a total of two that seem to be doing well. Ag New Mexico of Clovis is fairly small, at $185 million in assets. Farm Credit of New Mexico, based in Albuquerque, is much larger, at $1.4 billion in assets. Both are well capitalized, Ag New Mexico at 17% capital-to-assets and Farm Credit at 22% at the end of last year, according to call reports they filed with FCA. Both saw profits increase in the last half of 2013, from $1.4 million at June 30 to $2.9 million at yearend for the smaller institution, and from $14 million to $26 million for the bigger one.

New York’s MetLife is an example of a life insurer with a big interest in agricultural mortgages (it says it has been in this field since 1917). It says it originated $3 billion in ag mortgages in 2012. Interestingly, $300 million of that volume went out of country, to Brazilian farmers. Its total ag portfolio was nearly $13 billion at yearend 2012.

As those Brazilian farmers doubtless know, froth is great for specialty coffee. But it’s not so good for specialty finance.