
A new rule from the Biden administration will force homebuyers with good credit scores to pay higher mortgage rates in order to subsidize loans to those with riskier borrowing profiles, the Washington Times reports.
Tag Archives: affordable housing
California To Front 20% Down Payments With 0% Interest For Homebuyers With Incomes Up To $211,000
California homebuyers making up to $211,000 annually will be able to receive a 20% down payment, and all closing costs, at a 0% interest rate.
Rate Hikes Jeopardize Much More Than Just American Home Ownership
(J.G. Collins) Someone once said that you never actually “buy” a home. Instead, you merely commit to paying an annuity: the mortgage.
That’s largely true. The price and “value” of homes for the overwhelming majority of homeowners is a function of home buyers’ ability to make payments.
And with the Federal Reserve signaling further interest rate hikes, home buyers and sellers—and assorted others who use credit—will incur knock-on effects from those increases.
Want To Own Apartment Buildings? Buy Distressed Hotels For Pennies On The Dollar
(Diana Olick) Communities are desperate for more affordable housing, but the cost for developers is just too high. Land, labor and materials were pricey before the pandemic, and they are even more so now.
That is why some creative developers are now turning to hotels – and it appears to be a match made in real estate heaven.
US Home Price Gains Slump For 12th Straight Month, Weakest In 7 Years
Case-Shiller’s March home price index showed yet another deceleration in growth – the 12 months in a row of slowing equals the 2014 growth scare’s length but is the weakest growth since July 2012.
After February’s 20-City Composite 3.00% YoY print, expectations were for 2.55% growth in March and it surprised very modestly with a 2.68% YoY print (still the lowest in 7 years)…
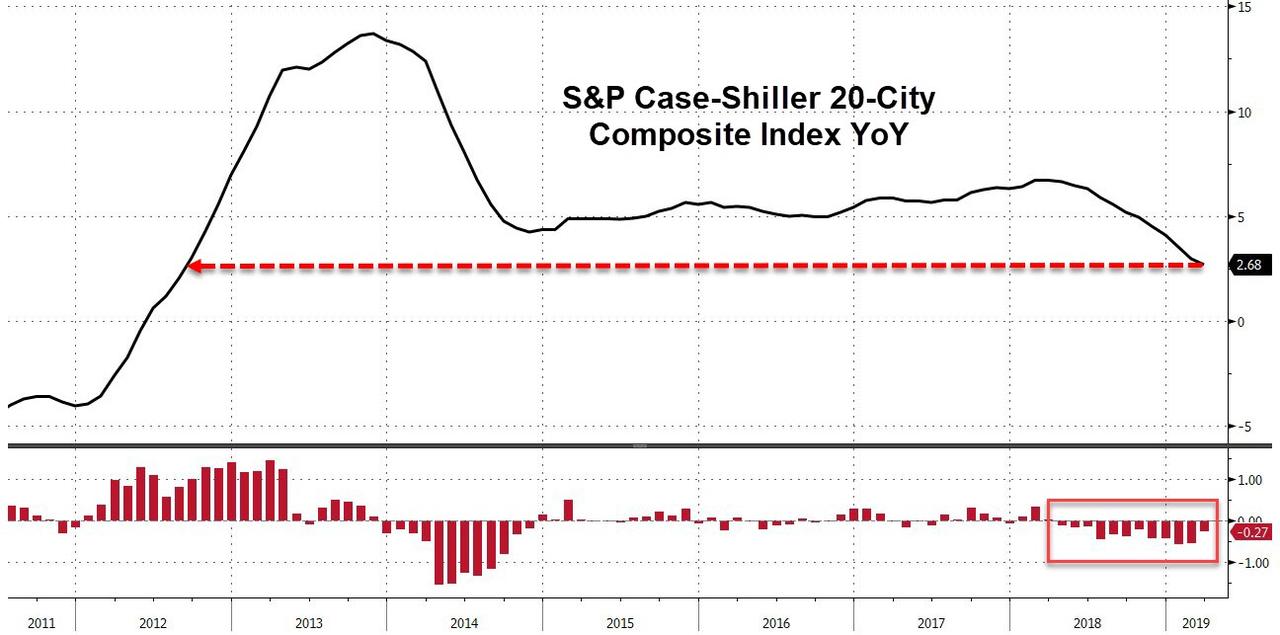
Nationally, home-price gains slowed to a 3.7% pace.
“Given the broader economic picture, housing should be doing better,” David Blitzer, chairman of the S&P index committee, said in a statement.
“Measures of household debt service do not reveal any problems and consumer sentiment surveys are upbeat. The difficulty facing housing may be too-high price increases,” which continue to outpace inflation, he said.
While all 20 cities in the index showed year-over-year gains, five were below 2%: Chicago, Los Angeles, San Diego, San Francisco and Seattle, which a year ago posted a 13% increase. Las Vegas led the nation in March with an 8.2% gain, followed by Phoenix.
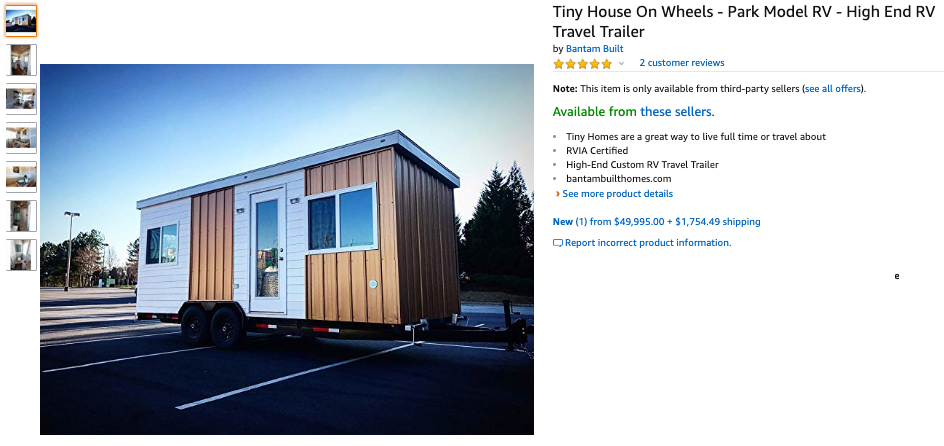
Attention Millennials: You Can Now Buy Tiny Homes On Amazon
One of the main goals of the Federal Reserve’s monetary policies of the past decade was to generate the “wealth effect”: by pushing the valuations of homes higher, would make American households feel wealthier. But it didn’t. Most Americans can’t afford the traditional home with a white picket fence around a private yard (otherwise known as the American dream), and as a result, has led to the popularity of tiny homes among heavily indebted millennials.
Tiny homes are popping up across West Coast cities as a solution to out of control rents and bubbly home prices, also known as the housing affordability crisis.

Amazon has recognized the hot market for tiny homes among millennials and has recently started selling DIY kits and complete tiny homes.
One of the first tiny homes we spotted on Amazon is a $7,250 kit for a tiny home that can be assembled in about eight hours.

A more luxurious tiny home on the e-commerce website is selling for $49,995 +$1,745.49 for shipping. This one is certified by the RV Industry Association’s standards inspection program, which means millennials can travel from Seattle to San Diego in a nomadic fashion searching for gig-economy jobs.
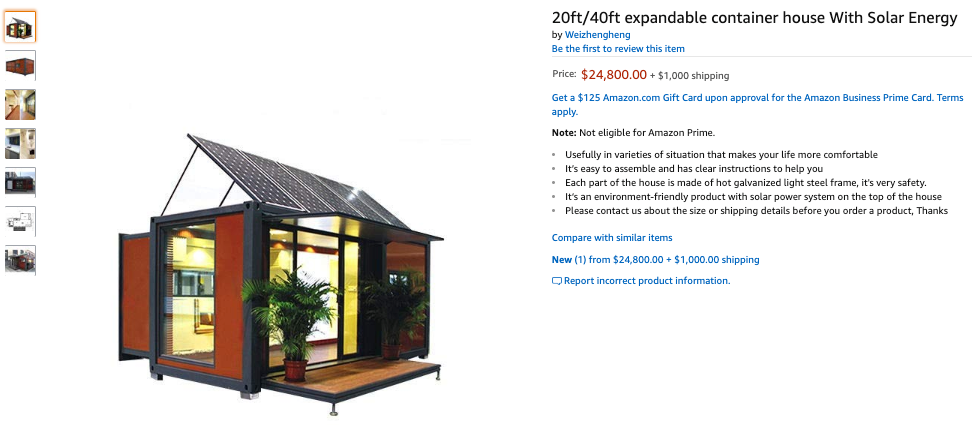
Those who want a 20 ft/40 ft expandable container house with solar energy, well, Amazon has that too. This tiny home has it all: a post-industrial feel using an old shipping container, virtue signaling with solar panels, full bathroom, and a kitchen to make avocado and toast.
With almost two-thirds of Millennials living paycheck to paycheck and less than half of them have $500 in savings, we’re sure this lost generation could afford one of these trailers tiny homes with their Amazon credit card. Nevertheless, the tiny home craze among millennials is more evidence that living standards are collapsing.
Where Home Prices Are Rising the Fastest (Slowest) In America
Since the end of the great recession, home prices in America have rebounded substantially. Since the dark days of 2009, prices have steadily climbed and are up over 50% on average from the lowest point.
This is great news for homeowners whose homes may be worth more than their pre-recession values, but less great news for homebuyers who can afford less house for the dollar. What’s more is that in some places, home prices have spiked much faster than average, while in other places, home prices have remained depressed.
So where in America are home prices increasing the fastest and the slowest? In light of fluctuating mortgage interest rates, tax reform that’s limited many homeowner deductions, and an affordability crisis in many urban areas, along with Priceonomics customer RefiGuide.org thought we’d dive deeper into the home price data published, aggregated and made available by Zillow.
Over the last year, the median home prices increased the fastest at the state level in Idaho, where prices increased by a staggering 17.2%. In just two states did home prices actually fall last year (Alaska and Delaware). The large cities with the fastest home appreciation were Newark, Dallas, and Buffalo where prices increased more than 15% in each place. The large city where prices decreased the fastest was Seattle, where home prices actually fell 2.4%.
Lastly, we looked at the expensive markets (where homes cost more than a million dollars) that had the highest price appreciation. St. Helena, CA, Quogue, NY and Stinson Beach, CA all had prices increase over 20% last year.
***
For this analysis, we looked at data from the beginning of March 2019 compared to prices one year earlier. We looked at Zillow’s seasonally adjusted median price estimate as published by Zillow Research Data.
Nationally, home prices increased 7.2% last year or about $15,000 more than the year before. However, in some states prices spiked much more than that.
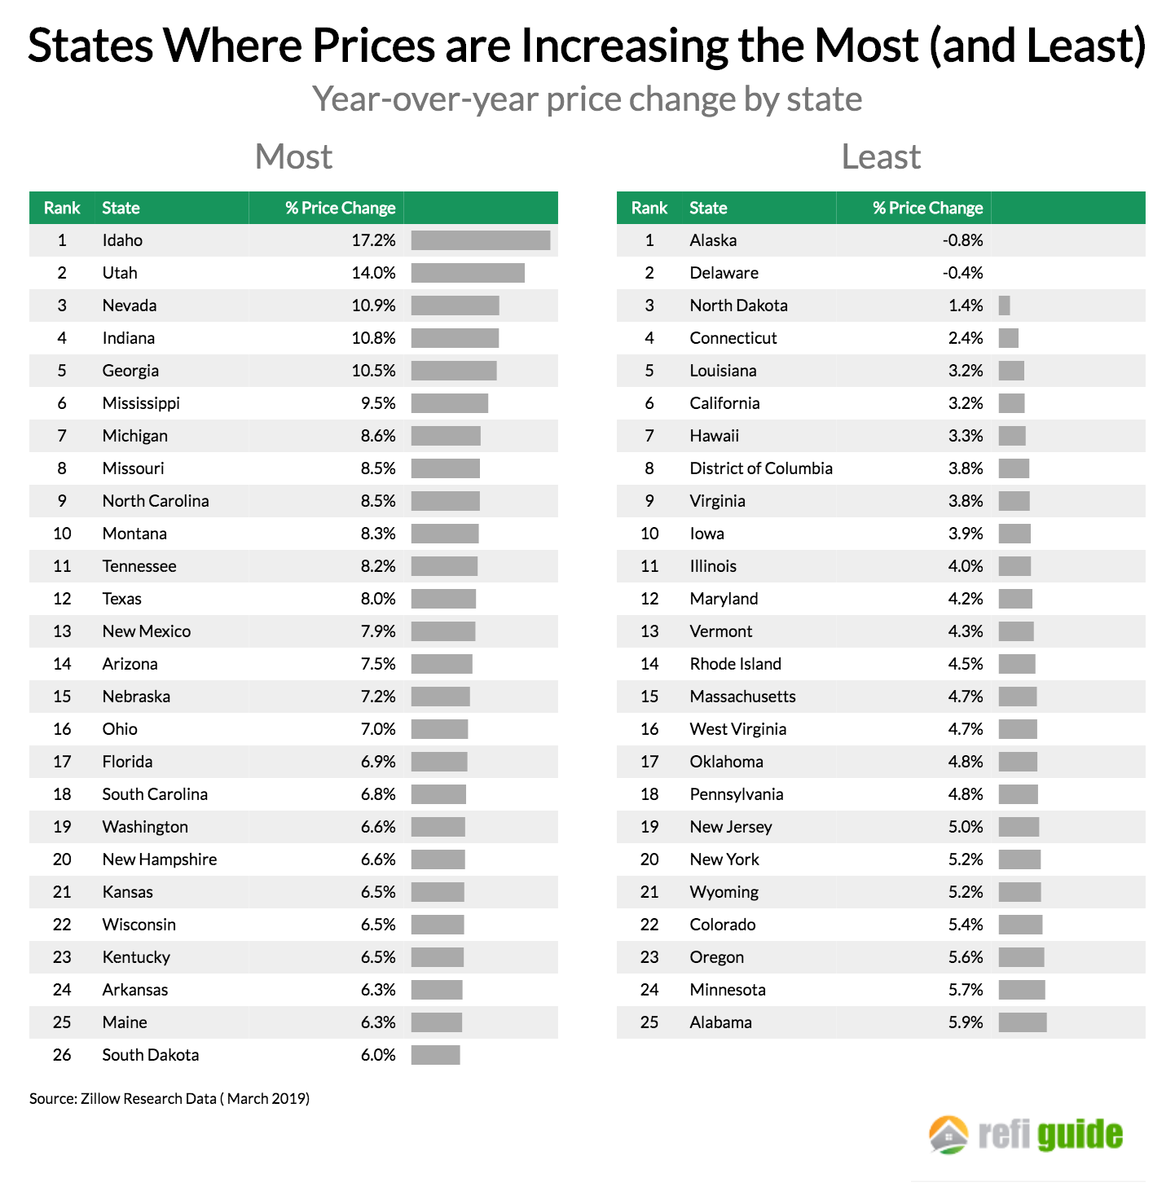
Idaho leads the country with home prices increasing by 17.2% last year, driven by strong demand in the Boise market. In Utah the impact of a thriving economy and growing population is that prices increased 14% in just one year. Nevada, likewise is seeing strong home price growth as people migrate from California and the state’s low taxes are more favorable under the most recent tax reform. Alaska and Delaware have the distinction of being the only states where home prices fell over the last year.
Next, we looked at home prices in the top one hundred largest housing markets, as measured by population. Which cities were experiencing rapid home equity appreciation and which ones are not?
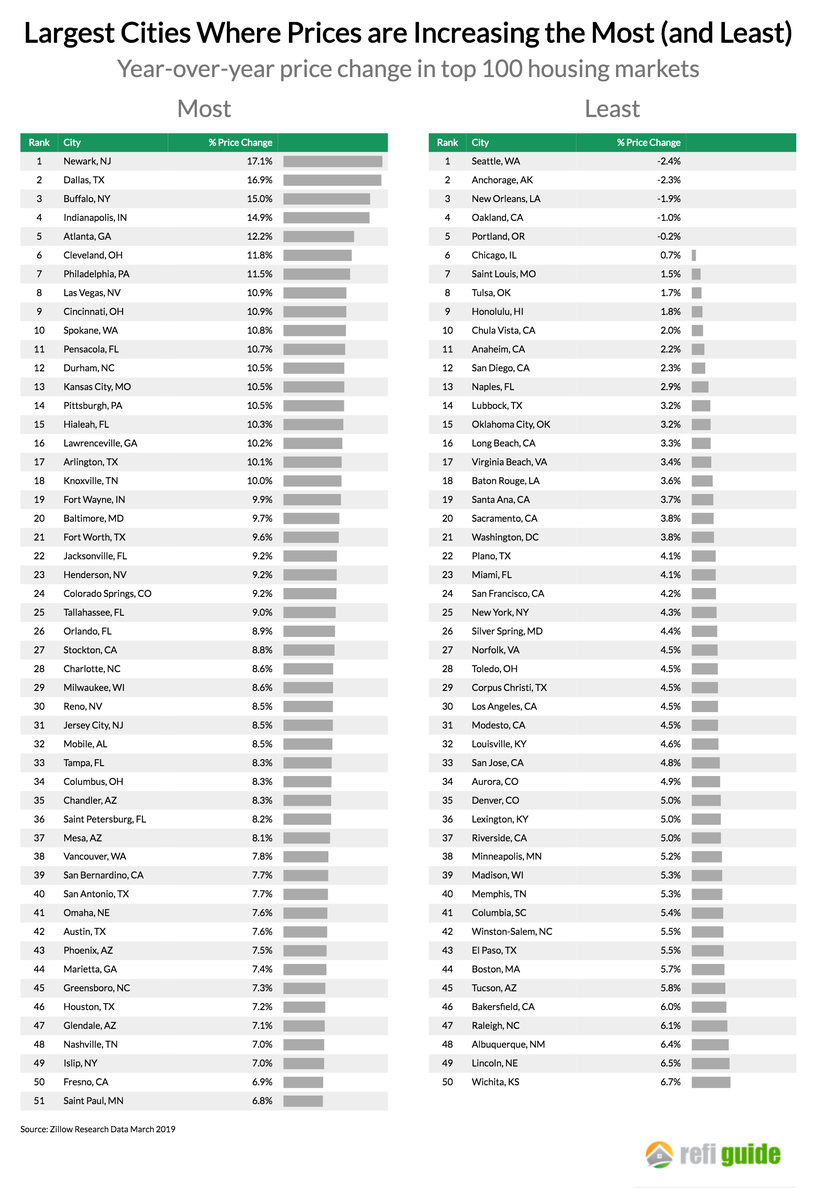
At the city level, home prices have increased the fastest in Newark, NJ where prices have increased more than 17% as buyers who are priced out of New York City have purchased in this area. Dallas, a city with a strong economy and low taxes has seen home prices increase nearly 17% as well.
Notably, some of the most expensive and desirable cities like Seattle, Oakland and Portland have seen their prices decrease in the last year. Each of these locations has experienced price appreciation during this decade, however.
Were there any smaller cities and towns that experienced home prices rising faster than the big cities? Below shows the fifty places in the United States where home prices increased the most this last year:
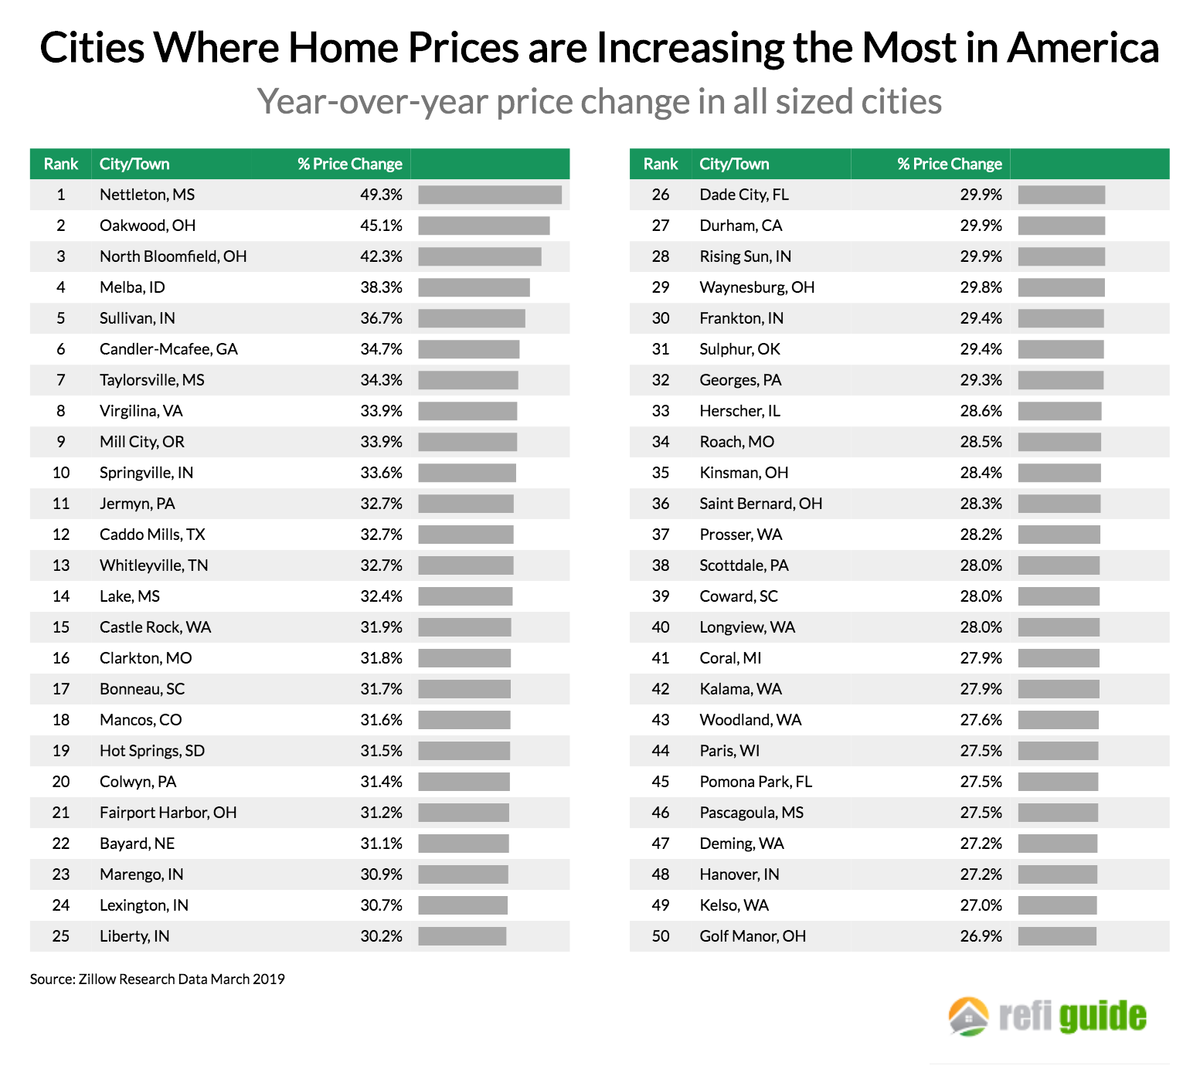
Across the Midwest and South, numerous smaller cities experienced price appreciation much greater than 25% last year. In Nettleton, MS prices increased 49% in just one year! Notably, almost none of these high-price growth cities are located on the coasts.
Lastly, what are expensive places to buy a home in America that are just getting more expensive? To conclude we looked at locations where the median home price was over one million dollars and the prices keep rising:
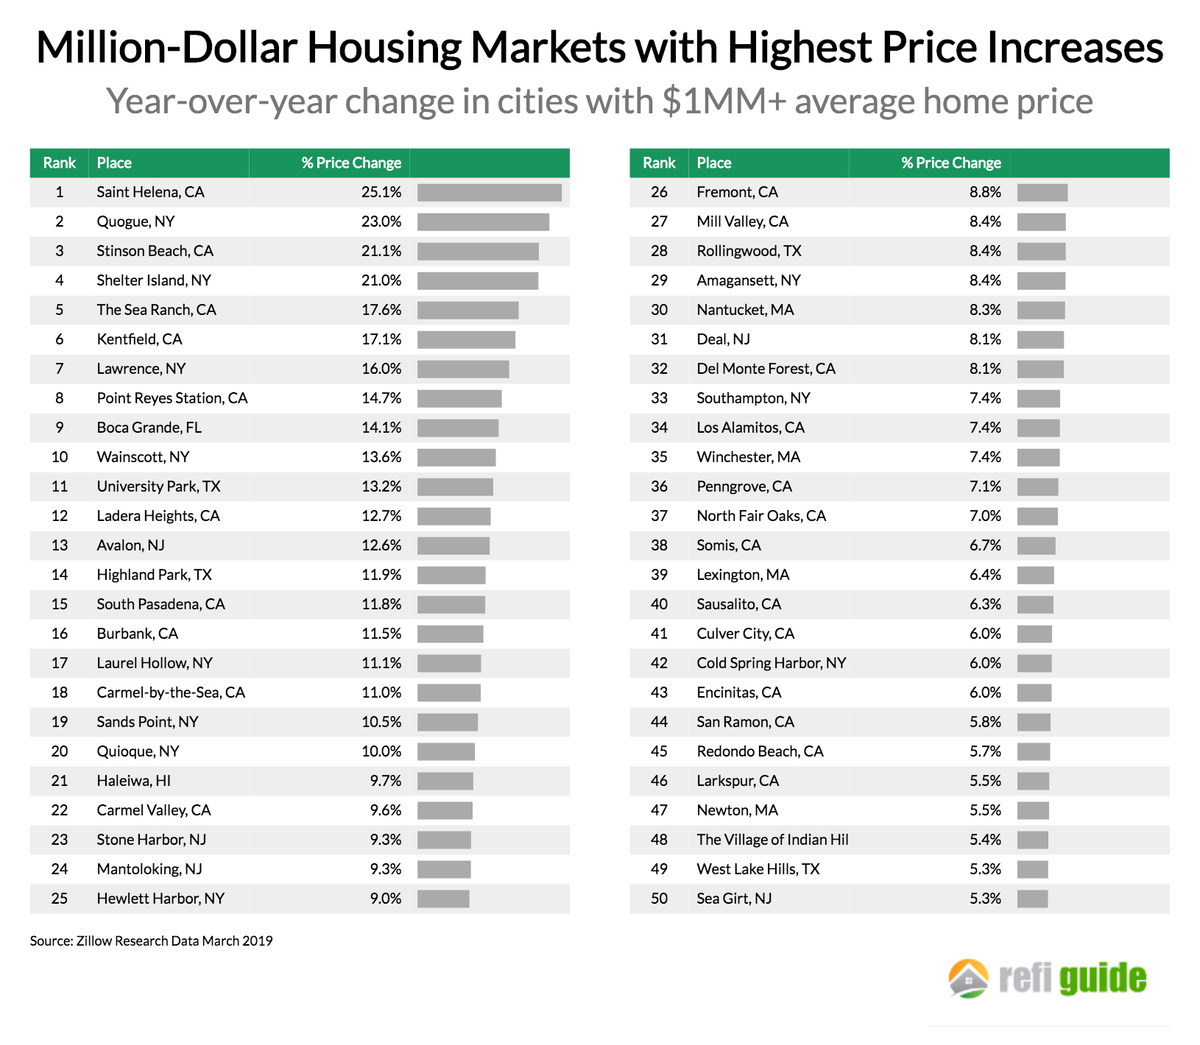
In this rarefied group, prices increased the most in Saint Helena, CA. In this tony town in Napa Valley, prices increased over 25% last year. In second place was Quogue, NY a town in the Hamptons. In fact, 9 out of the top 10 expensive cities with high price appreciation are in California or New York. More specifically, many of these locations are in the vicinity of San Francisco and New York City, the two very large economic engines that are driving home prices.
***
After nearly a decade of vibrant stock market and real estate returns, this year home prices have continued to climb at a steady clip. In only two states in America did prices actually fall, and in five states prices grew more than 10% in a year. As the economy has continued roaring, places that were once known for being affordable like Idaho, Utah, and Nevada have seen home prices spike. While expensive cities like Seattle, Portland and Oakland have seen prices level off in the last year, and places like Newark, Dallas and Buffalo have become less affordable. In this stage of American economic expansion, the once affordable places are seeing their prices escalate.
Mapped: The Salary Needed To Buy A Home In 50 U.S. Metro Areas
Over the last year, home prices have risen in 49 of the biggest 50 metro areas in the United States.
At the same time, mortgage rates have hit seven-year highs, making things more expensive for any prospective home buyer.
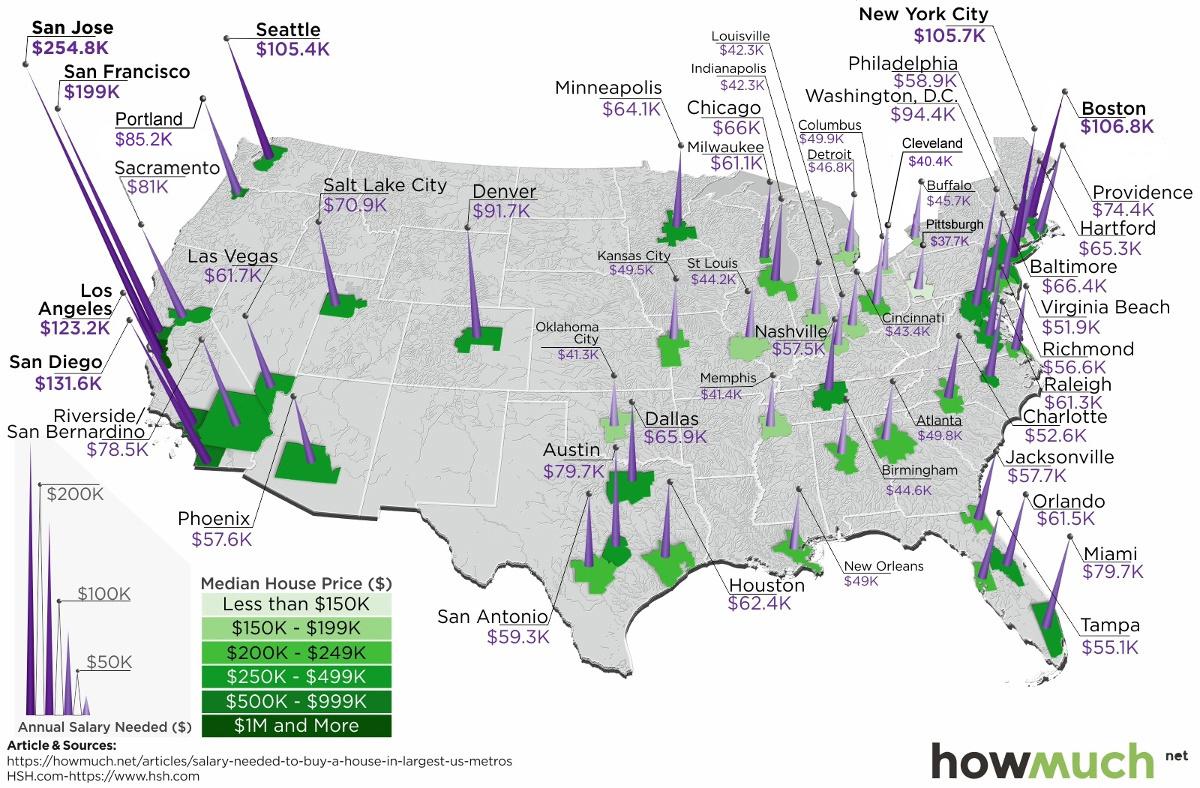
With this context in mind, today’s map comes from HowMuch.net, and it shows the salary needed to buy a home in the 50 largest U.S. metro areas.
The Least and Most Expensive Metro Areas
As a reference point, Visual Capitalist’s Jeff Desjardins points out that the median home in the United States costs about $257,600, according to the National Association of Realtors.

With a 20% down payment and a 4.90% mortgage rate, and taking into account what’s needed to pay principal, interest, taxes, and insurance (PITI) on the home, it would mean a prospective buyer would need to have $61,453.51 in salary to afford such a purchase.
However, based on your frame of reference, this national estimate may seem extremely low or quite high. That’s because the salary required to buy in different major cities in the U.S. can fall anywhere between $37,659 to $254,835.
The 10 Lowest Cost Metro Areas
Here are the lowest cost metro areas in the U.S., based on data and calculations from HSH.com:

After the dust settles, Pittsburgh ranks as the cheapest metro area in the U.S. to buy a home. According to these calculations, buying a median home in Pittsburgh – which includes the surrounding metro area – requires an annual income of less than $40,000 to buy.
Just missing the list was Detroit, where a salary of $48,002.89 is needed.
The 10 Most Expensive Metro Areas
Now, here are the priciest markets in the country, also based on data from HSH.com:
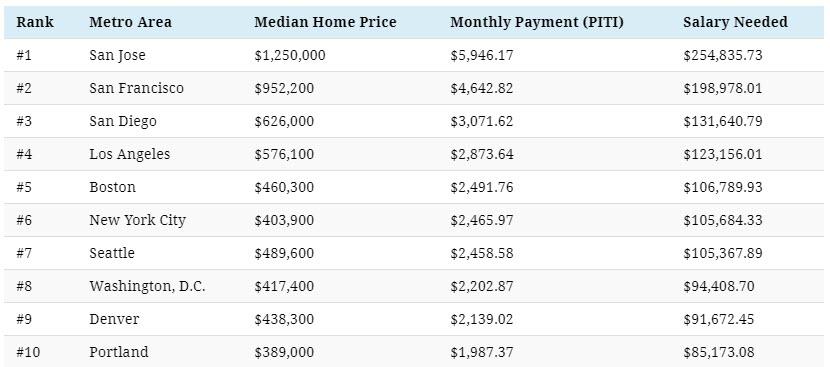
Topping the list of the most expensive metro areas are San Jose and San Francisco, which are both cities fueled by the economic boom in Silicon Valley. Meanwhile, two other major metro areas in California, Los Angeles and San Diego, are not far behind.
New York City only ranks in sixth here, though it is worth noting that the NYC metro area extends well beyond the five boroughs. It includes Newark, Jersey City, and many nearby counties as well.
As a final point, it’s worth mentioning that all cities here (with the exception of Denver) are in coastal states.
Notes on Calculations
Data on median home prices comes from the National Association of Realtors and is based on 2018 Q4 information, while national mortgage rate data is derived from weekly surveys by Freddie Mac and the Mortgage Bankers Association of America for 30-year fixed rate mortgages.
Calculations include tax and homeowners insurance costs to determine the annual salary it takes to afford the base cost of owning a home (principal, interest, property tax and homeowner’s insurance, or PITI) in the nation’s 50 largest metropolitan areas.
Standard 28% “front-end” debt ratios and a 20% down payments subtracted from the median-home-price data are used to arrive at these figures.
Americans Can’t Afford To Buy A Home In 70% Of The Country

Even at a time of low interest rates and rising wages, Americans simply can’t afford a home in more than 70% of the country, according to CBS. Out of 473 US counties that were analyzed in a recent report, 335 listed median home prices were more than what average wage earners could afford. According to the report from ATTOM Data Solutions, these counties included Los Angeles and San Diego in California, as well as places like Maricopa County in Arizona.
New York City claimed the largest share of a person’s income to purchase a home. While on average, earners nationwide needed to spend only about 33% of their income on a home, residents in Brooklyn and Manhattan need to shell out more than 115% of their income. In San Francisco this number is about 103%. Homes were found to be affordable in places like Chicago, Houston and Philadelphia.
This news is stunning because homes are considerably more affordable today than they were a year ago. Although prices are rising in many areas, they are also falling in places like Manhattan. Unaffordability in the market has been the result of slower home building and owners staying in their homes longer. Both have reduced the supply of homes in the market.
And the market may continue to create better conditions for buyers. Affordability could improve because of the fact that homes are out of reach for so many seekers, according to Todd Teta, chief product officer at ATTOM Data Solutions. Today’s market is also more affordable than it was a decade ago, before the crisis. Home prices were about the same prior to the crisis, even though income adjusted for inflation was lower.
“What kept the market going was looser lending standards, so that was compensating for affordability issues,” Teta said. Since then, standards have toughened (for now, at least).
We recently wrote about residents of New York City who simply claimed they couldn’t afford to live there.
More than a third of New York residents complained that they “can’t afford to live there” anymore (and yet they do). On top of that, many believe that economic hardships are going to force them to leave the city in five years or less, according to a Quinnipiac poll published a couple weeks ago. The poll surveyed 1,216 voters between March 13 and 18.
In total, 41% of New York residents said they couldn’t cope with the city’s high cost of living. They believe they will be forced to go somewhere where the “economic climate is more welcoming”, according to the report.
Ari Buitron, a 49-year-old paralegal from Queens said: “They are making this city a city for the wealthy, and they are really choking out the middle class. A lot of my friends have had to move to Florida, Texas, Oregon. You go to your local shop, and it’s $5 for a gallon of milk and $13 for shampoo. Do you know how much a one-bedroom, one-bathroom apartment is? $1700! What’s wrong with this picture?”
US Rents Still Growing 3.7% YoY For Low-income Households (vs. 2.9% for high-end)


The Cycle That Has Been Saving Home Buyers $3,000 Per Year Just Ran Out Of Fuel
Summary
- After five years of supporting rising home prices, the latest phase of a long-term financial cycle is nearing its end.
- While little followed in the real estate market, this cycle of yield curve spread compression has been one of the largest determinants of home affordability and housing prices.
- Using a detailed analysis of national statistics, it is demonstrated that average home buyers in 2018 have been saving about $250 per month, or $3,000 per year.
- The reasons why the cycle is ending are mathematically and visually demonstrated.
(Daniel Amerian) Home buyers in every city and state have been benefiting from a powerful financial cycle for almost five years. Most people are not aware of this cycle, but it has lowered the average monthly mortgage payment for home buyers on a national basis by about $250 per month since the end of 2013.
The interest rate cycle in question is one of “yield curve spread” expansion and compression, with yield curve spreads being the difference between long-term and short-term interest rates. This interest rate spread has been going through a compression phase in its ongoing cycle, meaning that the gap between long-term interest rates and short-term interest rates fell sharply in recent years.
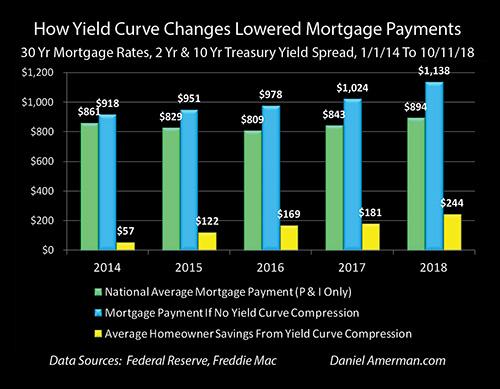
The green bars in the graph above show national average mortgage payments (principal and interest only), and they fell from $861 a month in 2013 to $809 a month in 2016 and have now risen to $894 per month. However, without the narrowing of the spread between short-term rates and long-term rates, mortgage payments would have been entirely different (and likely home prices as well).
Without the cycle of yield curve spread compression then, as shown with the blue bars, average mortgage payments would have been above $900 per month even in 2014, and they would have risen every year since without exception. If it had not been for compression, national average mortgage payments would have reached $978 per month in 2016 (instead of $809) and then $1,138 per month in 2018 (instead of $894).
The yellow bars show the average monthly savings for everyone buying a home during the years from 2014 to 2018. The monthly reduction in mortgage payments has risen from $57 per month in 2014 to $169 per month in 2016, to $244 per month by 2018 (through the week of October 11th).
In other words, the average home buyer in the U.S. in 2018 is saving almost $3,000 per year in mortgage payments because of this little-known cycle, even if they’ve never heard of the term “yield curve.” Indeed, while the particulars vary by location, home affordability, home prices and disposable household income have been powerfully impacted in each of the years shown by this interest rate cycle, in every city and neighborhood across the nation.
While knowledge of this cyclical cash flow engine has not been necessary for home buyers (and sellers) to enjoy these benefits in previous years, an issue has developed over the course of 2018 – the “fuel” available to power the engine has almost run out. That means that mortgage payments, home affordability and housing prices could be traveling a quite different path in the months and years ahead.
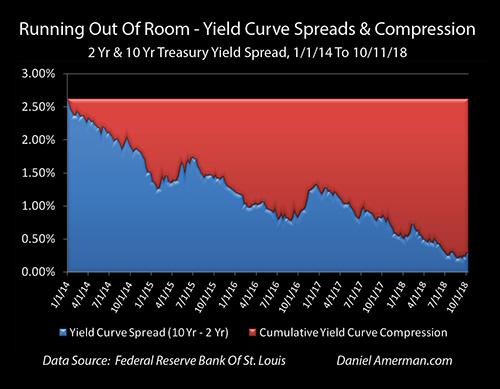
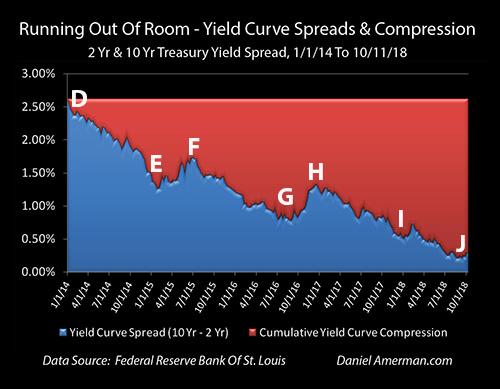
The yield curve spread is shown in the blue area above, and it was quite wide at the beginning of this particular cycle, equaling 2.62% as of the beginning of 2014. It has been steadily used up since that time, however, with the compression of the spread being shown in red. As of the current time, the yield curve compression which has powered the reduction in mortgage payments has almost maxed out, the blue area is almost gone and the ability to further compress (absent an inversion) is almost over.
This analysis is part of a series of related analyses; an overview of the rest of the series is linked here.
(More information on the data sources and calculations supporting the summary numbers above can be found in the rest of series, as well as in the more detailed analysis below. A quick summary is that mortgage rates are from the Freddie Mac Primary Mortgage Market Survey, Treasury yields are from the Federal Reserve, the national median home sale price is from Zillow for the year 2017 and the assumed mortgage LTV is 80%.)
A Cyclical Home Buyer Savings Engine
A yield curve spread is the difference in yields between short-term and long-term investments, and the most common yield curve measure the markets looks to is the difference between the 2-year and 10-year U.S. Treasury yields.
An introduction to what yield curves are and why they matter can be found in the analysis “A Remarkably Accurate Warning Indicator For Economic And Market Perils.” As can be seen in the graph below and as is explored in more detail in some of the linked analyses, there is a very long history of yield curve spreads expanding and compressing as part of the overall business cycle of economic expansions and recessions, as well as the related Federal Reserve cycles of increasing and decreasing interest rates.
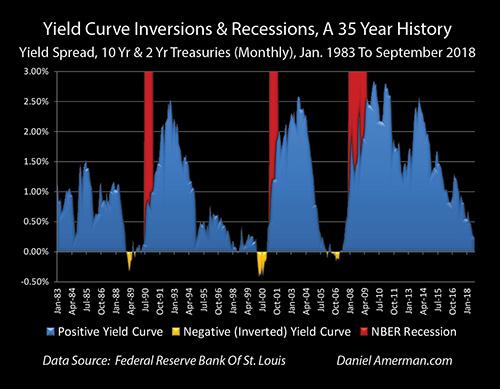
Since the beginning of 2014, the rapid shrinkage of the blue area shows the current compression cycle, and a resemblance (in broad strokes) can be seen with the compression cycles of 1992-2000 and of 2003-2006.
What has seized the attention of the markets in recent months is what followed next in some previous cycles, which is that yield curve spreads went to zero and then became negative, creating “inversions” where short-term yields are higher than long-term yields (as shown in the golden areas). This is important because, while such inversions are quite uncommon, when they do occur they have had a perfect record in recent decades (over the last 35 years) of being followed by economic recessions within about 1-2 years.
However, yield curves don’t have to actually invert in order to turn the markets upside down, and as explored in the analysis linked here, when the Fed goes through cycles of increasing interest rates, we have a long-term history of yield curve spreads acting as a counter cyclical “shock absorber” and shielding long-term interest rates and bond prices from the Fed actions.
That only works until the “shock absorber” is used up, however, and as of the end of the third quarter of 2018, the yield curve “shock absorber” has been almost entirely used up. So, when the Fed increased short-term rates in late September of 2018, there was almost no buffer, and that increase passed straight through to 10-year Treasury yields. The results were painful for bond prices, stock prices and even the value of emerging market currencies.
The same lack of compression led to a sudden and sharp leap to the highest mortgage rates in seven years. Unfortunately, that jump may also potentially be just a taste of what could be on the way, with little further room for the yield curve to compress (without inverting).
Understanding The Relationships Between Mortgage Rates, Treasury Yields and Yield Curve Spreads
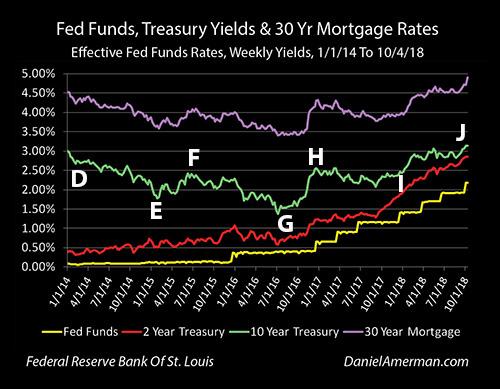
The graphic below shows weekly yields for Fed Funds, 2-year Treasuries, 10-year Treasuries and 30-year fixed-rate mortgages since the beginning of 2014.

The first relationship is the visually obvious close correlation between the top purple line of mortgage rates and the green line of 10-year Treasury yields. Mortgage amortization and prepayments mean that most mortgage principal is returned to investors well before the 30-year term of the mortgage, and therefore, investors typically price those mortgage rates at a spread (the distance between the green and purple lines) above 10-year Treasury yields. It isn’t a perfect relationship – the 10-year Treasury tends to be a bit more volatile – but is a close one.
The bottom two lines are the short-term yields, with the yellow line being effective overnight Fed Funds rates, and the red line being 2-year Treasury yields. Because the yield curve has been positive over the entire time period shown (as it almost always is), long-term rates have consistently been higher than short-term rates, and 10-year Treasury yields have been higher than 2-year Treasury yields, which have been higher than Fed Funds rates.
Now, the long-term rates have been moving together, and while the relationship is not quite as close, the short-term rates have also been generally moving together, with the 2-year Treasury yield more or less moving up with the Fed’s cycle of increasing interest rates (each “step” in the yellow staircase is another 0.25% increase in interest rates by the Federal Reserve).
However, the long-term rates have not been moving with the short-term rates. As can be seen with point “D,” 10-year Treasury yields were 3.01% at the beginning of 2014, 2-year Treasury yields were a mere 0.39% and the yield curve spread – the difference between the yields – was a very wide 2.62%.
About a year later, by late January of 2015 (point “E”), 10-year Treasury yields had fallen to 1.77%, while 2-year Treasury yields had climbed to 0.51%. The yield curve spread – the distance between the green and red lines – had narrowed to only 1.26%, or a little less than half of the previous 2.62% spread.
It can be a little hard to accurately track the relative distance between two lines that are each continually changing, so the graphic below shows just that distance. The top of the blue area is the yield curve spread; it begins at 2.62% at point “D” and falls to 1.26% by point “E.” The great reduction between points “D” and “E” is now visually obvious.
So, if there had been no change in yield curve spreads, and the 2-year Treasury had risen to 0.51% while the spread remained constant at 2.62%, then the 10-year Treasury yields would have had to have moved to 3.13%.
But they didn’t – the yield curve compressed by 1.36% (2.62% – 1.26%) between points “D” and “E,” and the compression can be seen in the growing size of the red area labeled “Cumulative Yield Curve Compression.” If we start with a 2.62% interest rate spread, and that spread falls to 1.26% (the blue area), then we have used up 1.36% (the red area) of the starting spread and it is no longer available for us.
The critical importance of this yield curve compression for homeowners and housing investors, as well as some REIT investors, can be seen in the graphic below:
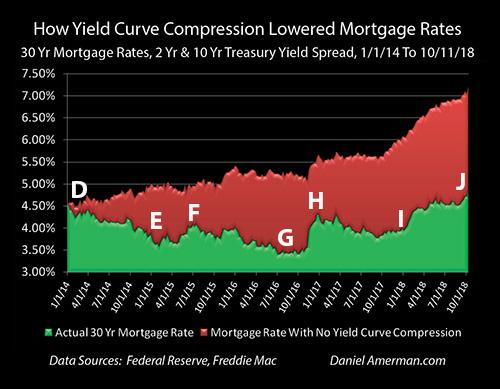
The top of the green area is the national average 30-year mortgage rate as reported weekly by Freddie Mac. That rate fell from 4.53% in the beginning of 2014 (point “D”) to 3.66% in late January of 2015.
But remember the tight relationship between the green and purple lines in the graph of all four yields / rates. Mortgage investors demand a spread above the 10-year Treasury, mortgage lenders will only lend at rates that will enable them to meet that spread requirement (and sell the mortgages), and therefore, it was the reduction in 10-year Treasury yields that drove the reduction in mortgage rates. And if the yield curve compression had not occurred, then neither would have the major reduction in mortgage rates.
As we saw in the “Running Out Of Room” graphic, the red area of yield curve compression increased by 1.36% between points “D” and “E.” If we simply take the red area of yield curve compression from that graph and we add it to the green area of actual mortgage rates, then we get what mortgage rates would have been with no yield curve compression (all else being equal).
With no yield curve compression, mortgage rates of 3.66% at point “E” would have been 5.02% instead (3.66% + 1.36% – 5.02%).
With a $176,766 mortgage in late January of 2015, a monthly P&I payment at a 3.66% rate is $810. (This is based on a national median home sale price for 2017 of $220,958 (per Zillow) and an assumed 80% mortgage LTV.)
At a 5.02% mortgage rate – which is what it would have been with no yield curve compression – the payment would have been $951. This meant that for any given size mortgage, monthly payments were reduced by 15% over the time period as a result of yield curve spread compression ($810 / $951 = 85%).
Now, at that time, housing prices were still in a somewhat fragile position. The largest decrease in home prices in modern history had just taken place between the peak year of 2006 and the floor years of 2011-2012. Nationally, average home prices had recovered by 9.5% in 2013, and then another 6.4% in 2014.
Here is a question to consider: Would housing prices have risen by 6.4% in 2014 if mortgage rates had not reduced monthly mortgage payments by 15%?
The Next Yield Curve Spread Compression
Our next key period to look at is between points “E” and “G,” late January of 2015 to late August of 2016. We are now beginning a rising interest rate cycle when it comes to short-term rates. The Fed had done its first slow and tentative 0.25% increase in Fed Funds rates, and 2-year Treasury yields were up to 0.80%, which was a 0.29% increase.
All else being equal, when we focus on the yellow and red lines of short-term interest rates, mortgage rates should have climbed as well. (Graphs are repeated for ease of scrolling.)

However, that isn’t what happened. After a brief jump upwards at point “F,” yield curve spreads had substantially fallen to 0.78% by point “G,” as can be seen in the reduction of the blue area above. For this to happen, the compression of yield curve spreads had to materially increase to 1.84%, as can be seen in the growth of the red area.

In the early stages of a cycle of rising interest rates (as part of the larger cycle of exiting the containment of crisis), mortgage rates did not rise, but fell from the very low level of 3.66% at point “E” to an even lower level of 3.46% at point “G,” as can be seen in the reduction of the green area.
To get that reduction in the green area during a rising interest rate cycle required a major growth in the red area of yield curve compression. To see what mortgage rates would have been without yield curve compression (all else being equal), we add the red area of cumulative yield curve compression of 1.84% to the green area of actual mortgage rates of 3.46% and find that mortgage rates would have been 5.30%.
Returning to our $176,766 mortgage example, the monthly mortgage payment (P&I only) is $790 with a 3.46% mortgage rate, and is $982 with a 5.30% mortgage rate. Yield curve compression was responsible for a 20% reduction in mortgage payments for any given borrowing amount by late August of 2016.
However, a problem is that by late August of 2016, the 1.84% cumulative cyclical compression of the yield curve meant that only 0.78% of yield curve spreads remained. A full 70% of the initial yield curve spread had been used up.
(Please note that the mortgage payments in this section of the analysis are calculated based on historical mortgage rates for the particular weeks identified. The annual average payments presented in the beginning of this analysis are the average of all weekly payment calculations for a given year, and therefore, do not correspond to any given week.)
Using Up The Rest Of The Fuel (Yield Curve Spreads):

After its slow and tentative start, the Federal Reserve returned to 0.25% Fed Funds rate increases in December of 2016, and has kept up a much steadier pace since that time. As of October of 2018, Fed Funds rates are now up a total of 2% from their floor. As can be seen in the line graph of the yield curve over time, 2-year Treasury yields have also been steadily climbing and were up to 2.85% by point “J,” the week ending October 11th.
However, 10-year Treasury yields are not up by nearly that amount. By late August of 2018, 10-year Treasury yields were only up to 2.87%, which was 1.29% above where they had been two years before.

The difference can be found by looking at the very small amount of blue area left by point “J” – yield curve spreads were down to a mere 0.22% by the week ending August 29th, or less than one 0.25% Fed Funds rate increase. This meant that the red area of total cumulative yield curve compression was up to 2.40%, which means that 92% of the “fuel” that had been driving the compression profit engine had been used up – before the Fed’s 0.25% Fed Funds rate increase of September 2018.
As explored in much more detail in the previous analysis linked here, when the Federal Reserve raised rates for the eighth time in September, the yield curve did not compress. Such a compression could have been problematic, as the yield curve would have been right on the very edge of inverting, and there is that troubling history when it comes to yield curve inversions being such an accurate warning signal of coming recessions.
Instead, the short-term Fed Funds rate increase went straight through to the long-term 10-year Treasury yields, full force, with no buffering or mitigation of the rate increase by yield curve compression. The resulting shock as the 10-year Treasury yield leaped to 3.22% led to sharp losses in bonds, stocks and even emerging market currencies.
The same shock also passed through in mostly un-buffered form to the mortgage market via the demand for mortgage investors to be able to buy mortgages at a spread above the 10-year Treasury bond. Thirty-year mortgage rates leaped from 4.71% to 4.90%, an increase of 0.19%, and the highest rate seen in more than seven years.
(I’ve concentrated on the 2- to 10-year yield curve spread in this analysis to keep things simple, to correspond to the market norm for the most commonly tracked yield curve spread and because it has a strong explanatory power for the big picture over time. If one wants to get more precise (and therefore, quite a bit messier), there are also the generally much smaller spread fluctuations between 1) Fed Funds rates and 2-year Treasury yields; and 2) 10-year Treasury yields and mortgage rates.)

When we look at the period between points “G” and “J,” it looks quite different than either of the previous periods we looked at. Mortgage rates have been rising, with the largest spike occurring at the time that the Federal Reserve proved it was serious about actually materially increasing interest rates with the Fed Funds rate increase of December 2016 (point “H”).
However, this does not mean that the money saving power of yield curve compression had lost its potency. Between points “D” and “J,” early January of 2014 and early October of 2018, average annual mortgage rates rose from 4.53% to 4.90%, as can be seen in the green area – which is an increase of only 0.37%. Meanwhile, the yield curve spread between the 2- and 10-year Treasuries was compressing from 2.62% to 0.29%, which was a yield curve compression of 2.33%. Adding the red area of cumulative yield curve compression to the green area of actual mortgage rates shows that current mortgage rates would be 7.23% if there had been no yield curve compression (all else being equal).
Mortgage principal and interest payments on a 30-year $176,766 mortgage with 4.90% interest rate are $938 per month, and they are $1,203 per month with a 7.23% mortgage rate. This means that yield curve compression has reduced the national average mortgage payment by about 22%.
Turning The Impossible Into The Possible:
This particular analysis is a specialized “outtake” from the much more comprehensive foundation built in the Five Graphs series linked here, which explores the cycles that have created a very different real estate market over the past twenty or so years.
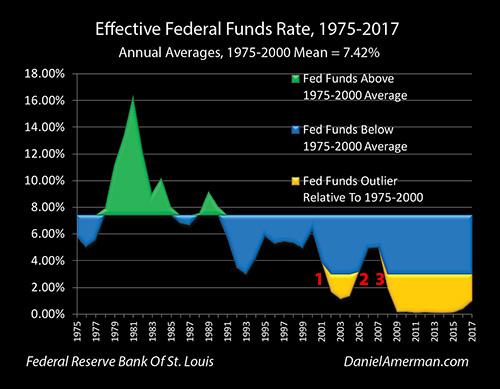
As developed in that series, as part of the #1 cycle of the containment of crisis, the attempts to cure the financial and economic damage resulting from the collapse of the tech stock bubble and the resulting recession, the Federal Reserve pushed Fed Funds rates down into an outlier range (shown in gold), the lowest rates seen in almost 50 years.
As part of the #3 cycle of the containment of crisis, in the attempt to overcome the financial and economic damage from the Financial Crisis of 2008 and the resulting Great Recession, the Federal Reserve pushed interest rates even further into the golden outlier range, with near-zero percent Fed Funds rates that were the lowest in history.
By the time we reach early January of 2014 to late January of 2015, points “D” to “E,” Fed Funds rates were still where they had been the previous five to six years – near zero. Mathematically, there was no room to reduce interest rates, without the U.S. going to negative nominal interest rates.
But yet, mortgage rates fell sharply, from an already low 4.53% to an extraordinarily low 3.66%. This sharp reduction in rates transformed the housing markets and would steer extraordinary profits to homeowners and investors over the years that followed. However, none of it would have been possible without the compression of yield curve spreads.
Once the past has already happened, it is easy to not only take it for granted, but to internalize it and to make it the pattern that we believe is right and natural. Once this happens, the next natural step is to then either explicitly or implicitly project this assumed reality forward, as that trend line then becomes the basis for our financial and investment decisions.
However, where this natural process can run into difficulties is when what made the past possible becomes impossible. Yield curve spread compression took what would have been impossible – a plunge in mortgage rates even as short-term rates remained near a floor – and made it possible. But that pattern can’t repeat (at least not in that manner) when there is no longer the spread to compress.
San Francisco Bay Area Expats Are Driving Up Home Prices From Boise To Reno
In the not-too-distant future, it’s not improbable that low-wage laborers in San Francisco will be replaced by ubiquitous machines (the city is already home to the first restaurant run by a robot). And not just fast food workers, either – the jobs of teachers, fire fighters and law enforcement will all be assumed by robots, as NorCal’s prohibitively high cost of living and astronomical home prices spark a mass exodus of families earning less than $250,000 a year.

While this scenario might seem like an exaggeration (and it very well might be), we’ve paid close attention to the flight of Californians who are abandoning the Bay Area for all of the reasons mentioned above, as well as what Peter Thiel (himself a Bay Area emigre) once described as a political “monoculture” that has made California inhospitable for conservatives. And as if circumstances weren’t already dire enough for would-be homeowners (even miles away from San Francisco, relatively modest homes still sell for upwards of $2 million), a report published earlier this year by realtor.com illustrated how a lapse in new home construction has led to a serious imbalance between home supply and the increasing demand of the state’s ever-growing population, leading to a cavernous supply gap.

With this in mind, it shouldn’t be surprising that Californians comprise a majority of the residents moving into other states in the American West – even states like Idaho where the culture is very different from the liberal Bay Area. This week, Bloomberg published a story about how Californians constitute an increasing share of out-of-state homebuyers in small cities like Boise, Phoenix and Reno, which are significantly more affordable than California, and offer some semblance of the walkable urban environment that nesting millennials crave.

As Californians sell their homes in the Bay Area in search of roomier, cheaper locales, they’re bringing the curse of surging property prices with them. In fact, the influx of Californians is the primary factor leading to some of the largest YoY price increases in the country, as Bloomberg explains:
About 29 percent of the Idaho capital’s home-listing views are from Californians, according to Realtor.com. Reno and Prescott, Ariz., also were popular. These housing markets are soaring while much of the rest of the country cools. In Nevada, where Californians make up the largest share of arrivals, prices jumped 13 percent in August, the biggest increase for any state, according to CoreLogic Inc. data. It was followed closely by Idaho, with a 12 percent gain.
Even in places like deep-red Idaho, these transplants are beginning to remake the terrain in their own image, as food co-ops and Women’s Marches starting to populate the landscape. Businesses are rushing to Boise to meet every desire of the newly arrived Cali transplants.
D’Agostino, the Bay Area transplant, isn’t ashamed of her progressive views and is finding her place: at the natural foods co-op downtown, the Boise’s Women’s March last year, and with the volunteer group she founded to collect unused food for the needy. But it was also good to get out of her comfort zone, she says. “I can’t remember a time when it’s ever been this divided, so the fact that I can have some interaction with people who might not have exactly the same beliefs as me, that’s fine,” she says. “As long as we can respect each other.”
It’s not new for politics to factor into moving decisions—it’s just that in the age of Trump, tensions get magnified. “What’s different now is how far apart the parties are ideologically,” says Matt Lassiter, a professor of history at the University of Michigan.
Politics aside, businesses are rushing into Boise to fill every West Coast craving. In nearby Eagle, the new Renovare gated community is selling 1,900- to 4,000-square-foot homes with floor-to-ceiling glass and “wine walls” that start at $650,000—a bargain by California standards, says sales agent Nik Buich. About half of buyers are from out of state, he says.
One couple even opened a “boutique taqueria” and another transplant is preparing to start a blog about his experience moving to Idaho.
Julie and John Cuevas left Southern California a year ago to open Madre, a “boutique taqueria” in Boise that would make many of their fellow transplants feel at home. It’s more fusion than typical Mexican fare, with taco fillings including kimchi short rib and the popular “Idaho spud & chorizo.” It would have cost them three times as much to open a restaurant in California, says John, a former chef at a Beverly Hills hotel.
John Del Rio, a real estate agent sporting a beard, baseball cap, and sunglasses, just registered moving2idaho.com, where he’s planning to blog about all the things that make his new home great. He left Northern California two years ago with his wife in search of a place with less crime, lighter regulation, and more open space. Del Rio, a conservative with a libertarian bent, is reassured to see average people walking through Walmart with handguns in their holsters. In Idaho, he says, “nobody even flinches.”
In Boise alone, Californians made up 85% of new arrivals, and have driven home prices up nearly 20% in the span of a year. One realtor described the attitude of transplants as like “they’re playing with monopoly money.”
Nestled against the foothills of the Rocky Mountains, Boise (pop. 227,000) has drawn families for decades to its open spaces and short commutes. It’s been particularly attractive to Californians, who accounted for 85 percent of net domestic immigration to Idaho, according to Realtor.com’s analysis of 2016 Census data. While it has always prided itself on being welcoming, skyrocketing housing costs fueled by the influx is testing residents’ patience. In his state of the city speech last month, Mayor David Bieter outlined steps to keep housing affordable and asked Boise to stay friendly: “Call it Boise kind, our kindness manifesto,” he said.
It’s especially easy for buyers who have sold properties in the Golden State to push up prices in relatively cheap places because they feel like they’re playing with Monopoly money, Kelman says. The median existing-home price in Boise’s home of Ada County was $299,950 last month—up almost 18 percent from a year earlier, but still about half California’s. The influx is great news for people who already own homes in the area, says Danielle Hale, chief economist for Realtor.com. “But if you’re a local aspiring to home ownership, it feels very much that Californians are bringing high prices with them.”
And now that Trump’s tax reform package has been implemented, it’s only a matter of time before a whole new batch of Californian home owners, unwilling to forego their SALT tax write offs, start looking for greener pastures in low-cost red states.
US Home Prices Hit Peak Unaffordability ─ Prospective Buyers Are Better Off Renting
 With unaffordability reaching levels not seen in decades across some of the most expensive urban markets in the US, a housing-market rout that began in the high-end of markets like New York City and San Francisco is beginning to spread. And as home sales continued to struggle in August, a phenomenon that realtors have blamed on a dearth of properties for sale, those who are choosing to sell might soon see a chasm open up between bids and asks – that is, if they haven’t already.
While home unaffordability is most egregious in urban markets, cities don’t have a monopoly on unaffordability. According to a report by ATTOM, which keeps the most comprehensive database of home prices in the US, of the 440 US counties analyzed in the report, roughly 80% of them had an unaffordability index below 100, the highest rate in ten years. Any reading below 100 is considered unaffordable, by ATTOM’s standards. Based on their analysis, one-third of Americans (roughly 220 million people) now live in counties where buying a median-priced home is considered unaffordable. And in 69 US counties, qualifying for a mortgage would require at least $100,000 in annual income (Assuming a 3% down payment and a maximum front-end debt-to-income ratio of 28%). As one might expect, prohibitively high home prices are inspiring some Americans to relocate to areas where the cost of living is lower. US Census data revealed that two-thirds of those highest-priced markets experienced negative net migration, while more than three-quarters of markets where people earning less than $100,000 a year can qualify for a mortgage experienced net positive migration.
Rising home prices have played a big part in driving home unaffordability, but they’re not the whole story. Stagnant wages are also an important factor. The median nationwide home price of $250,000 in Q3 2018 climbed 6% from a year earlier, which is nearly twice the 3% growth in wages during that time. Looking back over a longer period, median home prices have increased 76% since bottoming out in Q1 2012, while average weekly wages have increased 17% over the same period.
Instead of fighting to overpay for existing inventory, one study showed that, for now at least, most Americans would be better off renting than buying a residential property. According to the latest national index produced by Florida Atlantic University and Florida International University faculty, renting and reinvesting will “outperform owning and building equity in terms of wealth creation.”
However, with the average national rent at an all-time high, American consumers are increasingly finding that there are no good options in the modern housing market. Which could be one reason why millennials, despite having more college degrees than any preceding generation, are increasingly choosing to rent instead of buying, even after they get married and start a family.

New York Millennials Paying $1800 Per Month To Cram Into 98-Square-Foot Rooms
Millennials in New York are known for living in a state of perpetual brokeness – between student loans, $20 nightclub drinks and $15 avocado toast, it’s easy to understand why 70% of millennials have less than $1,000 in savings.
Now we can add expensive, glorified closets to the mix, as the Wall Street Journal reports.

30-year-old marketing manager Scott Levine lives in an $1,800 per month, 98-square-foot room in a postage-stamp of an apartment – “basically, a kitchen” – with two roomates. Every week, someone from Ollie – his property manager, stops by to drop off towels and toiletries.
A “community-engagement team” at Ollie helps plan Mr. Levine’s social calendar. A live-in “community manager”—sort of like a residential adviser for a college dorm—gets to know Mr. Levine and everyone else living on the 14 Ollie-managed floors of the Alta LIC building, known as Alta+, and finds creative ways to get them engaged in shared activities, like behind-the-scenes tours of Broadway shows or trips to organic farms. –WSJ
“Life in general can be a bit of a headache,” says Mr. Levine. Thanks to Ollie, he adds, “Everything is done for you, which is convenient.”


Ollie’s business model is all about convenience and roommates – usually single people in their 20s and 30s who have all amenities provided for them, while sharing a kitchen and common area.
For city-dwellers accustomed to living cheek-by-jowl with people whose names they’ll never bother to learn, this might seem strange. But for young people still forming their postcollege friend groups—in an era when participation in civic life is down and going to a bar can mean huddling in a corner swiping on Tinder—it makes sense. So much sense that people put up with apartments so small they’re called “micro.” But hey, free shampoo. –WSJ
Meanwhile, startups such as Ollie and Common are competing with big-city real-estate developers. Common manages 20 co-living properties in six cities where roommate situations are more common, such as New York, Los Angeles and Washington DC. They have approximately 650 renters according to CEO Brad Hargreaves.
“Our audience is people who make $40,000 to $80,000 a year, who we believe are underserved in most markets today,” Mr. Hargreaves says.
Other startups are managing existing homes and apartments, “Airbnb-style” as the WSJ puts it.
Bungalow, which just announced $64 million in funding, wants property owners to offer space to “early-career professionals” looking for a low-maintenance place to stay. It charges rent that’s “slightly higher” than what it pays those owners, a company spokeswoman says. It currently maintains over 200 properties—housing nearly 800 residents—across seven big cities, says co-founder and CEO Andrew Collins.
As with Common and Ollie, Bungalow advertises that it furnishes the common areas in its homes, installs fast free Wi-Fi, and cleans them regularly. The company also organizes events and outings to help you “build a community with… your new friends.” –WSJ
One of the underlying aspects of the co-living startup models is a technology platform that both advertises to prospective tenants and takes care of their needs once they’re living on-site. Ollie’s “Bedvetter” system, for example, shows apartments to potential tenants – and shows who’s already signed up to live there with links to their personal profiles in order to match roommates. Bedvetter also matches people into “pods” of “potential roommates” before they begin an apartment hunt.
“It’s like online dating,” says Levine – while his roommate, Joseph Watson, 29, compares it to eHarmony or Match.com vs. Tinder, as it’s designed for long term pairings.

“Micro Economics”
While millennials in New York and other urban areas scramble to make ends meet, developers are making hand over fist on the co-living movement – even though the renters themselves are paying less than they would for a private studio.
The Alta LIC building also has conventional apartments, but the co-living units are filling up faster, says Matthew Baron, one of the Alta LIC building’s developers. What’s more, he adds, he can get more than $80 a square foot for Ollie units compared with around $60 a square foot for the others, even though the Ollie ones are on the lower, less-desirable floors. –WSJ
Another complication with co-living arrangements is tricky community management. L.A.’s PodShare, for example, vets potential tenants beforehand – however issues with problem tenants are unavoidable. “We’ve hosted 25,000 people at this point, so there’s bound to be some problems,” says founder Elvina Beck.
Common building tenant Teiko Yakobson said that the “community vibe broke down after Common eliminated the paid “house leader,” complaining that “We all just became strangers, and it was no better than living in any other apartment.” Common instead replaced the program with “centralized” community managers at the corporate level – which Hargreaves says is “more coherent” for them.
It’s not all bad, however…
When it does work, co-living can re-create the kind of communities tenants seek online—ones grounded in common interests and shared socioeconomic status.
Mr. Levine, who not only lives in a co-living building but also works in a co-working space—and in whose social circle most people do either one of those or the other—is aware that, while this isn’t for everyone, he is hardly a standout. “One thing I’ve heard before is that I’m a stereotype of a New York millennial,” he says.
Just make sure you have earplugs in case your roommate is able to get laid in their respectively expensive, tiny room.
The Millennial Crisis

There is a serious economic crisis brewing that few seem to be paying attention. According to a new survey from Zillow Group Inc. (ZG – Get Report), approximately 22.5% of millennials ages 24 through 36 are living at home with their moms or both parents, up nine percentage points since 2005 which was 13.5% and the most in any year in the last decade. Between the student loans which cannot be discharged thanks to the Clintons (to get the support of bankers) even after they find that degrees are worthless when 60% of graduates cannot find employment with such a degree and the fact that taxes have escalated to nearly doubling over the last 20 years that is predominantly state and local, the affordability of buying a home has been fading fast. Despite the fact that millennials are eager to enter the real estate market, they’re bearing the brunt of the challenge directly caused by the combination of taxes and non-dischargeable student loans.

Now 63% of millennials under the age of 29 cannot even afford the cost of home ownership, according to a CoreLogic and RTi Research study. The expense, in fact, is their number one reason for remaining a renter. In their research, they concluded that one-third of millennial renters reported feeling they cannot afford a down payment to buy a home. This is a sad response that is not being taken into consideration by governments.
Where home prices have not risen sharply, taxes have. First-time home buyers face ever-growing challenges to find and buy affordable entry-level homes as the economics of inefficient governments at the state and local levels have refused to reform and raise taxes to meet pension costs they promised themselves. Politicians from London to Vancouver have increased taxes to try to bring home prices down rather than looking at the problem objectively. All they are accomplishing is punishing people who have owned homes and destroying their future when home values were their retirement savings.
California and Illinois are just two major examples at the top of the list of grossly mismanaged state governments. It is this net affordability factor that has begun to encumber sales of real estate, softening prices and turning many millennials into renters rather than home buyers. Then add the rise of interest rates and we have an economic cocktail of taxes that is beginning to kill the real estate market in a slow death drip by drip. Depressions take place when the debt and real estate markets collapse – not equities and commodities. The amount of money invested in debt markets dwarfs equities, It is ALWAYS the debt market that you undermine when you want to destroy an economy.

Taxes and the rise in interest rates will further erode affordability and is beginning to slow existing-home sales in many markets already. As this trend continues, home prices and mortgage rates over the next couple of years will likely dampen sales and home price growth. There was another study conducted by Freddie Mac which also found that affordability challenges are contributing to a downtrend in young adult home ownership. Long-term, real estate prices will decline as taxes and interest rates rise. The next crop of buyers is being culled and as that unfolds, real estate cannot rise when banks also begin to curtail the availability of mortgages.
Millennials Are Flocking To Cheap Rust Belt Cities
Educated, but poor, millennials are transforming neighborhoods in several Rust Belt states like Ohio, Michigan, and Wisconsin in search for affordable communities.
Since the end of the American high (the late 1960s), the Rust Belt had experienced decades of de-industrialization and a mass exodus of residents. Manufacturing plants closed down, jobs disappeared, and communities disintegrated, as this once vibrant region is now a symbol of decay and opioids.
However, this trend has reversed in recent years, as some millennials have abandoned big cities for Rust Belt communities, in hopes to catch the falling knife and invest in real estate that could be near its lows.

It is a massive risk, and the narrative behind this “attractive investment bet” are affordable communities, unlike the Washington Metropolitan Area, San Francisco, New York, San Diego County, and Boston.
Yet this revitalization of the Rust Belt economy could not have come at the worse time: Last week, Bank of America rang the proverbial bell on the US real estate market, saying existing home sales have peaked, reflecting declining affordability, greater price reductions and deteriorating housing sentiment.
While it is difficult to say what exactly happens in Rust Belt communities in the next downturn, one should understand that housing prices in these regions will probably stay depressed for the foreseeable future. So, if the millennial who was hoping for a Bitcoin-style like move, they should think again as investing in Rust Belt communities is a long-term strategy.

Constantine Valhouli, Director of Research for the real estate research and analytics firm NeighborhoodX, told CNBC that millennials are flocking to these areas not just for home ownership, but rather rebuilding these communities from the bottom up.
“It is about having roots and contributing to the revival of a place that needs businesses that create jobs and create value.”
According to Paul Boomsma, president and CEO of Leading Real Estate Companies of the World (LeadingRE), some of these formerly blighted towns are gradually coming back to life. The latest influx of millennials view these regions as financial opportunities and places to construct new economies – especially with real estate prices far below the Case–Shiller 20-City Composite Home Price Index.
“Millennials are swiping up properties for next-to-nothing prices near downtown city areas that have completely revitalized,” Boomsma said. LendingRE has listed a three-bedroom Victorian home in Mansfield, Ohio, with an asking price of $39,900.
The median home value in Mansfield is $60,300, now compare that to the median home value of nearly $700,000 in New York City and a whopping $1.3 million in San Francisco, and it is obvious why millennials are flocking to the Rust Belt. Experts add that there is more to consider than discounted prices.
“There is a community-mindedness with millennials that attracts them to the smaller Rust Belt towns,” said Peter Haring, president of Haring Realty in Mansfield, Ohio.
“We are seeing an intense interest in participating in the revitalization of our towns and being a part of the community. It’s palpable, and it’s exciting,” he added.

Haring said affordable homes in Mansfield comes with a significant drawback: distance. The closest large cities, Cleveland and Columbus, are each an hour’s drive, and amenities are lacking.
“For people working in those cities, they are sacrificing drive time,” Haring said. “In some cases, they are sacrificing the convenience of nearby shopping and restaurants.”
But for millennials that is a little concern: they have the luxury of working remotely and ordering consumable goods from Amazon.
“More and more people are now working virtually, which means they do not need to be in their office and can work from almost anywhere,” said Ralph DiBugnara, senior vice president at Residential Home Funding. “So why not find somewhere to live where your city dollars can go a lot further?”
CNBC points out that some large corporations are moving back into these areas, the same areas that they left decades ago for cheap labor overseas. One example is home appliance manufacturer Whirlpool, whose corporate headquarters are in Benton Harbor, Michigan.
“It helped revitalize surrounding areas with new lifestyle and cultural amenities,” said LendingRe’s Boomsma. “This type of corporate commitment draws a young workforce, who are attracted by the lifestyle, paired with the relative affordability.”
Todd Stofflet, a Managing Partner at the KIG CRE brokerage firm, said for the millennials who still cannot afford to buy a home, the Rust Belt also has a robust rental market. Millennials who are heavily indebted with student loans, auto debt, and high-interest credit card loans could discover that these low-cost regions are perfect strategies to break free from the debt ball and chain and start saving again. Restore capitalism and say goodbye to creditism, something the Federal Reserve and the White House would not be happy about.
Millennials are creating demand for new apartments, which is a “a catalyst for retail, grocery and office development,” Stofflet added. “As downtown populations experience a resurgence, so does the dining, entertainment and lifestyle of the area.”

Although discounted real estate prices in Rust Belt regions are appealing in today’s overinflated Central Bank controlled markets, Daniela Andreevska, a marketing director at real estate data analytics company Mashvisor, cautioned millennials to learn about the dynamics of why these communities have low prices.
“One should keep in mind that many of the homes there are foreclosures or other types of distressed properties,” she said. “You should analyze and inspect the property well in order to know how much exactly you will have to pay in repairs before buying it.”
These migration trends indicate both positive and negative shifts: on one hand millennials are fleeing unaffordable large cities to Rust Belt regions, in an adverse reaction to failed economic policies to reinflate the housing market. On the other hand, for millennials with insurmountable debt, migrating to these low-cost regions could be the most viable solution to get their finances under control.
Existing Home Sales Tumble As Home-Buying Sentiment Hits Lehman Lows
After June’s dismal US housing data, hope was high for a rebound in July but it was crushed as existing home sales tumbled 0.7% MoM (against expectations of a 0.4% jump). This is the longest streak of declines since the taper tantrum in 2013.
- Single-family home sales fell 0.2% MoM (-1.2% YoY) to annual rate of 4.75 million
- Purchases of condominium and co-op units dropped 4.8% MoM (-3.3% YoY) to a 590,000 pace

As lower-priced home sales collapsed…

This is the weakest SAAR existing home sales (5.34mm) since Feb 2016…

The median sales price increased 4.5% YoY to $269,600, but dipped MoM (seasonal norm)

Lawrence Yun, NAR chief economist, says the continuous solid gains in home prices have now steadily reduced demand.
“Led by a notable decrease in closings in the Northeast, existing home sales trailed off again last month, sliding to their slowest pace since February 2016 at 5.21 million,” he said.
“Too many would-be buyers are either being priced out, or are deciding to postpone their search until more homes in their price range come onto the market.”
“In addition to the steady climb in home prices over the past year, it’s evident that the quick run-up in mortgage rates earlier this spring has had somewhat of a cooling effect on home sales,” said Yun.
“This weakening in affordability has put the most pressure on would-be first-time buyers in recent months, who continue to represent only around a third of sales despite a very healthy economy and labor market.”
Total housing inventory at the end of July decreased 0.5 percent to 1.92 million existing homes available for sale (unchanged from a year ago). Unsold inventory is at a 4.3-month supply at the current sales pace (also unchanged from a year ago).
And finally a glance at the following chart shows that the US housing market is in freefall – not what record high stocks would suggest…

Perhaps this helps explain it – Sentiment for Home-Buying Conditions are the worst since the infamous Lehman Brothers collapse …

Affordability Crisis: Low-Income Workers Can’t Afford A 2-Bedroom Rental Anywhere In America

The National Low Income Housing Coalition’s (NLIHC) annual report, Out of Reach, reveals the striking gap between wages and the price of housing across the United States. The report’s ‘Housing Wage’ is an estimate of what a full-time worker on a state by state basis must make to afford a one or two-bedroom rental home at the Housing and Urban Development’s (HUD) fair market rent without exceeding 30 percent of income on housing expenses.
With decades of declining wages and widening wealth inequality via the financialization of corporate America, and thanks to the Federal Reserve’s disastrous policies (whose direct outcome is the ascent of Trump), the recent insignificant countertrend in wage growth for low-income workers has not been enough to boost their standard of living.
The report finds that a full-time minimum wage worker, or the average American stuck in the gig economy, cannot afford to rent a two-bedroom apartment anywhere in the U.S.
According to the report, the 2018 national Housing Wage is $22.10 for a two-bedroom rental home and $17.90 for a one-bedroom rental. Across the country, the two-bedroom Housing Wage ranges from $13.84 in Arkansas to $36.13 in Hawaii.
The five cities with the highest two-bedroom Housing Wages are Stamford-Norwalk, CT ($38.19), Honolulu, HI ($39.06), Oakland-Fremont, CA ($44.79), San Jose-Sunnyvale-Santa Clara, CA ($48.50), and San Francisco, CA ($60.02).
For people earning minimum wage, which could be most millennials stuck in the gig economy, the situation is beyond dire. At $7.25 per hour, these hopeless souls would need to work 122 hours per week, or approximately three full-time jobs, to afford a two-bedroom rental at HUD’s fair market rent; for a one-bedroom, these individuals would need to work 99 hours per week, or hold at least two full-time jobs.
The disturbing reality is that many will work until they die to only rent a roof over their head.
The report warns: “in no state, metropolitan area, or county can a worker earning the federal minimum wage or prevailing state minimum wage afford a two-bedroom rental home at fair market rent by working a standard 40-hour week.”
The quest to afford rental homes is not limited to minimum-wage workers. NLIHC calculates that the average renter’s hourly wage is $16.88. The average renter in each county across the U.S. makes enough to afford a two-bedroom in only 11 percent of counties, and a one-bedroom, in just 43% .
FIGURE 1: States With The Largest Shortfall Between Average Renter Wage And Two-Bedroom Housing Wage

Low wages and widespread wage inequality contribute to the widening gap between what people earn and mandatory outlays, in the price of their housing. The national Housing Wage in 2018 is $22.10 for a two-bedroom rental home and $17.90 for a one-bedroom, the report found.
FIGURE 3: Hourly Wages By Percentile VS. One And Two-Bedroom Housing Wages

Here is how much it costs to rent a two-bedroom in your state:


Case Shiller House Prices have continued to surge to bubble levels with growing demand for rental housing in the decade post the Great Recession.

The report indicates that new rental construction has shifted toward the luxury market because it is more profitable for homebuilders. The number of rentals for $2000 or more per month has more than doubled between 2005 and 2015.
Here are the Most Expensive Jurisdictions for Housing Wage for Two-Bedroom Rentals

Here is how your state ranks regarding Housing Wage:

“While the housing market may have recovered for many, we are nonetheless experiencing an affordable housing crisis, especially for very low-income families,” said Bernie Sanders quoted in the report.
The fact is, the low-wage workforce is projected to soar over the next decade, particularly in unproductive service-sector jobs and odd jobs in the gig economy, as increasingly more menial jobs are replaced by automation/robots. This is not sustainable for a fragile economy where many are heavily indebted with limited savings; this should be a warning, as many Americans do not understand their living standards are in decline. American exceptionalism is dying.

The bad news is that for the government to combat the unaffordability crisis, deficits would have to explode because even more Americans would demand housing subsidies, setting the US debt on an even more unsustainable trajectory. Even though Congress marginally increased the 2018 HUD budget, the change in funding levels for some housing programs have declined.
Changes In Funding Levels For Key HUD Programs (FY10 Enacted To F18 Enacted)

But wait a minute, something does not quite add up: consider President Trump’s cheer leading on Twitter calling today’s economy the “greatest economy in History of America and the best time EVER to look for a job.”
Rents Surge Most in 16 Months Pressuring Home Buyer Wannabees

The Rent Cafe’s Monthly Rent Report for the 250 largest US cities shows a 3.2% Y-o-Y surge.
The national average rent in April clocked in at $1,377. This marks the highest annual growth rate since the end of 2016.
By Size
- Large cities: Las Vegas sees the fastest increasing rents Y-o-Y (6.0%), followed by Denver (5.8%) and Detroit (5.4%). Apartment prices in Brooklyn and Manhattan continue to slide, while rents in Washington, D.C., Portland, and Austin have been steady, growing by less than 1.5%.
- Mid-size cities: Rents in Sacramento cooled down to 6%, but still lead. At the other end of the spectrum are New Orleans (-2.2%), Tulsa (0.5%), and Wichita (1.0%), where rents are growing the slowest.
- Small cities see the top 20 most significant rent increases in April. Rents in the Midland-Odessa area skyrocketed for another month, 35.6% and 32.6% respectively. At the bottom of the list sit Norman (-2.5%), Lubbock (-2.5%), and Alexandria (-1.1%).
- No significant fluctuation in prices was noticed in Chicago, Philadelphia, and San Francisco, where apartment rents grew slower than 2% over the year.
Significant Changes

Wages Aren’t Keeping Up

The above chart was released today by the BLS. For details, please see Jobs Report: Payroll Miss +164K, Nonfarm Wage Growth Anemic +0.1%.
BLS in Agreement

The BLS also has rent of primary residence up 3.6% (from March).
Median New Home Sales Price

Median Real Wages

Home Buyer Wannabee Dilemma
Home buyer wannabees struggle with rents but cannot afford houses.
The most recent data for median wages is from May of 2016. May of 2017 will be out soon and I will update the chart.
New buyers struggle with rent but home buying is not an option.
Real median wages are down seven of the last 11 years while home prices (not even reflected in the CPI), have soared.
How the Fed’s Inflation Policies Crucify Workers in Pictures
For median wage details, please see How the Fed’s Inflation Policies Crucify Workers in Pictures
Deflationary Bust Coming
The current setup leads to another deflationary collapse as we saw in 2008-2009, not an inflation boom.
“If I were trying to create a deflationary bust, I would do exact exactly what the world’s central bankers have been doing the last six years,” said Stanley Druckenmiller, 2018 recipient of the Alexander Hamilton award.
That is precisely what I have been saying for a long time.
For an explanation of the coming deflationary collapse, please see Can We Please Try Capitalism? Just Once?
No Relief In Sight: Housing affordability is weakening at the fastest pace in a quarter century

- Rising home prices, rising mortgage rates and rising demand are colliding with a critical shortage of homes for sale. And all of that is slamming housing affordability.
- This year, affordability — based on the amount of the monthly mortgage payment will weaken at the fastest pace in a quarter century, according to researchers at Arch Mortgage Insurance.
- Other studies that factor in median income also show decreasing affordability because home prices are rising far faster than income growth.
It is the perfect storm: Rising home prices, rising mortgage rates and rising demand are colliding with a critical shortage of homes for sale.
And all of that is slamming housing affordability, which is causing more of today’s buyers to overstretch their budgets. This year, affordability — a metric based solely on the amount of the monthly mortgage payment — will weaken at the fastest pace in a quarter century, according to researchers at Arch Mortgage Insurance.
The average mortgage payment, based on the median-priced home, increased by 5 percent in the first quarter of 2018 nationally and could go up another 10 to 15 percent by the end of the year, according to their report.
Researchers looked at the median-priced home, now $250,000, and estimated price gains this year of 5 percent in addition to mortgage rates going from 4 percent to 5 percent on the 30-year fixed. Other studies that factor in median income also show decreasing affordability because home prices are rising far faster than income growth.
That is a national picture – but all real estate is local, and some markets will see affordability weaken more dramatically. The average monthly payment in Tacoma, Washington, is estimated to increase 25 percent this year, given sharply rising prices. In Baltimore and Boston, it could rise 21 percent in each. Philadelphia, Detroit and Las Vegas could all see 20 percent increases in the average monthly payment.
“If mortgage rates and home prices continue to rise as expected, affordability will get hammered by year-end as demand continues to outstrip supply,” said Ralph DeFranco, global chief economist-mortgage services at Arch Capital Services. “A strong U.S. economy combined with a housing shortage in many markets means that there is little hope of any price drop for buyers. Whether someone is looking to upgrade or purchase their first home, the window to buy before rates jump again is probably closing fast.”
Barely a decade after home values crashed especially, they are now hovering near their historical peak, accounting for inflation. Prices are being driven by record low inventory of homes for sale. Home builders are still producing well below historical norms, and demand for housing is very hot. The economy is stronger, which is giving younger buyers the incentive and the means to buy homes.
Stretching budgets and pushing limits
Maryland real estate agent Theresa Taylor said the supply shortage is hitting buyers hard. She is seeing more clients stretch their budgets to win a deal amid multiple offers.
“People are having to escalate offers on top of rates going up. I’m seeing it in all price ranges,” said Taylor, an agent at Keller Williams. “I am seeing it when I’m getting five offers, and people are trying to package up an offer where they’re pushing their limits.”
Buyers are taking on much higher debt levels today to be able to afford a home. In fact, the share of mortgage borrowers with more than 45 percent of their monthly gross income going to debt payments more than tripled in the second half of last year. Part of that was because Fannie Mae raised that debt-to-income threshold to 50 percent, but clearly there was demand waiting.
“Family income is rising more slowly than home prices and mortgage rates, meaning that the mortgage payment takes a bigger bite out of income for new home buyers,” said Frank Martell, president and CEO of CoreLogic. “CoreLogic’s Market Conditions Indicator has identified nearly one-half of the 50 largest metropolitan areas as overvalued. Often buyers are lulled into thinking these high-priced markets will continue, but we find that overvalued markets will tend to have a slowdown in price growth.”
CoreLogic considers a market overvalued when home prices are at least 10 percent higher than the long-term, sustainable level. High demand makes the likelihood of a national home price decline very slim, but certain markets could see prices cool if supply grows or if there is a hit to the local economy and local employment.
In any case, the more home buyers stretch, the more house-poor they become, and the less money they have to spend in the rest of the economy.
With no relief in either inventory or home price appreciation in sight, the housing market is likely to become even more competitive this year.
At some point, however, there will come a breaking point when sales slow, which is already beginning to happen in some cities. Home prices usually lag sales, so if history holds true, price gains should start to ease next year.
Economists Who Push Inflation Stunned That Rising Home Prices Have Put Buyers Deeper Into Debt
Once again, when the government intervenes – this time in housing – the left hand is starting a fire that the right hand is trying to put out. Rising prices for homes are once again pricing out prime borrowers and nobody can “figure out” why this is happening.

It is news like this article reported this morning by the Wall Street Journal that continues to perpetuate the hilarious notion of Keynesian economics as giving a job to one man digging a hole and another job to another man filling it, simply so that they both have jobs.
There is nothing funnier (or sadder) than “economists” struggling to understand how housing prices got so high and why people are taking on more debt in order to purchase them. However, that is the great mystery that the Wall Street Journal reported on Tuesday morning, making note of the fact that people are “stretching“ in order to purchase homes. What’s the solution to this problem? How about just easing lending standards again? After all, what could go wrong?
Apparently blind to the obvious – that forced inflation could amazingly make things more expensive relative to income – “economists” have hilariously blamed this price/debt delta on lack of supply. Of course, no one has mentioned the credit worthiness of borrowers getting worse or the fact that homes prices are being manipulated in order to offer home ownership to people who otherwise may not be in the market.
More Americans are stretching to buy homes, the latest sign that rising prices are making homeownership more difficult for a broad swath of potential buyers.
Roughly one in five conventional mortgage loans made this winter went to borrowers spending more than 45% of their monthly incomes on their mortgage payment and other debts, the highest proportion since the housing crisis, according to new data from mortgage-data tracker CoreLogic Inc. That was almost triple the proportion of such loans made in 2016 and the first half of 2017, CoreLogic said.
Economists said rising debt levels are a symptom of a market in which home prices are rising sharply in relation to incomes, driven in part by a historic lack of supply that is forcing prices higher.
The “lack of supply” argument is just wonderful – a bunch of “economists” finding a basic free market capitalism solution to a problem that has nothing to do with free market capitalism. Perhaps “economists” can also argue that building more, despite the lack of prime borrower demand, will also have the added benefit of puffing up GDP. From there, it’s only a couple more steps down the primrose path that leads to China’s ghost cities.

And of course, people are worried that we could have a “weak selling season” upcoming. In a free market economy, weakness is necessary and normal. In Keynesian theory, it’s the devil incarnate. The Wall Street Journal continued:
Real-estate agents worry that buyers’ weariness from being priced out of the market could make this one of the weakest spring selling seasons in recent years.
Consumers are growing more optimistic about the economy and their personal financial prospects but less hopeful that now is the right time to buy a home, according to results of a survey released in late March by the National Association of Realtors.
At the same time, the average rate for a 30-year, fixed-rate mortgage has risen to 4.40% as of last week from 3.95% at the beginning of the year, according to Freddie Mac, putting still more pressure on affordability.
These factors “are working against affordability and that’s why you get the pressure to ease credit standards,” said Doug Duncan, chief economist at Fannie Mae. He said that pressure has to be balanced against the potential toll if underqualified buyers eventually default on their mortgages.
CoreLogic studied home-purchase loans that generally meet standards set by Fannie Mae and Freddie Mac, the federally sponsored providers of 30-year mortgage financing.
The amount of these loans packaged and sold by Fannie and Freddie increased 73% in the second half of 2017, compared with the first half of the year, according to Inside Mortgage Finance, an industry research group. In that same period, overall new mortgages rose 15%.
As if the signs weren’t clear enough that manipulating the economy and manipulating the housing market has a detrimental effect, the article continued that Fannie Mae and Freddie Mac are “experimenting with how to make homeownership more affordable, including backing loans made by lenders who agree to help pay down a buyer’s student debt“. Sure, solve one government subsidized shit show (student loan debt) with another one!
Is it any wonder that the entire supply and demand environment for housing has been thrown completely out of order? On one hand, the government wants to make housing affordable so that everybody can have it, which closely resembles socialism. On the other hand, they are targeting prices to rise 2% every single year and claim that this is normal and healthy economic policy that we should all be buying into and applauding. The left hand doesn’t know what the right hand is doing!
We were on this case back in October 2017 when we wrote an article pointing out that home prices had again eclipsed their highest point prior to the financial crisis. We knew this was coming. We at the time that the ratio of the trailing twelve month averages of median new home sale prices to median household income in the U.S. had risen to an all time high of 5.454, which following revisions in the data for new home sale prices, was recorded in July 2017. The initial value for September 2017 is 5.437.
In other words, the median new home in the US has never been more unaffordable in terms of current income.

Here we are 6 months later and “economists” are just figuring this out. What’s wrong with this picture?
What’s really happening is clear. Instead of letting the free market determine the pricing and availability of housing, the government has continued to try and manipulate the market in order to give everyone a house. This is simply going to lead to the same type of behavior that led Fannie Mae and Freddie Mac to fail during the housing crisis.
If we are going to have free market capitalism, the reality of the situation is that not everybody is going to own a house.
Furthermore, while there are many benefits to owning a house, there are also many reasons why people rent. Peter Schiff, for instance, often makes the case that renting is generally worth it because you’re saving yourself on upkeep and it allows you to be flexible with where you live and when you have the opportunity to move. He himself rents property for these reasons, which he often notes in his podcast. Sure, there are some benefits of homeownership, namely that a homeowner is supposed to be building equity in something, but looking again at the situation we are in today, is it worth investing in the equity of a home that might see its price crash significantly again, similar to the way housing prices did in 2008?
The government is creating both the problem and the solution here and instead of trying to continually fix the housing market, they should just keep their nose out of it and allow the free market to determine who should own a house and at what price. Call us crazy, but we don’t think that’s going to happen.
How Much Income You Need to Afford the Average Home in Every State
The housing market has not only recovered its pre-recession levels, but some observers are actually starting to worry about yet another housing bubble. Housing prices are on the rise, thanks in large part to extremely tight inventory, so it’s worth asking: are potential home buyers getting priced out of the market? The answer depends on where they live and how much money they make.
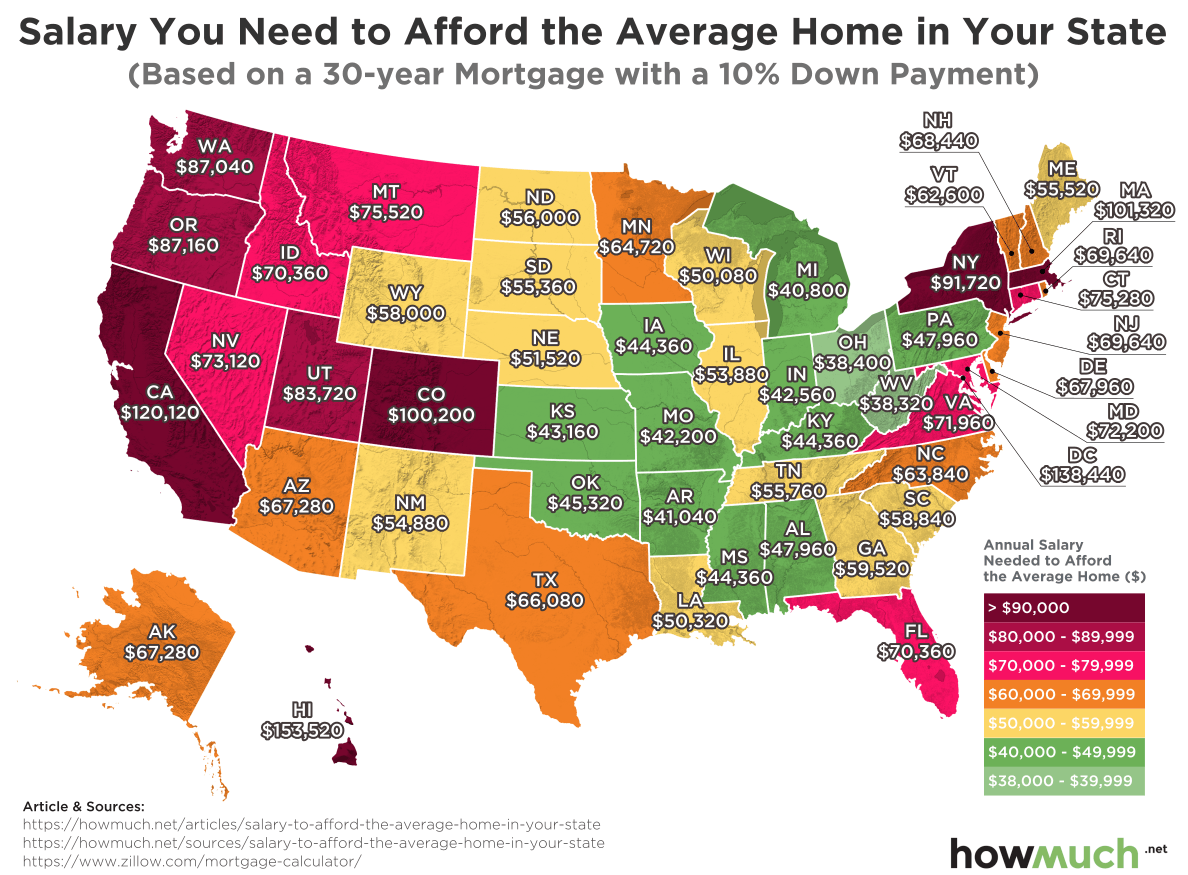
We collected average home prices for every state from Zillow which we then plugged into a mortgage calculator to figure out monthly payments. Remember, mortgage payments consist of both the principal and the interest for the loan. The interest rate we used varied from 4 to 5% in each state, depending on the market. The lower the interest rate, the lower the monthly payment. To keep things simple, we assumed buyers could contribute a 10% down payment. Another thing to keep in mind is that financial advisors commonly recommend the total cost of housing take up no more than 30% of gross income (the amount before taxes, retirement savings, etc.). Using this rule as our benchmark, we calculated the minimum salary required to afford the average home in each state.
Top Five Places Where You Need the Highest Salaries to Afford the Average Home
1. Hawaii: $153,520 for a house worth $610,000
2. Washington, DC: $138,440 for a house worth $549,000
3. California: $120,120 for a house worth $499,900
4. Massachusetts: $101,320 for a house worth $419,900
5. Colorado: $100,200 for a house worth $415,000
Top Five Places Where You Need the Lowest Salaries to Afford the Average Home
1. West Virginia: $38,320 for a house worth $149,500
2. Ohio: $38,400 for a house worth $149,900
3. Michigan: $40,800 for a house worth $160,000
4. Arkansas: $41,040 for a house worth $161,000
5. Missouri: $42,200 for a house worth $165,900
Our map creates a quick snapshot of housing affordability across the United States. There are several pockets in which only the upper middle class and above can afford to own even the average home, most notably across the West and in the Northeast. There are only two states west of the Mississippi River where a worker with an annual salary under $40,000 can afford a mid-level home: Missouri and Oklahoma. Colorado stands out as the only landlocked state requiring a significant amount of income ($100,200), thanks in large part to the housing market around Denver.
Homes tend to be more affordable in the eastern half of the country, with a notable pocket of “green” (less expensive) states located in the upper Midwest. The North is generally more affordable than the South and the typical home is significantly easier to buy in places like Michigan or Ohio than in Louisiana or Arkansas. Additionally, our map indicates that workers can more easily afford homes in the East than in the West, which is surprising given how much more land is available out West. It is important to note that there are certainly deep pockets of poverty in all of these places, which suggests that our map obscures the inequality behind averages.
The best takeaway from our map is that housing remains affordable in large swaths of the country, even though there will always be places like California and New York where there is simply too much demand for the available inventory. Thankfully, that doesn’t mean that buying a home is suddenly out of reach for average Americans in Ohio or Mississippi, for example.
In Nearly 70% Of US Counties, The Average Worker Can’t Afford To Buy A Home
Housing, as we’ve pointed out in the past, is perhaps the most reliable bellwether of widening economic inequality in the US. And in its latest quarterly report on housing affordability in the US, ATTOM discovered that median-priced homes aren’t affordable to average wage earners in an astounding 68% of US housing markets.
In its report, the company calculated affordability by incorporating the amount of income needed to make monthly home payments – including mortgage payments, property tax payments and insurance – on a median-priced home, assuming a 3% down payment and a 28% maximum “front-end” debt-to-income ratio.
That required income was then compared with the median home price.

The 304 counties where a median-priced home in the first quarter was not affordable for average wage earners included Los Angeles County, California; Maricopa County (Phoenix), Arizona; San Diego County, California; Orange County, California; and Miami-Dade County, Florida. Meanwhile, the 142 counties (32 percent of the 446 counties analyzed in the report) where a median-priced home in the first quarter was still affordable for average wage earners included Cook County (Chicago), Illinois; Harris County (Houston), Texas; Dallas County, Texas; Wayne County (Detroit), Michigan; and Philadelphia County, Pennsylvania.

Already, the “hottest” housing markets are seeing an exodus of working- and middle-class individuals who can no longer afford to pay the high rents – let along afford to set aside enough money for a down payment.
Eight of the top 10 counties with the highest median home prices in Q1 2018 posted negative net migration in 2017: Kings County (Brooklyn), New York (25,484 net migration decrease); Santa Clara County (San Jose), California (5,559 net migration decrease); New York County (Manhattan), New York (3,762 net migration decrease); Orange County, California (3,750 net migration decrease); and San Mateo, Marin, Napa and Santa Cruz counties in Northern California.
Furthermore, ATTOM’s data found that this problem is getting worse, not better, with 41% of housing markets less affordable than their historical average during the first quarter. That’s up from 35% the quarter before.
Meanwhile, a staggering 73% of markets posted worsening affordability compared with a year ago, including Los Angeles, Cook County (home to Chicago), Maricopa County (Phoenix) and Kings County (Brooklyn).

The counties where the average wage earner would need to spend the highest share of their income to buy a median-priced home are Baltimore, Bibb County (Macon, Georgia) and Wayne County (Detroit).
Continuing with the trend of home prices rising more than twice as quickly as wages, home-price appreciation outpaced wage growth in 83% of housing markets.
When Fed Chairman Jerome Powell warned last month that “valuations are still elevated across a range of asset classes” and that he fears “signs of rising non-financial leverage” it’s possible that he was still understating the problem.
US Home Prices Surge Most Since 2014
For the 29th month in a row, US home prices rose at a faster pace than incomes with November prices rising a better than expected 6.41% – the highest since July 2014.
The 20-City Composite rose 6.41% YoY in November (above the 6.30% expectations)

The 20-City Composite price index is within 1% of its record highs from 2006…

“Top”? or “Breakout”?
Home Prices Set To Soar In 2018
 The temperature may be frigid across much of the nation, yet home prices are sizzling and sellers are in the hot seat.
Sales prices jumped 7 percent annually in November, according to a new report from CoreLogic. That is the third straight month at that pace, far higher than the price gains in the first half of 2017. Low supply and high demand are fueling the spurt and neither of those is expected to ease up anytime soon. Supply is actually falling even more now, and a strengthening economy is pushing demand. This will have potential buyers out early this year, trying to get a jump on the spring market. “Rising home prices are good news for home sellers, but add to the challenges that home buyers face,” said Frank Nothaft, chief economist at CoreLogic, in the report. Nothaft said the limited supply is the worst at the lower end, and will hit the growing number of first-time buyers hardest.
The largest metropolitan areas are seeing the biggest gains.
In the nation’s top 50 markets, half of the housing stock is now considered overvalued, based on market fundamentals, like income and employment. CoreLogic defines an overvalued housing market as one in which home prices are at least 10 percent higher than the long-term, sustainable level. Las Vegas led the November report as not only being overvalued, but showing a double-digit annual price gain of 11 percent. San Francisco was not far behind at 9 percent, and Denver came in third at 8 percent. Las Vegas and Denver are both considered overvalued, but San Francisco is not, as incomes in the tech capital far exceed the national level. Of the nation’s 10 major markets with the biggest price gains, seven are overvalued. These include Washington, D.C., Houston and Miami. Boston and Chicago are still seeing price gains but are considered at value. Without a significant jump in home construction, prices will remain high and likely move higher. Mortgage rates could also move slightly higher, and new tax policy limiting mortgage and property tax deductions, is hitting homeowners in some states hard.
All will combine to make housing less and less affordable in the new year.
Baby Boomers Who Refuse to Sell Are Dominating the Housing Market

Jake Yanoviak is hunting for houses. On a weekday afternoon in North Philadelphia, the 23-year-old painter cruises along on his bike, its black paint obscured under stickers from breweries and rock bands. He turns onto a side street, where he spots a few elderly neighbors, standing on adjoining porches. He parks, leans on one handlebar and makes his pitch.
“Anybody on the block considering selling?” Yanoviak asks gently. “I’m not a developer, I’m not interested in renting to students. I’m just a kid trying to buy a house, fix it up and live in it.”

“We’re not going no place,” replies a 70-something woman, relaxing in fuzzy white pig slippers in the row house where she’s lived twice as long as Yanoviak has been alive. “All these houses are taken.”
Like much of his generation, Yanoviak is desperate to get a piece of an increasingly scarce commodity: prime American real estate. Millennials are finding themselves out in the cold because building has slowed, and longer-living baby boomers are staying put, setting up a simmering conflict between the two biggest generations in U.S. history.
To succeed, buyers and real estate brokers must show uncommon persistence and, at times, diplomacy. Yanoviak has tried sheriff’s sales, lost two bidding wars, ridden miles on potholed streets and left notes in mailboxes, all to no avail.
People 55 and older own 53 percent of U.S. owner-occupied houses, the biggest share since the government started collecting data in 1900, according to real estate website Trulia. That’s up from 43 percent a decade ago. Those ages 18 to 34 possess just 11 percent. When they were that age, baby boomers had homes at almost twice that level.

Public policy contributes to the generational standoff. Property-tax exemptions for longtime residents keep older Americans from moving. Zoning rules make it harder to build affordable apartments attractive to senior citizens.
“The system is gridlocked,” says Dowell Myers, a professor of urban planning and demography at the University of Southern California. “The seniors aren’t turning over homes as fast as they used to, so there are very few existing homes coming online. To turn it over, they’ll have to have a landing place.”
In Lexington, Massachusetts, a Boston suburb, broker Dani Fleming offers pizza and refreshments to entice the mostly elderly homeowners to attend seller seminars on “how to unlock the potential of your home.”
In Alameda, California, east of San Francisco, 38-year-old Angela Hockabout, her husband and their two children live with her 76-year-old mother-in-law, who is holding onto the home because the real estate taxes are so low. Under the almost-40-year-old ballot measure Proposition 13, they are tied to the property’s value when the house was purchased in the 1970s.
“Dear Homeowner, I have been looking to buy a house for almost a year and have not found one.”
Kale, Tomatoes
In Omaha, Nebraska, Bill and Peg Swanson, a couple in their late 60s, say they might move if they could find affordable single-family homes aimed at seniors nearby. Still, like many from their generation, they like aging in place, tending their garden of green peppers, kale and tomatoes.
“There are a lot of reasons to stay here,” Bill Swanson says. “We still enjoy putzing around the yard.”
That kind of thinking ends up costing young home shoppers such as Yanoviak. After graduating from Carleton College in Minnesota with a degree in media studies, he now lives in West Philadelphia with his parents, an arborist and a director of a nonprofit. For a living, he does carpentry and helps paint movie sets. He’s looking at homes costing as much as $200,000 and may rent out rooms to friends.
 Yanoviak looks at a Philadelphia zoning notice outlining a plan for multifamily units on that site.
Yanoviak scouts property with Google Maps, Zillow and the city’s property-record site. When he finds something, he calls his real estate agent, Cecile Steinriede, who checks it out. He also keeps an old-school sheaf of letters in the rear pocket of his pants, so he can hand them out or slip them in mailboxes.
“Dear Homeowner,” they read. “I have been looking to buy a house for almost a year and have not found one.”
Brewerytown
Yanoviak has his sights on a neighborhood called Brewerytown, a community of brick, masonry and vinyl row houses that range from tidy to decaying, with paint peeling, holes in roofs and weeds growing from cracks in sidewalks.
Along with inter-generational tension, Yanoviak’s search raises delicate questions of race and class. He’s white and college-educated, and he’s often knocking on the doors of working-class black homeowners who see their homes as key to an affordable retirement and a way to pass wealth to future generations. (None would give their names.) Yanoviak acknowledges the awkwardness. It doesn’t help, he says, when developers assault residents with insulting, low-ball cash offers.

Yanoviak inspecting a house in the Brewerytown district.
“It’s inevitable for me to be perceived as an outsider,” Yanoviak says. “But I’m not trying to change the community. I’m trying to contribute in positive ways and be a neighbor.”
Resentments fester in neighborhoods of all ethnicities. In a traditionally Italian section of South Philadelphia, which is now out of Yanoviak’s price range, 70-year-old Nick Ingenito, sits on the front steps of the three-story brick house his grandmother’s aunt bought in the early 1900s.
‘Wouldn’t Move’
“Where do these young people get this money?” he says, looking out at the street where he played stick ball as a kid. “This neighborhood still has the soul of the past. Everybody I know — people older than me — wouldn’t move from here for nothing unless they couldn’t afford it no more.”
On a recent Thursday evening after work, Yanoviak, wearing a black T-shirt, jeans and a brown belt emblazoned with the Schlitz logo, mounts his bike to make the housing round.
On one of his first stops, a black cat slinks under the wooden gate next to an abandoned house with bay windows that piqued Yanoviak’s interest. Using his bike as a ladder, he stands on the seat and stretches his chin over barbed wire. All he can see are bed springs and junk.
Yanoviak starts cycling again, taking both hands off the handle bar to tap on his iPhone, noting the address of a property he might want to revisit.

Yanoviak carries pitch letters with him to hand out to homeowners and slip in mail boxes.
Church Properties
He stops to chat with the pastor of a church, which owns a handful of properties but isn’t selling.
“No, we’re holding out for God to do what he said he was going to do and that is to give us the block,” the pastor tells Yanoviak.
Then, he sees a gray-haired man puttering in his garage.
“I’m looking at properties in the neighborhood, there isn’t a whole lot on the market so I’m cold calling,” Yanoviak says.
“Give me $2 million,” the homeowner replies. “I don’t want no low number.”
It turns out the price is for the whole block. Even then, the potential seller has second thoughts.
“I wouldn’t sell even if you gave me $2 million — this is my retirement,” he says. “If you gave me a bag of money, I wouldn’t sell.”
After a few hours chatting with a half dozen owners and visiting eight properties, Yanoviak gets back on his bike, his pitch letters still hanging from the back pocket of his jeans. He heads back to his parents’ house, deferring for yet another day his search for a home.
Exercise self discipline, practice and consistency …
“Granite Islands And Backsplashes”: Even Singlewide Trailers Are No Longer “Affordable”

Since the early 1900s, millions of Americans have relied on trailers as a source of no-frills, affordable housing. In fact, roughly 22 million Americans live in trailer parks today, but the industry is hardly the stable source of affordable housing that it used to be…a lesson that 73-year-old Judy Goff of Naples, Florida recently discovered the hard way after Hurricane Irma ripped through her park and destroyed her home, along with roughly 1.8 million others.
As Bloomberg points out, when Goff went to a local LeeCorp dealer lot to replace her $46,000, 1,200 square foot trailer with something of similar size and value, what she found instead was “manufactured homes” stuffed with high-end upgrades like granite counter-tops and vaulted ceilings that rendered them too expensive for her $23,000 per year of income.
Last month, Judy Goff, a 73-year-old hardware store clerk whose double-wide in Naples, Fla., was blown to bits, pulled into a LeeCorp Homes Inc. sales lot and wandered through models with kitchen islands and vaulted ceilings. In the salesman’s office, she got the total price, including a carport, taxes, and removal of her destroyed trailer: $140,000. “I don’t have that kind of money,” said Goff as she stood amid the wreckage of her old home, whose walls and ceiling were stripped away, leaving her leather furniture and a lifetime of possessions to bake in the sun. “That was all I had.”
Goff—who just wants to replace the wrecked 1,200-square-foot trailer that she bought 17 years ago for $46,000, including the cost of land—says she feels boxed in. Her mobile-home community won’t allow single-wide homes or older used models as replacements. And every home must have a carport. She’s willing to give up such upgrades as the higher-end countertops, but that probably won’t be enough. Between her Social Security check and income from her job at Ace Hardware Corp., she earns only about $23,000 a year. “I just want a home that’s equal to what I had,” she says. “My home was a beauty.”
“I get that higher-end countertops and kitchen islands are where the better margins are, but that’s also going to put homes out of reach for a lot of buyers,” says Doug Ryan, director of affordable homeownership at the Washington nonprofit Prosperity Now. “The storm is revealing a whole lot of problems in the low-cost housing market.”

Meanwhile, as we note frequently, while the cost of manufactured homes has surged, the pay for the bottom fifth of American wage earners has been somewhat stagnant for nearly two decades now. Even after a modest uptick recently, the bottom 20% of households have seen their income fall 9% since 2000, in real terms.
But, as low-income households have found it increasingly difficult to rebuild after devastating hurricanes, the surge in manufacturing home pricing has been a boon for billionaire Warren Buffett who made a big financial bet on the largest manufactured housing builder, Clayton Homes, back in 2003.
The industry, led by Warren Buffett’s Clayton Homes Inc., is peddling such pricey interior-designer touches as breakfast bars and his-and-her bathroom sinks. These extras, plus manufacturers’ increased costs for labor and materials, have pushed average prices for new double-wides up more than 20 percent in five years, putting them out of reach for many of the newly homeless.
Phil Lee, the 74-year-old founder of LeeCorp, has been riding a wave of retiring baby boomers who want affordable luxury. Driving a reporter in his black BMW SUV through Bayside Estates in Fort Myers Beach, where many of the fanciest homes he sells are installed, Lee points out units with pitched roofs that look almost indistinguishable from conventional homes, facing canals with boats tied outside. Their owners, former dentists, doctors, executives, and others, spent upwards of $150,000 to buy aging units just to clear the way for something more luxurious. On a palm-lined street flanked by ranks of 1970s-era trailers, Lee sees profit. “There’s no end to replacing these homes,” he says. “You get a hurricane in there and it really accelerates things.”
Terms such as “mobile home” or “trailer” are now verboten in an industry striving to break free of its downscale origins. Buffett’s Clayton Homes, which produces almost half of all new manufactured housing in the U.S. and competes with such companies as Cavco Industries Inc. and Champion Home Builders Inc., still builds lower-priced units, but there’s barely a sign of them on its website, which is mostly devoted to high-price models. The 2,000-square-foot Bordeaux features a separate tub and shower, a computer station, and a mud room, with prices starting at $121,000 and ranging as high as $238,000, not including delivery and installation costs. Clayton declined to comment.

Of course, while mobile homes are becoming increasingly cost-prohibitive for low-income families in Florida and Texas, Silicon Valley’s future tech billionaires can’t seem to get enough of them.
Home Prices In All US Cities Grow Faster Than Wages… And Then There’s Seattle

From 1898 until Aug. 10, 1940, streetcars (here seen in 1910) made their way between upper and lower Queen Anne Hill, assisted by a weighting system called a “counterbalance.”
According to the latest BLS data, average hourly wages for all US workers rose at a respectable 2.9% relative to the previous year, if still below the Fed’s “target” of 3.5-4.5%, as countless economists are unable to explain how 4.3% unemployment, and “no slack” in the economy fails to boost wage growth. Another problem with tepid wage growth, in addition to crush the Fed’s credibility, is that it keeps a lid on how much general price levels can rise by. With record debt, it has been the Fed’s imperative to boost inflation at any cost (or rather at a cost of $4.5 trillion) to inflate away the debt overhang, however weak wages have made this impossible.
Well, not really.
Because a quick look at US housing shows that while wages may be growing at a little over 2%, according to the latest Case Shiller data, every single metro area in the US saw home prices grow at a higher rate, while 15 of 20 major U.S. cities experienced home price growth of 5% or higher, something which even the NAR has been complaining about with its chief economist Larry Yun warning that as the disconnect between prices and wages hits record wides, homes become increasingly unaffordable. Paradoxically – the higher prices rise, the more unaffordable US homes become for the average American as we showed this weekend. In fact, as of this moment, homes have never been more unaffordable, which even more paradoxically hasn’t stopped priced from hitting new all time high virtually every month for the past year.

And while this should not come as a surprise, one look at the chart below suggests that something strange is taking place in Seattle where prices soared by a bubbly 13.2% Y/Y, and which has either become “Vancouver South” when it comes to Chinese hot money laundering, or there is an unprecedented mini housing bubble in the hipster capital of the world.

Putting the above data in context, here are two charts courtesy of real-estate expert Mark Hanson, the first of which shows how much household income increase is needed to buy the median priced home in key US cities…

… while the next chart shows the divergence between actual household income, and the income needed to buy the median priced house.

Know the Competition: Who’s Buying Homes, Who’s Selling—and Who’s Not?

With soaring rental prices, extremely low mortgage rates, and a stronger economy, it seems that just about everyone wants to buy a home these days. But high home prices are keeping many aspiring homeowners, as well as would-be sellers (who need a new home to move into) out of the market.
So who is buying and selling these days?
It turns out the typical buyer and seller both are getting older—and buyers need to make more money to be able to afford a home of their own, according to the 2017 Profile of Home Buyers and Sellers by the National Association of Realtors®. The report is based on a 131-question survey filled out by nearly 8,000 recent home buyers.
It turns out the typical buyer and seller both are getting older—and buyers need to make more money to be able to afford a home of their own, according to the 2017 Profile of Home Buyers and Sellers by the National Association of Realtors®. The report is based on a 131-question survey filled out by nearly 8,000 recent home buyers.
“Prices are going up,” says Chief Economist Danielle Hale of realtor.com®. “So in order to get into the housing market, buyers need to have more income to afford the same type of properties.”
Who is the typical home buyer these days?
Home buyers come in all shapes and sizes, but the typical one is about 45 years old. That’s up considerably since 1981, the inaugural year of the report, when the median age was just 31.
Buyers these days are also making good money, at about $88,800 a year, according to the report. It was $88,500 in the previous year.
Most buyers preferred the suburbs and more rural areas, at 85%, compared with urban areas, which is where just 13% of folks bought homes. And the vast majority, 83%, also preferred a stand-alone, single-family house, the kind that typically has a lawn out back.
The suburbs reigned supreme because that’s where many of the available homes with the desired features are, says Hale.
“Properties tend to be a bit more affordable than in urban areas,” Hale says. “You’ll get much more space in the suburbs for your money than you will in an urban area, and the schools do tend to be better as well.”
Calling all the single ladies
In another indication of just how much things can change in 36 years, about 18% of home sales were made by single women. That’s up from 17% last year and just 11% in 1981. And while it’s still well below the 65% of sales that married couples scooped up, it’s ahead of the 7% of sales that unmarried men made. An additional 8% of closings were made by unmarried couples.
There are more single women today than there have been historically, says Jessica Lautz, NAR’s managing director of survey research and communications. She points to how folks are marrying later in life, or not at all. Or, some may have been married before and become widowed or divorced.
Being able to have a 30-year fixed mortgage provides financial security, compared with facing rising rental prices, Lautz says.
In addition, single women buy homes that cost just a little bit more than single men: a median $185,000 versus $175,000 for the men. And that’s despite often making less than their male counterparts.
Fewer first-time buyers are getting in on the action
High student debt, coupled with rising home prices, kept many first-time buyers out of the market. These real estate virgins made up only about 34% of home sales, according to the report. That’s slightly down from 35% last year and the long-term average of 39%.
Those who were able to buy a home were a median age of 32.
“Right around turning 30 is still a significant milestone in many people’s lives,” says Hale. “That’s why we tend to see a lot of first-time buyers.”
These buyers typically had a household income of about $75,000, up from $72,000 last year. They were likely to buy a 1,650-square-foot abode for about $190,000 in a suburban area.
“The dreams of many aspiring first-time buyers were unfortunately dimmed over the past year by persistent inventory shortages,” NAR’s Chief Economist Lawrence Yun said in a statement. “Multiple offers were a common occurrence, investors paying in cash had the upper hand, and prices kept climbing, which yanked homeownership out of reach for countless would-be buyers.”
Big student loan bills due every month also make it harder for many of these younger folks to save up for a down payment. And it could affect their debt-to-income ratios, which lenders look at before issuing mortgages.
About 41% of first-time buyers have debt, according to NAR’s report, up from 40% last year. And they now owe about $29,000—compared with $26,000 in 2016. Ouch.
“An overwhelming majority of millennials with student debt believe it’s delaying their ability to buy a home, and typically for seven years,” Yun said in a statement. “Even in markets with a plethora of job opportunities and higher pay, steep rents and home prices make it extremely difficult to put savings aside for a down payment.”
What kinds of homes are buyers snagging?
Buyers overwhelmingly opted for existing homes (ones that had previously been lived in), at about 85%, compared with just 15% who closed on brand-new abodes, according to the report. That’s likely because there are fewer newly built homes on the market as well as the newer homes tending to cost significantly more.
They shelled out a median $235,000 on their homes, which were a median 1,870 square feet. The typical home was built in 1991 and had three bedrooms and two bathrooms.
And they’re not moving far away. Usually buyers moved only about 15 miles from their previous home.
Who’s selling their homes?
They typical home seller in 2017 was much older than the typical buyer, at about 55 years old. Their household incomes were also higher, at about $103,300 a year.
“The age of sellers and repeat buyers continues to increase,” says NAR’s Lautz. That’s because many baby boomers are purchasing retirement homes later in life.
The top reasons for selling were a residence that was too small, the desire to be close to family and friends, and the need to relocate for work.
Sellers usually stayed about 10 years in their homes before putting them on the market. Their properties stayed on the market for a median of three weeks, compared with four weeks last year.
And, in a boon for sellers, they sold their homes for a median $47,500 more than what they originally paid for them, and got about 99% of their final listing price.
Fannie Mae Says Economy Will Slow in 2nd Half Of 2017

WASHINGTON, DC – Expectations for 2017 economic growth remain at 2.0 percent amid a projected second half slowdown, according to the Fannie Mae Economic & Strategic Research (ESR) Group’s July 2017 Economic and Housing Outlook. With the expansion having entered its ninth year, incoming data point to a second quarter economic growth rebound to 2.7 percent annualized, up from 1.4 percent in the first quarter. However, the full percentage point rise in the saving rate since December signals increased caution among consumers, despite elevated consumer confidence. Decelerating corporate profit growth, commonly seen in the late stages of an expansion, presents a challenge to business investment that is compounded by tax policy uncertainty. In addition, residential investment will likely contribute less to second half growth due to lackluster homebuilding activity and tight for-sale inventory that is restraining home sales. Consequently, se cond half growth is expected to slow slightly to 1.9 percent. Moderate growth is expected to continue in 2018, with potential changes to fiscal and monetary policy posing both upside and downside risks to the forecast.
“While second quarter growth is poised to rebound, we expect growth to moderate through the remainder of 2017. Consumer spending, traditionally the largest contributor to economic growth, is sluggish and is lagging positive consumer sentiment and solid hiring,” said Fannie Mae Chief Economist Doug Duncan. “While labor market slack continues to diminish, wage growth is not accelerating and inflation has moved further below the Fed’s target. These conditions support our call that the Fed will continue gradual monetary policy normalization, announce its balance sheet tapering policy in September, and wait until December for additional data, especially on inflation, before raising the fed funds rate for the third time this year.”
“Construction activity has lost some steam following the first quarter’s weather-driven boost,” Duncan continued. “Meanwhile, very lean inventory continues to act as a boon for home prices and a bane for affordability, particularly among potential first-time homeowners. According to our second quarter Mortgage Lender Sentiment Survey, lenders expect to ease credit standards further. However, we continue to project that the pace of growth in total home sales will slow to 3.3 percent this year, as we believe rapid home price gains amid scarce supply will remain a hurdle for potential homebuyers despite improvements in credit access.”
Visit the Economic & Strategic Research site at www.fanniemae.com to read the full July 2017 Economic Outlook, including the Economic Developments Commentary, Economic Forecast, Housing Forecast, and Multifamily Market Commentary. To receive e-mail updates with other housing market research from Fannie Mae’s Economic & Strategic Research Group, please click here.
Existing Home Sales Down 1.8% In June And Why It Matters

Existing Home Sales in June Dive 1.8 Percent: Same Old Problem? Second and Third Quarter Impact?
The wind down to the end of the second quarter is not going very well. Existing home sales in June fell 1.8% to a seasonally adjusted annualized rate of 5.52 million. The Econoday consensus estimate was 5.58 million.
The slip in pending home sales was no false signal as existing home sales fell 1.8 percent in June to a lower-than-expected annualized rate of 5.520 million. Year-on-year, sales are still in the plus column but not by much, at 0.7 percent which is the lowest reading since February.
Compared to sales, prices are rich with the median of $263,800 up 6.5 percent from a year ago. Another negative for sales is supply which fell 0.5 percent in the month to 1.96 million for an on-year decline of 7.1 percent. Relative to sales, supply is at 4.3 months vs 4.2 months in May.
High prices appear to be keeping first-time buyers out of the market with the group representing 32 percent of sales vs 33 percent in May and 35 percent for all of last year.
Rising prices and thin supply, not to mention low wages, are offsetting favorable mortgage rates and holding down sales. Housing data have been up and down and unable to find convincing traction so far this year. Watch for new home sales on Wednesday where general strength is the expectation.
Existing Homes Sales Month-Over-Month and Year-Over-Year

Same Old Problem?
Mortgage News Daily says Existing Home Sales Weakness Blamed on Same Old Problem.
Existing home sales slipped in June, with the blame again placed on low levels of inventory. The decline in sales, announced on Monday by the National Association of Realtors® (NAR), was anticipated, as pending home sales have decreased in each of the previous three months, ticking down 0.8 percent in May.
NAR said sales of existing single-family houses, townhouses, condos and cooperative apartments were down 1.8 percent in June, to a seasonally adjusted annual rate of 5.52 million units, the second slowest performance of the year.
Lawrence Yun, NAR chief economist, says the pullback in existing home sales in June reflected the lull in contract activity in March, April, and May. “Closings were down in most of the country last month because interested buyers are being tripped up by supply that remains stuck at a meager level and price growth that’s straining their budget,” he said. “The demand for buying a home is as strong as it has been since before the Great Recession. Listings in the affordable price range continue to be scooped up rapidly, but the severe housing shortages inflicting many markets are keeping a large segment of would-be buyers on the sidelines.”
The median existing-home price for all housing types in June was $263,800, up 6.5 percent from June 2016 ($247,600). This is a new peak price, surpassing the record set in May. June marked the 64th straight month of year-over-year gains.
The median existing single-family home price was $266,200 in June and the median existing condo price was $245,900. Those prices reflected annual increases of 6.6 percent and 6.5 percent respectively.
The tight supply of homes continues to be reflected in short marketing period. Properties typically stayed on the market for 28 days in June, one day more than in May, but six days fewer than in June 2016. Short sales were on the market the longest at a median of 102 days in June, while foreclosures sold in 57 days and non-distressed homes took 27 days. Fifty-four percent of homes sold in June were on the market for less than a month.
“Prospective buyers who postponed their home search this spring because of limited inventory may have better luck as the summer winds down,” said NAR President William E. Brown. “The pool of buyers this time of year typically begins to shrink as households with children have likely closed on a home before school starts. Inventory remains extremely tight, but patience may pay off in coming months for those looking to buy.”
First-time buyers accounted for 32 percent of existing home sales in June, down from 33 percent the previous month and a year earlier, while individual investors purchased 13 percent, unchanged from a year ago.
Convoluted Logic
Supposedly buyers may have better luck because the pool of buyers is shrinking as summer winds down. Really? By that logic, if there was only one person looking there would be a 100% success rate.
Yun says “The demand for buying a home is as strong as it has been since before the Great Recession.”
Really? By what measure?
Attitudes and Price
This is not a case of inventory or strong unmet demand. Here are the real factors.
- The Fed re-blew the housing bubble and wages did not keep up. People cannot afford the going prices. Thus, the number of first-time buyers keeps shrinking.
- Millenials do not have the same attitudes towards debt, housing, and family formations as their parents.
- Millenials are unwilling to spend money they do not have, for a place that will keep them tied down. They would rather be mobile.
Second and Third Quarter Impact
The decline in existing home purchases portends weakness in consumer spending.
There will be fewer people painting, buying furniture, updating appliances, remodeling kitchens, adding landscaping etc. The pass through effect will be greatest in the third quarter unless there is a rebound.
Angelinos Spend Nearly 50% On Their Rent

The rental apocalypse continues in Los Angeles. It is interesting to see how far some house humpers will go trying to justify prices. Some are arguing future weed sales are going to create another boom which is somewhat ironic since the benefits are actually to mellow you out, not turn you into a Taco Tuesday baby boomer that becomes a cubicle stressed slave just to purchase a home. And many times people plan on having a family shortly after which means higher childcare costs which they tend to forget. However, Los Angeles once again continues to be the worst place to rent in terms of affordability (and own for that matter). Zillow put out some interesting research and of course as you would expect, those spending nearly half of their income on rent are simply not saving for retirement.
L.A. is the Whole Foods of rental markets
I liken the L.A. housing market to Whole Foods. Great and healthy items that usually break the bank. L.A. has a large number of young and healthy hipsters and Millennials but most can’t buy a home. Heck, most Uber and Lyft drivers have nicer cars than most of us. So we live in this market where the perception is that everyone is well off and healthy when in reality many homeowners are stuck in a ridiculous commute for a crap shack and that is bad for your health.
Of course this isn’t some made up figure. Just take a look at how much income is dumped on rent in various markets:

Los Angeles by far is the worst market for renters surpassing even New York and San Francisco. I’ve made this argument multiple times and that has to do with incomes being far lower in this area compared to San Francisco and New York. Of course to house humpers they only see coastal Santa Monica and somehow use this as the reference for every other hood in the area where most of the plebs live. They forget that L.A. County has 10,000,000 people with most not living on the coast.
So it is also telling that L.A. is largely a renting household dominated county. You have millions of Millennials across the state living at home with their parents because rents are too expensive. There is also this romantic idea that many people are stashing millions of dollars away by doing this but the stats show a different story. Some are, but most are not.
What you have is Taco Tuesday baby boomers now stuck in granite countertop HGTV upgraded sarcophagi that they can’t leave for a variety of reasons including locked in Prop 13 tax assessments and adult children back in their nursery rooms. You also have the issue of low inventory that is plaguing the country:

The low inventory dilemma is not only a SoCal phenomenon but has also impacted most urban metro markets. This is why housing as an entire asset class has soared with the stock market since 2009. Unlike the stock market however, scarcity has been a large factor driving prices up in real estate.
The issue of rents is problematic however. As the percentage of households that rent grows, you are going to get those in the middle being squeezed. What do renter households care if taxes get increased on property if they don’t own? Back in 1978 when Prop 13 passed you had a much larger percentage of California homeowners. Today that is clearly not the case. “Well we’ll just increase the rent and pass it on!” Do you think people think like this? Of course not! Just take a look at New York City where only 31 percent of households own. And look at how they tax people there. That is the future. Where only the uber elite will be comfortable in their homes. Grandfathered in Taco Tuesday baby boomer homeowners will live in million dollar crap shacks and shop at the 99 Cents Store.
The idea that broke Millennials were going to buy in mass in Los Angeles never made sense. Many would rather eat out, work out, and live a more Spartan life (many by necessity). Ironically more are healthier than those pot belly cubicle dwellers that are stuck in obscene traffic everyday having to make that massive 30-year mortgage commitment. But hey, we do live in the Whole Foods of housing markets.
When Does A Home Become A Prison?

The housing market is suffering from a supply shortage, not a demand dilemma. As Millennial first-time homebuyer demand continues to increase, the inventory of homes for sale tightens. At the same time, prices are increasing, so why aren’t there more homeowners selling their homes?
In most markets, the seller, or supplier, makes their decision about adding supply to the market independent of the buyer, or source of demand, and their decision to buy. In the housing market, the seller and the buyer are, in many cases, actually the same economic actor. In order to buy a new home, you have to sell the home you already own.
So, in a market with rising prices and strong demand, what’s preventing existing homeowners from putting their homes on the market?
“Existing homeowners are increasingly financially imprisoned in their own home by their historically low mortgage rate. It makes choosing a kitchen renovation seem more appealing than moving.”
The housing market has experienced a long-run decline in mortgage rates from a high of 18 percent for the 30-year, fixed-rate mortgage in 1981 to a low of almost 3 percent in 2012. Today, five years later, mortgage rates remain just a stone’s throw away from that historic low point. This long-run decline in rates encouraged existing homeowners to both move more often and to refinance more often, in many cases refinancing multiple times between each move.

It’s widely expected that mortgage rates will rise further. This is more important than we may even realize because the housing market has not experienced a rising rate environment in almost three decades! No longer is there a financial incentive to refinance for most homeowners, and there’s more to consider when moving. Why move when it will cost more each month to borrow the same amount from the bank? A homeowner can re-extend the mortgage term another 30 years to increase the amount one can borrow at the higher rate, but the mortgage has to be paid off at some point. Hopefully before or soon after retirement. Existing homeowners are increasingly financially imprisoned in their own home by their historically low mortgage rate. It makes choosing a kitchen renovation seem more appealing than moving.”
There is one more possibility caused by the fact that the existing-home owner is both seller and buyer. In today’s market, sellers face a prisoner’s dilemma, a situation in which individuals don’t cooperate with each other, even though it is seemingly in their best interest to do so.
Consider two existing homeowners. They both want to buy a new house and move, but are unable to communicate with each other. If they both choose to sell, they both benefit because they increase the inventory of homes available, and collectively alleviate the supply shortage. However, if one chooses to sell and the other doesn’t, the seller must buy a new home in a market with a shortage of supply, bidding wars and escalating prices. Because of this risk, neither homeowner sells (non-cooperation) and neither get what they wanted in the first place – a move to a new, more desirable home. Imagine this scenario playing out across an entire market. If everyone sells there will be plenty of supply. But, the risk of selling when others don’t convinces everyone not to sell and produces the non-cooperative outcome.

Possible Outcomes
- Owner moves, but pays a price escalated by supply shortages for a more desirable home
- Owner stays in current house and does not get a more desirable home
- Owner moves, finding a more desirable home without paying a price escalated by supply shortages
Rising mortgage rates and the fear of not being able to find something affordable to buy is imprisoning homeowners and causing the inventory shortages that are seen in practically every market across the country. So, what gives in a market short of supply relative to demand? Prices. According to the First American Real House Price Index, the fast pace of house price growth, combined with rising rates, has had a material impact on affordability. In our most recent analysis in April, affordability was down 11 percent compared to a year ago. It was once said that a man’s home is his castle. In today’s market, a man’s home may be his prison, but he is getting wealthier for it.
By MarK Fleming | First American Economic Blog
Used Home Sales Fall From 10-Year Yigh
 U.S. home resales fell more than expected in February amid a persistent shortage of houses on the market that is pushing up prices and sidelining potential buyers.
The National Association of Realtors said on Wednesday existing home sales declined 3.7 percent to a seasonally adjusted annual rate of 5.48 million units last month.
January’s sales pace was un-revised at 5.69 million units, which was the highest level since February 2007. Economists polled by Reuters had forecast sales decreasing 2.0 percent to a pace of 5.57 million units last month.
“Realtors are reporting stronger foot traffic from a year ago, but low supply in the affordable price range continues to be the pest that’s pushing up price growth and pressuring the budgets of prospective buyers,” said Lawrence Yun, the NAR’s chief economist.
Sales were up 5.4 percent from February 2016, underscoring the sustainability of the housing market recovery despite rising mortgage rates. In February, houses typically stayed on the market for 45 days, down from 50 days in January.
U.S. financial markets were little moved by the data as investors increasingly worried whether President Donald Trump would be able to push ahead with his pro-growth policies. The dollar fell against a basket of currencies and U.S. stocks were trading mostly lower. Prices for U.S. government bonds fell.
The 30-year fixed mortgage rate is hovering at 4.30 percent.
Home loans could cost more after the Federal Reserve last week raised its benchmark overnight interest rate by 25 basis points to a range of 0.75 percent to 1.00 percent. The U.S. central bank has forecast two more rate hikes for 2017.
BUOYANT LABOR MARKET
Demand for housing is being buoyed by a labor market that is near full employment. But home sales remain constrained by the dearth of properties available for sale, which is keeping prices elevated.
While the number of homes on the market increased 4.2 percent to 1.75 million units last month, housing inventory remained close to the all-time low of 1.65 million units hit in December. Supply was down 6.4 percent from a year ago.
Housing inventory has dropped for 21 straight months on a year-on-year basis. With supply remaining tight, the median house price surged 7.7 percent from a year ago to $228,400 in February. That marked the 60th consecutive month of year-on-year price gains.
Builders have been unable to fill the housing inventory gap, citing rising prices for materials, higher borrowing costs, and shortages of lots and labor.
Lennar Corp, the second-largest U.S. homebuilder, reported on Tuesday a drop in quarterly gross margin as the company struggled with higher land and construction costs.
The Florida-based builder, however, sold 5,453 homes in the first quarter ended Feb. 28, up from 4,832 homes in the year-earlier period, and reported a 12 percent jump in orders.
The NAR estimates housing starts and completions should be in a range of 1.5 million to 1.6 million units to alleviate the chronic shortage. Housing starts are running above a rate of 1.2 million units and completions around a pace of 1 million units.
At February’s sales pace, it would take 3.8 months to clear the stock of houses on the market, up from 3.5 months in January. A six-month supply is viewed as a healthy balance between supply and demand. Though higher prices are increasing equity for homeowners and might encourage some to put their homes on the market, they could be sidelining first-time buyers from the market. First-time buyers accounted for 32 percent of transactionslast month, well below the 40 percent share that economists and realtors say is needed for a robust housing market.
That was down from 33 percent in January but up from 30 percent a year ago.
The Mortgage-Bond Whale That Everyone Is Suddenly Worried About

◆ Fed holds $1.75 Trillion of MBS from quantitative easing program ◆
◆ Comments spur talk Fed may start draw down as soon as this year
Almost a decade after it all began, the Federal Reserve is finally talking about unwinding its grand experiment in monetary policy.
And when it happens, the knock-on effects in the bond market could pose a threat to the U.S. housing recovery.
Just how big is hard to quantify. But over the past month, a number of Fed officials have openly discussed the need for the central bank to reduce its bond holdings, which it amassed as part of its unprecedented quantitative easing during and after the financial crisis. The talk has prompted some on Wall Street to suggest the Fed will start its drawdown as soon as this year, which has refocused attention on its $1.75 trillion stash of mortgage-backed securities.
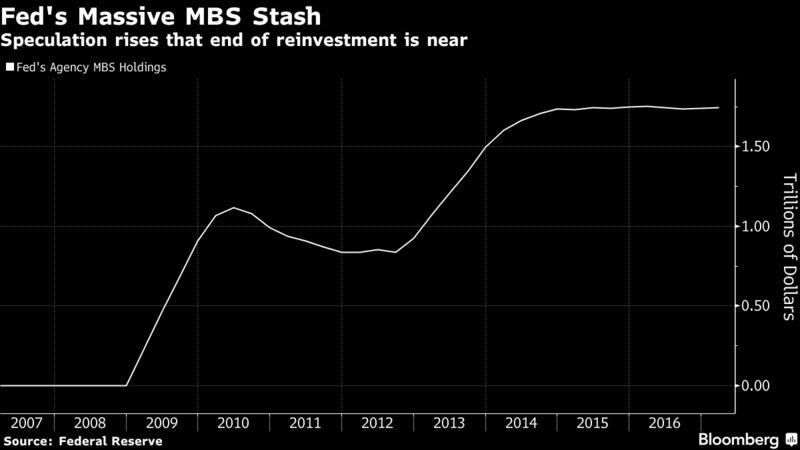
While the Fed also owns Treasuries as part of its $4.45 trillion of assets, its MBS holdings have long been a contentious issue, with some lawmakers criticizing the investments as beyond what’s needed to achieve the central bank’s mandate. Yet because the Fed is now the biggest source of demand for U.S. government-backed mortgage debt and owns a third of the market, any move is likely to boost costs for home buyers.
In the past year alone, the Fed bought $387 billion of mortgage bonds just to maintain its holdings. Getting out of the bond-buying business as the economy strengthens could help lift 30-year mortgage rates past 6 percent within three years, according to Moody’s Analytics Inc.
Unwinding QE “will be a massive and long-lasting hit” for the mortgage market, said Michael Cloherty, the head of U.S. interest-rate strategy at RBC Capital Markets. He expects the Fed to start paring its investments in the fourth quarter and ultimately dispose of all its MBS holdings.
Unprecedented Buying
Unlike Treasuries, the Fed rarely owned mortgage-backed securities before the financial crisis. Over the years, its purchases have been key in getting the housing market back on its feet. Along with near-zero interest rates, the demand from the Fed reduced the cost of mortgage debt relative to Treasuries and encouraged banks to extend more loans to consumers.
In a roughly two-year span that ended in 2014, the Fed increased its MBS holdings by about $1 trillion, which it has maintained by reinvesting its maturing debt. Since then, 30-year bonds composed of Fannie Mae-backed mortgages have only been about a percentage point higher than the average yield for five- and 10-year Treasuries, data compiled by Bloomberg show. That’s less than the spread during housing boom in 2005 and 2006.
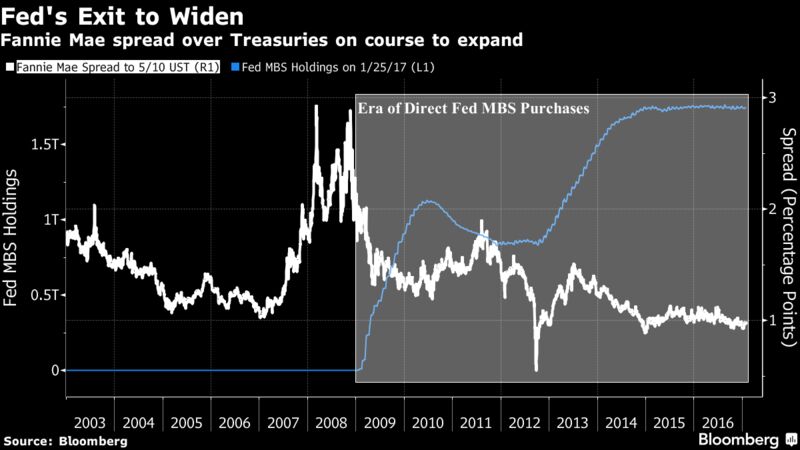
Talk of the Fed pulling back from the market has bond dealers anticipating that spreads will widen. Goldman Sachs Group Inc. sees the gap increasing 0.1 percentage point this year, while strategists from JPMorgan Chase & Co. say that once the Fed actually starts to slow its MBS reinvestments, the spread would widen at least 0.2 to 0.25 percentage points.
“The biggest buyer is leaving the market, so there will be less demand for MBS,” said Marty Young, fixed-income analyst at Goldman Sachs. The firm forecasts the central bank will start reducing its holdings in 2018. That’s in line with a majority of bond dealers in the New York Fed’s December survey.
The Fed, for its part, has said it will keep reinvesting until its tightening cycle is “well underway,” according to language that has appeared in every policy statement since December 2015. The range for its target rate currently stands at 0.5 percent to 0.75 percent.
Mortgage Rates
Mortgage rates have started to rise as the Fed moves to increase short-term borrowing costs. Rates for 30-year home loans surged to an almost three-year high of 4.32 percent in December. While rates have edged lower since, they’ve jumped more than three-quarters of a percentage point in just four months.
The surge in mortgage rates is already putting a dent in housing demand. Sales of previously owned homes declined more than forecast in December, even as full-year figures were the strongest in a decade, according to data from the National Association of Realtors.
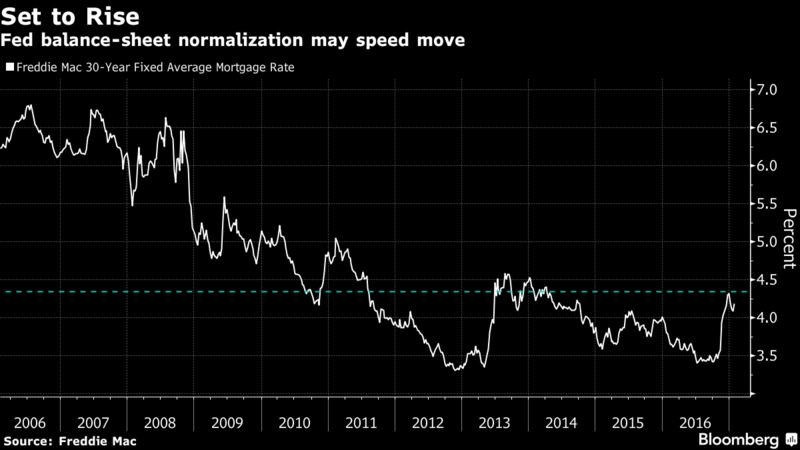
People are starting to ask the question, “Gee, did I miss my opportunity here to get a low-rate mortgage?” said Tim Steffen, a financial planner at Robert W. Baird & Co. in Milwaukee. “I tell them that rates are still pretty low. But are rates going to go up? It certainly seems like they are.”
Part of it, of course, has to do with the Fed simply raising interest rates as inflation perks up. Officials have long wanted to get benchmark borrowing costs off rock-bottom levels (another legacy of crisis-era policies) and back to levels more consist with a healthy economy. This year, the Fed has penciled in three additional quarter-point rate increases.
The move to taper its investments has the potential to cause further tightening. Morgan Stanley estimates that a $325 billion reduction in the Fed’s MBS holdings from April 2018 through end of 2019 may have the same impact as nearly two additional rate increases.
Finding other sources of demand won’t be easy either. Because of the Fed’s outsize role in the MBS market since the crisis, the vast majority of transactions are done by just a handful of dealers. What’s more, it’s not clear whether investors like foreign central banks and commercial banks can absorb all the extra supply — at least without wider spreads.
On the plus side, getting MBS back into the hands of private investors could help make the market more robust by increasing trading. Average daily volume has plunged more than 40 percent since the crisis, Securities Industry and Financial Markets Association data show.
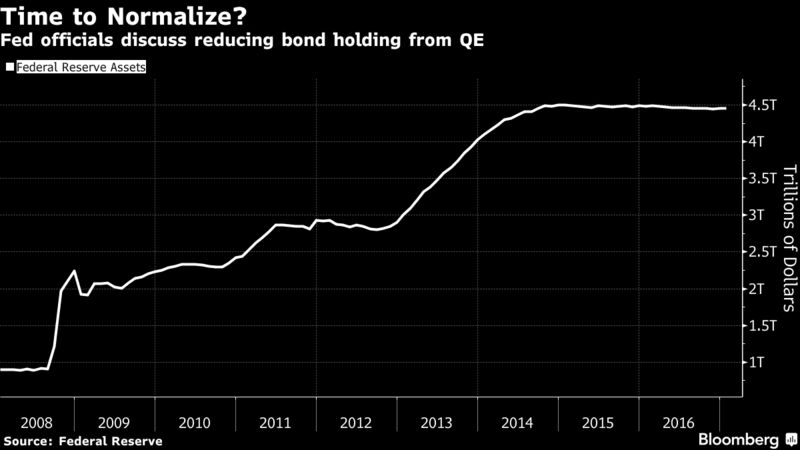
“Ending reinvestment will mean there are more bonds for the private sector to buy,” said Daniel Hyman, the co-head of the agency-mortgage portfolio management team at Pacific Investment Management Co.
What’s more, it may give the central bank more flexibility to tighten policy, especially if President Donald Trump’s spending plans stir more economic growth and inflation. St. Louis Fed President James Bullard said last month that he’d prefer to use the central bank’s holdings to do some of the lifting, echoing remarks by his Boston colleague Eric Rosengren.
Nevertheless, the consequences for the U.S. housing market can’t be ignored.
The “Fed has already hiked twice and the market is expecting” more, said Munish Gupta, a manager at Nara Capital, a new hedge fund being started by star mortgage trader Charles Smart. “Tapering is the next logical step.”
Home Prices Rise, Inventory Falls
Following a flurry of home sales in November, the total number of homes for sale in December declined to a three-year low, according to data provided by Redfin.
“Prospective sellers were hesitant to list last month,” said Redfin Chief Economist Nela Richardson. “Many of them are also buyers, and two transactions are much harder to pull off in a fast-paced, low-inventory environment than one. We expect sellers to list early in 2017, not only to make top dollar from eager buyers, but also to be in a position to act quickly when it comes time to make their next home purchase.”
Redfin receives current and local data from its agents positioned throughout the country. This allows the firm to have a comprehensive view of general real-estate trends unfolding within the markets it covers.
When compared to November, the number of new listings for December decreased by 26.8 percent. December’s median home price was about 276,000, which represents a 4.7 percent increase over the previous year. Furthermore, the median amount of days for which a home was listed on the market before going under contract was 54, which is the fastest rate for any December since Redfin began tracking the data in 2010.
“We’ve never before seen homes turn over so quickly at a national level,” Richardson said. She also noted that December’s data was rather surprising given existing conditions such as a new president-elect, higher mortgage rates, and low home inventory.
The low inventory should continue to cause an upward movement in the prices of homes in2017, with some regions experiencing higher growth than others.
Seattle was the quickest region for home sales, as half of all homes listed on the market were pending a sale within 19 days. Seattle also had the highest home price growth, increasing by a rate 14.8 percent since 2015.
This Is Where America’s Runaway Inflation Is Hiding

The Census Bureau released its quarterly update on residential vacancies and home ownership for Q1 which is closely watched for its update of how many Americans own versus rent. It shows that following a modest pickup in the home ownership rate in the prior two quarters, US homeowners once again posted a substantial decline, sliding from 63.8% to 63.5%, and just 0.1% higher than the 50 year low reported in Q2 2015.

And perhaps logically, while home ownership continues to stagnate, the number of renters has continued to soar. In fact, in the first quarter, the number of renter occupied houses rose by precisely double the amount, or 360,000, as the number of owner occupied houses, which was a modest increase of 180,000. This brings the total number of renter houses to 42.85 million while the number of homeowners is virtually unchanged at 74.66 million.
A stark representation of the divergence between renters and owners can be seen in the chart below. It shows that over the past decade, virtually all the housing growth has come thanks to renters while the number of homeowners hasn’t budged even a fraction and has in fact declined in absolute numbers. What is obvious is that around the time the housing bubble burst, many Americans appear to have lost faith in home ownership and decided to become renters instead.

An immediate consequence of the above is that as demand for rental units has soared, so have median asking rents, and sure enough, according to Census, in Q1 the median asking rent at the national level soared to an all time high $870.

Which brings us to the one chart showing where the “missing” runaway inflation in the US is hiding: if one shows the annual increase in asking rents, what one gets is the following stunning chart which shows that while rent inflation had been roughly in the 1-2% corridor for two decades, starting in 2013 something snapped, and rent inflation for some 43 million Americans has exploded and is currently printing at a blended four quarter average rate of just over 8%, the highest on record, and 4 times higher than Yellen’s inflationary target.

So the next time Janet Yellen laments the collapse of inflation, feel free to show her this chart which even she can easily recreate using the government’s own data (the sad reality is that rents are rising even faster than what the government reports) at the following link.
U.S. Home Price Gains Concentrated in West, Says Case-Shiller Price Index

According to the S&P/Case-Shiller Home Price Indices for July 2015, U.S. home prices continued their rise across the country over the last 12 months.
Year-over-Year
The S&P/Case-Shiller U.S. National Home Price Index, covering all nine U.S. census divisions, recorded a slightly higher year-over-year gain with a 4.7% annual increase in July 2015 versus a 4.5% increase in June 2015. The 10-City Composite was virtually unchanged from last month, rising 4.5% year-over-year. The 20-City Composite had higher year-over-year gains, with an increase of 5.0%. San Francisco, Denver and Dallas reported the highest year-over-year gains among the 20 cities with price increases of 10.4%, 10.3%, and 8.7%, respectively. Fourteen cities reported greater price increases in the year ending July 2015 over the year ending June 2015.
San Francisco and Denver are the only cities with a double digit increase, and Phoenix had the longest streak of year-over-year increases. Phoenix reported an increase of 4.6% in July 2015, the eighth consecutive year over-year increase. Boston posted a 4.3% annual increase, up from 3.2% in June 2015; this is the biggest jump in year-over year gains this month.
Month-over-Month
Before seasonal adjustment, the National Index posted a gain of 0.7% month-over-month in July. The 10-City Composite and 20-City Composite both reported gains of 0.6% month-over-month. After seasonal adjustment, the National index posted a gain of 0.4%, while the 10-City and 20-City Composites were both down 0.2% month-over-month. All 20 cities reported increases in July before seasonal adjustment; after seasonal adjustment, 10 were down, nine were up, and one was unchanged.
Market Analysis
“Prices of existing homes and housing overall are seeing strong growth and contributing to recent solid growth for the economy,” says David M. Blitzer, Managing Director and Chairman of the Index Committee at S&P Dow Jones Indices.
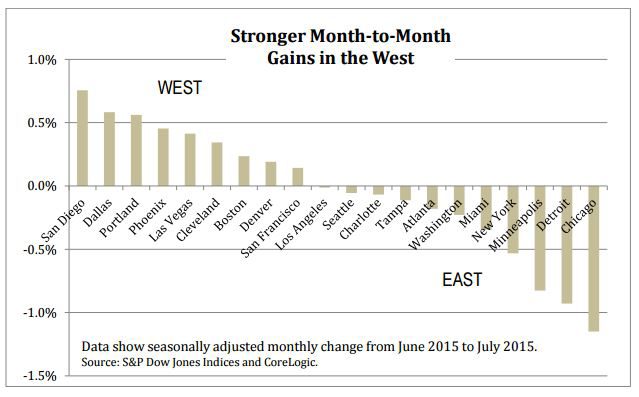 “The S&P/Case Shiller National Home Price Index has risen at a 4% or higher annual rate since September 2012, well ahead of inflation. Most of the strength is focused on states west of the Mississippi. The three cities with the largest cumulative price increases since January 2000 are all in California: Los Angeles (138%), San Francisco (116%) and San Diego (115%). The two smallest gains since January 2000 are Detroit (3%) and Cleveland (10%). The Sunbelt cities – Miami, Tampa, Phoenix and Las Vegas – which were the poster children of the housing boom have yet to make new all-time highs.
“The economy grew at a 3.9% real annual rate in the second quarter of 2015 with housing making a major contribution. Residential investment grew at annual real rates of 9-10% in the last three quarters (2014:4th quarter, 2015:1st-2 nd quarters), far faster than total GDP.
Further, expenditures on furniture and household equipment, a sector that depends on home sales and housing construction, also surpassed total GDP growth rates. Other positive indicators of current and expected future housing activity include gains in sales of new and existing housing and the National Association of Home Builders sentiment index. An interest rate increase by the Federal Reserve, now expected in December by many analysts, is not likely to derail the strong housing performance.”
Affordable Housing Plan Slaps Fee on California Property Owners

by Phil Hall
The speaker of California’s State Assembly is seeking to raise new funds for affordable housing development by adding a new $75 fee to the costs of recording real estate documents.
Toni Atkins, a San Diego Democrat, stated that the new fee would be a permanent addition to the state’s line-up of fees and taxes and would apply to all real estate documents except those related to home sales. Atkins conspicuously avoided citing the $75 figure in a press statement issued by her office, only briefly identifying it as a “small fee” while insisting that she had broad support for the plan.
“The permanent funding source, which earned overwhelming support from California’s business community, will generate hundreds of millions annually for affordable housing and leverage billions of dollars more in federal, local, and bank investment,” Atkins said. “This plan will reap benefits for education, healthcare and public safety as well. The outcomes sought in other sectors improve when housing instability is addressed.”
Atkins added that her plan should add between $300 million to $720 million a year for the state’s affordable housing endeavors. But Atkins isn’t completely focused on collecting revenue: She is simultaneously proposing that developers offering low-income housing should receive $370 million in tax credits, up from the current level of $70 million.
This is the third time that a $75 real estate transaction fee has been proposed in the state legislature. Earlier efforts were put forward in 2012 and 2013, but failed to gained traction. Previously, opponents to the proposal argued that transactions involving multiple documents would be burdened with excess costs because the fee applies on a per-document basis and not a per-transaction basis.
One of the main opponents of Atkins’ proposal, Jon Coupal, president of the Howard Jarvis Taxpayers Association, told the San Francisco Chronicle that the speaker was playing word games by insisting this was merely a fee and that she was penalizing property owners to finance a problem that they did not create.
“It’s clearly a tax, not a fee,” said Coupal. “There is not a nexus between the fee payer and the public need being addressed. It’s not like charging a polluter a fee for the pollution they caused. It’s a revenue that is totally divorced from the so-called need for affordable housing.”
Number of U.S. First-Time Homebuyers Plummets

by National Mortgage Professional Magazine
Despite an improving job market and low interest rates, the share of first-time homebuyers fell to its lowest point in nearly three decades and is preventing a healthier housing market from reaching its full potential, according to an annual survey released by the National Association of Realtors (NAR). The survey additionally found that an overwhelming majority of buyers search for homes online and then purchase their home through a real estate agent.
The 2014 NAR Profile of Home Buyers and Sellers continues a long-running series of large national NAR surveys evaluating the demographics, preferences, motivations, plans and experiences of recent home buyers and sellers; the series dates back to 1981. Results are representative of owner-occupants and do not include investors or vacation homes.
The long-term average in this survey, dating back to 1981, shows that four out of 10 purchases are from first-time home buyers. In this year’s survey, the share of first-time home buyers dropped five percentage points from a year ago to 33 percent, representing the lowest share since 1987 (30 percent).
“Rising rents and repaying student loan debt makes saving for a down payment more difficult, especially for young adults who’ve experienced limited job prospects and flat wage growth since entering the workforce,” said Lawrence Yun, NAR chief economist. “Adding more bumps in the road, is that those finally in a position to buy have had to overcome low inventory levels in their price range, competition from investors, tight credit conditions and high mortgage insurance premiums.”
Yun added, “Stronger job growth should eventually support higher wages, but nearly half (47 percent) of first-time buyers in this year’s survey (43 percent in 2013) said the mortgage application and approval process was much more or somewhat more difficult than expected. Less stringent credit standards and mortgage insurance premiums commensurate with current buyer risk profiles are needed to boost first-time buyer participation, especially with interest rates likely rising in upcoming years.”
The household composition of buyers responding to the survey was mostly unchanged from a year ago. Sixty-five percent of buyers were married couples, 16 percent single women, nine percent single men and eight percent unmarried couples.
 In 2009, 60 percent of buyers were married, 21 percent were single women, 10 percent single men and 8 percent unmarried couples. Thirteen percent of survey respondents were multi-generational households, including adult children, parents and/or grandparents.
The median age of first-time buyers was 31, unchanged from the last two years, and the median income was $68,300 ($67,400 in 2013). The typical first-time buyer purchased a 1,570 square-foot home costing $169,000, while the typical repeat buyer was 53 years old and earned $95,000. Repeat buyers purchased a median 2,030-square foot home costing $240,000.
When asked about the primary reason for purchasing, 53 percent of first-time buyers cited a desire to own a home of their own. For repeat buyers, 12 percent had a job-related move, 11 percent wanted a home in a better area, and another 10 percent said they wanted a larger home. Responses for other reasons were in the single digits.
According to the survey, 79 percent of recent buyers said their home is a good investment, and 40 percent believe it’s better than stocks.
Financing the purchase
Nearly nine out of 10 buyers (88 percent) financed their purchase. Younger buyers were more likely to finance (97 percent) compared to buyers aged 65 years and older (64 percent). The median down payment ranged from six percent for first-time buyers to 13 percent for repeat buyers. Among 23 percent of first-time buyers who said saving for a down payment was difficult, more than half (57 percent) said student loans delayed saving, up from 54 percent a year ago.
 In addition to tapping into their own savings (81 percent), first-time homebuyers used a variety of outside resources for their loan downpayment. Twenty-six percent received a gift from a friend or relative—most likely their parents—and six percent received a loan from a relative or friend. Ten percent of buyers sold stocks or bonds and tapped into a 401(k) fund.
Ninety-three percent of entry-level buyers chose a fixed-rate mortgage, with 35 percent financing their purchase with a low-down payment Federal Housing Administration-backed mortgage (39 percent in 2013), and nine percent using the Veterans Affairs loan program with no downpayment requirements.
“FHA premiums are too high in relation to default rates and have likely dissuaded some prospective first-time buyers from entering the market,” said Yun. “To put it in perspective, 56 percent of first-time buyers used a FHA loan in 2010. The current high mortgage insurance added to their monthly payment is likely causing some young adults to forgo taking out a loan.”
Buyers used a wide variety of resources in searching for a home, with the Internet (92 percent) and real estate agents (87 percent) leading the way. Other noteworthy results included mobile or tablet applications (50 percent), mobile or tablet search engines (48 percent), yard signs (48 percent) and open houses (44 percent).
According to NAR President Steve Brown, co-owner of Irongate, Inc., Realtors® in Dayton, Ohio, although more buyers used the Internet as the first step of their search than any other option (43 percent), the Internet hasn’t replaced the real estate agent’s role in a transaction.
“Ninety percent of home buyers who searched for homes online ended up purchasing their home through an agent,” Brown said. “In fact, buyers who used the Internet were more likely to purchase their home through an agent than those who didn’t (67 percent). Realtors are not only the source of online real estate data, they also use their unparalleled local market knowledge and resources to close the deal for buyers and sellers.”
When buyers were asked where they first learned about the home they purchased, 43 percent said the Internet (unchanged from last year, but up from 36 percent in 2009); 33 percent from a real estate agent; 9 percent a yard sign or open house; six percent from a friend, neighbor or relative; five percent from home builders; three percent directly from the seller; and one percent a print or newspaper ad.
Likely highlighting the low inventory levels seen earlier in 2014, buyers visited 10 homes and typically found the one they eventually purchased two weeks quicker than last year (10 weeks compared to 12 in 2013). Overall, 89 percent were satisfied with the buying process.
First-time home buyers plan to stay in their home for 10 years and repeat buyers plan to hold their property for 15 years; sellers in this year’s survey had been in their previous home for a median of 10 years.
 The biggest factors influencing neighborhood choice were quality of the neighborhood (69 percent), convenience to jobs (52 percent), overall affordability of homes (47 percent), and convenience to family and friends (43 percent). Other factors with relatively high responses included convenience to shopping (31 percent), quality of the school district (30 percent), neighborhood design (28 percent) and convenience to entertainment or leisure activities (25 percent).
This year’s survey also highlighted the significant role transportation costs and “green” features have in the purchase decision process. Seventy percent of buyers said transportation costs were important, while 86 percent said heating and cooling costs were important. Over two-thirds said energy efficient appliances and lighting were important (68 and 66 percent, respectively).
Seventy-nine percent of respondents purchased a detached single-family home, eight percent a townhouse or row house, 8 percent a condo and six percent some other kind of housing. First-time home buyers were slightly more likely (10 percent) to purchase a townhouse or a condo than repeat buyers (seven percent). The typical home had three bedrooms and two bathrooms.
The majority of buyers surveyed purchased in a suburb or subdivision (50 percent). The remaining bought in a small town (20 percent), urban area (16 percent), rural area (11 percent) or resort/recreation area (three percent). Buyers’ median distance from their previous residence was 12 miles.
Characteristics of sellers
The typical seller over the past year was 54 years old (53 in 2013; 46 in 2009), was married (74 percent), had a household income of $96,700, and was in their home for 10 years before selling—a new high for tenure in home. Seventeen percent of sellers wanted to sell earlier but were stalled because their home had been worth less than their mortgage (13 percent in 2013).
“Faster price appreciation this past year finally allowed more previously stuck homeowners with little or no equity the ability to sell after waiting the last few years,” Yun said.
Sellers realized a median equity gain of $30,100 ($25,000 in 2013)—a 17 percent increase (13 percent last year) over the original purchase price. Sellers who owned a home for one year to five years typically reported higher gains than those who owned a home for six to 10 years, underlining the price swings since the recession.
The median time on the market for recently sold homes dropped to four weeks in this year’s report compared to five weeks last year, indicating tight inventory in many local markets. Sellers moved a median distance of 20 miles and approximately 71 percent moved to a larger or comparably sized home.
A combined 60 percent of responding sellers found a real estate agent through a referral by a friend, neighbor or relative, or used their agent from a previous transaction. Eighty-three percent are likely to use the agent again or recommend to others.
For the past three years, 88 percent of sellers have sold with the assistance of an agent and only nine percent of sales have been for-sale-by-owner, or FSBO sales.
For-sale-by-owner transactions accounted for 9 percent of sales, unchanged from a year ago and matching the record lows set in 2010 and 2012; the record high was 20 percent in 1987. The share of homes sold without professional representation has trended lower since reaching a cyclical peak of 18 percent in 1997.
Factoring out private sales between parties who knew each other in advance, the actual number of homes sold on the open market without professional assistance was 5 percent. The most difficult tasks reported by FSBOs are getting the right price, selling within the length of time planned, preparing or fixing up the home for sale, and understanding and completing paperwork.
NAR mailed a 127-question survey in July 2014 using a random sample weighted to be representative of sales on a geographic basis. A total of 6,572 responses were received from primary residence buyers. After accounting for undeliverable questionnaires, the survey had an adjusted response rate of 9.4 percent. The recent home buyers had to have purchased a home between July of 2013 and June of 2014. Because of rounding and omissions for space, percentage distributions for some findings may not add up to 100 percent. All information is characteristic of the 12-month period ending in June 2014 with the exception of income data, which are for 2013.

You must be logged in to post a comment.