
Drilling into the December data, 61 of the nation’s 100 largest cities saw rents fall this month, indicating a widespread rental market cool down.
Tag Archives: Rental Housing
Largest Private U.S. Landlord Jacking Rents As Purchasing Power Of Blown USD Evaporates
Demand for single-family rental homes is off the charts and shows no signs of abating anytime soon, and that is pushing rents sky-high. This has allowed the largest owner of houses in the U.S. to raise rents.
Another Month, Another Record Surge in U.S. Rents To a New All Time High
Massive Shifts Underway In Residential Rental Real Estate Rates
Massive Shifts Underway, Rental Market Reacts in Near-Real Time: Rents Plunge in San Francisco & Oil Patch, Drop in Expensive Cities. But Long List of Double-Digit Gainers
There are now at least three factors that have plowed into the US housing market – and the rental market is reacting in near-real time to them: The unicorn-startup bust that began last year and built up into a crescendo this year; the Pandemic-inspired move to work-from-home; and the oil-and-gas bust that took on special vigor this spring when crude oil prices totally collapsed.
People are bailing out of some places and moving elsewhere. In the most expensive cities, rents are dropping, but in other cities – a lot of them – rents are skyrocketing by the double-digits.
Crazy-overpriced San Francisco rents.
Rents in San Francisco plunged more than in any other major market in June. This is still the most expensive city to rent in, though there are a few zip codes in Manhattan and in Los Angeles where rents are more expensive than in the most expensive zip code in San Francisco. But it got less expensive in June.
In June, the median asking rent for a one-bedroom apartment dropped 2.4% from May, to $3,280, down 11.8% from June last year, which made the city the fastest-dropping rental market in the US.
The median asking rent for two-bedroom apartments in June fell 1.8% from May to $4,340 and was down 9.6% year-over-year.
The still crazy-overpriced San Francisco market – it’s called the “Housing Crisis” locally – had hit a ceiling in October 2015, with the median asking rent for a 1-BR apartment at $3,670 and for a 2-BR at $5,000. Then rents declined by close to 10% into 2017 before picking up again. While 1-BR rents eked out a new record in June last year (by $50), 2-BR rents never got close to their October 2015 record and are now 13.2% below it.
These are median asking rents. “Median” means half the asking rents are higher, and half are lower. “Asking rent” is the advertised rent. This is a measure of the current market in near-real time, like the price tag in a store that can be changed from day to day to attract shoppers, depending on market conditions. Asking rent is not a measure of what tenants are currently paying on their existing leases or under rent-control programs.
A sea of red in the 17 most expensive rental markets.
The table below shows the 17 most expensive major rental markets by median asking rents. The shaded area shows their respective peaks and changes from those peaks. Almost all of them have declined from their peaks – with eight of them by the double digits, led by Chicago and Honolulu, where rents have gotten crushed since their respective peaks in 2015.
Seattle is now solidly on the list of double-digit decliners, booking the third largest decline-from-peak in 2-BR rents (-15.1%), behind Chicago and Honolulu, and the ninth largest in 1-BR rents (-9.5%).
Denver, not long ago one of the hottest rental markets in the US, has frozen over, with declines-from-peak in the -10% range.
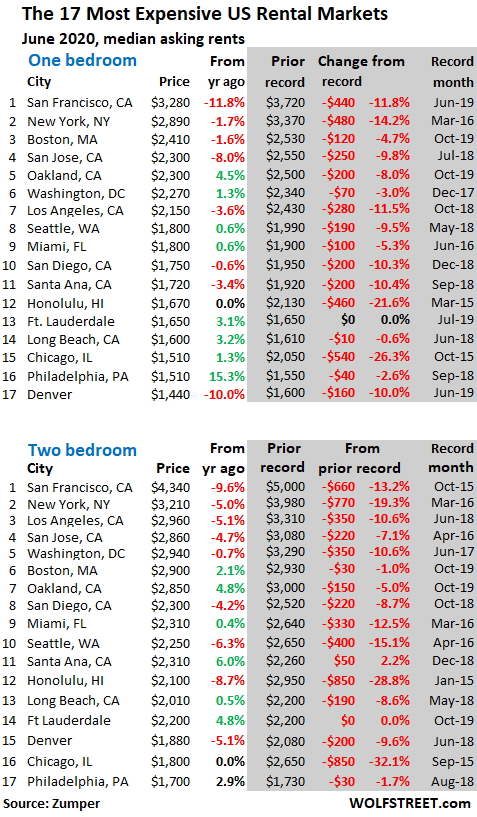
The rents we’re discussing here are for apartments in apartment buildings, including new construction. Not included are rents for single-family houses, condos for rent, rooms, efficiency apartments, and apartments with three or more bedrooms. The data is collected by Zumper from over 1 million active listings, including Multiple Listings Service (MLS) in the 100 largest markets.
The Cities with the biggest %-declines in 1-BR rents.
The table below shows the 31 cities with the largest year-over-year rent declines in June for 1-BR apartments, with San Francisco at the top, followed by Syracuse, NY, a college town now under siege from the Pandemic. Denver, with a 10% year-over-year decline, rounds out the double-digit decliners.
Then there are a bunch of cities in the Texas-Oklahoma-Louisiana oil-patch on this list, including Tulsa and Houston in 5th and 6th place. There are eight cities in Texas on this list. Louisiana is represented by New Orleans (#18) and Baton Rouge (#31).
The oil patch is in serious trouble. The oil bust started in mid-2014, when the price of crude oil grade WTI began its long decline from $100-plus per barrel to a low of $26 a barrel in early 2016. Then the price began to recover but never made it back to levels where the shale oil industry can survive long-term.
In January this year, WTI started heading lower again, and this April hit a new low, when in some places the price at the wellhead dropped to zero and when WTI futures briefly collapsed below zero for the first time ever.
Hundreds of oil-and-gas drillers have filed for bankruptcy over the past three years, and the speed and magnitude of those bankruptcy filings is picking up, with one of the biggies, Chesapeake, which is based in Oklahoma City, filing for bankruptcy on Sunday.
Houston is the center of the US oil patch, and despite its vast and diversified economy, the city has gotten slammed by the oil-and-gas bust in various ways, including by the highest office vacancy rates in the US, now at a catastrophic 24.5%.
Also on this list are Silicon Valley (San Jose), Southern California (Los Angeles, Anaheim, Santa Ana), and three markets in Florida, among others.
| Biggest Declines, in % |
1 BR Rent | Y/Y % | |
| 1 | San Francisco, CA | $3,280 | -11.8% |
| 2 | Syracuse, NY | $860 | -11.3% |
| 3 | Denver, CO | $1,440 | -10.0% |
| 4 | Irving, TX | $1,080 | -9.2% |
| 5 | Tulsa, OK | $590 | -9.2% |
| 6 | Houston, TX | $1,100 | -9.1% |
| 7 | Madison, WI | $1,080 | -8.5% |
| 8 | Aurora, CO | $1,090 | -8.4% |
| 9 | San Jose, CA | $2,300 | -8.0% |
| 10 | Orlando, FL | $1,220 | -6.9% |
| 11 | Durham, NC | $1,040 | -6.3% |
| 12 | Laredo, TX | $780 | -6.0% |
| 13 | Anaheim, CA | $1,600 | -5.9% |
| 14 | Jacksonville, FL | $900 | -5.3% |
| 15 | Charlotte, NC | $1,200 | -4.8% |
| 16 | Fort Worth, TX | $1,100 | -4.3% |
| 17 | Los Angeles, CA | $2,150 | -3.6% |
| 18 | New Orleans, LA | $1,380 | -3.5% |
| 19 | Santa Ana, CA | $1,720 | -3.4% |
| 20 | Seattle, WA | $1,800 | -2.7% |
| 21 | Plano, TX | $1,130 | -2.6% |
| 22 | Tampa, FL | $1,150 | -2.5% |
| 23 | Corpus Christi, TX | $830 | -2.4% |
| 24 | Louisville, KY | $860 | -2.3% |
| 25 | San Antonio, TX | $880 | -2.2% |
| 26 | Salt Lake City, UT | $1,050 | -1.9% |
| 27 | Raleigh, NC | $1,020 | -1.9% |
| 28 | New York, NY | $2,890 | -1.7% |
| 29 | Boston, MA | $2,410 | -1.6% |
| 30 | Dallas, TX | $1,230 | -1.6% |
| 31 | Baton Rouge, LA | $820 | -1.2% |
The Cities with biggest %-increases in 1-BR rents.
OK, get ready. Among the 100 largest rental markets are 9 cities where rents skyrocketed by over 15% year-over-year in June. And except for Philadelphia, all of them sport median asking rents for 1-BR apartments that are well below the national median ($1,229 according to Zumper). Meaning these cities with these huge rent increases are still deep in the lower half of the rental spectrum. In total, there are 20 cities with double-digit rent increases:
| Biggest Increases, in % | 1 BR Rent | Y/Y % | |
| 1 | Cleveland, OH | $940 | 16.0% |
| 2 | Indianapolis, IN | $870 | 16.0% |
| 3 | Columbus, OH | $810 | 15.7% |
| 4 | Rochester, NY | $970 | 15.5% |
| 5 | Chattanooga, TN | $900 | 15.4% |
| 6 | Cincinnati, OH | $900 | 15.4% |
| 7 | Philadelphia, PA | $1,510 | 15.3% |
| 8 | St Louis, MO | $910 | 15.2% |
| 9 | Norfolk, VA | $920 | 15.0% |
| 10 | Lincoln, NE | $770 | 14.9% |
| 11 | Newark, NJ | $1,320 | 14.8% |
| 12 | Des Moines, IA | $930 | 14.8% |
| 13 | Detroit, MI | $700 | 14.8% |
| 14 | Wichita, KS | $700 | 14.8% |
| 15 | Bakersfield, CA | $840 | 13.5% |
| 16 | Reno, NV | $1,030 | 13.2% |
| 17 | Baltimore, MD | $1,320 | 11.9% |
| 18 | St Petersburg, FL | $1,230 | 11.8% |
| 19 | Akron, OH | $610 | 10.9% |
| 20 | Boise, ID | $1,060 | 10.4% |
| 21 | Tucson, AZ | $700 | 9.4% |
| 22 | Buffalo, NY | $1,080 | 9.1% |
| 23 | Chesapeake, VA | $1,080 | 9.1% |
| 24 | Fresno, CA | $1,090 | 9.0% |
| 25 | Nashville, TN | $1,340 | 8.9% |
| 26 | Memphis, TN | $790 | 8.2% |
| 27 | Sacramento, CA | $1,360 | 7.9% |
| 28 | Colorado Springs, CO | $990 | 7.6% |
| 29 | Arlington, TX | $880 | 7.3% |
| 30 | Albuquerque, NM | $750 | 7.1% |
| 31 | Gilbert, AZ | $1,280 | 6.7% |
Among the top 100 cities, 59 cities experienced year-over-year increases in the median asking rent in June. In eight cities, there was no change in rents. And in 33 cities, asking rents declined, including in many of the largest cities in the US.
The top 100 rental markets, from most expensive to least expensive.
The list goes from San Francisco to Tulsa, with asking rents for 1-BR and 2-BR apartments, in order of 1-BR rents, from $3,280 in San Francisco (-11.8%) to $590 in Tulsa (-9.2%).
These rents that are dropping in some markets and surging in others show two things:
- Rental markets are local, and the median national rent is irrelevant at the local level.
- Big shifts are underway in housing, and the rental market is pointing out the weaknesses in demand where it exists in near-real time.
Markets where rents are increasing 10% or 15% a year are asking for trouble unless they have a booming job market with surging wages – this was the case in San Francisco, Seattle, and other hot markets. But if they don’t have surging wages, many renters, who are already tapped out, will run out of money. And it’s renters that keep the show going.
You can search the list list via the search box in your browser. If your smartphone clips this 6-column table on the right, hold your device in landscape position:
| 1-BR rent | Y/Y % | 2-BR rent | Y/Y % | ||
| 1 | San Francisco, CA | $3,280 | -11.8% | $4,340 | -9.6% |
| 2 | New York, NY | $2,890 | -1.7% | $3,210 | -5.0% |
| 3 | Boston, MA | $2,410 | -1.6% | $2,900 | 2.1% |
| 4 | Oakland, CA | $2,300 | 4.5% | $2,850 | 4.8% |
| 4 | San Jose, CA | $2,300 | -8.0% | $2,860 | -4.7% |
| 6 | Washington, DC | $2,270 | 1.3% | $2,920 | 2.5% |
| 7 | Los Angeles, CA | $2,150 | -3.6% | $2,960 | -5.1% |
| 8 | Miami, FL | $1,800 | 0.6% | $2,310 | 0.4% |
| 8 | Seattle, WA | $1,800 | -2.7% | $2,250 | -6.3% |
| 10 | San Diego, CA | $1,750 | -0.6% | $2,300 | -4.2% |
| 11 | Santa Ana, CA | $1,720 | -3.4% | $2,310 | 6.0% |
| 12 | Honolulu, HI | $1,670 | 0.0% | $2,100 | -8.7% |
| 13 | Fort Lauderdale, FL | $1,650 | 3.1% | $2,200 | 4.8% |
| 14 | Anaheim, CA | $1,600 | -5.9% | $1,960 | -7.5% |
| 14 | Long Beach, CA | $1,600 | 3.2% | $2,010 | 0.5% |
| 16 | Chicago, IL | $1,510 | 1.3% | $1,800 | 0.0% |
| 16 | Philadelphia, PA | $1,510 | 15.3% | $1,750 | 2.9% |
| 18 | Providence, RI | $1,470 | 2.8% | $1,650 | 4.4% |
| 19 | Atlanta, GA | $1,440 | 5.1% | $1,840 | 5.7% |
| 19 | Denver, CO | $1,440 | -10.0% | $1,880 | -5.1% |
| 21 | Portland, OR | $1,420 | 4.4% | $1,750 | 1.2% |
| 22 | Minneapolis, MN | $1,400 | 0.0% | $1,900 | 3.8% |
| 22 | Scottsdale, AZ | $1,400 | 1.4% | $1,870 | -2.1% |
| 24 | New Orleans, LA | $1,380 | -3.5% | $1,610 | 5.2% |
| 25 | Sacramento, CA | $1,360 | 7.9% | $1,600 | 8.8% |
| 26 | Nashville, TN | $1,340 | 8.9% | $1,450 | 7.4% |
| 27 | Baltimore, MD | $1,320 | 11.9% | $1,540 | 10.8% |
| 27 | Newark, NJ | $1,320 | 14.8% | $1,680 | 14.3% |
| 29 | Gilbert, AZ | $1,280 | 6.7% | $1,490 | 4.2% |
| 30 | Austin, TX | $1,250 | 5.0% | $1,520 | 0.7% |
| 30 | Chandler, AZ | $1,250 | 3.3% | $1,440 | -0.7% |
| 32 | Dallas, TX | $1,230 | -1.6% | $1,680 | -1.8% |
| 32 | St Petersburg, FL | $1,230 | 11.8% | $1,600 | 3.9% |
| 34 | Orlando, FL | $1,220 | -6.9% | $1,400 | -6.7% |
| 35 | Charlotte, NC | $1,200 | -4.8% | $1,370 | 0.0% |
| 36 | Tampa, FL | $1,150 | -2.5% | $1,390 | 4.5% |
| 37 | Plano, TX | $1,130 | -2.6% | $1,540 | -0.6% |
| 38 | Henderson, NV | $1,120 | -0.9% | $1,350 | 0.0% |
| 39 | Richmond, VA | $1,110 | 2.8% | $1,370 | 11.4% |
| 40 | Fort Worth, TX | $1,100 | -4.3% | $1,360 | 1.5% |
| 40 | Houston, TX | $1,100 | -9.1% | $1,310 | -6.4% |
| 42 | Aurora, CO | $1,090 | -8.4% | $1,350 | -9.4% |
| 42 | Fresno, CA | $1,090 | 9.0% | $1,240 | 8.8% |
| 44 | Buffalo, NY | $1,080 | 9.1% | $1,350 | 14.4% |
| 44 | Chesapeake, VA | $1,080 | 9.1% | $1,250 | 4.2% |
| 44 | Irving, TX | $1,080 | -9.2% | $1,390 | -10.3% |
| 44 | Madison, WI | $1,080 | -8.5% | $1,310 | -5.1% |
| 44 | Pittsburgh, PA | $1,080 | 1.9% | $1,350 | 3.8% |
| 49 | Boise, ID | $1,060 | 10.4% | $1,120 | 1.8% |
| 50 | Salt Lake City, UT | $1,050 | -1.9% | $1,300 | -5.1% |
| 50 | Virginia Beach, VA | $1,050 | 0.0% | $1,250 | 1.6% |
| 52 | Durham, NC | $1,040 | -6.3% | $1,230 | -3.1% |
| 53 | Reno, NV | $1,030 | 13.2% | $1,350 | 3.1% |
| 54 | Raleigh, NC | $1,020 | -1.9% | $1,200 | 0.0% |
| 55 | Phoenix, AZ | $1,010 | 1.0% | $1,280 | 2.4% |
| 56 | Las Vegas, NV | $1,000 | 1.0% | $1,200 | 4.3% |
| 56 | Milwaukee, WI | $1,000 | 3.1% | $1,170 | 14.7% |
| 58 | Colorado Springs, CO | $990 | 7.6% | $1,250 | 7.8% |
| 59 | Rochester, NY | $970 | 15.5% | $1,130 | 15.3% |
| 60 | Anchorage, AK | $960 | 5.5% | $1,180 | 2.6% |
| 60 | Kansas City, MO | $960 | 0.0% | $1,120 | 0.9% |
| 60 | Mesa, AZ | $960 | 4.3% | $1,190 | 3.5% |
| 63 | Cleveland, OH | $940 | 16.0% | $1,000 | 14.9% |
| 64 | Des Moines, IA | $930 | 14.8% | $990 | 15.1% |
| 65 | Norfolk, VA | $920 | 15.0% | $1,070 | 1.9% |
| 66 | St Louis, MO | $910 | 15.2% | $1,290 | 12.2% |
| 67 | Chattanooga, TN | $900 | 15.4% | $1,020 | 14.6% |
| 67 | Cincinnati, OH | $900 | 15.4% | $1,200 | 7.1% |
| 67 | Jacksonville, FL | $900 | -5.3% | $1,100 | 1.9% |
| 70 | Arlington, TX | $880 | 7.3% | $1,150 | 5.5% |
| 70 | San Antonio, TX | $880 | -2.2% | $1,100 | -1.8% |
| 72 | Glendale, AZ | $870 | 3.6% | $1,100 | 2.8% |
| 72 | Indianapolis, IN | $870 | 16.0% | $940 | 16.0% |
| 74 | Louisville, KY | $860 | -2.3% | $940 | -1.1% |
| 74 | Syracuse, NY | $860 | -11.3% | $1,060 | 1.0% |
| 76 | Omaha, NE | $850 | 1.2% | $1,020 | -2.9% |
| 77 | Bakersfield, CA | $840 | 13.5% | $1,070 | 15.1% |
| 78 | Corpus Christi, TX | $830 | -2.4% | $1,050 | -0.9% |
| 79 | Baton Rouge, LA | $820 | -1.2% | $940 | 1.1% |
| 80 | Columbus, OH | $810 | 15.7% | $1,050 | -1.9% |
| 80 | Knoxville, TN | $810 | 1.3% | $950 | 5.6% |
| 80 | Spokane, WA | $810 | 0.0% | $1,070 | 7.0% |
| 83 | Winston Salem, NC | $800 | 3.9% | $880 | 6.0% |
| 84 | Augusta, GA | $790 | 5.3% | $880 | 8.6% |
| 84 | Memphis, TN | $790 | 8.2% | $840 | 9.1% |
| 86 | Laredo, TX | $780 | -6.0% | $890 | 0.0% |
| 87 | Lincoln, NE | $770 | 14.9% | $920 | 3.4% |
| 88 | Tallahassee, FL | $760 | 0.0% | $900 | 2.3% |
| 89 | Albuquerque, NM | $750 | 7.1% | $900 | 7.1% |
| 89 | Lexington, KY | $750 | 0.0% | $950 | -3.1% |
| 89 | Oklahoma City, OK | $750 | 4.2% | $880 | 0.0% |
| 92 | Greensboro, NC | $720 | 1.4% | $840 | 1.2% |
| 93 | Detroit, MI | $700 | 14.8% | $800 | 15.9% |
| 93 | Tucson, AZ | $700 | 9.4% | $930 | 5.7% |
| 93 | Wichita, KS | $700 | 14.8% | $750 | 0.0% |
| 96 | El Paso, TX | $680 | 4.6% | $800 | 0.0% |
| 97 | Lubbock, TX | $650 | 3.2% | $840 | 7.7% |
| 97 | Shreveport, LA | $650 | 0.0% | $800 | 14.3% |
| 99 | Akron, OH | $610 | 10.9% | $730 | 0.0% |
| 100 | Tulsa, OK | $590 | -9.2% | $810 | 1.3% |
National Apartment Rents Stabilize As Small Cities Boom
After years of torrid growth that has far outstripped wages, national apartment rents have finally plateaued, climbing a scant 2.5% YOY to $1,371 in March, according to RentCafe‘s latest monthly rent report.
Interestingly, the hottest rental markets (Brooklyn, for example), have seen rents retreat from record highs as they grapple with too much development at the high end of the housing market.
Meanwhile, mid-sized cities like Sacramento, Colorado Springs and Tampa have seen strong growth. But by far the strongest growth has been recorded in small cities like Midland, Texas (famously the home of George W Bush) and Yonkers, New York. Midland saw rents increase by a staggering 29% over the past 12 months, while nearby Odessa recorded a nearly 40% rent increase. Meanwhile, Reno, Tacoma and Orlando are in the top ten fastest growing rental markets.

Still, despite a slight year-over-year drop, Manhattan still has the highest average rent in the country, followed by San Francisco, which saw rents rise 2.4% year-over-year.

Of the 250 cities surveyed by RentCafe, Wichita, Kansas had the lowest average rent at $632 a month.
Source: ZeroHedge
Rental Insecurity: Survey Finds 1 in 5 American Renters Missed a Payment in Past 3 Months

A new survey conducted by ApartmentList.com recently found that Americans, despite historically low unemployment levels and surging stock indices which would both seem to suggest that ‘everything is awesome’, are having a very difficult time making ends meet. Per the survey, some 20% of renters admit they were unable to make their monthly payments on time at least once over the preceding three months with the results being even worse among minorities and those lacking a college degree.
- Analyzing data from Apartment List users, we find that nearly one in five renters were unable to pay their rent in full for at least one of the past three months. We estimate that 3.7 million American renters have experienced an eviction.
- Evictions disproportionately impact the most vulnerable members of our society. Renters without a college education are more than twice as likely to face eviction as those with a four-year degree.
- Additionally, we find that black households face the highest rates of eviction, even when controlling for education and income. Perhaps most troublingly, households with children are twice as likely to face an eviction threat, regardless of marital status.
- The impacts of eviction are severe and long-lasting. Evictions are a leading cause of homelessness, and research has tied eviction to poor health outcomes in both adults and children. These effects are persistent, and experiencing an eviction makes it difficult to get back on one’s feet.
- Performing a metro-level analysis, we find that evictions are most common in metros hit hard by the foreclosure crisis and in those experiencing high rates of poverty. Perhaps counterintuitively, expensive coastal metros have comparatively low rates of eviction, in part because strong job markets with high median wages offset expensive rents in those areas.
As ApartmentList notes, some 3.7 million Americans, of roughly 118 million total renters, have experienced an eviction at some point in their life. Meanwhile, “rent insecurity” is even more prevalent with nearly 30% of folks making less than $30,000 per year saying they have difficultly making monthly rent payments.
3.7 million Americans have experienced eviction, with rental insecurity affecting nearly one in five.
Our Apartment List estimates show that 3.3 percent of renters have experienced an eviction at some point in the past, and 2.4 percent were evicted from their most recent residence. With an estimated 118 million renters in the U.S. today, we estimate that 3.7 million Americans have been affected by eviction at some point. If we assume that some share respondents fail to report informal evictions, this estimate is most likely understated.
While experiencing eviction is a worst-case scenario with dire effects, a much larger share of renters still struggle with some form of rental insecurity. Our analysis shows that 18 percent of respondents had difficulty paying all or part of their rent within the past three months. The issue is particularly acute for low-income renters, 27.5 percent of whom were recently unable to pay their full rent.

Renters with just a high school diploma are more than three times as likely to have faced an eviction threat in the past year than those with a Bachelor’s degree.
Of those who did not attend college, 4.1 percent cited an eviction as the reason for their last move, compared to just 1.9 percent of those with at least some college education. This trend points to a broader issue of the housing market leaving behind less educated Americans. A recent Apartment List study showed that the gap in homeownership rates between high school and college graduates widened from 1.6 percent in 1980 to 14.9 percent in 2015.
A similar trend holds when broken down by income. Of those earning less than $30,000 per year, 11 percent faced an eviction threat in the past year, and 3.4 percent were evicted from their previous residence. In contrast, for those earning more than $60,000 per year, these figures are 3.1 percent and 1.5 percent, respectively.

Meanwhile, households with children were found to be twice as likely to face an eviction threat, regardless of marital status.
Single parent households are at the highest risk, with 30.1 percent reporting difficulty paying rent within the past three months. However, married couples with children do not fare much better, with 27.2 percent struggling to pay rent. For those without children, the rates are 14.7 percent for single respondents and 13.3 percent of married respondents. Our findings are consistent with previous research showing that, among tenants who appear in eviction court, those with children are significantly more likely to be evicted.
This result points to the fact the child care represents an essential but often overwhelming expense for many families, even those with both parents in the house. Analysis from Care.com shows that average daycare costs for toddlers range from $8,043 to $18,815 per year. Furthermore, one-third of families surveyed reported that childcare costs take up 20 percent or more of their household income.

Not surprisingly, evictions were found to be most prevalent in metro areas where poverty rates are the highest.
Of the 50 largest metros in the nation, evictions are most prevalent in Memphis, with 6.1 percent of users reporting a prior eviction. Most of the metros with the highest eviction rates are located in the South and Midwest and include Atlanta, Indianapolis and Dallas. We find that the factors most strongly correlated with eviction rates include (1) the rate of foreclosures from 2007 to 2008, during the height of the foreclosure crisis, and (2) current poverty rates.
Memphis, for example, has the highest share of its population living in poverty at 19.4 percent, and it also has the highest eviction rate. In metros with high poverty rates, many households may qualify for assistance through programs such as Section 8, but, unfortunately, only a small share of those eligible for such benefits actually receive them, leaving the majority of low-income households struggling to pay rent.
Las Vegas had the second highest foreclosure rate from 2007 to 2008 at 9.2 percent and now has the sixth-highest eviction rate at 5.5 percent. This correlation suggests that many of the areas hit hardest by the foreclosure crisis have had a difficult time recovering. Despite lower housing costs, renters in these areas — some of whom are likely former owners who had their homes foreclosed upon — face a lack of opportunity that makes it difficult for them to pay their rent.

Of course, with rental rates steadily climbing since the great recession, in spite of stagnant wages, it’s hardly surprising that the Federal Reserve Bank’s controlled “recovery” hasn’t helped all Americans equally.
L.A. to Worsen Housing Shortage with New Rent Controls

Los Angeles, home to one of the least affordable housing markets in North America, is now proposing to expand rent control to “fix” its housing problem.
As with all price control schemes, rent control will serve only to make housing affordable to a small sliver of the population while rendering housing more inaccessible to most.
Specifically, city activists hope that a new bill in the state legislature, AB1506, will allow local governments, Los Angeles included, to expand the number of units covered by rent control laws while also restricting the extent to which landlords can raise rents.
Unintended Consequences
Currently, partial rent control is already in place in Los Angeles and landlords there are limited in how much they can raise rents on current residents. However, according to LA Weekly, landlords are free to raise rents to market levels for a unit once that unit turns over to new residents.
This creates a situation of perverse incentives that do a disservice to both renters and landlords. Under normal circumstances, landlords want to minimize turnover among renters because it is costly to advertise and fill units, and it’s costly to prepare units for new renters. (Turnover is also costly and inconvenient for renters.)
By limiting rent growth for ongoing renters, however, this creates an incentive for landlords to break leases with residents — even residents who the landlords may like — just so the landlords can increase rents for new incoming renters in order to cover their costs of building maintenance and improvements. The only upside to this current regime is that at least this partial loophole still allows for some profit to be made, and thus allows for owners to produce and improve housing some of the time.
But, if this loophole is closed, as the “affordable housing” activists hope to do, we can look forward to even fewer housing units being built, current units falling into disrepair, and even less availability of housing for residents.
Why Entrepreneurs Bring Products to Market
The reason fewer units will be built under a regime of harsher rent control, is because entrepreneurs (i.e., producers) only bring goods and services to market if they can be produced at a cost below the market price.
Contrary to the myth perpetuated by many anti-capitalists, market prices — in this case, rents — are not determined by the cost of producing a good or service. Nor are prices determined by the whims of producers based on how greedy they are or how much profit they’d like to make.
In fact, producers are at the mercy of the renters who — in the absence of price controls — determine the price level at which entrepreneurs must produce housing before they can expect to make any profit.
However, when governments dictate that rent levels must be below what would have been market prices — and also below the level at which new units can be produced and maintained — then producers of housing will look elsewhere.
Henry Hazlitt explains many of the distortions and bizarre incentives that emerge from price control measures:
The effects of rent control become worse the longer the rent control continues. New housing is not built because there is no incentive to build it. With the increase in building costs (commonly as a result of inflation), the old level of rents will not yield a profit. If, as often happens, the government finally recognizes this and exempts new housing from rent control, there is still not an incentive to as much new building as if older buildings were also free of rent control. Depending on the extent of money depreciation since old rents were legally frozen, rents for new housing might be ten or twenty times as high as rent in equivalent space in the old. (This actually happened in France after World War II, for example.) Under such conditions existing tenants in old buildings are indisposed to move, no matter how much their families grow or their existing accommodations deteriorate.
Thus,
Rent control … encourages wasteful use of space. It discriminates in favor of those who already occupy houses or apartments in a particular city or region at the expense of those who find themselves on the outside. Permitting rents to rise to the free market level allows all tenants or would-be tenants equal opportunity to bid for space.
Nor surprisingly, when we look into the current rent-control regime in Los Angeles, we find that newer housing is exempt, just as Hazlitt might have predicted. Unfortunately, housing activists now seek to eliminate even this exemption, and once these expanded rent controls are imposed, those on the outside won’t be able to bid for space in either new or old housing.
Newcomers will be locked out of all rent-controlled units — on which the current residents hold a death grip — and they can’t bid on the units that were never built because rent control made new housing production unprofitable. Thus, as rent control expands, the universe of available units shrinks smaller and smaller. Renters might flee to single-family rental homes where rent increases might still be allowed, or they might have to move to neighboring jurisdictions that might not have rent controls in place.
In both cases, the effect is to reduce affordability and choice. By pushing new renters toward single-family homes this makes single-family homes relatively more profitable than multi-family dwellings, thus reducing density, and robbing both owners and renters of the benefits of economies of scale that come with higher-density housing. Also, those renters who would prefer the amenities of multi-family communities are prevented from accessing them. Meanwhile, by forcing multi-family production into neighboring jurisdictions, this increases commute times for renters while forcing them into areas they would have preferred not to live in the first place.
But, then again, for many local governments — and the residents who support them — fewer multi-family units, lower densities, and fewer residents in general, are all to the good. After all, local government routinely prohibit developers from developing more housing through zoning laws, regulation of new construction, parking requirements, and limitations on density.
And these local ordinances, of course, are the real cause of Los Angeles’s housing crisis. Housing isn’t expensive in Los Angeles because landlords are greedy monsters who try to exploit their residents. Housing is expensive because a large number of renters are competing for a relatively small number of housing units.
And why are there so few housing units? Because the local governments usually drive up the cost of housing. As this report from UC Berkeley concluded:
In California, local governments have substantial control over the quantity and type of housing that can be built. Through the local zoning code, cities decide how much housing can theoretically be built, whether it can be built by right or requires significant public review, whether the developer needs to perform a costly environmental review, fees that a developer must pay, parking and retail required on site, and the design of the building, among other regulations. And these factors can be significant – a 2002 study by economists from Harvard and the University of Pennsylvania found strict zoning controls to be the most likely cause of high housing costs in California.
Contrary to what housing activists seem to think, declaring that rents shall be lower will not magically make more housing appear. Put simply, the problem of too little housing — assuming demand remains the same — can be solved with only one strategy: producing more housing.
Rent control certainly won’t solve that problem, and if housing advocates need to find a reason why so little housing is being built, they likely will need to look no further than the city council.
Rents Set To Keep Rising After Latest Multi-family Starts & Permits Report
 Unlike recent months when the Census Bureau reported some fireworks in the New Housing Starts and Permits data, the April update was relatively tame, and saw Starts rise from an upward revised 1,099K to 1,172K, beating expectations of a 1,125K print, mostly as a result of a 36K increase in multi-family units which however remain depressed below recent peaks from early 2015, which will likely stoke even higher asking rents, already at record highs across the nation.

But if starts were better than expected, then the future pipeline in the form of Housing Permits disappointed, with 1,116K units permitted for the month of April, below the 1,135K expected, if a rebound from last month’s downward revised 1,077K.

The issue, as with the starts data, is the multi-family, aka rental units, barely rebounded and remained at severely depressed levels last seen in 2013: at 348K rental units permitted in April, this is a far cry from the recent highs of 598K in June.
One wonders if this is intentional, because based on soaring asking rents, as shown in the chart below, with Americans increasingly unable or unwilling to buy single-family units, rental prices have exploded to 8% Y/Y based on Census data.


Should multi-family permits and starts remain as depressed as it has been in recent months, we expect that this chart of soaring median asking rents will only accelerate in the near future, and will require a whole host of seasonal adjustments from making its way into the already bubbly CPI data.
This Is Where America’s Runaway Inflation Is Hiding

The Census Bureau released its quarterly update on residential vacancies and home ownership for Q1 which is closely watched for its update of how many Americans own versus rent. It shows that following a modest pickup in the home ownership rate in the prior two quarters, US homeowners once again posted a substantial decline, sliding from 63.8% to 63.5%, and just 0.1% higher than the 50 year low reported in Q2 2015.

And perhaps logically, while home ownership continues to stagnate, the number of renters has continued to soar. In fact, in the first quarter, the number of renter occupied houses rose by precisely double the amount, or 360,000, as the number of owner occupied houses, which was a modest increase of 180,000. This brings the total number of renter houses to 42.85 million while the number of homeowners is virtually unchanged at 74.66 million.
A stark representation of the divergence between renters and owners can be seen in the chart below. It shows that over the past decade, virtually all the housing growth has come thanks to renters while the number of homeowners hasn’t budged even a fraction and has in fact declined in absolute numbers. What is obvious is that around the time the housing bubble burst, many Americans appear to have lost faith in home ownership and decided to become renters instead.

An immediate consequence of the above is that as demand for rental units has soared, so have median asking rents, and sure enough, according to Census, in Q1 the median asking rent at the national level soared to an all time high $870.
Which brings us to the one chart showing where the “missing” runaway inflation in the US is hiding: if one shows the annual increase in asking rents, what one gets is the following stunning chart which shows that while rent inflation had been roughly in the 1-2% corridor for two decades, starting in 2013 something snapped, and rent inflation for some 43 million Americans has exploded and is currently printing at a blended four quarter average rate of just over 8%, the highest on record, and 4 times higher than Yellen’s inflationary target.
So the next time Janet Yellen laments the collapse of inflation, feel free to show her this chart which even she can easily recreate using the government’s own data (the sad reality is that rents are rising even faster than what the government reports) at the following link.
Hooray! Huge Rent Hikes Coming
In news that is bound to make the inflationists at the Fed as well as property owners happy, Landlords Will Hike Rents by 8% this Year.
Some 88% of property managers raised their rent in the last 12 months and 68% predict that rental rates will continue to rise in the next year by an average of 8%, according to a survey of more than 500 of Rent.com’s property management customers, which the site says represents thousands of rental properties and hundreds of thousands of rental units. That’s nearly three times the wage increase that most employees can expect this year.
What’s more, 55% of property managers said that they are less likely to offer concessions or lower rents in order to fill vacancies. One reason why they’re getting even tougher: They are in a stronger position than they were this time last year.
More than 46% of property managers surveyed reported a decrease in rental vacancies in Rent.com’s survey and, in the second quarter of 2015, vacancy rates in the U.S. for rental housing was 6.8%, the lowest it has been in almost 20 years, according to data from the U.S. Census Bureau.
Despite this, many renters are spending more than 30% of their income on rent (the amount generally recommended) and need help qualifying for the lease.
Yardi Survey
Mish reader “BJ” is retired but works part-time a number of hours each week, surveying apartments for rent. He reports …
I am retired but work part-time for Yardi from my home, surveying apartments for rents. Yardi runs a full survey 3 times a year, Jan, May and Sept. These generally run about 6 weeks.
Yardi has the country divided into 24 sectors and we normally work 6-7 sectors once a month for a week on a rotating basis. Toward the end of the survey, we can work any market and I’ve been keeping track of a few select places. From what I see, rents are up and up a lot. Some of the places I watch are up 7% or more than last year for the same apartments.
The absolute worst places to be looking for a rental unit are San Fran and North LA. If anyone does answer the phone in those areas, it’s either a new building just opening, or they don’t have anything. You can’t even get on a waiting list. I’ve seen apartments in tight areas where they want you to make 3X net before they will talk to you.
Portland, Seattle, Washington DC, northern NJ, Miami and Boston are also difficult. I talked to a complex in Portland last week that had 3500 apartments under management with a total of 7 open apartments.
I am amazed by the amount of apartments that are either tax credit or subsidized in some manner. All of them have long waiting lists.
Measuring Housing Inflation
The Fed wants inflation. But how do they measure it?
Rents Have Been Skyrocketing In These 13 US Cities
Seven years ago, the American home ownership “dream” was shattered when a housing bubble built on a decisively shaky foundation burst in spectacular fashion, bringing Wall Street and Main Street to their knees.
In the blink of an eye, the seemingly inexorable rise in the American home ownership rate abruptly reversed course, and by 2014, two decades of gains had disappeared and the ashes of Bill Clinton’s National Home ownership Strategy lay smoldering in the aftermath of the greatest financial collapse since the Great Depression.

In short, decades of speculative excess driven by imprudence, greed, and financial engineering and financed by the world’s demand for GSE debt had come crashing down and in relatively short order, a nation of homeowners was transformed into a nation of renters.
It wasn’t difficult to predict what would happen next.
As demand for rentals increased and PE snapped up foreclosures, rents rose, just as a subpar jobs market, a meteoric rise in student debt, tougher lending standards, and critically important demographic shifts put further pressure on home ownership rates. Now, America faces a rather dire housing predicament: buying and renting are both unaffordable. Or, as WSJ put it last month, “households are stuck between homes they can’t qualify for and rents they can’t afford.”
We’ve seen evidence of this across the country with perhaps the most telling statistic coming courtesy of The National Low Income Housing Coalition who recently noted that in no state can a minimum wage worker afford a one bedroom apartment.
In this context, Bloomberg is out with a list of 13 cities where single-family rents have risen by double-digits in just the last 12 months. Note that in Iowa, rents have risen more than 20% over the past year alone.
 More color from Bloomberg:
Landlords have been preparing to raise rents on single-family homes this year, Bloomberg reported in April. It looks like those plans are already being put into action.
The median rent for a three-bedroom single-family house increased 3.3 percent, to $1,320, during the second quarter, according to data compiled by RentRange and provided to Bloomberg by franchiser Real Property Management. Median rents are up 6.1 percent over the past 12 months. Even that kind of increase would have been welcome in 13 U.S. cities where single-family rents increased by double digits.
It’s more evidence that rising rents have affected a broad scope of Americans. Sixty percent of low-income renters spend more than 50 percent of their income on rent, according to a report in May from New York University’s Furman Center. High rents have also stretched the budgets of middle-class workers and made it harder for young professionals to launch careers and start families.
“You’re finding that people who wouldn’t have shared accommodations in the past are moving in with friends,”says Don Lawby, president of Real Property Management. “Kids are staying in their parents’ homes for longer and delaying the formation of families.”
And for those with short memories, we thought this would be an opportune time to remind you of who became America’s landlord in the wake of the crisis…

Airbnb And Other Short-Term Rentals Worsen Housing Shortage, Critics Say

Landlords in Venice and other tourist-friendly areas are converting units into short-term rentals, worsening the area’s housing shortage, a study says.
The last time he advertised one of his apartments, longtime Los Feliz landlord Andre LaFlamme got a request he’d never seen before.
A man wanted to rent LaFlamme’s 245-square-foot bachelor unit with hardwood floors for $875 a month, then list it himself on Airbnb.
“Thanks but no thanks,” LaFlamme told the prospective tenant. “You’ve got to be kidding me.”
But he understood why: More money might be made renting to tourists a few days at a time than to a local for 12 months or more.
About 12,700 rental units were listed on Airbnb in Los Angeles County on Dec. 22, 2014, but they were not spread out equally. In parts of Venice and Hollywood, Airbnb listings accounted for 4% or more of all housing units.
As short-term rental websites such as Airbnb explode in popularity in Southern California, a growing number of homeowners and landlords are caving to the economics. A study released Wednesday from Los Angeles Alliance for a New Economy, a labor-backed advocacy group, estimates that more than 7,000 houses and apartments have been taken off the rental market in metro Los Angeles for use as short-term rentals. In parts of tourist-friendly neighborhoods such as Venice and Hollywood, Airbnb listings account for 4% or more of all housing units, according to a Times analysis of data from Airbnb’s website.
That’s worsening a housing shortage that already makes Los Angeles one of the least affordable places to rent in the country.
“In places where vacancy is already limited and rents are already squeezing people out, this is exacerbating the problem,” said Roy Samaan, a policy analyst who wrote the alliance’s report. “There aren’t 1,000 units to give in Venice or Hollywood.”
![]()
Fast-growing Airbnb and others like it say they help cash-strapped Angelenos earn a little extra money. Airbnb estimates that 82% of its 4,500 L.A. hosts are “primary residents” of the homes they list, and that nearly half use the proceeds to help pay their rent or mortgage. And the effect on the broader housing market is so small that it’s all but irrelevant, said Tom Davidoff, a housing economist at the University of British Columbia whom Airbnb hired to study its impact.
“Over the lifetime of a lease, rents maybe go up 1.5%,” he said. “That’s peanuts relative to the increases we’ve seen in housing costs in a lot of places.”
But there are growing signs of professionalization of the short-term rental world, from property-manager middlemen like the one who e-mailed LaFlamme to Airbnb “hosts” who list dozens of properties on the site. The Los Angeles Alliance study estimates that 35% of Airbnb revenue in Southern California comes from people who list more than one unit.
“I don’t think anyone would begrudge someone renting out a spare bedroom,” Samaan said. “But there’s a whole cottage industry that’s springing up around this.”
City Council member Mike Bonin, whose coastal district includes Venice, and Council President Herb Wesson want to study how these rentals have affected the city. No regulations have been drafted, and Bonin said the council would seek extensive community input. Current rules bar short-term rentals in many residential areas of the city, but critics say they’re rarely enforced.
As city officials craft new ones, they’ll certainly be hearing from Airbnb and its allies. Last year, the company spent more than $100,000 lobbying City Hall and released a study touting its economic impact in L.A. — more than $200 million in spending by guests, supporting an estimated 2,600 jobs. A group representing short-term rental hosts has made the rounds of City Council offices as well.
This industry “needs to be regulated and regulated the right way,” said Sebastian de Kleer, co-founder of the Los Angeles Short Term Rental Alliance and owner of a Venice-based vacation rental company. “For a lot of people, this is a very new issue.”
Neighborhood groups are sure to weigh in too, especially in Venice.
 The beach neighborhood has the highest concentration of Airbnb listings in all of metro Los Angeles. Data collected by Beyond Pricing, a San Francisco-based start-up that helps short-term rental hosts optimize pricing, show that in census tracts along Venice Beach and Abbott-Kinney Boulevard, Airbnb listings accounted for 6% to 7% of all housing units — about 10 times the countywide average.
A letter last fall from the Venice Neighborhood Council to city officials estimated that the number of short-term rental listings in the area had tripled in a year, citing a “Gold Rush mentality” among investors looking for a piece of the action. That’s hurting local renters, said Steve Clare, executive director of Venice Community Housing.
“Short-term rentals are really taking over a significant portion of the rental housing market in our community,” Clare said. “It’s going to further escalate rents, and take affordable housing out of Venice.”
Along the Venice boardwalk, a number of apartment buildings now advertise short-term rentals, and houses on the city’s famed “walk streets” routinely show up in searches on Airbnb. Even several blocks inland, at Lincoln Place Apartments — a 696-unit, newly renovated complex that includes a pool, gym and other tourist-friendly amenities — Roman Barrett recently counted more than 40 listings on Airbnb and other sites. Barrett, who moved out over the issue, said Airbnb effectively drives up the rent. He paid $2,700 a month for a one-bedroom; now he’s looking farther east for something he can afford.
“It’s making places like Santa Monica and Venice totally priced out. Silver Lake is impossible. I’m looking in Koreatown right now,” Barrett said. “They need to make a law about this.”

A new law of some sort is the goal at City Hall. New York, San Francisco and Portland, Ore., have crafted regulations to govern taxes, zoning and length of stay in short-term rentals, and Airbnb says it’s glad to help in that process here.
“It’s time for all of us to work together on some sensible solutions that let people share the home in which they live and contribute to their community,” spokesman Christopher Nulty said in a statement Tuesday.
Will Youngblood, the man who e-mailed LaFlamme about managing his apartment in Los Feliz, says he’d also appreciate clearer rules and an easier way to pay occupancy taxes.
Youngblood runs five Airbnb apartments, mostly in Hollywood. A former celebrity assistant, he’s been doing this for two years; it’s a full-time job. Most of Youngblood’s clients own their homes but travel a lot or live elsewhere. One, he rents and lists full time. He’s been looking around for another.
“I’m honest about what I do,” he said. “Some [landlords] are like, ‘That’s insane. No way.’ Other people say, ‘We’d love that.'”
If the city decides it doesn’t like what he’s doing, Youngblood said, he’ll go do something else. But for now, he said, it’s a good way to make some cash and meet interesting people.
But he won’t meet LaFlamme. The longtime landlord concedes he “might be old-fashioned,” but he just doesn’t like the idea of strangers traipsing through his apartments. He prefers good, long-term tenants, and in L.A.’s red-hot rental market he has no problem finding them.
“I almost find it painful to rent things these days,” he said. “There’s so much demand and so many people who are qualified and nice people who I have to turn away.”
For that apartment in Los Feliz, LaFlamme said, he found a tenant in less than 24 hours.
