Illinois has passed a law requiring landlords to open their doors to illegal immigrants.


Illinois has passed a law requiring landlords to open their doors to illegal immigrants.
The real estate market is going through a massive correction right now, and the pain real estate investors and homeowners feel is about to get much worse. That’s according to JP Morgan’s new report on the state of shadow vacancy in the real estate market. We dive into how they uncovered this shadow vacancy and what it means for the broader real estate and housing market.
A clear bifurcation of risk emerged between mortgaged homes purchased relatively recently versus those bought early in or prior to the pandemic: Black Knight

(Connie Kim) Home price corrections exposed a growing pocket of equity risk concentrated among purchase mortgages originated in 2022, Black Knight said in its latest mortgage monitor report. Of all homes purchased with a mortgage in 2022, 8% are now at least marginally underwater.
Of the 450,000 underwater borrowers at the end of the third quarter, nearly 60% of the mortgages originated in the first nine months of 2022, according to Black Knight. In total, 5% of all mortgages originated so far this year are now marginally underwater, with another 20% in low equity positions.
As new inventory is finally starting to hit the market and demand has temporarily slowed down thanks to rising rates, the housing expansion between March 2020 and now is still very likely to go down in history as blowing unprecedented amounts of air into an unprecedented bubble.
And now we have the data to show it. Continue reading
All these curveballs will further fragment the housing market.
30 Year fixed mortgage rates have jumped 160bp this year, reaching the highest since November 2018, with the latest Freddie Mac data showing an acceleration in mortgage rates which jumped a quarter point in just the past week, from 4.42% to 4.67%. This is an even bigger increase than we discussed in our recent housing comment.
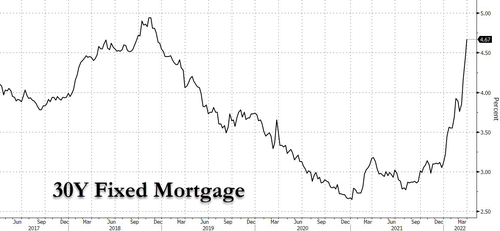
And while the benchmark 10y Treasury yield has also risen, the increase is “only” 94bp. In other words, there has also been a significant widening in mortgage spreads, by 66bp to 243bp. This could be explained by the Fed’s accelerated pivot from QE to QT, the latter of which we expect will be announced at the next FOMC meeting in May.
As discussed one week ago in “Housing Affordability Is About To Crash The Most On Record“, the move higher in rates means that an already record affordability shock will be even worse! Continue reading
For the past several months we have warned about the pernicious effects soaring prices are having on both corporations (“Buckle Up! Inflation Is Here!“) and consumers (“”This Is Not Transitory”: Hyperinflation Fears Are Soaring Across America“), prompting even otherwise boring sell side research to get (hyper) exciting, with Deutsche Bank (which warned this week that “Inflation Is About To Explode “Leaving Global Economies Sitting On A Time Bomb“) and Bank of America (which “Just Threw Up All Over The Fed’s “Transitory” Argument“) now openly claiming that the Fed is wrong, and the US is facing an unprecedented period of far higher, non-transitory inflation, with DB going so far as to warn “policymakers will face the most challenging years since the Volcker/Reagan period in the 1980s.”
Both existing home sales and new home sales are exhibiting a V-shaped recovery DESPITE the COVID-1984.

And an even more pronounced recovery is in the national home ownership rate, highest since 2008.

Case-Shiller home price gains have re-accelerated over the last 3 months and analysts expected another acceleration in November (the latest data set) and were right as the 20-City Composite surge 2.55% YoY (better than the +2.40% YoY expectation).
This is the biggest YoY rise since Feb 2019…
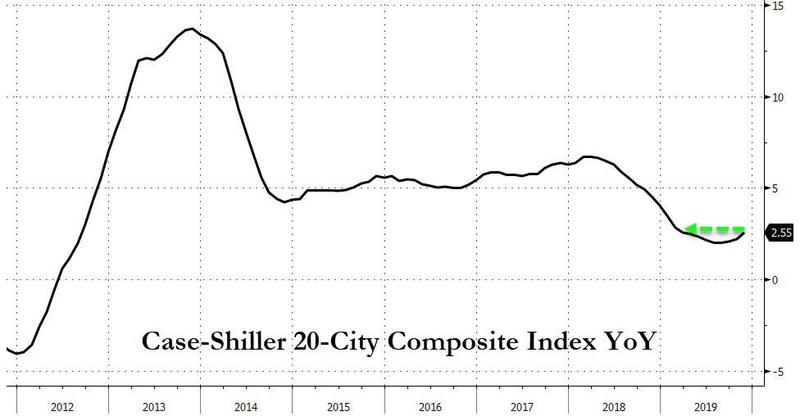
Source: Bloomberg
Home prices climbed 0.5% from the previous month – also topping forecasts – matching the October increase for the best back-to-back gains since early 2018.
All 20 cities in the index showed year-over-year home-price gains, led by Phoenix; Charlotte, North Carolina; and Tampa, Florida.
After dropping YoY in September and October, the mecca of all things socially just and tech-savvy – San Francisco – saw prices adjust higher and back into the green YoY…
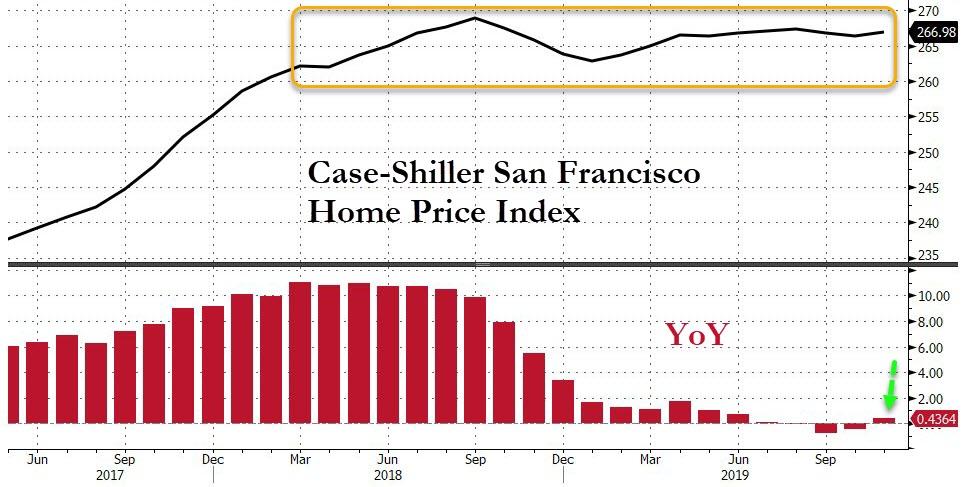
Source: Bloomberg
Finally, a broader national index of home prices was up 3.5% from a year earlier, the most since April.
Over the last year, home prices have risen in 49 of the biggest 50 metro areas in the United States.
At the same time, mortgage rates have hit seven-year highs, making things more expensive for any prospective home buyer.
With this context in mind, today’s map comes from HowMuch.net, and it shows the salary needed to buy a home in the 50 largest U.S. metro areas.
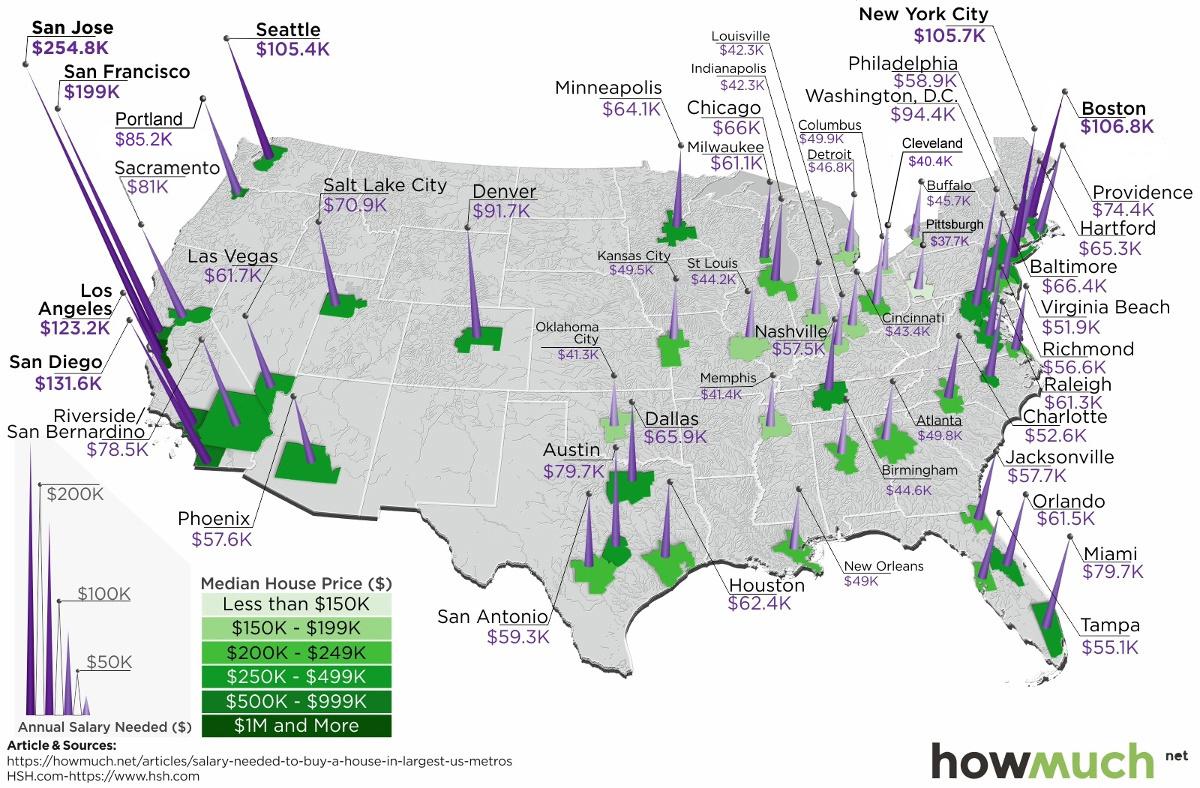
As a reference point, Visual Capitalist’s Jeff Desjardins points out that the median home in the United States costs about $257,600, according to the National Association of Realtors.

With a 20% down payment and a 4.90% mortgage rate, and taking into account what’s needed to pay principal, interest, taxes, and insurance (PITI) on the home, it would mean a prospective buyer would need to have $61,453.51 in salary to afford such a purchase.
However, based on your frame of reference, this national estimate may seem extremely low or quite high. That’s because the salary required to buy in different major cities in the U.S. can fall anywhere between $37,659 to $254,835.
Here are the lowest cost metro areas in the U.S., based on data and calculations from HSH.com:

After the dust settles, Pittsburgh ranks as the cheapest metro area in the U.S. to buy a home. According to these calculations, buying a median home in Pittsburgh – which includes the surrounding metro area – requires an annual income of less than $40,000 to buy.
Just missing the list was Detroit, where a salary of $48,002.89 is needed.
Now, here are the priciest markets in the country, also based on data from HSH.com:
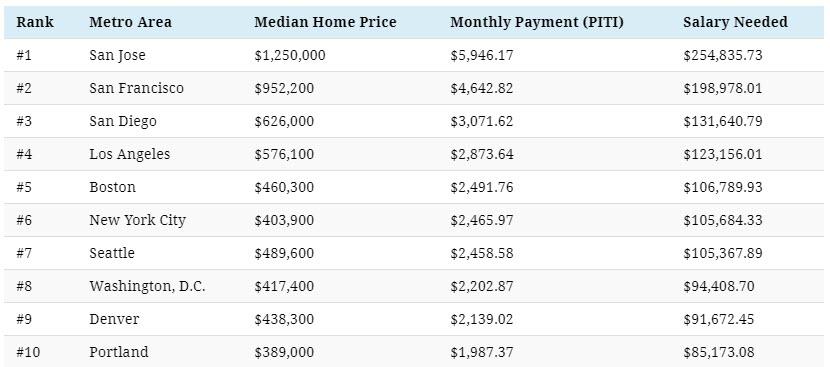
Topping the list of the most expensive metro areas are San Jose and San Francisco, which are both cities fueled by the economic boom in Silicon Valley. Meanwhile, two other major metro areas in California, Los Angeles and San Diego, are not far behind.
New York City only ranks in sixth here, though it is worth noting that the NYC metro area extends well beyond the five boroughs. It includes Newark, Jersey City, and many nearby counties as well.
As a final point, it’s worth mentioning that all cities here (with the exception of Denver) are in coastal states.
Notes on Calculations
Data on median home prices comes from the National Association of Realtors and is based on 2018 Q4 information, while national mortgage rate data is derived from weekly surveys by Freddie Mac and the Mortgage Bankers Association of America for 30-year fixed rate mortgages.
Calculations include tax and homeowners insurance costs to determine the annual salary it takes to afford the base cost of owning a home (principal, interest, property tax and homeowner’s insurance, or PITI) in the nation’s 50 largest metropolitan areas.
Standard 28% “front-end” debt ratios and a 20% down payments subtracted from the median-home-price data are used to arrive at these figures.
Bank of America is ringing the proverbial bell on the US real estate market, saying existing home sales have peaked, reflecting declining affordability, greater price reductions and deteriorating housing sentiment. In the latest weekly report from chief economist Michelle Meyer, the bank warned that “the housing market is no longer a tailwind for the economy but rather a headwind.”
“Call your realtor,” the BofA note proclaimed: “We are calling it: existing home sales have peaked.”
BofA’s economists believe the peak was seen when existing home sales hit 5.72 million, back in November 2017. From this point on, sales should trend sideways, as this moment in time is comparable to the rate the economy witnessed in the early 2000s before the bubble inflated.
And while BofA believes existing home sales have plateaued, they do not think the same for new home sales. The reason: new home sales have lagged existing in this “economic recovery” – leaving home builders some room to flood the market with new single-family units before a turning point in the entire real estate market is realized.
The deterioration in affordability can mostly explain the peak in existing home sales. This is due to the Federal Reserve reinflating real estate prices back to levels last seen since before the 2008 crash. The National Association of Realtors (NAR) affordability index prints 138.8, the lowest since August 2008.
Chart 1 (below) shows there is a leading relationship between the trend in affordability and in home sales — a simple regression suggests the lead is about three months. In major cities, affordability continues to be a significant problem for many Americans amid a rising interest rate environment and elevated home prices, existing home sales should remain under pressure for the foreseeable future.

Chart 2 (above right) indicates that the share of properties with price discounts is on the rise, suggesting that sellers are unloading into weakening demand. The data from Zillow reveals that 15 percent of listings have price reductions, the highest since mid-2013 when home sales tumbled last.
The University of Michigan survey (Chart 3 below) reveals a worsening mood in the perception of buying conditions for homes. Respondents noted that home prices have become too high while rates have become restrictive.

BofA said that existing home sales were quick to recover post-crisis given motivated sellers – the lenders who were sitting with millions of distressed properties.
Distressed properties made up between 30 and 40 percent of sales in the early stages of the recovery.
Home prices were discounted until they reached the market clearing price and buyers entered.
The recovery for new homes sales began one year after existing, as homebuilders stayed idol waiting for the dust to settle.
“We are now looking at a market where existing home sales have returned to a solid pace but new home sales are still below normal levels. We think that builders will continue to selectively add inventory in markets where there is demand, allowing new home sales to glide higher. Ultimately we think new home sales will peak around 1mn saar based on the historical relationship between existing and new home sales,” said BofA.
BofA asks the difficult question: If existing home sales have peaked, does it mean the rate of growth of home prices will as well?
Their answer: In the last cycle, existing home sales peaked at 6.26mn saar on September 2005, coinciding with peak home price growth of 14.4 percent the same month (Chart 5). The pre-boom historical data are generally supportive as well, as are the recent data-single family existing home sales peaked at 4.9mn saar in March this year, as did home price appreciation at 6.5 percent. The result, well, existing home sales are pressured by declining affordability, home price growth should slow from here. BofA said a contraction in home prices seems unlikely at the moment, however, if demand is not stoked soon that can all change.

While BofA makes clear the housing market is starting to stall, the Federal Reserve is conducting quantitative tightening and rapidly increasing interest rates to get ahead of the next recession. In other words, liquidity is being removed from the system and the cost of borrowing is headed higher – an environment that is not friendly to real estate, and could be the key factor explaining the weakness in housing.

Which brings up another important question: while financial assets continue to rise, these have largely benefited the Top 10% of the population; meanwhile the bulk of the US middle class net worth has traditionally been allocated to such fixed assets as real estate. And if that is now rolling over, what is the outlook for the US consumer, which remains the dynamo behind the US economy?
There is another, potentially more troubling observation. According to TS Lombard, the current period is now only the third time in US history – after 1968 and 1999 – in which equities have made up a larger percentage of net worth than real estate.

While this may be good news for holders of stocks, it may not last: as TS Lombard observes, sharp bear markets followed shortly after 1968 and even sooner after 1999. And with housing peaking – if BofA is correct – share prices remain the only driver behind continued economic growth, prompting TSL to conclude that “the US economy can not afford a bear market.”

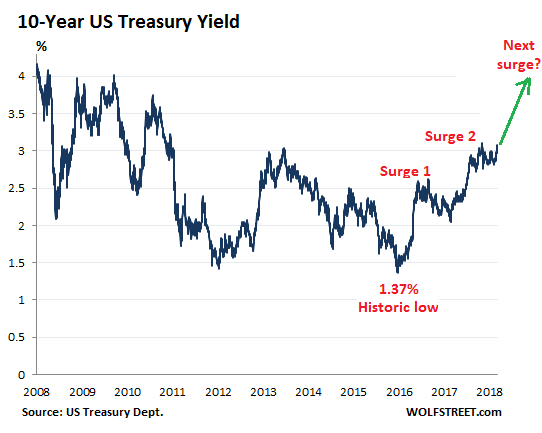
There’s an interesting thing that just happened, which shows that the US Treasury 10-year yield is ready for the next leg up, and that the yield curve might not invert just yet: the 10-year yield climbed over the 3% hurdle again, and there was none of the financial-media excitement about it as there was when that happened last time. It just dabbled with 3% on Monday, climbed over 3% yesterday, and closed at 3.08% today, and it was met with shrugs. In other words, this move is now accepted.
Note how the 10-year yield rose in two big surges since the historic low in June 2016, interspersed by some backtracking. This market might be setting up for the next surge:
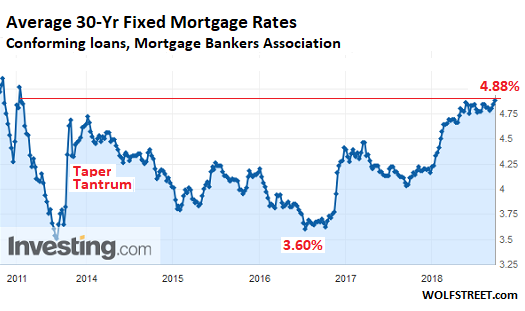
And it’s impacting mortgage rates – which move roughly in parallel with the 10-year Treasury yield. The Mortgage Bankers Association (MBA) reported this morning that the average interest rate for 30-year fixed-rate mortgages with conforming loan balances ($453,100 or less) and a 20% down-payment rose to 4.88% for the week ending September 14, 2018, the highest since April 2011.
And this doesn’t even include the 9-basis-point uptick of the 10-year Treasury yield since the end of the reporting week on September 14, from 2.99% to 3.08% (chart via Investing.com; red marks added):
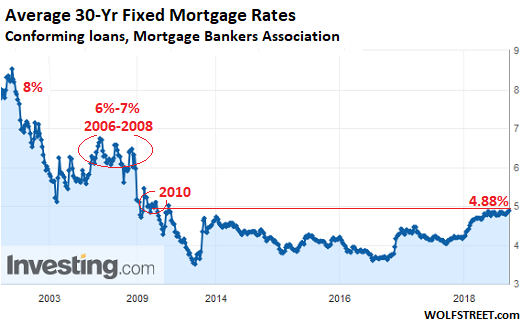
While 5% may sound high for the average 30-year fixed rate mortgage, given the inflated home prices that must be financed at this rate, and while 6% seems impossibly high under current home price conditions, these rates are low when looking back at rates during the Great Recession and before (chart via Investing.com):
And more rate hikes will continue to drive short-term yields higher, even as long-term yields for now are having trouble keeping up. And these higher rates are getting baked in. Since the end of August, the market has been seeing a 100% chance that the Fed, at its September 25-26 meeting, will raise its target for the federal funds rate by a quarter point to a range between 2.0% and 2.25%, according to CME 30-day fed fund futures prices. It will be the 3rd rate hike in 2018.
And the market now sees an 81% chance that the Fed will announced a 4th rate hike for 2018 after the FOMC meeting in December (chart via Investing.com, red marks added):
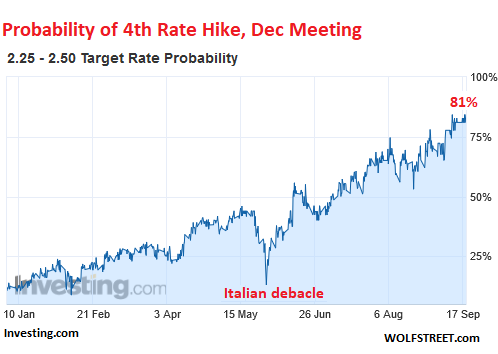
The Fed’s go-super-slow approach – everything is “gradual,” as it never ceases to point out – is giving markets plenty of time to prepare and adjust, and gradually start taking for granted what had been considered impossible just two years ago: That in 2019, short-term yields will be heading for 3% or higher – the 3-month yield is already at 2.16% — that the 10-year yield will be going past 4%, and that the average 30-year fixed rate mortgage will be flirting with a 6% rate.
Potential home buyers next year haven’t quite done the math yet what those higher rates, applied to home prices that have been inflated by 10 years of interest rate repression, will do to their willingness and ability to buy anything at those prices, but they’ll get around to it.
As for holding my breath that an inverted yield curve – a phenomenon when the 2-year yield is higher than the 10-year yield – will ominously appear and make the Fed stop in its tracks? Well, this rate-hike cycle is so slow, even if it is speeding up a tiny bit, that long-term yields may have enough time to go through their surge-and-backtracking cycles without being overtaken by slowly but consistently rising short-term yields.
There has never been a rate-hike cycle this slow and this drawn-out: We’re now almost three years into it, and rates have come up, but it hasn’t produced the results the Fed is trying to achieve: A tightening of financial conditions, an end to yield-chasing in the credit markets and more prudence, and finally an uptick in the unemployment rate above 4%. And the Fed will keep going until it thinks it has this under control.
The Housing Picture Is Not Brightening – Part I
A house should be earned – It is not a right
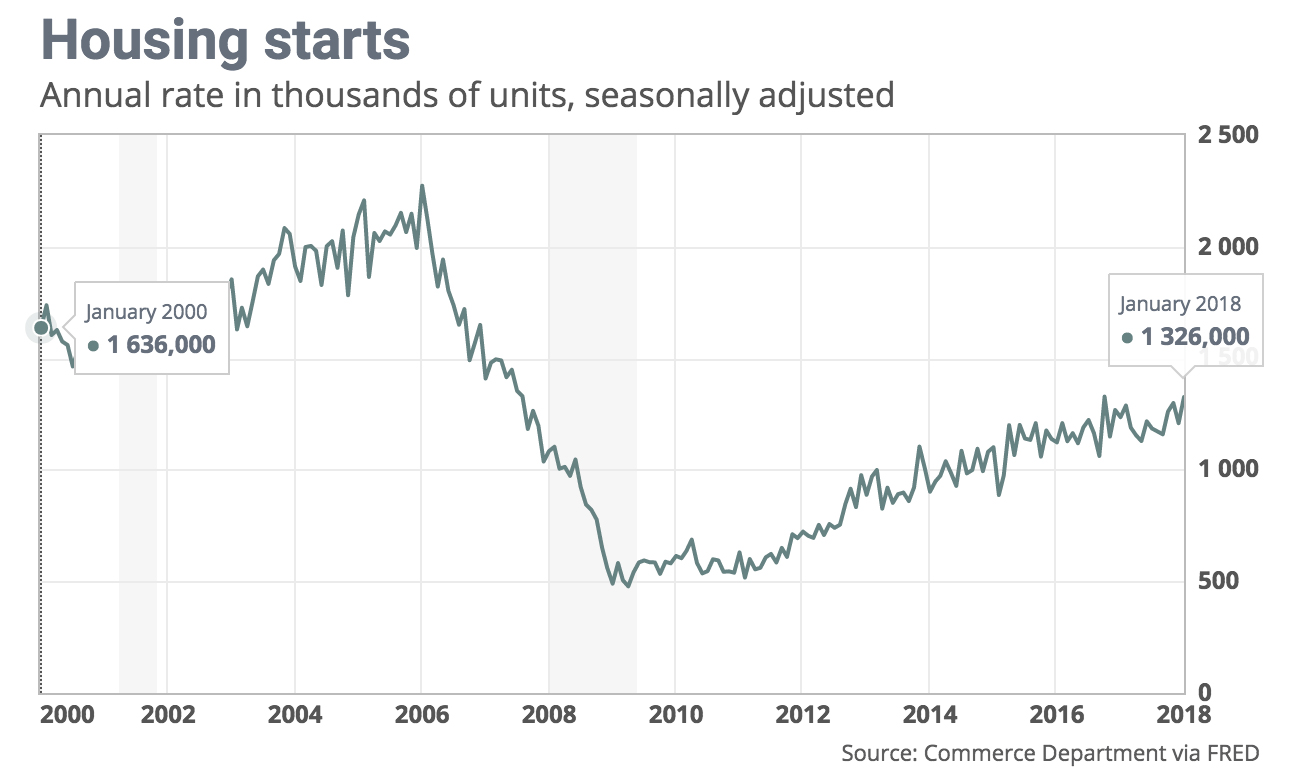
The future of the housing market is a topic that has been subject to a great deal of debate and can be somewhat confusing. The intention of this post is to dispel some of the myths that have been generated and add some clarity to the discussion. One of the charts below clearly shows that new construction is still far below levels prior to 2008. It should also be noted that much of the new construction is in apartments and not single family dwellings. In much of the country, housing units are being built using cheap money flowing from the Fed and Wall Street under the idea that if it is built “they will come.” While many people claim the formation of new households and pent-up demand drives this construction I beg to differ. I contend it is a combination of too much money looking for a place to hide and buyers looking for a safe place to put their money.
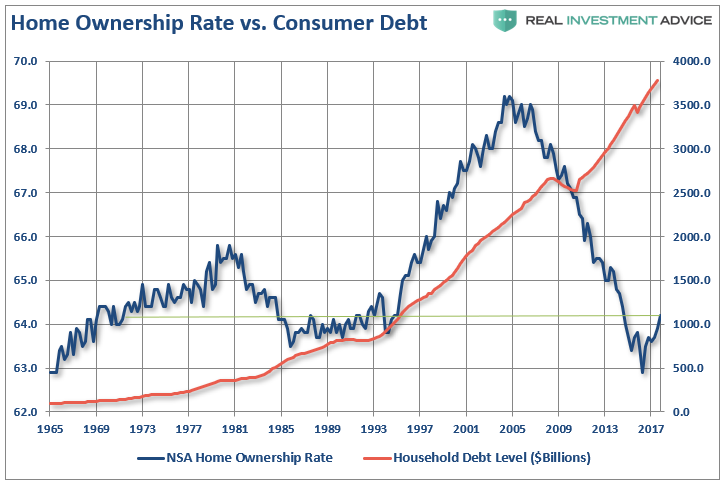
As I wrote this post I tried to do a bit of additional research to supplement what I know as a contractor and Apartment owner but what I found was more like a pack of lies and half-truths spun to fit an agenda. In America, the government, coupled with a slew of builder and Realtor associations control the housing narrative. Huge discrepancies exist in the cost of housing in the various markets across America and while price variations are not uncommon they should be seen as a red flag and reason for caution. Many of the messages being promoted as common knowledge do not pass serious scrutiny. Those of us in the trenches and with our boots on the ground often see things from a different perspective than the economist in their ivory towers, Washington politicians, Wall Street elite, or the media. Home ownership in America is in decline and demographics are not supportive of higher prices. If prices rise it most likely it will be a result of inflation.
Note the amount of traffic, or calls an apartment complex receives may have little to do with the strength of the market. A well qualified potential tenant only has to apply at one complex while those who are rejected continue time after time. Government subsidized housing through programs such as section 8 have cannibalized the market often taking the “best of the worse” and leaving those landlords who choose not to participate with a rather unsavory pool of potential tenants from which to choose. This often includes those denied government housing, nearly bankrupt, or chronically unemployed. The city where I live ranks 23rd in the nation for having the most “zombie foreclosures” however, markets in other parts of the nation are often not as strong as the media claims. A relative of mine who sold a home with an extra lot that was on a golf course north of Houston several years ago took a severe beating. Weak pricing in a market that was touted as very solid is more proof that what many claim is a “boom” is far from spectacular.
A Bloomberg article years ago titled “Wall Street Unlocks Profits From Distress With Rental Revolution” looked behind the curtain and pointed out that a great deal of this housing recovery that has driven the average home price up 30% since 2012 has been the result of Wall Street hedge funds buying in bulk foreclosed houses in order to turn them into rentals. Like many people, I find it totally objectionable these deals were “bundled” and offered in such a way that allowed big business to crowd the average American out of the housing market. In parts of the country, cash fleeing China and other troubled countries has flowed into the market pumping up prices. These type of situations create a questionable base for higher home prices when we consider the low end of the market is driven by Fannie, Freddie, and the FHA all insuring 3.5% down payments from borrowers that lack substantial collateral. History has shown that such special financing simply encourages people to rush out and buy homes they cannot afford. It is important to remember that low-interest rates do not necessarily bring about quality growth or prosperity, decades of slow growth in Japan has proven this.
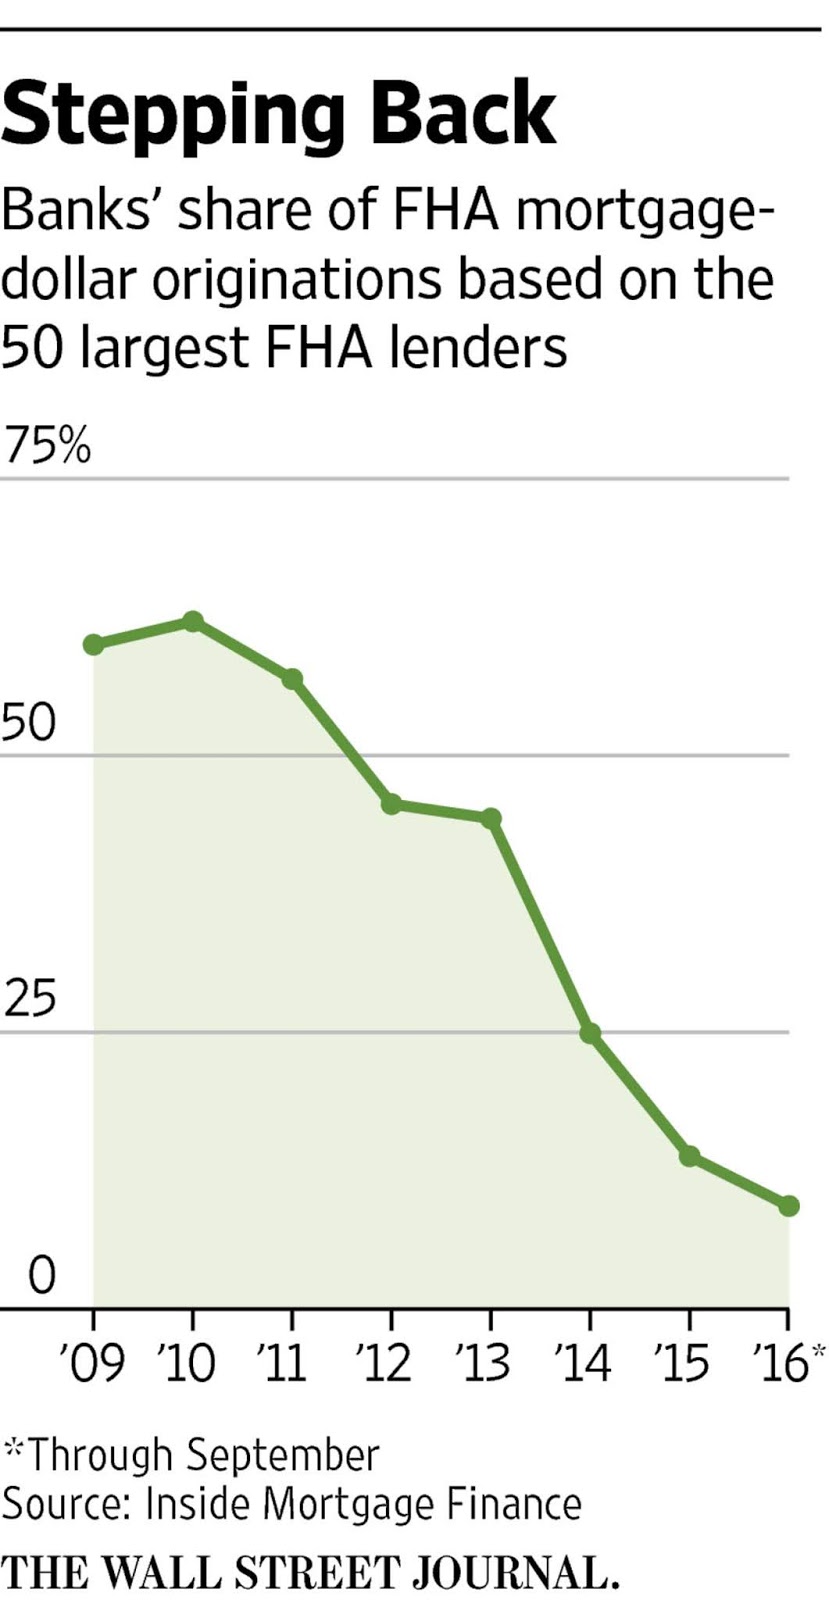
One of the sad accomplishments of current Fed policy is that low-interest rates often do not create all that much new demand but simply moves what does exist forward. To make the situation worse the FHA is busy issuing and guaranteeing risky mortgages written by thinly capitalized non-banks. In 2012 the large Wall Street banks represented over 65% of FHA backed loans, today that number has cratered. Even they have realized loaning money to people that won’t pay it back is a recipe for disaster. America is preparing for a replay of the 2008 housing crisis. Our politically motivated government has insured subprime mortgages with down payments of as little as 3.5% while using weak underwriting standards. We are even seeing restrictions raised on borrowers with past foreclosures in a housing market that may drop 20% when this Fed Wall Street bubble pops. Years ago Lee Iacocca who brought Chrysler back from the brink and made the company viable said something to the effect of when you special out all your cars on Monday you have no sales for the rest of the week. In the current situation, low-interest rates are only one of the factors distorting and skewing America’s housing markets, others will be discussed in part two.
Housing In America – Part II
When it comes to real estate, low-interest rates at some point becomes a double edge sword, that affects both its value by making it easier to purchase thus driving up prices, and at the same time allowing more building to take place and increasing the supply. Often we reach or exceed demand, this eventually has a dampening effect on rents and people stop buying it as an “investment”. Rents from real estate and the prices it brings when sold must appreciate more than the natural depreciation from the wear and tear from age or the main driver for owning it as an investment quickly vanishes. Oversupply is the bane of real estate and crushes the value of this hard and expensive to maintain commodity. History has generally shown homes that are paid for and un-leveraged to be a better than average place to store wealth when purchased for a good price, as to whether now is a good time to buy that is difficult to say.
How does the reality of a half-empty apartment complex and a slew of empty houses gel with what we hear about soaring rents, the demand for more housing, and more affordable housing? Those declaring housing has fully recovered must admit housing prices vary greatly across the nation and this is a problem that can be difficult to get your head around. Only politicians in Washington would be silly enough to think that landlords who have to compete against subsidized housing would be eager to remain in the game or that someone working for a living enjoys paying more for an older apartment than someone on the dole who moves into a brand new unit for a fraction of the cost. By not rewarding those who do the right thing our current policies have a corrosive effect on both housing and society.
America has built a lot of housing units over the years, now we must face the fact that they need to be maintained. Instead of focusing and creating policies to rebuild our cities by encouraging homeowners to invest more in upgrading windows, adding insulation and improving the existing housing stock, Washington has doled out low-interest money to Wall Street and home builders in an effort to kick-start the economy by building new housing to generate the illusion of growth and rising prices. Currently, we are in uncharted waters and where this market is headed is anyone’s guess but one thing is certain it is not straight up. Speculating on housing is dangerous and should not be encouraged through bad policy. When people leave older neighborhoods and move to a new house in the suburbs enticed by current artificially low-interest rates they in effect hollow out our cities.
 Old houses need to be maintained
Adding to our housing problems is low down payments and other policies often put people in older houses that they have no interest or knowledge in how to maintain. This can cause even more people to flee the area and brings about further decay. When offered the choice many people find moving easier than repairing and maintaining their homes or neighborhoods and low-interest rates power this trend forward. Policies should be geared toward creating jobs that maintain these units instead of making them prematurely obsolete. This is a flashing red light warning of danger ahead. By choosing the easy answers America has not faced its housing problems with long-term solutions and encouraging this bodes poorly for the future.
Get your financing in order and get the project started before the market dries up has been how developers everywhere have operated for decades. I have owned an apartment complex in the Midwest for many years and many houses in my area are empty or under leased. In 2005 and 2006 prior to the housing collapse, many people were looking at second homes, today not only have they shed the extra home many have doubled up with family or friends reducing the need for housing. This has left me busy trying to sort out and make sense of the current economy. This is no easy task, it seems we are pushing on a string and calling it demand when someone who can barely pay the rent is encouraged by the government to buy a house they can neither afford or maintain. Currently, we have a shortage of “qualified” buyers and renters.
A close look of permits and starts shows many of the future housing starts are multi-family units, these are being built with cheap “Wall Street” money for the markets of tomorrow with little regard for the realities of today. A new report by Yardi Systems Inc indicates apartment construction is far outpacing demand in many markets, this overbuilding of multi-family will have ramifications on the cost of living and the resale value of homes going forward. It is a fact that single-family housing starts have languished as the percentage of multi-unit buildings under construction has risen. Some of these may be slated as condos but another name for an unsold condo that is being leased is “apartment.” Let us call a spade a spade, much of what we see today is not a housing market, it is a place where too much money has gone to hide under the impression and hope it will pay off when inflation awakes and comes out roaring from its quiet slumber.
After small rebounds in July (after three ugly months prior), August was expected to see those gains consolidate but the picture was extremely mixed with Starts spiking 9.2% MoM and Permits plunging 5.7% MoM.

This suggests a rough time ahead for housing as Permits plummet to the lowest since May 2017…

All of which suggests home builder stocks have further to fall…

Probably time for some more rate hikes!
Despite efforts by state legislators at creating a socialist utopia, California still has the highest poverty rate in the nation at 19%, despite a 1.4% decrease from last year according to the Census Bureau.

Poverty and income figures released Wednesday reveal that over 7 million Californians are struggling to get by in the second most expensive state to live in, according to the Council for Community and Economic Research‘s 2017 Annual Cost of Living Index.
And while California has a “vigorous economy and a number of safety net programs to aid needy residents,” according to the Sacramento Bee, one out of every five residents is suffering economic hardship – which is fueled in large part by sky-high housing costs, according to Caroline Danielson, policy director at the Public Policy Institute of California.
“We do have a housing crisis in many parts of the state and our poverty rate is highest in Los Angeles County,” she said, adding that cost of living and poverty is often highest in the state’s coastal counties. “When you factor that in we struggle.”
Silicon Valley residents in particular are leaving in droves – more so than any other part of the state. Nearby San Mateo County which is home to Facebook came in Second, while Los Angeles County came in third.
“They’re looking for affordability and not finding it in Santa Clara County,” said Danielle Hale, chief economist for realtor.com.
It’s not just housing prices driving the exodus, of course. Punitive taxes – more than twice as much as some other states, are eating away at disposable income. Nearby Arizona’s income tax rate is 4.54% vs. California’s 9.3%, while the new tax bill may accelerate the exodus.
As Michael Snyder of the Economic Collapse Blog pointed out in May…
Reasons for the mass exodus include rising crime, the worst traffic in the western world, a growing homelessness epidemic, wildfires, earthquakes and crazy politicians that do some of the stupidest things imaginable. But for most families, the decision to leave California comes down to one basic factor…
Money.
Mass Exodus

As you may or may not be aware, we’ve mentioned the flood of various types of Californians fleeing the state for various reasons; be it wealthy families who want to keep more of their income safe from the tax man, or poor residents leaving the Golden State because they are being crushed by the high cost of living.
To that end, the Orange County Register notes a significant out migration of people in their child-raising years – as the largest group leaving the state, some 28%, are those aged 35 to 44.
According to IRS data from 2015-2016, the latest available, roughly half of those leaving the state make less than $50,000 per year, while roughly 25% of those leaving make over $100,000.
What did the OC register conclude?
Thanks to unaffordable housing, California’s moderate wage earners are going to have to leave the state, while only the wealthy and the impoverished residents will remain.
But the big enchilada in California — by far the largest source of distortion in living costs — is housing. Over 90 percent of the difference in costs between California’s coastal metropolises and the country derives from housing. Coastal California is affordable for roughly 15 percent of residents, down from 30 percent in 2000 and 30 percent in the interior, from nearly 60 percent in 2000. In the country as a whole, affordability hovers at roughly 60 percent.
***
Over time these factors — along with prospects of reduced immigration — will impact severely the state’s future. California is already seeing its population aged 6 to 17 decline. This reflects a continued drop in fertility in comparison to less regulated, and less costly, states such as Utah, Texas and Tennessee. These areas are generally those experiencing the biggest surge in millennial populations. –OC Register
And according to ULI, 74% of California millennials are considering an exodus.
Where to?
As we noted in June, these are the top 10 California counties that people are leaving, and where they’re headed (via the Mercury News):
1. Santa Clara County
Out of state destinations: Arizona, Nevada, Texas and Idaho
In state destinations: Alameda, Sacramento, San Joaquin, Santa Cruz and Placer counties
2. San Mateo County
Out of state destinations: Arizona, Nevada, Texas and Washington
In state destinations: Alameda, Contra Costa, Santa Clara, Sacramento, and San Francisco counties
3. Los Angeles County
Out of state destinations: Nevada, Arizona, and Idaho
In state destinations: San Bernardino, Riverside, Ventura and Kern counties
4. Napa County
Out of state destinations: Arizona, Idaho, Nevada, Florida and Oregon
In state destinations: Solano, Sonoma, Sacramento, Lake and El Dorado counties
5. Monterey County
Out of state destinations: Arizona, Nevada, and Idaho
In state destinations: San Luis Obispo, Fresno, Santa Cruz, Sacramento and San Diego counties
6. Alameda County
Out of state destinations: Arizona, Nevada, Idaho, and Hawaii.
In state destinations: Contra Costa, San Joaquin, Sacramento, Placer, and El Dorado counties
7. Marin County
Out of state destinations: Nevada, Arizona, Oregon and Idaho.
In state destinations: Sonoma, Contra Costa, Solano and San Francisco counties
8. Orange County
Out of state destinations: Arizona, Nevada and Idaho
In state destinations: Riverside, Los Angeles, San Bernardino, San Diego and San Luis Obispo
9. Santa Barbara County
Out of state destinations: Arizona, Nevada and Idaho.
In state destinations: San Luis Obispo, Ventura, Los Angeles, Riverside and Kern counties
10. San Diego County
Out of state destinations: Arizona and Nevada
In state destinations: Riverside, San Bernardino, Imperial, Orange County and Los Angeles
“Live with your friends in these Shipping Container Apartments!” the Craigslist, Inc. post reads
As President Trump’s trade war seizes up global supply chains, one side-effect is an overabundance of shipping containers. And, with just one simple click on eBay, there are pages and pages of 40-foot shipping containers for sale ranging from $1,500 to $3,500.
Intertwined in the pages, dozens of pre-fab architecture firms are offering tiny modern homes built with containers.
Some pre-fab container homes are more luxurious than others, ranging from $30,000 to $449,000 for a massive luxury duplex. While most Americans are too blind to understand their living standards are in decline, on a post-great financial crisis basis, the search trend among Americans for “shipping container homes for sale” has rapidly grown in the past decade.

The American dream has transformed from a McMansion of the 1990s and 2000s to a tiny modern container home built with relics from the industrial past of a once vibrant economy.
Enter the brave new world of shipping container apartment buildings.

About 16 days ago, someone posted an ad on Craigslist, offering “units” for rent in a brand new container apartment building in Washington, D.C. where each unit costs about $1,099 per month, and in light of DC’s unaffordable rents, this seems like a good deal for heavily indebted millennials.

“This uniquely constructed 4 unit building is truly one of a kind. Welcome to DC’s first shipping container residential building. Constructed using repurposed steel shipping containers, this brand new modern apartment is one of the most memorable multi-family buildings in all of DC. You can rent a bedroom for yourself or bring a group of friends!” the ad stated.

As shown above, residents share a “large restaurant style kitchen,” and have a large communal area, sort of like a dormitory (below).

Could shipping container “apartments” be the solution for cities battling a housing affordability crisis? If the experiment proves successful in Washington, expect the metal crate buildings to show up in a port city neighborhood near you housing several dozen broke, if entitled, young Americans, and owned by – who else – Blackstone.
… meanwhile, realtors are getting nervous about sustainability of the Las Vegas area housing market for good reason.
Amid its “broadest slowdown in years” the US housing market faces prices for starter homes at the highest they have been since 2008, just prior to the collapse of the housing market, and August is confirming that prices are indeed becoming an issue.
Following the drop in Existing- and New-home sales (as well as another drop in mortgage apps), Pending-home sales missed expectations dramatically, dropping 0.7% MoM in July (+0.3% exp).

This is the seventh straight month of annual declines in pending home sales…

Lawrence Yun, NAR chief economist, says the housing market’s summer slowdown continued in July.
“Contract signings inched backward once again last month, as declines in the South and West weighed down on overall activity,” he said.
“It’s evident in recent months that many of the most overheated real estate markets – especially those out West – are starting to see a slight decline in home sales and slower price growth.”
Yun blames affordability (and supply)…
“The reason sales are falling off last year’s pace is that multiple years of inadequate supply in markets with strong job growth have finally driven up home prices to a point where an increasing number of prospective buyers are unable to afford it.”
The US housing data just keeps getting worse…

Again as we noted previously, none of this should come as a huge surprise since
Sentiment for Home-Buying Conditions are the worst since Lehman…

With The Fed set on its automaton hiking trajectory, we suspect home sales will continue to lag.
There is a simple reason why the US housing market is headed for its “broadest slowdown in years“: prices for housing are just too high, a new report suggests. Which is odd considering the conventionally accepted narrative that “rising prices are better for everybody.”
According to a new report from the National Association of Realtors, prices for starter homes are the highest they have been since 2008, just prior to the collapse of the housing market, and when Ben Bernanke infamously said that there is no housing bubble and that “we’ve never had a decline in house prices on a nationwide basis” and therefore we’ll never have one. The housing market suffered its worst crash on record shortly after.

In the second quarter, first time buyers needed 23% of their income in order to afford a typical entry-level home; this was up from 21% in the year prior, and the highest in the past decade.
This, of course, should surprise nobody as price gains in the housing market have long outpaced wages; in fact in most markets the average home price increase is double the growth in hourly earnings.

Now, with the housing market starting to show signs of cooling off, those bearing the brunt of the increases are buyers at the low-end of the market and in areas where supplies are the tightest. This has probably not been helped along by the volatile cost of commodities like lumber which have been impacted by Canadian tariffs, among others.
On top of that, rising interest rates are making mortgage prohibitively expensive for a broad section of the population.
“When prices go up at the entry level, that’s where the affordability issue is most acute,” Wells Fargo economist Charles Dougherty told Bloomberg. “People are hesitant to stretch the amount they’re willing to pay.”
The most expensive markets in the United States were San Francisco and New York City, where Bloomberg reported that the median household needed 65% of its income to buy a house in the second quarter of this year. Similar statistics followed in Los Angeles and Miami, where those numbers were 59% and 55%, respectively.
Perhaps a better way of saying this is that no mere mortal can actually afford to buy there, and the only buyers are members of the 0.01% or those who have an extremely generous mortgage lender.
None of this housing information is discussed at length by the FOMC or the government, which find no problem with a near record number of people getting priced out of the market. Nobody will be surprised when, as prices continue to rise, we are “surprised” by the next housing crisis.
This news comes just days after we reported layoffs taking place at Wells Fargo as a result of the slumping housing market and slower mortgage applications, as a result of collapsing mortgage loan demand. Last Friday, Wells Fargo announced it was cutting 638 mortgage employees as the nation’s largest home lender is hit by a crippling slowdown in the business.

“After carefully evaluating market conditions and consumer needs, we are reducing to better align with current volumes,” Wells Fargo spokesman Tom Goyda said in an emailed statement according to Bloomberg.
As we reported back in March that the “Bank Sector Is In Peril As Refi Activity Crashes Amid Rising Rates” and as interest rates have continued to rise, Wells Fargo has been contending with the end of a refinancing boom that helped push profits to a record.
One month ago we discussed why according to the recent data, the “Housing Market Headed For “Broadest Slowdown In Years.” Fast forward to today, when we received the latest confirmation that the US housing market appears to have recently hit a downward inflection point: according to the just released July 2018 U.S. Foreclosure Market Report released by ATTOM Data Solutions, foreclosure starts in July increased by 1% from a year ago — the first year-over-year increase following 36 consecutive months of decreases.
Foreclosures rose from a year ago in 96 of the 219 metropolitan statistical areas, or 44% of the markets analyzed in the report; 33 of those areas posted their third straight monthly increase. A total of 30,187 U.S. properties started the foreclosure process for the first time in July, up 1 percent from the previous month and while the increase was less than 1% from a year ago, it marked the first annual increase in exactly 3 years.
21 states posted a year-over-year increase in foreclosure starts in July, including Florida (up 35 percent); California (up 3 percent); Texas (up 7 percent); Illinois (up 7 percent); and Ohio (up 2 percent).
Metro areas posting year-over-year increases in foreclosure starts in July included Los Angeles, California (up 20 percent); Houston, Texas (up 76 percent); Philadelphia, Pennsylvania (up 10 percent); Miami, Florida (up 29 percent); and San Francisco, California (up 10 percent).

“The increase in foreclosure starts is not just a one-month anomaly in many local markets given that July represented the third consecutive month with a year-over-year increase in 33 metro areas, including Los Angeles, Miami, Houston, Detroit, San Diego and Austin,” said Daren Blomquist, senior vice president with ATTOM Data Solutions.
“Gradually loosening lending standards over the past few years have introduced a modicum of risk back into the housing market, and that additional risk is resulting in rising foreclosure starts in a diverse set of markets across the country. Most susceptible to rising foreclosure starts are affordability-challenged markets where home buyers are more financially stretched and markets with some type of trigger event such as a natural disaster or large-scale layoffs.”
The data comes shortly after a separate report found that there has been a plunge of sales in ultra-luxury real estate in New York City, where apartments that cost $5 million or more have seen their sale plunge more than 31% in the first 6 months of the year.
The surprising reversal in the US housing sector comes at a time when the US economy is reportedly firing on all four cylinders, with the stock market at all time highs and not long after the Department of Commerce revised income and spending data to “discover” that US households had actually saved twice as much as previously expected. Which begs the question: is the rise in interest rates a sufficiently adverse development to offset all the other favorable trends in the economy, or is something more sinister – and unknown – taking place in the US economy.
As a reminder it is housing – and not financial markets or stocks – that has traditionally been the most relevant, and aspirational, asset for the US middle class and as such is the best indicator of economic prosperity (or lack thereof) for a majority of the US population. And recent trends are anything but optimistic.
After June’s dismal US housing data, hope was high for a rebound in July but it was crushed as existing home sales tumbled 0.7% MoM (against expectations of a 0.4% jump). This is the longest streak of declines since the taper tantrum in 2013.

As lower-priced home sales collapsed…

This is the weakest SAAR existing home sales (5.34mm) since Feb 2016…

The median sales price increased 4.5% YoY to $269,600, but dipped MoM (seasonal norm)

Lawrence Yun, NAR chief economist, says the continuous solid gains in home prices have now steadily reduced demand.
“Led by a notable decrease in closings in the Northeast, existing home sales trailed off again last month, sliding to their slowest pace since February 2016 at 5.21 million,” he said.
“Too many would-be buyers are either being priced out, or are deciding to postpone their search until more homes in their price range come onto the market.”
“In addition to the steady climb in home prices over the past year, it’s evident that the quick run-up in mortgage rates earlier this spring has had somewhat of a cooling effect on home sales,” said Yun.
“This weakening in affordability has put the most pressure on would-be first-time buyers in recent months, who continue to represent only around a third of sales despite a very healthy economy and labor market.”
Total housing inventory at the end of July decreased 0.5 percent to 1.92 million existing homes available for sale (unchanged from a year ago). Unsold inventory is at a 4.3-month supply at the current sales pace (also unchanged from a year ago).
And finally a glance at the following chart shows that the US housing market is in freefall – not what record high stocks would suggest…

Perhaps this helps explain it – Sentiment for Home-Buying Conditions are the worst since the infamous Lehman Brothers collapse …


WASHINGTON, DC – Expectations for 2017 economic growth remain at 2.0 percent amid a projected second half slowdown, according to the Fannie Mae Economic & Strategic Research (ESR) Group’s July 2017 Economic and Housing Outlook. With the expansion having entered its ninth year, incoming data point to a second quarter economic growth rebound to 2.7 percent annualized, up from 1.4 percent in the first quarter. However, the full percentage point rise in the saving rate since December signals increased caution among consumers, despite elevated consumer confidence. Decelerating corporate profit growth, commonly seen in the late stages of an expansion, presents a challenge to business investment that is compounded by tax policy uncertainty. In addition, residential investment will likely contribute less to second half growth due to lackluster homebuilding activity and tight for-sale inventory that is restraining home sales. Consequently, se cond half growth is expected to slow slightly to 1.9 percent. Moderate growth is expected to continue in 2018, with potential changes to fiscal and monetary policy posing both upside and downside risks to the forecast.
“While second quarter growth is poised to rebound, we expect growth to moderate through the remainder of 2017. Consumer spending, traditionally the largest contributor to economic growth, is sluggish and is lagging positive consumer sentiment and solid hiring,” said Fannie Mae Chief Economist Doug Duncan. “While labor market slack continues to diminish, wage growth is not accelerating and inflation has moved further below the Fed’s target. These conditions support our call that the Fed will continue gradual monetary policy normalization, announce its balance sheet tapering policy in September, and wait until December for additional data, especially on inflation, before raising the fed funds rate for the third time this year.”
“Construction activity has lost some steam following the first quarter’s weather-driven boost,” Duncan continued. “Meanwhile, very lean inventory continues to act as a boon for home prices and a bane for affordability, particularly among potential first-time homeowners. According to our second quarter Mortgage Lender Sentiment Survey, lenders expect to ease credit standards further. However, we continue to project that the pace of growth in total home sales will slow to 3.3 percent this year, as we believe rapid home price gains amid scarce supply will remain a hurdle for potential homebuyers despite improvements in credit access.”
Visit the Economic & Strategic Research site at www.fanniemae.com to read the full July 2017 Economic Outlook, including the Economic Developments Commentary, Economic Forecast, Housing Forecast, and Multifamily Market Commentary. To receive e-mail updates with other housing market research from Fannie Mae’s Economic & Strategic Research Group, please click here.

Following a flurry of home sales in November, the total number of homes for sale in December declined to a three-year low, according to data provided by Redfin.
“Prospective sellers were hesitant to list last month,” said Redfin Chief Economist Nela Richardson. “Many of them are also buyers, and two transactions are much harder to pull off in a fast-paced, low-inventory environment than one. We expect sellers to list early in 2017, not only to make top dollar from eager buyers, but also to be in a position to act quickly when it comes time to make their next home purchase.”
Redfin receives current and local data from its agents positioned throughout the country. This allows the firm to have a comprehensive view of general real-estate trends unfolding within the markets it covers.
When compared to November, the number of new listings for December decreased by 26.8 percent. December’s median home price was about 276,000, which represents a 4.7 percent increase over the previous year. Furthermore, the median amount of days for which a home was listed on the market before going under contract was 54, which is the fastest rate for any December since Redfin began tracking the data in 2010.
“We’ve never before seen homes turn over so quickly at a national level,” Richardson said. She also noted that December’s data was rather surprising given existing conditions such as a new president-elect, higher mortgage rates, and low home inventory.
The low inventory should continue to cause an upward movement in the prices of homes in2017, with some regions experiencing higher growth than others.
Seattle was the quickest region for home sales, as half of all homes listed on the market were pending a sale within 19 days. Seattle also had the highest home price growth, increasing by a rate 14.8 percent since 2015.
While the single-family housing stagnation continues, multi-family, or rental, housing starts and permits jumped in the month of July according to the latest Census data.

In the latest month, housing starts rose by 2.1% from June, and were higher by 5.6% from a year ago, rising to 1.211MM, above the 1.180MM expected, driven by a 33K jump in rental unit starts, which rose to 433K, while single-family units remained largely unchanged at 770K, up 0.5% from last month’s 766K. As the chart below shows, single-family start have barely budged in the past year even as rental units appear to once again be growing at a solid pace.

On an annual basis, the rate of change continues to hug the flat line, and after last month’s modest decline, starts rose by 5.6% in the latest month.

Meanwhile, the more important building permits data series, fell modestly to 1.152MM in July from 1.160MM in June, on top of the 1.153MM expected.

While these series are notoriously volatile, if indeed multi-family housing is picking up it could provide a modest ray of hope for America’s renters who continue to suffer under record high asking rents, in part due to a lack of supply. Then again, it depends who ends up being the ultimate owner of these buildings, and if the units end up controlled by Wall Street it is likely that there will be no respite from record high rates any time soon as the “curtailing” of supply is set to continue for the indefinite future.

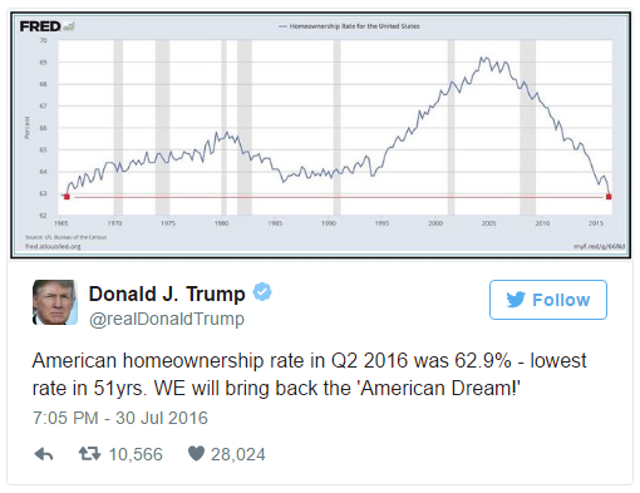
As you probably assumed anyway, due to Betteridge’s Law, we aren’t currently in a homeownership trough. The recent homeownership rate posting of 62.9% for the second quarter of 2016 is not the lowest in history, nor is it even the lowest in recorded US history. However, it is the lowest post in 51 years(!) – not since the third quarter of 1965 have we seen homeownership rates this low.
And why are we at DQYDJ bothering to look now?
Donald Trump, the Republican nominee for President sent this Tweet a couple days back:
The History of the Home Ownership Rate
A while back, we did a two-part deep dive into the history of the 30 year mortgage and the history of the (recorded) home ownership rate in America. That research dug up some very interesting information.
First, long-dated mortgages of 15, 20 and longer years started in the mid 1930s. Second, private mortgage insurance (which was mostly done in by the Great Depression) started up in 1957 with the Mortgage Guaranty Insurance Company.
Those innovations brought homeownership to the masses – no longer did you have to be able to afford a huge, short-term loan with a massive down payment. Extending Mr. Trump’s graph back to 1890 you can see the effect of the innovations (and of the Great Depression and Recession) on homeownership rates:
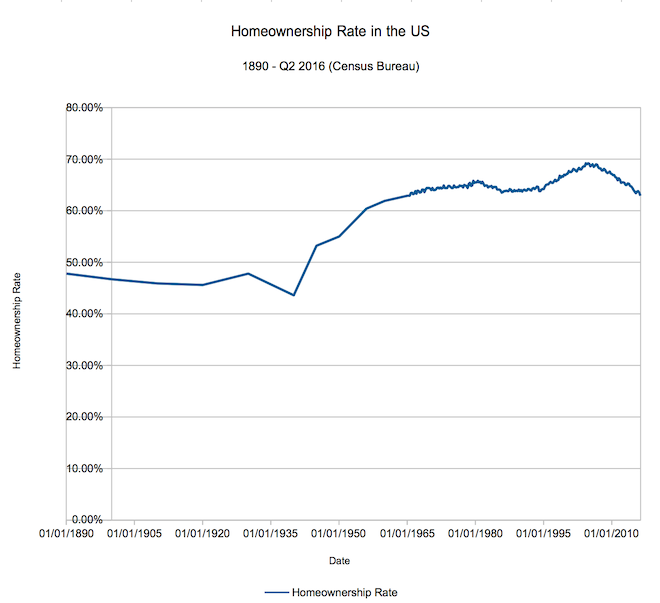
(Note that until the 60s there wasn’t as much resolution in the series – see our historical research for details).
The longer dated series lets us state a few interesting facts:
Why Is the Home Ownership Rate Dipping?
Oh, you won’t accept ‘people are renting more’ as an answer?
Yes, the run up in real estate prices in many areas of the country (so soon after the Great Recession!) is a huge factor. But, so too are the massive demographic changes underway in our country.
As we have pointed out many times, the millennials (of which I count myself as an older member) now makeup roughly 25% of the workforce. Millennials have different living arrangements than past generations – a greater propensity to live at home, a seeming desire to be free to change jobs (and areas!) more often, and, yes, more expensive housing options. That last point, of course, prices many millennials out of the market – renting makes much more sense when you look at the home prices in many metros in the United States.
Can It Change? Will We See the Rate Rise Again?
Yes – as of right now, I don’t see the drive towards renting (and living at home) to be a sort of permanent desire. Already there are countering trends – the so-called “Tiny House” movement one of them (and, yes, I have been searching for a place to name-drop it!). It’s safest, at this point in time, to assume millennials will tend to be similar to their parents – eventually leaving the city to marry, have kids and buy homes. You know, like yours truly.
However, we’re looking into the future here. Marriage is trending towards being an institution for older and older couples, along with kids. If these trends keep up, we might start to get into uncharted territory here – I’d love your input on whether you think homeownership rates will recover, or high-60s was an anachronism.
Will we see an increase in homeownership led by the millennials?
On the heels of the 17-sigma beat in new home sales, pending home sales soared 5.1% MoM in April – 6.5 standard deviations above economist estimates of a 0.7% jump. Pending home sales rose for the third consecutive month in April and reached their highest level in over a decade, according to the National Association of Realtors. All major regions saw gains in contract activity last month (with The West surging 11.5% MoM) except for the Midwest, which saw a meager decline.
Best month since 2010…

Which no one saw coming…. Some context for the “beat”…

Lawrence Yun, NAR chief economist, says vast gains in the South and West propelled pending sales in April to their highest level since February 2006 (117.4).
“The ability to sign a contract on a home is slightly exceeding expectations this spring even with the affordability stresses and inventory squeezes affecting buyers in a number of markets,” he said. “The building momentum from the over 14 million jobs created since 2010 and the prospect of facing higher rents and mortgage rates down the road appear to be bringing more interested buyers into the market.”
Yun expects sales this year to climb above earlier estimates and be around 5.41 million, a 3.0 percent boost from 2015. After accelerating to 6.8 percent a year ago, national median existing-home price growth is forecast to slightly moderate to between 4 and 5 percent.
 The usually strong spring housing market could be far stronger this year, if only there were more homes for sale.
The number of listings continues to drop, as demand outstrips supply and potential sellers bow out, fearing they won’t be able to find something else to buy.
The inventory of homes for sale nationally in April was 3.6 percent lower than in April 2015, according to the National Association of Realtors. Redfin, a real estate brokerage, also recently reported a drop in new listings.
The supply numbers are even tighter in certain local markets: Inventory is down 32 percent in Portland, Oregon, from a year ago; down 22 percent in Kansas City; down 21 percent in Dallas and Seattle; down 17 percent in Charlotte, North Carolina; down 12 percent in Atlanta; down nearly 10 percent in Chicago; and down 8 percent in Los Angeles, according to Zillow. Houston and Miami are seeing big gains in supply, due to economic issues specific to those markets.
“The struggle will continue for home shoppers this summer,” said Zillow chief economist Svenja Gudell. “New construction has been sluggish over the past year; we’re building about half as many homes as we should be in a normal market. There still aren’t enough homes on the market to keep up with the high demand from every type of home buyer.”
The short supply is pushing home prices higher than expected this year. Zillow had predicted 2 percent growth in home values from April 2015 to April 2016, but its latest data show values currently soaring more than twice that, at 4.9 percent.
“In many markets, those looking to buy a home in the bottom or middle of the market will need to be prepared for bidding wars and homes selling for over the asking price. This summer’s selling season’s borders will most likely be blurred again, as many buyers are left without homes and will need to keep searching,” added Gudell.
The inventory drops are most severe in the lower-priced tier of the market. Homes in the top tier are seeing gains and therefore show more price cuts. Sixteen percent of top-tier homes had a price cut over the past year, compared with 11 percent of bottom-tier homes and 13 percent of middle-tier, according to Zillow.
 Single-family existing home sales rose just 0.6% MoM in April with The South and The West regions seeing notable declines in sales (down 2.7% and down 1.7% respectively). What saved the headline print was a 10.3% surge in Condo sales – among the best monthly spikes since the crisis helped by a spike in sales in The Midwest – where prices are most affordable.
Condos saved the day:

While supply of single-family homes is rising, the demand was again all on condos:

The median price of existing homes:

Single-family home sales inched forward 0.6 percent to a seasonally adjusted annual rate of 4.81 million in April from 4.78 million in March, and are now 6.2 percent higher than the 4.53 million pace a year ago. The median existing single-family home price was $233,700 in April, up 6.2 percent from April 2015.
Existing condominium and co-op sales jumped 10.3 percent to a seasonally adjusted annual rate of 640,000 units in April from 580,000 in March, and are now 4.9 percent above April 2015 (610,000 units). The median existing condo price was $223,300 in April, which is 6.8 percent above a year ago.
Lawrence Yun, NAR chief economist, says April’s sales increase signals slowly building momentum for the housing market this spring.
“Primarily driven by a convincing jump in the Midwest, where home prices are most affordable, sales activity overall was at a healthy pace last month as very low mortgage rates and modest seasonal inventory gains encouraged more households to search for and close on a home,” he said.
“Except for in the West — where supply shortages and stark price growth are hampering buyers the most — sales are meaningfully higher than a year ago in much of the country.”
Regionally, the story is very mixed…

The West is exhibiting a notable trend with low-end sales plunging and higher-end rising…

Which price buckets saw the most transactions:

And Y/Y transactions by bucket:

The NAR’s chief economy Larry Yun warns again:
“The temporary relief from mortgage rates currently near three-year lows has helped preserve housing affordability this spring, but there’s growing concern a number of buyers will be unable to find homes at affordable prices if wages don’t rise and price growth doesn’t slow.”
Finally, it is worth noting that since the data was better than expected, there was no scapegoating of “weather” this time.
 Unlike recent months when the Census Bureau reported some fireworks in the New Housing Starts and Permits data, the April update was relatively tame, and saw Starts rise from an upward revised 1,099K to 1,172K, beating expectations of a 1,125K print, mostly as a result of a 36K increase in multi-family units which however remain depressed below recent peaks from early 2015, which will likely stoke even higher asking rents, already at record highs across the nation.

But if starts were better than expected, then the future pipeline in the form of Housing Permits disappointed, with 1,116K units permitted for the month of April, below the 1,135K expected, if a rebound from last month’s downward revised 1,077K.

The issue, as with the starts data, is the multi-family, aka rental units, barely rebounded and remained at severely depressed levels last seen in 2013: at 348K rental units permitted in April, this is a far cry from the recent highs of 598K in June.
One wonders if this is intentional, because based on soaring asking rents, as shown in the chart below, with Americans increasingly unable or unwilling to buy single-family units, rental prices have exploded to 8% Y/Y based on Census data.


Should multi-family permits and starts remain as depressed as it has been in recent months, we expect that this chart of soaring median asking rents will only accelerate in the near future, and will require a whole host of seasonal adjustments from making its way into the already bubbly CPI data.
 Purchases of new homes unexpectedly declined in March for a third month, reflecting the weakest pace of demand in the West since July 2014.
Total sales decreased 1.5% to a 511,000 annualized pace, a Commerce Department report showed Monday. The median forecast in a Bloomberg survey was for a gain to 520,000. In Western states, demand slumped 23.6%.
Purchases rose in two regions last month, indicating uneven demand at the start of the busiest time of the year for builders and real estate agents. While new construction has been showing limited upside, cheap borrowing costs and solid hiring will help ensure residential real estate continues to expand.
“Housing is certainly not booming,” Jim O’Sullivan, chief U.S. economist at High Frequency Economics Ltd. in Valhalla, N.Y., said before the report. “Some people may be shut out of the market because lending standards are still tight. There may still be some reluctance to buy versus rent.”
Even so, “through the volatility, the trend is still more up than down, and we expect modest growth in sales,” he said.
Economists’ estimates for new-home sales ranged from 488,000 to 540,000. February purchases were revised to 519,000 from 512,000. The monthly data are generally volatile, one reason economists prefer to look at longer term trends.
The report said there was 90% confidence the change in sales last month ranged from a 13.5% drop to a 16.5% increase.
Sales in the West declined to a 107,000 annualized rate in March after surging 21.7% the previous month to 140,000. In the South, purchases climbed 5% to a 314,000 pace in March, the strongest in 13 months. Sales in the Midwest advanced 18.5%, the first gain in three months, and were unchanged in the Northeast.
The median sales price decreased 1.8% from March 2015 to $288,000.
There were 246,000 new houses on the market at the end of March, the most since September 2009. The supply of homes at the current sales rate rose to 5.8 months, the highest since September, from 5.6 months in the prior period.
From a year earlier, purchases increased 5.8% on an unadjusted basis.
New-home sales, which account for less than 10% of the residential market, are tabulated when contracts get signed. They are generally considered a timelier barometer of the residential market than purchases of previously owned dwellings, which are calculated when a contract closes, typically a month or two later.
Borrowing costs are hovering close to a three-year low, helping to bring house purchases within the reach of more Americans. The average rate for a 30-year fixed mortgage was 3.59% last week, down from 3.97% at the start of the year, according to data from Freddie Mac.
The job market is another source of support. Monthly payrolls growth averaged 234,000 in the past year, and the unemployment rate of 5% is near an eight-year low. Still, year-over-year wage gains have been stuck in a 2% to 2.5% range since the economic expansion began in mid-2009.
The market for previously owned homes improved last month, climbing 5.1% to a 5.33 million annualized rate, the National Association of Realtors reported April 20. Prices rose as inventories remained tight.
Even so, the market is getting little boost from first-time buyers, who accounted for 30% of all existing-home purchases, a historically low share, according to the group.
Recent data on home building has been less encouraging, although those figures are volatile month to month. New-home construction slumped in March, reflecting a broad-based retreat, a Commerce Department report showed last week. Home starts fell 8.8% to the weakest annual pace since October. Permits, a proxy for future construction, also unexpectedly dropped.
While the outlook for overall economic growth is darkening, the housing market is expected to keep up its momentum in 2016, according to Freddie Mac’s April 2016 Economic Outlook released on Friday.
Freddie Mac revised downward its forecast for Q1 GDP growth from 1.8 percent down to 1.1 percent. The “advance” estimate for GDP growth in the first quarter will be released by the Bureau of Economic Analysis (BEA) on Thursday, April 28. The GDP grew at an annual rate of just 0.6 percent in the first quarter of 2015 but then shot up to 3.9 percent for Q2; for the third and fourth quarter, the real GDP grew at rates of 2.0 percent and 1.4 percent, respectively.
The first quarter for the last few years has been punctuated by slow economic growth. While some of this can be attributed to seasonality, Ten-X (then Auction.com) Chief Economist Peter Muoio said that last year’s dismal GDP showing in the first quarter could be attributed to the brutal winter which slowed economic activity, labor disagreements at a bunch of the West Coast ports that really slowed the flow of cargo in Q1, and low oil prices (though this was partially offset by lower gas prices which put more money in consumers’ pockets).
“We’ve revised down our forecast for economic growth to reflect the recent data for the first quarter, but our outlook for the balance of the year remains modestly optimistic for the economy,” Freddie Mac Chief Economist Sean Becketti said. “However, we maintain our positive view on housing. In fact, the declines in long-term interest rates that accompanied much of the recent news should increase mortgage market activity, particularly refinance.”
On the positive side, Freddie Mac expects the unemployment rate will fall back below 5 percent for 2016 and 2017 (last month it ticked back up to 5.0 percent after hovering at 4.9 percent for a couple of months). Reduced slack in the labor market will push wage gains above inflation, although the gains are expected to be only modest, according to Freddie Mac.
While the economic forecast for Q1 has grown darker, the forecast looks bright for housing in 2016, however.
“We expect housing to be an engine of growth,” Freddie Mac stated in the report. “Construction activity will pick up as we enter the spring and summer months, and rising home values will bolster consumers and help support renewed confidence in the remaining months of this year.”

Low mortgage rates have boosted refinance activity in the housing market during Q1. The 30-year fixed mortgage rate averaged 3.7 percent for the first quarter, which drove an increase for the 1-4 single-family originations estimate for 2016 up by $50 billion up to $1.7 billion. Rates are expected to bump up, however, and average 4 percent over the full year of 2016, according to Freddie Mac. House prices are expected to appreciate by 4.8 percent over 2016 and 3.5 percent for 2017; homeowner equity is expected to rise as a result of the home price appreciation, which could mean more refinance opportunities.
The low mortgage rates combined with solid job growth are expected to make 2016 the strongest year for home sales since the pre-crisis year of 2006 despite the persistently tight inventory of for-sale homes, according to Freddie Mac.
“Sales were slow in the first quarter, but trends in mortgage purchase applications remain robust and we expect home sales to accelerate throughout the second quarter of 2016 as we approach peak home buying season,” Freddie Mac said.
Click here to view the entire Freddie Mac Economic Outlook for April 2016.
 The pessimists are already talking about 3% inflation later this year if energy prices don’t retreat. Most likely, Federal Reserve monetary experimentation will inflict a new great inflation on the U.S., although this is much more likely to occur in the next business cycle rather than the current one. Before that, we’ll get the shock of an economic slowdown — or even recession — which will exert some pause. So many households are right to ask whether their main asset will insulate them from this shock whenever it occurs. The answer from economic science is no.
House prices perform best during the asset-price inflation phase of the monetary cycle. During that period, low or zero rates stimulate investors to search for yield, which many do, shedding their normal skepticism. The growth in irrationality across many marketplaces is why some economists describe set price inflation as a “disease.” Usually, the housing and commercial real estate markets become infected by this disease at some stage.
Real estate markets are certainly not shielded from irrational forces. “Speculative stories” about real estate flourish and quickly gain popularity — whether it’s the ever-growing housing shortage in metropolitan centers; illicit money pouring into the top end from all over the world and high prices rippling down to lower layers of the market; or bricks and mortar (and land), the ultimate safe haven when goods and services inflation ultimately accelerates.
That last story defies much economic experience to the contrary. By the time inflation shock emerges, home prices have already increased so much in real terms under asset-price inflation that they cannot keep up with goods and services inflation, and may even fall in nominal terms. One thinks of the tale of the gold price in the Paris black market during World War II: prices hit their peak just before the Germans entered the city in May 1940 and never returned.
Real estate is only a hedge against high inflation if it is bought early on in the preceding asset-price inflation period. We can generalize this lesson. The arrival of high inflation is an antidote to asset-price inflation. That is, if it has not already reached its late terminal stage when speculative temperatures are falling across an array of markets.
To understand how home prices in real terms behave under inflation shock we must realize how, in real terms, they are driven by expectations of future rents (actual, or as given to homeowners); the cost of capital; and the profit from carry trade. All of these drivers have been operating in the powerful asset-price inflation phase the U.S. and many foreign countries have been experiencing during recent years.
Together they have pushed up the S&P Case Shiller national home price index to almost 20% above its long-run trend (0.6% each year since 1998), having fallen slightly below at its trough in 2011, and having reached a peak 85% above in 2006.
Let’s take the drivers in turn.
Rents are rising in many metropolitan centers.
The cost of equity is low, judging by high underlying price earnings ratios in the stock markets. Investors suffering from interest income famine are willing to put a higher price on future earnings, whether in the form of house rents or corporate profits, than they would do under monetary stability.
Leveraged owners of real estate can earn a handsome profit between rental income and interest paid, especially taking account of steady erosion of loan principal by inflation and tax deductions.
The arrival of high inflation would change all these calculations.
Cost of equity would rise as markets feared the denouement of recession, and reckoned with the new burden on economic prosperity. Long-term interest rates would climb starkly in nominal terms. Their equivalent in real terms would be highly volatile and unpredictable, albeit at first low in real terms (inflation-adjusted), meaning that carry trade income for leveraged owners would become elusive.
None of this is to suggest that a high inflation shock is likely in the second quarter. A sustained period of much stronger demand growth across an array of goods, services and labor markets would most likely have to occur first, and could be seen as early as the next cyclical upturn.
An economic miracle could bring a reprieve from inflation. But much more likely, the infernal inflation machine of expanding budget deficits and Fed experimentation will ultimately mow down any resistance in its way.
by Brendan Brown | National Mortgage News
Brendan Brown is an executive director and the chief economist of Mitsubishi UFJ Securities International.

Following the mid-aughts housing bubble that saw homeowners across the country get themselves upside down in homes and mortgages they couldn’t ever afford to repay — a crisis that was as much about too much supply as it was about too much bad financing — the market has gone the complete other direction.
First-time home buyers are crowded out, with Trulia’s chief economist Ralph McLaughlin writing Monday that the number of starter homes on the market has declined 43.6% in the last four years.
Homeowners that want to move from a starter home to something better can’t afford the next step. McLaughlin notes that the number of “trade-up” homes on the market is also down about 40% over the same period.
Meanwhile, mortgage lenders, despite record-low rates, are still reluctant to extend credit to less-than-superb borrowers.
And as investors look for places to earn whatever return on capital they can muster, the low-end of the housing market has almost ceased to exist as the investor class has bought up homes with the plan to flip them.
On Monday, the latest report on existing home sales showed the pace of sales fell 7.1% to an annualized rate of 5.08 million in February. Compared to last year, the pace of sales is still up 2.2% from a year ago.
Additionally, this report showed that sales to individual investors — or buyers who intend on flipping the home for a profit — accounted for 18% of existing homes sold in February, the highest share since April 2014. Almost two-thirds of these buyers paid cash.
Also in Monday’s report, commentary from Lawrence Yun, chief economist for the National Association of Realtors — which publishes the existing home sales report — showed the kind of crisis the housing market is facing.
“The lull in contract signings in January from the large East Coast blizzard, along with the slump in the stock market, may have played a role in February’s lack of closings,” Yun said Monday.
“However, the main issue continues to be a supply and affordability problem. Finding the right property at an affordable price is burdening many potential buyers.”
Yun added that, “The overall demand for buying is still solid entering the busy spring season, but home prices and rents outpacing wages and anxiety about the health of the economy are holding back a segment of would-be buyers.”
This chart from Bank of America Merrill Lynch, which we highlighted earlier this month, captures the dynamic Yun is talking about here.
In our latest Most Important Charts collection, Scott Buchta, a fixed income strategist at Brean Capital, argued that existing and new home sales are often incorrectly conflated as joint indicators on the health of the housing market.
Existing home sales, even with Monday’s drop, are still roughly near pre-crisis levels. This argues that in a healthy housing market we’re looking at something like 5 million already-built homes being sold in a given year, more or less.
New home sales, on the other hand, have been a major laggard.
“In our view, the recovery in existing home sales has been led by rising home prices, which has brought additional supply into the market,” Buchta noted. This view which is consistent with the increase in investors buying existing homes as well as the high number of cash-only sales, which accounted for 25% of transactions in February.
“The lag in new home sales, on the other hand, is more reflective of the economy as a whole and has been adversely impacted by sluggish wage growth and tight credit windows.”
Buchta’s colleague at Brean Capital, Peter Tchir, also hammered on this idea of new home sales as reflecting economic trends that have persisted since the crisis — slow wage growth, rampant concern about the future, and an under built low-end housing market have all kept renters renting.
If we take the view that the jobs currently being created aren’t that great — which is another argument for another post — then what we’re going to see is a rising class of renters.
“These low paying jobs are not the type of job that are conducive to buying a home,” Tchir wrote.
“The first problem is saving for the down payment – a Herculean task in itself. The second problem, and the one that I think is addressed less frequently, is who really wants to commit to an area when the job isn’t that good and may not be stable?”
And if we consider that the economy is, as much as anything, a confidence game, the reality is that instability and imminent collapse have been the dominant psychological themes for both consumers and investors since the crisis.
So we can hit on the theme that the US economy is not heading for recession time and time again, but there is a reason Donald Trump is leading in the Republican polls: people do not believe in this economy.
The upshot here is that with more folks renting and the labor market recovering faster than the housing market, we’re suddenly looking at a new class of well-employed, would-be home buyers relegated to renting… and paying ever-increasing rents.
And this is likely to manifest itself in more inflation, something we’ve noted has been a fast-growing trend in the US economy despite the Federal Reserve’s clear talking-down of this recent move in last week’s policy announcement.
 FRED
FRED
Earlier this month we highlighted commentary from New River Investments’ Conor Sen who said, among other things, that the housing market has simply been under built following the crisis and is ill-prepared to handle the coming wave of millennial households that will be formed over the next several decades.
Home prices may increase and as an investment — not a place to live — buying houses may still be attractive for some time to come.
But demand for housing is not going away and will only get stronger.
Millennials are growing up and despite all the trend-piece fanfare suggesting otherwise, will be just like their parents: Millennials will have kids, move to the suburbs, and want to buy a house.
The problem is there might not be enough houses, at the right price points, to go around.

Shadows from the financial crisis and Great Recession still linger in Americans’ personal finances, researchers at the New York Fed found.
Mortgage debt outstanding nearly doubled in the period from 2000 and 2006, but has risen only about 1% since 2012, according to data compiled in the regional bank’s quarterly report on household debt and crisis.
Put another way, in 2008 just as the subprime crisis was coming to a head, Americans had $12.68 trillion in debt outstanding, of which housing debt made up $10 trillion, or 79% of the total. In the fourth quarter of 2015, there was $12.12 trillion in total debt, and housing’s share had dwindled to 72%, or $8.74 trillion.
One of the biggest contributors to the decline in mortgage debt is that Americans aren’t taking equity out of their homes at nearly the same rate as in the prior decade. Cash-out refinances and home equity lines of credit rose at a rate of more than $300 billion every year from 2003-2007. In 2015, such debt grew only by $30 billion.
“In fact,” the researchers note on their blog, “the small amount of cash-out refi going on is almost completely offset by people repaying second mortgages and HELOCs.”
But it’s not just a newfound frugality that’s keeping a lid on mortgage debt. The pace of home buying has slowed even as Americans are paying down their home loans.
The total amount paid against mortgage debt in 2015 was $288 billion, or 3.5% of the total outstanding. The last time the total amount of mortgage debt outstanding was $8.25 trillion was 2006, the height of the boom, the researchers noted. That year, consumers paid down only $170 billion, or 2.1% of the balance.
In recent years, much of the pay down has come thanks to lower interest rates. New mortgages are being lent with lower rates, and existing homeowners have been refinancing. The researchers also note that as credit standards have remained tight, most new mortgages are going to people with excellent credit, enabling them to pay lower rates.
Those factors have taken the weighed average interest rate on the outstanding mortgage debt balance from 7.65% in 2000 to 3.85% in 2015.
There’s another factor contributing to the higher pace of pay downs. The existing inventory of mortgage debt outstanding has aged significantly over the past decade as the pace of buying and selling slowed. That means mortgage payments are further along in their amortization process and principal, rather than interest, is being paid down.
Since 2008, the researchers note, aggregate mortgage payments have fallen 8% but principal payments have risen 41%.
The shrinking mortgage debt is a good thing, the New York Fed researchers conclude. Principal pay-down is a form of saving for borrowers, so in the face of rising home prices this means strengthening balance sheets for mortgagors. This is important, of course, as we learned in 2008 just how crucial household debts can be.
But some analysts worry that Americans’ equity is too concentrated in real estate assets. Another lesson from the 2008 crisis is that it can be very dangerous when the price of those assets plummets.
by Andrea Riquier for MarketWatch
 The rise in rents and home prices is adding additional pressure to the bottom line of most California families. Home prices have been rising steadily for a few years largely driven by low inventory, little construction thanks to NIMBYism, and foreign money flowing into certain markets. But even areas that don’t have foreign demand are seeing prices jump all the while household incomes are stagnant. Yet that growth has hit a wall in 2016, largely because of financial turmoil. We’ve seen a big jump in the financial markets from 2009. Those big investor bets on real estate are paying off as rents continue to move up. For a place like California where net home ownership has fallen in the last decade, a growing list of new renter households is a good thing so long as you own a rental.
The problem of course is that household incomes are not moving up and more money is being siphoned off into an unproductive asset class, a house. Let us look at the changing dynamics in California households.
More renters
Many people would like to buy but simply cannot because their wages do not justify current prices for glorious crap shacks. In San Francisco even high paid tech workers can’t afford to pay $1.2 million for your typical Barbie house in a rundown neighborhood. So with little inventory investors and foreign money shift the price momentum. With the stock market moving up nonstop from 2009 there was plenty of wealth injected back into real estate. The last few months are showing cracks in that foundation.
It is still easy to get a mortgage if you have the income to back it up. You now see the resurrection of no money down mortgages. In the end however the number of renter households is up in a big way in California and home ownership is down:
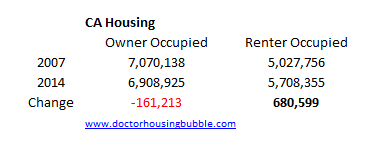
Source: Census
So what we see is that since 2007 we’ve added more than 680,000 renter households but have lost 161,000 owner occupied households. At the same time the population is increasing. When it comes to raw numbers, people are opting to rent for whatever reason. Also, just because the population increases doesn’t mean people are adding new renter households. You have 2.3 million grown adults living at home with mom and dad enjoying Taco Tuesdays in their old room filled with Nirvana and Dr. Dre posters.
And yes, with little construction and unable to buy, many are renting and rents have jumped up in a big way in 2015:
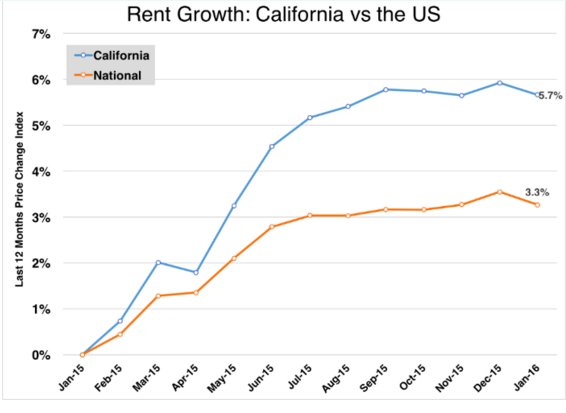
Source: Apartmentlist.com
This has slowed down dramatically in 2016. It is hard to envision this pace going on if a reversal in the economy hits (which it always does as the business cycle does its usual thing).
Home ownership rate in a steep decline
In the LA/OC area home prices are up 37 percent in the last three years:
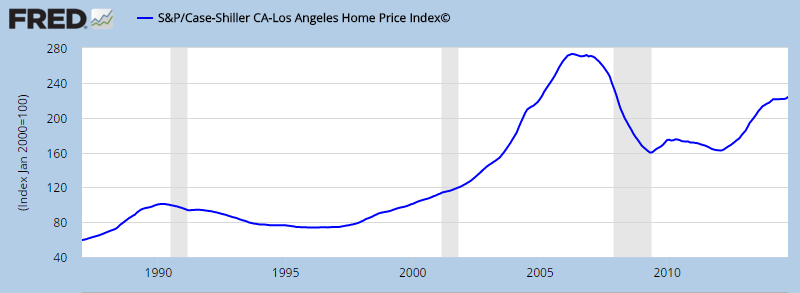
Of course there are no accompanying income gains. If you look at the stock market, the unemployment rate, and real estate values you would expect the public to be happy this 2016 election year. To the contrary, outlier momentum is massive because people realize the system is rigged and are trying to fight back. Watch the Big Short for a trip down memory lane and you’ll realize nothing has really changed since then. The house humping pundits think they found some new secret here. It is timing like buying Apple or Amazon stock at the right time. What I’ve seen is that many that bought no longer can afford their property in a matter of 3 years! Some shop at the dollar store while the new buyers are either foreign money or dual income DINKs (which will take a big hit to their income once those kids start popping out). $2,000 a month per kid daycare in the Bay Area is common.
If this was such a simple decision then the home ownership rate would be soaring. Yet the home ownership rate is doing this:
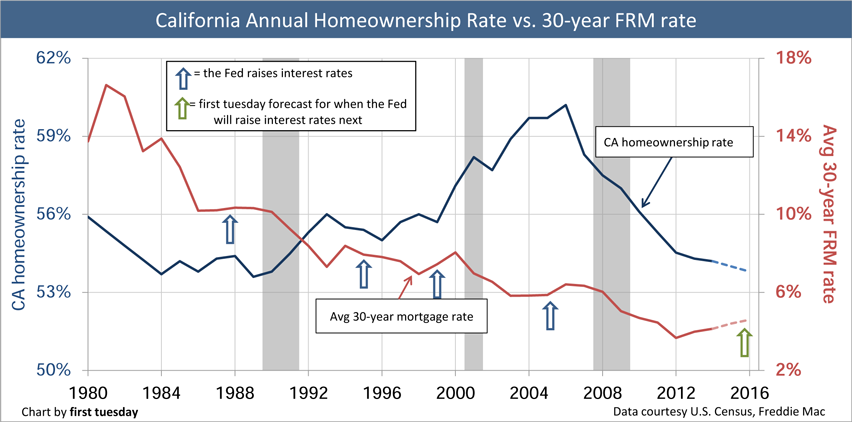
In the end a $700,000 crap shack is still a crap shack. That $1.2 million piece of junk in San Francisco is still junk. And you better make sure you can carry that housing nut for 30 years. For tech workers, mobility is key so renting serves more as an option on housing versus renting the place from the bank for 30 years. Make no mistake, in most of the US buying a home makes total sense. In California, the massive drop in the home ownership rate shows a different story. And that story is the middle class is disappearing.
 Two days ago, I published a post explaining how the super high end real estate bubble had popped, and how signs of this reality have emerged across America. Here’s an excerpt from that post, The Luxury Housing Bubble Pops – Overseas Investors Struggle to Sell Overpriced Mansions:
The six-bedroom mansion in the shadow of Southern California’s Sierra Madre Mountains has lime trees and a swimming pool, tennis courts and a sauna — the kind of place that would have sold quickly just a year ago, according to real estate agent Kanney Zhang.
Not now.
Zhang is shopping it for a discounted $3.68 million, but nobody’s biting. Her clients, a couple from China, are getting anxious. They’re the kind of well-heeled international investors who fueled a four-year luxury real estate boom that helped pull America out of its worst housing slump since the 1930s. Now the couple is reeling from the selloff in the Chinese stock market and looking to raise cash to shore up finances.
In the Los Angeles suburb of Arcadia, where Zhang is struggling to sell the six-bedroom home, dozens of aging ranch houses were demolished to make way for 38 mansions built with Chinese buyers in mind. They have manicured lawns and wok kitchens and are priced as high as $12 million. Many of them sit empty because the prices are out of the range of most domestic buyers, said Re/Max broker Rudy Kusuma, who blames a crackdown by the Chinese on large sums leaving the country.
Well, I have some more bad news for mansion-flipping Chinese nationals.
From Reuters:
Europe’s biggest lender HSBC will no longer provide mortgages to some Chinese nationals who buy real estate in the United States, a policy change that comes as Beijing is battling to stem a swelling crowd of citizens trying to get money out of China.
An HSBC spokesman in New York told Reuters on Wednesday that the new policy went into effect last week, roughly a month after China suspended Standard Chartered and DBS Group Holdings Ltd from conducting some foreign exchange business and as authorities try to limit capital outflows.
Realtors of luxury property in cities like New York, Los Angeles, and Vancouver, said more than 80 percent of wealthy Chinese buyers have ties to China.
Luxury homes news website Mansion Global, which first reported the HSBC policy change, said it would affect Chinese nationals holding temporary visitor ‘B’ visas if the majority of their income and assets are maintained in China.
Meanwhile…
HSBC’s pivot away from lending to some Chinese nationals abroad comes as other international banks clamor to lend more to wealthy Chinese.
The Royal Bank of Canada scrapped its C$1.25 million cap on mortgages to borrowers with no local credit history last year in a bid to tap into surging demand for financing from wealthy immigrant buyers.
Collapse in crude oil prices is a huge blow to areas where oil extraction and associated industries are the bread and butter of the economy.
As petro-economies suffer from the bust in crude prices, the effects are showing up in the housing market.
Take North Dakota, for example, which was on the front lines of the oil boom between 2011 and 2014. In fact, North Dakota is probably the most vulnerable to a downturn in housing because of low oil prices. The economy is smaller and thus more dependent on the oil boom than other places, such as Texas. The state saw an influx of new workers over the past few years, looking for work in in the prolific Bakken Shale. A housing shortage quickly emerged, pushing up prices. With the inability to house all of the new people, rent spiked, as did hotel rates. The overflow led to a proliferation of “man camps.”
Now the boom has reversed. The state’s rig count is down to 53 as of January 13, about one-third of the level from one year ago. Drilling is quickly drying up and production is falling. “The jobs are leaving, and if an area gets depopulated, they can’t take the houses with them and that’s dangerous for the housing market,” Ralph DeFranco, senior director of risk analytics and pricing at Arch Mortgage Insurance Company, told CNN Money.
New home sales were down by 6.3 percent in North Dakota between January and October of 2015 compared to a year earlier. Housing prices have not crashed yet, but there tends to be a bit of a lag with housing prices. JP Ackerman of House Canary says that it typically takes 15 to 24 months before house prices start to show the negative effects of an oil downturn.
According to Arch Mortgage, homes in North Dakota are probably 20 percent overvalued at this point. They also estimate that the state has a 46 percent chance that house prices will decline over the next two years. But that is probably understating the risk since oil prices are not expected to rebound through most of 2016. Moreover, with some permanent damage to the balance sheets of U.S. shale companies, drilling won’t spring back to life immediately upon a rebound in oil prices.
There are some other states that are also at risk of a hit to their housing markets, including Wyoming, West Virginia and Alaska. Out of those three, only Alaska is a significant oil producer, but it is in the midst of a budget crisis because of the twin threats of falling production and rock bottom prices. Alaska’s oil fields are mature, and have been in decline for years. With a massive hole blown through the state’s budget, the Governor has floated the idea of instituting an income tax, a once unthinkable idea.
The downturn in Wyoming and West Virginia has more to do with the collapse in natural gas prices, which continues to hollow out their coal industries. Coal prices have plummeted in recent years, and coal production is now at its lowest level since the Reagan administration. Shale gas production, particularly in West Virginia, partially offsets the decline, but won’t be enough to come to the state’s rescue.
Texas is another place to keep an eye on. However, Arch Mortgage says the economy there is much larger and more diversified than other states, and also better equipped to handle the downturn than it was back in the 1980s during the last oil bust.
But Texas won’t escape unscathed. The Dallas Fed says job growth will turn negative in a few months if oil prices don’t move back to $40 or $50 per barrel. Texas is expected to see an additional 161,200 jobs this year if oil prices move back up into that range. But while that could be the best-case scenario, it would still only amount to one-third of the jobs created in 2014. “The biggest risk to the forecast is if oil prices are in the range of $20 to $30 for much of the year,” Keith Phillips, Dallas Fed Senior Economist, said in a written statement. “Then I expect job growth to slip into negative territory as Houston gets hit much harder and greater problems emerge in the financial sector.”
After 41 consecutive months of increases in house prices in Houston, prices started to decline in third quarter of 2015. In Odessa, TX, near the Permian Basin, home sales declined by 10.6 percent between January and October 2015 compared to a year earlier.
Most Americans will still welcome low prices at the pump. But in the oil boom towns of yesterday, the slowdown is very much being felt.
By Nick Cunningham in ZeroHedge

Mortgage delinquency rates are low as long as home prices are soaring since you can always sell the home and pay off the mortgage, or most of it, and losses for lenders are minimal. Nonbank lenders with complicated corporate structures backed by a mix of PE firms, hedge funds, debt, and IPO monies revel in it. Regulators close their eyes because no one loses money when home prices are soaring. The Fed talks about having “healed” the housing market. And the whole industry is happy.
The show is run by some experienced hands: former executives from Countrywide Financial, which exploded during the Financial Crisis and left behind one of the biggest craters related to mortgages and mortgage backed securities ever. Only this time, they’re even bigger.
PennyMac is the nation’s sixth largest mortgage lender and largest nonbank mortgage lender. Others in that elite club include AmeriHome Mortgage, Stearns Lending, and Impac Mortgage. The LA Times:
All are headquartered in Southern California, the epicenter of the last decade’s subprime lending industry. And all are run by former executives of Countrywide Financial, the once-giant mortgage lender that made tens of billions of dollars in risky loans that contributed to the 2008 financial crisis.
 During their heyday in 2005, non-bank lenders, often targeting subprime borrowers, originated 31% of all home mortgages. Then it blew up. From 2009 through 2011, non-bank lenders originated about 10% of all mortgages. But then PE firms stormed into the housing market. In 2012, non-bank lenders originated over 20% of all mortgages, in 2013 nearly 30%, in 2014 about 42%. And it will likely be even higher this year.
That share surpasses the peak prior to the Financial Crisis.
As before the Financial Crisis, they dominate the riskiest end of the housing market, according to the LA Times: “this time, loans insured by the Federal Housing Administration, aimed at first-time and bad-credit buyers. Such lenders now control 64% of the market for FHA and similar Veterans Affairs loans, compared with 18% in 2010.”
Low down payments increase the risks for lenders. Low credit scores also increase risks for lenders. And they coagulate into a toxic mix with high home prices during housing bubbles, such as Housing Bubble 2, which is in full swing.
The FHA allows down payments to be as low as 3.5%, and credit scores to be as low as 580, hence “subprime” borrowers. And these borrowers in many parts of the country, particularly in California, are now paying sky-high prices for very basic homes.
When home prices drop and mortgage payments become a challenge for whatever reason, such as a layoff or a miscalculation from get-go, nothing stops that underwater subprime borrower from not making any more payments and instead living in the home for free until kicked out.
“Those are the loans that are going to default, and those are the defaults we are going to be arguing about 10 years from now,” predicted Wells Fargo CFO John Shrewsberry at a conference in September. “We are not going to do that again,” he said, in reference to Wells Fargo’s decision to stay out of this end of the business.
But when home prices are soaring, as in California, delinquencies are low and don’t matter. They only matter after the bubble bursts. Then prices are deflating and delinquencies are soaring. Last time this happened, it triggered the most majestic bailouts the world has ever seen.
The LA Times:
For now, regulators aren’t worried. Sandra Thompson, a deputy director of the Federal Housing Finance Agency, which oversees government-sponsored mortgage buyers Fannie Mae and Freddie Mac, said non-bank lenders play an important role.
“We want to make sure there is broad liquidity in the mortgage market,” she said. “It gives borrowers options.”
But another regulator isn’t so sanguine about the breakneck growth of these new non-bank lenders: Ginnie Mae, which guarantees FHA and VA loans that are packaged into structured mortgage backed securities, has requested funding for 33 additional regulators. It’s fretting that these non-bank lenders won’t have the reserves to cover any losses.
“Where’s the money going to come from?” wondered Ginnie Mae’s president, Ted Tozer. “We want to make sure everyone’s going to be there when the next downturn comes.”
But the money, like last time, may not be there.

PennyMac was founded in 2008 by former Countrywide executives, including Stanford Kurland, as the LA Times put it, “the second-in-command to Angelo Mozilo, the Countrywide founder who came to symbolize the excesses of the subprime mortgage boom.” Kurland is PennyMac’s Chairman and CEO. The company is backed by BlackRock and hedge fund Highfields Capital Management.
In September 2013, PennyMac went public at $18 a share. Shares closed on Monday at $16.23. It also consists of PennyMac Mortgage Investment Trust, a REIT that invests primarily in residential mortgages and mortgage-backed securities. It went public in 2009 with an IPO price of $20 a share. It closed at $16.64 a share. There are other intricacies.
According to the company, “PennyMac manages private investment funds,” while PennyMac Mortgage Investment Trust is “a tax-efficient vehicle for investing in mortgage-related assets and has a successful track record of raising and deploying cost-effective capital in mortgage-related investments.”
The LA Times describes it this way:
It has a corporate structure that might be difficult for regulators to grasp. The business is two separate-but-related publicly traded companies, one that originates and services mortgages, the other a real estate investment trust that buys mortgages.
And they’re big: PennyMac originated $37 billion in mortgages during the first nine months this year.

Then there’s AmeriHome. Founded in 1988, it was acquired by Aris Mortgage Holding in 2014 from Impac Mortgage Holdings, a lender that almost toppled under its Alt-A mortgages during the Financial Crisis. Aris then started doing business as AmeriHome. James Furash, head of Countrywide’s banking operation until 2007, is CEO of AmeriHome. Clustered under him are other Countrywide executives.
It gets more complicated, with a private equity angle. In 2014, Bermuda-based insurer Athene Holding, home to other Countrywide executives and majority-owned by PE firm Apollo Global Management, acquired a large stake in AmeriHome and announced that it would buy some of its structured mortgage backed securities, in order to chase yield in the Fed-designed zero-yield environment.
Among the hottest products the nonbank lenders now offer are, to use AmeriHomes’ words, “a wider array of non-Agency programs,” including adjustable rate mortgages (ARM), “Non-Agency 5/1 Hybrid ARMs with Interest Only options,” and “Alt-QM” mortgages.
“Alt-QM” stands for Alternative to Qualified Mortgages. They’re the new Alt-A mortgages that blew up so spectacularly, after having been considered low-risk. They might exceed debt guidelines. They might come with higher rates, adjustable rates, and interest-only payment periods. And these lenders chase after subprime borrowers who’ve been rejected by banks and think they have no other options.
Even Impac Mortgage, which had cleaned up its ways after the Financial Crisis, is now offering, among other goodies, these “Alt-QM” mortgages.
Yet as long as home prices continue to rise, nothing matters, not the volume of these mortgages originated by non-bank lenders, not the risks involved, not the share of subprime borrowers, and not the often ludicrously high prices of even basic homes. As in 2006, the mantra reigns that you can’t lose money in real estate – as long as prices rise.

The ranks of real estate appraisers stand to shrink substantially over the next five years, which could mean longer waits, higher fees and even lower-quality appraisals as more appraisers cross state lines to value properties.
There were 78,500 real estate appraisers working in the U.S. earlier this year, according to the Appraisal Institute, an industry organization, down 20% from 2007. That could fall another 3% each year for the next decade, according to the group. Much of the drop has been among residential, rather than commercial, appraisers.
Some say Americans are unlikely to feel the effects right now, as it’s mostly confined to rural areas and the number of appraisal certifications — many appraisers are licensed to work in multiple states — has held relatively steady. Others say it’s already happening, and rural areas are simply the start.
Since most residential mortgages require an appraiser to value a property before a sale closes, they say, a shortage of appraisers is potentially problematic — and expensive — for both home buyers, who rely on accurate valuations to ensure that they aren’t overpaying, and sellers, who can see deals fall through if appraisals come in low.
“As an appraiser, I should be quiet about this shortage because it’s great for current business,” said Craig Steinley, who runs Steinley Real Estate Appraisals in Rapid City, S.D. But “what will undoubtedly happen, since the market can’t solve this problem by adding new appraisers, [is] it will solve the problem by doing fewer appraisals.”
A shrinking and aging pool
As appraiser numbers are falling, the pool is aging: Sixty-two percent of appraisers are 51 and older, according to the Appraisal Institute (http://www.appraisalinstitute.org/), while 24% are between 36 and 50. Only 13% are 35 or younger.
Industry experts blame an increasingly inhospitable career outlook. Financial institutions used to hire and train entry-level appraisers, but few do anymore, according to John Brenan, modirector of appraisal issues for the Appraisal Foundation (http://www.appraisalfoundation.org/), which sets national standards for real estate appraisers.
That has created a marketplace where current appraisers, mostly small businesses, are fearful of losing business or shrinking their own revenue as they approach retirement. Many have opted not to hire and train replacements.
The requirements to become a certified residential appraiser have also increased over the past couple of decades. Before the early 1990s, a real estate license was often all that was needed. Today, classes and years of apprenticeship are required for certification.

And this year marked the first in which a four-year college degree was required for work as a certified residential appraiser. (It takes only two years of college to become licensed, but that limits the properties on which an appraiser can work. Some states, meanwhile, only offer full certification, not licensing.)
“If you come out of college with a finance degree, you can work for a bank for $70,000 [or] $80,000 a year with benefits,” said Appraisal Institute President Lance Coyle. “As a trainee, you might make $30,000 and get no benefits.” For some, especially those with student loans to pay, the choice may be easy.
“There were definitely easier options of career paths I could have chosen,” said Brooke Newstrom, 34, who became an apprentice for Steinley Real Estate Appraisals earlier this year. She networked for a year and a half, cold calling appraiser offices and attending professional conferences, before getting the job.
For residential appraisers, business isn’t as lucrative as it once was. Federal regulations in 2009 led to the rise of appraisal management companies, which act as a firewall between appraisers and lenders so appraisers can give an unbiased opinion of a home’s value.
But those companies take a chunk of the fee, cutting appraiser compensation. Some community lenders don’t use appraisal management companies, according to Coyle, but they are often used by mortgage brokers and large banks.
Appraiser numbers appear poised to continue shrinking, and as appraisers continue to get multiple state certifications they may be stretched more thinly, industry experts say.
For now, any shortages are likely regional, Brenan said. “There are certainly some parts of the country — and primarily some rural areas — where there aren’t as many appraisers available to perform certain assignments that there were in the past,” he said.
Elsewhere, however, the decrease in appraisers isn’t felt as acutely. In Chicago, according to appraiser John Tsiaousis, it may be difficult for young appraisers to break in but customers in search of one shouldn’t have a problem.
“I don’t believe they will allow us to run out of appraisers,” Tsiaousis said. “Some changes will be made [to the certification process]. When they will be made, I don’t know.”
Longer waits, more expensive appraisals, and quality questions
The effects of an appraiser shortage could be substantial for individuals on both sides of a real estate transaction, experts say.
Fewer appraisers means longer waits, which could hold up a closing. That delay means that borrowers might have to pay for longer mortgage rate locks, according to Sandra O’Connor, regional vice president for the National Association of Realtors (http://www.realtor.org/). (Rate locks hold interest rates firm for set periods of time and are generally purchased after a buyer with initial approval for a loan finds a home she wants.)
Longer waits also affect sellers who need the equity from one sale to purchase their next home. When they can’t close on the home they’re selling, they can’t close on the one they’re buying.
A shortage also means appraisals will likely cost more, which some say is already happening in rural areas. Appraisal fees are generally paid by borrowers.
“Appraisal fees in areas where there aren’t enough appraisers are higher than those areas where there are plenty of people to take up the cause,” said Steinley, who holds leadership roles in the Appraisal Institute and the Association of Appraiser Regulatory Officials (http://www.aaro.net/).
There is a quality issue, too: In some areas, appraisers come in from other states to value homes. While there are guidelines for these appraisers to become geographically competent, they could miss subtleties in the market, Coyle said.
And if the shortage isn’t addressed, and lenders are unable to get appraisers to value homes, lenders might ask federal regulators to relax the rules governing when traditional appraisals are needed, allowing more computer-generated analyses in their place, according to Steinley.
Automated valuation models, which are less expensive and quicker, are rarely used for mortgage originations today, Coyle said. They’re sometimes used for portfolio analysis, or when a borrower needs to demonstrate 20% equity in order to stop paying for private mortgage insurance, he added. They might be used for low-risk home-equity loans, Brenan said.
Currently, appraisers are required for mortgages backed by the Federal Housing Administration, Fannie Mae and Freddie Mac. Those mortgages make up about 70% of the market by loan volume and 90% of the market by loan count, according to the Mortgage Bankers Association (https://www.mba.org/).
And computer-generated appraisals can’t match the precision of one conducted by someone who has seen the property, and knows the area, many in the industry say.
The industry is beginning to address the issue. Last month, the Appraisal Foundation’s qualifications board held a hearing to gather comments and suggestions, Brenan said.
One of the options being discussed: Creating a set of competency-based exams that could shorten the time people spend as trainees. That way, someone with a background in real estate finance could become certified more quickly, Steinley said. The board is also looking to further develop courses that would allow college students to gain practical experience before graduation, Brenan said.
Proper education is important “because real estate valuation is hard to do, and you need to get it right,” Coyle said. But the unintended consequences of the current qualifications are just too much, he added. “It’s almost as if you have some regulators trying to keep people out.”
-Amy Hoak; 415-439-6400; AskNewswires@dowjones.co
Copyright (c) 2015 Dow Jones & Company, Inc.
Examining the reasons to buy a house today may give us some idea where the housing market is heading in the future.
Reason 1 – Utility
A house (any dwelling) is a shelter. It provides enjoyment, a home to raise one’s family, or just a place to watch that big screen TV. Utility is not quantifiable and it differs from household to household.
Reason 2 – Savings
If financed, a mortgage is a way of saving something every month until the mortgage is paid in full. If paid for, the savings come in the form of “owners’ equivalent rent”, which is what the census bureau uses to measure inflation in housing.
Reason 3 – Asset appreciation
At 5% appreciation per year, a $100k house today will be worth $412k in 30 years. Even a more modest 3% appreciation would result in better than a double.

Based on the reasons above, it appears to be a slam dunk decision. Why would anyone not want to buy a house? There are three obstacles:
Obstacle 1 – Affordability
Housing, as a percentage of household income, is too expensive. A decade of ill-conceived government intervention and Federal Reserve accommodations prevented natural economic forces from driving house prices to equilibrium. As a result, not only is entry difficult, but many are struggling and are stuck in dire housing traps. Corelogic estimated that as of the 1st quarter of 2015, 10.2% of mortgages are still under water while 9.7 million households have less than 20% equity.
Obstacle 2 – High Risk
Say you are young couple that purchased a home two years ago, using minimal down financing. The wife is now pregnant and the husband has an excellent career opportunity in another city. The couple has insufficient savings and the house has not appreciated enough to facilitate a sale, which results in negative equity after selling expenses. The house can become a trap that diminishes a life time of income stream.
Obstacle 3 – “Dead zones”
Say you live in the middle of the country, in Kane County Illinois. For the privilege of living there, you pay 3% in property taxes. That is like adding 3% to a mortgage that never gets paid down. Your property would have to appreciate 3% per year just to break even. By the way, “appreciation” is unheard of in Kane County, good times or bad. There are many Kane Counties in the US. Real estate in these counties should be named something else and should not be co-mingled with other housing statistics. Employment is continuing to trend away from these areas. What is going to happen to real estate in these markets?
 The Kane County court house: where real estate goes to vegetate
The factors listed above are nothing new. They provide some perspective as to where are are heading. Looking at each of the reasons and obstacles, they are all trending negatively.
The country is spending too much on housing, a luxury that is made possible by irresponsible Fed policies. 50% debt to income ratios are just insane and Ms. Yellen has the gall to call mortgage lending restrictive. Can we not see what is happening to Greece?
 Mortgage backed securities held by the Federal Reserve System, a non-market central economic planning institution that is the chief instigator of house price inflation. Still growing, in spite of QE having officially ended – via Saint Louis Federal Reserve Research, click to enlarge.
Real estate is an investment that matures over time. The first few years are the toughest, until equity can be built up. With appreciation slowing, not to mention the possibility of depreciation, it is taking much longer to reach financial safety. The current base is weak, with too high a percentage of low equity and no equity ownership. The stress of a recession, or just a few years of a flat market, can impact the economy beyond expectations. The risks that might have been negligible once upon a time are much higher today. Many who purchased ten years ago are still living with the consequences of that ill-timed decision today.
By stepping back and looking at the big picture, we can see that real estate should be correcting and trending down. The reasons why our grandparents bought their homes have changed. Government intervention cannot last forever. It will change from accommodation to devastation, when they finally run out of ideas.
In summary, my working life had its origins in real estate and I am not trying to bite the hand that fed me. However, the reality is that the circumstances that prevailed when I entered the market are non-existent today. I seriously doubt that I would chose real estate as a career, or as an investment avenue, if I were starting over. As for buying a house, I would consider it more of a luxury as opposed to an investment, and one has to be prepared for the possibility of it being a depreciating asset, especially if one decides to move.
In “Underwater Homeowners Here To Stay” we highlighted a report from Zillow which showed that negative equity has now become a permanent fixture of the US housing market. The report also showed that the percentage of homeowners who are underwater was flat from Q314 to Q414, breaking a string of 10 consecutive quarters of declines. We also recently noted that a completely ridiculous new home sales print that defied all logic notwithstanding, housing data, including starts and existing home sales, has come in below expectations. On a side note, home price appreciation has outpaced wage growth at a rate of 13:1, to which we would add:
Of course, the biggest determinant of home price appreciation over the past 2 years has nothing to do with US consumers, or household formation, as confirmed by the collapse in first-time home buyers or the unprecedented depression in new mortgage origination, and everything to do with what we first suggested is one of the main drivers of the US housing bubble – foreigners parking their illegally procured cash in the US and evading taxes, now that US housing, with the NAR’s anti-money laundering exemption blessing, is the new normal’s Swiss Bank Account. That and flipping homes from one “all-cash” buyer to another “all-cash” buyer in hopes of a quick capital appreciation and the constant presence of the proverbial dumb money.
Against this backdrop, Deutsche Bank is out predicting that a sluggish US housing market is likely to impact the supply of MBS going forward. As DB notes, housing isn’t the GDP contributor it once was and not by a long shot. Not only that, but when it comes to recoveries, the housing market’s GDP contribution was 7 times below its post WW2 average in year one and has fared even worse since. Here’s DB with more:
The contribution of housing to US GDP continues to run at some of the lowest levels since the end of World War II. New construction of single- and multi-family homes, renovations, broker fees and the like still only make up a bit more than 3% of current GDP, well below the post-war average of 4.7%. Not only has the level of lift from housing come in low, but it has bounced out of the last official recession slowly, too. Housing on average has contributed a half a percentage point to GDP a year after the end of every post-war US recession. This time around, housing added only 7 bp. And the contribution of housing in the second and third years after the recent recession also has fallen well below post-war averages. And while “insufficient supply” (not enough homes) was cited as a possible contributor to the existing home sales miss, DB notes that at least as of today, there appears to still be a “supply hangover” (although it’s waning):
US home ownership started the decade at 66.9%, peaked in 2004 at 69.2% and ended at 66.5%. It has since dropped to 64.0%. The exodus of owners initially threatened to leave a lot of extra houses behind and reduce the need to build new ones. But investors have come in to pick up the keys, and many houses have found a new home in the market for single-family rentals. This has helped reduce the supply of distressed homes, although it’s still higher than the levels that prevailed in the early 1990s when homeownership last ranged around 64% . The supply hangover isn’t done but should be in the next two or three years.
And demand isn’t looking so hot either:
Demand has likely played a part in slow housing, too, starting with owners that bought their homes in the last decade. Thanks to a 38% drop in home prices nationally from 2006 to 2012, according to Case-Shiller, a lot of those owners walked out the front door without any equity and without the ability to reenter the market as buyers. This has almost certainly contributed to the drop in rental unit vacancies from 10.6% in mid-2009 to 7.0% today. As for potential new owners, Americans, even before the crisis, started moving into their own place at a much slower pace than the long-term average of 1.2 million new households a year, that is, until recently. Demand from former and potential new owners has been soft.
Even in the best case scenario is which supply falls and demand rises, banks’ reluctance to lend could end up hobbling the market for the foreseeable future.
Although the market seems to be clearing out the lingering housing supply and the economy and the labor market look likely to repair demand, the availability of credit could prove to be the lasting constraint. Today’s lending standards reflect limits designed to keep the last decade’s boom and bust from happening again. Borrowers today without the ability to repay will not get a loan. But it looks like some borrowers with the ability to repay—but with low FICO scores or with needs that keep them outside the agency or prime jumbo markets—will also not get a loan. The market is reducing risk today to avoid risk tomorrow. But it also is likely reducing housing growth today to avoid a downturn tomorrow.
And here’s further confirmation of this from BofAML:
So there is your housing recovery in a nutshell: supply hangover, lackluster demand, and reluctant lenders all coalescing in a housing market whose contribution to US economic growth is virtually nonexistent.
And if you’re looking for the next shoe to drop, here’s a hint:
As the generational war heats up, we should all remember the source of all the bubbles and all the policies that could only result in generational poverty: The Federal Reserve.
Federal Reserve chair Janet Yellen recently treated the nation to an astonishing lecture on the solution to rising wealth inequality–according to Yellen, low-income households should save capital and buy assets such as stocks and housing.
It’s difficult to know which is more insulting: her oily sanctimony or her callous disregard for facts. What Yellen and the rest of the Fed Mafia have done is inflate bubbles in credit and assets that have made housing unaffordable to all but the wealthiest households.
Fed policy has been especially destructive to young households: not only is it difficult to save capital when your income is declining in real terms, housing has soared out of reach as the direct consequence of Fed policies.
Two charts reflect this reality. The first is of median household income, the second is the Case-Shiller Index of housing prices for the San Francisco Bay Area.
I have marked the wage chart with the actual price of a modest 900 square foot suburban house in the S.F. Bay Area whose price history mirrors the Case-Shiller Index, with one difference: this house (and many others) are actually worth more now than they were at the top of the national bubble in 2006-7.
But that is a mere quibble. The main point is that housing exploded from 3 times median income to 12 times median income as a direct result of Fed policies. Lowering interest rates doesn’t make assets any more affordable–it pushes them higher.
The only winners in the housing bubble are those who bought in 1998 or earlier. The extraordinary gains reaped since the late 1990s have not been available to younger households. The popping of the housing bubble did lower prices from nosebleed heights, but in most locales price did not return to 1996 levels.
As a multiple of real (inflation-adjusted) income, in many areas housing is more expensive than it was at the top of the 2006 bubble.
While Yellen and the rest of the Fed Mafia have been enormously successful in blowing bubbles that crash with devastating consequences, they failed to move the needle on household income. Median income has actually declined since 2000.

Inflating asset bubbles shovels unearned gains into the pockets of those who own assets prior to the bubble, but it inflates those assets out of reach of those who don’t own assets–for example, people who were too young to buy assets at pre-bubble prices.

Inflating housing out of reach of young households as a matter of Fed policy isn’t simply unjust–it’s cruel. Fed policies designed to goose asset valuations as a theater-of-the-absurd measure of “prosperity” overlooked that it is only the older generations who bought all these assets at pre-bubble prices who have gained.
In the good old days, a 20% down payment was standard. How long will it take a young family to save $130,000 for a $650,000 house? How much of their income will be squandered in interest and property taxes for the privilege of owning a bubblicious-priced house?
If we scrape away the toxic sludge of sanctimony and misrepresentation from Yellen’s absurd lecture, we divine her true message: if you want a house, make sure you’re born to rich parents who bought at pre-bubble prices.
As the generational war heats up, we should all remember the source of all the bubbles and all the policies that could only result in generational poverty: The Federal Reserve.
When it comes to housing, sometimes it seems we never learn. Just when America appeared to be recovering from the last housing crisis—the trigger, in many ways, for 2008’s grand financial meltdown and the beginning of a three-year recession—another one may be looming on the horizon.
For one, the housing market never truly recovered from the recession. Trulia Chief Economist Jed Kolko points out that, while the third quarter of 2014 saw improvement in a number of housing key barometers, none have returned to normal, pre-recession levels. Existing home sales are now 80 percent of the way back to normal, while home prices are stuck at 75 percent back, remaining undervalued by 3.4 percent. More troubling, new construction is less than halfway (49 percent) back to normal. Kolko also notes that the fundamental building blocks of the economy, including employment levels, income and household formation, have also been slow to improve. “In this recovery, jobs and housing can’t get what they need from each other,” he writes.
Second, Americans continue to overspend on housing. Even as the economy drags itself out of its recession, a spate of reports show that families are having a harder and harder time paying for housing. Part of the problem is that Americans continue to want more space in bigger homes, and not just in the suburbs but in urban areas, as well. Americans more than 33 percent of their income on housing in 2013, up nearly 13 percent from two decades ago, according to newly released data from the Bureau of Labor Statistics (BLS). The graph below plots the trend by age.
Over-spending on housing is far worse in some places than others; the housing market and its recovery remain highly uneven. Another BLS report released last month showed that households in Washington, D.C., spent nearly twice as much on housing ($17,603) as those in Cleveland, Ohio ($9,061). The chart below, from the BLS report, shows average annual expenses on housing related items:

The result, of course, is that more and more American households, especially middle- and working-class people, are having a harder time affording housing. This is particularly the case in reviving urban centers, as more affluent, highly educated and creative-class workers snap up the best spaces, particularly those along convenient transit, pushing the service and working class further out.
Last but certainly not least, the rate of home ownership continues to fall, and dramatically. Home ownership has reached its lowest level in two decades—64.4 percent (as of the third quarter of 2014). Here’s the data, from the U.S. Census Bureau:

Home ownership currently hovers from the mid-50 to low-60 percent range in some of the most highly productive and innovative metros in this country—places like San Francisco, New York, and Los Angeles. This range seems “to provide the flexibility of rental and ownership options required for a fast-paced, rapidly changing knowledge economy. Widespread home ownership is no longer the key to a thriving economy,” I’ve written.
What we are going through is much more than a generational shift or simple lifestyle change. It’s a deep economic shift—I’ve called it the Great Reset. It entails a shift away from the economic system, population patterns and geographic layout of the old suburban growth model, which was deeply connected to old industrial economy, toward a new kind of denser, more urban growth more in line with today’s knowledge economy. We remain in the early stages of this reset. If history is any guide, the complete shift will take a generation or so.
The upshot, as the Nobel Prize winner Edmund Phelps has written, is that it is time for Americans to get over their house passion. The new knowledge economy requires we spend less on housing and cars, and more on education, human capital and innovation—exactly those inputs that fuel the new economic and social system.
But we’re not moving in that direction; in fact, we appear to be going the other way. This past weekend, Peter J. Wallison pointed out in a New York Times op-ed that federal regulators moved back off tougher mortgage-underwriting standards brought on by 2010’s Dodd-Frank Act and instead relaxed them. Regulators are hoping to encourage more home ownership, but they’re essentially recreating the conditions that led to 2008’s crash.
Wallison notes that this amounts to “underwriting the next housing crisis.” He’s right: It’s time to impose stricter underwriting standards and encourage the dense, mixed-use, more flexible housing options that the knowledge economy requires.
During the depression and after World War II, this country’s leaders pioneered a series of purposeful and ultimately game-changing polices that set in motion the old suburban growth model, helping propel the industrial economy and creating a middle class of workers and owners. Now that our economy has changed again, we need to do the same for the denser urban growth model, creating more flexible housing system that can help bolster today’s economy.

Dream housing for new economy workers?
 b
b
The dramatic resurgence of the oil industry over the past few years has been a notable factor in the national economic recovery. Production levels have reached totals not seen since the late 1980s and continue to increase, and rig counts are in the 1,900 range. While prices have dipped recently, it will take more than that to markedly slow the level of activity. Cycles are inevitable, but activity is forecast to remain at relatively high levels.
An outgrowth of oil and gas activity strength is a need for additional workers. At the same time, the industry workforce is aging, and shortages are likely to emerge in key fields ranging from petroleum engineers to experienced drilling crews. I was recently asked to comment on the topic at a gathering of energy workforce professionals. Because the industry is so important to many parts of Texas, it’s an issue with relevance to future prosperity.
Although direct employment in the energy industry is a small percentage of total jobs in the state, the work is often well paying. Moreover, the ripple effects through the economy of this high value-added industry are large, especially in areas which have a substantial concentration of support services.

Employment in oil and gas extraction has expanded rapidly, up from 119,800 in January 2004 to 213,500 in September 2014. Strong demand for key occupations is evidenced by the high salaries; for example, median pay was $130,280 for petroleum engineers in 2012 according to the Bureau of Labor Statistics (BLS).
Due to expansion in the industry alone, the BLS estimates employment growth of 39 percent through 2022 for petroleum engineers, which comprised 11 percent of total employment in oil and gas extraction in 2012. Other key categories (such as geoscientists, wellhead pumpers, and roustabouts) are also expected to see employment gains exceeding 15 percent. In high-activity regions, shortages are emerging in secondary fields such as welders, electricians, and truck drivers.
The fact that the industry workforce is aging is widely recognized. The cyclical nature of the energy industry contributes to uneven entry into fields such as petroleum engineering and others which support oil and gas activity. For example, the current surge has pushed up wages, and enrollment in related fields has increased sharply. Past downturns, however, led to relatively low enrollments, and therefore relatively lower numbers of workers in some age cohorts. The loss of the large baby boom generation of experienced workers to retirement will affect all industries. This problem is compounded in the energy sector because of the long stagnation of the industry in the 1980s and 1990s resulting in a generation of workers with little incentive to enter the industry. As a result, the projected need for workers due to replacement is particularly high for key fields.
The BLS estimates that 9,800 petroleum engineers (25.5 percent of the total) working in 2012 will need to be replaced by 2022 because they retire or permanently leave the field. Replacement rates are also projected to be high for other crucial occupations including petroleum pump system operators, refinery operators, and gaugers (37.1 percent); derrick, rotary drill, and service unit operators, oil, gas, and mining (40.4 percent).

Putting together the needs from industry expansion and replacement, most critical occupations will require new workers equal to 40 percent or more of the current employment levels. The total need for petroleum engineers is estimated to equal approximately 64.5 percent of the current workforce. Clearly, it will be a major challenge to deal with this rapid turnover.
Potential solutions which have been attempted or discussed present problems, and it will require cooperative efforts between the industry and higher education and training institutions to adequately deal with future workforce shortages. Universities have had problems filling open teaching positions, because private-sector jobs are more lucrative for qualified candidates. Given budget constraints and other considerations, it is not feasible for universities to compete on the basis of salary. Without additional teaching and research staff, it will be difficult to continue to expand enrollment while maintaining education quality. At the same time, high-paying jobs are enticing students into the workforce, and fewer are entering doctoral programs.
Another option which has been suggested is for engineers who are experienced in the workplace to spend some of their time teaching. However, busy companies are naturally resistant to allowing employees to take time away from their regular duties. Innovative training and associate degree and certification programs blending classroom and hands-on experience show promise for helping deal with current and potential shortages in support occupations. Such programs can prepare students for well-paying technical jobs in the industry. Encouraging experienced professionals to work past retirement, using flexible hours and locations to appeal to Millennials, and other innovative approaches must be part of the mix, as well as encouraging the entry of females into the field (only 20 percent of the current workforce is female, but over 40 percent of the new entries).
Industry observers have long been aware of the coming “changing of the guard” in the oil and gas business. We are now approaching the crucial time period for ensuring the availability of the workers needed to fill future jobs. Cooperative efforts between the industry and higher education/training institutions will likely be required, and it’s time to act.

The practice of multigenerational housing has been on the rise the past few years, and now experts are saying that it is adding value to properties.
In a recent Wall Street Journal article, several couples across the country are quoted saying that instead of downsizing to a new home, they are choosing to live with their adult children.
This is what many families across the country are doing for both a “peace of mind” and for “higher property values.”
“For both domestic and foreign buyers, the hottest amenity in real estate these days is an in-law unit, an apartment carved out of an existing home or a stand-alone dwelling built on the homeowners’ property,” writes Katy McLaughlin of the WSJ. “While the adult children get the peace of mind of having mom and dad nearby, real-estate agents say the in-law accommodations are adding value to their homes.”
And how much more are these homes worth? In an analysis by Zillow, the homes with this type of living accommodations were priced about 60 percent higher than regular single-family homes.
Local builders are noticing the trend, too. Horsham based Toll Brothers are building more communities that include both large, single-family homes and smaller homes for empty nesters, the company’s chief marketing officer, Kira Sterling, told the WSJ.

 Romania draws foreign buyers looking for historic mansions and modern villas in resort areas
Count Dracula, the central character of Irish author Bram Stoker’s classic vampire novel, eagerly left for England in search of new blood, in a story that popularized the Romanian region of Transylvania. Today, house hunters are invited to make the reverse journey now that Romania is a member of the European Union and that restrictions were lifted this year on purchases of local real estate by the bloc’s nationals.
Britain’s Prince Charles, for one, unwinds every year in Zalanpatak. The mud road leading to the remote village stretches for miles, with the clanging of cow bells accompanying tourists making the trek.
Elsewhere in the world, the heir to the British throne occupies great castles and sprawling mansions. In rural Romania, he resides in a small old cottage. His involvement, since 2006, in the restoration of a few local farmhouses has given the hamlet global popularity and added a sense of excitement about Transylvania living.
 A living room in Bran Castle, a Transylvania property marketed as Count Dracula’s castle. The home is for sale, initially listed for $78 million.
 Transylvania, with a population of more than seven million in the central part of Romania, has a number of high-end homes on the market. And, yes, one is a castle. Bran Castle in Brasov county is marketed as the home of Count Dracula. In reality it was a residence of Romanian Queen Marie in the early 20th century. In 2007, the home was available for $78 million. The sellers are no longer listing a price, said Mark A. Meyer, of Herzfeld and Rubin, the New York attorneys representing the queen’s descendants, but will entertain offers.
Foreign buyers had been focused on Bucharest, where there was speculative buying of apartments after the country joined the EU in 2007. But Transylvania has been luring house hunters away from the capital city.
 A guesthouse on the property in Zalanpatak, Transylvania, that is owned by Britain’s Prince Charles. His presence has boosted interest in Romanian real estate.
 Transylvania means “the land beyond the forest” and the region is famous for its scenic mountain routes. Brasov, an elegant mountain resort and the closest Transylvanian city to the capital, has many big villas built in the 19th century by wealthy merchants. A 10-room townhouse from that period in the historic city center is listed for $2.7 million. For $500,000, a 2,200-square-foot apartment offers rooftop views of the city and the surrounding mountains.
A seven-bedroom mansion in the nearby village of Halchiu, close to popular skiing resorts, is on the market for $2.4 million. The modern villa features two huge living rooms, a swimming pool, a tennis court and spectacular views of the Carpathian Mountains.
The village, founded by Saxons in the 12th century, has rows of historic houses across the street. Four such buildings were demolished to make way for the mansion, completed in 2010.
 A $2.4 million mansion is for sale in Halchiu village.
 “Rather than invest a million or more to buy an existing house, the wealthy prefer to build on their own because construction materials and work is cheaper,” said Raluca Plavita, senior consultant at real-estate firm DTZ Echinox in Bucharest.
Non-EU nationals can’t purchase land outright—although they may use locally registered companies to circumvent the restriction—but they can buy buildings freely, said Razvan Popa, real-estate partner at law firm Kinstellar. High-end properties are out of reach for many Romanians, who make an average of $500 in monthly take-home pay.
The country saw a rapid inflation of real-estate prices before 2008, on prospects of Romania’s entry to the EU and the North Atlantic Treaty Organization, as well as aggressive lending by banks. Values then fell by half during the global financial crisis.
The economy is stronger now, with the International Monetary Fund estimating 2.4% growth this year. But the country is still among Europe’s poorest. Its isolation during the dictatorship of Nicolae Ceausescu gave it a bad image.
 The interior of the seven-bedroom Halchiu mansion, which was built on the site of four traditional Saxon homes.
“Interest in Romania isn’t comparable with Prague or Budapest where some may be looking to buy a small apartment with a view of Charles Bridge or the Danube,” said Mr. Popa, the real-estate lawyer.
The international publicity around Prince Charles’s properties offers a counterbalance to some of the negative press Romania has received in Western Europe, which is worried about well-educated Romanians moving to other countries to provide inexpensive labor.
The Zalanpatak property is looked after by Tibor Kalnoky, a descendant of a Hungarian aristocratic family. The 47-year-old studied in Germany to be a veterinarian and, after reclaiming family assets in Romania, has managed the prince’s property and has hosted him during his visits.
These occasional visits are enough to attract scores of tourists throughout the year to the formerly obscure village in a Transylvanian valley. The fact that few street signs lead there, that the property offers no Internet or TV and that cellphone signals are absent for miles, seems only to add to the mystery of the place.


You must be logged in to post a comment.