While it won’t come as a surprise to those who keep tabs on the monthly Case-Shiller data, where the latest Top 20 City Composite Index rose a record 17% in May, and which showed that every metro area in the US saw double digit Y/Y price gains…
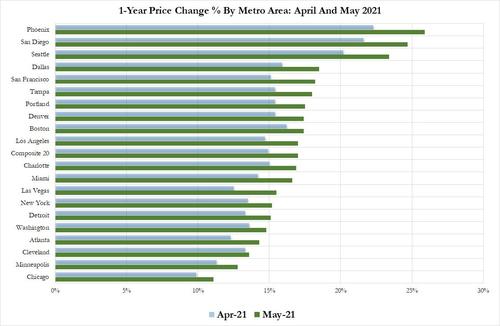

While it won’t come as a surprise to those who keep tabs on the monthly Case-Shiller data, where the latest Top 20 City Composite Index rose a record 17% in May, and which showed that every metro area in the US saw double digit Y/Y price gains…

The Federal Reserve continued to increase its holdings of mortgage-backed securities by the tune of $40 billion per month, fueling a housing bubble with record-low mortgage rates and low inventory.
Even as the housing sector has more than recovered from the downturn, Chair Jerome Powell continues pedal to the metal with MBS purchases. According to the National Association of Realtors (NAR), this has resulted in the median price for a single-family home to soar the most on record in the first quarter.
Following May’s unexpected slowdown in growth, analysts expect June’s Case-Shiller Home Price Index to show further deceleration, and it did – but notably worse than expected.
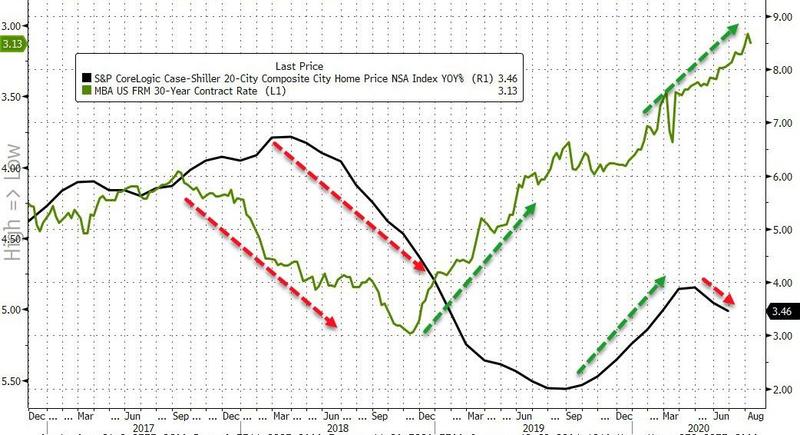
The Case-Shiller 20-City Composite Home Price rose 3/46% YoY in June (the latest data), well below expectations of a +3.60% and May’s 3.61% prints…

And it seems that even with mortgage rates hitting record lows, prices have stopped appreciating so fast…
Is this emblematic of the exodus from the cities (highest cost housing?)
Amid the collapse on US home sales, as mortgage rates surge above 5.00%, August’s Case-Shiller home price data plunged to its weakest annual growth since Dec 2016, dramatically missing expectations).
Against expectations of a 5.80% YoY rise, August home prices rose 5.49% (slowing from July’s 5.90% YoY) to its weakest since Dec 2016…

This is the biggest two-month slowdown in Case-Shiller home price growth since 2014…

On a non-seasonally-adjusted basis, home prices rose 5.77%, down from 5.99%, the lowest since June 2017.
And judging by mortgage rates, it’s about to get a whole lot worse…

Of course, the establishment is saying this is “contained”:
“Following reports that home sales are flat to down, price gains are beginning to moderate,” David Blitzer, chairman of the S&P index committee, said in a statement. “There are no signs that the current weakness will become a repeat of the crisis, however.”
Las Vegas had the biggest annual increase at 13.9 percent, followed by San Francisco at 10.6 percent and Seattle at 9.6 percent,

But Seattle’s price appreciation slumped MoM…the biggest drop since Feb 2011…

Is it any surprise that home builder stocks have collapsed along with US housing data?


Home values have been rising for six straight years, and the gains have been accelerating for the past two years. Unlike the last housing boom, the gains are not driven by fast and easy mortgage money, but instead by solid buyer demand and very low supply. Still, like the last housing boom, some are starting to warn these price gains cannot continue.
“The continuing run-up in home prices above the pace of income growth is simply not sustainable,” wrote Lawrence Yun, chief economist for the National Association of Realtors, in response to the latest price reading from the much-watched S&P CoreLogic Case Shiller Home Price Indices. “From the cyclical low point in home prices six years ago, a typical home price has increased by 48 percent while the average wage rate has grown by only 14 percent.”
Yun also pointed to rising mortgage interest rates as a factor that would weaken affordability. The average rate on the 30-year fixed mortgage is nearly a full percentage point higher today than it was at its most recent low in September 2017.
Some argue that despite weakened affordability, demand is just so strong that it can support higher home prices. Improving economic factors are seeing to that.
“A generally strong economy and favorable demographic tailwinds driven by the huge millennial generation aging into their home buying prime will help ensure that demand stays high, even as prices rise,” wrote Aaron Terrazas, senior economist at Zillow. “Getting a mortgage remains incredibly affordable compared to paying rent each month.”
But he admits that the “advantage is starting to erode, as mortgage interest rates rise alongside prices and income growth lags behind.”
And demand may in fact be weakening. A monthly survey from Redfin found fewer potential buyers requesting home tours or making offers.
“April was the first time in 27 months that we saw a year-over-year decline in the number of customers touring homes,” said Redfin’s chief economist, Nela Richardson. “We believe this was driven by the low levels of new listings in March.”
Richardson points to an increase in new listings in April is a positive turn for home buyers, which could bode well for futures sales. Prices, however, still stand in the way, and the increased inventory was more pronounced in higher-priced tiers.
Meanwhile the home price gains are widest on the low end of the market, where supply is leanest. That is why home sales have been dropping most on the low end. Evidence is now mounting that a growing number of first-time buyers are giving up and dropping out of the market altogether. Sales to first-time buyers dropped 2 percent in the first quarter of this year compared with the first quarter of 2017, according to Genworth Mortgage Insurance.
“This quarter’s decline in first-time home buyer sales reflects a slowdown in cyclical momentum as the first-time home buyer market approached its historical norms. It also reflects a shortage of available homes priced at or below the median first-time home buyer market price of $250,000,” wrote Tian Liu, Genworth’s chief economist. “Supply pressures will continue to drive price appreciation and freeze out a large percentage of the 2.7 million first-time home buyers who are still missing from the market.”
Competition from all-cash investors continues to thwart first-time buyers, most of whom are reliant on mortgage financing. With so little supply available, bidding wars are the rule, rather than the exception.
“When you’re competing against 10 other offers, you have to stand out, so sometimes a letter to the sellers can pull on the emotional heartstrings, but really it’s all about the dollars,” said Karen Kelly, a real estate agent with Compass in the Washington, D.C., area.
Half of the homes on the market in D.C. in April sold in eight days or less, according to the Greater Capital Area Association of Realtors. Home prices in D.C. were over 13 percent higher in April of this year compared with a year ago. The number of listings was down more than 3 percent.
Affordability continues to be a tricky metric to monitor. Some economists argue that housing is no less affordable than it was in the early part of this century, when adjusting for inflation. No question, though, even if home prices are still lower than they were during the last housing boom, adjusting for inflation, the mortgage market today is nothing like it was then.
In fact, affordability was largely meaningless back then, since buyers could put no money down for a home and pay incredibly low monthly payments, using mortgage products that adjusted higher over time and tacked huge costs onto later payments. Those so-called negative amortization loans caused the housing crash and are not offered today.
US housing data has been disappointing so far in 2018 as affordability plummets on the heels of rising rates, but that didn’t stop Case-Shiller Home Prices from surging at a faster-than-expected 6.4% YoY in January.
Home sales, permits, and starts have been underwhelming so far this year…

But according to Case-Shiller, home prices are accelerating at their fastest rate since July 2014 (up 6.4% YoY vs 6.15% YoY exp)…

All 20 cities in the index showed year-over-year gains, led by a 12.9 percent increase in Seattle and an 11.1 percent gain in Las Vegas.
After seasonal adjustment, Seattle, San Francisco and Atlanta had the biggest month-over-month gains.
Washington has the smallest month-over-month advance at 0.2 percent.
“The home price surge continues,” David Blitzer, chairman of the S&P index committee, said in a statement.
“Two factors supporting price increases are the low inventory of homes for sale and the low vacancy rate among owner-occupied housing.”
The 20-City Home price index is less than 1% away from the record highs of 2006…

But the National home price index is over 6% above 2006 highs…

 The temperature may be frigid across much of the nation, yet home prices are sizzling and sellers are in the hot seat.
Sales prices jumped 7 percent annually in November, according to a new report from CoreLogic. That is the third straight month at that pace, far higher than the price gains in the first half of 2017. Low supply and high demand are fueling the spurt and neither of those is expected to ease up anytime soon. Supply is actually falling even more now, and a strengthening economy is pushing demand. This will have potential buyers out early this year, trying to get a jump on the spring market. “Rising home prices are good news for home sellers, but add to the challenges that home buyers face,” said Frank Nothaft, chief economist at CoreLogic, in the report. Nothaft said the limited supply is the worst at the lower end, and will hit the growing number of first-time buyers hardest.
The largest metropolitan areas are seeing the biggest gains.
In the nation’s top 50 markets, half of the housing stock is now considered overvalued, based on market fundamentals, like income and employment. CoreLogic defines an overvalued housing market as one in which home prices are at least 10 percent higher than the long-term, sustainable level. Las Vegas led the November report as not only being overvalued, but showing a double-digit annual price gain of 11 percent. San Francisco was not far behind at 9 percent, and Denver came in third at 8 percent. Las Vegas and Denver are both considered overvalued, but San Francisco is not, as incomes in the tech capital far exceed the national level. Of the nation’s 10 major markets with the biggest price gains, seven are overvalued. These include Washington, D.C., Houston and Miami. Boston and Chicago are still seeing price gains but are considered at value. Without a significant jump in home construction, prices will remain high and likely move higher. Mortgage rates could also move slightly higher, and new tax policy limiting mortgage and property tax deductions, is hitting homeowners in some states hard.
All will combine to make housing less and less affordable in the new year.
Following the bounce in exisitng home sales (albeit lower YoY), new home sales ripped back higher in October (up 6.2% vs expectations of a 6.1% drop) following a big downward revision of last month’s manic spike. This is the highest print for new home sales since Nov 2007.
The 6.2% surge is a six standard deviation beat of expectations…

September’s 18.9% spike was revised notably lwoer to a 14.2% jump to 685k SAAR…

This is the highest new home sales SAAR print since Nov 2007… but still has a long way to go back to ‘normal’…

And finally, we note that the average new home sales price hit a new record high, above $400K for the first time ever – $400,200.

The monthly housing market reports I publish each month became bullish in late 2011 due to the relative undervaluation of properties at the time. I was still cautious due to weak demand, excessive shadow inventory, the uncertainty of the duration of the interest rate stimulus, and an overall skepticism of the lending cartel’s ability to manage their liquidations.
In 2012, the lending cartel managed to completely shut off the flow of foreclosures on the market, and with ever-declining interest rates, a small uptick in demand coupled with a dramatic reduction in supply caused the housing market to bottom.
Even with the bottom in the rear-view mirror, I remained skeptical of the so-called housing recovery because the market headwinds remained, and the low-interest rate stimulus could change at any moment. Without the stimulus, the housing market would again turn down.
It wasn’t until Ben Bernanke, chairman of the federal reserve, took out his housing bazooka and fired it in September 2012 that I became convinced the bottom was really in for housing. Back in September, Bernanke pledged to buy $40 billion in mortgage-backed securities each month for as long as it takes for housing to fully recover. With an unlimited pledge to provide stimulus, any concerns about a decline in prices was washed away.
In addtion to buying new securities, the federal reserve also embarked on a policy of reinvesting principal payments from agency debt and mortgage-backed securities back into mortgages — a policy they continue to this day.

by Liz McCormick and Matt Scully, February 5, 2017
Almost a decade after it all began, the Federal Reserve is finally talking about unwinding its grand experiment in monetary policy.
And when it happens, the knock-on effects in the bond market could pose a threat to the U.S. housing recovery.
Just how big is hard to quantify. But over the past month, a number of Fed officials have openly discussed the need for the central bank to reduce its bond holdings, which it amassed as part of its unprecedented quantitative easing during and after the financial crisis. The talk has prompted some on Wall Street to suggest the Fed will start its drawdown as soon as this year, which has refocused attention on its $1.75 trillion stash of mortgage-backed securities.
While the Fed also owns Treasuries as part of its $4.45 trillion of assets, its MBS holdings have long been a contentious issue, with some lawmakers criticizing the investments as beyond what’s needed to achieve the central bank’s mandate. Yet because the Fed is now the biggest source of demand for U.S. government-backed mortgage debt and owns a third of the market, any move is likely to boost costs for home buyers. …
In the past year alone, the Fed bought $387 billion of mortgage bonds just to maintain its holdings. Getting out of the bond-buying business as the economy strengthens could help lift 30-year mortgage rates past 6 percent within three years, according to Moody’s Analytics Inc.
It’s difficult to imagine that losing a buyer of that magnitude wouldn’t cause prices to fall, thereby raising yields and mortgage interest rates.

The surge in mortgage rates is already putting a dent in housing demand. Sales of previously owned homes declined more than forecast in December, …, according to data from the National Association of Realtors.
People are starting to ask the question, “Gee, did I miss my opportunity here to get a low-rate mortgage?” …
While this may close the door on the opportunity to get a low rate, it opens the door on the opportunity to get a low price.
People can only afford what they can afford. If their payment stretches to finance huge sums like they do today, then prices get bid up to that equilibrium price level. If their payment finances a smaller sum, like they will if mortgage rates rise, then prices will need to “adjust” downward to this new equilibrium price level.
I wouldn’t count on a big drop. Prices are sticky on the way down, particularly without a flood of foreclosures to push them down. Today’s owners with low-rate mortgages won’t sell unless they really need to, and lenders would rather can-kick than cause another foreclosure crisis, so any downward movement would be slow.
As prices creep downward, rents and incomes will rise offsetting some of the pain, and those buyers that are active will substitute downward in quality to something they can afford. It’s a prescription for low sales volumes and unhappy buyers and sellers. The buyers pay too much, and the sellers get too little.
Nevertheless, the consequences for the U.S. housing market can’t be ignored.
The “Fed has already hiked twice and the market is expecting” more, said Munish Gupta, a manager at Nara Capital, a new hedge fund being started by star mortgage trader Charles Smart. “Tapering is the next logical step.”
As the federal reserve tapers its purchases of mortgage bonds, it opens up this market to private investment. Perhaps money will flow out of 10-year treasuries into mortgage-backed securities for a little more yield. It’s also possible that Congress will reform mortgage finance and remove the government guarantee from these securities, making them less desirable.
It’s entirely possible that the yield on the 10-year treasury will drop this year. Higher short term rates and a strengthening economy means the US dollar should appreciate relative to other currencies, attracting foreign capital. Once converted to US dollars, that capital must find someplace to invest, and US Treasuries are the safest investment providing some yield. If a great deal of foreign capital enters the country and buys treasuries, yields will drop, and mortgage rates may drop with them. Rising mortgage rates are not a certainty.
For now, the federal reserve will keep buying mortgage-backed securities, but the messy taper is on the horizon. Apparently, when it comes to boosting housing, Yellen plans to stay the course.

Following a flurry of home sales in November, the total number of homes for sale in December declined to a three-year low, according to data provided by Redfin.
“Prospective sellers were hesitant to list last month,” said Redfin Chief Economist Nela Richardson. “Many of them are also buyers, and two transactions are much harder to pull off in a fast-paced, low-inventory environment than one. We expect sellers to list early in 2017, not only to make top dollar from eager buyers, but also to be in a position to act quickly when it comes time to make their next home purchase.”
Redfin receives current and local data from its agents positioned throughout the country. This allows the firm to have a comprehensive view of general real-estate trends unfolding within the markets it covers.
When compared to November, the number of new listings for December decreased by 26.8 percent. December’s median home price was about 276,000, which represents a 4.7 percent increase over the previous year. Furthermore, the median amount of days for which a home was listed on the market before going under contract was 54, which is the fastest rate for any December since Redfin began tracking the data in 2010.
“We’ve never before seen homes turn over so quickly at a national level,” Richardson said. She also noted that December’s data was rather surprising given existing conditions such as a new president-elect, higher mortgage rates, and low home inventory.
The low inventory should continue to cause an upward movement in the prices of homes in2017, with some regions experiencing higher growth than others.
Seattle was the quickest region for home sales, as half of all homes listed on the market were pending a sale within 19 days. Seattle also had the highest home price growth, increasing by a rate 14.8 percent since 2015.
April was not a good month for home prices – despite hopeful signs from seasonally adjusted sales data. S&P Case-Shiller 20-City index rose just 0.45% MoM (well below expectations and March’s 0.85% gain) – the weakest rise since Aug 2015. The broader Home Price Index hovered near unchanged for the 2nd month – the weakest since January 2012. Most worrisome, perhaps, is the 18.16% YoY plunge in San Francisco home sales… as perhaps the bubble is finally bursting.
20-City (Seasonally Adjusted) Index…

Broad (Seasonally-Adjusted) Home Price Index…

Examining the reasons to buy a house today may give us some idea where the housing market is heading in the future.
Reason 1 – Utility
A house (any dwelling) is a shelter. It provides enjoyment, a home to raise one’s family, or just a place to watch that big screen TV. Utility is not quantifiable and it differs from household to household.
Reason 2 – Savings
If financed, a mortgage is a way of saving something every month until the mortgage is paid in full. If paid for, the savings come in the form of “owners’ equivalent rent”, which is what the census bureau uses to measure inflation in housing.
Reason 3 – Asset appreciation
At 5% appreciation per year, a $100k house today will be worth $412k in 30 years. Even a more modest 3% appreciation would result in better than a double.

Based on the reasons above, it appears to be a slam dunk decision. Why would anyone not want to buy a house? There are three obstacles:
Obstacle 1 – Affordability
Housing, as a percentage of household income, is too expensive. A decade of ill-conceived government intervention and Federal Reserve accommodations prevented natural economic forces from driving house prices to equilibrium. As a result, not only is entry difficult, but many are struggling and are stuck in dire housing traps. Corelogic estimated that as of the 1st quarter of 2015, 10.2% of mortgages are still under water while 9.7 million households have less than 20% equity.
Obstacle 2 – High Risk
Say you are young couple that purchased a home two years ago, using minimal down financing. The wife is now pregnant and the husband has an excellent career opportunity in another city. The couple has insufficient savings and the house has not appreciated enough to facilitate a sale, which results in negative equity after selling expenses. The house can become a trap that diminishes a life time of income stream.
Obstacle 3 – “Dead zones”
Say you live in the middle of the country, in Kane County Illinois. For the privilege of living there, you pay 3% in property taxes. That is like adding 3% to a mortgage that never gets paid down. Your property would have to appreciate 3% per year just to break even. By the way, “appreciation” is unheard of in Kane County, good times or bad. There are many Kane Counties in the US. Real estate in these counties should be named something else and should not be co-mingled with other housing statistics. Employment is continuing to trend away from these areas. What is going to happen to real estate in these markets?
 The Kane County court house: where real estate goes to vegetate
The factors listed above are nothing new. They provide some perspective as to where are are heading. Looking at each of the reasons and obstacles, they are all trending negatively.
The country is spending too much on housing, a luxury that is made possible by irresponsible Fed policies. 50% debt to income ratios are just insane and Ms. Yellen has the gall to call mortgage lending restrictive. Can we not see what is happening to Greece?
 Mortgage backed securities held by the Federal Reserve System, a non-market central economic planning institution that is the chief instigator of house price inflation. Still growing, in spite of QE having officially ended – via Saint Louis Federal Reserve Research, click to enlarge.
Real estate is an investment that matures over time. The first few years are the toughest, until equity can be built up. With appreciation slowing, not to mention the possibility of depreciation, it is taking much longer to reach financial safety. The current base is weak, with too high a percentage of low equity and no equity ownership. The stress of a recession, or just a few years of a flat market, can impact the economy beyond expectations. The risks that might have been negligible once upon a time are much higher today. Many who purchased ten years ago are still living with the consequences of that ill-timed decision today.
By stepping back and looking at the big picture, we can see that real estate should be correcting and trending down. The reasons why our grandparents bought their homes have changed. Government intervention cannot last forever. It will change from accommodation to devastation, when they finally run out of ideas.
In summary, my working life had its origins in real estate and I am not trying to bite the hand that fed me. However, the reality is that the circumstances that prevailed when I entered the market are non-existent today. I seriously doubt that I would chose real estate as a career, or as an investment avenue, if I were starting over. As for buying a house, I would consider it more of a luxury as opposed to an investment, and one has to be prepared for the possibility of it being a depreciating asset, especially if one decides to move.

– Price Appreciation Slowing in More than Half of Major U.S. Markets –
– 20 Major Metros Reach New Post-Recession Price Peaks in 2013 or 2014 –
– REO and Short Sales Down from a Year Ago, Foreclosure Auction Sales Increase –
IRVINE, Calif. – Nov. 26, 2014 — RealtyTrac® (www.realtytrac.com), the nation’s leading source for comprehensive housing data, today released its October 2014 Residential & Foreclosure Sales Report, which shows the median sales price of U.S. single family homes and condos in October was $193,000, up 2 percent from the previous month and up 16 percent from a year ago to the highest level since September 2008 — a 73-month high.

“This U.S. recovery is largely being driven by investors, and as the lower-priced, often distressed inventory most appealing to investors dries up in a given market, investor activity will slow down in that market and move to other markets with more ideal inventory available,” said Daren Blomquist, vice president at RealtyTrac. “This has created a ripple-effect recovery moving out from traditional investor hot spots such as Phoenix, Atlanta and many California markets and into markets such as Charlotte, Columbus, Ohio, Dallas and Oklahoma City.
“More than 32 percent of all single family homes and condos purchased so far in 2014 are non-owner occupied compared to 68 percent that are owner-occupied,” Blomquist added. “That is the highest share of investor purchases since we began tracking in 2001.”
The October median sales price — which included both distressed sales of homes in some stage of foreclosure and non-distressed sales — was up 37 percent from a trough of $141,000 in March 2012 but still 19 percent below the previous peak of $237,537 in August 2006. Among 97 metropolitan statistical areas with a population of 500,000 or more with sufficient home price data, 20 have reached new post-recession median sales price peaks in 2013 or 2014, including Denver, Pittsburgh, Columbus, Ohio, and Charlotte.
“Home prices have risen substantially in the lower price ranges — generally under $400,000. That has led most underwater properties out of trouble,” said Phil Shell, Managing Broker of RE/MAX Alliance, covering the Denver market, where median home prices reached a new post-recession peak in July 2014. “We are seeing a ‘compression’ in the market because we are experiencing record low inventories. Prices on the low end are coming up, and while the high end is not necessarily coming down, it has flat-lined. So we are seeing prices compress in the middle. A homeowner wanting to move up into the market at $550,000 or above will find substantial value and a terrific opportunity.”
The median sales price of distressed homes — those in the foreclosure process or bank-owned — was $128,701 nationwide in October, 36 percent below the median sales price of non-distressed properties, $200,000. But distressed home prices increased at a faster pace, up 18 percent from a year ago while non-distressed home prices were up 11 percent during the same time period.
“The demand is strong for a lessening distressed inventory and pushing prices to their highest level since 2008,” said Mike Pappas, CEO and president of the Keyes Company, covering the South Florida market. “Additionally, due to the long delay in our judicial foreclosure system we are now seeing a higher quality of distressed inventory being liquidated, although overall home prices have begun to gradually level off over the past few months as the market normalizes.”
Markets with highest home price appreciation
Among metro areas with a population of 500,000 or more and sufficient home price data, those with the biggest annual increase in median sales price were Toledo, Ohio (up 33 percent), Detroit (up 27 percent), Cleveland (up 21 percent), McAllen-Edinburg-Mission, Texas (up 21 percent), and Dayton, Ohio (up 20 percent).
Other major markets with double-digit appreciation compared to a year ago included Memphis, Tenn. (up 18 percent), Austin, Texas (up 17 percent), Miami (up 16 percent), Houston (up 16 percent), Cincinnati (up 15 percent), and Chicago (up 15 percent).
“While price appreciation has leveled off month to month, home prices have increased significantly from a year ago and we expect this trend to continue,” said Craig King, COO of Chase International, covering the Lake Tahoe and Reno, Nev., markets. The median sales price in Reno was unchanged from September to October but up 15 percent from a year ago — the 29th consecutive month with a year-over-year increase in the market.
“A number of things have lined up regionally to provide game changing growth as we look forward,” continued King. “The world is aware that Tesla is making a move in to Northern Nevada with their Giga factory, but there are other huge projects on tap as well. Collectively, these projects could account for population gains of 20 to 25 percent in the region over the next four to five years. With limited inventory the demand for housing will be unprecedented.”
Markets with accelerating home price appreciation
Home price appreciation accelerated in 45 of the 97 (46 percent) metro areas nationwide with a population of half a million or more and with sufficient home price data.
Markets with the fastest-accelerating appreciation included Cincinnati (15 percent annual appreciation this year compared to 4 percent annual depreciation last year), Cleveland (21 percent annual appreciation this year compared to 2 percent annual appreciation last year), Nashville (13 percent annual appreciation this year compared to 1 percent annual appreciation last year), Charlotte (10 percent annual appreciation this year compared to 1 percent annual depreciation last year), and Columbus, Ohio (14 percent annual appreciation this year compared to 3 percent annual appreciation last year.
Other major markets with accelerating home price appreciation were Chicago (15 percent annual appreciation this year compared to 11 percent a year ago), Dallas (11 percent annual appreciation this year compared to 7 percent a year ago), Pittsburgh (8 percent annual appreciation compared to 5 percent a year ago), Seattle (10 percent annual appreciation this year compared to 7 percent a year ago), Tampa (15 percent annual appreciation this year compared to 12 percent a year ago) and Baltimore (2 percent annual appreciation this year compared to 0 percent a year ago).
“The continued rise in Seattle median home prices is largely a result of a strong local economy, low housing supply, and high buyer demand,” said OB Jacobi, president of Windermere Real Estate, covering the Seattle market. The percentage of distressed home sales in Seattle has returned to pre-mortgage crisis levels, with activity being driven by the hardships that have always instigated short sales, such as job loss, divorce, illness, and job relocation. Most of the distressed properties have shifted into the outlying areas around Seattle and are selling for well under the median home price.”

Markets with slowing home price appreciation
Home price appreciation slowed compared to a year ago in 52 of the 97 (54 percent) metro areas nationwide with a population of half a million or more and with sufficient home price data.
Some of the fastest-appreciating markets in 2013 have seen substantial slowdowns in price appreciation this year, including Phoenix (6 percent annual appreciation in October 2014 compared to 25 percent a year ago), Los Angeles (9 percent annual appreciation this year compared to 24 percent a year ago), Oxnard-Thousand Oaks-Ventura in Southern California (7 percent annual appreciation this year compared to 24 percent a year ago), Jacksonville, Fla. (4 percent annual appreciation this year compared to 23 percent a year ago), Boston (3 percent annual appreciation this year compared to 21 percent a year ago), and San Diego (8 percent this year compared to 19 percent a year ago).
Other major markets with decelerating home price appreciation in October were New York (1 percent annual appreciation this year compared to 4 percent a year ago), Philadelphia (4 percent annual depreciation this year compared to 5 percent annual appreciation a year ago), Houston (16 percent annual appreciation this year compared to 27 percent a year ago), Miami (16 percent annual appreciation this year compared to 20 percent a year ago), Atlanta (13 percent annual appreciation this year compared to 25 percent a year ago), and San Francisco (12 percent annual appreciation this year compared to 34 percent a year ago).

Las Vegas, Central California and Central Florida post highest distressed sale share
Short sales and distressed sales — in foreclosure or bank-owned — combined accounted for 13.8 percent of all residential property sales in October, up slightly from 13.7 percent the previous month, but down from 14.7 percent in October 2013.
Markets with the highest percentage of distressed and short sales combined were Las Vegas (33.6 percent), Stockton, Calif., (33.6 percent), Modesto, Calif., (31.7 percent), Lakeland, Fla., (28.9 percent), and Orlando (28.4 percent).
Short sales share close to pre-recession levels nationwide, up from a year ago in 12 states
Short sales accounted for 5.0 percent of all residential property sales in October, unchanged from the previous month and a year ago and not far above the pre-recession average of 4.5 percent a month in 2006.
Markets with the highest percentage of short sales were in Orlando (14.2 percent), Lakeland, Fla., (13.0 percent), Palm bay-Melbourne-Titusville, Fla., (11.8 percent), Cape Coral-Fort Myers, Fla., (11.8 percent), and Las Vegas (11.5 percent).
Twelve states saw an increase in short sales share compared to a year ago, including New Jersey (7.1 percent compared to 4.6 percent a year ago), Illinois (9.9 percent compared to 6.6 percent a year ago), Maryland (9.3 percent compared to 7.2 percent a year ago), Ohio (5.4 percent compared to 4.7 percent a year ago), Nevada (10.8 percent compared to 9.8 percent a year ago), California (4.6 percent compared to 4.3 percent a year ago), Michigan (6.5 percent compared to 6.2 percent a year ago) and Arizona (5.8 percent compared to 5.6 percent a year ago).
Bank-owned sales share matches lowest level since January 2011
Sales of bank-owned properties nationwide accounted for 7.5 percent of all U.S. residential sales in October, the same as previous month but down from 9.1 percent a year ago. The share of bank-owned sales in September and October was the lowest share since January 2011.
Markets with the highest percentage of bank-owned sales were in Stockton, Calif. (23.5 percent), Modesto, Calif., (19.3 percent), Bakersfield, Calif., (18.8 percent), Las Vegas (18.6 percent), Riverside-San Bernardino, Calif., (18.3 percent), and Phoenix (16.4 percent).
“Distressed sales remain a small percentage of the overall marketplace in Southern California as prices stabilize and market health continues to improve,” said Chris Pollinger, senior vice president of sales at First Team Real Estate, covering the Southern California market.
Foreclosure auction sales share increases most in Midwest, Rust Belt cities
Sales at the public foreclosure auction accounted for 1.3 percent of all U.S. residential property sales in October, up from 1.2 percent in September and up from 0.7 percent in October 2013.
Markets with the highest percentage of sales at foreclosure auction were Lakeland, Fla. (5.4 percent), Orlando (4.2 percent), Palm Bay-Melbourne-Titusville (4.1 percent), Miami (4.1 percent), Tampa (4.0 percent) and Las Vegas (3.5 percent).
Markets with the biggest annual increases in share of foreclosure auctions were Des Moines (1.9 percent compared to 0.1 percent a year ago), Akron, Ohio (2.1 percent compared to 0.1 percent a year ago), Philadelphia (1.9 percent compared to 0.1 percent a year ago), Chattanooga, Tenn., (1.3 percent compared to 0.1 percent a year ago), and Fresno, Calif., (0.9 percent compared to 0.1 percent a year ago).
Major metros with an annual increase in share of foreclosure auction sales included Dallas (1.8 percent compared to 0.4 percent a year ago), Cincinnati (1.2 percent compared to 0.3 percent a year ago), Columbus (3.0 percent compared to 0.7 percent a year ago), San Antonio (1.5 percent compared to 0.4 percent a year ago), Cleveland (2.2 percent compared to 0.6 percent a year ago), Houston (1.6 percent compared to 0.6 percent a year ago), Jacksonville, Fla., (3.5 percent compared to 1.4 percent a year ago), Oklahoma City (1.3 percent compared to 0.8 percent a year ago), Virginia Beach (1.4 percent compared to 0.8 percent a year ago), and Atlanta (2.3 percent compared to 3.3 percent a year ago).
Report methodology
The RealtyTrac U.S. Residential Sales Report provides counts and median prices for sales of residential properties nationwide, by state and metropolitan statistical areas with a population of 500,000 or more. Data is also available at the county level upon request. The report also provides a breakdown of short sales, bank-owned sales and foreclosure auction sales to third parties. The data is derived from recorded sales deeds and loan data, which is used to determine cash sales and short sales. Sales counts for recent months are projected based on seasonality and expected number of sales records for those months that are not yet available from public record sources but will be in the future given historical patterns. Statistics for previous months are revised when each new monthly report is issued as more deed data becomes available for those previous months.
Definitions
Residential property sales: sales of single family homes, condominiums/town homes, and co-ops, not including multi-family properties.
Annualized sales: an annualized estimate of the number of residential property sales based on the actual number of sales deeds received for the month, accounting for expected sales records for that month that will be received in future months as well as seasonality.
Distressed sales: sale of a residential property that is actively in the foreclosure process or bank-owned when the sale is recorded.
Distressed discount: percentage difference between the median distressed sales price and the median non-distressed sales price in a given geographic area.
Bank-Owned sales: sales of residential properties that have been foreclosed on and are owned by the foreclosing lender (bank).
Short sales: sales of residential properties where the sale price is below the combined total of outstanding mortgages secured by the property.
Foreclosure Auction sales: sale of a property at the public foreclosure auction to a third party buyer that is not the foreclosing lender.
Report License
The RealtyTrac U.S. Residential & Foreclosure Sales report is the result of a proprietary evaluation of information compiled by RealtyTrac; the report and any of the information in whole or in part can only be quoted, copied, published, re-published, distributed and/or re-distributed or used in any manner if the user specifically references RealtyTrac as the source for said report and/or any of the information set forth within the report.
Data Licensing and Custom Report Order
Investors, businesses and government institutions can contact RealtyTrac to license bulk foreclosure and neighborhood data or purchase customized reports. For more information contact our Data Licensing Department at 800.462.5193![]() 800.462.5193 or datasales@realtytrac.com.
800.462.5193 or datasales@realtytrac.com.
About RealtyTrac
RealtyTrac is a leading supplier of U.S. real estate data, with nationwide parcel-level records for more than 129 million U.S. parcels that include property characteristics, tax assessor data, sales and mortgage deed records, Automated Valuation Models (AVMs) and 20 million active and historical default, foreclosure auction and bank-owned properties. RealtyTrac’s housing data and foreclosure reports are relied on by the Federal Reserve, U.S. Treasury Department, HUD, numerous state housing and banking departments, investment funds as well as millions of real estate professionals and consumers, to help evaluate housing trends and make informed decisions about real estate.
Media Contacts:
Jennifer von Pohlmann
949.502.8300![]() 949.502.8300, ext. 139
949.502.8300, ext. 139
jennifer.vonpohlmann@realtytrac.com
Ginny Walker
949.502.8300![]() 949.502.8300, ext. 268
949.502.8300, ext. 268
Ginny.walker@realtytrac.com
Data and Report Licensing:
800.462.5193![]() 800.462.5193
800.462.5193
datasales@realtytrac.com
As the generational war heats up, we should all remember the source of all the bubbles and all the policies that could only result in generational poverty: The Federal Reserve.
Federal Reserve chair Janet Yellen recently treated the nation to an astonishing lecture on the solution to rising wealth inequality–according to Yellen, low-income households should save capital and buy assets such as stocks and housing.
It’s difficult to know which is more insulting: her oily sanctimony or her callous disregard for facts. What Yellen and the rest of the Fed Mafia have done is inflate bubbles in credit and assets that have made housing unaffordable to all but the wealthiest households.
Fed policy has been especially destructive to young households: not only is it difficult to save capital when your income is declining in real terms, housing has soared out of reach as the direct consequence of Fed policies.
Two charts reflect this reality. The first is of median household income, the second is the Case-Shiller Index of housing prices for the San Francisco Bay Area.
I have marked the wage chart with the actual price of a modest 900 square foot suburban house in the S.F. Bay Area whose price history mirrors the Case-Shiller Index, with one difference: this house (and many others) are actually worth more now than they were at the top of the national bubble in 2006-7.
But that is a mere quibble. The main point is that housing exploded from 3 times median income to 12 times median income as a direct result of Fed policies. Lowering interest rates doesn’t make assets any more affordable–it pushes them higher.
The only winners in the housing bubble are those who bought in 1998 or earlier. The extraordinary gains reaped since the late 1990s have not been available to younger households. The popping of the housing bubble did lower prices from nosebleed heights, but in most locales price did not return to 1996 levels.
As a multiple of real (inflation-adjusted) income, in many areas housing is more expensive than it was at the top of the 2006 bubble.
While Yellen and the rest of the Fed Mafia have been enormously successful in blowing bubbles that crash with devastating consequences, they failed to move the needle on household income. Median income has actually declined since 2000.

Inflating asset bubbles shovels unearned gains into the pockets of those who own assets prior to the bubble, but it inflates those assets out of reach of those who don’t own assets–for example, people who were too young to buy assets at pre-bubble prices.

Inflating housing out of reach of young households as a matter of Fed policy isn’t simply unjust–it’s cruel. Fed policies designed to goose asset valuations as a theater-of-the-absurd measure of “prosperity” overlooked that it is only the older generations who bought all these assets at pre-bubble prices who have gained.
In the good old days, a 20% down payment was standard. How long will it take a young family to save $130,000 for a $650,000 house? How much of their income will be squandered in interest and property taxes for the privilege of owning a bubblicious-priced house?
If we scrape away the toxic sludge of sanctimony and misrepresentation from Yellen’s absurd lecture, we divine her true message: if you want a house, make sure you’re born to rich parents who bought at pre-bubble prices.
As the generational war heats up, we should all remember the source of all the bubbles and all the policies that could only result in generational poverty: The Federal Reserve.


You must be logged in to post a comment.