Tag Archives: Midland Texas

“It’s Crazy”: Midland Texas Roiled By Unprecedented Labor Shortage Hiring “Just About Anyone”

A battle is playing out in Midland, TX between employee-starved local businesses and multinational energy companies who are poaching local residents left and right for high-paying jobs as the latest Permian Basin shale-oil boom accelerates.

https://www.zerohedge.com/sites/default/files/inline-images/shale-extraction.jpg?itok=6EbGR0ag

Midland Mayor Jerry Morales says the boom is a double-edged sword; while the energy industry has increased sales-tax revenue by 34% year-over-year, an incredibly low unemployment rate of  2.1% has resulted in a severe shortage of low-paying jobs around town – such as the 100 open teaching positions, according to Bloomberg.

Morales, a native Midlander and second-generation restaurateur, has seen it happen so many times before. Oil prices go up, and energy companies dangle such incredible salaries that restaurants, grocery stores, hotels and other businesses can’t compete. People complain about poor service and long lines at McDonald’s and the Walmart and their favorite Tex-Mex joints. Rents soar. –Bloomberg

https://www.zerohedge.com/sites/default/files/inline-images/shalelow.JPG?itok=odFsD9t3

“This economy is on fire,” said Morales – who is also the proprietor of Mulberry Cafe and Gerardo’s Casita. Unfortunately, the fire is so hot that the Mayor is scrambling to fill open jobs – from local government positions, to cooks at his restaurants. 

In the country’s busiest oil patch, where the rig count has climbed by nearly one third in the past year, drillers, service providers and trucking companies have been poaching in all corners, recruiting everyone from police officers to grocery clerks. So many bus drivers with the Ector County Independent School District in nearby Odessa quit for the shale fields that kids were sometimes late to class. The George W. Bush Childhood Home, a museum in Midland dedicated to the 43rd U.S. president, is smarting from a volunteer shortage.

And it doesn’t take much to get hired by the oil industry – which, as Bloomberg summarizes, “will hire just about anyone with basic training“… and it will quickly double, triple or x-ple their pay in the process. “It is crazy” said Jazmin Jimenez, 24, who flew through a two-week training program at New Mexico Junior College about 100 miles north of Midland. Jimenez was hired by Chevron as a well-pump checker. “Honestly I never thought I’d see myself at an oilfield company. But now that I’m here — I think this is it.

And at $28-an-hour, Jimenez makes double what she was earning as a prison guard at the Lea County Correctional Facility in Hobbs. 

Meanwhile, innovations in oilfield technology promise to find new and efficient ways of finding and pulling oil from the pancaked lawyers of rock in the 75,000 square-mile Permian basin – an extraction method which now accounts for 30% of all US output

The booming shale economy has also effected the local real-estate market – as the supply of homes for sale is the lowest on record according to the Texas A&M Real Estate Center. 

The $325,440 average price in Midland is the highest since June 2014, the last time the world saw oil above $100 a barrel. Apartment rents in Midland and Odessa are up by more than a third from a year ago, with the average 863-square-foot unit commanding $1,272 a month.

People who move for jobs are stunned by the cost of living. Armin Rashvand’s apartment is smaller and costs more than the one he rented in Cleveland before moving last August to run the energy-technology program at Odessa College.

“That really surprised me,” he said, because Texas’s reputation is that it’s affordable. “In Texas, yes — except here.”

Some of Rashvand’s students with two-year degrees are making more than he does, despite his master’s degrees in science, electrical and electronic engineering.

Keep on truckin’

And for those who would rather work a bit further upstream from the oilfields, schools that teach how to pass the test for a commercial drivers license (CDL) are packed.  “A CDL is a golden ticket around here,” said Steve Sauceda, head of the workforce training program at New Mexico Junior College. “You are employable just about anywhere.

Truckers in the shale fields can easily make six-figures, such as Jeremiah Fleming, 30, who is on track to make $140,000 driving flatbed trucks for Aveda Transportation & Energy Services Inc., hauling rigs. 

“This will be my best year yet,” said Fleming, who used to work in the once-bustling shale play in North Dakota. “I wouldn’t want to go anywhere else.”

So what is Mayor Morales doing? 

In order to try and retain employees, Morales has come up with several strategies – such as weekly vs. twice-monthly paychecks, more opportunities for overtime, and a “common-sense pitch” to employees thinking of jumping ship for the oil fields: 

“If you’ll stay with me, I can give you three quarters of what the oil will give you but you don’t have to get dirty or worry about getting hurt.”

Source: ZeroHedge

***

‘Moving in droves’ to Midland, Texas
CNN’s famous 2013 Midland Texas oil boom report


‘Housing Bubble 2’ Has Bloomed Into Full Magnificence

The current housing boom has Dallas solidly in its grip. As in many cities around the US, prices are soaring, buyers are going nuts, sellers run the show, realtors are laughing all the way to the bank, and the media are having a field day. Nationwide, the median price of existing homes, at $236,400, as the National Association of Realtors sees it, is now 2.7% higher than it was even in July 2006, the insane peak of the crazy housing bubble that blew up with such spectacular results.

Housing Bubble 2 has bloomed into full magnificence: In many cities, the median price today is far higher, not just a little higher, than it was during the prior housing bubble, and excitement is once again palpable. Buy now, or miss out forever! A buying panic has set in.

And so the July edition of D Magazine – “Making Dallas Even Better,” is its motto – had this enticing cover, sent to me by David in Texas, titled, “The Great Dallas Land Rush”:

Dallas Land Rush

“Dallas Real Estate 2015: The Hottest Market Ever,” the subtitle says.

That’s true for many cities, including San Francisco. The “Boom Town,” as it’s now called, is where the housing market has gone completely out of whack, with a median condo price at $1.13 million and the median house price at $1.35 million. This entails some consequences [read… The San Francisco “Housing Crisis” Gets Ugly].

The fact that Housing Bubble 2 is now even more magnificent than the prior housing bubble, even while real incomes have stagnated or declined for all but the top earners, is another sign that the Fed, in its infinite wisdom, has succeeded elegantly in pumping up nearly all asset prices to achieve its “wealth effect.” And it continues to do so, come heck or high water. It has in this ingenious manner “healed” the housing market.

But despite the current “buying panic,” the soaring prices, and all the hoopla round them, there is a fly in the ointment: overall home ownership is plunging.

The home ownership rate dropped to 63.4% in the second quarter, not seasonally adjusted, according to a new report by the Census Bureau, down 1.3 percentage points from a year ago. The lowest since 1967!

home ownershipWolf Street

The process has been accelerating, instead of slowing down. The 1.2 percentage point plunge in 2014 was the largest annual drop in the history of the data series going back to 1965. And this year is on track to match this record: the drop over the first two quarters so far amounts to 0.6 percentage points. This accelerated drop in home ownership rates coincides with a sharp increase in home prices. Go figure.

The plunge in home ownership rates has spread across all age groups, but to differing degrees. Younger households have been hit the hardest. In the age group under 35, the home ownership rate in Q2 saw a slight uptick to 34.8%, from the dismal record low of 34.6% in the prior quarter. Either a feeble ray of hope or just one of the brief upticks, as in the past, to be succeeded by more down ticks on the way to lower lows.

This chart by the Economics and Strategy folks at National Bank Financial shows the different rates of home ownership by age group. The 35-year and under group is where the first-time buyers are concentrated; and they’re being sidelined, whether they have no interest in buying, or simply don’t make enough money to buy (represented by the sharply descending solid black line, left scale). Note how the oldest age group (dotted blue line, right scale) has recently started to cave as well:

homeownership ratesWolf Street

The bitter irony? In the same breath, the Census Bureau also reported that the rental vacancy rate dropped to 6.8%, from 7.5% a year ago, the lowest since 1985. America is turning into a country of renters.

This chart shows the dynamics between home ownership rates (black line, left scale) and rental vacancy rates (red line, right scale) over time: they essentially rise and dive together. It makes sense on an intuitive basis: as people abandon the idea of owning a home, they turn into renters, and the rental market tightens up, and vacancy rates decline.

homeownership rate v rental vacancy rateWolf Street

This too has been by design, it seems. Since 2012, private equity firms bought several hundred thousand vacant single-family homes in key markets, drove up prices in the process, and started to rent them out. Thousands of smaller investors have jumped into the fray, buying homes, driving up prices, and trying to rent them out. This explains the record median home price across the country, and the totally crazy price increases in some key markets, even as regular Americans are trying to figure out how to pay for a basic roof over their heads.

This has worked out well. By every measure, rents have jumped. According to the Census Bureau’s report, the median asking rent in the US rose 6.2% from a year ago, and 17.6% since 2011. So inflation bites. But the Fed is still desperately looking for signs of inflation and simply cannot find any.

And how much have incomes risen over these years to allow renters to meet these rising rents? OK, that was a rhetorical question. We already know what has been happening to incomes.

That’s what it always boils down to in the Fed’s salvation of the economy: people who can’t afford to pay the rising rents with their stagnant or declining incomes should borrow the money to make up the difference and then spend even more on consumer goods. After us, the deluge.

One Third Of U.S. Companies’ Q1 Job Cuts Due To Oil Prices

https://i0.wp.com/www.jobcutnews.com/wp-content/uploads/2011/10/pink-slips.jpgby Olivia Pulsinelli

Oil prices caused one-third of the job cuts that U.S.-based companies announced in the first quarter, according to a new report. March was the fourth month in a row to record a year-over-year increase in job cuts, Chicago-based outplacement consultancy Challenger, Gray & Christmas Inc. reports. And 47,610 of the 140,214 job cuts announced between January and March were directly attributed to falling oil prices. Not surprisingly, the energy sector accounted for 37,811 of the job cuts — up a staggering 3,900 percent from the same quarter a year earlier, when 940 energy jobs were cut. However, U.S. energy firms only announced 1,279 job cuts in March, down about 92 percent from the 16,339 announced in February and down nearly 94 percent from the 20,193 announced in January. The trend held true in Houston, where several energy employers announced job cuts in January and February, while fewer cuts were announced in March. Overall job-cut announcements are declining, as well. U.S. employers announced 36,594 job cuts in March, down 27.6 percent from the 50,579 announced in February and down 31 percent from the 53,041 announced in January. In December, 32,640 job cuts were announced. “Without these oil related cuts, we could have been looking one of lowest quarters for job-cutting since the mid-90s when three-month tallies totaled fewer than 100,000. However, the drop in the price of oil has taken a significant toll on oil field services, energy providers, pipelines, and related manufacturing this year,” John Challenger, CEO of Challenger, Gray & Christmas, said in a statement.

The U.S. Oil Boom Is Moving To A Level Not Seen In 45 Years

by Myra P. Saefong

Peak U.S. oil production is a ‘moving target’

SAN FRANCISCO (MarketWatch) — U.S. oil production is on track to reach an annual all-time high by September of this year, according to Rystad Energy. If production does indeed top out, then supply levels may soon hit a peak as well. That, in turn, could lead to shrinking supplies. The oil-and-gas consulting-services firm estimates an average 2015 output of 9.65 million barrels a day will be reached in five months — topping the previous peak annual reading of 9.64 million barrels a day in 1970. Coincidentally, the nation’s crude inventories stand at a record 471.4 million barrels, based on data from U.S. Energy Information Administration, also going back to the 1970s. The staggering pace of production from shale drilling and hydraulic fracturing have been blamed for the 46% drop in crude prices CLK5, -1.08% last year. But reaching so-called peak production may translate into a return to higher oil prices as supplies begin to thin.

Rystad Energy’s estimate includes crude oil and lease condensate (liquid hydrocarbons that enter the crude-oil stream after production), and assumes an average price of $55 for West Texas Intermediate crude oil. May WTI crude settled at $49.14 a barrel on Friday. The forecast peak production level in September is also dependent on horizontal oil rig counts for Bakken, Eagle Ford and Permian shale plays stabilizing at 400 rigs, notes Per Magnus Nysveen, senior partner and head of analysis at Rystad. Of course, in this case, hitting peak production isn’t assured. “Some will be debating whether the U.S. has reached its peak production for the current boom, without addressing the question of what level will U.S. production climb to in any future booms,” said Charles Perry, head of energy consultant Perry Management. “So one might also say U.S. peak production is a moving target.” James Williams, an energy economist at WTRG Economics, said that by his calculations, peak production may have already happened or may occur this month, since the market has seen a decline in North Dakota production, with Texas expected to follow.

Permian Basin Idles Five Rigs This Week

by Trevor Hawes

Drilling rig

The number of rigs exploring for oil and natural gas in the Permian Basin decreased five this week to 285, according to the weekly rotary rig count released Thursday by Houston-based oilfield services company Baker Hughes.

The North American rig count was released a day early this week because of the Good Friday holiday, according to the Baker Hughes website.

District 8 — which includes Midland and Ector counties — shed four rigs, bringing the total to 180. The district’s rig count is down 42.68 percent on the year. The Permian Basin is down 46.23 percent.

At this time last year, the Permian Basin had 524 rigs.

TEXAS

Texas’ count fell six this week, leaving 456 rigs statewide.

In other major Texas basins, there were 137 rigs in the Eagle Ford, unchanged; 29 in the Haynesville, down three; 23 in the Granite Wash, down one; and six in the Barnett, unchanged.

Texas had 877 rigs a year ago this week.

UNITED STATES

The number of rigs in the U.S. decreased 20 this week, bringing the nationwide total to 1,028.

There were 802 oil rigs, down 11; 222 natural gas rigs, down 11; and four rigs listed as miscellaneous, up two.

By trajectory, there were 136 vertical rigs, down eight; 799 horizontal rigs, down 13; and 93 directional rigs, up one. The last time the horizontal rig count fell below 800 was the week ending June 4, 2010, when Baker Hughes reported 798 rigs.

There were 993 rigs on land, down 17; four in inland waters, unchanged; and 31 offshore, down three. There were 29 rigs in the Gulf of Mexico, down four.

The U.S. had 1,818 rigs at this time last year.

TOP 5s

The top five states by rig count this week were Texas; Oklahoma with 129, down four; North Dakota with 90, down six; Louisiana with 67, down five; and New Mexico with 51, unchanged.

The top five rig counts by basin were the Permian; the Eagle Ford; the Williston with 91, down six; the Marcellus with 70, unchanged; and the Cana Woodford and Mississippian with 40 each. The Mississippian idled three rigs, while the Cana Woodford was unchanged. The Cana Woodford shale play is located in central Oklahoma.

CANADA AND NORTH AMERICA

The number of rigs operating in Canada fell 20 this week to 100. There were 20 oil rigs, up two; 80 natural gas rigs, down 22; and zero rigs listed as miscellaneous, unchanged.

The last time Canada’s rig count dipped below 100 was the week ending May 29, 2009, when 90 rigs were reported.

Canada had 235 rigs at this time last year.

The total number of rigs in the North America region fell 40 this week to 1,128. North America had 2,083 rigs a year ago this week.

Junk-Rated Oil & Gas Companies in a “Liquidity Death Spiral”

by Wolf Richter

https://ashwinikumar007.files.wordpress.com/2011/06/blackmoney.jpg

On the face of it, the oil price appears to be stabilizing. What a precarious balance it is, however.

Behind the facade of stability, the re-balancing triggered by the price collapse has yet to run its course, and it might be overly optimistic to expect it to proceed smoothly. Steep drops in the US rig count have been a key driver of the price rebound. Yet US supply so far shows precious little sign of slowing down. Quite to the contrary, it continues to defy expectations.

So said the International Energy Agency in its Oil Market Report on Friday. West Texas Intermediate plunged over 4% to $45 a barrel.

The boom in US oil production will continue “to defy expectations” and wreak havoc on the price of oil until the power behind the boom dries up: money borrowed from yield-chasing investors driven to near insanity by the Fed’s interest rate repression. But that money isn’t drying up yet – except at the margins.

Companies have raked in 14% more money from high-grade bond sales so far this year than over the same period in 2014, according to LCD. And in 2014 at this time, they were 27% ahead of the same period in 2013. You get the idea.

Even energy companies got to top off their money reservoirs. Among high-grade issuers over just the last few days were BP Capital, Valero Energy, Sempra Energy, Noble, and Helmerich & Payne. They’re all furiously bringing in liquidity before it gets more expensive.

In the junk-bond market, bond-fund managers are chasing yield with gusto. Last week alone, pro-forma junk bond issuance “ballooned to $16.48 billion, the largest weekly tally in two years,” the LCD HY Weekly reported. Year-to-date, $79.2 billion in junk bonds have been sold, 36% more than in the same period last year.

But despite this drunken investor enthusiasm, the bottom of the energy sector – junk-rated smaller companies – is falling out.

Standard & Poor’s rates 170 bond issuers that are engaged in oil and gas exploration & production, oil field services, and contract drilling. Of them, 81% are junk rated – many of them deep junk. The oil bust is now picking off the smaller junk-rated companies, one after the other, three of them so far in March.

On March 3, offshore oil-and-gas contractor CalDive that in 2013 still had 1,550 employees filed for bankruptcy. It’s focused on maintaining offshore production platforms. But some projects were suspended last year, and lenders shut off the spigot.

On March 8, Dune Energy filed for bankruptcy in Austin, TX, after its merger with Eos Petro collapsed. It listed $144 million in debt. Dune said that it received $10 million Debtor in Possession financing, on the condition that the company puts itself up for auction.

On March 9, BPZ Resources traipsed to the courthouse in Houston to file for bankruptcy, four days after I’d written about its travails; it had skipped a $60 million payment to its bondholders [read… “Default Monday”: Oil & Gas Companies Face Their Creditors].

And more companies are “in the pipeline to be restructured,” LCD reported. They all face the same issues: low oil and gas prices, newly skittish bond investors, and banks that have their eyes riveted on the revolving lines of credit with which these companies fund their capital expenditures. Being forever cash-flow negative, these companies periodically issue bonds and use the proceeds to pay down their revolver when it approaches the limit. In many cases, the bank uses the value of the company’s oil and gas reserves to determine that limit.

If the prices of oil and gas are high, those reserves have a high value. It those prices plunge, the borrowing base for their revolving lines of credit plunges. S&P Capital IQ explained it this way in its report, “Waiting for the Spring… Will it Recoil”:

Typically, banks do their credit facility redeterminations in April and November with one random redetermination if needed. With oil prices plummeting, we expect banks to lower their price decks, which will then lead to lower reserves and thus, reduced borrowing-base availability.

April is coming up soon. These companies would then have to issue bonds to pay down their credit lines. But with bond fund managers losing their appetite for junk-rated oil & gas bonds, and with shares nearly worthless, these companies are blocked from the capital markets and can neither pay back the banks nor fund their cash-flow negative operations. For many companies, according to S&P Capital IQ, these redeterminations of their credit facilities could lead to a “liquidity death spiral.”

Alan Holtz, Managing Director in AlixPartners’ Turnaround and Restructuring group told LCD in an interview:

We are already starting to see companies that on the one hand are trying to work out their operational problems and are looking for financing or a way out through the capital markets, while on the other hand are preparing for the events of contingency planning or bankruptcy.

Look at BPZ Resources. It wasn’t able to raise more money and ended up filing for bankruptcy. “I think that is going to be a pattern for many other companies out there as well,” Holtz said.

When it trickled out on Tuesday that Hercules Offshore, which I last wrote about on March 3, had retained Lazard to explore options for its capital structure, its bonds plunged as low as 28 cents on the dollar. By Friday, its stock closed at $0.41 a share.

When Midstates Petroleum announced that it had hired an interim CEO and put a restructuring specialist on its board of directors, its bonds got knocked down, and its shares plummeted 33% during the week, closing at $0.77 a share on Friday.

When news emerged that Walter Energy hired legal counsel Paul Weiss to explore restructuring options, its first-lien notes – whose investors thought they’d see a reasonable recovery in case of bankruptcy – dropped to 64.5 cents on the dollar by Thursday. Its stock plunged 63% during the week to close at $0.33 a share on Friday.

Numerous other oil and gas companies are heading down that path as the oil bust is working its way from smaller more vulnerable companies to larger ones. In the process, stockholders get wiped out. Bondholders get to fight with other creditors over the scraps. But restructuring firms are licking their chops, after a Fed-induced dry spell that had lasted for years.

Investors Crushed as US Natural Gas Drillers Blow Up

by Wolf Richter

The Fed speaks, the dollar crashes. The dollar was ripe. The entire world had been bullish on it. Down nearly 3% against the euro, before recovering some. The biggest drop since March 2009. Everything else jumped. Stocks, Treasuries, gold, even oil.

West Texas Intermediate had been experiencing its biggest weekly plunge since January, trading at just above $42 a barrel, a new low in the current oil bust. When the Fed released its magic words, WTI soared to $45.34 a barrel before re-sagging some. Even natural gas rose 1.8%. Energy related bonds had been drowning in red ink; they too rose when oil roared higher. It was one heck of a party.

But it was too late for some players mired in the oil and gas bust where the series of Chapter 11 bankruptcy filings continues. Next in line was Quicksilver Resources.

It had focused on producing natural gas. Natural gas was where the fracking boom got started. Fracking has a special characteristic. After a well is fracked, it produces a terrific surge of hydrocarbons during first few months, and particularly on the first day. Many drillers used the first-day production numbers, which some of them enhanced in various ways, in their investor materials. Investors drooled and threw more money at these companies that then drilled this money into the ground.

But the impressive initial production soon declines sharply. Two years later, only a fraction is coming out of the ground. So these companies had to drill more just to cover up the decline rates, and in order to drill more, they needed to borrow more money, and it triggered a junk-rated energy boom on Wall Street.

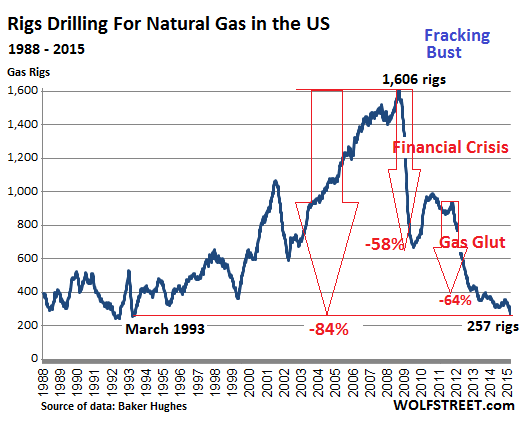
At the time, the price of natural gas was soaring. It hit $13 per million Btu at the Henry Hub in June 2008. About 1,600 rigs were drilling for gas. It was the game in town. And Wall Street firms were greasing it with other people’s money. Production soared. And the US became the largest gas producer in the world.

https://martinhladyniuk.files.wordpress.com/2015/03/be197-deathspiral2.jpg

But then the price began to plunge. It recovered a little after the Financial Crisis but re-plunged during the gas “glut.” By April 2012, natural gas had crashed 85% from June 2008, to $1.92/mmBtu. With the exception of a few short periods, it has remained below $4/mmBtu – trading at $2.91/mmBtu today.

Throughout, gas drillers had to go back to Wall Street to borrow more money to feed the fracking orgy. They were cash-flow negative. They lost money on wells that produced mostly dry gas. Yet they kept up the charade. They aced investor presentations with fancy charts. They raved about new technologies that were performing miracles and bringing down costs. The theme was that they would make their investors rich at these gas prices.

The saving grace was that oil and natural-gas liquids, which were selling for much higher prices, also occur in many shale plays along with dry gas. So drillers began to emphasize that they were drilling for liquids, not dry gas, and they tried to switch production to liquids-rich plays. In that vein, Quicksilver ventured into the oil-rich Permian Basin in Texas. But it was too little, too late for the amount of borrowed money it had already burned through over the years by fracking for gas below cost.

During the terrible years of 2011 and 2012, drillers began reclassifying gas rigs as rigs drilling for oil. It was a judgement call, since most wells produce both. The gas rig count plummeted further, and the oil rig count skyrocketed by about the same amount. But gas production has continued to rise since, even as the gas rig count has continued to drop. On Friday, the rig count was down to 257 gas rigs, the lowest since March 1993, down 84% from its peak in 2008.

US-rig-count_1988_2015-03-13=gas

Quicksilver’s bankruptcy is a consequence of this fracking environment. It listed $2.35 billion in debts. That’s what is left from its borrowing binge that covered its negative cash flows. It listed only $1.21 billion in assets. The rest has gone up in smoke.

Its shares are worthless. Stockholders got wiped out. Creditors get to fight over the scraps.

Its leveraged loan was holding up better: the $625 million covenant-lite second-lien term loan traded at 56 cents on the dollar this morning, according to S&P Capital IQ LCD. But its junk bonds have gotten eviscerated over time. Its 9.125% senior notes due 2019 traded at 17.6 cents on the dollar; its 7.125% subordinated notes due 2016 traded at around 2 cents on the dollar.

Among its creditors, according to the Star Telegram: the Wilmington Trust National Association ($361.6 million), Delaware Trust Co. ($332.6 million), US Bank National Association ($312.7 million), and several pipeline companies, including Oasis Pipeline and Energy Transfer Fuel.

Last year, it hired restructuring advisers. On February 17, it announced that it would not make a $13.6 million interest payment on its senior notes and invoked the possibility of filing for Chapter 11. It said it would use its 30-day grace period to haggle with its creditors over the “company’s options.”

Now, those 30 days are up. But there were no other “viable options,” the company said in the statement. Its Canadian subsidiary was not included in the bankruptcy filing; it reached a forbearance agreement with its first lien secured lenders and has some breathing room until June 16.

Quicksilver isn’t alone in its travails. Samson Resources and other natural gas drillers are stuck neck-deep in the same frack mud.

A group of private equity firms, led by KKR, had acquired Samson in 2011 for $7.2 billion. Since then, Samson has lost $3 billion. It too hired restructuring advisers to deal with its $3.75 billion in debt. On March 2, Moody’s downgraded Samson to Caa3, pointing at “chronically low natural gas prices,” “suddenly weaker crude oil prices,” the “stressed liquidity position,” and delays in asset sales. It invoked the possibility of “a debt restructuring” and “a high risk of default.”

But maybe not just yet. The New York Post reported today that, according to sources, a JPMorgan-led group, which holds a $1 billion revolving line of credit, is granting Samson a waiver for an expected covenant breach. This would avert default for the moment. Under the deal, the group will reduce the size of the revolver. Last year, the same JPMorgan-led group already reduced the credit line from $1.8 billion to $1 billion and waived a covenant breach.

By curtailing access to funding, they’re driving Samson deeper into what S&P Capital IQ called the “liquidity death spiral.” According to the New York Post’s sources, in August the company has to make an interest payment to its more junior creditors, “and may run out of money later this year.”

Industry soothsayers claimed vociferously over the years that natural gas drillers can make money at these prices due to new technologies and efficiencies. They said this to attract more money. But Quicksilver along with Samson Resources and others are proof that these drillers had been drilling below the cost of production for years. And they’d been bleeding every step along the way. A business model that lasts only as long as new investors are willing to bail out old investors.

But it was the crash in the price of “liquids” that made investors finally squeamish, and they began to look beyond the hype. In doing so, they’re triggering the very bloodletting amongst each other that ever more new money had delayed for years. Only now, it’s a lot more expensive for them than it would have been three years ago. While the companies will get through it in restructured form, investors get crushed.


Oil Production Falling In Three Big Shale Plays, EIA Says

HOUSTON – It’s official: The shale oil boom is starting to waver.

And, in a way, it may have souped-up rigs and more efficient drilling technologies to thank for that.

Crude production at three major U.S. shale oil fields is projected to fall this month for the first time in six years, the U.S. Energy Information Administration said Tuesday.

It’s one of the first signs that idling hundreds of drilling rigs and billions of dollars in corporate cutbacks are starting to crimp the nation’s surging oil patch.

But it also shows that drilling technology and techniques have advanced to the point that productivity gains may be negligible in some shale plays where horizontal drilling and hydraulic fracturing have been used together for the past several years.

Because some plays are already full of souped-up horizontal rigs, oil companies don’t have as many options to become more efficient and stem production losses, as they did in the 2008-2009 downturn, the EIA said.

The EIA’s monthly drilling productivity report indicates that rapid production declines from older wells in three shale plays are starting to overtake new output, as oil companies drill fewer wells.

In the recession six years ago, the falling rig count didn’t lead to declining production because new technologies boosted how fast rigs could drill wells.

But now that oil firms have figured out how to drill much more efficiently, “it is not clear that productivity gains will offset rig count declines to the same degree as in 2008-09,” the EIA said.

Energy Information Agency

Overall, U.S. oil production is set to increase slightly from March to April to 5.6 million barrels a day in six major fields, according to the EIA.

But output is falling in the Eagle Ford Shale in South Texas, North Dakota’s Bakken Shale and the Niobrara Shale in Colorado, Wyoming, Nebraska and Kansas.

In those three fields, net production is expected to drop by a combined 24,000 barrels a day.

The losses were masked by production gains in the Permian Basin in West Texas and other regions.

Efficiency improvements are still emerging in the Permian, faster than in other oil fields because the region was largely a vertical-drilling zone as recently as December 2013, the EIA said.

Net crude output in the Bakken is expected to decline by 8,000 barrels a day from March to April. In the Eagle Ford, it’s slated to fall by 10,000 barrels a day. And in the Niobrara, production will dip by roughly 5,000 barrels a day.

But daily crude output jumped by 21,000 barrels in the Permian and by 3,000 barrels in the Utica Shale in Ohio and Pennsylvania.

Read more at MRT.com

Tenants Benefit When Rent Payment Data Are Factored Into Credit Scores

by Kenneth R. Harney | LA Times

It’s the great credit divide in American housing: If you buy a home and pay your mortgage on time regularly, your credit score typically benefits. If you rent an apartment and pay the landlord on time every month, you get no boost to your score. Since most landlords aren’t set up or approved to report rent payments to the national credit bureaus, their tenants’ credit scores often suffer as a direct result.

All this has huge implications for renters who hope one day to buy a house. To qualify for a mortgage, they’ll need good credit scores. Young, first-time buyers are especially vulnerable — they often have “thin” credit files with few accounts and would greatly benefit by having their rent histories included in credit reports and factored into their scores. Without a major positive such as rent payments in their files, a missed payment on a credit card or auto loan could have significant negative effects on their credit scores.

You probably know folks like these — sons, daughters, neighbors, friends. Or you may be one of the casualties of the system yourself, a renter with a perfect payment history that creditors will never see when they pull your credit. Think of it this way and the great divide gets intensely personal.

But here’s some good news: Growing numbers of landlords are now reporting rent payments to the bureaus with the help of high-tech intermediaries who set up electronic rent-collection systems for tenants.

One of these, RentTrack, says it already has coverage in thousands of rental buildings nationwide, with a total of 100,000-plus apartment units, and expects to be reporting rent payments for more than 1 million tenants within the year. Two others, ClearNow Inc. and PayYourRent, also report to one of the national bureaus, Experian, which includes the data in consumer credit files. RentTrack reports to Experian and TransUnion.

Why does this matter? Two new studies illustrate what can happen when on-time rent payments are factored into consumers’ credit reports and scores. RentTrack examined a sample of the tenants in its database and found that 100% of renters who previously were rated as “unscoreable” — there wasn’t enough information in their credit files to evaluate — became scoreable once they had two months to six months of rental payments reported to the credit bureaus.

https://i0.wp.com/blog.phroogal.com/wp-content/uploads/2013/05/CreditScoreRanges.png

Tenants who had scores below 650 at the start of the sampling gained an average of 29 points with the inclusion of positive monthly payment data. Overall, residents in all score brackets saw an average gain of 9 points. The scores were computed using the VantageScore model, which competes with FICO scores and uses a similar 300 to 850 scoring scale, with high scores indicating low risk of nonpayment.

Experian, the first major credit bureau to begin integrating rental payment records into credit files, also completed a major study recently. Using a sample of 20,000 tenants who live in government-subsidized apartment buildings, Experian found that 100% of unscoreable tenants became scoreable, and that 97% of them had scores in the “prime” (average 688) and “non-prime” (average 649) categories. Among tenants who had scores before the start of the research, fully 75% saw increases after the addition of positive rental information, typically 11 points or higher.

Think about what these two studies are really saying: Tenants often would score higher — sometimes significantly higher — if rent payments were reported to the national credit bureaus. Many deserve higher credit scores but don’t get them.

Matt Briggs, chief executive and founder of RentTrack, says for many tenants, their steady rent payments “may be the only major positive thing in their credit report,” so including them can be crucial when lenders pull their scores.

Justin Yung, vice president of ClearNow, told me that “for most [tenants] the rent is the largest payment they make per month and yet it doesn’t appear on their credit report” unless their landlord has signed up with one of the electronic payment firms.

Is this something difficult or complicated? Not really. You, your landlord or property manager can go to one of the three companies’ websites (RentTrack.com, ClearNow.com and PayYourRent.com), check out the procedures and request coverage. Costs to tenants are either minimal or zero, and the benefits to the landlord of having tenants pay rents electronically appear to be attractive.

Everybody benefits. So why not?

kenharney@earthlink.net Distributed by Washington Post Writers Group. Copyright © 2015, Los Angeles Times

Dreaming Big: Americans Still Yearning for Larger Homes

by Ralph McLaughlin | Trulia

https://i0.wp.com/media-cache-ec0.pinimg.com/736x/4e/db/ef/4edbef39bc7ca7378eb266f56b71a350.jpg

43% of adults would prefer homes bigger than where they currently live, but attitudes differ by age. Baby boomers would prefer to upsize rather than downsize by only a small margin, while the gap among millennials is much wider, with GenXers falling in between. Would-be downsizers outnumber upsizers only among households living in the largest homes.

Last year, we found that Baby Boomers were especially unlikely to live in multi-unit housing. At the same time, we noted that the share of seniors living in multi-unit housing rather than single-family homes has been shrinking for decades. These findings got us thinking about how the generations vary in house-size preference. So we surveyed over 2000 people at the end of last year to figure out if boomers have different house-size preferences than their younger counterparts. And that led us to ask: What size homes do Americans really want?

Image 1

Most Americans are not living in the size home they want

https://i0.wp.com/tinyhouseblog.com/wp-content/uploads/2011/06/Rustic-guest-cottage-8.jpg

As a whole, Americans are living in a world of mismatch – only 40% of our respondents said they are living in the size home that’s ideal. Furthermore, over 43% answered that the size of their ideal residence is somewhat or much larger than their current digs. Only 16% told us that their ideal residence is smaller than their existing home. However, these overall figures mask what is going on within different generations.

It’s natural to think that baby boomers are the generation most likely to downsize.  After all, their nests are emptying and they may move when they retire.  As it turns out though, more boomers would prefer to live in a larger home than a smaller one: 21% said their ideal residence is smaller than their current home, while 26% wanted a larger home – a 5-percentage-point difference. Clearly, boomers don’t feel a massive yearn to downsize. On the contrary, just over half (53%) said they’re already living in their ideally sized home. Nonetheless, members of this generation are more likely to want to downsize than millennials and GenXers.

In fact, those younger generations want some elbow room. First, the millennials. They’re looking to move on up by a big margin: just over 60% told us their ideal residence is larger than where they live now – the largest proportion among the generations in our sample. By contrast, only a little over 13% of millennials said they’d rather have a smaller home than their existing one – which is also the smallest among the generations in our sample. The results are clear: millennials are much more likely to want to upsize than downsize.

The next generation up the ladder, the GenXers, are hitting their peak earning years and many in this group may be in a position to trade up. Many aren’t living in their ideally sized home. Just 38% said where they live now is dream sized. Nearly a majority (48%) said their dream home is larger, while only 14% of GenXers would rather have a smaller home.  This is the generation that bore the brunt of the foreclosure crisis. So, some of this mismatch could be because a significant number of GenXers lost homes during the housing bust and may now be living in smaller-than-desired quarters. But a much more probable reason is that many GenXers are in their peak child-rearing years. With kids bouncing off the walls, the place may be feeling a tad crowded.

Even the groups that seem ripe for downsizing don’t want smaller homes

Of course, age doesn’t tell the whole story about why people might want to downsize. It could be that certain kinds of households, – such as those without children, and living in the suburbs or in affordable areas – might be more likely to live in larger homes than they need. But our survey shows that households in these categories are about twice as likely to want a larger than a smaller home. For those with kids especially, the desire to upsize is strong: 39% preferred a larger home versus 18% who liked a smaller home.  For those living in the suburbs, the disparity is even greater – 42% to 16%. And even among those living in the most affordable zip codes, where ideally-sized homes might be within the budgets of households, 40% of our respondents preferred larger homes versus 20% who said smaller.

Image 2

Are all households more likely to upsize than downsize?

At this point you might be asking, “Are there any types of households that want to downsize?” The answer is yes. But only one kind of household falls into this category – those living in homes larger than 3,200 square feet.  Of this group, 26% wanted to downsize versus 25% that wanted to upsize – a slight difference. But, when we looked overall at survey responses based on the size of current residence, households wanting a larger home kicked up as current home size went down. We can see this clearly when we divide households into six groups based on the size of the home they’re living in now. Among households living in 2,600-3,200 square foot homes, 37% prefer a larger home versus 16% a smaller home; in 2,000–2,600 square foot homes, its 34% to 18%; 38% to 18% in 1,400–2,000 square foot homes; 55% to 13% in 800–1,400 square foot homes; and 66% to 13% in homes less than 800 square feet. This makes intuitive sense.  Those living in the biggest homes are most likely to have gotten a home larger than their ideal size. And those in the smallest homes are probably the ones feeling most squeezed.

Image 3 (2)

The responses to our survey show significantly more demand for larger homes than for smaller ones. But the reality, of course, is that households must make tradeoffs between things like accessibility, amenities, and affordability when choosing what size homes to get. The “ideal” sized home for most Americans may be larger than where they’re living now. But that spacious dream home may not be practical.  As result, the mismatch between what Americans say they want and what best suits their circumstances may persist.

Oil Glut Gets Worse – Production, Inventories Soar to Record

https://i0.wp.com/bloximages.newyork1.vip.townnews.com/oaoa.com/content/tncms/assets/v3/editorial/9/14/914424e8-aaf0-11e4-ac1c-b74346c3e35b/54cf9855658eb.image.jpgby Wolf Richter

February 4th, 2015: Crude oil had rallied 20% in three days, with West Texas Intermediate jumping $9 a barrel since Friday morning, from $44.51 a barrel to $53.56 at its peak on Tuesday. “Bull market” was what we read Tuesday night. The trigger had been the Baker Hughes report of active rigs drilling for oil in the US, which had plummeted by the most ever during the latest week. It caused a bout of short covering that accelerated the gains. It was a truly phenomenal rally!

But the weekly rig count hasn’t dropped nearly enough to make a dent into production. It’s down 24% from its peak in October. During the last oil bust, it had dropped 60%. It’s way too soon to tell what impact it will have because for now, production of oil is still rising.

And that phenomenal three-day 20% rally imploded today when it came in contact with another reality: rising production, slack demand, and soaring crude oil inventories in the US.

The Energy Information Administration reported that these inventories (excluding the Strategic Petroleum Reserve) rose by another 6.3 million barrels last week to 413.1 million barrels – the highest level in the weekly data going back to 1982. Note the increasingly scary upward trajectory that is making a mockery of the 5-year range and seasonal fluctuations:

US-crude-oil-stocks-2015-02-04
And there is still no respite in sight.

Oil production in the US is still increasing and now runs at a multi-decade high of 9.2 million barrels a day. But demand for petroleum products, such as gasoline, dropped last week, according to the EIA, and so gasoline inventories jumped by 2.3 million barrels. Disappointed analysts, who’d hoped for a drop of 300,000 barrels, blamed the winter weather in the East that had kept people from driving (though in California, the weather has been gorgeous). And inventories of distillate, such as heating oil and diesel, rose by 1.8 million barrels. Analysts had hoped for a drop of 2.2 million barrels.

In response to this ugly data, WTI plunged $4.50 per barrel, or 8.5%, to $48.54 as I’m writing this. It gave up half of the phenomenal three-day rally in a single day.

Macquarie Research explained it this way:

In our experience, oil markets rarely exhibit V-shaped recoveries and we would be surprised if an oversupply situation as severe as the current one was resolved this soon. In fact, our balances indicate the absolute oversupply is set to become more severe heading into 2Q15.

Those hoping for a quick end to the oil glut in the US, and elsewhere in the world, may be disappointed because there is another principle at work – and that principle has already kicked in.

As the price has crashed, oil companies aren’t going to just exit the industry. Producing oil is what they do, and they’re not going to switch to selling diapers online. They’re going to continue to produce oil, and in order to survive in this brutal pricing environment, they have to adjust in a myriad ways.

“Efficiency and innovation, when price falls, it accelerates, because necessity is the mother of invention,” Michael Masters, CEO of Masters Capital Management, explained to FT Alphaville on Monday, in the middle of the three-day rally. “Even if the investment only spits out quarters, or even nickels, you don’t turn it off.”

Crude has been overvalued for over five years, he said. “Whenever the return on capital is in the high double digits, that’s not sustainable in nature.” And the industry has gotten fat during those years.

Now, the fat is getting trimmed off. To survive, companies are cutting operating costs and capital expenditures, and they’re shifting the remaining funds to the most productive plays, and they’re pushing 20% or even 30% price concessions on their suppliers, and the damage spreads in all directions, but they’ll keep producing oil, maybe more of it than before, but more efficiently.

This is where American firms excel: using ingenuity to survive. The exploration and production sector has been through this before. And those whose debts overwhelm them – and there will be a slew of them – will default and restructure, wiping out stockholders and perhaps junior debt holders, and those who hold the senior debt will own the company, minus much of the debt. The groundwork is already being done, as private equity firms and hedge funds offer credit to teetering oil companies at exorbitant rates, with an eye on the assets in case of default.

And these restructured companies will continue to produce oil, even if the price drops further.

So Masters said that, “in our view, production will not decrease but increase,” and that increased production “will be around a lot longer than people are forecasting right now.”

After the industry goes through its adjustment process, focused on running highly efficient operations, it can still scrape by with oil at $45 a barrel, he estimated, which would keep production flowing and the glut intact. And the market has to appreciate that possibility.


Rigs Down By 21% Since Start Of 2015
Permian Basin loses 37 rigs first week in February

by Trevor Hawes

The number of rigs exploring for oil and natural gas in the Permian Basin fell 37 this week to 417, according to the weekly rotary rig count released Friday by Houston-based oilfield service company Baker Hughes.

This week’s count marked the ninth-consecutive decrease for the Permian Basin. The last time Baker Hughes reported a positive rig-count change was Dec. 5, when 568 rigs were reported. Since then, the Permian Basin has shed 151 rigs, a decrease of 26.58 percent.

For the year, the Permian Basin has shed 113 rigs, or 21.32 percent.

In District 8, which includes Midland and Ector counties, the rig count fell 19 this week to 256. District 8 has shed 58 rigs, 18.47 percent, this year.

Texas lost 41 rigs this week for a statewide total of 654. The Lone Star State has 186 fewer rigs since the beginning of the year, a decrease of 22.14 percent.

In other major Texas basins, there were 168 rigs in the Eagle Ford, down 10; 43 in the Haynesville, unchanged; 39 in the Granite Wash, down one; and 19 in the Barnett, unchanged.

The Haynesville shale is the only major play in Texas to have added rigs this year. The East Texas play started 2015 with 40 rigs.

At this time last year, there were 483 rigs in the Permian Basin and 845 in Texas.

In the U.S., there were 1,456 rigs this week, a decrease of 87. There were 1,140 oil rigs, down 83; 314 natural gas rigs, down five; and two rigs listed as miscellaneous, up one.

By trajectory, there were 233 vertical drilling rigs, down two; 1,088 horizontal drilling rigs, down 80; and 135 directional drilling rigs, down five.

The top five states by rig count this week were Texas; Oklahoma with 176, down seven; North Dakota with 132, down 11; Louisiana with 107, down one; and New Mexico with 78, down nine.

The top five basins were the Permian; the Eagle Ford; the Williston with 137, down 11; the Marcellus with 71, down four; and the Mississippian with 53, down one.

In the U.S., there were 1,397 rigs on land, down 85; nine in inland waters, down three; and 50 offshore, up one. There were 48 rigs in the Gulf of Mexico, up one.

Canada’s rig count fell 13 this week to 381. There were 184 oil rigs, down 16; 197 natural gas rigs, up three; and zero rigs listed as miscellaneous, unchanged. Canada had 621 rigs a year ago this week, a difference of 240 rigs compared to this week’s count.

The number of rigs exploring for oil and natural gas in the North America region, which includes the U.S. and Canada, fell 100 this week to 1,837. There were 2,392 rigs in North America last year.

Rigs worldwide

On Friday, Baker Hughes released its monthly international rig count for January. The worldwide total was 3,309 rigs. The U.S. ended January with 1,683 rigs, just more than half of all rigs worldwide.

The following are January’s rig counts by region, with the top three nations in each region in parentheses:

Africa: 132 (Algeria: 97; Nigeria: 19; Angola: 14)

Asia-Pacific: 232 (India: 108; Indonesia: 36; China offshore: 33)

Europe: 128 (Turkey: 37; United Kingdom offshore: 15; Norway: 13)

Latin America: 351 (Argentina: 106; Mexico: 69; Venezuela: 64)

Middle East: 415 (Saudi Arabia: 119; Oman: 61; Iraq: 60)

Odessa migrant worker 1937

Migrant oil worker and wife near Odessa, Texas 1937

Photographer: Dorothea Lange Created: May 1937 Location: OdessaTexas

Call Number: LC-USF34-016932 Source: MRT.com

Bank of America Sees $50 Oil As OPEC Dies

“Our biggest worry is the end of the liquidity cycle. The Fed is done. The reach for yield that we have seen since 2009 is going into reverse”, said Bank of America.

https://i0.wp.com/media0.faz.net/ppmedia/aktuell/wirtschaft/759001933/1.2727518/article_multimedia_overview/umweltpolitisch-hoch-umstritten-hilft-fracking-hier-in-colorado-amerika-dabei-unabhaengiger-von-den-opec-mitgliedern-zu-werden.jpgBy Ambrose Evans-Pritchard

The OPEC oil cartel no longer exists in any meaningful sense and crude prices will slump to $50 a barrel over the coming months as market forces shake out the weakest producers, Bank of America has warned.

Revolutionary changes sweeping the world’s energy industry will drive down the price of liquefied natural gas (LNG), creating a “multi-year” glut and a much cheaper source of gas for Europe.

Francisco Blanch, the bank’s commodity chief, said OPEC is “effectively dissolved” after it failed to stabilize prices at its last meeting. “The consequences are profound and long-lasting,“ he said.

The free market will now set the global cost of oil, leading to a new era of wild price swings and disorderly trading that benefits only the Mid-East petro-states with deepest pockets such as Saudi Arabia. If so, the weaker peripheral members such as Venezuela and Nigeria are being thrown to the wolves.

The bank said in its year-end report that at least 15pc of US shale producers are losing money at current prices, and more than half will be under water if US crude falls below $55. The high-cost producers in the Permian basin will be the first to “feel the pain” and may soon have to cut back on production.

The claims pit Bank of America against its arch-rival Citigroup, which insists that the US shale industry is far more resilient than widely supposed, with marginal costs for existing rigs nearer $40, and much of its output hedged on the futures markets.

Bank of America said the current slump will choke off shale projects in Argentina and Mexico, and will force retrenchment in Canadian oil sands and some of Russia’s remote fields. The major oil companies will have to cut back on projects with a break-even cost below $80 for Brent crude.

It will take six months or so to whittle away the 1m barrels a day of excess oil on the market – with US crude falling to $50 – given that supply and demand are both “inelastic” in the short-run. That will create the beginnings of the next shortage. “We expect a pretty sharp rebound to the high $80s or even $90 in the second half of next year,” said Sabine Schels, the bank’s energy expert.

Mrs Schels said the global market for (LNG) will “change drastically” in 2015, going into a “bear market” lasting years as a surge of supply from Australia compounds the global effects of the US gas saga.

If the forecast is correct, the LNG flood could have powerful political effects, giving Europe a source of mass supply that can undercut pipeline gas from Russia. The EU already has enough LNG terminals to cover most of its gas needs. It has not been able to use this asset as a geostrategic bargaining chip with the Kremlin because LGN itself has been in scarce supply, mostly diverted to Japan and Korea. Much of Europe may not need Russian gas at all within a couple of years.

Bank of America said the oil price crash is worth $1 trillion of stimulus for the global economy, equal to a $730bn “tax cut” in 2015. Yet the effects are complex, with winners and losers. The benefits diminish the further it falls. Academic studies suggest that oil crashes can ultimately turn negative if they trigger systemic financial crises in commodity states.

Barnaby Martin, the bank’s European credit chief, said world asset markets may face a stress test as the US Federal Reserve starts to tighten afters year of largesse. “Our biggest worry is the end of the liquidity cycle. The Fed is done and it is preparing to raise rates. The reach for yield that we have seen since 2009 is going into reverse”, he said.

Mr Martin flagged warnings by William Dudley, the head of the New York Fed, that the US authorities had tightened too gently in 2004 and might do better to adopt the strategy of 1994 when they raised rates fast and hard, sending tremors through global bond markets.

Bank of America said quantitative easing in Europe and Japan will cover just 35pc of the global stimulus lost as the Fed pulls back, creating a treacherous hiatus for markets. It warned that the full effect of Fed tapering had yet to be felt. From now on the markets cannot expect to be rescued every time there is a squall. “The threshold for the Fed to return to QE will be high. This is why we believe we are entering a phase in which bad news will be bad news and volatility will likely rise,” it said.

What is clear is that the world has become addicted to central bank stimulus. Bank of America said 56pc of global GDP is currently supported by zero interest rates, and so are 83pc of the free-floating equities on global bourses. Half of all government bonds in the world yield less that 1pc. Roughly 1.4bn people are experiencing negative rates in one form or another.

These are astonishing figures, evidence of a 1930s-style depression, albeit one that is still contained. Nobody knows what will happen as the Fed tries to break out of the stimulus trap, including Fed officials themselves.

OPEC Forecasts $110 Nominal Price Through End Of This Decade:

OPEC’s World Oil Outlook And Pivot To Asia

https://i0.wp.com/www.sweetcrudereports.com/wp-content/uploads/2013/06/OPEC-conference.jpgby Jennifer Warren

Summary

  • OPEC published its recent global oil market outlook, which offers a slightly different and instructional viewpoint.
  • OPEC sees its share of crude oil/liquids production reducing in light of increases in U.S. and Canada production.
  • OPEC also indicates a pivot toward Asia, where it sees the greatest demand for its primary exports in the future.

In perusing through OPEC’s recently released “World Oil Outlook,” several viewpoints are noteworthy. According to OPEC, demand grows mainly from developing countries and U.S. supply slows its run up after 2019. After 2019, OPEC begins to pick up the slack, supplying its products more readily. In OPEC’s view, Asia becomes a center of gravity given global population growth, up nearly 2 billion by 2040, and economic prosperity. The world economy grows by 260% versus that of 2013 on a purchasing power parity basis.

During the period 2013-2040, OPEC says oil demand is expected to increase by just over 21 million barrels per day (mb/d), reaching 111.1 mb/d by 2040. Developing countries alone will account for growth of 28 mb/d and demand in the OECD will fall by over 7 mb/d (p.1). On the supply side, “in the long-term, OPEC will supply the majority of the additional required barrels, with the OPEC liquids supply forecast increasing by over 13 mb/d in the Reference Case from 2020-2040,” they offer (p.1). OPEC shaved off 0.5 million barrels from their last year’s forecast to 2035. Asian oil demand accounts for 71% of the growth of oil demand.

Morgan Stanley pulled out the following items:

The oil cartel released its World Oil Outlook last week, showing OPEC crude production falling to 29.5 million barrels per day in 2015 and 28.5 million barrels per day in 2016. This year’s average of 30 million barrels per day has helped flood the market and push oil prices to multi-year lows.

In the period to 2019, this chart illustrates where the barrels will flow:

Prices

With regard to price, OPEC acknowledges that the marginal cost to supply barrels continues to be a factor in expectations in the medium and long term. This sentiment has been echoed by other E&P CEOs in various communiques this year. OPEC forecasts a nominal price of $110 to the end of this decade:

On this evidence, a similar price assumption is made for the OPEC Reference Basket (ORB) price in the Reference Case compared to that presented in the WOO 2013: a constant nominal price of $110/b is assumed for the rest of the decade, corresponding to a small decline in real values.

Real values are assumed to approach $100/b in 2013 prices by 2035, with a slight further increase to $102/b by 2040. Nominal prices reach $124/b by 2025 and $177/b by 2040. These values are not to be taken as targets, according to OPEC. They acknowledge the challenge of predicting the world economy as well as non-OPEC supply. The Energy Information Administration (EIA) forecast a price for Brent averaging over $101 in 2015 and West Texas Intermediate (WTI) of over $94 as of their October 7th forecast. (This will have likely changed as of November 12th after the steep declines of October are weighed into their equations.) WTI averaged around the $97 range for 2013 and 2014. Importantly, U.S. supply may ratchet down slightly (green broken line) in response to price declines, if they continue.

It’s also the cars, globally

In 2013, OPEC says gasoline and diesel engines comprised 97% of the passenger cars total in 2013, and will hold 92% of the road in 2040. The diesel share for autos rises from 14% in 2013 to 21% in 2040. Basically, the number of cars buzzing on roads doubles from now to 2040. And 68% of the increase in cars comes from developing countries. China comprises the lion’s share of car volume growing by more than 470 million between 2011-2040, followed by India, then OPEC members will attribute 110 million new cars on the road. These increases assume levels similar to advanced economy (OECD) car volumes of the 1990s. In spite of efficiency and fuel economy, oil use per vehicle is expected to decline by 2.2%.

Commercial vehicles gain 300 million by 2040 from about 200 million in 2011. There are now more commercial vehicles in developing countries than developed.

U.S. Supply and OPEC

According to OPEC, U.S. and Canada supply increases through the period to 2019, the medium term. After 2017, they believe U.S. supply tempers from 1.2 million barrels of tight oil increases between 2013 and 2014 to 0.4 million in 2015, and less incremental increases thereafter. This acknowledges shale oil’s contribution to supply, with other supply sources declining, i.e., conventional and offshore.

OPEC Suggests:

The amount of OPEC crude required will fall from just over 30 mb/d in 2013 to 28.2 mb/d in 2017, and will start to rise again in 2018. By 2019, OPEC crude supply, at 28.7 mb/d, is still lower than in 2013.

However, the OPEC requirements are expected to ramp back up after 2019. By 2040, they expect to be supplying the world with 39 mb/d, a 9 million barrel/d increase from 2013. OPEC’s global share of crude oil supply is then 36%, above 2013 levels of about 30%. A select few firms like Pioneer Natural Resources (NYSE:PXD), Occidental Petroleum (NYSE:OXY), Chevron (NYSE:CVX) and even small-cap RSP Permian (NYSE:RSPP) are staying the course on shale oil production in the Permian for the present. After the first of the year, they will evaluate the price environment.

How does this outlook by OPEC inform the future? From the appearances in its forecasts, OPEC has slightly lower production in the medium term (to 2019), a decline of 1.3 million b/d in 2019 from the 2014 production of 30 million b/d. Thus, the main lever for an increase in prices for oil markets is for OPEC to restrict production, or encourage other members to keep to the current quota of 30 million b/d. Better economic indicators also could help. However, Saudi Arabia, the swing producer, has shown interest in maintaining its market share vis-à-vis the price cuts it has offered China, first, and then the U.S. more recently.

The global state of crude oil and liquids and prices has fundamentally changed with the addition of tight oil or shale oil, particularly from the U.S. While demand particulars have dominated the price regime recently, the upcoming decisions by OPEC at the late November meeting will have an influence on price expectations. In an environment of softer perceived demand now because of global economics and in the future because of non-OPEC supply, it would seem rational for OPEC to indicate some type of discipline among members’ production.

Source: OPEC “2014 World Oil Outlook,” mainly from the executive summary.

The Next Housing Crisis May Be Sooner Than You Think

How we could fall into another housing crisis before we’ve fully pulled out of the 2008 one.

https://i0.wp.com/cdn.citylab.com/media/img/citylab/2014/11/RTR2LDPC/lead_large.jpgby Richard Florida

When it comes to housing, sometimes it seems we never learn. Just when America appeared to be recovering from the last housing crisis—the trigger, in many ways, for 2008’s grand financial meltdown and the beginning of a three-year recession—another one may be looming on the horizon.

There are at several big red flags.

For one, the housing market never truly recovered from the recession. Trulia Chief Economist Jed Kolko points out that, while the third quarter of 2014 saw improvement in a number of housing key barometers, none have returned to normal, pre-recession levels. Existing home sales are now 80 percent of the way back to normal, while home prices are stuck at 75 percent back, remaining undervalued by 3.4 percent. More troubling, new construction is less than halfway (49 percent) back to normal. Kolko also notes that the fundamental building blocks of the economy, including employment levels, income and household formation, have also been slow to improve. “In this recovery, jobs and housing can’t get what they need from each other,” he writes.

Americans are spending more than 33 percent of their income on housing.

Second, Americans continue to overspend on housing. Even as the economy drags itself out of its recession, a spate of reports show that families are having a harder and harder time paying for housing. Part of the problem is that Americans continue to want more space in bigger homes, and not just in the suburbs but in urban areas, as well. Americans more than 33 percent of their income on housing in 2013, up nearly 13 percent from two decades ago, according to newly released data from the Bureau of Labor Statistics (BLS). The graph below plots the trend by age.

Over-spending on housing is far worse in some places than others; the housing market and its recovery remain highly uneven. Another BLS report released last month showed that households in Washington, D.C., spent nearly twice as much on housing ($17,603) as those in Cleveland, Ohio ($9,061). The chart below, from the BLS report, shows average annual expenses on housing related items:

(Bureau of Labor Statistics)

The result, of course, is that more and more American households, especially middle- and working-class people, are having a harder time affording housing. This is particularly the case in reviving urban centers, as more affluent, highly educated and creative-class workers snap up the best spaces, particularly those along convenient transit, pushing the service and working class further out.

Last but certainly not least, the rate of home ownership continues to fall, and dramatically. Home ownership has reached its lowest level in two decades—64.4 percent (as of the third quarter of 2014). Here’s the data, from the U.S. Census Bureau:

(Data from U.S. Census Bureau)

Home ownership currently hovers from the mid-50 to low-60 percent range in some of the most highly productive and innovative metros in this country—places like San Francisco, New York, and Los Angeles. This range seems “to provide the flexibility of rental and ownership options required for a fast-paced, rapidly changing knowledge economy. Widespread home ownership is no longer the key to a thriving economy,” I’ve written.

What we are going through is much more than a generational shift or simple lifestyle change. It’s a deep economic shift—I’ve called it the Great Reset. It entails a shift away from the economic system, population patterns and geographic layout of the old suburban growth model, which was deeply connected to old industrial economy, toward a new kind of denser, more urban growth more in line with today’s knowledge economy. We remain in the early stages of this reset. If history is any guide, the complete shift will take a generation or so.

It’s time to impose stricter underwriting standards and encourage the dense, mixed-use, more flexible housing options that the knowledge economy requires.

The upshot, as the Nobel Prize winner Edmund Phelps has written, is that it is time for Americans to get over their house passion. The new knowledge economy requires we spend less on housing and cars, and more on education, human capital and innovation—exactly those inputs that fuel the new economic and social system.

But we’re not moving in that direction; in fact, we appear to be going the other way. This past weekend, Peter J. Wallison pointed out in a New York Times op-ed that federal regulators moved back off tougher mortgage-underwriting standards brought on by 2010’s Dodd-Frank Act and instead relaxed them. Regulators are hoping to encourage more home ownership, but they’re essentially recreating the conditions that led to 2008’s crash.

Wallison notes that this amounts to “underwriting the next housing crisis.” He’s right: It’s time to impose stricter underwriting standards and encourage the dense, mixed-use, more flexible housing options that the knowledge economy requires.

During the depression and after World War II, this country’s leaders pioneered a series of purposeful and ultimately game-changing polices that set in motion the old suburban growth model, helping propel the industrial economy and creating a middle class of workers and owners. Now that our economy has changed again, we need to do the same for the denser urban growth model, creating more flexible housing system that can help bolster today’s economy.

https://i0.wp.com/www.thefifthestate.com.au/wp-content/uploads/2012/10/High_Density_Housing_____20120101_800x600.jpg
Dream housing for new economy workers
?

Energy Workforce Projected To Grow 39% Through 2022

The dramatic resurgence of the oil industry over the past few years has been a notable factor in the national economic recovery. Production levels have reached totals not seen since the late 1980s and continue to increase, and rig counts are in the 1,900 range. While prices have dipped recently, it will take more than that to markedly slow the level of activity. Cycles are inevitable, but activity is forecast to remain at relatively high levels.  

An outgrowth of oil and gas activity strength is a need for additional workers. At the same time, the industry workforce is aging, and shortages are likely to emerge in key fields ranging from petroleum engineers to experienced drilling crews. I was recently asked to comment on the topic at a gathering of energy workforce professionals. Because the industry is so important to many parts of Texas, it’s an issue with relevance to future prosperity.  


Although direct employment in the energy industry is a small percentage of total jobs in the state, the work is often well paying. Moreover, the ripple effects through the economy of this high value-added industry are large, especially in areas which have a substantial concentration of support services.  

Petroleum Engineer

Employment in oil and gas extraction has expanded rapidly, up from 119,800 in January 2004 to 213,500 in September 2014. Strong demand for key occupations is evidenced by the high salaries; for example, median pay was $130,280 for petroleum engineers in 2012 according to the Bureau of Labor Statistics (BLS).  

Due to expansion in the industry alone, the BLS estimates employment growth of 39 percent through 2022 for petroleum engineers, which comprised 11 percent of total employment in oil and gas extraction in 2012. Other key categories (such as geoscientists, wellhead pumpers, and roustabouts) are also expected to see employment gains exceeding 15 percent. In high-activity regions, shortages are emerging in secondary fields such as welders, electricians, and truck drivers.  

The fact that the industry workforce is aging is widely recognized. The cyclical nature of the energy industry contributes to uneven entry into fields such as petroleum engineering and others which support oil and gas activity. For example, the current surge has pushed up wages, and enrollment in related fields has increased sharply. Past downturns, however, led to relatively low enrollments, and therefore relatively lower numbers of workers in some age cohorts. The loss of the large baby boom generation of experienced workers to retirement will affect all industries. This problem is compounded in the energy sector because of the long stagnation of the industry in the 1980s and 1990s resulting in a generation of workers with little incentive to enter the industry. As a result, the projected need for workers due to replacement is particularly high for key fields.

The BLS estimates that 9,800 petroleum engineers (25.5 percent of the total) working in 2012 will need to be replaced by 2022 because they retire or permanently leave the field. Replacement rates are also projected to be high for other crucial occupations including petroleum pump system operators, refinery operators, and gaugers (37.1 percent); derrick, rotary drill, and service unit operators, oil, gas, and mining (40.4 percent).  

http://jobdiagnosis.files.wordpress.com/2010/03/petroleum-engineer.jpg

Putting together the needs from industry expansion and replacement, most critical occupations will require new workers equal to 40 percent or more of the current employment levels. The total need for petroleum engineers is estimated to equal approximately 64.5 percent of the current workforce. Clearly, it will be a major challenge to deal with this rapid turnover.

Potential solutions which have been attempted or discussed present problems, and it will require cooperative efforts between the industry and higher education and training institutions to adequately deal with future workforce shortages. Universities have had problems filling open teaching positions, because private-sector jobs are more lucrative for qualified candidates. Given budget constraints and other considerations, it is not feasible for universities to compete on the basis of salary. Without additional teaching and research staff, it will be difficult to continue to expand enrollment while maintaining education quality. At the same time, high-paying jobs are enticing students into the workforce, and fewer are entering doctoral programs.  

Another option which has been suggested is for engineers who are experienced in the workplace to spend some of their time teaching. However, busy companies are naturally resistant to allowing employees to take time away from their regular duties. Innovative training and associate degree and certification programs blending classroom and hands-on experience show promise for helping deal with current and potential shortages in support occupations. Such programs can prepare students for well-paying technical jobs in the industry. Encouraging experienced professionals to work past retirement, using flexible hours and locations to appeal to Millennials, and other innovative approaches must be part of the mix, as well as encouraging the entry of females into the field (only 20 percent of the current workforce is female, but over 40 percent of the new entries).

Industry observers have long been aware of the coming “changing of the guard” in the oil and gas business. We are now approaching the crucial time period for ensuring the availability of the workers needed to fill future jobs. Cooperative efforts between the industry and higher education/training institutions will likely be required, and it’s time to act.

https://i0.wp.com/oilandcareers.com/wp-content/uploads/2013/04/Petroleum-Engineer.jpg

Don’t Count On A Major Slowdown In U.S. Oil Production Growth

https://i0.wp.com/upachaya.com/wp-content/uploads/2014/05/fracking.jpgby Richard Zeits

Summary

  • The presumption that North American shale oil production is the “swing” component of global supply may be incorrect.
  • Supply cutbacks from other sources may come first.
  • Growth momentum in North American unconventional oil production will likely carry on into 2015, with little impact from lower oil prices on the next two quarters’ volumes.
  • The current oil price does not represent a structural “economic floor” for North American unconventional oil production.

The recent pull back in crude oil prices is often portrayed as being a consequence of the rapid growth of North American shale oil production.

The thesis is often further extrapolated to suggest that a major slowdown in North American unconventional oil production growth, induced by the oil price decline, will be the corrective mechanism that will bring oil supply and demand back in equilibrium (given that OPEC’s cost to produce is low).

Both views would be, in my opinion, overly simplistic interpretations of the global supply/demand dynamics and are not supported by historical statistical data.

Oil Price – The Economic Signal Is Both Loud and Clear

The current oil price correction is, arguably, the most pronounced since the global financial crisis of 2008-2009. The following chart illustrates very vividly that the price of the OPEC Basket (which represents waterborne grades of oil) has moved far outside the “stability band” that seems to have worked well for both consumers and producers over the past four years. (It is important, in my opinion, to measure historical prices in “today’s dollars.”)

(Source: Zeits Energy Analytics, November 2014)

Given the sheer magnitude of the recent oil price move, the economic signal to the world’s largest oil suppliers is, arguably, quite powerful already. A case can be made that it goes beyond what could be interpreted as “ordinary volatility,” giving the hope that the current price level may be sufficient to induce some supply response from the largest producers – in the event a supply cut back is indeed needed to eliminate a transitory supply/demand imbalance.

Are The U.S. Oil Shales The Culprit?

It is debatable, in my opinion, if the continued growth of the U.S. onshore oil production can be identified as the primary cause of the current correction in the oil price. Most likely, North American shale oil is just one of several powerful factors, on both supply and demand sides, that came together to cause the price decline.

The history of oil production increases from North America in the past three years shows that the OPEC Basket price remained within the fairly tight band, as highlighted on the graph above, during 2012-2013, the period when such increases were the largest. Global oil prices “broke down” in September of 2014, when North American oil production was growing at a lower rate than in 2012-2013.

(Source: OPEC, October 2014)

If the supply growth from North America was indeed the primary “disruptive” factor causing the imbalance, one would expect the impact on oil prices to become visible at the time when incremental volumes from North America were the highest, i.e., in 2012-2013.

Should One Expect A Strong Slowdown in North American Oil Production Growth?

There is no question that the sharp pullback in the price of oil will impact operating margins and cash flows of North American shale oil producers. However, a major slowdown in North American unconventional oil production growth is a lot less obvious.

First, the oil price correction being seen by North American shale oil producers is less pronounced than the oil price correction experienced by OPEC exporters. It is sufficient to look at the WTI historical price graph below (which is also presented in “today’s dollars”) to realize that the current WTI price decline is not dissimilar to those seen in 2012 and 2013 and therefore represents a signal of lesser magnitude than the one sent to international exporters (the OPEC Basket price).

(Source: Zeits Energy Analytics, November 2014)

Furthermore, among all the sources of global oil supply, North American oil shales are the least established category. Their cost structure is evolving rapidly. Given the strong productivity gains in North American shale oil plays, what was a below-breakeven price just two-three years ago, may have become a price stimulating growth going into 2015.

Therefore, the signal sent by the recent oil price decline may not be punitive enough for North American shale oil producers and may not be able to starve the industry of external capital.

Most importantly, review of historical operating statistics provides an indication that the previous similar WTI price corrections – seen in 2012 and 2013 – did not result in meaningful slowdowns in the North American shale oil production.

The following graph shows the trajectory of oil production in the Bakken play. From this graph, it is difficult to discern any significant impact from the 2012 and 2013 WTI price corrections on the play’s aggregate production volumes. While a positive correlation between these two price corrections and the pace of production growth in the Bakken exists, there are other factors – such as takeaway capacity availability and local differentials – that appear to have played a greater role. I should also note that the impact of the lower oil prices on production volumes was not visible in the production growth rate for more than half a year after the onset of the correction.

(Source: Zeits Energy Analytics, November 2014)

Leading U.S. Independents Will Likely Continue to Grow Production At A Rapid Pace

Production growth track record by several leading shale oil players suggests that U.S. shale oil production will likely remain strong even in the $80 per barrel WTI price environment. Several examples provide an illustration.

Continental Resources (NYSE:CLR) grew its Bakken production volumes at a 58% CAGR over the past three years (slide below). By looking at the company’s historical production, it would be difficult to identify any impact from the 2012 and 2013 oil price corrections on the company’s production growth rate. Continental just announced a reduction to its capital budget in 2015 in response to lower oil prices, to $4.6 billion from $5.2 billion planned initially. The company still expects to grow its total production in 2015 by 23%-29% year-on-year.

(Source: Continental Resources, October 2014)

EOG Resources (NYSE:EOG) expects that its largest core plays (Eagle Ford, Bakken and Delaware Basin) will generate after-tax rates of return in excess of 100% in 2015 at $80 per barrel wellhead price. EOG went further to suggest that these plays may remain economically viable (10% well-level returns) at oil prices as low as $40 per barrel. The company expects to continue to grow its oil production at a double-digit rate in 2015 while spending within its cash flow. EOG achieved ~40% oil production growth in 2012-2013 and expects 31% growth for 2014. While a slowdown is visible, it is important to take into consideration that EOG’s oil production base has increased dramatically in the past three years and requires significant capital just to be maintained flat. Again, one would not notice much impact from prior years’ oil price corrections on EOG’s production growth trajectory.

(Source: EOG Resources, November 2014)

Anadarko Petroleum’s (NYSE:APC) U.S. onshore oil production growth story is similar. Anadarko increased its U.S. crude oil and NLS production from 100,000 barrels per day in 2010 to close to almost 300,000 barrels per day expected in Q4 2014. Anadarko has not yet provided growth guidance for 2015, but indicated that the company’s exploration and development strategies remain intact. While recognizing a very steep decline in the oil price, Anadarko stated that it wants “to watch this environment a little longer” before reaching conclusions with regard to the impact on its future spending plans.

(Source: Anadarko Petroleum, October 2014)

Devon Energy (NYSE:DVN) posted company-wide oil production of 216,000 barrels per day in Q3 2014. While Devon will provide detailed production and capital guidance at a later date, the company has indicated that it sees 20% to 25% oil production growth and mid‐single digit top‐line growth “on a retained‐property basis” (pro forma for divestitures) in 2015.

The list can continue on.

In Conclusion…

Based on preliminary 2015 growth indications from large shale oil operators, North American oil production growth in 2015 will likely remain strong, barring further strong decline in the price of oil.

No slowdown effect from lower oil prices will be seen for at least six months from the time operators received the “price signal” (August-September 2014).

Given the effects of the technical learning curve in oil shales and continuously improving drilling economics, the current ~$77 per barrel WTI price is unlikely to be sufficient to eliminate North American unconventional production growth.

North American shale oil production remains a very small and highly fragmented component of the global oil supply.

The global oil “central bank” (Saudi Arabia and its close allies in OPEC) remain best positioned to quickly re-instate stability of oil price in the event further significant decline occurred.