Tag Archives: Odessa Texas

Oil & Gas Stocks: ‘Stability At The Bottom’ May Be A Positive Sign

https://i0.wp.com/www.avidtrader.com/wordpress/wp-content/uploads/2012/10/oil_and_gas.jpgby Richard Zeits

Summary:

  • The article provides “correction scorecards” by stock and by group versus commodities.
  • In the past two weeks, oil & gas stocks firmed up, despite the continued slide in the price of oil.
  • Small- and mid-capitalization oil-focused E&Ps were the strongest winners.
  • Emerging markets Oil Majors and Upstream MLPs were the worst performers.

During the two weeks since my previous update, stocks in the Oil & Gas sector demonstrated what an optimist might interpret as “stability at the bottom.” The net effect of another sequence of high-amplitude intraday moves was a slight recovery from the two weeks ago levels across the vast majority of segments and stock groups, as shown on the chart below. It should be no surprise that those groups that had declined the most were also the biggest gainers in the past two weeks.

Most notable is the fact that the descend trend in the Oil & Gas stocks was interrupted (and even marginally reversed) in spite of the new lows posted by the price of oil. One could try to interpret this performance as an indication that the current price levels already discount the market’s fear that the oil price paradigm has shifted. This stability may also indicate that the wave of forced liquidations by hedge funds and in individual margin accounts has run its course and the worst part of this correction may be already behind us.

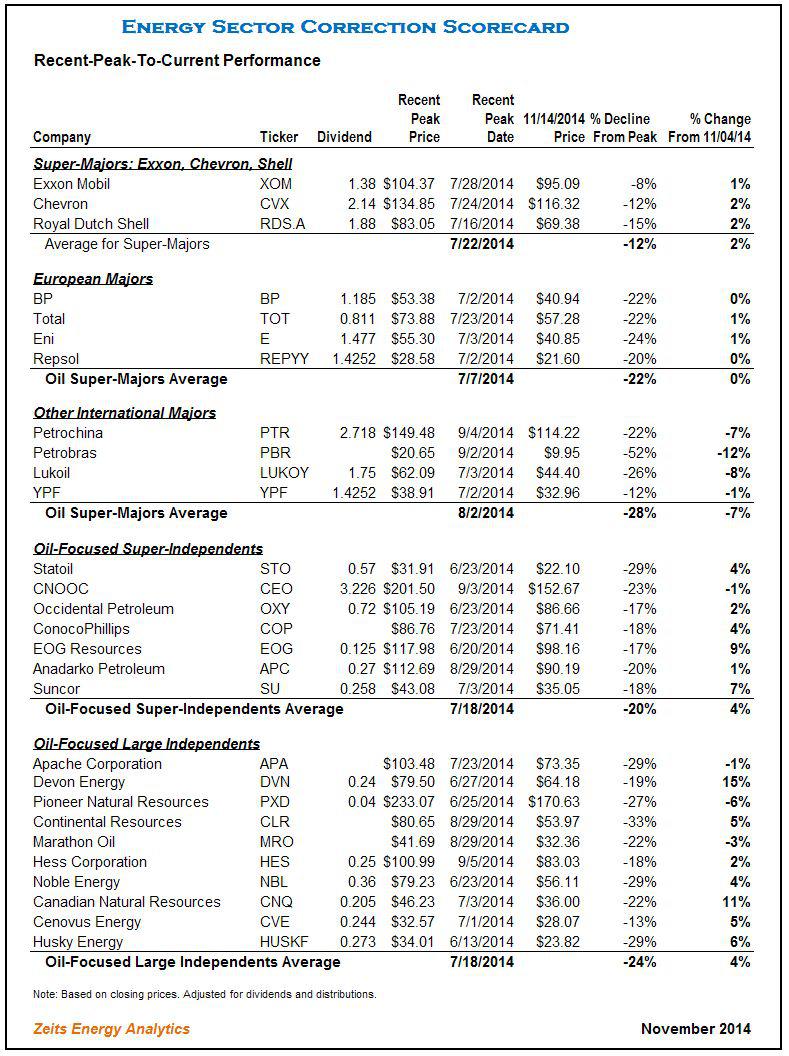
Even though this recent stock price “stability” is a welcome development, it provides little consolation to investors in the Oil & Gas sector who still see their positions trading far below the peak levels achieved last summer. The correction scorecard graph below summarizes average “peak-to-current” performance by individual stocks that are grouped together by sector and size. Individual stock performance is provided in full detail in the spreadsheets at the end of this note.

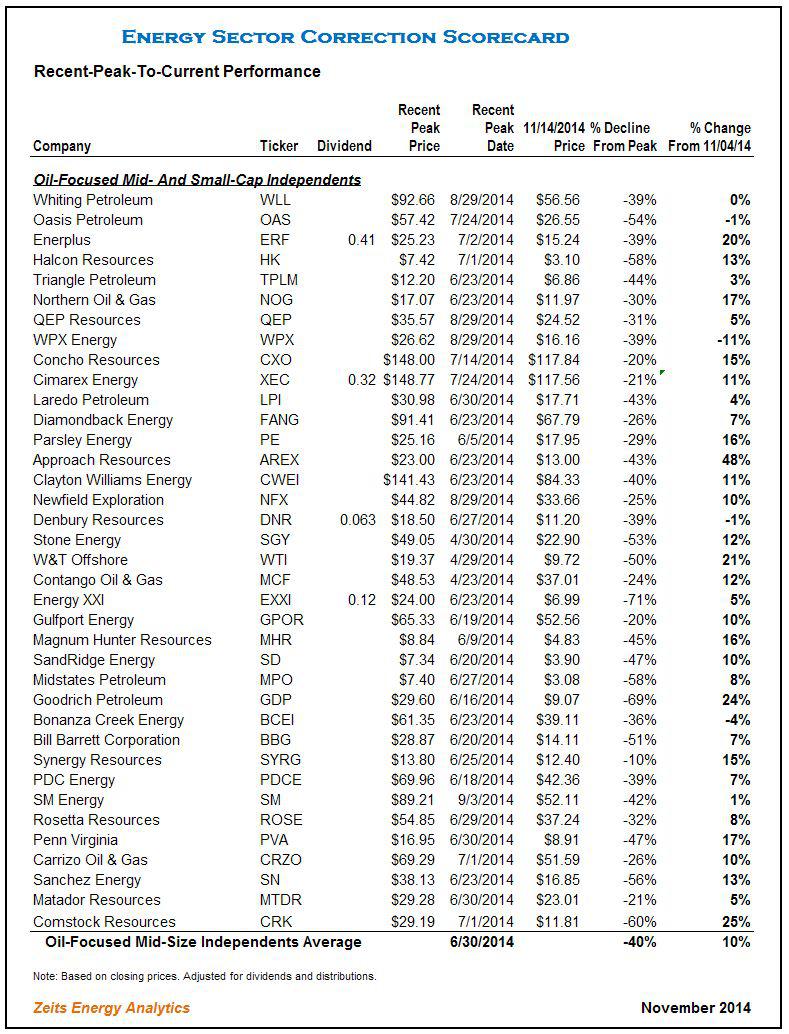
Mid- and small-capitalization stocks, in both Upstream and Oil Service segments, remain the worst performing groups, now trading at an average discount to each individual stock’s recent peak price of over 40%, a staggering decline. Large-capitalization E&P independents and large-capitalization oil service stocks are trading at a 20%-24% average discount.

Emerging Markets Oil Majors Post A Strong Decline:

Emerging markets Oil Majors were one of the worst performing categories during the past two weeks:

Petrobras (NYSE:PBR) continued to slide down, moving 12% down since my previous update. Petrobras stands out as one of the most disappointing Oil Majors in terms of stock performance in the past five years, having lost a staggering three-quarters of its value during that period. The company’s market capitalization currently stands at only $62 billion.

· Lukoil (OTCPK:LUKOY) and Petrochina (NYSE:PTR) are other examples of strong declines in the past two weeks, with the stocks losing 8% and 7%, respectively. Lukoil’s performance may in fact be interpreted as “solid,” given the continued deterioration of Russia’s political and credit risk.

A strong contrast is the performance of the three oil super-majors – Exxon (NYSE:XOM), Chevron (NYSE:CVX) and Shell (NYSE:RDS.A) – that gained ~2% during the past two weeks and remain the best performing group in the Oil & Gas sector. I have argued in my earlier notes that, given the combined $0.9 trillion market capitalization of these three stocks, the resilient performance by the Super-majors has effectively isolated the correction in the Oil & Gas sector from the broader markets. From a fundamental perspective, the Super-majors are characterized by very low financial leverage, high proportion of counter-cyclical production sharing contracts (“PSAs”) and the effective hedge from downstream assets, which limits their exposure to the oil price decline.

Small-Capitalization E&P Stocks Bounce Back:

After a dramatic underperformance, small- and mid-capitalization E&P stocks posted meaningful gains in the past two weeks. However, in most cases the recovery is “a drop in the bucket,” given that high-percentage moves are measured off price levels that sometimes are a fraction of recent peak prices. The sector remains a menu of bargains for those investors who believe in a recovery in oil prices.

  • Enerplus (NYSE:ERF): +20%
  • Northern Oil & Gas (NYSEMKT:NOG): +17%
  • Concho Resources (NYSE:CXO): +15%
  • Approach Resources (NASDAQ:AREX): +48%
  • Goodrich Petroleum (NYSE:GDP): +24%
  • Synergy Resources (NYSEMKT:SYRG): +15%
  • Penn Virginia (NYSE:PVA): +17%
  • Comstock Resources (NYSE:CRK): +25%
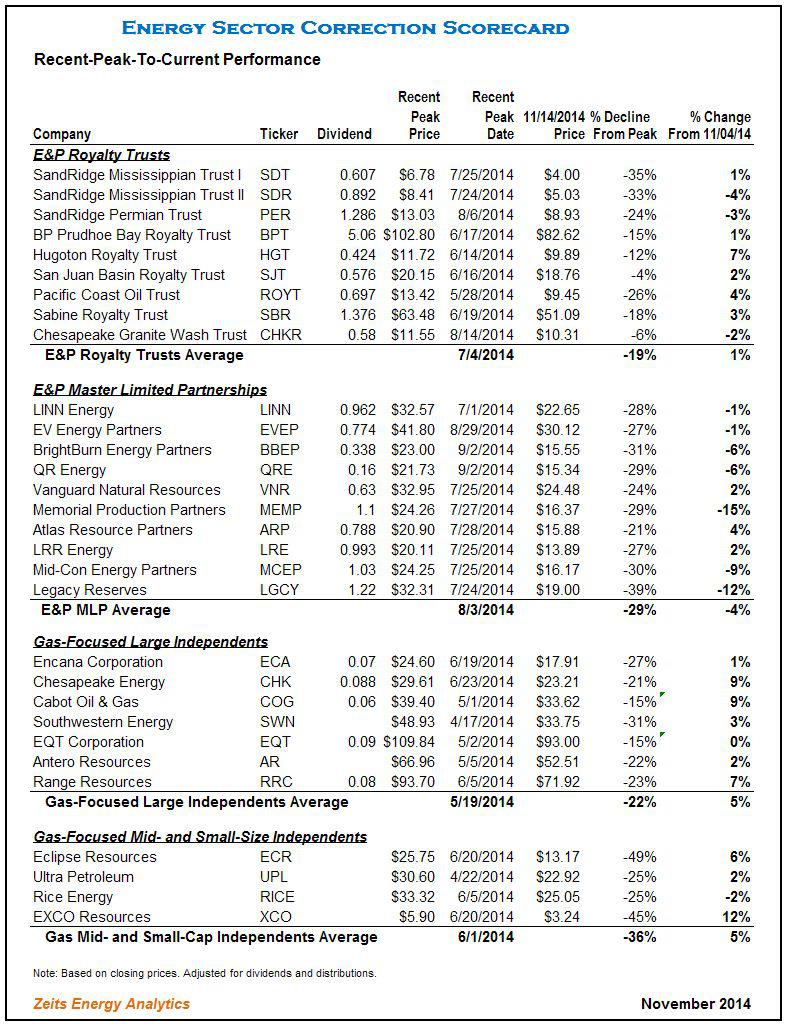
E&P MLPs Retreat:

Upstream MLPs were one of the exceptions in the E&P sector, declining by an average of 4% in the past two weeks. The largest Upstream MLP, Linn Energy (NASDAQ:LINE) and its sister entity LinnCo(NASDAQ:LNCO), are again trading close to their lows, after having enjoyed a strong bounce a month ago. The previously very wide gap in relative performance between Upstream MLPs and other Upstream equities has contracted substantially which, arguably, makes sense given that both categories of companies participate in the same business, irrespective of the corporate envelope.

Oil & Gas Sector Correction Scorecards:


How Low Can the Price of Oil Plunge?

https://i0.wp.com/www.gulf-times.com/NewsImages/2014/10/27/30d677e0-63da-4004-ac67-2ce174ec36a9.jpgby Wolf Richter

It is possible that a miracle intervenes and that the price of oil bounces off and zooms skyward. We’ve seen stocks perform these sorts of miracles on a routine basis, but when it comes to oil, miracles have become rare. As I’m writing this, US light sweet crude trades at $76.90 a barrel, down 26% from June, a price last seen in the summer of 2010.

But this price isn’t what drillers get paid at the wellhead. Grades of oil vary. In the Bakken, the shale-oil paradise in North Dakota, wellhead prices are significantly lower not only because the Bakken blend isn’t as valuable to refiners as the benchmark West Texas Intermediate, but also because take-away capacity by pipeline is limited. Crude-by-rail has become the dominant – but more costly – way to get the oil from the Northern Rockies to refineries on the Gulf Coast or the East Coast.

These additional transportation costs come out of the wellhead price. So for a particular well, a driller might get less than $60/bbl – and not the $76.90/bbl that WTI traded for at the New York Mercantile Exchange.

Fracking is expensive, capital intensive, and characterized by steep decline rates. Much of the production occurs over the first two years – and much of the cash flow. If prices are low during those two years, the well might never be profitable.

Meanwhile, North Sea Brent has dropped to $79.85 a barrel, last seen in September 2010.

So the US Energy Information Administration, in its monthly short-term energy outlook a week ago, chopped down its forecast of the average price in 2015: WTI from $94.58/bbl to $77.55/bbl and Brent from $101.67/bbl to $83.24/bbl.

Independent exploration and production companies have gotten mauled. For example, Goodrich Petroleum plunged 71% and Comstock Resources 58% from their 52-week highs in June while Rex Energy plunged 65% and Stone Energy 54% from their highs in April.

Integrated oil majors have fared better, so far. Exxon Mobil is down “only” 9% from its July high. On a broader scale, the SPDR S&P Oil & Gas Exploration & Production ETF (XOP) is down 28% from June – even as the S&P 500 set a new record.

https://i0.wp.com/maxspeak.net/wp-content/uploads/2014/08/34852468Rick-Santelli-380x190.jpg

So how low can oil drop, and how long can this go on?

The theory is being propagated that the price won’t drop much below the breakeven point in higher-cost areas, such as the tar sands in Canada or the Bakken in the US. At that price, rather than lose money, drillers would stop fracking and tar-sands operators would shut down their tar pits. And soon, supplies would tighten up, inventories would be drawn down, and prices would jump.

But that’s not what happened in natural gas. US drillers didn’t stop fracking when the price of natural gas plunged below the cost of production and kept plunging for years. In April 2012, it reached not a four-year low but a decade-low of about $1.90 per million Btu at the Henry hub. At the time, shorts were vociferously proclaiming that gas storage would be full by fall, that the remaining gas would have to be flared, and that the price would then drop to zero.

But drillers were still drilling, and production continues to rise to this day, though the low price also caused an uptick in consumption that coincided with a harsh winter, leaving storage levels below the five-year minimum for this time of the year.

The gas glut has disappeared. The price at the Henry hub has since more than doubled, but it remains below breakeven for many wells. And when natural gas was selling for $4/MM Btu at the Henry hub, it was selling for $2/MM Btu at the Appalachian hubs, where the wondrous production from the Marcellus shale comes to market. No one can make money at that price.

And they’re still drilling in the Marcellus.

Natural gas drillers had a cover: a well that also produced a lot of oil and natural gas liquids was profitable because they fetched a much higher price. But this too has been obviated by events: on top of the rout in oil, the inevitable glut in natural gas liquids has caused their prices to swoon too (chart).

Yet, they’re still drilling, and production is still rising. And they will continue to drill as long as they can get the moolah to do so. They might pick and choose where they drill, and they might back off a smidgen, but as long as they get the money, they’ll drill.

Money has been flowing into the oil and gas business like a tsunami unleashed by yield-desperate investors who, driven to near insanity by the Fed’s policies, do what the Fed has been telling them to do: close their eyes and hold their noses and disregard risk and hand over their money, and borrow money for nearly free and hand over that money too.

Oil and gas companies have issued record amounts of junk bonds. They’ve raised record amounts of money via a record number of IPOs. They’ve raised money by spinning off assets into publicly traded MLPs. They’ve borrowed from banks that then packaged these loans into securities that were then sold. The industry has taken this cheap money and has drilled it into the ground.

This is one of the consequences of the Fed’s decision to flood the land with free liquidity. When the cost of capital is near zero, and when returns on low-risk investments are near zero as well, or even below zero, investors go into a sort of coma. But when they come out of it and realize that “sunk capital” has taken on a literal meaning, they’ll shut off the spigot.

Only then will drilling and production decline. As with natural gas, it can take years. And as with natural gas, the price might plunge through a four-year low and hit a decade low – which would be near $40/bbl, a price last seen in 2009. The bloodletting would be epic. To see where this is going, watch the money.

https://i0.wp.com/www.independent.co.uk/incoming/article9783416.ece/alternates/w620/pg-58-oil-getty.jpg

OPEC Forecasts $110 Nominal Price Through End Of This Decade:

OPEC’s World Oil Outlook And Pivot To Asia

https://i0.wp.com/www.sweetcrudereports.com/wp-content/uploads/2013/06/OPEC-conference.jpgby Jennifer Warren

Summary

  • OPEC published its recent global oil market outlook, which offers a slightly different and instructional viewpoint.
  • OPEC sees its share of crude oil/liquids production reducing in light of increases in U.S. and Canada production.
  • OPEC also indicates a pivot toward Asia, where it sees the greatest demand for its primary exports in the future.

In perusing through OPEC’s recently released “World Oil Outlook,” several viewpoints are noteworthy. According to OPEC, demand grows mainly from developing countries and U.S. supply slows its run up after 2019. After 2019, OPEC begins to pick up the slack, supplying its products more readily. In OPEC’s view, Asia becomes a center of gravity given global population growth, up nearly 2 billion by 2040, and economic prosperity. The world economy grows by 260% versus that of 2013 on a purchasing power parity basis.

During the period 2013-2040, OPEC says oil demand is expected to increase by just over 21 million barrels per day (mb/d), reaching 111.1 mb/d by 2040. Developing countries alone will account for growth of 28 mb/d and demand in the OECD will fall by over 7 mb/d (p.1). On the supply side, “in the long-term, OPEC will supply the majority of the additional required barrels, with the OPEC liquids supply forecast increasing by over 13 mb/d in the Reference Case from 2020-2040,” they offer (p.1). OPEC shaved off 0.5 million barrels from their last year’s forecast to 2035. Asian oil demand accounts for 71% of the growth of oil demand.

Morgan Stanley pulled out the following items:

The oil cartel released its World Oil Outlook last week, showing OPEC crude production falling to 29.5 million barrels per day in 2015 and 28.5 million barrels per day in 2016. This year’s average of 30 million barrels per day has helped flood the market and push oil prices to multi-year lows.

In the period to 2019, this chart illustrates where the barrels will flow:

Prices

With regard to price, OPEC acknowledges that the marginal cost to supply barrels continues to be a factor in expectations in the medium and long term. This sentiment has been echoed by other E&P CEOs in various communiques this year. OPEC forecasts a nominal price of $110 to the end of this decade:

On this evidence, a similar price assumption is made for the OPEC Reference Basket (ORB) price in the Reference Case compared to that presented in the WOO 2013: a constant nominal price of $110/b is assumed for the rest of the decade, corresponding to a small decline in real values.

Real values are assumed to approach $100/b in 2013 prices by 2035, with a slight further increase to $102/b by 2040. Nominal prices reach $124/b by 2025 and $177/b by 2040. These values are not to be taken as targets, according to OPEC. They acknowledge the challenge of predicting the world economy as well as non-OPEC supply. The Energy Information Administration (EIA) forecast a price for Brent averaging over $101 in 2015 and West Texas Intermediate (WTI) of over $94 as of their October 7th forecast. (This will have likely changed as of November 12th after the steep declines of October are weighed into their equations.) WTI averaged around the $97 range for 2013 and 2014. Importantly, U.S. supply may ratchet down slightly (green broken line) in response to price declines, if they continue.

It’s also the cars, globally

In 2013, OPEC says gasoline and diesel engines comprised 97% of the passenger cars total in 2013, and will hold 92% of the road in 2040. The diesel share for autos rises from 14% in 2013 to 21% in 2040. Basically, the number of cars buzzing on roads doubles from now to 2040. And 68% of the increase in cars comes from developing countries. China comprises the lion’s share of car volume growing by more than 470 million between 2011-2040, followed by India, then OPEC members will attribute 110 million new cars on the road. These increases assume levels similar to advanced economy (OECD) car volumes of the 1990s. In spite of efficiency and fuel economy, oil use per vehicle is expected to decline by 2.2%.

Commercial vehicles gain 300 million by 2040 from about 200 million in 2011. There are now more commercial vehicles in developing countries than developed.

U.S. Supply and OPEC

According to OPEC, U.S. and Canada supply increases through the period to 2019, the medium term. After 2017, they believe U.S. supply tempers from 1.2 million barrels of tight oil increases between 2013 and 2014 to 0.4 million in 2015, and less incremental increases thereafter. This acknowledges shale oil’s contribution to supply, with other supply sources declining, i.e., conventional and offshore.

OPEC Suggests:

The amount of OPEC crude required will fall from just over 30 mb/d in 2013 to 28.2 mb/d in 2017, and will start to rise again in 2018. By 2019, OPEC crude supply, at 28.7 mb/d, is still lower than in 2013.

However, the OPEC requirements are expected to ramp back up after 2019. By 2040, they expect to be supplying the world with 39 mb/d, a 9 million barrel/d increase from 2013. OPEC’s global share of crude oil supply is then 36%, above 2013 levels of about 30%. A select few firms like Pioneer Natural Resources (NYSE:PXD), Occidental Petroleum (NYSE:OXY), Chevron (NYSE:CVX) and even small-cap RSP Permian (NYSE:RSPP) are staying the course on shale oil production in the Permian for the present. After the first of the year, they will evaluate the price environment.

How does this outlook by OPEC inform the future? From the appearances in its forecasts, OPEC has slightly lower production in the medium term (to 2019), a decline of 1.3 million b/d in 2019 from the 2014 production of 30 million b/d. Thus, the main lever for an increase in prices for oil markets is for OPEC to restrict production, or encourage other members to keep to the current quota of 30 million b/d. Better economic indicators also could help. However, Saudi Arabia, the swing producer, has shown interest in maintaining its market share vis-à-vis the price cuts it has offered China, first, and then the U.S. more recently.

The global state of crude oil and liquids and prices has fundamentally changed with the addition of tight oil or shale oil, particularly from the U.S. While demand particulars have dominated the price regime recently, the upcoming decisions by OPEC at the late November meeting will have an influence on price expectations. In an environment of softer perceived demand now because of global economics and in the future because of non-OPEC supply, it would seem rational for OPEC to indicate some type of discipline among members’ production.

Source: OPEC “2014 World Oil Outlook,” mainly from the executive summary.