
The Wall Street Code (2013)
Tag Archives: Stock Market
Housing Bubble Getting Ready to Pop: Mortgage Applications to Purchase a Home Drop to Lockdown Lows, “Bad Time to Buy” Hits Record amid Sky-High Prices, Spiking Mortgage Rates
(Wolf Richter) This just keeps getting worse: Applications for mortgages to purchase a home dropped 7% for the week, and were down 21% from a year ago, the Mortgage Bankers Association reported today. An indicator of future home sales: Potential homebuyers try to get pre-approved for a mortgage, lock in a mortgage rate, and then start house-hunting.
Mortgage rates have soared this year, and home prices have soared for years to ridiculous levels, causing layers and layers of potential buyers to abandon the market, amid “worsening affordability challenges,” as the MBA called it. And these applications to purchase a home hit the lowest point since the depth of the lockdown in April 2020 (data via Investing.com):
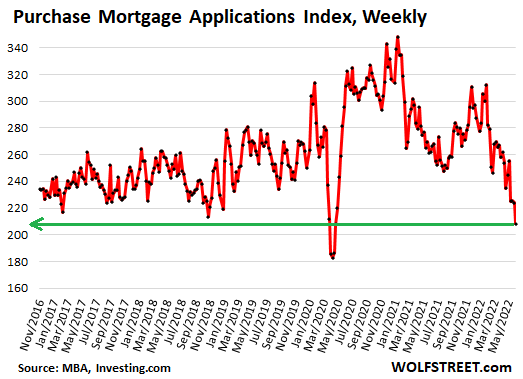
The MBA’s Purchase Mortgage Applications Index has now dropped below the lows of late 2018. By November 2018, the Fed had been hiking rates for years (slowly), and its QT was in full swing, and mortgage rates had edged above 5%, which was enough to begin shaking up the housing market. Home sales volume slowed, prices began to come down in some markets, and stocks were selling off. But with inflation below the Fed’s target, and with Trump, who’d taken ownership of the Dow, constantly throwing darts at Powell, the Fed signaled in December 2018 that it would cave, and instantly mortgage rates began to fall, and volume and prices took off again.
Today, raging inflation is the #1 economic issue, and the Fed is chasing after it, with backing from the White House, and so this issue in the housing market is just going to have to play out.
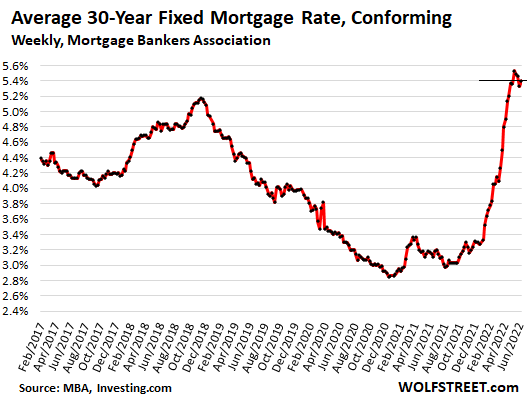
Holy-Moly Mortgage Rates.
The average 30-year fixed mortgage rate with conforming balances and 20% down rose to 5.40% this week, according to the MBA today, having been in this 5.4% range, plus or minus a little, since the end of April, the highest since 2009.
I call them holy-moly mortgage rates because that’s the reaction you get when you apply this rate to figure a mortgage payment for a home at current prices and then accidentally look at the resulting mortgage payment (data via Investing.com):
“Bad time to buy a home.”
Turns out, sky-high home prices to be financed with holy-moly mortgage rates, plus uncertainty about the economy, dropping stock prices, and inflation eating everyone’s lunch make a toxic mix for homebuyers.
The percentage of people who said that now is a “bad time to buy” a home jumped to 79%, another record-worst in the data going back to 2010, according to Fannie Mae’s National Housing Survey for May. Sentiment has been deteriorating since February 2021:
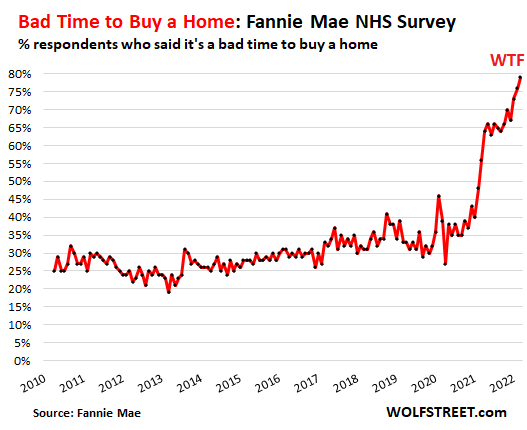
“Consumers’ expectations that their personal financial situations will worsen over the next year reached an all-time high in the May survey, and they expressed greater concern about job security,” according to Fannie Mae’s report.
“These results suggest to us that increased mortgage rates, high home prices, and inflation will likely continue to squeeze would-be home buyers – as well as those potential sellers with lower, locked-in mortgage rates – out of the market, supporting our forecast that home sales will slow meaningfully through the rest of this year and into next,” said Fannie Mae.
Sagging stock prices keep getting blamed.
The stock market is on the front pages every day. Only a small percentage of Americans own any significant amount of equities, but that doesn’t matter. Stock market declines, with many high-flying stocks plunging 70% or 80% or even 90% since February 2021, have rattled a lot of nerves. Which is in part why Fannie Mae pointed out, “consumers’ expectations that their personal financial situations will worsen over the next year reached an all-time high.”
The MBA also had previously pointed at the financial markets as one of the reasons for the plunge in purchase mortgage applications.
In the tech and social media sector, the big declines in stock prices have now triggered the first hiring freezes and a few layoffs. And this too – just the idea of nirvana being somehow over – is shaking up some folks.
Sharp increases in stock portfolios, stock options from employers, or cryptos empowered potential homebuyers and enabled many to borrow against their portfolios to come up with down payments. This option has either vanished or is looking very shaky for many.
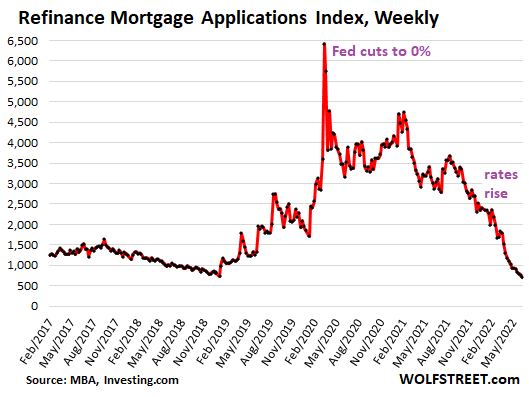
Refi applications collapsed to lowest since year 2000.
Applications for mortgages to refinance an existing mortgage dropped another 6% for the week, and have collapsed by 75% from a year ago, to the lowest level since the year 2000, according to the MBA’s Refinance Mortgage Applications Index. The MBA obtains this data from a weekly survey of mortgage bankers.
With these holy-moly mortgage rates, just about the only reason to refinance is to extract cash from the home via a cash-out refi (data via Investing.com):
Cash-Out Refi mortgage applications.
According to the AEI Housing Center, which tracks mortgage applications by the number of rate locks, no-cash-out refi applications have collapsed by 92% from a year ago. But cash-out refi applications are primarily driven by the desire to extract cash from a home, with mortgage rates being a secondary issue – and so they continue but a slower pace.
Cash out refi applications in week through May 30 (black line) plunged by 42% from the same week in 2021 and have stabilized roughly level with 2019:
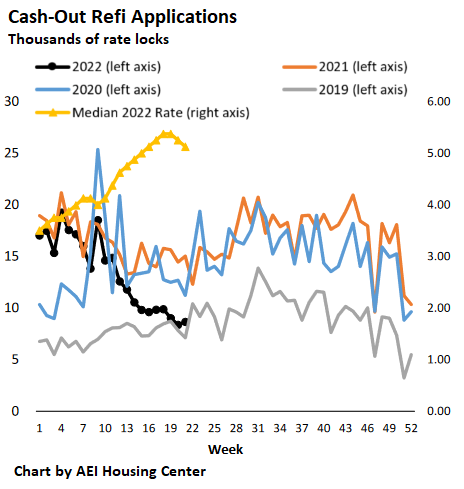
A cash-out refi provides a big lump sum for the homeowner to spend on all kinds of things, from cars to home improvement projects. They are also used to pay off high-cost debts, such as credit cards so that these credit cards can then be used for more purchases. The plunge in cash-out refi reduces the availability of these lump-sums, and therefore reduces the stimulus to the economy they provide.
No-cash-out refi mortgages at lower mortgage rates also boost consumer spending, as the lower rates reduce payments that then leave some extra every month to spend on other stuff. But the spike in mortgage rates, and the subsequent 92% collapse of no-cash-out refi mortgage applications ends this program.
Source: by Wolf Richter | Wolf Street
***
George Gammon: Thinking of buying a house? Stop and watch this first – MS
US housing implosion about to start – Market Sanity
Bank of America declares ‘technical recession’ – NTD
Inflation, consumer woe add to worries that recession is already here – CNBC
“Warning flags are everywhere” – ECB, inflation and U.S. stocks – QTR
Bond market rout so severe double-digit losses are the norm – Yahoo!
Get ready for currency collapses – King World News
Retail Stock Buying In July Blew Away All Records, 50% Higher Than Previous All Time High

(ZeroHedge) Last month, when out of the blue we saw a sharp surge in a handful of gigacap names among which Amazon, which rapidly broke out of the range it had been trading in for the past year as a result of an aggressive bid in short-dated OTM calls, a move we dubbed Gammazon, we speculated that a key driver behind this move are retail investors who had moved away from their usual small and mid-cap stomping grounds and decided to target illiquid tech giants during the lowest volume season of the year.
Now that the data is in, it appears that we were right.
The Zombification Of America – Over 40% Of Listed Companies Don’t Make Money
It’s absolutely stunning how the Fed/ECB/BoJ injected upwards of $1.1 trillion into global markets in the last quarter and cut rates 80 times in the past 12 months, which allowed money-losing companies to survive another day.
The leader of all this insanity is Telsa, the biggest money-losing company on Wall Street, has soared 120% since the Fed launched ‘Not QE.’
Tesla investors are convinced that fundamentals are driving the stock higher, but that might not be the case, as central bank liquidity has been pouring into anything with a CUSIP.
The company has lost money over the last 12 months, and to be fair, Elon Musk reported one quarter that turned a profit, but overall – Tesla is a black hole. Its market capitalization is larger than Ford and General Motors put together. When you listen to Tesla investors, near-term profitability isn’t important because if it were, the stock would be much lower.
The Wall Street Journal notes that in the past 12 months, 40% of all US-listed companies were losing money, the highest level since the late 1990s – or a period also referred to as the Dot Com bubble.
Jay Ritter, a finance professor at the University of Florida, provided The Journal with a chart that shows the percentage of money-losing IPOs hit 81% in 2018, the same level that was also seen in 2000.
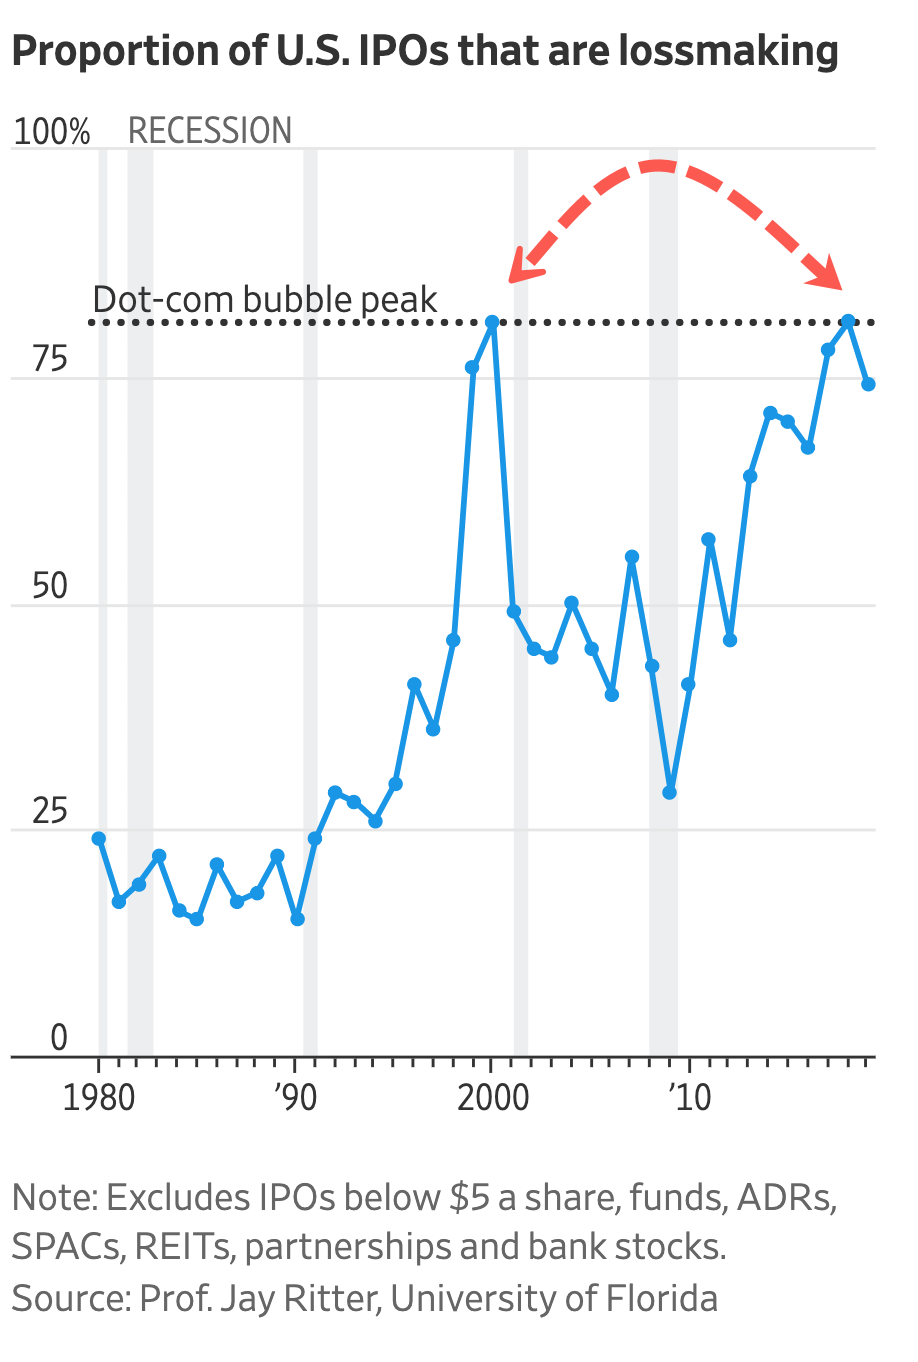
The Journal notes that 42% of health-care companies lost money, mostly because of speculative biotech. About 17% of technology companies also fail to turn a profit.
A more traditional company that has been losing money is GE. Its shares have plunged 60% in the last 42 months as a slowing economy, and insurmountable debts have forced a balance sheet recession that has doomed the company.
Data from S&P Global Market Intelligence shows for small companies, losing money is part of the job. About 33% of the 100 biggest companies reported losses over the last 12 months.
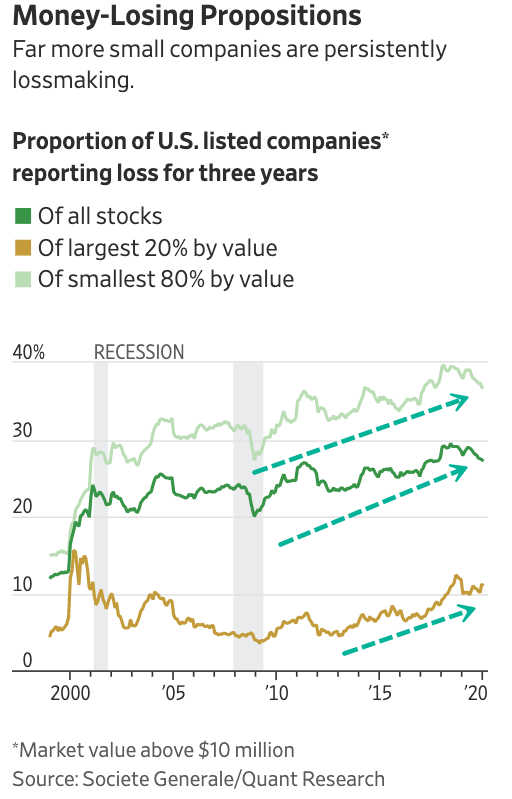
Among the smallest 80% of companies, there has been a notable rise in money-losing operations in the last three years.

“The proportion of these loss-making companies rose after each of the last two recessions and didn’t come down again afterward. The story should be familiar by now: Many small companies are being dominated by the biggest corporates, squeezing them out of markets and crushing their ability to invest for growth,” The Journal noted.
And while central bank liquidity has zombified companies, investors are already starting to make a mad dash out of trash into companies that turn a profit ahead of the next recession.
Goldman Sachs Has Just Issued An Ominous Warning About Stock Market Crash In October
Are we about to see the stock market crash this year? That is what Goldman Sachs seems to think, and it certainly wouldn’t be the first time that great financial chaos has been unleashed during the month of October. When the stock market crashed in October 1929, it started the worst economic depression that we have ever witnessed. In October 1987, the largest single day percentage decline in U.S. stock market history rocked the entire planet. And the nightmarish events of October 2008 set the stage for a “Great Recession” that we still haven’t fully recovered from. So could it be possible that something similar may happen in October 2019?
The storm clouds are looming and disaster could strike at any time. This is one of the most critical times in the history of our nation, and most Americans are completely unprepared for what is going to happen next.
This Time Is Different
Bubble Burst? Smart Money Flow Index Continues To Decline To 1995 Levels
The Smart Money Flow Index, measuring the movement of the Dow in two time periods: the first 30 minutes and the last hour, has just declined AGAIN.

The Smart Money Flow Index, like the DJIA, has been around for decades. But it has just fallen to the lowest level since 1995.
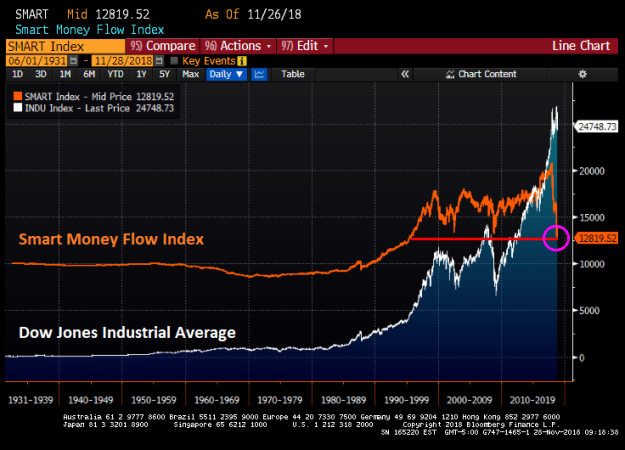
Is the asset bubble starting to burst? Or is it just one lone indicator getting sick?

September YoY Home Sales Down 13.2%, Median Price Down 3.5%, S&P Down 6.5% From High
New Home Sales (SAAR) in September plunged to their lowest since Dec 2016, crashing 5.5% MoM (and revised dramatically lower in August)… Maybe Trump has a point on Fed rate hikes?
Remember this is the first month that takes the impact of the latest big spike in rates – not good!
This is a disastrous print:
August’s 629k SAAR was revised drastically lower to 585k and September printed 553k (SAAR) massively missing expectations of 625k (SAAR) – plunging to the weakest since Dec 2016…

That is a 13.2% collapse YoY – the biggest drop since May 2011

The median sales price decreased 3.5% YoY to $320,000…

New homes sales were down across all regions … except the midwest.

As the supply of homes at current sales rate rose to 7.1 months, the highest since March 2011, from 6.5 months.

The decline in purchases was led by a 40.6 percent plunge in the Northeast to the lowest level since April 2015 and 12 percent drop in the West.
70% Of S&P 500 Stocks Are Already In A Correction
Spooked by fears about peak profits, the slowing Chinese economy, Trump’s tariffs, ongoing political turmoil in the UK and Italy, and ongoing jitters among systematic, vol-targeting funds, on Tuesday the S&P tumbled as much as 2.34% in early trade – a drop which almost wiped out all gains for the year – before paring losses and closing only -0.55% lower. The drop pushed the S&P’s decline from its September highs to 6.5%, two-thirds on the way to a technical correction.

However the relatively stability at the index level has masked turmoil among individual names where some 1,256 stocks hit 52-week lows, while only 21 establishing new highs.

More concerning, and a testament to the tech-heavy leadership of the market concentrated amid just a handful of stocks, is that while the broader S&P 500 index has yet to enter a correction, more than three quarters of all S&P stocks – or 353 – have already fallen more than 10% from their highs. Worse, of those, more than half 179 have already fallen by 20% or more from their highs, entering a bear market.

The reason why the broader index has so far avoided a similar fate is because Apple, whose $1 trillion market value makes it by far the most heavily weighted stock within the S&P 500, has fallen only 4.6% from its October 3 record high. That has helped the S&P 500 itself stay out of correction territory.
Broken down by sector, the S&P 500 materials index – the closest proxy of Chinese economic growth – has fared the worst in October, leaving it down 19% from its 52-week highs, with the utilities index is the outperformer, down just 5 percent.

At the individual level, among the bottom 10 S&P 500 performers, are names likes Wynn Resorts and Western Digital, both highly exposed to China. Nektar Therapeutics and Newell Brands are also among the S&P 500’s worst performers.

Taking a step back, despite its relative resilience, the S&P 500 is still on track for its worst month since August 2015, while most global equities are down for the year. North America is still the best performing region with 67% of the six countries having benchmark equities trading higher on the year in US dollar terms, according to Deutsche Bank. In EMEA, only 23% of countries are up, and only 6% of countries in the European Union (in USD). In South American (6 countries) and Asia (18), not a single country has a positive return in USD terms this year.
One day later, and despite widespread call for an imminent market bounce, traders remain completely ambivalent as today’s market cash open action shows:
- Half of S&P 500 stocks rising, half falling
- 5 of 11 S&P 500 groups rising, 6 falling
- 15 DJIA stocks rising, 15 falling
Meanwhile, the Nasdaq has a more negative tone with decliners outpacing advancers. In other words, as Bloomberg’s Andrew Cinko writes, “there’s no follow through on either the upside or the downside after yesterday’s epic rebound. At this moment, he who hesitates isn’t lost, in fact, he’s got a lot of company as stock market pundits engage in verbal duel over where we go from here.”
Insider Selling Soars In “Cautionary Sign” To Market
One month ago, when Apple finally crossed above $1 trillion in market cap, Goldman’s chief equity strategist David Kostin said that investors had been focusing on the “wrong $1 trillion question”, adding that the correct question was: what amount of buyback will companies authorize in 2018? The reason was that according to the latest estimate from Goldman’s buyback desk, stock buyback authorizations in 2018 had increased to a record $1.0 trillion – a result of tax reform and strong cash flow growth – a 46% rise from last year.

The upward revision was warranted: according to TrimTabs calculations, buyback announcements swelled to a record $436.6 billion in the second quarter, smashing the previous record of $242.1 billion set just one quarter earlier, in Q1. Combined, this meant that buybacks in the first half totaled a ridiculous $680 billion which annualized amounted to a staggering $1.35 trillion, indicating that Goldman’s revised estimate may in fact be conservative.
Furthermore, with many strategists warning that August could be a volatile month, Goldman remained optimistic noting that “August is the most popular month for repurchase executions, accounting for 13% of annual activity”, implying that a solid buyback bid would support the market in a worst case scenario which never materialized as the S&P rose to a fresh all time high at the end of the month.

Based on the Goldman data and estimates, it is probably safe to say that August was one of the all-time record months in terms of buyback activity. That companies would be scrambling to repurchase their stock last month was not lost on one particular group of investors: the corporate insiders of the companies buying back their own stocks.
According to data compiled by TrimTabs, insider selling reached $450 million daily in August, the highest level this year; on a monthly basis, insiders sold more than $10 billion of their stock, the most of any month this year and near the most on record.

“As corporate buying is at least taking a breather, corporate insiders are ramping up share selling as the major U.S. stock market averages are at or near record highs,” TrimTabs wrote in a note.
In other words, as insiders and management teams authorized record buybacks, the same insiders and management teams were some of the biggest sellers into this very bid, which one would say is a rather risk-free way of dumping their stock without any risk of the clearing price declining. It also suggests that contrary to prevailing expectations, stocks are anything but cheap when viewed from the lens of insiders who know their own profit potential best.
There is another consideration: September is traditionally the most volatile month for the stock market (especially the last two weeks), and it may be the insiders are simply looking to offload their holdings ahead of a potential air pocket in prices.
As CNBC further notes, September is usually the worst month for stocks, possibly explaining why corporate executives sold so much stock last month. Data from the “Stock Trader’s Almanac” show the S&P 500 and Nasdaq both fall an average of 0.5% in September. The Dow Jones Industrial Average, meanwhile, averages a loss of 0.7% in September.
TrimTabs summarizes this best:
“One cautionary sign for U.S. stocks is that corporate insiders have accelerated their selling of U.S. equities,” said Winston Chua, an analyst at TrimTabs. “They’ve dedicated record amounts of shareholder money to buybacks but aren’t doing the same with their own which suggests that companies aren’t buying stocks because they’re cheap.”
Finally, as we noted yesterday, the September selling may have started early this year in an ominous sign for the rest of the month:
it’s already been a tough start to the month of September for the S&P 500, which has fallen for the fourth day in a row. This is notable, as LPL Financial notes “going back to the Great Depression, only two times did it start down the first four days. 1987 and 2001.“
And with insiders dumping a near record amount of stock, it may be the case that the selling is only just getting started.
Excluding FAANG Stocks, The S&P Would Be Negative
Two weeks ago, Goldman made a surprising finding: as of July 1, just one stock alone was responsible for more than a third of the market’s YTD performance: Amazon, whose 45% YTD return has contributed to 36% of the S&P 3% total return this year, including dividends. Goldman also calculated that the rest of the Top 10 S&P 500 stocks of 2018 are the who’s who of the tech world, and collectively their total return amounted to 122% of the S&P total return in the first half of the year.

And another striking fact: just the Top 4 stocks, Amazon, Microsoft, Apple and Netflix have been responsible for 84% of the S&P upside in 2018 (and yes, these are more or less the stocks David Einhorn is short in his bubble basket, which explains his -19% YTD return).

Now, in a review of first half performance, Bank of America has performed a similar analysis and found that excluding just the five FAANG stocks, the S&P 500 return in H1 would have been -0.7%; Staples (-8.6%) and Telco (-8.4%) were the worst.

FAANGs aside, here are the other notable sector observations about a market whose leadership has rarely been this narrow:
- Only three sectors outperformed in the 1H (Discretionary, Tech and Energy). Meanwhile, Staples and Telecom were the worst-performers in the 1H.
- Energy staged the biggest comeback in 2Q to become the quarter’s best-performing sector after turning in among the worst returns in 1Q.
- Industrials and Financials notably underperformed in June, the 2Q, and the 1H while Discretionary and Energy outperformed in all three.

Looking at the entire first half performance, tech predictably was the biggest contributor to the S&P 500’s 1H gain, contributing 2.6ppt or 98% of the S&P 500’s 2.6% total return.

The broader market did ok: trade tensions, negative headlines, and the slow withdrawal of Fed liquidity contributed to volatility’s return in June and earlier in February, but the S&P 500 still ended 2Q +3.4% and the 1H +2.6%, outperforming bonds and gold.
The Russell 2000 led the Russell 1000 by 4.9ppt in the 1H as small caps may have benefitted from expectations of a stronger US economy, a strong USD and the sense that smaller more domestic companies are shielded from trade tensions (where we take issue with this notion). However, mega-caps also did well: the “Nifty 50” largest companies within the S&P 500 beat the “Not-so-nifty 450” in the 2Q and the 1H. Non-US performed worst.
Some additional return details by asset class:
- US stocks outperformed most other asset classes in the 1H, including bonds, cash, and gold.
- Within equities, the US was the only major region to post positive returns, outperforming non-US equities by 6.1ppt in US dollar terms in the 1H.
- Amid concerns over global growth, a stronger dollar and trade, coupled with a strong US economic backdrop, small caps outperformed large caps in the 1H.
- Megacaps also did well: the “Nifty 50” mega-caps within the S&P 500 beat the “Other 450” stocks in 2Q and the 1H.

Performance by quant groups:
- Growth factors were the best-performing group in the 1H (+6.7% on average), leading Momentum/Technical factors (the second best-performing group) by 1.7ppt while Value factors were among the weakest.
- Despite the macro risks, the best way to make money was to stick to the fundamentals and own stocks with the highest Upward Estimate Revisions (+12.4% in the 1H), a Growth factor.
- Low Quality (B or worse) stocks beat High Quality (B+ or better) stocks in June, 2Q and the 1H. But both the lowest and highest quality stocks outperformed the rest of the market in all three periods.

The Russell 1000 Growth Index beat the Russell 1000 Value Index by 9ppt in the 1H, on track to exceed last year’s 17ppt spread. Growth factors were the best-performing group in the 1H (+6.7% on avg.), followed by Momentum factors. But Momentum broke down in June, and June saw the 56th worst month out of 60, -1.4 standard deviations from average returns.

What About Alpha?
Unfortunately for active managers, BofA notes that while pair-wise correlations remain lows, alpha remained scarce. The average pairwise correlation of S&P 500 stocks rose sharply in 1Q with the increased volatility which typically hurts stock pickers, but quickly came down below its long-term average of 26% in 2Q. However, performance dispersion (long-short alpha) continues to trail its long-term average.

What does this mean for active managers? According to BofA, never has the herding been this profound: since the bank began to track large cap fund holdings in 2008, managers have been increasing their tilts towards expensive, large, low dividend yield and low quality stocks. And today, their respective factor exposure relative to the S&P 500 is near its record level.

This is a risk because as we discussed recently, the threat is that as a result of an adverse surprise, “everyone” would be forced to sell at the same time. As BofA notes, “positioning matters more than fundamentals in the short-term, and this has been especially true around the quarter-end rebalancing. Since 2012, a long-short strategy of selling the 10 most overweight stocks and buying the 10 most underweight stocks by managers over the 15 days post-quarter-end would have yielded an average annualized spread of 90ppt, 15x higher than the average annualized spread of 6ppt over the full 90 days.”

Keep an eye on the first FAANG today when Netflix reports after the close.
Stocks Suffer Worst Q2 Start Since The Great Depression
Well that really escalated quickly…
After last week’s “paint the tape ahead of a long-weekend” melt-up into the close, the first trading day of the second quarter was a bloodbath… In fact the worst since The Great Depression…

As David Rosenberg (@EconguyRosie) summed up so precisely: New math: every tweet by @realDonaldTrump subtracts 70 points off the Dow. Keep ’em coming.
Woah…a ubiquitous opening bounce, then puked into Europe’s close, then another attempt to ignite momentum, fails and stocks puked into red for the year again…

3rd dead cat bounce in a week…

The S&P 500 and The Dow broke below their critical 200DMA… (Nasdaq is closest to its 200DMA since Brexit plunge) –

there was a desperate last few minutes attempt to rally ’em back above the 200DMAs – Dow ended back above its 200DMA

First time the S&P has closed below the 200DMA since June 27th 2016 (Brexit)

VIX topped 25, leading the US equity index vols higher today…

Tech led the tumble…

Lowest close for NYSE FANG+ Index since January 5th…

With Tesla bonds…

and Stocks really ugly – We suspect Elon is regretting the April Fools’ joke…
Tesla Tumbles After Elon Musk Jokes About Bankruptcy

This morning shareholders of Tesla are hardly laughing, with Tesla stock tumbling as much as 5%, down to $254, the lowest level in a year.

And the 10Y Yield dropping to neat two-month lows…

***
The very next day…
Stocks Soar After Bloomberg Report Unleashes Amazon Buying Panic

It was generally a quiet day, with no macro news and equities range-bound, seemingly spooked by the ongoing verbal war between Trump and Jeff Bezos, where first in a tweet then a White House press conference, the president warned that US taxpayers will no longer subsidize Amazon “by the billions.” And, as has been the case recently, every time Trump spoke or tweeted, Amazon turned negative.
And then, just around 2:45pm, a Bloomberg headline hit, according to which President Trump is not formally looking at options to address his concerns with Amazon, which immediately unleashed a buying panic first in Amazon and then across the broader market:

Bonds Finally Noticed What Is Going On… Are Stocks Next?
It is safe to say that one of the most popular, and important, charts of 2017, was the one showing the ongoing and projected decline across central bank assets, which from a record expansion of over $2 trillion in early 2017 is expected to turn negative by mid 2019. This is shown on both a 3- and 12-month rolling basis courtesy of these recent charts from Citi.

The reason the above charts are key, is because as Citi’s Matt King, DB’s Jim Reid, BofA’s Barnaby Martin and countless other Wall Street commentators have pointed out, historically asset performance has correlated strongly with the change in central bank balance sheets, especially on the way up.
As a result, the big question in 2017 (and 2018) is whether risk assets would exhibit the same correlation on the way down as well, i.e. drop.
We can now say that for credit the answer appears to be yes, because as the following chart shows, the ongoing decline in CB assets is starting to have an adverse impact on investment grade spreads which have been pushing wider in recent days, in large part due to the sharp moves in government bonds underline the credit spread.

And, what is more important, is that investors appear to have noticed the repricing across credit. This is visible in two places: on one hand while inflows into broader credit have remained generally strong, there has been a surprisingly sharp and persistent outflow from US high yield funds in recent weeks. These outflows from junk bond funds have occurred against a backdrop of rising UST yields, which recently hit 2.67%, the highest since 2014, another key risk factor to credit investors.
But while similar acute outflows have yet to be observed across the rest of the credit space, and especially among investment grade bonds, JPM points out that the continued outflows from HY and some early signs of waning interest in HG bonds in the ETF space in the US has also been accompanied by sharp increases in short interest ratios in LQD (Figure 13), the largest US investment grade bond ETF…

… as well as HYG, the largest US high yield ETF by total assets,

This, together with the chart showing the correlation of spreads to CB assets, suggests that positioning among institutional investors has turned markedly more bearish recently.
Putting the above together, it is becoming increasingly apparent that a big credit-quake is imminent, and Wall Street is already positioning to take advantage of it when it hits.
So what about stocks?
Well, as Citi noted two weeks ago, one of the reasons why there has been a dramatic surge in stocks in the new years is that while the impulse – i.e., rate of change – of central bank assets has been sharply declining on its way to going negative in ~18 months, the recent boost of purchases from EM FX reserve managers, i.e. mostly China, has been a huge tailwind to stocks.

This “intervention”, as well as the recent retail capitulation which has seen retail investors unleashed across stock markets, buying at a pace not seen since just before both the 1987 and 2008 crash, helps explain why stocks have – for now – de-correlated from central bank balance sheets. This is shown in the final chart below, also from Citi.

And while the blue line and the black line above have decoupled, it is only a matter of time before stocks notice the same things that are spooking bonds, and credit in general, and get reacquainted with gravity.
What happens next? Well, if the Citi correlation extrapolation is accurate, and historically it has been, it would imply that by mid-2019, equities are facing a nearly 50% drop to keep up with central bank asset shrinkage. Which is why it is safe to say that this is one time when the bulls will be praying that correlation is as far from causation as statistically possible.
… age makes absolutely no difference
Morgan Stanley: “Client Cash Is At Its Lowest Level” As Institutions Dump Stocks To Retail
The “cash on the sidelines” myth is officially dead.

Recall that at the end of July, we reported that in its Q2 earnings results, Schwab announced that after years of avoiding equities, clients of the retail brokerage opened the highest number of brokerage accounts in the first half of 2017 since 2000. This is what Schwab said on its Q2 conference call:
New accounts are at levels we have not seen since the Internet boom of the late 1990s, up 34% over the first half of last year. But maybe more important for the long-term growth of the organization is not so much new accounts, but new-to-firm households, and our new-to-firm retail households were up 50% over that same period from 2016.
In total, Schwab clients opened over 350,000 new brokerage accounts during the quarter, with the year-to-date total reaching 719,000, marking the biggest first-half increase in 17 years. Total client assets rose 16% to $3.04 trillion. Perhaps more ominously to the sustainability of the market’s melt up, Schwab also adds that the net cash level among its clients has only been lower once since the depths of the financial crisis in Q1 2009:
Now, it’s clear that clients are highly engaged in the markets, we have cash being aggressively invested into the equity market, as the market has climbed. By the end of the second quarter, cash levels for our clients had fallen to about 11.5% of assets overall, now, that’s a level that we’ve only seen one time since the market began its recovery in the spring of 2009.
While some of this newfound euphoria may have been due to Schwab’s recent aggressive cost-cutting strategy, it is safe to say that the wholesale influx of new clients, coupled with the euphoria-like allocation of cash into stocks, means that between ETFs and other passive forms of investing, as well as on a discretionary basis, US retail investors are now the most excited to own stocks since the financial crisis. In a confirmation that retail investors had thrown in the towel on prudence, according to a quarterly investment survey from E*Trade, nearly a third of millennial investors were planning to move out of cash and into new positions in the second half of 2017. By comparison, only 19% of Generation X investors (aged 35-54) were planning such a change to their portfolio, while 9% of investors above the age of 55 had plans to buy in.
Furthermore, according to a June survey from Legg Mason, nearly 80% of millennial investors plan to take on more risk this year, with 66% of them expressing an interest in equities. About 45% plan to take on “much more risk” in their portfolios.
In short, retail investors – certainly those on the low end which relies on commodity brokerages to invest – are going “all in.”
This was also confirmed by the recent UMichigan Consumer Survey, according to which surveyed households said there has – quite literally – never been a better time to buy stocks.

What about the higher net worth segment? For the answer we go to this morning’s Morgan Stanley earnings call, where this exchange was particularly notable:
Question: Hey good morning. Maybe just on the Wealth Management side, you guys had very good growth, sequential growth in deposits. There’s been some discussion in the industry about kind of a pricing pressure. Can you discuss where you saw the positive rates in Wealth Management business and how you’re able to track, I think, about $10 billion sequentially on deposit franchise?
Answer: Sure. I think, as you recall, we’ve been talking about our deposit deployment strategy for quite sometime, and we’ve been investing excess liquidity into our loan product over the last several years. In the beginning of the year, we told you that, that trend would come to an end. We did see that this year. It happened a bit sooner than we anticipated as we saw more cash go into the markets, particularly the equity markets, as those markets rose around the world. And we’ve seen cash in our clients’ accounts at its lowest level.
In other words, when it comes to retail investors – either on the low, or high net worth side – everyone is now either all in stocks or aggressively trying to get there.
Which reminds us of an article we wrote early this year, in which JPM noted that “both institutions and hedge funds are using the rally to sell to retail.” Incidentally, the latest BofA client report confirmed that while retail investors scramble into stocks, institutions continue to sell. To wit:
Equity euphoria continues to remain absent based on BofAML client flows. Last week, during which the S&P 500 climbed 0.2% to yet another new high, BofAML clients were net sellers of US equities for the fourth consecutive week. Large net sales of single stocks offset small net buys of ETFs, leading to overall net sales of $1.7bn. Net sales were led by institutional clients, who have sold US equities for the last eight weeks; hedge funds were also (small) net sellers for the sixth straight week. Private clients were net buyers, which has been the case in four of the last five weeks, but with buying almost entirely via ETFs. Clients sold stocks across all three size segments last week.”

The best way to visualize what BofA clients, and especially institutions, have been doing in 2017 is the following chart:

Meanwhile, a familiar buyer has returned: “buybacks by corporate clients picked up as US earnings season kicked off, with Financials buybacks continuing to dominate this flow.”
And just like during the peak of the last bubble, retail is once again becoming the last bagholder; now it is only a question of how long before the rug is pulled out. For now, however, enjoy the Dow 23,000.
Fed Warns Markets “Vulnerable to Elevated Valuations” [charts]

Hussman Predicts Massive Losses As Cycle Completes After Fed Warns Markets “Vulnerable to Elevated Valuations”
Buried deep in today’s FOMC Minutes was a warning to the equity markets that few noticed…
This overall assessment incorporated the staff’s judgment that, since the April assessment, vulnerabilities associated with asset valuation pressures had edged up from notable to elevated, as asset prices remained high or climbed further, risk spreads narrowed, and expected and actual volatility remained muted in a range of financial markets…
According to another view, recent rises in equity prices might be part of a broad-based adjustment of asset prices to changes in longer-term financial conditions, importantly including a lower neutral real interest rate, and, therefore, the recent equity price increases might not provide much additional impetus to aggregate spending on goods and services.
According to one view, the easing of financial conditions meant that the economic effects of the Committee’s actions in gradually removing policy accommodation had been largely offset by other factors influencing financial markets, and that a tighter monetary policy than otherwise was warranted.
Roughly translated means – higher equity prices are driving financial conditions to extreme ‘easiness’ and The Fed needs to slow stock prices to regain any effective control over monetary conditions.

And with that ‘explicit bubble warning’, it appears the ‘other’ side of the cycle, that Hussman Funds’ John Hussman has been so vehemently explaining to investors, is about to begin…
Nothing in history leads me to expect that current extremes will end in something other than profound disappointment for investors. In my view, the S&P 500 will likely complete the current cycle at an index level that has only 3-digits. Indeed, a market decline of -63% would presently be required to take the most historically reliable valuation measures we identify to the same norms that they have revisited or breached during the completion of nearly every market cycle in history.
The notion that elevated valuations are “justified” by low interest rates requires the assumption that future cash flows and growth rates are held constant. But any investor familiar with discounted cash flow valuation should recognize that if interest rates are lower because expected growth is also lower, the prospective return on the investment falls without any need for a valuation premium.
At present, however, we observe not only the most obscene level of valuation in history aside from the single week of the March 24, 2000 market peak; not only the most extreme median valuations across individual S&P 500 component stocks in history; not only the most extreme overvalued, overbought, over bullish syndromes we define; but also interest rates that are off the zero-bound, and a key feature that has historically been the hinge between overvalued markets that continue higher and overvalued markets that collapse: widening divergences in internal market action across a broad range of stocks and security types, signaling growing risk-aversion among investors, at valuation levels that provide no cushion against severe losses.
We extract signals about the preferences of investors toward speculation or risk-aversion based on the joint and sometimes subtle behavior of numerous markets and securities, so our inferences don’t map to any short list of indicators. Still, internal dispersion is becoming apparent in measures that are increasingly obvious. For example, a growing proportion of individual stocks falling below their respective 200-day moving averages; widening divergences in leadership (as measured by the proportion of individual issues setting both new highs and new lows); widening dispersion across industry groups and sectors, for example, transportation versus industrial stocks, small-cap stocks versus large-cap stocks; and fresh divergences in the behavior of credit-sensitive junk debt versus debt securities of higher quality. All of this dispersion suggests that risk-aversion is rising, no longer subtly. Across history, this sort of shift in investor preferences, coupled with extreme overvalued, overbought, over bullish conditions, has been the hallmark of major peaks and subsequent market collapses.
The chart below shows the percentage of U.S. stocks above their respective 200-day moving averages, along with the S&P 500 Index. The deterioration and widening dispersion in market internals is no longer subtle.

Market internals suggest that risk-aversion is now accelerating. The most extreme variants of “overvalued, overbought, over bullish” conditions we identify are already in place.

A market loss of [1/2.70-1 =] -63% over the completion of this cycle would be a rather run-of-the-mill outcome from these valuations. All of our key measures of expected market return/risk prospects are unfavorable here. Market conditions will change, and as they do, the prospective market return/risk profile will change as well. Examine all of your investment exposures, and ensure that they are consistent with your actual investment horizon and tolerance for risk.
BofA: This Entire Rally Has Been Institutions Selling To “Animal Spirited” Retail Investors
Important considerations for those who acquire and leverage real estate with financial market assets.
Another paradoxical observation emerges when combing through the latest Bank of America data.
First, as discussed earlier today, while a net 48% of surveyed fund managers had an allocation to equities in March, the highest in two years, this flood into stocks has taken place even as the highest number of respondents since 2000 admitted stocks were overvalued.

That was one part.
The other part is that while fund managers respond that they are loading up on stocks, what they are doing is very different, and as BofA’s Jill Hall reported overnight, the bank’s clients sold stocks for the fifth consecutive week led entirely by institutional clients.
According to the report, last week, during which the S&P 500 climbed 0.2% (but remained below its early-March highs), BofA clients were net sellers of US equities for the fifth consecutive week, in the amount of $891MM. ETFs continued to see muted inflows, while single stocks saw outflows. There was one smallchange: unlike the previous four weeks, when sales had been broad-based across client groups, net sales last week were entirely due to institutional clients, while private clients and hedge funds were net buyers for the first time in five and seven weeks, respectively. These two groups had been the chief buyers of equities post-election prior to the recent selling streak. In other words, while previously the great rotation was out of institutions and hedge funds to “animal spirited” rich retail investors, last week hedge funds joined the buy parade, perhaps pressured by a need to catch up to their benchmark at quarter-end, and buy any overvalued garbage they could find.
More Details:
- Clients were net sellers across all three size segments last week. Buybacks by corporate clients slowed from the prior week’s levels, and year-to-date continue to track their lowest of any comparable period since 2013.
- Biggest buying of Health Care stocks in over a year
- Clients sold stocks in eight of the eleven sectors last week, led by Consumer Discretionary and Industrials (which have both seen net sales for the last five weeks). Real Estate-the worst-performing sector in March-continues to have the longest selling streak (for seven consecutive weeks).
- And amid the Fed rate hike last week, Utilities saw their biggest sales in three months. Health Care stocks saw the largest net buying, with the biggest inflows since last January and the first positive flows in six weeks, driven by institutional clients. This sector saw the greatest outflows of any sector in 2016 and has seen the second-largest outflows (after Discretionary) year-to-date.
- Bearish sentiment, light positioning and attractive valuations are several reasons we are positive on Health Care stocks, where we see political risks as overly discounted. Other sectors which saw inflows last week were Materials and Telecom, where flows into Materials were the largest since last February.
Other notable flows: Broad-based sales of Disc. & bond proxies
- Hedge funds, private clients and institutional clients alike were net sellers of Consumer Discretionary stocks last week-which typically underperform during tightening cycles-along with stocks in the bond-proxy sectors of Utilities and Real Estate. No sector saw net buying by all three groups.
- Hedge funds’ net buying last week was spread across five cyclical sectors, while private clients’ net buying was entirely in ETFs and Financials stocks last week.
- Pension fund clients were net sellers of US stocks for the second straight week, led by sales of ETFs and Real Estate stocks. Their biggest purchases last week were of Energy stocks. For more details, see Pension fund flows.
Finally, here is the breakdown of institutional, HF and retail client flow prior to US election through present. What it clearly shows is that the whole rally has been one “great rotation” from selling institutional investors to buying “animal spirited” retail traders.

And when institutions sell enough, the bottom from the market is pulled, retail panics to sell as the S&P tumbled, institutions reload, and the whole cycle repeats.
110-Day Streak Is Over – S&P Drops 1% For First Time Since October
The S&P 500 is down over 1% this morning. While in the old normal that would be nothing much to note, in the new normal, this is the biggest drop since October 11th!

The 110-day streak without a 1% drop is over… this was the longest streak since May 1995

Below is a look at historical streaks of trading days without a 1%+ decline going back to 1928:

VIX topped 12.5 for the first time since february and is breaking towards its 100DMA…

And for those expecting The Fed to step in and save the day… Don’t hold your breath!
Don’t care about stock market fall itself. Care abt potential financial instability. Stock market drop unlikely to trigger crisis. #AskNeel https://t.co/Cv7ENuJuqU
— Neel Kashkari (@neelkashkari) March 21, 2017
And sure enough,

The “Mystery” Of Who Is Pushing Stocks To All Time Highs Has Been Solved
One conundrum stumping investors in recent months has been how, with investors pulling money out of equity funds (at last check for 17 consecutive weeks) at a pace that suggests a full-on flight to safety, as can be seen in the chart below which shows record fund outflows in the first half of the year – the fastest pace of withdrawals for any first half on record…

… are these same markets trading at all time highs? We now have the answer.
Recall at the end of January when global markets were keeling over, that Citi’s Matt King showed that despite aggressive attempts by the ECB and BOJ to inject constant central bank liquidity into the gunfible global markets, it was the EM drain via reserve liquidations, that was causing a shock to the system, as net liquidity was being withdrawn, and in the process stocks were sliding.

Fast forward six months when Matt King reports that “many clients have been asking for an update of our usual central bank liquidity metrics.”
What the update reveals is “a surge in net global central bank asset purchases to their highest since 2013.”

And just like that the mystery of who has been buying stocks as everyone else has been selling has been revealed.
But wait, there’s more because as King suggests “credit and equities should rally even more strongly than they have done already.”

More observations from King:
The underlying drivers are an acceleration in the pace of ECB and BoJ purchases, coupled with a reversal in the previous decline of EMFX reserves. Other indicators also point to the potential for a further squeeze in global risk assets: a broadening out of mutual fund inflows from IG to HY, EM and equities; the second lowest level of positions in our credit survey (after February) since 2008; and prospects of further stimulus from the BoE and perhaps the BoJ.
His conclusion:
While we remain deeply skeptical of the durability of such a policy-induced rally, unless there is a follow-through in terms of fundamentals, and in credit had already started to emphasize relative value over absolute, we suspect those with bearish longer-term inclinations may nevertheless feel now is not the time to position for them.
And some words of consolation for those who find themselves once again fighting not just the Fed but all central banks:
The problems investors face are those we have referred to many times: markets being driven more by momentum than by value, and most negatives being extremely long-term in nature (the need for deleveraging; political trends towards deglobalization; a steady erosion of confidence in central banks). Against these, the combination of UK political fudge (and perhaps Italian tiramisu), a lack of near-term catalysts, and overwhelming central bank liquidity risks proving overwhelming – albeit only temporarily.
Why have central banks now completely turned their backs on the long-run just to provide some further near-term comfort? Simple: as Keynes said, in the long-run we are all dead.
The Bubble No One Is Talking About

Summary
- There has been an inexplicable divergence between the performance of the stock market and market fundamentals.
- I believe that it is the growth in the monetary base, through excess bank reserves, that has created this divergence.
- The correlation between the performance of the stock market and the ebb and flow of the monetary base continues to strengthen.
- This correlation creates a conundrum for Fed policy.
- It is the bubble that no one is talking about.
The Inexplicable Divergence
After the closing bell last Thursday, four heavyweights in the S&P 500 index (NYSEARCA:SPY) reported results that disappointed investors. The following morning, Alphabet (NASDAQ:GOOG) (NASDAQ:GOOGL), Microsoft (NASDAQ:MSFT), Starbucks (NASDAQ:SBUX) and Visa (NYSE:V) were all down 4% or more in pre-market trading, yet the headlines read “futures flat even as some big names tumble post-earnings.” This was stunning, as I can remember in the not too distant past when a horrible day for just one of these goliaths would have sent the broad market reeling due to the implications they had for their respective sector and the market as a whole. Today, this is no longer the case, as the vast majority of stocks were higher at the opening of trade on Friday, while the S&P 500 managed to close unchanged and the Russell 2000 (NYSEARCA:IWM) rallied nearly 1%.
This is but one example of the inexplicable divergence between the performance of the stock market and the fundamentals that it is ultimately supposed to reflect – a phenomenon that has happened with such frequency that it is becoming the norm. It is as though an indiscriminate buyer with very deep pockets has been supporting the share price of every stock, other than the handful in which the selling is overwhelming due to company-specific criteria. Then again, there have been rare occasions when this buyer seems to disappear.
Why did the stock market cascade during the first six weeks of the year? I initially thought that the market was finally discounting fundamentals that had been deteriorating for months, but the swift recovery we have seen to date, absent any improvement in the fundamentals, invalidates that theory. I then surmised, along with the consensus, that the drop in the broad market was a reaction to the increase in short-term interest rates, but this event had been telegraphed repeatedly well in advance. Lastly, I concluded that the steep slide in stocks was the result of the temporary suspension of corporate stock buybacks that occur during every earnings season, but this loss of demand has had only a negligible effect during the month of April.
The bottom line is that the fundamentals don’t seem to matter, and they haven’t mattered for a very long time. Instead, I think that there is a more powerful force at work, which is dictating the short- to intermediate-term moves in the broad market, and bringing new meaning to the phrase, “don’t fight the Fed.” I was under the impression that the central bank’s influence over the stock market had waned significantly when it concluded its bond-buying programs, otherwise known as quantitative easing, or QE. Now I realize that I was wrong.
The Monetary Base
In my view, the most influential force in our financial markets continues to be the ebb and flow of the monetary base, which is controlled by the Federal Reserve. In layman’s terms, the monetary base includes the total amount of currency in public circulation in addition to the currency held by banks, like Goldman Sachs (NYSE:GS) and JPMorgan (NYSE:JPM), as reserves.
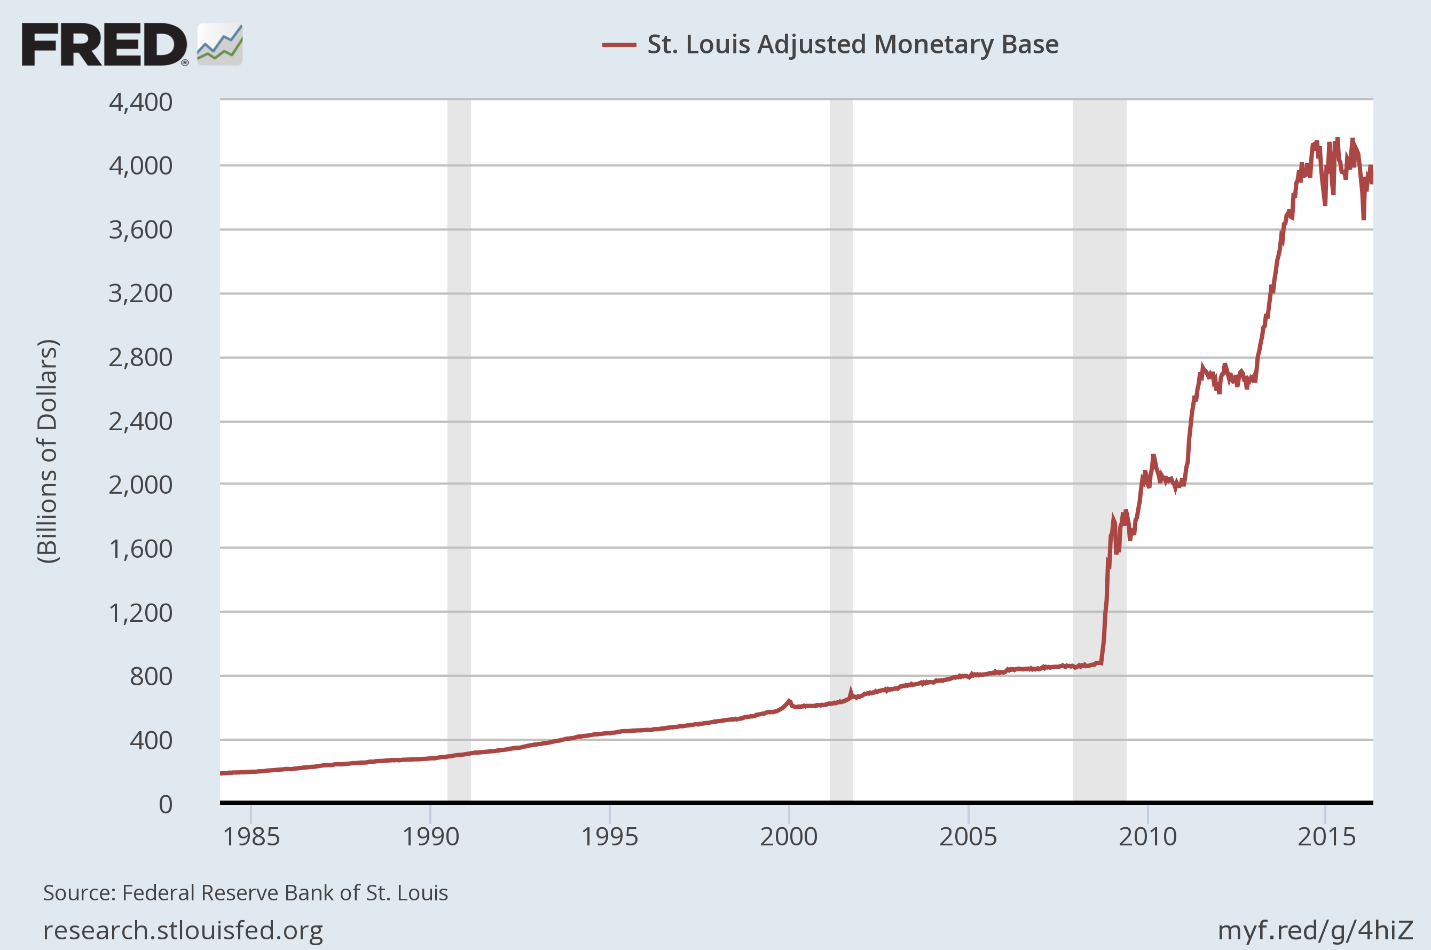
Bank reserves are deposits that are not being lent out to a bank’s customers. Instead, they are either held with the central bank to meet minimum reserve requirements or held as excess reserves over and above these requirements. Excess reserves in the banking system have increased from what was a mere $1.9 billion in August 2008 to approximately $2.4 trillion today. This accounts for the majority of the unprecedented increase in the monetary base, which now totals a staggering $3.9 trillion, over the past seven years.
The Federal Reserve can increase or decrease the size of the monetary base by buying or selling government bonds through a select list of the largest banks that serve as primary dealers. When the Fed was conducting its QE programs, which ended in October 2014, it was purchasing US Treasuries and mortgage-backed securities, and then crediting the accounts of the primary dealers with the equivalent value in currency, which would show up as excess reserves in the banking system.
A Correlation Emerges
Prior to the financial crisis, the monetary base grew at a very steady rate consistent with the rate of growth in the US economy, as one might expect. There was no change in the growth rate during the booms and busts in the stock market that occurred in 2000 and 2008, as can be seen below. It wasn’t until the Federal Reserve’s unprecedented monetary policy intervention that began during the financial crisis that the monetary base soared, but something else also happened. A very close correlation emerged between the rising value of the overall stock market and the growth in the monetary base.
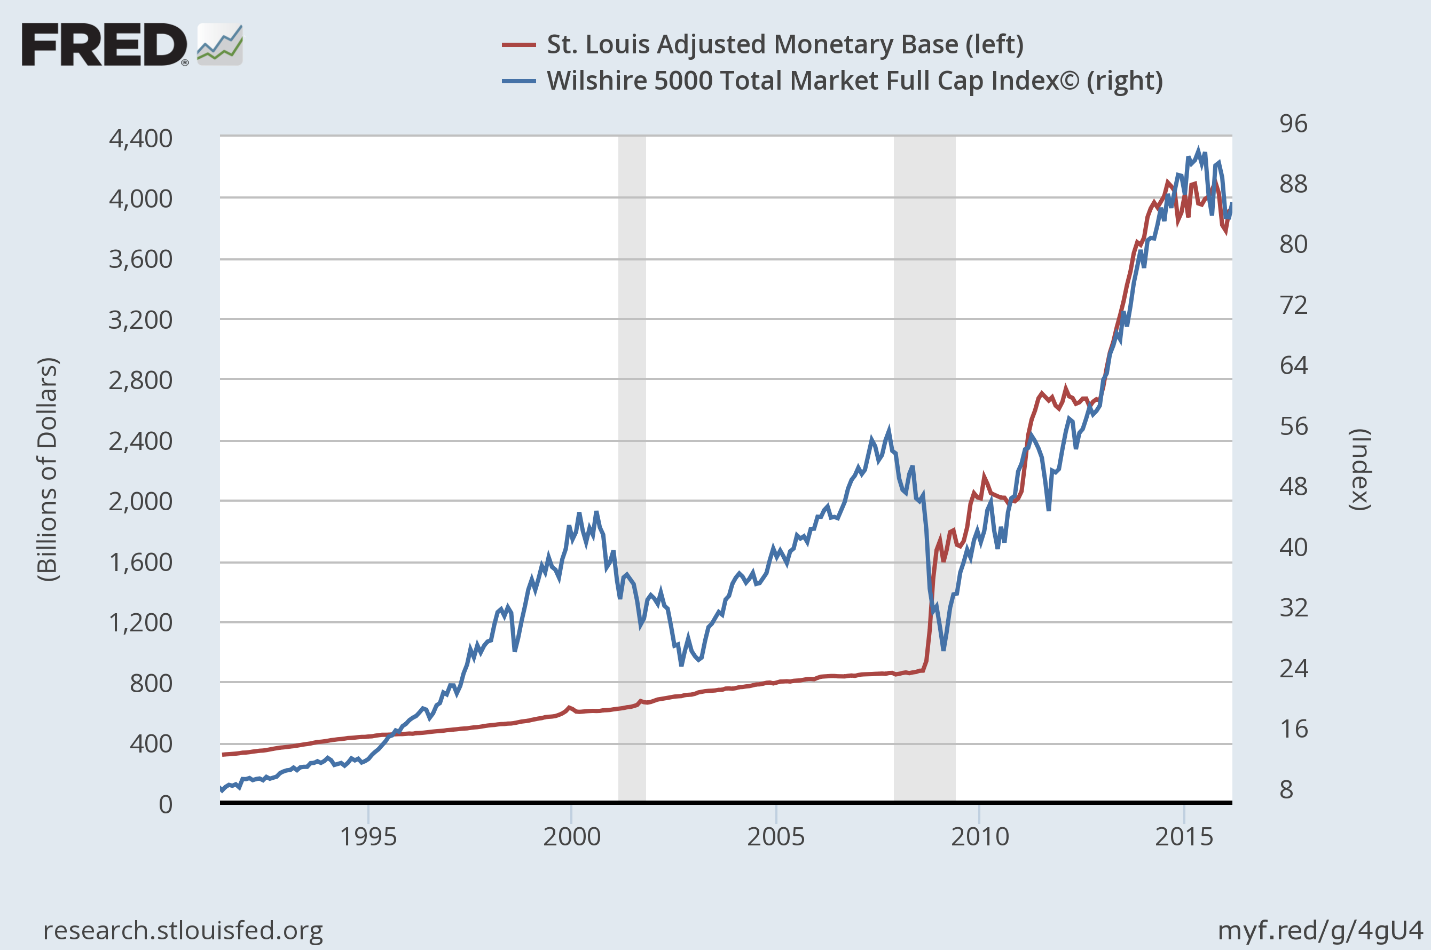
It is well understood that the Fed’s QE programs fueled demand for higher risk assets, including common stocks. The consensus view has been that the Fed spurred investor demand for stocks by lowering the interest rate on the more conservative investments it was buying, making them less attractive, which encouraged investors to take more risk.
Still, this does not explain the very strong correlation between the rising value of the stock market and the increase in the monetary base. This is where conspiracy theories arise, and the relevance of this data is lost. It would be a lot easier to measure the significance of this correlation if I had proof that the investment banks that serve as primary dealers had been piling excess reserves into the stock market month after month over the past seven years. I cannot. What is important for investors to recognize is that an undeniable correlation exists, and it strengthens as we shorten the timeline to approach present day.
The Correlation Cuts Both Ways
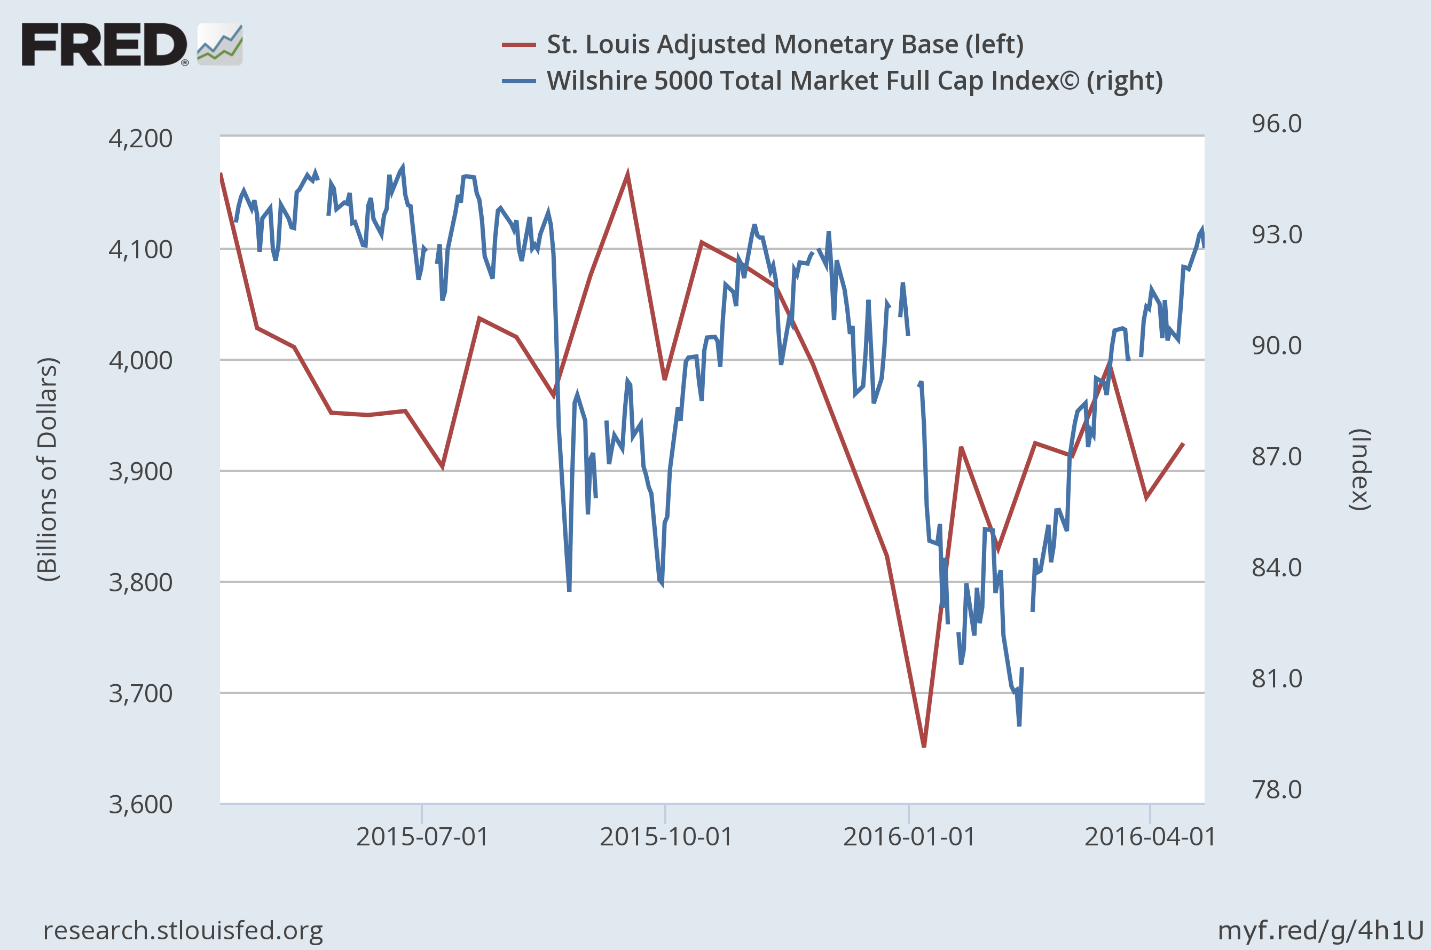
Notice that the monetary base (red line) peaked in October 2014, when the Fed stopped buying bonds. From that point moving forward, the monetary base has oscillated up and down in what is a very modest downtrend, similar to that of the overall stock market, which peaked a few months later.
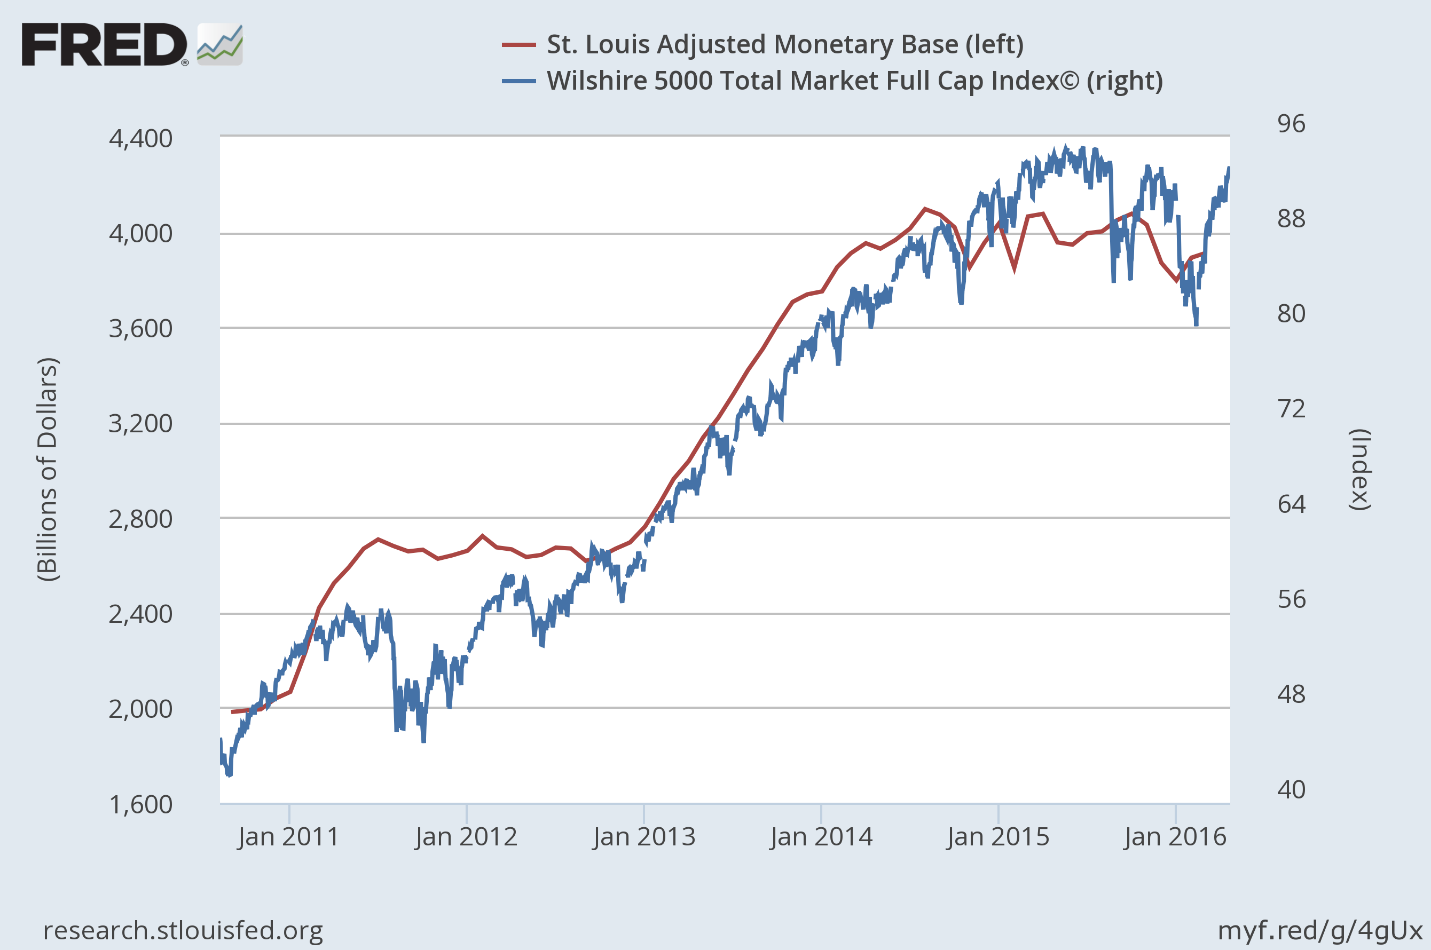
What I have come to realize is that these ebbs and flows continue to have a measurable impact on the value of the overall stock market, but in both directions! This is important for investors to understand if the Fed continues to tighten monetary policy later this year, which would require reducing the monetary base.
If we look at the fluctuations in the monetary base over just the past year, in relation to the performance of the stock market, a pattern emerges, as can be seen below. A decline in the monetary base leads a decline in the stock market, and an increase in the monetary base leads a rally in the stock market. The monetary base is serving as a leading indicator of sorts. The one exception, given the severity of the decline in the stock market, would be last August. At that time, investors were anticipating the first rate increase by the Federal Reserve, which didn’t happen, and the stock market recovered along with the rise in the monetary base.
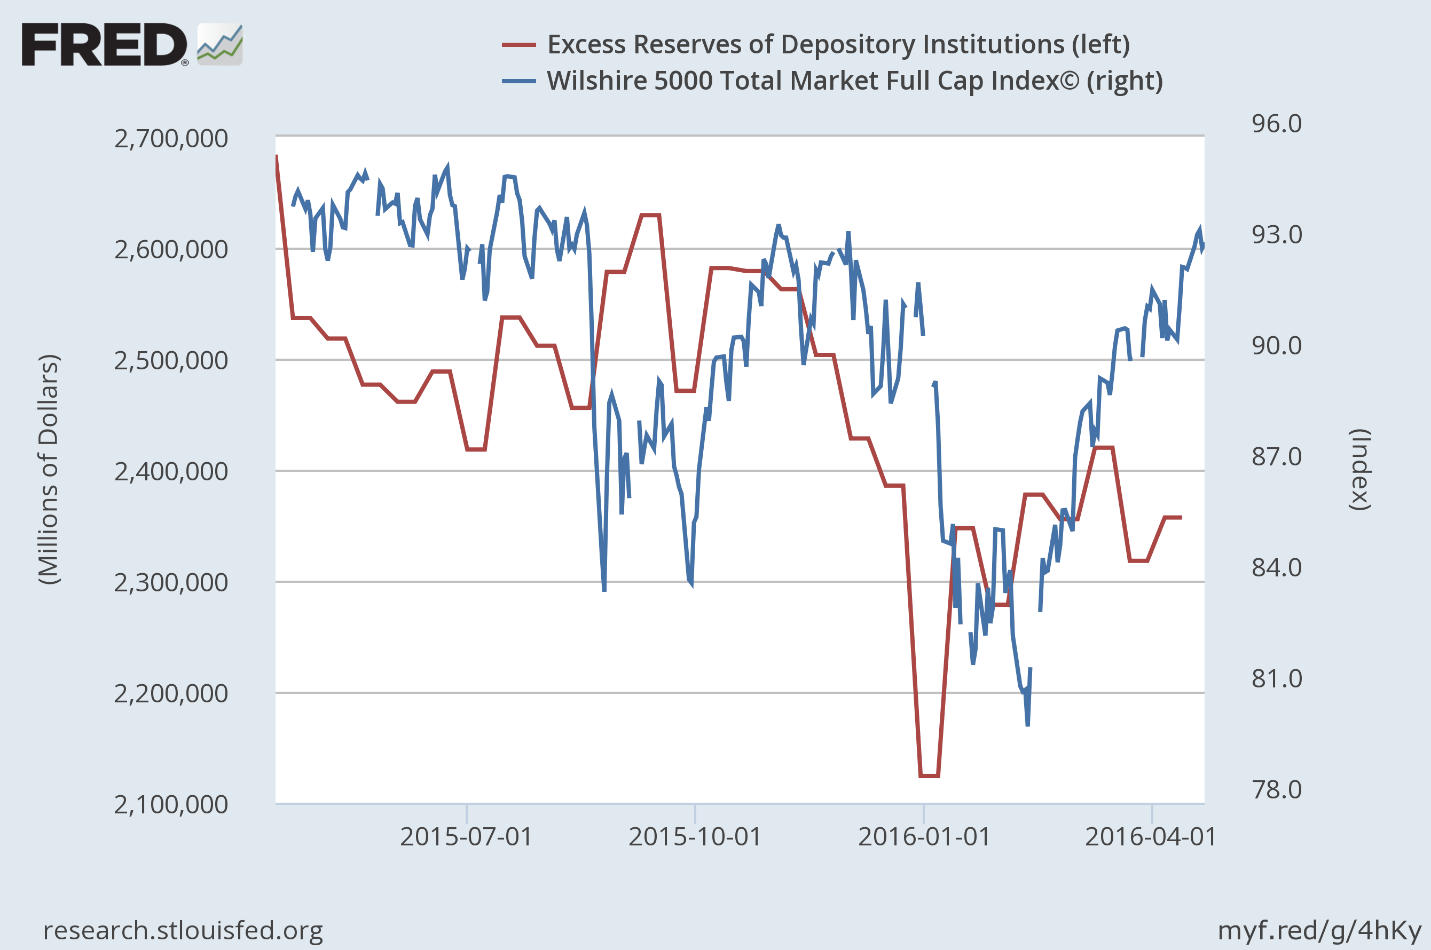
If we replace the fluctuations in the monetary base with the fluctuations in excess bank reserves, the same correlation exists with stock prices, as can be seen below. The image that comes to mind is that of a bathtub filled with water, or liquidity, in the form of excess bank reserves. This liquidity is supporting the stock market. When the Fed pulls the drain plug, withdrawing liquidity, the water level falls and so does the stock market. The Fed then plugs the drain, turns on the faucet and allows the tub to fill back up with water, injecting liquidity back into the banking system, and the stock market recovers. Could this be the indiscriminate buyer that I mentioned previously at work in the market? I don’t know.
What I can’t do is draw a road map that shows exactly how an increase or decrease in excess reserves leads to the buying or selling of stocks, especially over the last 12 months. The deadline for banks to comply with the Volcker Rule, which bans proprietary trading, was only nine months ago. Who knows what the largest domestic banks that hold the vast majority of the $2.4 trillion in excess reserves were doing on the investment front in the years prior. As recently as January 2015, traders at JPMorgan made a whopping $300 million in one day trading Swiss francs on what was speculated to be a $1 billion bet. Was that a risky trade?
Despite the ban on proprietary trading imposed by the Volcker Rule, there are countless loopholes that weaken the statute. For example, banks can continue to trade physical commodities, just not commodity derivatives. Excluded from the ban are repos, reverse repos and securities lending, through which a lot of speculation takes place. There is also an exclusion for what is called “liquidity management,” which allows a bank to put all of its relatively safe holdings in an account and manage them with no restrictions on trading, so long as there is a written plan. The bank can hold anything it wants in the account so long as it is a liquid security.
My favorite loophole is the one that allows a bank to facilitate client transactions. This means that if a bank has clients that its traders think might want to own certain stocks or stock-related securities, it can trade in those securities, regardless of whether or not the clients buy them. Banks can also engage in high-frequency trading through dark pools, which mask their trading activity altogether.
As a friend of mine who is a trader for one of the largest US banks told me last week, he can buy whatever he wants within his area of expertise, with the intent to make a market and a profit, so long as he sells the security within six months. If he doesn’t sell it within six months, he is hit with a Volcker Rule violation. I asked him what the consequences of that would be, to which he replied, “a slap on the wrist.”
Regardless of the investment activities of the largest banks, it is clear that a change in the total amount of excess reserves in the banking system has a significant impact on the value of the overall stock market. The only conclusion that I can definitively come to is that as excess reserves increase, liquidity is created, leading to an increase in demand for financial assets, including stocks, and prices rise. When that liquidity is withdrawn, prices fall. The demand for higher risk financial assets that this liquidity is creating is overriding any supply, or selling, that results from a deterioration in market fundamentals.
There is one aspect of excess reserves that is important to understand. If a bank uses excess reserves to buy a security, that transaction does not reduce the total amount of reserves in the banking system. It simply transfers the reserves from the buyer to the seller, or to the bank account in which the seller deposits the proceeds from the sale, if that seller is not another bank. It does change the composition of the reserves, as 10% of the new deposit becomes required reserves and the remaining 90% remains as excess reserves. The Fed is the only institution that can change the total amount of excess reserves in the banking system, and as it has begun to do so over the past year, I think it is finally realizing that it must reap what it has sown.
The Conundrum
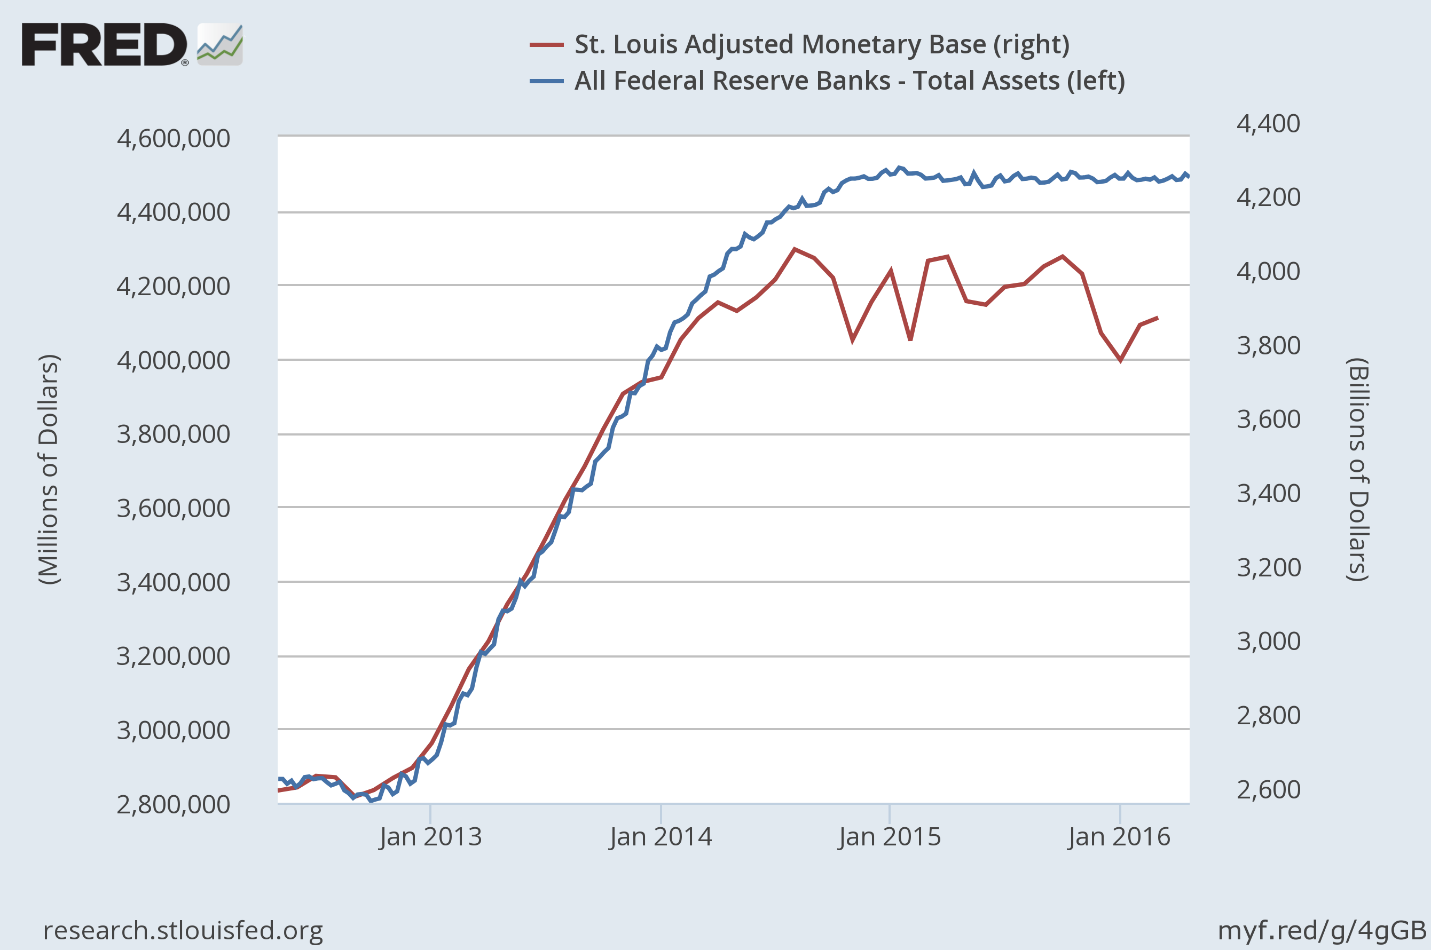
In order to tighten monetary policy, the Federal Reserve must drain the banking system of the excess reserves it has created, but it doesn’t want to sell any of the bonds that it has purchased. It continues to reinvest the proceeds of maturing securities. As can be seen below, it holds approximately $4.5 trillion in assets, a number which has remained constant over the past 18 months.
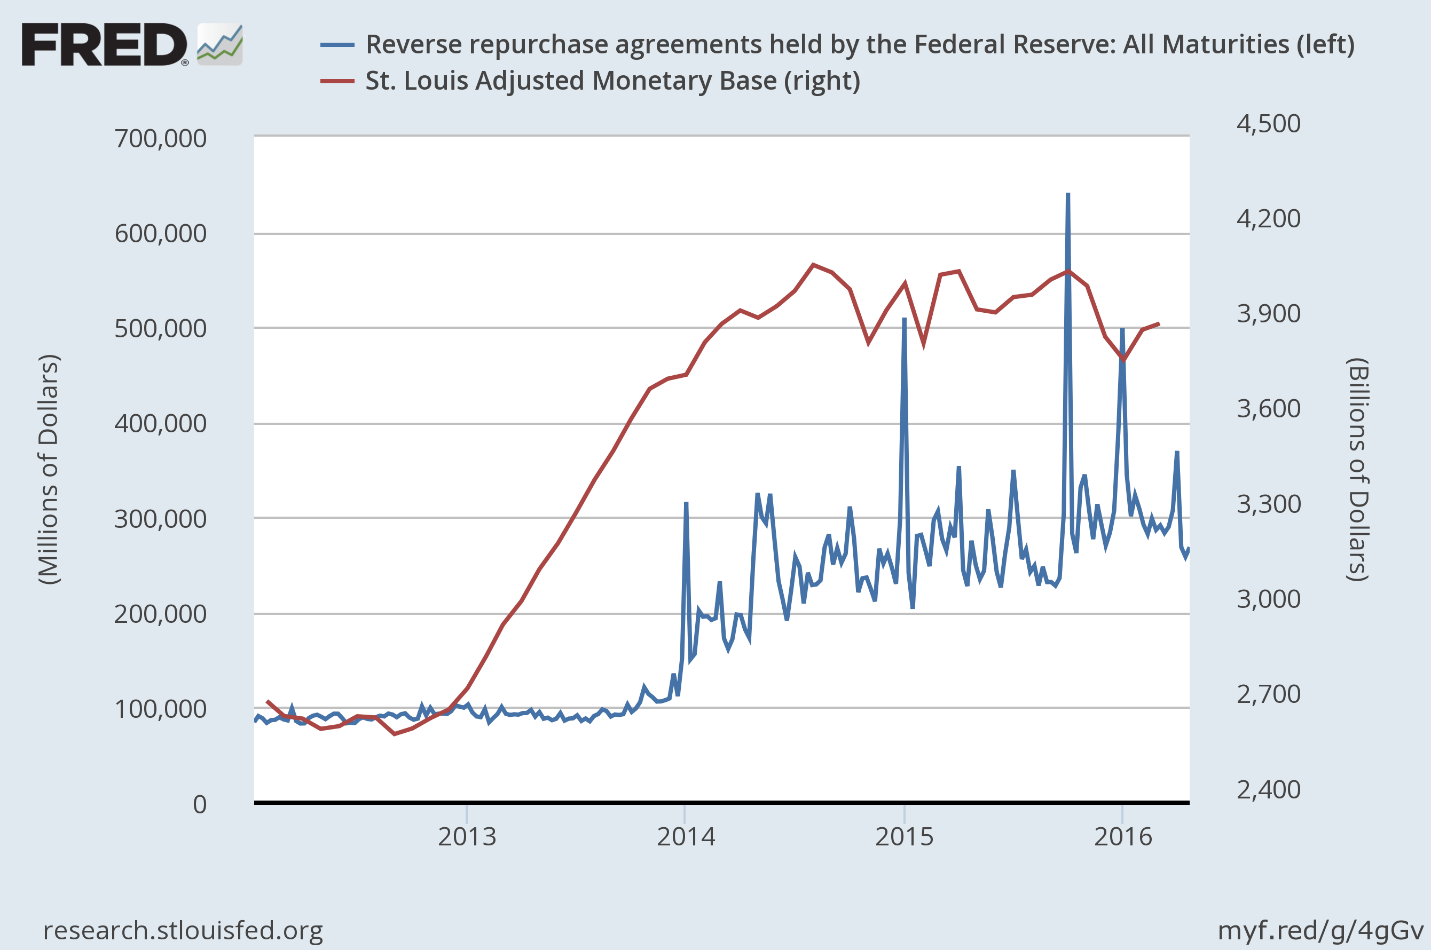
Therefore, in order to drain reserves, thereby reducing the size of the monetary base, the Fed has been lending out its bonds on a temporary basis in exchange for the reserves that the bond purchases created. These transactions are called reverse repurchase agreements. This is how the Fed has been reducing the monetary base, while still holding all of its assets, as can be seen below.
There has been a gradual increase in the volume of repurchase agreements outstanding over the past two years, which has resulted in a gradual decline in the monetary base and excess reserves, as can be seen below.
I am certain that the Fed recognizes the correlation between the rise and fall in excess reserves, and the rise and fall in the stock market. This is why it has been so reluctant to tighten monetary policy further. In lieu of being transparent, it continues to come up with excuses for why it must hold off on further tightening, which have very little to do with the domestic economy. The Fed rightfully fears that a significant market decline will thwart the progress it has made so far in meeting its mandate of full employment and a rate of inflation that approaches 2% (stable prices).
The conundrum the Fed faces is that if the rate of inflation rises above its target of 2%, forcing it to further drain excess bank reserves and increase short-term interest rates, it is likely to significantly deflate the value of financial assets, based on the correlation that I have shown. This will have dire consequences both for consumer spending and sentiment, and for what is already a stall-speed rate of economic growth. Slower rates of economic growth feed into a further deterioration in market fundamentals, which leads to even lower stock prices, and a negative-feedback loop develops. This reminds me of the deflationary spiral that took place during the financial crisis.
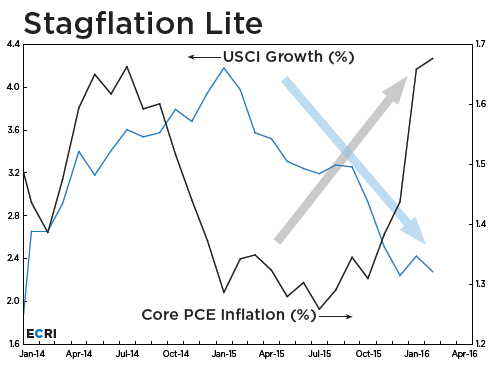
The Fed’s preferred measurement of inflation is the core Personal Consumption Expenditures, or PCE, price index, which excludes food and energy. The latest year-over-year increase of 1.7% is the highest since February 2013, and it is rapidly closing in on the Fed’s 2% target even though the rate of economic growth is moving in the opposite direction, as can be seen below.
The Bubble
If you have been wondering, as I have, why the stock market has been able to thumb its nose at an ongoing recession in corporate profits and revenues that started more than a year ago, I think you will find the answer in $2.4 trillion of excess reserves in the banking system. It is this abundance of liquidity, for which the real economy has no use, that is decoupling the stock market from economic fundamentals. The Fed has distorted the natural pricing mechanism of a free market, and at some point in the future, we will all learn that this distortion has a great cost.
Alan Greenspan once said, “how do we know when irrational exuberance has unduly escalated asset values?” Open your eyes.
What you see in the chart below is a bubble. It is much different than the asset bubbles we experienced in technology stocks and home prices, which is why it has gone largely unnoticed. It is similar from the standpoint that it has been built on exaggerated expectations of future growth. It is a bubble of the Fed’s own making, built on the expectation that an unprecedented increase in the monetary base and excess bank reserves would lead to faster rates of economic growth. It has clearly not. Instead, this mountain of money has either directly, or indirectly, flooded into financial assets, manipulating prices to levels well above what economic fundamentals would otherwise dictate.
The great irony of this bubble is that it is the achievement of the Fed’s objectives, for which the bubble was created, that will ultimately lead it to its bursting. It was an unprecedented amount of credit available at historically low interest rates that fueled the rise in home prices, and it has also been an unprecedented amount of credit at historically low interest rates that has fueled the rise in financial asset prices, including the stock market. How and when this bubble will be pricked remains a question mark, but what is certain is that the current level of excess reserves in the banking system that appear to be supporting financial markets cannot exist in perpetuity.
Is Wall Street Dancing On A Live Volcano?
The S&P 500 closed today exactly where it first crossed in November 2014. In the interim, its been a roller-coaster of rips, dips, spills and thrills.

The thing is, however, this extended period of sideways churning has not materialized under a constant economic backdrop; it does not reflect a mere steady-state of dare-doing at the gaming tables.
Actually, earnings have been falling sharply and macroeconomic headwinds have been intensifying dramatically. So the level of risk in the financial system has been rocketing higher even as the stock averages have labored around the flat-line.
Thus, GAAP earnings of the S&P 500 in November 2014 were $106 per share on an LTM basis compared to $86.44 today. So earnings are down by 18.5%, meaning that the broad market PE multiple has escalated from an already sporty 19.3X back then to an outlandish 23.7X today.

Always and everywhere, such persistent profit collapses have signaled recession just around the corner. And there are plenty of macro-economic data points signaling just that in the remainder of this article (here)
by David Stockman | Contra Corner
Headlines Heading South
 China’s slowdown, cash-strapped emerging markets, the negative interest rate contagion – news from the world economy has been almost uniformly negative for much of the past twelve months. The bright spot amid the gloom has been the relatively upbeat US economy, the strength of which finally convinced the Fed to nudge up interest rates last December. At that time, based on the available data, we concurred that a slow liftoff was the right course of action. But a growing number of macroeconomic reports issued since call that decision into question. From productivity to durable goods orders to real GDP growth, indications are that the pace of recovery is waning. Not enough to raise fears of an imminent recession, but enough to stoke the flames of negative sentiment currently afflicting risk asset markets around the world.
Mary Mary Quite Contrary, How Does Your Economy Grow?
Jobs Friday may be the headline event for macro data nerds, but in our opinion, Productivity Wednesday was the more significant event of the week. The Bureau of Labor Statistics release this past midweek showed that fourth quarter 2015 productivity declined by three percent (annualized) from the previous quarter. Now, productivity can be sporadic from quarter to quarter, but this week’s release is part of a larger trend of lackluster efficiency gains.
As measured by real GDP, an economy can only grow in three ways: population growth, increased labor force participation, or increased output per hour of labor – i.e. productivity. Unfortunately, none of these are trending positive. The chart below offers a snapshot of current labor, productivity and growth trends.
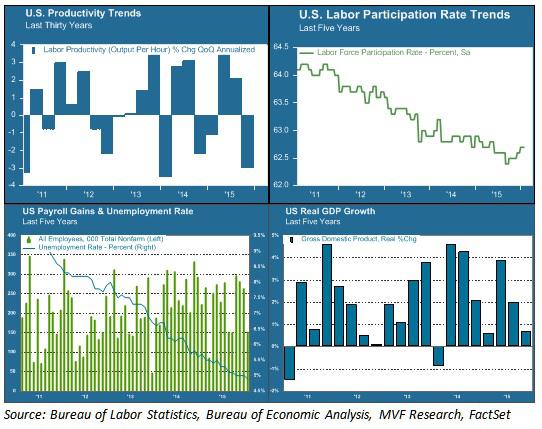
Labor force participation (upper right area of chart) has been in steep decline for the past five years – an outcome of both the jobs lost from the 2007-09 recession and the retirement of baby boomers from the workplace. This decline has helped keep the headline unemployment rate low (blue line in the bottom left chart) and also explains in part the anemic growth in hourly wages over this period. This trend is unlikely to reverse any time soon. If real GDP growth (bottom right chart) is to return to its pre-recession normal trend line, it will have to come from productivity gains. That is why the current trend in productivity (upper left chart) is of such concern.
Of Smartphones and Sewage
The last sustained productivity surge we experienced was in the late 1990s. It is attributed largely to the fruits of the Information Age – the period when the innovations in computing and automation of the previous decades translated into increased efficiencies in the workplace. From 1995 to 2000, quarterly productivity gains averaged 2.6 percent on an annual basis. The pace slackened in the first decade of the current century. In the first five years of this decade – from 2010 to the present – average quarterly productivity growth amounted to just 0.6 percent – more than three times slower than the gains of the late 1990s.
Is that all we can expect from the Smartphone Age? Or are we simply in the middle of an innovation gap – a period in between technological breakthroughs and the translation of those breakthroughs to actual results? It is possible that a new growth age is just around the corner, powered by artificial intelligence, virtual reality and the Internet of Things, among other inventions. It is also possible that the innovations of our day simply don’t pack the same punch as those of other ages. Economist Robert Gordon makes a version of this argument in his recent book, The Rise and Fall of American Growth. Gordon points to the extraordinary period of growth our country experienced from 1870 to 1970 – growth delivered largely thanks to the inventions of electricity and the internal combustion engine – and argues that this was a one-off anomaly that we should not expect to continue indefinitely. What would you rather live without – your Twitter feed and Uber app, or indoor plumbing?
We don’t necessarily agree with Gordon’s conclusion that nothing will ever again rival electricity and motorized transport as an economic growth driver. But we do believe that the growth equation is currently stuck, and the headline data we have seen so far this year do nothing to indicate its becoming unstuck. Long-term growth is not something that drives day-to-day fluctuations in asset prices. But its absence is a problem that is increasingly part of the conversation about where markets go from here. Stay tuned for more Productivity Wednesdays.
The Fed’s Stunning Admission Of What Happens Next
Following an epic stock rout to start the year, one which has wiped out trillions in market capitalization, it has rapidly become a consensus view (even by staunch Fed supporters such as the Nikkei Times) that the Fed committed a gross policy mistake by hiking rates on December 16, so much so that this week none other than former Fed president Kocherlakota openly mocked the Fed’s credibility when he pointed out the near record plunge in forward break evens suggesting the market has called the Fed’s bluff on rising inflation.
All of this happened before JPM cut its Q4 GDP estimate from 1.0% to 0.1% in the quarter in which Yellen hiked.
To be sure, the dramatic reaction and outcome following the Fed’s “error” rate hike was predicted on this website on many occasions, most recently two weeks prior to the rate hike in “This Is What Happened The Last Time The Fed Hiked While The U.S. Was In Recession” when we demonstrated what would happen once the Fed unleashed the “Ghost of 1937.”
As we pointed out in early December, conveniently we have a great historical primer of what happened the last time the Fed hiked at a time when it misread the US economy, which was also at or below stall speed, and the Fed incorrectly assumed it was growing.
We are talking of course, about the infamous RRR-hike of 1936-1937, which took place smack in the middle of the Great Recession.

Here is what happened then, as we described previously in June.
[No episode is more comparable to what is about to happen] than what happened in the US in 1937, smack in the middle of the Great Depression. This is the only time in US history which is analogous to what the Fed will attempt to do, and not only because short rates collapsed to zero between 1929-36 but because the Fed’s balance sheet jumped from 5% to 20% of GDP to offset the Great Depression.
Just like now.
Follows a detailed narrative of precisely what happened from a recent Bridgewater note:
The first tightening in August 1936 did not hurt stock prices or the economy, as is typical.
The tightening of monetary policy was intensified by currency devaluations by France and Switzerland, which chose not to move in lock-step with the US tightening. The demand for dollars increased. By late 1936, the President and other policy makers became increasingly concerned by gold inflows (which allowed faster money and credit growth).
The economy remained strong going into early 1937. The stock market was still rising, industrial production remained strong, and inflation had ticked up to around 5%. The second tightening came in March of 1937 and the third one came in May. While neither the Fed nor the Treasury anticipated that the increase in required reserves combined with the sterilization program would push rates higher, the tighter money and reduced liquidity led to a sell-off in bonds, a rise in the short rate, and a sell-off in stocks. Following the second increase in reserves in March 1937, both the short-term rate and the bond yield spiked.
Stocks also fell that month nearly 10%. They bottomed a year later, in March of 1938, declining more than 50%!
Or, as Bank of America summarizes it: “The Fed exit strategy completely failed as the money supply immediately contracted; Fed tightening in H1’37 was followed in H2’37 by a severe recession and a 49% collapse in the Dow Jones.”
* * *
As it turns out, however, the Fed did not even have to read this blog, or Bank of America, or even Bridgewater, to know the result of its rate hike. All it had to do was to read… the Fed.
But first, as J Pierpont Morgan reminds us, it was Charles Kindleberger’s “The World in Depression” which summarized succinctly just how 2015/2016 is a carbon copy of the 1936/1937 period. In explaining how and why both the markets and the economy imploded so spectacularly after the Fed’s decision to tighten in 1936, Kindleberger says:
“For a considerable time there was no understanding of what had happened. Then it became clear. The spurt in activity from October 1936 had been dominated by inventory accumulation. This was especially the case in automobiles, where, because of fears of strikes, supplies of new cars had been built up. It was the same in steel and textiles – two other industries with strong CIO unions.”
If all off this sounds oddly familiar, here’s the reason why: as we showed just last week, while inventories remain at record levels, wholesale sales are crashing, and the result is that the nominal spread between inventories and sales is all time high.

The inventory liquidation cycle was previewed all the way back in June in “The Coming US Recession Charted” long before it became “conventional wisdom.”
Kindleberger continues:
When it became evident after the spring of of 1937 that commodity prices were not going to continue upward, the basis for the inventory accumulation was undermined, and first in textiles, then in steel, the reverse process took place.
Oil anyone?
And then this: “The steepest economic descent in the history of the United States, which lost half the ground gained for many indexes since 1932, proved that the economic recovery in the United States had been built on an illusion.“
Which, of course, is what we have been saying since day 1, and which even such finance legends as Bill Gross now openly admit when they say that the zero-percent interest rates and quantitative easing created leverage that fueled a wealth effect and propped up markets in a way that now seems unsustainable, adding that “the wealth effect is created by leverage based on QE’s and 0% rates.“
And not just Bill Gross. The Fed itself.
Yes, it was the Fed itself who, in its Federal Reserve Bulletin from June 1938 as transcribed in the 8th Annual General Meeting of the Bank of International Settlements, uttered the following prophetic words:
The events of 1929 taught us that the absence of any rise in prices did not prove that no crisis was pending. 1937 has taught us that an abundant supply of gold and a cheap money policy do not prevent prices from falling.
If only the Fed had listened to, well, the Fed.
What happened next? The chart below shows the stock market reaction in 1937 to the Fed’s attempt to tighten smack in the middle pf the Great Depression.

If the Fed was right, the far more prophetic 1937 Fed that is not the current wealth effect-pandering iteration, then the market is about to see half its value wiped out.

Fear porn or another opportunity to BTFD? Source: ZeroHedge
The Stock Market Decline Is Gaining Momentum
Summary:
- The current stock market decline began with transportation stocks and small capitalization stocks severely under-performing the market.
- Weakness then spread to the energy complex and high-yield bonds.
- Yield focused stocks were the next to fall, with Kinder Morgan being the most prominent example.
- Stalwarts like Apple and Gilead lost their momentum with the August 2015 decline and never regained their mojo.
- In 2016, a slow motion crash is occurring in the stock market, and the price action has finally impacted the leading FANG stocks.
“Hysteria is impossible without an audience. Panicking by yourself is the same as laughing alone in an empty room. You feel really silly.” – Chuck Palahniuk
“Life is ten percent what you experience and ninety percent how you respond to it.” – Dorothy M. Neddermeyer
Introduction:
The stock market decline has gained momentum in 2016, and much like a runaway train, the current decline will be hard to stop, until the persistent overvaluations plaguing the stock market over this current bull market are corrected.
The correction that has caused the average stock in the United States to correct over 25%, thus far, started as an innocuous move down in global equities, outside of the depression enveloping the downtrodden emerging markets and commodities stocks, and then spread from transportation stocks to market leaders like biotechnology companies. The first wave down culminated in a gut-wrenching August 2015 sell-off that saw the Dow Jones Industrial Average (NYSEARCA:DIA) fall 1000 points at the open on August 24th, 2015. The panic was quickly brushed aside, but not forgotten, as market leading stocks made new highs in the fall of 2015.
That optimism, has given way to the reality that global quantitative easing has not provided the boost that its biggest supporters claimed. Now, everything is falling in tandem, and there is not much hope with the Fed nearly out of bullets, other than perhaps lower energy prices, to spark a true recovery.
The financial markets have taken notice, and are repricing assets accordingly. Just like forays to the upside are not one way affairs, the move down will not be a one-way adjustment, and investors should be prepared for sharp counter-trend rallies, and the price action yesterday, Thursday, January 14th, 2016 is a perfect example. To close, with leading stocks now suffering sizable declines that suggest institutional liquidation, investors should have their respective defensive teams on the field, and be looking for opportunistic, out-of-favor investments that have already been discounted.
Thesis:
The market correction is gaining steam and will not be completed until leading stocks and market capitalization indexes correct materially.
Small-Caps & Transports Led The Downturn:
While U.S. stocks have outperformed international markets since 2011, 2014 and 2015 saw the development of material divergences. Specifically, smaller capitalization stocks, measured by the Russell 2000 Index, and represented by the iShares Russell 2000 ETF (NYSEARCA:IWM), began under performing in 2014. Importantly, small-caps went on to make a new high in 2015, but their negative divergence all the way back in 2014, planted the seeds for the current decline, as illustrated in the chart below.
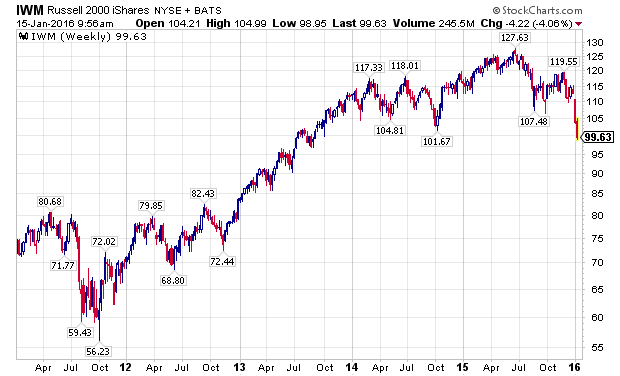
Building on the negative divergences, transportation stocks began severely under performing the broader markets in 2015. To illustrate this, I have used the charts of two leading transportation stocks, American Airlines (NASDAQ:AAL) and Union Pacific Corporation (NYSE:UNP), which are depicted below. For the record, I have taken a fundamental interest in both companies as I believe they are leading operators in their industries.
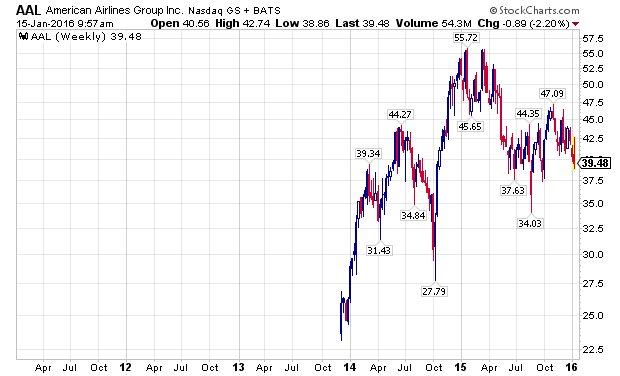
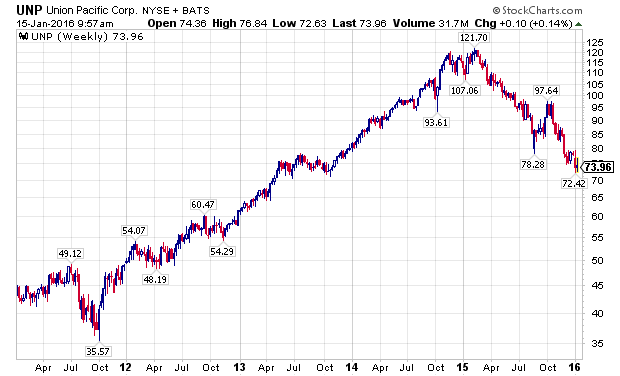
The Next Dominoes – Oil Prices & High Yield Bonds:
Oil prices, as measured by the United States Oil Fund (NYSEARCA:USO) in the chart below, were actually one of the first shoes to drop, even prior to small-cap stocks, starting a sizable move down in June of 2014.
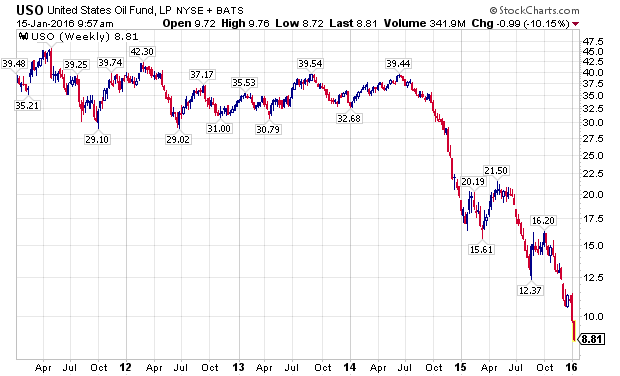
Industry stalwart Chevron Corporation (NYSE:CVX) peaked in July of 2014, and despite tremendous volatility since then, has been in a confirmed downtrend.
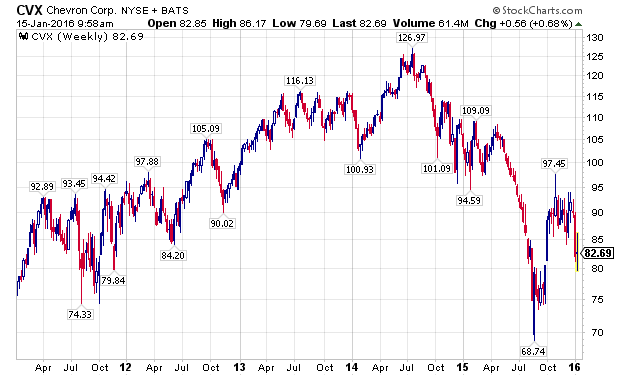
As the energy complex fell apart with declining oil prices, high-yield bonds, as measured by the iShares iBoxx High Yield Corporate Bond Fund (NYSEARCA:HYG), and by the SPDR Barclays High Yield Bond ETF (NYSEARCA:JNK), made material new lows.
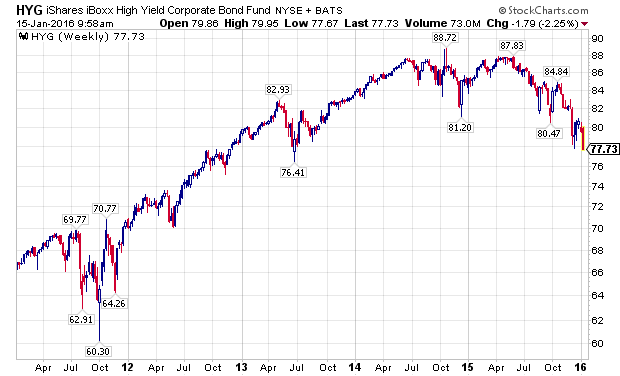

Yield Focused Stocks Take It On The Chin
As the energy downturn intensified, many companies that had focused on providing attractive yields, to their yield starved investors, saw their business models questioned at best, and implode at worst. The most prominent example was shares of Kinder Morgan (NYSE:KMI).
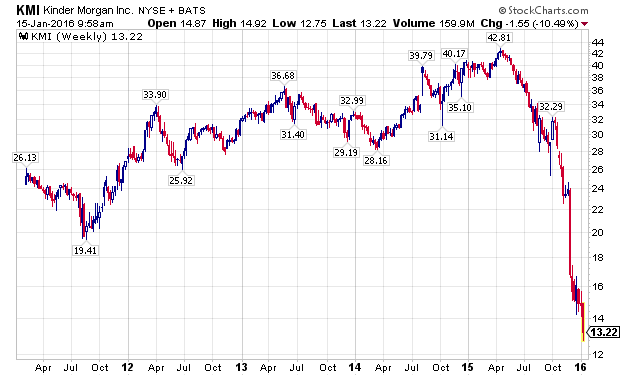
The fallout did not stop with KMI, as many MLP s and other yield oriented stocks continue to see declines as 2015 has rolled into 2016. Williams Companies (NYSE:WMB) has been especially hard hit, showing extreme volatility over the past several weeks.

Leading GARP Stocks Never Recovered:
Even though I have been bearish on the markets for some time, I was not sure if the markets would melt-up or meltdown in December of 2015, as I articulated in a Seeking Alpha article at the time.
In hindsight, the under performance of growth-at-a-reasonable-price stocks, like Apple (NASDAQ:AAPL) and Gilead Sciences (NASDAQ:GILD), which had struggled ever since the August 2015 sell-off, should have been an ominous sign.
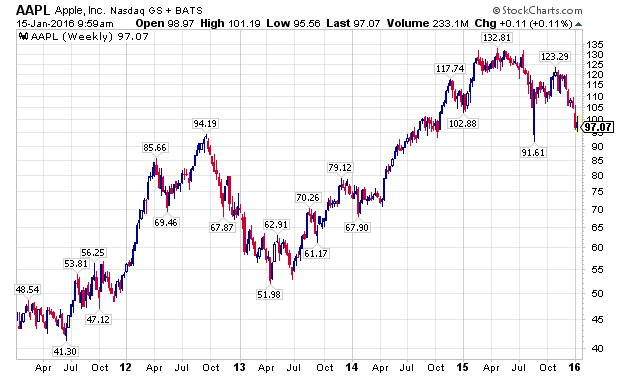

FANG Stocks, The Last Shoe To Drop:
Even as many divergences developed in the financial markets over the last year, many leading stocks made substantial new highs in the fall of 2015, led by the FANG stocks. Facebook (NASDAQ:FB), Amazon (NASDAQ:AMZN), Netflix (NASDAQ:NFLX), and Alphabet (NASDAQ:GOOG) (NASDAQ:GOOGL), along with NASDAQ stalwarts Microsoft (NASDAQ:MSFT) and Starbucks (NASDAQ:SBUX), attracted global capital as growth became an increasingly scarce commodity. The last two weeks have challenged the assumption that these companies are a safe-haven, immune from declines impacting the rest of the stock market, as the following charts show.
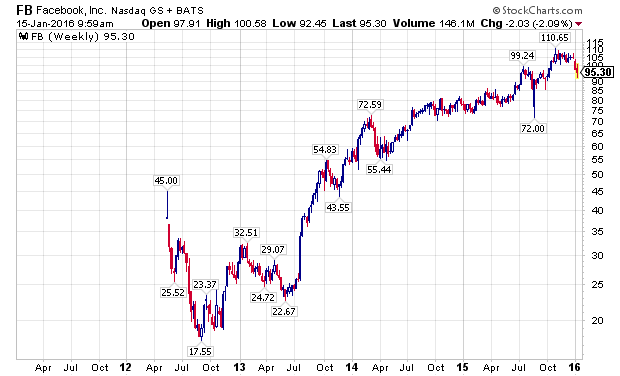

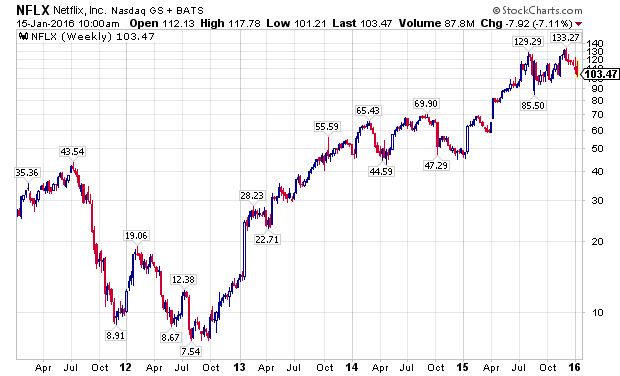
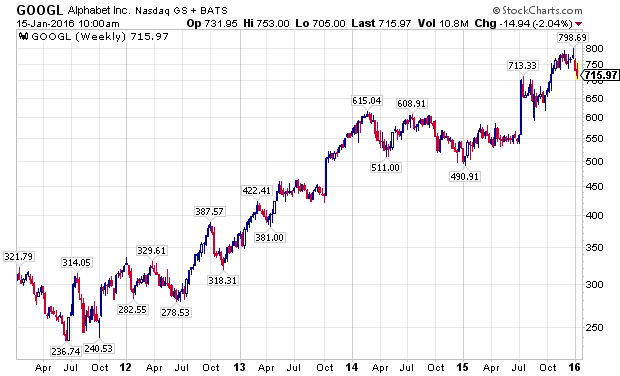
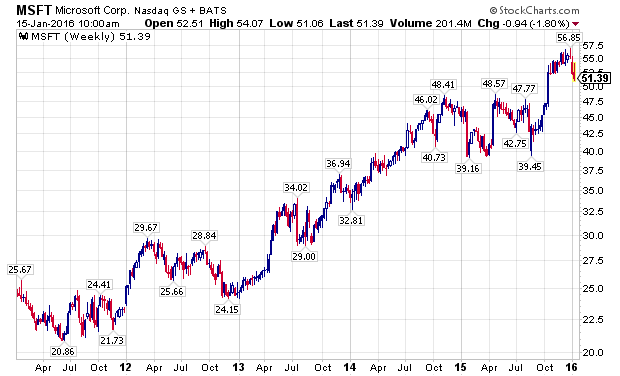
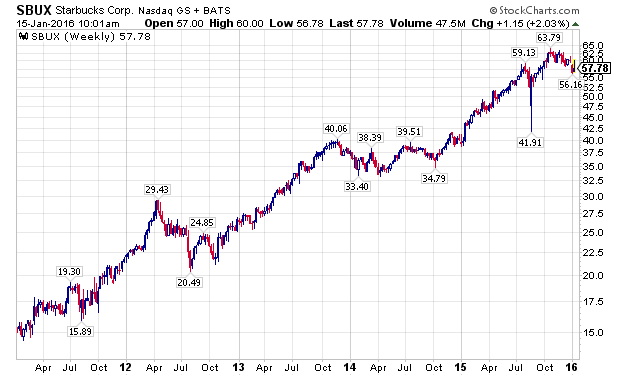
The PowerShares QQQ ETF (NASDAQ:QQQ), which is designed to track the performance of the NASDAQ 100 Index, and counts five of the world’s ten largest market capitalization companies among its largest holdings, Apple, Alphabet, Microsoft, Amazon, and Facebook, has outperformed the S&P 500 Index, as measured by the SPDRs S&P 500 ETF (NYSEARCA:SPY), for a majority of the current bull market, with a notable exception being the last week of 2015, and the first two weeks of 2016. Wholesale, sustained selling is now starting to grip the markets.


Conclusion – The Market Downturn Is Gaining Momentum:
The developing market correction is gaining momentum. Like an avalanche coming down a mountain, it is impacting everything it touches, and no sectors or companies, even the previously exalted FANG stocks, are immune from its reaches. Investors should have their respective defensive teams on the field, while looking for opportunities in undervalued, out-of-favor assets, as many stocks have been in their own bear markets for years.
by William Koldus in Seeking Alpha
Why The Junk Bond Selloff Is Getting Scary
High-yield bonds have led previous big reversals in S&P 500

The junk bond market is looking more and more like the boogeyman for stock market investors.
The iShares iBoxx $ High Yield Corporate Bond exchange-traded fund HYG, -2.34% tumbled 2.4% in midday trade Friday, putting the ETF (HYG) on course for the lowest close since July 2009. Volume as of 12 p.m. Eastern was already more than double the full-day average, according to FactSet.
While weakness in the junk bonds — bonds with credit ratings below investment grade — is nothing new, fears of meltdown have increased after high-yield mutual fund Third Avenue Focused Credit Fund TFCIX, -2.86% TFCVX, -2.70% on Thursday blocked investors from withdrawing their money amid a flood of redemption requests and reduced liquidity.
This chart shows why stock market investors should care:
 FactSet
When junk bonds and stocks disagree, junks bonds tend to be right.
The MainStay High Yield Corporate Bond Fund MHCAX, -0.19% was used in the chart instead of the HYG, because HYG started trading in April 2007.
When investors start scaling back, and market liquidity starts to dry up, the riskiest investments tend to get hurt first. And when money starts flowing again, and investors start feeling safe, bottom-pickers tend to look at the hardest hit sectors first.
So it’s no coincidence that when the junk bond market and the stock market diverged, it was the junk bond market that proved prescient. Read more about the junk bond market’s message for stocks.
There’s still no reason to believe the run on the junk bond market is nearing an end.
As Jason Goepfert, president of Sundial Capital Research, points out, he hasn’t seen any sign of panic selling in the HYG, which has been associated with previous short-term bottoms. “Looking at one-month and three-month lows [in the HYG] over the past six years, almost all of them saw more extreme sentiment than we’re seeing now,” Goepfert wrote in a note to clients.
by Tomi Gilmore in MarketWatch
Icahn Warns “Meltdown In High Yield Is Just Beginning”
 by Tyler Durden
Amid the biggest weekly collapse in high-yield bonds since March 2009, Carl Icahn gently reminds investors that he saw this coming… and that it’s only just getting started!
As we warned here, and confirmed here, something has blown-up in high-yield…

With the biggest discount to NAV since 2011…

The carnage is across the entire credit complex… with yields on ‘triple hooks’ back to 2009 levels…

As fund outflows explode..

And here’s why equity investors simply can’t ignore it anymore…


If all of that wasn’t bad enough… the week is apocalyptic…

Icahn says, it’s only just getting started…
If you haven’t seen ‘Danger Ahead’ watch it on https://t.co/4rVAcLBsH9. Unfortunately I believe the meltdown in High Yield is just beginning
— Carl Icahn (@Carl_C_Icahn) December 11, 2015
As we detailed previously, to be sure, no one ever accused Carl Icahn of being shy and earlier this year he had a very candid sitdown with Larry Fink at whom Icahn leveled quite a bit of sharp (if good natured) criticism related to BlackRock’s role in creating the conditions that could end up conspiring to cause a meltdown in illiquid corporate credit markets. Still, talking one’s book speaking one’s mind is one thing, while making a video that might as well be called “The Sky Is Falling” is another and amusingly that is precisely what Carl Icahn has done.
Over the course of 15 minutes, Icahn lays out his concerns about many of the issues we’ve been warning about for years and while none of what he says will come as a surprise (especially to those who frequent these pages), the video, called “Danger Ahead”, is probably worth your time as it does a fairly good job of summarizing how the various risk factors work to reinforce one another on the way to setting the stage for a meltdown. Here’s a list of Icahn’s concerns:
- Low rates and asset bubbles: Fed policy in the wake of the dot com collapse helped fuel the housing bubble and given what we know about how monetary policy is affecting the financial cycle (i.e. creating larger and larger booms and busts) we might fairly say that the Fed has become the bubble blower extraordinaire. See the price tag attached to Picasso’s Women of Algiers (Version O) for proof of this.
- Herding behavior: The quest for yield is pushing investors into risk in a frantic hunt for yield in an environment where risk free assets yield at best an inflation adjusted zero and at worst have a negative carrying cost.
- Financial engineering: Icahn is supposedly concerned about the myopia displayed by corporate management teams who are of course issuing massive amounts of debt to fund EPS-inflating buybacks as well as M&A. We have of course been warning about debt fueled buybacks all year and make no mistake, there’s something a bit ironic about Carl Icahn criticizing companies for short-term thinking and buybacks as he hasn’t exactly been quiet about his opinion with regard to Apple’s buyback program (he does add that healthy companies with lots of cash should repurchases shares).
- Fake earnings: Companies are being deceptive about their bottom lines.
- Ineffective leadership: Congress has demonstrated a remarkable inability to do what it was elected to do (i.e. legislate). To fix this we need someone in The White House who can help break intractable legislative stalemates.
- Corporate taxes are too high: Inversions are costing the US jobs.
Ultimately what Icahn has done is put the pieces together for anyone who might have been struggling to understand how it all fits together and how the multiple dynamics at play serve to feed off one another to pyramid risk on top of risk. Put differently: one more very “serious” person is now shouting about any and all of the things Zero Hedge readers have been keenly aware of for years.
* * *
Finally, here is Bill Gross also chiming in:
Gross: HY Fund closes exit doors. Who will get in if you can’t get out? Risk off.
— Janus Capital (@JanusCapital) December 11, 2015
As Shanghai Stock Market Tanks, China Makes Mass Arrests: ‘You Could Disappear at any Time’

The Shanghai stock exchange, which has been creating global stock market convulsions while trimming 39 percent off its value since June, will be closed for the next two days. The Chinese holiday started on Thursday in Beijing with a big parade and show of military might to commemorate the 70th anniversary of V-Day and the defeat of Japan in World War II.
The massive military pageantry and display of weaponry was widely seen as a move by President Xi Jinping to reassert his authoritarian rule in the wake of a sputtering domestic economy, $5 trillion in value shaved off the stock market in a matter of months, and the need to devalue the country’s currency on August 11 in a bid to boost exports.
Tragically, what has received far less attention than melting China stocks is the mass arrests of dissidents, human rights activists, attorneys and religious leaders. More recently, the government has begun to “detain” journalists and finance executives in an apparent attempt to scapegoat them for the stock market’s selloff.

The mass arrests began in July, the same time the China stock market started to crater in earnest. Last evening, the Financial Times had this to say about the disappearance of Li Yifei, a prominent hedge fund chief at Man Group China.
“The whereabouts of Ms Li remained unclear on Wednesday. Her husband, Wang Chaoyong, told the Financial Times that her meetings with financial market authorities in Beijing had concluded, and ‘she will take a break for a while.’ ”
Bloomberg Business had previously reported that Li Yifei was being held by the police as part of a larger roundup of persons they wanted to interview regarding the stock market rout.
The reaction to these authoritarian sweeps has worsened the stock market situation in China. Volume on the Shanghai market, according to the Financial Times, has skidded from $200 billion on the heaviest days in June to just $66 billion this past Tuesday.
On Tuesday afternoon, a Wall Street Journal reporter was interviewed by phone from Beijing on the business channel, CNBC. He said “waves” of arrests were taking place. That interview followed an article in the Wall Street Journal on Monday, which appeared with no byline (perhaps for the safety of the Beijing-based reporter) that shed more light on the arrests:
“Chinese police on the weekend began rounding up the usual suspects, which in this case are journalists, brokers and analysts who have been reporting stock-market news. Naturally, the culprits soon confessed their non-crimes on national television. A reporter for the financial publication Caijing was shown on China Central Television on Monday admitting that he had written an article with ‘great negative impact on the market.’ His offense was reporting that authorities might scale back official share-buying, which is what they soon did. On Sunday China’s Ministry of Public Security announced the arrest of nearly 200 people for spreading rumors about stocks and other incidents.”
Also on Tuesday, David Saperstein, the U.S. Ambassador-at-large for religious freedom, publicly demanded that China release attorney Zhang Kai and religious leaders who had been swept up by the government the very day before Saperstein had been scheduled to meet with them. In an interview with the Associated Press, Saperstein called the state actions “outrageous,” particularly since he had been invited to China to observe religious freedom in the country.
Christianity is growing rapidly in some regions of China and strong religious leaders or movements are seen as a threat to communist party rule. Religious leaders had been protesting the state’s removal of crosses from the tops of churches.

On July 22, the New York Times reported that over 200 human rights lawyers and their associates had been detained. Using the same humiliating tactic as used recently against the financial journalist, The Times reports that some of the “lawyers have been paraded on television making humiliating confessions or portrayed as rabble-rousing thugs.” One of the lawyers who was later released, Zhang Lei, told The Times: “This feels like the biggest attack we’ve ever experienced. It looks like they’re acting by the law, but hardly any of the lawyers who disappeared have been allowed to see their own lawyers. Over 200 brought in for questioning and warnings — I’ve never seen anything like it before.”
U.S. Ambassador to the United Nations, Samantha Power, is also demanding the release of female prisoners in China, including Wang Yu, who was arrested with her husband in July.
According to a detailed interview that Wang Yu gave the Guardian prior to her detention and disappearance on July 9, people are being arrested, grabbed off the street, sent to mental hospitals or detention centers. She said: ‘You could disappear at any time.’
As a documentary made by the Guardian shows, one of Wang Yu’s cases involved the alleged rape of six underage girls by the headmaster of their school. Wang Yu took the case and organized a protest, handing out literature on child protection laws to pedestrians and people passing by in automobiles.
Parents of the young girls who had originally consented to their legal representation soon withdrew the consent, saying they were being monitored by the government and had been told not to speak to journalists or lawyers. Wang Yu said that cases like this are happening every minute and everywhere in China.
Yesterday, the Mail & Guardian reported that Wang Yu’s whereabouts remain a mystery.
On August 18, Reuters reported that Chinese government officials “had arrested about 15,000 people for crimes that ‘jeopardized Internet security,’ as the government moves to tighten controls on the Internet.”

Against this horrific backdrop, China’s authoritarian President Xi Jinping is slated to visit the United States late this month for a meeting with President Obama and state dinner at the White House. According to the Washington Post’s David Nakamura, a bipartisan group of 10 senators sent President Obama a letter in August calling on him to raise the issue of human rights abuses when Xi visits. The Post published the following excerpt from the letter:
“We expect that China’s recent actions in the East and South China Seas, economic and trade issues, climate change, as well as the recent cyber-attacks, will figure prominently in your discussions. While these issues deserve a full and robust exchange of views, so too do human rights. Under President Xi, there has been an extraordinary assault on rule of law and civil society in China.”

Given the delicacy with which President Obama is likely to broach this subject with Xi, a mass demonstration outside of the White House by human rights activists and lawyers in this country during the White House visit might send a more powerful message. Last year, U.S. consumers and businesses purchased $466.8 billion in goods from China. Should these human rights abuses continue, China should be made aware that consumers in the U.S. know how to check labels for country of origin.
By Pam Martens and Russ Martens, featured in Wall Street On Parade
Why Insider Trading Should Be Legal
 TIVOLI, New York — It’s hot here in the Hudson River Valley.
People are taking it easy, sitting on benches in the shade. We had to put in a window air conditioner to take some of the heat out. Still, we sweat … and we wait for the cool of the evening.
The markets are lackluster, too. A little up, a little down. Languid. Summertime slow.
Counterfeit information
We have been focusing on technology — sometimes directly, often obliquely.
It is the subject of our next monthly issue of The Bill Bonner Letter, requiring us to do some homework with the help of our resident tech expert, Jeff Brown.
But today, let’s look at how the stock market reacts to new technology.
Investors are supposed to look ahead. They are expected to dole out the future earnings of technology stocks and figure out their present value.
Not that they know immediately and to the penny what Twitter or Tesla should be worth, but markets are always discovering prices, based on public information flowing to investors.
The problem is the feds have distorted, twisted, and outright counterfeited this information. They falsified it for the benefit of the people it’s supposed to be protecting us against: the insiders.
The entire edifice of federal regulation and policing is a scam — at least when it comes to the stock market.
First the feds claimed to be creating a “level playing field” by prohibiting “insider trading.”
If you had privileged information — say, as the accountant for a Fortune 500 company, or the lawyer for an upcoming merger — you were supposed to play dead.
“Front-running” — buying or selling in advance of the public release of information — is against the law. And in 1934, Congress set up a special bureaucracy, the Securities Exchange Commission — to enforce it.
Tilting the playing field
But the SEC never leveled the playing field. Instead, it tilted it even more in the insiders’ favor.
Those who knew something were not supposed to take advantage of it, so this information became even more valuable.
That is why so many investors turned to “private equity.” Insiders at private companies — held close to the vest by the investment firms that owned them — could trade on all the inside information they wanted.
The law prohibits insiders from manipulating a publicly traded stock for their benefit.
But there’s an odd exemption for the people who control a public company. General Motors announces a share buyback plan, for example. It will spend $5 billion to buy back its shares in the open market and then cancel them. This raises the earnings per share of the outstanding shares, making them more valuable as a result.
Why would an automaker — recently back from the dead, thanks to a handout from the feds — take its precious capital and give it to management (in the form of more valuable stock options) and shareholders (in the form of higher stock prices)?
There you have your answer: GE execs and their insider shareholders (mostly hedge funds) joined forces to manipulate the stock upward and give themselves a big payday.
Reports the Harvard Business Review:

‘A little coup de whiskey’
Here at the Diary, we disagree …
The feds should not ban share buybacks. Instead, insider trading should be legal for everyone.
And the feds shouldn’t bail out the insiders, either. The government bailed out GM to the tune of $50 billion in return for a 61% equity stake in the company.

But at the end of 2013, Washington was able to sell off the last of its GM shares … for “just” an $11 billion loss.
How?
The Fed fiddled with stock market prices … by pushing down the so-called “risk-free” rate on bonds. A lower rate means less opportunity cost for stock market investors.
Just look at the valuations of today’s tech companies. They’re over the top, much like they were at the peak of the dot-com bubble in 2000. They are driven to extraordinary levels not by a prudent calculation of anticipated earnings but by the Fed’s EZ money regime.
This conclusion, by the way, was buttressed by our look at the automakers of 100 years ago.
Now, there was a game-changing industry!
It was so promising and so crowded with new entrants that you could barely walk down Shelby Street in Detroit without getting run over by an automobile you’d never heard of.
Most of those companies went broke within a few years. A few, however, prospered.
GM’s share price barely budged between 1915 and 1925 — when the company was one of the greatest success stories of the greatest new tech industry the world had ever seen.
But then, in 1927, the influential New York Fed President Benjamin Strong gave the market “a little coup de whiskey.”
The Fed not only bought $445 million of government bonds, resulting in the biggest increase in bank reserves the US had ever seen, but it also cut its key lending rate from 4% to 3.5%.
After that, it was off to the races! GM shares rose 2,200%.
In other words, the prices of “tech” stocks were manipulated then, as now, by the feds.
Cheap credit — not an honest calculation of anticipated earnings — is what sent GM soaring in the late 1920s.
And it is why our billion-dollar tech babies are flying so high today.
Welcome To The Revenue Recession

The “Revenue Recession” is alive and well, at least when it comes to the 30 companies of the Dow Jones Industrial Average.
Every month we look at what brokerage analysts have in their financial models in terms of expected sales growth for the Dow constituents. This year hasn’t been pretty, with Q1 down an average of 0.8% from last year and Q2 to be down 3.5% (WMT and HD still need to report to finish out the quarter). The hits keep coming in Q3, down an expected 4.0% (1.4% less energy) and Q4 down 1.8% (flat less energy).
The good news is that if markets discount 2 quarters ahead, we should be through the rough patch because Q1 2015 analyst numbers call for 1.9% sales growth, with or without the energy names of the Dow. The bad news is that analysts tend to be too optimistic: back in Q3 last year they thought Q2 2015 would be +2%, and that didn’t work out too well.
Overall, the lack of revenue growth combined with full equity valuations (unless you think +17x is cheap) is all you need to know about the current market churn. And why it will likely continue.
The most successful guy I’ve ever worked for – and he has the billions to prove it – had the simplest mantra: “Don’t make things harder than they have to be”. In the spirit of that sentiment, consider a simple question: which Dow stocks have done the best and worst this year, and why? Here’s the answer:
The three best performing names are UnitedHealth (+19.3%), Visa (+18.2%) and Disney (14.2%).
The worst three names are Dupont (-28.3%), Chevron (-23.5%) and Wal-Mart (-16.0%).
Now, consider the old market aphorism that “Markets discount two quarters ahead” (remember, we’re keeping this simple). What are analysts expecting for revenue growth in Q3 and Q4 that might have encouraged investors to reprice these stocks higher in the first 7 months of the year?
For the three best performing stocks, analysts expect second half revenues to climb an average of 14.1% versus last year.And for the worst three? How about -22.1%. Don’t make things harder than they have to be.

That, in a nutshell, is why we look at the expected revenue growth for the 30 companies of the Dow every month. Even though earnings and interest rates ultimately drive asset prices, revenues are the headwaters of the cash flow stream. They also have the benefit of being easier for an analyst to quality control than earnings. Not easy, mind you – just easier. Units, price and mix are the only three drivers of revenues you have to worry about. When those increase profitably the rest of the income statement – including the bottom line – tends to take care of itself.
By both performance and revenue growth measures, 2015 has been tough on the Dow. It is the only one of the three major U.S. “Indexes” to be down on the year, with a 2.3% decline versus +1.2% for the S&P 500 and +6.3% for the NASDAQ. Ten names out of the 30 are lower by 10% or more, or a full 33%. By comparison, we count 107 stocks in the S&P 500 that are lower by 10% or greater, or only 21% of that index.
Looking at the average revenue growth for the Dow names tells a large part of the story, for the last time the Average enjoyed positive top line momentum was Q3 2014 and the next time brokerage analysts expect actual growth isn’t until Q1 2016. The two largest problems are well understood: declining oil and other commodity prices along with an increase in the value of the dollar. For a brief period there was some hope that declining energy company revenues would migrate to other companies’ top lines as consumers spent their energy savings elsewhere. That, of course, didn’t quite work out.
Still, we are at the crosswords of what could be a turn back to positive growth in 2016. Here’s how Street analysts currently expect that to play out:
At the moment, Wall Street analysts that cover the companies of the Dow expect Q3 2015 to be the trough quarter for revenue growth for the year. On average, they expect the typical Dow name to print a 4.0% decline in revenues versus last year. Exclude financials, and the comp gets a little worse: 4.4%. Take out the 2 energy names, and the expected comp is still negative to the tune of 1.5%.
Things get a little better in Q4, presumably because we start to anniversary the declines in oil prices as well as the strength of the dollar. These both began to kick in during Q4 2014, and as the old Wall Street adage goes “Don’t sweat a bad quarter – it just makes next year’s comp that much easier”. That’s why analysts are looking for an average of -1.8% revenue comps for Q4, and essentially flat (-0.01%) when you take out the Dow’s energy names.
Go all the way out to Q1 2016, and analysts expect revenue growth to finally turn positive: 1.9% versus Q1 2015, whether you’re talking about the whole Average or excluding the energy names. Better still, analysts are showing expected revenue growth for all of 2016 at 4.1%. OK, that’s probably overly optimistic unless the dollar weakens next year. But after 2015, even 1-3% growth would be welcome.

We’re still keeping it simple, so let’s wrap up. What ails the Dow names also hamstrings the U.S. equity market as whole. We need better revenue growth than the negative comps we’ve talked about here or the flattish top line progressions of the S&P 500 to get stocks moving again. The third quarter seems unlikely to provide much relief. On a more optimistic note, our chances improve in Q4 and even more so in Q1 2016. Until we see the U.S. economy accelerate and/or the dollar weaken and/or oil prices stabilize, the chance that investors will pay even higher multiples for stagnant earnings appears remote. That’s a recipe for more volatility – potentially a lot more.
Via Zero Hedge … Via ConvergEx’s Nick Colas
Why Were So Many Chinese Company Stocks Suspended? – Bank loans against stocks

At least 1,331 companies have halted trading on China’s mainland exchanges, freezing $2.6 trillion of shares, or about 40 percent of the country’s market value, Bloomberg News reports today.
The Shanghai Composite Index has fallen 5.9 percent on Wednesday, July 8th, 2015. It was about 32 percent below the peak of 5,166 it reached on June 12. The unwinding of margin loans is adding fuel to the fire. Individual investors, we all know by now, have used generous margin financing terms to enter the stock market and then build up their portfolios. Less known is that Chinese companies have been doing the exact same thing by using their own corporate stock to secure loans from banks.
This means that they stood to lose a lot when those share prices start trending dramatically lower.
Says Nick Lawson at Deutsche Bank: “Stocks are being suspended by the companies themselves because many have bank loans backed by shares which the banks themselves may want to liquidate, joining the queues of margin sellers.”
Nomura analysts add that: “Some bank loans have been extended with shares of listed companies put up as collateral.”
Numbers here are sketchy, but the team at Nomura estimate that the total amount of such loans may be 500-600 billion yuan ($80 billion – $96 billion), which sounds like a lot but is equivalent to about 1 percent of total loans to Chinese enterprises.
Still, the dynamic now at play is reminiscent of the troubles encountered by U.S. energy firms thanks to the plunging price of oil. Many shale explorers have bank loans tied to the value of their oil and gas reserves. When the price of oil began sinking last year, those credit lines were generally reassessed at a lower value, limiting the amount of credit available to the energy companies and creating further pressure for firms that were already dealing with the fallout from dramatically lower crude prices.
The easiest way to stop a painful cycle of lower share prices leading to curbed corporate credit, further troubles for Chinese companies and then ever-increasing share price pressures is to halt stock trading altogether.
Speaking of which, the latest move from Chinese regulators announced on Wednesday bans corporate executives from selling stock for six months.

Source: Bloomberg
This vicious circle described above also explains why China’s central bank has quickly moved to support the market in an effort to limit its impact on the wider economy.
Why US Stock And Bond Markets Are High
We’ve been saying for quite some time now that the US equity market’s seemingly inexorable (until this week) tendency to rise to new highs in the absence of the Fed’s guiding hand is almost certainly in large part attributable to the fact that in a world where you are literally guaranteed to lose money if you invest in safe haven assets such as negative-yielding German bunds, corporations can and will take advantage of the situation by issuing debt and using the proceeds to buy back stock, thus underwriting the rally in US equities. Here’s what we said after stocks turned in their best month in three years in February:
It also explains why, in the absence of the Fed, stocks continue to rise as if QE was still taking place: simply said, bondholders – starved for any yield in an increasingly NIRP world – have taken the place of the Federal Reserve, and are willing to throw any money at companies who promise even the tiniest of returns over Treasuries, oblivious if all the proceeds will be used immediately to buyback stock, thus pushing equity prices even higher, but benefiting not only shareholders but management teams who equity-linked compensation has likewise never been higher.
If you need further proof that this is precisely what is going on in US markets, consider the following from Citi:
Companies are rapidly re-leveraging…

…and the proceeds sure aren’t being invested in future productivity, but rather in buy backs and dividends…

…and Citi says all that debt issued by struggling oil producers may prove dangerous given that “default risk in the energy space has jumped [and considering] the energy sector now accounts for 18% of the market”…
 …and ratings agencies are behind the curve…

 We’ll leave you with the following:
To be sure, this theater of financial engineering – because stocks are not going up on any resemblance of fundamental reasons but simply due to expanding balance sheet leverage – will continue only until it can no longer continue.
How The Baltic Dry Index Predicted 3 Market Crashes: Will It Do It Again?
Summary
- The BDI as a precursor to three different stock market corrections.
- Is it really causation or is it correlation?
- A look at the current level of the index as it hits new lows.
by Jonathan Fishman
The Baltic Dry Index, usually referred to as the BDI, is making historical lows in recent weeks, almost every week.
The index is a composition of four sub-indexes that follow shipping freight rates. Each of the four sub-indexes follows a different ship size category and the BDI mixes them all together to get a sense of global shipping freight rates.
The index follows dry bulk shipping rates, which represent the trade of various raw materials: iron, cement, copper, etc.
The main argument for looking at the Baltic Dry Index as an economic indicator is that end demand for those raw materials is tightly tied to economic activity. If demand for those raw materials is weak, one of the first places that will be evident is in shipping prices.
The supply of ships is not very flexible, so changes to the index are more likely to be caused by changes in demand.
Let’s first look at the three cases where the Baltic Dry Index predicted a stock market crash, as well as a recession.
1986 – The Baltic Dry Index Hits Its first All-time Low.
In late 1986, the newly formed BDI (which replaced an older index) hit its first all-time low.
Other than predicting the late 80s-early 90s recession itself, the index was a precursor to the 1987 stock market crash.
(click to enlarge)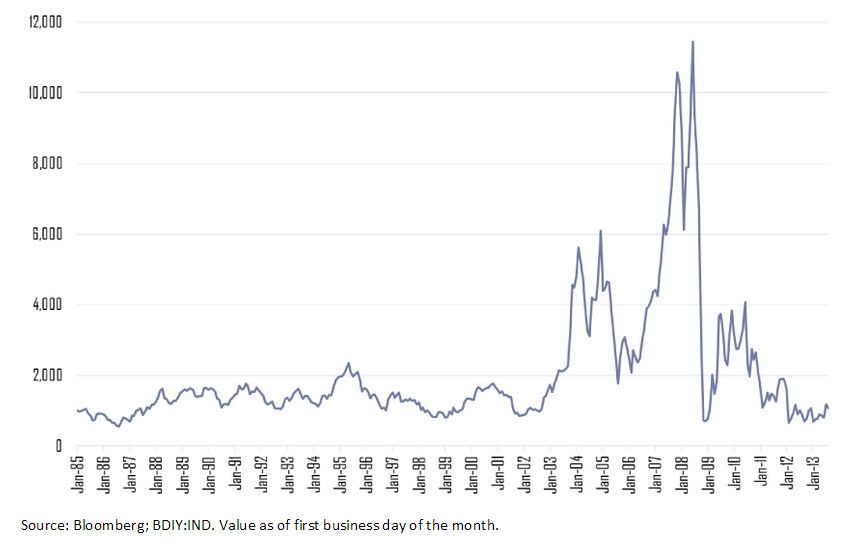
1999 – The Baltic Dry Index Takes a Dive
In 1999, the BDI hit a 12-year low. After a short recovery, it almost hit that low point again two years later. The index was predicting the recession of the early 2000s and the dot-com market crash.
(click to enlarge)
2008 – The Sharpest Decline in The History of the BDI
In 2008, the BDI almost hit its all-time low from 1986 in a free fall from around 11,000 points to around 780.
(click to enlarge)
You already know what happened next. The 2008 stock market crash and a long recession that many parts of the global economy is still trying to get out of.
Is It Real Causation?
One of the pitfalls that affects many investors is to confuse correlation and causation. Just because two metrics seem to behave in a certain relationship, doesn’t tell us if A caused B or vice versa.
When trying to navigate your portfolio ahead, correctly making the distinction between causation and correlation is crucial.
Without doing so, you can find yourself selling when there is no reason to, or buying when you should be selling.
So let’s think critically about the BDI.
Is it the BDI itself that predicts stock market crashes? Is it a magical omen of things to come?
My view is that no. The BDI is not sufficient to determine if a stock market crash is coming or not. That said, the index does tells us many important things about the global economy.
Each and every time the BDI hit its lows, it predicted a real-world recession. That is no surprise as the index follows a fundamental precursor, which is shipping rates. It’s very intuitive; as manufacturers see demand for end products start to slow down, they start to wind-down production and inventory, which immediately affects their orders for raw materials.
Manufacturers are the ultimate indicator to follow, because they are the ones that see end demand most closely and have the best sense of where it’s going.
But does an economic slowdown necessarily bring about a full-blown market crash?
Only if the stock market valuation is not reflecting that coming economic downturn. When these two conditions align, chances are a sharp market correction is around the corner.
2010-2015 – The BDI Hits All-time Low, Again
In recent weeks, the BDI has hit an all-time low that is even lower than the 1986 low point. That comes after a few years of depressed prices.
(click to enlarge)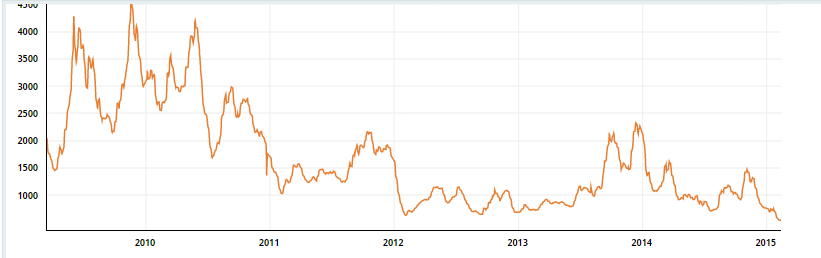
Source: Bloomberg
What does that tell us?
- The global economy, excluding the U.S., is still struggling. Numerous signs for that are the strengthening dollar, the crisis in Russia and Eastern Europe, a slowdown in China, and new uncertainties concerning Greece.
- The U.S. is almost the sole bright spot in the landscape of the global economy, although it’s starting to be affected by the global turmoil. A strong dollar hits exporters and lower oil prices hit the American oil industry hard.
Looking at stock prices, we are at the peak of a 6-year long bull market, although earnings seem to be at all-time highs as well.
(click to enlarge)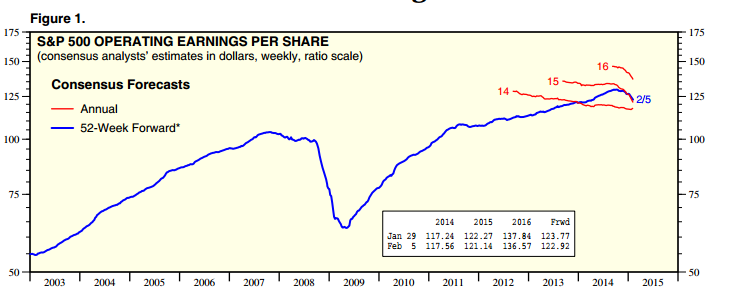
Source: Yardeni
What the BDI might tell us is that the disconnect between the global economy’s struggle and great American business performance across the board might be coming to an end.
More than that, China could be a significant reason for why the index has taken such a dive, as serious slowdowns on the real-estate market in China and tremendous real estate inventory accumulation are disrupting the imports of steel, cement and other raw materials.
Conclusion
The BDI tells us that a global economic slowdown is well underway. The source of that downturn seems to be outside of the U.S., and is more concentrated in China and the E.U.
The performance of the U.S. economy can’t be disconnected from the global economy for too long.
The BDI is a precursor for recessions, not stock market crashes. It’s not a sufficient condition to base a decision upon, but it’s one you can’t afford to ignore.
Going forward, this is a time to make sure you know the companies you invest in inside and out, and make sure end demand for their products is bound for continued growth and success despite overall headwinds.
Oil Markets: Sentiment And Lame Thinking Are Currently In The Driver’s Seat

Summary
- The oil markets have hit multi-year lows on unsubstantiated theories about a supply glut and fears of cooling demand.
- Meanwhile, the geopolitical risks around the world have oddly disappeared in H2 2015.
- Nevertheless, the facts prove that the real thing is way too far from evaporating geopolitical risks or a material deterioration of the global supply-demand fundamentals that can justify a slump.
- The unprecedented downward pressure on oil prices is a headline-driven and sentiment-driven event.
- The oil price will definitely rise significantly in 2015.
Introduction
The stock market will always give the investors a chance to make a blunder, especially for those who allow emotions to overrule facts and factual thinking. The emotional blunders are part of the game in the stock market. And if you run your portfolio based on lame-thinking and emotion, you will most likely follow the herd mentality and sell at the wrong time, because lame-thinking and emotion will always cloud your judgment.
Things get worse for your portfolio when you allow the analysts and the opinion makers who show up daily on CNBC and Bloomberg, to tell you what is really going on with a sector. To me, many of these guys are not just incompetent. To me, they are dangerous because their advice can ruin your wealth in a record time. It is easy to throw out statements without backing them up with any math, and it is easy to make overly simplistic interpretations of the global supply/demand dynamics. “So easy even a caveman can do it,” as GEICO’s commercial states.
And as clearly illustrated by the following charts, insanity and panic are currently hovering over the oil markets, due to the fact that many incompetent oil prognosticators have flooded the media with their lame opinions over the last months. For instance, the charts for the bullish ETFs (NYSEARCA:USO), (NYSEARCA:DBO) and (NYSEARCA:OIL) that track WTI are below:
(click to enlarge)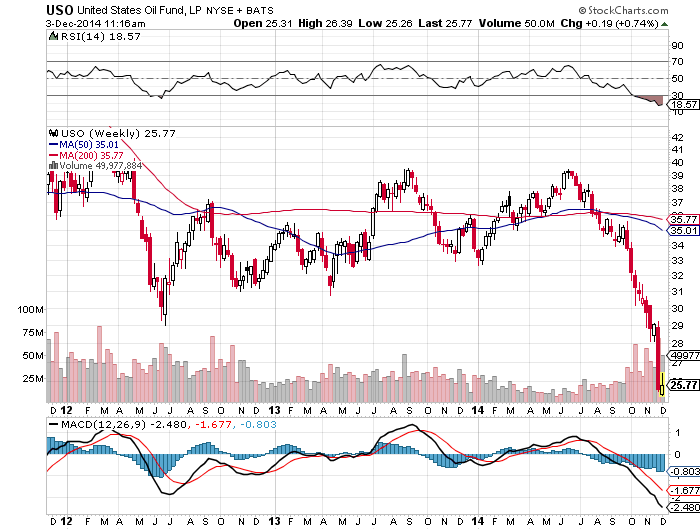
and below:
(click to enlarge)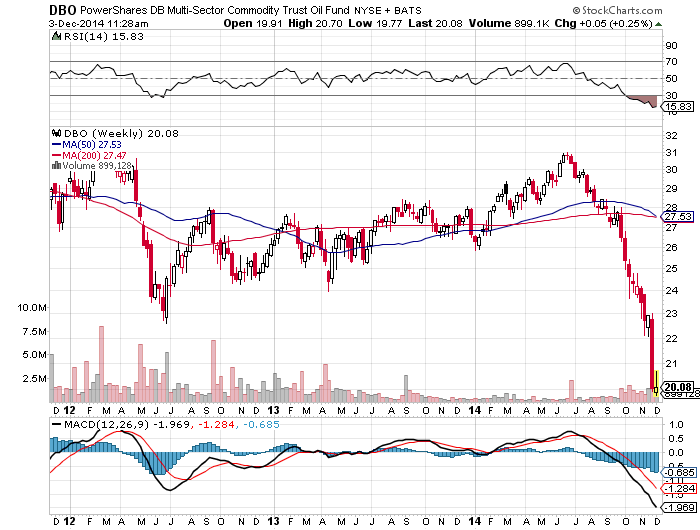
and below:
(click to enlarge)
This is the chart for the bullish ETF (NYSEARCA:BNO) that tracks Brent:
(click to enlarge)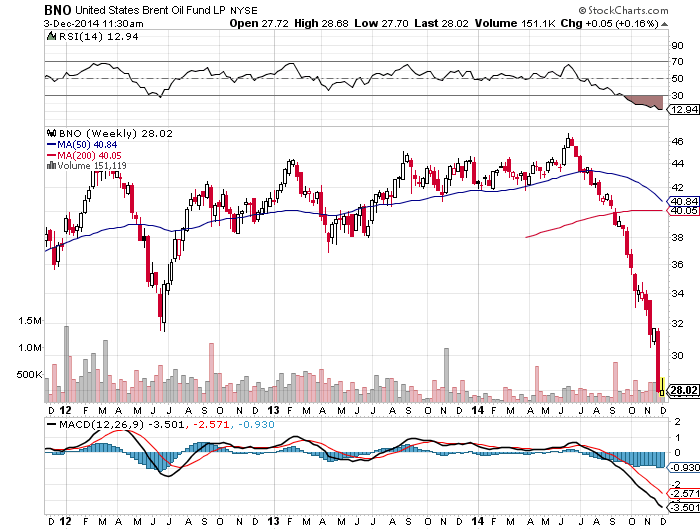
And the charts for the leveraged bullish ETFs (NYSEARCA:UCO) and (NYSEARCA:UWTI) are below:
(click to enlarge)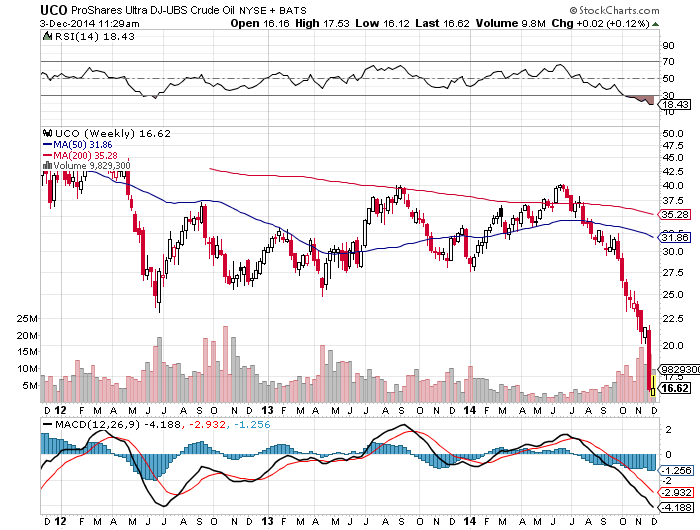
and below:
(click to enlarge)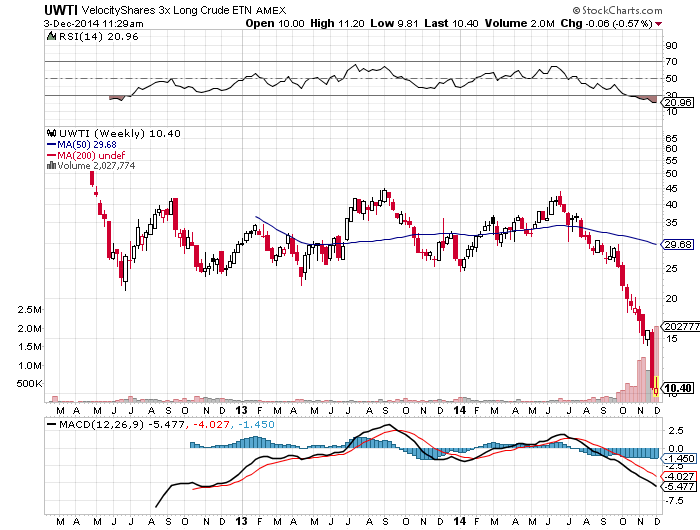
All these bullish ETFs have returned back to their 2010 levels amid irrational fears for oversupply. But, these fears are completely unsubstantiated and they do not justify at all the sentiment-driven slump in the oil price over the last 4 months.
Andre Kostolany and The Oil Price
Obviously, all these sellers ignore Andre Kostolany who has said that:
“Imagine a man walking, one step at a time, on a country lane for a mile or so. He is accompanied by his dog, which follows the man like a dog follows his master: one step forward, one step backward. While the man is walking slowly, his dog is jumping around back and forth. There will be times when the man is ahead; he will wait for the dog and then there will be times when the dog is ahead and the dog will wait. In this example, the man represents the economy, and the dog the stock market.”
And for those who do not know Andre Kostolany, Kostolany is a stock market legend. Kostolany’s great quote describes what is going on with the oil price these days. The dog (oil price) currently is behind the man (oil supply/demand dynamics) and will catch him sooner rather than later.
In other words, I am a strong believer that Brent is not going to stay below $75/barrel for long, and the dubious Thomas are welcome to read the facts that will propel Brent higher than its current levels by early 2015.
What They Were Telling You In 2013 And H1 2014
Back in 2013 and H1 2014, when Brent was trading around $110/bbl, the analysts and several other opinion makers were calling for oil to hit $150 per barrel. Let’s see some more details and the reasons behind these calls:
1) In H1 2013, the U.S. Department of Energy reported that China overtook the U.S. as the world’s largest net oil importer. That was the time when a report from the Paris-based OECD (Organization for Economic Co-Operation and Development) came out and noted:
“Based on plausible demand and supply equations, there is a risk that prices could go up to anywhere between $150 and $270 per barrel in real terms by 2020, depending on the responsiveness of oil demand and supply and on the size of the temporary risk premium embedded in current prices due to fears about future supply shortages.”
OECD also noted in that report:
“There is a strong price increase needed despite this new oil production coming on stream.”
2) In H1 2013, Energy Aspects, an energy research consultancy, noted as linked above “All estimates point to Asian demand propelling growth.” It also said that the implications of the U.S. shale-oil boom could be overstated for the rest of the world if demand from Asia keeps up.
3) In H1 2013, some analysts from Goldman Sachs wrote that Brent crude oil prices could rise to $150 per barrel in H2 2013 because:
“Despite the boom in U.S. shale gas, the oil price remains high, which he attributed primarily to sanction-related supply disruptions in Iran. Trying to compensate for this, Saudi Arabia has already increased its oil production to a 30-year high this year.”
Mr. Currie added that:
“While global oil demand has increased at a slower pace, it is still higher than the production increases in non-OPEC countries. Upside risks for oil prices include low inventory levels, limited OPEC spare capacity, and geopolitical risks which are likely near an all-time high with production in a very large number of countries at risk, including Egypt, Iran, Iraq, Libya, Nigeria, Sudan, Syria and Venezuela. Europe still faces economic and policy headwinds, China just experienced a significant food inflation surprise (and the livestock impacts from last year’s agriculture price spike will only be felt this year) and the US still faces risks from the debt ceiling debate, the automatic spending cuts (or “sequestration”) and impending tax increases.”
4) In H2 2013, when Brent was still around $115/bbl, the French bank Societe Generale said:
“Brent crude is likely to rise towards $125 a barrel if the West launches airstrikes against Syria, and could go even higher if the conflict spills over into the rest of the Middle East.”
5) As linked above, another report from JBC Energy in Vienna said in H2 2013:
“Current developments such as low spare capacity in Saudi Arabia, stockpiles falling in the U.S., disappointing supply developments around the world and signs of an improving global economy are pointing to tighter markets.”
6) In late 2013, the analysts at the National Bank of Abu Dhabi in UAE noted:
“Average oil price was $112 per barrel in 2012. The average price of crude oil is forecast at $105 per barrel in 2013, $101 per barrel in 2014 and $100 per barrel in 2015. The base case is for oil prices to soften mildly, but remain close to $100 per barrel through 2018. Thereafter, prices rise by a few dollars each year in this scenario.”
7) Even a few months ago in June 2014, the analysts were telling you:
A) This is from Nordea Bank (OTCPK:NRBAY):
“If Iraq, accounting for 3.7% of the world’s total oil production, suffers a serious disruption to its oil supplies, we will see a sharp upswing in oil prices as the OPEC effective spare capacity buffer is low, making the global oil market highly sensitive to further supply disturbances. If Iraqi oil production would fall back to the low levels seen during the invasion of Iraq in 2003, oil prices could easily rise by up to $30 a barrel as this would push the global spare capacity back to the lows when oil prices reached $150 a barrel in July 2008. High oil prices would put the world economic recovery at risk.”
B) This is from PVM Oil Associates:
“The deteriorating situation in Iraq could be the source of an oil price and therefore a financial shock should be sending economic-growth forecasters back to the drawing board. There can be no doubt that if Iraq’s southern oil operations are impacted Brent could reach $125 a barrel and beyond. Saudi Arabia may have 2 million barrels a day of capacity it can turn on reasonably quickly but that leaves no spare capacity margin.”
C) This is from Commerzbank (OTCPK:CRZBY):
“It is hard to imagine that the oil production in northern Iraq will return to the market in the foreseeable future. So far, oil production in the south of Iraq, which accounts for 90% of Iraq’s oil exports, has been unaffected by the fighting in the north and center of the country. However, the sharp price rise in the last two days shows that this oil supply is no longer viewed as secure, either. Without the oil production from the south of Iraq, the market would be stripped of an estimated 2.5 million barrels per day.”
D) This is from the research consultancy Energy Aspects:
“Look at any forecast, they are calling for Iraqi production to be around 7-8 million barrels a day by 2018/2020 for oil prices to not rise substantially. And I think that’s the key, because that’s not going to happen. If this is contained within Iraq that’s one thing, but there’s a very different implication if it becomes a bigger regional conflict. That’s the biggest problem. Iraq’s at the heart of this big oil-producing region.”
What They Are Telling You In H2 2014
Let’s see now what the analysts and several other oil experts have been telling you lately:
1) In October 2014, Goldman Sachs slashed its 2015 oil price forecast. Goldman sees Q1 2015 WTI crude at $75/bbl versus $90/bbl previously and Q1 2015 Brent at $85/bbl versus $100/bbl previously. The U.S. investment bank said rising production will outstrip demand, joining other oil analysts who predict consumption will be dented by slower global economic growth and lead to a supply glut.
2) Other analysts who joined the bearish party lately, predict that the bear market in crude will continue with prices falling as low as $50 a barrel, in part because the global economy is slowing, pushing supply levels higher.
3) In late October 2014, fellow newsletter editor Dennis Gartman showed up and implied that oil could go to $40-$50 per barrel because among others, Lockheed Martin (NYSE:LMT) was working on a compact fusion reactor that could be ready within 10 years. He said:
“Fusion is going to be the great nuclear power of the next 150 years. And finally, we are driving less and less. We are using so much less gasoline than we ever have, in global terms, in national terms, in per capital terms. All of those things, I think, are going to be weighing heavily on crude oil. And where could it go? A lot lower, a lot lower.”
So within ten years from now, we will fit a nuclear fusion reactor on the back of our cars dumping our gas tanks. Let Star Trek come to life! Obviously, Gartman’s thesis also implies that Star Trek’s high-tech, innovative and game-changing tools will be on clearance, so all the people from China and India to Africa and America will not afford to overlook this irrationally cheap nuclear fusion reactor. I don’t even understand why an investor can take Gartman’s approach on oil seriously.
4) The technical traders also showed up a few weeks ago calling for $40/bbl, based on the following chart:
(click to enlarge)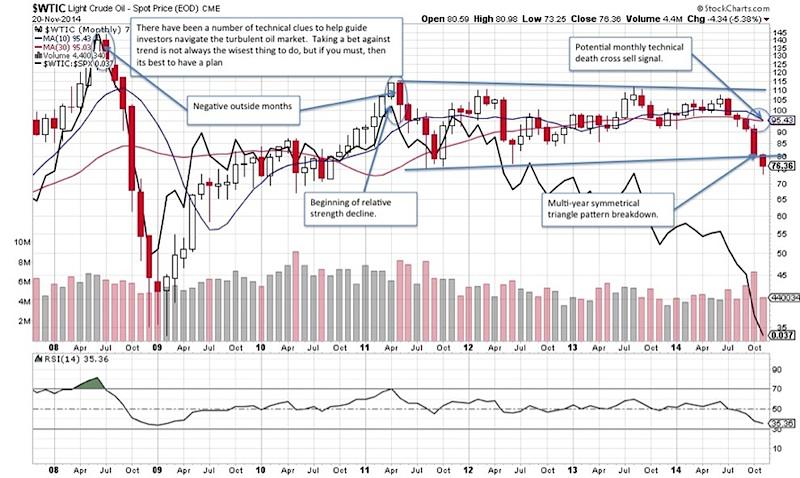
2013/H1 2014 vs. H2 2014: No Major Fundamental Change While Geopolitical Risks Deteriorate
According to Forbes, these are the world’s biggest oil consumers today:
1) United States.
2) China.
3) Japan.
4) India.
5) Euro area.
As also shown in the previous paragraph, the calls in 2013 and H1 2014 for $150/bbl were based on the geopolitical tensions in the Middle East and the expectations about global growth with a focus on demand from the growing Asian markets, which are high in the list with the world’s biggest oil consumers.
And the facts below prove that nothing has changed over the last six months to justify a drop of 35% in the oil price that has occurred lately. In contrast, the geopolitical risks in the Middle East have deteriorated, and the security situation both in Iraq and in Libya has worsened recently. Even International Monetary Fund [IMF] admits that the geopolitical risks have worsened since H1 2014, according to its latest report.
Also, the world’s biggest oil consumers are growing at rates that either are in line with 2013 rates or exceed expectations. There is nothing to indicate that global supply and demand imbalance has fundamentally changed in the past six months. There is just too much speculation, emotion, panic and short-term lame thinking that have been used to determine the value of the oil price lately, and this slump in oil prices is clearly a result of sentiment and emotion.
Let’s proceed now with the facts:
1) Geopolitical risks deteriorate primarily due to ISIS, Iran and Libya: The extremist Islamic State of Iraq and Syria (ISIS) is still there, and the U.S. military and its allies hit ISIS forces with 15 air strikes in Iraq and Syria during a three-day period, The U.S. Central Command revealed a couple of days ago. Thirteen attacks were carried out in Iraq since last Wednesday and two more targeted Islamic State in Syria.
Meanwhile, ISIS keeps advancing in Iraq and Syria, after seizing Iraq’s second largest city Mosul on June 10th. The attacks have been escalating since 2013 and H1 2014, while American, British and Syrian soldiers were beheaded in October 2014 and November 2014, which is confirmed by Obama Administration. Apparently, there is no improvement compared to the situation in 2013 or H1 2014.
Furthermore, world powers failed to reach a nuclear agreement with Iran last week and extended talks for seven months. This means that the Western economic sanctions are not going to be lifted anytime soon, freezing the ability of Iranian banks to conduct international transactions while Iran’s daily oil export restrictions will remain too. This also means that Iran will continue working on its nuclear program by the summer of 2015, impacting negatively the destabilization risk in the region. And there is obviously no improvement compared to the situation in 2013 or H1 2014.
Also, there is no risk improvement in Libya compared to the situation in 2013 or H1 2014. In late August 2014, Libya’s ambassador to the United Nations warned of “full-blown civil war,” if the chaos and division in the North African country continue.
Libya currently has two competing parliaments and governments. The first government and elected House of Representatives relocated to Tobruk a few months ago after an armed group from the western city of Misrata seized the capital Tripoli and most government institutions, as well as the eastern city of Benghazi. The rival previous parliament remains in Tripoli and is backed by militias.
And just a couple of weeks ago, Libya’s political strife intensified as the rival government that has seized the capital took control of Libya’s largest oilfield (El Sharara), according to Reuters. Libya’s oil production rose above 900,000 bopd in September 2014, sharply above lows of 100,000 bopd in June 2014, but it has already fallen to around 500,000 bopd at most, as a recovery in Libya has faltered so far, according to Reuters. This translates into a material drop of approximately 400,000 bopd from Libya only.
2) GDP Growth Rates: Let’s take a look now at the GDP growth rates of the world’s biggest oil consumers:
A) United States: According to the latest news of September 2014, the U.S. economy grew 4.6% in Q2 2014, exceeding earlier estimates. And according to the latest news of November 2014, the U.S. economy grew 3.9% in Q3 2014, exceeding once again the consensus estimate of 3.3%, as illustrated below:
(click to enlarge)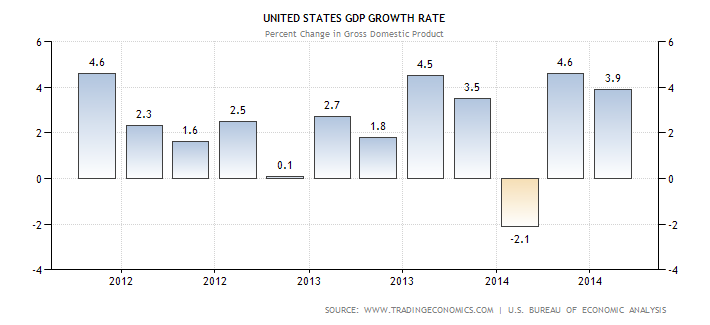
B) China: China grew 7.6% in 2013 and grows 7.4% (on average) to date, as shown below:
(click to enlarge)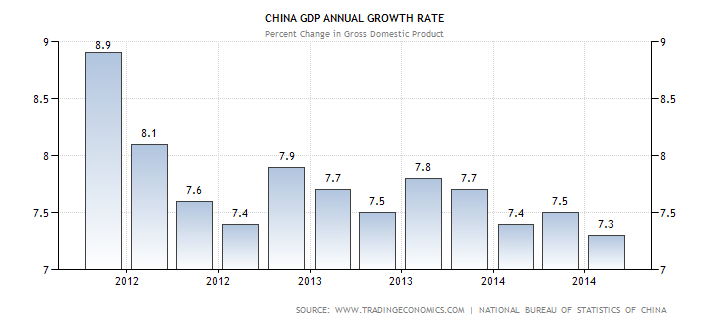
Also, China’s GDP per capita continues growing in 2014 at the same pace it has been growing over the last couple of years, as illustrated below:
(click to enlarge)
On top of that, the Chinese central bank initiated an easing cycle just a few weeks ago. How can a serious investor ignore this initiative that will have material effects on China’s future growth and China’s oil consumption of course?
C) Japan: The Japanese economy grew in Q1 2014 and contracted in Q2 and Q3 2014, as illustrated below:
(click to enlarge)
But on average, Japan grew 1.52% in 2013 and grew 0.89% in 2014 too, based on the three quarterly GDP figures to date.
Additionally, Japan’s GDP per capita continues growing in 2014 compared to 2013, as illustrated below:
(click to enlarge)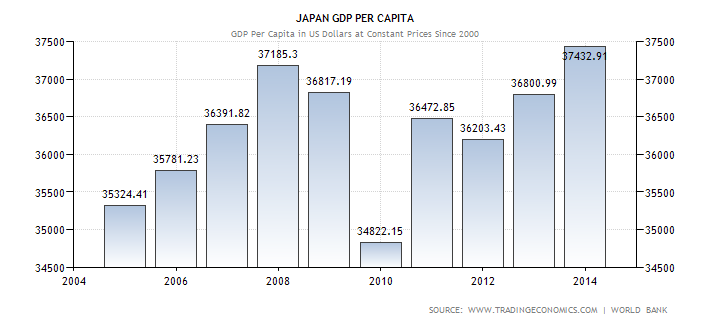
D) India: As shown below, the Indian economy grew 4.5% in 2013:
(click to enlarge)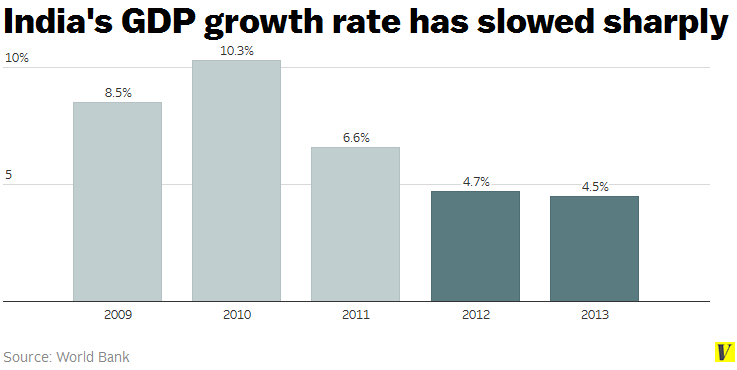
That was the time when the analysts were saying that these GDP numbers were below their expectations. Please see some analysts’ and officials’ statements about India’s GDP growth from late 2013:
i) “There is no light at the end of the tunnel visible in India’s GDP release.”
ii) “It was slightly below expectations but I feel the overall growth rate of 4.9% would be achieved this year (2014)” said C. Rangarajan, Chairman of the Prime Minister’s Economic Advisory Council.
iii) “These numbers clearly show that attaining a growth rate of 4.9% in 2014 is not possible.”
That was also the time when Brent was around $110/bbl and all the oil prognosticators were projecting $150/bbl, as shown in the previous paragraph.
However, the Indian economy picked up steam and rebounded to a 5.7% rate in Q2 2014 from 4.6% in Q1 2014, led by a sharp recovery in industrial growth and gradual improvement in services.
And under the Modi government and thanks to a series of fundamental economic reforms, the Indian economy continued its growth and grew 5.3% in Q3 2014, as illustrated below:
(click to enlarge)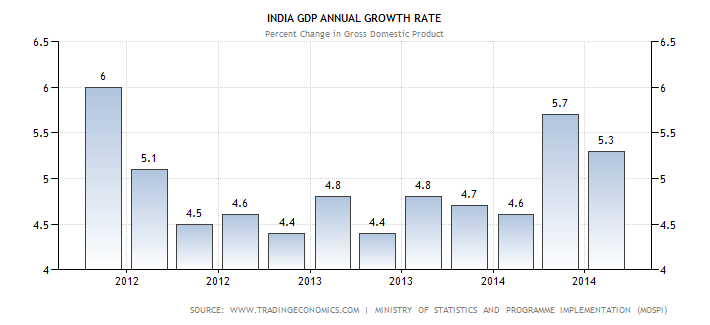
Needless to mention that these GDP rates in Q2 2014 and Q3 2014 were well above the analysts’ expectations.
Additionally, India’s GDP per capita continues rising in 2014 compared to 2013, as illustrated below:
(click to enlarge)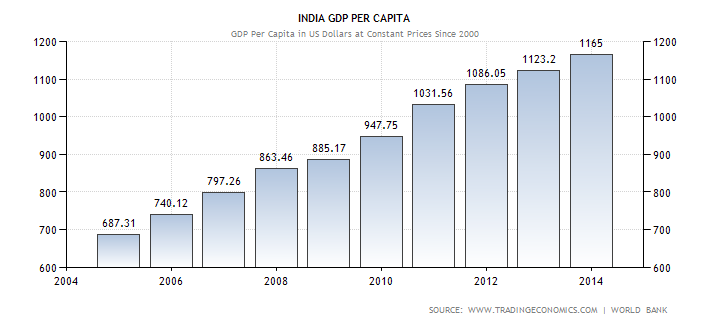
And according to yesterday’s news from Reuters, Indian factory activity expanded at its fastest pace in nearly two years in November 2014. The HSBC Manufacturing Purchasing Managers’ Index (PMI) rose to 53.3 in November 2014 from 51.6 in October 2014, its highest since February 2013, and the thirteenth consecutive month of expansion in activity. The analysts had expected manufacturing activity to lose some steam and predicted the index would fall to 51.2.
On top of that, India overtook Japan as the world’s third-biggest crude oil importer in 2013 and the U.S. Energy Information Administration [EIA] projects that India will become the world’s largest oil importer by 2020.
E) Europe: Europe continues growing in 2014 albeit in a slow rate, as illustrated below:
(click to enlarge)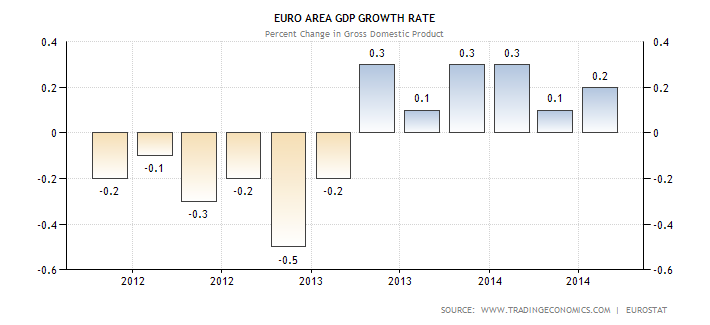
But the current slow growth in Europe was there in 2013 too. In fact, Europe has been limping forward for years and this is nothing new, as clearly illustrated at the previous chart.
The Half-Truths And The Peak Oil
Given the fact that neither the geopolitical risks have declined since H1 2014 nor the average GDP growth rates in the world’s biggest oil consumers have dropped compared to 2013, the oil bears had to discover something else to strengthen their lame approach to oil and the supposedly supply glut.
Therefore, it does not surprise me the fact that I have seen the chart below more than 20 times in numerous online articles over the last weeks, given also that there are always willing authors who behave like parrots repeating what they hear:

The thing is that this chart itself tells you half-truths for the following three reasons that you will not find all together in any of the recent bearish articles about oil:
1) This chart above compares apple to oranges. It compares Saudi’s conventional production with U.S. oil production which is primarily a result of drilling unconventional shale wells that peter out quickly. The gap between the extraction cost in Saudi Arabia and the U.S. is approximately $60/bbl. Extracting oil from shale costs $60 to $100 a barrel, compared with $25 a barrel on average for conventional supplies from the Middle East, according to the International Energy Agency [IEA].
In other words, new oil is not cheap and the rising oil production in the U.S. over the last couple of years has been conditional upon the high oil price. Most of the wave of the U.S. production is currently unprofitable and the current low oil price discourages new drilling.
2) The U.S. shale players are on a steep rate treadmill because of the high decline rates of the unconventional wells, and an investor must be in denial to not see it.
3) The sweet spots and the spots with high productivity in the main oil basins in the U.S. (Williston, EF, Permian) cover a finite amount of land and eventually the number of the wells at the sweet spots is not infinite. The shale producers say that they have reserves [RLI] for approximately 10 years but this does not mean that their drilling locations are sweet spots.
The shale producers have already drilled in many of the best areas, or sweet spots. Once those areas have been drilled out completely, operators will have to move to more-marginal locations and well productivity will fall precipitously. Meanwhile, the advances in technology cannot make wonders to boost the recovery rates overnight.
As such, it is imperative to keep in mind that the peak oil in the U.S. is not a myth. At the current oil price, the supply of the unconventional oil production in the U.S. will quickly prove self-correcting. Both the oil production and the crude inventories in the U.S. will stall soon and will go into a permanent decline effective H1 2015 as a result of the ongoing reduction in drilling activity, the high depletion rates of the unconventional wells and the finite number of the sweet spots.
In fact, the rapid decline has already started. First, the Energy Information Administration said yesterday U.S. crude-oil supplies declined 3.7 million barrels on the week ended Nov. 28. Analysts surveyed by Platts had expected crude inventories to increase by 380,000 barrels on the week.
According also to today’s news from Seeking Alpha, new permits, which outline what drilling rigs will be doing 60-90 days in the future, showed heavy declines for the first time this year across the top three U.S. onshore fields: the Permian Basin, Eagle Ford and Bakken shale. Specifically, there is an almost 40% decline in new well permits issued across the U.S. in November 2014, with only 4,520 new well permits approved last month, down from 7,227 in October 2014.
These numbers indicate a sizable dent in U.S. production in the not too distant future. Most of that dent will come from the highly leverage players holding lower quality land.
The Oil Sector In 2015 And The Real Estate Analog
The ETFs (NYSEARCA:IYR) and (NYSEARCA:VNQ) measure the performance of the real estate sector of the U.S. equity market and include large-, mid- or small-capitalization companies known as real estate investment trusts (“REITs”). Their charts over the last couple of years are illustrated below:
(click to enlarge)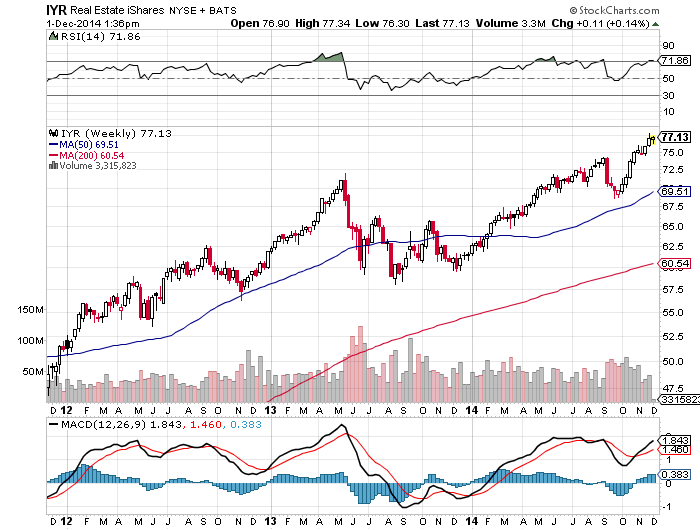
and below:
(click to enlarge)
All the investors know the fundamental problems behind the slump of the real estate sector in the U.S. a few years ago. Given that no fundamental improvement can take place overnight, it took the real estate sector in the U.S. a few years to recover from its lows in 2009.
I am sure now that many readers wonder why I talk about the real estate sector in an oil-related article. What is the relation between the real estate sector and the oil markets?
I mention this example because I strongly believe that the oil price will recover like the real estate sector has recovered from its bottom over the last three years. But, there is also a big difference here. The recovery of the oil price will be much quicker than the recovery of the real estate sector, given that this slump of the oil price has been driven by lame thinking, arbitrary speculation and sentiment, while having nothing to do with evaporating geopolitical risks around the world or a material deterioration of the global supply-demand fundamentals.
On top of that, there are some additional geopolitical clouds on the horizon that can make oil jump by H1 2015. For instance, the current low oil price has brought many OPEC members to their knees, while the holders of those countries’ sovereign debt are toast as long as oil stays at the current levels. Iran, Iraq, Libya, Algeria and Venezuela are not prepared to withstand low oil prices for long and they are now in serious danger of political upheaval at current prices. According to yesterday’s news from CNBC, the first signs of an escalating social unrest in Venezuela are already there, and things will definitely get worse over the next weeks.
Furthermore, Russia and Saudi Arabia will be anxiously watching the rapid depletion of their sovereign wealth funds, which will make the political situation in these two countries dicey over the next months.
In other words, I obviously agree with Andrew John Hall, who is known as the God of Crude Oil Trading. Although many investors and readers do not know this oil legend, Hall is secure in his view that the price of oil is destined to rise sooner rather than later, mocking those who are convinced that a U.S. shale boom will mean long-term cheap, abundant energy.
My Takeaway
Fellow investors, please educate yourselves for your own benefit. Everyone talks about buying low and selling high, but he often does the opposite. The typical investor often buys high because he feels good. And he sells low because of panic and lame thinking.
Therefore, this is the essence of my investment thesis. This oil price fall is a sentiment-driven slump. This is short term and sentiment-driven noise in the big picture story. Right now, oil has come to the point where it is unloved, which is exactly when you have to expose yourself to the sector. This oil downturn cannot last long and oil will bounce back by early 2015.
On the supply side, there are not any “elephant” conventional discoveries over the last years, and this is why the conventional oil production from the U.S., the North Sea, Mexico, North Africa and the Middle East has been falling over the last years. Cheap and easy oil is gone forever, and the global marginal barrel currently is in the $80 to $90 range.
Due to the current low oil price, oil supplies will become critically tight by early 2015, largely because production leader Saudi Arabia is not able to pump as much extra oil as many people believe. In fact, Saudi oil production has peaked at approximately 10 million bopd over the last years, as illustrated below:

On the demand side, the investors must not ignore that world population keep growing at a satisfactory rate in an energy intensive world, as witnessed by the GDP growth rates and the GDP per capita for the world’s biggest oil consumers mentioned above. As a result, global oil demand continues growing unabated at average of 1 million barrels per year.
Meanwhile, the geopolitical tensions are escalating and the crude oil price is best proxy for geopolitical risk.
After all, how can the investors weather this temporary storm and benefit from this oil price shock? Well, big fortunes will be made to those with the patience and foresight to pick right and hold tight. Just pick quality oil stocks with low key metrics (i.e. EV/EBITDA, EV/Production, EV/Reserves), sit tight, and you are going to do very well given that the strong players will remain and the weak ones will vanish.
For instance, stay far from the heavily indebted companies with a high Net Debt to EBITDA ratio, because many highly leveraged U.S. shale producers will go broke over the next couple of years. The rising tide will not lift all boats. Even if WTI jumps at $85/bbl tomorrow, several U.S. shale oil producers will not avoid bankruptcy while others will be sold for pennies on the dollar. Beggars cannot be choosers.
And now you know why I sent out last Thursday a Market Update to the subscribers of “Nathan’s Bulletin,” urging them to load specific quality picks. And when Brent crests that $90 mark again, they will be glad they did.

The reason oil stayed as high as it did was the fact that India and China subsidized it. The fact that China passed the US in imports misses the point. China uses 36mm boe in coal every year. They manufacture 700 million tons of steel versus 40 in the US. This is due largely to $5 trillion in QE. In the process of this absurd borrowing, they have wiped out most of their neighbors.
Earnest and Young estimates that there is 300 million tons of excess steel capacity in the world and China is STILL building new capacity. That 300 million tons is assuming China continues to use 640 million tons internally. Once countries start to protect their steel producers, China is going to collapse. Steel requires 11 BOE of energy per ton. 300 million tons is the equivalent of 10 million BOE of energy per day. If there’s a recession, you could see total energy use drop by 15-20 million BOE per day.
Demand isn’t what people want, demand is what they can pay for. Once the wold starts defaulting on this junk corporate debt, petroleum demand is going to collapse. The last time we went through a shock like this was 1982 and 6 million BPD of demand came of the market. This one is going to be far far worse. You could easily see oil go to $50 and stay there for a decade. According to Evans-Ambrose Prichard, Jim Chanos and Kyle Bass, China is going to collapse.
” The recovery of the oil price will be much quicker than the recovery of the real estate sector, given that this slump of the oil price has been driven by lame thinking, arbitrary speculation and sentiment, while having nothing to do with evaporating geopolitical risks around the world or a material deterioration of the global supply-demand fundamentals”.
and this one:
” In fact, the rapid decline has already started. First, the Energy Information Administration said yesterday U.S. crude-oil supplies declined 3.7 million barrels on the week ended Nov. 28. Analysts surveyed by Platts had expected crude inventories to increase by 380,000 barrels on the week.
According also to today’s news from Seeking Alpha, new permits, which outline what drilling rigs will be doing 60-90 days in the future, showed heavy declines for the first time this year across the top three U.S. onshore fields: the Permian Basin, Eagle Ford and Bakken shale. Specifically, there is an almost 40% decline in new well permits issued across the U.S. in November 2014, with only 4,520 new well permits approved last month, down from 7,227 in October 2014. “
I did not actually expect such big declines so soon. Both declines really surprised me. How long can an investor remain in denial?
“China is going to collapse.”
People have been saying that for around, well, forever.
How many people world-wide have been sitting on the proverbial sidelines at $100+ oil? Waiting to start or expand a biz. Waiting to buy a car?
All of a sudden, poof, 40% off on the COGS!
Possibly a big demand shock coming.
Answer: None.
Most people (Americans) can’t even tell you who Ben Franklin was, much less tell you the price of oil.
They can’t even remember how much their last tattoo cost them, or their boyfriend.
Nonetheless, I don’t buy some of the talk I’m reading on the internet that “the US shale drillers will keep right on going with oil at $65”. That idea is just totally ridiculous. The operating cash flow generated by US shale producers will decline dramatically if oil stays below $80 and they won’t be able to raise nearly as much capital because of lower stock prices and substantially higher yields required to sell bonds. So US shale drillers will be forced to cut back on drilling activity because of a simple lack of capital and cash flow to pay for horizontal drilling, which is expensive. This big drop in drilling activity, which will happen for sure if oil stays below $80, should cause US oil production growth to drop sharply in the first half of next year and that drop will probably cause the oil market to correct back up into the 80s by the second half of next year.
I’ve been surprised that the Saudis have been willing to let oil prices fall all the way below $70. I’m starting to wonder if anyone really knows what oil price they need to balance their national budget. Same thing with the Russians–it’s difficult to get good credible information from the Middle East, South America, and Russia about national budgets and other subjects like what kind of oil production technology they’re using today and what their marginal cost of production is today. Do Wall Street analysts and those sleepy international agencies in Europe really know what’s going on in the Middle East and Russia? I’m starting to wonder.
Thank you for your compliments. The huge divergence between the reality and the market perception is more than apparent in the oil markets now.
The geopolitical risks have worsened compared to 2013 and H1 2014, the GDP growth rates in 2014 are at or above expectations in the world’s largest oil consumers compared to 2013, while the crude inventories and the new permits have already started to drop rapidly. We talk for a 40% decline here.
To me, this is the definition of: THEATER OF THE ABSURD.
Let’s see how long this THEATER OF THE ABSURD will go on.
Regards,
VD
Thank you for your compliments. As mentioned above, what is going on now in the oil markets is the definition of the: THEATER OF THE ABSURD.
Let’s see how long the oil bears will keep behaving in this irrational manner trying to make money at the bottom although the facts are not there.
Regards,
VD
Re: “I don’t buy some of the talk I’m reading on the internet that “the US shale drillers will keep right on going with oil at $65″. That idea is just totally ridiculous. The operating cash flow generated by US shale producers will decline dramatically if oil stays below $80 and they won’t be able to raise nearly as much capital because of lower stock prices and substantially higher yields required to sell bonds”
If oil price keeps going down, and I’m a shale driller with sunk cost already, wouldn’t I want to try to keep pumping MUCH, MUCH more first to try to keep my fixed costs even lower, to try my best to survive, before the inevitable happens? In other words, I think we might just be seeing the beginning of the price fall … sure, 6-12 months down the road, we’ll see some real bust happening (not all producers have enough liquidity to last 6-12 months), but the time from today to the next 3-6 months could be really painful for longs … before they cut production, I think, they’ll try to produce a heck of a lot more to try to survive, before the financial constraints starts to work – remember, financials have many avenues, some will still pump more, borrow from banks to suvive, etc. i.e. we could be looking at 6-12 months pain before recovery, before the banks finally say enough is enough, before capital markets starts to rate the bonds as junk, etc. These process could last a long time, and until then, we might be seeing continued increased weekly production which will keep depressing crude oil prices …
Originally, I plan to go long on crude oil stocks, but I’m now thinking of holding back my longs until I see a real bottom in prices. I like to see US production slows down for 2 to 3 weeks in a row, and right now, we are just not seeing this happening at all – US producers keep producing more oil every week, and with Saudis not cutting down, the supply of oil on a weekly basis keeps going up, and prices inevitably must come down … I have a feeling, $65 will not be the immediate bottom yet … but let’s see …
I do think there is a temporary glut of supply that triggered the decline, coupled with the obligatory unwinding of long positions…crude prices may capitulate further, but they won’t stay down for long. The tricky part is staying patient and waiting for a tradeable bottom, and separating the long term winners from the ones with excess leverage and poor fundamentals. We know the hedge funds are herd animals so expect more piling on of short positions to drive crude lower.
I am getting sick when I see how quickly all these highly paid “gurus” change their mind depending on which way the wind blows, while ignoring the facts. And they behave like parrots repeating the words and imitating the actions of another.
This is why, I felt the need to write this factual article that clearly demonstrates what these “gurus” were telling us in 2013 and H1 2014, and what could drive prices at $150/bbl.
Also, separating the wheat from the chaff is something that ALL the investors must do now. They must NOT make the mistake to load the heavily indebted energy companies because it will be a “dead cat bounce”, if these companies ever bounce back.
Regards,
VD
I greatly value your research, time and effort put into you articles.
However, timing is everything. This piece feels desperate. I have read a lot of details on the subject of late and there were many signs of this slump in prices coming that were not accounted for by those who only see oil prices as going up.
Prices go up and they go down. I don’t see the compelling evidence that it will suddenly go up soon.
Just pull up the price charts of crude oil over the past 20 years.
You’ll see this current price drop is the 2nd longest drop over that period.
The only time when crude had a bigger drop was back in 2008, from a peak of $147, down to a low of $33, near the 200 month MA. Today, we are near the 200 month MA as well which is currently around $60-$65 … we can’t time it precisely, but over the next few months, I feel we are close to the current bottom, and it makes sense to pick good quality issues relating to crude oil, and slowly work your way inside. Never go on margin, this is really Value Investing at its finest, and if you are not scared, you are not doing Value Investing properly – I won’t bat an eyelid if the purchases made this week drops by 50% more at the bottom, because history has shown that they will rise much, much more. I’m looking at +100% gains over the next 1-3 years at the least …
Demand for oil in the six segments that simply cannot stop are impervious to economic slowdown (plastics, oceangoing freight, train freight, fertilizer, aviation, modern armies). Regardless of consumer slowdowns, these six segments represent 80% of oil and net gas consumed around the world. When economies slow down, the food, freight, aviation and military segments do not, they continue on. A recession in Europe or China would only slow the rise in demand, not reverse it. Look at the demand trend of the past year and understand that even if demand only rises at one half the slope is has followed from 2004 until now, it will still outstrip current expected global production for Q1 2015. Oil price strip is highly elastic to tiny percentage changes in the supply-demand balance. Current situation is creating the coiled spring and that coiled spring WILL unwind before the end of 2015.
We just hope it is a measured controlled unwind throughout the year, otherwise we will have the $140 spike we saw in 2008 for a month or two before settling down to something in the $90 – $100 brent range.
Set your DCF and NAV models for $90 brent / $85 WTI. This is going to get ugly before the weather gets cold again in 2015. I’m willing to go out on a limb and say you can quote me on this one.
Here is the reality when Brent is $70/bbl for more than one or two months…
1. Venezuela is cash flow negative and cannot make coupon payments on its foreign debt. Venezuela WILL default on its debt before end of 2015 in this price regime.
2. Iran cannot feed its army at this price. The mullahs depend on the support of their army to maintain power. Kicking this leg out from under the government stool makes their continued existence precarious. Martial law kind of precarious.
3. The government in Tripoli cannot feed their guard at these prices. If the government in Tripoli cannot do this, they cannot protect the pipes that carry crude to their northern port. When that happens the other government in the west breaks through and shuts the pipe down to prevent revenue from reaching the Tripoli government and thereby trying to strangle it. 800,000 bbl/day go off stream.
4. Saudi Arabia is burning $2b/month from their sovereign wealth fund. At that burn rate, the ENTIRE sovereign wealth fund runs dry in 60 months. They need to turn the boat around long before that happens because if they burn through more than about 25% of it, angry men with beards and automatic rifles start to hang around the palace gates. Not a stable internal situation. Riyadh has made major financial promises to its citizens in return for peace and their support. And in Saudi Arabia, the citizens do not have peaceful protest marches when they are aggrieved.
5. Russia is burning $2.5b/month form their sovereign wealth fund. At that burn rate, the ENTIRE sovereign wealth fund runs dry in 48 months. They will tighten their belts, suffer, freeze, grit their teeth and tough it out. BUT! (and this is a big one) understand that at the back of the mind of every strategist in the Kremlin is the nagging thought that all they have to do to cause a global geopolitical crisis and force the price of energy to whipsaw back up to $100/bbl in the course of a week is to kick the hornets nest: Roll the tanks into Donetsk and Lukhansk. Overnight crisis and EU buckles because it is now winter and Germany will freeze without the Ukrainian transit gas (Nordstream can only supply about one third of what Europe needs to stay warm).
6. I can’t even begin to fathom what the dynamics going on in Syria / Iraq are right now, but it can’t be good. I’m sure Baghdad had to guarantee Kurdistan a minimum cut in the negotiation to let them export. Well, either Baghdad or Kurdistan is not going to get that minimum cut agreed in that negotiation. How do you think things are panning out in their relations now?
This situation has the makings of a new Arab Spring / Cold War settling in… and it cannot remain in equilibrium for a whole 12 months.
Thank you for your comment. But, my article is full of facts as always. If you disagree with the facts, it is your choice.
Regards,
VD
Thank you for your compliments. Good luck with your investments.
Regards,
VD
Oil Bears and Analysts are driving the oil price down with their unrealistic attitude towards:
a) Negative growth;
b) India’s energy appetite; and
c) The fallacy of Nirvana in the Middle East.
Not to mention that Pick-Ups and large SUVs are back in vogue in North America…
I also believe that Putin will rattle his sabre and agitate conflict somewhere, to raise uncertainty and thus prices – if the drought in Oil prices remains lower much longer. After all, the fall in the price of crude in the mid 80’s (and Reagan) brought the USSR to its knees. He will not repeat that. Guaranteed.
Waiting for a firm bottom – then backing up the truck for more PTA.
No one will know the absolute bottom, at the “Hard Right Edge” of the charts. Bottoms are only know once some time are passed, and by then, you won’t be able to buy at the bottom price. That’s the reality of prices. The key is Money Management – always make sure to have enough cash to buy at lower prices when bargains avails themselves. For highly cyclical stocks, a rough yardstick is 75% fall in prices from the peak for decent names. E.g. SDRL is one that I think could be interesting – peak price was $48 in 2013, and is now trading near $12, or 75% fall. I would allocate around 4% of my portfolio to this, to be split into 4 bullets, and have actually deployed first bullet at $13.50. I’ll be looking for a final buy price of around $7 (approximately 50% fall from my first entry), and these types of buys are just put into the drawer and forget. When the drawer is opened in 1-3 year’s time, you will most likely earn anywhere from 50% to 100% gains or more.
Meanwhile, have the stomach to see the value of what you bought dropped by 50% from what you purchased. Don’t ever think about selling then, because the Reward to Risk of holding is much, much better.
And diversify into 3 issues at the very least, so that total exposure to crude oil is no more than say 12% trading capital. I am just very cautious, but of course, at the very bottom, for the 4th buy, you could double or triple the buy size and raise the 12% up to say 15%-20% capital … but these type of substantial increase must show capitulation, i.e. big price drops with big volumes …. (SDRL has shown the first capitulation last week and this week, and usually, there’s more than 1 capitulation). And if you are a nimble trader, you would also consider adding on the way up, e.g. when Weekly RSI(14) crossed above 20 and Daily RSI(14) dropped back down to around 30-40 or so ie. dipping on the way up, if you are worried that you only have 3% capital in this during the bottom.
PS. SDRL falls into my screen, because at $13.50, it is trading at NAV, and well below Replacement Cost. So, if it falls to $7, that would be trading at 50% NAV approximately, and is good enough for me.
Thank you for your compliments. Also, good luck with PTA (Petroamerica Oil) which is debt free with a pristine balance sheet, as shown in my previous articles.
Regards,
VD
Warren Buffett has said more than once that he has NEVER managed to buy at the bottom and sell at the top. Nevertheless, he is a billionaire.
Regards,
VD
– more and more suppliers will go out of business or reduce supply
– consumption and hence demand will rise if oil is that cheap.
There are a lot of factors at play as you well demonstrated – geopolitical, GDP growth, but also competing energy sources (and I’m not talking nuclear fission, but renewables). But the overriding factors appear to be speculation and herd behaviour. And we all know they can only go for so long into one direction.
Thank you for your compliments.
Regards,
VD
Also, not all shale formations are so thin as to horizontally support only single laterals. Some, like the Wolfcamp, are very thick, and the first wells drilled are really only the first of many stacked laterals.
Back to innovation and knowledge, that is not limited to shale plays, either. Not all of the new oil production is shale production. At least some if not much of it is from new horizontal development of non-shale assets. For example, look at the Spraberry in W TX.
Also, the shale wells that are drilled and produced typically hold under the leases of unsophisticated lessors other zones that have not yet been tapped.
There is more to be squeezed out of these formations than most people realize, and with advances in cost savings along the way, there still remains quite a bit of money to be made.
If it is “not fully understood” then you cannot say anything about future shale production. Currently, the author is correct. Until production is realized, such as current retrievable shale oil, for investment purposes, it doesn’t exist.
What it is going to take to send men to Mars is not fully understood, either. But that does not mean that we cannot say anything about sending men to Mars at some point in the future.
Thank you for your kind words.
In terms of the shale oil and the technology, I believe that the technology cannot make wonders overnight. And more importantly, the current technology cannot get a lot better overnight, given that it took us (George Mitchell) many years to improve this shale process and bring it to the point where we are now.
If the oil price remains at the current levels for long, the peak oil event will occur in 2015, in my view.
Regards,
VD
———————-…
Please let me know when the majority of oil newsletter writers turn bearish, that is when I’ll be a buyer.
best,
-samberpax
You are NOT a subscriber of my newsletter that was out just 3 months ago, in September 2014, when the oil price was already falling.
If you were a subscriber, you could check my picks and the recommended entry prices.
And please let me know and I will gladly send you the returns from my picks in H1 2015, based on the recommended entry prices.
Regards,
VD
I buy the long case for Oil, long term. But the question is that of how long it will take to come back.
The political unrest in the middle east ist not necessarily a cause for less supplies: the ISIS for instance uses Oil to finance their war. The anarchy actually can dislocate the production discipline and lead to lower prices. But agreed with you, anarchy is not sustainable and Oil prices will eventually move up again.
Rgeards,
VD
The author seeks to discount the additional 3.5 million barrels the US produces that were not available 5 years ago by saying the wells dry up fast and the production cost are too high. That is the true “lame thinking” here. I heard estimates that some production cost in the Bakken are as low as $29 dollars and that $70 is actually on the high end. His cost estimates are from years ago. Good ole American ingenuity drives down the cost of recovering this oil daily.
The author doesn’t deal with the death spiral that OPEC currently finds itself in. The more profligate members need a high oil price in order to maintain their spending. If I can’t make my revenue with a high oil price what is my alternative? That’s right pump more. Their state goal at this last meeting was to keep the production quotas in place. What was unsaid and the real reason oil took another dive is cheating on production quotas will reach an all time high over the coming months as these governments seek to shore up their finances.
Finally, the author displays several charts but proceeds to ignore what the charts say. We have firmly broken all uptrends and any recovery will be very difficult. I would further break his argument down but that would just give more credence to yesterday’s theory about the state of energy supplies in the world.
So whats the max production capacity for the rest of OPEC for them to keep ‘pumping more’ to make budgets meet?
Secondly, just like in October when everybody “woke up!!” and sent the market down 10%, because NOW the world is going into recession, good call btw. I highly doubt you bears are any more correct on your reactionary projections after crude fell from $90, you must be rich predicting this stuff.
As an aside Gartman has been one of the best contrarian indicators of the past 2 years.
And just to put my money where it counts, not that seeking alpha isn’t awesome.I recently sold multiple strike puts on EOG, NOV, PXD, XOM, CLR. Implied volatility is ridiculously high, and if history is any indicator its a very high probability trade.
Edmund
Yes, that would be Dennis “Marty McFly” Gartman. To be honest, I would rather have the sports almanac than my oil stocks right now.
Thank you for the compliments. And when it comes to the nuclear fusion reactor, I do not disagree with you. We can definitely see it both ways.
Regards,
VD
Both oil and oil stocks have a lot further to fall in upcoming months. There will be a far better entry point for both later in 2015. Investors would be wise to exercise some patience here and let things play out for a while. Buying the first sharp break is rarely a good idea, particularly not when there are so many signals indicating that the global economy is losing momentum.
Oil prices will ultimately come back, until then focus on the myriad of economic sectors that benefit from cheaper energy. It should also present a great buying opportunity for a whole host of energy stocks.
This piece has too much emotion embedded in it for my liking.
I am not a professional analyst who is living from this analysis.
I am an investor instead.
Regards,
VD
Thank you for your compliments.
Please see my previous articles and comments to find my bearish calls on several energy stocks over the last months i.e. Halcon Resources (HK), Goodrich Petroleum (GDP), Cobalt International (CIE), GMX Resources (GMXRQ), ATP Oil and Gas (ATPGQ), CAMAC Energy (CAK), Pinecrest Energy (PRY.V), Midstates Petroleum (MPO) etc.
Regards,
VD
The title really sums up how stupid investors are being now. The current daily correlation between a 50 cent or $1 move in oil taking down oil stocks by a few percent is ridiculous. Dennis Gartman has no credibility, I don’t understand why CNBC has him on regularly.
Thanks again for the article!
They have Jim Cramer on, so why not Dennis Gartman? They both change their minds on a daily basis and do it with conviction.
Right now, small cap oil stocks should be bought for a year end rally, stocks like MDR, WG, etc could see huge gains from current levels.
Thank you for your compliments.
Regards,
VD
I think investors need to pull the trigger on stocks they wanted lower instead of watching tv for a buying signal.
What you describe is the definition of “HERD MENTALITY” that has brought the oil price at the current ridiculously low levels.
But Einstein has said: “Two things are infinite: the Universe and human stupidity. And I am not sure about the Universe.”
Regards,
VD
However, the claim that $80-$100 is the breakeven for shale seems unfounded – I think it was the IEA that said that only 4% of production uneconomic under $70?
I also read a very interesting article today, I think on CNBC (apologies for the lack of sources), that discussed how transportation costs have plummeted in the past years.
It mentioned that in 2011, companies were paying up to $28 a barrel in transport costs. It is now $1-$3 because of pipeline construction.
If that is indeed the case, it is clear that a lot of shale is economic way below $70.
Gartman and his nuclear fusion. What a tool. I made the exact same point elsewhere that unless engines are replaced with fusion reactors and someone discovers how to make plastic from ‘fusion’ we will be using oil for some time to come…
I think the plummeting oil prices are the result of speculation more than any other factor but, as always, the market can remain irrational for longer than most of us can remain solvent.
GL
Saudi only produces 10M bbl out of 30M bbl. I predict NOCs can only withstand the pain for 6 months. after that, they can elect to exit OPEC, and form a non-Saudi cartel to sell at $80-$90 band. Saudi can sell their 10M bbl cheap if they elect to, but that’s not enough to meet global demand, so buyers will have to pay non-Saudi price.
Regards, VD
He is betting that the price of oil will increase. He is correct in this assertion. Everyone knows the price of oil is going to go up, eventually.
““When you believe something, facts become inconvenient obstacles,” Hall wrote in April, taking issue with an analyst who predicted a shale renaissance could result in $75-a-barrel oil over the next five years.”
He should listen to his own advice, it seems.
Here is one article where the “5 year” buzz line comes from:
http://bit.ly/1viOe43
“The team acknowledges that the project is in its earliest stages, and many key challenges remain before a viable prototype can be built. However, McGuire expects swift progress. The Skunk Works mind-set and “the pace that people work at here is ridiculously fast,” he says. “We would like to get to a prototype in five generations. If we can meet our plan of doing a design-build-test generation every year, that will put us at about five years, and we’ve already shown we can do that in the lab” . . . . An initial production version could follow five years after that.”
And then ramping up commercialization of fusion power, another decade? we’re looking at 15-20 years best case scenario before fusion has any affect on fossil fuel prices. This just goes to support the author’s conclusion that oil prices are low due to “lame thinking.”
No chart of the relationship between the strength of the dollar and the price of oil. Is it relevant?
Good luck with your picks.
To all those investors who believe operators in the unconventional reservoirs can keep producing while oil prices are dropping, check out their H1 budget forecasts for negative changes in CAPEX. That will remove much of the guess work and hand waving on how profitable they expect their operations to be. They know better than the analysts and economists on when to turn the taps off.
gartman is the worst of the worst in my opinion. he really is clueless. I dont know why they keep having him on every other day on fast money and the like.
Its funny how media affect sentiment changes on a dime that makes everyone forget the bigger picture as you referenced above.
remember ebola and the airline stocks in october? ignore the noise.
Regards,
VD
I think at some point sooner than the media and herd thinks that oil will bounce hard upward. OPEC made a good move to instigate a needed correction and put the industry in check. Now I think (in the short term) we will see a scary drop lower fueled by more moves by OPEC such as todays move to cut prices from SA to Asia/India and USA. SA sees India as growing and needs to subdue the fact that demand is growing. I would not be surprised if massive amounts of capital is also used to force the commodity down further to keep the herd moving ion that direction. OPEC knows that they can turn it around very quickly (just tell the world they are cutting production and the herd reverses quickly) when they need to so they are in the drivers seat for sure.
Thank you for the compliments.
A LOT of people and greedy oil speculators will be burned by shorting at the current levels. They have to pay for their mistakes and their greed, as always.
Regards,
VD
There is nothing about ego here. You misunderstood it. I have a clear opinion that I support it with facts and links. If you have a different opinion, you are welcome to present it coupled with facts in another article. If you present speculation only, it will not help, I think.
Regards,
VD
when you started quoting your” gods ” and casting scorn on any who disagree i lost interest.
ps mr market is always right no matter how much fundamentalist cry.
Another paradigm changing event already mentioned is China. The enormous real estate debt bubble and steel production bubble also fueled by debt has to come to a head soon. Yes, the collapse of China has been forecasted “forever” but so was the 2007 US recession which also was belittled for years right up to the edge. So was the collapse of the Soviet Union. The Chinese Govmnt has been able to keep the ball in the air because they control most of the economy but the Piper stands at the door. A Chinese economic collapse which WILL come will also collapse the oil price. Maybe it will recover some first but no energy investor can afford to ignore this.
Caveat Emptor!
position, firmly. [until I change it]
What I am sure of, is that this situation will change, and that change
is inevitable.
NO, I am not an analyst.
What I want to know is a chart from the EIA on Zero Hedge showing retail gasoline sales in the USA have declined almost 75%!!!! since 2004. Then Bloomberg showed a photo of the first gas station in America selling gas for below $ 2.00. Weird that below the gas price it showed Diesel selling for $3.39 plus! The EIA does not explain that stuff well why diesel is much more expensive than gasoline.(a six cents higher tax from the Feds. low suphur costs and “demand” globally????) Then the EIA shows gasoline production in the USA has risen!!! OK that tells me big oil is exporting refined petroleum products to other countries to make tons of money off us. Killing diesel over environmental EPA type stuff for political reasons because gasoline costs more to make than Diesel even with the other factors and six cent tax, and Exxon is back in Green River developing their shale oil in situ electro-fracking method for the largest oil play on earth-TRILLIONS of BARRELS in AMERICA. All comes down to costs, the big boys games, and ignorance of the average US citizen willing to be played and fleeced.
Yes overall your article was good but there’s a lot more going on the secret weird world of big oil than any of us will understand like how in the 70’s the US “government” supposedly allowed Saudi Arabia to shut down our nation in the WINTER and I froze waiting in gas lines? The USA??? Biggest army on earth plus Standard Oil of California developed the Saudi oil???? Or that their lawyer, John J. McCloy told at least seven US “presidents” what to do and say through Reagan and HW Bush? Heck he even ran the Warren Commission with Dulles and World War 11. Harold Hamm says he can drill existing wells in the “Scoop” at 99 cents a barrel and tried to sue OPEC. He is not going to shut down next year and plans on ramping up oil production big no matter what the price is. He wants to ream OPEC and make them blink unlike the 1986 oil bust when we went broke.
All highly interesting and I am watching and going to buy back when I think oil has hit the low-could be next year though?
why are you looking at GDP growth rates when talking about oil demand when oil demand figures for those same countries are available?
I dislike articles that spend their time making fun of other oracles and then turn around and make their own guesses of what the future holds. It’s an emotional argument.
Actually, I like that part – in my nearly 2 decade experience, I’ve seen far too many investors put too much faith on analysts and it’s important to show actual real life examples where analysts are fallible also.
For example, take a look at SDRL. When SDRL was above $40, there were not many analysts telling investors to sell, the prevailing tone was “crude oil is going up, up, up, and buy, buy, buy”.. But when SDRL cuts dividends to zero at $15-$20, they are now downgrading SDRL. Buy at $40, sell at $20? I think you can go to the poorhouse very fast following these “anal-ysts”.
SDRL is not an isolated example. Today, after massive price falls, I see Zacks now telling investors to sell their energy mutual funds after these funds have massive falls …
As for the future, no one knows what is going to happen, you have to follow your own investing/trading thesis. For me, I think SDRL has fallen 75% from peak, cut dividends to zero, so, I am slowly starting to accumulate SDRL, looking to spend up to 4% capital when it finally gets down to say $7. Yes, no guarantee it will fall down that far when today is only $12, but I like the fact that it has fallen from a peak of $48 down to $12 … that’s my unsubstantiated opinion also, and probably emotional as well 🙂 And yes, I’m starting to think of accumulating when analysts consensus is to sell … it worked very well for me over the past decade ….
———————-…
Exactly so! I am elevating my standard by lowering theirs. Sad, very sad indeed.
Best,
-samberpax
http://bloom.bg/12CBfjp
Here is the link to Lockheed-Martin’s compact fusion announcement. These researchers/engineers are the best of the best, I would think, so if they’re making an announcement, they must have something legitimate up their sleeve, I would think:
http://lmt.co/1yJEu5x
Interesting article on Fusion, nice read.
However, the recent crude oil price fall down to $66 is most likely unrelated to Lockheed-Martin’s fusion piece, as that piece seems more about promoting Lockheed-Martin in research and what they think they could achieve in 5 years time, and still not yet confirmed …. but good to cast a quick glance from time to time on these sort of things ….
If Lockheed-Martin managed to bring this to commercial production at small enough sizes at reasonable prices (that’s a BIG IF), then, I think we first see Lockheed-Martin’s stock price zooms up first a lot more than what we’ve seen so far, before we see global crude oil prices comes down significantly … that’s just my gut feel …
There is no guarantee we’ve seen bottom in crude yet, but I feel we are now entering a period where Value Investors should start to feel excited on some of the high quality issues that are beaten up hugely, to trade below NAV and trade well below Replacement Costs …
Cheers,
TF
I haven’t sold any of my oil stocks, but I haven’t added yet, either. Would love to buy some LNCO to bring down my cost basis, but I’m concerned they’ll have to cut, or pull a Seadrill and eliminate, their dividend.
I have been waiting for a follow-up and this seems to be the one.
Again I am impressed by your knowledge and your reasoning but I’m a bit disappointed too. Especially by not addressing points 3 and 4 of these 8 major reasons.
———————-
Just to refresh, points 3 and 4 of these 8 major reasons:
3) The weakening of the U.S. dollar.
4) OPEC’s decision to cut supply in November 2014.
Best,
-samberpax
Please bear in mind that the HERD MENTALITY is like the TITANIC cruise ship. The big ships need a couple of miles to turn….
Regards,
VD
Agree this is very much a TITANIC cruise ship that will take a few miles to turn … apparently, the weekly US Oil production figure need to show 2 to 3 consecutive week of decline at the very least first. Until then, odds are crude oil will keep falling (short term momentum). I now feel we may be close to bottom, but we are not confirmed there yet, and I won’t be surprised if crude makes $30 very briefly, before a strong and fast recovery once a few of these marginal producers are out of the picture …
Just as Saudis and US are stubborn right now to curtail production, in a year’s time when a few of the US producers goes bust, the Saudis will have achieved their objective and cut production, and just as quick, I see crude oil could rise back to $100 very fast … the US production numbers are always a surprise to markets, I expect the Saudi’s response to also be a surprise to the market when they cut back production in 6-12 months time – those looking for signs will not find it, I believe it will be a surprise to the market when it happen anytime within the next 12 months …
Whilst I agree with your base thesis and believe that the price of oil is going back up to what are more “normal” levels, some of the biggest consumers of oil on the planet are likely going to use less-and-less of it as time goes on. For example, there are pretty strict rules in place for future vehicle mileage requirements in the US, the EU has been clamping down hard on emissions for a pretty long time and lots of companies are now involved in the business of making energy efficient equipment and machinery. The list is long – GE, Siemens, Caterpillar, Deere, Hitachi, Volvo, Komatsu…..and so on.
The historical environment for oil consumption is becoming more-and-more dated when compared to what the oil consumption environment will look like going forward. It’s hard if not impossible to use the past as an accurate guide to the future.
The future oil consumption environment in two words – different and lower.
If you are short on crude oil, I don’t see a reason why you need to close your shorts now as crude keeps falling. You should only close it when you see a confirmed uptrend, at least, that’s my view.
Value Investors though are a different breed – they ease their way in specific value stocks, and now, many oil related stocks are trading at below NAV and well below Replacement Costs with strong cashflows during the last oil crisis … these stocks could still fall by another 25%-50% or close to bottom, no one really knows and so, they start to accumulate a little bit at a time … history has shown that crude oil will eventually recover, and they could be looking at +100% returns in 1-3 years time … the Value approach does not require market timing, and crude oil being highly cyclical in nature means we will definitely see $80-$100 crude oil again eventually over the next 1-3 years, we just don’t know exactly when. If it goes back to $100, you can be sure many of these crude related counters will go back up to their former levels, potentially 100%-300% gains …
Mr Market has presented a compelling opportunity, the key is Money Management, accumulate a few high quality counters, and once bought, lock them up in a drawer and don’t worry about the daily price volatilities. In 1-3 years time, the gains of +100%-300% can be had … know the strategies in advance, never allocate more than 15%-20% portfolio to oil related counters at the bottom, and certainly, never go on margins. I have been staying cash majority of my portfolio, I just recently allocate 2% capital on oil counters, and plan to slowly work my way to 15%-20% assuming these stocks could fall up to 50% from current levels … This is a no-brainer approach, I just don’t care about the daily price volatilities.
Cheers,
TF.
i am heavily long on oil and hurting badly but i keep buying as price drops. i am in your camp
Oil futures, stocks or options? I hope it is not leveraged instruments? The trend is still down …
I’m eyeing SDRL – originally, I plan to go in with 4 bullets, at $13.50 (already done), $11, $9 and $7 very roughly speaking, but now, I will most likely try to take advantage of the short term down momentum (I am a trader) to cut loss some and take wait to pick it up at lower prices, and wait for a better technical signal. Allocating just 4% capital for SDRL.
The other 2 counters are HP (this is a Dividend Aristocrat that keeps paying higher dividends every year for over 25 years) and NE (this is a nice Value play), but I haven’t triggered any buys in either yet as Crude keeps falling and the counters keep falling … Again, 4 bullets each, total 12% capital when I’m done all the 3 buys at the bottom.
Originally, I plan to make a “simple” buy approach of just buying at set levels, but the more I study the crude markets fundamentally, the more I realize that I can fine-tune my entry better, so, let’s see if this is successful or not …
How about you? What counters are you looking at?
Glad you didn’t go for futures / options with time expiries – I just don’t know how long these crude oil price can fall – it can keep falling and falling, and the bottom and recovery I believe will be a huge surprise to me.
Personally, I prefer safer, large caps, very liquid stocks that institutional buys with average daily volume greater than 500k to 1000k shares, and try to buy using a combination of writing puts and directly, and sell covered calls also.
Whilst my current list is SDRL, HP and NE, if I find something else better, I’ll most likely drop one for that …
Good luck.
Cheers,
TF
Oil company stock valuation is based on EV/B/D; EV/EBITDA and EV/Reserve; It does not matter whether large cap or debt; In case of low rev they can always curtail drilling and be very liquid to pay down debt. Worse come worse they will sell their reserves for better price than current valuation. We just bid on various leases offered by Chevron and we did not get it as there are numerous buyers willing to pay higher price.
raj
One could make educated guesses based on the geopolitical actions/goals of the major oil producing countries, changes in demand, etc.
I’d rather see oil stay around these levels for a while as I accumulate.
Looking at Venezuela and Iran for example – the oil price before the crash, at it’s peak…was nowhere near the quoted figures given for these countries to approach break even; so who goes broke first…small shale producers in the USA or the countries that need $150 oil to just break even, or do they just continue to go broke forever?
I don’t think the OPEC decision is targeted solely at US shale plays…there’s others that are in far more pain over this, the rest of the global economy benefits while oil producers suffer a small but probably needed shakeout: I’ve got investments in oil but it’s ok to lose paper money on one part of the portfolio if another part benefits… I think sovereign default would be a lot worse for everyone involved. Oil will go back up in price eventually, and the median price will rise over time as the asset depletes. When is actually not that important unless you need your money tomorrow.
Please see the excerpt below:
” On top of that, there are some additional geopolitical clouds on the horizon that can make oil jump by H1 2015. For instance, the current low oil price has brought many OPEC members to their knees, while the holders of those countries’ sovereign debt are toast as long as oil stays at the current levels. Iran, Iraq, Libya, Algeria and Venezuela are not prepared to withstand low oil prices for long and they are now in serious danger of political upheaval at current prices.
According to yesterday’s news from CNBC, the first signs of an escalating social unrest in Venezuela are already there, and things will definitely get worse over the next weeks.
Furthermore, Russia and Saudi Arabia will be anxiously watching the rapid depletion of their sovereign wealth funds, which will make the political situation in these two countries dicey over the next months. “
Regards,
VD
The sharp increase in production in the US over the past 5 years is simply amazing, however, it would be interesting to see what the overall average decline rate is for the US over the same time period.
I’m inclined to believe that the decline rate is substantially higher in part due to the tremendous number of unconventional wells that have been drilled in the past few years and the fact that they are in the steep part of the decline curve. So, while production has been climbing, it seems that the Saudi’s are hoping to curb drilling and therefore let the decline curve catch up with the industry. With a sustained drop in prices, eventually borrowing base redeterminations will result in at least a moderate decrease in drilling, perhaps even drilling within cash flow!
Also, while my opinions mean very little, I think it is important to point out somewhat misleading comments about certain plays being profitable at $40 or whatever they want to insert. Yes, if lease operating expenses and field level costs, transportation, ad valorem etc are $25-$40 per barrel, then those wells will be cash flow positive as long as pricing remains above that price.
However $25-$40 oil will not provide a decent IRR for new wells. Remember most of these shale wells exhibit very high initial production and have sharp hyperbolic type declines. Producers need to get full payout in the first 12-24 months. Wells might decline 60-70% within the first 24 months. Look at the NPV of many of the Bakken wells at $60/bbl. Not nearly as attractive as when they were $100.
I don’t know what oil pricing will do in the next few months, nor do I know what OPEC and the Saudi’s will do in 6 months. I do however believe that US oil producers will eventually have to reign in drilling budgets as cash flow wanes. I don’t know if that will mean production growth will taper, if production will hold steady with new production offsetting natural decline or if total US production will slowly decrease. I do know that it will be interesting to see it unfold.
And while my opinion isn’t worth much, I believe that we will eventually find some happy medium where US producers can achieve decent IRRs and production can grow modestly. My guess is $75-$80 bbl.
While VD is great at pointing out value, guessing what will happen to the price of oil will always be speculation. I like the argument given here, but the truth is that no one really knows.
Investors in oil-producing companies should do so because they believe that their fundamentals will allow them to be successful and profitable in any environment of oil pricing.
– The recommended entry price for my picks, given that timing matters when it comes to investing. Buying a good company is not enough.
– The investment horizon, given that I am not a day trader.
Regards,
VD
Thanks for your reply. One of the things I appreciate about your articles is always standing by your track record. Given that, here are some of your picks from this year:
CAZFF Recommended 5/15/14 – market price $0.30, currently at $0.14.
PTAXF Recommended 8/26/14 – Market price $0.38, currently at $0.14
LNREF Recommended 6/7/14 – Market price $0.35, currently at $0.19
They have all experienced significant losses (on average 52%). However, I agree that I am not a day trader so if I liked these companies enough to buy them, I would still hold on as long as the fundamentals have not changed. As Buffet said, if you aren’t willing to lose half of your investment in the market, you shouldn’t be there.
I remain long, but the simple fact is that there have been some significant losses in the short term.
I was wondering why you did not mention:
AEI.T recommended at C$4.95, now at C$6.85, up 40% despite the slump of the energy stocks.
CKE.T recommended at C$0.82, now at C$1.25, up 50% despite the slump of the energy stocks.
CAZ.T was recommended at C$0.24 in May 2014.
LNR was recommended at $0.32 in June 2014.
PTA.V was recommended at C$0.39 AND C$0.25 in October 2014:
http://seekingalpha.co…
and for reference, Oasis (OAS) has dropped from $55 to $14,
Sandridge (SD) from $7 to $2.4
Magnum (MHR) from $8.6 to $3.9
Penn Virginia (PVA) from $17 to $4.8
Quicksilver (KWK) from $3 to $0.40
and many many other producers have returned back to their 2010 levels. I can continue if you want. This might help you see the big picture.
Regards,
VD
My view is some new tight oil wells would still be drilled if oil stayed below $70, but likely not enough to overcome the rapid depletion from existing wells. I believe we will start to see US production drop sometime in H2 2015, but until then US production keeps going up. Think it will take maybe 6 months for wells already committed to be drilled and completed. After that market should at some point get back to $80-$85, maybe 12 months. But likely to be a volatile ride along the way. I personally think we have not seen bottom yet. Too much downward momentum, global oil production likely to keep increasing for the near term.
Best to prepare for the volatility and try to recognize the opportunities as they play out, IMO. So many things could intervene ( geopolitics, global economic activity, China credit, etc)!
Take care
http://bit.ly/12EquNo
Regards,
Nawar
Thank you for your compliments and your insightful comment. Yes, the news you mention is another very strong bullish indicator.
Regards,
VD
If this 5 million BOEPD were not on the world market today, where would we be?
We would be short on oil.
Instead, we are long on barrels because every dumba** American oilman that drills a good well immediately turns around and puts all of the cash flow from his good well into ANOTHER well. Plus he borrows a few million bucks to drill a few more wells.
How else can you explain the unprecedented exponential oil production growth in this country?
I wish these geniuses would spend their profits on wine, women, song, jet airplanes, country houses or something, besides plowing every single dollar of profit back into the ground.
You make a statement in your piece that sums up your whole thesis: “new oil is not cheap.”
Any way we look at the supply situation, most new production will continue to come from expensive unconventional means such as shale or tar sands. Surely there are new conventional pockets of crude to be found, but they won’t be Elephants and will probably be expensive “deep water” reservoirs.
Petroleum remains a key product for Global Energy & Industrial production and current low prices will NOT allow future demand to be satisfied.
Us reserves….
http://bit.ly/1vYF4uf
china oil reserves
http://bit.ly/1vYF4ug
I agree with much of what you wrote.
In a recent interview with Jim Cramer, Boone Pickens stated that the Saudis will eventually have to cut production. (my comments: OPEC will not survive if the Saudis let Venezuela, Iran, Algeria, Nigeria, Libya, as well as Russia descend into chaos. Not to mention destabilizing an already fragile world economic situation. When the Saudis cut, oil will soar.) B.P. also stated that the producers will be forced to cut CapEx. As they do US production will come down. Based on this, B.P. thought oil would rebound to $100 by mid-2015. Most people will dismiss Boone Picken’s comments. But when a wise old billionaire oilman speaks, I pay attention.
I think most oil services companies will have a rough 2015 (buying opportunity for HAL, SLB). Also, highly leveraged small producers may be forced into bankruptcy, but stronger producers will benefit by picking up their producing acreage and reserves for pennies on the dollar.
Regarding Syria, it seems clear the US has opted to fight a war of attrition in northern Iraq rather than cut the head off the snake in Syria. This approach takes care of a number of problems (high casualties on both sides) and is training a whole new generation of US pilots and drone operators.
I take your comments regarding portable fusion to be light hearted because the neutron flux off such reactors would kill everyone in the car.
The greatest proof against Fleischmann–Pons knuckleheaded claims of nuclear fusion at room temperature was that they were alive at the announcement. The thought that Fleischmann & Pons conducted such an experiment in an occupied building should have been grounds for dismissal or incarceration.
LMT is relying on plasma (not room temperature). This compounds the problems with having some random drunk driving around with a nuclear fusion device. Perhaps LMT can make electricity that is too cheap to meter, which would be big, but it is just speculation and not 5 years away.
In the end, the House of Saud is still in control of the price of oil. Thank God the Iranians are not in that seat.
By the way, in 1938, the US producers predicted the US has a 10 year supply of oil. I think producers can only see ten years ahead.
Thanks for your article!
It confirms what I have been thinking, although without the sources that you cite!
Geo-politically, the world is a much more uncertain place at present! As for the pace of economic activity in the U. S. and elsewhere, the numbers are always after the fact! Can’t measure what hasn’t happened yet! Prognostication is fine for what it is, but it is just that- a guess, however educated!
Oil prices may have further to decline, I don’t know, but the value of some of the oil stocks, I find compelling at these levels.