Tag Archives: QE

Major Banks Admit QE4 (money printing) Has Resumed And That Stocks Are Rising Because Of The Fed’s Soaring Balance Sheet

There was a period of about two months when some of the more confused, Fed sycophantic elements, would parrot everything Powell would say regarding the recently launched $60 billion in monthly purchases of T-Bills, and which according to this rather vocal, if always wrong, sub-segment of financial experts, did not constitute QE. Perhaps one can’t really blame them: after all, unable to think for themselves, they merely repeated what Powell said, namely that 

“growth of our balance sheet for reserve management purposes should in no way be confused with the large-scale asset purchase programs that we deployed after the financial crisis. Neither the recent technical issues nor the purchases of Treasury bills we are contemplating to resolve them should materially affect the stance of monetary policy. In no sense, is this QE.

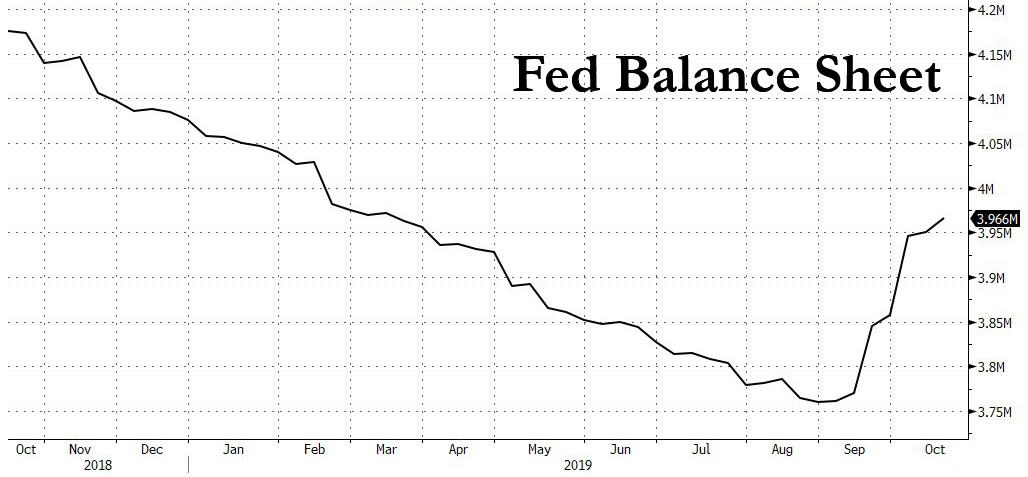
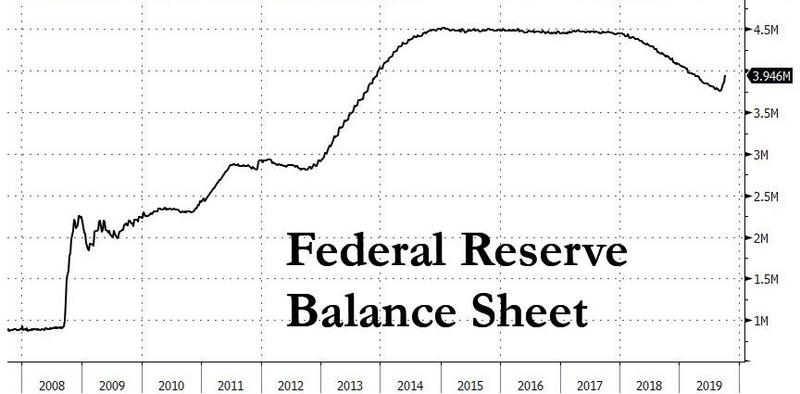
As it turned out, it was QE from the perspective of the market, which saw the Fed boosting its balance sheet by $60BN per month, and together with another $20BN or so in TSY and MBS maturity reinvestments, as well as tens of billions in overnight and term repos, and soared roughly around the time the Fed announced “not QE.”

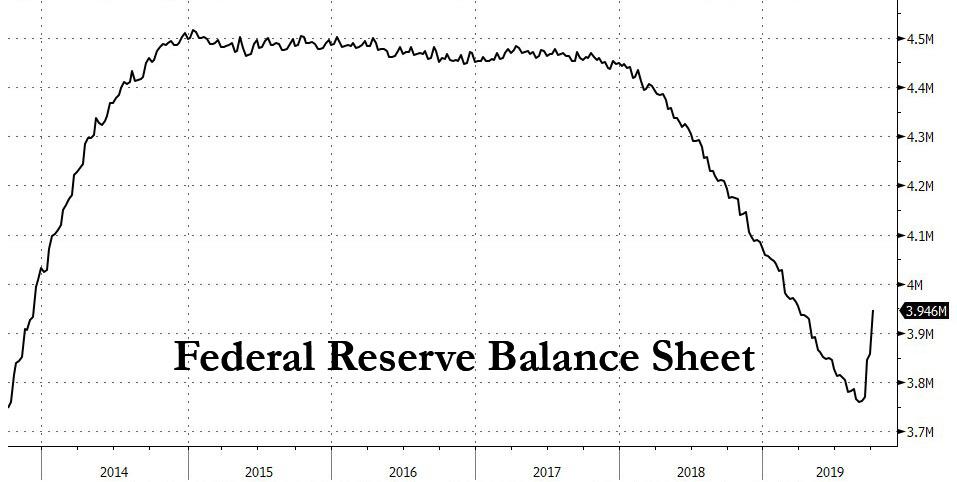
And so, as the Fed’s balance sheet exploded by over $400 billion in under four months, a rate of balance sheet expansion that surpassed QE1, QE2 and Qe3…

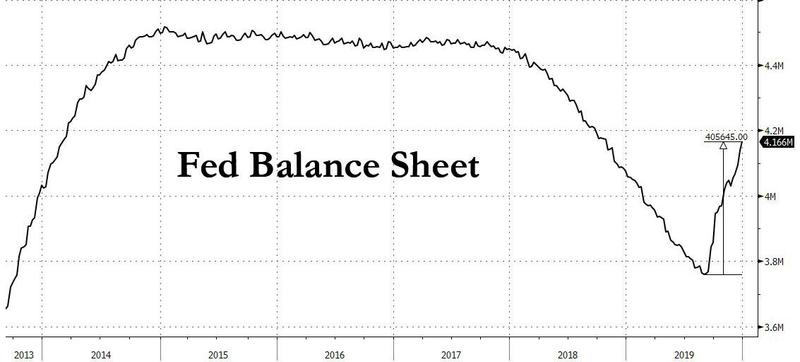
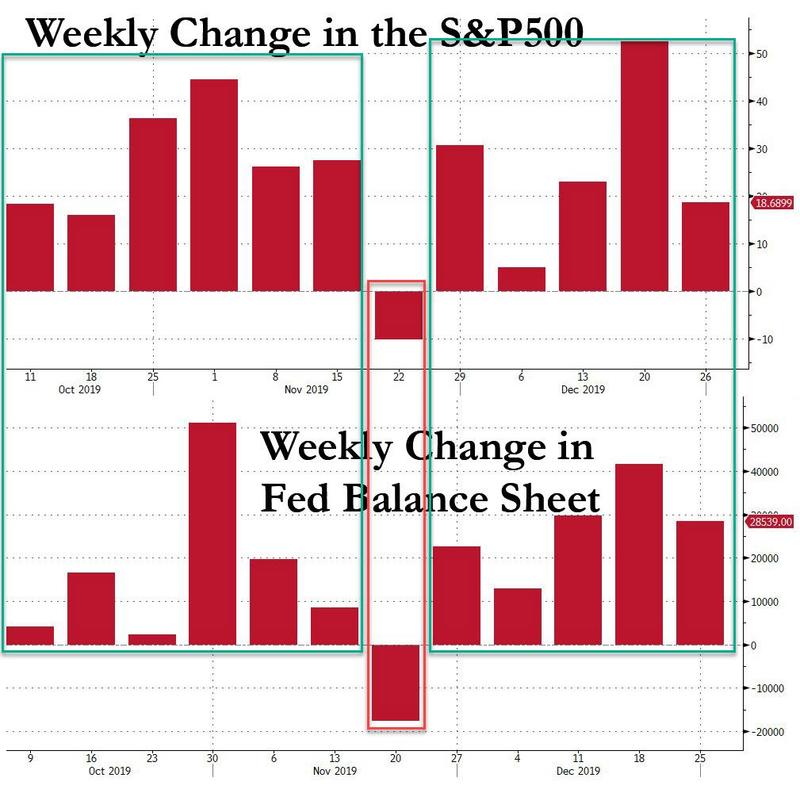
… stocks blasted off higher roughly at the same time as the Fed’s QE returned, and are now up every single week since the start of the Fed’s QE4 announcement when the Fed’s balance sheet rose, and are down just one week since then: the week when the Fed’s balance sheet shrank.

The result of this unprecedented correlation between the market’s response to the Fed’s actions – and the Fed’s growing balance sheet – has meant that it gradually became impossible to deny that what the Fed is doing is no longer QE. It started with Bank of America in mid-November (as described in “One Bank Finally Admits The Fed’s “NOT QE” Is Indeed QE… And Could Lead To Financial Collapse), and then after several other banks also joined in, and even Fed fanboy David Zervos admitted on CNBC that the Fed is indeed doing QE, the tipping point finally arrived, and it was no longer blasphemy (or tinfoil hat conspiracy theory) to call out the naked emperor, and overnight none other than Deutsche Bank joined the “truther” chorus, when in a report by the bank’s chief economist Torsten Slok, he writes what we pointed out several weeks back, namely that

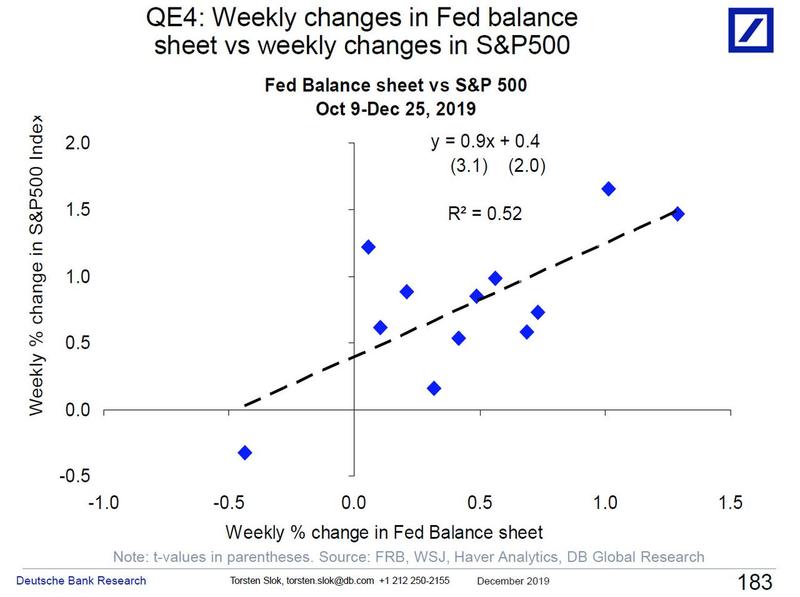
“since QE4 started in October, a 1% increase in the Fed balance sheet has been associated with a 1% increase in the S&P500, see chart below.” 

Not that DB has absolutely no qualms about calling what the Fed is doing QE4 for the simple reason that… it is QE4.

The chart in question, which is effectively the same as the one we created above, shows the weekly change in the Fed’s balance sheet and the S&P500 as a scatterplot, and concludes that all it takes to push the S&P higher by 1% is to grow the Fed’s balance sheet by 1%.

And just to underscore this point, the strategist points out that such a finding is “consistent with this new working paper, which finds that QE boosts stock markets even when controlling for improving macro fundamentals.” Which, of course, is hardly rocket science – after all when you inject hundreds of billions into the market in months, and this money can’t enter the economy, it will enter the market. The result: the S&P trading at an all time high in a year in which corporate profits actually decreased and the entire rise in the stock market was due to multiple expansion.

In short: the Kool Aid is flowing, the party is in full force and everyone has to dance, because the Fed will continue to perform QE4 at least until Q2 2020. Which reminds us of what we wrote last week, namely that another big bank, Morgan Stanley, has already seen through the current melt up phase, and predicts the “Melt-Up Lasting Until April, After Which Markets Will “Confront A World With No Fed Support“.”

Source: ZeroHedge

How QE Has Radically Changed The Nature Of The West’s Financial System


‘Because they are so ensconsed in their little bubble and because they profit so much from maintaining the status quo, Western mainstream media pundits don’t – or perhaps can’t – admit how Quantitative Easing policies have so quickly and so radically changed the financial system of the West and their satellites’

(Authored by Ramin Mazaheri via The Saker blog,) I imagine that most everyone reading this is already aware of what has transpired economically across the West over the last decade:

  • Elite-class asset (stuff rich people own – stocks, real estate, financial derivatives, luxury goods, etc.) prices have ballooned to pre-2008 levels.
  • Debt (which is, of course, another elite-owned asset), mainly to pay for banker bailouts and their usurious interest levels, has ballooned national accounts to incredible levels.
  • The “real” economy has only weakened, as proven by endemic low economic growth across the West and Japan.

Similarly, I imagine that everyone reading this is generally aware of what will happen should the West stop easy money: obviously, once artificial demand is no longer being fabricated then these assets will plummet in value, with huge ripple effects in the “real” economy. The West will be right back to dealing with most of the same toxic assets they had back in 2007, but now compounded by a decade of more debt, more interest payments, and a “real” economy which was made weaker via austerity.

None of that is really “news” to a smart reader… but it is “news” to many dumb journalists.

Continue reading

Global Debt & Liquidity Crisis Update: Fed Injects $134BN In Liquidity, Term Repo Oversubscribed Amid Month-End Liquidity Panic

‘The volume of billions being lent into existence from nothing by the Fed to bail banks out will go parabolic. It must, otherwise credit will freeze, asset prices will fall, forced bank depositor bail-ins will ensue’

With stocks threatening to close in the red, late on Wednesday the Fed sparked a furious last hour rally…

… when in a statement published at 1515ET, precisely when the S&P ramp started, the New York Fed confirmed it would dramatically increase both its overnight and term liquidity provisions beginning tomorrow through November 14th.

The Desk has released an update to the schedule of repurchase agreement (repo) operations for the current monthly period.  Consistent with the most recent FOMC directive, to ensure that the supply of reserves remains ample even during periods of sharp increases in non-reserve liabilities, and to mitigate the risk of money market pressures that could adversely affect policy implementation…

As we noted yesterday, that was a massive 60% increase in the overnight repo liquidity availability (from $75 billion to $120 billion) and a 28% jump in the term repo provision (from $35 billion to $45 billion).

“It’s just more evidence the Fed will not back off as year-end gets closer,” said Wells Fargo’s rates strategist, Mike Schumacher. “The Fed wants to take out more insurance. You had repo pick up last week. That might not have gone over too well.”

And now we know that there was good reason for that, because according to the latest, just concluded Term Repo operation, a whopping $62.15BN in securities were submitted to the Fed’s 14-day operation, ($47.55BN in TSYs, $14.6BN in MBS), resulting in a 1.38x oversubscribed term operation, the second consecutive oversubscription following Tuesday’s Term Repo, when $52.2BN in securities were submitted into the Fed’s then-$35BN operation.

This was the highest uptake of the Fed’s term repo operation since Sept 26.

But wait there’s more, because while the upsized term-repo saw the biggest (oversubscribed) uptake in one month, demand for the Fed’s overnight repo also soared, with dealers submitting 89.2BN in securities for the newly upsized, $120BN operation.

In total, between the $45BN term repo and the $89.2BN overnight repo, the Fed just injected a whopping $134.2BN in liquidity just to make sure the US banking system is stable. That, as the Fed’s balance sheet soared by $200BN in the past month rising to just shy of $4 trillion.

Meanwhile, funding tensions weren’t evident only in repo, but also in the Fed’s T-Bill POMO, where as we noted yesterday, demand for liquidity has also been increasing with every subsequent operation, peaking with yesterday’s operation.

Needless to say, if the funding shortage was getting better, none of this would be happening; instead it appears that with every passing day the liquidity shortage is getting worse, even as the Fed’s balance sheet is surging.

The only possible explanation, is someone really needed to lock in cash for month end (the maturity of the op is on Nov 7) which is when a “No Deal” Brexit may go live, and as a result one or more banks are bracing for the worst. The question, as before,  remains why: just what is the source of this unprecedented spike in liquidity needs in a system which already has $1.5 trillion in excess reserves? And while we await the answer, expect stocks to close pleasantly in the green as dealers transform their newly granted liquidity into bets on risk assets.

‘The powers that shouldn’t be would rather us experience a mad max world while they hide in luxury bunkers, than allow us a treasury issued gold backed currency, absent a central bank once again’

Source: ZeroHedge

Did Something Just Snap? US Policy Uncertainty Unexpectedly Soars Above Lehman, Sept 11 Levels

With US equity markets within one percent of all-time record highs, and US equity risk back near cycle lows, one could be forgiven for ‘believing’ that all is well in the world.

A China trade deal is imminent, right? A Brexit deal is imminent, right? Turkey ceasefire, right?

Well, according to The Baker, Bloom and Davis daily news-based Economic Policy Uncertainty Index (based on newspaper archives from Access World New’s NewsBank service), US economic policy uncertainty has never, ever been higher than it is currently…

All hands are on deck, like never before, to prevent a credit freeze…

Global Debt & Liquidity Crisis Update: Repo Locking Up Again As Overnight Fed Operation Oversubscribed, Repo Rate Jumps

‘The Fed is an outpost of a foreign power that controls our economy, most of our politics and our financial future. It’s an instrument of the Rothschild global cabal. It always has been since 1913’

First it was supposed to be just a mid-month tax payment issue coupled with an accelerated cash rebuild by the US Treasury. Then, it was supposed to be just quarter-end pressure. Then, once the Fed rolled out QE4 while keeping both its overnight and term repo operations, the mid-September repo rate fireworks which sent the overnight G/C repo rate as high as 10% was supposed to go away for good as Powell admitted the level of reserves was too low and the Fed launched a $60BN/month Bill POMO to boost the Fed’s balance sheet.

Bottom line: the ongoing repo market pressure – which indicated that one or more banks were severely liquidity constrained – was supposed to be a non-event.

Alas, as of this morning when the Fed’s latest repo operation was once again oversubscribed, it appears that the repo turmoil is not only not going away, but is in fact (to paraphrase Joe Biden) getting worse, because even with both term and overnight repos in play and with the market now expecting the Fed to start injecting copious liquidity tomorrow with the first Bill POMO, banks are still cash starved.

To wit: in its latest overnight operation, the Fed indicated that $80.35BN in collateral ($74.7BN in TSYs, $5.65BN in MBS) had been submitted into an operation that maxed out at $75BN, with a weighted average rate on both TSY and MBS rising to 1.823% and 1.828% respectively.

While it was clear that the repo market was tightening in the past week, with each incremental overnight repo operation rising, today was the first oversubscribed repo operation since September 25, and follows yesterday’s $67.6BN repo and $20.1BN term repo.

But the clearest sign that the repo market is freezing up again came from the overnight general collateral rate itself, which after posting in the 1.80%-1.90% range for much of the past two weeks, spiked as high as 2.275% overnight and was last seen at 2.15%, well above the fed funds upper range…

‘The powers that be would rather us experience a mad max world while they hide in luxury bunkers, than allow a treasury issued gold backed currency, absent a central bank once again’

Source: ZeroHedge

Fed Announces QE4 One Day After BIS Warns QE Has Broken The Market

Following Fed Chair Powell’s surprising announcement today that the Fed was resuming Permanent Open Market Operations after a 5 year hiatus, just as we said last month that it would (see “The Fed Will Restart QE In November: This Is How It Will Do It“)…

… there was a brief debate whether the Fed’s soon to be permanent expansion in its balance sheet is QE or not QE. The answer to this semantic debate simple: Powell defined Quantitative Tightening as removing reserves from the system. Thus, by that simple definition, adding reserves to the system on a permanent basis via permanent open market operations, i.e., bond purchases, is Quantitative Easing. Incidentally, the repo market fireworks were just a smokescreen: the real reason why the Fed is resuming QE is far simpler: the US has facing an avalanche of debt issuance and with China and Japan barely able to keep up, someone has to buy this debt. That someone: the Fed.

And just to shut up anyone who still wants to call the upcoming $400BN expansion in the Fed’s balance sheet, as represented in the following chart by Goldman…

… QE-Lite, here is JPMorgan comparing what is coming with what has been: at a $21BN in monthly 10Yr equivalent TSY purchases, the “upcoming” operation is the same size as QE1.

Yet semantic bullshit aside, what is most infuriating about Powell’s “shocking” announcement (which we previewed a few weeks ago) is that it took place just one day after the central banks’ central bank, the Bank of International Settlements, finally caught up with what we first said in 2009 – for economists being only 10 years behind the curve is actually not terrible – and wrote that “the unprecedented growth in central banks’ balance sheets since the financial crisis has had a negative impact on the way in which financial markets function.”

Ignoring the fact that central bank policies are responsible for such phenomena as Brexit and Trump, as it is the flawed monetary policy of the past decade that made the rich richer beyond their wildest dreams by expanding the biggest asset bubble in history, while destroying the middle class…

… it is disgusting that even as the Fed’s own supervisor admits that its balance sheet expanding policies have broken the market – something this “tinfoil” conspiracy blog has been saying since 2008 – the Fed is doing even more of the same, ensuring that the market will be more broken than ever!

So what was this startling epiphany? According to the BIS, while the immediate impact of this massive balance sheet expansion had eased the severe market strains created by the 2008 financial crisis, there had been several negative side-effects. These included a scarcity of bonds available for investors to purchase, squeezed liquidity in some markets, higher levels of bank reserves and fewer market operators actively trading in some areas.

In short: last month’s repo crisis is a direct consequence of central banks’ own actions. as Scott Skyrm explained earlier.

“Lower trading volumes and price volatility, compressed credit spreads and flatter term structures may reduce the attractiveness of investing and dealing in bond markets,” the BIS said in the Monday report. “Some players may leave the market altogether, resulting in a more concentrated and homogenous set of investors and fewer dealers.”

This “could result in market malfunctioning when large central bank balance sheets are eventually unwound”, the BIS warned, adding that “it could make it more difficult for reserves to be redistributed effectively between market participants.” Of course, the BIS was clearly joking because even five-year olds know balance sheets will never be unwound.

Additionally, the BIS went on to point out that negative impacts have been more prevalent when central banks hold a larger share of outstanding assets, as the FT reportedmajor central banks’ holdings of domestic sovereign bonds range from 20% of outstanding paper at the US Fed to over 40% in Japan.

But the BIS said these side-effects had so far only rarely affected financial conditions in such a way as to impede central banks’ monetary policymaking, though it added that the full consequences were unlikely to become clear until major central banks started to shrink their balance sheets.

Worse, the BIS noted that regulations demanding liquidity at large banks might discourage the banks from offering to lend out their reserves — a source of same-day liquidity — into overnight markets. This is similar to what the large banks themselves have said in the last month. But the BIS also noted that since the financial crisis, risk management practices might have changed within the banks themselves.

Sadly, the Fed – which is fully aware of all of this – decided to ignore everything the BIS warned about, and by launching more POMO/QE/”don’t call it QE”, just ensured that the next financial crisis will be the last one.

“So looks like the banks are being re-capitalized, (bailed out) and lower rates are coming, zero or negative.. well.. now the banks can borrow cash for zero, or less directly from the Fed., then shell out loans and credit cards at exorbitant rates to We The People… oh… you are not supposed to know this… (don’t share)…”

Source: ZeroHedge

Global Debt & Liquidity Crisis Update: NY Fed Announces Extension Of Overnight Repos Until Nov 4, Will Offer 8 More Term Repos

The Fed’s “temporary” liquidity injections are starting to look rather permanent…

Anyone who expected that the easing of the quarter-end funding squeeze in the repo market would mean the Fed would gradually fade its interventions in the repo market, was disappointed on Friday afternoon when the NY Fed announced it would extend the duration of overnight repo operations (with a total size of $75BN) for at least another month, while also offering no less than eight 2-week term repo operations until November 4, 2019, which confirms that the funding unlocked via term repo is no longer merely a part of the quarter-end arsenal but an integral part of the Fed’s overall “temporary” open market operations… which are starting to look quite permanent.

This is the statement published today by the NY Fed:

In accordance with the most recent Federal Open Market Committee (FOMC) directive, the Open Market Trading Desk (the Desk) at the Federal Reserve Bank of New York will conduct a series of overnight and term repurchase agreement (repo) operations to help maintain the federal funds rate within the target range.

Effective the week of October 7, the Desk will offer term repos through the end of October as indicated in the schedule below. The Desk will continue to offer daily overnight repos for an aggregate amount of at least $75 billion each through Monday, November 4, 2019.

Securities eligible as collateral include Treasury, agency debt, and agency mortgage-backed securities. Awarded amounts may be less than the amount offered, depending on the total quantity of eligible propositions submitted. Additional details about the operations will be released each afternoon for the following day’s operation(s) on the Repurchase Agreement Operational Details web page. The operation schedule and parameters are subject to change if market conditions warrant or should the FOMC alter its guidance to the Desk.  

What this means is that until such time as the Fed launches Permanent Open Market Operations – either at the November or December FOMC meeting, which according to JPMorgan will be roughly $37BN per month, or approximately the same size as QE1…

… the NY Fed will continue to inject liquidity via the now standard TOMOs: overnight and term repos. At that point, watch as the Fed’s balance sheet, which rose by $185BN in the past month, continues rising indefinitely as QE4 is quietly launched to no fanfare.

And remember: whatever you do, don’t call it QE4!

Trader Gregory Mannarino breaks it down… 

Source: ZeroHedge

The Fed Accelerates its QE Unwind

Mopping up liquidity.

The Fed’s QE Unwind – “balance sheet normalization,” as it calls this – is accelerating toward cruising speed. The first 12 months of the QE unwind, which started in October 2017, are the ramp-up period – just like there was the “Taper” during the final 12 months of QE. The plan calls for shedding up to $420 billion in securities in 2018 and up to $600 billion a year in each of the following years until the balance sheet is sufficiently “normalized” – or until something big breaks.

Treasuries

In July, the QE Unwind accelerated sharply. According to the plan, the Fed was supposed to shed up to $24 billion in Treasury Securities in July, up from $18 billion a month in the prior three months. And? The Fed released its weekly balance sheet Thursday afternoon. Over the four weeks ending August 1, the balance of Treasury securities fell by $23.5 billion to $2,337 billion, the lowest since April 16, 2014. Since the beginning of the QE-Unwind, the Fed has shed $129 billion in Treasuries.

https://wolfstreet.com/wp-content/uploads/2018/08/US-Fed-Balance-sheet-2018-08-02-Treasuries.png

The step-pattern in the chart above is a result of how the Fed sheds Treasury securities. It doesn’t sell them outright but allows them to “roll off” when they mature. Treasuries only mature mid-month or at the end of the month. Hence the stair-steps.

In mid-July, no Treasuries matured. But on July 31, $28.4 billion matured. The Fed replaced about $4 billion of them with new Treasury securities directly via its arrangement with the Treasury Department that cuts out Walls Street (its “primary dealers”) with which the Fed normally does business. Those $4 billion in securities, to use the jargon, were “rolled over.” But it did not replace about $24 billion of maturing Treasuries. They “rolled off.”

Mortgage-Backed Securities

Under QE, the Fed also bought mortgage-backed securities, which were issued and guaranteed by Fannie Mae, Freddie Mac, and Ginnie Mae. Holders of residential MBS receive principal payments as the underlying mortgages are paid down or are paid off. At maturity, the remaining principal is paid off.  So, to keep the MBS balance from declining on the Fed’s balance sheet after QE ended, the New York Fed’s Open Market Operations (OMO) kept buying MBS.

Settlement of those trades occurs two to three months later. Since the Fed books the trades at settlement, there’s a lag of two to three months between the date of the trade and when the trade appears on the Fed’s balance sheet [here’s my detailed explanation]. This is why it took a few months before the QE unwind in MBS showed up distinctively on the balance sheet.

The current changes of MBS on the balance sheet reflect trades from about two months ago. At the time, the cap for shedding MBS was $12 billion a month. And? Over the past four weeks, the balance of MBS fell by $11.8 billion, to $1,710 billion as of August 1, the lowest since October 8, 2014. In total, $61 billion in MBS have been shed since the beginning of the QE unwind:

https://wolfstreet.com/wp-content/uploads/2018/08/US-Fed-Balance-sheet-2018-08-02-MBS.png

Total Assets on the Balance Sheet

QE only involved Treasuries and MBS. And so the QE unwind only involves Treasuries and MBS. Since the beginning of the QE Unwind, Treasuries dropped by $129 billion and MBS by $61 billion, for a combined decline of $190 billion.

But the balance sheet of the Fed also reflects the Fed’s other functions and activities. And the decline in the overall balance sheet is not going to reflect exactly the amounts shed in Treasuries and MBS.

Total assets on the Fed’s balance sheet for the four weeks ending August 1 dropped by $34.1 billion. This brought the drop since October, when the QE unwind began, to $205 billion. At $4,256 billion, total assets are now at the lowest level since April 9, 2014, during the middle of the “taper.” It took the Fed about six years to pile on these securities, and now it’s going to take years to shed them:

https://wolfstreet.com/wp-content/uploads/2018/08/US-Fed-Balance-sheet-2018-08-02-overall.png

So the pace of the QE Unwind has accelerated in July, as planned. The Fed has not blinked during the sell-offs in the market, and it’s not going to. It is targeting “elevated” asset prices and financial conditions. Asset prices remain elevated and financial conditions remain ultra-loose. Markets have essentially brushed off the Fed so far. And that only acts as an encouragement for the Fed to proceed.

The FOMC, in its August 1 statement, mentioned “strong” five times in describing various aspects of the economy and the labor market – the most hawkish statement in a long time. Rate hikes will continue, and the pace might pick up. And the QE unwind will accelerate to final cruising speed and proceed as planned. The Fed stopped flip-flopping in the fall of 2016 and hasn’t looked back since.

When the economy eventually slows down enough to where the Fed feels like it needs to act, it will cut rates, but it will let the QE unwind proceed on automatic pilot toward “normalization,” whatever that will mean. That’s the stated plan. And the Fed will stick to it – unless something big breaks, such as credit freezing up again in the credit-dependent US economy, at which point all bets are off.

Source: by Wolf Richter | Wolf Street

Exploring The Death Spiral Of Financialization [video]

Each new policy destroys another level of prudent fiscal/financial discipline.

The primary driver of our economy–financialization–is in a death spiral. Financialization substitutes expansion of interest, leverage and speculation for real-world expansion of goods, services and wages.

Financial “wealth” created by leveraging more debt on a base of real-world collateral that doesn’t actually produce more goods and services flows to the top of the wealth-power pyramid, driving the soaring wealth-income inequality we see everywhere in the global economy.

As this phantom wealth pours into assets such as stocks, bonds and real estate, it has pushed the value of these assets into the stratosphere, out of reach of the bottom 95% whose incomes have stagnated for the past 16 years.

The core problem with financialization is that it requires ever more extreme policies to keep it going. These policies are mutually reinforcing, meaning that the total impact becomes geometric rather than linear. Put another way, the fragility and instability generated by each new policy extreme reinforces the negative consequences of previous policies.

These extremes don’t just pile up like bricks–they fuel a parabolic rise in systemic leverage, debt, speculation, fragility, distortion and instability.

This accretive, mutually reinforcing, geometric rise in systemic fragility that is the unavoidable output of financialization is poorly understood, not just by laypeople but by the financial punditry and professional economists.

Gordon Long and I cover the policy extremes which have locked our financial system into a death spiral in a new 50-minute presentation, The Road to Financialization. Each “fix” that boosts leverage and debt fuels a speculative boom that then fizzles when the distortions introduced by financialization destabilize the real economy’s credit-business cycle.

Each new policy destroys another level of prudent fiscal/financial discipline.

The discipline of sound money? Gone.

The discipline of limited leverage? Gone.

The discipline of prudent lending? Gone.

The discipline of mark-to-market discovery of the price of collateral? Gone.

The discipline of separating investment and commercial banking, i.e. Glass-Steagall? Gone.

The discipline of open-market interest rates? Gone.

The discipline of losses being absorbed by those who generated the loans? Gone.

And so on: every structural source of discipline has been eradicated, weakened or hollowed out. Financialization has consumed the nation’s seed corn, and the harvest of instability is ripening in the fields of finance and the real economy alike.

Source: ZeroHedge

Foreign Governments Dump US Treasuries as Never Before, But Who the Heck is Buying Them?

It started with a whimper a couple of years ago and has turned into a roar: foreign governments are dumping US Treasuries. The signs are coming from all sides. The data from the US Treasury Department points at it. The People’s Bank of China points at it in its data releases on its foreign exchange reserves. Japan too has started selling Treasuries, as have other governments and central banks.

Some, like China and Saudi Arabia, are unloading their foreign exchange reserves to counteract capital flight, prop up their own currencies, or defend a currency peg.

Others might sell US Treasuries because QE is over and yields are rising as the Fed has embarked on ending its eight years of zero-interest-rate policy with what looks like years of wild flip-flopping, while some of the Fed heads are talking out loud about unwinding QE and shedding some of the Treasuries on its balance sheet.

Inflation has picked up too, and Treasury yields have begun to rise, and when yields rise, bond prices fall, and so unloading US Treasuries at what might be seen as the peak may just be an investment decision by some official institutions.

The chart below from Goldman Sachs, via Christine Hughes at Otterwood Capital, shows the net transactions of US Treasury bonds and notes in billions of dollars by foreign official institutions (central banks, government funds, and the like) on a 12-month moving average. Note how it started with a whimper, bounced back a little, before turning into wholesale dumping, hitting record after record (red marks added):

https://i0.wp.com/wolfstreet.com/wp-content/uploads/2017/02/US-Treasuries-net-foreign-transactions.png

The People’s Bank of China reported two days ago that foreign exchange reserves fell by another $12.3 billion in January, to $2.998 trillion, the seventh month in a row of declines, and the lowest in six years. They’re down 25%, or almost exactly $1 trillion, from their peak in June 2014 of nearly $4 trillion (via Trading Economics, red line added):

https://i0.wp.com/wolfstreet.com/wp-content/uploads/2017/02/China-Foreign-exchange-reserves-2017-01.png

China’s foreign exchange reserves are composed of assets that are denominated in different currencies, but China does not provide details. So of the $1 trillion in reserves that it shed since 2014, not all were denominated in dollars.

The US Treasury Department provides another partial view, based on data collected primarily from US-based custodians and broker-dealers that are holding these securities for China and other countries. But the US Treasury cannot determine which country owns the Treasuries held in custodial accounts overseas. Based on this limited data, China’s holdings of US Treasuries have plunged by $215.2 billion, or 17%, over the most recent 12 reporting months through November, to just above $1 trillion.

So who is buying all these Treasuries when the formerly largest buyers – the Fed, China, and Japan – have stepped away, and when in fact China, Japan, and other countries have become net sellers, and when the Fed is thinking out loud about shedding some of the Treasuries on its balance sheet, just as nearly $900 billion in net new supply (to fund the US government) flooded the market over the past 12 months?

Turns out, there are plenty of buyers among US investors who may be worried about what might happen to some of the other hyper-inflated asset classes.

And for long suffering NIRP refugees in Europe, there’s a special math behind buying Treasuries. They’re yielding substantially more than, for example, French government bonds, with the US Treasury 10-year yield at 2.4%, and the French 10-year yield at 1.0%, as the ECB under its QE program is currently the relentless bid, buying no matter what, especially if no one else wants this paper. So on the face of it, buying US Treasuries would be a no-brainer.

But the math got a lot more one-sided in recent days as French government bonds now face a new risk, even if faint, of being re-denominated from euros into new French francs, against the will of bondholders, an act of brazen default, and these francs would subsequently get watered down, as per the euro-exit election platform of Marine Le Pen. However distant that possibility, the mere prospect of it, or the prospect of what might happen in Italy, is sending plenty of investors to feed on the richer yields sprouting in less chaos, for the moment at least, across the Atlantic.

By Wolf Richter | Wolf Street

Why US Stock And Bond Markets Are High

We’ve been saying for quite some time now that the US equity market’s seemingly inexorable (until this week) tendency to rise to new highs in the absence of the Fed’s guiding hand is almost certainly in large part attributable to the fact that in a world where you are literally guaranteed to lose money if you invest in safe haven assets such as negative-yielding German bunds, corporations can and will take advantage of the situation by issuing debt and using the proceeds to buy back stock, thus underwriting the rally in US equities. Here’s what we said after stocks turned in their best month in three years in February:

It also explains why, in the absence of the Fed, stocks continue to rise as if QE was still taking place: simply said, bondholders – starved for any yield in an increasingly NIRP world – have taken the place of the Federal Reserve, and are willing to throw any money at companies who promise even the tiniest of returns over Treasuries, oblivious if all the proceeds will be used immediately to buyback stock, thus pushing equity prices even higher, but benefiting not only shareholders but management teams who equity-linked compensation has likewise never been higher.

If you need further proof that this is precisely what is going on in US markets, consider the following from Citi: 

Companies are rapidly re-leveraging…

…and the proceeds sure aren’t being invested in future productivity, but rather in buy backs and dividends…
https://i0.wp.com/www.zerohedge.com/sites/default/files/images/user92183/imageroot/2015/03/Leverage2.jpg
…and Citi says all that debt issued by struggling oil producers may prove dangerous given that “default risk in the energy space has jumped [and considering] the energy sector now accounts for 18% of the market”…
…and ratings agencies are behind the curve…
https://i0.wp.com/www.zerohedge.com/sites/default/files/images/user92183/imageroot/2015/03/Leverage4.jpg
We’ll leave you with the following:

To be sure, this theater of financial engineering – because stocks are not going up on any resemblance of fundamental reasons but simply due to expanding balance sheet leverage – will continue only until it can no longer continue.

Read more at Zero Hedge

Long-Term Interest Rates Are Down This Year – Why?

By Gary Halbert

Back in December when the Fed started its “tapering” operation, with the goal of terminating it by the end of 2014, it was only natural to assume that the Fed’s retreat would result in higher yields this year, especially on long-maturity Treasuries and mortgage-backed securities (MBS).

After all, the Fed has been the largest buyer of Treasuries and MBS in the history of the world since it began its “quantitative easing” (QE) program in late 2008. At that time, the Fed had apprx. $750 billion worth of Treasuries and MBS on its balance sheet. Today, that number is north of $4 trillion! Of this amount, over half ($2.4 trillion) is in long-dated Treasuries. QE has been the largest central bank asset purchase program ever recorded by far.

By late 2012, the Fed’s purchases of long-dated Treasuries and MBS climbed to a staggering $85 billion per month – just over $1 trillionadded in 2013 alone. The Fed has been reducing these monthly asset purchases by $10 billion at each policy meeting since last December. Following the last policy meeting on June 17-18, the Fed’s QE purchases are now down to $35 billion per month. The plan is that these purchases will wind-down to zero before the end of this year.

Virtually every forecaster I read predicted that the Fed’s withdrawal from QE would result in higher interest rates for long-dated Treasuries and mortgage rates. Yet to the surprise of just about everyone, longer-term Treasury yields have plunged this year.

Fig2

The Problem: A Shortage of Long-Dated Bonds

One reason that Treasury yields have fallen significantly this year is that there is a shortage of long-dated Treasuries. The Fed is partly to blame. Through its massive QE purchases of Treasuries and MBS, the Fed now owns about 20% of all Treasuries, or $2.4 trillion. Banks, on the other hand, hold only $547 billion of tradable Treasuries and government agency-related debt.

In addition, the Fed’s holdings have shifted in ways that leave fewer central-bank-owned Treasuries available to be borrowed. This shift was caused by “Operation Twist” during the November 2011 to December 2012 period when the Fed sold shorter-dated Treasuries and bought more longer-dated bonds, which reduced the available pool of long bonds even more.

Adding to the problem, major US banks have also increased their purchases of Treasury debt, in part due to the Dodd-Frank law that was supposedly designed to limit risk taking by large US banks. Demand for Treasuries from large pension funds and foreign investors has also increased this year. Also, some of the outsized gains from the stock market last year have made their way into Treasuries.

Finally, the government itself has been selling fewer Treasuries in recent years as the federal budget deficits have fallen significantly. During the Great Recession, budget deficits ran over $1 trillion a year. The budget deficit for FY2012 was $1.1 trillion. However, in FY2013 the deficit fell sharply to $680 billion, down 37%.

For FY2014, the Congressional Budget Office estimates that the deficit will fall even further to $492 billion, and many believe it will be closer to $400 billion, as the economy shows more signs of strength. For FY2015, the deficit is expected to be $462 billion or less.

The point is, with budget deficits less than half of the $1 trillion or so that they were in President Obama’s first term, the government is selling less than half the amount of Treasuries it was just a few years ago. This, too, adds to the shortage of Treasuries.

The bottom line: When Treasuries are in short supply and demand is strong
as it has been this year, buyers bid up the prices of these securities. When
bond prices go up, yields fall.

This helps explain why interest rates have come down this year at a time when almost everyone expected them to rise. It also explains why the Fed would like investors to sell their bonds to help alleviate the shortage. Of course, Fed Chair Janet Yellen would never say that!

It remains to be seen if this trend of lower interest rates will continue as the economy gathers momentum. While I didn’t mention it above, no one expected the economy to tank 2.9% in the 1Q and this, too, helped bring interest rates down more than expected.

As you can see in the chart above, the 30-year T-bond yield bottomed in late May at 3.30% and has been rising since then. If the first estimate of 2Q GDP comes in above 3% on July 30, I would expect that we’ve seen the bottom in long rates for this cycle.

Update: for a deeper look at this issue, click here for an Zero Hedge article on this topic.