
Mopping up liquidity.
The Fed’s QE Unwind – “balance sheet normalization,” as it calls this – is accelerating toward cruising speed. The first 12 months of the QE unwind, which started in October 2017, are the ramp-up period – just like there was the “Taper” during the final 12 months of QE. The plan calls for shedding up to $420 billion in securities in 2018 and up to $600 billion a year in each of the following years until the balance sheet is sufficiently “normalized” – or until something big breaks.
Treasuries
In July, the QE Unwind accelerated sharply. According to the plan, the Fed was supposed to shed up to $24 billion in Treasury Securities in July, up from $18 billion a month in the prior three months. And? The Fed released its weekly balance sheet Thursday afternoon. Over the four weeks ending August 1, the balance of Treasury securities fell by $23.5 billion to $2,337 billion, the lowest since April 16, 2014. Since the beginning of the QE-Unwind, the Fed has shed $129 billion in Treasuries.
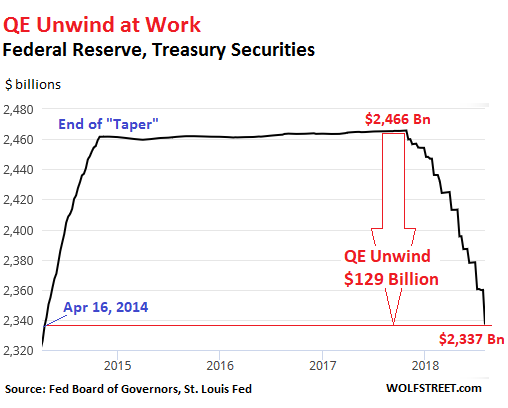
The step-pattern in the chart above is a result of how the Fed sheds Treasury securities. It doesn’t sell them outright but allows them to “roll off” when they mature. Treasuries only mature mid-month or at the end of the month. Hence the stair-steps.
In mid-July, no Treasuries matured. But on July 31, $28.4 billion matured. The Fed replaced about $4 billion of them with new Treasury securities directly via its arrangement with the Treasury Department that cuts out Walls Street (its “primary dealers”) with which the Fed normally does business. Those $4 billion in securities, to use the jargon, were “rolled over.” But it did not replace about $24 billion of maturing Treasuries. They “rolled off.”
Mortgage-Backed Securities
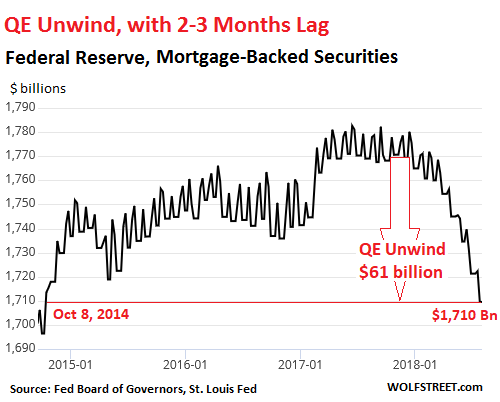
Under QE, the Fed also bought mortgage-backed securities, which were issued and guaranteed by Fannie Mae, Freddie Mac, and Ginnie Mae. Holders of residential MBS receive principal payments as the underlying mortgages are paid down or are paid off. At maturity, the remaining principal is paid off. So, to keep the MBS balance from declining on the Fed’s balance sheet after QE ended, the New York Fed’s Open Market Operations (OMO) kept buying MBS.
Settlement of those trades occurs two to three months later. Since the Fed books the trades at settlement, there’s a lag of two to three months between the date of the trade and when the trade appears on the Fed’s balance sheet [here’s my detailed explanation]. This is why it took a few months before the QE unwind in MBS showed up distinctively on the balance sheet.
The current changes of MBS on the balance sheet reflect trades from about two months ago. At the time, the cap for shedding MBS was $12 billion a month. And? Over the past four weeks, the balance of MBS fell by $11.8 billion, to $1,710 billion as of August 1, the lowest since October 8, 2014. In total, $61 billion in MBS have been shed since the beginning of the QE unwind:
Total Assets on the Balance Sheet
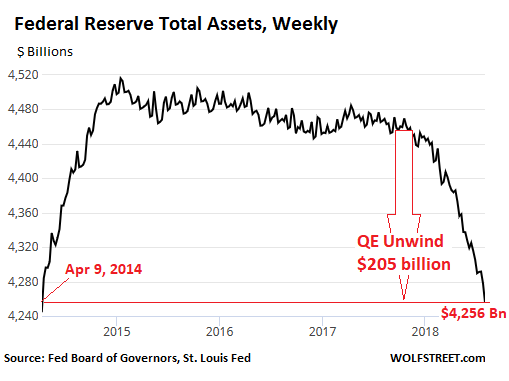
QE only involved Treasuries and MBS. And so the QE unwind only involves Treasuries and MBS. Since the beginning of the QE Unwind, Treasuries dropped by $129 billion and MBS by $61 billion, for a combined decline of $190 billion.
But the balance sheet of the Fed also reflects the Fed’s other functions and activities. And the decline in the overall balance sheet is not going to reflect exactly the amounts shed in Treasuries and MBS.
Total assets on the Fed’s balance sheet for the four weeks ending August 1 dropped by $34.1 billion. This brought the drop since October, when the QE unwind began, to $205 billion. At $4,256 billion, total assets are now at the lowest level since April 9, 2014, during the middle of the “taper.” It took the Fed about six years to pile on these securities, and now it’s going to take years to shed them:
So the pace of the QE Unwind has accelerated in July, as planned. The Fed has not blinked during the sell-offs in the market, and it’s not going to. It is targeting “elevated” asset prices and financial conditions. Asset prices remain elevated and financial conditions remain ultra-loose. Markets have essentially brushed off the Fed so far. And that only acts as an encouragement for the Fed to proceed.
The FOMC, in its August 1 statement, mentioned “strong” five times in describing various aspects of the economy and the labor market – the most hawkish statement in a long time. Rate hikes will continue, and the pace might pick up. And the QE unwind will accelerate to final cruising speed and proceed as planned. The Fed stopped flip-flopping in the fall of 2016 and hasn’t looked back since.
When the economy eventually slows down enough to where the Fed feels like it needs to act, it will cut rates, but it will let the QE unwind proceed on automatic pilot toward “normalization,” whatever that will mean. That’s the stated plan. And the Fed will stick to it – unless something big breaks, such as credit freezing up again in the credit-dependent US economy, at which point all bets are off.


