Following an epic stock rout to start the year, one which has wiped out trillions in market capitalization, it has rapidly become a consensus view (even by staunch Fed supporters such as the Nikkei Times) that the Fed committed a gross policy mistake by hiking rates on December 16, so much so that this week none other than former Fed president Kocherlakota openly mocked the Fed’s credibility when he pointed out the near record plunge in forward break evens suggesting the market has called the Fed’s bluff on rising inflation.
All of this happened before JPM cut its Q4 GDP estimate from 1.0% to 0.1% in the quarter in which Yellen hiked.
To be sure, the dramatic reaction and outcome following the Fed’s “error” rate hike was predicted on this website on many occasions, most recently two weeks prior to the rate hike in “This Is What Happened The Last Time The Fed Hiked While The U.S. Was In Recession” when we demonstrated what would happen once the Fed unleashed the “Ghost of 1937.”
As we pointed out in early December, conveniently we have a great historical primer of what happened the last time the Fed hiked at a time when it misread the US economy, which was also at or below stall speed, and the Fed incorrectly assumed it was growing.
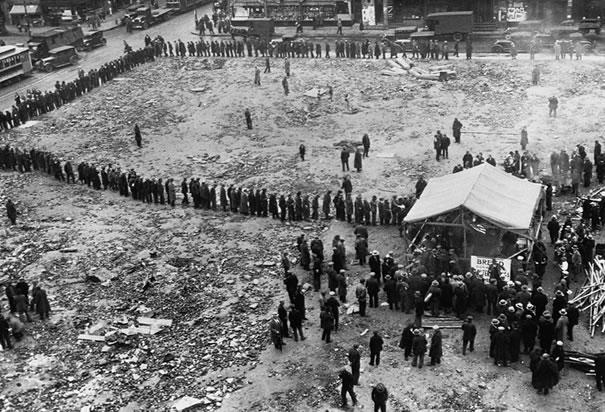
We are talking of course, about the infamous RRR-hike of 1936-1937, which took place smack in the middle of the Great Recession.

Here is what happened then, as we described previously in June.
[No episode is more comparable to what is about to happen] than what happened in the US in 1937, smack in the middle of the Great Depression. This is the only time in US history which is analogous to what the Fed will attempt to do, and not only because short rates collapsed to zero between 1929-36 but because the Fed’s balance sheet jumped from 5% to 20% of GDP to offset the Great Depression.
Just like now.
Follows a detailed narrative of precisely what happened from a recent Bridgewater note:
The first tightening in August 1936 did not hurt stock prices or the economy, as is typical.
The tightening of monetary policy was intensified by currency devaluations by France and Switzerland, which chose not to move in lock-step with the US tightening. The demand for dollars increased. By late 1936, the President and other policy makers became increasingly concerned by gold inflows (which allowed faster money and credit growth).
The economy remained strong going into early 1937. The stock market was still rising, industrial production remained strong, and inflation had ticked up to around 5%. The second tightening came in March of 1937 and the third one came in May. While neither the Fed nor the Treasury anticipated that the increase in required reserves combined with the sterilization program would push rates higher, the tighter money and reduced liquidity led to a sell-off in bonds, a rise in the short rate, and a sell-off in stocks. Following the second increase in reserves in March 1937, both the short-term rate and the bond yield spiked.
Stocks also fell that month nearly 10%. They bottomed a year later, in March of 1938, declining more than 50%!
Or, as Bank of America summarizes it: “The Fed exit strategy completely failed as the money supply immediately contracted; Fed tightening in H1’37 was followed in H2’37 by a severe recession and a 49% collapse in the Dow Jones.”
* * *
As it turns out, however, the Fed did not even have to read this blog, or Bank of America, or even Bridgewater, to know the result of its rate hike. All it had to do was to read… the Fed.
But first, as J Pierpont Morgan reminds us, it was Charles Kindleberger’s “The World in Depression” which summarized succinctly just how 2015/2016 is a carbon copy of the 1936/1937 period. In explaining how and why both the markets and the economy imploded so spectacularly after the Fed’s decision to tighten in 1936, Kindleberger says:
“For a considerable time there was no understanding of what had happened. Then it became clear. The spurt in activity from October 1936 had been dominated by inventory accumulation. This was especially the case in automobiles, where, because of fears of strikes, supplies of new cars had been built up. It was the same in steel and textiles – two other industries with strong CIO unions.”
If all off this sounds oddly familiar, here’s the reason why: as we showed just last week, while inventories remain at record levels, wholesale sales are crashing, and the result is that the nominal spread between inventories and sales is all time high.

The inventory liquidation cycle was previewed all the way back in June in “The Coming US Recession Charted” long before it became “conventional wisdom.”
Kindleberger continues:
When it became evident after the spring of of 1937 that commodity prices were not going to continue upward, the basis for the inventory accumulation was undermined, and first in textiles, then in steel, the reverse process took place.
Oil anyone?
And then this: “The steepest economic descent in the history of the United States, which lost half the ground gained for many indexes since 1932, proved that the economic recovery in the United States had been built on an illusion.“
Which, of course, is what we have been saying since day 1, and which even such finance legends as Bill Gross now openly admit when they say that the zero-percent interest rates and quantitative easing created leverage that fueled a wealth effect and propped up markets in a way that now seems unsustainable, adding that “the wealth effect is created by leverage based on QE’s and 0% rates.“
And not just Bill Gross. The Fed itself.
Yes, it was the Fed itself who, in its Federal Reserve Bulletin from June 1938 as transcribed in the 8th Annual General Meeting of the Bank of International Settlements, uttered the following prophetic words:
The events of 1929 taught us that the absence of any rise in prices did not prove that no crisis was pending. 1937 has taught us that an abundant supply of gold and a cheap money policy do not prevent prices from falling.
If only the Fed had listened to, well, the Fed.
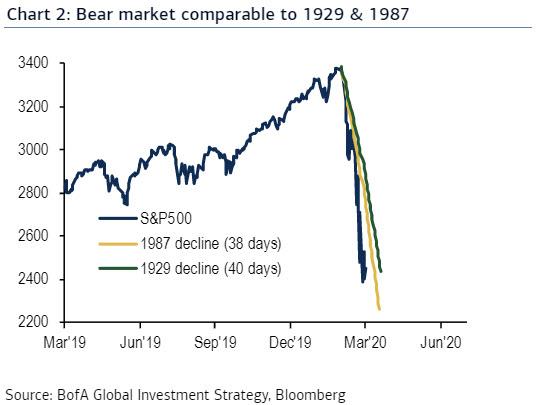
What happened next? The chart below shows the stock market reaction in 1937 to the Fed’s attempt to tighten smack in the middle pf the Great Depression.

If the Fed was right, the far more prophetic 1937 Fed that is not the current wealth effect-pandering iteration, then the market is about to see half its value wiped out.

Fear porn or another opportunity to BTFD? Source: ZeroHedge