

by Wolf Richter • February 26, 2015
China has long frustrated the hard-landing watchers – or any-landing watchers, for that matter – who’ve diligently put two and two together and rationally expected to be right. They see the supply glut in housing, after years of malinvestment. They see that unoccupied homes are considered a highly leveraged investment that speculators own like others own stocks, whose prices soar forever, as if by state mandate, but that regular people can’t afford to live in.
Hard-landing watchers know this can’t go on forever. Given that housing adds 15% to China’s GDP, when this housing bubble pops, the hard-landing watchers will finally be right.
Home-price inflation in China peaked 13 months ago. Since then, it has been a tough slog.
Earlier this month, the housing news from China’s National Bureau of Statistics gave observers the willies once again. New home prices in January had dropped in 69 of 70 cities by an average of 5.1% from prior year, the largest drop in the new data series going back to 2011, and beating the prior record, December’s year-over-year decline of 4.3%. It was the fifth month in a row of annual home price declines, and the ninth month in a row of monthly declines, the longest series on record.
Even in prime cities like Beijing and Shanghai, home prices dropped at an accelerating rate from December, 3.2% and 4.2% respectively.
For second-hand residential buildings, house prices fell in 67 of 70 cities over the past 12 months, topped by Mudanjiang, where they plunged nearly 14%.
True to form, the stimulus machinery has been cranked up, with the People’s Bank of China cutting reserve requirements for major banks in January, after cutting its interest rate in November. A sign that it thinks the situation is getting urgent.
So how bad is this housing bust – if this is what it turns out to be – compared to the housing bust in the US that was one of the triggers in the Global Financial Crisis?
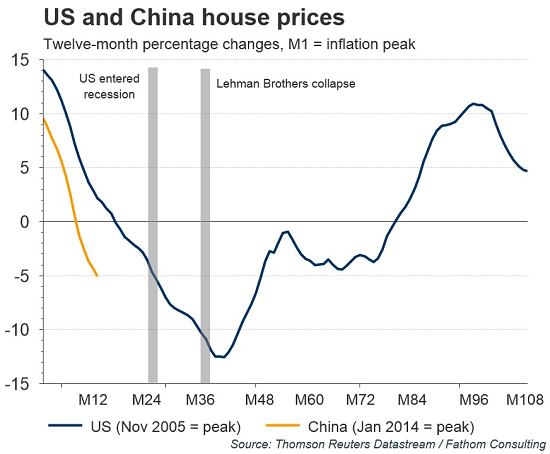
Thomson Reuters overlaid the home price changes of the US housing bust with those of the Chinese housing bust, and found this:
The US entered recession around two years after house price inflation had peaked. After nine months of recession, Lehman Brothers collapsed. As our chart illustrates, house price inflation in China has slowed from its peak in January 2014 at least as rapidly as it did in the US.
Note the crashing orange line on the left: year-over-year home-price changes in China, out-crashing (declining at a steeper rate than) the home-price changes in the US at the time….
The hard-landing watchers are now wondering whether the Chinese stimulus machinery can actually accomplish anything at all, given that a tsunami of global stimulus – from negative interest rates to big bouts of QE – is already sloshing through the globalized system. And look what it is accomplishing: Stocks and bonds are soaring, commodities – a demand gauge – are crashing, and real economies are languishing.
Besides, they argue, propping up the value of unoccupied and often unfinished investment properties that most Chinese can’t even afford to live in might look good on paper, but it won’t solve the problem. And building even more of these units props up GDP nicely in the short term, and therefore it’s still being done on a massive scale, but it just makes the supply glut worse.
Sooner or later, the hard-landing watchers expect to be right. They know how to add two and two together. And they’re already smelling the sweet scent of being right this time, which, alas, they have smelled many times before.
But it does make you wonder what the China housing crash might trigger when it blooms into full maturity, considering the US housing crash helped trigger of the Global Financial Crisis. It might be a hard landing for more than just China. And ironically, it might occur during, despite, or because of the greatest stimulus wave the world has ever seen.
Stocks, of course, have been oblivious to all this and have been on a tear, not only in China, but just about everywhere except Greece. But what happens to highly valued stock markets when they collide with a recession? They crash.
What to Expect When This Stock Market Meets a Recession
by Doug Short • February 25, 2015
Last week I had a fascinating conversation with Neile Wolfe, of Wells Fargo Advisors, LLC., about high equity valuations and what happens when they collide with a recession.
Here is my monthly update that shows the average of the four valuation indicators: Robert Shiller’s cyclically adjusted price-to-earnings ratio (CAPE), Ed Easterling’s Crestmont P/E, James Tobin’s Q Ratio, and my own monthly regression analysis of the S&P 500:

Based on the underlying data in the chart above, Neile made some cogent observations about the historical relationships between equity valuations, recessions and market prices:
- High valuations lead to large stock market declines during recessions.
- During secular bull markets, modest overvaluation does not produce large stock market declines.
- During secular bear markets, modest overvaluation still produces large stock market declines.
Here is a table that highlights some of the key points. The rows are sorted by the valuation column.

Beginning with the market peak before the epic Crash of 1929, there have been fourteen recessions as defined by the National Bureau of Economic Research (NBER). The table above l ists the recessions, the recession lengths, the valuation (as documented in the chart illustration above), the peak-to-trough changes in market price and GDP. The market price is based on the S&P Composite, an academic splicing of the S&P 500, which dates from 1957 and the S&P 90 for the earlier years (more on that splice here).
I’ve included a row for our current valuation, through the end of January, to assist us in making an assessment of potential risk of a near-term recession. The valuation that preceded the Tech Bubble tops the list and was associated with a 49.1% decline in the S&P 500. The largest decline, of course, was associated with the 43-month recession that began in 1929.
Note: Our current market valuation puts us between the two.
Here’s an interesting calculation not included in the table: Of the nine market declines associated with recessions that started with valuations above the mean, the average decline was -42.8%. Of the four declines that began with valuations below the mean, the average was -19.9% (and that doesn’t factor in the 1945 outlier recession associated with a market gain).
What are the Implications of Overvaluation for Portfolio Management?
Neile and I discussed his thoughts on the data in this table with respect to portfolio management. I came away with some key implications:
- The S&P 500 is likely to decline severely during the next recession, and future index returns over the next 7 to 10 years are likely to be low.
- Given this scenario, over the next 7 to 10 years a buy and hold strategy may not meet the return assumptions that many investors have for their portfolio.
- Asset allocation in general and tactical asset allocation specifically are going to be THE important determinant of portfolio return during this time frame. Just buying and holding the S&P 500 is likely be disappointing.
- Some market commentators argue that high long-term valuations (e.g., Shiller’s CAPE) no longer matter because accounting standards have changed and the stock market is still going up. However, the impact of elevated valuations — when it really matters — is expressed when the business cycle peaks and the next recession rolls around. Elevated valuations do not take a toll on portfolios so long as the economy is in expansion.
How Long Can Periods of Overvaluations Last?
Equity markets can stay at lofty valuation levels for a very long time. Consider the chart posted above. There are 1369 months in the series with only 58 months of valuations more than two Standard Deviations (STD) above the mean. They are:
- September 1929 (i.e., only one month above 2 STDs prior to the Crash of 1929)
- Fifty-one months during the Tech bubble (that’s over FOUR YEARS)
- Six of the last seven months have been above 2 STDs
Stay tuned.
