
After unexpectedly plunging in February (exaggerated by weather conditions), analysts expected existing home sales to continue to slide in March as affordability (inventories and rates) squeeze the marginal panic-buyer at record high prices. And just as we warned earlier, existing home sales were worse than expected, tumbling 3.7% MoM (for the second straight month)…
Tag Archives: Existing Home Sales
Existing Home Sales Fell Sharply In February, As Supply Dropped By The Largest Amount On Record
(Diana Olick) Closed sales of existing homes in February dropped a larger-than-expected 6.6% compared with January, according to the National Association of Realtors.
That put them at a seasonally adjusted, annualized rate of 6.22 million units, which was 9.1% higher compared with February 2020.
Despite being on the cusp of the historically busy spring housing market, homeowners are not listing their properties for sale at the pace they normally would this time of year. The supply of homes for sale fell 29.5% year over year, the largest annual decline ever, to 1.03 million homes.
How We Got Surging Home Prices
Terminal (Money) Velocity? The Missing Existing Home Sales Inventory And Collapsing Money Velocity
(Anthony B. Sanders) Have you ever wondered why the inventory of existing home sales have crashed since the housing bubble of the early/mid 2000s?

If I overlay the median price of existing home sales with low inventory and low money velocity, we get surging prices.

Poor Kristy Swanson.

Source: by Anthony B. Sanders | Confounded Interest
***
New Home Sales Tumble In September As Average Price Hits Record High
U.S. new home sales drop; record low mortgage rates underpinning demand
U.S. Existing Home Sales Soar To Highest Since 2006
Existing home sales soared 9.4% MoM in September, almost double the +5.0% expectation.
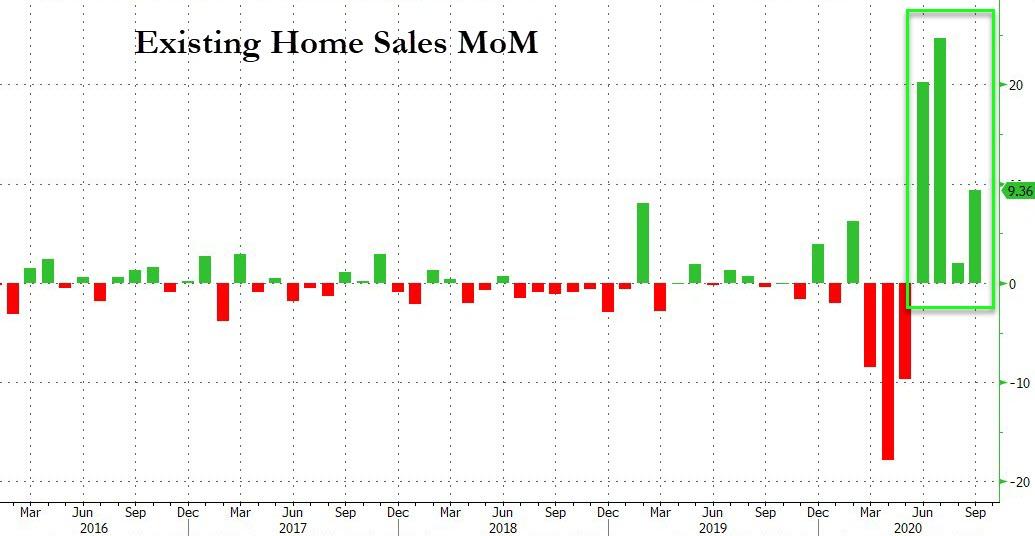
This is the highest level of sales since May 2006…

Now that’s a ‘V’…
Median home prices soared 14.8% from last year to $311,800 amid a tumble in inventory to just 2.7 months supply.
US Existing Home Sales Jump To Highest Since 2006 As Million-Dollar-Plus Sales Explode
While the rebound in existing home sales is expected to slow (from the massive beat: +24.7% MoM surge in July), analysts still expected SAAR to extend its gains to the highest since 2006… and it did.
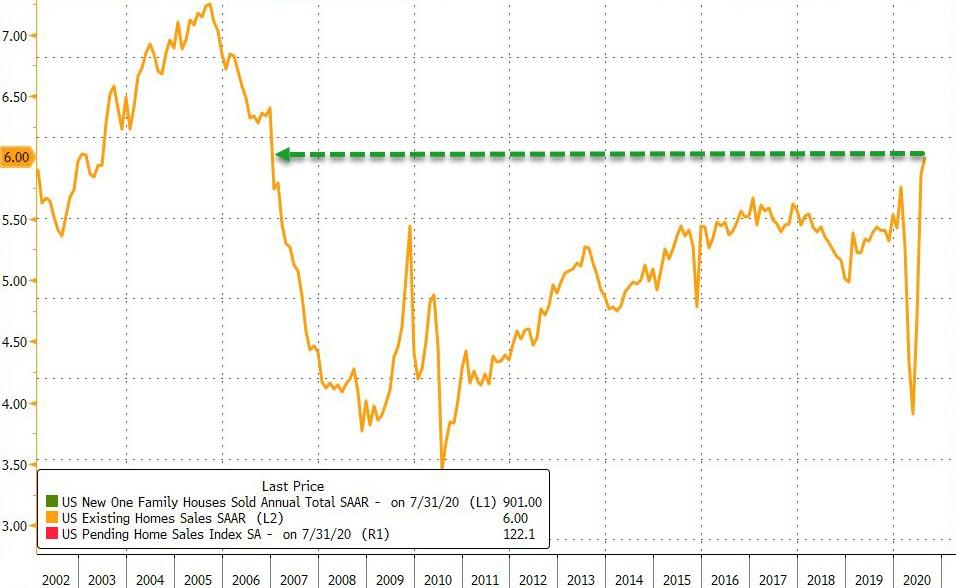
As expected, Existing Home Sales rose 2.4% MoM in August to 6.00mm SAAR – the highest since Dec 2006

Existing Home Sales Soar By Record To Highest In 14 Years; Median Price Breaches $300K For First Time Ever
As ZeroHedge noted earlier, existing home sales are expected to surge in July (the latest data), playing catch up to the huge rebound in new- and pending-home sales in June.
After a 20.7% MoM surge in June, July’s existing home sales were up a stunning 24.7% MoM (crushing expectations of a 14.6% MoM) and sending home sales up 8.72% YoY.
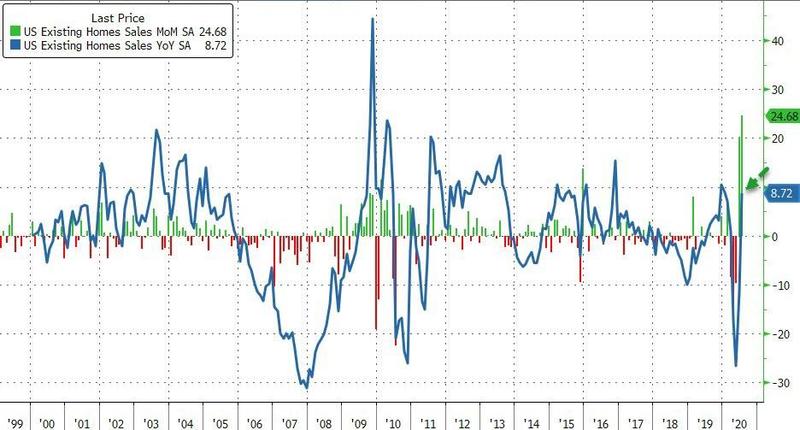
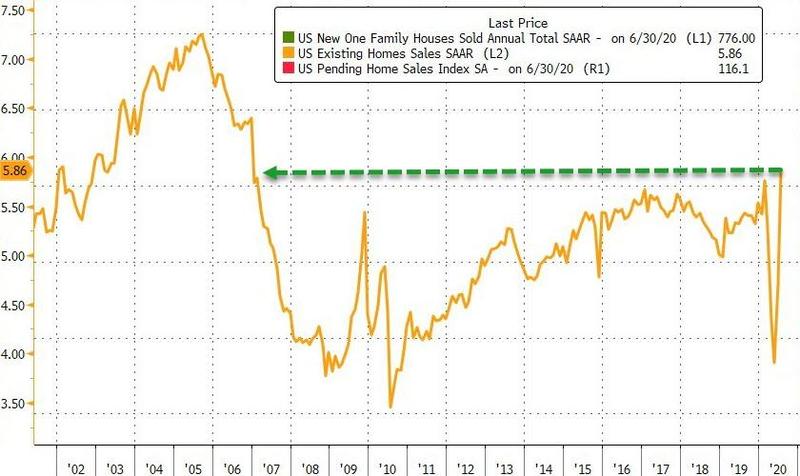
The SAAR rose from 4.70mm to 5.86mm in July, the highest since Dec 2006…
“The housing market is well past the recovery phase and is now booming with higher home sales compared to the pre-pandemic days,” said Lawrence Yun, NAR’s chief economist.
“With the sizable shift in remote work, current homeowners are looking for larger homes and this will lead to a secondary level of demand even into 2021.”
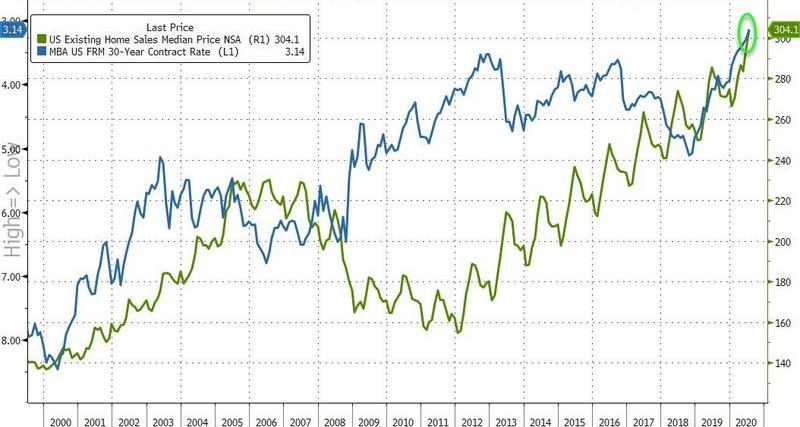
The median existing-home price for all housing types in July was $304,100, up 8.5% from July 2019 ($280,400), as prices rose in every region. July’s national price increase marks 101 straight months of year-over-year gains. For the first time ever, national median home prices breached the $300,000 level.
Total housing inventory at the end of July totaled 1.50 million units, down from both 2.6% in June and 21.1% from one year ago (1.90 million).
“The number of new listings is increasing, but they are quickly taken out of the market from heavy buyer competition,” he said. “More homes need to be built.”
Unsold inventory sits at a 3.1-month supply at the current sales pace, down from 3.9 months in June and down from the 4.2-month figure recorded in July 2019.
“Luxury homes in the suburbs are attracting buyers after having lagged the broader market for the past couple of years,” Yun said.
“Single-family homes are continuing to outperform condominium units, suggesting a preference shift for a larger home, including an extra room for a home office.”
For the second consecutive month, sales for July increased in every region and median home prices grew in each of the four major regions from one year ago.
- Existing-home sales in the Northeast rocketed 30.6%, recording an annual rate of 640,000, a 5.9% decrease from a year ago. The median price in the Northeast was $317,800, up 4.0% from July 2019.
- Existing-home sales jumped 27.5% in the Midwest to an annual rate of 1,390,000 in July, up 10.3% from a year ago. The median price in the Midwest was $244,500, an 8.0% increase from July 2019.
- Existing-home sales in the South shot up 19.4% to an annual rate of 2.59 million in July, up 12.6% from the same time one year ago. The median price in the South was $268,500, a 9.9% increase from a year ago.
- Existing-home sales in the West ascended 30.5% to an annual rate of 1,240,000 in July, a 7.8% increase from a year ago. The median price in the West was $453,800, up 11.3% from July 2019.
The question is – just how low do rates have to keep going (from already record lows now) to maintain this momentum?
***
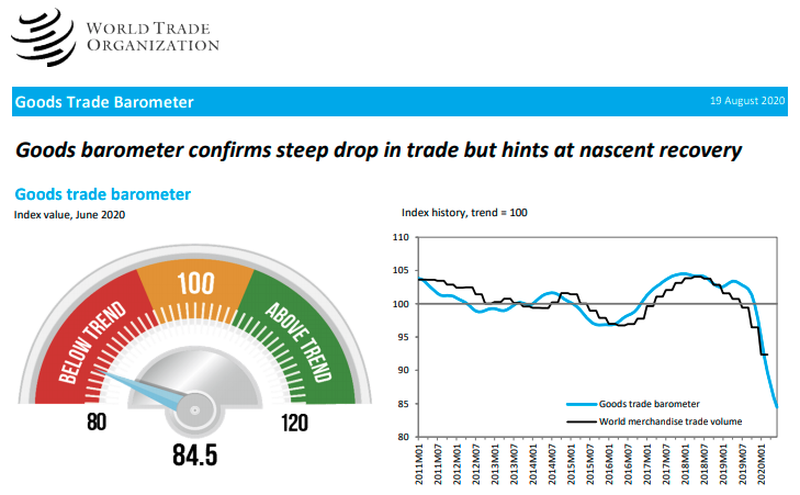
World Trade Plunged To ‘Lowest Levels’ On Record In June
The Devastation Of The Middle Class: It Now Takes 53 Weeks Of Median Wages Every Year To Pay For Basic Needs
“Thriving” has become impossible for the average worker.
250,000 Las Vegans Face Eviction Next Month
Shocking
Here’s How 2020 Compares With The Great Depression
The biggest difference between these two eras – and this is the thing that will be our downfall – is that we are now a nation of consumers instead of producers…
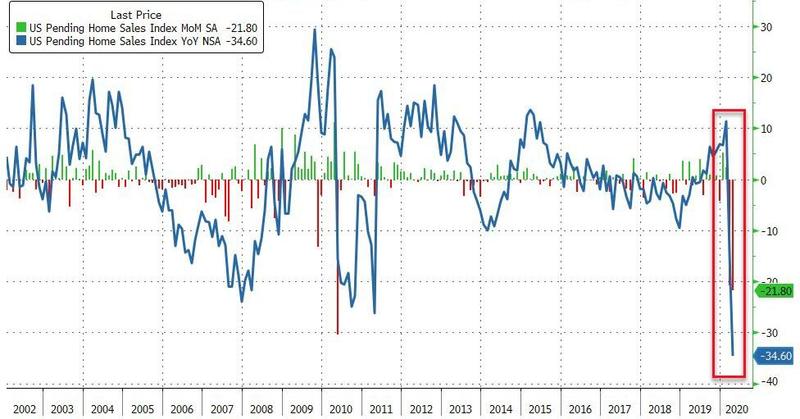
Pending Home Sales Plummet 35% YoY – Biggest Drop Ever As Buyers Forfeit Deposits
Existing home sales collapsed but new home sales rebounded in April, which leaves pending home sales to break the tie and analysts expected a 17.3% MoM drop. However, pending home sales disappointed notably with a 21.8% MoM collapse, sending YoY sales crashing 34.6% – the most ever…
“The housing market is temporarily grappling with the coronavirus-induced shutdown,” which reduced listings and purchases, Lawrence Yun, NAR’s chief economist, said in a statement.
So while all sorts of narratives about lower rates were puked out to defend new home sales outlier data, it seems pending home sales did not get the message…

Every region crashed…
- Northeast fell 14.5%; Feb. rose 2.8%
- Midwest fell 22%; Feb. rose 4.2%
- South fell 19.5%; Feb. fell 0.2%
- West fell 26.8%; Feb. rose 5.1%
That is the lowest level of pending home sales since records began in 2001…
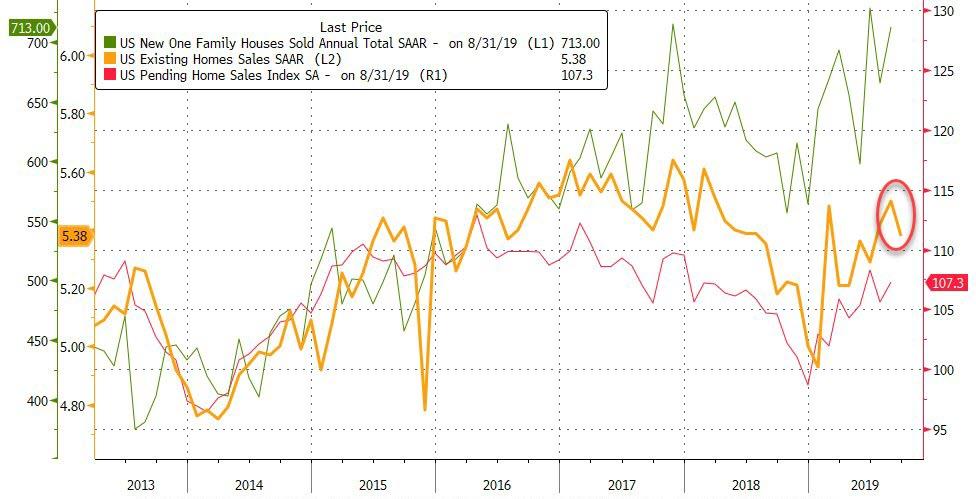
Existing Home Sales Tumble In September, Despite Low Mortgage Rates All Summer
After August’s rebound across the housing market – as mortgage rates tumbled – September was expected to see some slowdown but existing home sales fell significantly (dropping 2.2% MoM against expectations of a 0.7% drop).
Existing Home Sales SAAR fell from 5.50mm to 5.38mm in September…
Source: Bloomberg
Lawrence Yun, NAR’s chief economist, said that despite historically low mortgage rates, sales have not commensurately increased, in part due to a low level of new housing options.
“We must continue to beat the drum for more inventory,” said Yun, who has called for additional home construction for over a year.
“Home prices are rising too rapidly because of the housing shortage, and this lack of inventory is preventing home sales growth potential.”
Regional breakdown:
- September existing-home sales in the Northeast fell 2.8% to an annual rate of 690,000, a 1.5% rise from a year ago. The median price in the Northeast was $301,100, up 5.2% from September 2018.
- In the Midwest, existing-home sales dropped 3.1% to an annual rate of 1.27 million, which is nearly equal to August 2018. The median price in the Midwest was $213,500, a 7.2% jump from a year ago.
- Existing-home sales in the South decreased 2.1% to an annual rate of 2.28 million in September, up 6.0% from a year ago. The median price in the South was $237,300, up 6.3% from one year ago.
- Existing-home sales in the West declined 0.9% to an annual rate of 1.14 million in September, 5.6% above a year ago. The median price in the West was $403,600, up 4.5% from September 2018.
 Source: Bloomberg
As price once again becomes an issue.
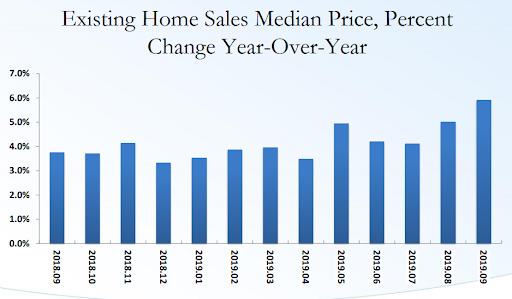
The median existing-home price for all housing types in September was $272,100, up 5.9% from September 2018 ($256,900), as prices rose in all regions. September’s price increase marks 91 straight months of year-over-year gains.
Total housing inventory at the end of September sat at 1.83 million, approximately equal to the amount of existing-homes available for sale in August, but a 2.7% decrease from 1.88 million one year ago. Unsold inventory is at a 4.1-month supply at the current sales pace, up from 4.0 months in August and down from the 4.4-month figure recorded in September 2018.
Existing Home Sales Fall 5.44% Year Over Year In March
Existing Housing Sales Inventory Lowest Since 1999
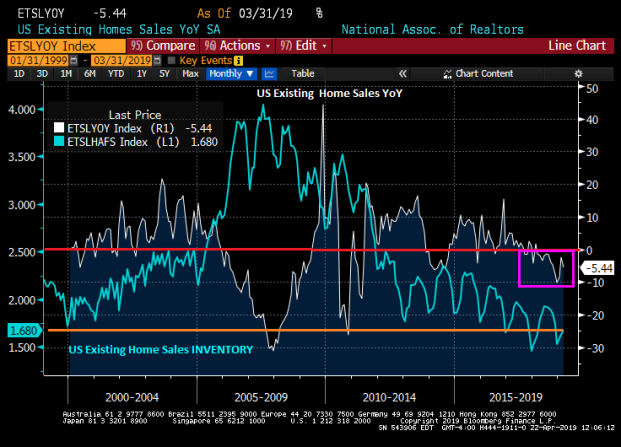
At the same time, the INVENTORY of existing home sales rose in March, but still remains near its lowest level since 1999.
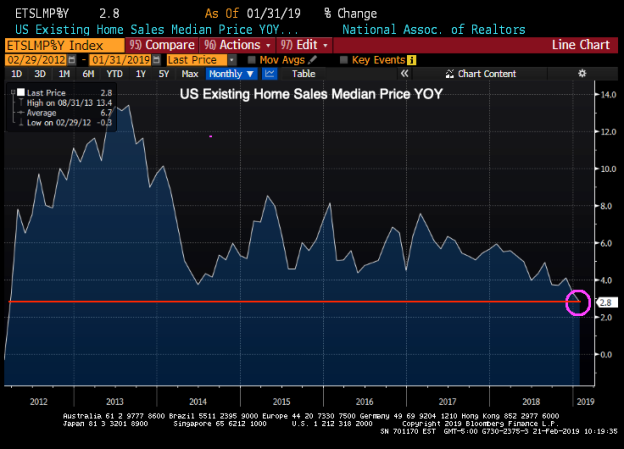
Existing home sales Median Price YoY has slowed to 3.8% with The Fed’s quantitative tightening (QT). As opposed to 13.4% YoY during The Fed’s QE3.
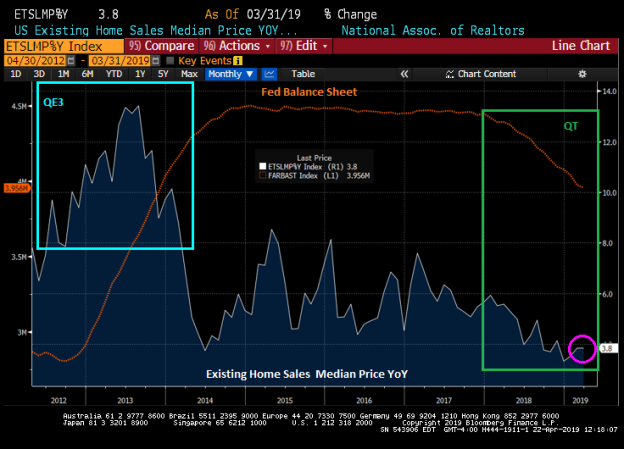
Time to bring out your Fed!

U.S. Existing Home Sales Fall 8.5% YoY In January
The housing market is cooling, both in terms of existing home sales YoY and median price YoY.
(Bloomberg) — Sales of previously owned U.S. homes fell to the weakest pace since November 2015, indicating that the housing market remained in a slowdown despite a drop in mortgage rates.
Contract closings decreased 1.2 percent in January from the prior month to an annual rate of 4.94 million, the National Association of Realtors said Thursday, below economists’ estimates for 5 million. The median sales price rose 2.8 percent from a year ago, the smallest increase since February 2012.
Is this a trend in median prices YoY for existing home sales?
Milage in your town will vary.
Existing home sales YoY dropped 8.50% in January, continuing the cooling trend that started in 2017.


Existing Home Sales Plunge 10.25% In December As Global Economy Slips Into Darkness
And no, that was not a seasonal effect. Existing home sales declined 6.4% MoM in December, the largest decline since November 2015.

And on a YoY basis, existing home sales plunge 10.25%.

US existing homes are very expensive compared to household income and the surge in mortgage rates during 2018 made housing ever less affordable.
The median price for existing home sales shows a seasonal pattern with June typically being the highest for the calendar year and January being the lowest.
Let’s see how Euro Zone and Japan slipping into darkness impacts the US economy and housing market.

***
Existing Home Sales Crash In December
Regional breakdown:
- December existing-home sales in the Northeast decreased 6.8 percent to an annual rate of 690,000, 6.8 percent below a year ago. The median price in the Northeast was $283,400, up 8.2 percent from December 2017.
- In the Midwest, existing-home sales fell 11.2 percent from last month to an annual rate of 1.19 million in December, down 10.5 percent overall from a year ago. The median price in the Midwest was $191,300, unchanged from last year.
- Existing-home sales in the South dropped 5.4 percent to an annual rate of 2.09 million in December, down 8.7 percent from last year. The median price in the South was $224,300, up 2.5 percent from a year ago.
- Existing-home sales in the West dipped 1.9 percent to an annual rate of 1.02 million in December, 15 percent below a year ago. The median price in the West was $374,400, up 0.2 percent from December 2017.
The latest results brought the 2018 tally to 5.34 million, the weakest pace since 2015. This is the biggest annual drop in existing home sales in 8 years…
Existing Home Sales Drop For 7th Straight Month As Homebuilders Stocks Collapse
With US home builder stocks having their worst year since 2007, hope is high that September will show the long-awaited rebound in home sales (despite a soaring mortgage rate).
After ‘stabilizing’ unchanged in August, existing home sales were expected to drop 0.9% MoM in September, but instead August’s data was revised notably lower and September plunged… down 3.4% MoM – the biggest drop since Feb 2016.

With SAAR at its lowest since Nov 2015…

This is the seventh month in a row of annual declines in existing home sales…

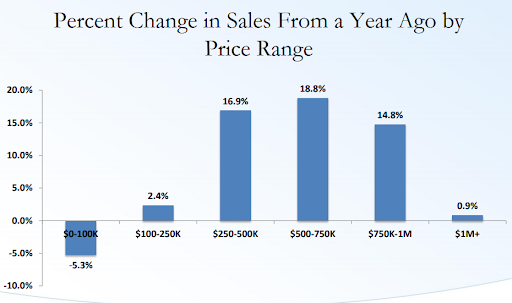
Sales fell across all price ranges (not just the low-end as we have seen recently).
Median home price rose 4.2% from last year to $258,100
And you can’t blame supply as it rose notably – 4.4 months supply in Sept. vs. 4.3 in Aug.
“This is the lowest existing home sales level since November 2015,” he said.
“A decade’s high mortgage rates are preventing consumers from making quick decisions on home purchases. All the while, affordable home listings remain low, continuing to spur underperforming sales activity across the country.”
“There is a clear shift in the market with another month of rising inventory on a year over year basis, though seasonal factors are leading to a third straight month of declining inventory,” said Yun.
“Homes will take a bit longer to sell compared to the super-heated fast pace seen earlier this year.”
Home builder stocks are collapsing…

This is the worst year for home builder stocks since 2007…

Probably nothing. Just keep hiking rates.
Existing Home Sales Tumble In April As Rate-Hikes Crush Affordability
Following the April drop in new home sales amid record high average prices, existing home sales tumbled 2.5% MoM (considerably worse than the 0.9% drop expected) to 5.36m SAAR.

Purchases fell in three of four regions, including a 2.9 percent decline in the South and a 3.3 percent drop in the West
Notably, while single-family home sales decreased 3 percent last month to an annual rate of 4.84 million, purchases of condominium and co-op units rose 1.6 percent to a 620,000 pace.

On a YoY basis, it looks like we have hit peak housing…

“Since NAR began tracking this data in May 2011, the median days a listing was on the market was at an all-time low in April, and the share of homes sold in less than a month was at an all-time high.”
The median existing-home price for all housing types in April was $257,900, up 5.3 percent from April 2017 ($245,000). March’s price increase marks the 74th straight month of year-over-year gains, but price growth is slowing…

And just like new home sales, all the positives are at the higher-end…

“We are seeing no breakout in home sales,” Lawrence Yun, NAR’s chief economist, said at a press briefing accompanying the report. “We are stuck in this narrow range at a time when the economy is doing well.”
“However, inventory shortages are even worse than in recent years, and home prices keep climbing above what many home shoppers can afford,” Yun said in a statement.
With mortgage rates at 8-year highs, it should not be surprise…

Existing Home Sales Extend Plunge, Biggest Annual Drop Since 2014

After new- and existing-home sales tumbled in December, expectations were for a modest 0.5% rebound in January (despite plunging mortgage applications and soaring rates). But that did not happen as existing home sales tumbled 3.2% MoM to its lowest level since Aug 2016.

NOTE – this data is based on signed contracts from Nov/DEC, which means the recent spike in rates is not even hitting this yet)
Existing home sales are down 4.8% YoY – the biggest drop since August 2014.

The West (-5.0%) and Midwest (-6.0%) saw the biggest drop in sales and while the blame (see below) was put on inventories, data shows a 4.1% increase in “available for sale” homes?
Of course NAR is careful to blame inventories – and not soaring rates affecting affordability: Lawrence Yun, NAR chief economist, says January’s retreat in closings highlights the housing market’s glaring inventory shortage to start 2018.
“The utter lack of sufficient housing supply and its influence on higher home prices muted overall sales activity in much of the U.S. last month,” he said.
“While the good news is that Realtors® in most areas are saying buyer traffic is even stronger than the beginning of last year, sales failed to follow course and far lagged last January’s pace.
“It’s very clear that too many markets right now are becoming less affordable and desperately need more new listings to calm the speedy price growth.”
The median existing-home price in January was $240,500, up 5.8% from January 2017.
First-time buyers were 29 percent of sales in January, which is down from 32 percent in December 2017 and 33 percent a year ago.
“The gradual uptick in wages over the last few months is a promising development for the housing market, but there’s risk these income gains could be offset by the recent jump in mortgage rates,” said Yun.
“That is why the pace of added new and existing supply in the months ahead is worth monitoring. If inventory conditions can improve enough to cool the swift price growth in several markets, most prospective buyers should be able to absorb the higher borrowing costs.”
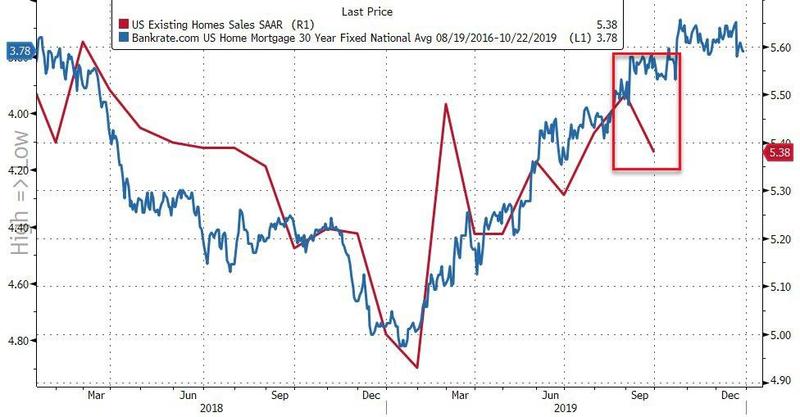
So, will higher rates break housing market momentum?
The following chart suggest ‘yes’ – that surge in rates will have a direct impact on home sales (or prices will be forced to adjust lower) as affordability collapses…

