Negative interest rate policies elsewhere hit US Treasury yields
The side effects of Negative Interest Rate Policies in Europe and Japan — what we’ve come to call the NIRP absurdity — are becoming numerous and legendary, and they’re fanning out across the globe, far beyond the NIRP countries.
No one knows what the consequences will be down the line. No one has ever gone through this before. It’s all a huge experiment in market manipulation. We have seen crazy experiments before, like creating a credit bubble and a housing bubble in order to stimulate the economy following the 2001 recession in the US, which culminated with spectacular fireworks.
Not too long ago, economists believed that nominal negative interest rates couldn’t actually exist beyond very brief periods. They figured that you’d have to increase inflation and keep interest rates low but positive to get negative “real” interest rates, which might have a similar effect, that of “financial repression”: perverting the behavior of creditors and borrowers alike, and triggering a massive wealth transfer.
But the NIRP absurdity has proven to be possible. It can exist. It does exist. That fact is so confidence-inspiring to central banks that more and more have inflicted it on their bailiwick. The Bank of Japan was the latest, and the one with the most debt to push into the negative yield absurdity — and therefore the most consequential.
But markets are globalized, money flows in all directions. The hot money, often borrowed money, washes ashore tsunami like, but then it can recede and dry up, leaving behind the debris. These money flows trigger chain reactions in markets around the globe.
NIRP is causing fixed income investors, and possibly even equity investors, to flee that bailiwick. They sell their bonds to the QE-obsessed central banks, which play the role of the incessant dumb bid in order to whip up bond prices and drive down yields, their stated policy. Investors take their money and run.
And then they invest it elsewhere — wherever yields are not negative, particularly in US Treasuries. This no-questions-asked demand from investors overseas has done a job on Treasury yields. That’s why the 10-year yield in the US has plunged even though the Fed got serious about flip-flopping on rate increases and then actually raised its policy rate, with threats of more to come.
So here are some of the numbers and dynamics — among the many consequences of the NIRP absurdity — by Christine Hughes, Chief Investment Strategist at OtterWood Capital:
Negative interest rate policies implemented by central banks in Europe and Japan have driven yields on many sovereign debt issues into negative territory.
If you look at the BAML Sovereign Bond index, just 6% of the bonds had negative yields at the beginning of 2015. Since then the share of negative yielding bonds has increased to almost 30% of the index, see below.
With negative yielding bonds becoming the norm, investors are instead reaching for the remaining assets with positive yields (i.e. US Treasuries). Private Japanese investors have purchased nearly $70 billion in foreign bonds this year with the sharpest increase coming after the BoJ adopted negative rates. Additionally, inflows into US Treasuries from European funds have increased since 2014:
“According to an analysis by Bank of America Merrill Lynch, for every $100 currently managed in global sovereign benchmarks, avoiding negative yields would result in roughly $20 being pushed into overweight US Treasuries assets,” wrote Christine Hughes of OtterWood Capital.
That’s a lot of money in markets where movements are measured in trillions of dollars. As long as NIRP rules in the Eurozone and Japan, US Treasury yields will become even more appealing every time they halfheartedly try to inch up just one tiny bit.
So China, Russia, and Saudi Arabia might be dumping their holdings of US Treasuries, for reasons of their own, but that won’t matter, and folks that expected this to turn into a disaster for the US will need some more patience: these Treasuries will be instantly mopped up by ever more desperate NIRP refugees.
In the wake of its recent $1.2 billion settlement with the government, whereby Wells Fargo admitted to deceiving the government into insuring thousands of risky mortgages (yet nobody went to jail), the bank has decided to break with the Federal Housing Administration and offer its own minimal down payment mortgage program.
The new program partners with Fannie Mae in order to allow borrowers with credit scores as low as 620 to make as little as a 3% down payment and use income from family members or renters to qualify. Naturally, the intent is to make more loans to low and middle-income borrowers – in the process pushing up home prices countrywide – without going through the FHA.
As a reminder, the FHA insures mortgages made to buyers who would otherwise have a hard time getting loans, but it has been shunned by banks following a wave of lawsuits by the Justice Department that alleged poor underwriting.
Wells Fargo made $6.3 billion in FHA-backed loans last year, and is a top 20 originator for the FHA according to the WSJ. It’s not just FHA however: as we have shown previously, Wells’ own mortgage origination pipeline has been slowing down in recent years, and as such the corner office of the country’s largest mortgage originator is desperate to find new and innovative ways to boost lending.
After being called out for its deceptive practices, the bank has scaled back on FHA backed mortgage lending in recent years. Wells Fargo accounted for just 2.5% of total FHA mortgages in 2015, down from 13% in 2010, and ultimately coming to this end game where the bank has a path forward without the FHA.
Self-Help Ventures Fund, based out of Durham, NC will now be taking the default risk on these low down payment mortgages originated by Wells Fargo.
Self-Help comprises a state and federally chartered credit union as well as the ventures loan fund, and has a total of $1.6 billion in assets. The “fund” has been partnering with Bank of America on insuring loans from their low down payment loan program since February, and has said it is on track to make between $300 million and $500 million in its BofA mortgage product within the first year.
As the WSJ explains, the new Wells Fargo product could save borrowers money
The new Wells Fargo product might save money for some borrowers who would have otherwise taken out an FHA-backed loan. For example, a borrower who buys a $200,000 home and has a credit score of 715 would pay about $1,040 a month with an FHA loan from Wells Fargo, assuming the borrower includes the FHA program’s upfront costs in the loan amount and makes a 3.5% down payment, the minimum the agency requires. The same borrower under the new program would pay about $994 a month with a 3% down payment.
By taking a housing-education course, the borrower could reduce the mortgage rate by an additional one-eighth of a percentage point, making the payment about $979 a month.
Fannie Mae Vice President of Product Development Jonathan Lawless expects other lenders to develop such programs as well, and that he expects the volume of low down-payment mortgages that Fannie backs to grow.
In summary, Wells Fargo didn’t like being taken to task on its deceptive actions and has decided to continue with risky mortgage origination, but shifting the risk to Self-Help instead of the FHA. This sounds like another New Century style lending blowup in the making, only this time one where there is a far more ambiguous relationship with the sponsor bank, in this case Wells Fargo.
Of course, the fact that the loans will be purchased by Fannie Mae means that the risk is still ultimately on the taxpayer if Self-Help is overwhelmed with defaults as happened during the last bubble, so one can probably say that the problem of taxpayers being once again exposed to risky subprime lending practices has just returned with a vengeance.
On the heels of the 17-sigma beat in new home sales, pending home sales soared 5.1% MoM in April – 6.5 standard deviations above economist estimates of a 0.7% jump. Pending home sales rose for the third consecutive month in April and reached their highest level in over a decade, according to the National Association of Realtors. All major regions saw gains in contract activity last month (with The West surging 11.5% MoM) except for the Midwest, which saw a meager decline.
Best month since 2010…
Which no one saw coming…. Some context for the “beat”…
Lawrence Yun, NAR chief economist, says vast gains in the South and West propelled pending sales in April to their highest level since February 2006 (117.4).
“The ability to sign a contract on a home is slightly exceeding expectations this spring even with the affordability stresses and inventory squeezes affecting buyers in a number of markets,” he said. “The building momentum from the over 14 million jobs created since 2010 and the prospect of facing higher rents and mortgage rates down the road appear to be bringing more interested buyers into the market.”
Yun expects sales this year to climb above earlier estimates and be around 5.41 million, a 3.0 percent boost from 2015. After accelerating to 6.8 percent a year ago, national median existing-home price growth is forecast to slightly moderate to between 4 and 5 percent.
While Wall Street looked upon today’s Durable Goods reportwith caution, noting the substantial beat in the headline print which was entirely as a result of a surge in non-defense aircraft orders (read Boeing) which soared by 65%, there was substantial weakness below the surface especially in the core CAPEX print, the capital goods orders non-defense ex-aircraft, which disappointed significantly, sliding 0.8% on expectations of a 0.3% rebound.
However, that was just part of the story. A far bigger part was missed by most because as always Wall Street was focused on the sequential change, and not on the absolute number.
As it turns out, the Department of Commerce decided to quietly revise all the core data going back all the way back to 2014. In doing so it stripped away about 4% from the nominal dollar amount in Durable Goods ex-transports, where the March print was slashed from $154.7 Billion to $148.3 Billion…
… and, worse, the government just confirmed what many had said for years, namely that CAPEX spending had been far lower than reported all along when it revised the capital goods orders non-defense ex-aircraft series lower by a whopping 6%, taking down the March print from $66.9 billion to only $62.4 billion, the lowest absolute number since early 2011.
So how did this downward revision to a critical historical series, and key driver of GDP, change the current GDP estimte? Well, according to the Atlanta Fed, “the GDPNow model forecast for real GDP growth (seasonally adjusted annual rate) in the second quarter of 2016 is 2.9 percent on May 26, up from 2.5 percent on May 17. The forecast for second-quarter real gross private domestic investment growth increased from -0.3 percent to 0.4 percent following this morning’s durable manufacturing release from the U.S. Census Bureau.“
Oddly not a word about the sharp revisions to the core data in main stream media.
China, as current chair of the G-20 group of nations, called on France to organize a very special conference in Paris. The fact such a conference would even take place in an OECD country is a sign of how weakened the hegemony of the US-dominated Dollar System has become.
On March 31 in Paris a special meeting, named “Nanjing II,” was held. People’s Bank of China Governor, Zhou Xiaochuan, was there and made a major presentation on, among other points, broader use of the IMF special basket of five major world currencies, the Special Drawing Rights or SDR’s. The invited were a very select few. The list included German Finance Minister Wolfgang Schaeuble, UK Chancellor of the Exchequer George Osborne, IMF Managing Director Christine Lagarde discussed the world’s financial architecture together with China. Apparently and significantly, there was no senior US official present.
On the Paris talks, Bloomberg reported: “China wants a much more closely managed system, where private-sector decisions can be managed by governments,” said Edwin Truman, a former Federal Reserve and US Treasury official. “The French have always favored international monetary reform, so they’re natural allies to the Chinese on this issue.”
A China Youth Daily journalist present in Paris noted, “Zhou Xiaochuan pointed out that the international monetary and financial system is currently undergoing structural adjustment, the world economy is facing many challenges…” According to the journalist Zhou went on to declare that China’s aim as current President of the G20 talks is to “promote the wider use of the SDR.”
For most of us, that sounds about as exciting as watching Johnson grass grow in the Texas plains. However, behind that seemingly minor technical move, as is becoming clearer by the day, is a grand Chinese strategy, if it succeeds or not, a grand strategy to displace the dominating role of the US dollar as world central bank reserve currency. China and others want an end to the tyranny of a broken dollar system that finances endless wars on other peoples’ borrowed money with no need to ever pay it back. The strategy is to end the domination of the dollar as the currency for most world trade in goods and services. That’s no small beer.
Despite the wreck of the US economy and the astronomical $19 trillion public debt of Washington, the dollar still makes up 64% of all central bank reserves. The largest holder of US debt is the Peoples Republic of China, with Japan a close second. As long as the dollar is “king currency,” Washington can run endless budget deficits knowing well that countries like China have no serious alternative to invest its foreign currency trade profits but in US Government or government-guaranteed debt. In effect, as I have pointed out, that has meant that China has de facto financed the military actions of Washington that act to go against Chinese or Russian sovereign interests, to finance countless US State Department Color Revolutions from Tibet to Hong Kong, from Libya to Ukraine, to finance ISIS in the Middle East and on and on and on…
Multi-currency world
If we look more closely at all the steps of the Beijing government since the global financial crisis of 2008 and especially since their creation of the Asian Infrastructure Investment Bank, the BRICS New Development Bank, the bilateral national currency energy agreements with Russia bypassing the dollar, it becomes clear that Zhou and the Beijing leadership have a long-term strategy.
As British economist David Marsh pointed out in reference to the recent Paris Nanjing II remarks of Zhou, “China is embarking, pragmatically but steadily, towards enshrining a multi-currency reserve system at the heart of the world’s financial order.”
Since China’s admission into the IMF select group of SDR currencies last November, the multi-currency system, which China calls “4+1,” would consist of the euro, sterling, yen and renminbi (the 4), co-existing with the dollar. These are the five constituents of the SDR.
To strengthen the recognition of the SDR, Zhou’s Peoples’ Bank of China has begun to publish its foreign reserves total–the world’s biggest–in SDRs as well as dollars.
A golden future
Yet the Chinese alternative to the domination of the US dollar is about far more than paper SDR currency basket promotion. China is clearly aiming at the re-establishment of an international gold standard, presumably one not based on the bankrupt Bretton Woods Dollar-Gold exchange that President Richard Nixon unilaterally ended in August, 1971 when he told the world they would have to swallow paper dollars in the future and could no longer redeem them for gold. At that point global inflation, measured in dollar terms, began to soar in what future economic historians will no doubt dub The Greatest Inflation.
By one estimate, the dollars in worldwide circulation rose by some 2,500% between 1970 and 2000. Since then the rise has clearly brought it well over 3,000%. Without a legal requirement to back its dollar printing by a pre-determined fixed amount of gold, all restraints were off in a global dollar inflation. So long as the world is forced to get dollars to settle accounts for oil, grain, other commodities, Washington can write endless checks with little fear of them bouncing, stamped “insufficient funds.”
Combined with the fact that over that same time span since 1971 there has been a silent coup of the Wall Street banks to hijack any and all semblance of representative democracy and Constitution-based rules, we have the mad money machine, much like the German poet Goethe’s 18th Century fable, Sorcerers’ Apprentice, or in German, Der Zauberlehrling. Dollar creation is out of control.
Since 2015 China is moving very clearly to replace London and New York and the western gold futures price-setting exchanges. As I noted in a longer analysis in this space in August, 2015, China, together with Russia, is making major strides to back their currencies with gold, to make them “as good as gold,” while currencies like the debt-bloated Euro or the debt-bloated bankrupt dollar zone, struggle.
In May 2015, China announced it had set up a state-run Gold Investment Fund. The aim was to create a pool, initially of $16 billion making it the world’s largest physical gold fund, to support gold mining projects along the new high-speed railway lines of President Xi’s New Economic Silk Road or One Road, One Belt as it is called. As China expressed it, the aim is to enable the Eurasian countries along the Silk Road to increase the gold backing of their currencies. The countries along the Silk Road and within the BRICS happen to contain most of the world’s people and natural and human resources utterly independent of any the West has to offer.
In May 2015, China’s Shanghai Gold Exchange formally established the “Silk Road Gold Fund.” The two main investors in the new fund were China’s two largest gold mining companies–Shandong Gold Group who bought 35% of the shares and Shaanxi Gold Group with 25%. The fund will invest in gold mining projects along the route of the Eurasian Silk Road railways, including in the vast under-explored parts of the Russian Federation.
A little-known fact is that no longer is South Africa the world’s gold king. It is a mere number 7 in annual gold production. China is Number One and Russia Number Two.
On May 11, just before creation of China’s new gold fund, China National Gold Group Corporation signed an agreement with the Russian gold mining group, Polyus Gold, Russia’s largest gold mining group, and one of the top ten in the world. The two companies will explore the gold resources of what is to date Russia’as largest gold deposit at Natalka in the far eastern part of Magadan’s Kolyma District.
Recently, the Chinese government and its state enterprises have also shifted strategy. Today, as of March 2016 official data, China holds more than $3.2 trillion in foreign currency reserves at the Peoples’ bank of China, of which it is believed approximately 60% or almost $2 trillion are dollar assets such as US Treasury bonds or quasi-government bonds such as Fannie Mae or Freddie Mac mortgage bonds. Instead of investing all its dollar earnings from trade surpluses into increasingly inflated and worthless US government debt, China has launched a global asset buying strategy.
Now it happens that prime on the Beijing foreign asset “to buy” shopping list are gold mines around the world. Despite a recent slight rise in the gold price since January, gold is still at 5 year-lows and many quality proven mining companies are cash-starved and forced into bankruptcy. Gold is truly at the beginning of a renaissance.
The beauty of gold is not only what countless gold bugs maintain, a hedge against inflation. It is the most beautiful of all precious metals. The Greek philosopher Plato, in his work The Republic, identified five types of regimes possible–Aristocracy, Timocracy, Oligarchy, Democracy, and Tyranny, with Tyranny the lowest most vile. He then lists Aristocracy, or rule by Philosopher Kings with “golden souls” as the highest form of rule, benevolent and with the highest integrity. Gold has worth in its own right throughout mankind’s history. China and Russia and other nations of Eurasia today are reviving gold to its rightful place. That’s very cool.
The usually strong spring housing market could be far stronger this year, if only there were more homes for sale.
The number of listings continues to drop, as demand outstrips supply and potential sellers bow out, fearing they won’t be able to find something else to buy.
The inventory of homes for sale nationally in April was 3.6 percent lower than in April 2015, according to the National Association of Realtors. Redfin, a real estate brokerage, also recently reported a drop in new listings.
The supply numbers are even tighter in certain local markets: Inventory is down 32 percent in Portland, Oregon, from a year ago; down 22 percent in Kansas City; down 21 percent in Dallas and Seattle; down 17 percent in Charlotte, North Carolina; down 12 percent in Atlanta; down nearly 10 percent in Chicago; and down 8 percent in Los Angeles, according to Zillow. Houston and Miami are seeing big gains in supply, due to economic issues specific to those markets.
“The struggle will continue for home shoppers this summer,” said Zillow chief economist Svenja Gudell. “New construction has been sluggish over the past year; we’re building about half as many homes as we should be in a normal market. There still aren’t enough homes on the market to keep up with the high demand from every type of home buyer.”
The short supply is pushing home prices higher than expected this year. Zillow had predicted 2 percent growth in home values from April 2015 to April 2016, but its latest data show values currently soaring more than twice that, at 4.9 percent.
“In many markets, those looking to buy a home in the bottom or middle of the market will need to be prepared for bidding wars and homes selling for over the asking price. This summer’s selling season’s borders will most likely be blurred again, as many buyers are left without homes and will need to keep searching,” added Gudell.
The inventory drops are most severe in the lower-priced tier of the market. Homes in the top tier are seeing gains and therefore show more price cuts. Sixteen percent of top-tier homes had a price cut over the past year, compared with 11 percent of bottom-tier homes and 13 percent of middle-tier, according to Zillow.
Sen. Mike Lee (R-Utah) has an amendment that would actually prohibit this implementation of the Affirmative Furthering Fair Housing (AFFH) regulation, specifically stopping HUD from attaching zoning changes as a condition for receiving funding, and it deserves every senator’s support.
According to the Federal Register, AFFH directs municipalities “to examine relevant factors, such as zoning and other land-use practices that are likely contributors to fair housing concerns, and take appropriate actions in response” as a condition for receipt of the block grants. It’s right there in the regulation.
On the other hand, Sen. Susan Collins (R-Maine) offers an amendment which merely reiterates current law that the federal government cannot compel the local zoning changes, stating no funds can be used “to direct a grantee to undertake specific changes to existing zoning laws.”
As noted by the National Review’s Stanley Kurtz, “Federal law already forbids HUD from mandating the spending priorities of state and local governments or forcing grant recipients to forgo their duly adopted policies or laws, including zoning laws. AFFH gets around this prohibition by setting up a situation in which a locality can’t get any federal grant money unless it ‘voluntarily’ promises to change its zoning laws and change its housing policies in exactly the way HUD wants.”
Kurtz emphasizes the point: “This trick allows HUD to avoid formally ‘directing’ localities to do anything at all in order to get their HUD grants. But HUD gives localities plenty of informal ‘guidance’ that makes it perfectly clear what they actually have to do to get their federal grants.”
Therefore, even with the Collins amendment, AFFH will still require municipalities to “examine relevant factors, such as zoning and other land-use practices that are likely contributors to fair housing concerns, and take appropriate actions in response” as a condition for receipt of the block grants.
This is an attempt by the Senate to pretend to have acted to stop the federalization of local zoning decisions without actually doing so. The Lee amendment will remove the local zoning strings attached to the funding, plain and simple. The Collins amendment will not.
It is telling that President Obama is threatening a veto of an appropriations bill that has “ideological” content, when the President himself is exercising the power of the purse to compel his ideological vision on our nation’s cities, towns and counties through implementation of AFFH.
The Collins amendment, ironically, will enable and advance this ideological agenda — while offering constituents false comfort that it has been abated when it has not. Only the Lee amendment can stop this HUD driven transformation of our neighborhoods.
The House has already passed the Lee language twice with vocal support from across the Conference ranging from Representatives Paul Gosar to Peter King. Americans for Limited Government urges every senator to vote yes on the Lee amendment to the Transportation-HUD appropriations bill — and stop the federalization of local zoning policiesonce and for all.
Talk about a poisoned chalice. No matter who is elected to the White House in November, the next president will probably face a recession.
The 83-month-old expansion is already the fourth-longest in more than 150 years and starting to show some signs of aging as corporate profits peak and wage pressures build. It also remains vulnerable to a shock because growth has been so feeble, averaging just about 2 percent since the last downturn ended in June 2009.
“If the next president is not going to have a recession, it will be a U.S. record,” said Gad Levanon, chief economist for North America at the Conference Board in New York. “The longest expansion we ever had was 10 years,” beginning in 1991.
The history of cyclical fluctuations suggests that the “odds are significantly better than 50-50 that we will have a recession within the next three years,” according to former Treasury Secretary Lawrence Summers.
Michael Feroli, chief U.S. economist for JPMorgan Chase & Co. in New York, puts the probability of a downturn during that time frame at about two in three.
The U.S. doesn’t look all that well-equipped to handle a contraction should one occur during the next president’s term, former Federal Reserve Vice Chairman Alan Blinder said. Monetary policy is stretched near its limit while fiscal policy is hamstrung by ideological battles.
Previous Decade
This wouldn’t be the first time that a new president was forced to tackle a contraction in gross domestic product. The nation was in the midst of its deepest slump since the Great Depression when Barack Obama took office on January 20, 2009. His predecessor, George W. Bush, started his tenure as president in 2001 with the economy about to be mired in a downturn as well, albeit a much milder one than greeted Obama.
The biggest near-term threat comes from abroad. Former International Monetary Fund official Desmond Lachman said a June 23 vote by the U.K. to leave the European Union, a steeper-than-anticipated Chinese slowdown and a renewed recession in Japan are among potential developments that could upend financial markets and the global economy in the coming months.
“There’s a non-negligible risk that by the time the next president takes office in January you would have the world in a pretty bad place,” said Lachman, who put the odds of that happening at 30 percent to 40 percent.
Investors also might get spooked if billionaire Donald Trump looks likely to win the presidency, considering his staunchly protectionist stance on trade and a seemingly cavalier attitude toward the nation’s debt, added Lachman, now a resident fellow at the American Enterprise Institute in Washington.
Election-Year Jitters
Uncertainty about the election’s outcome may already be infecting the economy at the margin, with companies and consumers in surveys increasingly citing it as a source of concern.
“The views expressed by the various candidates have weighed down” consumer confidence, said Richard Curtin, director of the University of Michigan’s household survey, which saw sentiment slip for a fourth straight month in April.
With growth so slow — it clocked in at a mere 0.5 percent on an annual basis in the first quarter — it wouldn’t take that much to tip the economy into a recession.
“It’s like a bicycle that’s going too slowly. All it takes is a little puff of wind to knock it over,” said Nariman Behravesh, chief economist for consultants IHS Inc. in Lexington, Massachusetts.
The economy still has some things going for it, leading Behravesh to conclude that the odds of a downturn over the next couple of years are at most 25 percent.
“Recoveries don’t die of old age,” he said. “They get killed off. And the three killers that we’ve had in the past don’t seem terribly frightening right now.”
The murderers’ row consists of a steep rise in interest rates engineered by the central bank, a sudden spike in oil prices and the bursting of an asset-price bubble. This time around, Fed policy makers have signaled they’re going to raise rates slowly, the oil market is still awash in excess supply and house prices by some measures remain below their 2007 highs.
“The expansion can continue for several more years,” Robert Gordon, a professor at Northwestern University in Evanston, Illinois, and a member of the committee of economists that determines the timing of recessions, said in an e-mail.
Balance Sheets
Consumers’ balance sheets are in much better shape than they were prior to the last economic contraction. Household debt as a share of disposable income stood at 105 percent in the fourth quarter, well below the 133 percent reached in the final three months of 2007.
Businesses seem more vulnerable. Corporate profits plunged 11.5 percent in the fourth quarter from the year-ago period, the biggest drop since a 31 percent collapse at the end of 2008 during the height of the financial crisis, according to data compiled by the Commerce Department.
History shows that when earnings decline, the economy often follows into a recession as profit-starved companies cut back on hiring and investment.
“More and more employers are struggling with profits,” Levanon said. “That is resulting in some belt tightening.”
While he doesn’t see that pushing the U.S. into a recession, Levanon expects monthly payroll growth to slow to 150,000 to 180,000 over the balance of this year, compared to an average of 229,000 in 2015.
Though much of the weakness in earnings has been concentrated in the energy industry, companies in general have been struggling with rising labor costs as the tightening jobs market puts upward pressure on wages and worker productivity has lagged.
Peter Hooper, chief economist for Deutsche Bank Securities in New York, sees that leading to a possible recession a couple of years out as companies raise prices, inflation starts to accelerate and Fed policy makers have to jack up interest rates more aggressively in response.
“The slower they go in the near-term, the bigger the risk down the road,” he said of the Fed. “Looking out over the next four years, the chances of a two-quarter contraction are probably above 50 percent.”
Single-family existing home sales rose just 0.6% MoM in April with The South and The West regions seeing notable declines in sales (down 2.7% and down 1.7% respectively). What saved the headline print was a 10.3% surge in Condo sales – among the best monthly spikes since the crisis helped by a spike in sales in The Midwest – where prices are most affordable.
Condos saved the day:
While supply of single-family homes is rising, the demand was again all on condos:
The median price of existing homes:
Single-family home sales inched forward 0.6 percent to a seasonally adjusted annual rate of 4.81 million in April from 4.78 million in March, and are now 6.2 percent higher than the 4.53 million pace a year ago. The median existing single-family home price was $233,700 in April, up 6.2 percent from April 2015.
Existing condominium and co-op sales jumped 10.3 percent to a seasonally adjusted annual rate of 640,000 units in April from 580,000 in March, and are now 4.9 percent above April 2015 (610,000 units). The median existing condo price was $223,300 in April, which is 6.8 percent above a year ago.
Lawrence Yun, NAR chief economist, says April’s sales increase signals slowly building momentum for the housing market this spring.
“Primarily driven by a convincing jump in the Midwest, where home prices are most affordable, sales activity overall was at a healthy pace last month as very low mortgage rates and modest seasonal inventory gains encouraged more households to search for and close on a home,” he said.
“Except for in the West — where supply shortages and stark price growth are hampering buyers the most — sales are meaningfully higher than a year ago in much of the country.”
Regionally, the story is very mixed…
April existing-home sales in the Northeast climbed 2.8 percent to an annual rate of 740,000, and are now 17.5 percent above a year ago. The median price in the Northeast was $263,600, which is 4.1 percent above April 2015.
In the Midwest, existing-home sales soared 12.1 percent to an annual rate of 1.39 million in April, and are now 12.1 percent above April 2015. The median price in the Midwest was $184,200, up 7.7 percent from a year ago.
Existing-home sales in the South declined 2.7 percent to an annual rate of 2.19 million in April, but are still 4.3 percent above April 2015. The median price in the South was $202,800, up 6.5 percent from a year ago.
Existing-home sales in the West decreased 1.7 percent to an annual rate of 1.13 million in April, and are 3.4 percent lower than a year ago. The median price in the West was $335,000, which is 6.5 percent above April 2015.
The West is exhibiting a notable trend with low-end sales plunging and higher-end rising…
Which price buckets saw the most transactions:
And Y/Y transactions by bucket:
The NAR’s chief economy Larry Yun warns again:
“The temporary relief from mortgage rates currently near three-year lows has helped preserve housing affordability this spring, but there’s growing concern a number of buyers will be unable to find homes at affordable prices if wages don’t rise and price growth doesn’t slow.”
Finally, it is worth noting that since the data was better than expected, there was no scapegoating of “weather” this time.
Unlike recent months when the Census Bureau reported some fireworks in the New Housing Starts and Permits data, the April update was relatively tame, and saw Starts rise from an upward revised 1,099K to 1,172K, beating expectations of a 1,125K print, mostly as a result of a 36K increase in multi-family units which however remain depressed below recent peaks from early 2015, which will likely stoke even higher asking rents, already at record highs across the nation.
But if starts were better than expected, then the future pipeline in the form of Housing Permits disappointed, with 1,116K units permitted for the month of April, below the 1,135K expected, if a rebound from last month’s downward revised 1,077K.
The issue, as with the starts data, is the multi-family, aka rental units, barely rebounded and remained at severely depressed levels last seen in 2013: at 348K rental units permitted in April, this is a far cry from the recent highs of 598K in June.
One wonders if this is intentional, because based on soaring asking rents, as shown in the chart below, with Americans increasingly unable or unwilling to buy single-family units, rental prices have exploded to 8% Y/Y based on Census data.
Should multi-family permits and starts remain as depressed as it has been in recent months, we expect that this chart of soaring median asking rents will only accelerate in the near future, and will require a whole host of seasonal adjustments from making its way into the already bubbly CPI data.
Private-Equity firm Blackstone Group is planning to acquire Market Center in San Francisco, a 720,000 square-foot complex that consists of a 21-story tower and a 40-story tower.
The seller, Manulife Financial in Canada, had bought the property in September 2010, near the bottom of the last bust. In its press release at the time, it said that it “identified San Francisco as one of several potential growth areas for our real estate business and we are optimistic about the possibilities.” It raved that the buildings, dating from 1965 and 1975, had been “extensively renovated and modernized with state-of-the-art systems in the last few years….” It paid $265 million, or $344 per square foot.
After a six-year boom in commercial real-estate in San Francisco, and with near-impeccable timing, Manulife put the property on the market in February with an asking price of $750 per square foot – a hoped-for gain of 118%!
Now the excellent Bay Area real estate publication, The Registry, reported that Blackstone Real Estate Partners had agreed to buy it for $489.6 million, or $680 per square foot, “according to sources familiar with the transaction.” The property has been placed under contract, but the deal hasn’t closed yet.
If the deal closes, Manulife would still have a 6-year gain of nearly 100%. But here is a sign, one more in a series, that the phenomenal commercial real estate bubble is deflating: the selling price is 9.3% below asking price!
The property is 92% leased, according to The Registry. Alas, among the largest tenants is Uber, which recently acquired the Sears building in Oakland and is expected to move into its new 330,000 sq-ft digs in a couple of years, which may leave Market Center scrambling for tenants at perhaps the worst possible time.
It’s already getting tough
Sublease space in San Francisco in the first quarter “has soared to its highest mark since 2010,” according to commercial real estate services firm Savills Studley. Sublease space is the red flag. Companies lease excess office space because they expect to grow and hire and thus eventually fill this space. They warehouse this space for future use because they think there’s an office shortage despite the dizzying construction boom underway. This space sits empty, looming in the shadow inventory. When pressure builds to cut expenses, it hits the market overnight, coming apparently out of nowhere. With other companies doing the same, it creates a glut, and lease rates begin to swoon.
Manulife might have seen the slowdown coming
Tech layoffs in the four-county Bay Area doubled for the first four months this year, compared to the same period last year, according to a report by Wells Fargo senior economist Mark Vitner, cited by The Mercury News, “in yet another sign of a slowdown in the booming Bay Area economy.”
Announced layoffs in the counties of San Francisco, Santa Clara, San Mateo, and Alameda jumped to 3,135, from 1,515 in the same period in 2015, and from 1,330 in 2014 — based on the mandatory filings under California’s WARN Act. But…
The number of layoffs in the tech sector is undoubtedly larger, because WARN notices do not include cuts by many smaller companies and startups. In addition, notices of layoffs of fewer than 50 people at larger companies aren’t required by the act.
The filings also don’t take attrition into account – when jobs disappear without layoffs. “There is a lot of that,” Vitner explained. “When businesses begin to clamp down on costs, one of the first things they do is say, ‘Let’s put in a hiring freeze.’ I feel pretty certain that if you had a pickup in layoffs, then hiring slowed ahead of that.”
And hiring has slowed down. According to Vitner’s analysis of state employment data, Bay Area tech firms added only 800 jobs a month in the first quarter – half of the 1,600 a month they’d added in 2015 and less than half of the 1,700 a month in 2014.
“Employment in the tech sector has clearly decelerated over the past three months,” he said. “As job growth slows and the cost of living remains as high as it is, that’s going to put many people in a difficult position.”
It’s going to put commercial real estate into a difficult position as well. During the boom years, the key rationalization for the insane prices and rents has been the rapid growth of tech jobs. Now, the slowdown in hiring and the growth in layoffs come just when the construction boom is coming into full bloom, and as sublease space gets dumped on the market.
Here’s what a real estate investor — at the time co-founder of a company they later sold — told me about real estate during the dotcom bust. All tenants should write this in nail polish on their smartphone screens:
It was funny in 2000 because the rent market was still moving up. We rejected our extension option, hired a broker, and started looking around. As months went on, we kept finding more and more, better and better space while our existing landlord refused to renegotiate a lower renewal. We went from a “B” building to an “A” building at half the rent with hundreds of thousands of dollars of free furniture.
The point is that tenants are normally the last to find out that rents are dropping.
With the second hack of Swift, the day of firewalls and permission systems are suddenly numbered.
This time it wasn’t hacked data — it was the banks’ money that was hacked.
Bank security is rapidly deteriorating.
It is time to adopt some kind of distributed ledger.
I see the bad moon arising. I see trouble on the way. I see earthquakes and lightnin’. I see bad times today.
— Creedence Clearwater Revival
The SWIFT payment system failed again this week. The tone of Swift’s announcement intimated the end of life on the planet earth as we know it. Swift’s description of the system’s attackers was apocalyptic, and did nothing to minimize the skills of the attackers, adding that the funds seized might be, of course, reinvested to give the hackers a kind of turboboost of evil. My sources tell me the culprit is Brainiac from the planet Zod.
Of course there is nothing funny about this situation, even if Swift’s “chicken little” corporate reaction was pretty funny. The real lesson of this event is deadly earnest and, I believe, fully anticipated by most specialists in the security of our financial system. This event, though, was the Fat Lady’s Song. The banks, exchanges, clearers like Swift, DDTC, and so on, are going to have to share something with the public that insiders already know.
The party is over for the old, permissioned, firewall based, electronic fortress, concept of trust-in-payments systems. And the alternative is very far from obvious.
The buzzwords, the sweethearts of the fintech movement, are systems known as distributed ledgers. Two words are about to become part of everyone’s vocabulary: Bitcoin and blockchain. There are multitudes of manifestations of these two intimately related electronic phenomena. If you are new to the subject of Bitcoin and blockchain, the learning curve is steep.
The significance of the second Swift failure is this. Trust-based systems, such as those upon which the current payments systems operate, are becoming more expensive to protect at a rapidly increasing rate. The horse race between hackers and firewall builders is being won by hackers in spite of the rapidly increasing spending on internet security.
And these most recent hacks took bank’s money, not customer money. That is a game changer.
Since God invented dirt, the banks have been soooo regretful about the lengthy delays and inefficiencies inherent in our transactions system. They’re so sorry, they tell us, about the three days you wait between transactions and payments. And they really regret all those fees that you pay and inconveniences you experience with foreign exchange transactions.
What bunk. The banks, as a whole, make hundreds of billions a year on these inefficiencies.
The point of the article is this. Now that the bank’s own money is being stolen, the financial world will be singing from one hymnal. The time of distributed ledgers is here. There is no longer a question that distributed ledgers will replace our current method of securing transactions. The firewall system no longer has a constituency after the Swift debacle.
What are the implications for investors? First, there is nothing yet you can invest in directly. It is possible to purchase a thing called a crypto-currency. The most prominent of these is called Bitcoin. However, unless you spend the necessary months of research to grasp the underlying determinants of the value of Bitcoin, I have an emphatic one-word recommendation. Don’t. This investment is incredibly risky, and those who provide confident forecasts of its future value are deluded or worse.
The future of transactions reminds me a little of the invasion of Europe by Genghis Khan. In the distributed ledger business, Genghis Khan is Bitcoin. There is no corporate presence sponsoring Bitcoin. It is open source. The key significance of Bitcoin/blockchain is that this particular distributed ledger is, at the moment, prohibitively expensive to hack. Its disadvantages include a lack of governance. Advocates will rightly argue that a lack of governance has its benefits – obvious to anyone who considers the problems with having a government – but there are also disputes in the Bitcoin community and no clear way to resolve them.
Genghis Kahn’s competition, the Pope and Kings of distributed ledgers, are the usual suspects – primarily the big banks. But also the big accounting firms and the major IT firms are involved. I wonder if the Pope and the Kings were afraid to speak the name of Genghis Kahn. One thing is for sure, the Big Business side of the distributed ledger debate is afraid to speak the name Bitcoin. Honest.
Almost universally, if the equity capital of a distributed ledger advocate exceeds one billion market value, the advocate will never use the word Bitcoin in a discussion of distributed ledgers. Blockchain is the magic term they use. I find this annoying since the developers of Bitcoin coined the term blockchain and would have copyrighted it if they had not been open-source kind of guys who don’t do that sort of thing.
It is much, much, too early to tell how this combat is going to sort itself out. There is a shortage of practical uses of the technology from any source. The number of practical uses at the moment is zero. But the word “inevitable” is no longer too strong.
Investment recommendations? I’ve got a few. My very long term bet is that the big banks (Bank of America (NYSE:BAC), Bank of New York Mellon (NYSE:BK), Bank of America , Citigroup (NYSE:C), Goldman Sachs (NYSE:GS), and JP Morgan Chase (NYSE:JPM), among others) will be the big losers. Likewise, the big accounting firms. All have invested billions. For them, pocket change, but pocket change invested pointlessly.
An exception: I find of particular interest Goldman’s entry into retail banking with a strong aversion to brick and mortar branches. These both are wise decisions. I have a buy on Goldman — and its awareness of, and willingness to place bets upon, the outcome of fintech is one reason I think Goldman’s long term strength is assured. In the distributed ledger future, branches disappear.
The distributed ledger contest will ultimately boil down to a contest between the major IT firms (IBM (NYSE:IBM), Microsoft (NASDAQ:MSFT), and Alphabet (NASDAQ:GOOGL)) (read: Pope and Kings) on one hand, and the loose governance of Bitcoin (The Great Kahn) on the other hand.
Do not, however, look here for a standard analysis of funds invested and rates of return. This is a game that will have one winner, and the game is winner-take-all. A thinking IT firm like IBM realizes that this is a contest it must enter. This is positive for the future of IBM’s stock, but I am a long way from knowing where IBM is going to jump, or whether I approve of their plan — which is, at the moment, very diffuse.
This is also not a time to look at the fintech component of IBM’s blockchain-oriented financials. It is far too early and the financials, nearly irrelevant. In this mega-contest for the future of distributed ledgers, it is not so much about dollars invested as intellectual resources expended and risks taken.
It is perhaps prudent at the moment for Big Blue to have a finger in every pie. But when a fully informed decision can be made, the winner of this contest will be the player with the most information and best instincts. And the earliest to make the right commitment. Then we can ask old fashioned questions like: What are the implications for IBM’s financials?
On the big firm side, IBM in particular has two things working for them. They are tight with the big banks and accounting firms on the one hand, yet comfortable in the world of open source on the other. I see them with a development role in devising the apps the banks and accountants will be ultimately reduced to offering in the transactions world. Those will be some monster apps, but Apps is Apps. They’re not where the big bucks are. The big distributed ledger itself is the real prize. IBM, or another big IT firm, will need to ramp up quickly to seize it.
IBM and its ilk will also be potentially better able to make decisions than the loosely structured management of Bitcoin/blockchain. But IBM should learn to say the word “Bitcoin.” The term was totally missing from their initial press release. It’s a clear sign of fear or hubris. And I don’t think IBM has a reason to fear, as its banking customers and the accounting firms do.
What of the Bitcoin community? For all of their pretensions of computer power/economics-based decision-making ala the internet, the Bitcoin community is not the free-wheeling fun-loving band it makes itself out to be. Bitcoin-land has a management problem of its own. There is indeed a hierarchy of Bitcoin/blockchain management, albeit informal. And this management has disputes. A very important current dispute is whether and how the blockchain will grow. This is no small matter. Because if Bitcoin will matter a year from now, it needs to grow like Topsy, and now.
Who will win the battle for the One Big Global Distributed Ledger? Too soon to call, but the stakes are enormous.
Not so long ago, US farmland – whose prices were until recently rising exponentially – was considered by many to be the next asset bubble. Continue reading →
The purpose of the Federal Housing Administration is “to help creditworthy low-income and first-time home buyers“, individuals and families often denied traditional credit, to obtain a mortgage and purchase a home.” This system has been successful, and has aided in promoting home ownership. However, the FHA loan program and its related benefits are under threat as the Department of Justice continues to bring investigations and actions against lenders under the False Claims Act.
Criticism of the DOJ’s approach is that the department is using the threat of treble damages available under the False Claims Act to intimidate lenders into paying outsized settlements and having lenders admit guilt simply to avoid the threat of the enormous liability and the cost of a prolonged defense. If the DOJ wanted to go after bad actors who are truly defrauding the government with dishonest underwriting practices or nonexistent quality control procedures, then that would be acceptable to the industry.
But the DOJ seems to be simply going after deep pockets, where the intentions of the lenders are well-placed and the errors found are legitimate mistakes. Case in point: as of December 2015, Quicken Loans was the largest originator of FHA loans in the country, and they are currently facing the threat of a False Claims Act violation. To date Quicken has vowed to continue to fight, and stated they will expose the truth about the DOJ’s egregious attempts to coerce these unjust “settlements.”
When an originator participates in the FHA program, they are operating under the Housing and Urban Development’s FHA guidelines. As HUD cannot, and does not, check each and every loan guaranteed by FHA to confirm unflawed origination, the agency requires certification that the lender originating the file did so in compliance with the applicable guidelines. If the loan defaults, the lender submits a claim and the FHA will pay out the balance of the loan under the guarantee.
The False Claims Act provides that any person who presents a false claim or makes a false record or statement material to a false claim, “is liable to the United States Government for a civil penalty of not less than $5,500 and not more than $11,000…plus 3 times the amount of damages which the Government sustains because of the act.”
The DOJ argues that when a loan with known origination errors is certified by the lender to the FHA, with a subsequent claim submitted by the lender to the FHA after a default, the lender is in violation of the False Claims Act — because they knew or should have known the loan had defects when they submitted their certification, and yet still allowed the government to sustain a loss when the FHA paid out of the loan balance.
In the mortgage space the potential liability is astronomical because of the aforementioned penalties. The major issues in a False Claims Act violation can be boiled down to two major points: lack of clarity and specificity around what the DOJ considers “errors;” and what constitutes knowing loans were defective under the DOJ’s application of the act.
To the first point: are the errors of the innocuous, ever-present type found in a large lender’s portfolio, or egregious underwriting errors knowingly committed to increase production while offsetting risk through the FHA program? Obviously, lenders are arguing the former.
Prior to Justice’s aggressive pursuit of these settlements, if the FHA identified an underwriting error the lender would simply indemnify the FHA and not process the claim, effectively making it a lender-owned loan. This was an acceptable risk to lenders, as an error in the origination process could not become such an oversized loss. The liability would be capped to any difference between the borrower’s total debt at the time of foreclosure sale and what the lender could recoup when the property was liquidated. The DOJ’s use of the False Claims Act now triples a lender’s risk when originating FHA loans by threatening damages that are triple the value of the amount paid out by FHA.
In his letter to all JPMorgan Chase & Co. shareholders in April, Chief Executive Officer Jamie Dimon outlined the bank’s reasons for discontinuing its involvement with FHA loans. This perfectly illustrates how the DOJ is basically restoring all the lender risk to FHA-backed originations. Banks originating FHA loans are left with two choices: price in the new risk of underwriting errors into and pass the cost to the end borrower, making the product so costly it becomes pointless to offer; or cease or severely limit FHA offerings. If lenders take either approach, the DOJ will have negated the purpose of the FHA by limiting borrowers’ access to credit.
Walking away from FHA lending is not as simple as it sounds. Most FHA borrowers tend to have lower credit scores and/or require lower down payments. Most FHA loans also tend to be for homes located in low- and moderate-income neighborhoods. Any decline in an institution’s FHA offerings most likely will have a negative impact on an institution’s Community Reinvestment Act ratings. One has to think the DOJ is well aware of this fact and believes it will keep lenders in the FHA business even with the elevated risk, and can simply continue to strong-arm lenders into settlements.
If the Justice Department continues to aggressively utilize the False Claims Act, originators will be forced to evolve and create a product that they can keep as a portfolio loan or sell privately that can reach the same borrowers the FHA-insured products currently do. Again, there is a high likelihood that these products will not have as attractive terms as the FHA loans that borrowers are currently enjoying.
Large lenders will continue to step away from FHA originations, and smaller lenders originating FHA loans should be strongly aware of the risk they are taking on by continuing to originate FHA loans and increasing their portfolios as the larger banks exit the FHA market. Many large lenders have faced or are currently facing these actions, and from the Justice Department’s recent statements it does not appear they will abate anytime soon.
Hillary’s rumored running mate, Housing Secretary Julian Castro, is cooking up a scheme to reallocate funding for Section 8 housing to punish suburbs for being too white and too wealthy.
The scheme involves super-sizing vouchers to help urban poor afford higher rents in pricey areas, such as Westchester County, while assigning them government real estate agents called “mobility counselors” to secure housing in the exurbs.
Castro plans to launch the Section 8 reboot this fall, even though a similar program tested a few years ago in Dallas has been blamed for shifting violent crime to affluent neighborhoods.
It’s all part of a grand scheme to forcibly desegregate inner cities and integrate the outer suburbs.
Anticipating NIMBY resistance, Castro last month threatened to sue suburban landlords for discrimination if they refuse even Section 8 tenants with criminal records. And last year, he implemented a powerful new regulation — “Affirmatively Furthering Fair Housing” — that pressures all suburban counties taking federal grant money to change local zoning laws to build more low-income housing (landlords of such properties are required to accept Section 8 vouchers).
Castro is expected to finalize the new regulation, known as “Small-Area Fair Market Rents” (SAFMR), this October, in the last days of the Obama presidency.
It will set voucher rent limits by ZIP code rather than metro area, the current formula, which makes payments relatively small. For example, the fair market rent for a one-bedroom in New York City is about $1,250, which wouldn’t cover rentals in leafy areas of Westchester County, such as Mamaroneck, where Castro and his social engineers seek to aggressively resettle Section 8 tenants.
In expensive ZIP codes, Castro’s plan — which requires no congressional approval — would more than double the standard subsidy, while also covering utilities. At the same time, he intends to reduce subsidies for those who choose to stay in housing in poor urban areas, such as Brooklyn. So Section 8 tenants won’t just be pulled to the suburbs, they’ll be pushed there.
“We want to use our housing-choice vouchers to ensure that we don’t have a concentration of poverty and the aggregation of racial minorities in one part of town, the poor part of town,” the HUD chief said recently, adding that he’s trying to undo the “result of discriminatory policies and practices in the past, and sometimes even now.”
A draft of the new HUD rule anticipates more than 350,000 Section 8 voucher holders will initially be resettled under the SAFMR program. Under Obama, the total number of voucher households has grown to more than 2.2 million.
The document argues that larger vouchers will allow poor urban families to “move into areas that potentially have better access to jobs, transportation, services and educational opportunities.” In other words, offering them more money to move to more expensive neighborhoods will improve their situation.
But HUD’s own studies show the theory doesn’t match reality.
President Bill Clinton started a similar program in 1994 called “Moving to Opportunity Initiative,” which moved thousands of mostly African-American families from government projects to higher-quality homes in safer and less racially segregated neighborhoods in several counties across the country.
The 15-year experiment bombed.
A 2011 study sponsored by HUD found that adults using more generous Section 8 vouchers did not get better jobs or get off welfare. In fact, more went on food stamps. And their children did not do better in their new schools.
Worse, crime simply followed them to their safer neighborhoods, ruining the quality of life for existing residents.
“Males … were arrested more often than those in the control group, primarily for property crimes,” the study found.
Dubuque, Iowa, for example, received an influx of voucher holders from projects in Chicago — and it’s had a problem with crime ever since. A recent study linked Dubuque’s crime wave directly to Section 8 housing.
Of course, even when reality mugs leftists, they never scrap their social theories. They just double down.
The problem, they rationalized, was that the relocation wasn’t aggressive enough. They concluded they could get the desired results if they placed urban poor in even more affluent areas.
HUD recently tested this new theory in Dallas with disastrous results.
Starting in 2012, the agency sweetened Section 8 voucher payments, and pointed inner-city recipients to the far-flung counties surrounding Dallas. As government-subsidized rentals spread in all areas of the Metroplex (163 ZIP codes vs. 129 ZIP codes), so did crime.
Now Dallas has one of the highest murder rates in the nation, and recently had to call in state troopers to help police control it. For the first time, violent crime has shifted to the tony bedroom communities north of the city. Three suburbs that have seen the most Section 8 transfers — Frisco, Plano and McKinney — have suffered unprecedented spikes in rapes, assaults and break-ins, including home invasions.
Although HUD’s “demonstration project” may have improved the lives of some who moved, it’s ended up harming the lives of many of their new neighbors. And now Castro wants to roll it out nationwide. Soon he will give Section 8 recipients money to afford rent wherever they choose — and if they don’t want to move, he’ll make them an offer they can’t refuse.
Ironically, Hillary’s own hometown of Chappaqua is fighting Section 8 housing because of links to drugs and crime and other problems.
This is a big policy shift that will have broad implications, affecting everything from crime to property values. And it could even impact the presidential election, especially if Castro joins Hillary on the Democratic ticket.
Bay Area residents have had it with high costs and congestion.
According to a 1,000-person poll conducted by the Bay Area Council, a business-sponsored public policy advocacy group, about one-third of people living in the nine counties surrounding the San Francisco Bay are considering moving. According to SF Gate, council president and CEO Jim Wunderman called it the region’s “canary in a coal mine,” forewarning danger if nothing’s done to remedy the issues.
The poll found that 34% of Bay Area residents say that they are either strongly and somewhat likely to move away. While 54% say they have no plans to do so, only 31% feel strongly about staying.
Plans for relocation aside, there has been a considerable drop in optimism in recent years. About 40% of residents think that the area is headed in the right direction, compared to 55% last year and 57% the year before. Meanwhile, another 40% think that the Bay Area is “seriously off the wrong track.” Notably, optimism positively correlates with higher income.
There has been an inexplicable divergence between the performance of the stock market and market fundamentals.
I believe that it is the growth in the monetary base, through excess bank reserves, that has created this divergence.
The correlation between the performance of the stock market and the ebb and flow of the monetary base continues to strengthen.
This correlation creates a conundrum for Fed policy.
It is the bubble that no one is talking about.
The Inexplicable Divergence
After the closing bell last Thursday, four heavyweights in the S&P 500 index (NYSEARCA:SPY) reported results that disappointed investors. The following morning, Alphabet (NASDAQ:GOOG) (NASDAQ:GOOGL), Microsoft (NASDAQ:MSFT), Starbucks (NASDAQ:SBUX) and Visa (NYSE:V) were all down 4% or more in pre-market trading, yet the headlines read “futures flat even as some big names tumble post-earnings.” This was stunning, as I can remember in the not too distant past when a horrible day for just one of these goliaths would have sent the broad market reeling due to the implications they had for their respective sector and the market as a whole. Today, this is no longer the case, as the vast majority of stocks were higher at the opening of trade on Friday, while the S&P 500 managed to close unchanged and the Russell 2000 (NYSEARCA:IWM) rallied nearly 1%.
This is but one example of the inexplicable divergence between the performance of the stock market and the fundamentals that it is ultimately supposed to reflect – a phenomenon that has happened with such frequency that it is becoming the norm. It is as though an indiscriminate buyer with very deep pockets has been supporting the share price of every stock, other than the handful in which the selling is overwhelming due to company-specific criteria. Then again, there have been rare occasions when this buyer seems to disappear.
Why did the stock market cascade during the first six weeks of the year? I initially thought that the market was finally discounting fundamentals that had been deteriorating for months, but the swift recovery we have seen to date, absent any improvement in the fundamentals, invalidates that theory. I then surmised, along with the consensus, that the drop in the broad market was a reaction to the increase in short-term interest rates, but this event had been telegraphed repeatedly well in advance. Lastly, I concluded that the steep slide in stocks was the result of the temporary suspension of corporate stock buybacks that occur during every earnings season, but this loss of demand has had only a negligible effect during the month of April.
The bottom line is that the fundamentals don’t seem to matter, and they haven’t mattered for a very long time. Instead, I think that there is a more powerful force at work, which is dictating the short- to intermediate-term moves in the broad market, and bringing new meaning to the phrase, “don’t fight the Fed.” I was under the impression that the central bank’s influence over the stock market had waned significantly when it concluded its bond-buying programs, otherwise known as quantitative easing, or QE. Now I realize that I was wrong.
The Monetary Base
In my view, the most influential force in our financial markets continues to be the ebb and flow of the monetary base, which is controlled by the Federal Reserve. In layman’s terms, the monetary base includes the total amount of currency in public circulation in addition to the currency held by banks, like Goldman Sachs (NYSE:GS) and JPMorgan (NYSE:JPM), as reserves.
Bank reserves are deposits that are not being lent out to a bank’s customers. Instead, they are either held with the central bank to meet minimum reserve requirements or held as excess reserves over and above these requirements. Excess reserves in the banking system have increased from what was a mere $1.9 billion in August 2008 to approximately $2.4 trillion today. This accounts for the majority of the unprecedented increase in the monetary base, which now totals a staggering $3.9 trillion, over the past seven years.
The Federal Reserve can increase or decrease the size of the monetary base by buying or selling government bonds through a select list of the largest banks that serve as primary dealers. When the Fed was conducting its QE programs, which ended in October 2014, it was purchasing US Treasuries and mortgage-backed securities, and then crediting the accounts of the primary dealers with the equivalent value in currency, which would show up as excess reserves in the banking system.
A Correlation Emerges
Prior to the financial crisis, the monetary base grew at a very steady rate consistent with the rate of growth in the US economy, as one might expect. There was no change in the growth rate during the booms and busts in the stock market that occurred in 2000 and 2008, as can be seen below. It wasn’t until the Federal Reserve’s unprecedented monetary policy intervention that began during the financial crisis that the monetary base soared, but something else also happened. A very close correlation emerged between the rising value of the overall stock market and the growth in the monetary base.
It is well understood that the Fed’s QE programs fueled demand for higher risk assets, including common stocks. The consensus view has been that the Fed spurred investor demand for stocks by lowering the interest rate on the more conservative investments it was buying, making them less attractive, which encouraged investors to take more risk.
Still, this does not explain the very strong correlation between the rising value of the stock market and the increase in the monetary base. This is where conspiracy theories arise, and the relevance of this data is lost. It would be a lot easier to measure the significance of this correlation if I had proof that the investment banks that serve as primary dealers had been piling excess reserves into the stock market month after month over the past seven years. I cannot. What is important for investors to recognize is that an undeniable correlation exists, and it strengthens as we shorten the timeline to approach present day.
The Correlation Cuts Both Ways Notice that the monetary base (red line) peaked in October 2014, when the Fed stopped buying bonds. From that point moving forward, the monetary base has oscillated up and down in what is a very modest downtrend, similar to that of the overall stock market, which peaked a few months later.
What I have come to realize is that these ebbs and flows continue to have a measurable impact on the value of the overall stock market, but in both directions! This is important for investors to understand if the Fed continues to tighten monetary policy later this year, which would require reducing the monetary base.
If we look at the fluctuations in the monetary base over just the past year, in relation to the performance of the stock market, a pattern emerges, as can be seen below. A decline in the monetary base leads a decline in the stock market, and an increase in the monetary base leads a rally in the stock market. The monetary base is serving as a leading indicator of sorts. The one exception, given the severity of the decline in the stock market, would be last August. At that time, investors were anticipating the first rate increase by the Federal Reserve, which didn’t happen, and the stock market recovered along with the rise in the monetary base.
If we replace the fluctuations in the monetary base with the fluctuations in excess bank reserves, the same correlation exists with stock prices, as can be seen below. The image that comes to mind is that of a bathtub filled with water, or liquidity, in the form of excess bank reserves. This liquidity is supporting the stock market. When the Fed pulls the drain plug, withdrawing liquidity, the water level falls and so does the stock market. The Fed then plugs the drain, turns on the faucet and allows the tub to fill back up with water, injecting liquidity back into the banking system, and the stock market recovers. Could this be the indiscriminate buyer that I mentioned previously at work in the market? I don’t know.
What I can’t do is draw a road map that shows exactly how an increase or decrease in excess reserves leads to the buying or selling of stocks, especially over the last 12 months. The deadline for banks to comply with the Volcker Rule, which bans proprietary trading, was only nine months ago. Who knows what the largest domestic banks that hold the vast majority of the $2.4 trillion in excess reserves were doing on the investment front in the years prior. As recently as January 2015, traders at JPMorgan made a whopping $300 million in one day trading Swiss francs on what was speculated to be a $1 billion bet. Was that a risky trade?
Despite the ban on proprietary trading imposed by the Volcker Rule, there are countless loopholes that weaken the statute. For example, banks can continue to trade physical commodities, just not commodity derivatives. Excluded from the ban are repos, reverse repos and securities lending, through which a lot of speculation takes place. There is also an exclusion for what is called “liquidity management,” which allows a bank to put all of its relatively safe holdings in an account and manage them with no restrictions on trading, so long as there is a written plan. The bank can hold anything it wants in the account so long as it is a liquid security.
My favorite loophole is the one that allows a bank to facilitate client transactions. This means that if a bank has clients that its traders think might want to own certain stocks or stock-related securities, it can trade in those securities, regardless of whether or not the clients buy them. Banks can also engage in high-frequency trading through dark pools, which mask their trading activity altogether.
As a friend of mine who is a trader for one of the largest US banks told me last week, he can buy whatever he wants within his area of expertise, with the intent to make a market and a profit, so long as he sells the security within six months. If he doesn’t sell it within six months, he is hit with a Volcker Rule violation. I asked him what the consequences of that would be, to which he replied, “a slap on the wrist.”
Regardless of the investment activities of the largest banks, it is clear that a change in the total amount of excess reserves in the banking system has a significant impact on the value of the overall stock market. The only conclusion that I can definitively come to is that as excess reserves increase, liquidity is created, leading to an increase in demand for financial assets, including stocks, and prices rise. When that liquidity is withdrawn, prices fall. The demand for higher risk financial assets that this liquidity is creating is overriding any supply, or selling, that results from a deterioration in market fundamentals.
There is one aspect of excess reserves that is important to understand. If a bank uses excess reserves to buy a security, that transaction does not reduce the total amount of reserves in the banking system. It simply transfers the reserves from the buyer to the seller, or to the bank account in which the seller deposits the proceeds from the sale, if that seller is not another bank. It does change the composition of the reserves, as 10% of the new deposit becomes required reserves and the remaining 90% remains as excess reserves. The Fed is the only institution that can change the total amount of excess reserves in the banking system, and as it has begun to do so over the past year, I think it is finally realizing that it must reap what it has sown.
The Conundrum
In order to tighten monetary policy, the Federal Reserve must drain the banking system of the excess reserves it has created, but it doesn’t want to sell any of the bonds that it has purchased. It continues to reinvest the proceeds of maturing securities. As can be seen below, it holds approximately $4.5 trillion in assets, a number which has remained constant over the past 18 months.
Therefore, in order to drain reserves, thereby reducing the size of the monetary base, the Fed has been lending out its bonds on a temporary basis in exchange for the reserves that the bond purchases created. These transactions are called reverse repurchase agreements. This is how the Fed has been reducing the monetary base, while still holding all of its assets, as can be seen below.
There has been a gradual increase in the volume of repurchase agreements outstanding over the past two years, which has resulted in a gradual decline in the monetary base and excess reserves, as can be seen below.
I am certain that the Fed recognizes the correlation between the rise and fall in excess reserves, and the rise and fall in the stock market. This is why it has been so reluctant to tighten monetary policy further. In lieu of being transparent, it continues to come up with excuses for why it must hold off on further tightening, which have very little to do with the domestic economy. The Fed rightfully fears that a significant market decline will thwart the progress it has made so far in meeting its mandate of full employment and a rate of inflation that approaches 2% (stable prices).
The conundrum the Fed faces is that if the rate of inflation rises above its target of 2%, forcing it to further drain excess bank reserves and increase short-term interest rates, it is likely to significantly deflate the value of financial assets, based on the correlation that I have shown. This will have dire consequences both for consumer spending and sentiment, and for what is already a stall-speed rate of economic growth. Slower rates of economic growth feed into a further deterioration in market fundamentals, which leads to even lower stock prices, and a negative-feedback loop develops. This reminds me of the deflationary spiral that took place during the financial crisis.
The Fed’s preferred measurement of inflation is the core Personal Consumption Expenditures, or PCE, price index, which excludes food and energy. The latest year-over-year increase of 1.7% is the highest since February 2013, and it is rapidly closing in on the Fed’s 2% target even though the rate of economic growth is moving in the opposite direction, as can be seen below.
The Bubble
If you have been wondering, as I have, why the stock market has been able to thumb its nose at an ongoing recession in corporate profits and revenues that started more than a year ago, I think you will find the answer in $2.4 trillion of excess reserves in the banking system. It is this abundance of liquidity, for which the real economy has no use, that is decoupling the stock market from economic fundamentals. The Fed has distorted the natural pricing mechanism of a free market, and at some point in the future, we will all learn that this distortion has a great cost.
Alan Greenspan once said, “how do we know when irrational exuberance has unduly escalated asset values?” Open your eyes.
What you see in the chart below is a bubble. It is much different than the asset bubbles we experienced in technology stocks and home prices, which is why it has gone largely unnoticed. It is similar from the standpoint that it has been built on exaggerated expectations of future growth. It is a bubble of the Fed’s own making, built on the expectation that an unprecedented increase in the monetary base and excess bank reserves would lead to faster rates of economic growth. It has clearly not. Instead, this mountain of money has either directly, or indirectly, flooded into financial assets, manipulating prices to levels well above what economic fundamentals would otherwise dictate.
The great irony of this bubble is that it is the achievement of the Fed’s objectives, for which the bubble was created, that will ultimately lead it to its bursting. It was an unprecedented amount of credit available at historically low interest rates that fueled the rise in home prices, and it has also been an unprecedented amount of credit at historically low interest rates that has fueled the rise in financial asset prices, including the stock market. How and when this bubble will be pricked remains a question mark, but what is certain is that the current level of excess reserves in the banking system that appear to be supporting financial markets cannot exist in perpetuity.


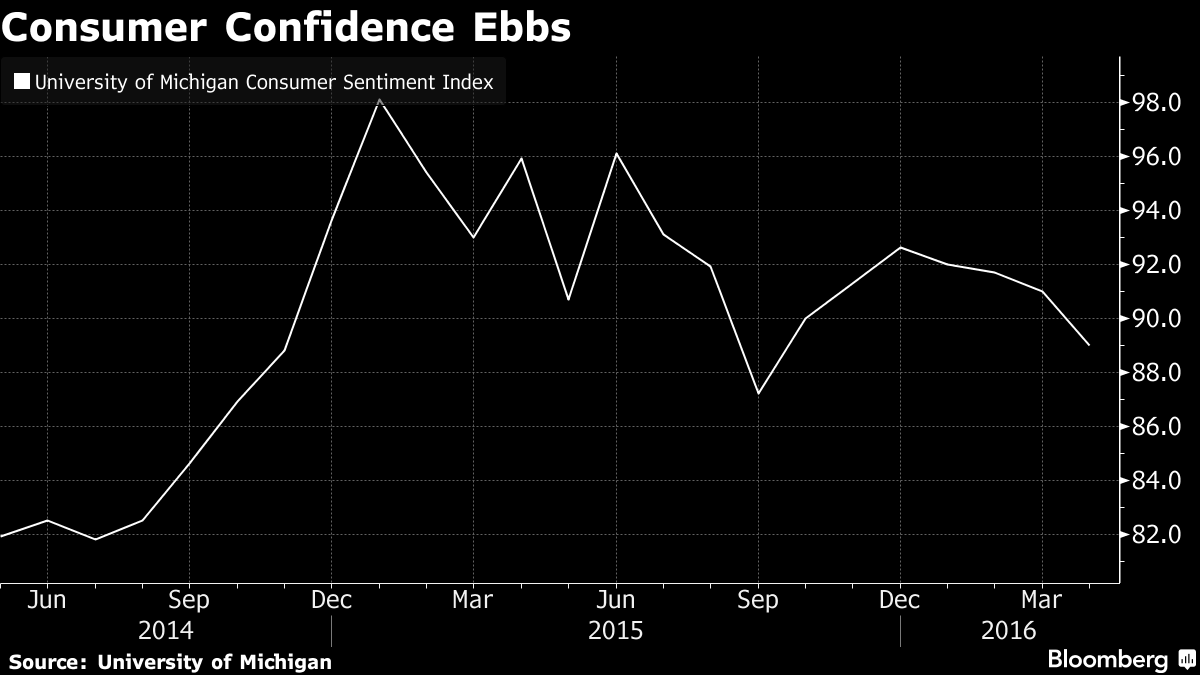
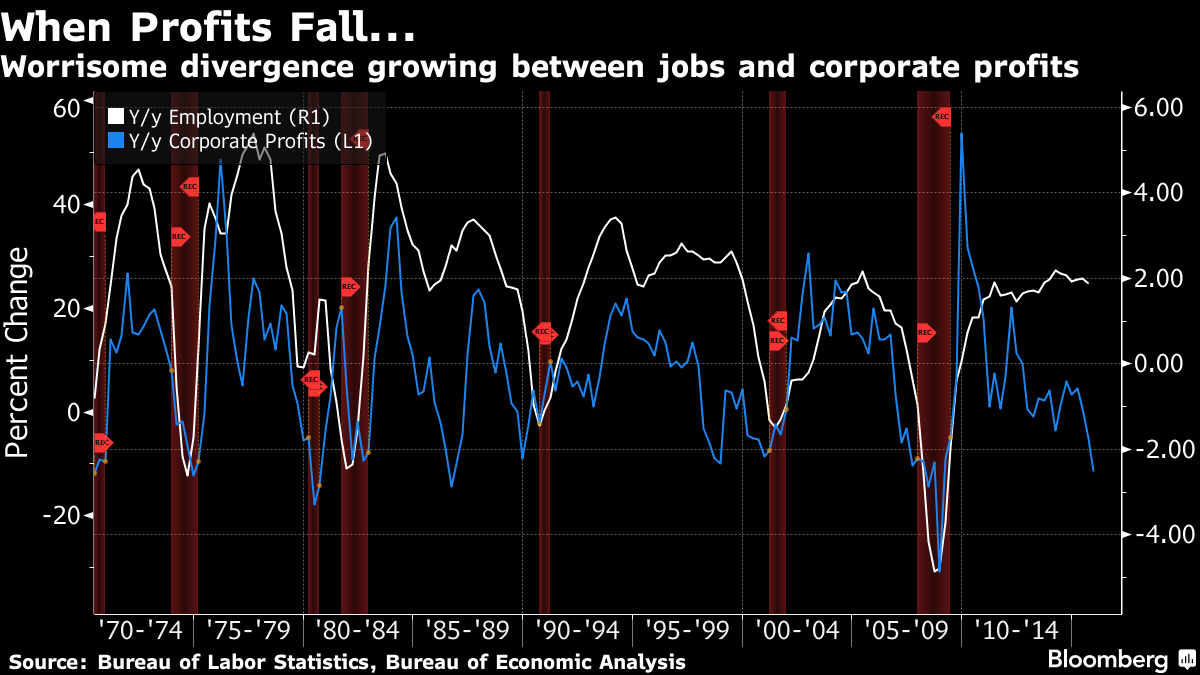


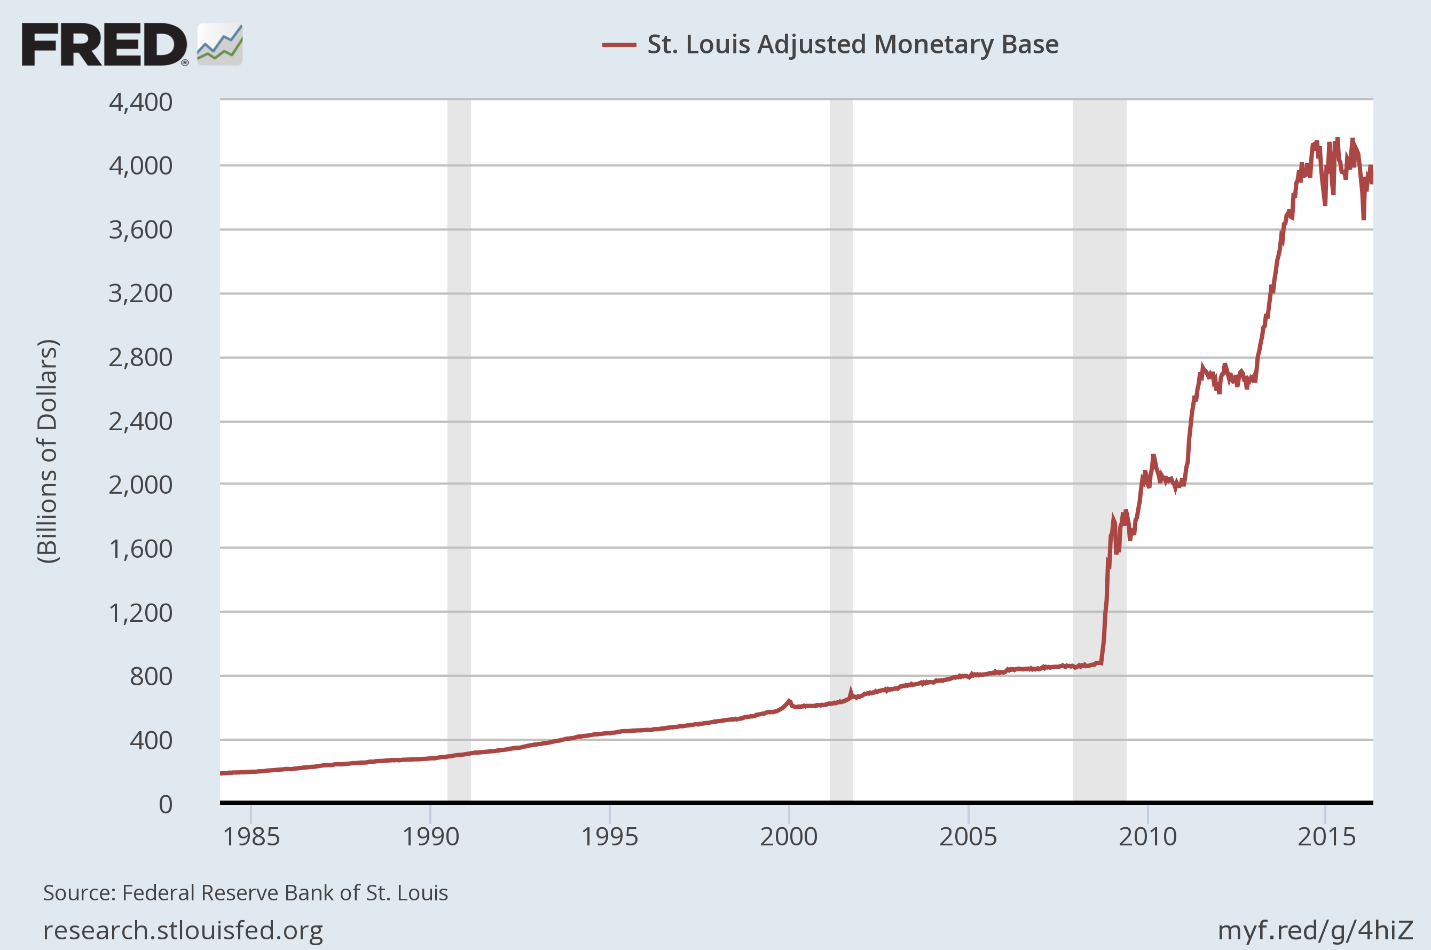
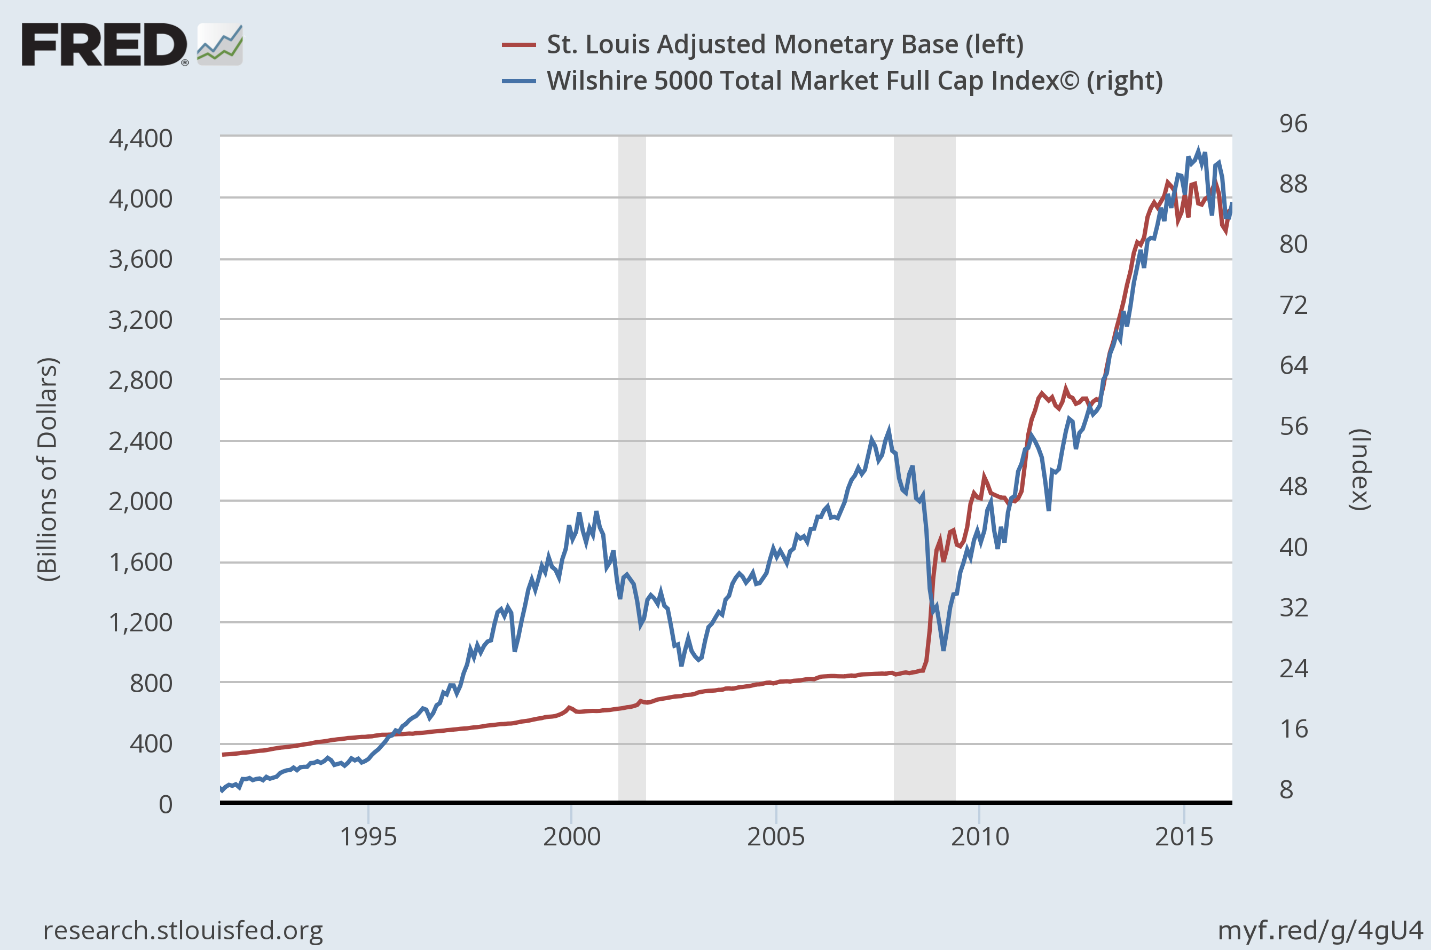
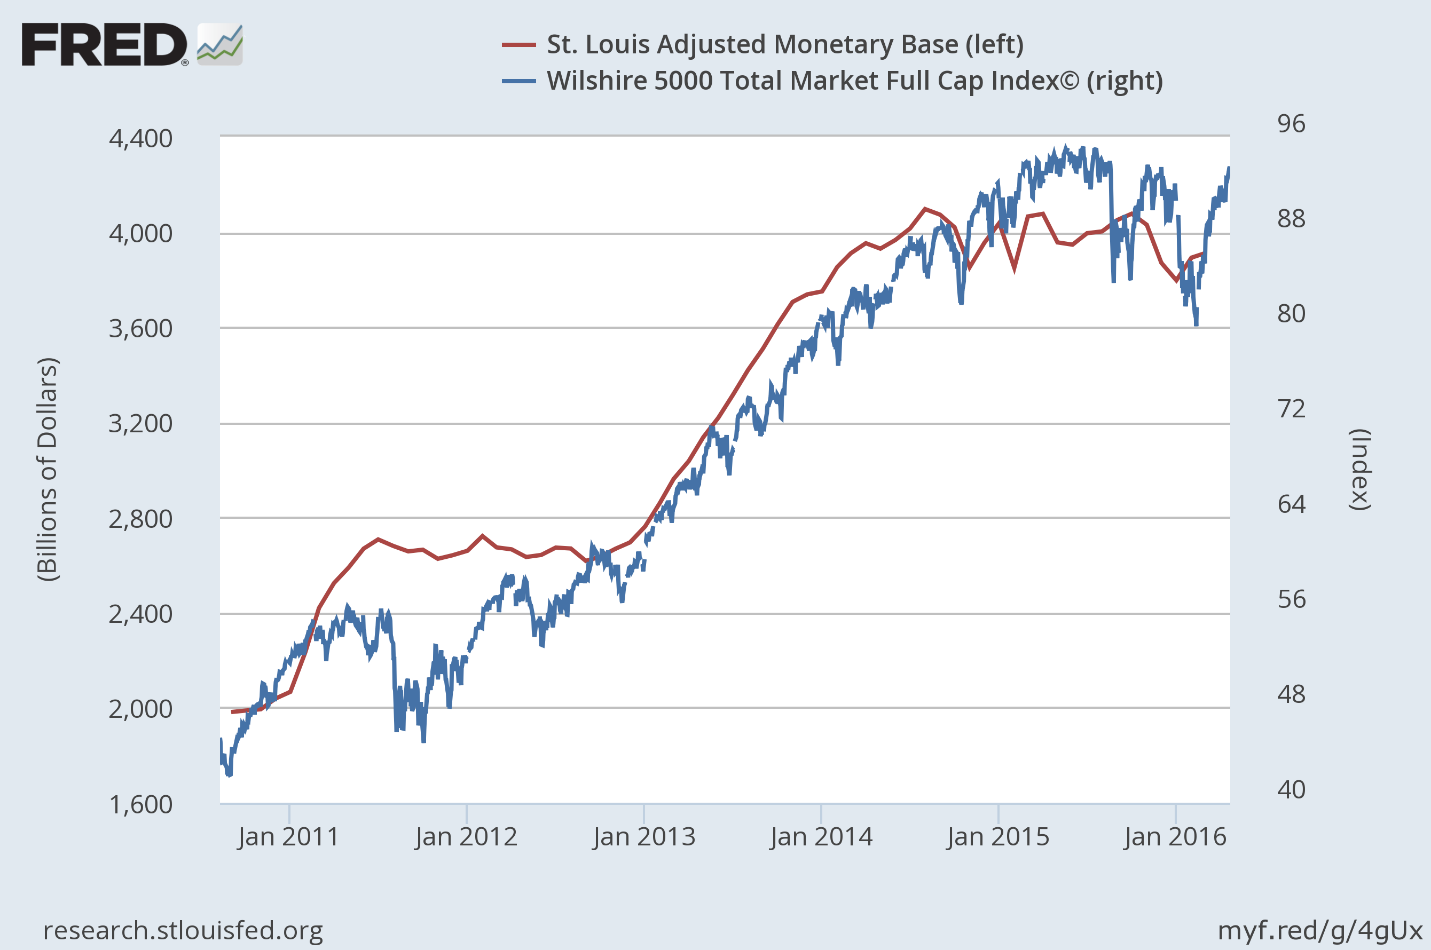
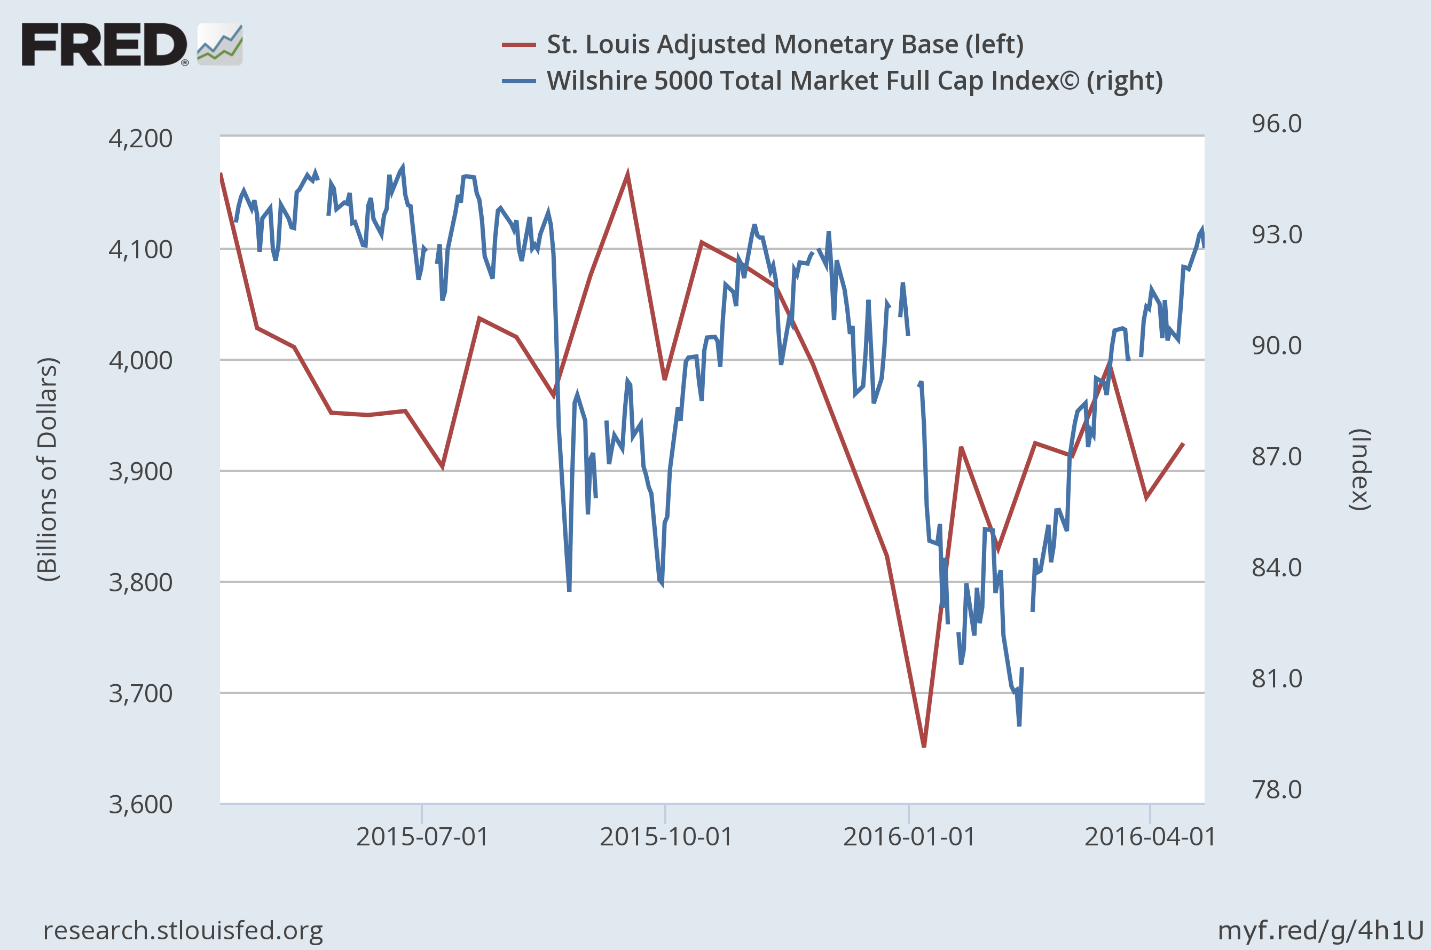
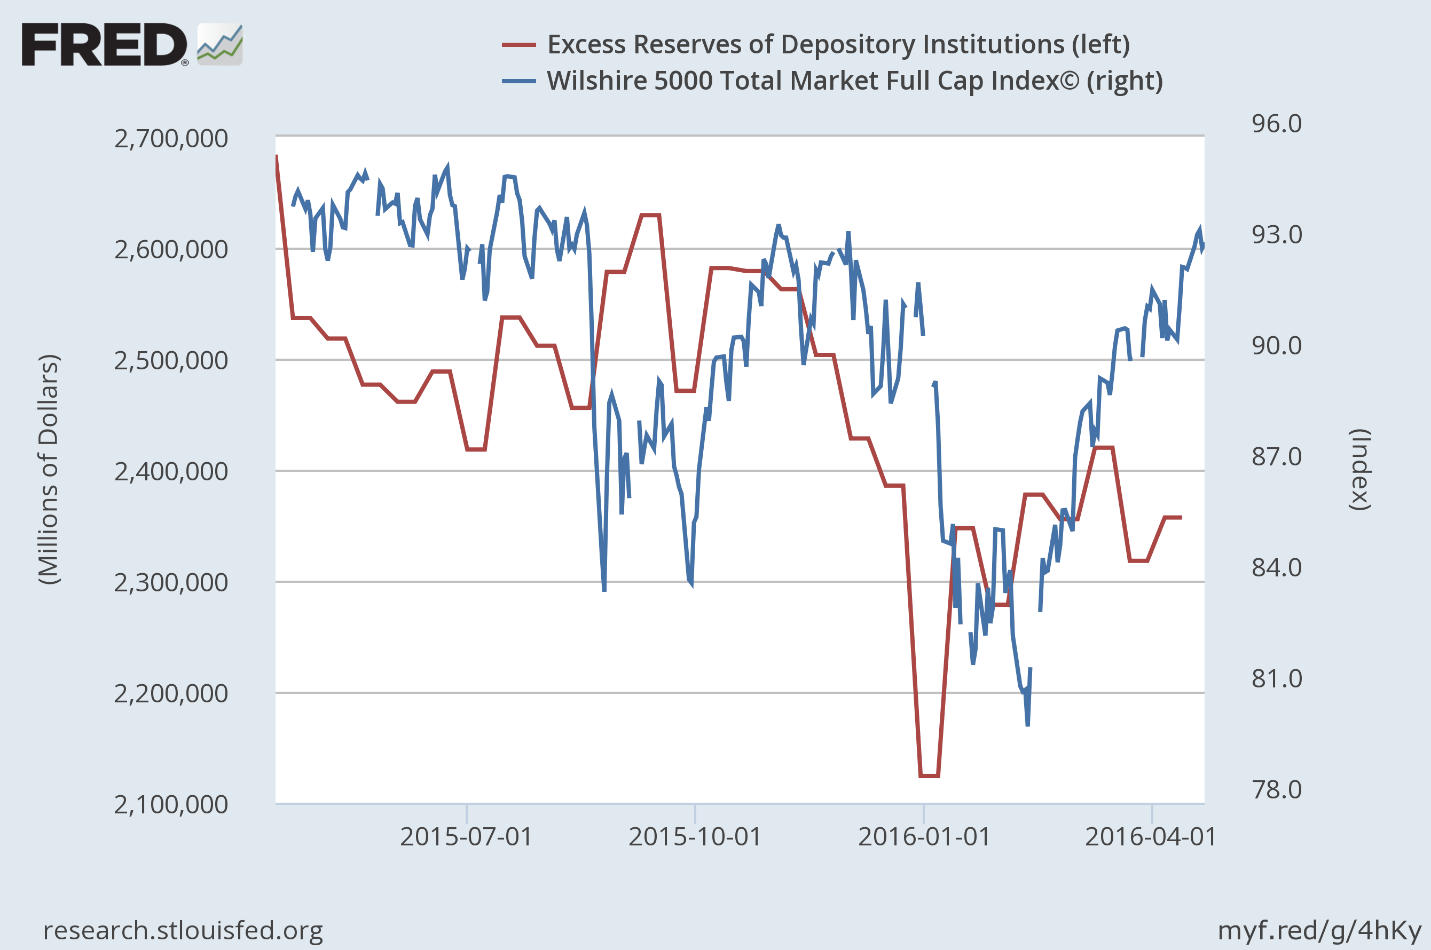
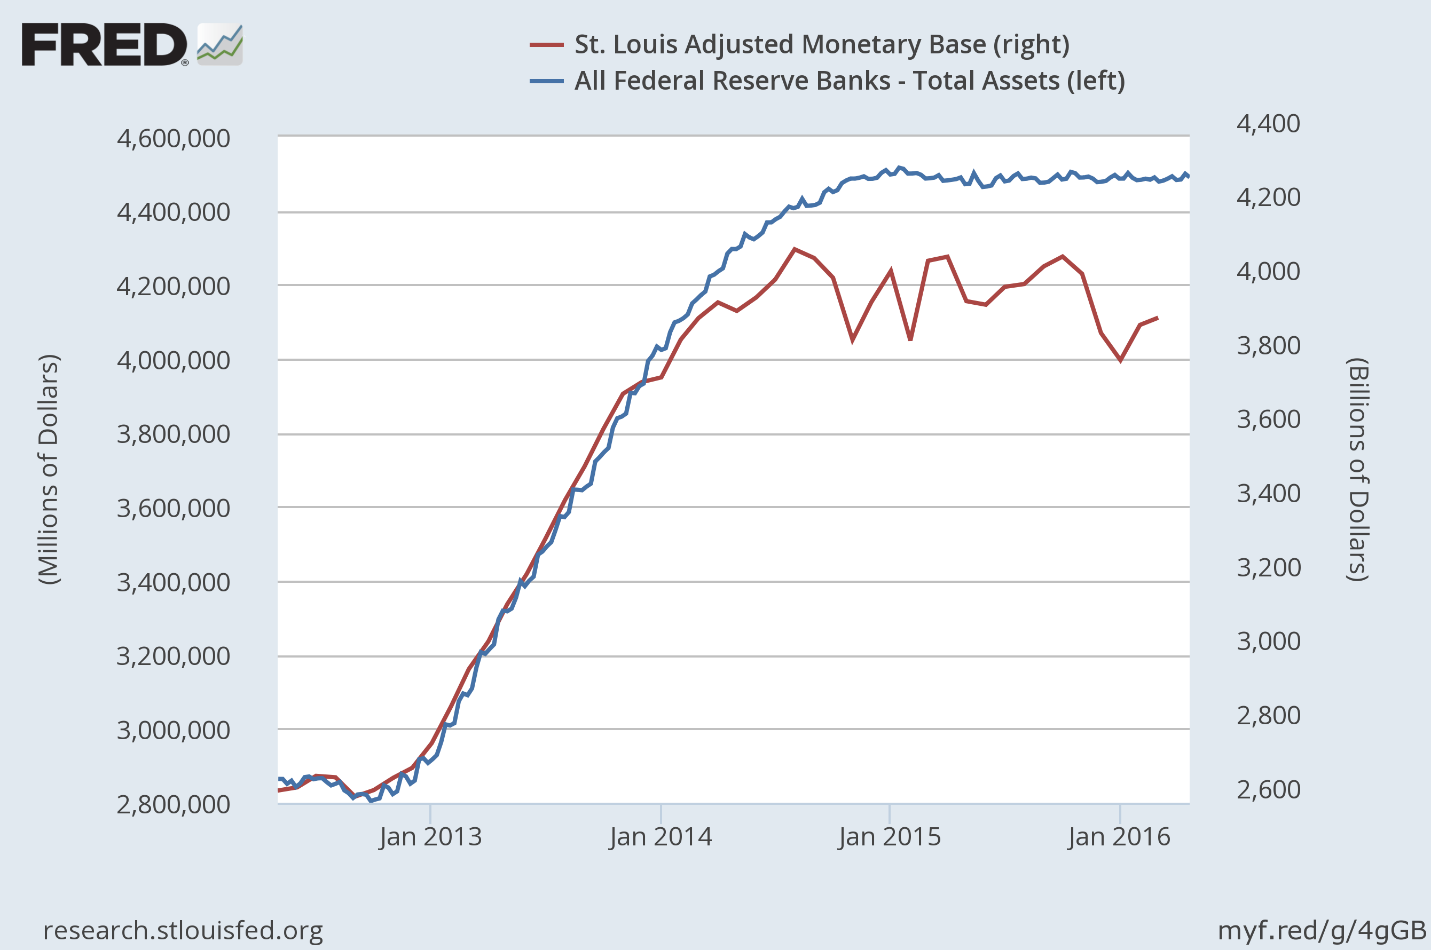
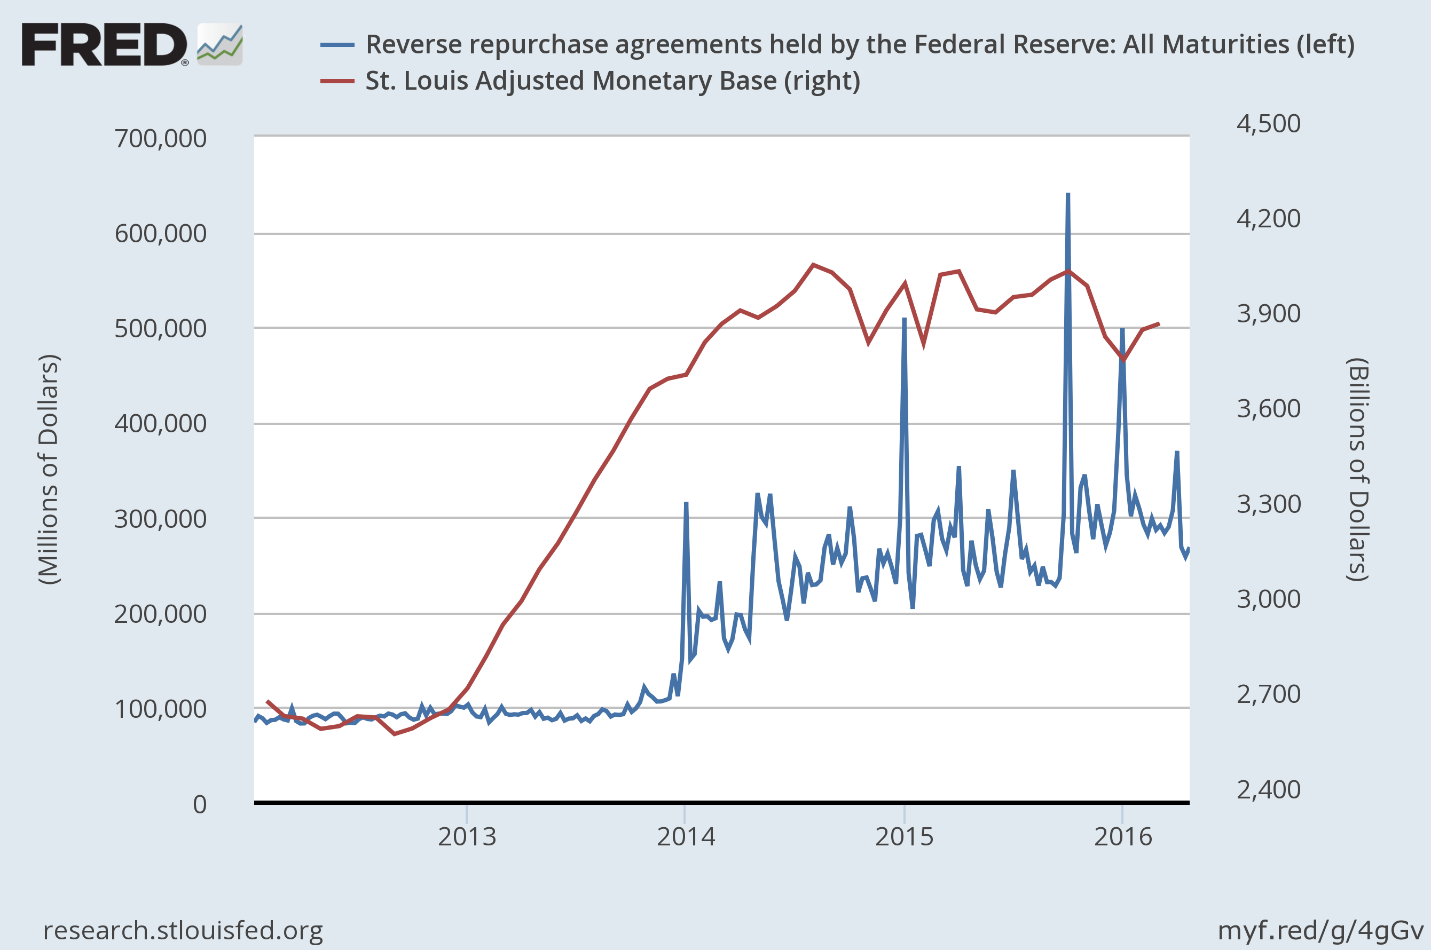
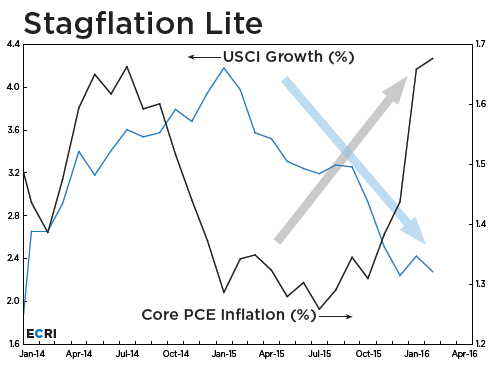

You must be logged in to post a comment.