(CNBC) Ride-hailing apps such as Uber and Lyft have been so disruptive to New York City’s taxi industry, they are causing lenders to fail.
Three New York-based credit unions that specialized in loaning money against taxi cab medallions, the hard-to-get licenses that allow the city’s traditional cab fleet to operate, have been placed into conservatorship as the value of those medallions has plummeted.
Just three years ago, cab owners and investors were paying as much as $1.3 million for a medallion. Now they are worth less than half that, and some medallion owners owe more on their loans than the medallions are worth.
“You’ve got borrowers who are under water. This is just like the subprime loan crisis,” said Keith Leggett, a credit union analyst and former senior economist at the American Bankers Association.
LOMTO Federal Credit Union, which was founded by taxi drivers in 1936 for mutual assistance, was placed into conservatorship by the National Credit Union Administration on June 26 “because of unsafe and unsound practices.”
New York City has the nation’s largest taxi industry, with more than 13,000 medallions.
Marcelino Hervias bought his medallion in 1990 for about $120,000 and thought its value would hit $2 million by the time he was ready to retire.
Instead, the 58-year-old said he owes $541,000 and is driving 12 to 16 hours a day to make ends meet.
“I celebrate my kids’ birthdays over the phone. Why?” Hervias said.
While some medallions are held by large owners with fleets, owning a single medallion was long seen as a ticket to the middle class for immigrants like Hervias, who is from Peru.
Many of them now owe more on their medallion loans than they originally paid for the medallions because they used their equity in the medallion for a home, a child’s education or other expenses.
Hervias said he borrowed against his medallion to pay for medical care for his mother, a new car and a visit to his homeland.
“Every time we want to go on vacation or do something, where do we go? To the equity of the medallion,” he said.
Other medallion owners tell similar stories.
Constant Granvil bought his medallion for $102,000 in 1987 and said he now owes more than $300,000 to his lender. He could have sold the medallion for two or three times that a few years ago, “but I said no, I’m not going to sell it,” said Granvil, who is 76. “And then I got caught.”
The value of Granvil’s medallion is hard to pinpoint because 2017 sale prices have varied from the $200,000s to the $500,000s depending on whether lenders are willing to finance the purchase.
Meanwhile, Granvil, who no longer drives because of poor health and uses a broker to hire a driver, said he is facing threats from the lender, Melrose Credit Union, to foreclose on not just his medallion, but also his house.
“How am I going to live?” he said. “And now Melrose wants to take my house?”
The New York State Department of Financial Services took possession of Melrose Credit Union in February and appointed the NCUA as conservator.
Critics say the federal agency is playing hardball with medallion owners like Granvil, who have been making their payments, by demanding that they pay off their loans in full or face foreclosure.
“They’re approaching it with this cookie-cutter idea,” said David Beier, head of the Committee for Taxi Safety, an association of taxi leasing agents. “They want you to mortgage your house to them as collateral. It’s forcing borrowers into bankruptcy.”
John Fairbanks, a spokesman for the NCUA, said that the agency has hired a management team to run Melrose and that it would be inappropriate to comment on the management team’s actions.
Supporters of the yellow cab industry have sued and pushed for city legislation to try to level the playing field between taxis and ride-hailing apps, which they say enjoy advantages like not paying a public transportation improvement surcharge that’s levied on yellow cabs and not having to outfit a percentage of cars with disabled-access features.
City Council member Ydanis Rodriguez, who chairs the council’s transportation committee, called this week for a panel to investigate the fall in medallion values.
According to a Morgan Stanley report, there were 11.1 million yellow cab trips in the city in April 2016, compared with 4.7 million Uber trips and 750,000 Lyft trips. The 11.1 million taxi rides were 9 percent fewer than the April 2015 number.
Some observers believe that the yellow cab’s market share will continue to shrink and that the value of a medallion won’t recover.
“This is a commodity that has been fundamentally disrupted,” said Leggett, who has written about medallion loans in his online newsletter Credit Union Watch. “I don’t see the value of the medallions getting close to what they were.”
Equity bears hunting for excess in the stock market might be better off worrying about bond prices, Alan Greenspan says. That’s where the actual bubble is, and when it pops, it’ll be bad for everyone.
“By any measure, real long-term interest rates are much too low and therefore unsustainable,” the former Federal Reserve chairman said in an interview. “When they move higher they are likely to move reasonably fast. We are experiencing a bubble, not in stock prices but in bond prices. This is not discounted in the marketplace.”
While the consensus of Wall Street forecasters is still for low rates to persist, Greenspan isn’t alone in warning they will break higher quickly as the era of global central-bank monetary accommodation ends. Deutsche Bank AG’s Binky Chadha says real Treasury yields sit far below where actual growth levels suggest they should be. Tom Porcelli, chief U.S. economist at RBC Capital Markets, says it’s only a matter of time before inflationary pressures hit the bond market.
“The real problem is that when the bond-market bubble collapses, long-term interest rates will rise,” Greenspan said. “We are moving into a different phase of the economy — to a stagflation not seen since the 1970s. That is not good for asset prices.”
Stocks, in particular, will suffer with bonds, as surging real interest rates will challenge one of the few remaining valuation cases that looks more gently upon U.S. equity prices, Greenspan argues. While hardly universally accepted,the theory underpinning his view, known as the Fed Model, holds that as long as bonds are rallying faster than stocks, investors are justified in sticking with the less-inflated asset.
Right now, the model shows U.S. stocks at one of the most compelling levels ever relative to bonds. Using Greenspan’s reference of an inflation-adjusted measure of bond yields, the gap between the S&P 500’s earnings yield of 4.7 percent and the 10-year yield of 0.47 percent is 21 percent higher than the 20-year average. That justifies records in major equity benchmarks and P/E ratios near the highest since the financial crisis.
If rates start rising quickly, investors would be advised to abandon stocks apace, Greenspan’s argument holds. Goldman Sachs Group Inc. Chief Economist David Kostin names the threat of rising inflation asone reasonhe isn’t joining Wall Street bulls in uppingyear-end estimatesfor the S&P 500.
While persistently low inflation would imply a fair value of 2,650 on the benchmark gauge, the more likely case is a narrowing of the gap between earnings and bond yields, Kostin says. He is sticking to his estimate that the index will finish the year at 2,400, implying a drop of about 3 percent from current levels.
That’s no slam dunk, as stocks have provenresilient to bond routsso far in the eight-year bull market. While the 10-year Treasury yield has peaked above 3 percent just once in the past six years, sudden spikes in yields in 2013 and after the 2016 election didn’t slow stocks from their grind higher.
Those shocks to the bond market proved short-lived, though, as tepid U.S. growth combined with low inflation to keep real and nominal long-term yields historically low.
That era could end soon, with the Fed widely expected to announce plans for unwinding its $4.5 trillion balance sheet and central banks around the world talking about scaling back stimulus.
“The biggest mispricing in our view across asset classes is government bonds,’’ Deutsche Bank’s Chadha said in an interview. “We should start to see inflation move up in the second half of the year.”
After dropping to an all time low 62.9% in Q2 of 2016, the US home ownership rate rebounded modestly in the subsequent two quarters, then dropped again at the start of the year, before once again rising fractionally to 63.7% in Q2 of 2017 from 63.6% in the previous quarter, just 1% from the all time lows in the series history going back to the mid 1960s.
A breakdown of the data by age group reveals that the primary driver for this decline has been the youngest age cohort. While older Americans, especially those 65 and older, have predictably seen only modest declines in their home ownership in recent decades, it was the youngest age group, those 35 and younger, the Millennials, who over the past decade have seen their home ownership decline steadily from the low 40%’s to the mid-30%, although in Q2 there was a glimmer of good news, as the home ownership rate for Americans 35 and younger posted its first increase in 3 quarters, rising from 34.3% to 35.3%.
As shown in the chart below, the homeownership rate for Millennials has declined from 43.6% in June 2004 to 35.3% in the latest qua rter, and just shy of the lowest rate reported by the Census Bureau going back nearly a quarter century. Of note: while Millennials finally splurged on houses in the latest quarter, the home ownership rates for every other age cohort declined.
But what was most notable in the latest Census data is that for yet another quarter, more Americans opted not to own, but rather rent, and in Q1 the median asking rent jumped by 7.4% Y/Y, from $864 in Q1 to $910.
Broken down by region, the sharpest spike in asking rents was in the Northeast and Western regions, whose median asking rents were nearly identical, at $1,182 and $1,192, an increase of 21% and 16%, respectively.
Finally, what makes the latest spike in rents curious is that while the homeownership vacancy rate declined in the latest quarter, the rental vacancy rate actually increased to 7.3% from 7.0%, the highest since Q1 2016. The rental vacancy has been increasing since Q2 2016 when it troughed at 6.7%, and has since posted four quarters of consecutive growth. It would seem counter intuitive that the vacancy rate is rising even as median asking rents are hitting new all time highs.
While a new record in rents is hardly what Americans want to hear, it will be music to the Fed’s ears as it means that contrary to various other calculations and imputations, inflation in the US is alive and well.
Unofficially, Libor died some time in 2012 when what until then was a giant “conspiracy theory” – namely that the world’s most important reference index, setting the price for $350 trillion in loans, credit and derivative securities had been rigged for years – was confirmed.Officially, Libor died earlier today when the top U.K. regulator, the Financial Conduct Authority which regulates Libor, said the scandal-plagued index would be phased out and that work would begin for a transition to alternate, and still undetermined, benchmarks by the end of 2021.
As Andrew Bailey,chief executive of the FCA, explainedthe decision to eliminate Libor was made as the amount of interbank lending has hugely diminished and as a result “we do not think markets can rely on Libor continuing to be available indefinitely.”
He is right: whether as a result of central banks effectively subsuming unsecured funding needs, or simply due to trader fears of being caught “red-handed” for simply trading it, the number of transactions directly involving Libor have virtually ground to a halt.According to the WSJ, “in one case banks setting the Libor rate for one version of the benchmark executed just 15 transactions in that currency and duration for the whole of 2016.”
As the WSJ adds, the U.K. regulator has the power to compel banks to submit data to calculate the benchmark. “But we do not think it right to ask, or to require, that panel banks continue to submit expert judgments indefinitely,” he said, adding that many banks felt “discomfort” at the current set up. The FCA recently launched an exercise to gather data from 49 banks to see which institutions are most active in the interbank lending market.
Commeting on the decision, NatWest Markets’ Blake Gwinn told Bloomberg that the decision was largely inevitable: “There had never been an answer as to how you get market participants to adopt a new benchmark. It was clear at some point authorities were going to force them. The FCA can compel people to participate in Libor. What can ICE do if they’ve lost the ability to get banks to submit Libor rates?”
Gwinn then mused that “in the meantime, what’s today’s trade? The U.K. has Sonia, but the U.S. doesn’t have a market. There’s still so much uncertainty at this point” Yesterday, “a Libor swap meant something. Now you can’t rely on swaps for balance-sheet hedging.”
And so the inevitable decision which many had anticipated, was finally made: after 2021 Libor will be no more.
Below is a brief history of what to many was and still remains the most important rate:
1986: First Libor rates published.
2008: WSJ articles show concerns with Libor. Regulators begin probes.
2012: Barclays becomes first bank to settle Libor-rigging allegations. U.K. regulator pledges to reform the benchmark.
2014: Intercontinental Exchange takes control of administering Libor.
2015: Trader Tom Hayes gets 14-year prison sentence after Libor trial.
2017: U.K. regulator plans to phase in Libor alternatives over five years.
Yet while anticipated, the surprising announcement of Libor’s upcoming death has taken many traders by surprise, not least because so many egacy trades still exist. As BLoomberg’s Cameron Crise writes, “There is currently an open interest of 170,000 eurodollar futures contracts expiring in 2022 and beyond – contracts that settle into a benchmark that will no longer exist. What are existing contract holders and market makers supposed to do?“
Then there is the question of succession: with over $300 trillion in derivative trades, and countless billion in floating debt contracts, currently referening Libor, the pressing question is what will replace it, and how will the transition be implemented seamlessly?
The FCA’s CEO didn’t set out exactly what a potential replacement for Libor might look like but a group within the Bank of England is already working on potential replacements. “However, any shift will have to be phased in slowly.”
Bailey said it was up to the IBA and banks to decide how to move Libor-based contracts to new benchmarks. After 2021 IBA could choose to keep Libor running, but the U.K. regulator would no longer compel banks to submit data for the benchmark.
The Fed has already been gearing up for the replacement: last month the Alternative Reference Rates Committee, a group made up of the largest US banks, voted to use a benchmark based on short-term loans known as repurchase agreements or “repo” trades, backed by Treasury securities, to replace U.S. dollar Libor. The new rate is expected to be phased in starting next year,and the group will hold its inaugural meeting in just days, on August 1.
The problem with a repo-based replacement, however, is that it will take the placidity of the existing reference rate, and replace it with a far more volatile equivalent. As Crise points, out, “since 2010 the average daily standard deviation of three month dollar Libor is 0.7 basis points. The equivalent measure for GC repo is 4.25 bps. That’s a completely different kettle of fish.”
So as the countdown to 2021 begins, what replaces Libor is not the only question: a bigger problem, and perhaps the reason why Libor was so irrelevant since the financial crisis, is that short-term funding costs since the financial crisis were virtually non-existent due to ZIRP and NIRP. Now that rates are once again rising, the concern will be that not does a replacement index have to be launched that has all the functionality of Libor (ex rigging of course), but that short-term interest rates linked to the Libor replacement will be inevitably rising. And, for all those who follow funding costs and the upcoming reduction in liquidity in a world of hawkish central banks, this means that volatility is guaranteed. In other words, this forced transition is coming in the worst possible time.
Then again, as many have speculated, with the next recession virtually assured to hit well before 2021, it is much more likely that this particular plan, like so many others, will be indefinitely postponed long before the actual deadline.
Amazon wiped out billions of dollars worth of grocery store market cap last month when they announced plans to purchase Whole Foods. The announcement sent shares of Kroger, Wal-Mart, Sprouts, and Target, among others, plunging… (WMT -4%, TGT -5.5%, SFM -7.6%, KR -12%).
But, as we pointed out back in May, well before Amazon’s decision to buy Whole Foods, Amazon’s success in penetrating the traditional grocery market was always a matter of when, not if. Concept stores, like Amazon Go, already exist that virtually eliminate the need for dozens of in-store employees which will allow them to generate higher returns at lower price points than traditional grocers. And, with grocery margins averaging around 1-2% at best, if Amazon, or anyone for that matter, can truly create smart stores with no check outs and cut employees in half they can effectively destroy the traditional supermarket business model.
And while the demise of the traditional grocery store will undoubtedly take time (recall that people were calling for the demise of Blockbuster for nearly a decade before it finally happened), make no mistake that the retail grocery market 10-15 years from now will not look anything like the stores you visit today.
And while the demise of the traditional grocery store will undoubtedly take time (recall that people were calling for the demise of Blockbuster for nearly a decade before it finally happened), make no mistake that the retail grocery market 10-15 years from now will not look anything like the stores you visit today.
So, grocers have a choice: (i) adapt to the technological revolution that is about to transform their industry or (ii) face the same slow death that ultimately claimed the life of Blockbuster.
As such, as the theSt. Louis Post-Dispatchpoints out today, the relatively small Midwest grocery store chain of Schnucks has decided to roll out the first of what could eventually be a large fleet of grocery stocking robots.
A slender robot named Tally soon will be roaming the aisles at select Schnucks groceries, on the lookout for out-of-stock items and verifying prices.
Maryland Heights-based Schnuck Markets, which operates 100 stores in five states, on Monday will begin testing its first Tally at its store at 6600 Clayton Road in Richmond Heights. The pilot test is expected to last six weeks. A second Tally will appear in coming weeks at Schnucks stores at 1060 Woods Mill Road in Town and Country and at 10233 Manchester Road in Kirkwood.
The robots are the first test of the technology in Missouri and could ultimately be expanded to more Schnucks stores.
Each 30-pound robot is equipped with sensors to help it navigate the store’s layout and avoid bumping into customers’ carts. When it detects product areas that aren’t fully stocked, the data is shared with store management staff so the retailer can make changes, said Dave Steck, Schnuck Markets’ vice president of IT and infrastructure.
Tally, created by a San Francisco-based company named Simbe, is also being tested at other mass merchants and dollar stores all across the country.
Founded in 2014, Simbe has placed Tally robots in mass merchants, dollar stores and groceries across the country, including some Target stores in San Francisco last year.
“The goal of Tally is to create more of a feedback mechanism,” Bogolea said. “Although most retailers have good supply chain intelligence, and point-of-sale data on what they’ve sold, what’s challenging for retailers is understanding the true state of merchandise on shelves. Everyone sees value in higher quality, more frequent information across the entire value chain.”
The robot does take breaks. When Tally senses it’s low on power, it finds its way to a charging dock. And, the robot is designed to stay out of the way of customers. If it detects a congested area, it’ll return to the aisle when it’s less busy. If a shopper approaches the robot, it’s programmed to stop moving.
Meanwhile, with nearly 40,000 grocery stores in the U.S. employing roughly 3.5mm people, most of whom work at or near minimum wage, Bernie’s “Fight for $15” agitators may want to take note of this development.
When you arise in the morning, think of what a precious privilege it is to be alive, to breathe, to think, to enjoy, to love.
–Marcus Aurelius–
Why is it so hard to do the things that are in line with our goals but not with our desires at that moment? How can we harness the power of our minds to create a steady fountain of self-discipline each day?
Dealing with Negative People: Advice from a Roman Emperor
I believe happiness is 10% circumstances and 90% attitude.
How you react to your circumstances makes the biggest impact – and the way you choose to deal with negative people is no exception.
As the ruler of a vast empire, Marcus Aurelius had to deal with negative people on a daily basis. In his writings – the self-addressed Meditations – Aurelius provides us with a quote about dealing with negative people that I find to be an incredibly helpful reminder for setting my attitude.
WASHINGTON, DC – Expectations for 2017 economic growth remain at 2.0 percent amid a projected second half slowdown, according to the Fannie Mae Economic & Strategic Research (ESR) Group’s July 2017 Economic and Housing Outlook. With the expansion having entered its ninth year, incoming data point to a second quarter economic growth rebound to 2.7 percent annualized, up from 1.4 percent in the first quarter. However, the full percentage point rise in the saving rate since December signals increased caution among consumers, despite elevated consumer confidence. Decelerating corporate profit growth, commonly seen in the late stages of an expansion, presents a challenge to business investment that is compounded by tax policy uncertainty. In addition, residential investment will likely contribute less to second half growth due to lackluster homebuilding activity and tight for-sale inventory that is restraining home sales. Consequently, se cond half growth is expected to slow slightly to 1.9 percent. Moderate growth is expected to continue in 2018, with potential changes to fiscal and monetary policy posing both upside and downside risks to the forecast.
“While second quarter growth is poised to rebound, we expect growth to moderate through the remainder of 2017. Consumer spending, traditionally the largest contributor to economic growth, is sluggish and is lagging positive consumer sentiment and solid hiring,” said Fannie Mae Chief Economist Doug Duncan. “While labor market slack continues to diminish, wage growth is not accelerating and inflation has moved further below the Fed’s target. These conditions support our call that the Fed will continue gradual monetary policy normalization, announce its balance sheet tapering policy in September, and wait until December for additional data, especially on inflation, before raising the fed funds rate for the third time this year.”
“Construction activity has lost some steam following the first quarter’s weather-driven boost,” Duncan continued. “Meanwhile, very lean inventory continues to act as a boon for home prices and a bane for affordability, particularly among potential first-time homeowners. According to our second quarterMortgage Lender Sentiment Survey, lenders expect to ease credit standards further. However, we continue to project that the pace of growth in total home sales will slow to 3.3 percent this year, as we believe rapid home price gains amid scarce supply will remain a hurdle for potential homebuyers despite improvements in credit access.”
Visit theEconomic & Strategic Researchsite atwww.fanniemae.comto read the full July 2017 Economic Outlook, including the Economic Developments Commentary, Economic Forecast, Housing Forecast, and Multifamily Market Commentary. To receive e-mail updates with other housing market research from Fannie Mae’s Economic & Strategic Research Group, pleaseclick here.
Existing Home Sales in June Dive 1.8 Percent: Same Old Problem? Second and Third Quarter Impact?
The wind down to the end of the second quarter is not going very well. Existing home sales in June fell 1.8% to a seasonally adjusted annualized rate of 5.52 million. The Econoday consensus estimate was 5.58 million.
The slip in pending home sales was no false signal as existing home sales fell 1.8 percent in June to a lower-than-expected annualized rate of 5.520 million. Year-on-year, sales are still in the plus column but not by much, at 0.7 percent which is the lowest reading since February.
Compared to sales, prices are rich with the median of $263,800 up 6.5 percent from a year ago. Another negative for sales is supply which fell 0.5 percent in the month to 1.96 million for an on-year decline of 7.1 percent. Relative to sales, supply is at 4.3 months vs 4.2 months in May.
High prices appear to be keeping first-time buyers out of the market with the group representing 32 percent of sales vs 33 percent in May and 35 percent for all of last year.
Rising prices and thin supply, not to mention low wages, are offsetting favorable mortgage rates and holding down sales. Housing data have been up and down and unable to find convincing traction so far this year. Watch for new home sales on Wednesday where general strength is the expectation.
Existing Homes Sales Month-Over-Month and Year-Over-Year
Existing home sales slipped in June, with the blame again placed on low levels of inventory. The decline in sales, announced on Monday by the National Association of Realtors® (NAR), was anticipated, as pending home sales have decreased in each of the previous three months, ticking down 0.8 percent in May.
NAR said sales of existing single-family houses, townhouses, condos and cooperative apartments were down 1.8 percent in June, to a seasonally adjusted annual rate of 5.52 million units, the second slowest performance of the year.
Lawrence Yun, NAR chief economist, says the pullback in existing home sales in June reflected the lull in contract activity in March, April, and May. “Closings were down in most of the country last month because interested buyers are being tripped up by supply that remains stuck at a meager level and price growth that’s straining their budget,” he said. “The demand for buying a home is as strong as it has been since before the Great Recession. Listings in the affordable price range continue to be scooped up rapidly, but the severe housing shortages inflicting many markets are keeping a large segment of would-be buyers on the sidelines.”
The median existing-home price for all housing types in June was $263,800, up 6.5 percent from June 2016 ($247,600). This is a new peak price, surpassing the record set in May. June marked the 64th straight month of year-over-year gains.
The median existing single-family home price was $266,200 in June and the median existing condo price was $245,900. Those prices reflected annual increases of 6.6 percent and 6.5 percent respectively.
The tight supply of homes continues to be reflected in short marketing period. Properties typically stayed on the market for 28 days in June, one day more than in May, but six days fewer than in June 2016. Short sales were on the market the longest at a median of 102 days in June, while foreclosures sold in 57 days and non-distressed homes took 27 days. Fifty-four percent of homes sold in June were on the market for less than a month.
“Prospective buyers who postponed their home search this spring because of limited inventory may have better luck as the summer winds down,” said NAR President William E. Brown. “The pool of buyers this time of year typically begins to shrink as households with children have likely closed on a home before school starts. Inventory remains extremely tight, but patience may pay off in coming months for those looking to buy.”
First-time buyers accounted for 32 percent of existing home sales in June, down from 33 percent the previous month and a year earlier, while individual investors purchased 13 percent, unchanged from a year ago.
Convoluted Logic
Supposedly buyers may have better luck because the pool of buyers is shrinking as summer winds down. Really? By that logic, if there was only one person looking there would be a 100% success rate.
Yun says “The demand for buying a home is as strong as it has been since before the Great Recession.”
Really? By what measure?
Attitudes and Price
This is not a case of inventory or strong unmet demand. Here are the real factors.
The Fed re-blew the housing bubble and wages did not keep up. People cannot afford the going prices. Thus, the number of first-time buyers keeps shrinking.
Millenials do not have the same attitudes towards debt, housing, and family formations as their parents.
Millenials are unwilling to spend money they do not have, for a place that will keep them tied down. They would rather be mobile.
Second and Third Quarter Impact
The decline in existing home purchases portends weakness in consumer spending.
There will be fewer people painting, buying furniture, updating appliances, remodeling kitchens, adding landscaping etc. The pass through effect will be greatest in the third quarter unless there is a rebound.
College graduates and other young Americans are increasingly clustering in urban centers like New York City, Chicago and Boston. And now, American companies are starting to follow them. Companies looking to appeal to, and be near, young professionals versed in the world of e-commerce, software analytics, digital engineering, marketing and finance are flocking to cities. But in many cases, they’re leaving their former suburban homes to face significant financial difficulties, according tothe Washington Post.
Earlier this summer, health-insurer Aetna said it would move its executives, plus most of technology-focused employees to New York City from Hartford, Conn., the city where the company was founded, and where it prospered for more than 150 years.GE said last year it would leave its Fairfield, Conn., campus for a new global headquarters in Boston. Marriott International is moving from an emptying Maryland office park into the center of Bethesda.
Meanwhile, Caterpillar is moving many of its executives and non-manufacturing employees to Deerfield, Ill. from Peoria, Ill., the manufacturing hub that CAT has long called home. And McDonald’s is leaving its longtime home in Oak Brook, Ill. for a new corporate campus in Chicago.
“Visitors to the McDonald’s wooded corporate campus enter on a driveway named for the late chief executive Ray Kroc, then turn onto Ronald Lane before reaching Hamburger University, where more than 80,000 people have been trained as fast-food managers.
Surrounded by quiet neighborhoods and easy highway connections, this 86-acre suburban compound adorned with walking paths and duck ponds was for four decades considered the ideal place to attract top executives as the company rose to global dominance.
Now its leafy environs are considered a liability. Locked in a battle with companies of all stripes to woo top tech workers and young professionals, McDonald’s executives announced last year that they were putting the property up for sale and moving to the West Loop of Chicago where “L” trains arrive every few minutes and construction cranes dot the skyline.”
The migration to urban centers, according toWaPo,threatens the prosperity outlying suburbs have long enjoyed, bringing a dose of pain felt by rural communities and exacerbating stark gaps in earnings and wealth that Donald Trump capitalized on in winning the presidency.
Many of these itinerant companies aren’t really moving – or at least not entirely. Some, like Caterpillar, are only moving executives, along with workers involved in technology and marketing work, while other employees remain behind.
“Machinery giant Caterpillar said this year that it was moving its headquarters from Peoria to Deerfield, which is closer to Chicago. It said it would keep about 12,000 manufacturing, engineering and research jobs in its original home town. But top-paying office jobs — the type that Caterpillar’s higher-ups enjoy — are being lost, and the company is canceling plans for a 3,200-person headquarters aimed at revitalizing Peoria’s downtown.”
Big corporate moves can be seriously disruptive for a cohort of smaller enterprises that feed on their proximity to big companies, from restaurants and janitorial operations to other subcontractors who located nearby. Plus, the cancellation of the new headquarters was a serious blow. Not to mention the rollback in public investment.
“It was really hard. I mean, you know that $800 million headquarters translated into hundreds and hundreds of good construction jobs over a number of years,” Peoria Mayor Jim Ardis (R) said.
For the village of Oak Brook, being the home of McDonald’s has always been a point of pride. Over the year’s the town’s brand has become closely intertwined with the company’s. But as McDonald’s came under pressure to update its offerings for the Internet age, it opened an office in San Francisco and a year later moved additional digital operations to downtown Chicago, strategically near tech incubators as well as digital outposts of companies that included Yelp and eBay. That precipitated the much larger move it is now planning to make.
“The village of Oak Brook and McDonald’s sort of grew up together. So, when the news came, it was a jolt from the blue — we were really not expecting it,” said Gopal G. Lalmalani, a cardiologist who also serves as the village president.
Lalmalani is no stranger to the desire of young professionals to live in cities: His adult daughters, a lawyer and an actress, live in Chicago. When McDonald’s arrived in Oak Brook, in 1971, many Americans were migrating in the opposite direction, away from the city. In the years since, the tiny village’s identity became closely linked with the fast-food chain as McDonald’s forged a brand that spread across postwar suburbia one Happy Meal at a time.
“It was fun to be traveling and tell someone you’re from Oak Brook and have them say, ‘Well, I never heard of that,’ and then tell them, ‘Yes, you have. Look at the back of the ketchup package from McDonald’s,’ ” said former village president Karen Bushy. Her son held his wedding reception at the hotel on campus, sometimes called McLodge.
The village showed its gratitude — there is no property tax — and McDonald’s reciprocated with donations such as $100,000 annually for the Fourth of July fireworks display and with an outsize status for a town of fewer than 8,000 people.”
Robert Gibbs, the former White House press secretary who is now a McDonald’s executive vice president, said the company had decided that it needed to be closer not just to workers who build e-commerce tools but also to the customers who use them.
“The decision is really grounded in getting closer to our customers,” Gibbs said.
Some in Oak Brook have begun to invent conspiracy theories about why McDonald’s is moving, including one theory that the company is trying to shake off its lifetime employees in Oak Brook in favor of hiring cheaper and younger urban workers.
“The site of the new headquarters, being built in place of the studio where Oprah Winfrey’s show was filmed, is in Fulton Market, a bustling neighborhood filled with new apartments and some of the city’s most highly rated new restaurants.
Bushy and others in Oak Brook wondered aloud if part of the reasoning for the relocation was to effectively get rid of the employees who have built lives around commuting to Oak Brook and may not follow the company downtown. Gibbs said that was not the intention.
‘Our assumption is not that some amount [of our staff] will not come. Some may not. In some ways that’s probably some personal decision. I think we’ve got a workforce that’s actually quite excited with the move,’ he said.”
Despite Chicago’s rapidly rising murder rate and one would think its reputation as an indebted, crime-ridden metropolis would repel companies looking for a new location for their headquarters. But crime and violence rarely penetrate Chicago’s tony neighborhoods like the Loop, where most corporate office space is located.
“Chicago’s arrival as a magnet for corporations belies statistics that would normally give corporate movers pause. High homicide rates and concerns about the police department have eroded Emanuel’s popularity locally, but those issues seem confined to other parts of the city as young professionals crowd into the Loop, Chicago’s lively central business district.
Chicago has been ranked the No. 1 city in the United States for corporate investment for the past four years by Site Selection Magazine, a real estate trade publication.
Emanuel said crime is not something executives scouting new offices routinely express concerns about. Rather, he touts data points such as 140,000 — the number of new graduates local colleges produce every year.
“Corporations tell me the number one concern that t: Zerohey have — workforce,” he said.”
Chicago Mayor Rahm Emanuel said the old model, where executives chose locations near where they wanted to live has been upturned by the growing influence of technology in nearly every industry. Years ago, IT operations were an afterthought. Now, people with such expertise are driving top-level corporate decisions, and many of them prefer to live in cities.
“It used to be the IT division was in a back office somewhere,” Emanuel said. “The IT division and software, computer and data mining, et cetera, is now next to the CEO. Otherwise, that company is gone.”
Even the Fed put commercial real estate on its financial-stability worry list.
No, the crane counters were not wrong. In 2017, the ongoing apartment building-boom in the US will set a new record: 346,000 new rental apartments in buildings with 50+ units are expected to hit the market.
How superlative is this? Deliveries in 2017 will be 21% above the prior record set in 2016, based on data going back to 1997, by Yardi Matrix,via Rent Café. And even 2015 had set a record. Between 1997 and 2006, so pre-Financial-Crisis, annual completions averaged 212,740 units; 2017 will be 63% higher!
These numbers do not include condos, though many condos are purchased by investors and show up on the rental market. And they do not include apartments in buildings with fewer than 50 units. This chart shows just how phenomenal the building boom of large apartment developments has been over the past few years:
The largest metros are experiencing the largest additions to the rental stock. The chart below shows the number of rental apartments to be delivered in those metros in 2017. But caution in over-interpreting the chart – the population sizes of the metros differ enormously.
The New York City metro includes Northern New Jersey, Central New Jersey, and White Plains and is by far the largest metro in the US. So the nearly 27,000 apartments it is adding this year cannot be compared to the 5,400 apartments for San Francisco (near the bottom of the list). The city of San Francisco is small (about 1/10th the size of New York City itself), and is relatively small even when part of the Bay Area is included.
Other metros on this list are vast, such as the Dallas-Fort Worth metro which includes the surrounding cities such as Plano. Driving through the area on I-35 East gives you a feel for just how vast the metro is. However, I walk across San Francisco in less than two hours:
Special note: Chicago is adding 7,800 apartments even though the population has begun to shrink. So this isn’t necessarily going to work out.
This building boom of large apartment buildings is starting to have an impact on rents. In nearly all of the 12 most expensive rental markets, median asking rents have fallen from their peaks, and in several markets by the double digits,including Chicago (-19%!), Honolulu, San Francisco, and New York City.
And it has an impact on the prices of these buildings. Apartments are a big part of commercial real estate. They’re highly leveraged. Government Sponsored Enterprises such as Fanny Mae guarantee commercial mortgages on apartment buildings and package them in Commercial Mortgage-Backed Securities. So taxpayers are on the hook. Banks are on the hook too.
This is big business. And it is now doing something it hasn’t done since the Great Recession. The Commercial Property Price Index (CPPI) byGreen Street, which tracks the “prices at which commercial real estate transactions are currently being negotiated and contracted,” plateaued briefly in December through February and then started to decline. By June, it was below where it had been in June 2016 – the first year-over-year decline since the Great Recession:
Some segments in the CPPI were up, notably industrial, which rose 9% year over year, benefiting from the shift to ecommerce, which entails a massive need for warehouses by Amazon [Is Amazon Eating UPS’s Lunch?] and other companies delivering goods to consumers.
But prices of mall properties fell 5%, prices of strip retail fell 4%, and prices of apartment buildings fell 3% year-over-year.
So for renters, there is some relief on the horizon, or already at hand – depending on the market. There’s nothing like an apartment glut to bring down rents. See what the oil glut in the US has done to the price of oil.
Investors in apartment buildings, lenders, and taxpayers (via Fannie Mae et al. that guarantee commercial mortgage-backed securities), however, face a treacherous road. Commercial real estate goes in cycles as the above chart shows. Those cycles are not benign. Plateaus don’t last long. And declines can be just as sharp, or sharper, than the surges, and the surges were breath-taking.
Even the Fed has put commercial real estate on its financial-stability worry list and has been tightening monetary policy in part to tamp down on the multi-year price surge. The Fed is worried about the banks, particularly the smaller banks that are heavily exposed to CRE loans and dropping collateral values.
But the new supply of apartment units hitting the market in 2018 and 2019 will even be larger. In Seattle, for example, there are 67,507 new apartment units in the pipeline.
Therental apocalypsecontinues in Los Angeles. It is interesting to see how far some house humpers will go trying to justify prices. Some are arguing future weed sales are going to create another boom which is somewhat ironic since the benefits are actually to mellow you out, not turn you into a Taco Tuesday baby boomer that becomes a cubicle stressed slave just to purchase a home. And many times people plan on having a family shortly after which means higher childcare costs which they tend to forget. However, Los Angeles once again continues to be theworst place to rent in terms of affordability(and own for that matter). Zillow put out some interesting research and of course as you would expect, those spending nearly half of their income on rent are simply not saving for retirement.
L.A. is the Whole Foods of rental markets
I liken the L.A. housing market to Whole Foods. Great and healthy items that usually break the bank. L.A. has a large number of young and healthy hipsters and Millennials but most can’t buy a home. Heck, most Uber and Lyft drivers have nicer cars than most of us. So we live in this market where the perception is that everyone is well off and healthy when in reality many homeowners are stuck in a ridiculous commute for acrap shack and that is bad for your health.
Of course this isn’t some made up figure. Just take a look at how much income is dumped on rent in various markets:
Los Angeles by far is the worst market for renters surpassing even New York and San Francisco. I’ve made this argument multiple times and that has to do with incomes being far lower in this area compared toSan Franciscoand New York. Of course to house humpers they only see coastal Santa Monica and somehow use this as the reference for every other hood in the area where most of the plebs live. They forget that L.A. County has 10,000,000 people with most not living on the coast.
So it is also telling that L.A. is largely a renting household dominated county. You havemillions of Millennialsacross the state living at home with their parents because rents are too expensive. There is also this romantic idea that many people are stashing millions of dollars away by doing this but the stats show a different story. Some are, but most are not.
What you have is Taco Tuesday baby boomers now stuck in granite countertop HGTV upgraded sarcophagi that they can’t leave for a variety of reasons including locked in Prop 13 tax assessments and adult children back in their nursery rooms. You also have the issue of low inventory that is plaguing the country:
The low inventory dilemma is not only a SoCal phenomenon but has also impacted most urban metro markets. This is why housing as an entire asset class has soared with the stock market since 2009. Unlike the stock market however, scarcity has been a large factor driving prices up in real estate.
The issue of rents is problematic however. As the percentage of households that rent grows, you are going to get those in the middle being squeezed. What do renter households care if taxes get increased on property if they don’t own? Back in 1978 when Prop 13 passed you had a much larger percentage of California homeowners. Today that is clearly not the case. “Well we’ll just increase the rent and pass it on!” Do you think people think like this? Of course not! Just take a look at New York City where only 31 percent of households own. And look at how they tax people there. That is the future. Where only the uber elite will be comfortable in their homes. Grandfathered in Taco Tuesday baby boomer homeowners will live in million dollarcrap shacksand shop at the 99 Cents Store.
The idea that broke Millennials were going to buy in mass in Los Angeles never made sense. Many would rather eat out, work out, and live a more Spartan life (many by necessity). Ironically more are healthier than those pot belly cubicle dwellers that are stuck in obscene traffic everyday having to make that massive 30-year mortgage commitment. But hey, we do live in the Whole Foods of housing markets.
The housing market is suffering from a supply shortage, not a demand dilemma. As Millennial first-time homebuyer demand continues to increase, the inventory of homes for sale tightens. At the same time, prices are increasing, so why aren’t there more homeowners selling their homes?
In most markets, the seller, or supplier, makes their decision about adding supply to the market independent of the buyer, or source of demand, and their decision to buy. In the housing market, the seller and the buyer are, in many cases, actually the same economic actor. In order to buy a new home, you have to sell the home you already own.
So, in a market with rising prices and strong demand, what’s preventing existing homeowners from putting their homes on the market?
“Existing homeowners are increasingly financially imprisoned in their own home by their historically low mortgage rate. It makes choosing a kitchen renovation seem more appealing than moving.”
The housing market has experienced a long-run decline in mortgage rates from a high of 18 percent for the 30-year, fixed-rate mortgage in 1981 to a low of almost 3 percent in 2012. Today, five years later, mortgage rates remain just a stone’s throw away from that historic low point. This long-run decline in rates encouraged existing homeowners to both move more often and to refinance more often, in many cases refinancing multiple times between each move.
It’s widely expected that mortgage rates will rise further. This is more important than we may even realize because the housing market has not experienced a rising rate environment in almost three decades! No longer is there a financial incentive to refinance for most homeowners, and there’s more to consider when moving. Why move when it will cost more each month to borrow the same amount from the bank? A homeowner can re-extend the mortgage term another 30 years to increase the amount one can borrow at the higher rate, but the mortgage has to be paid off at some point. Hopefully before or soon after retirement. Existing homeowners are increasingly financially imprisoned in their own home by their historically low mortgage rate. It makes choosing a kitchen renovation seem more appealing than moving.”
There is one more possibility caused by the fact that the existing-home owner is both seller and buyer. In today’s market, sellers face a prisoner’s dilemma, a situation in which individuals don’t cooperate with each other, even though it is seemingly in their best interest to do so.
Consider two existing homeowners. They both want to buy a new house and move, but are unable to communicate with each other. If they both choose to sell, they both benefit because they increase the inventory of homes available, and collectively alleviate the supply shortage. However, if one chooses to sell and the other doesn’t, the seller must buy a new home in a market with a shortage of supply, bidding wars and escalating prices. Because of this risk, neither homeowner sells (non-cooperation) and neither get what they wanted in the first place – a move to a new, more desirable home. Imagine this scenario playing out across an entire market. If everyone sells there will be plenty of supply. But, the risk of selling when others don’t convinces everyone not to sell and produces the non-cooperative outcome.
Possible Outcomes
Owner moves, but pays a price escalated by supply shortages for a more desirable home
Owner stays in current house and does not get a more desirable home
Owner moves, finding a more desirable home without paying a price escalated by supply shortages
Rising mortgage rates and the fear of not being able to find something affordable to buy is imprisoning homeowners and causing the inventory shortages that are seen in practically every market across the country. So, what gives in a market short of supply relative to demand? Prices.According to the First American Real House Price Index, the fast pace of house price growth, combined with rising rates, has had a material impact on affordability. In our most recent analysis in April, affordability was down 11 percent compared to a year ago. It was once said that a man’s home is his castle. In today’s market, a man’s home may be his prison, but he is getting wealthier for it.
The formation of a BRICS gold marketplace, which could bypass the U.S. Petrodollar in bilateral trade, continues to take shape as Russia’s largest bank, state-owned Sberbank, announced this week that its Swiss subsidiary had begun trading in gold on the Shanghai Gold Exchange.
Russian officials have repeatedly signaled that they plan to conduct transactions with China using gold as a means of marginalizing the power of the US dollar in bilateral trade between the geopolitically powerful nations. This latest movement is quite simply the manifestation of a larger geopolitical game afoot between great powers.
Sberbank was granted international membership of the Shanghai exchange in September last year and in July completed a pilot transaction with 200 kg of gold kilobars sold to local financial institutions, the bank said.
Sberbank plans to expand its presence on the Chinese precious metals market and anticipates total delivery of 5-6 tonnes of gold to China in the remaining months of 2017.
Gold bars will be delivered directly to the official importers in China as well as through the exchange, Sberbank said.
Russia’s second-largest bank VTB is also a member of the Shanghai Gold Exchange.
To be clear, there is a revolutionary transformation of the entire global monetary system currently underway, being driven by an almost perfect storm. The implications of this transformation are extremely profound for U.S. policy in the Middle East, which for nearly the past half century has been underpinned by its strategic relationship with Saudi Arabia.
THE RISE & FALL OF THE PETRODOLLAR
The dollar was established as the global reserve currency in 1944 with the Bretton Woods agreement, commonly referred to as the gold standard. The U.S. leveraged itself into this power position by holding the largest reserve of gold in the world. The dollar was pegged at $35 an ounce — and freely exchangeable into gold.
By the 1960s, a surplus of U.S. dollars caused by foreign aid, military spending, and foreign investment threatened this system, as the U.S. did not have enough gold to cover the volume of dollars in worldwide circulation at the rate of $35 per ounce; as a result, the dollar was overvalued.
America temporarily embraced a new paradigm in 1971, as the dollar became a pure fiat currency (decoupled from any physical store of value), until the petrodollar agreement was concluded by President Nixon in 1973.
The quid pro quo was that Saudi Arabia would denominate all oil trades in U.S. dollars, and in return, the U.S. would agree to sell Saudi Arabia military hardware and guarantee the defense of the Kingdom.
Areport by the Centre for Research on Globalizationclarifies the implications of these most recent moves by the Russians and the Chinese in an ongoing drive to replace the US petrodollar as the global reserve currency:
Fast forward to March 2017; the Russian Central Bank opened its first overseas office in Beijing as an early step in phasing in a gold-backed standard of trade. This would be done by finalizing the issuance of the first federal loan bonds denominated in Chinese yuan and to allow gold imports from Russia.
The Chinese government wishes to internationalize the yuan, and conduct trade in yuan as it has been doing, and is beginning to increase trade with Russia. They’ve been taking these steps with bilateral trading, native trading systems and so on. However, when Russia and China agreed on their bilateral US$400 billion pipeline deal, China wished to, and did, pay for the pipeline with yuan treasury bonds, and then later for Russian oil in yuan.
This evasion of, and unprecedented breakaway from, the reign of the US dollar monetary system is taking many forms, but one of the most threatening is the Russians trading Chinese yuan for gold. The Russians are already taking Chinese yuan, made from the sales of their oil to China, back to the Shanghai Gold Exchange to then buy gold with yuan-denominated gold futures contracts – basically a barter system or trade.
The Chinese are hoping that by starting to assimilate the yuan futures contract for oil, facilitating the payment of oil in yuan, the hedging of which will be done in Shanghai, it will allow the yuan to be perceived as a primary currency for trading oil. The world’s top importer (China) and exporter (Russia) are taking steps to convert payments into gold. This is known. So, who would be the greatest asset to lure into trading oil for yuan? The Saudis, of course.
All the Chinese need is for the Saudis to sell China oil in exchange for yuan. If the House of Saud decides to pursue that exchange, the Gulf petro-monarchies will follow suit, and then Nigeria, and so on. This will fundamentally threaten the petrodollar.
According to areport by the Russian government media, significant progress has been made in promoting bilateral trade in yuan, between the two nations, as the first step towards an even more ambitious plan—using gold to make transactions:
One measure under consideration is the joint organization of trade in gold. In recent years, China and Russia have been the world’s most active buyers of the precious metal.
On a visit to China last year, deputy head of the Russian Central Bank Sergey Shvetsov said that the two countries want to facilitate more transactions in gold between the two countries.
In April, Sberbank expressed interest in financing the direct import of gold to India—also a BRICS member. Make no mistake that a BRICS gold marketplace could be used to bypass the dollar in bilateral trade, and undermine the hegemonic control enjoyed by the US petrodollar as the global reserve currency.
“In 2014 Russia and China signed two mammoth 30-year contracts for Russian gas to China. The contracts specified that the exchange would be done in Renminbi [yuan] and Russian rubles, not in dollars. That was the beginning of an accelerating process of de-dollarization that is underway today.” according to strategic risk consultant F. William Engdahl.
“A Russian-Chinese alternative to the dollar in the form of a gold-backed ruble and gold-backed Renminbi or yuan, could start a snowball exit from the US dollar, and with it, a severe decline in America’s ability to use the reserve dollar role to finance her wars with other peoples’ money,”
Each new policy destroys another level of prudent fiscal/financial discipline.
The primary driver of our economy–financialization–is in a death spiral. Financialization substitutes expansion of interest, leverage and speculation for real-world expansion of goods, services and wages.
Financial “wealth” created by leveraging more debt on a base of real-world collateral that doesn’t actually produce more goods and services flows to the top of the wealth-power pyramid, driving the soaring wealth-income inequality we see everywhere in the global economy.
As this phantom wealth pours into assets such as stocks, bonds and real estate, it has pushed the value of these assets into the stratosphere, out of reach of the bottom 95% whose incomes have stagnated for the past 16 years.
The core problem with financialization is that it requires ever more extreme policies to keep it going. These policies are mutually reinforcing, meaning that the total impact becomes geometric rather than linear. Put another way, the fragility and instability generated by each new policy extreme reinforces the negative consequences of previous policies.
These extremes don’t just pile up like bricks–they fuel a parabolic rise in systemic leverage, debt, speculation, fragility, distortion and instability.
This accretive, mutually reinforcing, geometric rise in systemic fragility that is the unavoidable output of financialization is poorly understood, not just by laypeople but by the financial punditry and professional economists.
Gordon Long and I cover the policy extremes which have locked our financial system into a death spiral in a new 50-minute presentation, The Road to Financialization. Each “fix” that boosts leverage and debt fuels a speculative boom that then fizzles when the distortions introduced by financialization destabilize the real economy’s credit-business cycle.
Each new policy destroys another level of prudent fiscal/financial discipline.
The discipline of sound money? Gone.
The discipline of limited leverage? Gone.
The discipline of prudent lending? Gone.
The discipline of mark-to-market discovery of the price of collateral? Gone.
The discipline of separating investment and commercial banking, i.e. Glass-Steagall? Gone.
The discipline of open-market interest rates? Gone.
The discipline of losses being absorbed by those who generated the loans? Gone.
And so on: every structural source of discipline has been eradicated, weakened or hollowed out. Financialization has consumed the nation’s seed corn, and the harvest of instability is ripening in the fields of finance and the real economy alike.
(ZeroHedge) Sir Richard Branson once said that the quickest way to become a millionaire was to take a billion dollars and buy an airline. But, as EnerVest Ltd, a Houston-based private equity firm that focuses on energy investments, recently found out, there’s more than one way to go broke investing in extremely volatile sectors.
As theWall Street Journalpoints out today, EnerVest is a $2 billion private-equity fund that borrowed heavily at the height of the oil boom to scoop up oil and gas wells. Unfortunately, shortly after those purchases were made, energy prices plunged leaving the fund’s equity, supplied primarily by pensions, endowments and charitable foundations, worth essentially nothing.
The outcome will leave investors in the 2013 fund with, at most, pennies for every dollar they invested, the people said. At least one investor, the Orange County Employees Retirement System, already has marked its investment down to zero, according to a pension document.
Though private-equity investments regularly flop, industry consultants and fund investors say this situation could mark the first time that a fund larger than $1 billion has lost essentially all of its value.
EnerVest’s collapse shows how debt taken on during the drilling boom continues to haunt energy investors three years after a glut of fuel sent prices spiraling down.
But, at least John Walker, EnerVest’s co-founder and chief executive, expressed some remorse for investors by confirming to the WSJ that they “are not proud of the result.”
All of which leaves EnerVest with the rather unflattering honor of being perhaps the only private equity fund in history to ever raise over $1 billion in capital from investors and subsequently lose pretty much 100% of it.
Only seven private-equity funds larger than $1 billion have ever lost money for investors, according to investment firm Cambridge Associates LLC. Among those of any size to end in the red, losses greater than 25% or so are almost unheard of, though there are several energy-focused funds in danger of doing so, according to public pension records.
EnerVest has attempted to restructure the fund, as well as another raised in 2010 that has struggled with losses, to meet repayment demands from lenders who were themselves writing down the value of assets used as collateral, according to public pension documents and people familiar with the efforts.
So, who’s getting wiped out? Oh, the usual list of pension funds, charities and university endowments.
A number of prominent institutional investors are at risk of having their investments wiped out, including Caisse de dépôt et placement du Québec, Canada’s second-largest pension, which invested more than $100 million. Florida’s largest pension fund manager and the Western Conference of Teamsters Pension Plan, a manager of retirement savings for union members in nearly 30 states, each invested $100 million, according to public records.
The fund was popular among charitable organizations as well. The J. Paul Getty Trust, John D. and Catherine T. MacArthur and Fletcher Jones foundations each invested millions in the fund, according to their tax filings.
Michigan State University and a foundation that supports Arizona State University also have disclosed investments in the fund.
Luckily, we’re somewhat confident that at least the losses accrued by U.S.-based pension funds will be ultimately be backstopped by taxpayers…so no harm no foul.
The three-month average home price in the Toronto area is down a record 14.2% following a flood of new listings and an interest rate hike by the Bank of Canada.
Sales fell most in eight years. Did Canada’s housing bubble just burst?
Total home sales in Greater Toronto dropped to 5,977 in June, the lowest level since 2010 and down 15.1 percent from the month prior, data from the Canadian Real Estate Association show. Average prices are down 14.2 percent since March — the fastest 3-month decline in the history of the data back to 1988 — while the ratio of sales to new listings sits at its lowest level since 2009.
The June data comes after a series of measures by policy makers to tighten access to the market — and before the Bank of Canada hiked its benchmark interest rate last week, the first increase since 2010 that will further pinch mortgage eligibility. Prices and sales also fell in nearby regions such as Hamilton-Burlington and Kitchener-Waterloo, CREA data show.
Lawmakers, concerned that escalating prices could lead to a disorderly correction, imposed measures including tightened mortgage eligibility rules and a tax on foreign buyers. Toronto’s market has lost momentum, while in Vancouver sales plummeted last year on similar measures but have since rebounded.
The economists expect Toronto to follow Vancouver’s path — price adjustment at the top of the market with less impact at lower prices. Meanwhile, cities like Montreal and Ottawa look strong.
Vancouver rebounded after the restrictions and economists expect Toronto will do the same.
But at some point sanity will return. The bottom in both markets is a long way down.
(ZeroHedge) Shanghai’s status as an emerging tech hub is bringing with it problems related to overcrowding experienced by US cities like San Francisco and certain parts of New York City – namely out-of-control rents and home prices.
But now, the cities’ mid-tier office drones, some of whom may not have enough cash saved to “commit” to an apartment, have a new low-cost housing alternative. They’re called shared compartments, and they’re are popping up in office buildings around Shanghai. Users pay to sleep in the compartments for a set amount of time. They’re given disposable bedding to make sleeping more comfortable, and the compartments are disinfected automatically by ultraviolet light after each use.
Photos of these compartments have been circulating on Chinese media:
People can enjoy a rest in the compartment by scanning the QR codes for payment.
A man experiences a shared compartment in Shanghai…
The inside of a shared compartment…
The disposable bedding…
They have been rising precipitously now for at least a decade, with an average 1,000 square foot apartment in Shanghai going for $725,000, or around five million yuan. Shanghai’s average salary per month is 7,108 yuan ($1,135) or 85,300 yuan a year. That puts local property in Shanghai at about 50 times median salaries in the city, according to Forbes. By comparison, housing prices in New York City are 32 times salaries of average New Yorkers.
With those figures in mind, showering at the company gym doesn’t sound so bad.
Living in a box: The desperate workers forced to live in tiny ‘coffin’ apartments of Tokyo – which still cost up to £400 a month to rent
Japanese capital is one of the most crowded cities in the world
‘Geki-sema’ or share houses are mainly used by young professionals
No windows and enough room for one person and a few possessions
They are barely large enough for a single person to squeeze into at all, let alone swing a cat.
But incredibly these tiny ‘coffin’ apartments in central Tokyo still command rents of up to £400 a month.
The Japanese capital is one of the most crowded cities in the world, and to cash in on the chronic housing problem, landlords have developed what are known as ‘geki-sema’ or share houses.
Tight squeeze: A Tokyo local shows a Japanese news crew around her tiny ‘coffin apartment’
Pokey: People are paying up to £400-a-month to live in the tiny ‘coffin’ apartments
Party time: The news team somehow manage to all squeeze inside the miniscule apartment
They are little more than cupboards, tiny cubicles stacked on top of each other with just enough room for one person and a few of their possessions.
Definitely not for the claustrophobic, many don’t even have windows and the doors and anyone over 6ft tall would have trouble stretching their legs.
Most are used by young professionals who spend most of their time at work and outdoors, using these tiny accommodations just for sleeping.
The photo’s of the apartments in the Tokyo’s Shibuya district come from a recent Japanese news program showed
Tight squeeze: A man shows off his tiny Tokyo apartment with just enough room to stretch out and hang his clothes.
Cosy: The tiny cubicles are often stacked on top of each other and contain just enough room for one person to stretch out
Entertaining friends: The apartments tend to be used by young professionals who spend most of their time at work and outdoors
No space like home: Many of the ‘geki-sema’ share houses don’t even have windows
With about 150 projects starting this year or in the pipeline just in the core of the city, construction is as frenzied as ever.
(The Seattle Times) For the second year in a row, Seattle has been named the crane capital of America — and no other city is even close, as the local construction boom transforming the city shows no signs of slowing.
Seattle had 58 construction cranes towering over the skyline at the start of the month, about 60 percent more than any other U.S. city, according to a new semiannual count from Rider Levett Bucknall, a firm that tracks cranes around the world.
The designation has come to symbolize — for better or worse —the rapid growthand changing nature of the city, as mid-rises and skyscrapers pop up where parking lots and single-story buildings once stood.
And the title of most cranes might be here to stay, at least for a while. The city’sconstruction crazeis continuing at the same pace as last year, while cranes are coming down elsewhere: Crane counts in major cities nationwide have dropped 8 percent over the past six months.
During the last count, Seattle had just six more cranes than the next-highest city, Chicago. Now it holds a 22-crane lead over second-place Los Angeles, with Denver, Chicago and Portland just behind.
Seattle has more than twice as many cranes as San Francisco or Washington, D.C., and three times as many cranes as New York. Seattle has more cranes than New York, Honolulu, Austin, Boston and Phoenix combined.
At the same time, Seattle’s construction cycle doesn’t look like it’s letting up. Just in the greater downtown region, 50 major projects are scheduled to begin construction this year, according to the Downtown Seattle Association. An additional 99 developments are in the pipeline for future years. And that’s on top of what is already thebusiest-period everfor construction in the city’s core.
“We continue to see a lot of construction activity; projects that are finishing up are quickly replaced with new projects starting up,” said Emile Le Roux, who leads Rider Levett Bucknall’s Seattle office. “We are projecting that that’s going to continue for at least another year or two years.”
“It mainly has to do with the tech industry expanding big time here in Seattle,” Le Roux said.
Companies that supply the tower cranes say there’sa shortage of both equipment and manpower, so developers need to book the cranesand their operators several months in advance. It costs up to about $50,000 a month to rent one, and they can rise 600 feet into the air.
Most cranes continue to be clustered in downtown and South Lake Union, but several other neighborhoods have at least one, from Ballard to Interbay and Capitol Hill to Columbia City.
A Swiss bank is now offering to buy bitcoins for its clients. As of Wednesday, investors can ask their asset manager atFalcon Private Bank, a boutique investment firm headquartered in Zurich, to purchase and storebitcoinon their behalf – a first for conventional banks. Despite the cryptocurrency’s infamous volatility, this is another indication that is here to stay.
“We have various clients that are interested in buying bitcoin for investment purposes, and we’re making it very convenient for them,” says Arthur Vayloyan, the global head of products and services at Falcon. Because Falcon will be doing the buying and storing of the digital coins, its customers won’t require any specialist knowledge to switchtheir cash into bitcoin. The Swiss financial authority, FINMA, granted Falcon regulatory approval on Tuesday.
But some worry that people may be underestimating the importance of decentralisation to thedigital currency. Traditional banks that hold large sums of bitcoin for their customers will be obvious targets for hackers. “It’s a lot easier to steal digital currency than a traditional currency,” sayAndreas Antonopoulos, host of the Let’s Talk Bitcoin podcast.
Spaced out
“This is why decentralisation is so important,” Antonopoulos says. Indeed, Bitcoin is built on decentralization. Instead of central banks and governments, Bitcoin relies on a network of computers that anyone can join to check the legitimacy of transactions. Every Bitcoin is accounted for on a digital ledger called the blockchain that records how many coins each digital wallet holds.
Whenever currency changes hands, everyone on the network updates their copy of the blockchain too. Underpinning the whole system is some complex mathematics that makes it incredibly difficult to deceive or control without infeasible amounts of computing power.
The wallets are decentralized too. Instead of bank accounts, anyone can create and store their own bitcoin wallet. Because there isno centralised collection of wallets, there is no central target for hackers to try to steal large amounts of digital currency. Or atleast that’s the idea (in practice centralised pockets can emerge).
Put lots of wallets in the same place, and the system may no longer hold. If a thousand people each hold a single bitcoin, a certain level of security will be sufficient protection. However, if one place holds a thousand bitcoin, you increase the appeal to hackers a thousand-fold too, which means you have to similarly up the security. “But there is no way to do this. By putting in more eggs you make the basket weaker,” says Antonopoulos.
Hack attack
We have seen this problem before in exchanges, where people trade different digital and traditional currencies. The biggest of these until 2014 was Mount Gox, which at the time was handling more than half of all bitcoin transactions. In February of that year, 850,000 bitcoins corresponding to $450 million at the time went missing, with most thought to have been stolen by hackers.
Only a few years ago, many conventional banks still thought that bitcoin was doomed to fail, but as the price has soared and it has continued to survive, it hasbecome too attractive for investors to resist. In 2012, you could buy a bitcoin for less than $10, last month they were selling for a record high of $3000. Illustrating the currency’s volatility, it’s currently trading at just under $2500, but overall has tripled in value in the last year alone.
Users of Falcon’s bitcoin service will have to sign a waiver to show that they understand the risks, as they would with other high risk investments. In future, the bank plans to expand to other digital currencies.
Exploring Potential Implications For Company & Market
(SRSrocco Report) The world’s second largest primary silver mine, Tahoe Resources Escobal Mine, was forced to shut down operations in Guatemala by a ruling from the country’s Supreme Court. This was due to a provisional decision by the Guatemalan Supreme court in respect of a request by CALAS, an anti-mining group, for an order to temporarily suspend the license to operate the Escobal Mine until there is a full hearing. (picture courtesy of Tahoe Resources)
While this story has been out for a few days, I believe there is a great deal of misinformation on the Mainstream and Alternative media about the current situation and future outcome of Tahoe’s flagship Escobal Mine. Some analysis suggests that this is just a small speed-bump for Tahoe, so when they are able to address disputed regulatory issues, production and profits will shortly return once again.
However, there also seems to be a another side to the story that could cause more problems for Tahoe with a much longer suspension time than the company is publicly stating. For example, the following was published in the article… Tahoe Resources forced to halt Escobal mine in Guatemala:
While Tahoe is preparing for a three-month mine suspension, Haywood analysts project no production from the mine for the remainder of 2017.
Here we can see that the company (Tahoe) is very optimistic that production at Escobal will start back in three months, while Haywood analysts forecast operations won’t likely resume this year. So, who should we believe, or which forecast is more correct? Before we get into the details, let’s first look at the impact of suspending the 2nd largest primary silver mine in the world on the market.
A Shutdown Of The Escobal Mine, Ranked #2 In The World, Would Remove 21 Million Oz Of Supply
According to the 2017 World Silver Survey, Tahoe Resources Escobal Mine ranked #2, behind Fresnillo PLC’s Saucito Mine in primary silver production in 2016. Here are the top five producing primary silver mines in 2016 (Moz – million ounces):
Saucito (Mexico) = 21.9 Moz
Escobal (Guatemala) = 21.2 Moz
Dukat (Russia) = 19.8 Moz
Cannington (Australia) = 18.2 Moz
Uchucchacua (Peru) = 16.2 Moz
Furthermore, the data in the 2017 World Silver Survey reports that a total of 265 million oz (Moz) of primary silver was produced last year. Thus, the Escobal Mine represents 8% of total global primary silver mine supply. If Haywood Analysts are correct that production at Escobal may not resume in 2017, than the mine is likely to lose nearly half of the 20-21 Moz forecasted for 2017.
While this is not a great deal of silver compared to total world silver supply of 886 Moz (in 2016), if the Escobal Mine is shut for a longer period of time, or indefinitely, it could impact the silver market over the next few years.
So, again… the big question for investors is, HOW LONG will the ESCOBAL MINE be shut down? Well, let’s look at some information and data that seems to be overlooked by the Mainstream and Alternative media.
What Is The True Nature & Future Impact Of The Suspension Of Tahoe’s Escobal Mine?
First… after the Guatemalan Supreme Court suspended operations at Escobal, Tahoe’s stock price took a real beating falling 33% that day. In the past week, Tahoe’s stock price decline 40%:
A lot of investors were caught by surprise as Tahoe Resources has been making a lot of money from its mines, especially from its Escobal Silver Mine in Guatemala. For example, in 2016 Tahoe Resources reported profits of $118 million on revenue of $784 million. That is a stunning 15% margin of profit… and the majority of that profit was from the Escobal Mine.
Second …. the rich profits from the Escobal Mine came at a cost. And the cost was in the way of “serious human rights violations through its operations”, stated by several sources. Unfortunately, many investors that follow the Mainstream financial media do not understand that the Escobal Mine has been, and continues to be, a subject of human rights abuse and violations from day one.
Escobal will become a big player with forecasted silver production in 2014 of 18-20 million oz. Unfortunately for Tahoe Resources, the locals are not too happy with their Escobal mine. There have been murders and killings on both sides of the protest.
This is by no means a small matter by a few disenfranchised locals:
(Guatemala City/Ottawa) Contrary toTahoe Resources’ recent claims, tens of thousands of people oppose its Escobal project in southeastern Guatemala. Repression and violence have been the outcome of company and government efforts to install the project without social support. A recent high-court decision in Guatemala reinforces the legitimacy and importance of local decision-making processes.
More than half of the communities in the municipality of San Rafael las Flores, where the Escobal project is located, have declared opposition to the mine. In five neighbouring municipalities, in the departments of Santa Rosa and Jalapa, a majority have voted against the mine in municipal referenda, in which tens of thousands of people participated. The most recent vote took place on November 10th in the municipality of Jalapa, department of Jalapa. Over 23,000 people participated with 98.3% voting against mining and 1.7% in favour.
This is a perfect example of what Jim Sinclair states “As the wrong way to go about starting up a mining project in a foreign country.” Jim believes you must have the support of the locals, or the project will be doomed for failure.
And it didn’t help Tahoe Resources PR one bit when their contracted head of security, Alberto Rotondo gave direct orders to assassinate members of the community of San Rafael Las Flores.
“The preliminary investigations found that Rotondo gave the order to attack the community, he also ordered the crime scene to be cleaned up and change the police report.”
The information reveals Rotondo making several statements: “God dam dogs, they do not understand that the mine generates jobs”. “We must eliminate these animals’ pieces of shit”. “We can not allow people to establish resistance, another Puya no”. “Kill house sons of Bitches”
Rotondo was apprehended at the airport La Aurora, when he trying to flee the country. Wire tapping of conversations between him and his son reveal that he planned to leave Guatemala for a while, because “I ordered to kill some of these sons of Bitches.”
What seems to be missing from the current license suspension of the Escobal Mine is the extremely negative history it has had with the local community. As stated above, Tahoe’s former contracted head of Security, Alberto Rontondo gave the direct order to assassinate members of the San Rafael Las Flores community.
While the wire-tapped conversation between Alberto Rontondo and his son, where he says, “I ordered to kill some of these sons of Bitches”, was published in the media, it didn’t get much coverage in the Mainstream press. This was BAD NEWS for a large corporate mining company, so many news agencies seemed to just ignore it.
So…. the assumption by many WESTERN investors that Tahoe Resources is only dealing with pesky legal regulatory issues, is a seriously inaccurate assessment that could cost them dearly going forward. Now, I am not saying that Tahoe’s Escobal Mine will not be able to return to operating status, but there are more serious issues that are coming to light that could be quite detrimental for the company going forward.
For example…. according to the website,Tahoe On Trial, they published the following:
The legal cases against Tahoe Resources are being carried out in a larger context of opposition to the Escobal mine. The violence, repression, and criminalization community leaders continue to face is not limited to what transpired on April 27, 2013.
THE ESCOBAL PROJECT DEPENDS ON A MILITARIZED SECURITY STRATEGY TO SUPPRESS OPPOSITION AND HAS LED TO VIOLENCE AND CRIMINALIZATION.
in 2011, Tahoe Resources hired a US security and defense contractor – International Security and Defense Management, LLC – that boasts experience with corporations working in war zones like Iraq and Afghanistan to develop a security plan that has treated peaceful protest and community leaders as if they were armed insurgents.
In June 2012, Tahoe sued the Guatemalan government, stating that protests were hindering its operations and that the State was not doing enough to allow its activities to proceed.
Between 2011 and 2013, some 90 people were slapped with unfounded criminal charges and made to endure legal processes causing them distress and hardship. Several spent months in jail before being cleared of all charges.
This is just the tip of the ESCOBAL MINE PROTEST ICEBERG… I could fill pages. However, those who believe the protests have gone away and now the public is totally supportive of the Escobal Mine, are completely being deluded.
…Police have used teargas to clear a public road near the town of Casillas, in south-east Guatemala, of protesters blocking access to Canadian miner Tahoe Resources’ controversial Escobal mine…
This proves that the public protests continue even as the Escobal Mine in in its fourth year of full commercial production.
I would imagine some readers-investors are probably thinking… “Well, this is just a matter for the local and federal governments to deal with in getting the LOCAL PEOPLE to BEHAVE, so they will leave the Escobal Mine alone to continue producing lots of silver and profits.” Well, that is one opinion, but if you think that is a WISE ONE… think again. Several large Funds have dropped Tahoe Resources from their portfolios due to what they term as, “A HIGH RISK .”
Tahoe Resources is one of fourteen companies featured as a dangerous investment in the fifth edition of ‘Dirty Profits’ launched today in Hamburg, Germany and edited by the organization Facing Finance.
The publication identifies two billion-dollar European pension funds that have divested from the company, the Netherlands’ Pensioenfonds (PGB) and Norway’s Norges Bank Investment Management. The group calls for binding regulations on financial institutions and for the elimination of this and other harmful investments from their portfolios.
Problems cited include Tahoe Resources’ lack of respect for communities that have peacefully and democratically expressed their opposition to its Escobal mine in southeastern Guatemala, and a campaign of persecution through unfounded legal cases, violent incidents and militarization.
….The article about Tahoe Resources further describes how the company was granted a permit to put the mine into operation with disregard for over 200 individual complaints submitted against the license on the basis of environmental concerns. The officials responsible for this decision resigned in mid-2015 over serious allegations of corruption.
As we can see, the disinvestment of Tahoe Resources by two large European Funds should be a WARNING to investors that things may not be ROSEY for the company going forward.
Please understand, I am not only painting a negative picture for Tahoe, but rather providing additional information that seems to be missing from the Mainstream press. Thus, investors are making decisions without the COMPLETE information or story.
To be honest, as a silver analyst, I like the Escobal Mine’s performance. It is one of the most profitable primary silver mines in the world. However, I view this performance in a vacuum. By that, I mean based on the production and financial data alone. If we include the public and environmental issues, the Escobal Mine seems to be a very BAD DEAL for many of the local people that live adjacent to the mine.
I believe the suspension of Tahoe’s Escobal Mine by the Guatemalan Supreme Court may open a CAN OF WORMS that many individuals or companies invested in Tahoe do not realize or understand.
On the other hand, Tahoe might be able to work with the local people and Guatemalan government to resume operations. That being said, investors need to understand that the Escobal primary silver mine is a much HIGHER RISK than other silver mining companies. So, it would be wise to learn as much as one can before making a longer term investment in the company.
(MarketWatch) Bitcoin $55,000? Fundstrat’s Tom Lee, one of the biggest equity bears among the major Wall Street strategists, says it’s possible, but not necessarily for the reasons many bitcoin bulls have suggested.
“One of the drivers is crypto-currencies are cannibalizing demand for gold GCQ7, +0.12% ” Lee wrote in a report. “Based on our model, we estimate that bitcoin’s value per unit could be $20,000 to $55,000 by 2022 — hence, investors need to identify strategies to leverage this potential rise in crypto-currencies.”
That’s a major jump from the $2,530 level that bitcoin BTCUSD, -0.84% fetched recently. Of course, this would be on top of what’s already been an impressive stretch, with the price more than doubling since the start of the year.
Lee predicts investors will look to bitcoin as a gold substitute, and the fact that the amount of available bitcoin is reaching its limit makes this supply/demand story even more compelling for those looking to turn profits in the crypto market.
“Bitcoin supply will grow even slower than gold,” Lee said. “Hence, the scarcity of bitcoin is becoming increasingly attractive relative to gold.”
Another driver could come from central banks, which he expects will consider buying bitcoin if the total market cap hits $500 billion.
“This is a game changer, enhancing the legitimacy of the currency and likely accelerating the substitution for gold,” Lee wrote.
The trick is that there aren’t very many ways to play bitcoin, other than via direct investment or the bitcoin ETF GBTC, -1.75% he said, adding that “we will identify other opportunities in the future.”
How Bitcoin (and other cryptocurrencies) actually work
For the past few years, most retailers have struggled. Of course, it’s easy to blame Amazon.com, but it is only one of many causes. At the same time, for us hedgies living in major cities with luxury malls, there is confusion about the problem itself – my mall is crowded and people are shopping. After having debated with friends endlessly on what the real root of the problem is, I decided it was time to actually go investigate. Every city has its own story and the local mall is the nexus of that story.
In my mind, the only way to get real answers was a 4-day, 1,500 mile meandering road-trip through the lower mid-west, where we planned to hit as many malls and take as many meetings with facility managers and brokers as we could organize along the way. Besides, when an asset class like mall real estate is down 90% in a few years’ time, a different viewpoint can create huge upside.
The overriding question was: is retail suffering because of Amazon.com cannibalizing store-fronts or are rising health care costs, with stagnant wage growth, what’s really cannibalizing disposable spending power in middle-America? Is shopping still America’s pastime or do we prefer food and “experiences” instead? Every industry evolves. Why hasn’t the mall changed in the past three decades – it’s still the same cinema, crappy food court and undifferentiated retailers that I knew when I was a teen—where’s the fun in that? Other countries are perfecting “shoppertainment,” why hasn’t America? In summary, what is the real issue with retail?
When you scroll throughhttp://deadmalls.comthere is a certain eeriness about a million square feet of empty space.
However, the images don’t, in any way, prepare you for an almost-dead mall on its last gasps. As we wandered one facility with the head of leasing, we could look straight ahead at a thousand feet of almost vacant space, dimly lit from sky-lights as none of the lighting fixtures still worked—the air conditioner had long ago failed and it was 95 degrees inside this mall. However, there was one light that drew us forward. As we approached, we heard music and sure enough, it was the Victoria’s Secret that time forgot (corporate probably forgot it too). In a mall with only 7 tenants and even fewer shoppers, Victoria’s Secret was still jamming out. No customers, but 2 girls tending shop, blasting music and throwing light into a dark hallway.
As we rounded another corner, we heard the unmistakable sound of a Zumba Class at 100 decibels. As we drew nearer, we saw the first mall visitors in almost an hour – what looked like an instructor with a half dozen middle-aged women trying to do exercises that they were hopelessly unfit to accomplish.
I turned to the leasing agent;
Me: Any idea how much they pay in rent?
Him: Actually, I think they’re squatting in here. I don’t show any record of them being a tenant.
Me: Is anyone going to make them pay rent?
Him: Why bother, at least it brings people to the mall…
With no security or cleaning staff, who’s watering the plants?
All of this segwayed into the meeting with the leasing agent afterwards.
Me: Can I meet the facility manager when we’re done chatting?
Him: Funny story; actually, she quit a few months back. Unfortunately, the owner only told me last week that I am now in charge of managing this mall. I’m doing my best, but I live an hour away, so I can only come here a few times a week.
Me: So who’s been locking up at the end of the day lately?
Him: Hmmm…. Honestly, I’m not sure. That’s a pretty good question.
Me: Would anyone notice if they never locked the doors?
Him: Probably not…
Of course, you cannot quite put this into context until you realize that I was sitting there in a nearly pitch black food court, in 95 degree heat, with only a beam of light from the sky-light above to guide the conversation – yet despite the odds, one vendor still remained at the food court – ironically it was the sushi place.
I wonder what decade these gumballs are from?? I didn’t know they could turn brown.
While the tour was entertaining, what I really wanted to know was; why did this place, surrounded by a thriving community somehow fail? This is where the story actually deviates from the usual narrative.
This mall was in a community of about 100,000 people. A decade ago, this had been a thriving mall. Then, a new major highway was placed about 5 miles west of the mall, which diverted regional traffic away from the mall. Even worse, a massive open air retailing complex was built alongside the new highway, siphoning shoppers from the mall. In a town that was big enough to support one large shopping complex, the newer one with better access from the highway had ultimately won out. However, this mall was still muddling forward with a handful of national tenants who hadn’t quite thrown in the towel, despite no lighting, air conditioning or adult supervision at the mall. It lead to a real epiphany; malls die a slow strange death—not the cataclysmic collapse depicted by most analysts.
We saw a similar situation on the following day at another mall about 100 miles away. In this situation, a new retailing facility had been built closer to the local university to compete with the mall. This facility had stolen a number of the key tenants from the mall. At the time, it looked like this mall would also surrender to the newer facility in the better location. Instead, the mall was sold to new owners who; injected substantial capital to remodel the mall, offered discounted rent to retain existing tenants and had put up a fight to the death with the newer facility. Now, nearly a decade later, neither facility was full and both were desperately fighting it out for the minds of tenants and shoppers in a winner-take-all battle, a veritable retailing Battle of Verdun in the north of Texas—where even the winner will be a loser for having spent so much capital to win the booby prize of top retail destination in a town of about 125,000 people. Even worse, with no clear winner, new retailing concepts were hesitant to guess wrong in their expansion plans and simply chose to pass this town by when expanding—further sapping the strength of both facilities.
In fact, we continued to see similar stories as we ventured north. Retail may not be dead; instead there may simply be too much retail (both property and competing concepts) fighting it out for too few customers. This is further compounded by too much cheap capital developing more retail as a result of ultra-low interest rates. Naturally, there will be losers in this process – in fact; the losses have only just begun. There will also be huge winners.
Malls are bearing the brunt of changes in retail, but they’re only the canary in the coal mine.
Let’s start with a simple premise; commercial real estate (CRE) will change more in the next decade than it has in the past hundred years. Anyone who thinks they can fully foresee how it will evolve is lying to you. The only certainty is that highly leveraged real estate investors and lenders will be obliterated as current models evolve faster than anticipated.
In the past, retail was retail, warehouse was warehouse and office was office—the same for all other CRE classes. There was some cross-over, but the main commercial real estate components stayed segmented for the most part. Now, with big box stores, the lowest hanging fruit for online shopping to knock off, going to dodo-land, there will be hundreds of millions of feet of well-located space suddenly becoming available. People act as if there are enough Ulta Beauty and Dick’s Sporting Goods to go around. However, you cannot fill all of this space with the few big box retail concepts still expanding—especially as many stalwarts are themselves shrinking.
As a result, a huge game of musical chairs is about to take place. Why pay $20/ft for mid-rise office space, if you can now move into an abandoned Sports Authority for $5/ft. Sure, it doesn’t come with windows, but employees like open plan space and there’s plenty of parking. Besides, with the rental savings, you can offer your staff an in-house fitness facility and cafeteria for free. Does your mega-church need a larger space? There’s probably a former Sears or Kmart that perfectly accommodates you at $3/ft. Have an assisted living facility with an expiring lease? Why not move it to an abandoned JC Penney—the geriatrics will feel right at home, as they’re the only ones still shopping there.
Go onto any real estate website and you will find out that huge plan space is nearly free. No one knows what the hell to do with it and the waves of bankruptcy in big box are just starting. As online evolves, these waves will engulf other segments of retail as well.
Type Macy’s into Loopnet.com and look at how many millions of feet of old Macy’s are available for under $10/ft to purchase. Retail’s problems are about to become everyone’s problems in CRE. When the old Macy’s rents for $2/ft, what happens to everyone else’s rents? EXACTLY!!! What happens if a CRE owner is leveraged at 60% (currently considered conservative) and leasing at $15/ft when the old HHGregg across the street is offered for rent at $3/ft? An office owner can lower his rents a few dollars, but at the new price deck, he cannot cover his interest cost, much less his other operating expenses. What happens to a suddenly emptying mid-rise office building? It has higher operating expenses than the box store due to full-time security and cleaning—maybe it’s a zero—in that future market rents no longer cover the operating expenses of the asset, much less offer a return on investment. I know, crazy—that’s how musical chairs works when demand contracts and the supply stays the same.
What happens to the guys who lent against these assets? Kaplooey!!!
America currently has more feet of retail space per capita than any other country. For that matter, America has more feet of office and other CRE types per capita as well. A decade of low interest rates has made this problem substantially worse. Think of thetwo malls that I spoke about in the last piece— they weren’t done in by the internet, they were done in by a tripling of retail space in a cities that are barely growing. These cities simply ran out of shoppers for all of this space. Now the mall is empty—heck the strip retail is only partly filled in. The next step is that rents will drop—dramatically. The owners of each asset, the mall and the strip center will go bust. Neither has a cap structure that is designed for dramatically lower rents. Neither has an org structure designed for carving up this space for the sorts of eclectic tenants that will eventually absorb it over the next few decades.
CRE has had it so good for the past 35 years, that most owners have never seen a down cycle. Sure, Dallas had too much supply in the early ‘90’s. Silicon Valley over-expanded in the early ‘00’s. It took a few years for it to be absorbed. Anyone who had capital during the bust made a fortune. This time may really be different. There’s too much supply. Short of blowing it up, it will be with us for years into the future. Without dramatic economic or population growth, some of it may NEVER be absorbed.
As an investor, this is all interesting to understand, but you don’t fully comprehend it until you have visited a few dozen of these facilities and seen how owners are trying to cope with the problem. In Miami, space is constricted. In Texas, there’s more CRE than I’ve ever seen. They keep putting it up—even if there isn’t demand currently. For three decades, they’ve always been able to fill it over time. For the first time ever, they can’t seem to fill it—in fact, demand is now declining. It is now obvious; there will be a whole lot of pain for CRE owners and lenders. Of course, someone’s pain can be someone’s gain.
Nasdaq has issued a market-wide trading halt amid what appears to be a “glitch” that sent a number of the largest Nasdaq-listed stocks to crash or spike to exactly $123.47 per share.
This move crashed the value of companies including Amazon and Apple, sparked chaos in Microsoft, while sending Zynga rocketing up more than 3000%.
On the eve of the US Independence Day holiday and in after-hours trading, The FT reports that market data show that companies such as Apple, Amazon, Microsoft, eBay and Zynga were repriced at $123.47.
The Bloomberg data terminal listed either “market wide circuit breaker halt — level 2” or “volatility trading pause” on all the stocks affected.
The glitch did not affect any market trading, including after hours.
The mysterious reset to $123.47 per share meant that Amazon in theory saw its share price marked down 87.2 per cent…
while shares in Apple fell 14.3 per cent…
But Nasdaq-listed Microsoft had jumped 79.1 per cent — which would value the company at nearly $1tn…
As Bloomberg reports,the apparent swings triggered trading halts in some securities, according to automatically generated messages. The halts are a mechanism exchanges use to limit the impact of particularly volatile sessions. A system status alert on Nasdaq’s website said that systems were operating normally at 8:23 p.m. ET. After-market hours on Nasdaq typically last from 4 p.m. to 8:00 p.m.
In a statement, Nasdaq said the glitch was related to “improper use of test data” sent out to third party data providers, and said it was working to “ensure a prompt resolution of this matter”. In cases of any clearly erroneous data, trades made are cancelled.
Speculative booms are often poor guides to future valuations and the maturation trajectory of a new sector.
Charles Hugh Smith recently came across a December 1996 San Jose Mercury News article on tech pioneers’ attempts to carry the pre-browser Internet’s bulletin board community vibe over to the new-fangled World Wide Web.
In effect, the article is talking about social media a decade before MySpace and Facebook and 15 years before the maturation of social media.
(Apple was $25 per share in December 1996. Adjusted for splits, that’s about the cost of a cup of coffee.)
So what’s the point of digging up this ancient tech history?
— Technology changes in ways that are difficult to predict, even to visionaries who understand present-day technologies.
— The sources of great future fortunes are only visible in a rear view mirror.
Many of the tech and biotech companies listed in the financial pages of December 1996 no longer exist. Their industries changed, and they vanished or were bought up, often for pennies on the dollar of their heyday valuations.
Which brings us to cryptocurrencies, which entered the world with bitcoin in early 2009.
Now there are hundreds of cryptocurrencies, and a speculative boom has pushed bitcoin from around $600 a year ago to $2600 and Ethereum, another leading cryptocurrency, from around $10 last year to $370.
Where are cryptocurrencies in the evolution from new technology to speculative boom to
maturation? Judging by valuation leaps from $10 to $370, the technology is clearly in the speculative boom phase.
If recent tech history is any guide, speculative boom phases are often poor guides to future valuations and the maturation trajectory of a new sector.
Anyone remember “push” technologies circa 1997? This was the hottest thing going, and valuations of early companies went ballistic. Then the fad passed and some new innovation became The Next Big Thing.
All of which is to say: nobody can predict the future course of cryptocurrencies, other than to say that speculative booms eventually end and technologies mature into forms that solve real business problems in uniquely cheap and robust ways no other technology can match.
So while we can’t predict the future forms of cryptocurrencies that will dominate the mature marketplace, we can predict that markets will sort the wheat from the chaff by a winnowing the entries down to those that solve real business problems (i.e. address scarcities) in ways that are cheap and robust and that cannot be solved by other technologies.
The ‘Anything Goes’ Speculative Boom
Technologies with potentially mass applications often spark speculative booms. The advent of radio generated a speculative boom just as heady as any recent tech frenzy.
Many people decry the current speculative frenzy in cryptocurrencies, and others warn the whole thing is a Ponzi scheme, a fad, and a bubble in which the gullible sheep are being led to slaughter.
Tribalism is running hot in the cryptocurrencies space, with promoters and detractors of the various cryptocurrencies doing battle in online forums: bitcoin is doomed by FUD (fear, uncertainty and doubt) about its warring camps, or it’s the gold standard; Ethereum is either fundamentally flawed or the platform destined to dominate, and so on.
The technological issues are thorny and obtuse to non-programmers, and the eventual utility of the many cryptocurrencies is still an open question/in development.
It’s difficult for non-experts to sort out all these claims. What’s steak and what’s sizzle? We can’t be sure a new entrant is actually a blockchain or if its promoters are using blockchain as the selling buzzword.
Even more confusing are the debates over decentralization. One of the key advances of the bitcoin blockchain technology is its decentralized mode of operation: the blockchain is distributed on servers all over the planet, and those paying for the electricity to run those servers are paid for this service with bitcoin that is “mined” by the process of maintaining the blockchain. No central committee organizes this process.
Critics have noted that the mining of bitcoin is now dominated by large companies in China, who act as an informal “central committee” in that they can block any changes to the protocols governing the blockchain.
Others claim that competing cryptocurrencies such as Ethereum are centrally managed, despite defenders’ claims to the contrary.
Meanwhile, fortunes are being made as speculators jump from one cryptocurrency to the next as ICOs (initial coin offerings) proliferate. Since the new coins must typically be purchased with existing cryptocurrencies, this demand has been one driver of soaring prices for Ethereum.
As if all this wasn’t confusing enough, the many differences between various cryptocurrencies are difficult to understand and assess.
While bitcoin was designed to be a currency, and nothing but a currency, other cryptocurrencies such as Ethereum are not just currencies, they are platforms for other uses of blockchain technologies, for example, the much-touted smart contracts. This potential for applications beyond currencies is the reason why the big corporations have formed the Enterprise Ethereum Alliance (https://entethalliance.org/).
Despite the impressive credentials of the Alliance, real-world applications that are available to ordinary consumers and small enterprises using these blockchain technologies are still in development: there’s lots of sizzle but no steak yet.
Who Will The Winner(s) Be?
How can non-experts sort out what sizzle will fizzle and what sizzle will become dominant? The short answer is: we can’t. An experienced programmer who has actually worked on the bitcoin blockchain, Ethereum and Dash (to name three leading cryptocurrencies) would be well-placed to explain the trade-offs in each (and yes, there are always trade-offs), but precious few such qualified folks are available for unbiased commentary as tribalism has snared many developers into biases that are not always advertised upfront.
So what’s a non-expert to make of this swirl of speculation, skepticism, tribalism, confusing
technological claims and counterclaims and the unavoidable uncertainties of the exhilarating but dangerously speculative boom phase?
There is no way to predict the course of specific cryptocurrencies, or the potential emergence of a new cryptocurrency that leaves all the existing versions in the dust, or governments’ future actions to endorse or criminalize cryptocurrencies. But what we can do — now, in the present — is analyze present-day cryptocurrencies through the filters of scarcity and utility.
InPart 2: The Value Drivers Of Cryptocurrency, we analyze the necessary success requirements a cryptocurrency will need to excel on in order to become adopted at a mass, mainstream level. Once this happens (which increasingly looks like a matter of “when” not “if”), the resultant price increase of the winning coin(s) will highly likely be geometric and meteoric.
Sadly, the most probable catalyst for this will be a collapse of the current global fiat currency regime — something that increasingly looks more and more inevitable. This will destroy a staggering amount of the (paper) wealth currently held by today’s households. Which makes developing a fully-informed understanding of the cryptocurrency landscape now — today — an extremely important requirement for any prudent investor.
Chris Christie Announces New Jersey Government Shutdown, Orders State Of Emergency
Illinois, Maine, Connecticut: the end of the old fiscal year and the failure of numerous states to enter the new one with a budget, means that some of America’s most populous states have seen their local governments grind to a halt overnight until some spending agreement is reached. Now we can also add New Jersey to this list.
On Saturday morning, New Jersey Gov. Chris Christie declared a state of emergency in the state, and announced a partial state government shutdown as New Jersey become the latest state to enter the new fiscal year without an approved budget after the Republican governor and the Democrat-led Legislature failed to reach an agreement by the deadline at midnight Friday,CBS New York reports.
In a news conference Saturday morning, Christie blamed Democratic State Assembly Speaker Vincent Prieto for causing the shutdown. And, just like Illinois and Connecticut, Christie and the Democrat-led Legislature are returning to work in hopes of resolving the state’s first government shutdown since 2006 and the first under Christie, before NJ is downgraded further by the rating agencies.
Prieto remained steadfast in his opposition, reiterating that he won’t consider the plan as part of the budget process but would consider it once a budget is signed. Referring to the shutdown as “Gov. Christie’s Hostage Crisis Day One,” Prieto said he has made compromises that led to the budget now before the Legislature.
“I am also ready to consider reasonable alternatives that protect ratepayers, but others must come to the table ready to be equally reasonable,” Prieto said. “Gov. Christie and the legislators who won’t vote ‘yes’ on the budget are responsible for this unacceptable shutdown. I compromised. I put up a budget bill for a vote. Others now must now do their part and fulfill their responsibilities.”
Politics aside, the diplomaitc failure has immediate consequences for Jersey residents: Christie ordered nonessential services to close beginning Saturday. New Jerseyans were feeling the impact as the shutdown took effect, shuttering state parks and disrupting ferry service to Liberty and Ellis islands. Among those affected were a group of Cub Scouts forced to leave a state park campsite and people trying to obtain or renew documents from the state motor vehicle commission, among the agencies closed by the shutdown.
As funds run out elsewhere, it will only get worse. Police were turning away vehicles and bicyclists at Island Beach state park in Ocean County.
“If there’s not a resolution to this today, everyone will be back tomorrow,” Christie said, calling the shutdown “embarrassing and pointless.” He also repeatedly referred to the government closure as “the speaker’s shutdown.” Christie later announced that he would address the full legislature later at the statehouse on Saturday.
“From Horrific To Catastrophic”: Court Ruling Sends Illinois Into Financial Abyss
FirstMaine, thenConnecticut, and finally late on Friday, confirming the worst case outcome many had expected, Illinois entered its third straight fiscal year without a budget as Republican Governor Bruce Rauner and Democratic lawmakers failed to agree on how to compromise over the government’s chronic deficits, pushing it closer toward becoming the first junk-rated U.S. state.
By the end of Friday – the last day of the fiscal year – Illinois legislators failed to enact a budget, and while negotiationscontinued amid some glimmers of hopeand lawmakers planned to meet over the weekend, the failure marked a continuation of the historic impasse that’s left Illinois without a full-year budget since mid-2015, and which,recall, S&P warned one month ago will likely result in a humiliating and unprecedented downgrade of the 5th most populous US state to junk status.
Then came the begging.
According toBloomberg, on Friday Illinois House Speaker Michael Madigan, a Democrat who controls much of the legislative agenda, pleaded with rating companies to “temporarily withhold judgment” as lawmakers negotiate. “Much work remains to be done,” the Democrat said on the floor of the House Friday, before the chamber adjourned for the day. “We’ll get the job done.”
Meanwhile, the state remains without a spending plan, its tax receipts and outlays mostly on “autopilot”, leaving it with a record $15 billion of unpaid bills as it spent over $6 billion more than it brought in over the past year, and with $800 million in interest on the unpaid bills alone. The impasse has devastated social-service providers, shuttering services for the homeless, disabled and poor. The lack of state aid has wrecked havoc on universities, putting their accreditation at risk.
However, in a “shocking” development, just hours remaining before the midnight deadline to pass the Illinois budget, and Illinois’ imminent loss of its investment grade rating, federal judge Joan Lefkow in Chicago ordered Illinois to come up with hundreds of millions of dollars it owes in Medicaid payments that state officials say the government doesn’t have, theChicago Tribunereported. Judge Lefkow ordered the state to make $586 million in monthly payments (from the current $160 million) as well as another $2 billion toward a $3 billion backlog of payments – a $167 million increase in monthly outlays – the state owes to managed care organizations that process payments to providers.
While it is no secret that as part of its collapse into the financial abyss, Illinois has accumulated $15 billion in unpaid bills, the state’s Medicaid recipients had had enough, and went to court asking a judge to order the state to speed up its payments. On Friday, the court ruled in their favor. The problem, of course, is that Illinois can no more afford to pay the outstanding Medicaid bills, than it can to payany of its $14,711,351,943.90 in overdue bills as of June 30.
The backlog of unpaid claims the state owes to managed-care companies directly, as well as to the doctors, hospitals, clinics and other organizations “is crippling these providers and thereby dramatically reducing the Medicaid recipients’ access to health care,” Lefkow said in her ruling (attached below).
* * *
Friday’s court ruling, which meant that the near-insolvent state must pay an additional $593 million per month, may have been the straw that finally broke the Illinois camel’s back.
“Friday’s ruling by the U.S. District Court takes the state’s finances from horrific to catastrophic,” Comptroller Susana Mendoza, a Democrat, said in an emailed statement after the ruling.
As a result of the court decision, “payments to the state’s pension funds; state payroll including legislator pay; General State Aid to schools and payments to local governments — in some combination — will likely have to be cut.”
“As if the governor and legislators needed any more reason to compromise and settle on a comprehensive budget plan immediately, Friday’s ruling by the U.S. District Court takes the state’s finances from horrific to catastrophic,” Mendoza said in a statement. “A comprehensive budget plan must be passed immediately.” Realizing where all this is headed, she said that payments to bond holders won’t be interrupted (more below).
Illinois Comptroller Susana Mendoza
Friday night’s legal decisionfollowed a previously discussed ruling,when on June 7, Judge Lefkow ordered lawyers for the state to negotiate with Medicaid recipients to come up with more money, but she stopped short of dictating how much more the state should pay each month, or when. That decision sent Illinois General Obligation bond soaring.
Earlier this week, the parties again went before the judge to say they were at an impasse, with lawyers for Medicaid recipients asking for more than $1 billion a month to cover past and ongoing costs.
Lawyers for Illinois countered that they could only come up with approximately $75 million more a month, which would translate to $150 million with federal matching dollars. Although the state is way behind, state officials said in court filings that they have been making more than $1 billion in Medicaid related payments each month in 2017, “including payments to safety net hospitals, MCOs, and other providers.”
While the state was livid over the decision, plaintiffs were delighted. Tom Yates, one of the lawyers who represented the Medicaid recipients. said the judge’s ruling is a “fair result” that will help them have access to care. “Medicaid is an incredibly important program for 25 percent of the state’s population,” Yates said. It remains unclear, however, where Illinois would find the required funds.
In her ruling, Lefkow said the state must pay the $2 billion toward its past obligations beginning July 1 and ending June 30, 2018. She ordered the state to file monthly reports showing that it’s making the payments consistent with the ruling. The Judge said she considered submissions by managed care organizations, including The Meridian MCO and Aetna Better Health Inc., in reaching her decision. Meridian is owed $540 million and Aetna is owed $700 million, the judge said. In addition, she considered submissions from doctors and clinics.
Adding insult to crippling financial injury, the judge also ordered the state to file monthly reports showing that they are making the payments consistent with the ruling.
* * *
Meanwhile, despite the recent fireworks, things in Illinois remain on autopilot as the state needs a new budget to change financial direction.
Without a budget, Bloomberg writes, the state has continued to spend more than it brings in. That’s forced it to cover “core priority” payments first, including payroll, debt service and pensions that total about $1.85 billion a month. While those bills include some Medicaid-covered payments like health services for children and adults, the state has said there aren’t enough funds to include general payments to managed-care organizations as a top priority.
Also, without a budget that includes borrowing to pay down the bill backlog, Illinois by August will run out of money for key expenses for the first time since the stalemate began, according to Comptroller Mendoza. That means school funding, state payroll, and pension payments could be affected, she said. There won’t be enough money for these mandated or court-ordered payments.
As noted above, Mendoza said that this won’t jeopardize debt-service payments, however she probably should have added “for now.” For now, Illinois hasn’t missed any bond payments and state law requires it to make monthly deposits to its debt-service funds.
For now, despite the Illinois deadline coming and going, the political standoff shows no signs of ending.
And now the market is set to react: investors have already punished Illinois for its fiscal woes. Yields on the state’s 10-year bonds have soared to 4.8%, 2.8% points higher than benchmark debt. That’s the highest yield of all 22 states that Bloomberg tracks.
Summarizing best the chaos in Illinois was John Humphrey, the head of credit research for Gurtin Municipal Bond Management, which oversees about $10.1 billion of state and local debt who said that “recognizing that they’re continuing to work through the weekend, it doesn’t look good to adjourn halfway through your last day.”

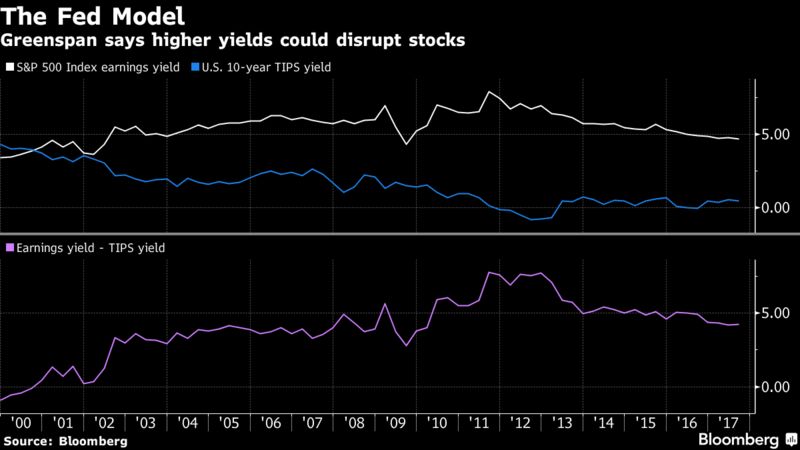


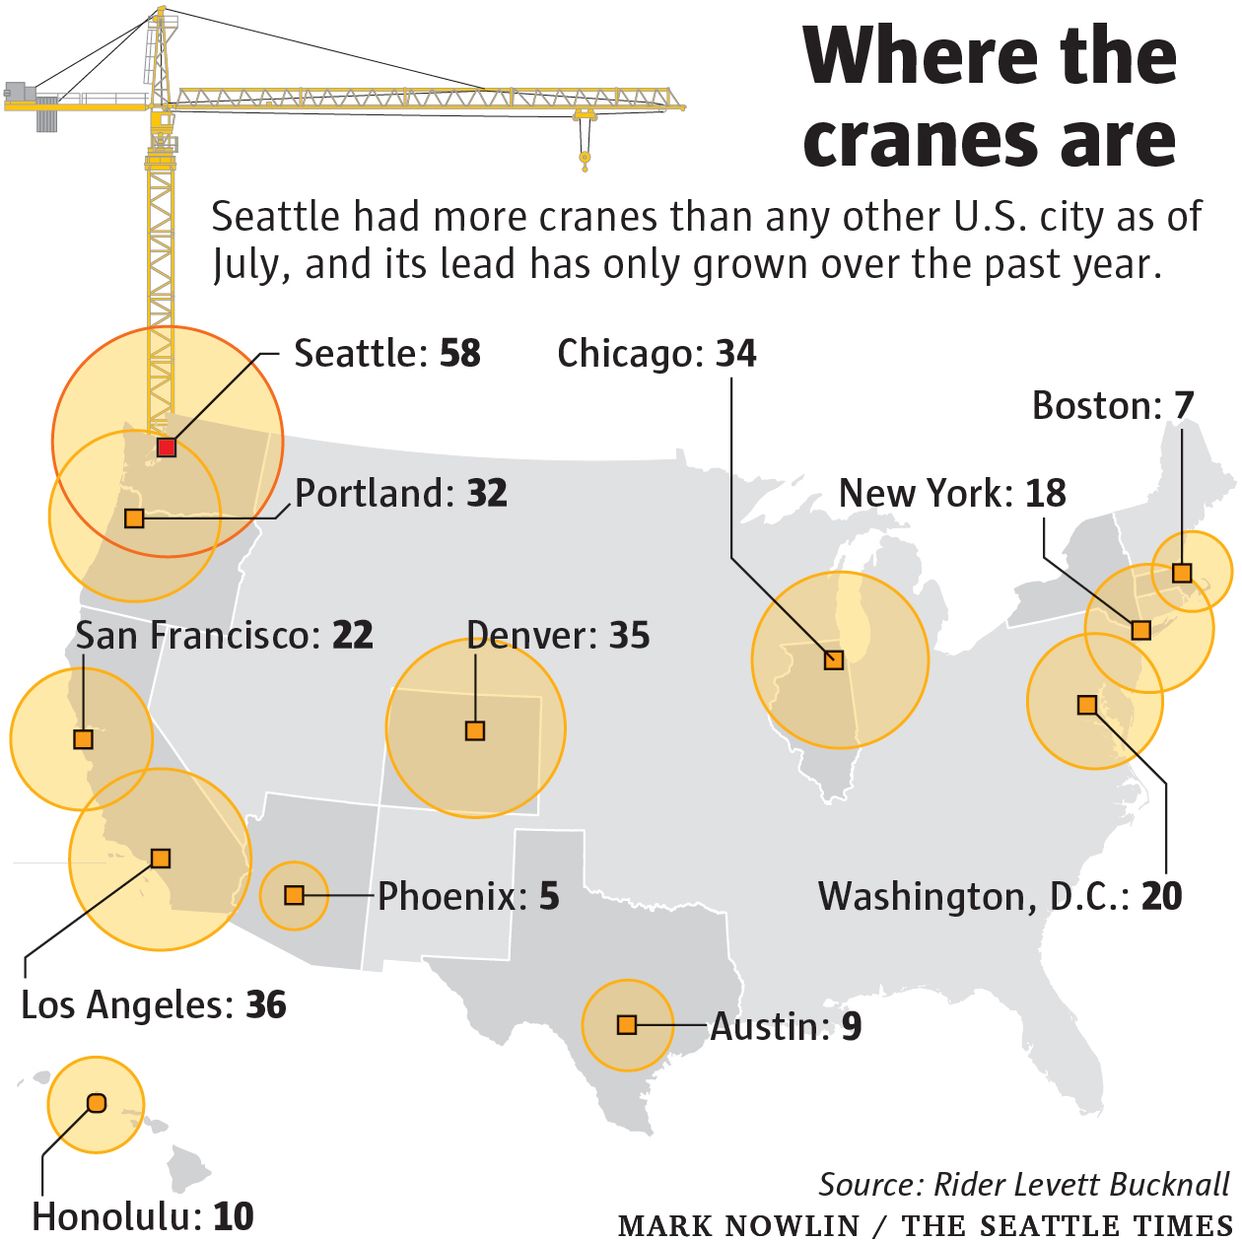

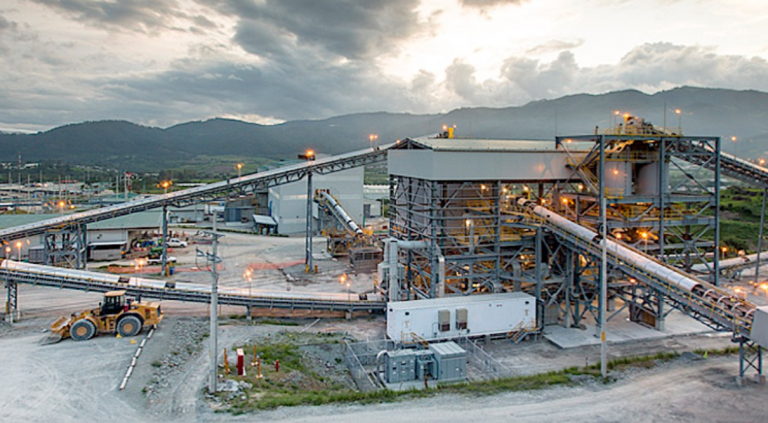
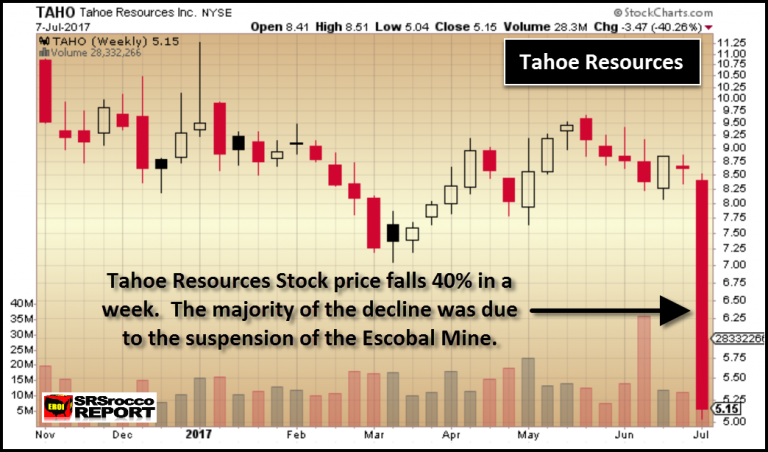


You must be logged in to post a comment.