Apparently the biggest banks in the US didn’t learn their lesson the first time around…
Because a few days ago, Wells Fargo, Bank of America, and many of the usual suspects made a stunning announcement that they would start making crappy subprime loans once again!
I’m sure you remember how this all blew up back in 2008.
Banks spent years making the most insane loans imaginable, giving no-money-down mortgages to people with bad credit, and intentionally doing almost zero due diligence on their borrowers.
With the infamous “stated income” loans, a borrower could qualify for a loan by simply writing down his/her income on the loan application, without having to show any proof whatsoever.
Fraud was rampant. If you wanted to qualify for a $500,000 mortgage, all you had to do was tell your banker that you made $1 million per year. Simple. They didn’t ask, and you didn’t have to prove it.
Fast forward eight years and the banks are dusting off the old playbook once again.
Here’s the skinny: through these special new loan programs, borrowers are able to obtain a mortgage with just 3% down.
Now, 3% isn’t as magical as 0% down, but just wait ‘til you hear the rest.
At Wells Fargo, borrowers who have almost no savings for a down payment can actually qualify for a LOWER interest rate as long as you go to some silly government-sponsored personal finance class.
I looked at the interest rates: today, Wells Fargo is offering the exact same interest rate of 3.75% on a 30-year fixed rate, whether you have bad credit and put down 3%, or have great credit and put down 30%.
But if you put down 3% and take the government’s personal finance class, they’ll shave an eighth of a percent off the interest rate.
In other words, if you are a creditworthy borrower with ample savings and a hefty down payment, you will actually end up getting penalized with a HIGHER interest rate.
The banks have also drastically lowered their credit guidelines as well… so if you have bad credit, or difficulty demonstrating any credit at all, they’re now willing to accept documentation from “nontraditional sources”.
In its heroic effort to lead this gaggle of madness, Bank of America’s subprime loan program actually requires you to prove that your income is below-average in order to qualify.
Think about that again: this bank is making home loans with just 3% down (because, of course, housing prices always go up) to borrowers with bad credit who MUST PROVE that their income is below average.
[As an aside, it’s amazing to see banks actively competing for consumers with bad credit and minimal savings… apparently this market of subprime borrowers is extremely large, another depressing sign of how rapidly the American Middle Class is vanishing.]
Now, here’s the craziest part: the US government is in on the scam.
The federal housing agencies, specifically Fannie Mae, are all set up to buy these subprime loans from the banks.
Wells Fargo even puts this on its website: “Wells Fargo will service the loans, but Fannie Mae will buy them.” Hilarious.
They might as well say, “Wells Fargo will make the profit, but the taxpayer will assume the risk.”
Because that’s precisely what happens.
The banks rake in fees when they close the loan, then book another small profit when they flip the loan to the government.
This essentially takes the risk off the shoulders of the banks and puts it right onto the shoulders of where it always ends up: you. The consumer. The depositor. The TAXPAYER.
You would be forgiven for mistaking these loan programs as a sign of dementia… because ALL the parties involved are wading right back into the same gigantic, shark-infested ocean of risk that nearly brought down the financial system in 2008.
Except last time around the US government ‘only’ had a debt level of $9 trillion. Today it’s more than double that amount at $19.2 trillion, well over 100% of GDP.
In 2008 the Federal Reserve actually had the capacity to rapidly expand its balance sheet and slash interest rates.
Today interest rates are barely above zero, and the Fed is technically insolvent.
Back in 2008 they were at least able to -just barely- prevent an all-out collapse.
This time around the government, central bank, and FDIC are all out of ammunition to fight another crisis. The math is pretty simple.
Look, this isn’t any cause for alarm or panic. No one makes good decisions when they’re emotional.
But it is important to look at objective data and recognize that the colossal stupidity in the banking system never ends.
So ask yourself, rationally, is it worth tying up 100% of your savings in a banking system that routinely gambles away your deposits with such wanton irresponsibility…
… especially when they’re only paying you 0.1% interest anyhow. What’s the point?
There are so many other options available to store your wealth. Physical cash. Precious metals. Conservative foreign banks located in solvent jurisdictions with minimal debt.
You can generate safe returns through peer-to-peer arrangements, earning up as much as 12% on secured loans.
(In comparison, your savings account is nothing more than an unsecured loan you make to your banker, for which you are paid 0.1%…)
There are even a number of cryptocurrency options.
Bottom line, it’s 2016. Banks no longer have a monopoly on your savings. You have options. You have the power to fix this.
There was a small ray of hope just after the Lehman collapse that one of the most lamentable characteristics of US society – the relentless urge to build massive McMansions (funding questions aside) – was fading. Alas, as the Census Bureau confirmed this week, that normalization in the innate American desire for bigger, bigger, bigger not only did not go away but is now back with a bang.
According to just released data, both the median and average size of a new single-family home built in 2015 hit new all time highs of 2,467 and 2,687 square feet, respectively.
And while it is known that in absolute number terms the total number of new home sales is still a fraction of what it was before the crisis, the one strata of new home sales which appears to not only not have been impacted but is openly flourishing once more, are the same McMansions which cater to the New Normal uber wealthy (which incidentally are the same as the Old Normal uber wealthy, only wealthier) and which for many symbolize America’s unbridled greed for mega housing no matter the cost.
Not surprisingly, as size has increased so has price: as we reported recently, the median price for sold new single-family homes just hit record a high of $321,100.
The data broken down by region reveals something unexpected: after nearly two decades of supremacy for the Northeast in having the largest new homes, for the past couple of years the region where the largest homes are built is the South.
While historically in the past the need for bigger housing could be explained away with the increase in the size of the US household, this is no longer the case, and as we showed last week, household formation in the US has cratered. In fact, for the first time In 130 years, more young adults live with parents than with partners…
…so the only logical explanation for this latest push to build ever bigger houses is a simple one: size matters.
Furthermore it turns out it is not only size that matters but amenities. As the chart below shows, virtually all newly-built houses have A/Cs, increasingly more have 3 or more car garages, 3 or more bathrooms, and for the first time, there were more 4-bedroom than 3-bedroom new houses built.
In conclusion it is clear that the desire for McMansions has not gone away, at least not among those who can afford them. For everyone else who can’t afford a mega home or any home for that matter: good luck renting Blackstone’s McApartment, whose price incidentally has soared by 8% in the past year.
For those curious for more, here is a snapshot of the typical characteristics of all 2015 new housing courtesy of the Census Bureau:
453,000 were detached homes, 49,000 were attached homes.
327,000 had a 2-car garage and 131,000 had a garage for 3 cars or more.
200,000 had one story, 278,000 had two stories, and 24,000 had three stories or more.
348,000 were paid for using conventional financing and 42,000 were VA-guaranteed.
The median sales price of new single-family homes sold was $296,400 in 2015, compared with the average sales price of $360,600.
The median size of a new single-family home sold was 2,520 square feet.
The type of foundation was a full or partial basement for 80% percent of the new single-family homes sold in the Midwest compared with 8% in the South.
On the heels of the 17-sigma beat in new home sales, pending home sales soared 5.1% MoM in April – 6.5 standard deviations above economist estimates of a 0.7% jump. Pending home sales rose for the third consecutive month in April and reached their highest level in over a decade, according to the National Association of Realtors. All major regions saw gains in contract activity last month (with The West surging 11.5% MoM) except for the Midwest, which saw a meager decline.
Best month since 2010…
Which no one saw coming…. Some context for the “beat”…
Lawrence Yun, NAR chief economist, says vast gains in the South and West propelled pending sales in April to their highest level since February 2006 (117.4).
“The ability to sign a contract on a home is slightly exceeding expectations this spring even with the affordability stresses and inventory squeezes affecting buyers in a number of markets,” he said. “The building momentum from the over 14 million jobs created since 2010 and the prospect of facing higher rents and mortgage rates down the road appear to be bringing more interested buyers into the market.”
Yun expects sales this year to climb above earlier estimates and be around 5.41 million, a 3.0 percent boost from 2015. After accelerating to 6.8 percent a year ago, national median existing-home price growth is forecast to slightly moderate to between 4 and 5 percent.
The usually strong spring housing market could be far stronger this year, if only there were more homes for sale.
The number of listings continues to drop, as demand outstrips supply and potential sellers bow out, fearing they won’t be able to find something else to buy.
The inventory of homes for sale nationally in April was 3.6 percent lower than in April 2015, according to the National Association of Realtors. Redfin, a real estate brokerage, also recently reported a drop in new listings.
The supply numbers are even tighter in certain local markets: Inventory is down 32 percent in Portland, Oregon, from a year ago; down 22 percent in Kansas City; down 21 percent in Dallas and Seattle; down 17 percent in Charlotte, North Carolina; down 12 percent in Atlanta; down nearly 10 percent in Chicago; and down 8 percent in Los Angeles, according to Zillow. Houston and Miami are seeing big gains in supply, due to economic issues specific to those markets.
“The struggle will continue for home shoppers this summer,” said Zillow chief economist Svenja Gudell. “New construction has been sluggish over the past year; we’re building about half as many homes as we should be in a normal market. There still aren’t enough homes on the market to keep up with the high demand from every type of home buyer.”
The short supply is pushing home prices higher than expected this year. Zillow had predicted 2 percent growth in home values from April 2015 to April 2016, but its latest data show values currently soaring more than twice that, at 4.9 percent.
“In many markets, those looking to buy a home in the bottom or middle of the market will need to be prepared for bidding wars and homes selling for over the asking price. This summer’s selling season’s borders will most likely be blurred again, as many buyers are left without homes and will need to keep searching,” added Gudell.
The inventory drops are most severe in the lower-priced tier of the market. Homes in the top tier are seeing gains and therefore show more price cuts. Sixteen percent of top-tier homes had a price cut over the past year, compared with 11 percent of bottom-tier homes and 13 percent of middle-tier, according to Zillow.
Sen. Mike Lee (R-Utah) has an amendment that would actually prohibit this implementation of the Affirmative Furthering Fair Housing (AFFH) regulation, specifically stopping HUD from attaching zoning changes as a condition for receiving funding, and it deserves every senator’s support.
According to the Federal Register, AFFH directs municipalities “to examine relevant factors, such as zoning and other land-use practices that are likely contributors to fair housing concerns, and take appropriate actions in response” as a condition for receipt of the block grants. It’s right there in the regulation.
On the other hand, Sen. Susan Collins (R-Maine) offers an amendment which merely reiterates current law that the federal government cannot compel the local zoning changes, stating no funds can be used “to direct a grantee to undertake specific changes to existing zoning laws.”
As noted by the National Review’s Stanley Kurtz, “Federal law already forbids HUD from mandating the spending priorities of state and local governments or forcing grant recipients to forgo their duly adopted policies or laws, including zoning laws. AFFH gets around this prohibition by setting up a situation in which a locality can’t get any federal grant money unless it ‘voluntarily’ promises to change its zoning laws and change its housing policies in exactly the way HUD wants.”
Kurtz emphasizes the point: “This trick allows HUD to avoid formally ‘directing’ localities to do anything at all in order to get their HUD grants. But HUD gives localities plenty of informal ‘guidance’ that makes it perfectly clear what they actually have to do to get their federal grants.”
Therefore, even with the Collins amendment, AFFH will still require municipalities to “examine relevant factors, such as zoning and other land-use practices that are likely contributors to fair housing concerns, and take appropriate actions in response” as a condition for receipt of the block grants.
This is an attempt by the Senate to pretend to have acted to stop the federalization of local zoning decisions without actually doing so. The Lee amendment will remove the local zoning strings attached to the funding, plain and simple. The Collins amendment will not.
It is telling that President Obama is threatening a veto of an appropriations bill that has “ideological” content, when the President himself is exercising the power of the purse to compel his ideological vision on our nation’s cities, towns and counties through implementation of AFFH.
The Collins amendment, ironically, will enable and advance this ideological agenda — while offering constituents false comfort that it has been abated when it has not. Only the Lee amendment can stop this HUD driven transformation of our neighborhoods.
The House has already passed the Lee language twice with vocal support from across the Conference ranging from Representatives Paul Gosar to Peter King. Americans for Limited Government urges every senator to vote yes on the Lee amendment to the Transportation-HUD appropriations bill — and stop the federalization of local zoning policiesonce and for all.
Unlike recent months when the Census Bureau reported some fireworks in the New Housing Starts and Permits data, the April update was relatively tame, and saw Starts rise from an upward revised 1,099K to 1,172K, beating expectations of a 1,125K print, mostly as a result of a 36K increase in multi-family units which however remain depressed below recent peaks from early 2015, which will likely stoke even higher asking rents, already at record highs across the nation.
But if starts were better than expected, then the future pipeline in the form of Housing Permits disappointed, with 1,116K units permitted for the month of April, below the 1,135K expected, if a rebound from last month’s downward revised 1,077K.
The issue, as with the starts data, is the multi-family, aka rental units, barely rebounded and remained at severely depressed levels last seen in 2013: at 348K rental units permitted in April, this is a far cry from the recent highs of 598K in June.
One wonders if this is intentional, because based on soaring asking rents, as shown in the chart below, with Americans increasingly unable or unwilling to buy single-family units, rental prices have exploded to 8% Y/Y based on Census data.
Should multi-family permits and starts remain as depressed as it has been in recent months, we expect that this chart of soaring median asking rents will only accelerate in the near future, and will require a whole host of seasonal adjustments from making its way into the already bubbly CPI data.
The purpose of the Federal Housing Administration is “to help creditworthy low-income and first-time home buyers“, individuals and families often denied traditional credit, to obtain a mortgage and purchase a home.” This system has been successful, and has aided in promoting home ownership. However, the FHA loan program and its related benefits are under threat as the Department of Justice continues to bring investigations and actions against lenders under the False Claims Act.
Criticism of the DOJ’s approach is that the department is using the threat of treble damages available under the False Claims Act to intimidate lenders into paying outsized settlements and having lenders admit guilt simply to avoid the threat of the enormous liability and the cost of a prolonged defense. If the DOJ wanted to go after bad actors who are truly defrauding the government with dishonest underwriting practices or nonexistent quality control procedures, then that would be acceptable to the industry.
But the DOJ seems to be simply going after deep pockets, where the intentions of the lenders are well-placed and the errors found are legitimate mistakes. Case in point: as of December 2015, Quicken Loans was the largest originator of FHA loans in the country, and they are currently facing the threat of a False Claims Act violation. To date Quicken has vowed to continue to fight, and stated they will expose the truth about the DOJ’s egregious attempts to coerce these unjust “settlements.”
When an originator participates in the FHA program, they are operating under the Housing and Urban Development’s FHA guidelines. As HUD cannot, and does not, check each and every loan guaranteed by FHA to confirm unflawed origination, the agency requires certification that the lender originating the file did so in compliance with the applicable guidelines. If the loan defaults, the lender submits a claim and the FHA will pay out the balance of the loan under the guarantee.
The False Claims Act provides that any person who presents a false claim or makes a false record or statement material to a false claim, “is liable to the United States Government for a civil penalty of not less than $5,500 and not more than $11,000…plus 3 times the amount of damages which the Government sustains because of the act.”
The DOJ argues that when a loan with known origination errors is certified by the lender to the FHA, with a subsequent claim submitted by the lender to the FHA after a default, the lender is in violation of the False Claims Act — because they knew or should have known the loan had defects when they submitted their certification, and yet still allowed the government to sustain a loss when the FHA paid out of the loan balance.
In the mortgage space the potential liability is astronomical because of the aforementioned penalties. The major issues in a False Claims Act violation can be boiled down to two major points: lack of clarity and specificity around what the DOJ considers “errors;” and what constitutes knowing loans were defective under the DOJ’s application of the act.
To the first point: are the errors of the innocuous, ever-present type found in a large lender’s portfolio, or egregious underwriting errors knowingly committed to increase production while offsetting risk through the FHA program? Obviously, lenders are arguing the former.
Prior to Justice’s aggressive pursuit of these settlements, if the FHA identified an underwriting error the lender would simply indemnify the FHA and not process the claim, effectively making it a lender-owned loan. This was an acceptable risk to lenders, as an error in the origination process could not become such an oversized loss. The liability would be capped to any difference between the borrower’s total debt at the time of foreclosure sale and what the lender could recoup when the property was liquidated. The DOJ’s use of the False Claims Act now triples a lender’s risk when originating FHA loans by threatening damages that are triple the value of the amount paid out by FHA.
In his letter to all JPMorgan Chase & Co. shareholders in April, Chief Executive Officer Jamie Dimon outlined the bank’s reasons for discontinuing its involvement with FHA loans. This perfectly illustrates how the DOJ is basically restoring all the lender risk to FHA-backed originations. Banks originating FHA loans are left with two choices: price in the new risk of underwriting errors into and pass the cost to the end borrower, making the product so costly it becomes pointless to offer; or cease or severely limit FHA offerings. If lenders take either approach, the DOJ will have negated the purpose of the FHA by limiting borrowers’ access to credit.
Walking away from FHA lending is not as simple as it sounds. Most FHA borrowers tend to have lower credit scores and/or require lower down payments. Most FHA loans also tend to be for homes located in low- and moderate-income neighborhoods. Any decline in an institution’s FHA offerings most likely will have a negative impact on an institution’s Community Reinvestment Act ratings. One has to think the DOJ is well aware of this fact and believes it will keep lenders in the FHA business even with the elevated risk, and can simply continue to strong-arm lenders into settlements.
If the Justice Department continues to aggressively utilize the False Claims Act, originators will be forced to evolve and create a product that they can keep as a portfolio loan or sell privately that can reach the same borrowers the FHA-insured products currently do. Again, there is a high likelihood that these products will not have as attractive terms as the FHA loans that borrowers are currently enjoying.
Large lenders will continue to step away from FHA originations, and smaller lenders originating FHA loans should be strongly aware of the risk they are taking on by continuing to originate FHA loans and increasing their portfolios as the larger banks exit the FHA market. Many large lenders have faced or are currently facing these actions, and from the Justice Department’s recent statements it does not appear they will abate anytime soon.
Hillary’s rumored running mate, Housing Secretary Julian Castro, is cooking up a scheme to reallocate funding for Section 8 housing to punish suburbs for being too white and too wealthy.
The scheme involves super-sizing vouchers to help urban poor afford higher rents in pricey areas, such as Westchester County, while assigning them government real estate agents called “mobility counselors” to secure housing in the exurbs.
Castro plans to launch the Section 8 reboot this fall, even though a similar program tested a few years ago in Dallas has been blamed for shifting violent crime to affluent neighborhoods.
It’s all part of a grand scheme to forcibly desegregate inner cities and integrate the outer suburbs.
Anticipating NIMBY resistance, Castro last month threatened to sue suburban landlords for discrimination if they refuse even Section 8 tenants with criminal records. And last year, he implemented a powerful new regulation — “Affirmatively Furthering Fair Housing” — that pressures all suburban counties taking federal grant money to change local zoning laws to build more low-income housing (landlords of such properties are required to accept Section 8 vouchers).
Castro is expected to finalize the new regulation, known as “Small-Area Fair Market Rents” (SAFMR), this October, in the last days of the Obama presidency.
It will set voucher rent limits by ZIP code rather than metro area, the current formula, which makes payments relatively small. For example, the fair market rent for a one-bedroom in New York City is about $1,250, which wouldn’t cover rentals in leafy areas of Westchester County, such as Mamaroneck, where Castro and his social engineers seek to aggressively resettle Section 8 tenants.
In expensive ZIP codes, Castro’s plan — which requires no congressional approval — would more than double the standard subsidy, while also covering utilities. At the same time, he intends to reduce subsidies for those who choose to stay in housing in poor urban areas, such as Brooklyn. So Section 8 tenants won’t just be pulled to the suburbs, they’ll be pushed there.
“We want to use our housing-choice vouchers to ensure that we don’t have a concentration of poverty and the aggregation of racial minorities in one part of town, the poor part of town,” the HUD chief said recently, adding that he’s trying to undo the “result of discriminatory policies and practices in the past, and sometimes even now.”
A draft of the new HUD rule anticipates more than 350,000 Section 8 voucher holders will initially be resettled under the SAFMR program. Under Obama, the total number of voucher households has grown to more than 2.2 million.
The document argues that larger vouchers will allow poor urban families to “move into areas that potentially have better access to jobs, transportation, services and educational opportunities.” In other words, offering them more money to move to more expensive neighborhoods will improve their situation.
But HUD’s own studies show the theory doesn’t match reality.
President Bill Clinton started a similar program in 1994 called “Moving to Opportunity Initiative,” which moved thousands of mostly African-American families from government projects to higher-quality homes in safer and less racially segregated neighborhoods in several counties across the country.
The 15-year experiment bombed.
A 2011 study sponsored by HUD found that adults using more generous Section 8 vouchers did not get better jobs or get off welfare. In fact, more went on food stamps. And their children did not do better in their new schools.
Worse, crime simply followed them to their safer neighborhoods, ruining the quality of life for existing residents.
“Males … were arrested more often than those in the control group, primarily for property crimes,” the study found.
Dubuque, Iowa, for example, received an influx of voucher holders from projects in Chicago — and it’s had a problem with crime ever since. A recent study linked Dubuque’s crime wave directly to Section 8 housing.
Of course, even when reality mugs leftists, they never scrap their social theories. They just double down.
The problem, they rationalized, was that the relocation wasn’t aggressive enough. They concluded they could get the desired results if they placed urban poor in even more affluent areas.
HUD recently tested this new theory in Dallas with disastrous results.
Starting in 2012, the agency sweetened Section 8 voucher payments, and pointed inner-city recipients to the far-flung counties surrounding Dallas. As government-subsidized rentals spread in all areas of the Metroplex (163 ZIP codes vs. 129 ZIP codes), so did crime.
Now Dallas has one of the highest murder rates in the nation, and recently had to call in state troopers to help police control it. For the first time, violent crime has shifted to the tony bedroom communities north of the city. Three suburbs that have seen the most Section 8 transfers — Frisco, Plano and McKinney — have suffered unprecedented spikes in rapes, assaults and break-ins, including home invasions.
Although HUD’s “demonstration project” may have improved the lives of some who moved, it’s ended up harming the lives of many of their new neighbors. And now Castro wants to roll it out nationwide. Soon he will give Section 8 recipients money to afford rent wherever they choose — and if they don’t want to move, he’ll make them an offer they can’t refuse.
Ironically, Hillary’s own hometown of Chappaqua is fighting Section 8 housing because of links to drugs and crime and other problems.
This is a big policy shift that will have broad implications, affecting everything from crime to property values. And it could even impact the presidential election, especially if Castro joins Hillary on the Democratic ticket.
Bay Area residents have had it with high costs and congestion.
According to a 1,000-person poll conducted by the Bay Area Council, a business-sponsored public policy advocacy group, about one-third of people living in the nine counties surrounding the San Francisco Bay are considering moving. According to SF Gate, council president and CEO Jim Wunderman called it the region’s “canary in a coal mine,” forewarning danger if nothing’s done to remedy the issues.
The poll found that 34% of Bay Area residents say that they are either strongly and somewhat likely to move away. While 54% say they have no plans to do so, only 31% feel strongly about staying.
Plans for relocation aside, there has been a considerable drop in optimism in recent years. About 40% of residents think that the area is headed in the right direction, compared to 55% last year and 57% the year before. Meanwhile, another 40% think that the Bay Area is “seriously off the wrong track.” Notably, optimism positively correlates with higher income.
The Census Bureau released its quarterly updateon residential vacancies and home ownership for Q1 which is closely watched for its update of how many Americans own versus rent. It shows that following a modest pickup in the home ownership rate in the prior two quarters, US homeowners once again posted a substantial decline, sliding from 63.8% to 63.5%, and just 0.1% higher than the 50 year low reported in Q2 2015.
And perhaps logically, while home ownership continues to stagnate, the number of renters has continued to soar. In fact, in the first quarter, the number of renter occupied houses rose by precisely double the amount, or 360,000, as the number of owner occupied houses, which was a modest increase of 180,000. This brings the total number of renter houses to 42.85 million while the number of homeowners is virtually unchanged at 74.66 million.
A stark representation of the divergence between renters and owners can be seen in the chart below. It shows that over the past decade, virtually all the housing growth has come thanks to renters while the number of homeowners hasn’t budged even a fraction and has in fact declined in absolute numbers. What is obvious is that around the time the housing bubble burst, many Americans appear to have lost faith in home ownership and decided to become renters instead.
An immediate consequence of the above is that as demand for rental units has soared, so have median asking rents, and sure enough, according to Census, in Q1 the median asking rent at the national level soared to an all time high $870.
Which brings us to the one chart showing where the “missing” runaway inflation in the US is hiding: if one shows the annual increase in asking rents, what one gets is the following stunning chart which shows that while rent inflation had been roughly in the 1-2% corridor for two decades, starting in 2013 something snapped, and rent inflation for some 43 million Americans has exploded and is currently printing at a blended four quarter average rate of just over 8%, the highest on record, and 4 times higher than Yellen’s inflationary target.
So the next time Janet Yellen laments the collapse of inflation, feel free to show her this chart which even she can easily recreate using the government’s own data (the sad reality is that rents are rising even faster than what the government reports) at the following link.
Purchases of new homes unexpectedly declined in March for a third month, reflecting the weakest pace of demand in the West since July 2014.
Total sales decreased 1.5% to a 511,000 annualized pace, a Commerce Department report showed Monday. The median forecast in a Bloomberg survey was for a gain to 520,000. In Western states, demand slumped 23.6%.
Purchases rose in two regions last month, indicating uneven demand at the start of the busiest time of the year for builders and real estate agents. While new construction has been showing limited upside, cheap borrowing costs and solid hiring will help ensure residential real estate continues to expand.
“Housing is certainly not booming,” Jim O’Sullivan, chief U.S. economist at High Frequency Economics Ltd. in Valhalla, N.Y., said before the report. “Some people may be shut out of the market because lending standards are still tight. There may still be some reluctance to buy versus rent.”
Even so, “through the volatility, the trend is still more up than down, and we expect modest growth in sales,” he said.
Economists’ estimates for new-home sales ranged from 488,000 to 540,000. February purchases were revised to 519,000 from 512,000. The monthly data are generally volatile, one reason economists prefer to look at longer term trends.
The report said there was 90% confidence the change in sales last month ranged from a 13.5% drop to a 16.5% increase.
Sales in the West declined to a 107,000 annualized rate in March after surging 21.7% the previous month to 140,000. In the South, purchases climbed 5% to a 314,000 pace in March, the strongest in 13 months. Sales in the Midwest advanced 18.5%, the first gain in three months, and were unchanged in the Northeast.
The median sales price decreased 1.8% from March 2015 to $288,000.
There were 246,000 new houses on the market at the end of March, the most since September 2009. The supply of homes at the current sales rate rose to 5.8 months, the highest since September, from 5.6 months in the prior period.
From a year earlier, purchases increased 5.8% on an unadjusted basis.
New-home sales, which account for less than 10% of the residential market, are tabulated when contracts get signed. They are generally considered a timelier barometer of the residential market than purchases of previously owned dwellings, which are calculated when a contract closes, typically a month or two later.
Borrowing costs are hovering close to a three-year low, helping to bring house purchases within the reach of more Americans. The average rate for a 30-year fixed mortgage was 3.59% last week, down from 3.97% at the start of the year, according to data from Freddie Mac.
The job market is another source of support. Monthly payrolls growth averaged 234,000 in the past year, and the unemployment rate of 5% is near an eight-year low. Still, year-over-year wage gains have been stuck in a 2% to 2.5% range since the economic expansion began in mid-2009.
The market for previously owned homes improved last month, climbing 5.1% to a 5.33 million annualized rate, the National Association of Realtors reported April 20. Prices rose as inventories remained tight.
Even so, the market is getting little boost from first-time buyers, who accounted for 30% of all existing-home purchases, a historically low share, according to the group.
Recent data on home building has been less encouraging, although those figures are volatile month to month. New-home construction slumped in March, reflecting a broad-based retreat, a Commerce Department report showed last week. Home starts fell 8.8% to the weakest annual pace since October. Permits, a proxy for future construction, also unexpectedly dropped.
While the outlook for overall economic growth is darkening, the housing market is expected to keep up its momentum in 2016, according to Freddie Mac’s April 2016 Economic Outlook released on Friday.
Freddie Mac revised downward its forecast for Q1 GDP growth from 1.8 percent down to 1.1 percent. The “advance” estimate for GDP growth in the first quarter will be released by the Bureau of Economic Analysis (BEA) on Thursday, April 28. The GDP grew at an annual rate of just 0.6 percent in the first quarter of 2015 but then shot up to 3.9 percent for Q2; for the third and fourth quarter, the real GDP grew at rates of 2.0 percent and 1.4 percent, respectively.
The first quarter for the last few years has been punctuated by slow economic growth. While some of this can be attributed to seasonality, Ten-X (then Auction.com) Chief Economist Peter Muoio said that last year’s dismal GDP showing in the first quarter could be attributed to the brutal winter which slowed economic activity, labor disagreements at a bunch of the West Coast ports that really slowed the flow of cargo in Q1, and low oil prices (though this was partially offset by lower gas prices which put more money in consumers’ pockets).
“We’ve revised down our forecast for economic growth to reflect the recent data for the first quarter, but our outlook for the balance of the year remains modestly optimistic for the economy,” Freddie Mac Chief Economist Sean Becketti said. “However, we maintain our positive view on housing. In fact, the declines in long-term interest rates that accompanied much of the recent news should increase mortgage market activity, particularly refinance.”
On the positive side, Freddie Mac expects the unemployment rate will fall back below 5 percent for 2016 and 2017 (last month it ticked back up to 5.0 percent after hovering at 4.9 percent for a couple of months). Reduced slack in the labor market will push wage gains above inflation, although the gains are expected to be only modest, according to Freddie Mac.
While the economic forecast for Q1 has grown darker, the forecast looks bright for housing in 2016, however.
“We expect housing to be an engine of growth,” Freddie Mac stated in the report. “Construction activity will pick up as we enter the spring and summer months, and rising home values will bolster consumers and help support renewed confidence in the remaining months of this year.”
Low mortgage rates have boosted refinance activity in the housing market during Q1. The 30-year fixed mortgage rate averaged 3.7 percent for the first quarter, which drove an increase for the 1-4 single-family originations estimate for 2016 up by $50 billion up to $1.7 billion. Rates are expected to bump up, however, and average 4 percent over the full year of 2016, according to Freddie Mac. House prices are expected to appreciate by 4.8 percent over 2016 and 3.5 percent for 2017; homeowner equity is expected to rise as a result of the home price appreciation, which could mean more refinance opportunities.
The low mortgage rates combined with solid job growth are expected to make 2016 the strongest year for home sales since the pre-crisis year of 2006 despite the persistently tight inventory of for-sale homes, according to Freddie Mac.
“Sales were slow in the first quarter, but trends in mortgage purchase applications remain robust and we expect home sales to accelerate throughout the second quarter of 2016 as we approach peak home buying season,” Freddie Mac said.
Click here to view the entire Freddie Mac Economic Outlook for April 2016.
It’s 9:30 a.m. on a recent sunny Friday, and 60 people have crammed into an airport hotel conference room in Northern Virginia to hear Kevin Shortle, a veteran real estate professional with a million-watt smile, talk about “architecting a deal.”
Some have worked in real estate before, flipping houses or managing rentals. But the deals Shortle, lead national instructor for a company called Note School, is describing are different: He teaches people how to buy home notes, the building blocks of housing finance.
While titles and deeds establish property ownership, notes — the financial agreements between lenders and home buyers — set the terms by which a borrower will pay for the home. Financial institutions have long passed them back and forth as they re-balance their portfolios.
But the trade in delinquent notes has exploded in the post-financial-crisis world. As government entities like Fannie Mae and Freddie Mac have struggled with the legacies of the housing bust, they’ve sold billions of dollars’ of delinquent notes to big institutional investors, who resell them in turn.
A sign outside a foreclosed home for sale in Princeton, Ill, in January 2014.
And people like the ones in the Sheraton now pay good money to learn how to pursue what Note School calls “rich rewards.” The result: a marketplace where thousands of notes are bought and sold for a fraction of the value of the homes they secure.
A buyer can renegotiate with the homeowner, collecting steady cash. Or she might offer a “cash for keys” payout and seek a tenant or new owner. If all else fails, she can foreclose.
For some housing market observers, the churn in notes is a sign that the financial crisis hasn’t fully healed — and a fresh source of potential abuses. But the people listening to Shortle saw opportunity as he explained how they can “be the bank” for people with mortgage-payment problems.
“You can make a lot of money in the problem-solving business,” Shortle said.
How home notes move through a healing housing market
Since most people buy homes using mortgage financing, notes can be thought of as another name for mortgage agreements. After the home purchase closes, banks and other lenders usually sell them to government entities like Fannie Mae, Freddie Mac, and the Federal Housing Administration.
The housing market has improved since the bust, but hasn’t healed fully. There were 1.4 million foreclosures in 2015, according to real estate data firm RealtyTrac, and more than 17% of all transactions last year were deemed “distressed” — more than double pre-bust levels — in some way.
As the dust has settled, government agencies have begun selling delinquent notes to big institutional investors like Lone Star Funds, Goldman Sachs GS, +2.76% and Fortress Investments FIG, +3.96% as well as some community nonprofits, in bulk. The agencies have sold more than $28 billion in distressed loans since 2012, according to government data.
The big investors then sell some to buyers such as Colonial Capital Management, which is run by the same people who run Note School. Colonial, which buys about 2,000 notes a year, sells most of them one by one to people like the ones who gathered in the Virginia Sheraton.
It’s difficult to know how much this happens and what it has meant for homeowners.
Anyone who buys notes from the government must follow reporting requirements that include information on how the loans perform. Those requirements stay with the notes if they’re resold; they expire four years after the government’s initial sale. But nobody tracks note sales that weren’t made by the government, and even the government’s records don’t link outcomes and note owners.
March data from the Federal Housing Administration only hint at a broad view of how post-sale loans perform. The FHA has sold roughly 89,000 loans since 2012; less than 11% of those homeowners now pay their mortgages on time. Many are simply classified as “unresolved.” More than 34% had been foreclosed upon.
Fannie Mae and Freddie Mac, which began selling notes in 2014, were supposed to report similar data by the end of March. A spokeswoman for the agencies’ regulator said she did not know when that report, still incomplete, would be submitted.
And not all notes are initially sold by the government, making comprehensive oversight of the marketplace even harder. Banks and other lenders often sell notes directly; Colonial doesn’t buy notes from the government, according to Eddie Speed, founder of both Note School and Colonial.
For investors, a cleaner deal than the world of ‘tenants and toilets’
Note buying has attractions for both investors and the communities where the homeowners live.
Delinquent notes can be bought cheaply, often for about a third of a home’s market value. Note buyers get an investment that’s more like a financial asset — and less dirty than the landlord’s world of “tenants and toilets.”
Meanwhile, investors can often afford to cut homeowners a significant break, avoiding foreclosure while still making a profit.
And there’s government money for the taking in the name of helping homeowners. Since the housing crisis, the federal government has allocated nearly $10 billion to states deemed hardest-hit by the bust. Those states funnel the money to borrowers, often to help them reach new agreements with their lenders.
That can help municipalities that lose out on property taxes when homeowners don’t make payments, and which benefit from having more involved owners, Speed says.
Eddie Speed
When Tj Osterman, 38, and Rick Allen, 36, who have worked together as real-estate investors for about 10 years in the Orlando area, first explored note buying, they thought it little different than flipping abandoned houses.
But when they realized homeowners were often still in the picture, they changed their approach to try to work with them. Some of their motivation came from personal experience: Allen went through foreclosure in 2007. “It was a tough time,” he said. “I wish there was someone like me who said, let’s help you keep your house.”
They can buy notes cheaply enough that they can reduce the principal owed by homeowners “as much as 50%, and still turn a nice profit, pay back taxes, [and] get these people feeling good about themselves again,” said Osterman.
They now have a goal of helping save 10,000 homeowners from foreclosure. “I’m so addicted to the socially responsible side of stuff,” Osterman said. “We talk with borrowers like human beings and underwrite to real-world standards.”
‘There’s a system out there that’s broken’
Some housing observers have concerns about drawing nonprofessionals into an often-opaque market. A recent example Shortle used as a case study during the Virginia seminar helps explain why.
A note on an Atlanta-area home was being sold for $24,360; according to estimates from Zillow and local agents, its market value was between $50,000 and $70,000.
Some back taxes were owed, and a payment history showed that while the homeowner was making erratic or partial payments on her $500 monthly mortgage, she hadn’t quit. She had some equity built up in the house, another sign of commitment.
Real-estate investment firm Stonecrest sold her the home in 2012; she had used Stonecrest’s own financing at 9%. Her payment record was spotless until 2014. Stonecrest sold the note to Colonial in 2015 and Colonial offered it for resale in early 2016.
Most notes underpin mortgages. But this one was linked to a land contract, a financial agreement more typical when the seller is offering financing. Land contracts are sometimes criticized for being almost predatory: If a buyer skips a payment, the house and all the money he’s put toward it can be taken away.
And buyers don’t hold the deeds to the home, so the homes can be taken more quickly if they’re delinquent. Note School often steers students to scenarios where government programs like Hardest Hit can be tapped, but those programs don’t apply to land contracts.
Shortle walked his class through different strategies. The new note owner could foreclose; they could also induce the home buyer to walk. “It may be time to give this person a little cash for keys to move on,” he told the class. “They can’t afford it.”
Other data indicated that the house would rent for roughly $750. It might make sense, Shortle suggested, to remove the homeowner, fix up the house, rent it out, then sell the entire arrangement to a cash investor.
If a new note owner took that tack, the note would change hands four times in about as many years—even as the homeowner changed just once. The homeowner might never notice.
Some analysts see evidence of a still-hurting housing market behind all that activity.
By diffusing distressed loans out into a broader marketplace, lenders avoid the negative publicity that comes with foreclosing on delinquent homeowners. That masks “a layer of distress in the housing market that’s being overlooked,” said Daren Blomquist, vice president at RealtyTrac.
“This has been a way to push aside the crisis and sweep it under the rug,” Blomquist told MarketWatch.
Osterman, left, and Allen
Note investors say they can offer a service others can’t or won’t. “There’s a real issue with how we’re treating hardships,” said Osterman. “There’s a system out there that’s broken and needs to be disrupted in a good way.”
Note School’s founder says the goal is a ‘win-win’
While newer investors like Osterman and Allen have a sense of mission forged during the recent housing crisis, Speed has been in the note business for more than 30 years. He is adamant that it’s in Note School’s best interest to teach students to observe regulation and treat homeowners respectfully. There’s no reason it can’t be a “win-win,” he said.
‘”We’re not teaching people to go and do ‘Wild West investing.’
Colonial Funding doesn’t make buyers of its notes go through Note School, but it does require them to work with licensed mortgage servicers. Note School offers connections to armies of vendors offering services for every step of the process: people who will assess the property’s real market value, “door-knockers” who will hand-deliver letters to homeowners, title research companies, insurers, and more.
“We’ve been in the note buying business for 30 years,” said Speed. “We’re not teaching people to go and do ‘Wild West investing.’”
Speed believes buying distressed notes is a process tailor-made for people with an entrepreneurial approach to doing well by solving problems — and maintains that he is mindful of the postcrisis environment in which they work.
“I’m walking into where the disaster has already happened,” he said. “If I walk into a loan where the customer has vacated, they probably want out. Common sense tells us if the borrower can deed it over to the lender and walk away with dignity, that seems like a good deal for him. We’re trying to do everything we can to reach resolution.”
Parents walk their daughter to class on the first day of kindergarten at the Telesis Academy in West Covina on Aug. 17, 2015. (Los Angeles Times)
Some of America’s most racially integrated neighborhoods and cities are on a path to becoming segregated all over again. In Los Angeles this means neighborhoods where Latinos and Asians now live alongside black or white neighbors may have few to no whites or blacks in 10 to 20 years.
In research I conducted with Siri Warkentien, another sociologist, we used a statistical model and census data to identify the most common changes in racial composition in 10,681 neighborhoods in metropolitan L.A., Houston, Chicago and New York, beginning as far back as 1970 in some areas. That starting point corresponds with the implementation of the 1968 federal Fair Housing Act, which protects buyers and renters from discrimination in choosing where to live.
Covina, 22 miles east of downtown L.A., provides an example of one city at risk of re-segregating. Whites make up about 26% of Covina as of 2014 and Latinos about 57%. Typically we consider neighborhoods with at least 10% of each group to be racially integrated. But the mix is crumbling. Latinos made up 13% of Covina’s residents in 1980, 26% in 1990, 40% in 2000, and 52% in 2010. Four years later, according to the most recent census estimate, the Latino population had grown by five more percentage points. By 2025, Covina is likely to be overwhelmingly Latino.
Something similar happened already in nearby Norwalk. In 1990, just under half its residents were Latino and about a third were white (not unlike Covina now). By 2014, Latinos made up 70% of residents and whites 11%.
The data show that vast portions of south and east Los Angeles are slipping from mixed populations toward single race populations. And the change has not just occurred in formerly white areas. One of the trajectories that we identified followed a similar pattern in neighborhoods that were once black. Compton residents were nearly three-quarters black in 1980; by 1990, the mix was about 52% black and 43% Latino; in 2014, two-thirds Latino. Such slow but steadily increasing Latino growth can be found in 46% of the neighborhoods we studied in the Los Angeles metropolitan region.
What’s causing a shift from mixed to single-race populations?
Immigration is one obvious factor. The Latino population increased in Los Angeles after immigration laws were changed in 1965 to encourage family reunification. That population was bolstered by a steady increase in Mexican immigrants from the mid-1990s until the recession. Newly arrived Latinos, like all immigrant groups, tend to find housing in neighborhoods already pioneered by their countryman who are already here.
Our research found that this process is occurring again in Southern California, but this time among immigrants from Asia, the source of the largest number of U.S. newcomers now. For example, the Asian proportion of the population in Cerritos increased from 44% in 1990 to 58% in 2000 to 62% in 2014. It appears to be following a path toward Asian segregation much like Covina is on the path to Latino segregation.
White preferences are another major factor that helps explain re-segregation.
Our model showed that, broadly speaking, during the 1980s, whites stopped fleeing from neighborhoods that were becoming integrated. But then — more than any other racial group — when whites did move they chose new neighborhoods with same-race neighbors.
In other words, Latinos moving to an area would not cause most whites to move out. But the prospect of having Latino neighbors might be enough to prevent whites from moving into a neighborhood. (Whites are moving to one kind of integrated neighborhoods: those that are gentrifying like downtown Los Angeles. But many fewer neighborhoods are gentrifying than segregating.)
For a time, places like Covina and Norwalk will remain integrated. But as whites in these areas get older and die, the outcome is clear. Consider the age patterns: In Covina, 22% of whites are 65 or older; only 14% are under the age of 18. Among Latinos in Covina, 6% are 65 or older; 32% are younger than 18.
Segregation is not, however, inevitable. Our statistical model found that in 20% of L.A. neighborhoods we examined, whites, blacks, Latinos and Asians have been living together for 10 to 30 years, and no group’s population is changing much faster or slower than any other. In fact, among L.A., Houston, Chicago and New York, Los Angeles had the highest proportion of these “quadrivial” neighborhoods.
There are ways to encourage integration. The Department of Housing and Urban Development has taken a positive step in this direction by requiring all grant recipients to show how they would promote integration, although Congress is threatening to undo this rule. At a local level, investment in neighborhood infrastructure, especially schools, attracts diverse residents and promotes integration. There is also new research that shows whites are choosing same-race neighborhoods not solely because of prejudice or animus, but because they don’t know about more mixed areas. In a separate study of Chicago area residents, for instance, whites were 2 to 6 times less likely than Latinos to even know about majority Latino neighborhoods.
Because so much of the shift in integration is based on whites’ decisions about where they will move next, Los Angeles’ future demographic patterns are in their hands. If whites do their homework, and find out more about neighborhoods that are now unfamiliar to them, they can make L.A. an example to the nation of how to create integration in the 21st century. Otherwise, knowingly or not, they may reproduce the problems of racial segregation for the future.
Chicago area sees greatest population loss of any major U.S. city, region in 2015
Ten years ago, Bonita Hatchett built her dream home in Flossmoor. A lawyer by trade, she moved to the south Chicago suburb to join a diverse community that included black professionals like herself.
But Hatchett is now planning to leave it all behind. The culprit? Property taxes.
“You’re told all your life: Be educated, be successful, work hard and buy a house. But, we’re being abused for doing so,” Hatchett said. “Living in a town like Flossmoor, it’s just not worth it.”
She’s not alone.
Illinoisans pay among the highest property taxes in the nation, according to the nonpartisan Tax Foundation. Some Illinoisans’ property-tax bills are more than their mortgage payments. And the squeeze is getting worse.
Since 1990, the average property-tax bill in Illinois has grown more than three times faster than the state’s median household income, according to Illinois Policy Institute research.
While Hatchett estimates the value of her home has been slashed in half over the past decade, her property tax bill has only gone up. She paid more than $18,000 in property taxes last year — well over 5 percent of what she thinks her house is worth.
Hatchett plans to move to Indiana, where taxes on residential property are capped at 1 percent of the value.
Seventy miles from Hatchett’s home, in the northwest Chicago suburb of Crystal Lake, Cassandra Bajak thinks this coming Christmas will be her two children’s last in their home. Since she and her husband, an Army veteran, built the house in 2002, their property-tax bills have doubled — eclipsing their mortgage payments.
Her family now is choosing between a move to a southern state or downsizing in their community.
“We’re being taxed out of our home,” Mrs. Bajak said. “The only reason we would ever leave our home or this state is property taxes, and that’s what’s going to happen.”
In McHenry County, where the Bajaks reside, property taxes eat up nearly 8 percent of the median household income. What’s worse, Illinoisans aren’t getting much bang for their tax bucks.
Property taxes at the municipal level have not been going to fund spotless roads or other public works. Instead, they’re mostly funding out-of-control pension costs.
Just take a look at Springfield, where 98 percent of the city’s 2014 property tax levy went to pensions. And where, from 2000 to 2014, members of the typical household have seen their property-tax bill grow more than twice as fast as their income.
Despite that, city-worker retirements are still in jeopardy.
While taxpayers have more than doubled their contributions to the local police and firefighter pension systems over the past decade, Springfield’s police pension fund has a mere 53 cents in the bank for every dollar it needs to pay out future benefits; for firefighter pensions, only 45 cents.
Forcing homeowners to keep shoveling more property tax dollars into broken pension systems has become a morally bankrupt solution to the problem.
In Springfield, for example, residents already contribute four times more money into police, fire and municipal employee pensions than do the employees.
The problem is that, in Illinois, state politicians mandate pension benefits for local government workers, with little regard to fairness for local taxpayers.
Many communities would prefer not to pay the high cost of workers enjoying early retirement ages, health insurance benefits normal residents could never afford, and annual 3 percent cost-of-living adjustments that private-sector workers could only dream of.
So how can the state protect homeowners?
Forcing local governments to begin to live within their means through a property-tax freeze, as has been proposed by Gov. Bruce Rauner, is necessary. But solving the root cause of the property-tax problem will require further reform, such as moving all new government workers from defined-benefit to self-managed retirement plans, transferring the power to negotiate pension benefits down to local leaders, and encouraging aggressive consolidation and resource-sharing across units of local government. For some communities, the only option to undo decades of mismanagement will be bankruptcy.
Until sincere efforts are made at reform, Illinoisans will continue to live in fear: taxpayers of being squeezed out of their homes, and government workers of pension payments that may never come.
Chicago area sees greatest population loss of any major U.S. city, region in 2015
After years of financial woes, Lindsey Yates and her husband had to at last address the nagging question: Should they stay or should they go?
The young couple’s continued residency in Chicago was threatened by new obstacles every few months. First came the rising property taxes, then the stress of finding a decent school for their 2-year-old son in a neighborhood they could afford.
Three weeks ago, Yates and her family hit the road, leaving the South Loop and successful careers in the rearview mirror as they headed toward their new house in a Denver suburb.
“The thing that boggles my mind: How is it that a dentist and a business professional and their one young son” can’t make it work financially? Yates asked from the road, at a pit stop in Nebraska, where her in-laws are living. “If we can’t make it work, who can?” she asked.
By almost every metric, Illinois’ population is sharply declining, largely because residents are fleeing the state. The Tribune surveyed dozens of former residents who’ve left within the last five years, and each offered their own list of reasons for doing so. Common reasons include high taxes, the state budget stalemate, crime, the unemployment rate and the weather. Census data released Thursday suggest the root of the problem is in the Chicago metropolitan area, which in 2015 saw its first population decline since at least 1990.
Chicago’s metropolitan statistical area, defined by the U.S. Census Bureau, includes the city and suburbs and extends into Wisconsin and Indiana.
The Chicago area lost an estimated 6,263 residents in 2015 — the greatest loss of any metropolitan area in the country. That puts the region’s population at 9.5 million.
While the numbers fell overall, there were some bright spots in the Chicago area: Will, Kane, McHenry and Kendall counties saw growth spurts, according to census data.
A crumbling, dangerous South Side creates exodus of black Chicagoans
The Chicago region’s decline extended to the state. In fact, Illinois was one of just seven states to see a population dip in 2015, and had the second-greatest decline rate last year after West Virginia, census data show. While the state’s population dropped by 7,391 people in 2014, the number more than tripled in 2015, to 22,194.
The plunge is mainly a result of the large number of residents leaving the state last year — about 105,200 in all — which couldn’t be offset by new residents and births, according to census data. The last year Illinois saw its population plunge was 1988.
The potential fallout is both political and financial. Federal and state government dollars are often distributed to local government agencies based on population; so the population loss creates long-term budget concerns. Communities pouring millions into new roads and schools, for example, based on rosy projections of future growth are left with fewer taxpayers to cover the cost.
Sights set on sun
Illinois has a long-standing pattern of losing residents to other states, but the loss has generally been offset by births and migration from other countries. Residents are mostly flocking to Sun Belt states — those with the country’s warmest climates, such as Nevada, Arizona and Florida.
During the years after the economic recession of the mid-2000s, migration to those states slowed, but it’s heated up again as states in the South and West have sunnier job opportunities and affordable housing.
“The old Snow Belt-to-Sun Belt movement is picking back up again, and movement south and west is fueling up,” said William Frey, a demographer with the Brookings Institution who analyzes census data.
Richard Morton, an Illinois resident of 62 years, is building a house in Panama City Beach, Fla., and plans to move into it in March 2017.
“We’ll say ‘hasta la vista, Illinois.’ I say that rather humorously, but I’m really rather sad about it,” he said. “My mother was born in Illinois. My grandparents lived their entire lives in Downers Grove.”
The clear draw for Morton is Florida’s weather but also what he calls an “attractive economy.”
“I used to enjoy Illinois and the area,” he said. “But everyday there’s a reason to not want to stay here. Between (Gov. Bruce) Rauner and (House Speaker Michael) Madigan, how will the state ever fix its pension problem? To me it seems unfixable, and I don’t want to have to pay for it.”
Texas attracts the greatest number of Illinois residents, followed by Florida, Indiana, California and Arizona, according to 2013 IRS migration data. Weather isn’t the only reason people are leaving the state.
More Illinois residents move to other Midwestern states than the number of Midwesterners moving to Illinois, said Michael Lucci, vice president of policy at the right-leaning Illinois Policy Institute. Job and business creation are simply stronger in neighboring states, he said.
“We talk opportunity all the time. If you’re moving to California, you might be a tech worker, or you might be someone who likes sunshine,” he said. “But when you see Illinois losing people to every Midwestern state, you know it’s not weather. People are moving for economic reasons.”
Through the 1990s and 2000s, Illinois saw what demographers consider normal rates of exodus for the state, about 50,000 to 70,000 more residents moving away from the state than moving in. But in 2015, the number spiked to about 95,000, and in 2015 it reached more than 100,000 people, according to census data.
Several moving companies that examine industry trends found high numbers of Illinoisans moving out of state. Allied Van Lines this year ranked Illinois No. 2 on its list of states with greatest outbound moves with 1,240, said spokeswoman Violette Sieczka. The numbers are limited to the movement of entire households.
The loss of residents over the last 20 years translates to about $50 billion in lost taxable income, and about $8 billion each year in lost state and local tax revenues, Lucci said.
“Frankly, we have this state budget problem, and it would be a lot less of a problem if we had all these people,” he said. “Growth makes problems better, out-migration makes problems worse.”
Losing faith in city
The main factors in Chicago’s population dip are diminished immigration, the aging of the Mexican immigrant population that bolstered the city throughout the 1990s as well as an exodus of African-Americans, experts say.
More than any other city, Chicago has depended on Mexican immigrants to balance the sluggish growth of its native-born population, said Rob Paral, a Chicago-based demographer who advises nonprofits and community groups. During the 1990s, immigration accounted for most of Chicago’s population growth. The number of Mexican immigrants rose by 117,000 in Chicago that decade, according to data gathered by Paral’s firm, Rob Paral and Associates.
After 2007, falling Mexican-born populations became a trend across the country’s major metropolitan areas. But most of those cities were able to make up for the loss with the growth of their native populations, Paral said. Chicago couldn’t.
Some experts also attribute the decline to the city’s African-American population, in part because of historically black communities hit hard by the foreclosure crisis, making houses cheap and easy to buy for Hispanics and whites who were willing to move for a bargain.
The 2010 census reported a 17 percent drop in the city’s black population over the previous decade. That number declined another an additional 4 percent through 2014, to 852,756.
“White people have left the state for years,” Paral said. “But African-Americans? That’s the one-two punch.”
Chicago residents leaving the state have cited the Chicago Public Schools’ financial crisis and the city’s red light camera controversy as motivating factors. The greatest concern, however, seems to be safety. Despite being the nation’s third most populous city, Chicago outpaces New York City and Los Angeles in the number of homicides and shootings, though it fares better than some smaller cities on a per capita comparison.
Melissa Koski, who moved to Arizona in 2008, said she left after being the victim of two crimes. One involved a break-in at her University Village neighborhood apartment while she slept, and the second involved being robbed at gunpoint near Grand and Milwaukee avenues with her mother.
“He got a whopping $40, but I still remember his smell and can feel his sweaty body wrapped around mine, with what felt like a gun pressed to my back,” she said.
Pat and Anna van Slee, longtime residents of the Uptown neighborhood, spent Thursday morning packing their house, preparing for their move to Thousand Oaks, Calif.
Their last apartment was in a six-flat that saw a series of crimes in and around the building in recent years. In one instance, a neighbor was mugged outside the complex; in another, a homeless man seeking shelter in the complex’s basement crawled through the window of the van Slees’ downstairs neighbor, Anna van Slee said.
“We’ve always lived in developing neighborhoods, but when you have a baby it makes you look at things differently,” Anna van Slee said, referring to her son, 4-month-old Orion. While the couple is moving primarily because of job opportunities, they’re glad to not have to enroll Orion in a CPS school, either, they said.
“Oddly, this was a safer neighborhood when it was rougher. It didn’t have some of the tension there is now, when million-dollar condos are going up next to subsidized housing,” she said.
Stemming the tide
There are things that can be done in coming years to mitigate the further exodus of residents from the state, said Lucci, of the Illinois Policy Institute. He recommends refocusing on manufacturing jobs in the state and curbing property taxes.
“We’re never gonna have Colorado’s mountains or California’s beaches,” he said. “But we have historically had an attractive business and job market. The problem is that we don’t have that anymore.”
Indeed, the employment rate is an issue: Illinois this year is tied with West Virginia for the 46th worst employment rate of all states, at 6.3 percent, according to Bureau of Labor Statistics.
“People are leaving Illinois because we rank near the bottom in job growth in the Midwest and have among the highest property taxes in America,” Catherine Kelly, a spokeswoman for Rauner, wrote in an emailed statement. “We have to make structural changes in Illinois to ensure talented people — many of whom run businesses — stay in Illinois to help grow the economy and improve our state’s future.”
In response to the decline in the region’s census numbers, Mayor Rahm Emanuel’s office issued a statement, saying the mayor was “working hard to build the Chicago economy of tomorrow by investing in a diverse economy and highly educated workforce that will continue to bring jobs and people to Chicago.”
It’s important that communities engage in careful discussion about cutbacks, and begin planning for smaller populations and smaller economic growth, said Eric Zeemering, a professor at Northern Illinois University’s School of Public and Global Affairs. But those discussions tend to be difficult and unpopular, he said.
“When politicians are focused on their next elections, it’s hard to have conversations about cutbacks and the realistic budgetary future,” Zeemering said.
In the meantime, he expects local leaders will make efforts to promote and advertise their towns as great places to live. The goal is that these communities will keep their residents despite the state’s problems.
“At the end of the day, some people are happy to live in snowy weather,” Zeemering said. “We don’t want to be a state people view in a negative light.”
The pessimists are already talking about 3% inflation later this year if energy prices don’t retreat. Most likely, Federal Reserve monetary experimentation will inflict a new great inflation on the U.S., although this is much more likely to occur in the next business cycle rather than the current one. Before that, we’ll get the shock of an economic slowdown — or even recession — which will exert some pause. So many households are right to ask whether their main asset will insulate them from this shock whenever it occurs. The answer from economic science is no.
House prices perform best during the asset-price inflation phase of the monetary cycle. During that period, low or zero rates stimulate investors to search for yield, which many do, shedding their normal skepticism. The growth in irrationality across many marketplaces is why some economists describe set price inflation as a “disease.” Usually, the housing and commercial real estate markets become infected by this disease at some stage.
Real estate markets are certainly not shielded from irrational forces. “Speculative stories” about real estate flourish and quickly gain popularity — whether it’s the ever-growing housing shortage in metropolitan centers; illicit money pouring into the top end from all over the world and high prices rippling down to lower layers of the market; or bricks and mortar (and land), the ultimate safe haven when goods and services inflation ultimately accelerates.
That last story defies much economic experience to the contrary. By the time inflation shock emerges, home prices have already increased so much in real terms under asset-price inflation that they cannot keep up with goods and services inflation, and may even fall in nominal terms. One thinks of the tale of the gold price in the Paris black market during World War II: prices hit their peak just before the Germans entered the city in May 1940 and never returned.
Real estate is only a hedge against high inflation if it is bought early on in the preceding asset-price inflation period. We can generalize this lesson. The arrival of high inflation is an antidote to asset-price inflation. That is, if it has not already reached its late terminal stage when speculative temperatures are falling across an array of markets.
To understand how home prices in real terms behave under inflation shock we must realize how, in real terms, they are driven by expectations of future rents (actual, or as given to homeowners); the cost of capital; and the profit from carry trade. All of these drivers have been operating in the powerful asset-price inflation phase the U.S. and many foreign countries have been experiencing during recent years.
Together they have pushed up the S&P Case Shiller national home price index to almost 20% above its long-run trend (0.6% each year since 1998), having fallen slightly below at its trough in 2011, and having reached a peak 85% above in 2006.
The cost of equity is low, judging by high underlying price earnings ratios in the stock markets. Investors suffering from interest income famine are willing to put a higher price on future earnings, whether in the form of house rents or corporate profits, than they would do under monetary stability.
Leveraged owners of real estate can earn a handsome profit between rental income and interest paid, especially taking account of steady erosion of loan principal by inflation and tax deductions.
The arrival of high inflation would change all these calculations.
Cost of equity would rise as markets feared the denouement of recession, and reckoned with the new burden on economic prosperity. Long-term interest rates would climb starkly in nominal terms. Their equivalent in real terms would be highly volatile and unpredictable, albeit at first low in real terms (inflation-adjusted), meaning that carry trade income for leveraged owners would become elusive.
None of this is to suggest that a high inflation shock is likely in the second quarter. A sustained period of much stronger demand growth across an array of goods, services and labor markets would most likely have to occur first, and could be seen as early as the next cyclical upturn.
An economic miracle could bring a reprieve from inflation. But much more likely, the infernal inflation machine of expanding budget deficits and Fed experimentation will ultimately mow down any resistance in its way.
The next housing crisis is here and this time it is all about one thing: supply.
Following the mid-aughts housing bubble that saw homeowners across the country get themselves upside down in homes and mortgages they couldn’t ever afford to repay — a crisis that was as much about too much supply as it was about too much bad financing — the market has gone the complete other direction.
First-time home buyers are crowded out, with Trulia’s chief economist Ralph McLaughlin writing Monday that the number of starter homes on the market has declined 43.6% in the last four years.
Homeowners that want to move from a starter home to something better can’t afford the next step. McLaughlin notes that the number of “trade-up” homes on the market is also down about 40% over the same period.
And as investors look for places to earn whatever return on capital they can muster, the low-end of the housing market has almost ceased to exist as the investor class has bought up homes with the plan to flip them.
On Monday, the latest report on existing home sales showed the pace of sales fell 7.1% to an annualized rate of 5.08 million in February. Compared to last year, the pace of sales is still up 2.2% from a year ago.
Additionally, this report showed that sales to individual investors — or buyers who intend on flipping the home for a profit — accounted for 18% of existing homes sold in February, the highest share since April 2014. Almost two-thirds of these buyers paid cash.
Also in Monday’s report, commentary from Lawrence Yun, chief economist for the National Association of Realtors — which publishes the existing home sales report — showed the kind of crisis the housing market is facing.
“The lull in contract signings in January from the large East Coast blizzard, along with the slump in the stock market, may have played a role in February’s lack of closings,” Yun said Monday.
“However, the main issue continues to be a supply and affordability problem. Finding the right property at an affordable price is burdening many potential buyers.”
Yun added that, “The overall demand for buying is still solid entering the busy spring season, but home prices and rents outpacing wages and anxiety about the health of the economy are holding back a segment of would-be buyers.”
In our latest Most Important Charts collection, Scott Buchta, a fixed income strategist at Brean Capital, argued that existing and new home sales are often incorrectly conflated as joint indicators on the health of the housing market.
Existing home sales, even with Monday’s drop, are still roughly near pre-crisis levels. This argues that in a healthy housing market we’re looking at something like 5 million already-built homes being sold in a given year, more or less.
New home sales, on the other hand, have been a major laggard.
“In our view, the recovery in existing home sales has been led by rising home prices, which has brought additional supply into the market,” Buchta noted. This view which is consistent with the increase in investors buying existing homes as well as the high number of cash-only sales, which accounted for 25% of transactions in February.
“The lag in new home sales, on the other hand, is more reflective of the economy as a whole and has been adversely impacted by sluggish wage growth and tight credit windows.”
Buchta’s colleague at Brean Capital, Peter Tchir, also hammered on this idea of new home sales as reflecting economic trends that have persisted since the crisis — slow wage growth, rampant concern about the future, and an under built low-end housing market have all kept renters renting.
If we take the view that the jobs currently being created aren’t that great — which is another argument for another post — then what we’re going to see is a rising class of renters.
“These low paying jobs are not the type of job that are conducive to buying a home,” Tchir wrote.
“The first problem is saving for the down payment – a Herculean task in itself. The second problem, and the one that I think is addressed less frequently, is who really wants to commit to an area when the job isn’t that good and may not be stable?”
And if we consider that the economy is, as much as anything, a confidence game, the reality is that instability and imminent collapse have been the dominant psychological themes for both consumers and investors since the crisis.
So we can hit on the theme that the US economy is not heading for recession timeand time again, but there is a reason Donald Trump is leading in the Republican polls: people do not believe in this economy.
The upshot here is that with more folks renting and the labor market recovering faster than the housing market, we’re suddenly looking at a new class of well-employed, would-be home buyers relegated to renting… and paying ever-increasing rents.
Earlier this month we highlightedcommentary from New River Investments’ Conor Sen who said, among other things, that the housing market has simply been under built following the crisis and is ill-prepared to handle the coming wave of millennial households that will be formed over the next several decades.
Home prices may increase and as an investment — not a place to live — buying houses may still be attractive for some time to come.
But demand for housing is not going away and will only get stronger.
Housing prices in Crenshaw jumped way up, while Hancock Park’s tumbled way down
Redfin’s housing market report for February has been released, and, as per usual, a lot of activity took place east of Vermont. Neighborhoods like Echo Park, Eagle Rock, Glassell Park, Mount Washington, and East LA all saw double digit rises in median housing price.
Mount Washington’s median price for February was up 19.2 percent to $790,000, which is up significantly from the $699,000 median price Redfin cited in January when it predicted Mount Washington would be the hottest neighborhood of 2016. Their prediction may be coming true (self-fulfilling?). Sellers in Mount Washington are getting 6.5 percent above asking price and houses are staying on the market for an average of only 13 days.
The Valley also saw some action in February: Studio City, Sherman Oaks, Sun Valley, and Van Nuys all had double digit jumps in median housing prices. Studio City fared the best with a 26.9 percent increase, to $888,250, and a 22.9 percent increase in total sales.
Around town other neighborhoods experienced some major fluctuations. On the positive end, Crenshaw had a big February; median prices in that neighborhood shot up a whopping 66.8 percent, to $628,125. Total sales in Crenshaw were up 64.3 percent.
Redfin also reports a 25 percent increase in the median price of houses on the Westside of town—those are now selling for a median of $1.5 million.
Conversely, Hancock Park did not fare so well in the February report. Median prices for the neighborhood contracted 68.8 percent, to an even (and crazy low) $500,000. Sales were down 31.3 percent and sellers were getting 1.7 percent below asking price.
Los Angeles on the whole had a 14.6 percent increase in median price, up to $590,000. The city also saw a lot of new houses added to the market in February, with inventory moving up 10.5 percent. But total sales were down 2.5 percent for the month.
Judith and Cliff Allen have owned the modest Marcus Apartments in Portland’s Irvington neighborhood since 1979. They personally know their 10 tenants, many of whom have lived there long-term and pay rents that these days are below the market rate. The building is 50 years old, but the renters like having hands-on landlords, said the Allens, who live in Clackamas County.
The couple now wants to build another 12-unit structure on the parking lot in front of the building. The surprising thing, said Brian Emerick, former chair of Portland’s Historic Landmarks Commission, is that they didn’t just knock down the old building and put up something bigger and fancier — and a lot more expensive.
“Almost no developer would have saved the existing building,” Emerick said. “They would have just knocked it down” and maximized the lot’s value.
But the Allens don’t want to throw their longtime tenants out of their apartments. It was perhaps a rare decision by an increasingly rare breed — the mom-and-pop landlord.
“There are very few of us left,” Judith Allen said. “People who both own and manage. It’s very expensive and time-consuming.”
If local landlords are on the way out, it’s because they’re being replaced at a surprisingly fast clip by large institutional investors.
In 2015, the Portland area saw more than $1.7 billion in sales of large multifamily properties, more than double the previous record set in 2007, according to data collected by the commercial real estate firm Jones Lang LaSalle. Much of that money comes from pension funds, banks, unions, insurance companies or real estate investment trusts.
The result for Portland renters? It’s increasingly likely that whether you’re writing a check to a person or a pension, the money is traveling out of town. And investors’ unceasing quest for yield puts upward pressure on rents.
Judith Allen estimates the couple receives about six offers a month from suitors, many of them large investment companies, that want to buy the Irvington property and develop it into “something much bigger.” The couple originally bought the building after Cliff Allen published a teacher’s manual, his wife said, and came into some money. They chose to invest it in real estate.
The Allens’ children are now also in the real estate business, Judith Allen said. But with increased competition from institutional investors, it’s not as easy these days to get a piece of the action.
“It’s tougher now,” she said. “It’s a little more difficult.”
Trickling down the asset ladder
Portland didn’t used to be the kind of market where big, national pension funds came hunting for real estate. But low interest rates — which make it hard for funds to make money on traditional investments, and also make it cheap for them to borrow for additional acquisitions and developments — and the Portland area’s tight rental market have shifted the landscape.
Ralph Cole, global financials analyst with Portland-based Ferguson Wellman Capital Management, said insurance companies and other institutional investors “are in smaller-size deals today than they were 10 years ago.” That opens up opportunities in midsized markets like Portland’s.
In the past, Cole said, an insurance company could generate returns by simply buying corporate bonds and treasuries. Low rates, though, have left them “searching other places to put funds to work.”
“Apartments have been very popular because the fundamentals are so good,” Cole said. Between October 2009 and October 2015, 39 percent of sales of buildings with 79 or more units went to institutional investors, and the trend has accelerated in the past two years.
The recent sale of the 63-unit Lower Burnside Lofts on the east side for $18.5 million to Boston-based Berkshire Group suggests investors are willing to perhaps “compromise some of their standards” to “grab any good quality” in the desirable Portland market, said Brian Glanville, senior managing director at the Portland arm of real estate consultant Integra Realty Resources.
Burnside Lofts
Until recently, Glanville said, there was no way you’d get an investor interested in the price range below $20 million or $25 million. And only in the past two years has institutional money gone after buildings outside of the central city with fewer than 100 units, he added.
Robert Black, managing director at the real estate brokerage ARA Newmark, represented the Lower Burnside Lofts’ seller, Portland-based developer Urban Asset Advisors, in the deal announced last month.
“The institutional buyer’s understanding of the east side has really started to pick up, and their comfort level with the east side has started to pick up,” Black said.
It’s not just apartments
The ongoing real estate frenzy isn’t limited to apartment buildings. Portland’s office market saw more than $1 billion in transactions last year, according to Jones Lang LaSalle, with more than 77 percent of the money coming from institutional investors. Meanwhile, office rents rose by nearly 10 percent year-over-year and Portland’s office vacancy rate was third-lowest in the nation, according to a report released in October.
A real estate investment trust associated with Connecticut-based UBS Global Real Estate set a Portland record when it bought the U.S. Bancorp Tower, known as “Big Pink,” for $372.5 million. Prudential paid $155.3 million for the Block 300 building at 308 S.W. Second Ave.
The New Jersey-based insurance provider has seen “more opportunity” of late in “secondary cities” like Portland, said Theresa Miller, a Prudential spokeswoman who specializes in asset management.
“We’re looking for good, steady, kind of predictable, safe returns,” Miller said. The company typically is interested in holding onto buildings over a period of years, she added — “We don’t come in just to flip stuff over.”
And it’s not just Californians flocking over Oregon’s southern border — it’s their money, too. The buyer of the 2100 River Parkway office building, which sold for $35.4 million last year, was CalSTRS, the California teachers’ retirement system. (CalSTRS officials declined comment for this story.)
“There is not a very good return anywhere else,” said Brian Allen, owner of Portland-based Windermere Real Estate. “You know, the bond market, the stock market — a lot of the places where institutional money might park itself — it’s not that good right now. And people are seeing opportunities in real estate.”
Advantages and disadvantages
The influx of institutional money bucks Portland tradition, Brian Allen said — traditionally, landlords tended to be wealthy but local. A doctor, lawyer, or business person, for example.
There are still opportunities for those folks, though, said attorney David Nepom, who represents such buyers.
“I see young folks still wanting to get into real estate in one manner or another,” Nepom said. “And usually what they do is they start out with the single-family rentals and they move up into a four-plex or six-plex. Does it take more money now? Yeah.”
Nepom doesn’t believe the “American real estate dream is over,” he said.
“I think it takes work and effort,” Nepom said. “But I can think of a few clients off the top of my head who have been very successful at it over the years…Big money does not go after the single-family homes or the four-plex. They just don’t.”
Until now. A series of reports by the nonprofit Investigate West found that Wall Street was scooping up single-family rentals in Portland by the hundreds. And where did one of the investors — Blackstone, a multinational private equity firm — raise some of its capital? Oregon’s own Public Employees Retirement System, or PERS.
Tenants worried about rising rents could be forgiven for fearing the trend. But institutional investors aren’t “steamrolling” the local community, said Daisy Okas, a spokeswoman for the major retirement provider TIAA-CREF, which bought the Cordelia apartments in Northwest Portland last year for $47.8 million.
Cordelia Apartments
“We’re investing capital and shoring up the housing stock,” Okas said.
What’s more, institutional investors are probably more likely to properly maintain their buildings, according to Brian Allen. And they’re perhaps less prone to economic downturns or overreacting to the ever-fluctuating stock market.
“They do have really long horizons,” Brian Allen said. “And so I would speculate they’re very unlikely to be slumlords. They’re probably likely to put in a professional property management company.”
That’s the case for Martin Forde, 22, who began renting at the Lower Burnside Lofts with his girlfriend a month after it opened last summer. The recent Oregon State University graduate moved to Portland for a job at the PepsiCo distribution plant in Gresham, he said.
Not long after he moved in, he found out the building was sold — a development he found “really surprising,” he said. He hadn’t been aware until this month that the buyer was an institutional group in Boston.
But it doesn’t bother him. The location is ideal. When the lights went out, the property manager fixed it within 12 hours. And though the $1,465 monthly rent is expensive, he said, he can afford it.
Still, he wonders about what’ll happen when his new seven-month lease expires.
“They haven’t hiked rent,” Forde said of the new owners. “But we’ll see what happens when the next lease is up.”
A recent poll found that two-thirds of metropolitan Vancouver residents believe “foreigners investing” is a main cause of high housing costs, and 70 per cent said the government should work to improve affordability.
One month ago, when describing the latest in an endless series of Vancouver real estate horror stories, in this case an abandoned, rotting home (which is currently listed for a modest$7.2 million), we explained the simple money-laundering dynamic involving Chinese “investors” as follows.
Chinese investors smuggle out millions in embezzled cash, hot money or perfectly legal funds, bypassing the $50,000/year limit in legal capital outflows.
They make “all cash” purchases, usually sight unseen, using third parties intermediaries to preserve their anonymity, or directly in person, in cities like Vancouver, New York, London or San Francisco.
The house becomes a new “Swiss bank account”, providing the promise of an anonymous store of value and retaining the cash equivalent value of the original capital outflow.
We also explained that hundreds if not thousands of Vancouver houses, have become a part of the new normal Swiss bank account: “a store of wealth to Chinese investors eager to park “hot money” outside of their native country, and bidding up any Canadian real estate they could get their hands on.”
This realization has now fully filtered down to the local population, and as the National Post writes in its latest troubling look at the “dark side” of Vancouver’s real estate market, it cites wholesaler Amanda who says that “Vancouver seems to be evolving from a residential city into almost like a lock box for money… but I have to live among the empty houses. I’m a resident, not just an investor.”
The Post article, however, is not about the use of Vancouver (or NYC, or SF, or London) real estate as the end target of China’s hot money outflows – by now most are aware what’s going on. It focuses, instead, on those who make the wholesale selling of Vancouver real estate to Chinese tycoons who are bidding up real estate in this western Canadian city to a point where virtually no domestic buyer can afford it, and specifically the job that unlicensed “wholesalers” do in spurring and accelerating what is currently the world’s biggest housing bubble.
A bubble which, the wholesalers themselves admit, will inevitably crash in spectacular fashion.
Vancouver’s real estate market has been very good to Amanda. She’s not a licensed realtor, but buying and selling property is her full-time job.
She started about eight years ago as an unlicensed “wholesaler” in Vancouver.
She would approach homeowners and make unsolicited offers for private cash deals. Amanda made a 10-per-cent fee on each purchase by immediately assigning the contract to a background investor. It is seen as the lowest job in property investment, but it is low risk and very profitable. Amanda has done so well that she now owns two homes in Vancouver and develops property in the U.S.
Unlicensed wholesaling is an illicit and predatory business that is quickly growing in Metro Vancouver because enforcement is virtually non-existent.
It’s similar to a tactic currently being examined by B.C. real estate authorities known as “assignment flipping,” which involves legally but secretly trading homes on paper to enrich realtors and circles of investors.
However, unlicensed wholesaling is completely unregulated. Amanda estimates hundreds of wholesalers are scouring Metro Vancouver’s never-hotter speculative market — not including the realtors who are secretly wholesaling for themselves.
Amanda decided to step away from the easy money for moral reasons.
She’s most concerned that wholesalers are targeting B.C.’s vulnerable seniors who don’t understand the value of their old homes. She is also worried about offshore money being laundered, and the resulting vacant homes.
Because wholesalers are unlicensed, they have no obligation to identify their background investors or reveal the source of funds to Canadian authorities who fight money laundering.
“Vancouver seems to be evolving from a residential city into almost like a lock box for money,” Amanda said. “But I have to live among the empty houses. I’m a resident, not just an investor.”
Amanda said she believes that unethical and ignorant investors are driving B.C.’s housing market at full speed towards a crash. For these reasons, and with the condition that we not use her real name, she came forward to reveal how wholesalers operate.
The calling cards of wholesalers — hand-written flyers offering homeowners “confidential” and “discreet” cash sales — started flooding west side Vancouver homes over the past 18 months. With the dramatic surge in home prices, wholesalers now are spreading into neighborhoods across Metro Vancouver and Vancouver Island.
In eight years Amanda has never seen the market hotter than it is right now, and her colleagues are urging her to start wholesaling again.
Notices offering cash for homes are the calling card of unlicensed wholesalers
“A lot of money is leaving China, so now every second day people are asking if I can go out and find places for them. They have tons of money,” Amanda said. “They are basically brokering business deals specifically for Chinese investors.”
She said the mechanics of wholesaling schemes work like this:
The investor behind the unlicensed broker targets a block, often with older homes, and gives the wholesaler cash in a legal trust.
The wholesaler persuades a homeowner to sell, offering immediate cash, no subjects, no home inspections, and savings on realtor fees.
While the wholesaler claims to represent one buyer, or in some cases to be the buyer, Amanda said three or four contract flippers are often already lined up, with an end-buyer from China who will eventually take title in most cases. These unlicensed broker deals appear to be illegal.
A veteran Vancouver realtor confirmed these types of deals. The realtors we spoke to have been asked by their brokerages not to comment to reporters, so we agreed to withhold their names.
“I work with some non-licensed flippers,” one said. “They walk on to the lawn of an older house, see the owner and yell, ‘We’re not realtors!’ The owner invites them in, thinks they’re saving a commission — which they are — and loses big-time on the actual sale. I’ve seen it first-hand.”
According to flyers obtained from across Metro Vancouver and interviews with homeowners who were solicited, wholesalers often say they have Chinese buyers willing to pay a premium for quick sales.
Homeowners in Richmond, Vancouver’s east and west sides, Surrey, Langley, Coquitlam, Burnaby, White Rock, Delta and North Vancouver confirmed such offers in interviews.
One resident of Vancouver’s west side Dunbar area said she was annoyed by wholesalers constantly soliciting her, and a man in Surrey said his elderly mother was bothered by wholesalers.
“A guy walked up and he offered $700,000 cash within a day, and he said I would save on the realtor fees,” said Zack Flegel, who lives near 119th Street and Scott Road in Delta.
“He also says he will give me $100,000 cash and move me into a $600,000 house. He said he has a bunch of properties. He was talking about my house like it was a trading card. We don’t have abandoned homes yet like Vancouver, but this is how it happens, right?”
After the offer is accepted, the wholesaler assigns the purchase contract to the investor for a 10-per-cent markup, Amanda said. But some wholesalers aren’t content with making $100,000 or more per sale.
“People were going in and offering, for example, an 80-year-old widow, she bought the house for $70,000 and it is now worth $800,000 and they were offering her $200,000,” Amanda said. “So they are making $300,000 or $400,000 (after assigning the contract).
“And you are socializing with other wholesalers, and it is hard to hear them say, ‘Oh this whole street is filled with seniors whose partners are dropping off like flies.’ Or, ‘They just want to get rid of it, they have no clue what their house is worth, and it’s the whole street.’”
Amanda said her father died recently. She pictured her mother being targeted by wholesalers and resolved never to play that role again.
“There are elements of this that are elder abuse, absolutely.”
In a recent story that deals with implications of rising property taxes rather than predatory real estate practices, the Financial Post reported that, especially in Vancouver and Toronto’s scorching markets, “it’s not uncommon for some Canadian seniors to be unaware of the value of their location.”
B.C.’s Superintendent of Real Estate, Carolyn Rogers, conceded the potential for elder abuse as reported by Amanda.
“We would welcome an opportunity to speak to (Amanda) and assuming she gives us the same information, we would open a file,” Rogers said. “The conditions in the Vancouver market right now present risks … and seniors could be an example of that.”
It is illegal for wholesalers to privately buy and sell property for investors without a licence, Rogers said. She said her officers have approached some wholesalers recently and asked them to become licensed or cease their activities.
A review of the superintendent’s website shows no enforcement orders, fines or consumer alerts filed in connection to unlicensed wholesalers making cash deals and flipping contracts.
Amanda said that over the past year she learned of new levels of “layering and complexity that I didn’t see five years ago” in wholesaling and assignment-clause flipping.
“Five years ago I didn’t see realtors wholesaling, and I didn’t see people calling me so that I would get them a property and not assign the property to them, but work as a ‘partner’ and I would attach a 10-per-cent fee.
“And then they would assign it to their boss and attach 10 per cent, and then that person’s boss would attach 10 per cent. I’ve been watching over the last month, and it has got astounding.”
Amanda said some wholesale deals involve only unlicensed brokers and pools of offshore cash organized informally, and some appear to involve realtors and brokerages hiding behind unlicensed wholesalers.
“I’ve seen it from the back end. We have friends in the British Properties and the realtor said he will buy their property for $2 million. And then six months later it was sold for $3.5 million. When I’m looking at that, it is a pretty clear wholesale deal.”
Darren Gibb, spokesman for Canada’s anti-money-laundering agency, FINTRAC, confirmed that unlicensed property buyers have no obligation to report the identity or sources of funds of the buyers they represent.
However, Gibb said, if realtors are involved in “assignment flipping” it is mandatory that they and unlicensed assistants make efforts to identify every assignment-clause buyer and their sources of funds.
Vancouver realtors confirmed that money laundering is a big concern in assignment-flipping deals, whether organized by an unlicensed wholesaler or a realtor.
“When you are a non-realtor broker you no longer have to play by any rules,” one Vancouver realtor said.
“There is a role for assignments, but nobody is asking where the money came from. We are creating vehicles for money laundering.”
“No person in their right mind wants to buy your house once, and sell it three more times in a small window of opportunity, unless they have a whole pool of people lined up trying to get their money out of the country. The higher the prices go, these vehicles to get money out of the country get bigger and bigger.”
NDP MLA David Eby and Green MLA Andrew Weaver commented that allegations of unlicensed brokers targeting seniors and participating in potential money-laundering schemes call for direct action from Victoria and independent investigation, because these concerns fall outside the jurisdiction of the B.C. Real Estate Council and its current ongoing review of real estate practices.
“It is very troubling to me,” Eby said, “that not only do we have a layer of real estate agents that are acting improperly and violating the rules, but there might be this additional layer who are not bound by any rule and have explicitly avoided becoming agents for that reason.
“This unscrupulous behavior is targeting seniors who need money for retirement. What kind of society is that?” Weaver said.
Fewer homes bought, more refinances, and older mortgages lead to principal balance declines
Shadows from the financial crisis and Great Recession still linger in Americans’ personal finances, researchers at the New York Fed found.
Mortgage debt outstanding nearly doubled in the period from 2000 and 2006, but has risen only about 1% since 2012, according to data compiled in the regional bank’s quarterly report on household debt and crisis.
Put another way, in 2008 just as the subprime crisis was coming to a head, Americans had $12.68 trillion in debt outstanding, of which housing debt made up $10 trillion, or 79% of the total. In the fourth quarter of 2015, there was $12.12 trillion in total debt, and housing’s share had dwindled to 72%, or $8.74 trillion.
One of the biggest contributors to the decline in mortgage debt is that Americans aren’t taking equity out of their homes at nearly the same rate as in the prior decade. Cash-out refinances and home equity lines of credit rose at a rate of more than $300 billion every year from 2003-2007. In 2015, such debt grew only by $30 billion.
“In fact,” the researchers note on their blog, “the small amount of cash-out refi going on is almost completely offset by people repaying second mortgages and HELOCs.”
But it’s not just a newfound frugality that’s keeping a lid on mortgage debt. The pace of home buying has slowed even as Americans are paying down their home loans.
The total amount paid against mortgage debt in 2015 was $288 billion, or 3.5% of the total outstanding. The last time the total amount of mortgage debt outstanding was $8.25 trillion was 2006, the height of the boom, the researchers noted. That year, consumers paid down only $170 billion, or 2.1% of the balance.
In recent years, much of the pay down has come thanks to lower interest rates. New mortgages are being lent with lower rates, and existing homeowners have been refinancing. The researchers also note that as credit standards have remained tight, most new mortgages are going to people with excellent credit, enabling them to pay lower rates.
Those factors have taken the weighed average interest rate on the outstanding mortgage debt balance from 7.65% in 2000 to 3.85% in 2015.
There’s another factor contributing to the higher pace of pay downs. The existing inventory of mortgage debt outstanding has aged significantly over the past decade as the pace of buying and selling slowed. That means mortgage payments are further along in their amortization process and principal, rather than interest, is being paid down.
Since 2008, the researchers note, aggregate mortgage payments have fallen 8% but principal payments have risen 41%.
The shrinking mortgage debt is a good thing, the New York Fed researchers conclude. Principal pay-down is a form of saving for borrowers, so in the face of rising home prices this means strengthening balance sheets for mortgagors. This is important, of course, as we learned in 2008 just how crucial household debts can be.
But some analysts worry that Americans’ equity is too concentrated in real estate assets. Another lesson from the 2008 crisis is that it can be very dangerous when the price of those assets plummets.
It is audacious that President Obama’s fiscal 2017 budget proposal released Tuesday counts income from Fannie Mae and Freddie Mac as just another revenue stream – not only for the coming year but for the next ten years.
The Administration has long shown it has a hearty appetite for the mortgage giants’ revenues. The two companies have already sent a combined $241.3 billion to the government since being placed in conservatorship 2008 – over $50 billion more than the $187.5 billion in taxpayer funds they received at that time. Should the “temporary” conservatorship and Third Amendment Sweep remain in force for at least another ten years the White House estimates the GSEs will send another $151.5 billion to the U.S. Treasury. That could mean these privately-owned mortgage giants will have sent nearly an astounding $400 billion to Treasury while needed reforms were put on hold.
The revenue projections in the budget proposal justify assumptions about why the Administration has had much less of an appetite for recommending ways to reform and recapitalize Fannie and Freddie and ensure they could provide liquidity and stability in the mortgage market for years to come. Why sell a cash cow? The Administration effectively yielded its statutory authority – and obligation – to end the conservatorship with the enactment of a massive spending bill late last year that included provisions of the so-called “Jumpstart GSE Reform.” Despite the bill’s name, it put Congress in the driver’s seat and all but guaranteed no additional action will be taken to end the conservatorship this year or perhaps not until well in 2017.
The proposed fiscal 2017 budget, like all blueprints before it, makes no room for the inevitable recession and market correction. Should a downturn occur in the next year or so, taxpayers will be obligated to provide additional bailout funding because Fannie Mae and Freddie Mac have been prohibited from building up adequate capital levels.
In a nod to the persistent problem of access to affordable housing, the budget proposal estimates Fannie and Freddie will provide another $136 million to the Affordable Housing Trust Fund in 2017. This money is provided to states to finance affordable housing options for the poor. The Administration reports this would be added to the $170 million set to be distributed this year. But here’s the catch: those funds derive from a small fee on loans Fannie Mae and Freddie Mac help finance but only as so long as they don’t require another infusion of public money.
In essence, President Obama’s final budget proposal counts money to which it was never entitled; it flaunts a disregard for the Housing and Economic Recovery Act’s requirement that Fannie Mae and Freddie Mac be made sound and solvent; and it takes a cavalier stance to the fact that under capitalized GSEs could have negative consequences for taxpayers and working Americans striving for home ownership. After eight years, the Administration’s parting message is that needed reforms in housing finance policy will simply have to wait for another president and another Congress. There is not urgency of now, just the audacity of nope.
The rise in rents and home prices is adding additional pressure to the bottom line of most California families. Home prices have been rising steadily for a few years largely driven by low inventory, little construction thanks to NIMBYism, and foreign money flowing into certain markets. But even areas that don’t have foreign demand are seeing prices jump all the while household incomes are stagnant. Yet that growth has hit a wall in 2016, largely because of financial turmoil. We’ve seen a big jump in the financial markets from 2009. Those big investor bets on real estate are paying off as rents continue to move up. For a place like California where net home ownership has fallen in the last decade, a growing list of new renter households is a good thing so long as you own a rental.
The problem of course is that household incomes are not moving up and more money is being siphoned off into an unproductive asset class, a house. Let us look at the changing dynamics in California households.
More renters
Many people would like to buy but simply cannot because their wages do not justify current prices for glorious crap shacks. In San Francisco even high paid tech workers can’t afford to pay $1.2 millionfor your typical Barbie house in a rundown neighborhood. So with little inventory investors and foreign money shift the price momentum. With the stock market moving up nonstop from 2009 there was plenty of wealth injected back into real estate. The last few months are showing cracks in that foundation.
It is still easy to get a mortgage if you have the income to back it up. You now see the resurrection of no money down mortgages. In the end however the number of renter households is up in a big way in California and home ownership is down:
Source: Census
So what we see is that since 2007 we’ve added more than 680,000 renter households but have lost 161,000 owner occupied households. At the same time the population is increasing. When it comes to raw numbers, people are opting to rent for whatever reason. Also, just because the population increases doesn’t mean people are adding new renter households. You have 2.3 million grown adults living at home with mom and dad enjoying Taco Tuesdays in their old room filled with Nirvana and Dr. Dre posters.
And yes, with little construction and unable to buy, many are renting and rents have jumped up in a big way in 2015:
This has slowed down dramatically in 2016. It is hard to envision this pace going on if a reversal in the economy hits (which it always does as the business cycle does its usual thing).
Home ownership rate in a steep decline
In the LA/OC area home prices are up 37 percent in the last three years:
Of course there are no accompanying income gains. If you look at the stock market, the unemployment rate, and real estate values you would expect the public to be happy this 2016 election year. To the contrary, outlier momentum is massive because people realize the system is rigged and are trying to fight back. Watch the Big Short for a trip down memory lane and you’ll realize nothing has really changed since then. The house humping pundits think they found some new secret here. It is timing like buying Apple or Amazon stock at the right time. What I’ve seen is that many that bought no longer can afford their property in a matter of 3 years! Some shop at the dollar store while the new buyers are either foreign money or dual income DINKs (which will take a big hit to their income once those kids start popping out). $2,000 a month per kid daycare in the Bay Area is common.
If this was such a simple decision then the home ownership rate would be soaring. Yet the home ownership rate is doing this:
In the end a $700,000 crap shack is still a crap shack. That $1.2 million piece of junk in San Francisco is still junk. And you better make sure you can carry that housing nut for 30 years. For tech workers, mobility is key so renting serves more as an option on housing versus renting the place from the bank for 30 years. Make no mistake, in most of the US buying a home makes total sense. In California, the massive drop in the home ownership rate shows a different story. And that story is the middle class is disappearing.
No one has called long-duration treasury yields better than Lacy Hunt at Hoisington Management. He says they are going lower. If the US is in or headed for recession then I believe he is correct.
“Debt only works if it generates an income to repay principle and interest.”
Research indicates that when public and private debt rises above 250% of GDP it has very serious effects on economic growth. There is no bit of evidence that indicates an indebtedness problem can be solved by taking on further debt.
One of the objectives of QE was to boost the stock market, on theory that an improved stock market will increase wealth and ultimately consumer spending. The other mechanism was that somehow by buying Government securities the Fed was in a position to cause the stock market to rise. But when the Fed buys government securities the process ends there. They can buy government securities and cause the banks to surrender one type of government asset for another government asset. There was no mechanism to explain why QE should boost the stock market, yet we saw that it did. The Fed gave a signal to decision makers that they were going to protect financial assets, in other words they incentivized decision makers to view financial assets as more valuable than real assets. So effectively these decision makers transferred funds that would have gone into the real economy into the financial economy, as a result the rate of growth was considerably smaller than expected.
“In essence the way in which it worked was by signaling that real assets were inferior to financial assets. The Fed, by going into an untested program of QE effectively ended up making things worse off.”
Flattening of the Yield Curve
“Monetary policies currently are asymmetric. If the Fed tried to do another round of QE and/or negative interest rates, the evidence is overwhelming that will not make things better. However if the Fed wishes to constrain economic activity, to tighten monetary conditions as they did in December; those mechanisms are still in place.”
They are more effective because the domestic and global economy is more heavily indebted than normal. The fact we are carrying abnormally high debt levels is the reason why small increases in interest rate channels through the economy more quickly.
If the Fed wishes to tighten which they did in December then sticking to the old traditional and tested methods is best. They contracted the monetary base which ultimately puts downward pressure on money and credit growth. As the Fed was telegraphing that they were going to raise the federal funds rate it had the effect of raising the intermediate yield but not the long term yields which caused the yield curve to flatten. It is a signal from the market place that the market believes the outlook is lower growth and lower inflation. When the Fed tightens it has a quick impact and when the Fed eases it has a negative impact.
The critical factor for the long bond is the inflationary environment. Last year was a disappointing year for the economy, moreover the economy ended on a very low note. There are outward manifestations of the weakening in economy activity. One impartial measure is what happened to commodity prices, which are of course influenced by supply and demand factors. But when there are broad declines in all the major indices it is an indication of a lack of demand. The Fed tightened monetary conditions into a weakening domestic global economy, in other words they hit it when it was already receding, which tends to further weaken the almost non-existent inflationary forces and for an investor increases the value.
Failure of Quantitative Easing
“If you do not have pricing power, it is an indication of rough times which is exactly what we have.”
The fact that the Fed made an ill-conceived move in December should not be surprising to economists. A detailed study was done of the Fed’s 4 yearly forecasts which they have been making since 2007. They have missed every single year.
That was another in a series of excellent interviews by Gordon Long. There’s much more in the interview. Give it a play.
Finally, lest anyone scream to high heavens, Lacy is obviously referring to price inflation, not monetary inflation which has been rampent.
From my standpoint, consumer price deflation may be again at hand. Asset deflation in equities, and junk bonds is a near given.
The Fed did not save the world as Ben Bernanke proclaimed. Instead, the Fed fostered a series of asset bubble boom-bust cycles with increasing amplitude over time.
The bottom is a long, long ways down in terms of time, or price, or both.
The six-bedroom mansion in the shadow of Southern California’s Sierra Madre Mountains has lime trees and a swimming pool, tennis courts and a sauna — the kind of place that would have sold quickly just a year ago, according to real estate agent Kanney Zhang.
Not now.
Zhang is shopping it for a discounted $3.68 million, but nobody’s biting. Her clients, a couple from China, are getting anxious. They’re the kind of well-heeled international investors who fueled a four-year luxury real estate boom that helped pull America out of its worst housing slump since the 1930s. Now the couple is reeling from the selloff in the Chinese stock market and looking to raise cash to shore up finances.
In the Los Angeles suburb of Arcadia, where Zhang is struggling to sell the six-bedroom home, dozens of aging ranch houses were demolished to make way for 38 mansions built with Chinese buyers in mind. They have manicured lawns and wok kitchens and are priced as high as $12 million. Many of them sit empty because the prices are out of the range of most domestic buyers, said Re/Max broker Rudy Kusuma, who blames a crackdown by the Chinese on large sums leaving the country.
Well, I have some more bad news for mansion-flipping Chinese nationals.
Europe’s biggest lender HSBC will no longer provide mortgages to some Chinese nationals who buy real estate in the United States, a policy change that comes as Beijing is battling to stem a swelling crowd of citizens trying to get money out of China.
An HSBC spokesman in New York told Reuters on Wednesday that the new policy went into effect last week, roughly a month after China suspended Standard Chartered and DBS Group Holdings Ltd from conducting some foreign exchange business and as authorities try to limit capital outflows.
Realtors of luxury property in cities like New York, Los Angeles, and Vancouver, said more than 80 percent of wealthy Chinese buyers have ties to China.
Luxury homes news website Mansion Global, which first reported the HSBC policy change, said it would affect Chinese nationals holding temporary visitor ‘B’ visas if the majority of their income and assets are maintained in China.
Meanwhile…
HSBC’s pivot away from lending to some Chinese nationals abroad comes as other international banks clamor to lend more to wealthy Chinese.
The Royal Bank of Canada scrapped its C$1.25 million cap on mortgages to borrowers with no local credit history last year in a bid to tap into surging demand for financing from wealthy immigrant buyers.
Distressed homeowners who, with their lender’s approval, arrange a short sale of their property — for less than they owe — can’t be sued for the balance of their debt, the state Supreme Court ruled Thursday.
The unanimous decision protects borrowers who increasingly resorted to short sales as property values fell at the end of the last decade. The Legislature amended state law in 2012 to provide them explicit protection against deficiency judgments, but a lawyer for the borrower in Thursday’s case said that about 200,000 Californians had conducted short sales in the previous five years and were potentially affected by the ruling.
“The little guy won today,” said the attorney, Andrew Stilwell.
His client, Carol Coker, borrowed $452,000 in 2004 to buy a condominium in San Diego County. She fell behind on her payments, and in March 2010 JPMorgan Chase Bank, which then held the loan, sent her a default notice and began foreclosure proceedings.
The bank then agreed to allow Coker to sell the condo to another buyer for $400,000, collect the proceedings and release its lien on the property. But after the sale, the bank billed her for the $116,000 balance due on her loan.
The state law at the time, originally enacted in 1933 and amended in 1989, prohibited a bank from seeking a deficiency judgment, for the balance due on its loan, after the bank itself foreclosed on a home. But the law did not address short sales, which were rare until the late 2000s, and JPMorgan Chase argued that the anti-deficiency rule did not apply to those cases.
But the court said the rationale of the law applied equally to short sales.
“For more than half a century, this court has understood the statute to limit a lender’s recovery on a standard purchase-money loan to the value of the security,” Justice Goodwin Liu said in the 7-0 decision.
Liu said the law was intended to maintain economic stability and protect property buyers from severe losses during periods of economic decline.
Coker’s short sale of the condo — which she bought as a residence, rather than an investment — “did not change the standard purchase-money character of her loan,” Liu said. He said the short sale, “like a foreclosure sale, allowed Chase to realize and exhaust its security” in the property.
Stilwell said the ruling would also affect cases in federal Bankruptcy Courts in California, which rely on state laws affecting creditors and debtors.
“The Supreme Court shut the door on banks trying to go too far to take advantage of the poor, the middle class, people who couldn’t afford what they got into in this real estate debacle,” he said.
The bank’s lawyers referred inquiries to bank headquarters in New York, which could not be reached for comment late Thursday.
Movie sequels are rarely as good as the original films on which they’re based. The same dictum, it appears, holds for finance.
The 2008 housing market collapse was bad enough, but it appears now that we’re on the verge of experiencing it all again. And the financial sequel, working from a similar script as its original version, could prove to be just as devastating to the American taxpayer.
The Federal National Mortgage Association (commonly referred to as Fannie Mae) plans a mortgage loan reboot, which could produce the same insane and predictable results as when the mortgage agency loaned so much money to people who had neither the income, nor credit history, to qualify for a traditional loan.
The Obama administration proposes the HomeReady program, a new mortgage program largely targeting high-risk immigrants, which, writes Investors.com, “for the first time lets lenders qualify borrowers by counting income from non-borrowers living in the household. What could go wrong?”
The question should answer itself.
The administration apparently believes that by changing the dirty words “subprime” to “alternative” mortgages, the process will be more palatable to the public. But, as Investor’s notes, instead of the name HomeReady, which will offer the mortgages, “It might as well be called DefaultReady, because it is just as risky as the subprime junk Fannie was peddling on the eve of the crisis.”
Before the 2008 housing bubble burst, one’s mortgage fitness was supposed to be based on the income of the borrower, the person whose name would be on the deed and who was responsible for making timely monthly payments. Under this new scheme — and scheme is what it is — the combined income of everyone living in the house will be considered for a conventional home loan backed by Fannie. One may even claim income from people not living in the home, such as the borrower’s parents.
If, or as recent history proves, when the approved borrower defaults, who will pay? Taxpayers, of course, not the politicians and certainly not those associated with Fannie Mae and Freddie Mac, whose leaders made out like the bandits they were during the last mortgage go-round. As CNN Money reported in 2011, “Mortgage finance giants Fannie Mae and Freddie Mac received the biggest federal bailout of the financial crisis. And nearly $100 million of those tax dollars went to lucrative pay packages for top executives, filings show.”
In case further reminders are needed of the outrageous behavior of financial institutions that contributed to the housing market collapse and a recession whose pain is still being felt by many, Goldman Sachs has agreed to a civil settlement of up to $5 billion for its role associated with the marketing and selling of faulty mortgage securities to investors.
Go see the film “The Big Short” to be reminded of the cynicism of many in the financial industry. It follows on the heels of the HBO film “Too Big to Fail,” which revealed how politicians and banks were part of the scam that harmed just about everyone but themselves. According to The New York Times, only one top banker, Kareem Serageldin, went to prison for concealing hundreds of millions in losses in Credit Suisse’s mortgage-backed securities portfolio. Many more should have joined him.
Under the latest mortgage proposal, it’s no credit, no problem. An immigrant can qualify with a credit score as low as 620. That’s subprime. And the borrower has only to put 3 percent down.
Investor’s reports, “Fannie says that 1 in 4 Hispanic households share dwellings — and finances — with extended families. It says this is a large ‘under served’ market.”
Is this another cynical attempt by Democrats, along with protecting illegal immigrants, to win Hispanic votes without regard to the potential cost to taxpayers? Wasn’t that the problem during the last housing market collapse? Could it happen again? Sure it could. Do politicians care? It doesn’t appear so.
Collapse in crude oil prices is a huge blow to areas where oil extraction and associated industries are the bread and butter of the economy.
As petro-economies suffer from the bust in crude prices, the effects are showing up in the housing market.
Take North Dakota, for example, which was on the front lines of the oil boom between 2011 and 2014. In fact, North Dakota is probably the most vulnerable to a downturn in housing because of low oil prices. The economy is smaller and thus more dependent on the oil boom than other places, such as Texas. The state saw an influx of new workers over the past few years, looking for work in in the prolific Bakken Shale. A housing shortage quickly emerged, pushing up prices. With the inability to house all of the new people, rent spiked, as did hotel rates. The overflow led to a proliferation of “man camps.”
Now the boom has reversed. The state’s rig count is down to 53 as of January 13, about one-third of the level from one year ago. Drilling is quickly drying up and production is falling. “The jobs are leaving, and if an area gets depopulated, they can’t take the houses with them and that’s dangerous for the housing market,” Ralph DeFranco, senior director of risk analytics and pricing at Arch Mortgage Insurance Company, told CNN Money.
New home sales were down by 6.3 percent in North Dakota between January and October of 2015 compared to a year earlier. Housing prices have not crashed yet, but there tends to be a bit of a lag with housing prices. JP Ackerman of House Canary says that it typically takes 15 to 24 months before house prices start to show the negative effects of an oil downturn.
According to Arch Mortgage, homes in North Dakota are probably 20 percent overvalued at this point. They also estimate that the state has a 46 percent chance that house prices will decline over the next two years. But that is probably understating the risk since oil prices are not expected to rebound through most of 2016. Moreover, with some permanent damage to the balance sheets of U.S. shale companies, drilling won’t spring back to life immediately upon a rebound in oil prices.
There are some other states that are also at risk of a hit to their housing markets, including Wyoming, West Virginia and Alaska. Out of those three, only Alaska is a significant oil producer, but it is in the midst of a budget crisis because of the twin threats of falling production and rock bottom prices. Alaska’s oil fields are mature, and have been in decline for years. With a massive hole blown through the state’s budget, the Governor has floated the idea of instituting an income tax, a once unthinkable idea.
The downturn in Wyoming and West Virginia has more to do with the collapse in natural gas prices, which continues to hollow out their coal industries. Coal prices have plummeted in recent years, and coal production is now at its lowest level since the Reagan administration. Shale gas production, particularly in West Virginia, partially offsets the decline, but won’t be enough to come to the state’s rescue.
Texas is another place to keep an eye on. However, Arch Mortgage says the economy there is much larger and more diversified than other states, and also better equipped to handle the downturn than it was back in the 1980s during the last oil bust.
But Texas won’t escape unscathed. The Dallas Fed says job growth will turn negative in a few months if oil prices don’t move back to $40 or $50 per barrel. Texas is expected to see an additional 161,200 jobs this year if oil prices move back up into that range. But while that could be the best-case scenario, it would still only amount to one-third of the jobs created in 2014. “The biggest risk to the forecast is if oil prices are in the range of $20 to $30 for much of the year,” Keith Phillips, Dallas Fed Senior Economist, said in a written statement. “Then I expect job growth to slip into negative territory as Houston gets hit much harder and greater problems emerge in the financial sector.”
After 41 consecutive months of increases in house prices in Houston, prices started to decline in third quarter of 2015. In Odessa, TX, near the Permian Basin, home sales declined by 10.6 percent between January and October 2015 compared to a year earlier.
Most Americans will still welcome low prices at the pump. But in the oil boom towns of yesterday, the slowdown is very much being felt.
Some of the richest people in the US, including billionaires Warren Buffett and Sam Zell, have made millions from trailer parks at the expense of the country’s poorest people. Seeing their success, ordinary people from across the country are now trying to follow in their footsteps and become trailer park millionaires.
Rising interest rates are a negative for real estate.
Gold and oil are still dropping.
Company earnings are not beating expectations.
So, where do we begin?
The economy has been firing on all eight cylinders for several years now. So long, in fact, that many do not or cannot accept the fact that all good things must come to an end. Since the 2008 recession, the only negative that has remained constant is the continuing dilemma of the “underemployed”.
Let me digress for a while and delve into the real issues I see as storm clouds on the horizon. Below are the top five storms I see brewing:
Real estate
Subprime auto loans
Falling commodity prices
Stalling equity markets and corporate earnings
Unpaid student loan debt
1. Real Estate
Just this past week there was an article detailing data from the National Association of Realtors (NAR), disclosing that existing home sales dropped 10.5% on an annual basis to 3.76 million units. This was the sharpest decline in over five years. The blame for the drop was tied to new required regulations for home buyers. What is perplexing about this excuse is NAR economist Lawrence Yun’s comments. The article cited Yun as saying that:
“most of November’s decline was likely due to regulations that came into effect in October aimed at simplifying paperwork for home purchasing. Yun said it appeared lenders and closing companies were being cautious about using the new mandated paperwork.”
Here is what I do not understand. How can simplifying paperwork make lenders “more cautious about using… the new mandated paperwork”?
Also noted was the fact that median home prices increased 6.3% in November to $220,300. This comes as interest rates are on the cusp of finally rising, thus putting pressure (albeit minor) on monthly mortgage rate payments. This has the very real possibility of pricing out investors whose eligibility for financing was borderline to begin with.
2. Subprime auto loans
Casey Research has a terrific article that sums up the problems in the subprime auto market. I strongly suggest that you read the article. Just a few of the highlights of the article are the following points:
The value of U.S. car loans now tops $1 trillion for the first time ever. This means the car loan market is 47% larger than all U.S. credit card debt combined.
According to the Federal Reserve Bank of New York, lenders have approved 96.7% of car loan applicants this year. In 2013, they only approved 89.7% of loan applicants.
It’s also never been cheaper to borrow. In 2007, the average rate for an auto loan was 7.8%. Today, it’s only 4.1%.
For combined Q2 2015 and Q3 2015, 64% of all new auto loans were classified as subprime.
The average loan term for a new car loan is 67 months. For a used car, the average loan term is 62 months. Both are records.
The only logical conclusion that can be derived is that the finances of the average American are still so weak that they will do anything/everything to get a car. Regardless of the rate, or risks associated with it.
3. Falling commodity prices
Remember $100 crude oil prices? Or $1,700 gold prices? Or $100 ton iron ore prices? They are all distant faded memories. Currently, oil is $36 a barrel, gold is $1,070 an ounce, and iron ore is $42 a ton. Commodity stocks from Cliffs Natural Resources (NYSE:CLF) to Peabody Energy (NYSE:BTU) (both of which I have written articles about) are struggling to pay off debt and keep their operations running due to the declines in commodity prices. Just this past week, Cliffs announced that it sold its coal operations to streamline its business and strengthen its balance sheet while waiting for the iron ore business to stabilize and or strengthen. Similarly, oil producers and metals mining/exploration companies are either going out of business or curtailing their operations at an ever increasing pace.
For 2016, Citi’s predictions commodity by commodity can be found here. Its outlook calls for 30% plus returns from natural gas and oil. Where are these predictions coming from? The backdrop of huge 2015 losses obviously produced a low base from which to begin 2016, but the overwhelming consensus is for oil and natural gas to be stable during 2016. This is clearly a case of Citi sticking its neck out with a prediction that will garnish plenty of attention. Give it credit for not sticking with the herd mentality on this one.
4. Stalling equity markets and corporate earnings
Historically, the equities markets have produced stellar returns. According to an article from geeksonfinace.com, the average return in equities markets from 1926 to 2010 was 9.8%. For 2015, the markets are struggling to erase negative returns. Interestingly, the Barron’s round table consensus group predicted a nearly 10% rise in equity prices in 2015 (which obviously did not materialize) and also repeated that bullish prediction for 2016 by anticipating an 8% return in the S&P. So what happened in 2015? Corporate earnings were not as robust as expected. Commodity prices put pressure on margins of commodity producing companies. Furthermore, there are headwinds from external market forces that are also weighing on the equities markets. As referenced by this article which appeared on Business Insider, equities markets are on the precipice of doing something they have not done since 1939: see negative returns during a pre-election year. Per the article, on average, the DJIA gains 10.4% during pre-election years. With less than one week to go in 2015, the DJIA is currently negative by 1.5%
5. Unpaid student loan debt
Once again, we have stumbled upon an excellent Bloomberg article discussing unpaid student loan debt. The main takeaway from the article is the fact that “about 3 million parents have $71 billion in loans, contributing to more than $1.2 trillion in federal education debt. As of May 2014, half of the balance was in deferment, racking up interest at annual rates as high as 7.9 percent.” The rate was as low as 1.8 percent just four years ago. It is key to note that this is debt that parents have taken out for the education of their children and does not include loans for their own college education.
The Institute for College Access & Success released a detailed 36 page analysis of what the class of 2014 faces regarding student debt. Some highlights:
69% of college seniors who graduated from public and private non-profit colleges in 2014 had student loan debt.
Average debt at graduation rose 56 percent, from $18,550 to $28,950, more than double the rate of inflation (25%) over this 10-year period.
Conclusion
So, what does this all mean?
To look at any one or two of the above categories and see their potential to stymie the economy, one would be smart to be cautious. To look at all five, one needs to contemplate the very real possibility of these creating the beginnings of another downturn in the economy. I strongly suggest a cautious and conservative investment outlook for 2016. While the risk one takes should always be based on your own risk tolerance levels, they should also be balanced by the very real possibility of a slowing economy which may also include deflation. Best of health and trading to all in 2016!
The Federal Reserve did it — raised the target federal funds rate a quarter point, its first boost in nearly a decade. That does not, however, mean that the average rate on the 30-year fixed mortgage will be a quarter point higher when we all wake up on Thursday. That’s not how mortgage rates work.
Mortgage rates follow the yields on mortgage-backed securities. These bonds track the yield on the U.S. 10-year Treasury. The bond market is still sorting itself out right now, and yields could end up higher or lower by the end of the week.
The bigger deal for mortgage rates is not the Fed’s headline move, but five paragraphs lower in its statement:
“The Committee is maintaining its existing policy of reinvesting principal payments from its holdings of agency debt and agency mortgage-backed securities in agency mortgage-backed securities and of rolling over maturing Treasury securities at auction, and it anticipates doing so until normalization of the level of the federal funds rate is well under way.”
When U.S. financial markets crashed in 2008, the Federal Reserve began buying billions of dollars worth of agency mortgage-backed securities (loans backed by Fannie Mae, Freddie Mac and Ginnie Mae). As part of the so-called “taper” in 2013, it gradually stopped using new money to buy MBS but continued to reinvest money it made from the bonds it had into more, newer bonds.
“In other words, all the income they receive from all that MBS they bought is going right back into buying more MBS,” wrote Matthew Graham, chief operating officer of Mortgage News Daily. “Over the past few cycles, that’s been $24-$26 billion a month — a staggering amount that accounts for nearly every newly originated MBS.”
At some point, the Fed will have to stop that and let the private market back into mortgage land, but so far that hasn’t happened. Mortgage finance reform is basically on the back-burner until we get a new president and a new Congress. As long as the Fed is the mortgage market’s sugar daddy, rates won’t move much higher.
“Also important is the continued popularity of US Treasury investments around the world, which puts downward pressure on Treasury rates, specifically the 10-year bond rate, which is the benchmark for MBS/mortgage pricing,” said Guy Cecala, CEO of Inside Mortgage Finance. “Both are much more significant than any small hike in the Fed rate.”
Still, consumers are likely going to be freaked out, especially young consumers, if mortgage rates inch up even slightly. That is because apparently they don’t understand just how low rates are. Sixty-seven percent of prospective home buyers surveyed by Berkshire Hathaway HomeServices, a network of real estate brokerages, categorized the level of today’s mortgage rates as “average” or “high.”
The current rate of 4 percent on the 30-year fixed is less than 1 percentage point higher than its record low. Fun fact, in the early 1980s, the rate was around 18 percent.
So a couple of weeks ago, we did a show about how the CFPB used a site to use names, to determine the race of a borrower. If you recall, 2 out of 3 of our test subjects came out with the wrong race. I, Brian Stevens, was the only correct conclusion.
We use our show, The National Real Estate Post, to point out the absurdity of the lending ecosystem. The problem is, because we use humor as our conduit, we’re not often taken seriously. However, when you consider the point that the CFPB uses a site, with an algorithm, to determine a consumer’s race; it’s not funny. Further, when you consider that the CFPB, a government agency, then uses that information to slander and sue lenders, it becomes less funny. Finally when you consider the fact that a government agency, who uses flawed racially bias information to slander and sue lenders, then tries to hide that information, we’ve got problems that make Donald Trump’s bullshit look like a playground prank. Yet here we are.
So the problem is, the CFPB operates as “judge, jury, and executioner” over those they regulate. For example; did you know the CFPB operates outside of congress, unaccountable to the judicial system, and off the books of taxpayers. Honestly, the CFPB is not part of the annual budget determined by congress. They are funded by the Federal Reserve, which means they can receive as little or as much money as they choose. That must be nice.
Did you know when the CFPB chooses to seemingly and ambiguously sue a lender, they use predetermined administrative law judges? In the past, they use judges from the SEC. So in the past, the CFPB gets to pick the judge on the cases they bring against lenders. How is a government agency allowed to operate under these rules? Short answer is “you’re not accountable to anyone.” This should infuriate you.
Good news is, the CFPB is no longer using SEC admin judges. The bad news is, they have white page job postings looking for their own judges. In an article by Ballard Spahr, who are probably the best CFPB law minds in the country, posted an article on July 20, that goes as follows:
The CFPB recently posted a job opening for an administrative law judge (ALJ). According to the government jobswebsite, the position is closed which suggests that it has been filled. A recent Politico article indicated that the CFPB posted the opening because it has ended its arrangement with the SEC to borrow ALJs.
OK so it’s time to insert outrage here. In case you missed it, the CFPB has a posting, on a government site, looking for judges to hire. To hire to work as the unbiased voice of reason to settle cases the CFPB has brought and will continue to bring against lenders. How can this happen?
Fast forward. It has now been proven that the CFPB has been using an algorithm to determine someone’s race based exclusively on their name. I proved this absurdity a month ago on my show “The National Real Estate Post,” and I’ll prove it again. I’m going to ask the first person I see their name, race, and identity. Here it goes.
That’s Andrew Strah, he’s a 20 something “tech support” at listing booster. After our short video clip he went back to his computer and “googled” his name. After all he was a little perplexed about the nature of my questions and wanted to find the answer to a question he never really considered. It turns out his name is Greek/Italian. His last name is Slavonian, which makes this Black/White kid Russian; according to him. How is it fair for the CFPB to use any system to determine anyone’s race when such issues are personal and complicated.
Yet this is the system the CFPB is using to pigeon hole guys like Andrew, and then bring lawsuits against lenders for being racist. If ever there was a system that made no sense this is it. Again, insert outrage here.
An agency with an unlimited budget, off the books, and unaccountable to the taxpayer. The very people they are protecting, while buying judges to bring lawsuits against people, with a protocol that makes no sense. Yet this is the system that allows the CFPB to force companies like Hudson City Savings and loan to pay 27 Million for Redlining for which they were not guilty. Insert outrage here.
Now the best part of the story. The CFPB knew that their information was bullshit. In an article from Right Side News.
Much like using a “ready-fire-aim” approach to shooting at targets, the Consumer Financial Protection Bureau (CFPB) appears to have conducted in racial discrimination witch hunt against auto lenders in this same manner. The CFPB investigated and sought racial discrimination charges against auto lenders, as it turns out, on the basis of guessing the race and ethnicity of borrowers based on their last names, and using this “evidence” to prove their allegations. Only 54 percent of those identified as African-American by this “proxy methodology,” theWall Street Journal reported, were actually African-Americans. The CFPB drafted rules to solve a problem they only believed existed, racial discrimination in auto lending.
Further.
The Republican staff of the House Financial Services Committee has released a trove of documents showing that bureau officials knew their information was flawed and even deliberated on ways to prevent people outside the bureau from learning how flawed it was.
The bureau has been guessing the race and ethnicity of car-loan borrowers based on their last names and addresses—and then suing banks whenever it looks like the people the government guesses are white seem to be getting a better deal than the people it guesses are minorities. This largely fact-free prosecutorial method is the reason a bipartisan House super majority recently voted to roll back the bureau’s auto-loan rules.
And we wonder why lenders don’t trust and will not approach the CFPB. They are crooked and untouchable and now we know that they know it.
Strangely, I think the solution is not as severe as my opinion in this article would suggest. I believe lending needs an agency. I think the CFPB is the answer. Further, I think every lender in the country agrees. The problem is that we have the wrong CFPB. It cannot be built on lies. It cannot view lenders as the problem. It cannot be unaccountable to congress. It cannot be off the books of the taxpayers.
The CFPB needs to view lenders as its partners. It needs to enforce rules and violations where they truly exist. It need to have more than one voice in rule making. It needs to make its direction clearly stated and understandable. Finally, it needs to work toward consumer protection.
Mortgage delinquency rates are low as long as home prices are soaring since you can always sell the home and pay off the mortgage, or most of it, and losses for lenders are minimal. Nonbank lenders with complicated corporate structures backed by a mix of PE firms, hedge funds, debt, and IPO monies revel in it. Regulators close their eyes because no one loses money when home prices are soaring. The Fed talks about having “healed” the housing market. And the whole industry is happy.
The show is run by some experienced hands: former executives from Countrywide Financial, which exploded during the Financial Crisis and left behind one of the biggest craters related to mortgages and mortgage backed securities ever. Only this time, they’re even bigger.
PennyMac is the nation’s sixth largest mortgage lender and largest nonbank mortgage lender. Others in that elite club include AmeriHome Mortgage, Stearns Lending, and Impac Mortgage. The LA Times:
All are headquartered in Southern California, the epicenter of the last decade’s subprime lending industry. And all are run by former executives of Countrywide Financial, the once-giant mortgage lender that made tens of billions of dollars in risky loans that contributed to the 2008 financial crisis.
During their heyday in 2005, non-bank lenders, often targeting subprime borrowers, originated 31% of all home mortgages. Then it blew up. From 2009 through 2011, non-bank lenders originated about 10% of all mortgages. But then PE firms stormed into the housing market. In 2012, non-bank lenders originated over 20% of all mortgages, in 2013 nearly 30%, in 2014 about 42%. And it will likely be even higher this year.
That share surpasses the peak prior to the Financial Crisis.
As before the Financial Crisis, they dominate the riskiest end of the housing market, according to the LA Times: “this time, loans insured by the Federal Housing Administration, aimed at first-time and bad-credit buyers. Such lenders now control 64% of the market for FHA and similar Veterans Affairs loans, compared with 18% in 2010.”
Low down payments increase the risks for lenders. Low credit scores also increase risks for lenders. And they coagulate into a toxic mix with high home prices during housing bubbles, such as Housing Bubble 2, which is in full swing.
The FHA allows down payments to be as low as 3.5%, and credit scores to be as low as 580, hence “subprime” borrowers. And these borrowers in many parts of the country, particularly in California, are now paying sky-high prices for very basic homes.
When home prices drop and mortgage payments become a challenge for whatever reason, such as a layoff or a miscalculation from get-go, nothing stops that underwater subprime borrower from not making any more payments and instead living in the home for free until kicked out.
“Those are the loans that are going to default, and those are the defaults we are going to be arguing about 10 years from now,” predicted Wells Fargo CFO John Shrewsberry at a conference in September. “We are not going to do that again,” he said, in reference to Wells Fargo’s decision to stay out of this end of the business.
But when home prices are soaring, as in California, delinquencies are low and don’t matter. They only matter after the bubble bursts. Then prices are deflating and delinquencies are soaring. Last time this happened, it triggered the most majestic bailouts the world has ever seen.
The LA Times:
For now, regulators aren’t worried. Sandra Thompson, a deputy director of the Federal Housing Finance Agency, which oversees government-sponsored mortgage buyers Fannie Mae and Freddie Mac, said non-bank lenders play an important role.
“We want to make sure there is broad liquidity in the mortgage market,” she said. “It gives borrowers options.”
But another regulator isn’t so sanguine about the breakneck growth of these new non-bank lenders: Ginnie Mae, which guarantees FHA and VA loans that are packaged into structured mortgage backed securities, has requested funding for 33 additional regulators. It’s fretting that these non-bank lenders won’t have the reserves to cover any losses.
“Where’s the money going to come from?” wondered Ginnie Mae’s president, Ted Tozer. “We want to make sure everyone’s going to be there when the next downturn comes.”
But the money, like last time, may not be there.
PennyMac was founded in 2008 by former Countrywide executives, including Stanford Kurland, as the LA Times put it, “the second-in-command to Angelo Mozilo, the Countrywide founder who came to symbolize the excesses of the subprime mortgage boom.” Kurland is PennyMac’s Chairman and CEO. The company is backed by BlackRock and hedge fund Highfields Capital Management.
In September 2013, PennyMac went public at $18 a share. Shares closed on Monday at $16.23. It also consists of PennyMac Mortgage Investment Trust, a REIT that invests primarily in residential mortgages and mortgage-backed securities. It went public in 2009 with an IPO price of $20 a share. It closed at $16.64 a share. There are other intricacies.
According to the company, “PennyMac manages private investment funds,” while PennyMac Mortgage Investment Trust is “a tax-efficient vehicle for investing in mortgage-related assets and has a successful track record of raising and deploying cost-effective capital in mortgage-related investments.”
The LA Times describes it this way:
It has a corporate structure that might be difficult for regulators to grasp. The business is two separate-but-related publicly traded companies, one that originates and services mortgages, the other a real estate investment trust that buys mortgages.
And they’re big: PennyMac originated $37 billion in mortgages during the first nine months this year.
Then there’s AmeriHome. Founded in 1988, it was acquired by Aris Mortgage Holding in 2014 from Impac Mortgage Holdings, a lender that almost toppled under its Alt-A mortgages during the Financial Crisis. Aris then started doing business as AmeriHome. James Furash, head of Countrywide’s banking operation until 2007, is CEO of AmeriHome. Clustered under him are other Countrywide executives.
It gets more complicated, with a private equity angle. In 2014, Bermuda-based insurer Athene Holding, home to other Countrywide executives and majority-owned by PE firm Apollo Global Management, acquired a large stake in AmeriHome and announced that it would buy some of its structured mortgage backed securities, in order to chase yield in the Fed-designed zero-yield environment.
Among the hottest products the nonbank lenders now offer are, to use AmeriHomes’ words, “a wider array of non-Agency programs,” including adjustable rate mortgages (ARM), “Non-Agency 5/1 Hybrid ARMs with Interest Only options,” and “Alt-QM” mortgages.
“Alt-QM” stands for Alternative to Qualified Mortgages. They’re the new Alt-A mortgages that blew up so spectacularly, after having been considered low-risk. They might exceed debt guidelines. They might come with higher rates, adjustable rates, and interest-only payment periods. And these lenders chase after subprime borrowers who’ve been rejected by banks and think they have no other options.
Even Impac Mortgage, which had cleaned up its ways after the Financial Crisis, is now offering, among other goodies, these “Alt-QM” mortgages.
Yet as long as home prices continue to rise, nothing matters, not the volume of these mortgages originated by non-bank lenders, not the risks involved, not the share of subprime borrowers, and not the often ludicrously high prices of even basic homes. As in 2006, the mantra reigns that you can’t lose money in real estate – as long as prices rise.
The ranks of real estate appraisers stand to shrink substantially over the next five years, which could mean longer waits, higher fees and even lower-quality appraisals as more appraisers cross state lines to value properties.
There were 78,500 real estate appraisers working in the U.S. earlier this year, according to the Appraisal Institute, an industry organization, down 20% from 2007. That could fall another 3% each year for the next decade, according to the group. Much of the drop has been among residential, rather than commercial, appraisers.
Some say Americans are unlikely to feel the effects right now, as it’s mostly confined to rural areas and the number of appraisal certifications — many appraisers are licensed to work in multiple states — has held relatively steady. Others say it’s already happening, and rural areas are simply the start.
Since most residential mortgages require an appraiser to value a property before a sale closes, they say, a shortage of appraisers is potentially problematic — and expensive — for both home buyers, who rely on accurate valuations to ensure that they aren’t overpaying, and sellers, who can see deals fall through if appraisals come in low.
“As an appraiser, I should be quiet about this shortage because it’s great for current business,” said Craig Steinley, who runs Steinley Real Estate Appraisals in Rapid City, S.D. But “what will undoubtedly happen, since the market can’t solve this problem by adding new appraisers, [is] it will solve the problem by doing fewer appraisals.”
A shrinking and aging pool
As appraiser numbers are falling, the pool is aging: Sixty-two percent of appraisers are 51 and older, according to the Appraisal Institute (http://www.appraisalinstitute.org/), while 24% are between 36 and 50. Only 13% are 35 or younger.
Industry experts blame an increasingly inhospitable career outlook. Financial institutions used to hire and train entry-level appraisers, but few do anymore, according to John Brenan, modirector of appraisal issues for the Appraisal Foundation (http://www.appraisalfoundation.org/), which sets national standards for real estate appraisers.
That has created a marketplace where current appraisers, mostly small businesses, are fearful of losing business or shrinking their own revenue as they approach retirement. Many have opted not to hire and train replacements.
The requirements to become a certified residential appraiser have also increased over the past couple of decades. Before the early 1990s, a real estate license was often all that was needed. Today, classes and years of apprenticeship are required for certification.
And this year marked the first in which a four-year college degree was required for work as a certified residential appraiser. (It takes only two years of college to become licensed, but that limits the properties on which an appraiser can work. Some states, meanwhile, only offer full certification, not licensing.)
“If you come out of college with a finance degree, you can work for a bank for $70,000 [or] $80,000 a year with benefits,” said Appraisal Institute President Lance Coyle. “As a trainee, you might make $30,000 and get no benefits.” For some, especially those with student loans to pay, the choice may be easy.
“There were definitely easier options of career paths I could have chosen,” said Brooke Newstrom, 34, who became an apprentice for Steinley Real Estate Appraisals earlier this year. She networked for a year and a half, cold calling appraiser offices and attending professional conferences, before getting the job.
For residential appraisers, business isn’t as lucrative as it once was. Federal regulations in 2009 led to the rise of appraisal management companies, which act as a firewall between appraisers and lenders so appraisers can give an unbiased opinion of a home’s value.
But those companies take a chunk of the fee, cutting appraiser compensation. Some community lenders don’t use appraisal management companies, according to Coyle, but they are often used by mortgage brokers and large banks.
Appraiser numbers appear poised to continue shrinking, and as appraisers continue to get multiple state certifications they may be stretched more thinly, industry experts say.
For now, any shortages are likely regional, Brenan said. “There are certainly some parts of the country — and primarily some rural areas — where there aren’t as many appraisers available to perform certain assignments that there were in the past,” he said.
Elsewhere, however, the decrease in appraisers isn’t felt as acutely. In Chicago, according to appraiser John Tsiaousis, it may be difficult for young appraisers to break in but customers in search of one shouldn’t have a problem.
“I don’t believe they will allow us to run out of appraisers,” Tsiaousis said. “Some changes will be made [to the certification process]. When they will be made, I don’t know.”
Longer waits, more expensive appraisals, and quality questions
The effects of an appraiser shortage could be substantial for individuals on both sides of a real estate transaction, experts say.
Fewer appraisers means longer waits, which could hold up a closing. That delay means that borrowers might have to pay for longer mortgage rate locks, according to Sandra O’Connor, regional vice president for the National Association of Realtors (http://www.realtor.org/). (Rate locks hold interest rates firm for set periods of time and are generally purchased after a buyer with initial approval for a loan finds a home she wants.)
Longer waits also affect sellers who need the equity from one sale to purchase their next home. When they can’t close on the home they’re selling, they can’t close on the one they’re buying.
A shortage also means appraisals will likely cost more, which some say is already happening in rural areas. Appraisal fees are generally paid by borrowers.
“Appraisal fees in areas where there aren’t enough appraisers are higher than those areas where there are plenty of people to take up the cause,” said Steinley, who holds leadership roles in the Appraisal Institute and the Association of Appraiser Regulatory Officials (http://www.aaro.net/).
There is a quality issue, too: In some areas, appraisers come in from other states to value homes. While there are guidelines for these appraisers to become geographically competent, they could miss subtleties in the market, Coyle said.
And if the shortage isn’t addressed, and lenders are unable to get appraisers to value homes, lenders might ask federal regulators to relax the rules governing when traditional appraisals are needed, allowing more computer-generated analyses in their place, according to Steinley.
Automated valuation models, which are less expensive and quicker, are rarely used for mortgage originations today, Coyle said. They’re sometimes used for portfolio analysis, or when a borrower needs to demonstrate 20% equity in order to stop paying for private mortgage insurance, he added. They might be used for low-risk home-equity loans, Brenan said.
Currently, appraisers are required for mortgages backed by the Federal Housing Administration, Fannie Mae and Freddie Mac. Those mortgages make up about 70% of the market by loan volume and 90% of the market by loan count, according to the Mortgage Bankers Association (https://www.mba.org/).
And computer-generated appraisals can’t match the precision of one conducted by someone who has seen the property, and knows the area, many in the industry say.
The industry is beginning to address the issue. Last month, the Appraisal Foundation’s qualifications board held a hearing to gather comments and suggestions, Brenan said.
One of the options being discussed: Creating a set of competency-based exams that could shorten the time people spend as trainees. That way, someone with a background in real estate finance could become certified more quickly, Steinley said. The board is also looking to further develop courses that would allow college students to gain practical experience before graduation, Brenan said.
Proper education is important “because real estate valuation is hard to do, and you need to get it right,” Coyle said. But the unintended consequences of the current qualifications are just too much, he added. “It’s almost as if you have some regulators trying to keep people out.”
-Amy Hoak; 415-439-6400; AskNewswires@dowjones.co
Copyright (c) 2015 Dow Jones & Company, Inc.
Without a doubt, the main things people think of when considering buying rural land for an off-grid property are size, location and cost.
But there are several other steps and factors you’ll need to consider to ascertain if the area is viable for living in and farming, especially in the long term. Going through these guidelines will help you make a better assessment, and spare you from potential problems ahead — especially if you’ve been a city-slicker all your life and are only now transitioning into country living. This list is by no means exhaustive, but it may include items you may not have thought of.
1. Soil condition. Is the soil arable? Too rocky? Too sandy? Clay-like? Contaminated with chemicals from fertilizers used by previous owners? These factors, along with soil acidity and pH, would determine the level of success and challenges you’ll have in growing your food. I would recommend getting a soil test done, and doing so on the specific areas you’re planning a garden.
2. Safety from hazards — natural and man-made. You may wish to steer clear of known earthquake faults, nuclear plants, tornado belts, flood plains, drought-prone areas, and low-lying coastal villages (at risk of hurricanes and tsunamis).
3. Water source. This could be a stream, an underground spring, an existing well shaft or a small creek or pond. An uphill spring is perfect, so you could do a gravity-fed water catchment system. If you’re looking to drill a well, ask the neighbors how deep they were able to tap their well.
Check the water quality, and how land is — and was — used in the surrounding area, not just yours. Is or was there a commercial orchard in the distance? A mining operation? A feedlot? A factory? You don’t want any of their wastes or chemical run-off in your groundwater. Find out about water rights, too. Some states don’t even allow residents to collect rainwater right from their own roof gutters.
4. Accessibility of goods and services. Depending on your and your family’s needs, you’ll need to consider the distance and time it would take for you to get to the nearest town for supplies and hard-to-find service – for anything from automotive repair to computer parts. Probably a few non-negotiables for many folks are a hospital, trauma center, fire station or any kind of emergency response. That would be very important if you or a family member have a medical condition that could need urgent care.
5. Zoning and building restrictions. Look at land use regulations, covenants and homeowners association rules. Can residents build or dig any structure they want — a straw bale house, a tree house, a pond, some cabins to rent out? Some neighborhoods set a limit on what kind and number of livestock homeowners can keep. While some counties have strict laws, others, especially those in the most remote locations, have virtually none. And not having them could be just as bad. What if the neighbors opened a huge poultry or hog operation in the distance and the smell and the flies start sweeping over to you? If peace and privacy are critical for you, go for residential and strictly non-commercial zones, as you wouldn’t want enterprises, big or small, building structures near you – from even a small, seemingly passive thing as a cell phone tower, to an all-out, invasive industrial park. Are you near a forest reserve or property owned by the government? Make sure property lines are clear and yours is a good distance from them. Look out for companies that do fracking, timber harvesting or mining of any sort. You don’t know if they’d be looking to encroach in your area in the future.
6. Woods. The benefits of having or living near wooded areas are endless: privacy and concealment, a buffer from dust and strong winds, and availability of timber and firewood. The natural habitat would also mean edible wildlife for you and your family.
Aside from hunting and foraging, the woods could also mean hours of recreation: exploring, trail running, camping and swimming if there’s a nearby pond or river. If you’re purchasing wooded land, find out exactly if you’d be allowed to cut — and how much.
7. Clearing. On the other hand, if you’re going to do some serious homesteading, you’ll need sunny, open spaces for gardening and livestock grazing. Don’t forget areas needed for barns and animal pens, an extra storage shed, garage or workshop, and a compost pile. Budget permitting, you might also consider building a greenhouse and potting shed. Off-grid energy installations like solar panels and wind turbines might also require specific locations besides your roof. And, if you decide to use a compost toilet instead of a septic, look for the most strategic location for an outhouse.
8. Communications. Unless you’re ready to totally unplug and live without phone or Internet connection, check the availability of telecom services. Check cell phone signals in different areas of the property. Not only would you want to remain connected to loved ones and the rest of the world, you might also consider working online by selling goods and services. Find out if there’s more than one service provider, so there’s an alternative if you’re not happy with one.
9. Like-minded neighbors. Whether they be somewhat similar to you in the area of self-sufficiency, farming practices, political views or faith, living next to people who share the same values will make life a lot easier for you. Neighbors can be an important asset and even a resource when living off the grid. They can come to your aid in an emergency, they can share valuable knowledge and skills in all things faming, they can lend tools and equipment you don’t yet have; and they can provide good-old company when things get lonely.
According to the National Association of REALTORS®, 25% of primary home buyers are single. Some of these non-married buyers, statistics show, buy homes jointly with other non-married buyers such as boyfriends, girlfriends or partners.
If you’re a non-married, joint home buyer, though, before signing at your closing, you’ll want to protect your interests.
Different from married home buyers, non-married buyers get almost no estate-planning protection on the state or federal level which can be, at minimum, an inconvenience and, at worst, result in foreclosure.
Non-Married Buyers Should Seek Professional Advice
The video clip referenced above is from 2007 but remains relevant today. It’s a four-minute breakdown which covers the risks of buying a home with a partner, and the various ways by which joint, non-married buyers can seek protection.
The process starts with an experienced real estate attorney.
The reason you’re seeking an attorney is because, at minimum, the following two documents should be drafted for signatures. They are :
Cohabitation Agreement
Property Agreement
The Cohabitation Agreement is a document which describes each person’s financial obligation to the home. It should include details on which party is responsible for payment of the mortgage, real estate taxes and insurance; the down payment made on the mortgage; and necessary repairs.
It will also describe the disposition of the home in the event of a break-up or death of one party which, unfortunately, can happen.
The second document, the Property Agreement, describes the physical property which you may accumulate while living together, and its disposition if one or both parties decide to move out.
A well-drafted Property Agreement will address furniture, appliances, plus other items brought into the joint household, and any items accumulated during the period of co-habitation.
It’s permissible to have a single real estate attorney represent both parties but, for maximum protection, it’s advised that both buyers hire counsel separately. This will add additional costs but will be worth the money paid in the event of catastrophe or break-up.
Also, remember that search engines cannot substitute for a real, live attorney. There are plenty of “cheap legal documents” available online but do-it-yourself lawyering won’t always hold up in court — especially in places where egregious errors or omissions have been made.
It’s preferable to spend a few hundred dollars on adequate legal protection as compared to the costs of fighting a courtroom battle or foreclosure.
Furthermore, a proper agreement will help keep the home out of probate in the event of a death of one or both parties.
Mortgages For First-Time Home Buyers
Many non-married, joint home buyers are also first-time home buyers and, for first-time home buyers, there are a number of low- and no-down payment mortgage options to put home ownership more within reach.
Among the most popular programs are the FHA mortgage and the USDA home loan.
The FHA mortgage is offered by the majority of U.S. lenders and allows for a minimum down payment of just 3.5 percent. Mortgage rates are often as low (or lower) than comparable loans from Fannie Mae or Freddie Mac; and underwriting requirements are among the loosest of all of today’s loan types.
FHA loans can be helpful in other ways, too.
As one example, the FHA offers a construction loan program known as the 203k which allows home buyers to finance construction costs into the purchase of their home. FHA home buyers have financed new garages, new windows, new siding and new floors via the 203k program.
FHA loans are also made with an “assumable” clause. This means that when you sell a home with FHA financing attached to it, the buyer of the home can “assume” the existing mortgage at its existing interest rate.
If mortgage rates move to 8 percent in 2020, you could sell your home to a buyer with an assumable FHA mortgage attached at 4.50%.
USDA loans are also popular among first-time home buyers.
Backed by the U.S. Department of Agriculture, USDA loans are available in many suburban and rural areas nationwide, and can be made as a no-money-down mortgage.
USDA mortgage rates are often lower than even FHA mortgage rates.
Domestic and business partnerships sometimes end unhappily. Engagements end and partnerships sour. Nobody intends for it to happen, but it does. It’s best to expect the best, but prepare for the worst.
All parties should seek equal legal protection in the event of a break-up.
As part of its mission to reform the mortgage industry in favor of home buyers, the Consumer Financial Protection Bureau replaced the industry’s existing lending forms with more simplified documents. These documents took effect in early October, as part of the CFPB’s “Know Before You Owe” initiative.
Here are five things to learn about these new disclosure forms.
Four forms become two.
When applying for a mortgage, you used to receive the Good Faith Estimate and Truth-in-Lending Act statements. Before closing, you were given the HUD-1 settlement and final TILA statements.
These days, you only have to worry about two mortgage documents instead of four: the Loan Estimate, which is given to you within three days of applying for a home loan, and the Closing Disclosure, which is sent to you three days before your scheduled closing.
The CFPB says the new forms, which were a few years in the making, are easier to understand and use.
The Loan Estimate helps you better compare loans …
One of the most important aspects of home buying, aside from finding the right house for you and your family, is choosing a mortgage that best suits your circumstances.
The Loan Estimate makes it easier for you to compare loan offers from multiple mortgage lenders by giving you a thorough idea of the many expenses related to a loan, including:
Your interest rate and whether it’s fixed or adjustable.
Your monthly payment amount.
What the loan may cost you over the first five years.
You get this three-page form with every mortgage application, which helps you make an apples-to-apples comparison among different loans.
… and lenders, too.
Each lender has its own set of origination charges, which include an application fee, underwriting fee and points. These charges are outlined on the second page of the Loan Estimate.
Lender fees are among the few costs over which you actually have control, meaning you can shop around for the source of your home loan. As a rule of thumb, apply for mortgages with at least two or three lenders.
‘Cash to close’ isn’t a mystery.
The first page of the Loan Estimate lists information about the approximate amount of money you should bring to the closing table to seal the deal on your home purchase.
The “Estimated Cash to Close,” as it’s called on the form, includes the closing costs attached to the loan transaction. If any of the closing costs are added to your loan amount that would also be noted on the Loan Estimate.
The cash to close amount also includes your down payment, minus any deposit you made or seller credits you’re given, and also any additional adjustments or credits.
Your closing costs can’t vary by much.
The fees listed on the Closing Disclosure – the form you receive three days before your closing – may not look identical to your Loan Estimate, but the two documents should be similar.
There are three categories of closing costs: those that cannot increase, those that can increase by up to 10 percent and those that can increase by any amount, according to the CFPB.
Lender fees and the services you aren’t allowed to shop for can’t increase, while fees for services you can shop for, such as homeowners or title insurance, can increase by any amount. Fees for certain lender-required third-party services and also recording fees can increase by up to 10 percent.
However, if your circumstances have changed significantly since you applied for a mortgage, you will probably be given a new Loan Estimate, which would restart this part of the home buying process.
For more on the Loan Estimate and Closing Disclosure, check the CFPB website. Happy home buying!
All-cash transactions comprised nearly 31 percent of all single-family residential home sales nationwide in July 2015, marking a decline of more than three full percentage points year-over-year, according to CoreLogic cash sales data released on Friday.
With July’s decline, the cash sales share has fallen year-over-year every month since January 2013, a total of 31 consecutive months, according to CoreLogic. July 2015’s reported share of 30.8 percent was a drop off from the share of 34.2 percent reported in July 2014.
As has historically been the case, REO sales made up the largest portion of cash sales with 56 percent in July 2015, and resales had the second highest share at 30.2 percent (resales made up 83 percent of all home sales in July and therefore have the biggest impact on moving the overall cash sales share). Short sales comprised 28 percent of cash sales, followed by new homes at 15.6 percent. Despite REO sales making up more than half of all cash sales, REO’s share of total home sales remained low in July at 6.1 percent. In January 2011, when the cash sales share reached its peak, REO sales made up 23.9 percent of total home sales.
Previously, much of the cash sales share could be attributed to institutional investors buying distressed properties at discounts; the continued decline of the cash sales share is a likely indicator that fewer institutional investors are buying homes, and that more buyers are obtaining mortgage credit, according to CoreLogic Senior Economist Molly Boesel.
Four states had a cash sales shares higher than 40 percent in July, led by Alabama (47.4 percent), Florida (44.7 percent), New York (42.8 percent), West Virginia (41.1 percent) and New Jersey (39.5 percent). Out of the nation’s top 100 Core-Based Statistical Areas, the five with the highest cash sales share were all located in Florida: West Palm Beach (53.2 percent), Miami (52.2 percent), North Port-Sarasota-Bradenton (50.1 percent), Fort Lauderdale (48.4 percent), and Cape Coral-Fort Myers (47.9 percent). The metro area out of the top 100 with the lowest cash sales share was Washington-Arlington-Alexandria, D.C.-Virginia at 13.6 percent, according to CoreLogic.
At their peak in January 2011, cash sales comprised about 46.5 percent of total single-family residential home sales in the United States. The cash sales share typically averaged about 25 percent prior to the housing crisis; if the share continues to decline at the same rate it did in July 2015, CoreLogic estimates that it will fall to 25 percent by the middle of 2017.
The Mortgage Bankers Association announced this week at their annual national conference in San Diego that they expect to see $905 billion in purchase mortgage originations during 2016, a ten percent increase from 2015.
In contrast, MBA anticipates refinance originations will decrease by one-third, resulting in refinance mortgage originations of $415 billion. On net, mortgage originations will decrease to $1.32 trillion in 2016 from $1.45 trillion in 2015.
For 2017, MBA is forecasting purchase originations of $978 billion and refinance originations of $331 billion for a total of $1.31 trillion.
“We are projecting that home purchase originations will increase in 2016 as the US housing market continues on its path towards more typical levels of turnover based on steadily rising demand and improvements in the supply of homes for sale and under construction. Despite bumps in the road from energy and export sectors, the job market is near full employment, with other measures of employment under-utilization continuing to improve,” said Michael Fratantoni, MBA’s Chief Economist and Senior Vice President for Research and Industry Technology. “We are forecasting that strong household formation, improving wages and a more liquid housing market will drive home sales and purchase originations in the coming years.
“Our projection for overall economic growth is 2.3 percent in 2016 and 2017 and 2 percent over the longer term, which will be driven mainly by consumer spending as households continue to buy durable goods, such as cars and appliances. The housing sector will contribute more to the economy than it has in recent years. We are forecasting a 17 percent increase in single family starts in 2016 and a further increase of 15 percent in 2017. Weaker growth abroad will mean fewer US exports, which will be a drag on growth over the next couple of years. Recurring flights to quality, a demand for safe assets from investors abroad, will keep longer-term rates lower than the domestic growth environment would warrant.
“Coincident with a strengthening economy, we expect the Federal Reserve will begin to slowly raise short-term rates at the end of 2015. At some point after liftoff, the Fed will begin to allow their holdings of MBS and Treasury securities to run off, likely beginning in late 2016. Even with these actions, we expect that the 10-Year Treasury rate will stay below three percent through the end of 2016, and 30-year mortgage rates will stay below 5 percent.
“We forecast that monthly job growth will average 150,000 per month in 2016, down from about 200,000 per month in 2015, and that the unemployment rate will decrease to 4.8 percent by the end of 2016, returning to 5.0 percent in 2017 and 2018. The slight rebound will be driven by an increase in labor force participation rates to more typical levels.
“Refinance activity will continue to decline as there are few remaining households that can benefit from an interest rate reduction and because rates will gradually begin to rise from historic lows in the coming years. Home equity products may see an increase in demand as home prices continue to increase at a decelerating rate,” Fratantoni said.
Some 88% of property managers raised their rent in the last 12 months and 68% predict that rental rates will continue to rise in the next year by an average of 8%, according to a survey of more than 500 of Rent.com’s property management customers, which the site says represents thousands of rental properties and hundreds of thousands of rental units. That’s nearly three times the wage increase that most employees can expect this year.
What’s more, 55% of property managers said that they are less likely to offer concessions or lower rents in order to fill vacancies. One reason why they’re getting even tougher: They are in a stronger position than they were this time last year.
More than 46% of property managers surveyed reported a decrease in rental vacancies in Rent.com’s survey and, in the second quarter of 2015, vacancy rates in the U.S. for rental housing was 6.8%, the lowest it has been in almost 20 years, according to data from the U.S. Census Bureau.
Despite this, many renters are spending more than 30% of their income on rent (the amount generally recommended) and need help qualifying for the lease.
Yardi Survey
Mish reader “BJ” is retired but works part-time a number of hours each week, surveying apartments for rent. He reports …
I am retired but work part-time for Yardi from my home, surveying apartments for rents. Yardi runs a full survey 3 times a year, Jan, May and Sept. These generally run about 6 weeks.
Yardi has the country divided into 24 sectors and we normally work 6-7 sectors once a month for a week on a rotating basis. Toward the end of the survey, we can work any market and I’ve been keeping track of a few select places. From what I see, rents are up and up a lot. Some of the places I watch are up 7% or more than last year for the same apartments.
The absolute worst places to be looking for a rental unit are San Fran and North LA. If anyone does answer the phone in those areas, it’s either a new building just opening, or they don’t have anything. You can’t even get on a waiting list. I’ve seen apartments in tight areas where they want you to make 3X net before they will talk to you.
Portland, Seattle, Washington DC, northern NJ, Miami and Boston are also difficult. I talked to a complex in Portland last week that had 3500 apartments under management with a total of 7 open apartments.
I am amazed by the amount of apartments that are either tax credit or subsidized in some manner. All of them have long waiting lists.
Measuring Housing Inflation
The Fed wants inflation. But how do they measure it?
According to a study by Wealth-X and the Sotheby’s International Realty, a growing number of ultra-high net worth (UHNW) individuals view homes as ‘opportunity gateways’, driving buying decisions that are based on potential opportunities from owning these luxury residential properties.
The UHNW Luxury Real Estate Report: Homes As Opportunity Gateways reveals two trends that are fueling the rise in the number of ultra wealthy individuals who are buying luxury homes: 1) International home-buying by UHNW individuals (defined as those with at least US$30 million in assets) from emerging nations seeking a safe investment diversification. 2) Home-buying as part of a program to gain citizenship or residency status in foreign nations. The report provides insight into the UHNW residential real estate opportunities in Sydney and Vancouver for buyers seeking safe investment diversification; and Malta, the Bahamas and Sao Paulo, which may appeal to ultra wealthy buyers who are seeking citizenship or residency through property investment.
Key report findings include:
12% of second homes purchased by UHNW individuals in emerging countries (those who reside in BRICS nations) are located outside their country of residence.
Recent market fluctuations in emerging nations are leading a new generation of UHNW investors to consider investing in luxury residential real estate in Western markets.
Chinese UHNW individuals make up the third largest share of foreign UHNW homeowners in the United States, behind only Canada and the United Kingdom.
Twenty nations in Europe and the Americas now offer citizenship or residency programs to individuals willing to invest in domestic residential real estate.
Many residential real estate markets with such programs – including Sao Paulo, Malta, and the Bahamas – offer good long-term investment opportunities.
The UHNW Residential Real Estate index, tracked by Wealth-X, rose to 115.2 in Q2 2015, an 8.3% rise year-on-year, and the sixth consecutive quarter in which the index has risen. The continued rise in the index reflects the confidence of UHNW individuals to invest in luxury residential real estate. The index takes into account the full range of luxury residential properties that are owned by the world’s wealthiest individuals. Wealth-X data shows there are 211,275 UHNW individuals globally, who collectively hold nearly $3 trillion in real estate assets, equal to 10% of their net worth.
Wealth-X President David Friedman commented, “Wealth-X is pleased to partner with the Sotheby’s International Realty brand for this third luxury real estate report for 2015. This new joint study explores the trends and home-buying motivations of a distinct group of ultra wealthy individuals in the emerging markets. As their wealth grows, so will their investment fueled by various motivations, be it to diversify their portfolio or to gain citizenship or residency in a foreign country.” According to Philip White, president and chief executive officer, Sotheby’s International Realty Affiliates LLC, this joint report was designed to provide an understanding of the trends driving buying decisions of ultra-high net worth individuals around the world. “The research reveals trends that go beyond traditional motivations and help guide real estate investments that contribute to long-term wealth,” he said. “It underscores the important role real estate plays in a larger strategy to build a valuable asset portfolio.”
“$20,000 on drinks is a plain night on the town,” says one local restaurateur, as big-time Chinese money pours into Los Angeles, consuming everything from wine to diamonds to watches to cars to prime real estate (in one case, 25,000 square feet for a teenage college student).
A version of this story first appeared in the Oct. 9 issue of The Hollywood Reporter magazine. To receive the magazine, click here to subscribe.
The ultra-wealthy Chinese tend to get what they want, and right now most of them want one thing: to get out. More than 60 percent of China’s most affluent citizens have already left the country or are planning to leave it, according to the Los Angeles Times. And L.A. — a politically stable and always-comfortable metropolis where catering to the rich is a way of life — is among their most coveted destinations. The numbers don’t lie: In 2014, a full 20 percent of the city’s $8 billion in real estate sales was purchased by Chinese buyers. Showing no signs of slowing down, this injection of Chinese capital and influence can be felt at every level of L.A.’s culture of consumption.
Thanks to big import and consumption taxes introduced in recent years by President Xi Jinping, most wealthy Chinese consider the cost of homes and luxury goods in L.A. to be something of a bargain. “They’ll buy high-end watches in threes and fours,” says Korosh Soltani, owner of Rodeo Drive jewelry store David Orgell, of his Chinese clientele, who’ll typically drop $200,000 on gifts in a single shopping spree. (Soltani has so many Chinese customers, he asks companies like Corum and Baume & Mercier to send him watches bearing the Mandarin logos they are more familiar with.)
Brand names are essential: Hermes tableware, Lalique crystal and yellow-gold jewelry from Carrera y Carrera — gold is the most popular gift among Chinese — are consistent hot sellers. Spending can easily soar much higher if shopping for a special occasion: “We just had a Chinese family come in looking for the finest, most vivid canary yellow diamond you can have. Fortunately I had one,” says Beverly Hills jeweler Martin Katz of a recent engagement ring purchase. “It was a seven-figure-priced stone in the six-carat range.”
While money is frequently no object, the Chinese still like to negotiate and won’t close a deal without getting “big discounts … it’s in the culture,” Soltanti says. They also expect a little something extra: “We ask our brands to give us pens or hats that will keep them happy. They’re very appreciative of it.”
The Beverly Center, meanwhile, has taken active steps toward luring China’s big spenders: The high-end shopping mall — which houses Louis Vuitton, Prada and Fendi boutiques — provides a Chinese version of its website and brochures, staffs Mandarin-speaking concierges, accepts China UnionPay credit cards and promotes itself on Sina Weibo, China’s answer to Twitter.
“They arrive with this endless stream of money without working or earning it. It’s just Monopoly money to them,” says Gotham Dream Cars’ Rob Ferretti of Chinese customers who come to him in search of an exotic ride. They lease cars like the $397,000 Maybach 57S for $2,200 a day. Color-wise, “They love these light blues,” Ferretti says. They’re even particular about the car’s VIN number: They like when it has as many eights in it as possible.
“Eight in Chinese rhymes with the word for prosperity. It’s extremely significant,” explains architect Anthony Poon of Beverly Hills-based Poon Design Inc. The Chinese fixation on the number can verge on the obsessive: One client, whose husband is a major film director, wanted Poon to design her an 8,888-square-foot home, while another Chinese developer working on a luxury community in Pacific Palisades insists that it have eight estates.
“They understand vertical living very well, and they love new construction, so condos are very much in their wheelhouse,” says Beverly Hills realtor (and Real Housewives of Beverly Hills star) Mauricio Umansky of his Chinese clients, most of whom are relocating from densely packed urban centers like Shanghai to the comparative expansiveness of Arcadia, an L.A. suburb and Chinese-wealth magnet. If their kids are attending UCLA, parents will think nothing of spending $1 million to $3 million or more on a Westwood pied-a-terre instead of putting their children up in dorms. “The wealth and lack of reference point can be staggering,” marvels Poon, before sharing an anecdote about the family who purchased a 25,000-square-foot home in the Hollywood Hills for their teenage son. On the ultra-high-end market — mansions that cost $50 million and above — Umansky estimates that about 25 percent of sales are made to Chinese, a figure he says is climbing due to ongoing “political and financial uncertainty in China.”
When it comes to design, feng shui — the ancient philosophy of living in harmony with your surroundings — is a top priority among Chinese buyers, with architects scrambling to accommodate its highly specific criteria. According to Poon, a contained foyer is preferable to an open-plan entryway (it helps retain life force, or chi); floor plans must be simple, with no awkward or cramped spaces; furniture should be placed away from doors and be round, not rectangular; sloping backyards are a no-no (again, to avoid chi loss); and, says Umansky, “you don’t want the staircase facing the front door because it’s the money and fortune flowing out.”
Dining, too, comes with its own set of Chinese rules. For a taste of home, Chinese emigres gravitate to authentic dumpling houses like Din Tai Fung — either the original in Arcadia or either of two trendier outposts in Costa Mesa and Glendale. (The latter location, nestled in Rick Caruso’s Americana at Brand, serves the much-coveted black-truffle soup dumplings, a Hong Kong delicacy.) Restaurateur Peter Garland, owner of Porta Via on Canon Drive, notes that uber-wealthy Chinese diners spend freely on high-end wines — especially chardonnay and California cabernet. That extends to any restaurant boasting a stellar wine list, as Beverly Hills mainstays like Cut or Mastro’s regularly draw a deep-pocketed Chinese clientele who’ll think nothing at dropping four-figures on rare vintages and for whom “$20,000 on drinks in one night is a plain night on the town,” says Poon.
The developers of Miami’s new and uber-luxe One Thousand Museum reported approximately $24 million in new condo sales contracts signed within 24 hours of their 24-hour concrete pour.
“If we knew we’d sell $1M an hour, we would have poured longer,” said Louis Birdman, one of the developers of the 62-story skyscraper. Four contracts were signed during the pour with buyers from the US, Mexico City, and Argentina. All sales were for half-floor units ranging in price from $5.8 to $6.5 million. The 83-unit tower, slated for completion in late 2017, will expect 4,800 pieces of the project’s revolutionary exoskeleton being shipped from Dubai to initiate this installation.
Once complete, One Thousand Museum will be the first building in the country to utilize this glass-fiber reinforced concrete (GFRC) outer shell as a permanent formwork. “Zaha Hadid is a visionary. The buildings she designs not only make headlines worldwide, but also garner critical acclaim and promise to be in history books for generations to come,” said Louis Birdman on the architectural component of the project. Some noted amenities include 30,000 square feet of luxury communal areas include a two-story amenity space at the top of the tower, an aquatic center, garden areas, event spaces, a two-story health spa, multiple art galleries, a theater, and the city’s only private rooftop helipad.
Would-be home buyers recently averted a major price hike by the narrowest of margins. No, this potential hike had little to do with the wholesale cost of building materials, the cost of borrowing capital, a scarcity of inventory, or the transaction costs of builders, Realtors or lenders. Rather, the latest proposed tax on new homeowners was designed to cover the cost of maintaining our nation’s bridges and roads.
Wait a second — what, if anything, does highway spending have to do with the cost of a residential mortgage? If you guessed “absolutely nothing at all” you’d be correct. Unless, of course, you happen to be a member of the 114th Congress. In that case, America’s newest class of would-be homeowners represents something similar to years past when homeowners were taxed to cover things like the payroll tax reduction extension.
In the Washington of today — similar to past occasions, the American homeowner is all-too-often referred to as a “pay for.”
In this case, various members of Congress sought an offset for a proposed $47 billion federal highway spending bill.
As crazy as it sounds, the latest unsuccessful home ownership “pay-for” proposal isn’t the first time such a plan has been considered. In fact, if you bought a home after December 2011 with a mortgage purchased by Fannie Mae and Freddie Mac, you’re already paying for much more than the cost of a place to live.
The Temporary Payroll Tax Cut Continuation Act of 2011 — H.R. 3765 of the 112th Congress charged new homeowners an additional 10 basis points in guarantee fee costs over the life of a 30-year mortgage. The proceeds were intended to help cover an increase in a two-month extension of the payroll tax credit and also unemployment compensation payments to long-term unemployed workers for roughly two months, from mid-December 2011 until February 29, 2012.
The law states that loan guarantee fees at Fannie and Freddie will rise “by not less than an average increase of 10 basis points for each origination year or book year above the average fees imposed in 2011 for such guarantees.” This means that an estimated $36 billion in additional fees collected over 10 years will be used to offset $33 billion in up-front costs tallied by a mere eight weeks of payroll tax deductions and unemployment insurance.
Of course none of this has anything to do with the financial health of Fannie Mae and Freddie Mac or the creditworthiness of the individual borrower, but it directly impacts the cost of a new home purchase or refinance. It happened because there’s value in home ownership — value that some congressional leaders think can be taxed for almost anything.
The recent flurry of loan guarantee fee increases at Fannie Mae and Freddie Mac (three times in just over four years) has nothing to do with the risk expected within the overall portfolios of loan business purchased by either of the two mortgage guarantor giants Fannie Mae or Freddie Mac during this time frame. The overall creditworthiness of loan portfolios purchased by both Fannie Mae and Freddie Mac has risen significantly over the last six years. In fact, both GSEs carry loan portfolios with aggregate averageFICO scores well in excess of the average American. Yet, loan guarantee fees at Fannie Mae and Freddie Mac have skyrocketed by more than 160 percent over the exact same time period.
One reason for the recent rise in “g-fee” expenses has to do with congressional spending packages brokered by both parties for all sorts of concerns. Add to this equation the simple fact that the GSEs themselves are essentially a government-controlled duopoly, and one can understand exactly how the last six years of guarantee fee hikes came to pass.
Fannie Mae and Freddie Mac both currently operate under federal conservatorship administered by the Federal Housing Finance Agency (FHFA). Now in its 84th consecutive month, this “temporary” conservatorship has continued for almost seven years with no proposed plan for a future model. Freddie Mac declared over $8 billion in profits in 2014 alone. Fannie Mae recently declared profits of $4.6 billion in the brief April-through-June time period of 2Q 2015 by itself. Meanwhile, home buyers, cities, communities and the lenders and real estate agents that support the home ownership market have continued to struggle to recover from the housing financial crisis.
Keep in mind, the true cost of capital for Fannie Mae and Freddie Mac alike, is essentially zero — they are “conservatees” of the federal government. The notion of passing the cost of capital to the consumer, much like a private sector bank would, simply does not apply in the same sense.
The damage that a deliberate yet unwarranted campaign of GSE guarantee fee has done to American home ownership is clear. With wrongheaded policies such as these, it is easy to understand how the U.S. home ownership rate has dropped to the lowest level in almost 50 years.
It bears mentioning that not everyone on Capitol Hill is interested in using your nest egg as their fiscal piggy bank. Various members of Congress from both political parties have stood in unison to say “enough.” Republican Senator Bob Corker of Tennessee recently joined Democratic Senator Mark Warner of Virginia in authoring an open letter to Senate Majority Leader Mitch McConnell (R) and Senate Minority Leader Harry Reid (D) in opposition to the “homes for highways” pay-for gambit.
“Each time guarantee fees are extended, increased or diverted for unrelated spending, homeowners are charged more for their mortgages and taxpayers are exposed to additional risk,” said Senators Corker and Warner. Exactly.
It took a (rare) bipartisan effort led by Senators Corker and Warner to publicly shame Congress into upholding the same measure prohibiting such g-fee “pay-for” deals that they themselves passed only months ago.
It has happened before, and it will undoubtedly happen again. It’s just too easy, and it makes almost everyone happy. Everyone except the unsuspecting homeowner, that is. Various constituent groups get whatever spending item they’re after today, fiscal watchdogs get the satisfaction of knowing that at least someone, somewhere, is on the hook to pay the added cost. The problem is, if you’re in the market to buy a home in the foreseeable future or planning to refinance your existing home loan, that “someone” will most likely be you.
Prospective new homeowners have all sorts of pressing concerns to consider. Strapping the cost of a federal highway spending bill onto their backs by way of artificially inflated loan guarantee fees paid over the life of a 30-year mortgage shouldn’t be one of them.
Perhaps it’s all the talk about across-the-board debt forgiveness or maybe the total amount of outstanding student debt has simply grown so large ($1.3 trillion) that even those with no conception of how much money that actually is realize that it’s simply never going to paid back so there’s no point worrying about, but whatever the case, the general level of concern regarding America’s student debt bubble doesn’t seem to be at all commensurate with the size of the problem.
And it’s not just the sheer size of the debt pile that’s worrisome. There’s also the knock-on effects, such as delayed household formation and the attendant downward pressure on the home ownership rate, and of course hyperinflation in the rental market.
Of course one reason no one is panicking – yet – is that the severity of the problem is masked by artificially suppressed delinquency rates. As we’ve documented in excruciating detail, if one excludes loans in deferment and forbearance from the numerator in the delinquency calculation, but includes those loans in the denominator then the delinquency rate will be deceptively low. In any event, as WSJ reports, even if one looks at something very simple like, say, the number of borrowers who haven’t made a payment in a year, the picture is not pretty and it’s getting worse all the time. Here’s more:
Nearly seven million Americans have gone at least a year without making a payment on their federal student loans, a staggering level of default that highlights how student debt continues to burden households despite an improving labor market.
As of July, 6.9 million Americans with student loans hadn’t sent a payment to the government in at least 360 days, quarterly data from the Education Department showed this week. That was up 6%, or 400,000 borrowers, from a year earlier.
The figures translate into about 17% of all borrowers with federal loans being severely delinquent—and that share would be even higher if borrowers currently in school were excluded. Additionally, millions of other borrowers who haven’t hit the 360-day threshold that the government defines as a default are months behind on their payments.
Each new crop of students is experiencing the same problems” with repaying, said Mark Kantrowitz, a higher-education expert and publisher of the information website Edvisors.com. “The entire situation isn’t getting better.”
The development carries big implications for borrowers, taxpayers and the economy. Economists have warned of student-debt defaults damaging borrowers’ credit standing, which would hurt their ability to borrow for things like cars and homes. That in turn would hamper the economy, which relies heavily on consumer purchases for economic activity. Delinquencies also drain government revenues, which are used to make future loans.
Education Secretary Arne Duncan said declines [in some categories of delinquencies] resulted from rising participation in income-based repayment plans, which lower borrowers’ monthly bills by tying payments to their incomes. Enrollment in the plans surged 56% over the past year among direct-loan borrowers.
The administration has urgently promoted the plans, mainly through emails to borrowers, over the past two years in an effort to stem defaults. The plans set payments as 10% or 15% of their discretionary income, defined as adjusted gross income minus 150% the federal poverty level.
The plans carry risks, though, for both borrowers and the government. Many borrowers’ payments aren’t enough to cover the interest on their debt, allowing their balances to grow and threatening to trap them under debt for years.
At the same time, the government could be left forgiving huge amounts of debt if borrowers stay in the plans. The government forgives balances after 10, 20 or 25 years of on-time payments, depending on the plan.
But aside from the fact that these plans will cost taxpayers an estimated $39 billion over the next decade – and that’s just counting those expected to enroll in plans going forward and ignoring the $200 billion or so in loans already enrolled in an IBR plan – the most absurd thing about Duncan’s claim is that, as we’ve shown, IBR programs don’t drive down delinquency rates, they just change the meaning of the term “payment”:
See how that works? If you can’t afford to pay, just tell the Department of Education and they’ll enroll you in an IBR plan where your “payments” can be $0 and you won’t be counted as delinquent.
So we suppose we should retract the statement we made above. You are correct Mr. Duncan, these plans are actually very effective at bringing down delinquencies and the method is remarkably straightforward: the government just stopped counting delinquent borrowers as delinquent.
Could that shiny new car you just financed with a big dealer loan or lease put a damper on your ability to refinance your mortgage or move to a different house? Could your growing debt — for autos, student loans and credit cards — make it tougher to come up with all the monthly payments you owe? Absolutely.
And some mortgage and credit analysts are beginning to cast a wary eye on the prodigious amounts of debt American homeowners are piling up. New research from Black Knight Financial Services, an analytics and technology company focused on the mortgage industry, reveals that homeowners’ non-mortgage debt has hit its highest level in 10 years.
New debt taken on to finance autos accounted for 81 percent of the increase — a direct consequence of booming car sales and attractive loan deals. The average transaction price of a new car or pickup truck in April was $33,560, according to Kelley Blue Book researchers.
Student-loan debt is also contributing to strains on owners’ budgets. Balances are up more than 55 percent since 2006.Credit-card debt is another factor, but it has not mushroomed like auto and student loans have. Nonetheless, homeowners carrying balances on their cards owe an average $8,684, according to Black Knight data.The jump in non-mortgage debt is especially noteworthy among owners with Federal Housing Administration and Veterans Affairs home loans. These borrowers — who typically have lower credit scores and make minimal down payments (as little as 3.5 percent for FHA, zero for VA) — now carry non-mortgage debt loads that average $29,415. By contrast, borrowers using conventional Fannie Mae and Freddie Mac financing have significantly lower debt loads — an average $22,414 — but typically have much higher credit scores and have made larger down payments.
Is there reason for concern? Bruce McClary, vice president at the National Foundation for Credit Counseling, thinks there could be if the pattern continues.
Some people have lost sight of the ground rules for responsible credit and are “pushing the boundaries,” he said.
Auto costs — monthly loan payments plus fuel and maintenance — shouldn’t exceed
15 to 20 percent of household income, he said. Yet some people who already have debt-strained budgets are buying new cars with easy-to-obtain dealer financing that knocks them well beyond prudent guidelines.
According to a recent study by credit bureau Equifax, total outstanding balances for auto loans and leases surged by
10.5 percent during the past 12 months. Of all auto loans originated through April, 23.5 percent were made to consumers with subprime credit scores.
Ben Graboske, senior vice president for data and analytics at Black Knight Financial Services, cautions that although rising debt loads might look ominous, there is no evidence that more borrowers are missing mortgage payments or heading for default. Thanks to rising home-equity holdings and improvements in employment, 30-day delinquencies on mortgages are just 2.3 percent, he said, the same level as they were in 2005, before the housing crisis. Even FHA delinquencies are relatively low at 4.53 percent.
But Graboske agrees that other consequences of high debt totals could limit homeowners’ financial options: They “are going to have less wiggle room” in refinancing their current mortgages or obtaining a new mortgage to buy another house.
Why?
Because debt-to-income ratios are a crucial part of mortgage underwriting and are stricter and less flexible than they were a decade ago. The more auto, student-loan and credit-card debt you have along with other recurring expenses such as alimony and child support, the tougher it will be to refinance or get a new home loan.
If your total monthly debt for mortgage and other obligations exceeds 45 percent of your monthly income, lenders who sell their mortgages to giant investors Fannie Mae and Freddie Mac could reject your application for a refinancing or new mortgage, absent strong compensating factors such as exceptional credit scores and substantial cash or investments in reserve. FHA is more flexible but generally doesn’t want to see debt levels above 50 percent.
Bottom line: Before signing up for a hefty loan on a new car, take a hard, sober look at the effect it will have on your debt-to-income ratio. When it comes to what Graboske calls your mortgage wiggle room, less debt, not more, might be the way to go.
Read more inThe Columbus Dispatchwhere author Kenneth R. Harney covers housing issues on Capitol Hill for the Washington Post Writers Group. kenharney@earthlink.net
Gay Americans can take pride in these house prices.
Over the last three years, home prices in neighborhoods popular with cohabiting, married or partnered gay men have grown by an average of 23%, according to research by the real-estate website Trulia. Similarly, prices have risen in neighborhoods that are popular with cohabiting, married or partnered gay women — by an average of 18%. “In honor of Gay Pride this year [the last weekend in June in many U.S. cities], we wanted to revisit these neighborhoods and find out what’s changed,” says Trulia housing economist Ralph McLaughlin.
Among the areas characterized as male “gayborhoods,” prices rocketed 65% to $260 per square foot in the 92262 ZIP Code of Palm Springs, Calif., between 2012 and 2015 and rose 47% to $768 in the 94131 ZIP Code, which comprises the Noe Valley, Glen Park and Diamond Heights neighborhoods of San Francisco. One theory: “If you are not raising children, you have two male incomes and have more money to devote to improve their home environment,” says Gary Gates, a demographer and research director of the Williams Institute for Sexual Orientation Law and Public Policy at the University of California.
Among neighborhoods popular with lesbians, prices rose 64% to $389 per square foot in the Redwood Heights/Skyline area of Oakland, Calif.
Many of these neighborhoods are in metro areas that have also experienced sharp price gains. But housing in almost all of the so-called gayborhoods was more expensive than in nearby sections, Trulia found. Homes in the Castro neighborhood of San Francisco cost $948 per square foot, which is 34% more expensive than the San Francisco metro area as a whole, while West Hollywood, Calif., and Provincetown, Mass., are 123% and 119% more expensive, respectively. Guerneville, Calif., was the only area less expensive than its wider metro-area comparable, but only by 2%.
Where gay men’s neighborhoods are getting more expensive
ZIP Code and city
Median price per sq. foot, June 2012
Median price per sq. foot, June 2015
% change in price per sq. foot, June 2012–June 2015
92262: Palm Springs, Calif.
$158
$260
65%
94131: Noe Valley/Glen Park/Diamond Heights, San Francisco
$522
$768
47%
92264: Palm Springs, Calif.
$174
$240
38%
48069: Pleasant Ridge, suburban Detroit
$137
$188
37%
94114: Castro, San Francisco
$699
$948
36%
90069: West Hollywood, Los Angeles
$611
$802
31%
75219: Oak Lawn, Dallas
$185
$225
22%
33305: Wilton Manors, Fort Lauderdale, Fla.
$249
$292
17%
19971: Rehoboth Beach, Del.
$193
$203
5%
02657: Provincetown, Cape Cod, Mass.
$604
$616
2%
Average for all gay men’s neighborhoods
$188
$238
23%
Note: Only ZIP Codes with at least 1,000 persons are included in the analysis. Average growth rate is weighted by number of gay households, so the listed percentage increase is different than the simple percentage change between average price per foot in 2012 and 2015. Data in this report are different from our report in June 2012 because of new MSA definitions and observed time period of listings (month vs. previous year in the June 2012 report)
Using the 2010 Census, McLaughlin calculated the share of households with same-sex couples in every ZIP Code. Focusing on the top 10 among these ZIP Codes, he then calculated the median price per foot of homes for sale in each ZIP Code on Trulia as of June 1, 2015, and compared it with June 1, 2012. He excluded neighborhoods with populations of less than 1,000. Gayborhoods are defined in the census as those with the highest proportion of same-sex cohabiting couples. (The census doesn’t measure sexual orientation.)
Why the discrepancy in price growth between the two? “The top gay-men neighborhoods are places where prices were already high relative to their metros and were not hit as hard during the housing crash as other less expensive neighborhoods,” McLaughlin says. Gay female couples are more than twice as likely to have children as are gay male couples, he adds, “so it could be that gay women seek up-and-coming neighborhoods with good schools to raise their children.”
Many of the neighborhoods on the list of gayborhoods are also places where people are less likely to have children, Gates says. “This survey is picking up neighborhoods where proportionally, fewer households have children in them,” Gates says. “This survey could be picking up a very practical economic reality.” Wellfleet and Provincetown, both on Cape Cod in Massachusetts; Rehoboth Beach, Del.; and Palm Springs are also popular among retirement communities, he says. “The Castro in San Francisco, while popular with both gay men and lesbians, is not high for child-friendly amenities for families,” he says.
Where gay women’s neighborhoods are getting more expensive
ZIP Code and city
Median price per sq. foot, June 2012
Median price per sq. foot, June 2015
% change in price per sq. foot, June 2012–June 2015
94619: Redwood Heights/Skyline, Oakland, Calif.
$237
$389
64%
30002: Avondale Estates, suburban Atlanta
$114
$173
52%
02130: Jamaica Plain, Boston
$303
$414
37%
94114: Castro, San Francisco
$699
$948
36%
95446: Guerneville, north of San Francisco
$270
$335
24%
01060: Northampton, Mass.
$197
$216
10%
19971: Rehoboth Beach, Del.
$193
$203
5%
01062: Northampton, Mass.
$190
$196
3%
02657: Provincetown, Cape Cod, Mass.
$604
$616
2%
02667: Wellfleet, Cape Cod, Mass.
$326
$323
-1%
Average for all gay women’s neighborhoods
$133
$157
18%
Note: Only ZIP Codes with at least 1,000 persons are included in the analysis. Average growth rate is weighted by number of gay households, so the listed percentage increase is different than the simple percentage change between average price per foot in 2012 and 2015. Data in this report are different from our report in June 2012 because of new MSA definitions and observed time period of listings (month vs. previous year in the June 2012 report)
There are other possible limitations to house-price rises within a gayborhood. A neighborhood may need to be “socially liberal” for an increase in same-sex households to increase house prices, a 2011 study by researchers at Konkuk University in Seoul and Tulane University in New Orleans found. They looked at Columbus, Ohio, and, adjusting for factors such as housing, crime and school quality, analyzed house prices with how residents voted in a 2004 ballot initiative on the Defense of Marriage Act. They found a “positive and significant” impact on prices, but only in more liberal locales.
Florida found that high-tech hot spots followed the locational patterns of gay people. Other measures he created, such as the Bohemian Index, which measured the prevalence of artists, writers and performers, had similar results. “Artistic and gay populations,” he wrote, “cluster in communities that value open-mindedness and self-expression.”
The current housing boom has Dallas solidly in its grip. As in many cities around the US, prices are soaring, buyers are going nuts, sellers run the show, realtors are laughing all the way to the bank, and the media are having a field day. Nationwide, the median price of existing homes, at $236,400, as the National Association of Realtors sees it, is now 2.7% higher than it was even in July 2006, the insane peak of the crazy housing bubble that blew up with such spectacular results.
Housing Bubble 2 has bloomed into full magnificence: In many cities, the median price today is far higher, not just a little higher, than it was during the prior housing bubble, and excitement is once again palpable. Buy now, or miss out forever! A buying panic has set in.
And so the July edition of D Magazine – “Making Dallas Even Better,” is its motto – had this enticing cover, sent to me by David in Texas, titled, “The Great Dallas Land Rush”:
“Dallas Real Estate 2015: The Hottest Market Ever,” the subtitle says.
That’s true for many cities, including San Francisco. The “Boom Town,” as it’s now called, is where the housing market has gone completely out of whack, with a median condo price at $1.13 million and the median house price at $1.35 million. This entails some consequences [read… The San Francisco “Housing Crisis” Gets Ugly].
The fact that Housing Bubble 2 is now even more magnificent than the prior housing bubble, even while real incomes have stagnated or declined for all but the top earners, is another sign that the Fed, in its infinite wisdom, has succeeded elegantly in pumping up nearly all asset prices to achieve its “wealth effect.” And it continues to do so, come heck or high water. It has in this ingenious manner “healed” the housing market.
But despite the current “buying panic,” the soaring prices, and all the hoopla round them, there is a fly in the ointment: overall home ownership is plunging.
The home ownership rate dropped to 63.4% in the second quarter, not seasonally adjusted, according to a new report by the Census Bureau, down 1.3 percentage points from a year ago. The lowest since 1967!
Wolf Street
The process has been accelerating, instead of slowing down. The 1.2 percentage point plunge in 2014 was the largest annual drop in the history of the data series going back to 1965. And this year is on track to match this record: the drop over the first two quarters so far amounts to 0.6 percentage points. This accelerated drop in home ownership rates coincides with a sharp increase in home prices. Go figure.
The plunge in home ownership rates has spread across all age groups, but to differing degrees. Younger households have been hit the hardest. In the age group under 35, the home ownership rate in Q2 saw a slight uptick to 34.8%, from the dismal record low of 34.6% in the prior quarter. Either a feeble ray of hope or just one of the brief upticks, as in the past, to be succeeded by more down ticks on the way to lower lows.
This chart by the Economics and Strategy folks at National Bank Financial shows the different rates of home ownership by age group. The 35-year and under group is where the first-time buyers are concentrated; and they’re being sidelined, whether they have no interest in buying, or simply don’t make enough money to buy (represented by the sharply descending solid black line, left scale). Note how the oldest age group (dotted blue line, right scale) has recently started to cave as well:
Wolf Street
The bitter irony? In the same breath, the Census Bureau also reported that the rental vacancy rate dropped to 6.8%, from 7.5% a year ago, the lowest since 1985. America is turning into a country of renters.
This chart shows the dynamics between home ownership rates (black line, left scale) and rental vacancy rates (red line, right scale) over time: they essentially rise and dive together. It makes sense on an intuitive basis: as people abandon the idea of owning a home, they turn into renters, and the rental market tightens up, and vacancy rates decline.
Wolf Street
This too has been by design, it seems. Since 2012, private equity firms bought several hundred thousand vacant single-family homes in key markets, drove up prices in the process, and started to rent them out. Thousands of smaller investors have jumped into the fray, buying homes, driving up prices, and trying to rent them out. This explains the record median home price across the country, and the totally crazy price increases in some key markets, even as regular Americans are trying to figure out how to pay for a basic roof over their heads.
This has worked out well. By every measure, rents have jumped. According to the Census Bureau’s report, the median asking rent in the US rose 6.2% from a year ago, and 17.6% since 2011. So inflation bites. But the Fed is still desperately looking for signs of inflation and simply cannot find any.
And how much have incomes risen over these years to allow renters to meet these rising rents? OK, that was a rhetorical question. We already know what has been happening to incomes.
That’s what it always boils down to in the Fed’s salvation of the economy: people who can’t afford to pay the rising rents with their stagnant or declining incomes should borrow the money to make up the difference and then spend even more on consumer goods. After us, the deluge.
The 24m2 (258 sq ft) Zoku Loft is designed as a living/working hybrid for ‘global nomads’ who typically seek temporary residence for between five days and several months. The designers add:
“In a regular hotel room or studio apartment, the bed always dominates. At Zoku, a big kitchen table serves as focal point. Use it to work across time zones, host dinner parties or gently rest your head after making a deadline. You decide. Then feel free to change your mind. The same goes for swapping the art on your walls, after which you can enjoy the view from your comfy Muuto design furniture.”
The loft has space-saving features like a retractable staircase and hide-away storage areas. It also includes a king size bed, dishwasher and commonly used home/office supplies. The first Zoku lofts are set to open in August in the eastern Canal District of Amsterdam. You can find much more information at the links below.
Seven years ago, the American home ownership “dream” was shattered when a housing bubble built on a decisively shaky foundation burst in spectacular fashion, bringing Wall Street and Main Street to their knees.
In the blink of an eye, the seemingly inexorable rise in the American home ownership rate abruptly reversed course, and by 2014, two decades of gains had disappeared and the ashes of Bill Clinton’s National Home ownership Strategy lay smoldering in the aftermath of the greatest financial collapse since the Great Depression.
In short, decades of speculative excess driven by imprudence, greed, and financial engineering and financed by the world’s demand for GSE debt had come crashing down and in relatively short order, a nation of homeowners was transformed into a nation of renters.
It wasn’t difficult to predict what would happen next.
As demand for rentals increased and PE snapped up foreclosures, rents rose, just as a subpar jobs market, a meteoric rise in student debt, tougher lending standards, and critically important demographic shifts put further pressure on home ownership rates. Now, America faces a rather dire housing predicament: buying and renting are both unaffordable. Or, as WSJ put it last month, “households are stuck between homes they can’t qualify for and rents they can’t afford.”
We’ve seen evidence of this across the country with perhaps the most telling statistic coming courtesy of The National Low Income Housing Coalition who recently noted that in no state can a minimum wage worker afford a one bedroom apartment.
In this context, Bloomberg is out with a list of 13 cities where single-family rents have risen by double-digits in just the last 12 months. Note that in Iowa, rents have risen more than 20% over the past year alone.
Landlords have been preparing to raise rents on single-family homes this year, Bloomberg reported in April. It looks like those plans are already being put into action.
The median rent for a three-bedroom single-family house increased 3.3 percent, to $1,320, during the second quarter, according to data compiled by RentRange and provided to Bloomberg by franchiser Real Property Management. Median rents are up 6.1 percent over the past 12 months. Even that kind of increase would have been welcome in 13 U.S. cities where single-family rents increased by double digits.
It’s more evidence that rising rents have affected a broad scope of Americans. Sixty percent of low-income renters spend more than 50 percent of their income on rent, according to a report in May from New York University’s Furman Center. High rents have also stretched the budgets of middle-class workers and made it harder for young professionals to launch careers and start families.
“You’re finding that people who wouldn’t have shared accommodations in the past are moving in with friends,”says Don Lawby, president of Real Property Management. “Kids are staying in their parents’ homes for longer and delaying the formation of families.”
And for those with short memories, we thought this would be an opportune time to remind you of who became America’s landlord in the wake of the crisis…
Examining the reasons to buy a house today may give us some idea where the housing market is heading in the future.
There are three reasons to buy a house:
Reason 1 – Utility
A house (any dwelling) is a shelter. It provides enjoyment, a home to raise one’s family, or just a place to watch that big screen TV. Utility is not quantifiable and it differs from household to household.
Reason 2 – Savings
If financed, a mortgage is a way of saving something every month until the mortgage is paid in full. If paid for, the savings come in the form of “owners’ equivalent rent”, which is what the census bureau uses to measure inflation in housing.
Reason 3 – Asset appreciation
At 5% appreciation per year, a $100k house today will be worth $412k in 30 years. Even a more modest 3% appreciation would result in better than a double.
Why Not to Buy a House Today
Based on the reasons above, it appears to be a slam dunk decision. Why would anyone not want to buy a house? There are three obstacles:
Obstacle 1 – Affordability
Housing, as a percentage of household income, is too expensive. A decade of ill-conceived government intervention and Federal Reserve accommodations prevented natural economic forces from driving house prices to equilibrium. As a result, not only is entry difficult, but many are struggling and are stuck in dire housing traps. Corelogic estimated that as of the 1st quarter of 2015, 10.2% of mortgages are still under water while 9.7 million households have less than 20% equity.
Obstacle 2 – High Risk
Say you are young couple that purchased a home two years ago, using minimal down financing. The wife is now pregnant and the husband has an excellent career opportunity in another city. The couple has insufficient savings and the house has not appreciated enough to facilitate a sale, which results in negative equity after selling expenses. The house can become a trap that diminishes a life time of income stream.
Obstacle 3 – “Dead zones”
Say you live in the middle of the country, in Kane County Illinois. For the privilege of living there, you pay 3% in property taxes. That is like adding 3% to a mortgage that never gets paid down. Your property would have to appreciate 3% per year just to break even. By the way, “appreciation” is unheard of in Kane County, good times or bad. There are many Kane Counties in the US. Real estate in these counties should be named something else and should not be co-mingled with other housing statistics. Employment is continuing to trend away from these areas. What is going to happen to real estate in these markets?
The Kane County court house: where real estate goes to vegetate
The factors listed above are nothing new. They provide some perspective as to where are are heading. Looking at each of the reasons and obstacles, they are all trending negatively.
The country is spending too much on housing, a luxury that is made possible by irresponsible Fed policies. 50% debt to income ratios are just insane and Ms. Yellen has the gall to call mortgage lending restrictive. Can we not see what is happening to Greece?
Mortgage backed securities held by the Federal Reserve System, a non-market central economic planning institution that is the chief instigator of house price inflation. Still growing, in spite of QE having officially ended – via Saint Louis Federal Reserve Research, click to enlarge.
Real estate is an investment that matures over time. The first few years are the toughest, until equity can be built up. With appreciation slowing, not to mention the possibility of depreciation, it is taking much longer to reach financial safety. The current base is weak, with too high a percentage of low equity and no equity ownership. The stress of a recession, or just a few years of a flat market, can impact the economy beyond expectations. The risks that might have been negligible once upon a time are much higher today. Many who purchased ten years ago are still living with the consequences of that ill-timed decision today.
By stepping back and looking at the big picture, we can see that real estate should be correcting and trending down. The reasons why our grandparents bought their homes have changed. Government intervention cannot last forever. It will change from accommodation to devastation, when they finally run out of ideas.
Conclusion
In summary, my working life had its origins in real estate and I am not trying to bite the hand that fed me. However, the reality is that the circumstances that prevailed when I entered the market are non-existent today. I seriously doubt that I would chose real estate as a career, or as an investment avenue, if I were starting over. As for buying a house, I would consider it more of a luxury as opposed to an investment, and one has to be prepared for the possibility of it being a depreciating asset, especially if one decides to move.
RealtyTrac has released its June and Midyear 2015 U.S. Home Sales Report, which shows distressed sales, cash sales and institutional investor sales in June were all down from a year ago to multi-year lows even as sales to first-time home buyers and other buyers using FHA loans increased compared to a year ago in June and reached a two-year high in the second quarter. Buyers using Federal Housing Administration (FHA) loans—typically low down payment loans utilized by first-time home buyers and other buyers without equity to bring to the closing table—accounted for 23 percent of all single family home and condo sales with financing—excluding all-cash sales—in the second quarter of 2015, up from 20 percent in the first quarter and up from 19 percent in the second quarter of 2014 to the highest share since the first quarter of 2013.
The report also shows 914,291 single family and condo sales through April 2015—the most recent month with complete sales data available—at the highest level through the first four months of a year since 2006, a nine-year high.
“As the investor-driven housing recovery faded in the first half of 2015, first-time home buyers, boomerang buyers and other traditional owner-occupant buyers started to step into the gap and pick up the slack,” said Daren Blomquist, vice president at RealtyTrac. “This is good news for sellers in many markets, providing them with strong demand from a larger pool of buyers, and U.S. sellers so far in 2015 are realizing the biggest gains in home price appreciation since 2007. In June sellers sold for above estimated market value on average for the first time in nearly two years.”
Cash buyers down nationwide, up in New York City and 20 other markets All-cash buyers accounted for 22.9 percent of all single family home and condo sales in June, down from 24.7 percent of all sales in the previous month and down from 29.1 percent of all sales in June 2014 to the lowest share of monthly cash sales nationwide since August 2008. The June cash sales share was almost half the peak of 42.1 percent in February 2011. Metros with highest share of cash sales in June were Homosassa Springs, Florida (53 percent), Naples-Marco Island, Florida (52 percent); Miami (50 percent); Sebastian-Vero Beach, Fla. (50 percent); and New York (49 percent).
“The first six months of sales in South Florida have been at a record pace. The millennials are entering the market along with many home buyers who had difficulty during the last recession while the investor market has quieted,” said Mike Pappas, CEO and president of Keyes Company, covering the South Florida market. “It is a real market with real buyers and sellers. The buyers have many lending options and are still enjoying low interest rates and many sellers are selling at their peak prices.”
In New York and 20 other markets analyzed for the report, the share of cash sales increased from a year ago, counter to the national trend. The New York metro share of cash sales increased from 40 percent in June 2014 to 49 percent in June 2015. Other markets with an increasing share of cash sales included Raleigh, North Carolina; Greenville, South Carolina; Bellingham, Washington located between Seattle and Vancouver, Canada; Knoxville, Tennessee; Providence, Rhode Island; and San Jose, Calif.
“Cash buyers have been a significant player in the Seattle housing market over the past 18 months, but the modest drop in this buyer segment doesn’t come as a surprise given the aggressive rise in home prices in recent months,” said Matthew Gardner, chief economist at Windermere Real Estate, covering the Seattle market. “Higher prices are forcing these buyers to dig deeper into their pockets and this process has started to push some out of the market. The same can be said for first time buyers; many of them are having a hard time qualifying for a loan also due to the rise in home prices in Seattle.”
Institutional investor share in June matches record low Institutional investors—entities purchasing at least 10 properties during a calendar year—accounted for 1.7 percent of all single family and condo sales in June, the same share as in May but down from 3.5 percent of all sales in June 2014. The 1.7 percent share of institutional investor sales in May and June was the lowest monthly share going back to January 2000—the earliest data is available—and was less than one-third of the monthly peak of 6.1 percent in February 2013.
Metro areas with the highest share of institutional investor sales in June 2015 were Macon, Georgia (10.2 percent); Columbia, Tenn. (9.5 percent); Memphis, Tenn. (8.7 percent); Detroit (7.8 percent); and Charlotte (5.3 percent).
Other major metros with a high percentage of institutional investor sales included Tampa (4.3 percent); Atlanta (4.0 percent); Tulsa, Oklahoma (3.9 percent); Oklahoma City (3.7 percent); and Nashville (3.7 percent).
The share of institutional investors increased from a year ago in just four markets: Detroit; Macon, Georgia; Lincoln, Nebraska; and Birmingham, Alabama.
Distressed sales drop to new record low Distressed sales—properties in the foreclosure process or bank-owned when they sold—accounted for eight percent of all single family and condo sales in June, down from 10.6 percent of all sales in May and down from 19.0 percent of all sales in June 2014 to the lowest monthly share since January 2011—the earliest that data is available. The share of distressed sales reached a monthly peak of 45.9 percent of all single family and condo sales in February 2011.
Metro areas with the highest share of distressed sales in June were Salisbury, North Carolina (30.6 percent); Gainesville, Ga. (23.8 percent); Jacksonville, N.C. (22.2 percent); Boone, N.C. (22.1 percent); and Marion, Ohio (21.9 percent).
Major metro areas with a high share of distressed sales in June included Chicago (14.7 percent); Baltimore (14.4 percent); Orlando (13.8 percent); Jacksonville, Fla. (13.6 percent); and Memphis (13.4 percent).
Markets with highest and lowest share of FHA loan purchases in first half of 2015 Nationwide, buyers using FHA loans accounted for 22 percent of all financed sales in the first half of 2015, up from 19 percent of all sales in 2014 and up from 20 percent of all sales in 2013.
Among markets with a population of 1 million or more, those with the highest share of buyers using FHA loans in the first six months of 2015 were Riverside-San Bernardino-Ontario in inland Southern California (35 percent); Las Vegas (32 percent); Oklahoma City (31 percent); Salt Lake City (30 percent); and Phoenix (29 percent).
Major markets with the lowest share of buyers using FHA loans in the first six months of 2015 were San Jose, California (7 percent); Hartford, Connecticut (10 percent); San Francisco (12 percent); Boston (12 percent); and Milwaukee (13 percent).
First-half 2015 sellers realized highest home price gains since 2007 Single family home and condo sellers in the first half of 2015 sold for an average of 13 percent above their original purchase price, the highest average percentage in home price gains realized by sellers since 2007, when it was 30 percent.
Major markets where sellers in the first half of 2015 realized the biggest average home price gains were San Jose, Calif. (41 percent); San Francisco (37 percent); Denver (29 percent); Portland (25 percent); Los Angeles (25 percent); and Seattle (20 percent).
There were six major markets where sellers in the first half of 2015 on average sold below their original purchase price: Chicago (seven percent below); Cleveland (seven percent below); Hartford, Conn. (three percent below); Jacksonville, Fla. (two percent below); St. Louis (one percent below); and Orlando (one percent below).
Homes sold in June sold above estimated market value on average Single family homes and condos in June sold for an average of $291,450 compared to an average $287,634 estimated market value for those same homes at the time of sale—a 101 percent price-to-value ratio. June was the first time since July 2013 that the national price-to-value ratio exceeded 100 percent.
Major metro areas with the highest price-to-value ratios—where homes sold the most above estimated market value—were San Francisco (106 percent); Hartford, Conn. (105 percent); Baltimore (105 percent); Rochester, N.Y. (104 percent); and Providence, R.I. (103 percent).
Other major markets with price-to-value ratios above 100 percent in June included Washington, D.C. (103 percent); Phoenix (103 percent); Sacramento (103 percent); Portland (103 percent); Seattle (102 percent); San Jose (102 percent); and St. Louis (102 percent).
Sales volume at highest level since 2006 in 16 percent of markets analyzed The number of single family homes and condos sold in the first four months of 2015 were at the highest level in the first four months of any year since 2006 in 43 out of 264 (16 percent) metropolitan statistical areas with sufficient home sales data. Markets at nine-year highs included Tampa; Denver; Columbus, Ohio; Jacksonville, Fla. and San Antonio.
There were 23 markets where sales volume in the first four months of 2015 was at 10-year highs, including Denver; Columbus, Ohio; San Antonio; Tucson, Ariz.; and Palm Bay-Melbourne-Titusville, Fla.
Among major metro areas with a population of one million or more, 22 out of 51 markets (43 percent) were at eight-year highs for single family home and condo sales in the first four months of the 2015, including New York, Dallas, Houston, Seattle and Portland.
New York City, Los Angeles, Honolulu: They’re all places you would think would be popular destinations for Americans. So it might come as a surprise that these are among the cities U.S. residents are fleeing in droves.
The map below shows the 20 metropolitan areas that lost the greatest share of local people to other parts of the country between July 2013 and July 2014, according to a Bloomberg News analysis of U.S. Census Bureau data. The New York City area ranked 2nd, losing about a net 163,000 U.S. residents, closely followed by a couple surrounding suburbs in Connecticut. Honolulu ranked fourth and Los Angeles ranked 14th. The Bloomberg calculations looked at the 100 most populous U.S. metropolitan areas.
Interestingly, these are also the cities with some of the highest net inflows of people from outside the country. That gives many of these cities a steadily growing population, despite the net exodus of people moving within the U.S.
So what’s going on here? Michael Stoll, a professor of public policy and urban planning at the University of California Los Angeles, has an idea. Soaring home prices are pushing local residents out and scaring away potential new ones from other parts of the country, he said. (Everyone knows how unaffordable the Manhattan area has become.)
And as Americans leave, people from abroad move in to these bustling cities to fill the vacant low-skilled jobs. They are able to do so by living in what Stoll calls “creative housing arrangements” in which they pack six to eight individuals, or two to four families, into one apartment or home. It’s an arrangement that most Americans just aren’t willing to pursue, and even many immigrants decide it’s not for them as time goes by, he said.
In addition, the growing demand for high-skilled workers, especially in the technology industry, brought foreigners who possess those skills to the U.S. They are compensated appropriately and can afford to live in these high-cost areas, just like Americans who hold similar positions. One example is Washington, D.C., which had a lot of people from abroad arriving to soak up jobs in the growing tech-hub, Stoll said.
Other areas weren’t so lucky. Take some of the Rust Belt cities that experienced fast drops in their American populations, like Cleveland, Dayton and Toledo, even though they are relatively inexpensive places to live. These cities didn’t get enough international migrants to make up for the those who left, a reflection of the fact that locals were probably leaving out of a lack of jobs.
This is part of a multiple-decade trend of the U.S. population moving away from these manufacturing hubs to areas in the Sun Belt and the Pacific Northwest, Stoll said. Retiring baby boomers are also leaving the Northeast and migrating to more affordable places with better climates.
This explains why the majority of metropolitan areas in Florida and Texas, as well as west-coast cities like Portland, had an influx of people.
El Paso, Texas, the city that residents fled from at the fastest pace, also saw a surprisingly small number of foreigners settling in given how close it is to Mexico.
“A lot of young, reasonably educated people are having a hard time finding work there,” Stoll said. “They’re not staying in town after they graduate,” leaving for the faster-growing economies of neighboring metro areas like Dallas and Austin, he said.
Methodology: Bloomberg ranked 100 of the most populous U.S. metropolitan areas based on their net domestic migration rates, from July 1, 2013 to July 1, 2014, as a percentage of total population as of July 2013. Domestic migration refers to people moving within the country (e.g. someone moving from New York City to San Francisco). A negative rate indicates more people leaving than coming in. International migration refers to a local resident leaving for a foreign country or someone from outside the U.S. moving into the U.S.
WASHINGTON (AP) — Americans bought homes in June at the fastest rate in over eight years, pushing prices to record highs as buyer demand has eclipsed the availability of houses on the market.
The National Association of Realtors said Wednesday that sales of existing homes climbed 3.2 percent last month to a seasonally adjusted annual rate of 5.49 million, the highest rate since February 2007. Sales have jumped 9.6 percent over the past 12 months, while the number of listings has risen just 0.4 percent.
Median home prices climbed 6.5 percent over the past 12 months to $236,400, the highest level reported by the Realtors not adjusted for inflation.
Home-buying has recently surged as more buyers are flooding into the real estate market. Robust hiring over the past 21 months and an economic recovery now in its sixth year have enabled more Americans to set aside money for a down payment. But the rising demand has failed to draw more sellers into the market, causing tight inventories and escalating prices that could cap sales growth.
“The recent pace can’t be sustained, but it points clearly to upside potential,” said Ian Shepherdson, chief economist at Pantheon Macroeconomics.
A mere five months’ supply of homes was on the market in June, compared to 5.5 months a year ago and an average of six months in a healthy market.
Some markets are barely adding any listings. The condominium market in Massachusetts contains just 1.8 months’ supply, according to a Federal Reserve report this month. The majority of real estate agents in the Atlanta Fed region – which ranges from Alabama to Florida- said that inventories were flat or falling over the past year.
Some of the recent sales burst appears to come from the prospect of low mortgage rates beginning to rise as the Federal Reserve considers raising a key interest rate from its near-zero level later this year. That possibility is prompting buyers to finalize sales before higher rates make borrowing costs prohibitively expensive, noted Daren Blomquist, a vice president at RealtyTrac, a housing analytics firm.
The premiums that the Federal Housing Administration charges to insure mortgages are also lower this year, further fueling buying activity, Blomquist said.
It’s also possible that home buyers are checking the market for listings more aggressively, making it possible for them to act fast with offers despite the lack of new inventory.
“Buyers can more quickly be alerted of new listings and also more conveniently access real estate data to help them pre-search a potential purchase before they even step foot in the property,” Blomquist said. “That may mean we don’t need such a large supply of inventory to feed growing sales.”
Properties typically sold last month in 34 days, the shortest time since the Realtors began tracking the figure in May 2011. There were fewer all-cash, individual investor and distressed home sales in the market, as more traditional buyers have returned.
Sales improved in all four geographical regions: Northeast, Midwest, South and West.
Still, the limited supplies could eventually prove to be a drag on sales growth in the coming months.
Ever rising home values are stretching the budgets of first-time buyers and owners looking to upgrade. As homes become less affordable, the current demand will likely taper off.
Home prices have increased nearly four times faster than wages, as average hourly earnings have risen just 2 percent over the past 12 months to $24.95 an hour, according to the Labor Department.
Some buyers are also bristling at the few available options on the market. Tony Smith, a Charlotte, North Carolina real estate broker, said some renters shopping for homes are now choosing instead to re-sign their leases and wait until a better selection of properties comes onto the market.
New construction has yet to satisfy rising demand, as builders are increasingly focused on the growing rental market.
Approved building permits rose increased 7.4 percent to an annual rate of 1.34 million in June, the highest level since July 2007, the Commerce Department said last week. Almost all of the gains came for apartment complexes, while permits for houses last month rose only 0.9 percent.
The share of Americans owning homes has fallen this year to a seasonally adjusted 63.8 percent, the lowest level since 1989.
Real estate had until recently lagged much of the six-year rebound from the recession, hobbled by the wave of foreclosures that came after the burst housing bubble.
But the job market found new traction in early 2014. Employers added 3.1 million jobs last year and are on pace to add 2.5 million jobs this year. As millions more Americans have found work, their new paychecks are increasingly going to housing, both in terms of renting and owning.
Low mortgage rates have also helped, although rates are now starting to climb to levels that could slow buying activity.
Average 30-year fixed rates were 4.09 percent last week, according to the mortgage giant Freddie Mac. The average has risen from a 52-week low of 3.59 percent.
Not buying a home right now will cost you, because home prices and interest rates are going to rise. Many renters would like to own, but they can’t afford down payments or don’t qualify for mortgages. Those two conclusions, drawn from separate reports released this week, sum up the housing market dilemma for many young professionals: Buyers get more for their money than renters—but most renters can’t afford to enter the home buying market.
The chart below comes from data published today by realtor.com that estimates the financial benefits of buying a home based on projected increases in mortgage rates and home prices in local housing markets. Specifically, it shows the amount that buyers gain, over a 30-year period, over renters in the country’s largest metropolitan areas.
The penalties for waiting to buy tend to be greater in smaller metro areas, especially in California. For example, the estimated cost of waiting one year was $61,805 in San Jose and $65,780 in Santa Cruz. Over the course of 30 years, homeowners save more than $1 million in Santa Cruz, the largest amount of any U.S. city.
To compile those numbers, realtor.com compared median home prices and the cost of renting a three-bedroom home in 382 local markets, then factored in estimates for transaction costs, price appreciation, future mortgage rates, and interest earned on any money renters saved when it was cheaper to rent.
In other words, researchers went to a lot of trouble to quantify something that renters intuitively know: They would probably be better off if they could come up with the money to buy. Eighty-one percent of renters said they would prefer to own but can’t afford it, according to a new report on Americans’ economic well-being published by the Federal Reserve.
Not all markets favor buyers over renters. In Dallas, the benefit of buying was about $800 over 30 years, according to realtor.com’s model, which expects price appreciation to regress to historical norms. In many popular markets, though, there are greater benefits to owning.
“It shouldn’t be a surprise that the places where you can have the highest reward over time also have the highest prices,” said Jonathan Smoke, chief economist for realtor.com. “It’s not true that if you’re a median-income household, that you can’t find a home that’s affordable, but in places like San Jose and Santa Cruz, less than 10 percent of inventory would be affordable.”
Or as Logan Mohtashami, a senior loan officer at AMC Lending Group in Irvine, Calif., told Bloomberg Radio this week: “The rich have no problem buying homes.”
The tale of this otherwise humble two-story home selling for more than $1.2 million has gone viral and has much of the real-estate chattering class talking.
“This is not a joke,” wrote SFist’s Jay Barmann. “[T]his is the world we live in.” He called the 1907 four-bedroom, two-bath Craftsman home “ramshackle.” A “total disaster,” chimed in Tracy Elsen, a real-estate blogger in San Francisco.
Indeed, it might not look like much from the outside or on the inside, but where it is — 1644 Great Highway, San Francisco, CA, 94122 — is where it is.
The 1,832-square-foot house, listed on Redfin.com as a “contractor’s special” in a “deteriorative state” that “needs everything,” just sold, on March 24, for a whopping $1.21 million in cash (or $660 a square foot) after being listed in February for $799,000 (a premium of $411,000). At that per-square-foot price, this house, on San Francisco’s often-chilly western fringe, was more expensive than the going rates in Boston, Washington and New York.
The home, even though it has been gutted, has an unobstructed view of the Pacific Ocean and sits a short walk across San Francisco’s Great Highway to the beach, and it is just five blocks from San Francisco’s famed Golden Gate Park. Oh, and it’s got off-street parking, not a small thing in the City by the Bay.
The house sold for $340,000 in August of 1997 and was sold for $935,000 in June of 2008, when it looked a lot better.
A minimalist museum and a literary landmark
Since then, the house has taken a pounding. Many of the Craftsman-era fixtures common to Bay Area homes, including stained glass and Tiffany-style lamps, have been ripped out, as have most of the fixtures and carpeting and, evidently, the outdoor hot tub that was listed in 2008 but not mentioned in the 2015 listing. A second-story deck in the front of the house with a view of the ocean remains, but it is badly weathered, as is the forest-green paint, in sharp contrast with the careful upkeep evident in 2008.
But some of what made this home a gem in 2008 remains intact, including its picture windows, its decked garden, the fireplaces with wood mantels, the built-in cabinets common to Craftsman homes, the wainscoting and a gas O’Keefe & Merritt stove that dates back to the late 1940s or early 1950s (collector’s items that are prized by many homeowners in the Bay Area).
And given the fact that San Francisco’s median home price recently hit $1 million, and that it rose 10% between February 2014 and February 2015 and is expected to gain another 4.3% through February 2016, the price for this house, on this lot, might just prove to be a bargain.
A $24 billion sea of red ink has millions of Americans in vulnerable flood zones, including homeowners still struggling to recover from Superstorm Sandy, facing steep increases in flood insurance premiums.
New legislation that went into effect this month — the second time in two years Congress has tweaked the troubled National Flood Insurance Program — allows rate increases of up to 18 percent.
“This appears to be death by a thousand cuts,'” said Scott Primiano, an Amityville, New York, insurance broker who has been holding seminars for clients to explain the new legislation. “The concept sounds good, but no one can say what the full risk is. … They are going to take it in bits and pieces every year and it keeps going until Congress determines we’ve had enough.”
Federal Emergency Management Agency spokesman Rafael Lemaitre said the flood insurance program has for decades been paying out more than it took in, with the United States as a whole totaling more than $260 billion in flood-related damages between 1980 and 2013. He said the new legislation is “intended to improve the long-term sustainability of the program while being sensitive to needs of policyholders.”
Lemaitre noted that a previous overhaul in 2012 had socked many policyholders with even higher rate hikes — as much as 25 percent annually.
In addition to rate increases capped at 18 percent annually for those with mortgages living in high-risk flood regions, the new legislation means all flood insurance customers nationwide will pay at least a $25 surcharge on their annual premiums. And homeowners with a “secondary residence,” such as vacation properties, will pay a $250 surcharge.
The law gives FEMA 18 months to complete a study on flood insurance affordability and up to 36 months to find a way to offer targeted assistance to policyholders who can’t afford high premiums. Congress also said FEMA should set a goal of limiting annual premiums to no more than $2,500 per year for $250,000 in coverage, but didn’t offer any suggestions on how to do that.
“Most of the 30 million homeowners have no idea that their flood insurance is going to rise,” says George Kasimos of Toms River, New Jersey, who founded the grass-roots group Stop FEMA Now after learning of increases in flood insurance premiums. “The exorbitant rise in flood insurance increases is going to make the 2007 housing bubble look like a walk in the park.”
Tom Daniels, a 66-year-old retiree from Lindenhurst, New York, said his home had 3 1/2 feet of water after Sandy struck, and received $97,000 in insurance to pay for the damage. He said his flood insurance rates are up $600 a year, and now pays more than $2,800 annually.
“I had a feeling they were going to go up,” he said. “I think I’m one of the lucky ones because I only have to pay $50 a month more. I understand that and we’re grateful for what we’ve got.”
Susan Goldstone said she is still struggling to assist her parents in their attempts to get their Oceanside, New York, home repaired after Sandy flooded up to 8 feet of their house.
“We’re still paying for flood insurance, but we’re still not back in the house,” she said. “How do they expect people to stay in their home? It’s crazy high and then you have to deal with the taxes. When does it end? There must be some other alternative.”
The hottest single-family housing markets in the nation are located across the Southwest and the South, according to the latest data released by Auction.com.
Among the nation’s 49 largest markets, Denver topped the list when it came to a combination of strong housing demand and favorable affordability coupled with a vibrant economy and demographic conditions. According to Auction.com, Denver experiences a 9.2 percent year-over-year home price growth and a 4.6 percent year-over-year home sales growth.
But why Denver, of all places?
“I’m tempted to tell you it is a Rocky Mountain high,” said Rick Sharga, executive vice president at Auction.com. And while Sharga admitted that the legalization of recreational marijuana in Colorado has helped to boost Denver’s tourism and hospitality industries, the city is enjoying a sturdy economic growth in the professional services sector. “They have exceptional job growth, about three times the national average.”
Rounding out the top 10 for the strongest markets are San Antonio, Nashville, Fort Lauderdale, Dallas, Fort Worth, Seattle, San Francisco, Phoenix and Charlotte. Conspicuously absent from the upper level of strong markets were Northeastern cities—the highest ranked on the Auction.com list was Boston in 34th place.
“We are seeing sort of the opposite of what we’re seeing in the South or Southwest,” said Sharga about the Northeast’s economic health and housing environment. “The population growth is flat or negative and there is not a lot of the job growth that we see in other markets.”
As a national whole, Sharga stated that housing has seen and hopes to see better days. “We’re off to a worse than expected start,” he said of the 2015 housing picture. “I expect a fairly healthy spring, approaching five units in sales. But we should be in the area of six units in sales.”
When Peter Jackson spotted the Alexander Farm during an aerial search of the North Island for the best possible locations to film The Lord of The Rings film trilogy, he immediately thought it was perfect for Hobbiton.
Site construction started in March 1999 and filming commenced in December that year, continuing for three months. The set was rebuilt in 2011 for the feature films “The Hobbit: An Unexpected Journey”, “The Hobbit: The Desolation of Smaug”, and “The Hobbit: There and Back Again”.
It is now a permanent attraction complete with hobbit holes, gardens, bridge, Mill and The Green Dragon Inn.
Matamata, home of the Hobbiton Movie Set, is a small agricultural town in the heart of the Waikato region, nestled at the base of the Kaimai ranges. It is about a 2 hour drive from Auckland and you can also find other nearby places and estimated travel times below:
From Hamilton: A 45-minute drive. From Rotorua: A 45-minute drive. From Taupo: One-and-a-half-hour drive. From Tauranga: 45-minute drive. From Waitomo: One-and-a-half-hour drive.
Thirty-seven hobbit holes were originally created with untreated timber, ply and polystyrene. After the 2011 rebuild, there are now 44 unique hobbit holes, the Green Dragon Pub, Mill, double arched bridge and the famous Party Tree.
The Alexanders moved to the 1250 acre (500 hectare) property, in 1978. Since then it has been farmed as a traditional New Zealand sheep and beef farm. It is still farmed the same today and is run by the brothers and their father. The property runs approximately 13,000 sheep and 300 Angus beef cattle hence the major sources of income are mutton, wool and beef. The brothers shear all the sheep on the property themselves, approximately every eight months. [source]
The home-sharing economy is heating up. Inevitably, more and more of us have been getting fleeced on fake vacation rentals.
Vacation planning often begins with excitement, optimism and nowadays the Internet. The online search leads far into a world of glossy photos, descriptive blurbs and, of course, countless promises of customer satisfaction. Even if you’re not inclined to rent a stranger’s house, you may find that for the most popular destinations, traditional hotels are booked or inadequate. So renting a vacation home is a natural alternative. According to the Vacation Rental Managers Association, 24 percent of leisure travelers report having stayed in a vacation home, up from around 11 percent in 2008.
Before the Internet, the search for a private vacation rental was slow and impractical. It involved trading a lot of phone calls, mailing printed packages and coordinating to solve all kinds of problems. Hoteliers like Marriott, Hilton and Hyatt Hotels built empires based on the wealthy traveler’s desire for luxury and reticence to deal with this process.
Then along came online portals like VRBO, Airbnb and Craigslist. All of a sudden, we’re in the mood to share.
For the most part, the rise of all of this house sharing has been positive. Sophisticated channels like Airbnb and HomeAway try especially hard to protect renters by providing secure payment, user comments and star ratings. But even they are not immune from deceit.
Vacation rental scams come in many different forms. Some Web portals are run by technologists with no connection to the actual real estate. Through smart search engine optimization, these sites attract users, and then sell the lead to the true agent, who offsets the cost with higher rent.
The worst rip-offs seduce would-be vacationers with fabulous pictures of fictitious properties. Once the renter is hooked, the phony landlord collects an up-front “security deposit” and runs for the hills. Victims are left unaware they’ve been cheated until weeks later, when they show up at the address with their luggage in hand.
Other variations on the scam are only slightly less fraudulent. Some fakes use the bait-and-switch method by showing unavailable properties, only to divert the renter to another, less desirable spot. Other tricksters may double-book a property, then send whichever vacationer arrives last to a second-rate backup, along with sincere apologies.
You’re too sharp to be ensnared in any of these scams, right? Real estate is my business, so I used to believe the same thing. Then I tried renting a vacation home in Aspen, Colorado, for a summer holiday.
I found many remarkable online listings — only to discover after contacting their presumed representatives that the properties were always booked. After many failed tries and long phone calls I realized I was being conned. I stopped browsing and hired a high-quality local real estate broker to show me real listings.
My experience could have been worse — some friends from Germany were recently snared here in Miami. Fortunately, they insisted on withholding their security deposit from their seemingly delightful contact until after completing a property inspection. Still, she pressured these visitors to wire funds — right up to the time they were driving to the property after their long flight. Having stood their ground, they arrived at the home, which appeared exactly as it did online. Unfortunately, it was occupied by its unsuspecting owner — who had no intention to rent. Of course, my friends never again succeeded in connecting with their agent and had to scramble to locate a hotel room.
Why aren’t authorities cracking down? Perhaps because the dollar figures involved in each case simply aren’t enough to justify an intercontinental examination. The victims, by definition, don’t live anywhere near the jurisdiction of the reported crime. Most often, the crooks don’t either.
So how do you protect yourself? Here’s a list of 10 ways to combat this scam:
Don’t be fooled by photography. In particular, be wary of the nicest-looking, most Photoshopped property photos. Ask the owner for additional photos — an honest lessor will always have them. Or ask your agent to use technology like FaceTime or Skype to show you the property live. At the very least, use GoogleGOOG-0.11% Earth and Google’s Street View feature to confirm that the property you’re renting actually exists at the address advertised. You can also use those Google tools to get an unvarnished look at the property’s exterior.
Be careful of the cheapest properties. If prices seem too good to be true, they probably are. If you don’t have a feel for what a reasonable price is in an area, get one. Scammers often go after people who aren’t that savvy. And drive a hard bargain — not just to get a better deal, but also to detect odd behavior from the other party.
Never pay with cash. The preferred methods of payment among criminals are cash and cash-transfer services like MoneyGram and Western UnionWU0%. Use a credit card instead — Visa, MasterCard and American Express will all allow you to recover money you lose to fraud. Reputable sites like Airbnb will hold your security funds in escrow. They play middleman, making sure you’ve put the funds in place before you get keys. (Some portals offer insurance against fraud — but it’s expensive and may not cover much; read the policy closely.)
Use a trusted local agent. Yes, you should expect to pay them. But they can show you bona fide listings or go look at the properties that you’ve seen on the Internet for you. Be sure to check their license.
Confirm legitimacy. For ownership and all documents, confirm that the owner’s name on the lease is the same as the one shown on public property appraiser records. Then have a lawyer review the lease, just like you would a full-year agreement.
Read the comments. The feedback from previous renters that appears on sites like Airbnb and VRBO is invaluable. And in some cases, you’re even allowed to pose questions to other users.
Trust your instincts. If you apply some skepticism to the process, you’re more likely to see red flags. You’re also more likely to catch suspicious behavior. My Germans looked back after their experience and realized their phony realty agent had exhibited all kinds of weird tics. They were so excited about their trip to Miami that they failed to pick up on them.
Take your time. No need to rush. For long vacations, consider going ahead of time to check out the property, or not renting a house for the first week — stay at a hotel for a few nights. It will give you an opportunity to see the property you’re renting in person before turning over your security deposit.
Be a regular. If you rent a home you like, stick with it. You’ll develop a relationship with the owner if you go back to the same place year in, year out — and avoid the risk of being scammed on a new property. If you’re traveling to a new place, try to find a friend who lives there and will give you honest feedback on potential rentals, good neighborhoods, etc.
Beware group think. If you’re vacationing with a half-dozen other people, everybody tends to figure that somebody else is paying attention to the details and making sure the group isn’t getting ripped off. Then, when the amazing six-bedroom place you all rented together is nowhere to be found and your security deposit evaporates, everybody’s pointing fingers.
Consumer demand for housing has dropped to its lowest recorded level due to reduced confidence in financial security and income raises, a new survey from Fannie Mae says.
The government-sponsored enterprise’s March national housing survey found that 41% of Americans expect their financial situation to improve over the next year, and 22% said their income had increased substantially over the last year.
Most importantly, the percentage of respondents who said they planned to buy a home dropped five basis points to 60%, an all-time survey low.
“We’ve seen modest improvement in total compensation resulting from a strengthened labor market,” Fannie Mae chief economist Doug Duncan said in a release.
“However, income growth perceptions and personal financial expectations both eased off of recent highs, consistent with Friday’s weak jobs report. Simultaneously, the share of consumers expecting to buy on their next move has declined. Meanwhile, the wait for housing expansion continues.”
Does anyone actually like cold calling? I’m definitely not a natural cold caller. And I’m assuming there are a fair number of you out there who would rather generate listings through other methods. So, I’m focusing on providing the best tactics for you get more listings, listing leads, and ultimately more money all without you having to do cold calling.
This is a slightly taboo topic but presents a great opportunity for agents looking for listings. Did you know that most judges mandate that couples sell their current property? This is part of the reason for the huge number of divorcees that list their homes each year!
Over 31% of people going through a divorce will list their home within 6 months of filing for their divorce. This gives you a huge opportunity! Not only can you list their property, but you can garner two buyers from the transaction.
If 31% of people going through a divorce end up selling their home and there are 1.2 million divorces in the United States a year, that means over 300,000 people list their home within 6 months of filing.
That’s a lot of transactions in a very short period of time! And a list of VERY motivated sellers.
There is very little competition for being the divorce listings expert! You can easily setup Facebook ads like this that target these home sellers:
And then use landing pages to collect their contact information:
This method will make you the divorce listings expert in no time! You should even place a section on your website or blog about this topic to start collecting leads.
2) Inherited Homes
Did you know that over 1 million people inherit a home every year? That’s an amazing opportunity for agents!
Think about it, would you want to move into a home that you recently inherited? Probably not. It might not be in the right location. Maybe it needs too many repairs. A huge majority of these new homeowners end up selling the property.
You need to target these people! And here’s how:
1) You’ll first want to find an online search for all the local cases in your county. This is typically held on a “county clerk’s” website. And you are looking for cases in regards to “inheritance.” A simple Google search will do the trick:
Then, you’ll have access to search public data and records. You should be able to secure the name of the former property owner. At this point, you head over to YellowPages and click “Search People.” Enter the person’s name into the form:
You should be able to find the address of the property that was recently inherited. Now, simply prospect away!
Do you mail FSBO’s? I’m sure a lot of you answered yes to that question. But how many of you have a pre-thought out series of mailers that you send once every 4-7 days? The percentage of realtors that follow up with their mailer is very small. In fact, over 65% of sales people never follow up with a marketing idea.
That’s bad. It takes between 5 and 12 points of contact for someone to be interested in doing business with you. You have to nurture these people along and get them warm to the idea of doing business with you. One way of doing this is sending FSBO’s a series of mailers. How many pain points does the typical prospecting session for FSBO’s contain? It’s usually 3-7 different pain points! You can think of 5 different things you’d like to explain to a FSBO, write them out in letter format, and then mail them to the home owner.
The marketing costs for this are incredibly low! Maybe 5 stamps, a Real Estate Logo, and some paper? The thing with FSBO’s is that they’ve probably been burned by a realtor before. So, you’re instantly standing out from the crowd by being the most persistent person out there.
I can’t stress enough the value of following up with your marketing actions. This is the key to experiencing great success in real estate.
4) Vacant Homes
The US Census Bureau shows that there were 104 million vacant homes at the end of the 1st quarter in 2014. By the end of the second quarter, there were only 93.2 million vacant homes. By the end of the third quarter, 96.1 vacant homes. And by the end of the fourth quarter, 94.5 vacant homes.
That’s a lot of transactions taking place!
If I were a realtor, I’d hire an admin or local college student to help prospect vacant homes. You can pay them hourly or work out a commission based arrangement for finding properties. This way, you save your time while still being the first realtor to find the vacant properties! Once you find them, it’s just a matter of time before the previous homeowner wants to sell.
You can use your local county clerk’s website to prospect for homes that might be vacant.
5) Look Into Property Taxes
Speaking of the county clerk’s website again, you can research homes that are behind in paying their property taxes while you are there! These houses give you an enormous opportunity! Did you know that over 23% of homes that are sold in any given year have some type of back tax to pay?
The fact that this many sellers are behind on property taxes is a critical determining factor in finding motivated sellers! You can prospect for these buyers in several ways.
1) Launch a niche SEO Campaign for keywords related to property taxes and selling your home. Look at this:
2) Start advertising online: Google Adwords and Facebook ads are very expensive if you target: Dallas Homes For Sale. But if you’re targeting “Sell A Home Quickly In Dallas Due To Taxes” there is a lot less competition!
3) Mail Individuals You Find On The Clerk’s Website: You can create a series of mailers you send to people who are behind on their taxes!
6) Partner With Small Local Banks Or Small Builders
Finally, you aren’t in this battle alone! Small local banks, builders, mortgage providers, plumbers, electricians, marriage counselors, dentists, etc., etc., etc. are all looking for business just like you. They are entrepreneurs looking to grow their businesses. And most of them probably wouldn’t mind a realtor giving them referrals. Why not start with the YellowPages and find a business in each major category to be your recommended provider?
Now, this won’t help you if you just spend 1 hour once talking with that person. Be sure to put them into your CRM, and follow up with them every month. Maybe even get coffee with them once a month. Figure out concrete ways for the two of you to work together! Incorporate this spirit of working together into your entire real estate brand and real estate slogans.
In “Underwater Homeowners Here To Stay” we highlighted a report from Zillow which showed that negative equity has now become a permanent fixture of the US housing market. The report also showed that the percentage of homeowners who are underwater was flat from Q314 to Q414, breaking a string of 10 consecutive quarters of declines. We also recently noted that a completely ridiculous new home sales print that defied all logic notwithstanding, housing data, including starts and existing home sales, has come in below expectations. On a side note, home price appreciation has outpaced wage growth at a rate of 13:1, to which we would add:
Of course, the biggest determinant of home price appreciation over the past 2 years has nothing to do with US consumers, or household formation, as confirmed by the collapse in first-time home buyers or the unprecedented depression in new mortgage origination, and everything to do with what we first suggested is one of the main drivers of the US housing bubble – foreigners parking their illegally procured cash in the US and evading taxes, now that US housing, with the NAR’s anti-money laundering exemption blessing, is the new normal’s Swiss Bank Account. That and flipping homes from one “all-cash” buyer to another “all-cash” buyer in hopes of a quick capital appreciation and the constant presence of the proverbial dumb money.
Against this backdrop, Deutsche Bank is out predicting that a sluggish US housing market is likely to impact the supply of MBS going forward. As DB notes, housing isn’t the GDP contributor it once was and not by a long shot. Not only that, but when it comes to recoveries, the housing market’s GDP contribution was 7 times below its post WW2 average in year one and has fared even worse since. Here’s DB with more:
The contribution of housing to US GDP continues to run at some of the lowest levels since the end of World War II. New construction of single- and multi-family homes, renovations, broker fees and the like still only make up a bit more than 3% of current GDP, well below the post-war average of 4.7%. Not only has the level of lift from housing come in low, but it has bounced out of the last official recession slowly, too. Housing on average has contributed a half a percentage point to GDP a year after the end of every post-war US recession. This time around, housing added only 7 bp. And the contribution of housing in the second and third years after the recent recession also has fallen well below post-war averages.And while “insufficient supply” (not enough homes) was cited as a possible contributor to the existing home sales miss, DB notes that at least as of today, there appears to still be a “supply hangover” (although it’s waning):
US home ownership started the decade at 66.9%, peaked in 2004 at 69.2% and ended at 66.5%. It has since dropped to 64.0%. The exodus of owners initially threatened to leave a lot of extra houses behind and reduce the need to build new ones. But investors have come in to pick up the keys, and many houses have found a new home in the market for single-family rentals. This has helped reduce the supply of distressed homes, although it’s still higher than the levels that prevailed in the early 1990s when homeownership last ranged around 64% . The supply hangover isn’t done but should be in the next two or three years.
And demand isn’t looking so hot either:
Demand has likely played a part in slow housing, too, starting with owners that bought their homes in the last decade. Thanks to a 38% drop in home prices nationally from 2006 to 2012, according to Case-Shiller, a lot of those owners walked out the front door without any equity and without the ability to reenter the market as buyers. This has almost certainly contributed to the drop in rental unit vacancies from 10.6% in mid-2009 to 7.0% today. As for potential new owners, Americans, even before the crisis, started moving into their own place at a much slower pace than the long-term average of 1.2 million new households a year, that is, until recently. Demand from former and potential new owners has been soft.
Even in the best case scenario is which supply falls and demand rises, banks’ reluctance to lend could end up hobbling the market for the foreseeable future.
Although the market seems to be clearing out the lingering housing supply and the economy and the labor market look likely to repair demand, the availability of credit could prove to be the lasting constraint. Today’s lending standards reflect limits designed to keep the last decade’s boom and bust from happening again. Borrowers today without the ability to repay will not get a loan. But it looks like some borrowers with the ability to repay—but with low FICO scores or with needs that keep them outside the agency or prime jumbo markets—will also not get a loan. The market is reducing risk today to avoid risk tomorrow. But it also is likely reducing housing growth today to avoid a downturn tomorrow.
And here’s further confirmation of this from BofAML:
So there is your housing recovery in a nutshell: supply hangover, lackluster demand, and reluctant lenders all coalescing in a housing market whose contribution to US economic growth is virtually nonexistent.
And if you’re looking for the next shoe to drop, here’s a hint:
It’s only natural to make hypothetical plans for fortifying your home—just in case the human dead rise from their graves and wander the earth, feasting on the flesh of the living. Totally normal.
OK, it’s not all that normal, but it’s fun. But of course your spouse is freaking out when he or she sees you drawing up blueprints for a moat surrounding your house. And he or she has a good point: How much would zombie fortifications cost? And what would they do for the value of your home?
Well, let’s take a look. We’ll consider the most critical zombie-proofing improvements you can make for your home, keeping in mind that CONOP 8888, the Pentagon’s zombie-invasion plan (seriously, it made a zombie-invasion plan—don’t worry, more as a thought exercise than for fear of an actual undead uprising … we hope), estimates that any zombie outbreak wouldn’t last more than 40 days. We’re also assuming that we’re dealing with slow, dumb “classic” George Romero-type zombies, rather than fast Danny Boyle-style zombies.
Doors
The first thing you’re going to want to do to shore up your zombie defenses is to strengthen the most obvious points of entry: outside doors. At the lowest end of the scale, you can follow the lead of 99% of your zombie-movie victims and board up your doors with a series of two-by-fours, four-by-eight sheets of plywood, and long nails, essentially barricading yourself inside your home till the cavalry comes. That’ll set you back little more than the cost of a nail gun, wood, and nails ($200–$300), and it’s not a permanent addition to the house, so you won’t affect the price of the home—unless you’re really horrible at using a nail gun. The downside is that your defenses will be as strong as your carpentry, and as soon as that first zombie gets its fingers into a weak point, your entire home is compromised.
An intermediate step is a security bar or security gate on the doors, which is a permanent addition to the home that frees you up to spend your first zombie-outbreak hours on quickie weapons training and other pressing needs instead of noisily hammering a bunch of wood planks to the walls. Security bars and security gates can run anywhere from $100 to several thousand dollars before installation costs (you’ll want to get them professionally installed, so that they’re anchored securely), and they probably won’t affect the value of your home for good or ill. But, as the inimitable zombie expert Max Brooks points out in “The Zombie Survival Guide,” “Experience has shown that as few as three walking dead can tear them down in less than twenty-four hours.”
Your best bet, and not necessarily your most expensive, is installing high-end steel doors at entry points, with steel frames and heavy-duty locks (remember to get secure bolt-style locks for the bottom of the door, too). A big plus is that steel doors generally run cheaper than wooden doors. But they tend to show more wear and need to be replaced more often, because they don’t weather the elements well (the salt air of homes near the oceans, for example, can quickly corrode steel doors). Expect the cost of an exterior steel door, with installation fees, to start at about $500 at the lowest end. But this may be the easiest zombie-proofing improvement to sell to a more practical-minded spouse: According to remodeling.hw.net, which tracks the cost of home improvements vs. their resale value, replacing an existing front door with a midrange 20-gauge steel door is worth 117% more than the money you put into it (an average cost of $1,230 vs. an average value of $1,446).
Windows
For some reason, Hollywood zombies seem to prefer trying to get to living people through the windows rather than the front door. Hollywood heroes tend to respond by dragging flimsy furniture in front of the bay windows and then hoping for the best. But you can do better!
If you want to keep things as cheap as possible, go the two-by-four route again. Assuming you already bought a nail gun for the door and still have a bucket of nails to dig into, you’ll have only to shell out for a few more two-by-fours for first-floor and basement windows—a couple of bucks per plank, or $15 or so for a four-by-eight sheet of 5/8-inch plywood. Reinforcing all the windows of, say a six-window first floor might run as little as $100.
A better, but vastly more expensive, bet would be to install hurricane shutters on all your first-floor windows—essentially the same kind of roll-down steel gates that city shopkeepers pull down to secure their stores at the end of the night. They’re easy to operate, offer the best protection for existing windows against both zombies and storms, and, depending on where you live, could greatly increase the value of your home.
“In a place like Florida, which sees a lot of storms, hurricane shutters would be very positive,” says Bill Lublin, CEO of Century 21 Advantage Gold. “And they roll up and go out of the way, so even in the Northeast, you’d probably see some slight improvement, or they’d be revenue-neutral.”
The downside? Price. Hurricane shutters cost a pretty penny—around $55 per square foot.
Rooftop and basement defenses
If you’ve watched any zombie movie, you know you’ll be spending a lot of your time waiting out the undead apocalypse on rooftops and in basements. So it makes sense that you prepare by getting those two locations shipshape now.
Rooftops are an ideal location to serve as a lookout for incoming zombie hordes, as a sniper’s nest for reanimated attackers, and to enjoy sunshine in relative safety—classic zombies aren’t big climbers, after all. The roof could easily end up being your command-and-control headquarters. All you really need to make your roof a usable perch is some cushions from the couch, a thermos of coffee, and an extra ladder that you can use to escape in case the house itself is compromised (a two-story escape ladder runs about $60).
But, if you don’t already have one, a roof deck could be a much more comfortable and functional space. First, check with your local zoning laws about whether you’re allowed to put up a roof deck. Then make sure your house can actually support a deck up there—a deck isn’t going to do much good if all it does is add a gaping hole to your roof. From that point, you should count on a roof deck running you at least $3,000 (depending on the materials you use, size, and circumstances of your home) and likely more in the $10,000 range or higher (keep in mind that you might have to put in stairs and pay for an additional safety assessment). The great thing about roof decks, though, is that they can be great for property value.
“If you’re down the Jersey shore and you’ve got a rooftop view of the ocean, or a skyline view of Center City, Philadelphia, a rooftop deck provides good value,” Lublin says. “If there’s good interior egress to it, it’s a great place to drop that deck.”
Though Brooks advises strongly against relying on basements (his primary advice for people besieged in houses is to get to the second floor and destroy the staircase), 40 days is a long time to spend hanging out in your sister’s bedroom. If you’re confident the windows and doors are secure, it might be worthwhile turning the basement into a place to keep not just necessary supplies but also recreational material—as long as the undead outside can’t see or hear you, of course. With a home generator and a decent library of DVDs, a finished basement can help survivors fend off cabin fever or worse till help comes—and as we all know from watching “The Walking Dead,” living human beings are their own worst enemies. Plus: excellent excuse to finally get that man cave you wanted!
“A finished basement, maybe with a nice kitchen or alternative food-preparation area and home theater with recliners and good video or audio media, would be beneficial for the zombie apocalypse and add to value,” Lublin says.
Border security
What about keeping the zombies away from your home in the first place? If you want to go full medieval, you could rent a backhoe and dig a moat that’s at least six feet deep and 10 feet wide around your home, then fill it with water. (You’d want to make sure it’s deep and steep enough that zombies can’t simply walk over one another to get to you.) Renting a full-size backhoe can cost between $200 and $350 a day, but you might consider just buying a used backhoe starting at around $7,000. That all, of course, is assuming that your town allows you to build a moat (it’s a good bet no), and not factoring in any additional costs for water bills, maintenance, the inevitable cleanup for when everyone in your area starts using it as a trash dump, and the permanent ill will of your neighbors. As for how much value a moat adds to your home, well…
“I don’t know—I’ve never sold a house with a moat,” Lublin says.
Common sense, of course, says that a gaping ring of stagnant water around your home is going to turn more home buyers off than on. Lublin says the best analogy might be with swimming pools in the North.
“Swimming pools sometimes have a negative impact on the value of a property, especially if the next person isn’t looking for one, and the geography means it’s only used so much for the year,” he says.
And remember, a moat is basically a giant, dirty swimming pool that no one wants and that no one gets to swim in, ever.
A better choice might be a much more conventional chain-link fence, as Brooks suggests: “A good ten-foot, chain-link fence can hold dozens of zombies for weeks, even months, provided their numbers remain at Class 1.” A commercial-grade chain-link fence can run around $40 a foot, which can quickly add up if you’re trying to enclose your entire home. (That’s $100,000 off the bat to cover a lot that’s 100 feet by 25 feet, for example.) And 10-foot-high chain-link fences around a house make home buyers immediately assume that there are serious security concerns in the area, making the house that much harder to sell.
Brooks recommends a steel-rod-reinforced, concrete-filled cinder-block wall if you’re concerned about more serious “Class 2″ zombie outbreaks, but it’s much pricier, and walls topping eight feet require specialized machinery—don’t be surprised if your contractor quotes you a price of at least $200 per linear foot for a wall of 10 feet or higher. Your town officials and neighbors are almost certainly going to have a problem with this, and if you think a chain-link fence is going to put off potential home buyers, imagine what a 10-foot concrete wall will make them think.
Additional improvements
A backup home generator could keep food and medical supplies from perishing, keep the lights, heat, and radios on, and help maintain sanity by letting everyone watch back seasons of “Mad Men.” And because it actually serves a genuine purpose in the real world, Lublin says it’s “a real plus” in any part of the country that’s ever experienced a blackout—which is probably all of them. Expect to pay between $3,000 and $7,000 for a natural-gas-powered backup generator for whole-home use, not including fuel and installation costs.
Inexpensive security-camera systems are now also available that can help you keep tabs on zombie lurkers at blind points around the house—or errant kids and pets when there isn’t an undead uprising going on—Nest’s Dropcams run $150 a pop and stream wirelessly to your generator-powered computer.
Ultimately, though, Lublin recommends making the improvements you want for your home regardless of the zombie situation.
“I wouldn’t spend too much time worrying about zombies, though it never does hurt to be prepared,” he says. “Consulting a Realtor® is always a good idea to ensure that an improvement is actually going to add to the value of your home.
Landlords in Venice and other tourist-friendly areas are converting units into short-term rentals, worsening the area’s housing shortage, a study says.
The last time he advertised one of his apartments, longtime Los Feliz landlord Andre LaFlamme got a request he’d never seen before.
A man wanted to rent LaFlamme’s 245-square-foot bachelor unit with hardwood floors for $875 a month, then list it himself on Airbnb.
“Thanks but no thanks,” LaFlamme told the prospective tenant. “You’ve got to be kidding me.”
But he understood why: More money might be made renting to tourists a few days at a time than to a local for 12 months or more.
About 12,700 rental units were listed on Airbnb in Los Angeles County on Dec. 22, 2014, but they were not spread out equally. In parts of Venice and Hollywood, Airbnb listings accounted for 4% or more of all housing units.
As short-term rental websites such as Airbnb explode in popularity in Southern California, a growing number of homeowners and landlords are caving to the economics. A study released Wednesday from Los Angeles Alliance for a New Economy, a labor-backed advocacy group, estimates that more than 7,000 houses and apartments have been taken off the rental market in metro Los Angeles for use as short-term rentals. In parts of tourist-friendly neighborhoods such as Venice and Hollywood, Airbnb listings account for 4% or more of all housing units, according to a Times analysis of data from Airbnb’s website.
That’s worsening a housing shortage that already makes Los Angeles one of the least affordable places to rent in the country.
“In places where vacancy is already limited and rents are already squeezing people out, this is exacerbating the problem,” said Roy Samaan, a policy analyst who wrote the alliance’s report. “There aren’t 1,000 units to give in Venice or Hollywood.”
Fast-growing Airbnb and others like it say they help cash-strapped Angelenos earn a little extra money. Airbnb estimates that 82% of its 4,500 L.A. hosts are “primary residents” of the homes they list, and that nearly half use the proceeds to help pay their rent or mortgage. And the effect on the broader housing market is so small that it’s all but irrelevant, said Tom Davidoff, a housing economist at the University of British Columbia whom Airbnb hired to study its impact.
“Over the lifetime of a lease, rents maybe go up 1.5%,” he said. “That’s peanuts relative to the increases we’ve seen in housing costs in a lot of places.”
But there are growing signs of professionalization of the short-term rental world, from property-manager middlemen like the one who e-mailed LaFlamme to Airbnb “hosts” who list dozens of properties on the site. The Los Angeles Alliance study estimates that 35% of Airbnb revenue in Southern California comes from people who list more than one unit.
“I don’t think anyone would begrudge someone renting out a spare bedroom,” Samaan said. “But there’s a whole cottage industry that’s springing up around this.”
City Council member Mike Bonin, whose coastal district includes Venice, and Council President Herb Wesson want to study how these rentals have affected the city. No regulations have been drafted, and Bonin said the council would seek extensive community input. Current rules bar short-term rentals in many residential areas of the city, but critics say they’re rarely enforced.
As city officials craft new ones, they’ll certainly be hearing from Airbnb and its allies. Last year, the company spent more than $100,000 lobbying City Hall and released a study touting its economic impact in L.A. — more than $200 million in spending by guests, supporting an estimated 2,600 jobs. A group representing short-term rental hosts has made the rounds of City Council offices as well.
This industry “needs to be regulated and regulated the right way,” said Sebastian de Kleer, co-founder of the Los Angeles Short Term Rental Alliance and owner of a Venice-based vacation rental company. “For a lot of people, this is a very new issue.”
Neighborhood groups are sure to weigh in too, especially in Venice.
The beach neighborhood has the highest concentration of Airbnb listings in all of metro Los Angeles. Data collected by Beyond Pricing, a San Francisco-based start-up that helps short-term rental hosts optimize pricing, show that in census tracts along Venice Beach and Abbott-Kinney Boulevard, Airbnb listings accounted for 6% to 7% of all housing units — about 10 times the countywide average.
A letter last fall from the Venice Neighborhood Council to city officials estimated that the number of short-term rental listings in the area had tripled in a year, citing a “Gold Rush mentality” among investors looking for a piece of the action. That’s hurting local renters, said Steve Clare, executive director of Venice Community Housing.
“Short-term rentals are really taking over a significant portion of the rental housing market in our community,” Clare said. “It’s going to further escalate rents, and take affordable housing out of Venice.”
Along the Venice boardwalk, a number of apartment buildings now advertise short-term rentals, and houses on the city’s famed “walk streets” routinely show up in searches on Airbnb. Even several blocks inland, at Lincoln Place Apartments — a 696-unit, newly renovated complex that includes a pool, gym and other tourist-friendly amenities — Roman Barrett recently counted more than 40 listings on Airbnb and other sites. Barrett, who moved out over the issue, said Airbnb effectively drives up the rent. He paid $2,700 a month for a one-bedroom; now he’s looking farther east for something he can afford.
“It’s making places like Santa Monica and Venice totally priced out. Silver Lake is impossible. I’m looking in Koreatown right now,” Barrett said. “They need to make a law about this.”
A new law of some sort is the goal at City Hall. New York, San Francisco and Portland, Ore., have crafted regulations to govern taxes, zoning and length of stay in short-term rentals, and Airbnb says it’s glad to help in that process here.
“It’s time for all of us to work together on some sensible solutions that let people share the home in which they live and contribute to their community,” spokesman Christopher Nulty said in a statement Tuesday.
Will Youngblood, the man who e-mailed LaFlamme about managing his apartment in Los Feliz, says he’d also appreciate clearer rules and an easier way to pay occupancy taxes.
Youngblood runs five Airbnb apartments, mostly in Hollywood. A former celebrity assistant, he’s been doing this for two years; it’s a full-time job. Most of Youngblood’s clients own their homes but travel a lot or live elsewhere. One, he rents and lists full time. He’s been looking around for another.
“I’m honest about what I do,” he said. “Some [landlords] are like, ‘That’s insane. No way.’ Other people say, ‘We’d love that.'”
If the city decides it doesn’t like what he’s doing, Youngblood said, he’ll go do something else. But for now, he said, it’s a good way to make some cash and meet interesting people.
But he won’t meet LaFlamme. The longtime landlord concedes he “might be old-fashioned,” but he just doesn’t like the idea of strangers traipsing through his apartments. He prefers good, long-term tenants, and in L.A.’s red-hot rental market he has no problem finding them.
“I almost find it painful to rent things these days,” he said. “There’s so much demand and so many people who are qualified and nice people who I have to turn away.”
For that apartment in Los Feliz, LaFlamme said, he found a tenant in less than 24 hours.
RealtyTrac’s Q1 2015 Zombie Foreclosure Report, found that as of the end of January 2015, 142,462 homes actively in the foreclosure process had been vacated by the homeowners prior to the bank repossessing the property, representing 25 percent of all active foreclosures.
The total number of zombie foreclosures was down 6 percent from a year ago, but the 25 percent share of total foreclosures represented by zombies was up from 21 percent a year ago.
“While the number of vacated zombie foreclosures is down from a year ago, they represent an increasing share of all foreclosures because they tend to be the problem cases still stuck in the pipeline,” said Daren Blomquist vice president at RealtyTrac. “Additionally, the states where overall foreclosure activity has been increasing over the past year — counter to the national trend — tend to be states with a longer foreclosure process more susceptible to the zombie problem.”
“In states with a bloated foreclosure process, the increase in zombie foreclosures is actually a good sign that banks and courts are finally moving forward with a resolution on these properties that may have been sitting in foreclosure limbo for years,” Blomquist continued. “In many markets there is plenty of demand from buyers and investors to snatch up these distressed properties as soon as they become available to purchase.”
Florida, New Jersey, New York have most zombie foreclosures
Despite a 35 percent decrease in zombie foreclosures compared to a year ago, Florida had the highest number of any state with 35,903 — down from 54,908 in the first quarter of 2014. Zombie foreclosures accounted for 26 percent of all foreclosures in Florida.
Zombie foreclosures increased 109 percent from a year ago in New Jersey, and the state posted the second highest total of any state with 17,983 — 23 percent of all properties in foreclosure.
New York zombie foreclosures increased 54 percent from a year ago to 16,777, the third highest state total and representing 19 percent of all residential properties in foreclosure.
Illinois had 9,358 zombie foreclosures at the end of January, down 40 percent from a year ago but still the fourth highest state total, while California had 7,370 zombie foreclosures at the end of January, up 24 percent from a year ago and the fifth highest state total.
“We are now in the final cycle of the foreclosure crisis cleanup, in which we are witnessing a large final wave of walkaways,” said Mark Hughes, Chief Operating Officer at First Team Real Estate, covering the Southern California market. “This has created an uptick in vacated or ‘zombie’ foreclosures and the intrinsic neighborhood issues most of them create.
“A much longer recovery, a largely veiled underemployment issue, and growing examples of faster bad debt forgiveness have most likely fueled this last wave of owners who have finally just walked away from their American dream,” Hughes added.
Other states among the top 10 for most zombie foreclosures were Ohio (7,360), Indiana (5,217), Pennsylvania (4,937), Maryland (3,363) and North Carolina (3,177).
“Rising home prices in Ohio are motivating lending servicers to commence foreclosure actions more quickly and with fewer workout options offered to delinquent homeowners, creating immediate vacancies earlier in the foreclosure process,” said Michael Mahon, executive vice president at HER Realtors, covering the Ohio housing markets of Cincinnati, Dayton and Columbus. “Delinquent homeowners need to understand how prices have increased in recent months, and how this increase in equity may provide positive options for them to avoid foreclosure.”
Metros with most zombie foreclosures: New York, Miami, Chicago, Tampa and Philadelphia. The greater New York metro area had by far the highest number of zombie foreclosures of any metropolitan statistical area nationwide, with 19,177 — 17 percent of all properties in foreclosure and up 73 percent from a year ago.
Zombie foreclosures decreased from a year ago in Miami, Chicago and Tampa, but the three metros still posted the second, third and fourth highest number of zombie foreclosures among metro areas nationwide: Miami had 9,580 zombie foreclosures,19 percent of all foreclosures but down 34 percent from a year ago; Chicago had 8,384 zombie foreclosures, 21 percent of all foreclosures but down 35 percent from a year ago; and Tampa had 7,838 zombie foreclosures, 34 percent of all foreclosures but down 25 percent from a year ago.
Zombie foreclosures increased 53 percent from a year ago in the Philadelphia metro area, giving it the fifth highest number of any metro nationwide in the first quarter of 2015. There were 7,554 zombie foreclosures in the Philadelphia metro area as of the end of January, 27 percent of all foreclosures.
Other metro areas among the top 10 for most zombie foreclosures were Orlando (3,718), Jacksonville, Florida (2,368), Los Angeles (2,074), Las Vegas (1,832), and Baltimore, Maryland (1,722).
Metros with highest share of zombie foreclosures: St. Louis, Portland, Las Vegas
Among metro areas with a population of 200,000 or more and at least 500 zombie foreclosures as of the end of January, those with the highest share of zombie foreclosures as a percentage of all foreclosures were St. Louis (51 percent), Portland (40 percent) and Las Vegas (36 percent).
Metros with biggest increase in zombie foreclosures: Atlantic City, Trenton, New York
Among metro areas with a population of 200,000 or more and at least 500 zombie foreclosures as of the end of January, those with the biggest year-over-year increase in zombie foreclosures were Atlantic City, New Jersey (up 133 percent), Trenton-Ewing, New Jersey (up 110 percent), and New York (up 73 percent).
It’s the great credit divide in American housing: If you buy a home and pay your mortgage on time regularly, your credit score typically benefits. If you rent an apartment and pay the landlord on time every month, you get no boost to your score. Since most landlords aren’t set up or approved to report rent payments to the national credit bureaus, their tenants’ credit scores often suffer as a direct result.
All this has huge implications for renters who hope one day to buy a house. To qualify for a mortgage, they’ll need good credit scores. Young, first-time buyers are especially vulnerable — they often have “thin” credit files with few accounts and would greatly benefit by having their rent histories included in credit reports and factored into their scores. Without a major positive such as rent payments in their files, a missed payment on a credit card or auto loan could have significant negative effects on their credit scores.
You probably know folks like these — sons, daughters, neighbors, friends. Or you may be one of the casualties of the system yourself, a renter with a perfect payment history that creditors will never see when they pull your credit. Think of it this way and the great divide gets intensely personal.
But here’s some good news: Growing numbers of landlords are now reporting rent payments to the bureaus with the help of high-tech intermediaries who set up electronic rent-collection systems for tenants.
One of these, RentTrack, says it already has coverage in thousands of rental buildings nationwide, with a total of 100,000-plus apartment units, and expects to be reporting rent payments for more than 1 million tenants within the year. Two others, ClearNow Inc. and PayYourRent, also report to one of the national bureaus, Experian, which includes the data in consumer credit files. RentTrack reports to Experian and TransUnion.
Why does this matter? Two new studies illustrate what can happen when on-time rent payments are factored into consumers’ credit reports and scores. RentTrack examined a sample of the tenants in its database and found that 100% of renters who previously were rated as “unscoreable” — there wasn’t enough information in their credit files to evaluate — became scoreable once they had two months to six months of rental payments reported to the credit bureaus.
Tenants who had scores below 650 at the start of the sampling gained an average of 29 points with the inclusion of positive monthly payment data. Overall, residents in all score brackets saw an average gain of 9 points. The scores were computed using the VantageScore model, which competes with FICO scores and uses a similar 300 to 850 scoring scale, with high scores indicating low risk of nonpayment.
Experian, the first major credit bureau to begin integrating rental payment records into credit files, also completed a major study recently. Using a sample of 20,000 tenants who live in government-subsidized apartment buildings, Experian found that 100% of unscoreable tenants became scoreable, and that 97% of them had scores in the “prime” (average 688) and “non-prime” (average 649) categories. Among tenants who had scores before the start of the research, fully 75% saw increases after the addition of positive rental information, typically 11 points or higher.
Think about what these two studies are really saying: Tenants often would score higher — sometimes significantly higher — if rent payments were reported to the national credit bureaus. Many deserve higher credit scores but don’t get them.
Matt Briggs, chief executive and founder of RentTrack, says for many tenants, their steady rent payments “may be the only major positive thing in their credit report,” so including them can be crucial when lenders pull their scores.
Justin Yung, vice president of ClearNow, told me that “for most [tenants] the rent is the largest payment they make per month and yet it doesn’t appear on their credit report” unless their landlord has signed up with one of the electronic payment firms.
Is this something difficult or complicated? Not really. You, your landlord or property manager can go to one of the three companies’ websites (RentTrack.com, ClearNow.com and PayYourRent.com), check out the procedures and request coverage. Costs to tenants are either minimal or zero, and the benefits to the landlord of having tenants pay rents electronically appear to be attractive.
43% of adults would prefer homes bigger than where they currently live, but attitudes differ by age. Baby boomers would prefer to upsize rather than downsize by only a small margin, while the gap among millennials is much wider, with GenXers falling in between. Would-be downsizers outnumber upsizers only among households living in the largest homes.
Last year, we found that Baby Boomers were especially unlikely to live in multi-unit housing. At the same time, we noted that the share of seniors living in multi-unit housing rather than single-family homes has been shrinking for decades. These findings got us thinking about how the generations vary in house-size preference. So we surveyed over 2000 people at the end of last year to figure out if boomers have different house-size preferences than their younger counterparts. And that led us to ask: What size homes do Americans really want?
Most Americans are not living in the size home they want
As a whole, Americans are living in a world of mismatch – only 40% of our respondents said they are living in the size home that’s ideal. Furthermore, over 43% answered that the size of their ideal residence is somewhat or much larger than their current digs. Only 16% told us that their ideal residence is smaller than their existing home. However, these overall figures mask what is going on within different generations.
It’s natural to think that baby boomers are the generation most likely to downsize. After all, their nests are emptying and they may move when they retire. As it turns out though, more boomers would prefer to live in a larger home than a smaller one: 21% said their ideal residence is smaller than their current home, while 26% wanted a larger home – a 5-percentage-point difference. Clearly, boomers don’t feel a massive yearn to downsize. On the contrary, just over half (53%) said they’re already living in their ideally sized home. Nonetheless, members of this generation are more likely to want to downsize than millennials and GenXers.
In fact, those younger generations want some elbow room. First, the millennials. They’re looking to move on up by a big margin: just over 60% told us their ideal residence is larger than where they live now – the largest proportion among the generations in our sample. By contrast, only a little over 13% of millennials said they’d rather have a smaller home than their existing one – which is also the smallest among the generations in our sample. The results are clear: millennials are much more likely to want to upsize than downsize.
The next generation up the ladder, the GenXers, are hitting their peak earning years and many in this group may be in a position to trade up. Many aren’t living in their ideally sized home. Just 38% said where they live now is dream sized. Nearly a majority (48%) said their dream home is larger, while only 14% of GenXers would rather have a smaller home. This is the generation that bore the brunt of the foreclosure crisis. So, some of this mismatch could be because a significant number of GenXers lost homes during the housing bust and may now be living in smaller-than-desired quarters. But a much more probable reason is that many GenXers are in their peak child-rearing years. With kids bouncing off the walls, the place may be feeling a tad crowded.
Even the groups that seem ripe for downsizing don’t want smaller homes
Of course, age doesn’t tell the whole story about why people might want to downsize. It could be that certain kinds of households, – such as those without children, and living in the suburbs or in affordable areas – might be more likely to live in larger homes than they need. But our survey shows that households in these categories are about twice as likely to want a larger than a smaller home. For those with kids especially, the desire to upsize is strong: 39% preferred a larger home versus 18% who liked a smaller home. For those living in the suburbs, the disparity is even greater – 42% to 16%. And even among those living in the most affordable zip codes, where ideally-sized homes might be within the budgets of households, 40% of our respondents preferred larger homes versus 20% who said smaller.
Are all households more likely to upsize than downsize?
At this point you might be asking, “Are there any types of households that want to downsize?” The answer is yes. But only one kind of household falls into this category – those living in homes larger than 3,200 square feet. Of this group, 26% wanted to downsize versus 25% that wanted to upsize – a slight difference. But, when we looked overall at survey responses based on the size of current residence, households wanting a larger home kicked up as current home size went down. We can see this clearly when we divide households into six groups based on the size of the home they’re living in now. Among households living in 2,600-3,200 square foot homes, 37% prefer a larger home versus 16% a smaller home; in 2,000–2,600 square foot homes, its 34% to 18%; 38% to 18% in 1,400–2,000 square foot homes; 55% to 13% in 800–1,400 square foot homes; and 66% to 13% in homes less than 800 square feet. This makes intuitive sense. Those living in the biggest homes are most likely to have gotten a home larger than their ideal size. And those in the smallest homes are probably the ones feeling most squeezed.
The responses to our survey show significantly more demand for larger homes than for smaller ones. But the reality, of course, is that households must make tradeoffs between things like accessibility, amenities, and affordability when choosing what size homes to get. The “ideal” sized home for most Americans may be larger than where they’re living now. But that spacious dream home may not be practical. As result, the mismatch between what Americans say they want and what best suits their circumstances may persist.
The March 2015 Texas Home buyers and Sellers Report from the Texas Association of Realtors shows that between July 2013 and June 2014 median household income for Texas home buyers increased 5.9 percent year-over-year compared with a national increase of only 1.4 percent.
The study shows that between July 2013 and June 2014 median household income for Texas home buyers increased 5.9 percent year-over-year compared with a national increase of only 1.4 percent. However, the percentage of first-time home buyers in Texas fell 4 points to 29 percent, compared to a 5 percent decline nationally to 33 percent.
Home buyers in Texas are also two years older compared to the previous period, edging up to 45 years of age, and 72 percent of home buyers are married, compared to 65 percent nationally.
Texans are also buying larger and newer homes than other buyers across the U.S. In Texas, the typical three-bedroom, two-bathroom home had 2,100 square feet and was built in 2002, compared to the typical national home built in 1993 with 1,870 square feet.
Forty-seven percent of first-time home buyers in Texas said that finding the right property was the most difficult step in buying a home, as did 48 percent of repeat home buyers.
For Texans selling homes, 21 percent said that the reason for selling was because of job relocation, followed by 16 percent who said that their home was too small. The median household income for a Texas home seller was $120,800, compared with a national media income of $96,700 among home sellers.
Texas home buyers (overall): July 2013 – June 2014
Median household income: +5.9% to $97,500
Percent of homes bought that were new: 28% (-1% from July 2012 – June
2013)
Percentage of first-time home buyers: 29% (-4% from July 2012 – June
2013)
Age of typical home buyer: 45 years old (+2 years from July 2012 – June 2013)
Average age of first-time home buyer: 32 years old (+1 year from July
2012 – June 2013)
Average age of repeat home buyer: 50 years old (unchanged from July 2012 – June 2013)
Median household income for first-time home buyers: +5.8% to $72,000 (compared to July 2012 – June 2013)
Median household income for repeat home buyers: -8.9% to $97,500 (compared to July 2012 – June 2013)
Percent of married home buyers: 72% (+1% from July 2012 – June 2013)
New homes purchased: 28% (-2% from July 2012 – June 2013)
Median household income for home sellers: $120,800
Age of average home seller: 49 years
National home buyers (overall): June 2013 – July 2014
Median household income: +1.4% to $84,500
Percent of homes bought that were new: 16% (constant from July 2012 – June 2013)
Percentage of first-time home buyers: 33% (-5% from July 2012 – June 2013)
Age of typical home buyer: 44 years old (+2 years from July 2012 – June
2013)
Average age of first-time home buyer: 31 years old (unchanged from July
2012 – June 2013)
Average age of repeat home buyer: 53 years old (+1 year from July 2012 – June 2013)
Median household income for first-time home buyers: +2.3% to $68,300 (compared to July 2012 – June 2013)
Median household income for repeat home buyers: -1% to $95,000 (compared to July 2012 – June 2013)
Percent of married home buyers: 65% (-1% from July 2012 – June 2013)
New homes purchased: 16% (unchanged from July 2012 – June 2013)
Stephen Schwarzman, CEO and co-founder of Blackstone Group, the world’s largest private-equity firm with $290 billion in assets under management, made $690 million for 2014 via a mix of dividends, compensation, and fund payouts, according to a regulatory filing. A 50% raise from last year.
The PE firm’s subsidiary Invitation Homes, doped with nearly free money the Fed’s policies have made available to Wall Street, has become America’s number one mega-landlord in the span of three years by buying up 46,000 vacant single-family homes in 14 metro areas, initially at a rate of $100 million per week, now reduced to $35 million per week.
As of September 30, Invitation Homes had $8.7 billion worth of homes on its balance sheet, followed by American Homes 4 Rent ($5.5 billion), Colony Financial ($3.4 billion), and Waypoint ($2.6 billion). Those are the top four. Countless smaller investors also jumped into the fray. Together they scooped up several hundred thousand single-family houses.
A “bet on America,” is what Schwarzman called the splurge two years ago.
The bet was to buy vacant homes out of foreclosure, outbidding potential homeowners who’d actually live in them, but who were hobbled by their need for mortgages in cash-only auctions. The PE firms were initially focused only on a handful of cities. Each wave of these concentrated purchases ratcheted up the prices of all other homes through the multiplier effect.
Homeowners at the time loved it as the price of their home re-soared. The effect rippled across the country and added about $7 trillion to homeowners’ wealth since 2011, doubling equity to $14 trillion.
But it pulled the rug out from under first-time buyers. Now, only the ludicrously low Fed-engineered interest rates allow regular people – the lucky ones – to buy a home at all. The rest are renting, in a world where rents are ballooning and wages are stagnating.
Thanks to the ratchet effect, whereby each PE firm helped drive up prices for the others, the top four landlords booked a 23% gain on equity so far, with Invitation Homes alone showing $523 million in gains, according to RealtyTrac. The “bet on America” has been an awesome ride.
But now what? PE firms need to exit their investments. It’s their business model. With home prices in certain markets exceeding the crazy bubble prices of 2006, it’s a great time to cash out. RealtyTrac VP Daren Blomquist told American Banker that small batches of investor-owned properties have already started to show up in the listings, and some investors might be preparing for larger liquidations.
“It is a very big concern for real estate professionals,” he said. “They are asking what the impact will be if investors liquidate directly onto the market.”
But larger firms might not dump these houses on the market unless they have to. American Banker reported that Blackstone will likely cash out of Invitation Homes by spinning it off to the public, according to “bankers close to the Industry.”
After less than two years in this business, Ellington Management Group exited by selling its portfolio of 900 houses to American Homes 4 Rent for a 26% premium over cost, after giving up on its earlier idea of an IPO. In July, Beazer Pre-Owned Rental Homes had exited the business by selling its 1,300 houses to American Homes 4 Rent, at the time still flush with cash from its IPO a year earlier.
Such portfolio sales maintain the homes as rentals. But smaller firms are more likely to cash out by putting their houses on the market, Blomquist said. And they have already started the process.
Now the industry is fretting that liquidations by investors could unravel the easy Fed-engineered gains of the last few years. Sure, it would help first-time buyers and perhaps put a halt to the plunging home ownership rates in the US [The American Dream Dissipates at Record Pace].
But the industry wants prices to rise. Period.
When large landlords start putting thousands of homes up for sale, it could get messy. It would leave tenants scrambling to find alternatives, and some might get stranded. A forest of for-sale signs would re-pop up in the very neighborhoods that these landlords had targeted during the buying binge. Each wave of selling would have the reverse ratchet effect. And the industry’s dream of forever rising prices would be threatened.
“What kind of impact will these large investors have on our communities?” wondered Rep. Mark Takano, D-California, in an email to American Banker. He represents Riverside in the Inland Empire, east of Los Angeles. During the housing bust, home prices in the area plunged. But recently, they have re-soared to where Fitch now considers Riverside the third-most overvalued metropolitan area in the US. So Takano fretted that “large sell-offs by investors will weaken our housing recovery in the very same communities, like mine, that were decimated by the sub prime mortgage crisis.”
PE firms have tried to exit via IPOs – which kept these houses in the rental market.
Silver Bay Realty Trust went public in December 2012 at $18.50 a share. On Friday, shares closed at $16.16, down 12.6% from their IPO price.
American Residential Properties went public in May 2013 at $21 a share, a price not seen since. “Although people look at this as a new industry, there’s really nothing new about renting single-family homes,” CEO Stephen Schmitz told Bloomberg at the time. “What’s new is that it’s being aggregated, we’re introducing professional management and we’re raising institutional capital.” Shares closed at $17.34 on Friday, down 17.4% from their IPO price.
American Homes 4 Rent went public in August 2013 at $16 a share. On Friday, shares closed at $16.69, barely above their IPO price. These performances occurred during a euphoric stock market!
So exiting this “bet on America,” as Schwarzman had put it so eloquently, by selling overpriced shares to the public is getting complicated. No doubt, Blackstone, as omnipotent as it is, will be able to pull off the IPO of Invitation Homes, regardless of what kind of bath investors end up taking on it.
Lesser firms might not be so lucky. If they can’t find a buyer like American Homes 4 Rent that is publicly traded and doesn’t mind overpaying, they’ll have to exit by selling their houses into the market.
But there’s a difference between homeowners who live in their homes and investors: when homeowners sell, they usually buy another home to live in. Investors cash out of the market. This is what the industry dreads. Investors were quick to jump in and inflated prices. But if they liquidate their holdings at these high prices, regular folks might not materialize in large enough numbers to buy tens of thousands of perhaps run-down single-family homes. And then, getting out of the “bet on America” would turn into a real mess.
China has long frustrated the hard-landing watchers – or any-landing watchers, for that matter – who’ve diligently put two and two together and rationally expected to be right. They see the supply glut in housing, after years of malinvestment. They see that unoccupied homes are considered a highly leveraged investment that speculators own like others own stocks, whose prices soar forever, as if by state mandate, but that regular people can’t afford to live in.
Hard-landing watchers know this can’t go on forever. Given that housing adds 15% to China’s GDP, when this housing bubble pops, the hard-landing watchers will finally be right.
Home-price inflation in China peaked 13 months ago. Since then, it has been a tough slog.
Earlier this month, the housing news from China’s National Bureau of Statistics gave observers the willies once again. New home prices in January had dropped in 69 of 70 cities by an average of 5.1% from prior year, the largest drop in the new data series going back to 2011, and beating the prior record, December’s year-over-year decline of 4.3%. It was the fifth month in a row of annual home price declines, and the ninth month in a row of monthly declines, the longest series on record.
Even in prime cities like Beijing and Shanghai, home prices dropped at an accelerating rate from December, 3.2% and 4.2% respectively.
For second-hand residential buildings, house prices fell in 67 of 70 cities over the past 12 months, topped by Mudanjiang, where they plunged nearly 14%.
True to form, the stimulus machinery has been cranked up, with the People’s Bank of China cutting reserve requirements for major banks in January, after cutting its interest rate in November. A sign that it thinks the situation is getting urgent.
So how bad is this housing bust – if this is what it turns out to be – compared to the housing bust in the US that was one of the triggers in the Global Financial Crisis?
Thomson Reuters overlaid the home price changes of the US housing bust with those of the Chinese housing bust, and found this:
The US entered recession around two years after house price inflation had peaked. After nine months of recession, Lehman Brothers collapsed. As our chart illustrates, house price inflation in China has slowed from its peak in January 2014 at least as rapidly as it did in the US.
Note the crashing orange line on the left: year-over-year home-price changes in China, out-crashing (declining at a steeper rate than) the home-price changes in the US at the time….
The hard-landing watchers are now wondering whether the Chinese stimulus machinery can actually accomplish anything at all, given that a tsunami of global stimulus – from negative interest rates to big bouts of QE – is already sloshing through the globalized system. And look what it is accomplishing: Stocks and bonds are soaring, commodities – a demand gauge – are crashing, and real economies are languishing.
Besides, they argue, propping up the value of unoccupied and often unfinished investment properties that most Chinese can’t even afford to live in might look good on paper, but it won’t solve the problem. And building even more of these units props up GDP nicely in the short term, and therefore it’s still being done on a massive scale, but it just makes the supply glut worse.
Sooner or later, the hard-landing watchers expect to be right. They know how to add two and two together. And they’re already smelling the sweet scent of being right this time, which, alas, they have smelled many times before.
But it does make you wonder what the China housing crash might trigger when it blooms into full maturity, considering the US housing crash helped trigger of the Global Financial Crisis. It might be a hard landing for more than just China. And ironically, it might occur during, despite, or because of the greatest stimulus wave the world has ever seen.
Stocks, of course, have been oblivious to all this and have been on a tear, not only in China, but just about everywhere except Greece. But what happens to highly valued stock markets when they collide with a recession? They crash.
What to Expect When This Stock Market Meets a Recession
Last week I had a fascinating conversation with Neile Wolfe, of Wells Fargo Advisors, LLC., about high equity valuations and what happens when they collide with a recession.
Here is my monthly update that shows the average of the four valuation indicators: Robert Shiller’s cyclically adjusted price-to-earnings ratio (CAPE), Ed Easterling’s Crestmont P/E, James Tobin’s Q Ratio, and my own monthly regression analysis of the S&P 500:
Based on the underlying data in the chart above, Neile made some cogent observations about the historical relationships between equity valuations, recessions and market prices:
High valuations lead to large stock market declines during recessions.
During secular bull markets, modest overvaluation does not produce large stock market declines.
During secular bear markets, modest overvaluation still produces large stock market declines.
Here is a table that highlights some of the key points. The rows are sorted by the valuation column.
Beginning with the market peak before the epic Crash of 1929, there have been fourteen recessions as defined by the National Bureau of Economic Research (NBER). The table above l ists the recessions, the recession lengths, the valuation (as documented in the chart illustration above), the peak-to-trough changes in market price and GDP. The market price is based on the S&P Composite, an academic splicing of the S&P 500, which dates from 1957 and the S&P 90 for the earlier years (more on that splice here).
I’ve included a row for our current valuation, through the end of January, to assist us in making an assessment of potential risk of a near-term recession. The valuation that preceded the Tech Bubble tops the list and was associated with a 49.1% decline in the S&P 500. The largest decline, of course, was associated with the 43-month recession that began in 1929.
Note: Our current market valuation puts us between the two.
Here’s an interesting calculation not included in the table: Of the nine market declines associated with recessions that started with valuations above the mean, the average decline was -42.8%. Of the four declines that began with valuations below the mean, the average was -19.9% (and that doesn’t factor in the 1945 outlier recession associated with a market gain).
What are the Implications of Overvaluation for Portfolio Management?
Neile and I discussed his thoughts on the data in this table with respect to portfolio management. I came away with some key implications:
The S&P 500 is likely to decline severely during the next recession, and future index returns over the next 7 to 10 years are likely to be low.
Given this scenario, over the next 7 to 10 years a buy and hold strategy may not meet the return assumptions that many investors have for their portfolio.
Asset allocation in general and tactical asset allocation specifically are going to be THE important determinant of portfolio return during this time frame. Just buying and holding the S&P 500 is likely be disappointing.
Some market commentators argue that high long-term valuations (e.g., Shiller’s CAPE) no longer matter because accounting standards have changed and the stock market is still going up. However, the impact of elevated valuations — when it really matters — is expressed when the business cycle peaks and the next recession rolls around. Elevated valuations do not take a toll on portfolios so long as the economy is in expansion.
How Long Can Periods of Overvaluations Last?
Equity markets can stay at lofty valuation levels for a very long time. Consider the chart posted above. There are 1369 months in the series with only 58 months of valuations more than two Standard Deviations (STD) above the mean. They are:
September 1929 (i.e., only one month above 2 STDs prior to the Crash of 1929)
Fifty-one months during the Tech bubble (that’s over FOUR YEARS)
Six of the last seven months have been above 2 STDs
The speaker of California’s State Assembly is seeking to raise new funds for affordable housing development by adding a new $75 fee to the costs of recording real estate documents.
Toni Atkins, a San Diego Democrat, stated that the new fee would be a permanent addition to the state’s line-up of fees and taxes and would apply to all real estate documents except those related to home sales. Atkins conspicuously avoided citing the $75 figure in a press statement issued by her office, only briefly identifying it as a “small fee” while insisting that she had broad support for the plan.
“The permanent funding source, which earned overwhelming support from California’s business community, will generate hundreds of millions annually for affordable housing and leverage billions of dollars more in federal, local, and bank investment,” Atkins said. “This plan will reap benefits for education, healthcare and public safety as well. The outcomes sought in other sectors improve when housing instability is addressed.”
Atkins added that her plan should add between $300 million to $720 million a year for the state’s affordable housing endeavors. But Atkins isn’t completely focused on collecting revenue: She is simultaneously proposing that developers offering low-income housing should receive $370 million in tax credits, up from the current level of $70 million.
This is the third time that a $75 real estate transaction fee has been proposed in the state legislature. Earlier efforts were put forward in 2012 and 2013, but failed to gained traction. Previously, opponents to the proposal argued that transactions involving multiple documents would be burdened with excess costs because the fee applies on a per-document basis and not a per-transaction basis.
One of the main opponents of Atkins’ proposal, Jon Coupal, president of the Howard Jarvis Taxpayers Association, told the San Francisco Chronicle that the speaker was playing word games by insisting this was merely a fee and that she was penalizing property owners to finance a problem that they did not create.
“It’s clearly a tax, not a fee,” said Coupal. “There is not a nexus between the fee payer and the public need being addressed. It’s not like charging a polluter a fee for the pollution they caused. It’s a revenue that is totally divorced from the so-called need for affordable housing.”
Recent court decisions against Fannie Mae and Freddie Mac shareholders have put to rest the notion that the two mortgage giants exist as anything but instrumentalities of the U.S. government, according to a report released Thursday by Kroll Bond Rating Agency.
Private equity investor groups recently have raised lawsuits against the Federal Housing Finance Agency, in an effort to regain control of the two entities. The failure of these legal actions points to the de facto nature of the two entities as sovereign credits, given their complete backing by the U.S. government.
The KBRA report also suggests that Fannie Mae and Freddie Mac have morphed into insurance agents rather than insurance companies, since they cannot produce the capital to bear the risk of their guarantees that the FHFA prices to begin with.
Still, the two bodies’ investors take issue with the 3rd Preferred Stock Purchase Agreement that directs all of Fannie Mae and Freddie Mac’s profits to the government, the KBRA report said.
But these investors’ suits have been unsuccessful because, in judges’ eyes, the legislation passed by Congress that saved Fannie Mae and Freddie Mac from the brink gives the U.S. Treasury and FHFA the right to manage the two companies as they see fit. But KBRA finds instead that “the 3rd PSPA simply compensates the Treasury for the capital injection made in 2008 and, more important, the open-ended support of the U.S. taxpayer.”
The report goes on to argue that these investors misinterpret the support the U.S. government lent to the two mortgage entities. Prior to the capital injection, Fannie Mae and Freddie Mac had negative net worth, meaning that Treasury’s aid only brought them to zero.
But, as the report reads, all of the profits the two make now represent therefore the return on the government’s investment, so to recapitalize Fannie Mae and Freddie Mac would essentially involve taxpayer money, which the report found “galling.”
“They are not talking about injecting any of their own cash into the companies,” KBRA writes. “If you accept the idea that the taxpayers are due a return on both the implicit and explicit capital advanced to keep the mortgage market operating, there are no earnings to be retained in the GSEs.”
The report did contend that while this may not spell out good news for the two mortgage agencies’ equity investors, it should end some of the uncertainty bond investors have faced by confirming their standing in the eyes of government.
Fannie Mae hit more than a few financial potholes during 2014, closing the year with significantly lower net income and comprehensive income and a stated concern that things may not get better during 2015.
The government-sponsored enterprise reported annual net income of $14.2 billion and annual comprehensive income of $14.7 billion in 2014, far below 2013’s levels of $84 billion in net income and $84.8 billion in comprehensive income.
The fourth quarter of 2014 was especially acute: Fannie Mae’s net income of $1.3 billion and comprehensive income of $1.3 billion for this period, a steep drop from the net income of $3.9 billion and comprehensive income of $4.0 billion for the third quarter. Fourth quarter net revenues were $5.5 billion, down from $6 billion for the third quarter, while fee and other income was $323 million for the fourth quarter, compared with $826 million for the third quarter. Net fair value losses were $2.5 billion in the fourth quarter, up substantially from $207 million in the third quarter.
Fannie Mae explained that its fourth quarter results were “driven by net interest income, partially offset by fair value losses on risk management derivatives due to declines in longer-term interest rates in the quarter.” Nonetheless, Fannie Mae reported a positive net worth of $3.7 billion as of Dec. 31, 2014, which resulted in a dividend obligation to the U.S. Department of the Treasury of $1.9 billion that will be paid next month.
In announcing its 2014 results, Fannie Mae offered a blunt prediction that this year will see continued disappointments.
“[Fannie Mae] expects its earnings in future years will be substantially lower than its earnings for 2014, due primarily to the company’s expectation of substantially lower income from resolution agreements, continued declines in net interest income from its retained mortgage portfolio assets, and lower credit related income,” said Fannie Mae in a press statement. “In addition, certain factors, such as changes in interest rates or home prices, could result in significant volatility in the company’s financial results from quarter to quarter or year to year. Fannie Mae’s future financial results also will be affected by a number of other factors, including: the company’s guaranty fee rates; the volume of single-family mortgage originations in the future; the size, composition, and quality of its retained mortgage portfolio and guaranty book of business; and economic and housing market conditions.”
Default Risk Index For Agency Purchase Loans Hits Series High
The default risk for mortgage loan originations rose in January, marking the fifth straight month-over-month increase, according to the composite National Mortgage Risk Index (NMRI) released by AEI’s International Center on Housing Risk.
In January, the NMRI for Agency purchase loans increased to a series high of 11.94 percent. That number represented an increase of 0.4 percentage points from the October through December average and a jump of 0.8 percentage points from January 2014.
“With the NMRI once again hitting a series high, the risks posed by the government’s 85 percent share of the home purchase market continue to rise,” said Stephen Oliner, co-director of AEI’s International Center on Housing Risk.
Default risk indices for Fannie Mae, FHA, and VA loans hit series highs within the composite, according to AEI. The firm attributes to the consistent monthly increases in risk indices to a substantial shift in market share from large banks to non-bank accounts, since the default risk tends to be greater on loans originated by non-bank lenders.
AEI’s study for January revealed that the volume of high debt-to-income (DTI) loans has not been reduced by the QM regulation. About 24 percent of loans over the past three months had a total DTI above 43 percent, compared to 22 percent for the same period a year earlier. The study also found that Fannie Mae and Freddie Mac were compensating to a limited extent for the riskiness of their high DTI loans.
Further, the NMRI for FHA loans in January experienced a year-over-year increase of 1.5 percentage points up to 24.41 percent – meaning that nearly one quarter of all recently guaranteed home purchase loans backed by FHA would be projected to default if they were to experience an economic shock similar to 2007-08. AEI estimates that if FHA were to adopt VA’s risk management practices, the composite index would fall to about 9 percent.
“Policy makers need to be mindful of the upward risk trends that are occurring with respect to both first-time and repeat buyers,” said Edward Pinto, co-director of AEI’s International Center on Housing Risk. “Recent policy moves by the FHA and FHFA will likely exacerbate this trend.”
AEI said the cause of the softness in mortgage lending is not tight lending standards, but rather reduced affordability, loan put back risk, and slow income growth among households.
More than 180,o00 home purchase loans were evaluated for the January results, bringing the total number of loans rated in the NMRI since December 2012 to nearly 5.5 million, according to AEI.
Fast-rising rents have made it difficult for many Americans to save up a down payment for a home purchase—and experts say that problem is unlikely to go away any time soon.
Late last year, real estate firm Zillow reported that renters living in the United States paid a cumulative $441 billion in rents throughout 2014, a nearly 5 percent annual increase spurred by rising numbers of renters and climbing prices. Last month, the company said that its own Rent Index increased 3.3 percent year-over-year, accelerating from 2013 even as home price growth slows down.
Results from a more recent survey conducted by Zillow and Pulsenomics suggest that rent prices will continue to be a problem for the aspiring homeowner for years to come.
Out of more than 100 real estate experts surveyed, 51 percent said they expect rental affordability won’t improve for at least another two years, Zillow reported Friday. Another 33 percent were a little more optimistic, calling for a deceleration in rental price increases sometime in the next one to two years.
Only five percent said they expect affordability conditions to improve for renters within the next year.
Despite the challenge that rising rents presents to home ownership throughout the country, more than half—52 percent of respondents—said the market should be allowed to correct the problem on its own, without government intervention.
“Solving the rental affordability crisis in this country will require a lot of innovative thinking and hard work, and that has to start at the local level, not the federal level,” said Zillow’s chief economist, Stan Humphries. “Housing markets in general and rental dynamics in particular are uniquely local and demand local, market-driven policies. Uncle Sam can certainly do a lot, but I worry we’ve become too accustomed to automatically seeking federal assistance for housing issues big and small, instead of trusting markets to correct themselves and without waiting to see the impact of decisions made at a broader local level.”
On the topic of government involvement in housing matters: The survey also asked respondents about last month’s reduction in annual mortgage insurance premiums for loans backed by the Federal Housing Administration (FHA). The Obama administration has projected that the cuts will help as many as 250,000 new homeowners make their first purchase.
The panelists were lukewarm on the change: While two-thirds of those with an opinion said they think the changes could be “somewhat effective in making homeownership more accessible and affordable,” just less than half said the new initiatives are unwise and potentially risky to taxpayers.
Finally, the survey polled panelists on their predictions for U.S. home values this year. As a whole, the group predicted values will rise 4.4 percent in 2015 to a median value of $187,040, with projections ranging from a low of 3.1 percent to a high of 5.5 percent.
“During the past year, expectations for annual home value appreciation over the long run have remained flat, despite lower mortgage rates,” said Terry Loebs, founder of Pulsenomics. “Regarding the near-term outlook, there is a clear consensus among the experts that the positive momentum in U.S. home prices will continue to slow this year.”
On average, panelists said they expect median home values will pass their precession peak ($196,400) by May 2017.
When “CBS This Morning” co-host Norah O’Donnell asked the chief executive of Zillow recently about the accuracy of the website’s automated property value estimates — known as Zestimates — she touched on one of the most sensitive perception gaps in American real estate.
Zillow is the most popular online real estate information site, with 73 million unique visitors in December. Along with active listings of properties for sale, it also provides information on houses that are not on the market. You can enter the address or general location in a database of millions of homes and probably pull up key information — square footage, lot size, number of bedrooms and baths, photos, taxes — plus a Zestimate.
Shoppers, sellers and buyers routinely quote Zestimates to realty agents — and to one another — as gauges of market value. If a house for sale has a Zestimate of $350,000, a buyer might challenge the sellers’ list price of $425,000. Or a seller might demand to know from potential listing brokers why they say a property should sell for just $595,000 when Zillow has it at $685,000.
Disparities like these are daily occurrences and, in the words of one realty agent who posted on the industry blog ActiveRain, they are “the bane of my existence.” Consumers often take Zestimates “as gospel,” said Tim Freund, an agent with Dilbeck Real Estate in Westlake Village. If either the buyer or the seller won’t budge off Zillow’s estimated value, he told me, “that will kill a deal.”
Back to the question posed by O’Donnell: Are Zestimates accurate? And if they’re off the mark, how far off? Zillow CEO Spencer Rascoff answered that they’re “a good starting point” but that nationwide Zestimates have a “median error rate” of about 8%.
Whoa. That sounds high. On a $500,000 house, that would be a $40,000 disparity — a lot of money on the table — and could create problems. But here’s something Rascoff was not asked about: Localized median error rates on Zestimates sometimes far exceed the national median, which raises the odds that sellers and buyers will have conflicts over pricing. Though it’s not prominently featured on the website, at the bottom of Zillow’s home page in small type is the word “Zestimates.” This section provides helpful background information along with valuation error rates by state and county — some of which are stunners.
For example, in New York County — Manhattan — the median valuation error rate is 19.9%. In Brooklyn, it’s 12.9%. In Somerset County, Md., the rate is an astounding 42%. In some rural counties in California, error rates range as high as 26%. In San Francisco it’s 11.6%. With a median home value of $1,000,800 in San Francisco, according to Zillow estimates as of December, a median error rate at this level translates into a price disparity of $116,093.
Some real estate agents have done their own studies of accuracy levels of Zillow in their local markets.
Last July, Robert Earl, an agent with Choice Homes Team in the Charlottesville, Va., area, examined selling prices and Zestimates of all 21 homes sold that month in the nearby community of Lake Monticello. On 17 sales Zillow overestimated values, including two houses that sold for 61% below the Zestimate.
In Carlsbad, Calif., Jeff Dowler, an agent with Solutions Real Estate, did a similar analysis on sales in two ZIP Codes. He found that Zestimates came in below the selling price 70% of the time, with disparities ranging as high as $70,000. In 25% of the sales, Zestimates were higher than the contract price. In 95% of the cases, he said, “Zestimates were wrong. That does not inspire a lot of confidence, at least not for me.” In a second ZIP Code, Dowler found that 100% of Zestimates were inaccurate and that disparities were as large as $190,000.
So what do you do now that you’ve got the scoop on Zestimate accuracy? Most important, take Rascoff’s advice: Look at them as no more than starting points in pricing discussions with the real authorities on local real estate values — experienced agents and appraisers. Zestimates are hardly gospel — often far from it.
First-time buyers Kellen and Ben Goldsmith are shown in their new town home, which they purchased for $620,000 in Seattle’s Eastlake neighborhood. (Ken Lambert / Tribune News Service. Authored byKenneth R. Harney
Call them the prodigal millennials: Statistical measures and anecdotal reports suggest that young couples and singles in their late 20s and early 30s have begun making a belated entry into the home-buying market, pushed by mortgage rates in the mid-3% range, government efforts to ease credit requirements and deep frustrations at having to pay rising rents without creating equity.
Listen to Kathleen Hart, who just bought a condo unit with her husband, Devin Wall, that looks out on the Columbia River in Wenatchee, Wash.: “We were just tired of renting, tired of sharing with roommates and not having a place of our own. Finally the numbers added up.”
Erin Beasley and her fiance closed on a condo in the Capitol Hill area of Washington, D.C., in January. “With the way rents kept on going,” she said, “we realized it was time” after five years as tenants. “With renting, at some point you get really tired of it — you want to own, be able to make changes” that suit you, not some landlord.
Hart and Beasley are part of the leading edge of the massive millennial demographic bulge that has been missing in action on home buying since the end of the Great Recession. Instead of representing the 38% to 40% of purchases that real estate industry economists say would have been expected for first-timers, they’ve lagged behind in market share, sometimes by as much as 10 percentage points. But new signs are emerging that hint that maybe the conditions finally are right for them to shop and buy:
• Redfin, a national real estate brokerage, said that first-time buyers accounted for 57% of home tours conducted by its agents mid-month — the highest rate in recent years. Home-purchase education class requests, typically dominated by first-timers, jumped 27% in January over a year earlier. “I think it is significant,” Redfin chief economist Nela Richardson said. “They are sticking a toe in the water.”
• The Campbell/Inside Mortgage Finance HousingPulse Tracking Survey, which monthly polls 2,000 realty agents nationwide, reported that first-time buyer activity has started to increase much earlier than is typical seasonally. First-timers accounted for 36.3% of home purchases in December, according to the survey.
• Anecdotal reports from realty brokers around the country also point to exceptional activity in the last few weeks. Gary Kassan, an agent with Pinnacle Estate Properties in the Los Angeles area, says nearly half of his current clients are first-time buyers. Martha Floyd, an agent with McEnearney Associates Inc. Realtors in McLean, Va., said she is working with “an unusually high” number of young, first-time buyers. “I think there are green shoots here,” she said, especially in contrast with a year ago.
Assuming these early impressions could point to a trend, what’s driving the action? The decline in interest rates, high rents and sheer pent-up demand play major roles.
But there are other factors that could be at work. In the last few weeks, key sources of financing for entry-level buyers — the Federal Housing Administration and giant investors Fannie Mae and Freddie Mac — have announced consumer-friendly improvements to their rules. The FHA cut its punitively high upfront mortgage insurance premiums and Fannie and Freddie reduced minimum down payments to 3% from 5%.
Price increases on homes also have moderated in many areas, improving affordability. Plus many younger buyers have discovered the wide spectrum of special financing assistance programs open to them through state and local housing agencies.
Hart and her husband made use of one of the Washington State Housing Finance Commission’s buyer assistance programs, which provides second-mortgage loans with zero interest rates to help with down payments and closing costs. Dozens of state agencies across the country offer help for first-timers, often with generous qualifying income limits.
Bottom line: Nobody knows yet whether or how long the uptick in first-time buyer activity will last, but there’s no question that market conditions are encouraging. It just might be the right time.
According to RealtyTrac, the first wave of 7.3 million homeowners who lost their home to foreclosure or short sale during the foreclosure crisis are now past the seven-year window they conservatively need to repair their credit and qualify to buy a home as we begin 2015.
In addition, more waves of these potential boomerang buyers will be moving past that seven-year window over the next eight years corresponding to the eight years of above-normal foreclosure activity from 2007 to 2014.
“The housing crisis certainly hit home the fact that home ownership is not for everyone, but those burned during the crisis should not immediately throw the baby out with the bathwater when it comes to their second chance at home ownership,” said Chris Pollinger, senior vice president of sales at First Team Real Estate, covering the Southern California market which has more than 260,000 potential boomerang buyers. “Home ownership done responsibly is still one of the best disciplined wealth-building strategies, and there is much more data available for home buyers than there was five years ago to help them make an informed decision about a home purchase.”
Nearly 7.3 million potential boomerang buyers nationwide will be in a position to buy again from a credit repair perspective over the next eight years.
Markets with the most potential boomerang buyers over the next eight years among metropolitan statistical areas with a population of at least 250,000.
Markets with the highest rate of potential boomerang buyers as a percentage of total housing units over the next eight years among metro areas with at least 250,000 people.
Markets most likely to see the boomerang buyers materialize are those where there are a high percentage of housing units lost to foreclosure but where current home prices are still affordable for median income earners and where the population of Gen Xers and Baby Boomers — the two generations most likely to be boomerang buyers — have held steady or increased during the Great Recession.
There were 22 metros among those with at least 250,000 people where this trifecta of market conditions is in place, making these metros the most likely nationwide to see a large number of boomerang buyers materialize in 2015 and beyond.
The latest data from the S&P/Case-Shiller Home Price Indices found housing prices slowing down during November 2014, leading to concern of a possibly weak housing market for this year.
The 10-City Composite gained 4.2 percent year-over-year in November, but that was down from 4.4 percent in October. The 20-City Composite gained 4.3 percent year-over-year, which was down from 4.5 percent in October. The S&P/Case-Shiller U.S. National Home Price Index, which covers all nine U.S. census divisions, recorded a 4.7 percent annual gain in November 2014, slightly above the 4.6 percent level recorded one month earlier.
However, there was good news from November’s numbers: Miami and San Francisco posted annual gains of 8.6 percent and 8.9 percent, respectively, while Tampa, Atlanta, Charlotte, and Portland also saw year-over-year housing price increases.
David Blitzer, managing director and chairman of the Index Committee at S&P Dow Jones Indices, acknowledged that the housing market could be stronger.
“With the spring home buying season, and spring training, still a month or two away, the housing recovery is barely on first base,” Blitzer said. “Prospects for a home run in 2015 aren’t good. Strong price gains are limited to California, Florida, the Pacific Northwest, Denver, and Dallas. Most of the rest of the country is lagging the national index gains. Moreover, these price patterns have been in place since last spring. Existing home sales were lower in 2014 than 2013, confirming these trends.
“Difficulties facing the housing recovery include continued low inventory levels and stiff mortgage qualification standards,” Blitzer added. “Distressed sales and investor purchases for buy-to-rent declined somewhat in the fourth quarter. The best hope for housing is the rest of the economy where the news is better.”
The oil boom that lifted home prices in Texas, Oklahoma and Louisiana is coming to an end.
Crude oil prices have crashed since June, falling by more than 54 percent to less than $50 a barrel. That swift drop has started to cripple job growth in oil country, creating a slow wave that in the years ahead may devastate what has been a thriving real estate market, according to new analysis by the real estate firm Trulia.
“Oil prices won’t tank home prices immediately,” Trulia chief economist Jed Kolko explained. “Rather, falling oil prices in the second half of 2014 might not have their biggest impact on home prices until late 2015 or in 2016.”
History shows it takes time for home prices in oil country to change course.
Kolko looked at the 100 largest housing markets where the oil industry accounted for at least 2 percent of all jobs. Asking prices in those cities rose 10.5 percent over the past year, compared with an average of 7.7 percent around the country.
Prices climbed 13.4 percent in Houston, where 5.6 percent of all jobs are in oil-related industries. The city is headquarters to energy heavyweights such as Phillips 66, Halliburton and Marathon Oil. Asking prices surged 10.2 percent in Fort Worth and 10.1 percent in Tulsa, Oklahoma. In some smaller markets, oil is overwhelmingly dominant — responsible for more than 30 percent of the jobs in Midland for instance.
The closest parallel to the Texas housing market might have occurred in the mid-1980s, when CBS was airing the prime-time soap opera “Dallas” about a family of oil tycoons.
In the first half of 1986, oil prices plunged more than 50 percent, to about $12 a barrel, according to a report by the Brookings Institution, a Washington-based think tank.
Job losses mounted in late 1986 around Houston. The loss of salaries eventually caused home prices to fall in the second half of 1987.
That led Kolko to conclude that since 1980, it takes roughly two years for changes in oil prices to hit home prices.
Of course, there is positive news for people living outside oil country, Kolko notes.
Falling oil prices lead to cheaper gasoline costs that reduce family expenses, freeing up more cash to spend.
“In the Northeast and Midwest especially, home prices tend to rise after oil prices fall,” he writes in the analysis.
Disparate Impact: The president’s new credit watchdog agency is warning lenders they could be investigated for discrimination if they scrutinize welfare recipients applying for home loans. Here we go again.
In an agency bulletin, the Consumer Financial Protection Bureau specifically advised mortgage lenders not to verify the income of people receiving Social Security Disability Insurance benefits.
SSDI enrollment has exploded under Obama, and fraud is rampant in the program. A recent probe by Congress found doctors rubber-stamping claims for the generous benefits. A random review found more than 1-in-4 cases failed to provide evidence to support claims.
No wonder mortgage lenders are asking for verification.
Last year, the number of Americans receiving payments skyrocketed to a record 15 million-plus. A disproportionate share of enrollees are African-American — blacks make up 12% of the population, but over 17% of all SSDI recipients — and black groups have complained to regulators that mortgage underwriters are making unreasonable demands for income verification.
The NAACP argues disability payments are a “critical source of financial support” for blacks, noting their average monthly benefit is almost $1,000.
“The program’s benefits provide a significant income boost to lower-earning African-Americans,” NAACP asserted, noting the share of blacks on federal disability is more than double that for whites.
In response, CFPB has issued a five-page edict warning mortgage lenders they could face “disparate impact” liability if they question whether “all or part” of a minority applicant’s income “derives from a public assistance program.”
If they know what’s good for them, they’ll “avoid unnecessary documentation requests and increase access to credit for persons receiving Social Security disability income.”
In a separate warning, HUD was more forceful: “A lender shouldn’t ask a consumer for documentation or about the nature of his or her disability under any circumstances.”
We can’t say we’re shocked. As we’ve reported — contrary to other media reporting — CFPB’s new Qualified Mortgage rule mandates payments from “government assistance programs are acceptable” forms of income for home loan qualification. (It’s in the 804-page regulation, if financial journalists would just take the time to read it.)
More, the Justice Department has ordered the biggest mortgage lenders in the country, including Wells Fargo and Bank of America, to offer loans to people on “public assistance.” They’re even required to post branch notices promoting the risky welfare acceptance policy.
The administration is actually forcing banks to target high-risk borrowers for 30-year debt under threat of prosecution.
Though President Obama’s worried about a plunge in new-home buying among jobless minorities, he’s just setting them up for failure all over again. A mortgage requires a stable job and income to avoid defaults and foreclosures.
Failure to require income documentation contributed to the mortgage crisis and was something CFPB was created to stop.
Exempting public-assistance income from the rules exposes the bogus nature of Obama’s financial “reforms.”
– Price Appreciation Slowing in More than Half of Major U.S. Markets – – 20 Major Metros Reach New Post-Recession Price Peaks in 2013 or 2014 – – REO and Short Sales Down from a Year Ago, Foreclosure Auction Sales Increase –
IRVINE, Calif. – Nov. 26, 2014 — RealtyTrac® (www.realtytrac.com), the nation’s leading source for comprehensive housing data, today released its October 2014 Residential & Foreclosure Sales Report, which shows the median sales price of U.S. single family homes and condos in October was $193,000, up 2 percent from the previous month and up 16 percent from a year ago to the highest level since September 2008 — a 73-month high.
“This U.S. recovery is largely being driven by investors, and as the lower-priced, often distressed inventory most appealing to investors dries up in a given market, investor activity will slow down in that market and move to other markets with more ideal inventory available,” said Daren Blomquist, vice president at RealtyTrac. “This has created a ripple-effect recovery moving out from traditional investor hot spots such as Phoenix, Atlanta and many California markets and into markets such as Charlotte, Columbus, Ohio, Dallas and Oklahoma City.
“More than 32 percent of all single family homes and condos purchased so far in 2014 are non-owner occupied compared to 68 percent that are owner-occupied,” Blomquist added. “That is the highest share of investor purchases since we began tracking in 2001.”
The October median sales price — which included both distressed sales of homes in some stage of foreclosure and non-distressed sales — was up 37 percent from a trough of $141,000 in March 2012 but still 19 percent below the previous peak of $237,537 in August 2006. Among 97 metropolitan statistical areas with a population of 500,000 or more with sufficient home price data, 20 have reached new post-recession median sales price peaks in 2013 or 2014, including Denver, Pittsburgh, Columbus, Ohio, and Charlotte.
“Home prices have risen substantially in the lower price ranges — generally under $400,000. That has led most underwater properties out of trouble,” said Phil Shell, Managing Broker of RE/MAX Alliance, covering the Denver market, where median home prices reached a new post-recession peak in July 2014. “We are seeing a ‘compression’ in the market because we are experiencing record low inventories. Prices on the low end are coming up, and while the high end is not necessarily coming down, it has flat-lined. So we are seeing prices compress in the middle. A homeowner wanting to move up into the market at $550,000 or above will find substantial value and a terrific opportunity.” The median sales price of distressed homes — those in the foreclosure process or bank-owned — was $128,701 nationwide in October, 36 percent below the median sales price of non-distressed properties, $200,000. But distressed home prices increased at a faster pace, up 18 percent from a year ago while non-distressed home prices were up 11 percent during the same time period.
“The demand is strong for a lessening distressed inventory and pushing prices to their highest level since 2008,” said Mike Pappas, CEO and president of the Keyes Company, covering the South Florida market. “Additionally, due to the long delay in our judicial foreclosure system we are now seeing a higher quality of distressed inventory being liquidated, although overall home prices have begun to gradually level off over the past few months as the market normalizes.”
Markets with highest home price appreciation Among metro areas with a population of 500,000 or more and sufficient home price data, those with the biggest annual increase in median sales price were Toledo, Ohio (up 33 percent), Detroit (up 27 percent), Cleveland (up 21 percent), McAllen-Edinburg-Mission, Texas (up 21 percent), and Dayton, Ohio (up 20 percent).
Other major markets with double-digit appreciation compared to a year ago included Memphis, Tenn. (up 18 percent), Austin, Texas (up 17 percent), Miami (up 16 percent), Houston (up 16 percent), Cincinnati (up 15 percent), and Chicago (up 15 percent).
“While price appreciation has leveled off month to month, home prices have increased significantly from a year ago and we expect this trend to continue,” said Craig King, COO of Chase International, covering the Lake Tahoe and Reno, Nev., markets. The median sales price in Reno was unchanged from September to October but up 15 percent from a year ago — the 29th consecutive month with a year-over-year increase in the market.
“A number of things have lined up regionally to provide game changing growth as we look forward,” continued King. “The world is aware that Tesla is making a move in to Northern Nevada with their Giga factory, but there are other huge projects on tap as well. Collectively, these projects could account for population gains of 20 to 25 percent in the region over the next four to five years. With limited inventory the demand for housing will be unprecedented.”
Markets with accelerating home price appreciation Home price appreciation accelerated in 45 of the 97 (46 percent) metro areas nationwide with a population of half a million or more and with sufficient home price data.
Markets with the fastest-accelerating appreciation included Cincinnati (15 percent annual appreciation this year compared to 4 percent annual depreciation last year), Cleveland (21 percent annual appreciation this year compared to 2 percent annual appreciation last year), Nashville (13 percent annual appreciation this year compared to 1 percent annual appreciation last year), Charlotte (10 percent annual appreciation this year compared to 1 percent annual depreciation last year), and Columbus, Ohio (14 percent annual appreciation this year compared to 3 percent annual appreciation last year.
Other major markets with accelerating home price appreciation were Chicago (15 percent annual appreciation this year compared to 11 percent a year ago), Dallas (11 percent annual appreciation this year compared to 7 percent a year ago), Pittsburgh (8 percent annual appreciation compared to 5 percent a year ago), Seattle (10 percent annual appreciation this year compared to 7 percent a year ago), Tampa (15 percent annual appreciation this year compared to 12 percent a year ago) and Baltimore (2 percent annual appreciation this year compared to 0 percent a year ago).
“The continued rise in Seattle median home prices is largely a result of a strong local economy, low housing supply, and high buyer demand,” said OB Jacobi, president of Windermere Real Estate, covering the Seattle market. The percentage of distressed home sales in Seattle has returned to pre-mortgage crisis levels, with activity being driven by the hardships that have always instigated short sales, such as job loss, divorce, illness, and job relocation. Most of the distressed properties have shifted into the outlying areas around Seattle and are selling for well under the median home price.”
Markets with slowing home price appreciation Home price appreciation slowed compared to a year ago in 52 of the 97 (54 percent) metro areas nationwide with a population of half a million or more and with sufficient home price data.
Some of the fastest-appreciating markets in 2013 have seen substantial slowdowns in price appreciation this year, including Phoenix (6 percent annual appreciation in October 2014 compared to 25 percent a year ago), Los Angeles (9 percent annual appreciation this year compared to 24 percent a year ago), Oxnard-Thousand Oaks-Ventura in Southern California (7 percent annual appreciation this year compared to 24 percent a year ago), Jacksonville, Fla. (4 percent annual appreciation this year compared to 23 percent a year ago), Boston (3 percent annual appreciation this year compared to 21 percent a year ago), and San Diego (8 percent this year compared to 19 percent a year ago).
Other major markets with decelerating home price appreciation in October were New York (1 percent annual appreciation this year compared to 4 percent a year ago), Philadelphia (4 percent annual depreciation this year compared to 5 percent annual appreciation a year ago), Houston (16 percent annual appreciation this year compared to 27 percent a year ago), Miami (16 percent annual appreciation this year compared to 20 percent a year ago), Atlanta (13 percent annual appreciation this year compared to 25 percent a year ago), and San Francisco (12 percent annual appreciation this year compared to 34 percent a year ago).
Las Vegas, Central California and Central Florida post highest distressed sale share Short sales and distressed sales — in foreclosure or bank-owned — combined accounted for 13.8 percent of all residential property sales in October, up slightly from 13.7 percent the previous month, but down from 14.7 percent in October 2013.
Markets with the highest percentage of distressed and short sales combined were Las Vegas (33.6 percent), Stockton, Calif., (33.6 percent), Modesto, Calif., (31.7 percent), Lakeland, Fla., (28.9 percent), and Orlando (28.4 percent).
Short sales share close to pre-recession levels nationwide, up from a year ago in 12 states Short sales accounted for 5.0 percent of all residential property sales in October, unchanged from the previous month and a year ago and not far above the pre-recession average of 4.5 percent a month in 2006.
Markets with the highest percentage of short sales were in Orlando (14.2 percent), Lakeland, Fla., (13.0 percent), Palm bay-Melbourne-Titusville, Fla., (11.8 percent), Cape Coral-Fort Myers, Fla., (11.8 percent), and Las Vegas (11.5 percent).
Twelve states saw an increase in short sales share compared to a year ago, including New Jersey (7.1 percent compared to 4.6 percent a year ago), Illinois (9.9 percent compared to 6.6 percent a year ago), Maryland (9.3 percent compared to 7.2 percent a year ago), Ohio (5.4 percent compared to 4.7 percent a year ago), Nevada (10.8 percent compared to 9.8 percent a year ago), California (4.6 percent compared to 4.3 percent a year ago), Michigan (6.5 percent compared to 6.2 percent a year ago) and Arizona (5.8 percent compared to 5.6 percent a year ago).
Bank-owned sales share matches lowest level since January 2011 Sales of bank-owned properties nationwide accounted for 7.5 percent of all U.S. residential sales in October, the same as previous month but down from 9.1 percent a year ago. The share of bank-owned sales in September and October was the lowest share since January 2011.
Markets with the highest percentage of bank-owned sales were in Stockton, Calif. (23.5 percent), Modesto, Calif., (19.3 percent), Bakersfield, Calif., (18.8 percent), Las Vegas (18.6 percent), Riverside-San Bernardino, Calif., (18.3 percent), and Phoenix (16.4 percent).
“Distressed sales remain a small percentage of the overall marketplace in Southern California as prices stabilize and market health continues to improve,” said Chris Pollinger, senior vice president of sales at First Team Real Estate, covering the Southern California market.
Foreclosure auction sales share increases most in Midwest, Rust Belt cities Sales at the public foreclosure auction accounted for 1.3 percent of all U.S. residential property sales in October, up from 1.2 percent in September and up from 0.7 percent in October 2013.
Markets with the highest percentage of sales at foreclosure auction were Lakeland, Fla. (5.4 percent), Orlando (4.2 percent), Palm Bay-Melbourne-Titusville (4.1 percent), Miami (4.1 percent), Tampa (4.0 percent) and Las Vegas (3.5 percent).
Markets with the biggest annual increases in share of foreclosure auctions were Des Moines (1.9 percent compared to 0.1 percent a year ago), Akron, Ohio (2.1 percent compared to 0.1 percent a year ago), Philadelphia (1.9 percent compared to 0.1 percent a year ago), Chattanooga, Tenn., (1.3 percent compared to 0.1 percent a year ago), and Fresno, Calif., (0.9 percent compared to 0.1 percent a year ago).
Major metros with an annual increase in share of foreclosure auction sales included Dallas (1.8 percent compared to 0.4 percent a year ago), Cincinnati (1.2 percent compared to 0.3 percent a year ago), Columbus (3.0 percent compared to 0.7 percent a year ago), San Antonio (1.5 percent compared to 0.4 percent a year ago), Cleveland (2.2 percent compared to 0.6 percent a year ago), Houston (1.6 percent compared to 0.6 percent a year ago), Jacksonville, Fla., (3.5 percent compared to 1.4 percent a year ago), Oklahoma City (1.3 percent compared to 0.8 percent a year ago), Virginia Beach (1.4 percent compared to 0.8 percent a year ago), and Atlanta (2.3 percent compared to 3.3 percent a year ago).
Report methodology The RealtyTrac U.S. Residential Sales Report provides counts and median prices for sales of residential properties nationwide, by state and metropolitan statistical areas with a population of 500,000 or more. Data is also available at the county level upon request. The report also provides a breakdown of short sales, bank-owned sales and foreclosure auction sales to third parties. The data is derived from recorded sales deeds and loan data, which is used to determine cash sales and short sales. Sales counts for recent months are projected based on seasonality and expected number of sales records for those months that are not yet available from public record sources but will be in the future given historical patterns. Statistics for previous months are revised when each new monthly report is issued as more deed data becomes available for those previous months.
Definitions Residential property sales: sales of single family homes, condominiums/town homes, and co-ops, not including multi-family properties.
Annualized sales: an annualized estimate of the number of residential property sales based on the actual number of sales deeds received for the month, accounting for expected sales records for that month that will be received in future months as well as seasonality.
Distressed sales: sale of a residential property that is actively in the foreclosure process or bank-owned when the sale is recorded.
Distressed discount: percentage difference between the median distressed sales price and the median non-distressed sales price in a given geographic area.
Bank-Owned sales: sales of residential properties that have been foreclosed on and are owned by the foreclosing lender (bank).
Short sales: sales of residential properties where the sale price is below the combined total of outstanding mortgages secured by the property.
Foreclosure Auction sales: sale of a property at the public foreclosure auction to a third party buyer that is not the foreclosing lender.
Report License The RealtyTrac U.S. Residential & Foreclosure Sales report is the result of a proprietary evaluation of information compiled by RealtyTrac; the report and any of the information in whole or in part can only be quoted, copied, published, re-published, distributed and/or re-distributed or used in any manner if the user specifically references RealtyTrac as the source for said report and/or any of the information set forth within the report.
Data Licensing and Custom Report Order Investors, businesses and government institutions can contact RealtyTrac to license bulk foreclosure and neighborhood data or purchase customized reports. For more information contact our Data Licensing Department at 800.462.5193800.462.5193 or datasales@realtytrac.com.
About RealtyTrac RealtyTrac is a leading supplier of U.S. real estate data, with nationwide parcel-level records for more than 129 million U.S. parcels that include property characteristics, tax assessor data, sales and mortgage deed records, Automated Valuation Models (AVMs) and 20 million active and historical default, foreclosure auction and bank-ownedproperties. RealtyTrac’s housing data and foreclosure reports are relied on by the Federal Reserve, U.S. Treasury Department, HUD, numerous state housing and banking departments, investment funds as well as millions of real estate professionals and consumers, to help evaluate housing trends and make informed decisions about real estate.
As the generational war heats up, we should all remember the source of all the bubbles and all the policies that could only result in generational poverty: The Federal Reserve.
Federal Reserve chair Janet Yellen recently treated the nation to an astonishing lecture on the solution to rising wealth inequality–according to Yellen, low-income households should save capital and buy assets such as stocks and housing.
It’s difficult to know which is more insulting: her oily sanctimony or her callous disregard for facts. What Yellen and the rest of the Fed Mafia have done is inflate bubbles in credit and assets that have made housing unaffordable to all but the wealthiest households.
Fed policy has been especially destructive to young households: not only is it difficult to save capital when your income is declining in real terms, housing has soared out of reach as the direct consequence of Fed policies.
Two charts reflect this reality. The first is of median household income, the second is the Case-Shiller Index of housing prices for the San Francisco Bay Area.
I have marked the wage chart with the actual price of a modest 900 square foot suburban house in the S.F. Bay Area whose price history mirrors the Case-Shiller Index, with one difference: this house (and many others) are actually worth more now than they were at the top of the national bubble in 2006-7.
But that is a mere quibble. The main point is that housing exploded from 3 times median income to 12 times median income as a direct result of Fed policies. Lowering interest rates doesn’t make assets any more affordable–it pushes them higher.
The only winners in the housing bubble are those who bought in 1998 or earlier. The extraordinary gains reaped since the late 1990s have not been available to younger households. The popping of the housing bubble did lower prices from nosebleed heights, but in most locales price did not return to 1996 levels.
As a multiple of real (inflation-adjusted) income, in many areas housing is more expensive than it was at the top of the 2006 bubble.
While Yellen and the rest of the Fed Mafia have been enormously successful in blowing bubbles that crash with devastating consequences, they failed to move the needle on household income. Median income has actually declined since 2000.
Inflating asset bubbles shovels unearned gains into the pockets of those who own assets prior to the bubble, but it inflates those assets out of reach of those who don’t own assets–for example, people who were too young to buy assets at pre-bubble prices.
Inflating housing out of reach of young households as a matter of Fed policy isn’t simply unjust–it’s cruel. Fed policies designed to goose asset valuations as a theater-of-the-absurd measure of “prosperity” overlooked that it is only the older generations who bought all these assets at pre-bubble prices who have gained.
In the good old days, a 20% down payment was standard. How long will it take a young family to save $130,000 for a $650,000 house? How much of their income will be squandered in interest and property taxes for the privilege of owning a bubblicious-priced house?
If we scrape away the toxic sludge of sanctimony and misrepresentation from Yellen’s absurd lecture, we divine her true message: if you want a house, make sure you’re born to rich parents who bought at pre-bubble prices.
As the generational war heats up, we should all remember the source of all the bubbles and all the policies that could only result in generational poverty: The Federal Reserve.


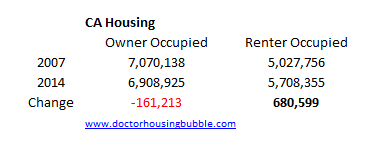
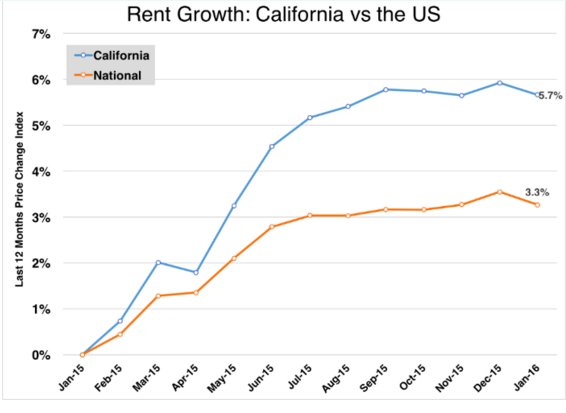
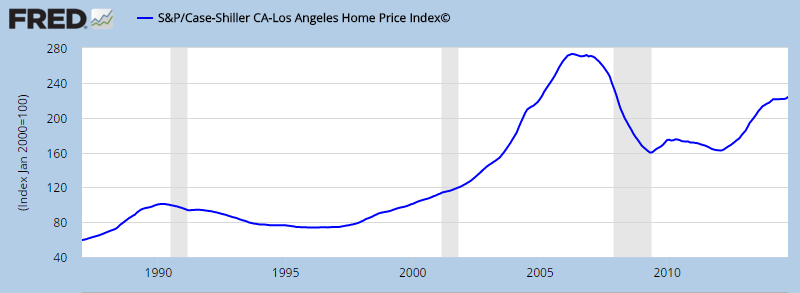
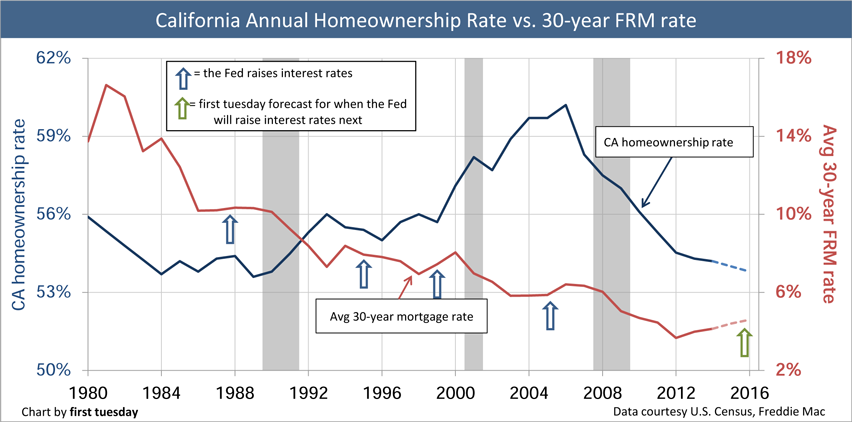


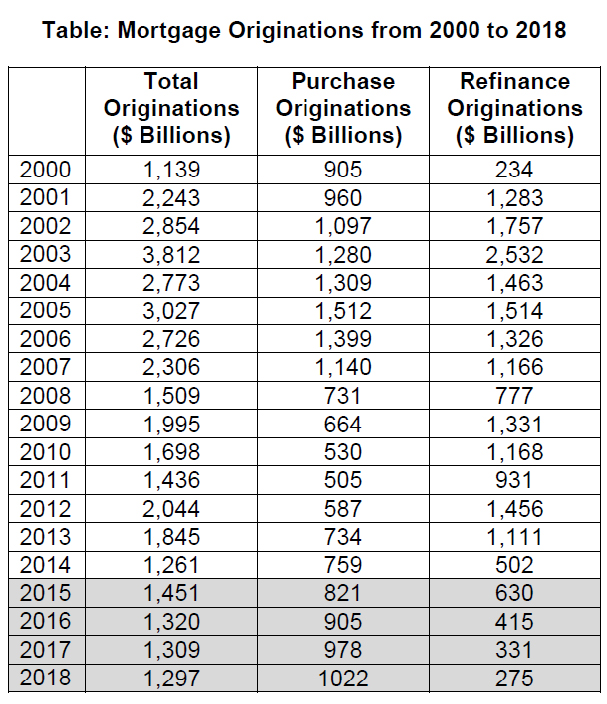


 The Kane County court house: where real estate goes to vegetate


 by Vanessa Grout


 The beach neighborhood has the highest concentration of Airbnb listings in all of metro Los Angeles. Data collected by