San Diego County’s median home price hit its highest price in history in July, $579,750, while sales hit a four-year low, real estate tracker CoreLogic reported Thursday.
The previous record was$575,000 in May.Home prices have been breaking records on nearly a month-to-month basis all year. As of July, home prices had increased 8 percent in a year — the most of any Southern California county.
Home sales hit its lowest point in years in July with 3,607 sales. The last time sales were that low was July 2014, when the county was still coming out of the housing bust, when there were 3,530 sales.
Affordability constraints for many potential buyers could be the reason why sales are so low despite more homes on the market, said CoreLogic analyst Andrew LePage in the monthly report.
“The overall trend in recent months has been toward more listings,” he wrote, “suggesting that sales also remain weak relative to current housing demand because more and more would-be buyers are unable or unwilling to buy.”
Home inventory has increased slightly in recent months, but it is still below levels reached in years past, said data from the Greater San Diego Association of Realtors. There were 7,613 homes listed for sale in July, up from July 2016 when 5,828 homes were for sale, and 6,571 homes for sale in July 2015.
In 2010, during the Great Recession, there were as many as 13,000 homes on sale in a given month.
In July, resale single-family homes tied the peak median of $630,000 reached in June with 2,314 sales. Resale condos hit their highest ever median of $432,000 with 1,080 sales. The median for newly built homes was $703,750, but was limited to 213 sales.
San Diego County’s 8 percent increase in a year outpaces the rest of the region, but it is still a cheaper option for coastal California.
Orange County home prices were up 6.6 percent in a year with a median of $735,750, Ventura County prices were up 6.3 percent for a median of $595,000 and Los Angeles County increased 5.7 percent for a median of $607,500.
Interior counties’ median home price increases still did not keep up with San Diego. In San Bernardino County, home prices were up 6.6 percent for a median of $325,000 and up 5.8 percent in Riverside County for a median of $386,000.
Dana Kuhn, real estate lecturer at San Diego State University, said affordability constraints and the number of people leaving the region for cheaper areas may slow the price increases. He said declining sales will not be the best indicator that sales are starting to slow down.
“The better indicator of that will be rising inventory of homes for sale and longer market times for those offered,” Kuhn said.
While inventory of homes is increasing, days on market still tends to be very quick. Based on a 12-month rolling average, the average days it took for a San Diego County home to sell in July was 28, down from 31 at the same time last year.
Condos from $250,001 to $500,000 sold the fastest, staying on the market 21 days.
Investors are still finding value in the San Diego market. Absentee buyers, typically investors who don’t intend on living in the home as a primary residence, made up 20.1 percent of sales in July, up from 19.4 percent of sales at the same time last year. In early 2013, more than 30 percent of sales went to absentee buyers.
For areas with at least 10 sales, Solana Beach (92075) had the biggest price increase for single-family resale homes in a year at 41 percent for a median of $1.8 million. It was followed by Coronado (92118) with an increase of 32 percent and a median of $2.4 million and Cardiff (92007) with an increase of 31 percent with a median of $1.1 million.
For resale condos, Oceanside (92054) had the biggest yearly increase at 50 percent with a median of $566,000. It was followed by Clairemont (92117) with a 37 percent increase and a median of $475,000 and Encinitas (92024) with a 32 percent increase and a median of $641,000.
When adjusting for inflation, San Diego County’s home price has still not reached its pre-housing crash price. In November 2005, the median hit $517,500, which would be nearly $660,000 today.
Following the drop in Existing- and New-home sales (as well as another drop in mortgage apps), Pending-home sales missed expectations dramatically, dropping 0.7% MoM in July (+0.3% exp).
This is the seventh straight month of annual declines in pending home sales…
Lawrence Yun, NAR chief economist, says the housing market’s summer slowdown continued in July.
“Contract signings inched backward once again last month, as declines in the South and West weighed down on overall activity,” he said.
“It’s evident in recent months that many of the most overheated real estate markets – especially those out West – are starting to see a slight decline in home sales and slower price growth.”
Yun blames affordability (and supply)…
“The reason sales are falling off last year’s pace is that multiple years of inadequate supply in markets with strong job growth have finally driven up home prices to a point where an increasing number of prospective buyers are unable to afford it.”
The US housing data just keeps getting worse…
Again as we noted previously, none of this should come as a huge surprise since
Sentiment for Home-Buying Conditions are the worst since Lehman…
With The Fed set on its automaton hiking trajectory, we suspect home sales will continue to lag.
One month ago we discussed why according to the recent data, the “Housing Market Headed For “Broadest Slowdown In Years.” Fast forward to today, when we received the latest confirmation that the US housing market appears to have recently hit a downward inflection point: according to the just released July 2018 U.S. Foreclosure Market Report released byATTOM Data Solutions, foreclosure starts in July increased by 1% from a year ago — the first year-over-year increase following 36 consecutive months of decreases.
Foreclosures rose from a year ago in 96 of the 219 metropolitan statistical areas, or 44% of the markets analyzed in the report; 33 of those areas posted their third straight monthly increase. A total of 30,187 U.S. properties started the foreclosure process for the first time in July, up 1 percent from the previous month and while the increase was less than 1% from a year ago, it marked the first annual increase in exactly 3 years.
21 states posted a year-over-year increase in foreclosure starts in July, including Florida (up 35 percent); California (up 3 percent); Texas (up 7 percent); Illinois (up 7 percent); and Ohio (up 2 percent).
Metro areas posting year-over-year increases in foreclosure starts in July included Los Angeles, California (up 20 percent); Houston, Texas (up 76 percent); Philadelphia, Pennsylvania (up 10 percent); Miami, Florida (up 29 percent); and San Francisco, California (up 10 percent).
“The increase in foreclosure starts is not just a one-month anomaly in many local markets given that July represented the third consecutive month with a year-over-year increase in 33 metro areas, including Los Angeles, Miami, Houston, Detroit, San Diego and Austin,” said Daren Blomquist, senior vice president with ATTOM Data Solutions.
“Gradually loosening lending standards over the past few years have introduced a modicum of risk back into the housing market, and that additional risk is resulting in rising foreclosure starts in a diverse set of markets across the country. Most susceptible to rising foreclosure starts are affordability-challenged markets where home buyers are more financially stretched and markets with some type of trigger event such as a natural disaster or large-scale layoffs.”
The data comes shortly after aseparate reportfound that there has been a plunge of sales in ultra-luxury real estate in New York City, where apartments that cost $5 million or more have seen their sale plunge more than 31% in the first 6 months of the year.
The surprising reversal in the US housing sector comes at a time when the US economy is reportedly firing on all four cylinders, with the stock market at all time highs and not long after the Department of Commerce revised income and spending data to “discover” that US households had actually saved twice as much as previously expected. Which begs the question: is the rise in interest rates a sufficiently adverse development to offset all the other favorable trends in the economy, or is something more sinister – and unknown – taking place in the US economy.
As a reminder it is housing – and not financial markets or stocks – that has traditionally been the most relevant, and aspirational, asset for the US middle class and as such is the best indicator of economic prosperity (or lack thereof) for a majority of the US population. And recent trends are anything but optimistic.
After June’s dismal US housing data, hope was high for a rebound in July but it was crushed as existing home sales tumbled 0.7% MoM (against expectations of a 0.4% jump). This is the longest streak of declines since the taper tantrum in 2013.
Single-family home sales fell 0.2% MoM (-1.2% YoY) to annual rate of 4.75 million
Purchases of condominium and co-op units dropped 4.8% MoM (-3.3% YoY) to a 590,000 pace
As lower-priced home sales collapsed…
This is the weakest SAAR existing home sales (5.34mm) since Feb 2016…
The median sales price increased 4.5% YoY to $269,600, but dipped MoM (seasonal norm)
Lawrence Yun, NAR chief economist, says the continuous solid gains in home prices have now steadily reduced demand.
“Led by a notable decrease in closings in the Northeast, existing home sales trailed off again last month, sliding to their slowest pace since February 2016 at 5.21 million,” he said.
“Too many would-be buyers are either being priced out, or are deciding to postpone their search until more homes in their price range come onto the market.”
“In addition to the steady climb in home prices over the past year, it’s evident that the quick run-up in mortgage rates earlier this spring has had somewhat of a cooling effect on home sales,” said Yun.
“This weakening in affordability has put the most pressure on would-be first-time buyers in recent months, who continue to represent only around a third of sales despite a very healthy economy and labor market.”
Total housing inventory at the end of July decreased 0.5 percent to 1.92 million existing homes available for sale (unchanged from a year ago). Unsold inventory is at a 4.3-month supply at the current sales pace (also unchanged from a year ago).
And finally a glance at the following chart shows that the US housing market is in freefall – not what record high stocks would suggest…
Perhaps this helps explain it – Sentiment for Home-Buying Conditions are the worst since the infamous Lehman Brothers collapse …
After Housing Starts collapsed 12.9% in June, July rebounded just 0.9% (dramatically missing expectations of a 7.4% bounce) as Permits rose 1.5% month over month.
A second month in a row with a massive miss to economists’ expectations…
Single-family starts remain very soft and multi-family starts barely rebound at all from June’s crash…
And housing starts are now down year over year for The 2nd month in a row…
Permits rebounded very modestly in both single- and multi-family units…
Two of four regions posted a gain in starts, with the South increasing 10.4 percent and the Midwest climbing by 11.6 percent; the Northeast declined 4 percent and the West plunged 19.6 percent, the biggest drop since January 2017
Finally we note that US home builder stocks have been tracking fundamentals dramatically lower all years…
Owning a home is generally viewed as a better deal than renting, but in cities with exploding home prices and relatively flat rents, that may not be the case anymore.
According to Trulia, it now makes more financial sense to rent than buy in the nation’s two most expensive markets — San Jose and San Francisco. The balance is also shifting in favor of renting in a few other high-cost cities, such as Honolulu, Seattle and Portland, Oregon, according to a recent study by the San Francisco-based company.
Trulia said the overall U.S. market still solidly provides buyers with a financial benefit. But in the five years since Trulia began estimating the financial advantages of buying versus renting, this is the first time renters have come out ahead in any of the major metros it tracks.
In San Jose and San Francisco, renting was 12 percent and 6 percent cheaper, respectively, for the consumer than buying a home, Trulia said. San Francisco and San Jose are outliers, though. The National Association of Realtors, for example, has estimated that for a person earning $100,000, just 2.5 percent of the June listings in San Jose and 9 percent in San Francisco were affordable. Trulia reported that buyers still have a significant advantage over renters in places like Detroit.
Trulia estimated that on a nationwide basis, buying a home was 26 percent cheaper for a consumer than renting as of last month. This is the narrowest gap in five years, and has come down from 41 percent in 2016, according to Trulia. The key factor in closing the gap is that house prices have increased steeply along with mortgage rates, while rents are remaining relatively stable. In San Jose, for example, home prices have jumped up 29 percent in a year, while rents were unchanged. Home values rose 14 percent in San Francisco, and rents fell by 3 percent.
“There are a lot of factors,” Trulia’s Senior Economist Cheryl Young said during an interview on Thursday. “Obviously, mortgage rates are going up. That is going to tip the scales a little bit toward renting, but also home value appreciation is far outpacing rent growth right now. So, rents are pretty much cooling out. As they cool down and home prices track up, that margin between buying and renting starts closing.”
Young said the balance could tip in favor of renters in other cities as well.
“There are markets that are always close to that margin, and things that could tip it,” she said. “If mortgage rates were to rise and we still see rents flattening and even decreasing as they have been in some places relative to rising home prices, we may see some markets tip.”
Trulia’s calculations include forecasts on future rent and price appreciation, and also estimates on how much a renter can potentially earn by investing in other vehicles. Trulia assumes that the buyer will stay in the home for seven years, put 20 percent down on a 30-year fixed mortgage.
Other housing analysts told Scotsman Guide News that gauging the advantages of buying versus renting can be a tricky exercise.
“The housing market doesn’t necessarily favor either one right now, as the choice of whether to be an owner or the renter is not a purely economic decision, but often includes the lifestyle decisions of an individual,” said Mark Fleming, chief economist for First American Corp.
Fleming also noted that in some of these high-cost cities, renters are in better position now to buy than when home prices were near their low point seven years ago.
“While housing prices are on the rise across the country, by historical standards they are still within reach in many markets,” Fleming said. “In fact, when you account for the historically low interest rate environment and rising incomes, consumer house-buying power is up nearly 24 percent since 2011,” he added.
Len Kiefer, deputy chief economist for Freddie Mac, said that rising home values tend to give the buyer a financial edge over the renter, who is gaining no equity.
“Certainly if we look back historically, homeowners have done pretty well relative to renters,” Kiefer said. “It doesn’t mean that it is going to be true in the future, but if you look at where our forecast is for the overall economy, we are still forecasting home prices to continue to rise at a pretty healthy pace over the next couple of years.”
Kiefer said in a few high-cost cities with high property taxes, homeowners will be hurt by new tax changes that eliminated or reduced homeownership perks in the federal tax code. This may give renters some advantage. He said the tax changes so far don’t seem to have reduced homebuyer demand significantly, though.
“Certainly in the high-cost, high-tax markets, places like parts of California, New Jersey, Illinois, the cost of homeownership is going to be a little bit negative,” Kiefer said. “But if we look at actual data on what has happened in those markets, it is hard to see a discernible impact in terms of slower overall activity that you could attribute to the tax law,” he said. Kiefer said rising prices and higher rates were likely making homebuying less appealing, however.
Renters have been less sold on the financial benefits of owning a home, according to recent Fannie Mae surveys. In January 2010, for example, 76 percent of surveyed renters saw an advantage in buying. That number has fallen to 68 percent as of the end of June.
“Renters’ view of the financial benefit of owning has come down a little bit,” said Mark Palim, deputy chief economist for Fannie Mae. “That probably reflects that home prices are up substantially.”
Palim said that renters are still expressing a strong desire in buying homes for non-financial, quality-of-life factors. He said the improved economy and a surge in household formation has kept the buyer demand up in spite of rising home prices and rates.
“Millennials have really moved into the market in a big way, and they are closing the gap relative to other generations,” Palim said. “People have far more financial means to afford a home and go out and buy a home, and that has translated into pretty brisk demand.”
(Paul Craig Roberts) The housing market is now apparently turning down. Consumer incomes are limited by jobs offshoring and the ability of employers to hold down wages and salaries. The Federal Reserve seems committed to higher interest rates – in my view to protect the exchange value of the US dollar on which Washington’s power is based. The arrogant fools in Washington, with whom I spent a quarter century, have, with their bellicosity and sanctions, encouraged nations with independent foreign and economic policies to drop the use of the dollar. This takes some time to accomplish, but Russia, China, Iran, and India are apparently committed to dropping or reducing the use of the US dollar.
A drop in the world demand for dollars can be destabilizing of the dollar’s value unless the central banks of Japan, UK, and EU continue to support the dollar’s exchange value, either by purchasing dollars with their currencies or by printing offsetting amounts of their currencies to keep the dollar’s value stable. So far they have been willing to do both. However, Trump’s criticisms of Europe has soured Europe against Trump, with a corresponding weakening of the willingness to cover for the US. Japan’s colonial status vis-a-vis the US since the Second World War is being stressed by the hostility that Washington is introducing into Japan’s part of the world. The orchestrated Washington tensions with North Korea and China do not serve Japan, and those Japanese politicians who are not heavily on the US payroll are aware that Japan is being put on the line for American, not Japanese interests.
If all this leads, as is likely, to the rise of more independence among Washington’s vassals, the vassals are likely to protect themselves from the cost of their independence by removing themselves from the dollar and payments mechanisms associated with the dollar as world currency. This means a drop in the value of the dollar that the Federal Reserve would have to prevent by raising interest rates on dollar investments in order to keep the demand for dollars up sufficiently to protect its value.
As every realtor knows, housing prices boom when interest rates are low, because the lower the rate the higher the price of the house that the person with the mortgage can afford. But when interest rates rise, the lower the price of the house that a buyer can afford.
If we are going into an era of higher interest rates, home prices and sales are going to decline.
The “on the other hand” to this analysis is that if the Federal Reserve loses control of the situation and the debts associated with the current value of the US dollar become a problem that can collapse the system, the Federal Reserve is likely to pump out enough new money to preserve the debt by driving interest rates back to zero or negative.
Would this save or revive the housing market?Not if the debt-burdened American people have no substantial increases in their real income. Where are these increases likely to come from? Robotics are about to take away the jobs not already lost to jobs offshoring. Indeed, despite President Trump’s emphasis on “bringing the jobs back,” Ford Motor Corp. has just announced that it is moving the production of the Ford Focus from Michigan to China.
Apparently it never occurs to the executives running America’s off shored corporations that potential customers in America working in part time jobs stocking shelves in Walmart, Home Depot, Lowe’s, etc., will not have enough money to purchase a Ford. Unlike Henry Ford, who had the intelligence to pay workers good wages so they could buy Fords, the executives of American companies today sacrifice their domestic market and the American economy to their short-term “performance bonuses” based on low foreign labor costs.
What is about to happen in America today is that the middle class, or rather those who were part of it as children and expected to join it, are going to be driven into manufactured “double-wide homes” or single trailers. The MacMansions will be cut up into tenements. Even the high-priced rentals along the Florida coast will find a drop in demand as real incomes continue to fall. The $5,000-$20,000 weekly summer rental rate along Florida’s panhandle 30A will not be sustainable. The speculators who are in over their heads in this arena are due for a future shock.
For years I have reported on the monthly payroll jobs statistics. The vast majority of new jobs are in lowly paid nontradable domestic services, such as waitresses and bartenders, retail clerks, and ambulatory health care services. In the payroll jobs report for June, for example, the new jobs, if they actually exist, are concentrated in these sectors: administrative and waste services, health care and social assistance, accommodation and food services, and local government.
High productivity, high value-added manufactured jobs shrink in the US as they are offshored to Asia.High productivity, high value-added professional service jobs, such as research, design, software engineering, accounting, legal research, are being filled by offshoring or by foreigners brought into the US on work visas with the fabricated and false excuse that there are no Americans qualified for the jobs.
America is a country hollowed out by the short-term greed of the ruling class and its shills in the economics profession and in Congress. Capitalism only works for the few. It no longer works for the many.
On national security grounds Trump should respond to Ford’s announcement of offshoring the production of Ford Focus to China by nationalizing Ford. Michigan’s payrolls and tax base will decline and employment in China will rise. We are witnessing a major US corporation enabling China’s rise over the United States. Among the external costs of Ford’s contribution to China’s GDP is Trump’s increased US military budget to counter the rise in China’s power.
Trump should also nationalize Apple, Nike, Levi, and all the rest of the offshored US global corporations who have put the interest of a few people above the interests of the American work force and the US economy. There is no other way to get the jobs back. Of course, if Trump did this, he would be assassinated.
America is ruled by a tiny percentage of people who constitute a treasonous class. These people have the money to purchase the government, the media, and the economics profession that shills for them. This greedy traitorous interest group must be dealt with or the United States of America and the entirety of its peoples are lost.
In her latest blockbuster book, Collusion, Nomi Prinsdocuments how central banks and international monetary institutions have used the 2008 financial crisis to manipulate markets and the fiscal policies of governments to benefit the super-rich.
These manipulations are used to enable the looting of countries such as Greece and Portugal by the large German and Dutch banks and the enrichment via inflated financial asset prices of shareholders at the expense of the general population.
One would think that repeated financial crises would undermine the power of financial interests, but the facts are otherwise. As long ago as November 21, 1933, President Franklin D. Roosevelt wrote to Col. House that “the real truth of the matter is, as you and I know, that a financial element in the larger centers has owned the Government ever since the days of Andrew Jackson.”
Thomas Jefferson said that “banking institutions are more dangerous to our liberties than standing armies” and that “if the American people ever allow private banks to control the issue of their currency, first by inflation, then by deflation, the banks . . . will deprive the people of all property until their children wake-up homeless on the continent their fathers conquered.”
The shrinkage of the US middle class is evidence that Jefferson’s prediction is coming true.
Tumbling house prices in Sydney and Melbourne are the main drivers behind the first annual drop in national property prices in six years, a new report shows. The national median house price fell 1.0 per cent over the June quarter and year, according to a report by property classifieds group Domain released on Thursday.
It is the first time values have fallen on an annual basis since June 2012.
The negative national growth rate reflects weakening house prices in Sydney and Melbourne, which together represent about two thirds of Australia’s housing market by value.
Sydney house prices fell by 4.5 per cent in the 12 months to the end of June for their largest annual drop since 2008. Sydney units also fell by 3.5 per cent over the same period.
The figures chime with those released this week by property data firm CoreLogic, which said overall Sydney prices fell 5.0 per cent in the 12 months to July 22.
“House and unit prices in Sydney are now back to values seen at the end of 2016,” Domain property analyst Nicola Powell told AAP. Tighter credit availability and a high number of units being built are key factors behind the dive, Dr Powell said.
Australia’s building commencements, fueled by investor apartment construction, look like heading from boom to bust, according to forecaster BIS Oxford Economics.
In a reality check for investors who bought at the top of the apartment boom, BIS is predicting the biggest correction since the global financial crisis hit in 2008, with housing starts set to fall by almost 23 per cent by 2020.
Associate director Adrian Hart told the ABC’s AM program that the slump would be led by high-density dwelling construction, which is set to halve over the next two years
A key factor in the residential slowdown has been tougher regulation by the Australian Prudential Regulation Authority (APRA) to curb investor lending, while the Foreign Investment Review Board (FIRB) and tax office has been clamping down on overseas buyers.
Australian homeowners are trapped in “mortgage prison” because of a rule change. And there is no easy way out.
Changes in bank rules around living expenses calculations have effectively wiped huge amounts off the maximum a bank will allow you to borrow.
Many people are now finding they originally borrowed more than a bank would lend them under current conditions, meaning they haven’t got the option of shopping around to get a better interest rate — no bank will lend them the amount they need.
Precise numbers of Australia’s mortgage prisoners are hard to come by, but Mozo investment and lending expert Steve Jovcevski told news.com.au that he expected most of them are those who have borrowed and bought in the last five years.
Oops!
Jovcevski gave an example in which a couple was able to borrow $800,000 a year ago can now only borrow $680,000 under the same rules.
They are now trapped in a mortgage with no way to refinance and no buyers because of declining prices.
Mortgage Slaves for Life
This is precisely what some us foresaw years ago. It’s finally come home to roost, and at a time China is highly unlikely to bail out these buyers.
Following last month’s disappointing starts/permits data and home sales prints, hope was high for a June rebound but they are gravely disappointed. Existing home sales tumbled 0.6% MoM (vs expectations of a 0.2% rise) and even worse, it’s off a downwardly revised May print of 0.7% MoM, with median home price hitting a record high $276k.
This is the first 3-in-a-row decline for existing home sales since Jan 2014…
Existing Home Sales SAAR is almost at its weakest since Jan 2016…
Lawrence Yun, NAR chief economist, says closings inched backwards in June and fell on an annual basis for the fourth straight month.
“There continues to be a mismatch since the spring between the growing level of homebuyer demand in most of the country in relation to the actual pace of home sales, which are declining,” he said.
“The root cause is without a doubt the severe housing shortage that is not releasing its grip on the nation’s housing market. What is for sale in most areas is going under contract very fast and in many cases, has multiple offers. This dynamic is keeping home price growth elevated, pricing out would-be buyers and ultimately slowing sales.”
The median existing-home price for all housing types in June was $276,900, surpassing last month as the new all-time high and up 5.2% from June 2017 ($263,300). June’s price increase marks the 76th straight month of year-over-year gains.
Homebuilder stocks have generally drifted lower with the dismal data but have yet to take the next leg lower…
Counter to the national trend, several housing markets saw foreclosure starts rise year over year last month, according to a new report from ATTOM Data Solutions, a real estate data firm.
Forty-three percent of local markets saw an annual increase in May in foreclosure starts. Foreclosure starts were most on the rise in Houston, which saw a 153 percent jump from a year ago. Hurricane Harvey struck the Houston metro area in August 2017, tying with Hurricane Katrina as the costliest tropical cyclone on record, and has contributed to many recent foreclosures in the area. Other areas that are seeing foreclosure starts rise: Dallas-Fort Worth (up 46% year over year); Los Angeles (up 14 percent); Atlanta (up 7 percent); and Miami (up 4 percent).
A total of 33,623 U.S. properties started the foreclosure process in May, which is down 6 percent from a year ago. But a number of states—23 states and the District of Columbia—posted a year-over-year increase in foreclosure starts in May.
Overall, the metro areas with the highest foreclosure rates in May were: Flint, Mich.; Atlantic City, N.J.; Trenton, N.J.; Philadelphia; and Columbia, S.C.
View the chart below to see foreclosure starts by metro area.
California’s median home price reached a new high in May at $600,860, surpassing its previous peak of $594,530 11 years ago.
Home sales declined by 1.8 percent from April and down 4.6 percent compared to May 2017 levels.
May marked the first year-over-year sales decline in four months and the lowest sales level in more than a year.
In Santa Barbara, median home price reached a new historic high in May at $1.2 million, while inventory continues to remain low.
“The softening in May home sales was due in part to the spike in interest rates in mid-April, when the 30-year fixed mortgage rate jumped 20 basis points in just one week to reach the highest level since 2014,” said Steve White, California Association of Realtors president.
“Homebuyers may have postponed escrow closings to wait out the effects of the rate surge,” White said.
“Additionally, the specter of rate increases earlier in the year may have pulled sales forward into the first quarter, which resulted in the subpar performance in the last couple of months,” he said.
“Looking ahead, higher mortgage rates and elevated home prices will heighten affordability constraints that will likely temper the housing market in the coming months,” he said.
While America, and more recently Canada, have both had their ups and downs with housing bubbles, nothing in the world compares to what is going on in Hong Kong, that mecca of overpriced real estate: overnight the Rating and Valuation Department announced that Hong Kong’s private home prices rose 1.7% in May, 15% higher from a year ago. This was the 19th consecutive record price, and a non-stop advance since April 2016.
“Hong Kong’s home prices have smashed records every month this year and we do not see the increase ending any time soon,” said Derek Chan, head of research at Ricacorp Properties. “One record high after another is making people panic.”
The unprecedented surge in prices, means that Hong Kong has persistently been among thecities identified by UBSas being in a real estate bubble.
It is also the world’s most unaffordable city: the same UBS report found that a skilled service worker would need to work 20 years to buy a 650-square-foot (60 square meter) apartment near the city center.
This is because real incomes have virtually stagnated in Hong Kong for many years, with UBS noting that “housing is less affordable here than in any other city we considered, and the average living space per person amounts to only 14m2 (150 sqft).”
So if it is not rising median wealth, what is behind this torrid demand for HK real estate? According to UBS “the latest boom stemmed from strong investor demand, general positive sentiment and the “fear of missing out” on capital gains. This is reflected as well in a frozen secondary market in which people hold on to their properties, expecting prices to rise further.”
In its latest attempt to moderate the housing bubble, on Thursday Hong Kong’s Executive Council approved several proposals, one of which includes introducing a vacancy tax on newly built flats that remain unsold, to cool down the overheating property market. Additionally, it is expected that Hong Kong’s flat-hoarding developers will face an annual vacancy tax amounting to double a property’s annual rental income.
However, according to analysts and agents the policy is not a long-term fix to the city’s housing crisis and urged the government to boost land supply.
“The extra supply of 9,000 [vacant] flats is even less than one third of the annual housing supply expected to offer by developers,” said Vincent Cheung, deputy managing director for Asia valuation and advisory services at Colliers International. “It would only work together with other mid- to long-term policies, such as reducing land premium and increasing the ratio of public land supply to private land supply.”
Until a solution is found, amid this “frozen” bubble of a housing market where normal buyers and Chinese oligarch sellers can rarely if ever that scenes such as the following are a common occurrence: watch as Hong Kong real estate agents literally throw punches, kick each other to the ground and otherwise pull their best kung fu moves as they brawl with one another to get a client’s business.
Chinese capital controls and a slump in foreign buyers? Check.
Trade war with the US? Check.
Things are not looking good for Canada’s national housing market, which as VCG reports, continued its sluggish performance in the month of May. Despite the warmer weather and usually busy spring selling season, buying activity has been awfully quiet. New mortgage regulations which are now in full swing have stymied fringe buyers, particularly millennials. According tonew data from credit bureau TransUnion, new mortgage originations among millennials in Canada fell by 19.5% between the last quarter of 2017 and the first three months of 2018.
That has also been showing up sales data.
As shown in the chart below, national home sales in Canada plunged by 16% Y/Y for the month of May. This was the worst decline since the great financial crisis in 2008 when home sales dipped 17% that May. Furthermore, total home sales of 50,604 marked the lowest total since May 2011.
Seasonally adjusted home sales edged 0.1% lower on a month over month basis, and 15% on a year over year basis. Or, as Steve Saretsky put it, “either way you slice it not a great month for one of the worlds most resilient housing markets.”
And as sales continue to slide inventory is beginning to build. For sale inventory crept up by 4% year over year, increasing for the first time in three years, and the highest May increase since 2010.
In light of the above, it is not surprising that the average sales price dipped 6% year over year in May, which however was not nearly as bad as April when year over year declines registered a head turning 11% decline.
But more troubling is that when looking at the smoothed out index of the MLS HPI prices showed the smallest possible increase of just 1% year over year in May, the lowest since September 2009. Not only did this mark the 13th consecutive month of decelerating year over year gains per theCanadian Real Estate Association, but at the current rate of slowdown, next month Canada will record the first annual drop in home prices since the global financial crisis.
The silver lining: condos continue to hold up well as buyers tumble down the housing ladder; here prices posted a 13% increase from May 2017.
CREA’s chief economist Gregory Klump shouldered much of the blame on tighter borrowing conditions, “This year’s new stress-test became even more restrictive in May, since the interest rate used to qualify mortgage applications rose early in the month. Movements in the stress test interest rate are beyond the control of policy makers. Further increases in the rate could weigh on home sales activity at a time when Canadian economic growth is facing headwinds from U.S. trade policy frictions.”
Klump’s theory stacks up well with recent data which suggests fringe borrowers are being pushed towards the private lending space, particularly in Ontario. Mortgage originations at private lenders in the Q1 2018rose to $2.09 billion in Ontario, a 2.95% increase from last year. The market share of private lending went from 5.71% of originations in Q1 2017, to 7.87% in Q1 2018, despite originations at other channels dropping.
In other words, there is a surge in unregulated, non-bank lending, just as the housing bubble pops, precisely what happened the last time there was a full-blown financial crisis.
Several Silicon Valley employees, including a software engineer for Twitter who made a $160,000 salary,were mocked online after complaining about their living standards inan articlefor The Guardian.
In the article, entitled “Scraping by on six figures? Tech workers feel poor in Silicon Valley’s wealth bubble,” the employee complained that his six-figure salary was “pretty bad” for the area.
“I didn’t become a software engineer just to make ends meet,”proclaimed the employee. “Families are priced out of the market.”
“The biggest cost is his $3,000 rent – which he said is ‘ultra cheap’ for the area – for a two-bedroom house in San Francisco, where he lives with his wife and two children,”reported The Guardiansympathetically. “He’d like a slightly bigger place, but finds himself competing with groups of twenty somethings happy to share accommodation while paying up to $2,000 for a single room.”
“Prohibitive costs have displaced teachers, city workers, firefighters and other members of the middle class, not to mention low-income residents,” they continued. “Now techies, many of whom are among the highest 1% of earners, are complaining they, too, are being priced out.”
The Guardian also covered other Silicon Valley employees in the piece who were earning “between $100,000 and $700,000 a year” but still allegedly had trouble “making ends meet.”
“One Apple employee was recently living in a Santa Cruz garage, using a compost bucket as a toilet. Another tech worker, enrolled in a coding boot camp, described how he lived with 12 other engineers in a two-bedroom apartment rented via Airbnb,” The Guardian reported.
“It was $1,100 for a fucking bunk bed and five people in the same room. One guy was living in a closet, paying $1,400 for a ‘private room,’” one man complained, while a female employee added, “We make over $1m between us, but we can’t afford a house… This is part of where the American dream is not working out here.”
Other established San Francisco residents mocked tech employees for their complaints.
House flipping activitysurged to an 11-year highthis year, with more than 207,000 homes flipped, according to ATTOM Data Solutions, a real estate data firm. But the key is knowing where to be and when. “The sweet spot for successful home flipping is finding the neighborhoods just emerging as the next hot neighborhoods in a city,” says Daren Blomquist, a senior vice president at ATTOM Data Solutions. The firm says the average profit for a housing flip in 2017 was $68,100.
Realtor.com® ranked the 200 largest metros according to the share of all home sales categorized as a flip (defined as any type of home that is bought and resold within a three- to 12-month period). Researchers limited their rankings to two metros per state for geographic diversity and only included markets where the average profit was at least $30,000.
The following are the best housing markets for home flippers, according to realtor.com®:
The early stages of a housing cycle are fun for pretty much everyone. Homeowners see their equity start to rise and feel smart for having bought, home seekers have to pay up, but not too much, and fully expect their new home to keep appreciating. People with modest incomes feel a bit of pinch but can still afford to stick around.
But later on the bad starts to outweigh the good. Existing homeowners still enjoy the ride but would-be buyers find themselves priced out of their top-choice neighborhoods. And residents who aren’t tech millionaires find that they can no longer afford to live where they work. Consider the plight of a teacher or cop pretty much anywhere in California these days:
Drew Barclay has a master’s degree in education and three years of experience as an English teacher, but, like most new teachers in Davis, he can’t afford to live there.
Instead, Barclay, 31, shares a rental in Sacramento that costs him $950 a month — about 40 percent of the $2,550 he brings home each month after taxes.
He is so certain that he won’t be able to qualify for a loan for a home in Davis on his $47,000 annual salary that he hasn’t bothered to house hunt. The median price for a house in the city in March was $682,500, according to tracking firm CoreLogic. Renting also is prohibitive, with the average rent in Davis about $2,500 a month, according to Zillow, a real estate website.
Davis Joint Unified officials hope to get a little help from state legislators. Last week, the state Senate voted 24-8 to waive the annual school district parcel tax of $620 for teachers and other employees of the Yolo County school district.
Davis school board member Alan Fernandes said that about two-thirds of the district’s teachers live outside Davis where housing is less expensive. He said the bill would encourage more of the district’s teachers to live in the community they serve.
Davis Joint Unified regularly passes parcel taxes to keep class sizes down and to support classroom programs. In 2016, 71 percent of Davis voters approved Measure H, a yearly tax of $620 on each parcel of taxable real property in the district for eight years. The measure raises $9.5 million a year to support math, reading and science programs and reduced class sizes for elementary grades.
But the roughly $50 a month exemption isn’t likely to help Davis Joint Unified teachers enough to make buying a house affordable. The teachers are some of the lowest-paid educators in the region, with some of the highest health care costs.
Barclay said he knows teachers 10 or 15 years older than he is who are renting rooms in other educators’ homes to get by. He said some teachers have weekend jobs to make enough money to pay their bills.
“Because I’m fairly certain I can’t put down permanent roots here, I don’t see this position as a permanent one,” Barclay said of his job as an English teacher at Davis Senior High School.
California school districts have responded by offering signing bonuses, housing stipends, computers and free tuition to educators who sign up with their districts.
When housing costs reach this point there’s no real fix. Raise taxes to increase teacher pay and there’s political trouble. Cut back on other services and the quality of life declines. “Streamline” the schools and educational outcomes and teacher morale plummet.
There’s a limit, in other words, to the ascent of home prices beyond which the system starts to break down. And when the people who make a town run smoothly – teachers, firefighters, cops, sanitation workers – can no longer afford to live there, that town has clearly crossed the line.
Based on the Case-Shiller home price index, which is now back to its 2007 housing bubble peak, there are a lot more Davis, CAs out there, with all the pathologies that that implies.
A housing bubble, of course, is just a symptom of a bigger problem. Easy money distorts the workings of a market economy by causing the prices of many assets to soar beyond all reason, enriching the owners and impoverishing the users. Typically, when housing reaches this point so have stocks and other financial assets,CEO salaries, corporate concentration, political corruption and a long list of other evils that feed on low interest rates and lax lending standards. The confluence of resulting problems then brings the cycle to a noisy end.
There are a large number of public and private services that measure the change in home prices. The algorithms behind these services, while complex, are primarily based on recent sale prices for comparative homes and adjusted for factors like location, property characteristics and the particulars of the house. While these pricing services are considered to be well represented measures of house prices, there is another important factor that is frequently overlooked despite the large role in plays in house prices.
In August 2016, the 30-year fixed mortgage rate as reported by the Federal Reserve hit an all-time low of 3.44%. Since then it has risen to its current level of 4.50%. While a 1% increase may appear small, especially at this low level of rates, the rise has begun to adversely affect housing and mortgage activity. After rising 33% and 22% in 2015 and 2016 respectively, total mortgage originations were down -16% in 2017. Further increases in rates will likely begin to weigh on house prices and the broader economy. This article will help quantify the benefit that lower rates played in making houses more affordable over the past few decades. By doing this, we can appreciate how further increases in mortgage rates might adversely affect house prices.
Lower Rates
In 1981 mortgage rates peaked at 18.50%. Since that time they have declined steadily and now stands at a relatively paltry 4.50%. Over this 37-year period, individuals’ payments on mortgage loans also declined allowing buyers to get more for their money. Continually declining rates also allowed them to further reduce their payments through refinancing. Consider that in 1990 a $500,000 house, bought with a 10%, 30-year fixed rate mortgage, which was the going rate, would have required a monthly principal and interest payment of $4,388. Today a loan for the same amount at the 4.50% current rate is almost half the payment at $2,533.
The sensitivity of mortgage payments to changes in mortgage rates is about 9%, meaning that each 1% increase or decrease in the mortgage rate results in a payment increase or decrease of 9%. From a home buyer’s perspective, this means that each 1% change in rates makes the house more or less affordable by about 9%.
Given this understanding of the math and the prior history of rate declines, we can calculate how lower rates helped make housing more affordable. To do this, we start in the year 1990 with a $500,000 home price and adjust it annually based on changes in the popular Case-Shiller House Price Index. This calculation approximates the 28-year price appreciation of the house. Second, we further adjust it to the change in interest rates. To accomplish this, we calculated how much more or less home one could buy based on the change in interest rates. The difference between the two, as shown below, provides a value on how much lower interest rates benefited home buyers and sellers.
Data Courtesy: S&P Core Logic Case-Shiller House Price Index
The graph shows that lower payments resulting from the decline in mortgage rates benefited buyers by approximately $325,000. Said differently, a homeowner can afford $325,000 more than would have otherwise been possible due to declining rates.
The Effect of Rising Rates
As stated, mortgage rates have been steadily declining for the past 37 years. There are some interest rate forecasters that believe the recent uptick in rates may be the first wave of a longer-term change in trend. If this is, in fact, the case, quantifying how higher mortgage rates affect payments, supply, demand, and therefore the prices of houses is an important consideration for the direction of the broad economy.
The graph below shows the mortgage payment required for a $500,000 house based on a range of mortgage rates. The background shows the decline in mortgage rates (10.00% to 4.50%) from 1990 to today.
To put this into a different perspective, the following graph shows how much a buyer can afford to pay for a house assuming a fixed payment ($2,333) and varying mortgage rates. The payment is based on the current mortgage rate.
As the graphs portray, home buyers will be forced to make higher mortgage payments or seek lower-priced houses if rates keep rising.
Summary
The Fed has raised interest rates six times since the end of 2015. Their forward guidance from recent Federal Open Market Committee (FOMC) meeting statements and minutes tells of their plans on continuing to do so throughout this year and next. Additionally, the Fed owns over one-quarter of all residential mortgage-backed securities (MBS) through QE purchases. Their stated plan is to reduce their ownership of those securities over the next several quarters. If the Fed continues on their expected path with regard to rates and balance sheet, it creates a significant market adjustment in terms of supply and demand dynamics and further implies that mortgage rates should rise.
The consequences of higher mortgage rates will not only affect buyers and sellers of housing but also make borrowing on the equity in homes more expensive. From a macro perspective, consider that housing contributes 15-18% to GDP, according to the National Association of Home Builders (NAHB). While we do not expect higher rates to devastate the housing market, we do think a period of price declines and economic weakness could accompany higher rates.
This analysis is clinical using simple math to illustrate the relationship, cause, and effects, between changes in interest rates and home prices. However, the housing market is anything but a simple asset class. It is among the most complex of systems within the broad economy. Rising rates not only impact affordability but also the general level of activity which feeds back into the economy. In addition to the effect that rates may have, also consider that the demographics for housing are challenged as retiring, empty-nest baby boomers seek to downsize. To whom will they sell and at what price?
If interest rates do indeed continue to rise, there is a lot more risk embedded in the housing market than currently seems apparent as these and other dynamics converge. The services providing pricing insight into the value of the housing market may do a fine job of assessing current value, but they lack the sophistication required to see around the next economic corner.
Home values have been rising for six straight years, and the gains have been accelerating for the past two years.
The average rate on the 30-year fixed mortgage is nearly a full percentage point higher today than it was in September 2017, its latest low.
Homebuyer demand may be weakening. A monthly survey from Redfin found fewer potential buyers requesting home tours or making offers.
Home values have been rising for six straight years, and the gains have been accelerating for the past two years. Unlike the last housing boom, the gains are not driven by fast and easy mortgage money, but instead by solid buyer demand and very low supply. Still, like the last housing boom, some are starting to warn these price gains cannot continue.
“The continuing run-up in home prices above the pace of income growth is simply not sustainable,” wrote Lawrence Yun, chief economist for the National Association of Realtors, in response to the latest price reading from the much-watched S&P CoreLogic Case Shiller Home Price Indices. “From the cyclical low point in home prices six years ago, a typical home price has increased by 48 percent while the average wage rate has grown by only 14 percent.”
Yun also pointed to rising mortgage interest rates as a factor that would weaken affordability. The average rate on the 30-year fixed mortgage is nearly a full percentage point higher today than it was at its most recent low in September 2017.
Some argue that despite weakened affordability, demand is just so strong that it can support higher home prices. Improving economic factors are seeing to that.
“A generally strong economy and favorable demographic tailwinds driven by the huge millennial generation aging into their home buying prime will help ensure that demand stays high, even as prices rise,” wrote Aaron Terrazas, senior economist at Zillow. “Getting a mortgage remains incredibly affordable compared to paying rent each month.”
But he admits that the “advantage is starting to erode, as mortgage interest rates rise alongside prices and income growth lags behind.”
Weakening Demand
And demand may in fact be weakening. A monthly survey from Redfin found fewer potential buyers requesting home tours or making offers.
“April was the first time in 27 months that we saw a year-over-year decline in the number of customers touring homes,” said Redfin’s chief economist, Nela Richardson. “We believe this was driven by the low levels of new listings in March.”
Richardson points to an increase in new listings in April is a positive turn for home buyers, which could bode well for futures sales. Prices, however, still stand in the way, and the increased inventory was more pronounced in higher-priced tiers.
Meanwhile the home price gains are widest on the low end of the market, where supply is leanest. That is why home sales have been dropping most on the low end. Evidence is now mounting that a growing number of first-time buyers are giving up and dropping out of the market altogether. Sales to first-time buyers dropped 2 percent in the first quarter of this year compared with the first quarter of 2017, according to Genworth Mortgage Insurance.
“This quarter’s decline in first-time home buyer sales reflects a slowdown in cyclical momentum as the first-time home buyer market approached its historical norms. It also reflects a shortage of available homes priced at or below the median first-time home buyer market price of $250,000,” wrote Tian Liu, Genworth’s chief economist. “Supply pressures will continue to drive price appreciation and freeze out a large percentage of the 2.7 million first-time home buyers who are still missing from the market.”
Competition from all-cash investors continues to thwart first-time buyers, most of whom are reliant on mortgage financing. With so little supply available, bidding wars are the rule, rather than the exception.
“When you’re competing against 10 other offers, you have to stand out, so sometimes a letter to the sellers can pull on the emotional heartstrings, but really it’s all about the dollars,” said Karen Kelly, a real estate agent with Compass in the Washington, D.C., area.
Measuring Affordability
Half of the homes on the market in D.C. in April sold in eight days or less, according to the Greater Capital Area Association of Realtors. Home prices in D.C. were over 13 percent higher in April of this year compared with a year ago. The number of listings was down more than 3 percent.
Affordability continues to be a tricky metric to monitor. Some economists argue that housing is no less affordable than it was in the early part of this century, when adjusting for inflation. No question, though, even if home prices are still lower than they were during the last housing boom, adjusting for inflation, the mortgage market today is nothing like it was then.
In fact, affordability was largely meaningless back then, since buyers could put no money down for a home and pay incredibly low monthly payments, using mortgage products that adjusted higher over time and tacked huge costs onto later payments. Those so-called negative amortization loans caused the housing crash and are not offered today.
Thanks to a modest downward revision in February’s print, March’s Case-Shiller 20-City Composite Home Price Index rose at 6.79% YoY – the fastest price appreciation since June 2014.
Surpassing July 2006’s record high…
Broadening out from the 20-City composite, the national home-price gauge climbed 6.5% YoY, matching February’s YoY advance that was the biggest since May 2014.
Of course, since March, interest rates have spiked and along with them mortgage rates, plunging mortgage apps, and as property-price appreciation continues to outpace worker pay (by 3.8 times!), it is proving a disadvantage for younger or first-time buyers even as it means rising homeowner equity for others.
“Months-supply, which combines inventory levels and sales, is currently at 3.8 months, lower than the levels of the 1990s, before the housing boom and bust,” – David Blitzer, chairman of the S&P index committee, said in a statement –
“Until inventories increase faster than sales, or the economy slows significantly, home prices are likely to continue rising.”
All 20 cities in the index showed year-over-year gains, led by a 13 percent increase in Seattle, a 12.4 percent advance in Las Vegas and 11.3 percent pickup in San Francisco.
Purchases fell in three of four regions, including a 2.9 percent decline in the South and a 3.3 percent drop in the West
Notably, while single-family home sales decreased 3 percent last month to an annual rate of 4.84 million, purchases of condominium and co-op units rose 1.6 percent to a 620,000 pace.
On a YoY basis, it looks like we have hit peak housing…
“Since NAR began tracking this data in May 2011, the median days a listing was on the market was at an all-time low in April, and the share of homes sold in less than a month was at an all-time high.”
The median existing-home price for all housing types in April was $257,900, up 5.3 percent from April 2017 ($245,000). March’s price increase marks the 74th straight month of year-over-year gains, but price growth is slowing…
And just like new home sales, all the positives are at the higher-end…
“We are seeing no breakout in home sales,” Lawrence Yun, NAR’s chief economist, said at a press briefing accompanying the report. “We are stuck in this narrow range at a time when the economy is doing well.”
“However, inventory shortages are even worse than in recent years, and home prices keep climbing above what many home shoppers can afford,” Yun said in a statement.
Yesterday when looking at the latest MBA Mortgage Application data, we found that, as mortgage rates jumped to the highest level since 2011, mortgage refi applications, not unexpectedly tumbled to the lowest level since the financial crisis, choking off a key revenue item for banks, and resulting ineven more painfor the likes of Wells Fargo.
Today, according to the latest Freddie Mac mortgage rates report, after plateauing in recent weeks, mortgage rates reversed course and reached a new high last seen eight years ago as the 30-year fixed mortgage rate edged up to 4.61% matching the highest level since May 19, 2011.
But while the highest mortgage rates in 8 years are predictably crushing mortgage refinance activity, they appears to be having the opposite effect on home purchases, where there is a sheer scramble to buy, and sell, houses. AsBloomberg notes, citing brokerage Redfin, the average home across the US that sold last month went into contract after a median of 36 only days on the market – a record speed in data going back to 2010.
To Sam Khater, chief economist of Freddie Mac, this was a sign of an economy firing on all cylinders: “This is what happens when the economy is strong,” Khater told Bloomberg in a phone interview. “All the higher-rate environment does is it either causes them to try and rush or look at different properties that are more affordable.”
Of course, one can simply counter that what rising rates rally do is make housing – for those who need a mortgage – increasingly more unaffordable, as a result of the higher monthly mortgage payments. Case in point: with this week’s jump, the monthly payment on a $300,000, 30-year loan has climbed to $1,540, up over $100 from $1,424 in the beginning of the year, when the average rate was 3.95%.
As such, surging rates merely pulls home demand from the future, as potential home buyers hope to lock in “lower” rates today instead of risking tomorrow’s rates. It also means that after today’s surge in activity, a vacuum in transactions will follow, especially if rates stabilize or happen to drop. Think “cash for clunkers”, only in this case it’s houses.
Meanwhile, the short supply of home listings for sale and increased competition is only making their purchases harder to afford: according to Redfin, this spike in demand and subdued supply means that home prices soared 7.6% in April from a year earlier to a median of $302,200, and sellers got a record 98.8% of what they asked on average.
Call it the sellers market.
Furthermore, bidding wars are increasingly breaking out: Minneapolis realtor Mary Sommerfeld said a family she works with offered $33,000 more than the $430,000 list price for a home in St. Paul. The listing agent gave her the bad news: There were nine offers and the family’s was second from the bottom.
For Sommerfeld’s clients, the lack of inventory is a bigger problem than rising mortgage rates. If anything, they want to close quickly before they get priced out of the market — and have to pay more interest.
“I don’t think it’s hurting the buyer demand at all,” she said. “My buyers say they better get busy and buy before the interest rates go up any further.”
Then again, in the grand scheme of things, 4.61% is still low. Kristin Wilson, a loan officer with Envoy Mortgage in Edina, Minnesota, tells customers to keep things in perspective. When she bought a house in the early 1980s, the interest on her adjustable-rate mortgage was 12 percent, she said.
“One woman actually used the phrase: ‘Rates shot up,’” Wilson said. “We’ve been spoiled after a number of years with rates hovering around 4 percent or lower.”
Of course, if the average mortgage rate in the America is ever 12% again, look for a real life recreation of Mad Max the movie in a neighborhood near you…
Today in “free-market capitalism actually benefits consumers” news, rents are being slashed across the board in Queens as landlords make concessions to deal with a supply glut and keep tenants renting. This lowering of rents taking place in Queens – to the tune of 12% YOY –was reported on by Bloombergon Thursday morning:
For New York City apartment hunters, April was another good month to find a deal on rents. But no one fared better than those in northwest Queens.
Rents there dropped 12 percent from a year earlier, to a median of $2,646 a month after landlord giveaways were subtracted, according to a report Thursday by appraiserMiller Samuel Inc.and brokerageDouglas Elliman Real Estate. Those giveaways were offered on 65 percent of all new leases signed in the area, excluding renewals, a record share in data going back to the beginning of 2016.
The result from the price deflation that our Fed pins as the devil incarnate? More renters, more business and higher quality tenants:
The enticements brought in more renters. New leases in northwest Queens — Long Island City, Astoria, Sunnyside and Woodside — jumped 11 percent to 272, the firms said.
“More customers who were originally looking in Manhattan and Brooklyn are considering Queens,” said Hal Gavzie, Douglas Elliman’s executive manager of leasing. “It used to be just 100 percent a different consumer.”
New York City tenants are crossing borders to compare deals in a market groaning under the weight of new supply. Landlords, who’ve accepted they need to compete to keep their units filled, are working to attract new tenants and offering sweeter renewal terms to keep the ones they have, Gavzie said.
Who knew this could happen to industries and sectors where the government is not subsidizing or interfering with the pricing – and where free market capitalism is actually, in some facet, allowed to run its course?
The consumer now has the control because the concessions landlords are making are benefiting the them. Bloomberg continued:
In Manhattan, 44 percent of all new leases came with a landlord concession, such as a free month of rent or payment of broker fees. In Brooklyn, the share was 51 percent, a record for the borough.
Still, the number of new leases in Manhattan and Brooklyn fell 3.5 percent and 1.6 percent, respectively, a sign that renters there found good reason to stay in their current apartments, Gavzie said.
“Tenants negotiating a renewal, they’ve looked around to see what deals they can get,” he said. “So their landlord gives them a sweet offer to stay.”
Manhattan rents in April, after subtracting concessions, fell 2.2 percent, to a median of $3,236, the fifth consecutive month of year-over-year declines. In Brooklyn, where rents have also fallen for five months, the decline was 2.9 percent, to a median of $2,686.
This comes just about one month after we reported about downtown Manhattan basically turning into a ghost towndue to just the opposite – prices rising and government overreach. Pricing out of tenants in some main downtown areas and shopping districts have caused vacancies in areas that have been occupied for decades.
The Fed loves to repeat how necessary and vital inflation is for economic prosperity, but in the case of midtown Manhattan’s “prime” retail real estate, it is doing nothing but helping cause once extremely prominent shopping areas become the very same “ghost towns” they turned into during the 2008 housing crisis.
Mayor DeBlasio’s asinine solution to this issue created in part by faulty government policy: more government and more regulation.
So much for the recovery.
As if brick and mortar retail didn’t have enough problems to deal with being methodically decimated by the ever growing behemoth that is Amazon, store owners are now facing rent that is simply so high it makes it impossible for most to open retail stores and do business in once prominent areas of downtown Manhattan.
If you want to see the future of storefront retailing, walk nine blocks along Broadway from 57th to 48th Street and count the stores.
The total number comes to precisely one — a tiny shop to buy drones.
That’s right: On a nine-block stretch of what’s arguably the world’s most famous avenue, steps south of the bustling Time Warner Center and the planned new Nordstrom department store, lies a shopping wasteland.
To be sure, none of this comes as a surprise to us – or our regular readers – because inlate March we recalled our own 2009 tour of Madison Avenueto discover that it also had turned into a ghost town. Just a week ago we told our readers that the ghost town that was New York’s “Golden Mile” was not surprising: after all the US economy had just been hit with the worst recession since the Great Depression, and only an emergency liquidity injection of trillions of dollars prevented a global financial collapse.
What is more surprising is why nearly 9 years later, at a time of what is supposed to be a coordinated global recovery, a walk along Madison Avenue reveals the exact same picture.
We would love for these two sets of facts to bludgeon the government and regulators over the head and make them realize that inflation isn’t the solution. Rather, they should realize from this that deflation can actually be a reward for capitalism, causing prices to fall, increased competition between sellers, and benefits for buyers.
Last month, a Wall Street Journal op-ed posited that the new tax bill could create a mass exodus of roughly800,000 residentsfrom the state of California who will flee the state for low-tax red states.
“In the years to come, millions of people, thousands of businesses, and tens of billions of dollars of net income will flee high-tax blue states for low-tax red states. This migration has been happening for years. But the Trump tax bill’s cap on the deduction for state and local taxes, or SALT, will accelerate the pace. The losers will be most of the Northeast, along with California. The winners are likely to be states like Arizona, Nevada, Tennessee, Texas and Utah.” –WSJ
Taxes aside, anew report by Next 10 and Beacon Economics suggests the California exodus may get a lot worse, as new housing construction since the Great Recession has been tepid at best, and as a result, California faces a housing backlog of 3.4 million unitsby 2025 if the trend continues – and 2.8 million units at the current rate of construction.
From 2007 to 2017, only 24.7 housing permits were filed for every 100 new residents in California – much lower than the U.S. average of 43.1 permits.
By 2025, California would have a housing backlog of 3.4 million units if the trend continues. At the current pace of construction, California would add just a minimal amount of new housing – about 600,000 new housing units (net of housing unit losses due to demolition and other causes) – leaving the state with a housing gap of 2.8 million units by 2025. –Next10
“California’s current housing supply is not able to support its growing population,” the report concludes, and as such “the low levels of construction will likely result in further increases in home prices, such that fewer and fewer California residents will be able to afford homes.“
According to the report, California lost over a million residents in the decade between 2006 and 2016, due primarily to the high cost of housing disproportionately hurting lower income households. Over 20% of those who moved over that decade did so in 2006 – at the height of the housing bubble.
And since American consumers are genetically predisposed to never learning from their mistakes, median home prices in California are once again gapping well above the national average in a very similar pattern, making housing once again prohibitively expensive:
Meanwhile, migration out of California is mostly tied to income, as most of those leaving the state earn less than $30,000 per year.
Those migration patterns are shaped by socioeconomics. Most people leaving the state earn less than $30,000 per year, even as those who can afford higher housing costs are still arriving. As the report noted, California was also a net importer of highly skilled professionals from the information, professional and technical services, and arts and entertainment industries. On the other hand, California saw the largest exodus of workers in accommodation, construction, manufacturing and retail trade industries. –MarketWatch
Crunched California homeowners spent an average of 21.9% of their income on housing expenses in 2016, while home ownership rates are terrible at just 53.6% of homes owner-occupied; the 49th worst in the nation on both counts. California renters meanwhile come in 48th in the nation when it comes to percentage of income spent on housing at 32.8%.
And how are Californians coping with the skyrocketing costs of housing? One strategy is doubling up – as nearly 14% of renters have more than one person per bedroom, making it the state with the highest percentage of overcroweded renter households.
Another solution?
Leaving.
In a separate analysis noted byMarketWatch‘s Andrea Riquier, “Realtor.com found that the number of people searching real estate listings in the 16 top California markets compared to people living there and searching elsewhere was more than double that of other areas — and growing.”
Searches for homes in pricey California towns – primarily Santa Clara, San Mateo and Los Angeles – experienced virtually no increase over the past year, while views of listings in other parts of the country were up 15%.
So where do most broke Californians move? Texas, Arizona, Nevada, Oregon and Washington .
It is official. Consumers in Colorado appear to be tapped out.
This comes at a time when the recovery is now tied for the second-longest economic expansion in American history. The stock market is near an all-time high, unemployment is the lowest in two decades, consumer confidence is beyond euphoric, and Trump tax cuts are stoking the best earnings quarter since 2011 — unleashing a record amount of corporate stock buybacks.
While a real economic recovery could be plausible this late in the business cycle, the unevenness of the recovery has left many residents in Colorado without a paddle. Accelerating real estate and rent prices across Colorado are squeezing residents out of their homes at an alarming pace.
According toABC Denver 7, Denver metro area’s skyrocketing cost of living, stagnate wage growth, and lack of affordable real estate has fueled an enormous housing crisis — overwhelming the state’s eviction courts.
Colorado Center on Law and Policy (CCLP), which has spent decades advocating for tenant rights, warns that an eviction crisis is underway in the Denver region.
ABC Denver 7 said, “27 percent of all civil cases filed in Colorado in 2017 were evictions, which represents 45,000 cases.” In Denver alone, eviction cases accounted for nearly 18 percent (8,000 eviction cases) of all evictions across the state. Arapahoe County, the third-most populated county outside of Denver, experienced the most significant number of eviction cases at nearly 22 percent (10,000 eviction cases) in 2017.
Jack Regenbogen, attorney and policy advocate for the Colorado center on Law and Policy, told ABC Denver 7 that most tenants are underrepresented in eviction court cases. In return, this has led to more evictions forcing tenants out onto the streets. He says about 90 percent of landlords are represented by legal counsel during an eviction process, but less than one percent of tenants have legal assistance.
“Traditionally, Colorado has been a very friendly state towards landlords. We really need our policymakers to begin investing meaningful resources to address this issue,” said adds.
ABC Denver 7 indicates that more than 50 percent of Coloradans are renting, and as court dockets continue to expand with evictions in 2018, the crisis is far from over.
According to the Denver Metro Association of Realtors (DMAR) May housing trends report, the average cost of a single-family home in the Denver metro area edged up, as it hit $543,059 in April. More and more homes are listing in the range between $500,000 to $750,000 than all of the price ranges below $500,000 combined. A spokesman from DMAR said homes priced between $500,000 and $749,000, is now considered the “new norm.”
“This demonstrates home buyer demand remains robust,” said Steve Danyliw, Chairman of the DMAR Market Trends Committee. “As new listings poured into the market, buyers that were waiting for them quickly gobbled them up, driving the average days on market down to 20 days.”
Danyliw, further said housing activity remains stable, but increasing interest rates could have an eventual impact on the real estate market.
Evidence continues to build that housing affordability is getting worse, particularly for everyday Americans. Colorado is the latest example of consumers physically tapping out, as they can no longer afford soaring real estate/rent prices – which is now overwhelming state courts in Denver.
Rents in all unit sizes picked up steam in April. Among the largest cities, Las Vegas, Denver, and Detroit led the pack.
The Rent Cafe’sMonthly Rent Reportfor the 250 largest US cities shows a 3.2% Y-o-Y surge.
The national average rent in April clocked in at $1,377. This marks the highest annual growth rate since the end of 2016.
By Size
Large cities: Las Vegas sees the fastest increasing rents Y-o-Y (6.0%), followed by Denver (5.8%) and Detroit (5.4%). Apartment prices in Brooklyn and Manhattan continue to slide, while rents in Washington,D.C., Portland, and Austin have been steady, growing by less than 1.5%.
Mid-size cities: Rents in Sacramento cooled down to 6%, but still lead. At the other end of the spectrum are New Orleans (-2.2%), Tulsa (0.5%), and Wichita (1.0%), where rents are growing the slowest.
Small cities see the top 20 most significant rent increases in April. Rents in the Midland-Odessaarea skyrocketed for another month, 35.6% and 32.6% respectively. At the bottom of the list sit Norman (-2.5%), Lubbock (-2.5%), and Alexandria (-1.1%).
No significant fluctuation in prices was noticed in Chicago, Philadelphia, and San Francisco, where apartment rents grew slower than 2% over the year.
The current setup leads to another deflationary collapse as we saw in 2008-2009, not an inflation boom.
“If I were trying to create a deflationary bust, I would do exact exactly what the world’s central bankers have been doing the last six years,” said Stanley Druckenmiller, 2018 recipient of the Alexander Hamilton award.
That is precisely what I have been saying for a long time.
Pending Home Sales rose just 0.4% MoM (missing expectations of 0.7% MoM) and saw prior months revised notably lower (Feb down from +3.1% to +2.8%).
Weather remains the ‘go to’ blame factor from realtors as the regional differences suggest…
Northeast fell 5.6%; Feb. rose 10.3%
Midwest up 2.4%; Feb. rose 0.7%
South up 2.5%; Feb. rose 2.9%
West fell 1.1%; Feb. fell 0.7%
Unadjusted pending home sales dropped 4.4% YoY (the 4th straight month of declines – the longest streak since 2014)…
“Healthy economic conditions are creating considerable demand for purchasing a home, but not all buyers are able to sign contracts because of the lack of choices in inventory,” Lawrence Yun, NAR’s chief economist, said in a statement.
“Prospective buyers are increasingly having difficulty finding an affordable home to buy.”
“It is an absolute necessity for there to be a large increase in new and existing homes available for sale in coming months to moderate home price growth,” he said.
“Otherwise, sales will remain stuck in this holding pattern and a growing share of would-be buyers — especially first-time buyers — will be left on the sidelines.”
Purchases dropped 5.6 percent in the Northeast, reflecting multiple winter storms…
“As anticipated, the multiple winter storms and unseasonably cold weather contributed to the decrease in contract signings in the Northeast.”
As a reminder, economists consider pending sales a leading indicator because they track contract signings.
The housing market is starting to overheat. Again.
According to the latest BLS data, average hourly wages for all US workers in November rose at a relativelybrisk 2.7% relative to the previous year, if below the Fed’s “target” of 3.5-4.5% as countless economists are unable to explain how 4.1% unemployment, and “no slack” in the economy fails to boost wage growth. Another problem with tepid wage growth, in addition to crushing the Fed’s credibility, is that it keeps a lid on how much overall price levels can rise by, i.e. inflation. Meanwhile, with record global debt, it has been the Fed’s imperative to boost inflation at any cost to inflate away the debt overhang, however weak wages have made this impossible.
Well, not really.
Because a quick look at US housing shows that while wages may be growing at roughly 2.7%, according to thelatest Case Shiller data, 18 of 20 metro areas in the US saw home prices grow at a higher pace, while 16 of 20 major U.S. cities experienced home price growth of 5.4% or higher, double the average wage growth, and something which even the NAR has been complaining about with its chief economist Larry Yun warning that as the disconnect between prices and wages becomes wider, homes become increasingly unaffordable for most Americans.
Confirming the recent jump in home prices, at the national level in February home prices for the Top 20 metro areas soared 6.8% YoY according to Case Shiller, the fastest rate since June 2014…
… and hitting a new all time high nationwide.
And while this should not come as a surprise – considering we have pointed it out on numerous occasions in the past – one look at the chart below confirms that something very troubling is taking place in San Francisco, which has either become “Vancouver South” when it comes to Chinese hot money laundering, or the second housing bubble has finally arrived on the West Coast. And while according to Case-Shiller data, home prices in San Francisco rose “only” 10.1% Y/Y, a more accurate breakdown of San Fran housing prices fromParagon Real Estateindicates a record 24% annual increase in San Francisco home prices, which increased by $110,000 in just the past quarter.
Behold: a housing bubble…
Also worth keeping an eye on: price appreciation in Sin City has quietly surged in recent months, and in February home prices jumped 11.6% Y/Y, the highest annual increase in years. Considering Las Vegas was the epicenter of the last housing bubble when prices exploded higher only to crash, it may be a good idea to keep a close eye on price tendencies in this metro area for a broader confirmation of the second housing bubble, than just the microcosm that is San Francisco.
* * *
Meanwhile, for those looking to buy for the first time, conditions have never been worse. Growth in property values is outpacing wage gains and limiting affordability, representing a major headwind for first-time buyers, and the broader market.
Finally, putting the above data in context, here are twocharts courtesy of real-estate expert Mark Hanson, the first of which shows how much household income increase is needed to buy the median priced home in key US cities…
… while the next chart shows the divergence between actual household income, and the income needed to buy the median priced house.
Rising home prices, rising mortgage rates and rising demand are colliding with a critical shortage of homes for sale. And all of that is slamming housing affordability.
This year, affordability — based on the amount of the monthly mortgage payment will weaken at the fastest pace in a quarter century, according to researchers at Arch Mortgage Insurance.
Other studies that factor in median income also show decreasing affordability because home prices are rising far faster than income growth.
It is the perfect storm: Rising home prices, rising mortgage rates and rising demand are colliding with a critical shortage of homes for sale.
And all of that is slamming housing affordability, which is causing more of today’s buyers to overstretch their budgets. This year, affordability — a metric based solely on the amount of the monthly mortgage payment — will weaken at the fastest pace in a quarter century, according to researchers at Arch Mortgage Insurance.
The average mortgage payment, based on the median-priced home, increased by 5 percent in the first quarter of 2018 nationally and could go up another 10 to 15 percent by the end of the year, according to their report.
Researchers looked at the median-priced home, now $250,000, and estimated price gains this year of 5 percent in addition to mortgage rates going from 4 percent to 5 percent on the 30-year fixed. Other studies that factor in median income also show decreasing affordability because home prices are rising far faster than income growth.
That is a national picture – but all real estate is local, and some markets will see affordability weaken more dramatically. The average monthly payment in Tacoma, Washington, is estimated to increase 25 percent this year, given sharply rising prices. In Baltimore and Boston, it could rise 21 percent in each. Philadelphia, Detroit and Las Vegas could all see 20 percent increases in the average monthly payment.
“If mortgage rates and home prices continue to rise as expected, affordability will get hammered by year-end as demand continues to outstrip supply,” said Ralph DeFranco, global chief economist-mortgage services at Arch Capital Services. “A strong U.S. economy combined with a housing shortage in many markets means that there is little hope of any price drop for buyers. Whether someone is looking to upgrade or purchase their first home, the window to buy before rates jump again is probably closing fast.”
Barely a decade after home values crashed especially, they are now hovering near their historical peak, accounting for inflation. Prices are being driven by record low inventory of homes for sale. Home builders are still producing well below historical norms, and demand for housing is very hot. The economy is stronger, which is giving younger buyers the incentive and the means to buy homes.
Stretching budgets and pushing limits
Maryland real estate agent Theresa Taylor said the supply shortage is hitting buyers hard. She is seeing more clients stretch their budgets to win a deal amid multiple offers.
“People are having to escalate offers on top of rates going up. I’m seeing it in all price ranges,” said Taylor, an agent at Keller Williams. “I am seeing it when I’m getting five offers, and people are trying to package up an offer where they’re pushing their limits.”
Buyers are taking on much higher debt levels today to be able to afford a home. In fact, the share of mortgage borrowers with more than 45 percent of their monthly gross income going to debt payments more than tripled in the second half of last year. Part of that was because Fannie Mae raised that debt-to-income threshold to 50 percent, but clearly there was demand waiting.
“Family income is rising more slowly than home prices and mortgage rates, meaning that the mortgage payment takes a bigger bite out of income for new home buyers,” said Frank Martell, president and CEO of CoreLogic. “CoreLogic’s Market Conditions Indicator has identified nearly one-half of the 50 largest metropolitan areas as overvalued. Often buyers are lulled into thinking these high-priced markets will continue, but we find that overvalued markets will tend to have a slowdown in price growth.”
CoreLogic considers a market overvalued when home prices are at least 10 percent higher than the long-term, sustainable level. High demand makes the likelihood of a national home price decline very slim, but certain markets could see prices cool if supply grows or if there is a hit to the local economy and local employment.
In any case, the more home buyers stretch, the more house-poor they become, and the less money they have to spend in the rest of the economy.
With no relief in either inventory or home price appreciation in sight, the housing market is likely to become even more competitive this year.
At some point, however, there will come a breaking point when sales slow, which is already beginning to happen in some cities. Home prices usually lag sales, so if history holds true, price gains should start to ease next year.
Home sales in Manhattan plunged by the most since the recession as buyers at all price levels drove hard bargains and were in no rush to close deals.
Haggling gets more aggressive for listings at all price points
‘People are very anxious about overpaying,’ brokerage CEO says
Sales of all condos and co-ops fell 25 percent in the first quarter from a year earlier to 2,180, according to a report Tuesday by appraiserMiller Samuel Inc.and brokerageDouglas Elliman Real Estate. It was the biggest annual decline since the second quarter of 2009, when Manhattan’s property market froze in the wake of Lehman Brothers Holdings Inc.’s bankruptcy filing and the global financial crisis that followed.
The drop in sales spanned from the highest reaches of theluxury marketto workaday studios and one-bedrooms. Buyers, who have noticed that home prices are no longer climbing as sharply as they have been, are realizing they can afford to be picky. Rising borrowing costs and new federal limits ontax deductions for mortgage interest and state and local levies also are making homeownership more expensive, giving shoppers even more reasons to push back on a listing’s price — or walk away.
While just a few years ago, bidding wars were the norm, “there’s nothing out there today that points to prices going up, and in many buyers’ minds, they point to being flat,” said Pamela Liebman, chief executive officer of brokerage Corcoran Group. “They’re now aggressive in the opposite way: putting in very low offers and seeing what concessions they can get from the sellers.”
Corcoran Group released its own Manhattan market report Tuesday, showing an 11 percent decrease in completed purchases and a 10 percent drop in sales that are pending.
For sellers, to reach a deal in the first quarter was to accept a lower offer. Fifty-two percent of all sales that closed in the period were for less than the last asking price, according to Miller Samuel and Douglas Elliman. Buyers agreed to pay the asking price in 38 percent of deals, but often that figure had already been reduced. Combined, the share of deals without a premium was the biggest since the end of 2012.
“Even with New York real estate prices, you do hit a point in which resistance sets in,” said Frederick Peters, CEO of brokerage Warburg Realty. “People are very anxious about overpaying.”
Peters said that these days, he gets dozens of emails a day announcing price reductions for listings. And buyers are haggling over all deals, no matter how small. In a recent sale of a two-bedroom home handled by his firm, a buyer who agreed to pay $1.5 million — after the seller cut the asking price — suddenly demanded an extra $100,000 discount before signing the contract. They agreed to meet halfway, Peters said.
Buyers also are finding value in co-ops, which in Manhattan tend to be priced lower than condos. Resale co-ops were the only category to have an increase in sales in the quarter, rising 2 percent to 1,486 deals, according to Corcoran Group. Sales of previously owned condos, on the other hand, fell 12 percent as their owners clung to prices near their record highs, the brokerage said.
The median price of all sales that closed in the quarter was $1.095 million, down 5.2 percent from a year earlier, brokerage Town Residential said in its own report. Three-bedroom apartments saw the biggest drop, with a decline of 7 percent to a median of $3.82 million, the firm said.
Prices fell the most in the lower Manhattan neighborhoods of Battery Park City and the Financial District, where the median slid 15 percent from a year earlier to $1.21 million, according to Corcoran Group. On the Upper West Side, the median dropped 8 percent to $1.1 million.
Neither new developments nor resales were spared from buyer apathy. Purchases of newly constructedcondos, which continue to proliferate on the market, plummeted 54 percent in the quarter to 259, Miller Samuel and Douglas Elliman said. Sales of previously owned apartments dropped 18 percent to 1,921.
The plunge in transactions is actually a good thing, in that it may serve as a wake-up call for more sellers to scale back their price expectations, said Steven James, Douglas Elliman’s CEO for the New York City region.
“It sends the sellers a signal that you have to get more reasonable if you want my buy,” James said. “It’s like buyers said, ‘I’ve told you all along, but you wouldn’t listen! Now I have your attention, so let’s talk.”
Once again, when the government intervenes – this time in housing – the left hand is starting a fire that the right hand is trying to put out. Rising prices for homes are once again pricing out prime borrowers and nobody can “figure out” why this is happening.
It is news likethis articlereported this morning by the Wall Street Journal that continues to perpetuate the hilarious notion of Keynesian economics as giving a job to one man digging a hole and another job to another man filling it, simply so that they both have jobs.
There is nothing funnier (or sadder) than “economists” struggling to understand how housing prices got so high and why people are taking on more debt in order to purchase them. However, that is the great mystery that the Wall Street Journal reported on Tuesday morning, making note of the fact that people are “stretching“ in order to purchase homes. What’s the solution to this problem? How about just easing lending standards again? After all, what could go wrong?
Apparently blind to the obvious – that forced inflation could amazingly make things more expensive relative to income – “economists” have hilariously blamed this price/debt delta on lack of supply. Of course, no one has mentioned the credit worthiness of borrowers getting worse or the fact that homes prices are being manipulated in order to offer home ownership to people who otherwise may not be in the market.
More Americans are stretching to buy homes, the latest sign that rising prices are making homeownership more difficult for a broad swath of potential buyers.
Roughly one in five conventional mortgage loans made this winter went to borrowers spending more than 45% of their monthly incomes on their mortgage payment and other debts, the highest proportion since the housing crisis, according to new data from mortgage-data trackerCoreLogicInc. That was almost triple the proportion of such loans made in 2016 and the first half of 2017, CoreLogic said.
The “lack of supply” argument is just wonderful – a bunch of “economists” finding a basic free market capitalism solution to a problem that has nothing to do with free market capitalism. Perhaps “economists” can also argue that building more, despite the lack of prime borrower demand, will also have the added benefit of puffing up GDP. From there, it’s only a couple more steps down the primrose path that leads to China’s ghost cities.
And of course, people are worried that we could have a “weak selling season” upcoming. In a free market economy, weakness is necessary and normal. In Keynesian theory, it’s the devil incarnate. The Wall Street Journal continued:
Consumers are growing more optimistic about the economy and their personal financial prospects but less hopeful that now is the right time to buy a home, according to results of a survey released in late March by the National Association of Realtors.
These factors “are working against affordability and that’s why you get the pressure to ease credit standards,” said Doug Duncan, chief economist atFannie Mae. He said that pressure has to be balanced against the potential toll if underqualified buyers eventually default on their mortgages.
CoreLogic studied home-purchase loans that generally meet standards set by Fannie Mae and Freddie Mac, the federally sponsored providers of 30-year mortgage financing.
The amount of these loans packaged and sold by Fannie and Freddie increased 73% in the second half of 2017, compared with the first half of the year, according to Inside Mortgage Finance, an industry research group. In that same period, overall new mortgages rose 15%.
As if the signs weren’t clear enough that manipulating the economy and manipulating the housing market has a detrimental effect, the article continued that Fannie Mae and Freddie Mac are “experimenting with how to make homeownership more affordable, including backing loans made by lenders whoagree to help pay down a buyer’s student debt“. Sure, solve one government subsidized shit show (student loan debt) with another one!
Is it any wonder that the entire supply and demand environment for housing has been thrown completely out of order? On one hand, the government wants to make housing affordable so that everybody can have it, which closely resembles socialism. On the other hand, they are targeting prices to rise 2% every single year and claim that this is normal and healthy economic policy that we should all be buying into and applauding. The left hand doesn’t know what the right hand is doing!
We wereon this case back in October 2017when we wrote an article pointing out that home prices had again eclipsed their highest point prior to the financial crisis. We knew this was coming. We at the time that the ratio of the trailing twelve month averages of median new home sale prices to median household income in the U.S. had risen to an all time high of 5.454, which following revisions in the data for new home sale prices, was recorded in July 2017. The initial value for September 2017 is 5.437.
In other words, the median new home in the US has never been more unaffordable in terms of current income.
Here we are 6 months later and “economists” are just figuring this out. What’s wrong with this picture?
What’s really happening is clear. Instead of letting the free market determine the pricing and availability of housing, the government has continued to try and manipulate the market in order to give everyone a house. This is simply going to lead to the same type of behavior that led Fannie Mae and Freddie Mac to fail during the housing crisis.
If we are going to have free market capitalism, the reality of the situation is that not everybody is going to own a house.
Furthermore, while there are many benefits to owning a house, there are also many reasons why people rent. Peter Schiff, for instance, often makes the case that renting is generally worth it because you’re saving yourself on upkeep and it allows you to be flexible with where you live and when you have the opportunity to move. He himself rents property for these reasons, which he often notes in his podcast. Sure, there are some benefits of homeownership, namely that a homeowner is supposed to be building equity in something, but looking again at the situation we are in today, is it worth investing in the equity of a home that might see its price crash significantly again, similar to the way housing prices did in 2008?
The government is creating both the problem and the solution here and instead of trying to continually fix the housing market, they should just keep their nose out of it and allow the free market to determine who should own a house and at what price. Call us crazy, but we don’t think that’s going to happen.
In San Francisco, a boom is always associated with its essential – and subsequent counterpart – the bust. They’re as typical to the city as sun and fog. And currently, judging by the insatiable appetite of home buyers in the city’s red-hot real estate market who appear completely unfazed stock-market volatility, tax-law changes, and tech sector gyrations, the city is in one heck of a housing boom, perhaps the biggest one ever, and national indices don’t do justice to how over-the-top mind-blowing crazy the situation has gotten.
Take for example, the S&P/Case-Shiller Home price index which covers not just the city (or county) of San Francisco but includes four other Bay Area counties: Alameda, Contra Costa, Marin, and San Mateo. There are more counties in the Bay Area, but they’re not included in the index. In terms of home prices, the five-county Case-Shiller index for “San Francisco,” though showing a significant, double digit annualgain of just over 10%, waters down the insanity happening every day on the streets of San Francisco.
To get a far more accurate, and granular neighborhood-by-neighborhood data for San Francisco itself, we go toParagon Real Estate Group’s March-April 2018 report, and what we find are vertigo-inducing price increases that have now beautifully spiked.
During the prior nationwide housing bubble that blew up with such fanfare, helped take down the world financial system, and caused central banks and governments to instigate the largest bail-out schemes the world has ever seen – from banks to entire countries – well, during that bubble, while it was still going on, homes in San Francisco reached what afterward were called totally crazy valuations, with the median price topping out in November 2007 at a mind-boggling $895,000. People were shaking their heads at the time. But after the boom came the inevitable bust. By January 2012, the median home price had plunged 31% to $615,000.
By then, however, the tsunami of money that global central bankers had unleashed was already washing over San Francisco from multiple directions: a stock-market and startup boom that the city is so dependent on, a tourist boom from around the world, wave after wave of Chinese, Russian and Petro-oligarchs desperate to park their ill-gotten cash in real estate, and of course, the veritable flood of nearly free funding. Everything came perfectly together. Then, over the course of just a little over three years, the median home price about doubled to $1,225,000, and we duly noted the unprecedented surge in prices back in the spring of 2015.
It turns out, that was just the start, because according to the latest Paragon report, the median sale price of a house in the city has since soared to a record $1.6 million in the first quarter, a 24% jump from a year earlier, and more than double the annual price increase reported by Case-Shiller. Q1 also rose above the previous high set in the fourth quarter of 2017 by $100,000.
This is what a real boom looks like.
As the report’s authors observe, prices in the city have been soaring for several years, as “feverish” demand far outstrips supply. Putting the recent price explosion in context, the median home price is now 80% above the prior-bubble completely mind-boggling median price that afterwards everyone admitted had been based on totally crazy valuations. Surely, this time is be different?
When compared to either California or the US, San Francisco houses and condos are in a world of their own: the median SF house sales price in 2017 was $1,420,000 (up from $1,325,000 in 2016), and for condos, it was $1,150,000 (up from $1,095,000). Looking just at the 4th quarter, median prices were $1,500,000 for houses (up from $1,350,000 in Q4 2016) and $1,185,000 for condos (up from $1,078,000) respectively.
On a neighborhood-by-neighborhood basis, the differences in median home prices are enormous. In the table below, the median house prices range from $960,000 in Bayview, one of the more troubled neighborhoods, to over $5 million in Pacific Heights. It is in this exclusive, gorgeous, and groomed neighborhood, endowed with breathtaking views of the Bay, where you find the humble abode of the champion of the poor, former Speaker of the House Nancy Pelosi.
How much bigger can this bubble get?
As the report’s authors write, “it is still very early in the year to come to definitive conclusions about where the year is going, but right now, in most market segments, buyer demand is competing ferociously for a limited supply of listings. Indeed, by some standard statistical measures of supply and demand – days on market, months supply of inventory, absorption rate – the SF market is about as heated now as it has been at any time in the past 10 years. This is especially true in the more affordable home segments, and particularly for house listings.”
The situation is somewhat more complicated in the highest price ranges, especially in the luxury condo segment where supply has been rapidly increasing. Of course, whatever the property type or price segment, it all ultimately depends on the specific property, and its location, appeal, preparation, marketing and pricing, although if there is a place where the bubble will pop, it will be in the ultra luxury segment, where the supply is off the charts:
The rest of the market, however, remains incredibly tight: only about 2% of house owners are putting their homes on the market each year, which is incredibly low by historical measures – and why should they? For many owners, the house doubles as a real-estate piggy bank where funds are parked for the indefinite future. Meanwhile, about 5% of condo owners sell their homes each year, plus the new-construction condos that come on the market. This dynamic has made houses into the scarce commodity, and has fueled dramatic house price appreciation.
Looking at the charts above, one thing is clear: the dynamics of the housing market in San Francisco have put the 2005-2007 bubble to shame – what is taking place is unprecedented, much the same as parallel events in capital markets. However, just like in the stock market, so among San Francisco housing what the catalyst will be that punctures this appreciation utopia, is still very much unknown.
Historic: A 1906 “video-enhanced” film of an original taken more than a hundred years ago on Market Street in San Francisco, with sounds representative of that time and location. Interesting to note that the average life expectancy in 1906 was 47 years; there were only 8,000 cars on the road in America; only 144 miles of paved roads; and the maximum speed limit was 10 mph. 1906 most popular songs can also be heard as you’re traveling down Market Street. To see the “Raw” film footage from which this enhanced version came from (with a detailed, scene-by-scene description) go to this site: The Library of Congress: https://www.loc.gov/item/00694408
Housing, aswe’ve pointed out in the past,is perhaps the most reliable bellwether of widening economic inequality in the US. And in its latest quarterly report on housing affordability in the US, ATTOM discovered that median-priced homes aren’t affordable to average wage earners in an astounding 68% of US housing markets.
In its report, the company calculated affordability by incorporating the amount of income needed to make monthly home payments – including mortgage payments, property tax payments and insurance – on a median-priced home, assuming a 3% down payment and a 28% maximum “front-end” debt-to-income ratio.
That required income was then compared with the median home price.
The 304 counties where a median-priced home in the first quarter was not affordable for average wage earners included Los Angeles County, California; Maricopa County (Phoenix), Arizona; San Diego County, California; Orange County, California; and Miami-Dade County, Florida. Meanwhile, the 142 counties (32 percent of the 446 counties analyzed in the report) where a median-priced home in the first quarter was still affordable for average wage earners included Cook County (Chicago), Illinois; Harris County (Houston), Texas; Dallas County, Texas; Wayne County (Detroit), Michigan; and Philadelphia County, Pennsylvania.
Already, the “hottest” housing markets are seeing an exodus of working- and middle-class individuals who can no longer afford to pay the high rents – let along afford to set aside enough money for a down payment.
Eight of the top 10 counties with the highest median home prices in Q1 2018 posted negative net migration in 2017: Kings County (Brooklyn), New York (25,484 net migration decrease); Santa Clara County (San Jose), California (5,559 net migration decrease); New York County (Manhattan), New York (3,762 net migration decrease); Orange County, California (3,750 net migration decrease); and San Mateo, Marin, Napa and Santa Cruz counties in Northern California.
Furthermore, ATTOM’s data found that this problem is getting worse, not better, with 41% of housing markets less affordable than their historical average during the first quarter. That’s up from 35% the quarter before.
Meanwhile, a staggering 73% of markets posted worsening affordability compared with a year ago, including Los Angeles, Cook County (home to Chicago), Maricopa County (Phoenix) and Kings County (Brooklyn).
The counties where the average wage earner would need to spend the highest share of their income to buy a median-priced home are Baltimore, Bibb County (Macon, Georgia) and Wayne County (Detroit).
Continuing with the trend of home prices rising more than twice as quickly as wages, home-price appreciation outpaced wage growth in 83% of housing markets.
When Fed Chairman Jerome Powellwarned last monththat “valuations are still elevated across a range of asset classes” and that he fears “signs of rising non-financial leverage” it’s possible that he was still understating the problem.
The REALTORS® Confidence Index is a key indicator of housing market strength based on a monthly survey sent to over 50,000 real estate practitioners. Practitioners are asked about their expectations for home sales, prices and market conditions. In addition, the “Questions of the Month,” feature results of a timely aspect of the housing market.
Note: the REALTOR® Confidence Index is provided by NAR solely for use as a reference. Resale of any part of this data is prohibited without NAR’s prior written consent.
Highlights
Properties were typically on the market for 37 days (45 days in February 2017).
First-time buyers accounted for 29 percent of sales (32 percent in February 2017).
Cash sales made up 24 percent of sales (27 percent in February 2017).
REALTORS® report “low inventory” and “interest rate” as the major issues affecting transactions in February 2018.
US housing data has been disappointing so far in 2018 as affordability plummets on the heels of rising rates, but that didn’t stop Case-Shiller Home Prices from surging at a faster-than-expected 6.4% YoY in January.
Home sales, permits, and starts have been underwhelming so far this year…
But according to Case-Shiller, home prices are accelerating at their fastest rate since July 2014 (up 6.4% YoY vs 6.15% YoY exp)…
All 20 cities in the index showed year-over-year gains, led by a 12.9 percent increase in Seattle and an 11.1 percent gain in Las Vegas.
After seasonal adjustment, Seattle, San Francisco and Atlanta had the biggest month-over-month gains.
Washington has the smallest month-over-month advance at 0.2 percent.
“The home price surge continues,” David Blitzer, chairman of the S&P index committee, said in a statement.
“Two factors supporting price increases are the low inventory of homes for sale and the low vacancy rate among owner-occupied housing.”
The 20-City Home price index is less than 1% away from the record highs of 2006…
But the National home price index is over 6% above 2006 highs…
This is the first time new home sales declined for 3 straight months since Q1 2014
Single-family home sales increased 4.2 percent last month to an annual rate of 4.96 million. Purchases of condominium and co-op units declined 6.5 percent to a 580,000 pace (down 4.9% YoY – the worst since Sept 2014)
However, the inventory of available properties plunged 8.1% YoY to 1.59mm, the lowest for February in data going back to 1999.
While purchases rose 11.4%MoM in The West, The NorthEast saw a 12.3% MoM plunge in sales (blamed on weather)
“There’s no letup in home-price growth, another testament to the solid, strong housing demand in the marketplace,” Lawrence Yun, NAR’s chief economist, said in a conference call with reporters.
“If prices were weakening that may be signaling a possible turning point but we are not really seeing that.” Inventory conditions remain “very tight,” he said.
However, it’s not been a pretty start to 2018 for US housing data as the Hurricane/Flood bump fades…
This home on Plymouth Drive in Sunnyvale, Calif. recently set the highest price per square foot ever recorded by the Multiple Listing Service. The two bedroom, two bath home – 848 square feet in size – sold in two days for $2 million. It had been listed for $1.45 million. That means it sold for $2,358 per square foot, which is the highest price per square foot in Sunnyvale recorded by MLS Listings which has data going back to Jan. 1, 2000.
SUNNYVALE — The small, unassuming home in the Cherry Chase neighborhood was on the market just two days before it sold for $2 million, a whopping $550,000 over its asking price.]
In this red-hot real estate market, the price tag barely caused a stir. What did was the other number that turned the home into another Bay Area record-breaker: It sold for the highest square-foot price recorded in Sunnyvale — a stunning $2,358, according to MLSListings, which tracks homes sales going back to 2000.
The jaw-dropping price tag suggests Sunnyvale, which has traditionally been less expensive than neighboring cities Cupertino or Palo Alto, is becoming a real estate destination in itself.
“I was blown away by it,”Doug Larson of Coldwell Banker, the real estate agent who sold the home, said of the price it fetched.
There’s nothing particularly breathtaking about the modest, one-story house on quiet, tree-lined Plymouth Drive. But it sits nestled at the center of one of the country’s most expensive real estate markets. As prices continue to increase throughout the Bay Area,pushing out even some highly paid tech workers, experts say more residents are flocking to relatively affordable Sunnyvale, driving up prices there.
“It’s become the new hot market,” said Jim Harrison, president and CEO of MLSListings.
Homes in Sunnyvale sold for a median price of $1.57 million in January, according to Zillow. That’s affordable compared to neighboring Cupertino, with a median sale price of $2.2 million, or Palo Alto, with a median price of $3 million.
But it may not stay that way for long. So far this year, homes in Sunnyvale are selling for an average of 28 percent over their listed price and are spending just nine days on the market, Harrison said. A four-bedroom, two-bath, 2,000 square foot house in the city recentlysold for close to $800,000 over its listing price, fetching $2.47 million.
The Plymouth Drive house is small by comparison, just 848 square feet, which contributed to its high per-square-foot price. But it’s on a large lot — 6,000 square feet. That makes it a prime candidate for the new owner to tear it down and build something else, Harrison said.
Realtor Juliana Lee of Keller Williams, who represents the buyer of the Plymouth Drive home, declined to comment on behalf of herself and her client.
Listing photos of the home show a small, beige house with a huge backyard, hardwood floors and a large front window with white shutters. Before the sale, the most expensive per-square-foot price recorded in Sunnyvale was $2,175, according to MLSListings. That was for a 1,839-square-foot, two-bedroom home on a 36,155 square foot lot, which sold for $4 million.
Sunnyvale has become popular in part because of its proximity to Silicon Valley’s tech jobs, said realtor James Morris of James Morris Homes, which has offices in San Jose and Saratoga. LinkedIn is headquartered in the city, Apple is just next door in Cupertino, and Google is on the other side in Mountain View.
Millennials don’t want to endure long commutes on the Bay Area’s clogged freeways, Morris said.
“They will pay that premium to be close to their jobs and not have to drive,” he said.
When Larson put the Plymouth Drive house on the market on Feb. 7, he asked for $1.45 million and assumed his client would get about $1.6 million. The next day, he opened the house for a realtor tour so the community’s agents could check out the property and determine if it was something their clients might want. It generated a lot of interest, Larson said, with some agents indicating they had buyers willing to offer as much as $1.8 million.
Friday morning, a realtor called Larson and told him she was sending over an offer. Larson told her his client wasn’t accepting offers until the following Wednesday, but the persistent realtor refused to take no for an answer and sent her client’s offer that afternoon.
It was too tempting to pass up — $2 million, all cash, closing in 10 days. The seller was shocked.
“She said, ‘What?’” Larson said. “She was as taken aback as I was.”
Peter Thiel and his band oflibertarian-leaning Silicon Valley-typesaren’t the only ones scrambling to leave the Bay Area: As we’ve noted time and time again, staggering economic inequality is a daily fact of life in the area surrounding San Francisco – largely because rapidly growing home valuations have left couplesearning as much as $500,00 a year feeling like they’re being steadily priced out.
And while we’ve previously covered the exodus of renters to low-cost states like Texas, in a report published Saturday, theEast Bay Timesexplores an even more troubling trend: Landlords are increasingly taking the cue from their tenants and joining in the exodus.
After all, with one in four US homes sold during 2017 going for more than $500,000 above their asking – particularly in hot real-estate markets like San Francisco, where buyers battling for the highest bid have begun relying on clauses that will automatically – and incrementally – raise their bids until they either emerge victorious,or reach a predetermined ceiling.
For at least the last nine months, the Bay Area has led the country in the number of departing residents, as everybody who isn’t a tech worker – including essential civil servants like police and fire fighters – begins to feel like a secondary servile class. One landlord said several of his tenants asked if they could move with him when he announced he was selling the building and departing for Colorado
Tony Hicks moved to San Jose in 1981, but he’s had enough.
Hicks told his 11 tenants he would soon place the three homes he owns on the market. He expected disappointment. Instead, most wanted to move with him to Colorado.
“It didn’t take them long,” Hicks said. “I was surprised.”
Hicks first bonded with many of his tenants over their shared appreciation for conservative politics in an environment that is openly hostile to views that don’t conform to the dominant neoliberal ideology.
“I’ve been thinking about this for a long time,” said Dan Harvey, 60, a retiree in one of Hicks’ rentals who is concerned about the traffic he fights on his Harley Davidson and the high cost of living. “A fresh start.”
Rising prices, high taxes and his suspicion that the next big earthquake is just a few tremors away convinced the retired engineer to put his South San Jose properties up for sale.
The groundswell to leave Silicon Valley — the place of fortunes, world-changing tech and $2,500 a-month-garage apartments — has been building. For at least the last nine months, the San Francisco metro area has led the nation in the number of residents moving out, according to a survey by online brokerage Redfin.
San Jose real estate agent Sandy Jamison has seen many long-time residents and natives leave the state recently. The lack of available housing, leading to some of the priciest real estate in the country, is driving many from the region, she said.
The landlord and tenants came together through Hick’s rental ads on Craigslist and in the newspaper over the last two decades. They grew close with common bonds of conservative politics, religious faith and motorcycles.
It’s an unlikely collection of 10 men and one woman — a retired engineer, a few military veterans, blue collar workers and others on fixed incomes. Few say they could afford to go it alone in the sky-high housing market in San Jose, where a typical two bedroom rents for about $2,500 a month, far more than what they pay Hicks.
Most of the men are divorced, widowed or never married, and many suffer from health ailments and a crankiness exacerbated by Bay Area traffic, crowding and the state’s liberal policies on crime and immigration.
Hicks, 58, was an engineer and marketing executive at IBM, Xerox and other companies before retiring in his early 40s to raise his daughter from his first marriage.
…
He bought a few investment properties in South San Jose, and looked for long-term returns when he sold them. He kept rents low — between $500 to $1,200 a month for one bedroom — and never raised prices once a tenant signed a lease.
Many of his tenants have been with him for more than a decade.
“We became brothers,” said Mike Leyva. The 64-year-old Army veteran and retiree signed a lease in 2004 and never left.
And Hicks and his compatriots aren’t alone – not by a long shot: A five-county poll conducted for the Silicon Valley Leadership Group and the East Bay Times found that more than one-third of Bay Area apartment renters and one-quarter of residents in their 20s and 30s say they are struggling to afford their housing.
Many longtime residents also describe a feeling of alienation that seemed to accompany the tech boom.
According to one real estate agent, the top reasons people leave the Bay Area are as follows: high taxes, cost of living, quality of life from traffic to homelessness, politics and high housing prices. For many long-time residents, she said, “they feel like they don’t belong here any more.”
For Hicks, lofty real estate valuations were the last incentive he needed.
In recent years, Hicks began to believe there was a better life outside the valley.
Vaulting real estate prices added incentive. He kept up on tax laws that could maximize the returns on his property. Selling his San Jose rental houses and buying new properties with the proceeds would allow him to defer taxes. “It’s a great financial move,” he said.
Hicks was also moved by discussions with his pastor and sermons at his church, the Vietnamese Living Word Community Church, about Biblical journeys. His spiritual beliefs guided him to his decision to move with his new wife, Fidessa, 31, and her 8-year-old daughter.
Cautiously, he broke the news to his friends.
“I was totally shocked,” Leyva said. “I thought he was joking me. I had a lot of questions about it.”
The tenants who are accompanying Hicks expect to save hundreds of dollars a month in rent when they relocated to Colorado…
QUOTE
Levya spent two days researching the move and became convinced. He expects to slash his rent from $1,200 to about $800 a month, with more room in a newer home bought by Hicks. “I’m excited,” Leyva said. “It’s going to be a new journey in my life.”
Ed Blomgren, 70, pays $495 a month for one bedroom and a shared bathroom. The retired machinist, a Navy veteran, lives on a fixed income and couldn’t afford market-rate rent.
Blomgren grew up in Colorado, and he welcomes a chance to return to his home state, where he still has family. “At my age,” he said, “I think it might be a good thing.”
After he finishes selling off his portfolio of Bay Area propterties, Hicks expects to get a much bigger bang for his buck when he buys a new home in Colorado. The median home value in Colorado Springs is $263,000,compared with $1 million for a single family home in San Jose, according to real estate website Zillow.
Hicks’ plan, as it stands, is to sell all three homes and buy a half-dozen newer, bigger and cheaper homes in the smaller, mountain town that’s home to the US Air Force Academy.
Within a day of listing his Raposa Court home, Hicks had two offers in hand that – like most sales in the area – were well above his $1 million asking price…
Homebuyers increasingly can’t afford what they want.
Higher mortgage rates, combined with the loss of homeowner tax breaks in some of the nation’s most expensive markets, are taking away buying power.
New home sales were also down 9% in December
New home sales down 7.8% in January, on top of being down 9% in December
Sales of newly built homes are falling, and the culprit is clear. Homebuyers increasingly can’t afford what they want. Higher mortgage rates, combined with the loss of homeowner tax breaks in some of the nation’s most expensive markets, are taking away buying power.
Sales fell in December, when the new tax law was signed, and then again in January, when mortgage rates moved higher. Sales are now at their lowest level since August of last year.
The government’s measure of new home sales is based on signed contracts during the month, reflecting the people who are out shopping and signing deals with builders. It is therefore a strong read on current reactions to home affordability. Mortgage rates moved a full quarter of a percentage point higher during January, from below 4 percent to about 4.25 percent. It then took off further from there.
“It seems that the jump in mortgage rates in January had an immediate impact on contract signings,” wrote Peter Boockvar, chief investment officer at Bleakley Advisory Group. “You can’t get more interest rate sensitive when it comes to homes and cars with the associated cost to finance.”
Higher home prices are adding to the difficulty for buyers. The median price of a newly built home rose to $323,000, a 2.5 percent gain compared with January 2017. Builders are not only increasing prices, but they are also mostly focused on the move-up market, not the entry level where homes are needed most.
While there is a severe shortage of existing homes for sale, the opposite appears to be the case in the new home market. Supply rose to the highest level in four years, another sign that new construction is increasingly out of financial reach for today’s home buyers.
“The drop in sales may be due to saturation in the upper price range of the market, which should compel builders to follow the market and build more moderately priced homes,” wrote Joseph Kirchner, senior economist at Realtor.com. “We may be beginning to see this with the largest drop for new home sales in homes priced above $500,000.”
The expectation had been for an increase in new home sales in January, after the sharp drop in December. Some economists argue that when rates begin to rise, there is an initial surge reaction from buyers who want to get in before rates increase even further. That did not happen, likely because affordability stood in the way.
Builders did note a drop in buyer traffic in January, according to a monthly sentiment survey from the National Association of Home Builders. That measure did not improve in February, when rates moved even higher. Builder confidence remains high, but largely due to sales expectations over the next six months, not current sales conditions or buyer traffic.
Builders may be counting on the tight supply in the existing home market to push more business their way. Sales of existing homes fell in January as well, with the blame laid squarely on a severe shortage of homes for sale.
“This report is undoubtedly disappointing. Like 2017, 2018 isn’t setting up to be particularly favorable for builders — construction materials and permitting costs are high and rising, labor is tight, and desirable, buildable land is scarce and expensive,” wrote Aaron Terrazas, senior economist at Zillow. “It seems clear that we shouldn’t expect a big breakthrough in new home sales any time soon, and should instead look for incremental progress at best. At this point, we’ll take whatever we can get.”
After new- and existing-home sales tumbled in December, expectations were for a modest 0.5% rebound in January (despite plunging mortgage applications and soaring rates). But that did not happen as existing home sales tumbled 3.2% MoM to its lowest level since Aug 2016.
NOTE – this data is based on signed contracts from Nov/DEC, which means the recent spike in rates is not even hitting this yet)
Existing home sales are down 4.8% YoY – the biggest drop since August 2014.
The West (-5.0%) and Midwest (-6.0%) saw the biggest drop in sales and while the blame (see below) was put on inventories, data shows a 4.1% increase in “available for sale” homes?
Of course NAR is careful to blame inventories – and not soaring rates affecting affordability: Lawrence Yun, NAR chief economist, says January’s retreat in closings highlights the housing market’s glaring inventory shortage to start 2018.
“The utter lack of sufficient housing supply and its influence on higher home prices muted overall sales activity in much of the U.S. last month,” he said.
“While the good news is that Realtors® in most areas are saying buyer traffic is even stronger than the beginning of last year, sales failed to follow course and far lagged last January’s pace.
“It’s very clear that too many markets right now are becoming less affordable and desperately need more new listings to calm the speedy price growth.”
The median existing-home price in January was $240,500, up 5.8% from January 2017.
First-time buyers were 29 percent of sales in January, which is down from 32 percent in December 2017 and 33 percent a year ago.
“The gradual uptick in wages over the last few months is a promising development for the housing market, but there’s risk these income gains could be offset by the recent jump in mortgage rates,” said Yun.
“That is why the pace of added new and existing supply in the months ahead is worth monitoring. If inventory conditions can improve enough to cool the swift price growth in several markets, most prospective buyers should be able to absorb the higher borrowing costs.”
So, will higher rates break housing market momentum?
The following chart suggest ‘yes’ – that surge in rates will have a direct impact on home sales (or prices will be forced to adjust lower) as affordability collapses…
Growth? Inflation? Be careful what you wish for, as the surge in Treasury yields has sent mortgage interest rates to their highest in four years, flashing a big red warning light for affordability and home sales in 2018…
The U.S. weekly average 30-year fixed mortgage rate rocketed up 10 basis points to 4.32 percent this week. Following a turbulent Monday, financial markets settled down with the 10-year Treasury yield resuming its upward march. Mortgage rates have followed. The 30-year fixed mortgage rate is up 33 basis points since the start of the year.
Will higher rates break housing market momentum?
As the following chart shows, that surge in rates will have a direct impact on home sales (or prices will be forced to adjust lower) as affordability collapses…
The number of US renters is growing much more rapidly than the number of homeowners, so it shouldn’t come as a surprise that rents in the vast majority of American cities climbed again last month – continuing a trend that has largely persisted since the financial crisis, according to data compiled byRentCafe, a website that provides rental listings nationwide. RentCafe occasionally analyzes the reams of data it collects to provide insightful clues about the US housing market. And asmarkets pukedfollowing a robust headline increase in average hourly earnings – one of the first signs that stagnant consumer prices might once again rise – RC’s latest report shows that the national average rent was $1,361, 2.8% higher than this time last year, but flat on a monthly basis.
Nearly 90% of the nation’s biggest cities have seen rents grow in January; in 9% of cities rents remained unchanged, while only 2% experienced price declines…
Contrary to the conventional wisdom, it was actually America’s smaller cities that saw the greatest increases (to be sure, that’s probably because markets like San Francisco are already well past the boundaries of what typical middle-class workers can afford). These markets include Gilbert, AZ rose 8.5%, Roseville, CA (8.5%), and Fort Collins, CO (7.9%) breaking the top 10.
Meanwhile, in a sign that some of the hottest housing markets in the country are starting to buckle under the weight of over development, RC found that the only major market where rents dropped year-over-year was Brooklyn, where rents decreased by 14%.
Read RentCafe’s entire report below:
The price of apartments has gone up in 89% of the nation’s 250 largest cities in January 2018, as demand for rentals remains elevated throughout the country, sustained by an improving economy and low unemployment. Renters continue to embrace apartment life, as rent prices are increasing at a strong and steady annual rate of 2.8%, nationwide, reaching $1,361/month in January 2018.
The price of two-bedroom units is increasing the fastest
One and two-bedroom apartments remain the most in-demand apartment sizes in the U.S. The price of two-bedroom rentals has climbed the most over the year, with a 3.5% increase in rates, exceeding $1,400/month on average, while the price for one-bedroom units has increased by 3.4%, renting for $1,225/month on average in January. The slowest growing apartment type in January were studio apartments, renting for 2.5% more than this time last year.
Rents in 6 cities, including Brooklyn, NY, continue to slide
In only six cities out of the 250 studied are rents cheaper than they were one year ago. With a large new inventory of apartments to fill, the rental market in Lubbock, TX has seen the biggest drop in prices year over year, -6.3%, with an average apartment now renting for less than $900/month. Norman, OK is also seeing a slight decrease in the average rent (-2.3%), as a result of thousands of new apartments hitting the market in just the past few years, with an average rent of $861/month as of January 2018.
Diminished demand for housing has affected prices in McAllen, TX, which have declined by -2.2% year-over-year. Rents in Kansas City, KS and Baton Rouge, LA are also sliding slightly this month, by less than 2%. The only large market to see a decrease in rents is Brooklyn, NY, which had wrapped up last year -1.7% below the previous year’s levels, maintaining the downward direction in January as well, with rents down by -1.1% year over year.
U.S. Cities Where Rents Decreased Y-o-Y in January 2018
Three new cities break the top 10 with greatest rent increases
At the beginning of the year, we have three new cities entering the top 10 for fastest growing rents in the U.S. Fueled by increasing demand, Gilbert, AZ (8.5%), Roseville, CA (8.5%) and Fort Collins, CO (7.9%) saw big rent bumps over the past year. Rental prices in Gilbert, AZ are rising fast, clocking in at $1,156/month in January, as its population has been growing at extremely high rates, demand for housing has skyrocketed,and a big portion of the Gilbert population is renting.
Sacramento Metropolitan Area’s City of Roseville is joining Sacramento — where apartment prices have been on a steep climb for a while now — as one of the top 10 cities in the country with the fastest rising rents. The price ofapartments in Roseville, CAhas jumped by as much as 8.5% year-over-year, with the average rent currently exceeding $1,600/month. Fort Collins, CO has also become one of the country’s fastest growing rental markets, with residents and Colorado State students competing for a limited number of rental apartments. Rates are up almost 8% from the same time last year, a Fort Collins rental apartment costing on average $1,436/month at the moment.
Oil centers Odessa and Midland, TX are still at the top of the list with the highest rent rebounds over the year, 35% and 31.4% respectively. Buffalo, NY (12.1%) and Lancaster, CA (10.2%) also struggling with double-digit price hikes year-over-year.
U.S. Cities with the Fastest Growing Rents in January 2018:
The most expensive California rents push the limits again in January
The priciest cities for renters remain big urban job centers on both coasts, with Manhattan, NY at the top of the list with an average apartment rent of $4,079, unchanged from the previous month and down slightly by -1% over the year.
If renters living in The Golden State where hoping for a respite from high rents in the new year, they’re not getting it yet. Prices went up again in January in all 5 California cities in the top 10 most expensive for renters, with the highest rates in the state being in San Francisco, $3,448/month. Jersey City apartments, the sixth most expensive in the U.S., also saw increased rates this month, reaching $2,855.
Wichita, KS, Tulsa, OK, and Toledo, OH remain the country’s top 3 most affordable cities for renters, alongside 7 other Midwestern and Texan towns where average rents do not exceed $730/month, a fraction of the prices in coastal cities. In fact, things have been quiet in these parts of the country, as rents remained flat or grew slower than the national average in 9 out of 10 cities. Fort Wayne, IN was the only one to see a significant jump in prices for the year, 4.5%
At the start of the new year, rents are expected to continue rising throughout the country slightly above inflation, as demand for apartments remains strong from all generations of renters. Doug Ressler, senior analyst at Yardi Matrix, offered his opinion as to what renters can expect as we begin a new year:
You can find the average rent in your city atRentCafe.
A historic property in this rustic Italian village could be yours for less than the cost of a coffee — but, of course, there’s a catch
Cagliari, Italy, pictured, is the capital of the island of Sardinia, and lies about 105 kilometers south of Ollolai, where a house can be had for a mere €1.
Ever dreamed of packing up and moving abroad — to, say, a rustic Italian village? Now may be the time to make it happen.
Ollolai, a village on the Mediterranean isle of Sardinia, is,according to CNN, offering up its empty housing stock for the bargain price of just €1, or about $1.25.
The Italian island of Sardinia is highlighted on this European map. It lies just south of the French-controlled island of Corsica.
Of course, there is a catch. Buyers must commit to refurbishing their bargain-basement house within three years, which is likely to carry an estimated additional expense of $25,000 or more.
It’s all part of a plan to bring life back into a town that has watched its population sink from 2,250 to 1,300 over the past half decade, according to CNN. Most of the homes are in poor condition.
“We need to bring our grandmas’ homes back from the grave,” Ollolai Mayor Efisio Arbau reportedly told CNN.
Colorful sunshade umbrellas hang over the street in Pula, Italy, another village on the island of Sardinia, where homes are being sold for just €1.
If the plan works, the town, comprising a virtual maze of alleys and mural-adorned piazzas surrounded by stone dwellings, could turn the city into a stereotypically picturesque Italian village once more. And for homeowners, it could be an opportunity to retire to a more relaxing way of life. The town is known for its locally made premium sheep cheese, Casu Fiore Sardo; handwoven baskets; and traditional celebrations.
But if you think you might want to move to Ollolai, you’ll have to act fast. The €1 pricing is only available through Feb. 7,according to the city’s website.
Just after Wolf Richter reported on the minuscule 1.4% year-over-year growth of per-capita “real” disposable income and the lowest saving rate in 12 years —for the lucky ones— there’s another asset-bubble doozie: The S&P CoreLogic Case-Shiller National Home Price Index for November, released this morning, rose 6.2% year-over-year (not-seasonally-adjusted). The index has now surpassed by 6.1% what was afterwards called the crazy peak of Housing Bubble 1 in July 2006 and is up 46% from the bottom of Housing Bust 1:
Real estate prices are a result of local dynamics but are also impacted by national and global factors, including monetary policies and foreign non-resident investors trying to get their money out of harm’s way. This causes local housing bubbles, operating on their own schedules. When enough of them occur simultaneously, it becomes a national housing bubble. See chart above.
The Case-Shiller Index is based on a rolling three-month average; today’s release was for September, October, and November data. Instead of median prices, the index uses “home price sales pairs,” for example for a house that sold in 2010 and then again in 2017. The index provider incorporates other factors and uses algorithms to adjust the price movement into an index data point. The index was set at 100 for January 2000. An index value of 200 means prices as figured by the algorithm have doubled since then.
Here are the most magnificent leaders among the housing bubbles in major metro areas:
Boston:
The index for the Boston metro area edged down again on a monthly basis, the second decline in a row after 22 months in a row of increases. It has essentially been flat for four months but is still up 6.3% year-over-year. The slight monthly decline could be within the normal seasonal variations but there were no seasonal variations during the relentless surge in 2016 and 2015. During Housing Bubble 1, from January 2000 to October 2005, the index for Boston soared 82% before plunging. The index now exceeds the peak of Housing Bubble 1 by 12.5%:
Seattle:
The Case-Shiller home price index for the Seattle metro ticked up a smidgen on a month-to-month basis, after the first two back-to-back declines since the end of 2014! It has now been flat for the past five months. However, flat spots or slight declines in the index this time of the year were not unusual before 2015. The index is up 12.7% year-over-year, 20% from the peak of Housing Bubble 1 (July 2007), and 79% from the bottom of Housing Bust 1 in February 2011:
Denver:
The index for the Denver metro ticked up again on a monthly basis, the 25th increase in a row. It is up 7.0% year-over-year and has surged 45% above the prior peak in July 2006. Instead of the craziness of Housing Bubble 1, Denver experienced more “normal” home-price increases, and was therefore also spared the ravages of Housing Bust 1. But in 2012, Housing Bubble 2 erupted in full force:
Dallas-Fort Worth:
The index for the Dallas-Fort Worth metro ticked up again on a monthly basis — the 46th month in a row of increases. It is up 7.0% year-over-year and 43% from the prior peak in June 2007. Like Denver, Dallas experienced saner times during Housing Bubble 1. But prices began to surge relentlessly in 2012:
Atlanta:
The home price index for the Atlanta metro has now been flat (actually down a tiny bit) for three months in a row, in line with prior seasonal declines, but is still up 5.2% year-over-year and 2.6% above the peak of Housing Bubble 1 in July 2007. From that peak, the index plunged 37%. It’s now up 70% since February 2012:
Portland:
The Case-Shiller index for Portland was flat in November, and has now been flat or slightly down for five months in a row, and for now still in the range of normal seasonal patterns. The index is up 6.9% year-over-year and has skyrocketed 73% in five years. It’s 20% above the crazy peak of Housing Bubble 1 and has ballooned 123% since 2000:
San Francisco Bay Area:
The index for “San Francisco” covers the county of San Francisco plus four other Bay Area counties — Alameda, Contra Costa, Marin, and San Mateo (the northern part of Silicon Valley). It jumped 1.4% for the month, after jumping 1.2% in the prior month. It’s up 9.1% year-over-year, up 31.3% from the insane peak of Housing Bubble 1, and up 85% from the end of Housing Bust 1. The index has surged 151% since 2000:
Los Angeles:
Home prices in the Los Angeles metro, as tracked by the index, rose 0.7% for the month, and 7.0% year-over-year. LA’s Housing Bubble 1 was in a category of its own in its steepness on both sides, with home prices skyrocketing 174% from January 2000 to July 2006, before collapsing and surrendering much of the gains. The index has skyrocketed since Housing Bust 1 and is now within a smidgen of the prior insane peak:
New York City Condos:
Case-Shiller has a special index for New York City’s condo because this is such a vast market. And this index rose another notch in November and is up 4.4% year-over-year. The index soared 131% from 2000 to February 2006 during Housing Bubble 1, barely deflated during the bust before QE unleashed money from around the world which then re-floated Wall Street more than anything else. The index is 18% above the peak of Condo Bubble 1 and has nearly tripled over the past 17 years:
This is asset-price inflation at work — now that “homes” have become a global asset class. These homes didn’t get 50% bigger or 50% nicer over the past few years. Instead the purchasing power of the dollar with regards to these assets has been purposefully demolished by the Fed’s monetary policies that resulted in practically no wage inflation, moderate consumer price inflation, but massive asset-price inflation. Asset-price inflation without corresponding wage inflation means that the value of labor (wages earned) with regards to homes and other assets has been crushed — a phenomenon now hypocritically called the “affordability crisis” in many big urban areas in the US.
The housing market continues to operate in a very lean environment. Home builders are building but are focusing their efforts on multi-family units to cater to agrowing renting population. Builders are also shy about placing big bets given the recent memory of the previous housing bubble. Places where they can build freely like Arizona, Nevada, and Florida are known to pop as quickly as they go up in value. And in areas like California, where NIMBYism rules the day, people are now convinced that prices will never go down so the ratio of bulls to bears is extremely high. The sentiment seems to be that there could be no wrong in purchasing real estate even if it means leveraging up into acrap shack. Yet what is very telling is that inventory is still very low after many years.
Bouncing at the bottom
Inventory has been bouncing near the lows for almost six years now:
Nationwide inventory is down 10 percent year-over-year from an already low year.
In Los Angeles, inventory is down 22 percent year-over-year from an already low year.
What this means for house buyers is that you are going to encounter slim pickings, house lusting shoppers, and a market sentiment favoring sellers. If you are buying, you are not in the driver’s seat. If you are selling, you can command top dollar even for a shantycrap shack.
One thing that has changed since the late 1990s is that we now seem to live in a perpetual boom and bust cycle. Housing being a safe investment that tracks inflation is no longer the case. Real estate is now like a hot stock with big leverage behind it. When things are good, it can be very good. When things go bad, they can turn quickly. And for most people, the challenge in the last housing bust was simply making the mortgage payment. Recessions tend to expose those who are over leveraged in debt.
People seem to think this hot market is because of the current administration which is hard to believe. Timothy Geithner set the markets on fire in 2009 with QE:
Quantitative Easing essentially reversed the market and we have yet to look back since 2009. But this happened nearly a decade ago which is hard to believe. Yet to think all of this euphoria is happening because of current policy is incorrect. And clearly anyone in power is going to leverage positive factors to their side, regardless of party affiliation. But one things is clear and that is things are looking frothy across multiple asset classes.
The housing market is deep into a FOMO stage. There is a deep seated fear now that people will miss out: That$700,000 crap shack will be $1 million. Bitcoin will be $30,000. The Dow will hit 30,000. Everything seems to be going up yet the homeownership rate is stagnant and housing inventory is in the dumps.
The continued drought in inventory means that people will be bidding up crap shacks. The typical home in the US costs $206,000. The typical L.A. home is $632,000. It’ll be interesting to see how much more this market can sustain because the bull fever is definitely out:
The VIX Index shows near record low volatility meaning people expect the party to go on forever. The index nearly looks as low as housing inventory.
The chart does not quite show what MND headline says but the difference is a just a few basis points. I suspect rates inched lower just after the article came out.
For the past few weeks, rates made several successive runs up to the highest levels in more than 9 months. It was really only the spring of 2017 that stood in the way of rates being the highest since early 2014. After Friday marked another “highest in 9 months” day, it would only have taken a moderate movement to break into the “3+ year” territory. The move ended up being even bigger.
From a week and a half ago, most borrowers are now looking at another eighth of a percentage point higher in rate. In total, rates are up the better part of half a point since December 15th. This marks the only time rates have risen this much without having been at long term lows in the past year. For example, late 2010, mid-2013, mid-2015, and late 2016 all saw sharper increases in rates overall, but each of those moves happened only 1-3 months after a long term rate low.
Not a Drill
So far this month, MBS have stunningly dropped over 200 bps, which easily translates into a .5% or more increase in rates. I’ve been shouting “lock early” for quite a while, and this is precisely why, This isn’t a drill, or a momentary rate upturn. It’s likely the end of a decade+ long bull bond market. LOCK EARLY. -Ted Rood, Senior Originator
Housing Bust Coming
Drill or not, if rising rates stick, they are bound to have a negative impact on home buying.
In the short term, however, rate increases may fuel the opposite reaction people expect.
Why?
Those on the fence may decide it’s now or never and rush out to purchase something, anything. If that mentality sets in, there could be one final homebuilding push before the dam breaks. That’s not my call. Rather, that could easily be the outcome.
Completed Homes for Sale
Speculation by home builders sitting on finished homes in 2007 is quite amazing.
What about now?
Supply of Homes in Months at Current Sales Rate
Note that spikes in home inventory coincide with recessions.
A 5.9 month supply of homes did not seem to be a problem in March of 2006. In retrospect, it was the start of an enormous problem.
In absolute terms, builders are nowhere close to the problem situation of 2007. Indeed, it appears that builders learned a lesson.
Nonetheless, pain is on the horizon if rates keep rising.
Price Cutting Coming Up?
If builders cut prices to get rid of inventory, everyone who bought in the past few years is likely to quickly go underwater.
For the 29th month in a row, US home prices rose at a faster pace than incomes with November prices rising a better than expected 6.41% – the highest since July 2014.
The 20-City Composite rose 6.41% YoY in November (above the 6.30% expectations)
The 20-City Composite price index is within 1% of its record highs from 2006…
Following yesterday’sdisastrous drop in existing home sales(due to record low supply), new home sales plunged 9.3% MoM after November saw its biggest surge since Jan 1992, revised dramatically lower.
The November 17.5% spike was revised dramatically down to 15.0% spike – the highest since 1993 but December’s 9.3% plunge was already worse than the expected 7.9% giveback…
Biggest MoM drop since Aug 2016.
In fact the downward revisions are huge… October from 624K to 599K; November from 733K to 689K
As good as it gets?
While the blame is immediately laid on weather, the regional drops show that is simply not correct:
Purchases fell in all four U.S. regions, led by a 10 percent drop in the Midwest and a 9.8 percent slide in the South.
Median Home Prices reached a new record high…at $335,400
As Bloomberg notes, new-home sales, tabulated when contracts get signed, account for about 10 percent of the market. They’re considered a timelier barometer than purchases of previously owned homes, which are calculated when contracts close and are reported by the National Association of Realtors.
But the ongoing lack of supply remains the most notable aspect in the US housing ‘recovery’.
Alhambra’s Jeffrey Snider notescritically that it’s what’s going on underneath the headline that really matters (as always). The reluctance of Americans to sell their houses has become such a contradiction to the attempt to paint the housing market, and therefore the overall economic condition, as healthy, even robust. Prices are rising, in some places quickly. Yet, inventory of available-for-sale homes continues to decline, sharply once again in December.
It’s a glaring dichotomy that ever the NAR’s Chief Economist, Larry Yun, has been forcedto grudgingly address.
Existing sales concluded the year on a softer note, but they were guided higher these last 12 months by a multi-year streak of exceptional job growth, which ignited buyer demand. At the same time, market conditions were far from perfect. New listings struggled to keep up with what was sold very quickly, and buying became less affordable in a large swath of the country. These two factors ultimately muted what should have been a stronger sales pace.
It’s the “exceptional job growth” premise that leads toward only confusion. It’s one of those terms, like “globally synchronized growth” or “economic boom”, that refers quite differently to only the mainstream depiction of the economy, the one that has been consistently overoptimistic about things for a decade. The actual data suggests an entirely separate set of circumstances, which is where all this misunderstanding comes in.
In truth, falling inventory is quite easily explained, and in a way that is perfectly consistent with labor market and national (labor) income statistics as they are. The BLS outside of the unemployment rate, which, for the nth time doesn’t include Americans who would work if there was work, actually has been describing a consistently and persistently slowing labor market. The timing of where that started matches with where resale inventory began to contract.
There is actually a big difference between an average payroll gain of 150k and 250k; the latter is barely minimal, while the former is what panicked the Fed into launching QE3 in 2012. Last year was by every reasonable measure not even close to a good one for American workers.
The primary effect of sluggish, constrained payroll expansion, along with parallel effects in other labor factors, is weakened aggregate income. Even people who are working start to become uncertain or even fearful when the jobs market as a whole slows down – and not just slows, but continues to decelerate year after year (after year). This trend will be starting its fourth year. At that length, workers and prospective workers become quite certain about their general uncertainty.
If your ground-level view of the jobs environment and therefore economy is far more unsteady and dour than exceptional, you are not going to be as sure about selling your existing home to move up, taking on a larger monthly payment in the process. The more people like you who pass on the opportunity to cash in on higher prices, the more that says this is a widespread view quite different from the narrative established in consumer sentiment surveys and what news outlets write about in their headlines.
The economy is what actually happens, not what people think other people think Economists say is happening. Talk isn’t cheap, it’s wayovervalued.
A little over a year ago, home prices finally surpassed their prior all-time highs, reached during the heyday of the housing bubble back in 2006.
But with home prices in 80% of US cities are growing twice as fast as wages, working-class families across the US are finding it increasingly difficult to support their families – let alone afford a home. But fortunately, this hasn’t been a problem for institutional investors like Blackstone, which are presently enjoying the luxury of a controversial valuation assessment known as a Broker Price Opinion – or BPO.
As the Wall Street Journalexplains, Congress prohibited the use of BPOs to underpin traditional mortgages as part of Dodd-Frank. But, fortunately for private-equity firms and their limited partners, that prohibition doesn’t apply to investors buying tens of thousands of homes.
Blackstone and its lender, Deutsche Bank AG, settled on a sort of drive-by valuation done by real-estate agents that are more cursory and cost far less than traditional appraisals.
Congress outlawed the use of such assessments, called broker price opinions, or BPOs, to value properties for traditional mortgages. But the prohibition, enacted as part of postcrash financial regulation, doesn’t apply to investors buying tens of thousands of houses.
Now these perfunctory valuations abound, underpinning tens of billions of dollars of home deals. Sometimes the process is outsourced to India, where companies charge real-estate agents a few dollars to come up with U.S. home values by consulting Google Earth and real-estate websites.
That’s right: Shoddy satellite photos and workers at call centers in India – thousands of miles away from the homes they’re evaluating – are making up prices for homes that are then used to value collateral used in bond offerings. In fact, BPOs have been used to value collateral in the more than $20 billion of bonds sold by institutional landlord. They’re also thefast-growing business of lending to individual house flippers. Banks request them when considering whether to foreclose or negotiate repayment plans with delinquent homeowners.
Their popularity shows how Wall Street is finding ways to adapt to government efforts to crack down on some of the excesses that contributed to the housing crisis. Whileauthorities in Canada and Australiahave passed laws to curb speculation in their respective housing markets, US regulators have been unwilling to challenge BPOs – though the SEC is investigating whether certain rental-home companies used these shoddy valuations to distort the value of bonds tied to the deal. Critics say BPOs are ill-suited to gauge home values and could leave debt holders with less collateral than they thought.
So what are the risks, exactly? Well, inaccurate pricing information could result in abrupt and unexpected losses for investors when a more thorough appraisal is sought.
“BPOs are a creature of financial institutions that want deals to close fast, and so they don’t have to use an appraiser,” said Donald Epley, a retired University of South Alabama professor who helped write national appraisal standards after the 1980s savings-and-loan collapse. “You’re just dumbing down the standards to make the loan.”
Some credit rating firms have realized that these valuations aren’t reliable, and have stopped accepting them, or sought a second opinion.
When Fannie Mae last year guaranteed about $1 billion of Invitation Homes debt, it accepted BPOs for the 7,204 houses serving as collateral. Assuming a typical appraisal price of $450 and the $95 that Invitation Homes pays per BPO, the company saved about $2.6 million.
Credit-rating firms usually discount BPO values when grading rent-backed bonds. Kroll Bond Rating Agency has trimmed them by about 10% and uses the lower of the reduced BPOs and the amounts spent buying and renovating the homes.
“We’re never taking BPOs at face value,” said Kroll’s Daniel Tegen.
With many institutional investors expect, as Goldman Sachs put it, “a strong and synchronous global expansion” during the coming year, housing bears are difficult to come by. But Bloomberg managed to find one: James Stack, an investor who manages $1.3 billion for high net worth individuals, says that his “Housing Bubble Bellwether Barometer” is flashing red again. Stack predicted the housing crash back in 2005, just as home prices were reaching their peak.
His assessment of the market should send a chill down the spine of foreign investors who have poured money into New York City, San Francisco and other hot urban housing markets that have led the recovery in home valuations.
“It is 2005 all over again in terms of the valuation extreme, the psychological excess and the denial,” said Stack, whose fireproof files of newspaper articles on bear markets date back to 1929. “People don’t believe housing is in a bubble and don’t want to hear talk about prices being a little bit bubblish.”
Despite the torrid rally in home prices, Stack is one of the few real-estate market observers who foresee a sizable correction in prices. Indeed, as the vital spring selling season approaches, there are plenty of reasons for buyers to be optimistic – not the least of which is the “wealth effect” stemming from gains in equity prices. A backup in home building following the recession has left a paucity of inventory just as the housing needs of two generations – millennials who are buying their first homes and Baby Boomers who are downsizing in retirement – are shifting.
But there’s a structural mismatch between different tiers of the housing market that are poised to create problems for home builders.
There are plenty of reasons to be optimistic. The housing needs of two massive generations – millennials aging into home ownership and baby boomers getting ready for retirement – are expected to fuel demand for years to come if employment remains strong. Sales in master-planned communities, many of which target buyers who are at least 55, reached a record last year, according to John Burns Real Estate Consulting. Last month, a gauge of confidence from the National Association of Home Builders/Wells Fargo rose to the highest level in 18 years, and starts of single-family homes in November were the strongest in a decade.
“As soon as homes are finished, they’re flying off the shelf,” said Matthew Pointon, Capital Economics Ltd.’s U.S. property economist.
Home builders, which have focused on pricier homes since the market bottomed in 2012, are now getting ready for a wave of first-time buyers left with little to choose from on the existing-home market. Investors are rushing to builders of starter homes, because lower-priced homes in the U.S. are in the shortest supply. Shares of LGI Homes Inc., which targets renters with ads that trumpet monthly payments instead of prices, rose 161 percent last year. D.R. Horton Inc., the biggest builder, powered by its fast-selling Express entry-level brand, gained 87 percent.
Home builder stocks rallied 75% last year, outpacing the S&P 500’s best performance since the once-in-a-generation return in 2013. That gain made home builders one of the best-performing subsets of the market.
While demand for low-income homes remains robust, home builders have so far been fixated on housing stock for high-income earners – particularly in hot markets like San Francisco, New York City and Washington DC. Meanwhile, the SEC requested information in May from Radian Group about the BPO’s it provided for rent-backed bonds.
Of course, its premature to say that this will have any kind of tangible impact on the market. But it should certainly make investors think twice about valuations.
The temperature may be frigid across much of the nation, yet home prices are sizzling and sellers are in the hot seat.
Sales prices jumped 7 percent annually in November, according to a new report from CoreLogic. That is the third straight month at that pace, far higher than the price gains in the first half of 2017. Low supply and high demand are fueling the spurt and neither of those is expected to ease up anytime soon. Supply is actually falling even more now, and a strengthening economy is pushing demand. This will have potential buyers out early this year, trying to get a jump on the spring market. “Rising home prices are good news for home sellers, but add to the challenges that home buyers face,” said Frank Nothaft, chief economist at CoreLogic, in the report. Nothaft said the limited supply is the worst at the lower end, and will hit the growing number of first-time buyers hardest.
The largest metropolitan areas are seeing the biggest gains.
In the nation’s top 50 markets, half of the housing stock is now considered overvalued, based on market fundamentals, like income and employment. CoreLogic defines an overvalued housing market as one in which home prices are at least 10 percent higher than the long-term, sustainable level. Las Vegas led the November report as not only being overvalued, but showing a double-digit annual price gain of 11 percent. San Francisco was not far behind at 9 percent, and Denver came in third at 8 percent. Las Vegas and Denver are both considered overvalued, but San Francisco is not, as incomes in the tech capital far exceed the national level. Of the nation’s 10 major markets with the biggest price gains, seven are overvalued. These include Washington, D.C., Houston and Miami. Boston and Chicago are still seeing price gains but are considered at value. Without a significant jump in home construction, prices will remain high and likely move higher. Mortgage rates could also move slightly higher, and new tax policy limiting mortgage and property tax deductions, is hitting homeowners in some states hard.
All will combine to make housing less and less affordable in the new year.
Every industry tracks innovations in its field, and housing is no different. As a real estate pro, here are the need-to-know products and services promising to transform homes and your clients’ lifestyles over the next year or so.
The big-picture view on housing trends in 2018 center around integrating technology and creating healthy and connected living environments. That’s why building materials, systems, and products that speak to these concerns are expected to generate greater buzz in the coming year. And with more generations living under the same roof, home-related features that provide an extra pair of hands or calming—even spiritual—influence are also being enthusiastically embraced. Here’s a sampling of coming trends that are important to understand and share with clients.
The Rise of the Tech Guru
Why now: Smart homes are getting smarter, with homeowners increasingly purchasing devices and apps that perform tasks such as opening blinds, operating sprinkler systems, and telling Alexa what food to order. But not all these helpers speak the same language, nor do they always work together harmoniously. “Even plugs and chargers aren’t necessarily universal for different appliances and phones,” says Lisa Cini, senior living designer and author ofThe Future is Here: Senior Living Reimagined(iUniverse, 2016). Also, with more devices competing for airtime, Wi-Fi systems may not be strong enough to operate throughout a home, which results in dead spots, she says. “What many homeowners need is a skilled tech provider who makes house calls, assesses what’s needed, and makes all the tech devices hum effortlessly at the same time.”
What you should do: More buyers want to see listings updated to take advantage of all technological possibilities from the moment they move in. Add a home technology source to your list of trusted experts. You might even be able to offer a free first visit as a closing gift.
* * *
Smart Glass Adds Privacy, Energy Savings
Why now: As more homes feature bigger and more numerous windows, homeowners will naturally look for ways to pare down the energy costs, lack of privacy, and harmful ultraviolet rays that can accompany them. Next year, glass company Kinestral will begin offering a residential option to their line of windows and skylights. Called Halio, the technology allows users to tint glazing electronically up to 99.9 percent opacity. The company claims this can eliminate the need for blinds, shades, and curtains. “You’ll be able to tell Alexa to tint your windows, which will also provide privacy,” says Craig Henricksen, vice president of product and marketing for Halio. He notes that previously, the commercial version only offered the choice between yellow, brown, or blue casts, but that they’ll now add in an appealing gray tint to the mix. Windows come in a variety of sizes, and contractors can install the cable and low voltage system required to change the tinting. Homeowners can control the tint by voice command through an app, manual operation with switch, or with preset controls. Henricksen says Halio can save homeowners up to 40 percent off their energy bill, and that while the initial cost is around five to six times greater than similar low-E glass, the fact that traditional window treatments won’t be needed means the investment gap narrows.
What you should do: This is an important option to keep in mind if buyers are unsure about big, long runs of windows in a listing. It may make sense to price out options for your particular listing to help home shoppers understand how much it might cost to retrofit the space with such technology.
* * *
Spiritual Gardens That Lift the Soul
Why now: Homeowners have long seen their gardens as a place for quiet reflection, so choosing plants and designs that have a physical tie to spirituality is a natural next move. The trend may have started with Bible gardens, which use any number of the more than 100 plants mentioned in the Christian text to populate a restful repose. “So many are good choices because they are hardy, scented, edible, and can withstand harsh climates and environments,” says F. Nigel Hepper, with the Herbarium at the Royal Botanic Gardens in Kew, England, and author of Illustrative Encyclopedia of Biblical Plants (Inter-Varsity Press, 1992). But people of all faiths, or even those simply drawn to botanical history, can appreciate such spaces. “Around for generations, they feed the body and the soul,” says landscape designer Michael Glassman, who designed such a garden in the shape of a Jewish star as a meditative spot at one of Touro University’s campuses. He filled it with mint, pomegranate trees, sage, and other plants that are mentioned in ancient religious texts. Hepper says labeling and providing detailed context to plantings can transform a miscellaneous, obscure collection into an instructive experience.
What you should do: Find out if your local area has a peace garden that could provide examples of this trend. Homeowners might also find inspiration on the grounds of hospitals and assistance care facilities, which often create healing gardens for patients and family members.
* * *
Kitchens That Do More Than Just Look Pretty
Why now: An emphasis on eating fresh, healthy foods may mean more frequent trips to grocery stores and farmers markets, but it could also change the architecture of our kitchens. Portland, Ore.–based designer Robin Rigby Fisher says many of her higher-end clients want a refrigerator-only column to store their fresh foods, installing a freezer or freezer drawer in a separate pantry or auxiliary kitchen. The container-gardening industry is vying for counter space with compact growing kits that often feature self-watering capabilities and grow lights. Fisher is also getting more requests for steam ovens that cook and reheat foods without stripping them of key nutrients, though she notes that these ovens can cost $4,000 and have a steeper learning curve than conventional ones. Homeowners also want to be able to use their kitchen comfortably, which means having different or variable counter heights that work for each member of the family, ample light for safe prepping, easy-to-clean counter tops, and flooring that’s softer underfoot, such as cork.
What you should do: Be able to point out the beneficial elements of appliances and features in your listing, such as the antimicrobial nature of surfaces like quartzite and copper.
* * *
Home Robots to the Rescue
Why now: With lifestyles that seem busier by the day and many families inviting elders who require assistance to live with them, robots that can perform multiple services are gaining in popularity. IRobot’s Braava robots mop and vacuum floors, while Heykuri’s Kuri robot captures short videos of key life moments, including pets’ antics when owners are away. Some robots offer health benefits that mimic real pets, which the U.S. Centers for Disease Control and Prevention says can lower blood pressure and cholesterol, says Cini. She says Hasbro’s Joy for All line of furry robot dogs and cats can provide companionship for the elderly with dementia.
What you should do: Ask buyers about pain points in their current homes that might be mitigated by these new interactive technologies.
* * *
Black Is the New Gray
Why now: Palettes change all the time, and some feel the interest in black is a welcome contrast after years of off-whites, grays, and beiges. The hue is coming on strong in every category—appliances, plumbing fixtures, lighting, metal finishes, hardware, and soft goods, according to commercial interior designer Mary Cook of Mary Cook Associates. She appreciates black’s classic, neutral, sophisticated touch and notes it can be a universal mixer. “Black is a welcome accent in any palette,” she says. Marvin Windows and Doors launched its Designer Black line this year, incorporating a hip industrial vibe. Designer Kristie Barnett, owner of the Expert Psychological Stager training company in Nashville, loves how black mullions draw the eye out toward exterior views more efficiently than white windows can. Kohler has released its popular Numi line and Iron Works freestanding bath in black. Even MasterBrand cabinets are available in black stains and paints. For homeowners who prefer to step lightly into the trend, Chicago designer Jessica Lagrange suggests painting a door black.
What you should do: Suggest black accents as an option for sellers looking to update their homes to appear more modern.
* * *
Air Locks Preserve Energy, Increase Security
Why now: Incorporating two airtight doors has become a popular way for homeowners to cut energy costs. The double barrier helps keep outside air from entering the main portion of the house and provides a better envelope seal. “We rarely design a house nowadays without one,” says Orren Pickell, president of Orren Pickell Building Group in Northfield, Ill. It’s not just energy homeowners save, though; Pickell says it also supports the trend of more people shopping online. “It keeps packages safer than being left in full view” because delivery services can leave them inside the first door. Homeowners will need a minimum area of five feet squared in order to make this work. Costs vary by project size but it could run homeowners as much as $10,000 to add a small space beyond a front or back door. This usually costs less in new construction or as part of a larger remodeling project, Pickell says.
What you should do: If homeowners are thinking about making changes to their main entryway, be sure to alert them to this trend so they can decide if it makes sense to incorporate it. It may be expensive, but it’s not likely to go out of fashion anytime soon.
* * *
Maximized Side Yards
Why now: As a nationaltrend toward smaller lot sizescombines with surging interest in maximizing outdoor space, one area that’s often neglected is the side yard. But designers are beginning to pay attention, transforming these afterthoughts into aesthetically pleasing, functional places that buffer a home from neighbors, says Glassman. He suggests growing plants such as star jasmine, climbing roses, and clematis vertically along the siding or a fence. He has created a pleasant pass-through to a backyard, with meandering walkways flanked by ornamental grasses or honeysuckle. Homeowners who have extra space here might consider adding a small recirculating water feature or a tiny sitting area.
What you should do: Pay special attention to side yards when evaluating a home that’s about to go up on the market. Sellers don’t need to spend much to make this space stand out, and any little thing is better than the feeling that the space has been “thrown away, since real estate is so valuable,” Glassman says.
* * *
Battery Backup Systems Offer Resilience
Why now: Any home owner who’s experienced a weather-related disaster, such as hurricanes, forest fires, and torrential downpours, understands the peace of mind that comes from having systems in place to help withstand Mother Nature’s worst punches. One example of this is a battery backup that integrates into a home’s electric system and operates during power outages, says architect Nathan Kipnis of Kipnis Architecture + Planning in Chicago. The backup batteries can store either electricity from the grid or renewable energy generated onsite by solar panels or other means. A key advantage is that the system doesn’t create the noise and pollution you get with an old-school generator, because it doesn’t use natural gas or diesel fuel. While they’re generally more expensive than traditional fossil fuel systems, prices do continue to drop.
What you should do: Understand the difference between a battery backup system and a typical generator, even if you’re not working in an area that sees frequent extreme weather events.
* * *
Missing Middle Housing
Why now: Architect Daniel Parolek, principal at Opticos Design in Berkeley, Calif., sees a solution emerging for the mismatch between demand and the housing that’s actually been delivered over the last 20 to 30 years. “Thirty percent of home buyers are single, and their numbers may swell to 75 to 85 percent by 2040, yet 90 percent of available housing is designed for families and located in single-family home neighborhoods,” he says. Parolek says builders must fill in this demand with smaller housing of 600 to 1,200 square feet, usually constructed in styles such as duplexes and cottages communities, and preferably in walkable areas. He cites Holmes Homes’ small townhouses at Daybreak in South Jordan, Utah, as an affordable transit-oriented development that follows missing middle principles.
What you should do: Know where existing missing middle housing may be hiding in your community, so you can help buyers of all ages seeking smaller homes. Also, look for opportunities to invest, either for yourself or your clients, in a type of housing that will likely see more demand than supply in the coming years.
Following the bounce in exisitng home sales (albeit lower YoY), new home sales ripped back higher in October (up 6.2% vs expectations of a 6.1% drop) following a big downward revision of last month’s manic spike. This is the highest print for new home sales since Nov 2007.
The 6.2% surge is a six standard deviation beat of expectations…
September’s 18.9% spike was revised notably lwoer to a 14.2% jump to 685k SAAR…
This is the highest new home sales SAAR print since Nov 2007… but still has a long way to go back to ‘normal’…
And finally, we note that the average new home sales price hit a new record high, above $400K for the first time ever – $400,200.
Jake Yanoviak is hunting for houses. On a weekday afternoon in North Philadelphia, the 23-year-old painter cruises along on his bike, its black paint obscured under stickers from breweries and rock bands. He turns onto a side street, where he spots a few elderly neighbors, standing on adjoining porches. He parks, leans on one handlebar and makes his pitch.
“Anybody on the block considering selling?” Yanoviak asks gently. “I’m not a developer, I’m not interested in renting to students. I’m just a kid trying to buy a house, fix it up and live in it.”
“We’re not going no place,” replies a 70-something woman, relaxing in fuzzy white pig slippers in the row house where she’s lived twice as long as Yanoviak has been alive. “All these houses are taken.”
Like much of his generation, Yanoviak is desperate to get a piece of an increasingly scarce commodity: prime American real estate. Millennials are finding themselves out in the cold becausebuilding has slowed, and longer-living baby boomers are staying put, setting up a simmering conflict between the two biggest generations in U.S. history.
To succeed, buyers and real estate brokers must show uncommon persistence and, at times, diplomacy. Yanoviak has tried sheriff’s sales, lost two bidding wars, ridden miles on potholed streets and left notes in mailboxes, all to no avail.
People 55 and older own 53 percent of U.S. owner-occupied houses, the biggest share since the government started collecting data in 1900, according to real estate website Trulia. That’s up from 43 percent a decade ago. Those ages 18 to 34 possess just 11 percent. When they were that age, baby boomers had homes at almost twice that level.
Public policy contributes to the generational standoff. Property-tax exemptions for longtime residents keep older Americans from moving. Zoning rules make it harder to build affordable apartments attractive to senior citizens.
“The system is gridlocked,” says Dowell Myers, a professor of urban planning and demography at the University of Southern California. “The seniors aren’t turning over homes as fast as they used to, so there are very few existing homes coming online. To turn it over, they’ll have to have a landing place.”
In Lexington, Massachusetts, a Boston suburb, broker Dani Fleming offers pizza and refreshments to entice the mostly elderly homeowners to attend seller seminars on “how to unlock the potential of your home.”
In Alameda, California, east of San Francisco, 38-year-old Angela Hockabout, her husband and their two children live with her 76-year-old mother-in-law, who is holding onto the home because the real estate taxes are so low. Under the almost-40-year-old ballot measureProposition 13, they are tied to the property’s value when the house was purchased in the 1970s.
“Dear Homeowner, I have been looking to buy a house for almost a year and have not found one.”
Kale, Tomatoes
In Omaha, Nebraska, Bill and Peg Swanson, a couple in their late 60s, say they might move if they could find affordable single-family homes aimed at seniors nearby. Still, like many from their generation, they like aging in place, tending their garden of green peppers, kale and tomatoes.
“There are a lot of reasons to stay here,” Bill Swanson says. “We still enjoy putzing around the yard.”
That kind of thinking ends up costing young home shoppers such as Yanoviak. After graduating from Carleton College in Minnesota with a degree in media studies, he now lives in West Philadelphia with his parents, an arborist and a director of a nonprofit. For a living, he does carpentry and helps paint movie sets. He’s looking at homes costing as much as $200,000 and may rent out rooms to friends.
Yanoviak looks at a Philadelphia zoning notice outlining a plan for multifamily units on that site.
Yanoviak scouts property with Google Maps, Zillow and the city’s property-record site. When he finds something, he calls his real estate agent, Cecile Steinriede, who checks it out. He also keeps an old-school sheaf of letters in the rear pocket of his pants, so he can hand them out or slip them in mailboxes.
“Dear Homeowner,” they read. “I have been looking to buy a house for almost a year and have not found one.”
Brewerytown
Yanoviak has his sights on a neighborhood called Brewerytown, a community of brick, masonry and vinyl row houses that range from tidy to decaying, with paint peeling, holes in roofs and weeds growing from cracks in sidewalks.
Along with inter-generational tension, Yanoviak’s search raises delicate questions of race and class. He’s white and college-educated, and he’s often knocking on the doors of working-class black homeowners who see their homes as key to an affordable retirement and a way to pass wealth to future generations. (None would give their names.) Yanoviak acknowledges the awkwardness. It doesn’t help, he says, when developers assault residents with insulting, low-ball cash offers.
Yanoviak inspecting a house in the Brewerytown district.
“It’s inevitable for me to be perceived as an outsider,” Yanoviak says. “But I’m not trying to change the community. I’m trying to contribute in positive ways and be a neighbor.”
Resentments fester in neighborhoods of all ethnicities. In a traditionally Italian section of South Philadelphia, which is now out of Yanoviak’s price range, 70-year-old Nick Ingenito, sits on the front steps of the three-story brick house his grandmother’s aunt bought in the early 1900s.
‘Wouldn’t Move’
“Where do these young people get this money?” he says, looking out at the street where he played stick ball as a kid. “This neighborhood still has the soul of the past. Everybody I know — people older than me — wouldn’t move from here for nothing unless they couldn’t afford it no more.”
On a recent Thursday evening after work, Yanoviak, wearing a black T-shirt, jeans and a brown belt emblazoned with the Schlitz logo, mounts his bike to make the housing round.
On one of his first stops, a black cat slinks under the wooden gate next to an abandoned house with bay windows that piqued Yanoviak’s interest. Using his bike as a ladder, he stands on the seat and stretches his chin over barbed wire. All he can see are bed springs and junk.
Yanoviak starts cycling again, taking both hands off the handle bar to tap on his iPhone, noting the address of a property he might want to revisit.
Yanoviak carries pitch letters with him to hand out to homeowners and slip in mail boxes.
Church Properties
He stops to chat with the pastor of a church, which owns a handful of properties but isn’t selling.
“No, we’re holding out for God to do what he said he was going to do and that is to give us the block,” the pastor tells Yanoviak.
Then, he sees a gray-haired man puttering in his garage.
“I’m looking at properties in the neighborhood, there isn’t a whole lot on the market so I’m cold calling,” Yanoviak says.
“Give me $2 million,” the homeowner replies. “I don’t want no low number.”
It turns out the price is for the whole block. Even then, the potential seller has second thoughts.
“I wouldn’t sell even if you gave me $2 million — this is my retirement,” he says. “If you gave me a bag of money, I wouldn’t sell.”
After a few hours chatting with a half dozen owners and visiting eight properties, Yanoviak gets back on his bike, his pitch letters still hanging from the back pocket of his jeans. He heads back to his parents’ house, deferring for yet another day his search for a home.
Exercise self discipline, practice and consistency …
A small savings bank in Michigan, Flagstar Bank, has come up with a genius, innovative new mortgage product that they believe is going to be great for their investors and low-income housing buyers: the “zero-down mortgage.” What’s better, Flagstar is even offering to pay the closing costs of their low-income future mortgage debtors. Here’s more from HousingWire:
Under the program, Flagstar will gift the required 3% down payment to the borrower, plus up to $3,500 to be used for closing costs.
According to the bank, there is no obligation for borrowers who qualify to repay the down payment gift.
The program is available to only certain low- to moderate-income borrowers and borrowers in low- to moderate-income areas throughout Michigan.
Borrowers would not have to repay the down payment or closing costs. But a 1099 form to report the income would be issued to the Internal Revenue Service by the bank. So the gifts could be taxable, depending on the borrower’s financial picture.
Flagstar said borrowers who might qualify for its new program typically would have an annual income in the range of $35,000 to $62,000. The sales price of the home — which must be in qualifying areas — would tend to be in the range of $80,000 to $175,000.
Think it’s too good to be true? Lakeshia Wiley of Detroit’s west side begs to differ…she recently went through Flagstar to purchase her new home and only had to come up with $350 of her own money. Per the Detroit Free Press:
Lakeshia Wiley, 35, said she wouldn’t have been able to buy her first home without the Fifth Third Down Payment Assistance program and two other grants, including one from Southwest Solutions.
The brick home, built in 1951, is on Detroit’s west side, needed very little work and was priced at $50,000.
“I’m very excited every time I think about it. It’s beautiful. I love it,” Wiley said.
Wiley never expected to be able to buy a home, though, because she has had a hard time saving for a down payment.
“I didn’t think I’d be able to do it,” said the single mother who has two sons, ages 17 and 10, and a daughter, age 6. She works at a Detroit pharmacy.
Thanks to the down payment assistance and the grants, Wiley was able to buy her home in April. She had to bring less than $350 to the table at closing.
The Flagstar program is available in 18 counties in Michigan, and could be used for certain homes in Detroit and Flint, along with other cities.
Of course, we would highly encourage Flagstar to take a look back into ancient history for case studies on what happened the last time banks started peddling “innovative” mortgage products. Here’s a summary of the Lehman Brothers case study:
Ironically, South Park also did some fascinating research on the topic:
From 1898 until Aug. 10, 1940, streetcars (here seen in 1910) made their way between upper and lower Queen Anne Hill, assisted by a weighting system called a “counterbalance.”
According to the latest BLS data, average hourly wages for all US workers rose at a respectable 2.9% relative to the previous year, if still below the Fed’s “target” of 3.5-4.5%, as countless economists are unable to explain how 4.3% unemployment, and “no slack” in the economy fails to boost wage growth. Another problem with tepid wage growth, in addition to crush the Fed’s credibility, is that it keeps a lid on how much general price levels can rise by. With record debt, it has been the Fed’s imperative to boost inflation at any cost (or rather at a cost of $4.5 trillion) to inflate away the debt overhang, however weak wages have made this impossible.
Well, not really.
Because a quick look at US housing shows that while wages may be growing at a little over 2%, according to the latest Case Shiller data, every single metro area in the US saw home prices grow at a higher rate, while 15 of 20 major U.S. cities experienced home price growth of 5% or higher, something which even the NAR has been complaining about with its chief economist Larry Yun warning that as the disconnect between prices and wages hits record wides, homes become increasingly unaffordable. Paradoxically – the higher prices rise, the more unaffordable US homes become for the average Americanas we showed this weekend. In fact, as of this moment, homes have never been more unaffordable, which even more paradoxically hasn’t stopped priced from hitting new all time high virtually every month for the past year.
And while this should not come as a surprise, one look at the chart below suggests that something strange is taking place in Seattle where prices soared by a bubbly 13.2% Y/Y, and which has either become “Vancouver South” when it comes to Chinese hot money laundering, or there is an unprecedented mini housing bubble in the hipster capital of the world.
Putting the above data in context, here are twocharts courtesy of real-estate expert Mark Hanson, the first of which shows how much household income increase is needed to buy the median priced home in key US cities…
… while the next chart shows the divergence between actual household income, and the income needed to buy the median priced house.
Earlier todayBloombergshared their thoughts that recent data released by theNational Association of Realtors (NAR), namely the fact that homes are sitting on the market for a record low average of just 3 weeks before being scooped up, pointed to a devastating shortage of housing inventory for sale. Here was Bloomberg’s take:
Here’s more evidence that the defining characteristic of the U.S. housing market is a shortage of inventory for sale: Homes are sitting on the market for the shortest time in 30 years, according to an annual report on homebuyers and sellers published today by the National Association of Realtors.
The typical home spent just three weeks on the market, according to the report, which focused on about 8,000 homebuyers who purchased their home in the year ending in June. That was down from four weeks in the year ending June 2016 and 11 weeks in 2012, when the U.S. housing market was still reeling from the foreclosure crisis. It was the shortest time since the NAR report began including data on how long homes spend on the market, in 1987.
Buyers are snapping up homes quickly at a time when for-sale listings are in short supply, forcing them to compete. The number of available properties declined in September, according to NAR’s monthly report on existing home sales, marking the 28th consecutive month of year-on-year decline in inventory.
Moreover, the “inventory shortage’ thesis was further reinforced by data showing that a growing percentage of buyers are once again having to pay asking price or more to win their fair share of the American dream.
In addition to moving fast, buyers also had to pony up to close the deal. Forty-two percent of buyers paid at least the listing price, the highest share since the NAR survey started keeping track in 2007.
“With the lower end of the market seeing the worst of the supply crunch, house hunters faced mounting odds in finding their first home,” said Lawrence Yun, NAR chief economist, in a statement. “Multiple offers were a common occurrence, investors paying in cash had the upper hand, and prices kept climbing, which yanked homeownership out of reach for countless would-be buyers.”
That said, while Bloomberg has taken the ‘glass half full’ approach in it’s analysis, one could also easily make the argument that the housing market isn’t suffering from a lack of supply at all but rather an artificially high level of demand courtesy of a combination of perpetually low interest rates and taxpayer subsidized mortgages that require minimal down payments of just 3%.
For evidence of the slightly more pessimistic assessment of the housing market, one has to simply review the fine print included in the NAR report which reveals that the average first-time homebuyer is financing roughly 95% of their purchase price and the tightest housing markets are those that fall below FHA limits. So, what does that tell you about how “tight” housing markets would be if they weren’t subsidized by the U.S. taxpayer?
Of course, to suggest that millennials should hold off on purchasing a home until they can actually afford a debt-to-equity ratio somewhere south of 19x is probably considered a hate crime in many social circles so we can understand why it might be avoided.
With soaring rental prices, extremely low mortgage rates, and a stronger economy, it seems that just about everyone wants to buy a home these days. But high home prices are keeping many aspiring homeowners, as well as would-be sellers (who need a new home to move into) out of the market.
So who is buying and selling these days?
It turns out the typical buyer and seller both are getting older—and buyers need to make more money to be able to afford a home of their own, according to the 2017Profile of Home Buyers and Sellersby the National Association of Realtors®. The report is based on a 131-question survey filled out by nearly 8,000 recent home buyers.
It turns out the typical buyer and seller both are getting older—and buyers need to make more money to be able to afford a home of their own, according to the 2017Profile of Home Buyers and Sellersby the National Association of Realtors®. The report is based on a 131-question survey filled out by nearly 8,000 recent home buyers.
“Prices are going up,” says Chief Economist Danielle Hale of realtor.com®. “So in order to get into the housing market, buyers need to have more income to afford the same type of properties.”
Who is the typical home buyer these days?
Home buyers come in all shapes and sizes, but the typical one is about 45 years old. That’s up considerably since 1981, the inaugural year of the report, when the median age was just 31.
Buyers these days are also making good money, at about $88,800 a year, according to the report. It was $88,500 in the previous year.
Most buyers preferred the suburbs and more rural areas, at 85%, compared with urban areas, which is where just 13% of folks bought homes. And the vast majority, 83%, also preferred a stand-alone, single-family house, the kind that typically has a lawn out back.
The suburbs reigned supreme because that’s where many of the available homes with the desired features are, says Hale.
“Properties tend to be a bit more affordable than in urban areas,” Hale says. “You’ll get much more space in the suburbs for your money than you will in an urban area, and the schools do tend to be better as well.”
Calling all the single ladies
In another indication of just how much things can change in 36 years, about 18% of home sales were made by single women. That’s up from 17% last year and just 11% in 1981. And while it’s still well below the 65% of sales that married couples scooped up, it’s ahead of the 7% of sales that unmarried men made. An additional 8% of closings were made by unmarried couples.
There are more single women today than there have been historically, says Jessica Lautz, NAR’s managing director of survey research and communications. She points to how folks are marrying later in life, or not at all. Or, some may have been married before and become widowed or divorced.
Being able to have a 30-year fixed mortgage provides financial security, compared with facing rising rental prices, Lautz says.
In addition, single women buy homes that cost just a little bit more than single men: a median $185,000 versus $175,000 for the men. And that’s despite often making less than their male counterparts.
Fewer first-time buyers are getting in on the action
High student debt, coupled with rising home prices, kept many first-time buyers out of the market. These real estate virgins made up only about 34% of home sales, according to the report. That’s slightly down from 35% last year and the long-term average of 39%.
Those who were able to buy a home were a median age of 32.
“Right around turning 30 is still a significant milestone in many people’s lives,” says Hale. “That’s why we tend to see a lot of first-time buyers.”
These buyers typically had a household income of about $75,000, up from $72,000 last year. They were likely to buy a 1,650-square-foot abode for about $190,000 in a suburban area.
“The dreams of many aspiring first-time buyers were unfortunately dimmed over the past year by persistent inventory shortages,” NAR’s Chief Economist Lawrence Yun said in a statement. “Multiple offers were a common occurrence, investors paying in cash had the upper hand, and prices kept climbing, which yanked homeownership out of reach for countless would-be buyers.”
Big student loan bills due every month also make it harder for many of these younger folks to save up for a down payment. And it could affect their debt-to-income ratios, which lenders look at before issuing mortgages.
About 41% of first-time buyers have debt, according to NAR’s report, up from 40% last year. And they now owe about $29,000—compared with $26,000 in 2016. Ouch.
“An overwhelming majority of millennials with student debt believe it’s delaying their ability to buy a home, and typically for seven years,” Yun said in a statement. “Even in markets with a plethora of job opportunities and higher pay, steep rents and home prices make it extremely difficult to put savings aside for a down payment.”
What kinds of homes are buyers snagging?
Buyers overwhelmingly opted for existing homes (ones that had previously been lived in), at about 85%, compared with just 15% who closed on brand-new abodes, according to the report. That’s likely because there are fewer newly built homes on the market as well as the newer homes tending to cost significantly more.
They shelled out a median $235,000 on their homes, which were a median 1,870 square feet. The typical home was built in 1991 and had three bedrooms and two bathrooms.
And they’re not moving far away. Usually buyers moved only about 15 miles from their previous home.
Who’s selling their homes?
They typical home seller in 2017 was much older than the typical buyer, at about 55 years old. Their household incomes were also higher, at about $103,300 a year.
“The age of sellers and repeat buyers continues to increase,” says NAR’s Lautz. That’s because many baby boomers are purchasing retirement homes later in life.
The top reasons for selling were a residence that was too small, the desire to be close to family and friends, and the need to relocate for work.
Sellers usually stayed about 10 years in their homes before putting them on the market. Their properties stayed on the market for a median of three weeks, compared with four weeks last year.
And, in a boon for sellers, they sold their homes for a median $47,500 more than what they originally paid for them, and got about 99% of their final listing price.
The first graph shows the refinance index. The refinance index is down 76% from the levels in May 2013. Refinance activity is very low this year and will be the lowest since year 2000.
The second graph shows the MBA mortgage purchase index. According to the MBA, the unadjusted purchase index is down about 11% from a year ago.
Mortgage applications decreased 0.2 percent from one week earlier, according to data from the Mortgage Bankers Association’s (MBA) Weekly Mortgage Applications Survey for the week ending September 26, 2014 …
The Refinance Index decreased 0.3 percent from the previous week. The seasonally adjusted Purchase Index remained unchanged from one week earlier. The unadjusted Purchase Index decreased 1 percent compared with the previous week and was 11 percent lower than the same week one year ago. … … The average contract interest rate for 30-year fixed-rate mortgages with conforming loan balances ($417,000 or less) decreased to 4.33 percent from 4.39 percent, with points decreasing to 0.31 from 0.35 (including the origination fee) for 80 percent loan-to-value ratio (LTV) loans.
The owner of one tiny, unassuming cottage in Mountain View, California just sold his house for well below the asking price of $1.6 million – but asked the new buyers to agree to one highly unusual condition: They must allow him to continue living there, rent free, for seven years,NBC Newsreported.
The Silicon Valley property went for $1.1 million after being on the market for only a few weeks, which is surprising, considering the house – little more than a shotgun shack – hardly has room for multiple tenants.
The property’s realtor said the home’s elderly former owner will continue living in the home for seven more years ‘rent back at no charge.’
Realtor Joban Brown said that while the price is not unusual for the hot spot location, the former owner’s request to continue living at the property is ‘not a typical situation.’
Erika Enos, another realtor, said she’d never heard of this type of a deal during her multi-decade career as a realtor:
‘In almost 40 years as a realtor, I have never seen terms of sale that included seven years free rent back, not even seven months free rent back,’ Enos said.
‘What if the property does not close or the seller is unhappy with the results or work men don’t get paid and put a lien the property?’
‘The asking price reflects market value, which is essentially lot value, for this area … I empathize with the seller, but the terms and conditions for this sale I feel are unrealistic and may have negative legal ramifications.’
The listing for the 976 square-foot cottage also included a requirement for the buyer to pay for the expensive repairs needed.
However, Mountain View’s status as a well-heeled tech hub – Google’s headquarters is located in the town, and companies including Microsoft and Samsung have offices there – has caused real-estate prices to explode over the past two decades, reflecting similar gains throughout the tech-focused Bay Area.
The realtor in charge of selling the location described it as having “all the conveniences of urban living” but in a secluded setting.
‘This is a location that’s hard to beat, tucked away in a quiet corner at the end of a small street,’ listing agent Daniel Berman said.
‘You’ve got all the conveniences of urban living, nestled in a secluded country-like enclave.’
We wonder: With Silicon Valley home prices soaring well beyond the means of most middle-class families, will we start to see more deals like this one? Already, a startup called Loftium has hit upon a similar concept. The commpany will front you the entire down payment if you just agree to rent out one of the rooms in your new house over Airbnb for a specified period of time. But there’s a catch … for now Loftium is only available in Seattle.
After a steady march higher in the wake of the ‘great recession’ nearly a decade ago, a note today fromRent Cafereveals that average rents in the United States have now stalled for 4 months in row with September’s national average coming in at $1,354 per month, which is virtually flat from the $1,350 average reached in the summer.
National rents have barely moved through the entire peak rental season and into September, marking the longest period of stagnation in recent history — 4 consecutive months. Coming in at $1,354 for the month of September, the average rent is only 2.2 percent higher than this time last year. This is the slowest annual growth rate we’ve seen in more than six years — having reached a high point of 5.5%-5.6% peak growth around two years ago — a pretty good indicator that the rental market has entered calmer waters.
Still, that doesn’t mean rents have flat-lined everywhere. Though nationally and in the most expensive cities for renters prices have finally come to a full stop, there are still some holdouts—and it seems renters in smaller and mid-sized cities are not yet getting a break, on the contrary.
As we pointed out over the summer, just like almost any bubble, stagnating rents are undoubtedly the symptom of a massive, multi-year supply bubble in multi-family housing units sparked by, among other things, cheap borrowing costs for commercial builders. Per the chart below from Goldman Sachs, multi-family units under construction is now at record highs and have eclipsed the previous bubble peak by nearly 40%.
But, while rents are certainly slowing – and construction is indeed playing its part – the impact isn’t spread evenly across all markets as Rent Cafe notes that the construction boom in Texas has earned the state 6 out of 10 of the worst performing rental markets in the country.
The anticipated rent drops from Hurricane Harvey have not been realized in the city of Houston, but are seen in other Texas communities, with the biggest changes being outside of Harvey’s reach, as a result of the major apartment construction taking place throughout the state. Lubbock, located on the west side of the state, came in at No. 1 for biggest year-over-year rent decreases in the nation, with rents dropping 3.4 percent since 2016.
Rents for apartments in Round Rock, a suburb outside Austin—another city barely touched by Harvey, dipped to $1,092—3.4 percent below last year’s numbers. Round Rock took the No. 2 spot for biggest rent decreases of the year.
Texas claimed the third spot, too, with McAllen’s 2.6 percent drop in rents since last year, and three other Texas towns—College Station, Waco and Plano—also made the top 10, with decreases of 2.4 percent, 2 percent, and 1.1 percent, respectively. The rest of the list was spread throughout the nation, with California’s Simi Valley taking No. 4 (down 2.6 percent), New Orleans at No. 5 (down 2.4 percent), Manhattan, NYC at No. 8 (down 1.9 percent), and Tulsa, Oklahoma at No. 9 (down 1.5 percent.)
Meanwhile, areas with stronger job markets and/or better overall affordability are still seeing demand growth which, combined with a lack of capital investment, is driving rents considerably higher.
Though smaller and mid-sized towns used to be a haven for renters looking to avoid the sky-high prices of large urban areas, it seems those days are in the past. September’s list of fastest-growing rents is dominated by small and medium-sized towns—many boasting double-digit growth since this time last year.
The Lone Star State’s Odessa and Midland—both hubs of oil and gas activity—came in at the top two spots, with jumps of 24.7 percent and 20.7 percent, respectively. Odessa rents now clock in at $1,060 per month, while Midland’s reach even higher, coming in at $1,225.
The rest of the nation’s fastest-growing rents can be found largely on the West Coast, with California, Washington, Nevada and Colorado taking up the remaining bulk of the list. The only Northeastern cities to see big year-over-year rent growth were Buffalo, New York, with an 11.2 percent jump over 2016, and Elizabeth, New Jersey, which saw rents climb 8.5 percent to $1,187.
Finally, here are the top 10 most and least expensive rental markets in the U.S. at the end of September 2017. To our complete lack of surprise, New York and California continue to dominate the expensive list while Southern and Midwestern markets continue to provide the best value…perhaps this is why all those domestic migration studies show a mass exodus from the cities on the left to the cities on the right? Just a hunch…
We harp on the massive, unsustainable, yet largely unnoticed, debt burdens of American cities, counties and states fairly regularly because, well, it’s a frightening issue if you spend just a little time to understand the math and ultimate consequences. Here is some of our recent posts on the topic:
Luckily, for those looking to escape the trauma of being taxed into oblivion by their failing cities/counties/states, JP Morgan has provided a comprehensive guide on which municipalities haven’t the slightest hope of surviving their multi-decade debt binge and lavish public pension awards.
If you live in any of the ‘red’ cities below, it just might be time to start looking for another home…
To add a little context to the map above, JP Morgan ranked every major city in the United States based on what percentage of their annual budgets are required just to fund interest payments on debt, pension contributions and other post retirement benefits.
The results are staggering. To our great ‘shock’, Chicago residents win the award of “most screwed” with over 60% of their tax dollars going to fund debt and pension payments. Meanwhile, there are a dozen municipalities where over 50% of their annual budgets are used just to fund the maintenance cost of past expenditures.
As managers of $70 billion in US municipal bonds across our asset management business (Q2 2017), we’re very focused on credit risk of US municipalities.
The chart below shows our “IPOD” ratio for US states, cities and counties. This measure represents the percentage of a municipality’s revenues that would be needed to pay interest on direct debt, and fully amortize unfunded pension and retiree healthcare obligations over 30 years, assuming a conservative return of 6% on plan assets. While there’s no hard and fast rule, municipalities with IPOD ratios over 30% may eventually face very difficult choices regarding taxation, non-pension spending, infrastructure investment, contributions to unfunded plans and bond repayment.
So, what will it take to fix the mess in these various municipal budgets? How about massive tax hikes of ~30% or a slight 76,121% increase in worker pension contributions in Honolulu…
Anyone else feel like the winters in South Dakota are suddenly looking much more manageable?
After dismal drops in existing and new home sales, this morning’s pending home sales data for August was a disaster, tumbling 2.6% MoM (3.1% YoY) to its lowest SAAR since January 2016.
This is the second YoY decline in sales in a row, with SAAR tumbling to its lowest since Jan 2016…
Lawrence Yun, NAR chief economist,says this summer’s terribly low supply levels have officially drained all of the housing market’s momentum over the past year.
“August was another month of declining contract activity because of the one-two punch of limited listings and home prices rising far above incomes,” he said.
“Demand continues to overwhelm supply in most of the country, and as a result, many would-be buyers from earlier in the year are still in the market for a home, while others have perhaps decided to temporarily postpone their search.”
With little relief expected from the housing shortages that continue to plague several areas, Yun believes the housing market has essentially stalled.
Further complicating any sales improvement in the months ahead is the fact that Hurricane Harvey’s damage to the Houston region contributed to the South’s decline in contract signings in August, and will likely continue to do so in the months ahead. Furthermore, the temporary pause in activity in Florida this month in the wake of Hurricane Irma will slow overall sales even more in the South.
Yun now forecasts existing-home sales to close out the year at around 5.44 million, which comes in slightly below (0.2 percent) the pace set in 2016 (5.45 million). The national median existing-home price this year is expected to increase around 6 percent. In 2016, existing sales increased 3.8 percent and prices rose 5.1 percent.
“The supply and affordability headwinds would have likely held sales growth just a tad above last year, but coupled with the temporary effects from Hurricanes Harvey and Irma, sales in 2017 now appear will fall slightly below last year,” said Yun.
“The good news is that nearly all of the missed closings for the remainder of the year will likely show up in 2018, with existing sales forecast to rise 6.9 percent.”
TheCensus Bureaureports New home sales are down again, with median prices weakening sharply.
Net sales revisions for June and July were negative. In addition, year-over-year sales are negative.
Sales were down in the South, the West, and Northeast, so don’t blame the hurricanes.
Economists Surprised Again
Economists were surprised by another month of weak new home sales.
TheEconodayconsensus estimate was 583,000 at a seasonally adjusted annualized rate (SAAR) but sales came in at 560,000 SAAR.
Weakness in the South pulled down new home sales in August as it did in last week’s existing home sales report. New home sales fell sharply in the month to a 560,000 annualized rate vs an upward revised rate of 580,000 in July and a downward revised 614,000 in June (revisions total a net minus 7,000).
Sales in the South, which is by far the largest region for housing, fell 4.7 percent in the month to a 307,000 rate for a year-on-year decline of 9.2 percent. But importantly, sales in the West and Northeast were also lower, down 2.6 and 2.7 percent respectively, with sales in the Midwest unchanged.
September, in fact, was a weak month for housing demand, evident in this report’s median price which fell a very sharp 6.2 percent to $300,200. Year-on-year, the median is up only 0.4 percent which, in another negative, is still ahead of sales where the yearly rate is minus 1.2 percent.
Builders, despite late month disruptions in the South, moved houses into the market, up 12,000 to 284,000 for a striking 17.8 percent yearly gain that hints at a glut. But supply had been so thin that the balance is now at a traditional level, at 6.1 months vs 5.7 and 5.3 months in the prior two months and 5.1 months a year ago.
Hurricane effects are likely in the next report for September with the South to continue to suffer. But today’s data do mark a shift, one of softening sales nationally, which is a short-term weakness, and a re-balancing in supply which is a long-term strength. Yet for the 2017 economy, the housing sector looks to be ending the year in weakness, some of it hurricane-related.
Expect downward revisions in GDP estimates for the third and fourth quarters.
This is how monetary policies have crushed the value of labor.
For the good folks who hope fervently that the Fed doesn’t have reasons to raise rates or unwind QE because there isn’t enough inflation, here is an update on one aspect of inflation – asset price inflation, and particularly house price inflation – where the value of your hard-earned dollars has collapsed over a given number of years to where it takes a whole lot more dollars to pay for the same house.
So here are some visuals of amazing house price bubbles, city by city. Bubbles really aren’t hard to recognize, if you want to recognize them. What’s hard to predict accurately is when they will burst. Normally the Fed doesn’t want to acknowledge them. But now it has its eyes focused on them.
The S&P CoreLogic Case-Shiller National Home Price Index for June was released today. It jumped 5.8% year-over-year, not seasonally adjusted, once again outpacing growth in household incomes, as it has done for years. At 192.6, the index has surpassed by 5% the peak in May 2006 of crazy Housing Bubble 1, which everyone called “housing bubble” after it imploded (data viaFRED, St. Louis Fed):
The Case-Shiller Index is based on a rolling-three month average; today’s release was for April, May, and June data. Instead of median prices, it uses “home price sales pairs,” for example, a house sold in 2011 and then again in 2017. Algorithms adjust this price movement and add other factors. The index was set at 100 for January 2000. An index value of 200 means prices have doubled in the past 17 years, which is what most of the metros in this series have accomplished, or are close to accomplishing.
Real estate is local. Therefore real estate bubbles are local. If enough local bubbles balloon at the same time, it becomes a national housing bubble. As the above chart shows, the US national Housing Bubble 2 now exceeds the crazy levels of Housing Bubble 1, and in all ten major metro areas, home prices are setting new records.
In the Boston metro, the home price index is now 11% above the peak of Housing Bubble 1 (Nov 2005):
Home prices in the Seattle metro have spiked over the past year, pushing the index 20% above the peak of Housing Bubble 1 (Jul 2007):
Then there’s Denver’s very special house price bubble. The index has soared a stunning 43% above the peak of Housing Bubble 1 (Aug 2006):
People in the Dallas-Fort Worth metro felt left out during Housing Bubble 1, when prices rose only 13% in five years, while folks in other parts of the country were getting rich just sitting there. They also skipped much of the house price crash. But they know how to party when time comes. The index has now surged by 42% from the peak in June 2007:
The Atlanta metro, where home prices had plunged 36% after Housing Bubble 1, has now finally squeaked past the prior peak by 2%, with a near-perfect V-shaped bubble recovery:
Portland’s home prices have kicked butt since 2012, with the index soaring 71% in five years – not that homes were cheap in Portland in 2012. Portland’s house price bubble is now 20% above the peak of Housing Bubble 1:
The San Francisco Case-Shiller Index, which covers the five-county Bay Area and not just San Francisco, is now 10% above the insane peak of Housing Bubble 1. During the last housing crash, the index plunged 43%. Eight years of global monetary craziness has sent liquidity from around the world sloshing knee-deep through the streets, which has performed miracles:
Los Angeles home prices performed similar feat, doubling from 2002 to July 2006, before giving up two-thirds of those gains, then soaring once again. The index is now 3% above the peak of totally insane Housing Bubble 1:
New York City condo bubble never saw the crash in its full bloom. Prices are now 19% above the peak of the prior bubble (Feb. 2006). Over the past 15 years, the index has soared 112%:
While the monetary policies of the past eight years have had no impact on wage inflation in the US, and only moderate impact on consumer price inflation, they’ve been a rip-roaring success in creating asset price inflation.
Asset price inflation means that the dollar loses its value when it comes to buying assets. Wage earners, when they’re trying to buy assets today – not just homes but any type of asset, including buying into retirement plans – are finding out that their labor is buying only a fraction of the assets that their labor could buy eight years ago. This is how these monetary policies have crushed the value of labor.
The Department of Housing and Urban Development on Tuesday will formally announce plans to increase premiums and tighten lending limits on reverse mortgages, citing concerns about the strength of the program and taxpayer losses.
Mortgage insurance premiums on Home Equity Conversion Mortgages will rise to 2% of the home value at the time of origination, then 0.5% annually during the life of the loan, The Wall Street JournalreportedTuesday morning. In addition, the average amount of cash that seniors can access will drop from about 64% of the home’s value to 58% based on current rates, the WSJ said.
“Given the losses we’re seeing in the program, we have a responsibility to make changes that balance our mission with our responsibility to protect taxpayers,” HUD secretary Ben Carson told the WSJ via a spokesperson.
The HECM program’s value within the Mutual Mortgage Insurance Fund waspeggedat negative $7.72 billion in fiscal 2016, and the WSJ noted that the HECM program has generated in $12 billion in payouts from the fund since 2009. The value of the HECM program fluctuates over time, however: In 2015, the reverse mortgage portion of the fund generated an estimated $6.78 billion in value; in 2014, the deficit was negative $1.17 billion.
Unnamed HUD officials told the WSJ that without this change, the Federal Housing Administration would need an appropriation from Congress in the next few years to sustain the HECM fund. The officials also said that the drag created by reverse mortgages has prevented them from lowering insurance premiums on forward mortgages for homeowners.
“You have this cross-subsidy from younger, less affluent people who are trying to achieve homeownership,” HUD senior advisor Adolfo Marzol told the WSJ.
The move took the industry by surprise, with the WSJ reporting that leaders were not briefed on the changes beforehand.
Construction spending for the second quarter is off to a slow start as judged by housing starts. TheEconodayconsensus was for a 1% rise. Instead, starts declined nearly 5% from the initial June report, now revised lower.
After posting unexpectedly high numbers in June, all three residential construction indicators lost ground in July, and one, housing starts, is now running below its year-ago rate. While the softening is primarily in the multi-family sector, starts have declined in four of the last five months and permits in three of the last four.
The U.S. Census Bureau and the Department of Housing and Urban Development said privately owned housing starts were at a seasonally adjusted annual rate of 1,155,000 units, a 4.8 percent decline from June’s estimate of 1,213,000, which was revised down from 1,215,000. July starts were down 5.6 percent from the 1,223,000-unit annual rate in July 2016.
Starts failed to meet even the lowest predictions of analysts polled by Econoday. Their estimates ranged from 1.174 million to 1.250 million with a consensus of 1.225 million.
Single family starts were at a rate of 856,000, down 0.5 percent from a month earlier but 10.9 percent higher than the same month in 2016. Multifamily starts plunged 17.1 percent to 287,000 units and are down 35.2 percent year-over-year.
The performance of permits was like that of housing starts, down 4.1 percent to a seasonally adjusted annual rate of 1,223,000 units. Permits however held on to an annual increase of 4.1 percent. The June permitting rate was revised higher, from 1,254,000 to 1,275,000.
Analysts had expected permits to decline, with a consensus estimate of 1.246 units. Here again the drop was outside the low end of the range of 1.230 to 1.270 million units.
Authorizations for single-family homes were at a seasonally adjusted rate of 811,000, unchanged from June and 13.0 percent higher on an annual basis. Multi-family permits were 12.1 percent lower than the previous month at 377,000. This was down 11.7 percent year-over-year.
Permits:
Starts:
Units Under Construction:
Second-Half Outlook:
Econoday came up with this overall assessment: “Putting all the pieces together: starts are down 5.6 year-on-year in weakness offset by permits which are up 4.1 percent. Permits are the forward looking indication in this report and today’s news, despite July weakness and general volatility in the data, is good. The housing sector, even with starts being soft, looks to be a contributor to the second-half economy.”
While it’s true that it takes a permit to begin construction, a permit does not guarantee construction will start anytime soon. At economic turns, they won’t.
Even assuming those permits turn into starts, the data still does not look to be a contributor to the second-half economy.
The number of permits and starts for multifamily explains what you need to know. 5-unit or more buildings will add more to construction spending numbers than 1-unit buildings. Permits and starts for multifamily structures plunged.
The report shows serious credit card delinquencies rose for the third consecutive quarter, a trend not seen since 2009.
Let’s take a look at a sampling of report highlights and charts.
Household Debt and Credit Developments in 2017 Q2
Aggregate household debt balances increased in the second quarter of 2017, for the 12th consecutive quarter, and are now $164 billion higher than the previous (2008 Q3) peak of $12.68 trillion.
As of June 30, 2017, total household indebtedness was $12.84 trillion, a $114 billion (0.9%) increase from the first quarter of 2017. Overall household debt is now 15.1% above the 2013 Q2 trough.
The distribution of the credit scores of newly originating mortgage and auto loan borrowers shifted downward somewhat, as the median score for originating borrowers for auto loans dropped 8 points to 698, and the median origination score for mortgages declined to 754.
Student loans, auto loans, and mortgages all saw modest increases in their early delinquency flows, while delinquency flows on credit card balances ticked up notably in the second quarter.
Outstanding student loan balances were flat, and stood at $1.34 trillion as of June 30, 2017. The second quarter typically witnesses slow or no growth in student loan balances due to the academic cycle.
11.2% of aggregate student loan debt was 90+ days delinquent or in default in 2017 Q2.
Total Debt and Composition:
Mortgage Origination by Credit Score:
Auto Origination by Credit Score:
30-Day Delinquency Transition:
90-Day Delinquency Transition:
Credit card and auto loan delinquencies are trending up. The trend in mortgage delinquencies at the 30-day level has bottomed. A rise in serious delinquencies my follow.
A really long, long time ago, well before most of today’s wall street analysts made it through puberty, the entire international financial system almost collapsed courtesy of a mortgage lending bubble that allowed anyone with a pulse to finance over 100% of a home’s purchase price…with pretty much no questions asked.
And while the millennial titans of high finance today may consider a decade-old case study on mortgage finance to be about as useful as a Mark Twain novel when it comes to underwriting mortgage risk, they may want to considered at least taking a look at the ancient finance scrolls from 2009 before gleefully repeating the sins of their forefathers.
Alas, it may be too late. AsBlack Knight Financial Servicespoints out, down payments, the very thing that is supposed to deter rampant housing speculation by forcing buyers to have ‘skin in the game’, are once again disappearing from the mortgage market. In fact, just in the last 12 months, 1.5 million borrowers have purchased a home with less than 10% down, a 7-year high.
– Over the past 12 months, 1.5M borrowers have purchased a home by putting down less than 10 percent, which is close to a seven-year high in low down payment purchase volumes
– The increase is primarily a function of the overall growth in purchase lending, but, after nearly four consecutive years of declines, low down payment loans have ticked upwards in market share over the past 18 months
– Looking back historically, we see that half of all low down payment lending (less than 10 percent down) in 2005-2006 involved piggyback second liens rather than a single high LTV first lien mortgage
– The low down payment market share actually rose through 2010 as the GSEs and portfolio lenders pulled back, the PLS market dried up, and FHA lending buoyed the purchase market as a whole
– The FHA/VA share of purchase lending rose from less than 10 percent during 2005-2006 to nearly 50 percent in 2010
– As the market normalized and other lenders returned, the share of low-down payment lending declined consistent with a drop in the FHA/VA share of the purchase market
On the bright side, at least Yellen’s interest rate bubble means that today’s housing speculators don’t even have to rely on introductory teaser rates to finance their McMansions...Yellen just artificially set the 30-year fixed rate at the 2007 ARM teaser rate…it’s just much easier this way.
“The increase is primarily a function of the overall growth in purchase lending, but, after nearly four consecutive years of declines, low down payment loans have ticked upward in market share over the past 18 months as well,” said Ben Graboske, executive vice president at Black Knight Data & Analytics, in a recent note. “In fact, they now account for nearly 40 percent of all purchase lending.”
At that time half of all low down payment loans being made involved second loans, commonly known as “piggyback loans,” but today’s mortgages are largely single, first liens, Graboske noted.
The loans of the past were also far riskier – mostly adjustable-rate mortgages, which, according to the Black Knight report, are virtually nonexistent among low down payment mortgages today. Instead, most are fixed rate. Credit scores of borrowers taking out these loans today are also about 50 points higher than those between 2004 and 2007.
Finally, on another bright note, tax payers are just taking all the risk upfront this time around…no sense letting the banks take the risk while pretending that taxpayers aren’t on the hook for their poor decisions…again, it’s just easier this way.
Existing Home Sales in June Dive 1.8 Percent: Same Old Problem? Second and Third Quarter Impact?
The wind down to the end of the second quarter is not going very well. Existing home sales in June fell 1.8% to a seasonally adjusted annualized rate of 5.52 million. The Econoday consensus estimate was 5.58 million.
The slip in pending home sales was no false signal as existing home sales fell 1.8 percent in June to a lower-than-expected annualized rate of 5.520 million. Year-on-year, sales are still in the plus column but not by much, at 0.7 percent which is the lowest reading since February.
Compared to sales, prices are rich with the median of $263,800 up 6.5 percent from a year ago. Another negative for sales is supply which fell 0.5 percent in the month to 1.96 million for an on-year decline of 7.1 percent. Relative to sales, supply is at 4.3 months vs 4.2 months in May.
High prices appear to be keeping first-time buyers out of the market with the group representing 32 percent of sales vs 33 percent in May and 35 percent for all of last year.
Rising prices and thin supply, not to mention low wages, are offsetting favorable mortgage rates and holding down sales. Housing data have been up and down and unable to find convincing traction so far this year. Watch for new home sales on Wednesday where general strength is the expectation.
Existing Homes Sales Month-Over-Month and Year-Over-Year
Existing home sales slipped in June, with the blame again placed on low levels of inventory. The decline in sales, announced on Monday by the National Association of Realtors® (NAR), was anticipated, as pending home sales have decreased in each of the previous three months, ticking down 0.8 percent in May.
NAR said sales of existing single-family houses, townhouses, condos and cooperative apartments were down 1.8 percent in June, to a seasonally adjusted annual rate of 5.52 million units, the second slowest performance of the year.
Lawrence Yun, NAR chief economist, says the pullback in existing home sales in June reflected the lull in contract activity in March, April, and May. “Closings were down in most of the country last month because interested buyers are being tripped up by supply that remains stuck at a meager level and price growth that’s straining their budget,” he said. “The demand for buying a home is as strong as it has been since before the Great Recession. Listings in the affordable price range continue to be scooped up rapidly, but the severe housing shortages inflicting many markets are keeping a large segment of would-be buyers on the sidelines.”
The median existing-home price for all housing types in June was $263,800, up 6.5 percent from June 2016 ($247,600). This is a new peak price, surpassing the record set in May. June marked the 64th straight month of year-over-year gains.
The median existing single-family home price was $266,200 in June and the median existing condo price was $245,900. Those prices reflected annual increases of 6.6 percent and 6.5 percent respectively.
The tight supply of homes continues to be reflected in short marketing period. Properties typically stayed on the market for 28 days in June, one day more than in May, but six days fewer than in June 2016. Short sales were on the market the longest at a median of 102 days in June, while foreclosures sold in 57 days and non-distressed homes took 27 days. Fifty-four percent of homes sold in June were on the market for less than a month.
“Prospective buyers who postponed their home search this spring because of limited inventory may have better luck as the summer winds down,” said NAR President William E. Brown. “The pool of buyers this time of year typically begins to shrink as households with children have likely closed on a home before school starts. Inventory remains extremely tight, but patience may pay off in coming months for those looking to buy.”
First-time buyers accounted for 32 percent of existing home sales in June, down from 33 percent the previous month and a year earlier, while individual investors purchased 13 percent, unchanged from a year ago.
Convoluted Logic
Supposedly buyers may have better luck because the pool of buyers is shrinking as summer winds down. Really? By that logic, if there was only one person looking there would be a 100% success rate.
Yun says “The demand for buying a home is as strong as it has been since before the Great Recession.”
Really? By what measure?
Attitudes and Price
This is not a case of inventory or strong unmet demand. Here are the real factors.
The Fed re-blew the housing bubble and wages did not keep up. People cannot afford the going prices. Thus, the number of first-time buyers keeps shrinking.
Millenials do not have the same attitudes towards debt, housing, and family formations as their parents.
Millenials are unwilling to spend money they do not have, for a place that will keep them tied down. They would rather be mobile.
Second and Third Quarter Impact
The decline in existing home purchases portends weakness in consumer spending.
There will be fewer people painting, buying furniture, updating appliances, remodeling kitchens, adding landscaping etc. The pass through effect will be greatest in the third quarter unless there is a rebound.
College graduates and other young Americans are increasingly clustering in urban centers like New York City, Chicago and Boston. And now, American companies are starting to follow them. Companies looking to appeal to, and be near, young professionals versed in the world of e-commerce, software analytics, digital engineering, marketing and finance are flocking to cities. But in many cases, they’re leaving their former suburban homes to face significant financial difficulties, according tothe Washington Post.
Earlier this summer, health-insurer Aetna said it would move its executives, plus most of technology-focused employees to New York City from Hartford, Conn., the city where the company was founded, and where it prospered for more than 150 years.GE said last year it would leave its Fairfield, Conn., campus for a new global headquarters in Boston. Marriott International is moving from an emptying Maryland office park into the center of Bethesda.
Meanwhile, Caterpillar is moving many of its executives and non-manufacturing employees to Deerfield, Ill. from Peoria, Ill., the manufacturing hub that CAT has long called home. And McDonald’s is leaving its longtime home in Oak Brook, Ill. for a new corporate campus in Chicago.
“Visitors to the McDonald’s wooded corporate campus enter on a driveway named for the late chief executive Ray Kroc, then turn onto Ronald Lane before reaching Hamburger University, where more than 80,000 people have been trained as fast-food managers.
Surrounded by quiet neighborhoods and easy highway connections, this 86-acre suburban compound adorned with walking paths and duck ponds was for four decades considered the ideal place to attract top executives as the company rose to global dominance.
Now its leafy environs are considered a liability. Locked in a battle with companies of all stripes to woo top tech workers and young professionals, McDonald’s executives announced last year that they were putting the property up for sale and moving to the West Loop of Chicago where “L” trains arrive every few minutes and construction cranes dot the skyline.”
The migration to urban centers, according toWaPo,threatens the prosperity outlying suburbs have long enjoyed, bringing a dose of pain felt by rural communities and exacerbating stark gaps in earnings and wealth that Donald Trump capitalized on in winning the presidency.
Many of these itinerant companies aren’t really moving – or at least not entirely. Some, like Caterpillar, are only moving executives, along with workers involved in technology and marketing work, while other employees remain behind.
“Machinery giant Caterpillar said this year that it was moving its headquarters from Peoria to Deerfield, which is closer to Chicago. It said it would keep about 12,000 manufacturing, engineering and research jobs in its original home town. But top-paying office jobs — the type that Caterpillar’s higher-ups enjoy — are being lost, and the company is canceling plans for a 3,200-person headquarters aimed at revitalizing Peoria’s downtown.”
Big corporate moves can be seriously disruptive for a cohort of smaller enterprises that feed on their proximity to big companies, from restaurants and janitorial operations to other subcontractors who located nearby. Plus, the cancellation of the new headquarters was a serious blow. Not to mention the rollback in public investment.
“It was really hard. I mean, you know that $800 million headquarters translated into hundreds and hundreds of good construction jobs over a number of years,” Peoria Mayor Jim Ardis (R) said.
For the village of Oak Brook, being the home of McDonald’s has always been a point of pride. Over the year’s the town’s brand has become closely intertwined with the company’s. But as McDonald’s came under pressure to update its offerings for the Internet age, it opened an office in San Francisco and a year later moved additional digital operations to downtown Chicago, strategically near tech incubators as well as digital outposts of companies that included Yelp and eBay. That precipitated the much larger move it is now planning to make.
“The village of Oak Brook and McDonald’s sort of grew up together. So, when the news came, it was a jolt from the blue — we were really not expecting it,” said Gopal G. Lalmalani, a cardiologist who also serves as the village president.
Lalmalani is no stranger to the desire of young professionals to live in cities: His adult daughters, a lawyer and an actress, live in Chicago. When McDonald’s arrived in Oak Brook, in 1971, many Americans were migrating in the opposite direction, away from the city. In the years since, the tiny village’s identity became closely linked with the fast-food chain as McDonald’s forged a brand that spread across postwar suburbia one Happy Meal at a time.
“It was fun to be traveling and tell someone you’re from Oak Brook and have them say, ‘Well, I never heard of that,’ and then tell them, ‘Yes, you have. Look at the back of the ketchup package from McDonald’s,’ ” said former village president Karen Bushy. Her son held his wedding reception at the hotel on campus, sometimes called McLodge.
The village showed its gratitude — there is no property tax — and McDonald’s reciprocated with donations such as $100,000 annually for the Fourth of July fireworks display and with an outsize status for a town of fewer than 8,000 people.”
Robert Gibbs, the former White House press secretary who is now a McDonald’s executive vice president, said the company had decided that it needed to be closer not just to workers who build e-commerce tools but also to the customers who use them.
“The decision is really grounded in getting closer to our customers,” Gibbs said.
Some in Oak Brook have begun to invent conspiracy theories about why McDonald’s is moving, including one theory that the company is trying to shake off its lifetime employees in Oak Brook in favor of hiring cheaper and younger urban workers.
“The site of the new headquarters, being built in place of the studio where Oprah Winfrey’s show was filmed, is in Fulton Market, a bustling neighborhood filled with new apartments and some of the city’s most highly rated new restaurants.
Bushy and others in Oak Brook wondered aloud if part of the reasoning for the relocation was to effectively get rid of the employees who have built lives around commuting to Oak Brook and may not follow the company downtown. Gibbs said that was not the intention.
‘Our assumption is not that some amount [of our staff] will not come. Some may not. In some ways that’s probably some personal decision. I think we’ve got a workforce that’s actually quite excited with the move,’ he said.”
Despite Chicago’s rapidly rising murder rate and one would think its reputation as an indebted, crime-ridden metropolis would repel companies looking for a new location for their headquarters. But crime and violence rarely penetrate Chicago’s tony neighborhoods like the Loop, where most corporate office space is located.
“Chicago’s arrival as a magnet for corporations belies statistics that would normally give corporate movers pause. High homicide rates and concerns about the police department have eroded Emanuel’s popularity locally, but those issues seem confined to other parts of the city as young professionals crowd into the Loop, Chicago’s lively central business district.
Chicago has been ranked the No. 1 city in the United States for corporate investment for the past four years by Site Selection Magazine, a real estate trade publication.
Emanuel said crime is not something executives scouting new offices routinely express concerns about. Rather, he touts data points such as 140,000 — the number of new graduates local colleges produce every year.
“Corporations tell me the number one concern that t: Zerohey have — workforce,” he said.”
Chicago Mayor Rahm Emanuel said the old model, where executives chose locations near where they wanted to live has been upturned by the growing influence of technology in nearly every industry. Years ago, IT operations were an afterthought. Now, people with such expertise are driving top-level corporate decisions, and many of them prefer to live in cities.
“It used to be the IT division was in a back office somewhere,” Emanuel said. “The IT division and software, computer and data mining, et cetera, is now next to the CEO. Otherwise, that company is gone.”
Even the Fed put commercial real estate on its financial-stability worry list.
No, the crane counters were not wrong. In 2017, the ongoing apartment building-boom in the US will set a new record: 346,000 new rental apartments in buildings with 50+ units are expected to hit the market.
How superlative is this? Deliveries in 2017 will be 21% above the prior record set in 2016, based on data going back to 1997, by Yardi Matrix,via Rent Café. And even 2015 had set a record. Between 1997 and 2006, so pre-Financial-Crisis, annual completions averaged 212,740 units; 2017 will be 63% higher!
These numbers do not include condos, though many condos are purchased by investors and show up on the rental market. And they do not include apartments in buildings with fewer than 50 units. This chart shows just how phenomenal the building boom of large apartment developments has been over the past few years:
The largest metros are experiencing the largest additions to the rental stock. The chart below shows the number of rental apartments to be delivered in those metros in 2017. But caution in over-interpreting the chart – the population sizes of the metros differ enormously.
The New York City metro includes Northern New Jersey, Central New Jersey, and White Plains and is by far the largest metro in the US. So the nearly 27,000 apartments it is adding this year cannot be compared to the 5,400 apartments for San Francisco (near the bottom of the list). The city of San Francisco is small (about 1/10th the size of New York City itself), and is relatively small even when part of the Bay Area is included.
Other metros on this list are vast, such as the Dallas-Fort Worth metro which includes the surrounding cities such as Plano. Driving through the area on I-35 East gives you a feel for just how vast the metro is. However, I walk across San Francisco in less than two hours:
Special note: Chicago is adding 7,800 apartments even though the population has begun to shrink. So this isn’t necessarily going to work out.
This building boom of large apartment buildings is starting to have an impact on rents. In nearly all of the 12 most expensive rental markets, median asking rents have fallen from their peaks, and in several markets by the double digits,including Chicago (-19%!), Honolulu, San Francisco, and New York City.
And it has an impact on the prices of these buildings. Apartments are a big part of commercial real estate. They’re highly leveraged. Government Sponsored Enterprises such as Fanny Mae guarantee commercial mortgages on apartment buildings and package them in Commercial Mortgage-Backed Securities. So taxpayers are on the hook. Banks are on the hook too.
This is big business. And it is now doing something it hasn’t done since the Great Recession. The Commercial Property Price Index (CPPI) byGreen Street, which tracks the “prices at which commercial real estate transactions are currently being negotiated and contracted,” plateaued briefly in December through February and then started to decline. By June, it was below where it had been in June 2016 – the first year-over-year decline since the Great Recession:
Some segments in the CPPI were up, notably industrial, which rose 9% year over year, benefiting from the shift to ecommerce, which entails a massive need for warehouses by Amazon [Is Amazon Eating UPS’s Lunch?] and other companies delivering goods to consumers.
But prices of mall properties fell 5%, prices of strip retail fell 4%, and prices of apartment buildings fell 3% year-over-year.
So for renters, there is some relief on the horizon, or already at hand – depending on the market. There’s nothing like an apartment glut to bring down rents. See what the oil glut in the US has done to the price of oil.
Investors in apartment buildings, lenders, and taxpayers (via Fannie Mae et al. that guarantee commercial mortgage-backed securities), however, face a treacherous road. Commercial real estate goes in cycles as the above chart shows. Those cycles are not benign. Plateaus don’t last long. And declines can be just as sharp, or sharper, than the surges, and the surges were breath-taking.
Even the Fed has put commercial real estate on its financial-stability worry list and has been tightening monetary policy in part to tamp down on the multi-year price surge. The Fed is worried about the banks, particularly the smaller banks that are heavily exposed to CRE loans and dropping collateral values.
But the new supply of apartment units hitting the market in 2018 and 2019 will even be larger. In Seattle, for example, there are 67,507 new apartment units in the pipeline.
Therental apocalypsecontinues in Los Angeles. It is interesting to see how far some house humpers will go trying to justify prices. Some are arguing future weed sales are going to create another boom which is somewhat ironic since the benefits are actually to mellow you out, not turn you into a Taco Tuesday baby boomer that becomes a cubicle stressed slave just to purchase a home. And many times people plan on having a family shortly after which means higher childcare costs which they tend to forget. However, Los Angeles once again continues to be theworst place to rent in terms of affordability(and own for that matter). Zillow put out some interesting research and of course as you would expect, those spending nearly half of their income on rent are simply not saving for retirement.
L.A. is the Whole Foods of rental markets
I liken the L.A. housing market to Whole Foods. Great and healthy items that usually break the bank. L.A. has a large number of young and healthy hipsters and Millennials but most can’t buy a home. Heck, most Uber and Lyft drivers have nicer cars than most of us. So we live in this market where the perception is that everyone is well off and healthy when in reality many homeowners are stuck in a ridiculous commute for acrap shack and that is bad for your health.
Of course this isn’t some made up figure. Just take a look at how much income is dumped on rent in various markets:
Los Angeles by far is the worst market for renters surpassing even New York and San Francisco. I’ve made this argument multiple times and that has to do with incomes being far lower in this area compared toSan Franciscoand New York. Of course to house humpers they only see coastal Santa Monica and somehow use this as the reference for every other hood in the area where most of the plebs live. They forget that L.A. County has 10,000,000 people with most not living on the coast.
So it is also telling that L.A. is largely a renting household dominated county. You havemillions of Millennialsacross the state living at home with their parents because rents are too expensive. There is also this romantic idea that many people are stashing millions of dollars away by doing this but the stats show a different story. Some are, but most are not.
What you have is Taco Tuesday baby boomers now stuck in granite countertop HGTV upgraded sarcophagi that they can’t leave for a variety of reasons including locked in Prop 13 tax assessments and adult children back in their nursery rooms. You also have the issue of low inventory that is plaguing the country:
The low inventory dilemma is not only a SoCal phenomenon but has also impacted most urban metro markets. This is why housing as an entire asset class has soared with the stock market since 2009. Unlike the stock market however, scarcity has been a large factor driving prices up in real estate.
The issue of rents is problematic however. As the percentage of households that rent grows, you are going to get those in the middle being squeezed. What do renter households care if taxes get increased on property if they don’t own? Back in 1978 when Prop 13 passed you had a much larger percentage of California homeowners. Today that is clearly not the case. “Well we’ll just increase the rent and pass it on!” Do you think people think like this? Of course not! Just take a look at New York City where only 31 percent of households own. And look at how they tax people there. That is the future. Where only the uber elite will be comfortable in their homes. Grandfathered in Taco Tuesday baby boomer homeowners will live in million dollarcrap shacksand shop at the 99 Cents Store.
The idea that broke Millennials were going to buy in mass in Los Angeles never made sense. Many would rather eat out, work out, and live a more Spartan life (many by necessity). Ironically more are healthier than those pot belly cubicle dwellers that are stuck in obscene traffic everyday having to make that massive 30-year mortgage commitment. But hey, we do live in the Whole Foods of housing markets.
The housing market is suffering from a supply shortage, not a demand dilemma. As Millennial first-time homebuyer demand continues to increase, the inventory of homes for sale tightens. At the same time, prices are increasing, so why aren’t there more homeowners selling their homes?
In most markets, the seller, or supplier, makes their decision about adding supply to the market independent of the buyer, or source of demand, and their decision to buy. In the housing market, the seller and the buyer are, in many cases, actually the same economic actor. In order to buy a new home, you have to sell the home you already own.
So, in a market with rising prices and strong demand, what’s preventing existing homeowners from putting their homes on the market?
“Existing homeowners are increasingly financially imprisoned in their own home by their historically low mortgage rate. It makes choosing a kitchen renovation seem more appealing than moving.”
The housing market has experienced a long-run decline in mortgage rates from a high of 18 percent for the 30-year, fixed-rate mortgage in 1981 to a low of almost 3 percent in 2012. Today, five years later, mortgage rates remain just a stone’s throw away from that historic low point. This long-run decline in rates encouraged existing homeowners to both move more often and to refinance more often, in many cases refinancing multiple times between each move.
It’s widely expected that mortgage rates will rise further. This is more important than we may even realize because the housing market has not experienced a rising rate environment in almost three decades! No longer is there a financial incentive to refinance for most homeowners, and there’s more to consider when moving. Why move when it will cost more each month to borrow the same amount from the bank? A homeowner can re-extend the mortgage term another 30 years to increase the amount one can borrow at the higher rate, but the mortgage has to be paid off at some point. Hopefully before or soon after retirement. Existing homeowners are increasingly financially imprisoned in their own home by their historically low mortgage rate. It makes choosing a kitchen renovation seem more appealing than moving.”
There is one more possibility caused by the fact that the existing-home owner is both seller and buyer. In today’s market, sellers face a prisoner’s dilemma, a situation in which individuals don’t cooperate with each other, even though it is seemingly in their best interest to do so.
Consider two existing homeowners. They both want to buy a new house and move, but are unable to communicate with each other. If they both choose to sell, they both benefit because they increase the inventory of homes available, and collectively alleviate the supply shortage. However, if one chooses to sell and the other doesn’t, the seller must buy a new home in a market with a shortage of supply, bidding wars and escalating prices. Because of this risk, neither homeowner sells (non-cooperation) and neither get what they wanted in the first place – a move to a new, more desirable home. Imagine this scenario playing out across an entire market. If everyone sells there will be plenty of supply. But, the risk of selling when others don’t convinces everyone not to sell and produces the non-cooperative outcome.
Possible Outcomes
Owner moves, but pays a price escalated by supply shortages for a more desirable home
Owner stays in current house and does not get a more desirable home
Owner moves, finding a more desirable home without paying a price escalated by supply shortages
Rising mortgage rates and the fear of not being able to find something affordable to buy is imprisoning homeowners and causing the inventory shortages that are seen in practically every market across the country. So, what gives in a market short of supply relative to demand? Prices.According to the First American Real House Price Index, the fast pace of house price growth, combined with rising rates, has had a material impact on affordability. In our most recent analysis in April, affordability was down 11 percent compared to a year ago. It was once said that a man’s home is his castle. In today’s market, a man’s home may be his prison, but he is getting wealthier for it.
Each new policy destroys another level of prudent fiscal/financial discipline.
The primary driver of our economy–financialization–is in a death spiral. Financialization substitutes expansion of interest, leverage and speculation for real-world expansion of goods, services and wages.
Financial “wealth” created by leveraging more debt on a base of real-world collateral that doesn’t actually produce more goods and services flows to the top of the wealth-power pyramid, driving the soaring wealth-income inequality we see everywhere in the global economy.
As this phantom wealth pours into assets such as stocks, bonds and real estate, it has pushed the value of these assets into the stratosphere, out of reach of the bottom 95% whose incomes have stagnated for the past 16 years.
The core problem with financialization is that it requires ever more extreme policies to keep it going. These policies are mutually reinforcing, meaning that the total impact becomes geometric rather than linear. Put another way, the fragility and instability generated by each new policy extreme reinforces the negative consequences of previous policies.
These extremes don’t just pile up like bricks–they fuel a parabolic rise in systemic leverage, debt, speculation, fragility, distortion and instability.
This accretive, mutually reinforcing, geometric rise in systemic fragility that is the unavoidable output of financialization is poorly understood, not just by laypeople but by the financial punditry and professional economists.
Gordon Long and I cover the policy extremes which have locked our financial system into a death spiral in a new 50-minute presentation, The Road to Financialization. Each “fix” that boosts leverage and debt fuels a speculative boom that then fizzles when the distortions introduced by financialization destabilize the real economy’s credit-business cycle.
Each new policy destroys another level of prudent fiscal/financial discipline.
The discipline of sound money? Gone.
The discipline of limited leverage? Gone.
The discipline of prudent lending? Gone.
The discipline of mark-to-market discovery of the price of collateral? Gone.
The discipline of separating investment and commercial banking, i.e. Glass-Steagall? Gone.
The discipline of open-market interest rates? Gone.
The discipline of losses being absorbed by those who generated the loans? Gone.
And so on: every structural source of discipline has been eradicated, weakened or hollowed out. Financialization has consumed the nation’s seed corn, and the harvest of instability is ripening in the fields of finance and the real economy alike.
The three-month average home price in the Toronto area is down a record 14.2% following a flood of new listings and an interest rate hike by the Bank of Canada.
Sales fell most in eight years. Did Canada’s housing bubble just burst?
Total home sales in Greater Toronto dropped to 5,977 in June, the lowest level since 2010 and down 15.1 percent from the month prior, data from the Canadian Real Estate Association show. Average prices are down 14.2 percent since March — the fastest 3-month decline in the history of the data back to 1988 — while the ratio of sales to new listings sits at its lowest level since 2009.
The June data comes after a series of measures by policy makers to tighten access to the market — and before the Bank of Canada hiked its benchmark interest rate last week, the first increase since 2010 that will further pinch mortgage eligibility. Prices and sales also fell in nearby regions such as Hamilton-Burlington and Kitchener-Waterloo, CREA data show.
Lawmakers, concerned that escalating prices could lead to a disorderly correction, imposed measures including tightened mortgage eligibility rules and a tax on foreign buyers. Toronto’s market has lost momentum, while in Vancouver sales plummeted last year on similar measures but have since rebounded.
The economists expect Toronto to follow Vancouver’s path — price adjustment at the top of the market with less impact at lower prices. Meanwhile, cities like Montreal and Ottawa look strong.
Vancouver rebounded after the restrictions and economists expect Toronto will do the same.
But at some point sanity will return. The bottom in both markets is a long way down.
The second-quarter economic report misery continues in a major way today with housing starts and permits unexpectedly falling.
TheEconodayconsensus was was for starts to rise 4.35%. Instead, starts fell 5.5%. Adding insult to injury, April was revised lower by 1.37 percentage points making the consensus estimate off by an amazing 11.22 percentage points.
The bad economic news keeps building, this time in the housing sector. Housing starts fell an unexpected 5.5 percent in May to a far lower-than-expected annualized rate of 1.092 million with permits likewise very weak, down 4.9 percent to a 1.168 million rate.
All components show declines with single-family starts down 3.9 percent to a 794,000 rate and permits down 1.9 percent to 779,000. Multi-family starts fell 9.7 percent to 298,000 with permits down 10.4 percent to 389,000. Total completions did rise 5.6 percent to a 1.164 million rate, which adds supply to a thin market, but homes under construction slipped 0.7 percent to 1.067 million.
Adding to the bad news are downward revisions to starts including April which is now at 1.156 vs an initial 1.172 million. Looking at the quarter-to-quarter comparison, starts have averaged 1.124 million so far in the second quarter, down a very sizable 9.2 percent from 1.238 million in the second quarter. Permits, at an average of 1.198 million, are down 4.9 percent.
Residential investment looks to be yet another negative for second-quarter GDP.
The negative report prompted the following statement from the National Association of Realtor’s Chief Economist Lawrence Yun. “Housing shortages look to intensify and may well turn into a housing emergency if the discrepancy between housing demand and housing supply widens further. The falling housing starts and housing permits in May are befuddling given the lack of homes for sale and the quick pace of selling a newly-constructed homes. Meanwhile, job creations of a consistent 2 million a year will push up housing demand further. One thing that moving up is the housing costs for consumers: higher home prices and higher rents.”
NAR “Befuddled”
Yun is befuddled. That’s hardly surprising given that it does not take much to befuddle economists.
Let me clear up the confusion:
People cannot afford homes so they are not buying them.
Builders will not purposely build homes to sell at a loss.
The alleged demand for new homes is imaginary.
Such analysis is beyond the scope of most economists, so I am happy to help out.
America’sbiggest as of 2016 generation, the Millennials, has a heavy burden on itscollective 150 million shoulders: its task is to not only step in as a buyer of stocks once the baby boomers begin selling in bulk, but to also provide the much needed support pillar for the recovery of the US housing market. In fact, there have been countless “bullish” housing market theories built upon the premise that sooner or later tens of millions of young American adults will emerge from their parents’ basements, start a household, and buy a house.
So far that theory has not been validated. One simple reason is that Millennials simply can’t afford to buy a house. As we reported last week, a study from Apartment List showed that nearly 70% of young American adults, those aged 18 to 34 years old, said they have saved less than $1,000 for a down payment. This is similar to what a recentGoBanking Survey found last year, according to which 72% of “young millennials”- those between 18 and 24 years old – had $1,000 in their savings accounts and 31% have $0; a sliver (8%) have over $10,000 saved. Of the “older millennials”, those between 25 and 34, 67% had less than $1,000 in their savings accounts, 33% have nothing at all, and 15% had over $10,000.
So does that mean that Millennials can simply be written off as a potential generation of homeowners, and if so, what are the implications for the broader housing market?
That’s the question BofA economist Michelle Meyer asked on Friday, although she phrased it in the proper context: “Is it [still] cool to buy a home.“
To our surprise, Meyer found that while the home ownership rate among young adults has plunged to a record low, helping to explain the slow recovery in single family home building, and confirming empirical observations that Millennials have largely been a ‘renter’ generation, by Bank of America’s calculations, the Millennial generation can afford to buy a home – at least in terms of making the monthly payments. While we – and many others would dispute that – BofA does make some other interesting observations, namely that lifestyle changes, including delayed marriage and child rearing, have led to fewer homeowners and a tendency to live close to city centers. Well, if it’s not money it’s clearly something else. Let’s dig in.
First, here is BofA on a rather trivial, if critical topic: “the importance of the youth”
In order to understand the future of the housing stock, it helps to get a grasp on the growth in population, which is a function of immigration and the rate of births/deaths. The Census Bureau is projecting population growth of 0.8% annually over the next decade and 0.7%, on average, through 2036, showing continued slowing from the 0.9% average last decade. Perhaps even more important, however, is the age composition, with a particular focus on young adults who are the drivers of household formation. There are currently 75 million individuals considered to be Millennials, making up the largest generation. The average age is 27.5, implying that there is a large cohort of young adults coming to age (Chart 1). In theory, this should underpin growth in home ownership. But, it is complicated – we have to understand the ability of Millennials to afford housing and the desire to become homeowners vs. renters.
Can they afford to buy?
The first question to ask is whether the younger generation can afford to buy a home. We turn to the National Association of Realtors (NAR) affordability index which is a ratio between median family income and the qualifying income for a mortgage as a function of median existing single-family home prices and mortgage rates. According to this measure, homeownership is still very affordable relative to history. What about for young adults? Following the NAR’s methodology, we compute an affordability measure for the 25-34 year old age cohort using median household income data from the Census Bureau. Our computed index only goes to 2015 given data limitations, but we extrapolate forward (Chart 2). We find that housing is still affordable for young adults, although not to the extent it is for the overall population. The gap in affordability between the overall population and young adults has widened over the years. That said, the affordability index for young adults is still above the historical average for the aggregate, implying that housing is generally affordable.
So what seems to be the problem? One obstacle is being able to make the downpayment. The NAR measure assumes a 20% down payment, which is a high hurdle for young adults– remember that the bulk of the current 25-34 year old cohort started their careers during the financial crisis and early stages of the recovery, when the economy and labor market were fragile. Plugging in a lower down payment of 10% and the situation looks worse due to increased principal and interest payments.With a 10% downpayment, the index would be at 125.2 in 2015, which is 11% lower than the standard 25-34 year old index and 25% lower than the broad NAR index.
Another challenge is the ability to take on a mortgage loan given high student debt. According to the NY Fed’s credit panel, total outstanding student debt has reached $1.3 trillion, a substantial increase from the $260bn level in 2004. According to the NAR’s Generational Report, nearly 50% of homebuyers under the age of 36 noted that student debt delayed their home purchase, making it harder to afford the downpayment. And, of course, there is the challenge from tighter credit standards which has made it more difficult to achieve homeownership.
But do they want to buy?
Addressing whether Millennials can afford to buy is only one part of the story. We need to understand if they actually want to buy. The homeownership rate has tumbled at a faster rate for 25-34 year olds than for other generations which we do not think can be explained by affordability metrics (Chart 3). We think it also owes to lifestyle changes. Maybe there is something to the stories about Millennials preferring to spend money on avocado toast instead of their home?
The shopping cart of young adults
Using data from the Consumer Expenditure Survey, we can look at the evolution of the consumer basket over time for those aged 24-35 (Table 1). Relative to the peak of the housing bubble in 2004, there has been a decline in the share of dollars spent on owned shelter and an increase in spending on renting. It also seems that this age group is spending more on healthcare and household operations, which include services paid to keep their household running efficiently (think cleaning). This has come at the expense of spending on apparel, transportation and groceries. The young adult in 2004 has a difference shopping cart than one today.
The single life
The change in spending patterns could reflect the fact that young adults are not only less likely to be homeowners, but they are less likely to be married or even live independently. Instead, this age group is living with parents or other relatives more than in the past (Chart 4). This adjustment in living arrangements has been ongoing for years but the Great Recession seemed to have speed up the trend. Today only 55% of those aged 25-34 live with a spouse/partner compared to over 80% in 1967. Life events such as getting married or having children are typical triggers to buying a home. The longer this age group lives with parents or independently, the more home ownership will be delayed.
City slickers
We have also seen a shift toward urban centers and away from rural areas over the years. This goes hand-in-hand with a decline in home ownership for young adults. Interestingly the share of young adults living in the suburbs has been fairly steady at around 41% (Chart 5). Moreover, it appears that there is a flocking toward the major cities, specifically in the city centers which are close to transit, workplaces and restaurants. City centers typically have more rental properties than the suburbs. But we also see greater home sales close to city centers than in the past. According to BuildZoom, new home sales within 5 miles of the centers of the 10 most densely cities have exceeded 2000 levels but if you go another 10 miles out, sales are about 50% below 2000 levels.
There are both cyclical and secular forces behind the drop in the home ownership rate for young adults. While young adults can generally afford housing, there are other constraints including the ability to make a large enough down payment and tighter credit standards. Lifestyle changes are partly to blame.
BofA’ troubling conclusion: “These dynamics won’t change in the medium-term which should translate to a lower equilibrium pace for single family housing starts.”
The pending home sales index, an estimate of existing home sales, has accurately provided the direction of the monthly home resale reports.
The survey is down for the second month, providing further evidence of a housing slowdown.
TheEconodayconsensus estimate was for the index to rise 0.5%. Instead, the pending home sales index declined 1.3%.
“Spring sales data have not been favorable for the housing sector. Pending home sales are down for a second straight month, 1.3 percent lower in April to an index of 109.8 which is 3.3 percent below this time last year. This index tracks contract signings for resales and the results point to weakness for final sales in May and June. Final resales contracted in April as did new home sales while the month’s housing starts were also weak. Spring is the big season for housing and these are not the results of a sector that will be leading the 2017 economy.”
Pending home sales had been expected to rise slightly in April after declining 0.8 percent in March. Instead, the National Association of Realtors’® (NAR’s) Pending Home Sale Index (PHSI) slumped for the second straight month, dropping 1.3 percent. The PHSI, based on contracts signed for existing home purchases, fell from 111.3 (revised from 111.4) in March to 109.8.
The April dip put the Index 3.3 percent below its level in April 2016. This was the first year-over-year decline since last December and the largest since the Index fell 7.1 percent in June 2014.
Lawrence Yun, NAR chief economist, said the fading contract activity in the normally active spring market is due to significantly weak supply levels. These, in turn, are spurring deteriorating affordability conditions. “Much of the country for the second straight month saw a pullback in pending sales as the rate of new listings continues to lag the quicker pace of homes coming off the market,” he said. “Realtors are indicating that foot traffic is higher than a year ago, but it’s obviously not translating to more sales.”
Yun added, “Prospective buyers are feeling the double whammy this spring of inventory that’s down 9.0 percent from a year ago and price appreciation that’s much faster than any rise they’ve likely seen in their income.”
The economist sees little evidence that the record low levels of inventory will improve anytime soon. Homebuilding activity remains below the necessary levels and too few homeowners are listing their home for sale.
“The unloading of single-family homes purchased by real estate investors during the downturn for rental purposes would also go a long way in helping relieve these inventory shortages,” said Yun. “To date, there are no indications investors are ready to sell. However, they should be mindful of the fact that rental demand will soften as the overall population of young adults starts to shrink in roughly five years.”
NAR expects that existing home sales will increase about 3.5 percent from 2016 to 5.64 million units and the national median existing-home price is expected to increase around 5 percent. In 2016, existing sales increased 3.8 percent and prices rose 5.1 percent.
The decline of sales was nearly nationwide in scope and all four regions are now running lower index numbers than the previous April. The West was the only region enjoying a month-over-main gain. The PHSI in the Northeast decreased 1.7 percent to an index of 97.2, now 0.6 percent lower than the previous April. In the Midwest, the index fell 4.7 percent to 104.4, a decline of 6.1 percent year-over-year.
Supply Issue?
In addition to the decline this month, the Pending Home Sales Index for March was revised lower, from -0.8 % to -0.9 %. The second quarter recovery thesis is dying on the vine.
Once again Yun blames supply. And once again Yun is wrong. If supply was triple and prices remained the same, sales would not be skyrocketing.
Of course, if supply tripled and sales did not soar, prices would drop. That is the real issue. Prices are above what buyers can afford to pay.
Although the number of resales is well below the bubble years, the median price isn’t.
Median Home Prices 1963-Present:
More Trapped Home Buyers:
New home sales are recorded at signing. Existing home sales are recorded at closing.
Thus, the March report has negative implications for April and May, while the April report has negative implications for resales in May and June.
Looking ahead, existing home buyers in the last two to three years overpaid. In some areas, notably California, home buyers overpaid dramatically.
Another round of trapped home buyers unable to sell their homes is right around the corner.
Banks have sharply pulled back on lending and have been tightening lending standards.
Banks are saying they see less demand so why are people saying demand is strong?
Overview
We live in a credit driven economy. Most know this to be the case. Individuals and corporations borrow money from banks for homes, cars, real estate projects and other investments. The availability for credit is perhaps the most important driver of economic growth, aside from income growth. Without credit, the economy grinds to a halt. It is not a surprise that banks have a desire to lend money when times are good and pull back lending when times are tough. This seems logical but when times are tough for consumers is exactly when they need credit to push forward with new marginal consumption.
Much of my research lately has been outlining the peak in the economic cycle that occurred in 2015. Many people misconstrue this for an imminent recession call or a stock market crash prediction when that simply is not the case.
The economy follows a sine curve. It peaks and troughs and for the most part follows a nice cyclical wave. Recessions occur when growth is negative but the “peak” of the cycle occurs well before the recession. They are not simultaneous events.
The sine wave below may help illustrate my point:
The most important point to understand is the elapsed time between the peak and the recession, where we live today.
Many confuse the “peak” of the cycle with the end of the cycle when in fact, across all economic cycles, the peak occurred about ~2 years prior to the recession. After the peak of the cycle is in, growth does continue, albeit at a slower pace. It is a dangerous assumption to make when critics of this analysis say we are still growing when we are growing at an ever slowing pace. When growth goes from 3% to -2%, let’s say, it has to hit 2%, 1%, 0%, etc. in the middle. That deceleration is what occurs between the peak and the recession.
There is a large population of investors and analysts that simply look at the nominal growth rate and say 2% is still okay, without regarding that the growth has gone from 3% to 2.5% to 2% and now lower.
The time to prepare for the end of the economic cycle is after the peak in the cycle has been established. The good news, like I said before, is you typically have two years after the peak to prepare yourself.
Preparing yourself does not mean buying canned foods and building a bunker as many raging bulls like to straw-man even the smallest critics into a “doom and gloom” scenario.
Preparing yourself in my view involves reducing equity exposure, raising cash, and increasing defensive exposure.
The good news is that you can still ride the gains of the lasting bull market with an asset allocation that is slightly more defensive. You may slightly under perform the last year or two of the bull market but if offered a scenario in which you gained 3% instead of 10% in the last year of the bull market and then gained another 3% instead of -10% in the following year, I would hope you’d pick the pair of 3% because that in fact leaves you with more money.
In a raging bull market some cannot stomach “leaving” that 7% (these are clearly arbitrary numbers used to make a point) on the table.
For the rest of the piece, I will use the banking loan growth and the banking surveys to prove the peak of the credit cycle is in and we are in a period of decelerating growth, falling down the back of the sine wave as I pointed out above. The recession is in sight despite how hard many want to avoid it.
I will also at the end run through the portfolio I began to recommend on May 1st that will prepare you for slowing growth but also allows you to share in the upside should the market continue higher.
So far, that portfolio is actually outperforming the S&P 500 with a negative correlation and lower volatility. I will go through this at the end.
The Peak in Credit is Behind Us, The Fat Lady is Singing
For the analysis of the credit peak, I will use two main economic reports. First is the “Assets and Liabilities of Commercial Banks” published by the Board of Governors of the Federal Reserve and the second is the Senior Loan Officer Survey also published by the Board of Governors of the Federal Reserve.
Assets and Liabilities
The “Assets and Liabilities” report is a weekly aggregate balance sheet for all commercial banks in the United States. The release also breaks down several banking groups. The most interesting part of the report is the breakdown of loan group in which you can see auto loans, real estate loans, consumer loans and much more.
Most importantly, this is hard data and not subject to sentiment, feeling or bias. Banks are either growing their loan books at a faster pace or a slower pace. This is perhaps one of the biggest economic signals. Banks would experience lower demand or credit issues and tighten up their loan books before that lack of credit leaks into the economy in the form of lower growth.
The following data from the Assets and Liabilities report will indicate just how much banks have reeled in their lending and prove the peak in credit growth is long gone.
All Commercial & Industrial Loans:
This is exactly as it sounds; all loans banks make, the broadest measure of credit availability. This is an aggregation of all the loans made by all the commercial banks in the survey. Currently this report aggregates 875 domestically chartered banks and foreign related institutions.
Rarely do I look at any data series in nominal terms, not year over year that is, but this chart does show the peaks in total credit fairly clearly. Credit rises week after week without ever slowing down. The only times when there was a pause, drop, or large deceleration in credit creation was during times of economic distress. Banks are fairly smart and they won’t lend if risk is too high, uncertainty is too great or credit quality is too low.
Many will speculate on the reason for a drop off in bank lending but the reason truthfully isn’t that important.
The growth rate in total credit shows you exactly when the fat lady began to sing on loan growth.
The question is not whether credit growth has peaked, that is clear. Credit growth is also never negative without a recession and we are getting dangerously close to that. If the prevailing sentiment is that demand is high, why are banks pulling back lending at a record pace?
The rate of the drop in credit growth has been accelerating. Some may point to the current administration and the uncertainty surrounding policy changes but I would push back and say that growth peaked and was falling since 2015, far before this political scenario.
It is very critical to look at the above loan growth chart in the context of the sine curve at the beginning of this piece. If negative growth is a sign of recession, I think you’d be crazy not to shift defensive. Don’t sell all stocks, just know where you are in the cycle.
This is the broadest measure of all credit, so what is the specific sector that is causing the aggregate loan growth to plummet.
The context of the cycle is clear in the above chart so for all the specific loan sectors going forward I will focus on this cycle only from 2009 through today. The report is also on a weekly basis. If a data series does not start from 2009 or prior, that is because that is all the data available as some series began in 2014.
Real Estate Loans:
Credit growth in the real estate sector peaked later than overall credit but has certainly registered its highest growth of the cycle.
Real estate clearly does well in times of credit expansion and less so during times of credit growth contraction.
Mapping home price growth from the Case-Shiller Home Price Index over real estate loan growth should highlight the importance of credit growth for real estate and the dangers of disregarding its rollover.
Not surprisingly, there is a high correlation between real estate loan growth and home price growth. Just briefly skipping ahead (will return to this) the Senior Loan officer survey also shows that banks are claiming lower demand for real estate loans; mortgages and more specifically, commercial real estate.
(Federal Reserve)
(Federal Reserve)
It is hard to overstate the importance of this, specifically the commercial real estate demand. People claim “demand is booming” or something of the sort but banks, the ones who actually make the loans, are claiming demand for real estate loans is the weakest since just before the last housing crisis. Again, not making that call but this drop in loan growth and demand is telling a far different story than those who claim demand is through the roof.
Consumer Loans: Credit Cards:
Consumer loan growth in the credit card space are following trend with the rest of loan growth, still growing but decelerating and months past peak.
With credit card growth rolling over, in order to keep up with the same consumption, consumers need to spend their income. The problem is income growth is falling as well.
Total real aggregate income is near its lowest level of the cycle.
With loan growth slowing and income growth slowing, where is the marginal consumption going to come from? With this data in hand, it should not some as a surprise that GDP growth has gone from 2% to 1% and sub 1% as of the latest Q1 reading.
What are banks saying about consumer demand?
(Federal Reserve)
Across all categories banks are reporting weaker demand. Again, where is the strong demand that everyone keeps talking about? It is not showing up in loan growth data or in banking demand surveys.
I will reiterate this point continually; loans are still growing and income is still growing but at a slower pace and past peak pace. This should put into context where we are in the broader economic cycle.
Auto Loans:
Unfortunately, the auto loan data started in 2015 so there is no previous cycle to use for comparison. Nevertheless, the peak in auto loan growth occurred in the summer of 2016, and like other credit, has been declining to its lowest level of the cycle.
Not much more needs to be discussed on auto loans that is not widely covered in the media. Subprime auto loans and sky-high inventories are a massive issue. In fact, auto inventories are the highest they’ve been since the Great Recession.
(BEA, FRED)
The goal here is not to predict a subprime auto loan issue but rather to point out yet another area of growth that is slowing to its lowest level of the cycle.
Commercial Real Estate:
While the peak in commercial real estate loan growth is in as well, the peak occurred later than the aggregate index. CRE loan growth topped out in 2016 while the aggregate loan growth peaked closer to the beginning of 2015.
As I pointed out above, banks are sending a serious warning sign on the commercial real estate market.
The senior loan survey shows a triple threat of warning signs from the banks. They are claiming falling demand, tighter lending standards and uncertainty about future prices.
Weakening demand:
Tightening Standards:
The following is an excerpt from the senior loan survey on commercial real estate:
A warning from the banks.
The fat lady has been singing on credit growth…So what do you do?
How To Prepare
On May 1st, I put out a recommended portfolio that the average investor can follow. The portfolio is a take on Ray Dalio’s All Weather portfolio.
I strongly believe peak growth is behind us, and when that happens, growth decelerates until the eventual recession. I am not in the game of predicting the exact date of the next recession.
I do not want to be long the market or short the market per se.
The best way to phrase my positioning is I want to be long growth slowing.
The portfolio I recommended (and will continue to update and change asset allocation on a weekly basis. Follow my SA page for continued updates) was the following:
(All analysis on this portfolio is from the time of recommendation, May 1st, to the time of this writing on May 18).
I use SCHD in my analysis as I mentioned I would choose this over SPY for additional safety but either one is fine.
Since the recommendation, the portfolio is up an excess of 0.96% above the S&P 500 with under 2/3 the volatility and a negative correlation.
The weighted beta of this portfolio, given the asset allocations above, is 0.02. This portfolio is nearly exactly market neutral and has a yield of around 2.5%, above the S&P 500. This portfolio protects you in all scenarios. If the stock market continues to rise, your portfolio should rise just slightly and you should continue to clip a nice coupon.
Should the market fall, the bond allocation will provide safety and stability to the portfolio. A portfolio like this allows you to weather the bumpy ride, stay invested, and continue to clip a dividend yield.
Of course, this is not an exact science and past performance is no indication of future results. Also, those who chose to follow a defensive, yet still net long, portfolio such as the one above can replace SPY or SCHD with their favorite basket of stocks. The reason I chose the ETF was for simplicity.
The percentages above are what I feel are best for the current environment we are in. It will allow me to share partially in the upside while mitigating my downside. At the end of the day, the most important thing is to protect capital.
If you want more equity beta, reduce TLT exposure and raise SPY exposure (or your favorite stocks).
This portfolio is the best way in my opinion to not be long, not be short, but be neutral and long growth slowing.
I will continue to update this portfolio and rotate asset allocation as the economic data changes and my positioning becomes more bullish or bearish.
Disclosure:I/we have no positions in any stocks mentioned, but may initiate a long position in TLT, GLD, IEF over the next 72 hours.
I wrote this article myself, and it expresses my own opinions. I am not receiving compensation for it (other than from Seeking Alpha). I have no business relationship with any company whose stock is mentioned in this article.
InFebruary 2016 we explained, correctly in retrospect, that the reason behind the unprecedented surge in Vancouver home prices was the seemingly constant flood of “hot Chinese money” desperate to park itself as far away from China’s banking system, and into offshore real-estate. This is how we laid out the stylized sequence of events that culminated with Vancouver home prices surging by over 20%:
Chinese investors smuggled out millions in embezzled cash, hot money or perfectly legal funds, bypassing the $50,000/year limit in legal capital outflows.
They make “all cash” purchases, usually sight unseen, using third parties intermediaries to preserve their anonymity, or directly in person, in cities like Vancouver, New York, London or San Francisco.
The house becomes a new “Swiss bank account”, providing the promise of an anonymous store of value and retaining the cash equivalent value of the original capital outflow.
Then the owners disappear, never to be heard from or seen again.
Separately, in mid-2015, when bitcoin was still trading in the low $200s, we also predicted that in an attempt to bypass China’s increasingly more draconian capital controls, Chinese oligarchs and ordinary savers would increasingly turn to what at the time was a largely unregulated medium of exchange: bitcoin.
we would not be surprised to see another push higher in the value of bitcoin: it was earlier this summer when the digital currency, which can bypass capital controls and national borders with the click of a button, surged on Grexit concerns and fears a Drachma return would crush the savings of an entire nation. Since then, BTC has dropped (in no small part as a result of the previously documented “forking” with Bitcoin XT), however if a few hundred million Chinese decide that the time has come to use bitcoin as the capital controls bypassing currency of choice, and decide to invest even a tiny fraction of the $22 trillion in Chinese deposits in bitcoin (whose total market cap at last check was just over $3 billion), sit back and watch as we witness the second coming of the bitcoin bubble, one which could make the previous all time highs in the digital currency, seems like a low print.
With one bitcoin now going for roughly $1,800 – and with the PBOC repeatedly cracking down on all forms of bitcoin cross-border flow – this prediction also turned out to be right.
So putting the two together, at least one enterprising Canadian homeowner has decided to make life for potential Chinese buyers especially easy, and in a posting on the Hong Kong edition of Craigslist, has listed a relatively modest Vancouver house for the price of 2,099 bitcoin.
At today’s exchange rate of US$1,737 for one bitcoin, the US dollar equivalent price is roughly $3.6 million or C$4.9 million. So what does nearly five million Canadian dollars buy enterprising Chinese investors who are willing to pay up for the convenience of bypassing currency conversion into Canadian dollars altogether? This:
Jobs and wages are on the rise. Buyers are newly urgent, fearful an era of cheap money is ending. And to top it off, there simply aren’t enough homes listed for sale. As a result, bidding wars are common and prices are rising during the popular spring buying season. A report out Tuesday from CoreLogic shows the Southern California median home price jumped 7.1% in March from a year earlier, hitting $480,000 in the six-county area. And despite low inventory, sales rose 7.8%.
A pitched battle
When Elizabeth Rodriguez and her husband realized that the market was white-hot in the Northeast L.A. burbs where they wanted to raise their three children, they devised a strategy.
The couple, who moved from the Bay Area for Rodriguez’s husband’s director job, began writing a “love letter” to sellers describing how much they wanted the house. And then they bid over asking — way, way over asking.
In one case, they offered $102,000 above the $798,000 list price for a three-bedroom Spanish-style home in Mount Washington. The house sold to someone else for $985,000.
“After that I was like, this is insane,” said the 35-year-old mother of three.
The couple bid on 11 homes, she said, before they finally purchased a three-bedroom in the hills of Glassell Park listed at $799,900. To seal the deal, they again bid about $100,000 over asking, this time before an open house was held.
“It was a crazy process,” Rodriguez said. “I’m glad we are on the other side of it.”
For developers, crazy times are good — especially in areas where few new homes are being built.
Last weekend, builder Planet Home Living held a grand opening for a Silver Lake 10-home subdivision built on small lots. Before any prospective buyers showed up, six of the $1-million houses were already in escrow after the Newport Beach firm contacted people who signed a list of interested buyers.
“Four hundred people on an interest list, that’s a lot for 10 homes,” said the company’s chief executive, Michael Marini. “Anything in L.A. that we build, it sells out immediately.”
The buying frenzy isn’t limited to Los Angeles either.
Agents across the region reported heavy demand, even in the Inland Empire, which since the housing bust has recovered more slowly than areas near the coast.
Chino Hills agent Derek Oie said he and others are taking advantage by marketing open houses as a one-time-only event, in a bid to create even more of an auction atmosphere.
At one house in Eastvale he brought a client to earlier this year, 100 people showed up.
“We showed up and literally cars were parked up and down the whole cul-de-sac,” he said.
Two days agowe looked at the latest troubling developmentin US home price trends: a new bubble appears to be emerging in all the “usual suspect” places. As we noted on Thursday, “home prices in markets that bubbled over back in 2006/2007, like Las Vegas and San Francisco, got cut in half in 2009 but have since doubled again of their lows. Meanwhile, markets like Denver and Dallas that didn’t participate as much in the 2007 mania are now surging to all-time highs, with Dallas prices up 55% over the past 5 years.”
TheWall Street Journal addedthat some of the home buying behaviors of consumers, like paying prices well above appraisal values and waiving home inspections, are starting to be eerily reminiscent of 2006:
In some markets, bidding wars are breaking out. Agents said some buyers are kicking in extra cash when properties don’t appraise for the asking price, and some are waiving their right to home inspections.
“It can’t be sustained,” said David Berson, chief economist at Nationwide Insurance and a former chief economist at mortgage giant Fannie Mae, referring to the frenzied buying. “It can’t go on forever.”
Other signs of overexuberance have emerged, including surging levels of licensed Realtors all chasing a quick buck.
The number of licensed Realtors has jumped by nearly 25% since 2012, hitting a nine-year high in 2016 and sitting just 9% below the peak in 2006, according to real-estate consultant John Burns. In Denver, homes are selling briskly. The median number of days that homes spent on the market declined to eight in the first three months of the year from 61 in 2012, according to Redfin. Home prices rose 8.5% in Denver over the year ended in February, according to Case-Shiller.
Nicki Thompson, an agent in Denver, said she recently had a listing that was on the market for two weekends at $1.2 million and she received multiple all-cash offers above the listing price.
“It’s just crazy,” she said.
And for a practical example of just how crazy it truly is,take this renovated 2-bedroom, 1,948 sq. ft house first built in 1951 in the Eagle Rock section of Los Angeles, which was listed in mid-March for $699,000, was estimated by Redfin at $780,000, andsold yesterday for $980,888(more than $500/sq foot) and 40% above asking, just over a month after it was first listed.
In the 1960s-80s drums played on some of the most famous pop songs known (Good Vibrations, Mrs. Robinson, A Little Less Conversation, to name a few) were built in this garage in our beloved Eagle Rock. A. F. Blaemire and his wife, Kirsten, filled this home with music and creativity for decades, and now it’s ready for its next inspired owner! With freshly refinished hardwood floors and repainted interior, 5208 Monte Bonito is a blank canvas with great potential. The rooms are bright and spacious, including a downstairs recreation room perfect for a jam room, art studio, den (or all of the above!). The two-car garage has direct access to the house and an additional storage room. The back yard has plenty of space for entertaining and gardening – there is already an avocado tree, an orange tree, and a pitaya to get you started! Views of the Eagle Rock from the master bedroom, and sunset views from the front porch make this the ideal setting to call home.
Then again, maybe not.
So what do you get for just under a million in LA these days? Not much: two bedrooms, less than two bathrooms, a 2 car garage, a decorative fireplace, a rec room, and a 7,195 sq foot lot.
Here are some photos showing what a “million dollar house” looks like in the latest US housing bubble.
(ZeroHedge), contracts to buy previously owned U.S. homes declined in March after rising a month earlier by the most since 2010, as perhaps the seasonal exuberance gives way to affordability constraints. Despite NAR’s comments that “home shoppers are coming out in droves this spring,” it is evident from the chart below that pending home sales have been stagnant for almost two years.
Regionally, only The South saw a sales increase:
The PHSI in the Northeast decreased 2.9 percent to 99.1 in March, but is still 1.8 percent above a year ago.
In the Midwest the index declined 1.2 percent to 109.6 in March, and is now 2.4 percent lower than March 2016.
Pending home sales in the South rose 1.2 percent to an index of 129.4 in March and are now 3.9 percent above last March.
The index in the West fell 2.9 percent in March to 94.5, and is now 2.7 percent below a year ago.
Lawrence Yun, NAR chief economist, says sparse inventory levels caused a pullback in pending sales in March, but activity was still strong enough to be the third best in the past year.
“Home shoppers are coming out in droves this spring and competing with each other for the meager amount of listings in the affordable price range,” he said.
“In most areas, the lower the price of a home for sale, the more competition there is for it. That’s the reason why first-time buyers have yet to make up a larger share of the market this year, despite there being more sales overall.“
Yun worries that the painfully low supply levels this spring could heighten price growth — at 6.8 percent last month — even more in the months ahead. Homes in March came off the market at a near-record pace 1, and indicating an increase in the likelihood of listings receiving multiple offers, 42 percent of homes sold at or above list price (the second highest amount since NAR began tracking in December 2012).
Florida’s thesis–that urban zones are the primary incubators of technological and economic growth–is well-supported by data that shows that the large urban regions (NYC, L.A., S.F. Bay Area, Seattle, Minneapolis,etc.) generate the majority of GDP and wage gains.
Cities have always attracted capital, talent and people rich and poor alike. Indeed, “city” is the root of our word “civilization.” So in this sense, Florida is simply confirming the central role cities have played for millennia.
More recently, Florida has addressed the rising wealth/income inequality that is making desirable urban areas un-affordable to all but the top 10% or even 5% wage earners. This is a critical concern, because vitality is a function of diversity: a city of wealthy elites paying low wages to masses of service workers is not an economic powerhouse.
What happens as buying a home in a desirable city becomes out of reach of all but the most highly paid tranche of workers?
The larger question is: what happens to home ownership as housing prices continue higher while the next generation’s wages remain significantly lower than previous generations’ incomes?
Millennials are typically earning less than Baby Boomers and Gen-X did in their 20s and 30s, and if this continues–and history suggests it will–then how many Millennials will be able to buy a pricey house?
One consequence of stagnating wages and rising home valuations is a “nation of homeowners” morphs into a “nation of renters.”
The other big question is: if Millennials aren’t earning enough to buy pricey homes, who is going to buy the tens of millions of houses Baby Boomers will be selling as they downsize/move to assisted living? As for inheriting Mom and Dad’s house–that’s not likely if Mom or Dad need the cash to fund their retirement/assisted living.
This question is especially relevant to suburban homes, especially those far from employment centers. Though data on this trend is sketchy, it seems Millennials strongly favor city living over exurban/suburban living.
Anecdotally, I can’t think of a single individual in their 20s or 30s that I know personally who has bought a house in a distant suburb. Everyone in this age group has bought a house in an urban zone. Not a highrise condo in the city center, but a house in a ring city near public transport.
Though data on this is hard to find (if it exists at all), Millennials seem more willing to make the sacrifices necessary to live in the urban core, either by renting rather than buying a cheaper suburban home, or by purchasing a modest bungalow on a small lot rather than an expansive suburban home on a big lot.
(This could change if Millennials start having lots of children, but to date small bungalows in urban regions appear big enough for families with two children.)
In a turn-around from the postwar era, which saw a mass exodus of the middle class from city centers to suburbia, the upper middle class is moving back to urban centers and the lower-income populace–once the urban poor–are being pushed out to the suburbs. We can now speak of the suburban poor.
To some degree, the suburbs have become victims of their own success. Long commutes in heavy traffic are the inevitable result of the vast expansion of suburban subdivisions, shopping malls and business parks. These killer commutes detract from the desirability of suburbs, especially to auto-agnostics of the Millennial generation, who exhibit low enthusiasm for auto ownership.
Rather than symbolizing freedom, auto ownership is viewed as a burdensome necessity at best.
If we overlay these trends (assuming they continue into the future), we discern the possibility that marginal suburban housing could crash in price and morph into suburban ghettos of isolated low-income residents.
The Pareto Distribution may play a role in this transformation. Should 20% of the suburban housing stock fall into disrepair, that could trigger the collapse of valuation in the remaining 80%.
Not all suburbs are equal. Those with diverse job growth may well act as magnets much like small cities. Those with few jobs and long commutes are less desirable and have smaller tax bases to support services.
The asymmetry between modest/stagnant Millennial wages and the soaring cost of housing cannot be bridged. If these trends continue, only the top tranche of highly paid young workers will be able to afford housing in desirable areas. Given a choice between affordable ownership in a small city or in a distant suburb, Millennials may well choose the affordable small city rather than the distant exurb or low-services suburb.
Note that most incomes have gone nowhere since about 1998. Even the top 5% has made modest gains in real (inflation-adjusted) income.
Meanwhile, home prices are back in bubble territory. “Hot” urban areas such as Seattle, Portland, the San Francisco Bay Area, Los Angeles, Brooklyn NYC, etc. have logged double-digit gains in recent years.
So who’s going to pay bubble-valuation prices for the millions of suburban homes Baby Boomers will be off-loading in the coming decade as they retire/ downsize? We know one part of the answer: it won’t be Millennials, as they don’t have the income or savings to afford homes at these prices.
These trends promise to remake the financial geography of cities (large and small) and suburbia–and in the process, radically shift the financial assets of households, renters and owners alike.
U.S. home inventory tumbled to a new low in the first quarter of 2017, falling for eight consecutive quarters. Homebuyers have now been stifled by low inventory for the last two years despite prices rising to pre-recession highs in many markets.
In this edition of Trulia’s Inventory and Price Watch, we examine how home value recovery may be limiting supply in markets that have recovered most. We find that homebuyers in markets with the biggest gains are facing the tightest supply.
The Trulia Inventory and Price Watch is an analysis of the supply and affordability of starter homes, trade-up homes, and premium homes currently on the market. Segmentation is important because home seekers need information not just about total inventory, but also about inventory in the price range they are interested in buying. For example, changes in total inventory or median affordability don’t provide first-time buyers useful information about what’s happening with the types of homes they’re likely to buy, which are predominantly starter homes.
Looking at the housing stock nationally and in the 100 largest U.S. metros from Q1 2012 to Q1 2017, we found:
Nationally, the number of starter and trade-up homes continues drop, falling 8.7% and 7.9% respectively, during the past year, while inventory of premium homes has fallen by just 1.7%;
The persistent and disproportional drop in starter and trade-up home inventory is pushing affordability further out of reach of homebuyers. Starter and trade-up homebuyers need to spend 2.9% and 1.6% more of their income than this time last year, whereas premium homebuyers only need to shell out 0.9% more of their income;
A strong recovery may be partly to blame for the large drop in inventory some markets have experienced over the past five years. On average, the more valuable a market’s housing is compared to pre-recession levels, the larger drop in inventory it is has seen.
2017 Ushers in a Dramatic Shortage of Homes
Nationally, housing inventory dropped to its lowest level on record in 2017 Q1. The number of homes on the market dropped for the eighth consecutive quarter, falling 5.1% over the past year. In addition:
The number of starter homes on the market dropped by 8.7%, while the share of starter homes dropped from 26.1% to 25.9%. Starter homebuyers today will need to shell out 2.9% more of their income towards a home purchase than last year;
The number of trade-up homes on the market decreased by 7.9%, while the share of trade-up homes dropped from 23.9% to 23%. Trade-up homebuyers today will need to pay 1.6% more of their income for a home than last year;
The number of premium homes on the market decreased by 1.7%, while the share of premium homes increased from 50% to 51%. Premium homebuyers today will need to spend 0.6% more of their income for a home than last year.
How and Where a Strong Housing Market May Be Hurting Inventory
In the first edition of ourreport, we provided a few reasons why inventory is low: (1) investors bought up much of the foreclosure home inventory during the financial crisis and turned them into rental units, (2) price spread – that is, when prices of homes in different segments of the housing market diverge from each other – makes it difficult for existing homeowners to tradeup to the next the segment, and (3) slow home value recovery was making it difficult for some homeowners to break even on their homes. While there isevidencethat investors indeed converted owner-occupied homes into rentals as well as evidence from our first report that increasing price spread is correlated with decreases in inventory, little work has examined how home value recovery affects inventory. This is perhaps due to the tricky conceptual relationship between home values and inventory: too little recovery might make it difficult for homeowners to sell their home but cheap to buy one, while too much recovery might make it easy for them to sell but difficult to buy.
In fact, we find a negative correlation between how much a housing market has recovered and how much inventory has changed over the past five years. Using the current value of the housing market relative to the peak value as our measure of recovery, we find markets with greater home value recovery have experienced larger decreases in inventory over the past five years. The linear correlation was moderate (-0.36) and statistically significant. We also found that markets with the strongest recovery, on average, have experienced the largest decreases in inventory.
For example, the five-year average change in inventory of housing markets currently valued below their pre-recession peak (< 95% of peak value) isn’t that different from ones that have recovered to 95% – 105% of their peak. (-27.6% vs. -30.1%). However, the average change in inventory in well-recovered markets (> 105%) is 0more drastic at -45.4%.
The disparity also persists when looking at changes in inventory within each segment, although the difference is largest for starter homes. On average, markets with less than 95% recovery or 95% to 105% recovery had a 34.2% and 31.7% decrease in starter inventory, while markets with more than 105% home value recovery had a whopping 58.2% drop. These findings suggest that a moderate home value recovery doesn’t affect inventory much, but a strong recovery does and impacts inventory of starter homes the most.
Federal Reserve Shocker! What It Means For Housing
The Federal Reserve has announced it will be shrinking its balance sheet. During the last housing meltdown in 2008, it bought the underwater assets of big banks. It has more than two trillion dollars in mortgage-backed securities that are now worth something because of the latest housing boom. Gregory Mannarino of TradersChoice.net says the Fed is signaling a market top in housing. It pumped up the mortgage-backed securities it bought by inflating another housing bubble. Now, the Fed is going to dump the securities on the market. Mannarino predicts housing prices will fall and interest rates will rise.
New home sales shot up 6.1% in February aided by 39% jump in the mid-west but a 21.4% decline in the Northeast.
Sales came in just a bit below the topEconodayestimate.
New home sales shot 6.1 percent higher in February to a 592,000 annualized rate that easily beats the Econoday consensus for 565,000 and is near the top estimate of 600,000. Sales appeared to have gotten a boost from builder concessions as the median price fell a monthly 3.9 percent to $296,200 for a year-on-year rate that’s suddenly in the negative column at minus 4.9 percent.
Strength is centered in the Midwest where the sales rate surged 21,000 to 89,000 and easily surpassing 11,000 gains for the both the West, at 157,000, and the South at 313,000. Sales in the Northeast fell sharply in yesterday’s existing home sales report and are down 9,000 to a very low 33,000 annualized rate in today’s report.
Supply of new homes did rise slightly in the month, up 4,000 to 266,000 currently on the market, but relative to sales supply fell to 5.4 months from 5.6 months. Supply has been thin all cycle for new homes and was at 5.5 months in February last year.
Most of the news is good in this report underscored by the average price which, reflecting high-end properties, jumped 9.9 percent in the month for a yearly 11.7 percent gain at $390,400 and a new record. Today’s report helps offset weakness in existing home sales and keeps the housing sector on a moderately climbing slope.
New home sales posted a much better February than did existing home sales and, in fact, better than most analysts had expected.
It was the second consecutive month of strength for the indicator which had see-sawed between positive and negative results in the waning months of 2016.
On a non-seasonally adjusted basis, there were 49,000 new homes sold in February compared to 41,000 in January. Thirty-six-thousand of the homes sold were in the $200,000 to 299,000 price tier.
The median price of a new home sold in February was 296,200 compared to $311,300 a year earlier. The average price was $390,400 compared to $349,400.
There were strong geographic differences in the rate of sales. In the Northeast, sales were down 21.4 percent for the month while remaining 13.8 percent higher than the previous February. In contrast, the Midwest posted a 30.9 percent month-over-month improvement and the annual change was 50.8 percent.
Sales in the South rose 3.6 percent from January and 7.9 percent from February 2016 and sales in the West were up 7.5 percent and 6.8 percent from the two earlier periods.
At the end of February, there were an estimated 261,000 homes available for sale on a non-seasonally adjusted basis. This is an estimated 5.4-month supply at the current rate of sale. Sixty-three-thousand of the available homes are completed, construction had not started on 51,000.
Median vs Average Sale
It’s interesting to see the median price dropping with the average price soaring. It’s a tale of two economies and who is and isn’t gaining.
That said, these swings are so wild, I smell revisions.
U.S. home resales fell more than expected in February amid a persistent shortage of houses on the market that is pushing up prices and sidelining potential buyers.
The National Association of Realtors said on Wednesday existing home sales declined 3.7 percent to a seasonally adjusted annual rate of 5.48 million units last month.
January’s sales pace was un-revised at 5.69 million units, which was the highest level since February 2007. Economists polled by Reuters had forecast sales decreasing 2.0 percent to a pace of 5.57 million units last month.
“Realtors are reporting stronger foot traffic from a year ago, but low supply in the affordable price range continues to be the pest that’s pushing up price growth and pressuring the budgets of prospective buyers,” said Lawrence Yun, the NAR’s chief economist.
Sales were up 5.4 percent from February 2016, underscoring the sustainability of the housing market recovery despite rising mortgage rates. In February, houses typically stayed on the market for 45 days, down from 50 days in January.
U.S. financial markets were little moved by the data as investors increasingly worried whether President Donald Trump would be able to push ahead with his pro-growth policies. The dollar fell against a basket of currencies and U.S. stocks were trading mostly lower. Prices for U.S. government bonds fell.
The 30-year fixed mortgage rate is hovering at 4.30 percent.
Home loans could cost more after the Federal Reserve last week raised its benchmark overnight interest rate by 25 basis points to a range of 0.75 percent to 1.00 percent. The U.S. central bank has forecast two more rate hikes for 2017.
BUOYANT LABOR MARKET
Demand for housing is being buoyed by a labor market that is near full employment. But home sales remain constrained by the dearth of properties available for sale, which is keeping prices elevated.
While the number of homes on the market increased 4.2 percent to 1.75 million units last month, housing inventory remained close to the all-time low of 1.65 million units hit in December. Supply was down 6.4 percent from a year ago.
Housing inventory has dropped for 21 straight months on a year-on-year basis. With supply remaining tight, the median house price surged 7.7 percent from a year ago to $228,400 in February. That marked the 60th consecutive month of year-on-year price gains.
Builders have been unable to fill the housing inventory gap, citing rising prices for materials, higher borrowing costs, and shortages of lots and labor.
Lennar Corp, the second-largest U.S. homebuilder, reported on Tuesday a drop in quarterly gross margin as the company struggled with higher land and construction costs.
The Florida-based builder, however, sold 5,453 homes in the first quarter ended Feb. 28, up from 4,832 homes in the year-earlier period, and reported a 12 percent jump in orders.
The NAR estimates housing starts and completions should be in a range of 1.5 million to 1.6 million units to alleviate the chronic shortage. Housing starts are running above a rate of 1.2 million units and completions around a pace of 1 million units.
At February’s sales pace, it would take 3.8 months to clear the stock of houses on the market, up from 3.5 months in January. A six-month supply is viewed as a healthy balance between supply and demand. Though higher prices are increasing equity for homeowners and might encourage some to put their homes on the market, they could be sidelining first-time buyers from the market. First-time buyers accounted for 32 percent of transactionslast month, well below the 40 percent share that economists and realtors say is needed for a robust housing market.
That was down from 33 percent in January but up from 30 percent a year ago.
It appears, the worse the economy was doing, the higher the odds of a rate hike.
Putting the Federal Reserve’s third rate hike in 11 years into context, if the Atlanta Fed’s forecast is accurate, 0.9% GDP would mark the weakest quarter since 1980 in which rates were raised (according to Bloomberg data).
We look forward to Ms. Yellen explaining her reasoning – Inflation no longer “transitory”? Asset prices in a bubble? Because we want to crush Trump’s economic policies? Because the banks told us to?
For now it appears what matters to The Fed is not ‘hard’ real economic data but ‘soft’ survey and confidence data…
Back in August 2014,we reportedthat in what appeared a suspicious attempt to boost the pool of eligible, credit-worthy mortgage recipients, Fair Isaac, the company behind the crucial FICO score that determines every consumer’s credit rating, “will stop including in its FICO credit-score calculations any record of a consumer failing to pay a bill if the bill has been paid or settled with a collection agency. The San Jose, Calif., company also will give less weight to unpaid medical bills that are with a collection agency.” In doing so, the company would “make it easier for tens of millions of Americans to get loans.” Stated simply, the definition of the all important FICO score, the most important number at the base of every mortgage application, was set for an “adjustment” which would push it higher for millions of Americans.
As theWSJ said at the time, the changes are expected to boost consumer lending, especially among borrowers shut out of the market or charged high interest rates because of their low scores. “It expands banks’ ability to make loans for people who might not have qualified and to offer a lower price [for others],” said Nessa Feddis, senior vice president of consumer protection and payments at the American Bankers Association, a trade group.” Perhaps the thinking went that if you a borrower has defaulted once, they had learned your lesson and will never do it again. Unfortunately, empirical studies have shown that that is not the case.
Now, nearly three years later, in the latest push to artificially boost FICO scores, the WSJ reports that “many tax liens and civil judgments soon will be removed from people’s credit reports, the latest in a series of moves to omit negative information from these financial scorecards. The development could help boost credit scores for millions of consumers, but could pose risks for lenders” as FICO scores remain the only widely accepted method of quantifying any individual American’s credit risk, and determine how much consumers can borrow for a new house or car as well as determine their credit-card spending limit
The transformation is already in proces as the three major credit-reporting firms, Equifax, Experian and TransUnion, recently decided to remove tax-lien and civil-judgment data starting around July 1, according to the Consumer Data Industry Association, a trade group that represents them. The firms will remove the adverse data if they don’t include a complete list of a person’s name, address, as well as a social security number or date of birth, and since most liens and judgments don’t include all three or four, the effect will be like wiping the slate clean for millons of Americans. This change will apply to new tax lien and civil-judgment data that are added to credit reports as well as existing data on the reports.
Civil judgments include cases in which collection firms take borrowers to court over an unpaid debt. Ankush Tewari, senior director of credit-risk assessment at LexisNexis Risk Solutions, says that nearly all judgments will be removed and about half of tax liens will be removed from credit reports as a result of the changed approach. He says LexisNexis will continue to offer the data directly to lenders.
In addition, if public court records aren’t checked for updates on lien and judgment information at least every 90 days, they will have to be removed from credit reports.
The outcome of this change is clear: it “will make many people who have these types of credit-report blemishes look more creditworthy.“
The WSJ notes that the unusual move by the influential firms comes partially in response to regulatory concerns. The three reporting bureaus rarely tinker with the information that goes on credit reports and that lenders consult to gauge consumers’ ability and willingness to pay back debts.
The regulatory push to boost America’s creditworthiness started at the top, under the guise of improving data tracking and collection:
The Consumer Financial Protection Bureau earlier this month released a report citing problems it found while examining credit bureaus and changes it is requiring. Issues the agency cited included improving standards for public-records data by using better identity-matching criteria and updating records more frequently.
Inaccurate information on credit reports, especially if it is negative information, can derail consumers from being able to gain access to credit and even lead to other setbacks like not being able to rent an apartment or get a job.
One in five consumers has an error in at least one of their three major credit reports, according to a 2013 Federal Trade Commission study mandated by Congress. The three credit bureaus received around eight million requests disputing information on credit reports in 2011, according to the CFPB.
It won’t be the first time such an exercise is conducted: in 2015, as part of a settlement with the NY AG, credit-reporting firms were already prompted to remove several negative data sets from reports. These included non-loan related items that were sent to collections firms, such as gym memberships, library fines and traffic tickets. The firms also will have to remove medical-debt collections that have been paid by a patient’s insurance company from credit reports by 2018.
What happens next?
Such changes might help borrowers and could spur additional lending, possibly boosting economic activity. But it could potentially increase risks for lenders who might not be able to accurately assess borrowers’ default risk.
Consumers with liens or judgments are twice as likely to default on loan payments, according to LexisNexis Risk Solutions, a unit of RELX Group that supplies public-record information to the big three credit bureaus and lenders.
For lenders and credit card companies it means one thing: chaos, and the potential of substantial future charge offs: “It’s going to make someone who has poor credit look better than they should,” said John Ulzheimer, a credit specialist and former manager at Experian and credit-score creator FICO.
“Just because the lien or judgment information has been removed and someone’s score has improved doesn’t mean they’ll magically become a better credit risk.”
* * *
So how many US consumers will be impacted by this change? The answer: up to 12 million.
As the WSJ points out “removing this information from credit reports also will lead to changes in people’s credit scores. Roughly 12 million U.S. consumers, or about 6% of the total U.S. population that has FICO credit scores, will see increases in those scores as a result of this change, according to the company that created the FICO system, which is used by lenders in most U.S. consumer underwriting decisions.”
While for many of these consumers, the score increase will be relatively modest, as FICO projects that just under 11 million people will experience a score improvement of less than 20 points, that should be more than sufficient to go out and buy that brand new $60,000 BMW with an 80-month, $0 down, 0% interest rate loan.
Sarcasm aside, ultimately lenders will still be able to check public records on their own to find this information, and since FICO scores will now be “adjusted” just like GAAP, the likely outcome will be the transition of credit vetting in house, as Fair Isaac loses credibility within the loan system, potentially leading to even more draconian credit terms, even if it comes at substantial expense to US-based lenders.
“A housing recovery that is highly dependent on real estate investors is a bit of a double-edged sword,” explained Daren Blomquist, senior VP at ATTOM Data Solutions. “Rapidly rising home values have been good for homeowner equity, but also have caused an affordability crunch for the first-time home buyers the housing market typically relies on for sustained, long-term growth.”
So the housing market is “starkly different than a decade ago,” said Alex Villacorta, VP of research and analytics at Clear Capital. “As such, it’s imperative for all market participants to understand the nuances of the New Normal Real Estate Market.”
They were bothcommenting on a joint white paperby ATTOM and Clear Capital, titled “Landlord Land,” that analyzes who is behind the US housing boom that drove home prices to new all-time highs, and in many markets far beyond the prior crazy bubble highs – even as homeownership has plunged and remains near its 50-year low.
First-time buyers are the crux to a healthy housing market, but they aren’t buying with enough enthusiasm. In 2012, buyers with FHA-insured mortgages – “who are typically first-time home buyers with a low down payment,” according to the report – accounted for 25% of all home purchases. In 2013, their share dropped to about 20%, in 2014 to 18%. Then hope began rising, briefly:
However, in January 2015, FHA lowered its insurance premium 50 basis points, and there was a modest resurgence in FHA buyers – a trend perhaps indicative of loosening credit requirements or of a desire to re-enter the housing market for those displaced during the crash.
Their share of home purchases ticked up to 22.3%. Alas, “the FHA resurgence was short lived” and in 2016 eased down to 21.7%.
With first-time buyers twiddling their thumbs, who then is buying? Who is driving this housing market?
Institutional investors? Defined as those that buy at least 10 properties a year, they include the largest buy-to-rent Wall Street landlords, some with over 40,000 single-family homes, who’ve “picked up the low-hanging fruit of distressed properties available at a discount between 2009 and 2013,” as the report put it. That was during the foreclosure crisis, when they bought these properties from banks.
In Q3, 2010, institutional investors bought 7% of all homes. In Q1 2013, their share reached 9.5%. As home prices soared, fewer foreclosures were taking place. By 2014, when home prices reached levels where the large-scale buy-to-rent scheme with its heavy expense structure wasn’t working so well anymore, these large buyers began to pull back. In 2016, the share of institutional investors dropped to just 2% of all home sales.
But as institutional investors stepped back, smaller investors jumped into the fray in large numbers, “willing to purchase in a wider variety of market landscapes and operate on thinner margins.”
To approximate total investor purchases of homes, the report looks at the share of purchases where the home is afterwards occupied by non-owner residents. In 2009, according to this metric, 28% of all home purchases were investor-owned properties. In 2010, it rose to 30%. In 2011, 32%. Then as big investors pulled out, it fell back to 30%. But by 2015, small investors arrived in large numbers, and by 2016, investor purchases jumped to 37%, an all-time high in the ATTOM data series going back 21 years.
The chart shows the share of purchases in a given year. Note the declining share of first-time buyers (blue line), the declining share of institutional investors (gray bars), and the surging share of smaller investors (green line). In other words, smaller investors are now driving this housing boom:
The pie chart below shows the share of properties owned by investor size. Among investors in today’s housing market, small landlords that own one or two properties own in aggregate the largest slice of the rental housing pie – 79%:
However, Wall Street landlords are concentrated in just a few urban areas. For example, Invitation Homes, the 2012 buy-to-rent creature of private-equity firm Blackstone, which owns over 48,000 single-family homes and has nearly unlimited financial resources,including government guarantees on some of its debt, is concentrated in just 12 urban areas, where it has had an outsized impact.
Whereas small investors own properties across the entire country, in urban and rural areas, in cheap markets and ludicrously expensive markets. They own condos, detached houses, duplexes, and smaller multi-unit buildings.
So when the industry tells us about low inventories and strong demand in the housing market, it’s good to remember where a record 37% of that demand in 2016 came from: investors, most of them smaller investors. And when the financial equation no longer works for them, they’ll pull back, just like institutional investors have already done.
It started with a whimper a couple of years ago and has turned into a roar: foreign governments are dumping US Treasuries. The signs are coming from all sides. The data from the US Treasury Department points at it. The People’s Bank of China points at it in its data releases on its foreign exchange reserves. Japan too has started selling Treasuries, as have other governments and central banks.
Some, like China and Saudi Arabia, are unloading their foreign exchange reserves to counteract capital flight, prop up their own currencies, or defend a currency peg.
Others might sell US Treasuries because QE is over and yields are rising as the Fed has embarked on ending its eight years of zero-interest-rate policy with what looks like years of wild flip-flopping, while some of the Fed heads are talking out loud about unwinding QE and shedding some of the Treasuries on its balance sheet.
Inflation has picked up too, and Treasury yields have begun to rise, and when yields rise, bond prices fall, and so unloading US Treasuries at what might be seen as the peak may just be an investment decision by some official institutions.
The chart below from Goldman Sachs, via Christine Hughes at Otterwood Capital, shows the net transactions of US Treasury bonds and notes in billions of dollars by foreign official institutions (central banks, government funds, and the like) on a 12-month moving average. Note how it started with a whimper, bounced back a little, before turning into wholesale dumping, hitting record after record (red marks added):
The People’s Bank of China reported two days ago that foreign exchange reserves fell by another $12.3 billion in January, to $2.998 trillion, the seventh month in a row of declines, and the lowest in six years. They’re down 25%, or almost exactly $1 trillion, from their peak in June 2014 of nearly $4 trillion (via Trading Economics, red line added):
China’s foreign exchange reserves are composed of assets that are denominated in different currencies, but China does not provide details. So of the $1 trillion in reserves that it shed since 2014, not all were denominated in dollars.
The US Treasury Department provides another partial view, based on data collected primarily from US-based custodians and broker-dealers that are holding these securities for China and other countries. But the US Treasury cannot determine which country owns the Treasuries held in custodial accounts overseas. Based on this limited data, China’s holdings of US Treasuries have plunged by $215.2 billion, or 17%, over the most recent 12 reporting months through November, to just above $1 trillion.
So who is buying all these Treasuries when the formerly largest buyers – the Fed, China, and Japan – have stepped away, and when in fact China, Japan, and other countries have become net sellers, and when the Fed is thinking out loud about shedding some of the Treasuries on its balance sheet, just as nearly $900 billion in net new supply (to fund the US government) flooded the market over the past 12 months?
Turns out, there are plenty of buyers among US investors who may be worried about what might happen to some of the other hyper-inflated asset classes.
And for long suffering NIRP refugees in Europe, there’s a special math behind buying Treasuries. They’re yielding substantially more than, for example, French government bonds, with the US Treasury 10-year yield at 2.4%, and the French 10-year yield at 1.0%, as the ECB under its QE program is currently the relentless bid, buying no matter what, especially if no one else wants this paper. So on the face of it, buying US Treasuries would be a no-brainer.
But the math got a lot more one-sided in recent days as French government bonds now face a new risk, even if faint, of being re-denominated from euros into new French francs, against the will of bondholders, an act of brazen default, and these francs would subsequently get watered down, as per the euro-exit election platform of Marine Le Pen. However distant that possibility, the mere prospect of it, or the prospect of what might happen in Italy, is sending plenty of investors to feed on the richer yields sprouting in less chaos, for the moment at least, across the Atlantic.
The Federal Reserve’s oft-forgotten policy of buying mortgage-backed securities helped keep mortgage rates low over the last several years.
The monthly housing market reports I publish each month became bullish in late 2011 due to the relative undervaluation of properties at the time. I was still cautious due to weak demand, excessive shadow inventory, the uncertainty of the duration of the interest rate stimulus, and an overall skepticism of the lending cartel’s ability to manage their liquidations.
In 2012, the lending cartel managed to completely shut off the flow of foreclosures on the market, and with ever-declining interest rates, a small uptick in demand coupled with a dramatic reduction in supply caused the housing market to bottom.
Even with the bottom in the rear-view mirror, I remained skeptical of the so-called housing recovery because the market headwinds remained, and the low-interest rate stimulus could change at any moment. Without the stimulus, the housing market would again turn down.
It wasn’t until Ben Bernanke, chairman of the federal reserve, took out his housing bazooka and fired it in September 2012 that I became convinced the bottom was really in for housing. Back in September, Bernanke pledged to buy $40 billion in mortgage-backed securities each month for as long as it takes for housing to fully recover. With an unlimited pledge to provide stimulus, any concerns about a decline in prices was washed away.
In addtion to buying new securities, the federal reserve also embarked on a policy of reinvesting principal payments from agency debt and mortgage-backed securities back into mortgages — a policy they continue to this day.
by Liz McCormick and Matt Scully, February 5, 2017
Almost a decade after it all began, the Federal Reserve is finally talking about unwinding its grand experiment in monetary policy.
And when it happens, the knock-on effects in the bond market could pose a threat to the U.S. housing recovery.
Just how big is hard to quantify. But over the past month, a number of Fed officials have openly discussed the need for the central bank to reduce its bond holdings, which it amassed as part of its unprecedented quantitative easing during and after the financial crisis. The talk has prompted some on Wall Street to suggest the Fed will start its drawdown as soon as this year, which has refocused attention on its $1.75 trillion stash of mortgage-backed securities.
While the Fed also owns Treasuries as part of its $4.45 trillion of assets, its MBS holdings have long been a contentious issue, with some lawmakers criticizing the investments as beyond what’s needed to achieve the central bank’s mandate. Yet because the Fed is now the biggest source of demand for U.S. government-backed mortgage debt and owns a third of the market, any move is likely to boost costs for home buyers. …
In the past year alone, the Fed bought $387 billion of mortgage bonds just to maintain its holdings. Getting out of the bond-buying business as the economy strengthens could help lift 30-year mortgage rates past 6 percent within three years, according to Moody’s Analytics Inc.
It’s difficult to imagine that losing a buyer of that magnitude wouldn’t cause prices to fall, thereby raising yields and mortgage interest rates.
The surge in mortgage rates is already putting a dent in housing demand. Sales of previously owned homes declined more than forecast in December, …, according to data from the National Association of Realtors.
People are starting to ask the question, “Gee, did I miss my opportunity here to get a low-rate mortgage?” …
While this may close the door on the opportunity to get a low rate, it opens the door on the opportunity to get a low price.
People can only afford what they can afford. If their payment stretches to finance huge sums like they do today, then prices get bid up to that equilibrium price level. If their payment finances a smaller sum, like they will if mortgage rates rise, then prices will need to “adjust” downward to this new equilibrium price level.
I wouldn’t count on a big drop. Prices are sticky on the way down, particularly without a flood of foreclosures to push them down. Today’s owners with low-rate mortgages won’t sell unless they really need to, and lenders would rather can-kick than cause another foreclosure crisis, so any downward movement would be slow.
As prices creep downward, rents and incomes will rise offsetting some of the pain, and those buyers that are active will substitute downward in quality to something they can afford. It’s a prescription for low sales volumes and unhappy buyers and sellers. The buyers pay too much, and the sellers get too little.
Nevertheless, the consequences for the U.S. housing market can’t be ignored.
The “Fed has already hiked twice and the market is expecting” more, said Munish Gupta, a manager at Nara Capital, a new hedge fund being started by star mortgage trader Charles Smart. “Tapering is the next logical step.”
As the federal reserve tapers its purchases of mortgage bonds, it opens up this market to private investment. Perhaps money will flow out of 10-year treasuries into mortgage-backed securities for a little more yield. It’s also possible that Congress will reform mortgage finance and remove the government guarantee from these securities, making them less desirable.
It’s entirely possible that the yield on the 10-year treasury will drop this year. Higher short term rates and a strengthening economy means the US dollar should appreciate relative to other currencies, attracting foreign capital. Once converted to US dollars, that capital must find someplace to invest, and US Treasuries are the safest investment providing some yield. If a great deal of foreign capital enters the country and buys treasuries, yields will drop, and mortgage rates may drop with them. Rising mortgage rates are not a certainty.
For now, the federal reserve will keep buying mortgage-backed securities, but the messy taper is on the horizon. Apparently, when it comes to boosting housing, Yellen plans to stay the course.
◆ Fed holds $1.75 Trillion of MBS from quantitative easing program ◆
◆ Comments spur talk Fed may start draw down as soon as this year
Almost a decade after it all began, the Federal Reserve is finally talking about unwinding its grand experiment in monetary policy.
And when it happens, the knock-on effects in the bond market could pose a threat to the U.S. housing recovery.
Just how big is hard to quantify. But over the past month, a number of Fed officials have openly discussed the need for the central bank to reduce its bond holdings, which it amassed as part of its unprecedented quantitative easing during and after the financial crisis. The talk has prompted some on Wall Street to suggest the Fed will start its drawdown as soon as this year, which has refocused attention on its $1.75 trillion stash of mortgage-backed securities.
While the Fed also owns Treasuries as part of its $4.45 trillion of assets, its MBS holdings have long been a contentious issue, with some lawmakers criticizing the investments as beyond what’s needed to achieve the central bank’s mandate. Yet because the Fed is now the biggest source of demand for U.S. government-backed mortgage debt and owns a third of the market, any move is likely to boost costs for home buyers.
In the past year alone, the Fed bought $387 billion of mortgage bonds just to maintain its holdings. Getting out of the bond-buying business as the economy strengthens could help lift 30-year mortgage rates past 6 percent within three years, according to Moody’s Analytics Inc.
Unwinding QE “will be a massive and long-lasting hit” for the mortgage market, said Michael Cloherty, the head of U.S. interest-rate strategy at RBC Capital Markets. He expects the Fed to start paring its investments in the fourth quarter and ultimately dispose of all its MBS holdings.
Unprecedented Buying
Unlike Treasuries, the Fed rarely owned mortgage-backed securities before the financial crisis. Over the years, its purchases have been key in getting the housing market back on its feet. Along with near-zero interest rates, the demand from the Fed reduced the cost of mortgage debt relative to Treasuries and encouraged banks to extend more loans to consumers.
In a roughly two-year span that ended in 2014, the Fed increased its MBS holdings by about $1 trillion, which it has maintained by reinvesting its maturing debt. Since then, 30-year bonds composed of Fannie Mae-backed mortgages have only been about a percentage point higher than the average yield for five- and 10-year Treasuries, data compiled by Bloomberg show. That’s less than the spread during housing boom in 2005 and 2006.
Talk of the Fed pulling back from the market has bond dealers anticipating that spreads will widen. Goldman Sachs Group Inc. sees the gap increasing 0.1 percentage point this year, while strategists from JPMorgan Chase & Co. say that once the Fed actually starts to slow its MBS reinvestments, the spread would widen at least 0.2 to 0.25 percentage points.
“The biggest buyer is leaving the market, so there will be less demand for MBS,” said Marty Young, fixed-income analyst at Goldman Sachs. The firm forecasts the central bank will start reducing its holdings in 2018. That’s in line with a majority of bond dealers in the New York Fed’s December survey.
The Fed, for its part, has said it will keep reinvesting until its tightening cycle is “well underway,” according to language that has appeared in every policy statement since December 2015. The range for its target rate currently stands at 0.5 percent to 0.75 percent.
Mortgage Rates
Mortgage rates have started to rise as the Fed moves to increase short-term borrowing costs. Rates for 30-year home loans surged to an almost three-year high of 4.32 percent in December. While rates have edged lower since, they’ve jumped more than three-quarters of a percentage point in just four months.
The surge in mortgage rates is already putting a dent in housing demand. Sales of previously owned homes declined more than forecast in December, even as full-year figures were the strongest in a decade, according to data from the National Association of Realtors.
People are starting to ask the question, “Gee, did I miss my opportunity here to get a low-rate mortgage?” said Tim Steffen, a financial planner at Robert W. Baird & Co. in Milwaukee. “I tell them that rates are still pretty low. But are rates going to go up? It certainly seems like they are.”
Part of it, of course, has to do with the Fed simply raising interest rates as inflation perks up. Officials have long wanted to get benchmark borrowing costs off rock-bottom levels (another legacy of crisis-era policies) and back to levels more consist with a healthy economy. This year, the Fed has penciled in three additional quarter-point rate increases.
The move to taper its investments has the potential to cause further tightening. Morgan Stanley estimates that a $325 billion reduction in the Fed’s MBS holdings from April 2018 through end of 2019 may have the same impact as nearly two additional rate increases.
Finding other sources of demand won’t be easy either. Because of the Fed’s outsize role in the MBS market since the crisis, the vast majority of transactions are done by just a handful of dealers. What’s more, it’s not clear whether investors like foreign central banks and commercial banks can absorb all the extra supply — at least without wider spreads.
On the plus side, getting MBS back into the hands of private investors could help make the market more robust by increasing trading. Average daily volume has plunged more than 40 percent since the crisis, Securities Industry and Financial Markets Association data show.
“Ending reinvestment will mean there are more bonds for the private sector to buy,” said Daniel Hyman, the co-head of the agency-mortgage portfolio management team at Pacific Investment Management Co.
What’s more, it may give the central bank more flexibility to tighten policy, especially if President Donald Trump’s spending plans stir more economic growth and inflation. St. Louis Fed President James Bullard said last month that he’d prefer to use the central bank’s holdings to do some of the lifting, echoing remarks by his Boston colleague Eric Rosengren.
Nevertheless, the consequences for the U.S. housing market can’t be ignored.
The “Fed has already hiked twice and the market is expecting” more, said Munish Gupta, a manager at Nara Capital, a new hedge fund being started by star mortgage trader Charles Smart. “Tapering is the next logical step.”
Following a flurry of home sales in November, the total number of homes for sale in December declined to a three-year low, according to data provided by Redfin.
“Prospective sellers were hesitant to list last month,” said Redfin Chief Economist Nela Richardson. “Many of them are also buyers, and two transactions are much harder to pull off in a fast-paced, low-inventory environment than one. We expect sellers to list early in 2017, not only to make top dollar from eager buyers, but also to be in a position to act quickly when it comes time to make their next home purchase.”
Redfin receives current and local data from its agents positioned throughout the country. This allows the firm to have a comprehensive view of general real-estate trends unfolding within the markets it covers.
When compared to November, the number of new listings for December decreased by 26.8 percent. December’s median home price was about 276,000, which represents a 4.7 percent increase over the previous year. Furthermore, the median amount of days for which a home was listed on the market before going under contract was 54, which is the fastest rate for any December since Redfin began tracking the data in 2010.
“We’ve never before seen homes turn over so quickly at a national level,” Richardson said. She also noted that December’s data was rather surprising given existing conditions such as a new president-elect, higher mortgage rates, and low home inventory.
The low inventory should continue to cause an upward movement in the prices of homes in2017, with some regions experiencing higher growth than others.
Seattle was the quickest region for home sales, as half of all homes listed on the market were pending a sale within 19 days. Seattle also had the highest home price growth, increasing by a rate 14.8 percent since 2015.
Rates had been trending higher since hitting all-time lows in early July, and exploded higher following the presidential election
Some investors are increasingly worried/convinced that the decades-long trend toward lower rates has been permanently reversed, but such a conclusion would require YEARS to truly confirm
With the incoming administration’s policies driving a large portion of upward rate momentum, mortgage rates will be hard-pressed to return to pre-election levels until well after Trump takes office. Rates can move for other reasons, but it would take something big and unexpected for rates to get back to pre-election levels.
We’d need to see a sustained push back toward lower rates (something that lasts more than 3 days) before anything less than a cautious, lock-biased approach makes sense for all but the most risk-tolerant borrowers. The beginning of 2017 may be bringing such a push, but there’s no telling how long it will last.
Landlords of upscale properties across the U.S. are bracing for rough conditions in 2017 that will likely force them to slash rents and offer deep concessions as a glut of supply brings a seven-year luxury-apartment boom to an end.
The turnaround follows a more-than-26% jump in U.S. apartment rents since early 2010, far outstripping inflation and income growth. But in 2016, rents rose a modest 3.8%, a significant drop from the recent high of 5.6% year-to-year growth in the third quarter of 2015, according to a report to be released Tuesday by MPF Research, a division of RealPage Inc. that tracks the U.S. apartment market.
Developers in New York are already offering up to three months of free rent on some projects. In Los Angeles, some landlords are offering six months of free parking, and some in Houston are waiving security deposits. Meanwhile, MPF Vice President Jay Parsons said he expects little or no rent growth in urban rental markets this year.
“This will be a very challenged leasing environment almost everywhere,” Mr. Parsons said.
More than 50,000 new units were rented by tenants in the fourth quarter in the U.S., six times the number in the year-earlier period. But that demand was overwhelmed by the 88,000 new units that were completed in the quarter, the most since the mid-1980s, according to MPF.
That gap looks set to widen in 2017. More than 378,000 new apartments are expected to be completed across the country this year, almost 35% more than the 20-year average, according to real estate tracker Axiometrics Inc.
The New York area alone will be flooded with nearly 30,000 new apartments in 2017, double the historical average, according to Axiometrics. Roughly 85% are luxury units.
Dallas is expected to see nearly 25,000 new apartments delivered, compared with the long-term average of roughly 9,000 new apartments a year, according to Axiometrics. Los Angeles is expected to get roughly 13,000 new apartments, nearly double the historical average.
Nashville could see some 8,500 new apartments, more than triple the typical 2,400 apartments completed annually.
John Tirrill, managing partner at SWH Partners, an Atlanta developer that has several projects under way in the Nashville area, is leasing a new five-story property with a fitness center, yoga and barre studio and swimming pool. He has lowered rents from $2.25 a square foot to $2.10 a square foot—a $150 discount on a 1,000-square-foot apartment—and is offering one to two months of free rent.
Banks are pulling back on lending, which could help slow the pace of construction starting in late 2018.
“We’re just being really selective,” said John Cannon, a senior vice president at Pinnacle Financial Partners, a Nashville-based financial-services company that has increased its focus on multifamily lending in the last couple of years. “Multifamily has a large number of units on the ground that they really have to demonstrate some absorption.”
2017 Real Estate Synopsis
New home sales and existing home sales are already slowing because of mortgage rates.
A huge supply of apartments will come online in 2017.
Banks are tightening lending standards for apartments.
Economists, who are generally surprised by everything, were caught off guard once again.
Despite the fact that mortgage rates have been climbing for months, the economists’ consensus expectation was for pending home sales to rise 0.5%. Not a single economist predicted a decline this month. The range of estimates was 0.3% to 2.0%.
Pending sales, which were widely expected to make a good showing in November, pulled back sharply instead. The National Association of Realtors® (NAR) said its Pending Home Sales Index (PHSI), a forward-looking indicator based on contracts for existing home purchases, declined 2.5 percent to 107.3 in November from 110.0 in October. NAR said “the brisk upswing in mortgage rates and not enough inventory dispirited some would-be buyers.” The decrease brought the PHSI to its lowest level since January of this year and it is now 0.4 percent below the index last November which stood at 107.7.
Analysts polled by Econoday had been upbeat about the November outlook. The consensus was for an increase of 0.5 percent with some analysts predicting as much as a 2.0 percent gain.
Lawrence Yun, NAR chief economist said, “The budget of many prospective buyers last month was dealt an abrupt hit by the quick ascension of rates immediately after the election. Already faced with climbing home prices and minimal listings in the affordable price range, fewer home shoppers in most of the country were successfully able to sign a contract.”
Only one of the four regions displayed any strength in November. Pending sales in the Northeast were up 0.6 percent to 97.5 and are 5.7 percent higher than in November 2015.
The Midwest saw contract signings decline 2.5 percent to 103.5, falling behind the previous November by 2.4 percent. Sales in the South were down 1.2 percent to an index of 118.7, this is 1.3 percent behind the level a year earlier. The West posted the largest loss, 6.7 percent, and a year-over-year drop of 1.0 percent.
Yun says higher borrowing costs somewhat cloud the outlook for the housing market in 2017. NAR’s most recent HOME survey, found that renters have less confidence about the present being a good time to buy than they had at the beginning of the year. On the other hand, Yun says that the impact of higher rates will be partly neutralized by stronger wage growth because of the 2 million net new job additions expected next year.
The Pending Home Sales Index is based on a large national sample, typically representing about 20 percent of transactions for existing-home sales. An index of 100 is equal to the average level of contract activity during 2001, which was the first year to be examined. By coincidence, the volume of existing-home sales in 2001 fell within the range of 5.0 to 5.5 million, which is considered normal for the current U.S. population. Pending sales are generally expected to close within two months of contract signing.
The notion that strong wage growth and jobs will partially neutralize rising interest rates is silly. But Yun has a mission: Always be as positive as possible about housing.
The often volatile housing starts numbers took another dive this report, down 18.7% in November according to the Census Bureau New Residential Construction report for November 2016.
Housing starts 1959-Present
Year-Over-Year Detail Since 1994
New Residential Construction Details
Permits down 4.7% from October
Permits down 6.6% from year ago
Starts down 18.7% from October
Starts down 6.9% from year ago
Completions up 15.4% in October
Completions up 25% from year ago
Mortgage Rates Soar
Mortgage rates have risen 104 basis points (1.04 percentage points) since July 8.
As I have pointed out, this is bound to affect the housing market sooner or later. Sooner means now.
Each quarter-point hike will affect mortgage rates correspondingly until the long end of the curve refuses to rise further. At that point, we will be in recession.
With the Dow Jones just a handful of gamma imbalance rips away from 20,000, the CIO of One River Asset Management, Eric Peters, shares some critical perspective on the market’s recent euphoric surge, going so far as to brand what is going on as America’s “Massive Policy Error”, the biggest in the past 50 years.
His thoughts are presented below, framed in his typical “anecdotal” way.
Anecdote:
“America’s Massive Policy Error,” said the CIO. “That’s the title of the book someone will write in ten years about what’s happening today.” Never in economic history has a government implemented a fiscal stimulus of this size at full employment.
“The Trump team and economic elites believe that anemic corporate capital expenditure is the root cause of today’s lackluster growth.” It’s not that simple.
If credit to first-time homebuyers hadn’t been cut off post-2008, and state and local governments had spent as generously as they had after every other crisis, this recovery would have been like all others.
“People think that if only we cut taxes, kill Obamacare, and build some bridges, then American CEOs will start spending. That’s nonsense.” Ageing demographics, slowing population growth, and massive economy-wide debts have left CEOs unenthusiastic about expanding productive capacity.
“You make the most money in macro investing when there are policy errors and this will be the biggest one in 50yrs. These guys are going to crash the economy.” But not yet. First the anticipation of higher borrowing and rising growth expectations will widen interest rate differentials. Which will lift the dollar. But unlike recent episodes of dollar strength, this one will be accompanied by higher equities as investors ignore tightening financial conditions because they expect offsetting tax cuts and infrastructure spending.
Emboldened by higher equity prices, bond bears will push yields higher, lifting the dollar further, validating people’s belief in a strong economy in the kind of reflexive loop that Soros described in The Alchemy of Finance – the kind that drives extreme macro trends.
“This will be like the 1985 dollar super-spike. And the Fed will eventually be forced to follow the steepening yield curve, hiking rates aggressively, tightening the debt noose, killing the economy. Then rates will collapse, crushing the dollar.”
To visualize the impact the recent spike in mortgage rates will have on the US housing market in general, and home refinancing activity in particular, look no further than this chart from the October Mortgage Monitor slidepack by Black Knight.
The chart profiles the sudden collapse of the refi market using October and November rates. As Black Knight writes, it looks at the – quite dramatic – effect the mortgage rate rise has had on the population of borrowers who could both likely qualify for and have interest rate incentive to refinance. It finds it was cut in half in just one month.
Some more details from the source:
The results of the U.S. presidential election triggered a treasury bond selloff, resulting in a corresponding rise in both 10-year treasury and 30-year mortgage interest rates
Mortgage rates have jumped 49 BPS in the 3 weeks following the election, cutting the population of refinanceable borrowers from 8.3 million immediately prior to the election to a total of just 4 million, matching a 24-month low set back in July 2015
Though there are still 2M borrowers who could save $200+/month by refinancing and a cumulative $1B/month in potential savings, this is less than half of the $2.1B/ month available just four weeks ago
The last time the refinanceable population was this small, refi volumes were 37 percent below Q3 2016 levels
Which is bad news not only for homeowners, but also for the banks, whose refi pipeline – a steady source of income and easy profit – is about to vaporize.
It’s not just refinancings, however, According to the report, as housing expert Mark Hanson notes, here is a summary of the adverse impact the spike in yields will also have on home purchases:
Overall purchase origination growth is slowing, from 23% in Q3’15 to 7% in Q3’16.
The highest degree of slowing – and currently the slowest growing segment of the market – is among high credit borrowers (740+ credit scores).
The 740+ segment has been mainly responsible for the overall recovery in purchase volumes and in fact, currently accounts for 2/3 of all purchase lending in the market today.
Since Q3’15 the growth rate in this segment has dropped from 27% annually to 5% in Q3’16. (NOTE, Q3/Q4’15 included TRID & interest rate volatility making it an easy comp).
This naturally raises the question of whether we are nearing full saturation of this market segment.
Low credit score growth is still relatively slow, and only accounts of 15% of all lending (as compared to 40% from 2000-2006), the lowest share of purchase originations for this group on record. ITEM 2) The “Refi Capital Conveyor Belt” has ground to a halt, which will be felt across consumer spend. AND Rates are much higher now than in October when this sampling was done.
The carnage in bonds has consequences. The average interest rate of the a conforming 30-year fixed mortgage as of Friday was quoted at 4.125% for top credit scores. That’s up about 0.5 percentage point from just before the election, according to Mortgage News Daily. It put the month “on a short list of 4 worst months in more than a decade.”
One of the other three months on that short list occurred at the end of 2010 and two “back to back amid the 2013 Taper Tantrum,” when the Fed let it slip that it might taper QE Infinity out of existence.
Investors were not amused. From the day after the election through November 16, they yanked $8.2 billion out of bond funds, the largest weekly outflow since Taper-Tantrum June.
The 10-year Treasury yield jumped to 2.36% in late trading on Friday, the highest since December 2015, up 66 basis point since the election, and up one full percentage point since July!
The 10-year yield is at a critical juncture. In terms of reality, the first thing that might happen is a rate increase by the Fed in December, after a year of flip-flopping. A slew of post-election pronouncements by Fed heads – including Yellen’s “relatively soon” – have pushed the odds of a rate hike to 98%.
Then in January, the new administration will move into the White House. It will take them a while to get their feet on the ground. Legislation isn’t an instant thing. Lobbyists will swarm all over it and ask for more time to shoehorn their special goodies into it. In other words, that massive deficit-funded stimulus package, if it happens at all, won’t turn into circulating money for a while.
So eventually the bond market is going to figure this out and sit back and lick its wounds. A week ago, I pontificated that “it wouldn’t surprise me if yields fall some back next week – on the theory that nothing goes to heck in a straight line.”
And with impeccable timing, that’s what we got: mid-week, one teeny-weeny little squiggle in the 10-year yield, which I circled in the chart below. The only “pullback” in the yield spike since the election. (via StockCharts.com):
Note how the 10-year yield has jumped 100 basis points (1 percentage point) since July. I still think that pullback in yields is going to happen any day now. As I said, nothing goes to heck in a straight line.
In terms of dollars and cents, this move has wiped out a lot of wealth. Bond prices fall when yields rise. This chart (via StockCharts.com) shows the CBOT Price Index for the 10-year note. It’s down 5.6% since July:
The 30-year Treasury bond went through a similar drubbing. The yield spiked to 3.01%. The mid-week pullback was a little more pronounced. Since the election, the yield has spiked by 44 basis points and since early July by 91 basis points (via StockCharts.com):
Folks who have this “risk free” bond in their portfolios: note that in terms of dollars and cents, the CBOT Price Index for the 30-year bond has plunged 13.8% since early July!
However, the election razzmatazz hasn’t had much impact on junk bonds. They’d had a phenomenal run from mid-February through mid-October, when NIRP refugees from Europe and Japan plowed into them, along with those who believed that crushed energy junk bonds were a huge buying opportunity and that the banks after all wouldn’t cut these drillers’ lifelines to push them into bankruptcy, and so these junk bonds surged until mid-October. Since then, they have declined some. But they slept through the election and haven’t budged much since.
It seems worried folks fleeing junk bonds, or those cashing out at the top, were replaced by bloodied sellers of Treasuries.
Overall in bond-land, the Bloomberg Barclays Global Aggregate bond Index fell 4% from Friday November 4, just before the election, through Thursday. It was, as Bloomberg put it, “the biggest two-week rout in the data, which go back to 1990.”
And the hated dollar – which by all accounts should have died long ago – has jumped since the election, as the world now expects rate hikes from the Fed while other central banks are still jabbering about QE. In fact, it has been the place to go since mid-2014, which is when Fed heads began sprinkling their oracles with references to rate hikes (weekly chart of the dollar index DXY back to January 2014):
The markets now have a new interpretation: Every time a talking head affiliated with the future Trump administration says anything about policies — deficit-funded stimulus spending for infrastructure and defense, trade restrictions, new tariffs, walls and fences, keeping manufacturing in the US, tax cuts, and what not — the markets hear “inflation.”
So in the futures markets, inflation expectations have jumped. This chart via OtterWood Capital doesn’t capture the last couple of days of the bond carnage, but it does show how inflation expectations in the futures markets (black line) have spiked along with the 10-year yield (red line), whereas during the Taper Tantrum in 2013, inflation expectations continued to head lower:
Inflation expectations and Treasury yields normally move in sync. And they do now. The futures markets are saying that the spike in yields and mortgage rates during the Taper Tantrum was just a tantrum by a bunch of spooked traders, but that this time, it’s real, inflation is coming and rates are going up; that’s what they’re saying.
In the last few months, as The Fed has jawboned a rate hike into markets, mortgage applications in America have collapsed 30% to 10-month lows – plunging over 9% in the last week as mortgage rates approach 4.00%.
We suspect the divergent surge in homebuilders is overdone…
Donald Trump’s victory sparked a tremendous sell-off in the Treasury market from an expectation of fiscal stimulus, but more broadly, from an expectation that a unified-party government can enact business-friendly policies (protectionism, deregulation, tax cuts) which will be inflationary and economically positive. It doesn’t take too much digging to show that the reality is different. The deluge of commentaries suggesting ‘big-reflation’ are short-sighted. Just as before last Tuesday we thought the 10yr UST yield would get below 1%, we still think this now.
Business Cycle
No matter the President, this economic expansion is seven and a half years old (since 6/2009), and is pushing against a difficult history. It is already the 4th longest expansion in the US back to the 1700’s (link is external). As Larry Summers has pointed out (link is external) after 5 years of recovery, you add roughly 20% of a recession’s probability each year thereafter. Using this, there is around a 60% chance of recession now.
History also doesn’t bode well for new Republican administrations. Certainly, the circumstances were varied, but of the five new Republican administrations replacing Democrats in the 19th and 20th centuries, four of them (Eisenhower, Nixon, Reagan, and George W. Bush) faced new recessions in their first year. The fifth, Warren Harding, started his administration within a recession.
Fiscal Stimulus
Fiscal stimulus through infrastructure projects and tax cuts is now expected, but the Federal Reserve has been begging for more fiscal help since the financial crisis and it has been politically infeasible. The desire has not created the act. A unified-party government doesn’t make it any easier when that unified party is Republican; the party of fiscal conservatism. Many newer House of Representatives members have been elected almost wholly on platforms to reduce the Federal debt. Congress has gone to the wire several times with resistance to new budgets and debt ceilings. After all, the United States still carries a AA debt rating from S&P as a memento from this. Getting a bill through congress with a direct intention to increase debt will not be easy. As we often say, the political will to do fiscal stimulus only comes about after a big enough decrease in the stock market to get policy makers scared.
Also, fiscal stimulus doesn’t seem to generate inflation, probably because it is only used as a mitigation against recessions. After the U.S. 2009 Fiscal stimulus bill, the YoY CPI fell from 1.7% to 1% two years later. Japan has now injected 26 doses (link is external) of fiscal stimulus into its economy since 1990 and the country has a 0.0% YoY core CPI, and a 10yr Government bond at 0.0%.
Rate Sensitive World Economy
A hallmark of this economic recovery has been its reliance on debt to fuel it. The more debt outstanding, the more interest rates influence the economy’s performance. Not only does the Trump administration need low rates to try to sell fiscal stimulus to the nation, but the private sector needs it to survive. The household, business, and public sectors are all heavily reliant on the price of credit. So far, interest rates rising by 0.5% in the last two months is a drag on growth.
Global Mooring
Global policies favoring low rates continue to be extended, and there isn’t any economic reason to abandon them. Just about every developed economy (US, Central Europe, Japan, UK, Scandinavia) has policies in place to encourage interest rates to be lower. To the extent that the rest of the world has lower rates than in the US, this continues to exert a downward force on Treasury yields.
Demographics
As Japan knows and we are just getting into, aging demographics is an unmovable force against consumption, solved only with time. The percent of the population 65 and over in the United States is in the midst of its steepest climb. As older people spend less, paired with slowing immigration from the new administration, consumer demand slackens and puts downward pressure on prices.
Conclusion
We haven’t seen such a rush to judgement of boundless higher rates that we can remember. Its noise-level is correlated with its desire, not its likelihood. While we cannot call the absolute top of this movement in interest rates, it is limited by these enduring factors and thus, we think it is close to an end. In a sentence, not only will the Trump-administration policies not be enacted as imagined, but even if they were, they won’t have the net-positive effect that is hoped for. We think that a 3.0% 30yr UST is a rare opportunity buy.
The California housing market is expected to grow increasingly un-affordable next year, driving would-be home buyers away from high-cost coastal regions and toward the more inexpensive inland stretches of the state, according to an industry forecast.
The California Assn. of Realtors on Thursday predicted that sales will be more robust in the Central Valley and Inland Empire as families look for a home they can afford.
And as more and more families struggle to afford a home, price increases are expected to be more muted than in years past. The state’s median price is projected to end this year at $503,900, up 6.2% from last year. In 2017, prices should climb 4.3% to $525,600.
“Next year, California’s housing market will be driven by tight housing supplies and the lowest housing affordability in six years,” Pat Zicarelli, the association’s president, said in a statement.
The high cost of housing in California has become a growing political issue within the state. And it has spurred calls for increased funding for subsidized housing, as well as efforts to loosen building regulations so the private sector can quickly construct more residential units.
This week, two studies — one from UC Riverside and another from UCLA — warned that the state’s housing shortage threatens to put a drag on economic growth.
Despite those and other fears, the Realtors association predicted that the economy will keep improving and produce enough demand to nudge statewide home sales up 1.4%, compared to 2016.
In contrast, sales this year are projected to inch down 0.4% from 2015.
“The underlying fundamentals continue to support overall home sales growth, but headwinds, such as global economic uncertainty and deteriorating housing affordability, will temper stronger sales activity,” the association’s chief economist, Leslie Appleton-Young, said in a statement.
✖ Janet Yellen is kicking around the idea of backing off of the Fed’s 2% inflation target.
✖ If the Fed lets the economy run hot, the yield curve will steepen.
✖ Equities should rally.
✖ Gold looks vulnerable with real yields still too low.
Janet Yellen, in a speech on Friday mentioned that the Fed could choose to allow the U.S. economy to “run hot” to allow for an increase in the labor participation rate. In typical Fed fashion, the goalposts are being moved once again, and the implication for the yield curve is important.
“Another scenario, one which Holbrook recognizes but does not represent our base forecast, is that the Federal Reserve will continue to drag its feet and not respond to accelerated wage gains. In this environment, longer-term yields will rise as inflationary expectations rebound. Larry Summers, among others, has recently advocated for such Fed policy, calling for them to increase their inflation targets. If this materializes, short-term rates will remain low, and the yield curve will steepen.” – July 1st, 2016
Janet Yellen’s comments on Friday indicate that this scenario is increasingly likely. It seems that the Federal Reserve, rather than taking a proactive stance against inflation as it has done in the past, it is going to be reactionary. If this is the case, investors can shift their attention from leading indicators like unemployment claims and wage growth, and instead focus on lagging indicators like PPI and CPI when assessing future Fed action.
The fixed income market is still pricing in a 65% likelihood of a rate hike in December, and given the abundance of dissenters at the September meeting, as well as recent remarks from Stanley Fischer, we expect the Fed to raise in December. After which, we presume the Federal Reserve will declare all meetings live and “data-dependent.” We expect that the Federal Reserve will NOT raise rates again until the core PCE deflator (their preferred measure) breaches 2%.
If they do choose to let the economy “run hot,” the market will need to figure out what level of inflation the Federal Reserve considers to be “hot.” Is it 2.5%? Is it 3%? At what level does the labor participation rate need to reach for further Fed normalization?
These questions will be answered in time as investors parse through the litany of Fed commentary over the next couple of months. In any case, a shift in the Fed mandate is gaining traction. Rather than fighting inflation, the Federal Reserve is now fighting the low labor participation rate. Holbrook expects such a policy to manifest itself in the following manner:
Steepening yield curve
Weakening dollar
Further commodity appreciation
In terms of the equity markets, we expect the broad market to rally into year-end after the election – whatever the outcome. Bearish sentiment is still pervasive, and Fed inaction in the face of higher inflation should be welcomed by equity investors, at least in the short run. Holbrook is also cautious regarding gold. Gold is often described as an inflation hedge. However, this is incorrect. It is a real rate hedge. As real rates move lower, gold moves higher, and vice versa. With real rates at historical lows, we think there could be further weakness in the yellow metal.
The fixed income market is in the early stages of pricing in a “run-hot” economy. The spread between the yield on the thirty-year bond (most sensitive to changes in inflation) and the two-year bill (sensitive to Fed action) is testing its five-year downtrend. A successful breach indicates that the market has changed. The Federal Reserve is willing to keep rates low, or inflation is on the horizon, or both.
Holbrook’s research shows that during the current bull market, a bear steepening trade (long yields rise more than short-term yields) has implied solid market returns. The S&P 500 advances an average of 2% monthly in this environment. This environment is second only to a bull steepening trade (where short-term rates fall faster than long-term rates) during which the S&P 500 rose more than 3.5% monthly.
Flattening yield curves were detrimental to equity returns. You can see the analysis in our prior perspective, “Trouble with the Curve.” In any case, a steepening yield curve should bode well for equity prices.
Meanwhile, there is ample evidence that inflation is starting to make a comeback. Global producer price indices generally lead the CPI and they have been spiking this year. CPI will likely follow, and not just in the United States.
And finally, although the dollar has rallied over the last couple of weeks in expectation of a late-year rate hike, much of the deflationary effect from a stronger dollar is behind us. The chart below tracks the year-over-year percentage change in the dollar (green line, inverted) versus the year-over-year change in goods inflation (yellow line). The dollar typically leads by four months and as such is lagged in the graph.
As you can see, the shock of a stronger dollar is behind us and it is likely that the price deflation we have experienced will wane. If, over the next four months, the price of goods is flat year over year, which we expect, the core PCE deflator should register above the Fed’s 2% target. The real question is: How will the Fed react when this happens? Will they initiate additional rate hikes? Or will they let the economy “run hot?”
Everyone is fretting about the Canadian house price bubble and the mountain of debt it generates – from the IMF on down to the regular Canadian. Now even the Bank for International Settlement (BIS) and the Organization for Economic Co-operation and Development (OECD) warn about the risks.
Every city has its own housing market, and some aren’t so hot. But in Vancouver and Toronto, all heck has broken loose in recent years.
In Vancouver, for example, even as sales volume plunged 45% in August from a year ago – under the impact of the new 15% transfer tax aimed at Chinese non-resident investors – the “benchmark” price of a detached house soared by 35.8%, of an apartment by 26.9%, and of an attached house by 31.1%. Ludicrous price increases!
In Toronto, a similar scenario has been playing out, but not quite as wildly. In both cities, the median detached house now sells for well over C$1 million. Even the Bank of Canada has warned about them, though it has lowered rates last year to inflate the housing market further – instead of raising rate sharply, which would wring some speculative heat out of the system. But no one wants to deflate a housing bubble.
During the Financial Crisis, when real estate prices in the US collapsed and returned, if only briefly, to something reflecting the old normal, Canadian home prices barely dipped before re-soaring. And this has been going on for years and years and years.
Over recent years, real house prices have been growing at a similar or higher pace than prior to the crisis in a number of countries, including Canada, the United Kingdom, and the United States. The rise in real estate prices has pushed up price-to-rent ratios to record highs in several advanced economies.
Canada stands out. Even on an inflation-adjusted basis, Canadian home prices have long ago shot through the roof. The OECD supplied this bone-chilling chart. The top line (orange) represents Canadian house price changes, adjusted for inflation:
In the US, several national indices have now exceeded the crazy prices of the Housing Bubble that started blowing up in 2006. In some cities, the median price has shot way past the prior bubble highs – in San Francisco, by over 50%! But other cities have lagged behind, and the national averages paper over the local bubbles.
In Canada, real estate is more concentrated. The Canadian market is about one-tenth the size of the US market. But the two largest local markets, Toronto and Vancouver, together make up 54% of the Teranet National Bank House Price Index. So when these two local bubbles begin to deflate – or implode – they will create enormous havoc across Canada.
Real estate is highly leveraged. It’s funded with debt. Many folks cite down-payment requirements in rationalizing why the Canadian market cannot implode, and why, if it does implode, it won’t pose a problem for the banks. However, an entire industry has sprung up to help homebuyers get around the down-payment requirements.
So household debt has been piling up for years, driven by mortgage debt. Statistics Canada reported two weeks ago that the ratio of household debt to disposable income has jumped to another record in the second quarter, to a breath-taking 167.6%:
The BIS now too, in its Quarterly Review, jumped on the bandwagon of issuing ineffectual warnings about this pile of debt, fingering particularly China – and in the same breath Canada:
According to the BIS early warning indicators, which are intended to capture financial overheating and potential financial distress over medium-term horizons, credit growth continues to be unusually high relative to GDP in several Asian economies as well as in Canada.
Estimated debt service ratios, which attempt to capture principal and interest payments relative to income, appear to be at manageable levels at current interest rates for most countries, although they point to potential concerns in Brazil, Canada, China, and Turkey.
The BIS developed a metric – the “credit-to-GDP gap” – that compares current credit levels to long-term trends and serves as an early warning indicator for financial crises.
Everyone wants to know when the next financial crisis happens. It will happen, but once again, it will surprise the economic establishment because, in the eloquent words of the BIS, debts always “appear to be at manageable levels” – until suddenly, they’re not.
The country with the highest credit-to-GDP gap is China (30.1), and the second highest is Canada (12.1). When it comes to debt creation, it’s not a good idea to be mentioned in the same breath with China. Turkey (9.6) is next in line. Then Mexico (8.8). And Brazil (4.6). Oh, and Australia (4.4)! So housing-bubble Canada is in excellent company!
The only saving grace is the permanently near-zero-interest-rate environment. Because that’s what it takes to keep this thing from deflating, according to the BIS, and even then there are “concerns.” But these countries, particularly Canada, are going to be in trouble when rates rise even a little.
So have central banks painted themselves and their entire bailiwicks into a corner with their ingenious emergency policies that have been dragging on for eight years? You bet. Is there a way out? Nope. Not a good one, at least. It’s just a question of when and how – and who gets to pay.
“It’s the greatest thing in the world,” exclaims Alex Sifakis – the 33 year old Florida ‘flipper’ – saying he has never raised this much money this fast (despite teh 14% cost of capital). As Bloomberg reports, house flippers and property developers are increasingly crowdfunding — tapping the virtual wallets of anonymous internet backers on various platforms – because “the amount of money you can raise isn’t limited by anything but their investor base.” As one of the ‘investors’ in this crowdfunded flipfest notes “if something goes bad, you have the asset to fall back on,” but, as Bloomberg rebukes, speed and property loans may not mix — remember 2008?
Bloomberg points out that the house flipper from Jacksonville, Florida, crowdfunded nine deals totaling more than $9 million through RealtyShares over the last two and a half years. A July deal for $1 million took him just 12 hours.
“Generally, raising money takes so much time,’’ said Sifakis, 33. “This offers so much flexibility and time savings. It’s so much better than going to family offices, banks or Wall Street firms.’’
House flippers and property developers are increasingly crowdfunding — tapping the virtual wallets of anonymous internet backers on platforms such as RealtyShares, LendingHome, PeerStreet and Patch of Land. For riskier ventures, such as building new homes and buying, renovating and selling existing ones, they’re finding quick financing can be easier to get online than from banks.
That’s contributed to an increase in home flipping. In the second quarter, 39,775 investors bought and sold at least one house, the most since 2007, according to ATTOM Data Solutions.
The ease of fundraising through these nontraditional lenders could be a warning sign, according to Erik Gordon, a law professor at the University of Michigan in Ann Arbor.
“Whenever you see a big difference between the terms on which you can raise money in one market versus another market, something is wrong in at least one of those markets,” Gordon said.
“It usually is the market with the least-experienced players, and they usually end up wishing they hadn’t played.”
Sifakis said he’s borrowing money at an annual rate of 14 percent over two and a half years. He keeps all the profit he makes from selling homes, he said.
So far, Bloombergnotes that there have been few defaults in real estate crowdfunding deals. When they happen, the platforms say they’ll pay investors the proceeds from property sales.
The business has other potential pitfalls.
When it comes to real estate, faster isn’t always better. Wall Street’s home-mortgage machine of the mid-2000s valued speed over accuracy, with disastrous results, though most crowdfunding sites cater to investors and not homebuyers. Also, clicking for capital can be exploited by fraudsters who may not be who they say they are, according to Sara Hanks, co-founder and CEO of CrowdCheck, which provides due-diligence services for online investors.
“We’ve seen some things where the entity that’s supposed to own the property doesn’t actually own it,’’ she said.
Jeff Bullian, a Boston-based consultant, has invested in about 30 deals on RealtyShares and in a handful of others on websites such as Patch of Land. So far, only one deal has gone bad, he said. In that instance, the platform, which Bullian declined to identify, went to bat for investors so everyone could get their money back along with a small return.
Bullian said he contributes an average of $10,000 in each deal for returns of about 10 percent to 20 percent, similar to what he was getting from a marketplace lender.
“I really like the risk profile of real estate deals compared with some other investments because they’re secured,” Bullian said. “If something goes bad, you have the asset to fall back on.”
Sifakis, the Florida flipper, said he typically gets a $3 million line of credit from an investment firm for about every $1 million he raises on RealtyShares, giving him added buying power.
“It’s the greatest thing in the world,’’ Sifakis said. “The amount of money you can raise isn’t limited by anything but their investor base. And the investor base is growing and growing.”
The Fed has fostered this idiocy by manipulating everything and memories are short in housing markets. This will not end well…speed and property loans may not mix — remember 2008?
The oil boom caused a housing shortage in North Dakota’s Bakken oilfield. And towns rushed to build more homes and apartments. Now the price of oil is low, and the thousands who rushed to North Dakota for work are leaving. But new houses are still going up. Inside Energy’s Emily Guerin asks: Are these towns overbuilding?
Profile of a stretch of North Dakota highway witnesses oil’s boom and bust
Even before the latest Chinese home price data was released overnight, it was a pure bubble-buying frenzy.
As Chris Watling, the CEO of Longview Economics, told CNBC Thursday, “I think what’s going on in China is troubling … some of the valuations there are really quite extraordinary… We’ve double checked these numbers about seven times, because I found them quite hard to believe.“
What Watling found is that housing in major cities in China has seen price hikes over the last year that resemble the famous Dutch “Tulip Fever” bubble of 1637, according to new research by economic consultancy firm Longview Economics: the firm found that only San Jose in the Silicon Valley is more expensive than Shenzhen. The Chinese city has seen prices rise 76% since the start of 2015, with the acceleration beginning in April 2015 as the country’s stock market was nearing its peak. The situation in Beijing and Shanghai is similar, albeit less extreme, the company states.
According to Watling, the typical home in Shenzhen costs approximately $800,000. Watling said that the house-income ratio in Shenzhen is now running at 70 times, compared to around 16 times in somewhere like London.
“Housing in some of the tier 1 cities is more expensive than it is in London, which I think itself is on a bubble, Watling added. “The (stock) market exploded to the upside and then crashed dramatically. That money had to go somewhere, so it washed around the system … so a lot of it has gone into housing.”
China, the biggest economic story of the last 30 years, has soured in the eyes of many analysts. A stock market crash that began in the country last summer has highlighted the vast difficulties Chinese lawmakers are now facing. Watling said Chinese housing was a story built on credit, lots of liquidity and lots of debt. He added that all bubbles, though, once established, will eventually burst and deflate.
It will, but not yet.
According to the latest Chinese housing data released overnight, Chinese home prices rose the most in more than six years last month, suggesting local government efforts to avert a housing bubble are having only a limited effect according to Bloomberg. Average new-home prices in the 70 cities rose 1.2% in August from July, the biggest increase since Bloomberg started tracking records in January 2010. The value of home sales jumped 33 percent last month from a year earlier, the fastest pace in four months.
“Price growth accelerated in cities all of tiers,” the statistics bureau said in a statement released with the data. Almost half of the cities where prices increased had larger gains than in July, it added.
New-home prices, excluding government-subsidized housing, in August gained in 64 of the 70 cities the government tracks, compared with 51 in July, the National Bureau of Statistics said Monday. Prices fell in four cities, compared with 16 a month earlier, and were unchanged in two.
As Bloomberg notes, the jump in home prices comes in spite of lending curbs which have spread from major cities such as Shanghai and Shenzhen to regional hubs. That may may lead to further restrictions as policymakers become increasingly concerned about averting an asset bubble, said Xia Dan, a Shanghai-based analyst at Bank of Communications Co.
More importantly, Standard Chartered head of Greater China economic research Ding Shuang the latest surge in Chinese property prices in August suggests further broad-base easing by the PBOC is unlikely this year. He added that the home prices divergence continues with tier 1 and tier 2 cities overheating, whereas smaller cities are struggling to reduce inventory. As a result, Shuang expects PBOC to keep monetary policy prudent; and sees no further interest rate cut for the rest of the year. He also believes the Chinese government will introduce more curbs in major cities, such as a higher down-payment as mortgage loans are growing quickly
Hangzhou, Zhejiang’s provincial capital, on Sunday halted home sales to some non-local residents, adding to similar restrictions introduced last month in Suzhou and Xiamen. China’s top leaders, after a Politburo meeting led by President Xi Jinping, in July pledged to curb asset bubbles amid a renewed focus on financial stability.
However, for most Tier 1 cities, the curvs are having zero impact: prices climbed a record 4.4 percent and 3.6 percent in Shanghai and Beijing respectively, taking the year-on-year gains to 31 percent and 24 percent. Values rose 2.1 percent in Shenzhen and 2.4 percent in Guangzhou, both faster than a month earlier. Home prices climbed the fastest in regional hubs where local authorities haven’t introduced curbs. Zhengzhou, the provincial capital of central Henan province, led gains with a 5.5 percent increase, up from a 2 percent gain in July. Prices in Wuxi, a manufacturing base in southern Jiangsu province, followed with a 4.9 percent gain, compared with 2.7 percent a month earlier.
Some more details from Goldman:
Housing prices in the primary market increased 1.6% month-over-month after seasonal adjustment (weighted by population) in August, higher than the growth rate in July. Almost all cities saw price increases in August from July: Out of 70 cities monitored by China’s National Bureau of Statistics (NBS), 66 saw housing prices increase in August from the previous month (58 in July, on a seasonally-adjusted basis).
On a year-over-year, population-weighted basis, housing prices in the 70 cities were up 9.7% (vs. 8.3% yoy in July).
House price inflation accelerated across all tiers in August. In tier-1 cities, August price growth showed a spike to 3.5% month-over-month after seasonal adjustment, the largest price increase since the series started in Jan 2011. (Total property sales in tier-1 cities accounted for around 5% of nationwide property sales in volume terms.) August housing price growth was also at record high levels in tier-2 and 3 cities, with prices increasing at 1.8% mom sa and 1.1% mom sa respectively. The fast extension of mortgages likely contributed to the housing price rally – in August mortgage loans continued to be strong: medium- to long-term new loans to the household sector were Rmb 529bn, vs. Rmb 477bn in July. (see China: August money and credit data above expectations, reflecting supportive policy, Sep 14, 2016) In response to the fast growth of housing prices, many cities (such as Hangzhou, Suzhou, Xiamen, Zhengzhou) have announced tightening policies to curb the rapid price growth.
Finally, the main reason why tightening measures by local governments are unlikely to rein in prices is that credit remains easily attainable, said Jeffrey Gao, a Hong Kong-based property analyst at Nomura Holdings Inc. “The local curbs have limited impact as home inventory has already fallen to a low level,” Gao said. “Prices will not fall unless the government moves to tighten credit and add more land supply.”
Chinese authorities are facing a monetary policy dilemma amid “rapid” home-price growth, Zhou Hao, an economist at Commerzbank AG in Singapore, wrote in a note Monday. “The overall monetary policy should remain accommodative as inflation remains subdued and growth is still trending down. However, concern about an asset bubble will limit room for further easing.”
And, as we showed two weeks ago, the Chinese housing situation is likely to get even more bubbly in the coming weeks as mortgage loans as a % of total loans, the primary culprit behind the ongoing price surge, continues to rise to all time highs.
Social media mogul Mark Zuckerberg’s life seems to always revolve around houses in Palo Alto.
A house in Palo Alto is where he grew Facebook from a seed harvested at Harvard into one of the defining companies of 21st century Silicon Valley. A house in Palo Alto is where Zuckerberg and his family presently call home. And four houses in Palo Alto adjacent to his own are now a perhaps rare check on the authority of the sixth richest man in the world.
The contentious parcels. City of Palo Alto
In 2013, Zuckerberg bought the houses bordering his property, eventually revealing plans to demolish them. He was worried about his privacy. (You can all insert your own ironic “Facebook data mining privacy” joke here.)
Unfortunately, the city isn’t proving keen on his idea. We can’t imagine why they’d be a tiny bit sensitive about sacrificing perfectly good housing stock for the sake of its wealthiest resident’s desire not to live next to anyone.
To be fair, Zuckerberg also planned to build new homes on the four parcels—smaller ones that wouldn’t be able to peer into his own house. But Palo Alto’s Architectural Review Board didn’t like the looks of his proposed new homes and bounced the plan at Thursday’s meeting.
The board is an advisory committee, and Palo Alto’s director of planning Hillary Gitelman can override their decision and approve the proposals if she wants to. But architects who work in Palo Alto tell Curbed SF that this rarely happens. Railroading unpopular projects through wouldn’t be smart politics, after all.
Zuckerberg will probably have to come up with some new designs, resign himself to keeping the houses the way they are, or just start spending most of his time crashing in one of those sleep pods at the office.
Palo Alto Mayor Wants to ‘Meter’ ‘Reckless Job Growth’
Palo Alto mayor Patrick Burt says: “Palo Alto’s greatest problem right now is the Bay Area’s massive job growth.” And he wants to “meter” businesses to control “reckless job growth” in the Silicon Valley suburb.
Palo Alto has long been the center of Silicon Valley’s tech start-ups, and features 14 of theworld’s top 25 venture capital firms within a 10-mile radius. But in an interview with the real estate blog Curbed.com, Mayor Burt talked about how “Our community will not accept deterioration in our mobility.”
As a tech CEO that sold out for big bucks, Burt seems to want to keep out the riff-raff:
“First, we’re in a region that’s had extremely high job growth at a rate that is just not sustainable if we’re going to keep [Palo Alto] similar to what it’s been historically. Of course we know that the community is going to evolve. But we don’t want it to be a radical departure. We don’t want to turn into Manhattan.”
Burt claims it is the role of local government to avoid “reckless job growth”:
“We want metered job growth and metered housing growth, in places where it will have the least impact on things like our transit infrastructure. We look at the rates and we balance things.”
To “meter” housing growth, 97 percent of the non-commercial portion of Palo Alto is zoned R1 single family residence, while only 3 percent is zoned for multi-family apartments. The least expensive “starter home” in Palo Alto is listed at $995,000.
But according to the Planning Department, 45 percent of Palo Alto workers live in multi-unit housing, which means almost half of Palo Alto workers must commute in every day.
Mark Zuckerberg is believed to be the wealthiest resident of Palo Alto. He is a well known liberal, and made his fortune as the CEO of Facebook. The company data-mines the deepest secrets of 1.7 billion users, then sells those secrets to the highest bidder. Zuckerberg contributes heavily to liberal causes, advocates for unlimited immigration, and says he hates the wall Republican presidential nominee Donald Trump wants to build along the U.S./Mexican border.
But after Mr. Zuckerberg bought the three houses bordering surrounding his own Palo Alto home, he recently built an 8-foot high privacy wall around the compound for himself, his wife and young daughter.
Zuckerberg quietly submitted architectural drawings to the Palo Alto Planning Department this summer that were expected to be favored for approval, because the plan reduced density by demolishing four houses to build a mansion and three casitas.
However, they were rejected amidst a local controversy over gentrification that erupted when Palo Alto Planning and Transportation Commissioner Kate Vershov Downing announced in early September that her family is leaving Palo Alto for Santa Cruz, because they, like many other residents, can no longer afford the area.
Downing’s resignation letter bemoaned that despite splitting a house with another couple, her rent is still $6200 a month. She estimates that to buy the house and share it with children would cost $2.7 million. The monthly cost of a home mortgage, tax and insurance payment would be $12,177, or $146,127 per year. Downing laments that sum is too much for her as an attorney and her husband as a software engineer.
Downing’s resignation put unwelcome pressure on the Palo Alto’s Architectural Review Board to start being more family friendly. On September 15, the Board rejected Mr. Zuckerberg’s plans because they would seriously undermine the city’s housing stock.
The Architectural Board is only an advisory committee, and Palo Alto’s Director of Planning Hillary Gitelman can override their decision and approve the proposals. But local architects familiar with Palo Alto told the Curbed.com this rarely happens, because “railroading unpopular projects through wouldn’t be smart politics.”
It is unclear how widespread Mayor Burt’s feelings are, but there is at least some backlash.
Consumers and lenders are upset with the current residential appraisal situation. This came from Southern California. “Why isn’t anyone publicizing the appraisal gouging going on in select markets? Due to a lack of appraisers since the financial reform acts (must be college educated and possess certificates) there is a ‘rush’ fee on top of an inflated appraisal fee for purchases topping $2,000. All of this is costing the borrower in fees and in rates since some appraisals are taking 6 weeks thus requiring a longer rate lock period and higher rate. It seems like the financial and consumer protections are working in reverse order for the borrower. And speaking of appraisers, they are all older folks as the younger generation does not want to pursue a career in a dying industry (full automation).”
And this from one of the Rocky Mountain states. “Just this month, I have more than 4-week turnaround times quoted by most appraisers through the AMCs and appraisals as high as $2,620 for a non-rural basic FHA appraisal. Taking years to fix the problem is not good: we have major problems now. My first time homebuyers can barely afford the $500 appraisals let alone the $2,620 appraisals (most don’t even have credit cards with a limit that high). I even had an appraiser tell me (and it’s someone I know to be an honest hardworking appraiser) that if he can do 3 appraisals a week for $1000 each or 6 appraisals a week for $500 each, which do you think he will pick? Somebody asked me the other day if we did ‘cost plus’ for the AMC appraisals. We can’t do that as appraisals are one of the items we can’t redisclose if it comes in higher unless we can prove we didn’t know something about the property and that is extremely hard to prove. Something must be done.”
From Kentucky Dora Ann Griffin contributed, “The answer is with Collateral Underwriters (CU) – there is no reason we cannot go back to allowing brokers and lenders order appraisals from professional quality appraisers. It would allow small appraisal businesses to thrive and compete. The end result would be a much better pricing and quality. The question is how do we make that happen? I know it would be moving a mountain but is there a way associations, brokers, etc. can affect a movement back to common sense.
“I just closed a loan where the property failed CU. A desk review was done. Then a field review. The whole appraisal process spanned six weeks due to appraisers taking 4 days to accept and missing the delivery by four days. I was told repeatedly the AMC could not push because the appraiser would then not do it at all. That appraiser would be still on the roster if that happened! Meanwhile my buyer is living in a motel for weeks with two dogs, three kids and her husband spending thousands of dollars to get by.
“In the end the original appraiser had the wrong property ID and even had an address wrong on a comp along with nine other serious or minor corrections. As a consumer that appraisal was faulty but there is no remedy. I suffer the loss of repeat business and referrals for something totally out of my control.
“I dream of the day I can engage a qualified appraiser directly. If that does not happen we are looking at even higher costs and increasingly inferior quality. All the good appraisers in my market work directly with banks. I get the worst of the worst thru AMCs as a broker – an unfair playing field.”
From Washington Theresa Springer mailed, “In the PDX MSA (including Clark County, WA) it is a travesty with an average 4-6 week turn time with high rush fees to get us to this insane return point. Appraisers are cherry picking jobs based on amount given to receive appraisal back at a somewhat ‘normal’ time frame of 3+ weeks and where it is located, i.e. in town vs. ‘rural’ as in Camas and Ridgefield, like those two are rural (not). I spoke with an appraiser buddy of mine a week ago and he said, ‘I just scroll through my email in the AM to see what is being offered and I take the best fee and locale and go from there.’ He said he is getting offered $1,500- $2,000 to do an in-town appraisal with a 3 week turn time. Appraisers are now quoting mid-October to early November for an appraisal that is being ordered this week. We have a lack of appraisers, and here’s a video about why they’re taking so long. They are over loaded and it is the fault of the feds as they have made the bar to entry for an appraiser so high.
“This is getting so ridiculous and is causing a large uptick in costs to the borrowers and the sellers are so angry as they cannot close in any timely manner. Most agents now are writing PSA’s for 8 weeks or 6 weeks knowing that they will need an extension(s). VA loans are upwards of 8+ weeks in town and the VA seems to be doing very little to fix this issue on their end. Just closed a Brigadier General’s VA loan and he called the VA raised a riot and he was able to get his appraisal turned in 3 business days after an 8-week acceptance time lag. But it is taking the borrowers to call the VA to get anything done. The VA is only assigning out appraisals on Monday’s now and is no longer letting you know where you are in line. This is also hurting the Veterans as many sellers will no longer accept VA loans on their homes, which is their right.
“Due to the rules in place where a new appraiser needs a 4-year degree (this was the MOST insipid part of the appraisal license change, then comes the 2 +/- year apprenticeship where the certified appraiser has to personally review EVERY home and its comps in its entirety before approving the report, like they have time) we are not getting any new folks into the business. So much for saving the consumer money as all this is doing is creating more costs for the borrower and a longer wait time for the seller to close. Many sellers are only entertaining cash offers if they have this option due to these issues.”
Mike VanDerWeerd sent, “As a former (still licensed) appraiser, this appraisal discussion is quite interesting. In a nutshell, they took the business out of the profession and made appraisers lapdogs to AMCs. There is no incentive to perform quality work on a client basis. All you get is spoon fed assignments with no way of growing the business. My opinion is once the GSEs figure out an automated valuation method with a home inspection, appraisers will be VCR repairmen!”
And Bill King opined, “I would proffer that a good appraiser cannot do 2 to 3 appraisals per day and do them well. Unfortunately, that very expectation does more to drive down appraisal quality than almost all other things combined. Unless one has two or three of the same floor plan, in the same plat (rare) on the same day a good, competent appraisal isn’t going to happen with just 3 to 4 hours’ work. Without the ‘assembly line’ operation 2 or 3 appraisals per day is just not possible. The elephant in the living room is appraisal process itself. The single point value and single approach appraisal is fundamentally flawed and antiquated. Small data valuations in a big data world is silly.”
From Florida came, “As we all know, according to TRID, a consumer must receive Loan Estimate disclosures within 3 days of submitting all 6 items that comprise a loan application. First, the in-house stall was holding the property address out so more information could be gathered before mandatory disclosures. That worked for a while, except that when we have a purchase contract, we automatically have an address. So that stall doesn’t work anymore though offices do try to bury the contract for a while. Now, local offices are stalling disclosures until the appraisal comes back saying that is the basis for an estimate of property value. The obvious point being ignored by this argument is that if there’s a contract, there’s an estimation of property value. Two people have decided that the property is worth the agreed price and since a copy of the MLS listing is part of the loan file, processors and underwriters can see listed and contract values. The ‘wait for appraisal’ stall is a very thin one, and continues to make consumers wait longer for decisions and closing. As I have said before, every time CFPB tweaks a regulation a new cottage industry opens up in the lending community to try and circumvent the intended benefit to the public.” Thank you to Chris Carter for this note!
Chris Nielsen forecast, “I think in 10 years (maybe less) the Certified Appraiser will be little needed. With The UCDP and EAD portals, drone technology and other new intelligent systems, the routine property appraisal by a Human Being will be unnecessary.”
But those in the appraisal business deserve to be heard.
Mike Ousley, President & CEO of Direct Valuation Solutions, sends, “Being a company that provides solutions for lenders and appraisers to work directly with one another and one that also provides AMC services (DVS-AMC) gives me a unique perspective. On the AMC side we have first-hand knowledge of appraisers purposely and actively trying to damage the AMC by accepting orders, holding them for a week or two or three, then rejecting the order saying, ‘we never accepted the order.’ Recently, we had an appraiser in a well populated area quote a 4 month turn time!!!! Really? He had 80+ orders in his queue?
“The blogs are full of Appraiser v. AMC drama, and for sure there are good and bad AMCs, just like there are good and bad appraisers and yes, it would seem that some appraisers view the AMC as their shield from the relationships with the lender so they don’t have to ‘face the music’ when due dates are missed, report quality is substandard or errors are made and the lender is left holding the AMC responsible for their ‘inability to manage the independent appraiser.’
“The real rub is that in some cases the same appraiser who intentionally damages the AMC relationship is the same one professing to want the direct relationship with the lender through our software! Having started as a professional appraiser way back in 1979 and hopefully establishing myself as a ‘professional appraiser’ over the decades since, I am entirely flummoxed by the disconnect between saying as an appraiser you are a professional, acting professional and adhering to the Uniform Standards of PROFESSIONAL Appraisal Practice (USPAP) when the purpose of USPAP is ‘to promote and maintain a high level of public trust in appraisal practice by establishing requirements for appraisers.’ I think it is safe to say ‘public’ here includes the consumer who the lender is attempting to assist in securing a home loan for purchase or refinance purposes, and yet aren’t they the ones being damaged by the unprofessional conduct of the intentional actions of appraisers trying to damage the AMC hired by the lender and almost always paid for by the borrower? All too often, it seems, the word ‘Professional’ has gotten lost and the very public (read consumer) trust lost with it.
Mike wraps up with, “I think everyone, appraisers, lenders & AMCs, need to keep in mind the public we serve and not only maintain their trust but take a big step towards consistent and professional actions. While there is most certainly an issue with the number of appraisers dwindling, the number and frequency of underwriting or lender/investor stipulations and overall volume impacting the appraisal process, keeping professional conduct by ALL parties must be non-negotiable. On a closing note, I hope to drive a conversation with our national representation, the Mortgage Bankers Association, at our upcoming National Convention and bring not only more awareness to these growing issues but discuss forward thinking solutions and inclusion of appraisers & AMCs in the MBA agenda.”
Last Saturday in the commentary I quoted a reader who noted, among other things, “AMCs are keeping 1/3 to 1/2 of the appraisal fee.” Paul Dorman, President of Accurate Group, writes, “I did want to respond to this to dispel a myth. Good AMCs who want to promote partnerships with appraisers and expand their appraisal panels are not taking anywhere close to 1/3 to 1/2 of the appraisal fee. Good AMCs are actually sharing more of the appraisal fee with the appraiser and, when necessary, sharing the entire appraisal fee with the appraiser or taking losses on some orders to ensure service levels are met for both consumers and lenders.
“Yes, there is an appraiser shortage and good AMCs are working on solutions to that shortage – helping appraisers stay in the business, paying appraisers timely, limiting revision requests, looking for ways to educate and train new appraisers and developing products that make appraisers more efficient so they can complete more than 2 or 3 assignments a day. We’re doing all we can to ensure appraisers understand that the right AMCs can add a ton of value for them. We are expecting to see these efforts differentiate us in the market and expect that overtime more appraisers will see that not all AMCs are created equal.”
One month ago, ZeroHedge said that “it is not looking good for the US housing market”, when in the latest red flag for the US luxury real estate market, they reported that sales in the Hamptons plunged by halfand home prices fell sharply in the second quarter in the ultra-wealthy enclave, New York’s favorite weekend haunt for the 1%-ers.
Reutersblamed this on “stock market jitters earlier in the year” which damped the appetite to buy, however one can also blame the halt of offshore money laundering, a slowing global economy, the collapse of the petrodollar, and the drastic drop in Wall Street bonuses. In short: a sudden loss of confidence that a greater fool may emerge just around the corner, which in turn has frozen buyer interest.
A beachfront residence is seen in East Hampton, New York, March 16, 2016.
We concluded this is just the beginning, and sure enough, several weeks later a similar collapse in the luxury housing segment was reported in a different part of the country. As the Denver Post reported recently, high-end sales that fuel Aspen’s $2 billion-a-year real estate market are evaporating, pushing Pitkin County’s sales volume down more than 42 percent to $546.45 million for the first half of the year from $939.91 million in the same period of 2015.
The collapse in transactions means that Aspen’s high-end real estate market “one of the most robust in the country, with dozens of options for buyers ready to spend more than $10 million” finds itself in its first-ever sustained nosedive, despite “dense summer crowds, soaring sales tax revenues and high lodging occupancy.”
Like in the Hamptons, the question everyone is asking is “why”? There are many answers:
Ask a dozen market watchers why, and you’ll get a dozen answers. Uncertainty around the presidential election. Fear of Trump. Fear of Clinton. Growing trade imbalances with China. Brexit. Roller-coaster oil prices. Zika. Wobbling economies in South America. The list goes on.
“People are worried about all kinds of stuff these days,” says longtime Aspen broker Bob Ritchie. “I’ve never seen anything like this before.”
The speed of the collapse has been stunning. Until just last year, the local market was beyond robust, with Pitkin County real estate sales hitting $2 billion in 2015, a 33% annual increase driven largely by sales of homes in Aspen, where prices average $7.7 million.
This year, however, “a slowdown in January turned into a free fall.” Sales volume in Pitkin County is down 42%, according to data compiled by Land Title Guarantee Co.
Almost all of that decline is coming from Aspen, where the market is frozen. Sales in the Aspen-Snowmass market in the first half of the year were the bleakest since the first half of 2009, and inventory soared to levels not seen since the recession.
High-end sales that fuel Aspen’s $2 billion-a-year real estate market are evaporating
The statistics are stunning: single-family home sales in Aspen are down 62% in dollar volume through the first-half of the year. Sales of homes priced at $10 million or more — almost always paid for in cash — are down 60%. Last year, super-high-end transactions accounted for nearly a third of sales volume in Pitkin County.
“The high-end buyer has disappeared,” said Tim Estin, an Aspen broker whose Estin Report analyzes the Aspen-Snowmass real estate market.
“Aspen has never experienced such a sudden and precipitous drop in real estate sales,” according to the post.
Worse, it’s not just the collapse in the number of transaction: even more disconcerting for brokers who have always trumpeted Aspen as a safe and lucrative place to park a huge pile of money: Prices are dropping.
In the first half of this year, the average price per square foot of Aspen homes dropped 22 percent to $1,095 from $1,338 in 2015. Recent Aspen sales also closed at more than 15 percent below listing price, a rare discount.
Some brokers suspect that the frenzied sales and pricing pace of 2015 was not sustainable. The present decline is a correction, they say. “I think a lot of people thought we would go to the next level in 2016. Take the next step up and that step got resistance from buyers,” said longtime Aspen broker Joshua Saslove, who just put an Aspen home for more than $10 million under contract. If it closes, it will be just the fourth sale above $10 million in Aspen this year, compared with more than a dozen by this point last year.
“I think a lot of developers thought they would push their, say, $5 million properties to $6 million this year, but no one is buying,” Saslove said. “I don’t see that nonchalance or cavalier attitude any more.”
To be sure, Saslove is hoping that a rebound is coming; that however, may be overly optimistic and first far more pain is in store especially if one considers what is taking place in yet another formerly red-hot housing market, where suddenly things are just as bad, because as Mansion Global reports…
Luxury condo sales in Miami have crashed 44%.
According to the latest report by the Miami Association of Realtors, the local luxury housing market is just as bad, if not worse, than the Hamptons and Aspen.
The latest figures out of Miami this week showed residential sales are down almost 21% from the same time last year. But as bad as this double-digit decline may seem, it pales in comparison to what’s happening at the high end of the market.
A closer look at transactions for properties of $1 million or more in July shows just 73 single-family home sales, representing an annual decline of 31.8%, according to a new report by the Miami Association of Realtors. In the case of condos in the same price range, the number of closed sales fell by an even wider margin: 44.4%, to 45 transactions.
The Miami housing market, and its luxury segment in particular, has been softening for the past year with high-end condos sitting on the market for twice as long as they did a year ago and sellers offering bigger discounts amid an increased supply.
Number of closed sales for Miami condos priced over $1 million fell by 44%
In July, townhouses and condos of $1 million or more waited, on average, 162 days for a buyer, a 1.9% increase over a year ago and the longest time of any other price range, according to the report.
As in the previous two markets, the locals want something to blame, in this case the strong dollar, which has significantly increased the value of properties in other currencies, has been blamed, and perhaps rightfully so as sales to foreigners—an important client base, since international buyers acquire more homes in Florida than in any other state, according to the National Association of Realtors – have tumbled.
Real estate appraiser and data expert Jonathan Miller said that Miami is behaving like most of the rest of the U.S. housing market, which is in fairly good shape overall “but soft at the top.”
As noted here over the years, In the case of Miami, like in other most other coastal markets such as New York and Los Angeles, the housing boom was heavily boosted by foreign buyers, who used US luxury real estate as their new form of anonymous “offshore bank accounts” courtesy of the NAR’s exemption from Anti-Money Laundering Provisions. However, after the recent drops in commodity prices and the spike in the USD, they have scaled back their purchases.
“The international component is not as intense,” Mr. Miller said.
Depsite the slowdown deals are still being done, with cash the preferred form of payment of foreign buyers in the U.S., – some 43% of all sales in Miami in July were closed in cash, however down from 48.1% the same month last year, according to the latest figures.
Other potential buyers are also stepping back: cash sales for townhouses and condominiums, an indicator of investor activity, hit their lowest level in a year last month: 633 transactions, representing a 30.4% year-over-year decline, according to the report.
As for the forecast for the coming months, sales activity doesn’t look likely to surge. There were 1,272 pending sales of townhouses and condos in Miami in July, which means 25.4% fewer transactions waiting to close than in the same month in 2015 and the lowest number so far this year. Meanwhile, as a result of a building boom, luxury condo inventory is up 47.8% from last year, with 2,482 units worth $1 million or more waiting to change hands; this means that sellers of high-end condos will continue to face stiff competition, prompting even fewer transactions and/or lower prices.
So far, the collapse at the luxury end has failed to transmit to the broader market, less impacted by lack of foreign demand, however as we documented two weeks ago,it is only a matter of time before the overall US housing market suffers as well. The only question is whether the NAR and the US Census Bureau, who tabulate the “goal-seeked”, seasonally adjusted data, will admit it before or after the presidential elections. The likely answer: it depends on who the next president is.
As you probably assumed anyway, due to Betteridge’s Law, we aren’t currently in a homeownership trough. The recent homeownership rate posting of 62.9% for the second quarter of 2016 is not the lowest in history, nor is it even the lowest in recorded US history. However, it is the lowest post in 51 years(!) – not since the third quarter of 1965 have we seen homeownership rates this low.
And why are we at DQYDJ bothering to look now?
Donald Trump, the Republican nominee for President sent this Tweet a couple days back:
The History of the Home Ownership Rate
A while back, we did a two-part deep dive into the history of the 30 year mortgage and the history of the (recorded) home ownership rate in America. That research dug up some very interesting information.
First, long-dated mortgages of 15, 20 and longer years started in the mid 1930s. Second, private mortgage insurance (which was mostly done in by the Great Depression) started up in 1957 with the Mortgage Guaranty Insurance Company.
Those innovations brought homeownership to the masses – no longer did you have to be able to afford a huge, short-term loan with a massive down payment. Extending Mr. Trump’s graph back to 1890 you can see the effect of the innovations (and of the Great Depression and Recession) on homeownership rates:
(Note that until the 60s there wasn’t as much resolution in the series – see our historical research for details).
The longer dated series lets us state a few interesting facts:
The lowest homeownership rate since 1957’s PMI innovation was a 61.9% rate in 1960.
The lowest homeownership recorded since 1890 was 43.6% in 1940 – in the midst of the Great Depression.
Why Is the Home Ownership Rate Dipping?
Oh, you won’t accept ‘people are renting more’ as an answer?
Yes, the run up in real estate prices in many areas of the country (so soon after the Great Recession!) is a huge factor. But, so too are the massive demographic changes underway in our country.
As we have pointed out many times, the millennials (of which I count myself as an older member) now makeup roughly 25% of the workforce. Millennials have different living arrangements than past generations – a greater propensity to live at home, a seeming desire to be free to change jobs (and areas!) more often, and, yes, more expensive housing options. That last point, of course, prices many millennials out of the market – renting makes much more sense when you look at the home prices in many metros in the United States.
Can It Change? Will We See the Rate Rise Again?
Yes – as of right now, I don’t see the drive towards renting (and living at home) to be a sort of permanent desire. Already there are countering trends – the so-called “Tiny House” movement one of them (and, yes, I have been searching for a place to name-drop it!). It’s safest, at this point in time, to assume millennials will tend to be similar to their parents – eventually leaving the city to marry, have kids and buy homes. You know, like yours truly.
However, we’re looking into the future here. Marriage is trending towards being an institution for older and older couples, along with kids. If these trends keep up, we might start to get into uncharted territory here – I’d love your input on whether you think homeownership rates will recover, or high-60s was an anachronism.
Will we see an increase in homeownership led by the millennials?
Condos along Vancouver’s waterfront. (Photo: Getty Images)
Summary
U.S. investors betting on an epic U.S. style housing bust occurring in Canada have been doing so for a considerable period with no clear proof.
Claims of a broad-economy wide housing bubble that is ready to burst are significantly overstated with no clear evidence that a bubble exists.
The majority of price growth is coming from Vancouver and Toronto and there are specific reasons supporting higher prices in those markets.
The conditions in Canada’s housing market are strikingly different compared to those that existed in the U.S. during the lead-up to the 2007 housing meltdown.
It appears that ‘group think‘, ignorance and cognitive dissonance have come to dominate the argument around whether Canada’s housing market is in bubble territory and poised to burst sometime soon. Struggling U.S. hedge funds, many of which missed out on the ‘big short‘ of book and movie fame, have been betting heavily on an epic Canadian housing meltdown by shorting Canada’s major banks, but to date have incurred considerable losses.
Then you have the chorus of economists, analysts and investors who have been claiming that not only has a massive real estate bubble formed in Canada but that it is poised to burst. In many cases, these proclamations go back as far as 2009 and despite being reiterated by naysayers now for close on seven years, a housing bust has yet to occur. Many including acclaimed investor Canada’s own Prem Watsa have stated that Canada’s housing market resembles that which existed in the U.S. during the run-up to the subprime crisis.
These claims rest upon a broad-range of assertions that a number of one-off, disruptive and unsustainable factors are driving Canadian housing prices ever higher, creating the perfect storm that will cause the bubble to burst in a spectacular manner. These claims, many of which have been voiced for some years now, include:substantial amounts of foreign (read Asian) investment;
lax lending standards;
large volumes of subprime mortgages;
growing financial stress being placed on households; and
the growing risk of external economic shocks.
However, it appears that many investors, particularly those based in the U.S. are ignoring the fundamental differences between the two markets and local attributes that will not only prevent an epic meltdown but backstop prices for some time to come. Let’s take a detailed look at some of the major myths that are regularly wheeled out by those who claim that a massive housing bubble exists in Canada and is poised to burst any time.
#1 There is a massive economy wide housing bubble
One of the main drivers of the massive U.S. housing meltdown was that frothy prices were not restricted to specific regional markets or segments but instead constituted an economy-wide housing bubble that was highly speculative in nature. And the risk that this posed to the U.S. financial system and economy was magnified by the prevalence of non-traditional and substandard lending practices as well as considerable volumes of inferior mortgage backed securities.
Yet in the case of Canada, overheated or bubbly housing markets are restricted to a small number of regional markets and market segments, with the growth of housing prices either slowing or falling across other regions. By the end of June 2016 it was only a handful of markets including Toronto, Vancouver and Hamilton-Burlington that experienced double-digit growth.
In fact, it was the considerable increase of house prices in those markets which for June rose by 16.8%, 11.4% and 14.2% year-over-year respectively, which was responsible for the Canadian national average growing by 11%. Other regional markets such as New Brunswick and Quebec grew at more modest rates of around 3%, whereas Novia Scotia remained flat. Then you have Alberta and Saskatchewan, which are among the most affected by the prolonged slump in crude, where house prices fell by 1.4% and 1.6% respectively.
It is these points which indicate that Canada’s housing market on whole, is starting to cool with the growth in the national average house price predominantly being driven by Toronto and Vancouver. This does not necessarily mean that either of those housing markets have entered bubbles with a range of market specific dynamics responsible for the ongoing price growth.
#2 A massive influx of foreign investment is responsible for higher housing prices
Probably one of the biggest myths regularly bandied about by those that claim the market is in rarefied bubble territory and ready to burst, is that the tremendous inflow of foreign investment, particularly from China, is driving prices to unrealistic levels, particularly in Toronto and Vancouver. While it is certainly undeniable that these markets are attracting considerable amounts of attention from foreign investors this is not the only or most important factor in causing prices to surge in those markets.
Even naysayers such as Capital Economics economist Paul Ashworth believes that surging house prices are not being caused by foreign investment but rather by Canadians taking advantage of cheap credit and relaxed lending standards.
In fact, according to a range of reports and research conducted by a number of economists there is very little evidence to support the assertion that foreign money is driving up housing prices. According to an article from Canada’s National Post earlier this year, vacancy rates in Vancouver are on average 2% which then increases to 7.5% for condos, with very few of those vacant properties being foreign owned. The same article goes onto state that it is the laws of supply and demand that are responsible for higher housing prices rather than foreign money.
Recent data from the B.C. government shows that between June 10 and June 29 only 3.3% of all real estate deals in Vancouver involved foreign nationals and as a share of sales by value they only amounted to 5.1% of all sales. This is a far cry from the figures to be expected from a market where foreign money is responsible driving property prices into a bubble.
Indeed, if we take a closer look at the property markets of Vancouver and Toronto it is possible to identify specific market dynamics that are responsible for higher prices and these factors will continue to push them higher for some time to come.
#3 Toronto and Vancouver are in bubble territory
According to the naysayers, Canada’s housing market is now truly defying common sense and that a colossal housing crash is on its way, with the housing markets in Vancouver and Toronto caught in massive bubbles. This they claim is supported by factors such as Canada being judged to have the most overvalued housing market among developed economies and that global investors are increasingly betting against Canadian housing in record numbers.
Nonetheless, there are also a range of factors that indicate that these claims are alarmist and inaccurate, with no evidence to support the view that housing bubbles exit in either market. Will Dunning, chief economist of industry group Mortgage Professionals Canada, believes that prices are sustainable and not representative of a property bubble, stating that this talk has been going on since 2008 with no evidence of one existing. He even went on to state:
Housing bubbles do not exist in Canada, . . .
If we turn to what defines an economic or market bubble it becomes apparent that Dunning could certainly be right. For a housing bubble to exist people have to be buying houses for purely speculative reasons and this has to be across a considerable portion of the market. Then to illustrate that a bubble exists there has to be expectations of self-fulfilling price growth and that those unrealistic expectations are leading to increased and excessive activity in the housing market.
The theories postulated by Nobel award winning economist Joseph Stiglitz also supports these notions, he defines a bubble as where the reason that the price is high today, is only because investors believe that the selling price will be higher tomorrow.
None of these factors in their entirety apply to Canada’s housing market nor those of Vancouver or Toronto. If anything it is far more mundane market specific factors that are driving housing prices ever higher. A group of academics from the University of British Colombia while proposing placing a tax on vacant properties in order to reduce the level of foreign investment in Vancouver have stated that the fundamental drivers of higher prices are higher demand and limited supply. Upon taking a closer look at the markets of Vancouver and Toronto this becomes very apparent.
You see, Toronto and Vancouver are defined as global gateway cities that sees them cast in the same light as global cities such as London, New York, Paris and Hong Kong that have far more expensive real estate markets. This makes them important destinations for immigrants, with them accepting around half of all external immigrants to Canada.
The reasons for this are predominantly economic with both cities, particularly because of the prolonged slump in oil prices, have the greatest concentration of jobs in Canada, with around 25% of total employment in Canada. And according to economists’ from Bank of Montreal these two cities accounted for all of Canada’s job growth in 2015.
It is these factors which according to National Bank economist Stefane Marion are responsible for the working age population in Toronto and Vancouver to be growing at a rate that is 70% faster than the national average.
The prolonged slump in oil has magnified this phenomenon, with the deep economic slump in Canada’s oil patch significantly impacting the economies of Alberta and Saskatchewan. This has not only made those regions less appealing to immigrants but triggered a marked uptick in the number of households seeking to relocate because of higher unemployment and falling wages.
Meanwhile, The Economist has theorized that this rapidly growing demand is placing considerable pressure on housing supplies particularly because of their unchanging supplies, stating:
The supply of housing is rather inelastic, so in the short term house-price inflation is driven more by demand factors, such as the number of households, disposable income, interest rates and the yield available on other assets. In recent years all of these have helped to push house prices steadily upwards, especially in big cities.
The constrained supply situation caused by limited inventories in both cities is easy to see. As the chart below illustrates, Toronto’s housing inventory by June of this year was at less than half of its 10 year average and a third lower than the previous year.
Source: Canadian Real Estate Association.
When turning to Vancouver it is possible to see that for the same period inventories are around 60% lower than the 10 year average and a third lower than a year earlier.
Source: Canadian Real Estate Association.
With expanding populations, driven by growing internal and external migration, causing demand to swell coupled with extremely limited housing supplies in Toronto and Vancouver there is considerable support for higher prices, which means there won’t a correction in those markets anytime soon.
#3 The Conditions in Canada are similar to those in the U.S. prior to the financial crisis
One of the biggest myths concerning Canada’s housing market is that the conditions that exist are similar to, if not the same as those that existed in the U.S. in the lead-up to the massive housing meltdown that almost caused the U.S. financial system to collapse in 2007.
. . rising levels of Canadian household debt relative to income, along with rapidly increasing house prices, have created conditions similar to those in the United States prior to the financial crisis of 2008.
Then there is Steve Eismann who rose to fame betting against the U.S. housing market in the lead-up to the subprime crisis. He is making similar claims to Moody’s but was doing so way back in 2013 and has been recommending that investors bet against Canada’s mortgages lenders and banks.
It is this which has attracted the attention of short-sellers and now sees Toronto-Dominion Bank (NYSE:TD) and Bank of Nova Scotia (NYSE:BNS) being the first and third most shorted stocks on the TSX.
However, there are a range of reasons why Canada is not a repeat of what was occurring in the U.S. back in 2006, key among these is far higher underwriting standards for loans and a distinct lack of subprime mortgages.
It appeared that way back in 2006, anyone with a pulse could obtain a mortgage with mortgage underwriting standards relaxed to levels that were ridiculously low. Then there was the huge influx of fraudulent applications and an extremely lax approach to checking applications for accuracy. This easy money helped to fuel ever rising house prices and give a leg up to the next round of frenzied speculation. No one, from mortgage brokers, to the major banks wanted the merry-go-round to end as they all sort to cash in on the growing frenzy.
Clearly, Canada has not reached this stage yet and in fact it is doubtful that it ever well, with its property market certainly not caught in the same type of speculative frenzy.
Furthermore, it was the presence of considerable volumes of subprime mortgages that essentially precipitated the U.S. housing meltdown. It is estimated that they made up somewhere between 18% and 21% of all mortgages originated in the run-up to the housing crash. Whereas, in Canada subprime mortgages are estimated to make-up less than 5% of the market, and that was when the market was at its peak. With Bank of Canada pushing for tighter mortgage underwriting standards since this figure was released, it will certainly have fallen.
Aside from these key differences there are also a range of other Canada specific factors to consider including:
the lack of non-recourse mortgages, a greater prevalence of mortgage insurance;
the fact that borrowers on average have higher levels of equity in their homes; and
lower loan-to-valuation ratios for non-insured mortgages.
As a result, these differences mean that the market is not exposed to the same degree of risk nor the same volume of rapid defaults that forced U.S. lenders in 2006 and 2007 to flip repossessed properties as quickly as possible, causing prices to cascade ever lower.
Final musings
The differences between Canada’s housing market and that which existed in the U.S. in the run-up to the housing meltdown, which almost caused the U.S. financial system to collapse, are strikingly important. They highlight that not only is a sharp correction or housing meltdown unlikely but that in marked contrast to the claims of naysayers that there is in fact no evidence of a housing bubble. If anything while some regional markets are cooling, Vancouver and Toronto’s ever higher housing prices can be attributed to demographic pressures, higher demand and constrained supply. These factors will push prices higher in those markets for some time to come and backstop prices if there is a sharp economic downturn. For all of these reasons it is difficult to envision an epic Canadian housing meltdown occurring any time soon.
Net issuance seen rising after steady declines since 2009
Fed seen adding to supply as Treasury ramps up debt sales
Negative yields. Political risk. The Fed. Now add the U.S. deficit to the list of worries to keep beleaguered bond investors up at night.
Since peaking at $1.4 trillion in 2009, the budget deficit has plunged amid government spending cuts and a rebound in tax receipts. But now, America’s borrowing needs are rising once again as a lackluster economy slows revenue growth to a six-year low, data compiled by FTN Financial show. That in turn will pressure the U.S. to sell more Treasuries to bridge the funding gap.
No one predicts an immediate jump in issuance, or a surge in bond yields. But just about everyone agrees that without drastic changes to America’s finances, the government will have to ramp up its borrowing in a big way in the years to come. After a $96 billion increase in the deficit this fiscal year, the U.S. will go deeper and deeper into the red to pay for Social Security and Medicare, projections from the Congressional Budget Office show. The public debt burden could swell by almost $10 trillion in the coming decade as a result.
All the extra supply may ultimately push up Treasury yields and expose holders to losses. And it may come when the Federal Reserve starts to unwind its own holdings — the biggest source of demand since the financial crisis.
“It’s looking like we are at the end of the line,” when it comes to declining issuance of debt that matures in more than a year, said Michael Cloherty, head of U.S. interest-rate strategy at RBC Capital Markets, one of 23 dealers that bid at Treasury debt auctions. “We have deficits that are going to run higher, and at some point, a Fed that will start allowing its Treasury securities to mature.”
After the U.S. borrowed heavily in the wake of the financial crisis to bail out the banks and revive the economy, net issuance of Treasuries has steadily declined as budget shortfalls narrowed. In the year that ended September, the government sold $560 billion of Treasuries on a net basis, the least since 2007, data compiled by Bloomberg show.
Coupled with increased buying from the Fed, foreign central banks and investors seeking low-risk assets, yields on Treasuries have tumbled even as the overall size of the market ballooned to $13.4 trillion. For the 10-year note, yields hit a record 1.318 percent this month. They were 1.57 percent today. Before the crisis erupted, investors demanded more than 4 percent.
Net Issuance of U.S. Treasuries, Fiscal-Year Basis
One reason the U.S. may ultimately have to boost borrowing is paltry revenue growth, said Jim Vogel, FTN’s head of interest-rate strategy.
With the economy forecast to grow only about 2 percent a year for the foreseeable future as Americans save more and spend less, there just won’t enough tax revenue to cover the burgeoning costs of programs for the elderly and poor. Those funding issues will ultimately supersede worries about Fed policy, regardless of who ends up in the White House come January.
As a percentage of the gross domestic product, revenue will remain flat in the coming decade as spending rises, CBO forecasts show. That will increase the deficit from 2.9 percent this fiscal year to almost 5 percent by 2026.
“As the Fed recedes a little bit into the background, all of these other questions need to start coming back into the foreground,” Vogel said.
The potential for a glut in Treasuries is emerging as some measures show buyers aren’t giving themselves any margin of safety. A valuation tool called the term premium stands at minus 0.56 percentage point for 10-year notes. As the name implies, the term premium should normally be positive and has been for almost all of the past 50 years. But in 2016, it’s turned into a discount.
Some of the highest-profile players are already sounding the alarm. Jeffrey Gundlach, who oversees more than $100 billion at DoubleLine Capital, warned of a “mass psychosis” among investors piling into debt securities with ultra-low yields. Bill Gross of Janus Capital Group Inc. compared the sky-high prices in the global bond market to a “supernova that will explode one day.”
Despite the increase in supply, things like the gloomy outlook for global growth, an aging U.S. society and more than $9 trillion of negative-yielding bonds will conspire to keep Treasuries in demand, says Jeffrey Rosenberg, BlackRock Inc.’s chief investment strategist for fixed income.
What’s more, the Treasury is likely to fund much of the deficit in the immediate future by boosting sales of T-bills, which mature in a year or less, rather than longer-term debt like notes or bonds.
“We don’t have any other choice — if we’re going to increase the budget deficits, they have to be funded” with more debt, Rosenberg said. But, “in today’s environment, you’re seeing the potential for higher supply in an environment that is profoundly lacking supply of risk-free assets.”
Deutsche Bank AG also says the long-term fiscal outlook hinges more on who controls Congress. And if the Republicans, who hold both the House and Senate, retain control in November, it’s more likely future deficits will come in lower than forecast, based on the firm’s historical analysis.
FED HOLDINGS OF TREASURIES COMING DUE
2016 ────────────── $216 BILLION
2017 ────────────── $197 BILLION
2018 ────────────── $410 BILLION
2019 ────────────── $338 BILLION
However things turn out this election year, what the Fed does with its $2.46 trillion of Treasuries may ultimately prove to be most important of all for investors. Since the Fed ended quantitative easing in 2014, the central bank has maintained its holdings by reinvesting the money from maturing debt into Treasuries. The Fed will plow back about $216 billion this year and reinvest $197 billion in the next, based on current policy.
While the Fed has said it will look to reduce its holdings eventually by scaling back re-investments when bonds come due, it hasn’t announced any timetable for doing so.
“It’s the elephant in the room,” said Dov Zigler, a financial markets economist at Bank of Nova Scotia. “What will the Fed’s role be and how large will its participation be in the Treasury market next year and the year after?”
Homes are selling an average of a week faster than they did a year ago, meaning home shoppers should be prepared to move quickly in a competitive housing market, according to the June Zillow Real Estate Market Report.
Tight inventory continues to be a major factor for home shoppers. The supply of homes for sale is nearly 5 percent lower than it was a year ago, and 38 percent lower than its peak level in 2011. With fewer available options, home shoppers are moving quickly to buy homes, with the average U.S. home closing after 78 days on the market.
The 78-day average includes the time it takes to close, which is usually one or two months after the home goes under contract. This means that homes are pending within about a month of being listed.
The length of time homes stay on the market before selling has been steadily decreasing since 2010, when homes took an average of five months to sell. The average time home buyers had in Pittsburgh, Philadelphia and Charlotte, N.C. dropped by at least two weeks, the biggest change among the largest U.S. metros.
The low inventory and quick-moving market combine to create a competitive home shopping market, especially for potential buyers looking for less expensive homes. The most expensive third of the market has experienced the smallest drop in available inventory compared to the rest of the market.
“Homes are selling faster than ever as the home shopping season hits its peak,” said Zillow Chief Economist Dr. Svenja Gudell. “If you’re looking for a home, be prepared to move quickly. Adding to this difficult buying environment is low inventory—there simply aren’t many homes to choose from. And while this looks like a good time to be a seller, potential move-up buyers may hesitate to list their homes and become buyers. Until the supply increases, it will remain a tough market to find a home.”
Confidential briefing for CRA auditors outlines strategy to tackle suspected tax cheats who do not report global income or who ‘flip’ homes – but reveals that last year, there was only one successful audit of global income for all of British Columbia
A backhoe destroys a C$6 million mansion in Vancouver’s Shaughnessy neighbourhood this year. The destruction of the well-kept home prompted community outrage and was cited in a briefing for Canadian tax auditors looking into Vancouver real estate transactions. Photo: Twitter / @DeborahAMG
A secret strategy briefing for Canada Revenue Agency auditors has revealed plans to crack down on real estate tax cheats in Vancouver, with 50 auditors being assigned to investigate purchases funded by unreported foreign income.
Presentation notes for the seminar, delivered to auditors on June 2 and leaked to the South China Morning Post, show that only one successful audit of worldwide income was conducted in British Columbia in the past year, in spite of Vancouver’s reputation as a hotspot for immigrant “astronaut families” whose breadwinners often work in mainland China and Hong Kong.
The plans, which come amid a furore over the role of Chinese money in Vancouver’s runaway housing market, were provided by a Canada Revenue Agency employee who attended the June 2 briefing. The briefing is identified as a “protected B” confidential document on the cover.
The cover for a confidential CRA briefing for auditors. Photo: SCMP Pictures
But the employee feared the sweep would prove inadequate. “Sure, they’ve upped the numbers because it’s hitting the papers,” they said. But on average, they estimated, each redeployed income auditor would only be able to conduct 10 to 12 audits per year – about 500 or 600 in total. “This is nothing,” compared to the likely scale of the cheating, they said.
Confidential briefing notes for CRA auditors reveal how the Canadian tax agency is targeting unreported global income and other issues related to real estate sales in the Vancouver region. Photo: SCMP Pictures
That estimate is in keeping with the briefing text which says the crackdown will “review the top 500 highest risk files within our region”.
The briefing lists four areas being targeted for audit under the CRA’s “real estate projects”, launched in response to “significant media attention”: unreported worldwide income, property “flipping”, under-reporting of capital gains from home sales, and under-reporting of Goods and Services Tax (GST) on sales of new homes.
‘High-end homes, minimal income’
The time-consuming global income audits will tackle “individuals living in high-valued areas in BC who are reporting minimal income not supporting their lifestyle”, as well as those who buy “high-end homes with minimal income being reported.”
The supposed case of a C$5.8 million home bought by someone who claimed a tax break intended for the poor is cited in the CRA briefing. Photo: SCMP Pictures
The presentation includes a photo of a luxury home supposedly bought for C$5.8million whose owner claimed the “working income tax benefit” for low earners. It also lists the tuition fees of Vancouver private schools.
Confidential briefing notes for CRA auditors show that 50 income tax auditors are being redeployed to tackle real estate cheats in BC. Photo: SCMP Pictures
Property flippers who swiftly resell homes for profit will meanwhile be audited to see if their properties truly qualify for exemption from capital gains tax, granted to people selling their principal residence.
The briefing describes various excuses given by owners who moved out of newly purchased homes, including a negative feng shui report, the “bad omen” of tripping over a crack in the sidewalk, and a painter dying in the home.
It cites the highly publicized case of a well-kept 20-year-old, C$6million mansion that was simply torn down after being bought, prompting community outrage.
Yes, we are getting a response now, but the government has known about this issue for a few years. They held back
CRA employee
The briefing does not say the owners of this home, or the $5.8 million home, are tax cheats and nor does the SCMP suggest so.
The CRA employee said the briefing, which was streamed online, was delivered by CRA’s Pacific region business intelligence director, Mal Gill.
The CRA briefing lists various excuses given by people who moved out of new homes, apparently claimed as principal residences. Photo: SCMP Pictures
Gill declined to discuss the briefing. “I cannot confirm anything to you,” he said, referring the SCMP to a CRA communications manager.
The case of a well-kept C$6million Vancouver home that was simply demolished after purchase is cited in leaked notes for Canadian tax auditors. Photo: SCMP Pictures
A spokeswoman said: “The CRA cannot comment or release information related to risk assessment or non-compliance strategies.”
However, she said real estate transactions in Toronto have been the subject of greater scrutiny, for some years. “More recently, the CRA has been actively monitoring and auditing real estate transactions in British Columbia,” she said.
“For the year ending March 31, 2016, the CRA completed 2,203 files [in BC and Ontario] related to real estate,” she said.
In addition to the 50 redeployed income auditors, the leaked briefing says CRA is assigning 20 GST auditors and 15 other staff to the real estate project in BC.
The CRA source said they leaked the material because, “like many people, I’m pretty disgusted by what’s happening here [in the Vancouver real estate market], and a lack of enforcement has been a part of the problem. Yes, we are getting a response now, but the government has known about this issue for a few years. They held back.”
The CRA briefing reveals that there was just one successful audit conducted on unreported global income in BC last fiscal year. Photo: SCMP Pictures
The employee said they were surprised to discover that only one successful audit of global income had been conducted in BC in the year to March 31. “That’s the ludicrousness of this. I was shocked when I saw this, and they only got C$27,000 in tax revenue out of it,” they said.
Asked whether this might show a widespread problem with undeclared worldwide income did not exist in BC, the source said: “No, what it shows is that inadequate people and resources have been put to the task. These [tax cheats] are highly sophisticated individuals, with good representation from their lawyers and accountants, and we are sending out our least experienced people to catch them. That’s the problem.”
Source cites CRA’s ‘racism fear’
Census data from 2011 has previously shown that 25,000 households in the City of Vancouver spent more on their housing costs than their entire declared income, with these representing 9.5 per cent of all households.
But far from being impoverished, such households were concentrated in some of the city’s most expensive neighborhoods, where homes sell for multi-million-dollar prices.
The source suggested CRA bureaucrats previously feared being labelled racist if they targeted low-income declarers buying real estate “because the vast majority of these cases, involving high real estate values, involve mainland Chinese”.
The crackdown was not intended for public knowledge, and instead was to satisfy “people from high up” in the CRA and government who wanted to know “what are you guys doing about this…there’s stuff hitting the papers every day”, the source said. Yet the briefing says the crackdown “will not address the major concerns about affordability of real estate”.
“The vast majority of these [undeclared global income] cases, involving high real estate values, involve mainland Chinese”
CRA employee
The source said there had previously been little done to check whether taxpayers were secretly living and working abroad while supporting a family in Vancouver. “There’s virtually no liaising done with immigration. The common auditor would never check when people are actually coming and going, to check whether they might be going back to China or wherever to work. You can be lied to, to your face: ‘Oh no, I live here [in Canada] full-time’.”
The leaked documents show that in in addition to the single audit on global income in the last fiscal year, CRA in BC conducted 93 successful audits on property flips, 20 on capital gains tax and 225 on under-reported GST. The audits yielded C$14.4 million in new tax, of which C$10million was GST. There was C$1.3 million in fines.
As of April 29, there were 40 audits of global income under way, 205 related to flipping, 34 related to capital gains and 428 related to GST.
The average Vancouver house price now sits around C$1.75million for the metropolitan region, while the Real Estate Board of Greater Vancouver’s “benchmark” price for all residential properties is C$889,100, a 30 per cent increase over the past year. However, incomes remain among the lowest in Canada, making Vancouver one of the world’s most un-affordable cities .
The Hongcouver blog is devoted to the hybrid culture of its namesake cities: Hong Kong and Vancouver. All story ideas and comments are welcome. Connect with me by email ian.young@scmp.com or on Twitter, @ianjamesyoung70
This article appeared in the South China Morning Post print edition as:
Bolstered by first-time home buyers, existing-home sales rose for the fourth straight month in June, reaching a nine-year high.
Sales of existing single-family homes, townhomes, condominiums and co-ops increased 1.1% to a seasonally adjusted annual rate of 5.57 million, up from May’s downwardly revised 5.51 million, the National Association of Realtors said Thursday. The June pace was the strongest since 2007.
First-time buyers made up 33% of those transactions, the biggest share in four years. That eased concerns that a shortage of affordable houses has been pushing entry-level buyers out of the market.
The median existing-home price also reached a new high as it surged 4.8% to $247,700 from a year ago, above the former peak of $238,900 in May.
June’s sales exceeded the highest forecast of economists polled by Bloomberg, 5.56 million.
Healthy job gains, record-high stock prices and near-record low mortgage rates stoked June’s positive showings, said Lawrence Yun, chief economist at the National Association of Realtors.
“The modest bump in June sales to first-time buyers can be attributed to mortgage rates near all-time lows and perhaps a hopeful indication that more affordable, lower-priced homes are beginning to make their way onto the market,” he said. “The odds of closing on a home are definitely higher right now for first-time buyers living in metro areas with tamer price growth and greater entry-level supply — particularly areas in the Midwest and parts of the South.”
The Midwest has the lowest median existing-home price among all regions, $199,900, followed by the South, at $217,400. The median price in the West climbed 7.2% from a year ago to $350,800.
Total available existing homes for sale dipped 0.9% to 2.12 million, now 5.8% below a year ago.
“Seasonally adjusted, the month’s supply of homes in June 2016 was the lowest since June 2005, indicating that inventory problems still plague home buyers,” said Ralph McLaughlin, Trulia’s chief economist.
In Central London – the 30 most central postal codes and one of the most ludicrously expensive housing markets in the world – eager home sellers are slashing their asking prices to unload their properties. But even that isn’t working.
In the 12 days after the Brexit vote, cuts to asking prices have soared by 163% compared to the 12 days before the vote, according to the Financial Times. Yet sales have plunged 18% from before the Brexit vote. Sales had already taken a big beating before then and are now down a mind-boggling 43% from where they’d been a year ago!
So Brexit did it?
Um, well, sort of. But it’s more than Brexit. Home prices on a £-per-square-foot basis had peaked in Q2 2014, according to real-estate data provider LonRes. Since then, the market in Central London has been hissing hot air. By Q1 2016, prices for homes above £5 million had dropped 8% from their 2014 peak, and prices for homes from £2 million to £5 million had plunged 10%.
Back in December 2015, we reported that luxury housing in London was getting mauled, based on the LonRes report for the third quarter, released at the time. It pointed the finger at folks who, once “awash with cash, don’t have as much to spend” [read… It Gets Ugly in the Toniest Parts of London].
Then, in its spring review, LonRes called the prime London housing market “challenging.”
It wasn’t just the Brexit referendum and the new stamp duty – In 2014, a change in the stamp duty made buying high-end homes more costly; and in April this year, an additional duty was imposed on purchases beyond a primary residence. Now there’s a third reason, and it originates deep from the bowels of the UK economy. LonRes:
A third is now making itself known to us as it is not something that the chancellor can bury any more. This is the balance of payments which ran at 5.2% of GDP last year and was the largest annual deficit since records began in 1948.
If measures are not taken to bring this under control, then the mini experiment to deflate the London property bubble will seem small change compared to the £32.7bn deficit that exists.
The London residential market has undoubtedly slowed, and this is impacting prices. No one will disagree that London’s prime market needed the steam to be released from it. My guess is that this slower market will be here for some time.
And not just in London…
Last week, the Royal Institution of Chartered Surveyors was spreading gloom with its residential market survey of the UK, conducted after the Brexit vote, that found, as the Telegraph put it, “The number of people wanting to buy a house has fallen to the lowest level since mid-2008 amid post-referendum uncertainty.”
Lucian Cook, head of residential research at Savills, told the Telegraph:
“The current month’s figures suggest countrywide impact on sentiment which is to be expected. However previous months’ results would indicate that a slowdown in London has been on the cards for some time. It looks like the Brexit vote may be the trigger for this to materialize.”
Now all hopes are once again centered on foreigners and their money to bail out the housing bubble before it completely implodes. But this time, it’s different, as they say at the worst possible moment: it’s not the Russians or the Chinese, but people whose investments and incomes are in currencies linked to the US dollar. Over the last 12 months, the pound has lost about 14% against the dollar, most of it since the Brexit vote, which would give these folks an additional discount on UK real estate.
The Financial Times expressed those industry hopes, and its new saviors, citing Anthony Payne, managing director at LonRes:
“We have heard that quite a number of Middle Eastern buyers have been coming back into the market. A lot of them are converting from dollars, and together with any discount they get [plunging prices], the saving in the actual price is quite substantial,” said Mr. Payne. “Some people are concerned by Brexit – others see it as an opportunity.”
London isn’t the only ludicrously overpriced housing market, where prices, once helped along by foreign money, are skidding. And now the industry is hoping for more foreign money to wash ashore, just when the Chinese, by far the largest group of investors in the US housing market, are getting cold feet.
Pending home sales slipped in May after three months of gains as demand outstrips supply amid rising prices.
The National Association of Realtors said Wednesday that its pending home sales index, a forward-looking indicator based on contract signings, slid 3.7 percent to 110.8 in May, from 115 in April.
While the reading is still the third highest in the past year, the contract signings declined year-over-year for the first time since August 2014.
All four major regions also saw a decrease in contract activity last month.
“With demand holding firm this spring and homes selling even faster than a year ago, the notable increase in closings in recent months took a dent out of what was available for sale in May and ultimately dragged down contract activity,” said Lawrence Yun, NAR chief economist.
“Realtors are acknowledging with increasing frequency lately that buyers continue to be frustrated by the tense competition and lack of affordable homes for sale in their market,” Yun said.
Meanwhile, mortgage rages are hovering around three-year lows — below 4 percent — keeping prospective buyers in the market despite the headwinds.
Together, scant supply and swiftly rising home prices — which surpassed their all-time high last month — are creating an availability and affordability crunch that is weighing on the pace of sales, Yun said.
“Total housing inventory at the end of each month has remarkably decreased year-over-year now for an entire year,” Yun said.
“There are simply not enough homes coming onto the market to catch up with demand and to keep prices more in line with inflation and wage growth,” he said.
The United Kingdom’s decision to leave the European Union has injected some uncertainty into the U.S. housing market; the turbulence in financial markets and a shift into safer investments like Treasuries could lead to lower mortgage rates.
The flip side, though, is that any “prolonged market angst” could negatively affect the economy and temper the interest from potential buyers.
Despite the pullback in contract signings, existing-home sales this year are still expected to reach 5.44 million, 3.7 percent above 2015.
After accelerating to 6.8 percent a year ago, national median existing-home price growth is forecast to moderate to between 4 and 5 percent.
Regionally, contract signings fell in the Northeast 5.3 percent, the index in the Midwest slipped 4.2 percent, signings dropped 3.1 percent in the South and by 3.4 percent in the West.
April was not a good month for home prices – despite hopeful signs from seasonally adjusted sales data. S&P Case-Shiller 20-City index rose just 0.45% MoM (well below expectations and March’s 0.85% gain) – the weakest rise since Aug 2015. The broader Home Price Index hovered near unchanged for the 2nd month – the weakest since January 2012. Most worrisome, perhaps, is the 18.16% YoY plunge in San Francisco home sales… as perhaps the bubble is finally bursting.
Home ownership is at a 48-year low, driven in part by a shocking pattern of foreclosure that put 9.4 million out of their homes during the recent recession, according to a Harvard survey.
In its “State of the Nation’s Housing 2016,” Harvard said that “the U.S. homeownership rate has tumbled to its lowest level in nearly a half-century.”
Figures from the St. Louis Fed showed a home ownership rate of 63.5 percent. The last time it was lower was in 1967.
“A critical but often overlooked factor is the role of foreclosures in depleting the ranks of homeowners. Indeed, CoreLogic estimates that more than 9.4 million homes (the majority owner-occupied) were forfeited through foreclosures, short sales, and deeds-in-lieu of foreclosure from the start of the housing crash in 2007 through 2015,” said the report.
The report also noted that the number of people using at least 30 percent of their income for housing rose, as our Joseph Lawler reported this week. It said, “40.9 million Americans, both homeowners and renters, spend more than 30 percent of their income on housing, including 19.8 million who spend over half of their income for housing.”
At the same time, said Harvard, the drive for the American Dream has been braked by low incomes, higher prices and bad credit.
Harvard:
“Just as exits from homeownership have been high, transitions to owning have been low. Tight mortgage credit is one explanation, with essentially no home purchase loans made to applicants with subprime credit scores (below 620) since 2010 and a sharp retreat in lending to applicants with scores of 620–660 compared with the early 2000s. And given that the homeownership rate tends to move in tandem with incomes, the 18 percent drop in real incomes among 25–34 year olds and the 9 percent decline among 35–44 year olds between 2000 and 2014 no doubt played a part as well.”
Apparently the biggest banks in the US didn’t learn their lesson the first time around…
Because a few days ago, Wells Fargo, Bank of America, and many of the usual suspects made a stunning announcement that they would start making crappy subprime loans once again!
I’m sure you remember how this all blew up back in 2008.
Banks spent years making the most insane loans imaginable, giving no-money-down mortgages to people with bad credit, and intentionally doing almost zero due diligence on their borrowers.
With the infamous “stated income” loans, a borrower could qualify for a loan by simply writing down his/her income on the loan application, without having to show any proof whatsoever.
Fraud was rampant. If you wanted to qualify for a $500,000 mortgage, all you had to do was tell your banker that you made $1 million per year. Simple. They didn’t ask, and you didn’t have to prove it.
Fast forward eight years and the banks are dusting off the old playbook once again.
Here’s the skinny: through these special new loan programs, borrowers are able to obtain a mortgage with just 3% down.
Now, 3% isn’t as magical as 0% down, but just wait ‘til you hear the rest.
At Wells Fargo, borrowers who have almost no savings for a down payment can actually qualify for a LOWER interest rate as long as you go to some silly government-sponsored personal finance class.
I looked at the interest rates: today, Wells Fargo is offering the exact same interest rate of 3.75% on a 30-year fixed rate, whether you have bad credit and put down 3%, or have great credit and put down 30%.
But if you put down 3% and take the government’s personal finance class, they’ll shave an eighth of a percent off the interest rate.
In other words, if you are a creditworthy borrower with ample savings and a hefty down payment, you will actually end up getting penalized with a HIGHER interest rate.
The banks have also drastically lowered their credit guidelines as well… so if you have bad credit, or difficulty demonstrating any credit at all, they’re now willing to accept documentation from “nontraditional sources”.
In its heroic effort to lead this gaggle of madness, Bank of America’s subprime loan program actually requires you to prove that your income is below-average in order to qualify.
Think about that again: this bank is making home loans with just 3% down (because, of course, housing prices always go up) to borrowers with bad credit who MUST PROVE that their income is below average.
[As an aside, it’s amazing to see banks actively competing for consumers with bad credit and minimal savings… apparently this market of subprime borrowers is extremely large, another depressing sign of how rapidly the American Middle Class is vanishing.]
Now, here’s the craziest part: the US government is in on the scam.
The federal housing agencies, specifically Fannie Mae, are all set up to buy these subprime loans from the banks.
Wells Fargo even puts this on its website: “Wells Fargo will service the loans, but Fannie Mae will buy them.” Hilarious.
They might as well say, “Wells Fargo will make the profit, but the taxpayer will assume the risk.”
Because that’s precisely what happens.
The banks rake in fees when they close the loan, then book another small profit when they flip the loan to the government.
This essentially takes the risk off the shoulders of the banks and puts it right onto the shoulders of where it always ends up: you. The consumer. The depositor. The TAXPAYER.
You would be forgiven for mistaking these loan programs as a sign of dementia… because ALL the parties involved are wading right back into the same gigantic, shark-infested ocean of risk that nearly brought down the financial system in 2008.
Except last time around the US government ‘only’ had a debt level of $9 trillion. Today it’s more than double that amount at $19.2 trillion, well over 100% of GDP.
In 2008 the Federal Reserve actually had the capacity to rapidly expand its balance sheet and slash interest rates.
Today interest rates are barely above zero, and the Fed is technically insolvent.
Back in 2008 they were at least able to -just barely- prevent an all-out collapse.
This time around the government, central bank, and FDIC are all out of ammunition to fight another crisis. The math is pretty simple.
Look, this isn’t any cause for alarm or panic. No one makes good decisions when they’re emotional.
But it is important to look at objective data and recognize that the colossal stupidity in the banking system never ends.
So ask yourself, rationally, is it worth tying up 100% of your savings in a banking system that routinely gambles away your deposits with such wanton irresponsibility…
… especially when they’re only paying you 0.1% interest anyhow. What’s the point?
There are so many other options available to store your wealth. Physical cash. Precious metals. Conservative foreign banks located in solvent jurisdictions with minimal debt.
You can generate safe returns through peer-to-peer arrangements, earning up as much as 12% on secured loans.
(In comparison, your savings account is nothing more than an unsecured loan you make to your banker, for which you are paid 0.1%…)
There are even a number of cryptocurrency options.
Bottom line, it’s 2016. Banks no longer have a monopoly on your savings. You have options. You have the power to fix this.
German, Japanese, and British bond yields are plumbing historic depths as low growth outlooks combined with event risk concerns (Brexit, elections, etc.) have sent investors scurrying for safe-havens (away from US Biotechs).
At 2.0bps, 10Y Bunds are inching ever closer to the Maginot Line of NIRP which JGBs have already crossed, and all of this global compression is dragging US Treasury yields to their lowest levels since February’s flash-crash… back below 10Y’s lowest close level since 2013.
As Bloomberg reports, the rush into government bonds during 2016 shows no sign of reversing as a weakening global economic outlook fuels demand for perceived havens.
Bonds are off to their best start to a year since at least 1997, according to a broad global gauge of investment-grade debt that has gained 4.6 percent since the end of December, based on Bank of America Corp. data. They rallied most recently after the weakest U.S. payrolls data in almost six years was reported June 3, damping expectations the Federal Reserve will raise interest rates in the next few months.
At the same time, polls indicate Britain’s vote on remaining or exiting the European Union is too close to call. Billionaire investor George Soros was said to be concerned large market shifts may be at hand.
“The environment is fundamentally supportive of these low yields, and there is nothing in sight, at least in the short term, that could trigger a trend reversal,” said Marius Daheim, a senior rates strategist at SEB AB in Frankfurt. “The labor market report was one thing which has driven the Treasury market and has supported other markets. If you look in the euro zone, you have Brexit risks that have risen recently, and that is also creating safe-haven flows.”
10Y Japanese Government bonds plunged to record lows at -15bps!
With Gilts down 9 days in a row…
The World Bank this week cut its outlook for global growth as business spending sags in advanced economies including the U.S., while commodity exporters in emerging markets struggle to adjust to low prices.
The yield on the Bloomberg Global Developed Sovereign Bond Index dropped to a record 0.601 percent Thursday.
The dollar extended its slide for a second day as traders ruled out the possibility that the Federal Reserve will raise interest rates at its meeting next
The currency fell against all of its major peers, depressed by tepid U.S. job growth and comments by Fed Chair Janet Yellen that didn’t signal timing for the central bank’s next move. Traders see a zero percent chance the Fed will raise rates at its June 15 meeting, down from 22 percent a week ago, futures contracts indicate. The greenback posted its largest losses against the South African rand, the Mexican peso and the Brazilian real.
“There’s a bias to trade on the weaker side in the weeks to come” for the dollar, which will probably stay in its recent range, said Andres Jaime, a foreign-exchange and rates strategist at Barclays Plc in New York. “June and July are off the table — the probability of the Fed deciding to do something in those meetings is extremely low.”
The greenback resumed its slide this month as a lackluster jobs report weakened the case for the Fed to boost borrowing costs and dimmed prospects for policy divergence with stimulus increases in Europe and a Asia. The losses follow a rally in May, when policy makers including Yellen said higher rates in the coming months looked appropriate.
The Bloomberg Dollar Spot Index declined 0.5 percent as of 9:31 a.m. New York time, reaching the lowest level since May 4. The U.S. currency slipped 0.4 percent against the euro to $1.1399 and lost 0.5 percent to 106.83 yen.
There’s a 59 percent probability the central bank will hike by year-end, futures data showed. The Federal Open Market Committee will end two-day meeting on June 15 with a policy statement, revised economic projections and a news conference.
“Until the U.S. economy can make the case for a rate rise, the dollar will be at risk of slipping further,” said Joe Manimbo, an analyst with Western Union Business Solutions, a unit of Western Union Co., in Washington. The Fed’s “economic projections are going to be key, as well as Ms. Yellen’s news conference — if they were to sketch an even shallower path of rate rises next week, that would add fuel to the dollar’s selloff.”
The local market in March posted 12.3% year-over-year gains in home values, which was the largest increase by a significant margin among the 20 metro areas surveyed. Seattle (10.8%) and Denver (10%) were the only other two regions to post double-digit annual gains.
“It remains a tough home buying season for buyers, with little inventory available among lower-priced homes,” said Svenja Gudell, chief economist at Zillow, in an email. “The competition is locking out some first-time buyers, who instead are paying record-high rents.”
Portland’s inventory has been historically low recently. The latest report from the local Regional Multiple Listing Service showed inventory at a miniscule 1.4 months in April. The figure estimates how long it would take for all current homes on the market to sell at the current pace. (Six months of inventory indicates a balanced market.)
Prices have also reached record highs; the average sale price in the Portland area was $397,700 in April and the median reached $350,000.
Nationally, home values in March posted annual gains of 5.2%, the Case-Shiller report found, down from 5.3% the previous month.
“Home prices are continuing to rise at a 5% annual rate, a pace that has held since the start of 2015,” said David M. Blitzer, chairman of the index committee, in a news release. “The economy is supporting the price increases with improving labor markets, falling unemployment rates and extremely low mortgage rates.”
Blitzer added that the number of homes currently for sale is “less than two percent of the number of households in the U.S., the lowest percentage seen since the mid-1980s.”
“The Pacific Northwest and the west continue to be the strongest regions,” Blizter said.
Negative interest rate policies elsewhere hit US Treasury yields
The side effects of Negative Interest Rate Policies in Europe and Japan — what we’ve come to call the NIRP absurdity — are becoming numerous and legendary, and they’re fanning out across the globe, far beyond the NIRP countries.
No one knows what the consequences will be down the line. No one has ever gone through this before. It’s all a huge experiment in market manipulation. We have seen crazy experiments before, like creating a credit bubble and a housing bubble in order to stimulate the economy following the 2001 recession in the US, which culminated with spectacular fireworks.
Not too long ago, economists believed that nominal negative interest rates couldn’t actually exist beyond very brief periods. They figured that you’d have to increase inflation and keep interest rates low but positive to get negative “real” interest rates, which might have a similar effect, that of “financial repression”: perverting the behavior of creditors and borrowers alike, and triggering a massive wealth transfer.
But the NIRP absurdity has proven to be possible. It can exist. It does exist. That fact is so confidence-inspiring to central banks that more and more have inflicted it on their bailiwick. The Bank of Japan was the latest, and the one with the most debt to push into the negative yield absurdity — and therefore the most consequential.
But markets are globalized, money flows in all directions. The hot money, often borrowed money, washes ashore tsunami like, but then it can recede and dry up, leaving behind the debris. These money flows trigger chain reactions in markets around the globe.
NIRP is causing fixed income investors, and possibly even equity investors, to flee that bailiwick. They sell their bonds to the QE-obsessed central banks, which play the role of the incessant dumb bid in order to whip up bond prices and drive down yields, their stated policy. Investors take their money and run.
And then they invest it elsewhere — wherever yields are not negative, particularly in US Treasuries. This no-questions-asked demand from investors overseas has done a job on Treasury yields. That’s why the 10-year yield in the US has plunged even though the Fed got serious about flip-flopping on rate increases and then actually raised its policy rate, with threats of more to come.
So here are some of the numbers and dynamics — among the many consequences of the NIRP absurdity — by Christine Hughes, Chief Investment Strategist at OtterWood Capital:
Negative interest rate policies implemented by central banks in Europe and Japan have driven yields on many sovereign debt issues into negative territory.
If you look at the BAML Sovereign Bond index, just 6% of the bonds had negative yields at the beginning of 2015. Since then the share of negative yielding bonds has increased to almost 30% of the index, see below.
With negative yielding bonds becoming the norm, investors are instead reaching for the remaining assets with positive yields (i.e. US Treasuries). Private Japanese investors have purchased nearly $70 billion in foreign bonds this year with the sharpest increase coming after the BoJ adopted negative rates. Additionally, inflows into US Treasuries from European funds have increased since 2014:
“According to an analysis by Bank of America Merrill Lynch, for every $100 currently managed in global sovereign benchmarks, avoiding negative yields would result in roughly $20 being pushed into overweight US Treasuries assets,” wrote Christine Hughes of OtterWood Capital.
That’s a lot of money in markets where movements are measured in trillions of dollars. As long as NIRP rules in the Eurozone and Japan, US Treasury yields will become even more appealing every time they halfheartedly try to inch up just one tiny bit.
So China, Russia, and Saudi Arabia might be dumping their holdings of US Treasuries, for reasons of their own, but that won’t matter, and folks that expected this to turn into a disaster for the US will need some more patience: these Treasuries will be instantly mopped up by ever more desperate NIRP refugees.
In the wake of its recent $1.2 billion settlement with the government, whereby Wells Fargo admitted to deceiving the government into insuring thousands of risky mortgages (yet nobody went to jail), the bank has decided to break with the Federal Housing Administration and offer its own minimal down payment mortgage program.
The new program partners with Fannie Mae in order to allow borrowers with credit scores as low as 620 to make as little as a 3% down payment and use income from family members or renters to qualify. Naturally, the intent is to make more loans to low and middle-income borrowers – in the process pushing up home prices countrywide – without going through the FHA.
As a reminder, the FHA insures mortgages made to buyers who would otherwise have a hard time getting loans, but it has been shunned by banks following a wave of lawsuits by the Justice Department that alleged poor underwriting.
Wells Fargo made $6.3 billion in FHA-backed loans last year, and is a top 20 originator for the FHA according to the WSJ. It’s not just FHA however: as we have shown previously, Wells’ own mortgage origination pipeline has been slowing down in recent years, and as such the corner office of the country’s largest mortgage originator is desperate to find new and innovative ways to boost lending.
After being called out for its deceptive practices, the bank has scaled back on FHA backed mortgage lending in recent years. Wells Fargo accounted for just 2.5% of total FHA mortgages in 2015, down from 13% in 2010, and ultimately coming to this end game where the bank has a path forward without the FHA.
Self-Help Ventures Fund, based out of Durham, NC will now be taking the default risk on these low down payment mortgages originated by Wells Fargo.
Self-Help comprises a state and federally chartered credit union as well as the ventures loan fund, and has a total of $1.6 billion in assets. The “fund” has been partnering with Bank of America on insuring loans from their low down payment loan program since February, and has said it is on track to make between $300 million and $500 million in its BofA mortgage product within the first year.
As the WSJ explains, the new Wells Fargo product could save borrowers money
The new Wells Fargo product might save money for some borrowers who would have otherwise taken out an FHA-backed loan. For example, a borrower who buys a $200,000 home and has a credit score of 715 would pay about $1,040 a month with an FHA loan from Wells Fargo, assuming the borrower includes the FHA program’s upfront costs in the loan amount and makes a 3.5% down payment, the minimum the agency requires. The same borrower under the new program would pay about $994 a month with a 3% down payment.
By taking a housing-education course, the borrower could reduce the mortgage rate by an additional one-eighth of a percentage point, making the payment about $979 a month.
Fannie Mae Vice President of Product Development Jonathan Lawless expects other lenders to develop such programs as well, and that he expects the volume of low down-payment mortgages that Fannie backs to grow.
In summary, Wells Fargo didn’t like being taken to task on its deceptive actions and has decided to continue with risky mortgage origination, but shifting the risk to Self-Help instead of the FHA. This sounds like another New Century style lending blowup in the making, only this time one where there is a far more ambiguous relationship with the sponsor bank, in this case Wells Fargo.
Of course, the fact that the loans will be purchased by Fannie Mae means that the risk is still ultimately on the taxpayer if Self-Help is overwhelmed with defaults as happened during the last bubble, so one can probably say that the problem of taxpayers being once again exposed to risky subprime lending practices has just returned with a vengeance.
On the heels of the 17-sigma beat in new home sales, pending home sales soared 5.1% MoM in April – 6.5 standard deviations above economist estimates of a 0.7% jump. Pending home sales rose for the third consecutive month in April and reached their highest level in over a decade, according to the National Association of Realtors. All major regions saw gains in contract activity last month (with The West surging 11.5% MoM) except for the Midwest, which saw a meager decline.
Best month since 2010…
Which no one saw coming…. Some context for the “beat”…
Lawrence Yun, NAR chief economist, says vast gains in the South and West propelled pending sales in April to their highest level since February 2006 (117.4).
“The ability to sign a contract on a home is slightly exceeding expectations this spring even with the affordability stresses and inventory squeezes affecting buyers in a number of markets,” he said. “The building momentum from the over 14 million jobs created since 2010 and the prospect of facing higher rents and mortgage rates down the road appear to be bringing more interested buyers into the market.”
Yun expects sales this year to climb above earlier estimates and be around 5.41 million, a 3.0 percent boost from 2015. After accelerating to 6.8 percent a year ago, national median existing-home price growth is forecast to slightly moderate to between 4 and 5 percent.
The usually strong spring housing market could be far stronger this year, if only there were more homes for sale.
The number of listings continues to drop, as demand outstrips supply and potential sellers bow out, fearing they won’t be able to find something else to buy.
The inventory of homes for sale nationally in April was 3.6 percent lower than in April 2015, according to the National Association of Realtors. Redfin, a real estate brokerage, also recently reported a drop in new listings.
The supply numbers are even tighter in certain local markets: Inventory is down 32 percent in Portland, Oregon, from a year ago; down 22 percent in Kansas City; down 21 percent in Dallas and Seattle; down 17 percent in Charlotte, North Carolina; down 12 percent in Atlanta; down nearly 10 percent in Chicago; and down 8 percent in Los Angeles, according to Zillow. Houston and Miami are seeing big gains in supply, due to economic issues specific to those markets.
“The struggle will continue for home shoppers this summer,” said Zillow chief economist Svenja Gudell. “New construction has been sluggish over the past year; we’re building about half as many homes as we should be in a normal market. There still aren’t enough homes on the market to keep up with the high demand from every type of home buyer.”
The short supply is pushing home prices higher than expected this year. Zillow had predicted 2 percent growth in home values from April 2015 to April 2016, but its latest data show values currently soaring more than twice that, at 4.9 percent.
“In many markets, those looking to buy a home in the bottom or middle of the market will need to be prepared for bidding wars and homes selling for over the asking price. This summer’s selling season’s borders will most likely be blurred again, as many buyers are left without homes and will need to keep searching,” added Gudell.
The inventory drops are most severe in the lower-priced tier of the market. Homes in the top tier are seeing gains and therefore show more price cuts. Sixteen percent of top-tier homes had a price cut over the past year, compared with 11 percent of bottom-tier homes and 13 percent of middle-tier, according to Zillow.
Single-family existing home sales rose just 0.6% MoM in April with The South and The West regions seeing notable declines in sales (down 2.7% and down 1.7% respectively). What saved the headline print was a 10.3% surge in Condo sales – among the best monthly spikes since the crisis helped by a spike in sales in The Midwest – where prices are most affordable.
Condos saved the day:
While supply of single-family homes is rising, the demand was again all on condos:
The median price of existing homes:
Single-family home sales inched forward 0.6 percent to a seasonally adjusted annual rate of 4.81 million in April from 4.78 million in March, and are now 6.2 percent higher than the 4.53 million pace a year ago. The median existing single-family home price was $233,700 in April, up 6.2 percent from April 2015.
Existing condominium and co-op sales jumped 10.3 percent to a seasonally adjusted annual rate of 640,000 units in April from 580,000 in March, and are now 4.9 percent above April 2015 (610,000 units). The median existing condo price was $223,300 in April, which is 6.8 percent above a year ago.
Lawrence Yun, NAR chief economist, says April’s sales increase signals slowly building momentum for the housing market this spring.
“Primarily driven by a convincing jump in the Midwest, where home prices are most affordable, sales activity overall was at a healthy pace last month as very low mortgage rates and modest seasonal inventory gains encouraged more households to search for and close on a home,” he said.
“Except for in the West — where supply shortages and stark price growth are hampering buyers the most — sales are meaningfully higher than a year ago in much of the country.”
Regionally, the story is very mixed…
April existing-home sales in the Northeast climbed 2.8 percent to an annual rate of 740,000, and are now 17.5 percent above a year ago. The median price in the Northeast was $263,600, which is 4.1 percent above April 2015.
In the Midwest, existing-home sales soared 12.1 percent to an annual rate of 1.39 million in April, and are now 12.1 percent above April 2015. The median price in the Midwest was $184,200, up 7.7 percent from a year ago.
Existing-home sales in the South declined 2.7 percent to an annual rate of 2.19 million in April, but are still 4.3 percent above April 2015. The median price in the South was $202,800, up 6.5 percent from a year ago.
Existing-home sales in the West decreased 1.7 percent to an annual rate of 1.13 million in April, and are 3.4 percent lower than a year ago. The median price in the West was $335,000, which is 6.5 percent above April 2015.
The West is exhibiting a notable trend with low-end sales plunging and higher-end rising…
Which price buckets saw the most transactions:
And Y/Y transactions by bucket:
The NAR’s chief economy Larry Yun warns again:
“The temporary relief from mortgage rates currently near three-year lows has helped preserve housing affordability this spring, but there’s growing concern a number of buyers will be unable to find homes at affordable prices if wages don’t rise and price growth doesn’t slow.”
Finally, it is worth noting that since the data was better than expected, there was no scapegoating of “weather” this time.
Bay Area residents have had it with high costs and congestion.
According to a 1,000-person poll conducted by the Bay Area Council, a business-sponsored public policy advocacy group, about one-third of people living in the nine counties surrounding the San Francisco Bay are considering moving. According to SF Gate, council president and CEO Jim Wunderman called it the region’s “canary in a coal mine,” forewarning danger if nothing’s done to remedy the issues.
The poll found that 34% of Bay Area residents say that they are either strongly and somewhat likely to move away. While 54% say they have no plans to do so, only 31% feel strongly about staying.
Plans for relocation aside, there has been a considerable drop in optimism in recent years. About 40% of residents think that the area is headed in the right direction, compared to 55% last year and 57% the year before. Meanwhile, another 40% think that the Bay Area is “seriously off the wrong track.” Notably, optimism positively correlates with higher income.
Among our favorite indicators to write about is the GDP output gap. Today we update it with the latest Q1 2016 GDP data. We’ve written about it many times in the past (some recent examples: 09/30/2015, 12/27/2014, and 06/06/2014). It is the standard for representing economic slack in most other developed countries but is usually overlooked in the United States in favor of the gap between the unemployment rate and full employment (also called NAIRU (link is external). This is partially because the US Federal Reserve’s FOMC has one half of its main goal to promote ‘full employment’ (along with price stability) but it is also partially because the unemployment rate makes the economy look better, which is always popular to promote. In past US business cycles, these two gaps had a close linear relationship (Okun’s law (link is external) and so normally they were interchangeable, yet, in this recovery, the unemployment rate suggests much more progression than the GDP output gap.
The unemployment gap now, looked at on its face, would imply that the US is at full employment; i.e., the unemployment rate is 5% and full employment is considered to be 5%. Thus, this implies that the US economy is right on the verge of generating inflation pressure. Yet, the unemployment rate almost certainly overstates the health of the economy because of a sharp increase over the last many years of unemployed surveys claiming they are not involved in the workforce (i.e. not looking for a job). From the beginning of the last recession, November 2007, the share of adults claiming to be in the workforce has fallen by 3.0% of the adult population, or 7.6 million people of today’s population! Those 7.6 million simply claiming to be looking for a job would send the unemployment rate up to 9.4%!. In other words, this metric’s strength is heavily reliant on whether people say they are looking for a job or not, and many could switch if the economy was better. Thinking about this in a very simplistic way; a diminishing share of the population working still has to support the entire population and without offsetting higher real wages, this pattern is regressive to the economy. The unemployment rate’s strength misses this.
Adding to the evidence that the unemployment rate is overstating the health of the economy is the mismatch between the Bureau of Labor Statistics’ (BLS) household survey (unemployment rate) and the establishment survey (non-farm payroll number). Analyzing the growth in non-farm payrolls over the period of recovery (and adjusting for aging demographics) suggests that the US economy still has a gap to full employment of about 1.5 million jobs; this is the Hamilton Project’s Jobs Gap (link is external).
But, the labor market is a subset of the economy, and while its indicators are much more accessible and frequent than measurements on the entire economy, the comprehensive GDP output gap merits being part of the discussion on the economy. Even with the Congressional Budget Office (CBO) revising potential GDP lower each year, the GDP output gap (chart) continues to suggest a dis-inflationary economy, let alone a far away date when the Federal Reserve needs to raise rates to restrict growth. This analysis suggests a completely different path for the Fed funds rate than the day-to-day hysterics over which and how many meetings the Fed will raise rates this year. This analysis is the one that has worked, not the “aspirational” economics that most practice.
In an asset management context, US Treasury interest rates tend to trend lower when there is an output gap and trend higher when there is an output surplus. This simple, yet overlooked rule has helped to guide us to stay correctly long US Treasuries over the last several years while the Wall Street community came up with any reason why they were a losing asset class. We continue to think that US Treasury interest rates have significant appreciation ahead of them. As we have stated before, we think the 10yr US Treasury yield will fall to 1.00% or below.
Purchases of new homes unexpectedly declined in March for a third month, reflecting the weakest pace of demand in the West since July 2014.
Total sales decreased 1.5% to a 511,000 annualized pace, a Commerce Department report showed Monday. The median forecast in a Bloomberg survey was for a gain to 520,000. In Western states, demand slumped 23.6%.
Purchases rose in two regions last month, indicating uneven demand at the start of the busiest time of the year for builders and real estate agents. While new construction has been showing limited upside, cheap borrowing costs and solid hiring will help ensure residential real estate continues to expand.
“Housing is certainly not booming,” Jim O’Sullivan, chief U.S. economist at High Frequency Economics Ltd. in Valhalla, N.Y., said before the report. “Some people may be shut out of the market because lending standards are still tight. There may still be some reluctance to buy versus rent.”
Even so, “through the volatility, the trend is still more up than down, and we expect modest growth in sales,” he said.
Economists’ estimates for new-home sales ranged from 488,000 to 540,000. February purchases were revised to 519,000 from 512,000. The monthly data are generally volatile, one reason economists prefer to look at longer term trends.
The report said there was 90% confidence the change in sales last month ranged from a 13.5% drop to a 16.5% increase.
Sales in the West declined to a 107,000 annualized rate in March after surging 21.7% the previous month to 140,000. In the South, purchases climbed 5% to a 314,000 pace in March, the strongest in 13 months. Sales in the Midwest advanced 18.5%, the first gain in three months, and were unchanged in the Northeast.
The median sales price decreased 1.8% from March 2015 to $288,000.
There were 246,000 new houses on the market at the end of March, the most since September 2009. The supply of homes at the current sales rate rose to 5.8 months, the highest since September, from 5.6 months in the prior period.
From a year earlier, purchases increased 5.8% on an unadjusted basis.
New-home sales, which account for less than 10% of the residential market, are tabulated when contracts get signed. They are generally considered a timelier barometer of the residential market than purchases of previously owned dwellings, which are calculated when a contract closes, typically a month or two later.
Borrowing costs are hovering close to a three-year low, helping to bring house purchases within the reach of more Americans. The average rate for a 30-year fixed mortgage was 3.59% last week, down from 3.97% at the start of the year, according to data from Freddie Mac.
The job market is another source of support. Monthly payrolls growth averaged 234,000 in the past year, and the unemployment rate of 5% is near an eight-year low. Still, year-over-year wage gains have been stuck in a 2% to 2.5% range since the economic expansion began in mid-2009.
The market for previously owned homes improved last month, climbing 5.1% to a 5.33 million annualized rate, the National Association of Realtors reported April 20. Prices rose as inventories remained tight.
Even so, the market is getting little boost from first-time buyers, who accounted for 30% of all existing-home purchases, a historically low share, according to the group.
Recent data on home building has been less encouraging, although those figures are volatile month to month. New-home construction slumped in March, reflecting a broad-based retreat, a Commerce Department report showed last week. Home starts fell 8.8% to the weakest annual pace since October. Permits, a proxy for future construction, also unexpectedly dropped.
It seems the end really is nigh for the U.S. dollar.
And the mudfight for global dominance and currency war couldn’t be more ugly or dramatic.
The Saudis are now openly threatening to take down the U.S. economy in the ongoing fallout over collapsing oil prices and tense geopolitical events involving the 9/11 cover-up. The New York Times reports:
Saudi Arabia has told the Obama administration and members of Congress that it will sell off hundreds of billions of dollars’ worth of American assets held by the kingdom if Congress passes a bill that would allow the Saudi government to be held responsible in American courts for any role in the Sept. 11, 2001, attacks.
China’s shift to an official local-currency-based gold fixing is “the culmination of a two-year plan to move away from a US-centric monetary system,” according to Bocom strategist Hao Hong. In an insightfully honest Bloomberg TV interview, Hong admits that “by trading physical gold in renminbi, China is slowly chipping away at the dominance of US dollars.”
Putin also waits in the shadows, making similar moves and creating alliances to out-balance the United States with a growing Asian economy on the global stage.
Luke Rudkowski of WeAreChange asks “Is This The End of the U.S. Dollar?” in the video below.
He writes:
In this video Luke Rudkowski reports on the breaking news of both China and Saudi Arabia making geopolitical moves that could cause a U.S economic collapse and obliteration of the U.S hegemony petrodollar. We go over China’s new gold backed yuan that cannot be traded in U.S dollars and rising tension with Saudi Arabia threatening economic blackmail if their role in 911 is exposed.
Visit WeAreChange.org where this video report was first published.
The Federal Reserve, Henry Kissinger, the Rockefellers and their allies created the petrodollar and insisted upon the world using the U.S. dollar to buy oil, placing debt in American currency and entire countries under the yoke of the West.
But that paradigm has been crumbling as world order shifts away from U.S. hegemony.
It is a matter of when – not if – these events will change the U.S. financial landscape forever.
As SHTF has warned, major events are taking place, and no one can say if stability will be here tomorrow.
Stay vigilant, and prepare yourself and your family as best as you can.
While the outlook for overall economic growth is darkening, the housing market is expected to keep up its momentum in 2016, according to Freddie Mac’s April 2016 Economic Outlook released on Friday.
Freddie Mac revised downward its forecast for Q1 GDP growth from 1.8 percent down to 1.1 percent. The “advance” estimate for GDP growth in the first quarter will be released by the Bureau of Economic Analysis (BEA) on Thursday, April 28. The GDP grew at an annual rate of just 0.6 percent in the first quarter of 2015 but then shot up to 3.9 percent for Q2; for the third and fourth quarter, the real GDP grew at rates of 2.0 percent and 1.4 percent, respectively.
The first quarter for the last few years has been punctuated by slow economic growth. While some of this can be attributed to seasonality, Ten-X (then Auction.com) Chief Economist Peter Muoio said that last year’s dismal GDP showing in the first quarter could be attributed to the brutal winter which slowed economic activity, labor disagreements at a bunch of the West Coast ports that really slowed the flow of cargo in Q1, and low oil prices (though this was partially offset by lower gas prices which put more money in consumers’ pockets).
“We’ve revised down our forecast for economic growth to reflect the recent data for the first quarter, but our outlook for the balance of the year remains modestly optimistic for the economy,” Freddie Mac Chief Economist Sean Becketti said. “However, we maintain our positive view on housing. In fact, the declines in long-term interest rates that accompanied much of the recent news should increase mortgage market activity, particularly refinance.”
On the positive side, Freddie Mac expects the unemployment rate will fall back below 5 percent for 2016 and 2017 (last month it ticked back up to 5.0 percent after hovering at 4.9 percent for a couple of months). Reduced slack in the labor market will push wage gains above inflation, although the gains are expected to be only modest, according to Freddie Mac.
While the economic forecast for Q1 has grown darker, the forecast looks bright for housing in 2016, however.
“We expect housing to be an engine of growth,” Freddie Mac stated in the report. “Construction activity will pick up as we enter the spring and summer months, and rising home values will bolster consumers and help support renewed confidence in the remaining months of this year.”
Low mortgage rates have boosted refinance activity in the housing market during Q1. The 30-year fixed mortgage rate averaged 3.7 percent for the first quarter, which drove an increase for the 1-4 single-family originations estimate for 2016 up by $50 billion up to $1.7 billion. Rates are expected to bump up, however, and average 4 percent over the full year of 2016, according to Freddie Mac. House prices are expected to appreciate by 4.8 percent over 2016 and 3.5 percent for 2017; homeowner equity is expected to rise as a result of the home price appreciation, which could mean more refinance opportunities.
The low mortgage rates combined with solid job growth are expected to make 2016 the strongest year for home sales since the pre-crisis year of 2006 despite the persistently tight inventory of for-sale homes, according to Freddie Mac.
“Sales were slow in the first quarter, but trends in mortgage purchase applications remain robust and we expect home sales to accelerate throughout the second quarter of 2016 as we approach peak home buying season,” Freddie Mac said.
Click here to view the entire Freddie Mac Economic Outlook for April 2016.
The pessimists are already talking about 3% inflation later this year if energy prices don’t retreat. Most likely, Federal Reserve monetary experimentation will inflict a new great inflation on the U.S., although this is much more likely to occur in the next business cycle rather than the current one. Before that, we’ll get the shock of an economic slowdown — or even recession — which will exert some pause. So many households are right to ask whether their main asset will insulate them from this shock whenever it occurs. The answer from economic science is no.
House prices perform best during the asset-price inflation phase of the monetary cycle. During that period, low or zero rates stimulate investors to search for yield, which many do, shedding their normal skepticism. The growth in irrationality across many marketplaces is why some economists describe set price inflation as a “disease.” Usually, the housing and commercial real estate markets become infected by this disease at some stage.
Real estate markets are certainly not shielded from irrational forces. “Speculative stories” about real estate flourish and quickly gain popularity — whether it’s the ever-growing housing shortage in metropolitan centers; illicit money pouring into the top end from all over the world and high prices rippling down to lower layers of the market; or bricks and mortar (and land), the ultimate safe haven when goods and services inflation ultimately accelerates.
That last story defies much economic experience to the contrary. By the time inflation shock emerges, home prices have already increased so much in real terms under asset-price inflation that they cannot keep up with goods and services inflation, and may even fall in nominal terms. One thinks of the tale of the gold price in the Paris black market during World War II: prices hit their peak just before the Germans entered the city in May 1940 and never returned.
Real estate is only a hedge against high inflation if it is bought early on in the preceding asset-price inflation period. We can generalize this lesson. The arrival of high inflation is an antidote to asset-price inflation. That is, if it has not already reached its late terminal stage when speculative temperatures are falling across an array of markets.
To understand how home prices in real terms behave under inflation shock we must realize how, in real terms, they are driven by expectations of future rents (actual, or as given to homeowners); the cost of capital; and the profit from carry trade. All of these drivers have been operating in the powerful asset-price inflation phase the U.S. and many foreign countries have been experiencing during recent years.
Together they have pushed up the S&P Case Shiller national home price index to almost 20% above its long-run trend (0.6% each year since 1998), having fallen slightly below at its trough in 2011, and having reached a peak 85% above in 2006.
The cost of equity is low, judging by high underlying price earnings ratios in the stock markets. Investors suffering from interest income famine are willing to put a higher price on future earnings, whether in the form of house rents or corporate profits, than they would do under monetary stability.
Leveraged owners of real estate can earn a handsome profit between rental income and interest paid, especially taking account of steady erosion of loan principal by inflation and tax deductions.
The arrival of high inflation would change all these calculations.
Cost of equity would rise as markets feared the denouement of recession, and reckoned with the new burden on economic prosperity. Long-term interest rates would climb starkly in nominal terms. Their equivalent in real terms would be highly volatile and unpredictable, albeit at first low in real terms (inflation-adjusted), meaning that carry trade income for leveraged owners would become elusive.
None of this is to suggest that a high inflation shock is likely in the second quarter. A sustained period of much stronger demand growth across an array of goods, services and labor markets would most likely have to occur first, and could be seen as early as the next cyclical upturn.
An economic miracle could bring a reprieve from inflation. But much more likely, the infernal inflation machine of expanding budget deficits and Fed experimentation will ultimately mow down any resistance in its way.
Several months ago, a chart produced by one of the Big Banks was presented to readers . It was supposed to be innocuous data on global wealth distribution, but instead portrayed a horrifying picture.
The focal point of the aforementioned article was that when it came to “the world’s poorest people,” the Corrupt West has now produced a greater percentage of severe poverty in its own populations than in India, and an equal percentage of such poverty as exists in Africa.
Stacked beside this, we see that when it comes to the richest-of-the-rich, the Corrupt West remains in a league of its own. Supposedly, we are living in “the New Normal,” where life is supposed to get increasingly harder and harder. So why does the New Normal never affect those on top?
Of course all of these extremely poor people being manufactured by our governments (as these regimes give away our jobs, destroy wages, and eviscerate our social programs) have to come from somewhere. Certainly they don’t come from the Wealthy Class.
Indeed, the chart above provides us with a crystal-clear view of where all these poor and very-poor people are coming from: the near-extinct Middle Class. In order to manufacture hundreds of millions of impoverished citizens in our nations, the Old World Order has had to engage in a campaign to end the Middle Class.
We are conditioned to consider economic “classes” within our own societies, but with the chart above, we’re given a global perspective. Where does the Middle Class exist today, globally? At the upper end, it exists in China, and to a lesser extent, in Latin America and other Asian nations. At the lower end of the Middle Class, we see such populations growing in India and even Africa.
Only in the West, and especially North America, is the Middle Class clearly an endangered species. Two incredibly important aspects of this subject are necessary to cover:
1) How and why has the One Bank chosen to perpetrate Middle Class genocide?
2) What are the consequences of the Death of the Middle Class?
Attempting to catalogue the nearly infinite number of ways in which the oligarchs of the One Bank have perpetrated their Middle Class genocide is impractical. Instead, discussion will be limited to the five most important programs responsible for the Death of the Middle Class: three of them relatively new, and two of them old.
a) Globalization
b) Union decimation/wage destruction
c) Small business decimation
d) Money-printing/inflation
e) Income taxation
Globalization was rammed down our throats in the name of “free trade,” the Holy Grail of charlatan economists . But, as previously explained, real free trade is a world of “comparative advantage” where all nations play by a fair-and-equal set of rules. Without those conditions, “free trade” can never exist.
The globalization that has been imposed upon us is, instead, a world of “competitive devaluation,” a corrupt, perpetual, suicidal race to the bottom. The oligarchs understood this, given that they are the perpetrators. The charlatan economists were too blinded by their own dogma to understand this. And, as always, the puppet politicians simply do what they are told.
Next on the list: union decimation and wage destruction are inseparable subjects, virtually the flip side of the same coin. “But wait,” shout the right-wing ideologues, “unions are corrupt, everyone knows that.”
Really? Corrupt compared to whom? Are they “corrupt” standing next to the bankers, who have stolen all our wealth ? Are they “corrupt” standing next to their Masters, the oligarchs who are hoarding all our stolen wealth ? Are they “corrupt” standing next to our politicians, who betrayed their own people to facilitate this economic pillaging? No, compared to any of those groups, unions (back when they still existed) were relative choir-boys.
When it comes to corruption, nobody plays the game as well as those on top. Compared to the Fat Cats, everyone else are rank amateurs. When unions were strong and plentiful, everyone had jobs. Almost everyone earned a livable wage (or better). Gee, weren’t those terrible times! Look how much better off we are now, without all those “corrupt unions.”
The other major new component in the deliberate, systemic slaughter of the Middle Class was and continues to be Small Business decimation. “Small business is the principal job-creator in every economy.” Any politician who ever got elected can tell you that.
If this is so, why do our corrupt governments funnel endless trillions of dollars of Corporate Welfare (our money) into the coffers of Big Business, while complaining there is nothing left to support Small Business? Why do our governments stack the deck in all of our regulations and bureaucracies, greasing the wheels for Big Business and strangling Small Business in their red tape?
Why do our governments refuse to enforce our anti-trust laws? One of the primary reasons for not allowing the corporations of Big Business to grow to an illegal size is because these monopolies and oligopolies make “competition” (meaning Small Business) impossible. One might as well try to start a small business on the Moon.
Then we have the oligarchs’ “old tricks” for stealing from the masses (and fattening themselves): banking and taxation. Of course, to the oligarchs, “banking” means stealing, and you steal by printing money. As many readers are already aware, “inflation” is money-printing – the increase (or inflation) of the supply of money.
“In the absence of the gold standard, there is no way to protect savings [i.e. wealth] from confiscation through inflation”
Remove the Golden Handcuffs , as central banker Paul Volcker bragged of doing in 1971, and then it’s just print-and-steal – until the whole fiat currency Ponzi scheme implodes.
Then of course we have income taxation: 100 years of systemic thievery. No matter what the form or structure, by its very nature every system of income taxation will:
i) Provide a free ride to those at the very, very top
ii) Be revenue-neutral to the remainder of the wealthy
iii) Relentlessly steal out of the pockets of everyone else (via over-taxation)
This is nothing more than a matter of applying simple arithmetic. However, many refuse to educate themselves on how they are being robbed in this manner, year after year, so no more will be said on the subject.
These were the primary prongs of the oligarchs’ campaign to exterminate the Middle Class. As always, skeptical readers will be asking “why?” The answer is most easily summarized via The Bankers’ Manifesto of 1892 . This document was presented to the U.S. Congress in 1907 by Republican congressman, and career prosecutor, Charles Lindbergh Sr.
It reads, in part:
The courts must be called to our aid, debts must be collected, bonds and mortgages foreclosed as rapidly as possible.
When through the process of law, the common people have lost their homes they will be more tractable and easily governed through the influence of the strong arm of government applied to a central power of imperial wealth under the control of the leading financiers [the oligarchs]. People without homes won’t quarrel with their leaders.
We have “the strong arm of government.” The oligarchs saw to that by bringing us their “War on Terror.” When it comes to throwing people out of their homes, and creating a population of serfs, that’s a two-part process.
Step 1 is to manufacture artificial housing bubbles across the Western world, and then crash those bubbles. However, this is only partially effective in turning Homeowners into Homeless. To truly succeed at this requires Step 2: exterminating the Middle Class. A Middle Class can survive a collapsing housing bubble, assuming they remained reasonably prudent. The Working Poor cannot.
Finally, after more than a century of scheming, the oligarchs have all of their pieces in place. In the U.S., they’ve even already built many gulags – to warehouse these former Middle Class homeowners – since a large percentage of those people are armed.
This brings us to one, final point: the consequences of the Death of the Middle Class. What happens when you destroy the foundation of a house? Just look.
As readers have been told on many previous occasions, the “velocity of money” is effectively the heartbeat of an economy. It is another way of representing the economics principle known as the Marginal Propensity to Consume, probably the most important principle of economics forgotten by charlatan economists.
The principle is a simple one, since it is half basic arithmetic and half common sense. Unfortunately, these are both skills beyond the grasp of charlatan economists. If you take all of the money out of the pockets of the People, and you stuff it all into the vaults of the wealthy (where it sits in idle hoards), then there is no “capital” for our capitalist economies – and these economiesstarve to death.
What is the response of the oligarchs to the relentless hollowing-out of our economies? They have ordered the puppet politicians to impose Austerity: taking even more money out of the pockets of the people. It is the equivalent to someone with anorexia going to a doctor, and the doctor imposing a severe diet on the patient (i.e. victim). The patient will not survive.
The Middle Class is dying. Unlike the oligarchs’ Big Banks, we are not “too big to fail.”Our jobs are gone. Our unions are gone. Our Middle Class wages are gone. Very soon, our homes will be gone. But don’t worry! It’s just the New Normal.
The next housing crisis is here and this time it is all about one thing: supply.
Following the mid-aughts housing bubble that saw homeowners across the country get themselves upside down in homes and mortgages they couldn’t ever afford to repay — a crisis that was as much about too much supply as it was about too much bad financing — the market has gone the complete other direction.
First-time home buyers are crowded out, with Trulia’s chief economist Ralph McLaughlin writing Monday that the number of starter homes on the market has declined 43.6% in the last four years.
Homeowners that want to move from a starter home to something better can’t afford the next step. McLaughlin notes that the number of “trade-up” homes on the market is also down about 40% over the same period.
And as investors look for places to earn whatever return on capital they can muster, the low-end of the housing market has almost ceased to exist as the investor class has bought up homes with the plan to flip them.
On Monday, the latest report on existing home sales showed the pace of sales fell 7.1% to an annualized rate of 5.08 million in February. Compared to last year, the pace of sales is still up 2.2% from a year ago.
Additionally, this report showed that sales to individual investors — or buyers who intend on flipping the home for a profit — accounted for 18% of existing homes sold in February, the highest share since April 2014. Almost two-thirds of these buyers paid cash.
Also in Monday’s report, commentary from Lawrence Yun, chief economist for the National Association of Realtors — which publishes the existing home sales report — showed the kind of crisis the housing market is facing.
“The lull in contract signings in January from the large East Coast blizzard, along with the slump in the stock market, may have played a role in February’s lack of closings,” Yun said Monday.
“However, the main issue continues to be a supply and affordability problem. Finding the right property at an affordable price is burdening many potential buyers.”
Yun added that, “The overall demand for buying is still solid entering the busy spring season, but home prices and rents outpacing wages and anxiety about the health of the economy are holding back a segment of would-be buyers.”
In our latest Most Important Charts collection, Scott Buchta, a fixed income strategist at Brean Capital, argued that existing and new home sales are often incorrectly conflated as joint indicators on the health of the housing market.
Existing home sales, even with Monday’s drop, are still roughly near pre-crisis levels. This argues that in a healthy housing market we’re looking at something like 5 million already-built homes being sold in a given year, more or less.
New home sales, on the other hand, have been a major laggard.
“In our view, the recovery in existing home sales has been led by rising home prices, which has brought additional supply into the market,” Buchta noted. This view which is consistent with the increase in investors buying existing homes as well as the high number of cash-only sales, which accounted for 25% of transactions in February.
“The lag in new home sales, on the other hand, is more reflective of the economy as a whole and has been adversely impacted by sluggish wage growth and tight credit windows.”
Buchta’s colleague at Brean Capital, Peter Tchir, also hammered on this idea of new home sales as reflecting economic trends that have persisted since the crisis — slow wage growth, rampant concern about the future, and an under built low-end housing market have all kept renters renting.
If we take the view that the jobs currently being created aren’t that great — which is another argument for another post — then what we’re going to see is a rising class of renters.
“These low paying jobs are not the type of job that are conducive to buying a home,” Tchir wrote.
“The first problem is saving for the down payment – a Herculean task in itself. The second problem, and the one that I think is addressed less frequently, is who really wants to commit to an area when the job isn’t that good and may not be stable?”
And if we consider that the economy is, as much as anything, a confidence game, the reality is that instability and imminent collapse have been the dominant psychological themes for both consumers and investors since the crisis.
So we can hit on the theme that the US economy is not heading for recession timeand time again, but there is a reason Donald Trump is leading in the Republican polls: people do not believe in this economy.
The upshot here is that with more folks renting and the labor market recovering faster than the housing market, we’re suddenly looking at a new class of well-employed, would-be home buyers relegated to renting… and paying ever-increasing rents.
Earlier this month we highlightedcommentary from New River Investments’ Conor Sen who said, among other things, that the housing market has simply been under built following the crisis and is ill-prepared to handle the coming wave of millennial households that will be formed over the next several decades.
Home prices may increase and as an investment — not a place to live — buying houses may still be attractive for some time to come.
But demand for housing is not going away and will only get stronger.
Housing prices in Crenshaw jumped way up, while Hancock Park’s tumbled way down
Redfin’s housing market report for February has been released, and, as per usual, a lot of activity took place east of Vermont. Neighborhoods like Echo Park, Eagle Rock, Glassell Park, Mount Washington, and East LA all saw double digit rises in median housing price.
Mount Washington’s median price for February was up 19.2 percent to $790,000, which is up significantly from the $699,000 median price Redfin cited in January when it predicted Mount Washington would be the hottest neighborhood of 2016. Their prediction may be coming true (self-fulfilling?). Sellers in Mount Washington are getting 6.5 percent above asking price and houses are staying on the market for an average of only 13 days.
The Valley also saw some action in February: Studio City, Sherman Oaks, Sun Valley, and Van Nuys all had double digit jumps in median housing prices. Studio City fared the best with a 26.9 percent increase, to $888,250, and a 22.9 percent increase in total sales.
Around town other neighborhoods experienced some major fluctuations. On the positive end, Crenshaw had a big February; median prices in that neighborhood shot up a whopping 66.8 percent, to $628,125. Total sales in Crenshaw were up 64.3 percent.
Redfin also reports a 25 percent increase in the median price of houses on the Westside of town—those are now selling for a median of $1.5 million.
Conversely, Hancock Park did not fare so well in the February report. Median prices for the neighborhood contracted 68.8 percent, to an even (and crazy low) $500,000. Sales were down 31.3 percent and sellers were getting 1.7 percent below asking price.
Los Angeles on the whole had a 14.6 percent increase in median price, up to $590,000. The city also saw a lot of new houses added to the market in February, with inventory moving up 10.5 percent. But total sales were down 2.5 percent for the month.
Judith and Cliff Allen have owned the modest Marcus Apartments in Portland’s Irvington neighborhood since 1979. They personally know their 10 tenants, many of whom have lived there long-term and pay rents that these days are below the market rate. The building is 50 years old, but the renters like having hands-on landlords, said the Allens, who live in Clackamas County.
The couple now wants to build another 12-unit structure on the parking lot in front of the building. The surprising thing, said Brian Emerick, former chair of Portland’s Historic Landmarks Commission, is that they didn’t just knock down the old building and put up something bigger and fancier — and a lot more expensive.
“Almost no developer would have saved the existing building,” Emerick said. “They would have just knocked it down” and maximized the lot’s value.
But the Allens don’t want to throw their longtime tenants out of their apartments. It was perhaps a rare decision by an increasingly rare breed — the mom-and-pop landlord.
“There are very few of us left,” Judith Allen said. “People who both own and manage. It’s very expensive and time-consuming.”
If local landlords are on the way out, it’s because they’re being replaced at a surprisingly fast clip by large institutional investors.
In 2015, the Portland area saw more than $1.7 billion in sales of large multifamily properties, more than double the previous record set in 2007, according to data collected by the commercial real estate firm Jones Lang LaSalle. Much of that money comes from pension funds, banks, unions, insurance companies or real estate investment trusts.
The result for Portland renters? It’s increasingly likely that whether you’re writing a check to a person or a pension, the money is traveling out of town. And investors’ unceasing quest for yield puts upward pressure on rents.
Judith Allen estimates the couple receives about six offers a month from suitors, many of them large investment companies, that want to buy the Irvington property and develop it into “something much bigger.” The couple originally bought the building after Cliff Allen published a teacher’s manual, his wife said, and came into some money. They chose to invest it in real estate.
The Allens’ children are now also in the real estate business, Judith Allen said. But with increased competition from institutional investors, it’s not as easy these days to get a piece of the action.
“It’s tougher now,” she said. “It’s a little more difficult.”
Trickling down the asset ladder
Portland didn’t used to be the kind of market where big, national pension funds came hunting for real estate. But low interest rates — which make it hard for funds to make money on traditional investments, and also make it cheap for them to borrow for additional acquisitions and developments — and the Portland area’s tight rental market have shifted the landscape.
Ralph Cole, global financials analyst with Portland-based Ferguson Wellman Capital Management, said insurance companies and other institutional investors “are in smaller-size deals today than they were 10 years ago.” That opens up opportunities in midsized markets like Portland’s.
In the past, Cole said, an insurance company could generate returns by simply buying corporate bonds and treasuries. Low rates, though, have left them “searching other places to put funds to work.”
“Apartments have been very popular because the fundamentals are so good,” Cole said. Between October 2009 and October 2015, 39 percent of sales of buildings with 79 or more units went to institutional investors, and the trend has accelerated in the past two years.
The recent sale of the 63-unit Lower Burnside Lofts on the east side for $18.5 million to Boston-based Berkshire Group suggests investors are willing to perhaps “compromise some of their standards” to “grab any good quality” in the desirable Portland market, said Brian Glanville, senior managing director at the Portland arm of real estate consultant Integra Realty Resources.
Burnside Lofts
Until recently, Glanville said, there was no way you’d get an investor interested in the price range below $20 million or $25 million. And only in the past two years has institutional money gone after buildings outside of the central city with fewer than 100 units, he added.
Robert Black, managing director at the real estate brokerage ARA Newmark, represented the Lower Burnside Lofts’ seller, Portland-based developer Urban Asset Advisors, in the deal announced last month.
“The institutional buyer’s understanding of the east side has really started to pick up, and their comfort level with the east side has started to pick up,” Black said.
It’s not just apartments
The ongoing real estate frenzy isn’t limited to apartment buildings. Portland’s office market saw more than $1 billion in transactions last year, according to Jones Lang LaSalle, with more than 77 percent of the money coming from institutional investors. Meanwhile, office rents rose by nearly 10 percent year-over-year and Portland’s office vacancy rate was third-lowest in the nation, according to a report released in October.
A real estate investment trust associated with Connecticut-based UBS Global Real Estate set a Portland record when it bought the U.S. Bancorp Tower, known as “Big Pink,” for $372.5 million. Prudential paid $155.3 million for the Block 300 building at 308 S.W. Second Ave.
The New Jersey-based insurance provider has seen “more opportunity” of late in “secondary cities” like Portland, said Theresa Miller, a Prudential spokeswoman who specializes in asset management.
“We’re looking for good, steady, kind of predictable, safe returns,” Miller said. The company typically is interested in holding onto buildings over a period of years, she added — “We don’t come in just to flip stuff over.”
And it’s not just Californians flocking over Oregon’s southern border — it’s their money, too. The buyer of the 2100 River Parkway office building, which sold for $35.4 million last year, was CalSTRS, the California teachers’ retirement system. (CalSTRS officials declined comment for this story.)
“There is not a very good return anywhere else,” said Brian Allen, owner of Portland-based Windermere Real Estate. “You know, the bond market, the stock market — a lot of the places where institutional money might park itself — it’s not that good right now. And people are seeing opportunities in real estate.”
Advantages and disadvantages
The influx of institutional money bucks Portland tradition, Brian Allen said — traditionally, landlords tended to be wealthy but local. A doctor, lawyer, or business person, for example.
There are still opportunities for those folks, though, said attorney David Nepom, who represents such buyers.
“I see young folks still wanting to get into real estate in one manner or another,” Nepom said. “And usually what they do is they start out with the single-family rentals and they move up into a four-plex or six-plex. Does it take more money now? Yeah.”
Nepom doesn’t believe the “American real estate dream is over,” he said.
“I think it takes work and effort,” Nepom said. “But I can think of a few clients off the top of my head who have been very successful at it over the years…Big money does not go after the single-family homes or the four-plex. They just don’t.”
Until now. A series of reports by the nonprofit Investigate West found that Wall Street was scooping up single-family rentals in Portland by the hundreds. And where did one of the investors — Blackstone, a multinational private equity firm — raise some of its capital? Oregon’s own Public Employees Retirement System, or PERS.
Tenants worried about rising rents could be forgiven for fearing the trend. But institutional investors aren’t “steamrolling” the local community, said Daisy Okas, a spokeswoman for the major retirement provider TIAA-CREF, which bought the Cordelia apartments in Northwest Portland last year for $47.8 million.
Cordelia Apartments
“We’re investing capital and shoring up the housing stock,” Okas said.
What’s more, institutional investors are probably more likely to properly maintain their buildings, according to Brian Allen. And they’re perhaps less prone to economic downturns or overreacting to the ever-fluctuating stock market.
“They do have really long horizons,” Brian Allen said. “And so I would speculate they’re very unlikely to be slumlords. They’re probably likely to put in a professional property management company.”
That’s the case for Martin Forde, 22, who began renting at the Lower Burnside Lofts with his girlfriend a month after it opened last summer. The recent Oregon State University graduate moved to Portland for a job at the PepsiCo distribution plant in Gresham, he said.
Not long after he moved in, he found out the building was sold — a development he found “really surprising,” he said. He hadn’t been aware until this month that the buyer was an institutional group in Boston.
But it doesn’t bother him. The location is ideal. When the lights went out, the property manager fixed it within 12 hours. And though the $1,465 monthly rent is expensive, he said, he can afford it.
Still, he wonders about what’ll happen when his new seven-month lease expires.
“They haven’t hiked rent,” Forde said of the new owners. “But we’ll see what happens when the next lease is up.”
“The market wants to do it’s sole job which is to establish fair market value. I am talking currencies, housing, crude oil, derivatives and the stock market. This will correct to fair market value. It’s a mathematical certainty, and it’s already begun.”
Financial analyst and trader Gregory Mannarino thinks the coming market crash will be especially bad for people not awake or prepared. Mannarino says, “This is going to get a lot worse. On an individual level, we have to understand what we have to do for ourselves and our families to get through this. No matter what is happening on the political front, there is no stopping what is coming. . . . We’re going back to a two-tier society. We are seeing it happen. The middle class is being systematically destroyed. We are going to have a feudal system of the haves and the have nots. People walking around blindly thinking it’s going to be okay are going to suffer the worst.”
Mannarino’s advice is to “Bet against this debt, and that means hold hard assets; also, become your own central bank. Their system has already failed and it’s coming apart.”
A recent poll found that two-thirds of metropolitan Vancouver residents believe “foreigners investing” is a main cause of high housing costs, and 70 per cent said the government should work to improve affordability.
One month ago, when describing the latest in an endless series of Vancouver real estate horror stories, in this case an abandoned, rotting home (which is currently listed for a modest$7.2 million), we explained the simple money-laundering dynamic involving Chinese “investors” as follows.
Chinese investors smuggle out millions in embezzled cash, hot money or perfectly legal funds, bypassing the $50,000/year limit in legal capital outflows.
They make “all cash” purchases, usually sight unseen, using third parties intermediaries to preserve their anonymity, or directly in person, in cities like Vancouver, New York, London or San Francisco.
The house becomes a new “Swiss bank account”, providing the promise of an anonymous store of value and retaining the cash equivalent value of the original capital outflow.
We also explained that hundreds if not thousands of Vancouver houses, have become a part of the new normal Swiss bank account: “a store of wealth to Chinese investors eager to park “hot money” outside of their native country, and bidding up any Canadian real estate they could get their hands on.”
This realization has now fully filtered down to the local population, and as the National Post writes in its latest troubling look at the “dark side” of Vancouver’s real estate market, it cites wholesaler Amanda who says that “Vancouver seems to be evolving from a residential city into almost like a lock box for money… but I have to live among the empty houses. I’m a resident, not just an investor.”
The Post article, however, is not about the use of Vancouver (or NYC, or SF, or London) real estate as the end target of China’s hot money outflows – by now most are aware what’s going on. It focuses, instead, on those who make the wholesale selling of Vancouver real estate to Chinese tycoons who are bidding up real estate in this western Canadian city to a point where virtually no domestic buyer can afford it, and specifically the job that unlicensed “wholesalers” do in spurring and accelerating what is currently the world’s biggest housing bubble.
A bubble which, the wholesalers themselves admit, will inevitably crash in spectacular fashion.
Vancouver’s real estate market has been very good to Amanda. She’s not a licensed realtor, but buying and selling property is her full-time job.
She started about eight years ago as an unlicensed “wholesaler” in Vancouver.
She would approach homeowners and make unsolicited offers for private cash deals. Amanda made a 10-per-cent fee on each purchase by immediately assigning the contract to a background investor. It is seen as the lowest job in property investment, but it is low risk and very profitable. Amanda has done so well that she now owns two homes in Vancouver and develops property in the U.S.
Unlicensed wholesaling is an illicit and predatory business that is quickly growing in Metro Vancouver because enforcement is virtually non-existent.
It’s similar to a tactic currently being examined by B.C. real estate authorities known as “assignment flipping,” which involves legally but secretly trading homes on paper to enrich realtors and circles of investors.
However, unlicensed wholesaling is completely unregulated. Amanda estimates hundreds of wholesalers are scouring Metro Vancouver’s never-hotter speculative market — not including the realtors who are secretly wholesaling for themselves.
Amanda decided to step away from the easy money for moral reasons.
She’s most concerned that wholesalers are targeting B.C.’s vulnerable seniors who don’t understand the value of their old homes. She is also worried about offshore money being laundered, and the resulting vacant homes.
Because wholesalers are unlicensed, they have no obligation to identify their background investors or reveal the source of funds to Canadian authorities who fight money laundering.
“Vancouver seems to be evolving from a residential city into almost like a lock box for money,” Amanda said. “But I have to live among the empty houses. I’m a resident, not just an investor.”
Amanda said she believes that unethical and ignorant investors are driving B.C.’s housing market at full speed towards a crash. For these reasons, and with the condition that we not use her real name, she came forward to reveal how wholesalers operate.
The calling cards of wholesalers — hand-written flyers offering homeowners “confidential” and “discreet” cash sales — started flooding west side Vancouver homes over the past 18 months. With the dramatic surge in home prices, wholesalers now are spreading into neighborhoods across Metro Vancouver and Vancouver Island.
In eight years Amanda has never seen the market hotter than it is right now, and her colleagues are urging her to start wholesaling again.
Notices offering cash for homes are the calling card of unlicensed wholesalers
“A lot of money is leaving China, so now every second day people are asking if I can go out and find places for them. They have tons of money,” Amanda said. “They are basically brokering business deals specifically for Chinese investors.”
She said the mechanics of wholesaling schemes work like this:
The investor behind the unlicensed broker targets a block, often with older homes, and gives the wholesaler cash in a legal trust.
The wholesaler persuades a homeowner to sell, offering immediate cash, no subjects, no home inspections, and savings on realtor fees.
While the wholesaler claims to represent one buyer, or in some cases to be the buyer, Amanda said three or four contract flippers are often already lined up, with an end-buyer from China who will eventually take title in most cases. These unlicensed broker deals appear to be illegal.
A veteran Vancouver realtor confirmed these types of deals. The realtors we spoke to have been asked by their brokerages not to comment to reporters, so we agreed to withhold their names.
“I work with some non-licensed flippers,” one said. “They walk on to the lawn of an older house, see the owner and yell, ‘We’re not realtors!’ The owner invites them in, thinks they’re saving a commission — which they are — and loses big-time on the actual sale. I’ve seen it first-hand.”
According to flyers obtained from across Metro Vancouver and interviews with homeowners who were solicited, wholesalers often say they have Chinese buyers willing to pay a premium for quick sales.
Homeowners in Richmond, Vancouver’s east and west sides, Surrey, Langley, Coquitlam, Burnaby, White Rock, Delta and North Vancouver confirmed such offers in interviews.
One resident of Vancouver’s west side Dunbar area said she was annoyed by wholesalers constantly soliciting her, and a man in Surrey said his elderly mother was bothered by wholesalers.
“A guy walked up and he offered $700,000 cash within a day, and he said I would save on the realtor fees,” said Zack Flegel, who lives near 119th Street and Scott Road in Delta.
“He also says he will give me $100,000 cash and move me into a $600,000 house. He said he has a bunch of properties. He was talking about my house like it was a trading card. We don’t have abandoned homes yet like Vancouver, but this is how it happens, right?”
After the offer is accepted, the wholesaler assigns the purchase contract to the investor for a 10-per-cent markup, Amanda said. But some wholesalers aren’t content with making $100,000 or more per sale.
“People were going in and offering, for example, an 80-year-old widow, she bought the house for $70,000 and it is now worth $800,000 and they were offering her $200,000,” Amanda said. “So they are making $300,000 or $400,000 (after assigning the contract).
“And you are socializing with other wholesalers, and it is hard to hear them say, ‘Oh this whole street is filled with seniors whose partners are dropping off like flies.’ Or, ‘They just want to get rid of it, they have no clue what their house is worth, and it’s the whole street.’”
Amanda said her father died recently. She pictured her mother being targeted by wholesalers and resolved never to play that role again.
“There are elements of this that are elder abuse, absolutely.”
In a recent story that deals with implications of rising property taxes rather than predatory real estate practices, the Financial Post reported that, especially in Vancouver and Toronto’s scorching markets, “it’s not uncommon for some Canadian seniors to be unaware of the value of their location.”
B.C.’s Superintendent of Real Estate, Carolyn Rogers, conceded the potential for elder abuse as reported by Amanda.
“We would welcome an opportunity to speak to (Amanda) and assuming she gives us the same information, we would open a file,” Rogers said. “The conditions in the Vancouver market right now present risks … and seniors could be an example of that.”
It is illegal for wholesalers to privately buy and sell property for investors without a licence, Rogers said. She said her officers have approached some wholesalers recently and asked them to become licensed or cease their activities.
A review of the superintendent’s website shows no enforcement orders, fines or consumer alerts filed in connection to unlicensed wholesalers making cash deals and flipping contracts.
Amanda said that over the past year she learned of new levels of “layering and complexity that I didn’t see five years ago” in wholesaling and assignment-clause flipping.
“Five years ago I didn’t see realtors wholesaling, and I didn’t see people calling me so that I would get them a property and not assign the property to them, but work as a ‘partner’ and I would attach a 10-per-cent fee.
“And then they would assign it to their boss and attach 10 per cent, and then that person’s boss would attach 10 per cent. I’ve been watching over the last month, and it has got astounding.”
Amanda said some wholesale deals involve only unlicensed brokers and pools of offshore cash organized informally, and some appear to involve realtors and brokerages hiding behind unlicensed wholesalers.
“I’ve seen it from the back end. We have friends in the British Properties and the realtor said he will buy their property for $2 million. And then six months later it was sold for $3.5 million. When I’m looking at that, it is a pretty clear wholesale deal.”
Darren Gibb, spokesman for Canada’s anti-money-laundering agency, FINTRAC, confirmed that unlicensed property buyers have no obligation to report the identity or sources of funds of the buyers they represent.
However, Gibb said, if realtors are involved in “assignment flipping” it is mandatory that they and unlicensed assistants make efforts to identify every assignment-clause buyer and their sources of funds.
Vancouver realtors confirmed that money laundering is a big concern in assignment-flipping deals, whether organized by an unlicensed wholesaler or a realtor.
“When you are a non-realtor broker you no longer have to play by any rules,” one Vancouver realtor said.
“There is a role for assignments, but nobody is asking where the money came from. We are creating vehicles for money laundering.”
“No person in their right mind wants to buy your house once, and sell it three more times in a small window of opportunity, unless they have a whole pool of people lined up trying to get their money out of the country. The higher the prices go, these vehicles to get money out of the country get bigger and bigger.”
NDP MLA David Eby and Green MLA Andrew Weaver commented that allegations of unlicensed brokers targeting seniors and participating in potential money-laundering schemes call for direct action from Victoria and independent investigation, because these concerns fall outside the jurisdiction of the B.C. Real Estate Council and its current ongoing review of real estate practices.
“It is very troubling to me,” Eby said, “that not only do we have a layer of real estate agents that are acting improperly and violating the rules, but there might be this additional layer who are not bound by any rule and have explicitly avoided becoming agents for that reason.
“This unscrupulous behavior is targeting seniors who need money for retirement. What kind of society is that?” Weaver said.
Fewer homes bought, more refinances, and older mortgages lead to principal balance declines
Shadows from the financial crisis and Great Recession still linger in Americans’ personal finances, researchers at the New York Fed found.
Mortgage debt outstanding nearly doubled in the period from 2000 and 2006, but has risen only about 1% since 2012, according to data compiled in the regional bank’s quarterly report on household debt and crisis.
Put another way, in 2008 just as the subprime crisis was coming to a head, Americans had $12.68 trillion in debt outstanding, of which housing debt made up $10 trillion, or 79% of the total. In the fourth quarter of 2015, there was $12.12 trillion in total debt, and housing’s share had dwindled to 72%, or $8.74 trillion.
One of the biggest contributors to the decline in mortgage debt is that Americans aren’t taking equity out of their homes at nearly the same rate as in the prior decade. Cash-out refinances and home equity lines of credit rose at a rate of more than $300 billion every year from 2003-2007. In 2015, such debt grew only by $30 billion.
“In fact,” the researchers note on their blog, “the small amount of cash-out refi going on is almost completely offset by people repaying second mortgages and HELOCs.”
But it’s not just a newfound frugality that’s keeping a lid on mortgage debt. The pace of home buying has slowed even as Americans are paying down their home loans.
The total amount paid against mortgage debt in 2015 was $288 billion, or 3.5% of the total outstanding. The last time the total amount of mortgage debt outstanding was $8.25 trillion was 2006, the height of the boom, the researchers noted. That year, consumers paid down only $170 billion, or 2.1% of the balance.
In recent years, much of the pay down has come thanks to lower interest rates. New mortgages are being lent with lower rates, and existing homeowners have been refinancing. The researchers also note that as credit standards have remained tight, most new mortgages are going to people with excellent credit, enabling them to pay lower rates.
Those factors have taken the weighed average interest rate on the outstanding mortgage debt balance from 7.65% in 2000 to 3.85% in 2015.
There’s another factor contributing to the higher pace of pay downs. The existing inventory of mortgage debt outstanding has aged significantly over the past decade as the pace of buying and selling slowed. That means mortgage payments are further along in their amortization process and principal, rather than interest, is being paid down.
Since 2008, the researchers note, aggregate mortgage payments have fallen 8% but principal payments have risen 41%.
The shrinking mortgage debt is a good thing, the New York Fed researchers conclude. Principal pay-down is a form of saving for borrowers, so in the face of rising home prices this means strengthening balance sheets for mortgagors. This is important, of course, as we learned in 2008 just how crucial household debts can be.
But some analysts worry that Americans’ equity is too concentrated in real estate assets. Another lesson from the 2008 crisis is that it can be very dangerous when the price of those assets plummets.
The rise in rents and home prices is adding additional pressure to the bottom line of most California families. Home prices have been rising steadily for a few years largely driven by low inventory, little construction thanks to NIMBYism, and foreign money flowing into certain markets. But even areas that don’t have foreign demand are seeing prices jump all the while household incomes are stagnant. Yet that growth has hit a wall in 2016, largely because of financial turmoil. We’ve seen a big jump in the financial markets from 2009. Those big investor bets on real estate are paying off as rents continue to move up. For a place like California where net home ownership has fallen in the last decade, a growing list of new renter households is a good thing so long as you own a rental.
The problem of course is that household incomes are not moving up and more money is being siphoned off into an unproductive asset class, a house. Let us look at the changing dynamics in California households.
More renters
Many people would like to buy but simply cannot because their wages do not justify current prices for glorious crap shacks. In San Francisco even high paid tech workers can’t afford to pay $1.2 millionfor your typical Barbie house in a rundown neighborhood. So with little inventory investors and foreign money shift the price momentum. With the stock market moving up nonstop from 2009 there was plenty of wealth injected back into real estate. The last few months are showing cracks in that foundation.
It is still easy to get a mortgage if you have the income to back it up. You now see the resurrection of no money down mortgages. In the end however the number of renter households is up in a big way in California and home ownership is down:
Source: Census
So what we see is that since 2007 we’ve added more than 680,000 renter households but have lost 161,000 owner occupied households. At the same time the population is increasing. When it comes to raw numbers, people are opting to rent for whatever reason. Also, just because the population increases doesn’t mean people are adding new renter households. You have 2.3 million grown adults living at home with mom and dad enjoying Taco Tuesdays in their old room filled with Nirvana and Dr. Dre posters.
And yes, with little construction and unable to buy, many are renting and rents have jumped up in a big way in 2015:
This has slowed down dramatically in 2016. It is hard to envision this pace going on if a reversal in the economy hits (which it always does as the business cycle does its usual thing).
Home ownership rate in a steep decline
In the LA/OC area home prices are up 37 percent in the last three years:
Of course there are no accompanying income gains. If you look at the stock market, the unemployment rate, and real estate values you would expect the public to be happy this 2016 election year. To the contrary, outlier momentum is massive because people realize the system is rigged and are trying to fight back. Watch the Big Short for a trip down memory lane and you’ll realize nothing has really changed since then. The house humping pundits think they found some new secret here. It is timing like buying Apple or Amazon stock at the right time. What I’ve seen is that many that bought no longer can afford their property in a matter of 3 years! Some shop at the dollar store while the new buyers are either foreign money or dual income DINKs (which will take a big hit to their income once those kids start popping out). $2,000 a month per kid daycare in the Bay Area is common.
If this was such a simple decision then the home ownership rate would be soaring. Yet the home ownership rate is doing this:
In the end a $700,000 crap shack is still a crap shack. That $1.2 million piece of junk in San Francisco is still junk. And you better make sure you can carry that housing nut for 30 years. For tech workers, mobility is key so renting serves more as an option on housing versus renting the place from the bank for 30 years. Make no mistake, in most of the US buying a home makes total sense. In California, the massive drop in the home ownership rate shows a different story. And that story is the middle class is disappearing.
No one has called long-duration treasury yields better than Lacy Hunt at Hoisington Management. He says they are going lower. If the US is in or headed for recession then I believe he is correct.
“Debt only works if it generates an income to repay principle and interest.”
Research indicates that when public and private debt rises above 250% of GDP it has very serious effects on economic growth. There is no bit of evidence that indicates an indebtedness problem can be solved by taking on further debt.
One of the objectives of QE was to boost the stock market, on theory that an improved stock market will increase wealth and ultimately consumer spending. The other mechanism was that somehow by buying Government securities the Fed was in a position to cause the stock market to rise. But when the Fed buys government securities the process ends there. They can buy government securities and cause the banks to surrender one type of government asset for another government asset. There was no mechanism to explain why QE should boost the stock market, yet we saw that it did. The Fed gave a signal to decision makers that they were going to protect financial assets, in other words they incentivized decision makers to view financial assets as more valuable than real assets. So effectively these decision makers transferred funds that would have gone into the real economy into the financial economy, as a result the rate of growth was considerably smaller than expected.
“In essence the way in which it worked was by signaling that real assets were inferior to financial assets. The Fed, by going into an untested program of QE effectively ended up making things worse off.”
Flattening of the Yield Curve
“Monetary policies currently are asymmetric. If the Fed tried to do another round of QE and/or negative interest rates, the evidence is overwhelming that will not make things better. However if the Fed wishes to constrain economic activity, to tighten monetary conditions as they did in December; those mechanisms are still in place.”
They are more effective because the domestic and global economy is more heavily indebted than normal. The fact we are carrying abnormally high debt levels is the reason why small increases in interest rate channels through the economy more quickly.
If the Fed wishes to tighten which they did in December then sticking to the old traditional and tested methods is best. They contracted the monetary base which ultimately puts downward pressure on money and credit growth. As the Fed was telegraphing that they were going to raise the federal funds rate it had the effect of raising the intermediate yield but not the long term yields which caused the yield curve to flatten. It is a signal from the market place that the market believes the outlook is lower growth and lower inflation. When the Fed tightens it has a quick impact and when the Fed eases it has a negative impact.
The critical factor for the long bond is the inflationary environment. Last year was a disappointing year for the economy, moreover the economy ended on a very low note. There are outward manifestations of the weakening in economy activity. One impartial measure is what happened to commodity prices, which are of course influenced by supply and demand factors. But when there are broad declines in all the major indices it is an indication of a lack of demand. The Fed tightened monetary conditions into a weakening domestic global economy, in other words they hit it when it was already receding, which tends to further weaken the almost non-existent inflationary forces and for an investor increases the value.
Failure of Quantitative Easing
“If you do not have pricing power, it is an indication of rough times which is exactly what we have.”
The fact that the Fed made an ill-conceived move in December should not be surprising to economists. A detailed study was done of the Fed’s 4 yearly forecasts which they have been making since 2007. They have missed every single year.
That was another in a series of excellent interviews by Gordon Long. There’s much more in the interview. Give it a play.
Finally, lest anyone scream to high heavens, Lacy is obviously referring to price inflation, not monetary inflation which has been rampent.
From my standpoint, consumer price deflation may be again at hand. Asset deflation in equities, and junk bonds is a near given.
The Fed did not save the world as Ben Bernanke proclaimed. Instead, the Fed fostered a series of asset bubble boom-bust cycles with increasing amplitude over time.
The bottom is a long, long ways down in terms of time, or price, or both.
The six-bedroom mansion in the shadow of Southern California’s Sierra Madre Mountains has lime trees and a swimming pool, tennis courts and a sauna — the kind of place that would have sold quickly just a year ago, according to real estate agent Kanney Zhang.
Not now.
Zhang is shopping it for a discounted $3.68 million, but nobody’s biting. Her clients, a couple from China, are getting anxious. They’re the kind of well-heeled international investors who fueled a four-year luxury real estate boom that helped pull America out of its worst housing slump since the 1930s. Now the couple is reeling from the selloff in the Chinese stock market and looking to raise cash to shore up finances.
In the Los Angeles suburb of Arcadia, where Zhang is struggling to sell the six-bedroom home, dozens of aging ranch houses were demolished to make way for 38 mansions built with Chinese buyers in mind. They have manicured lawns and wok kitchens and are priced as high as $12 million. Many of them sit empty because the prices are out of the range of most domestic buyers, said Re/Max broker Rudy Kusuma, who blames a crackdown by the Chinese on large sums leaving the country.
Well, I have some more bad news for mansion-flipping Chinese nationals.
Europe’s biggest lender HSBC will no longer provide mortgages to some Chinese nationals who buy real estate in the United States, a policy change that comes as Beijing is battling to stem a swelling crowd of citizens trying to get money out of China.
An HSBC spokesman in New York told Reuters on Wednesday that the new policy went into effect last week, roughly a month after China suspended Standard Chartered and DBS Group Holdings Ltd from conducting some foreign exchange business and as authorities try to limit capital outflows.
Realtors of luxury property in cities like New York, Los Angeles, and Vancouver, said more than 80 percent of wealthy Chinese buyers have ties to China.
Luxury homes news website Mansion Global, which first reported the HSBC policy change, said it would affect Chinese nationals holding temporary visitor ‘B’ visas if the majority of their income and assets are maintained in China.
Meanwhile…
HSBC’s pivot away from lending to some Chinese nationals abroad comes as other international banks clamor to lend more to wealthy Chinese.
The Royal Bank of Canada scrapped its C$1.25 million cap on mortgages to borrowers with no local credit history last year in a bid to tap into surging demand for financing from wealthy immigrant buyers.


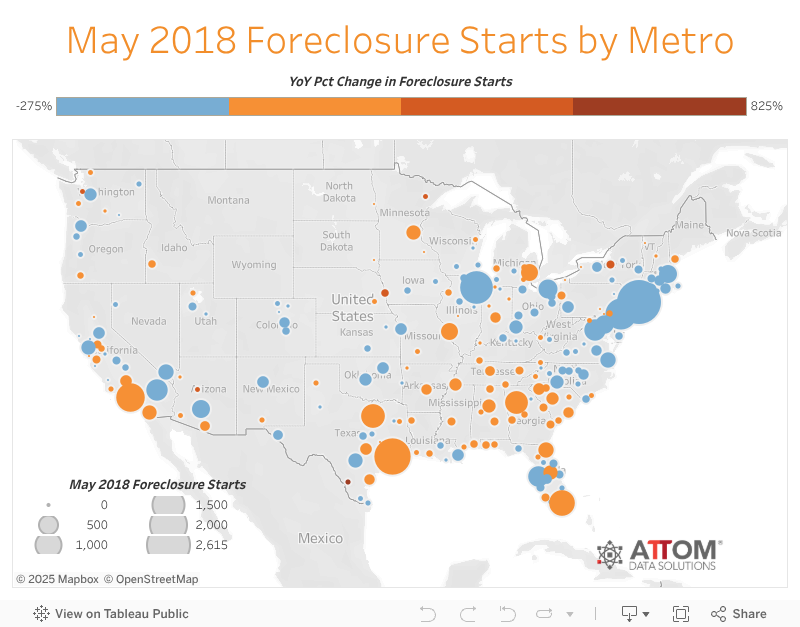


/cdn.vox-cdn.com/uploads/chorus_image/image/49760311/Brownstone-Lead.0.jpg)


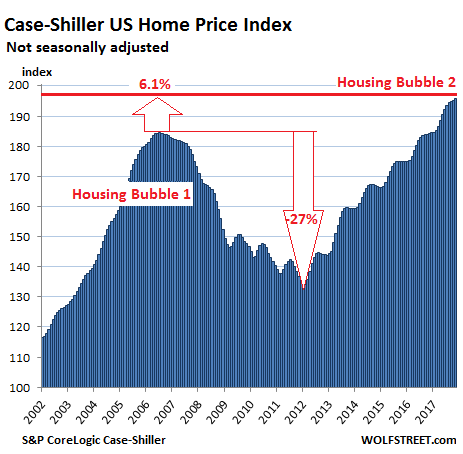
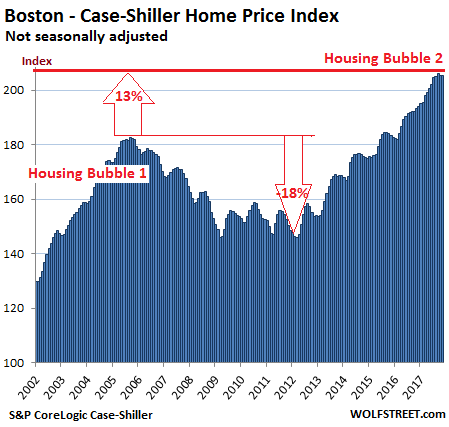
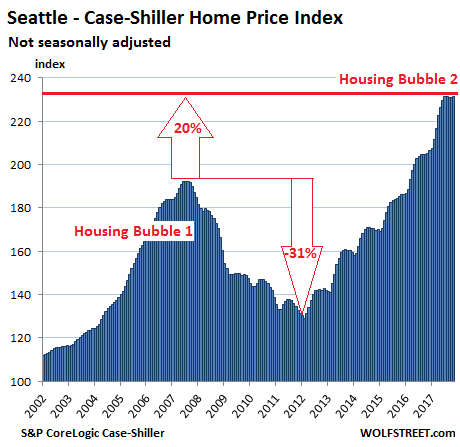
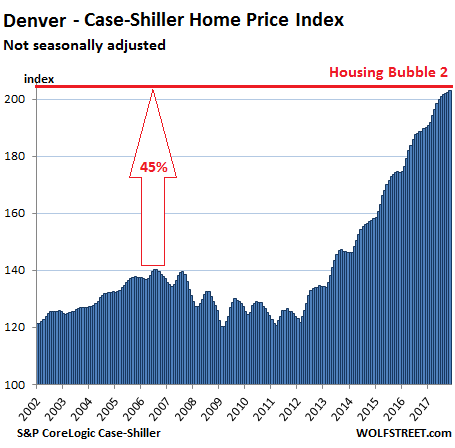
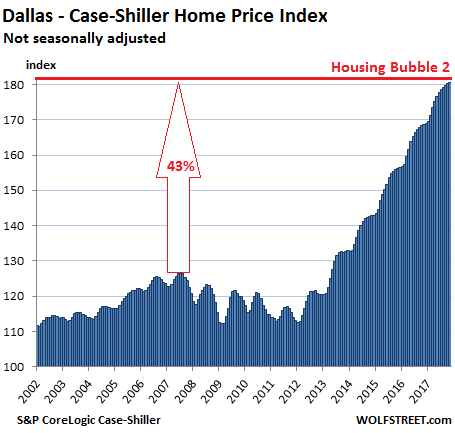
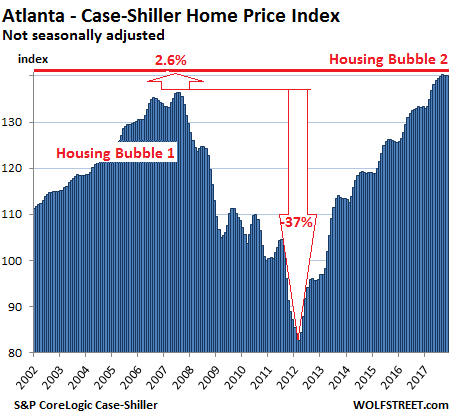
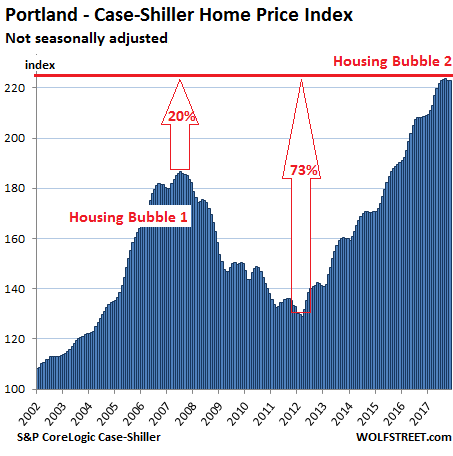
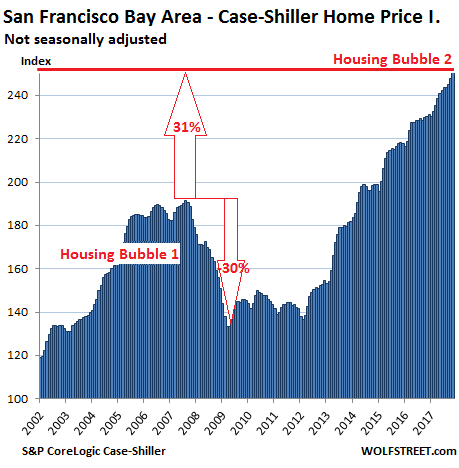
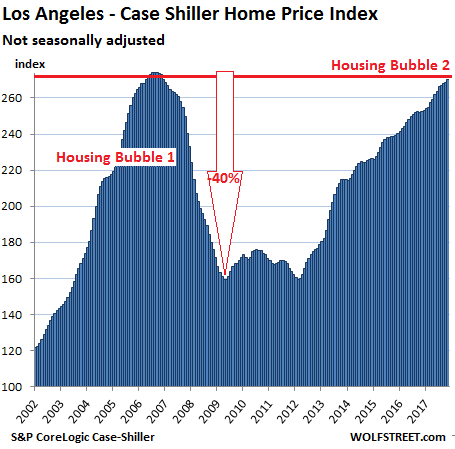
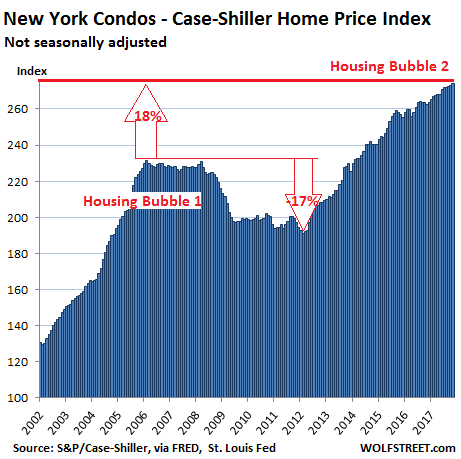


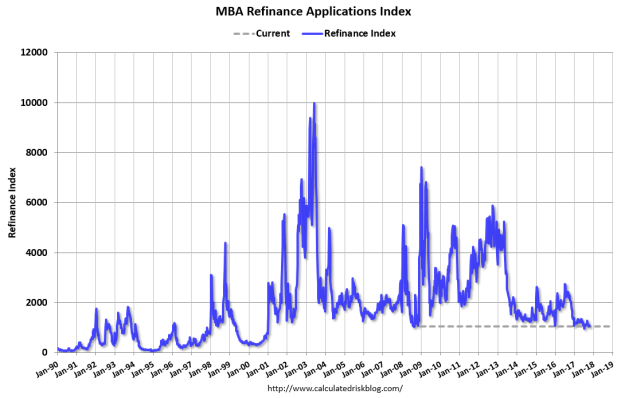
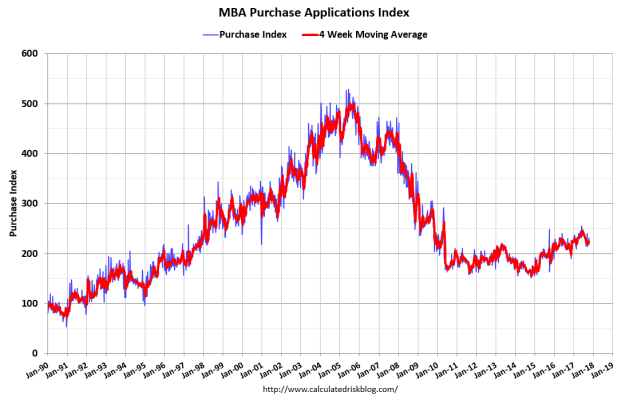


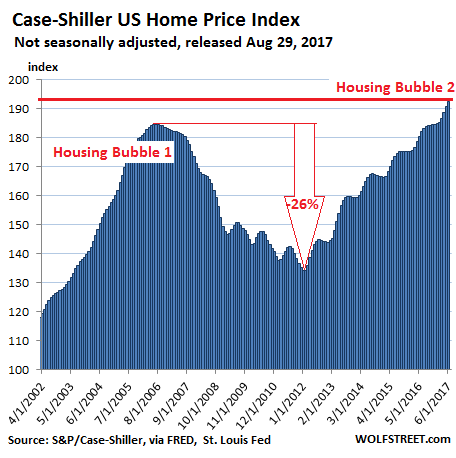
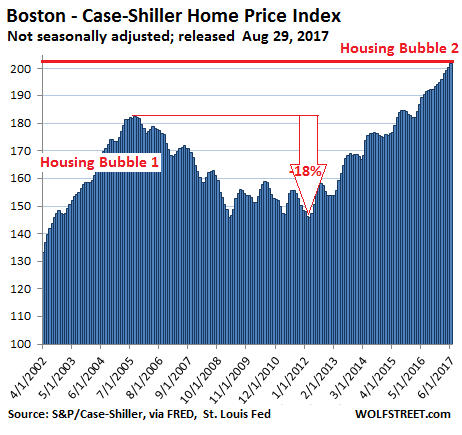
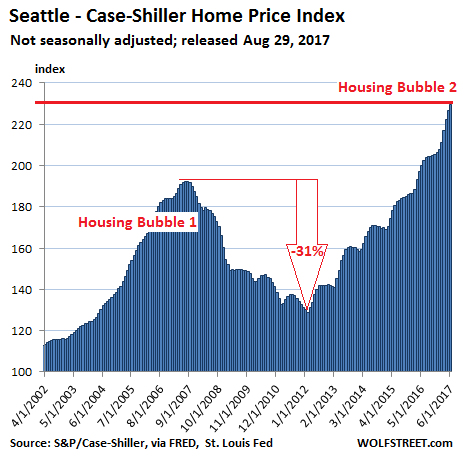
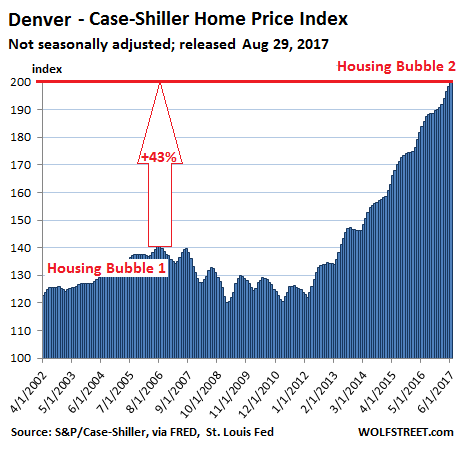
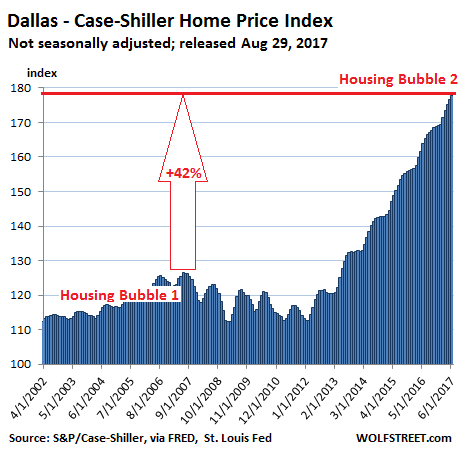
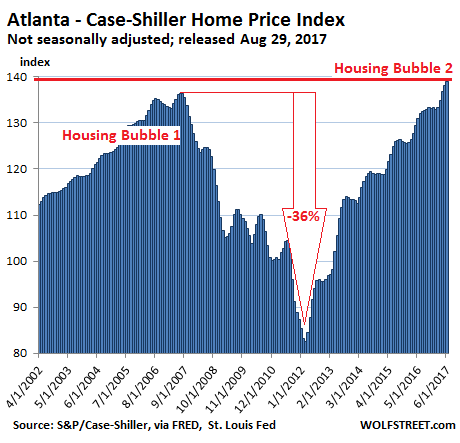
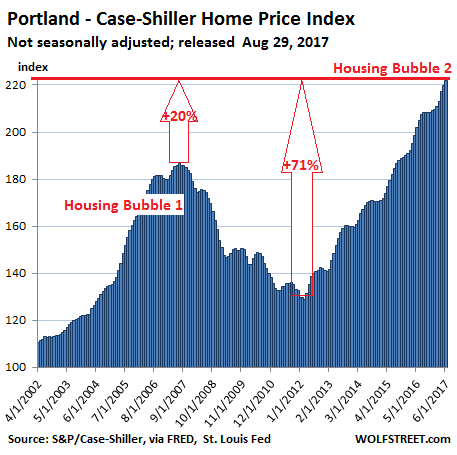
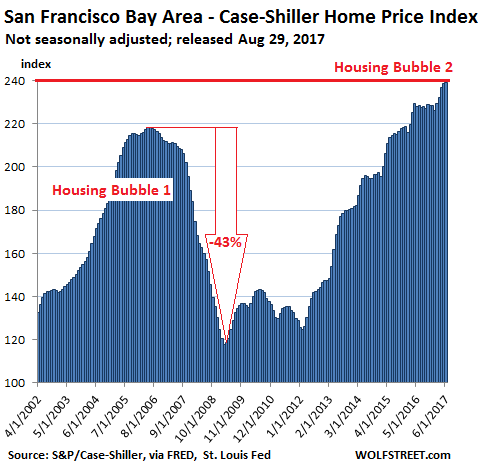
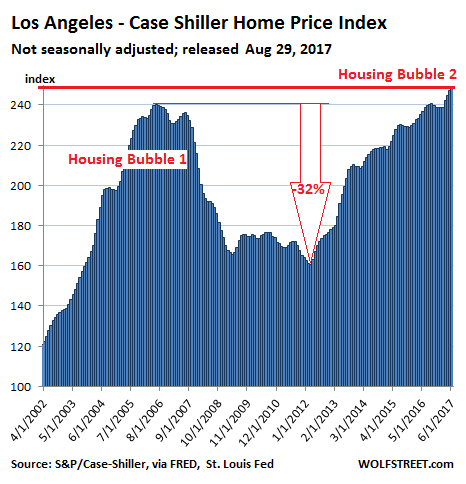
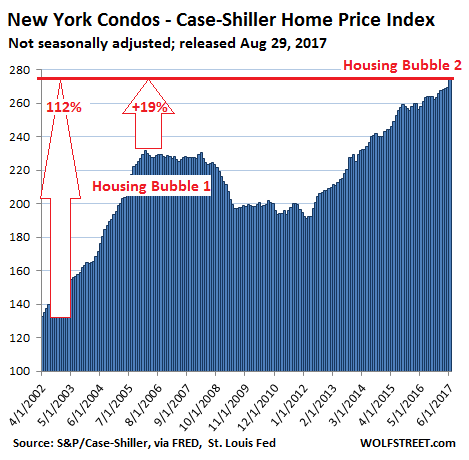


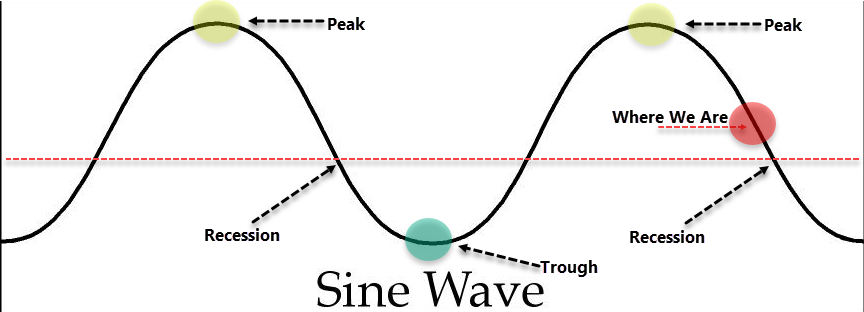


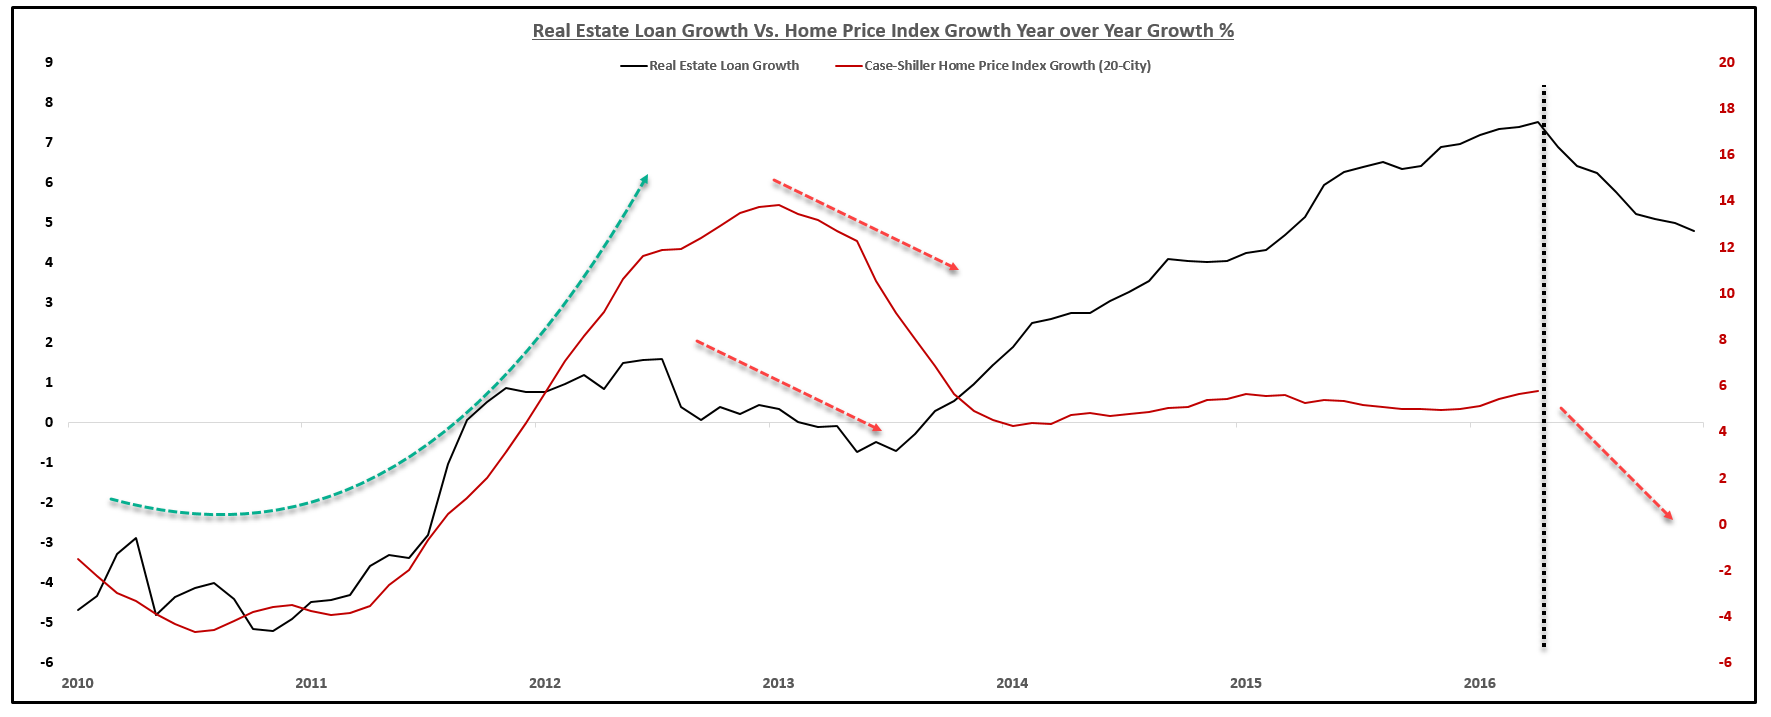
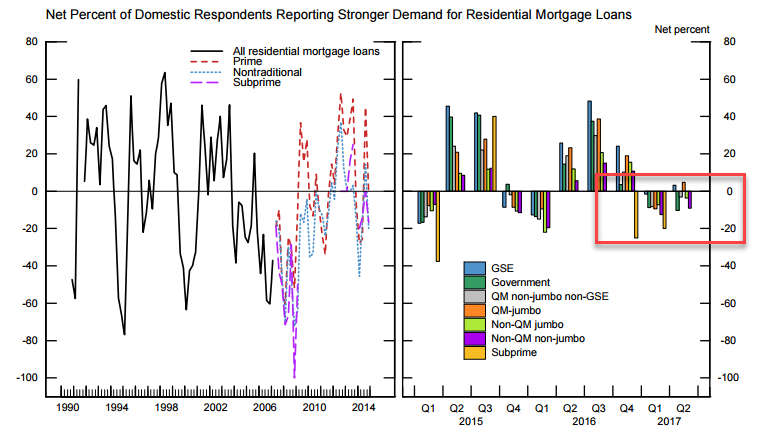
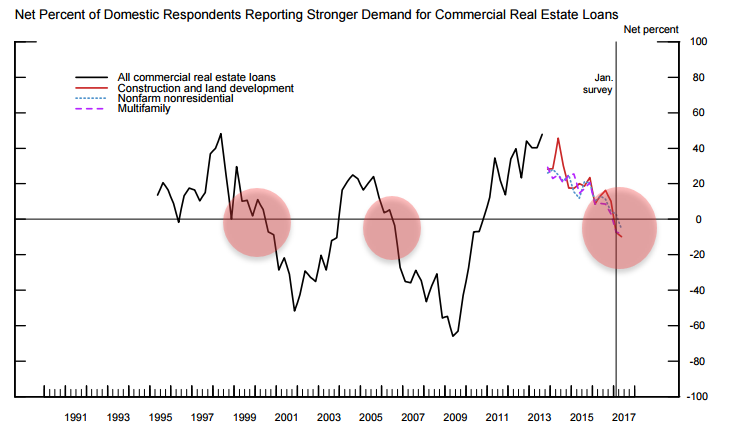
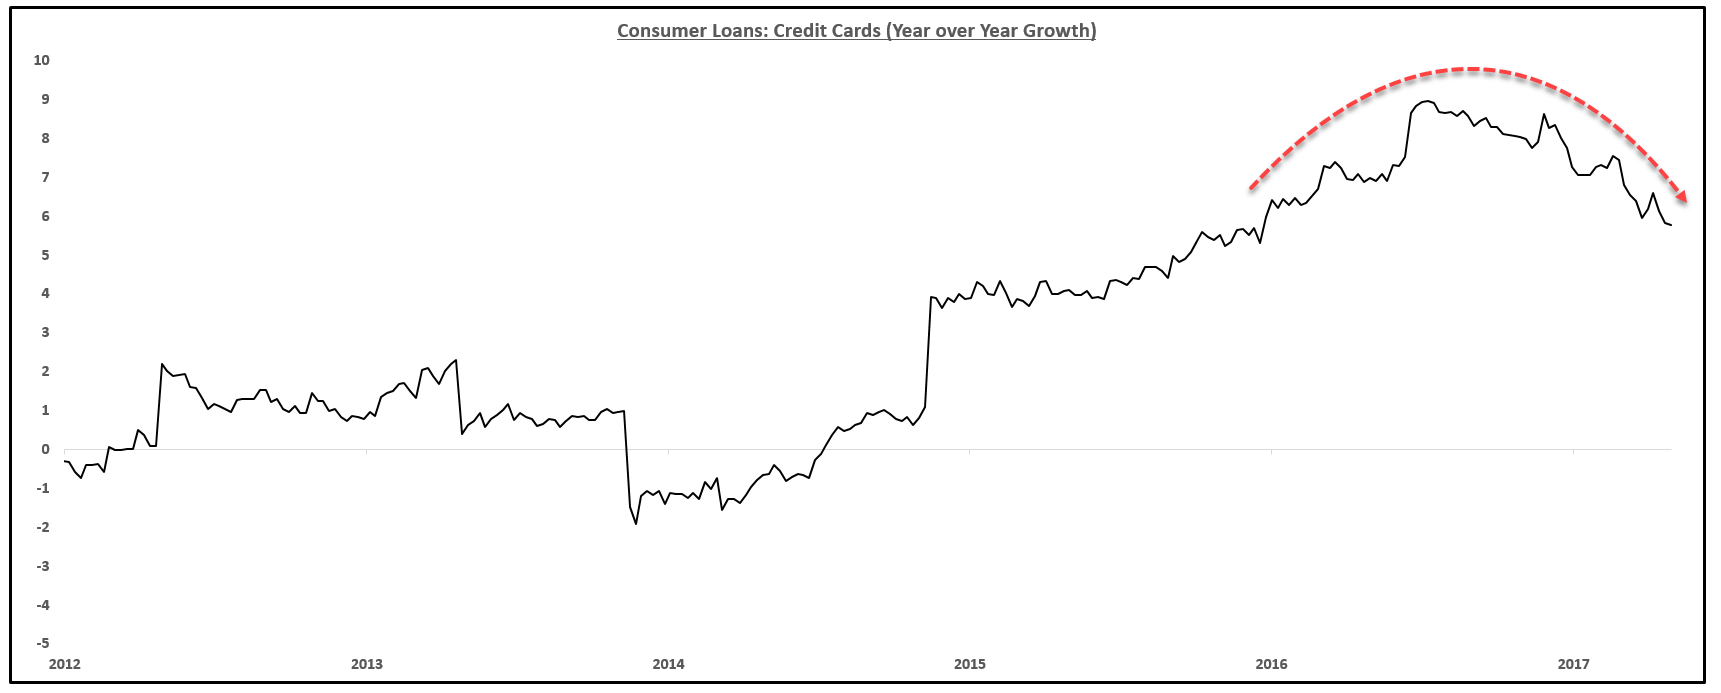
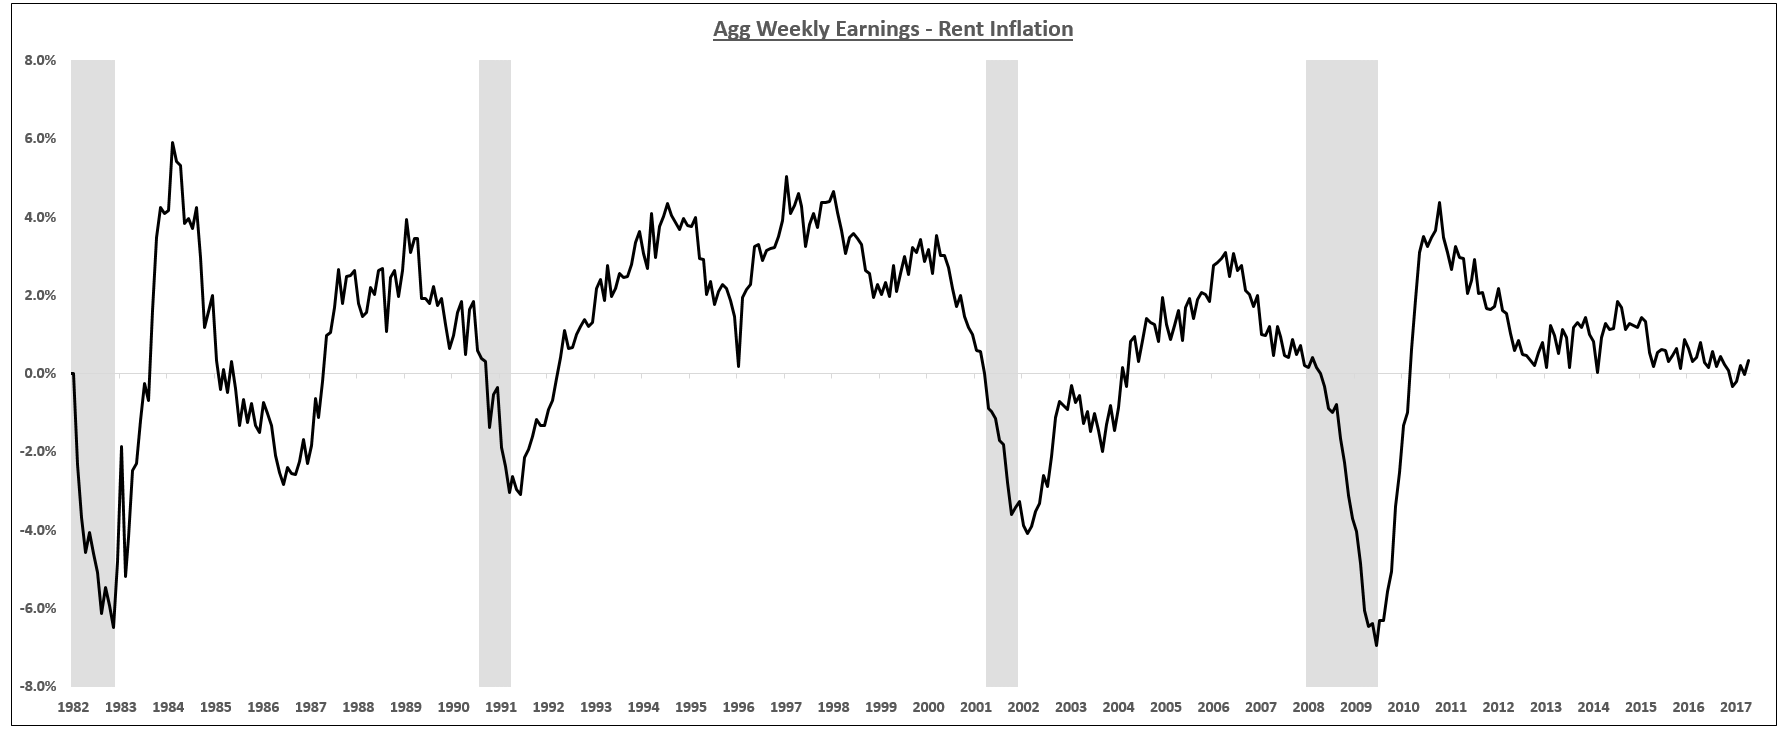
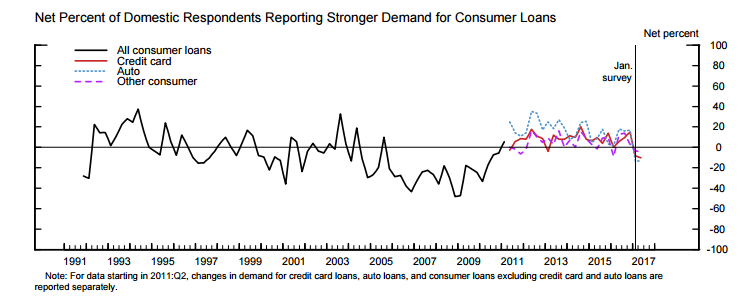
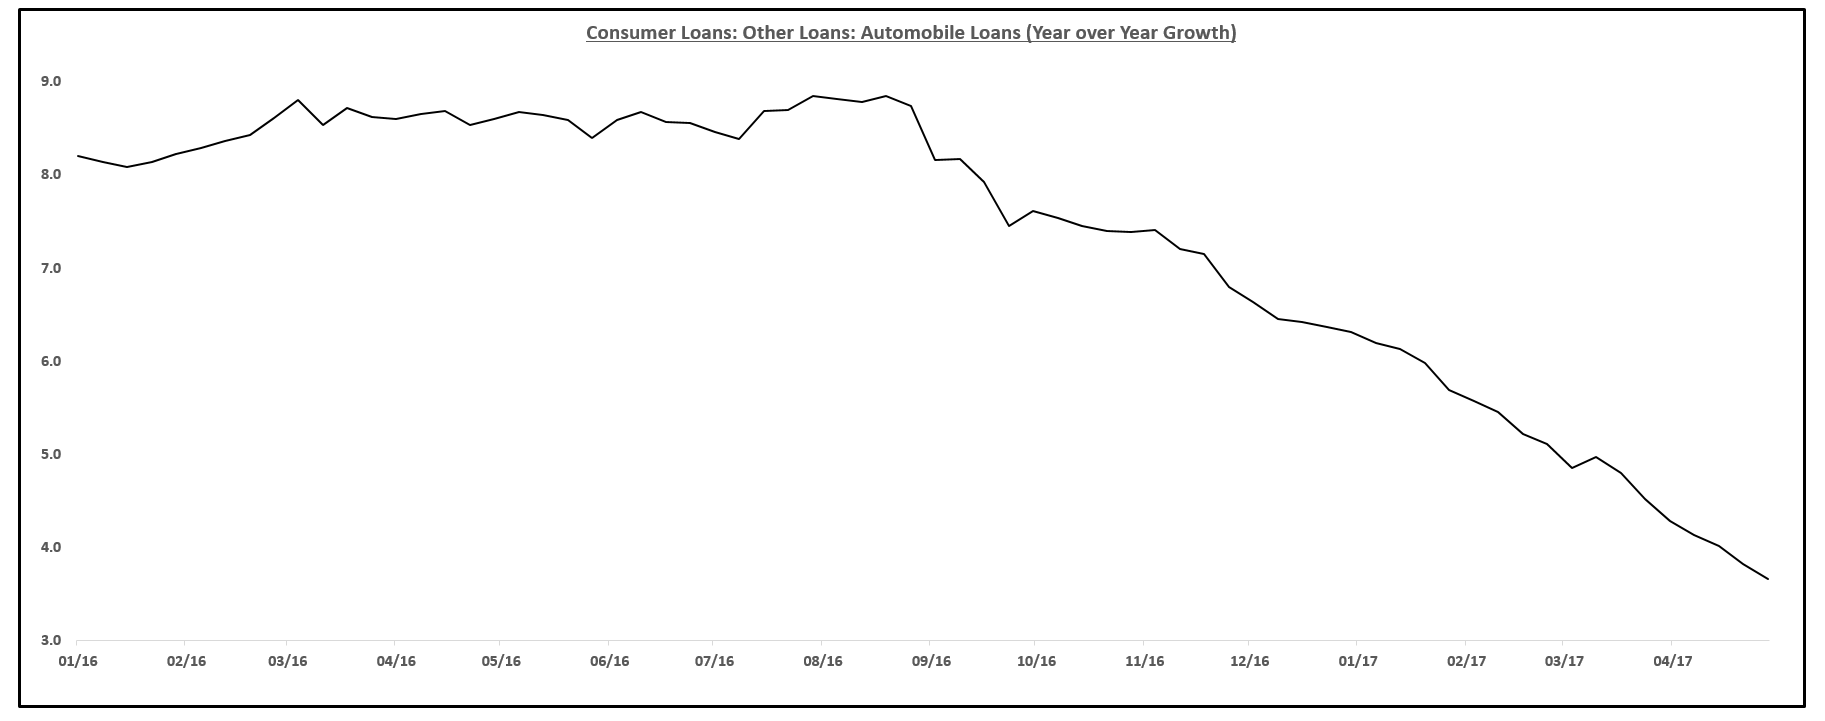
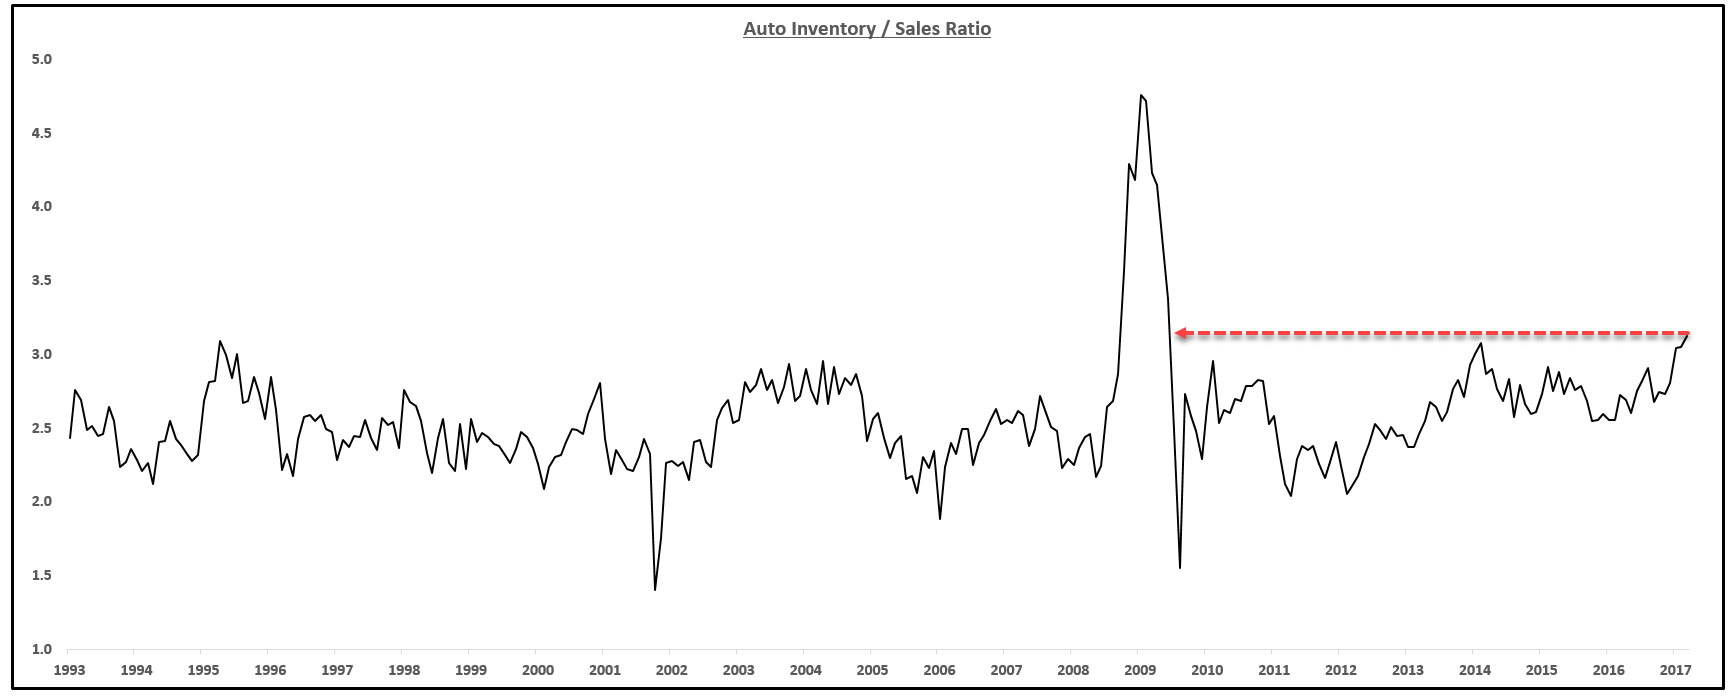
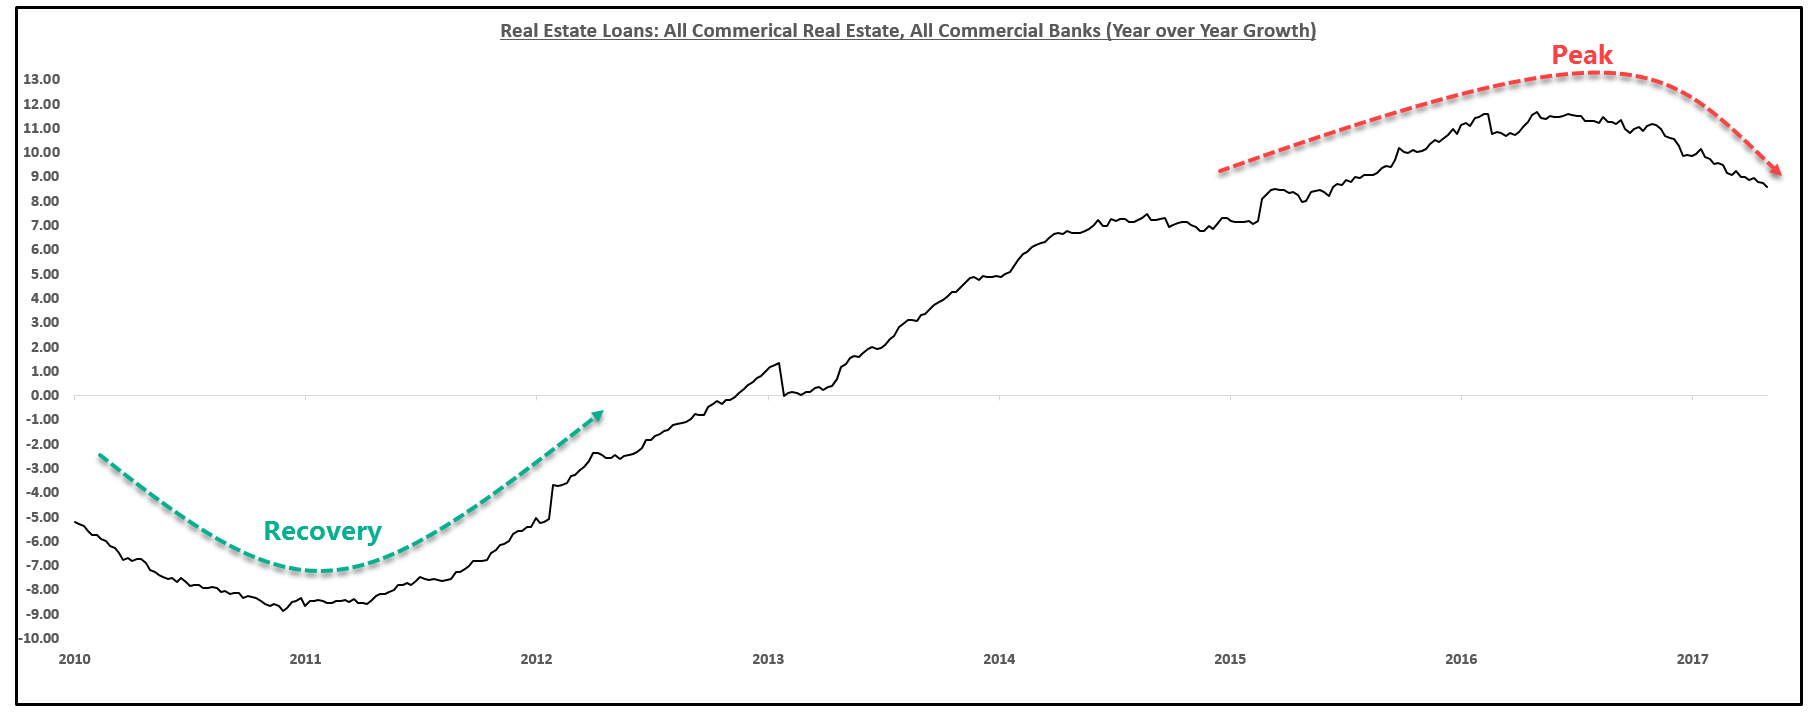
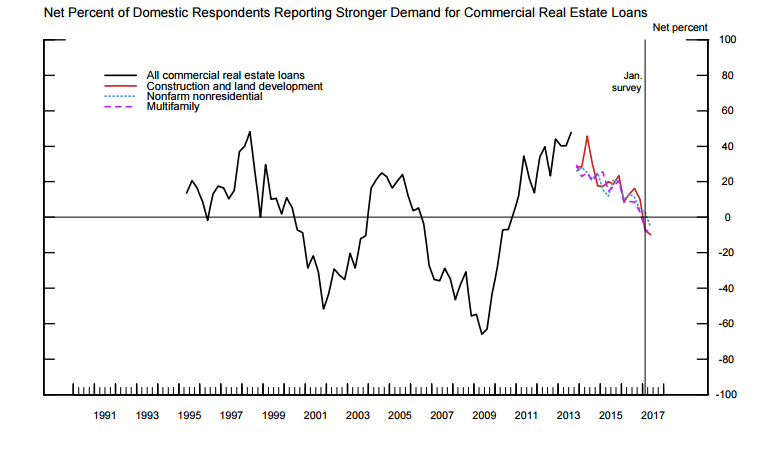
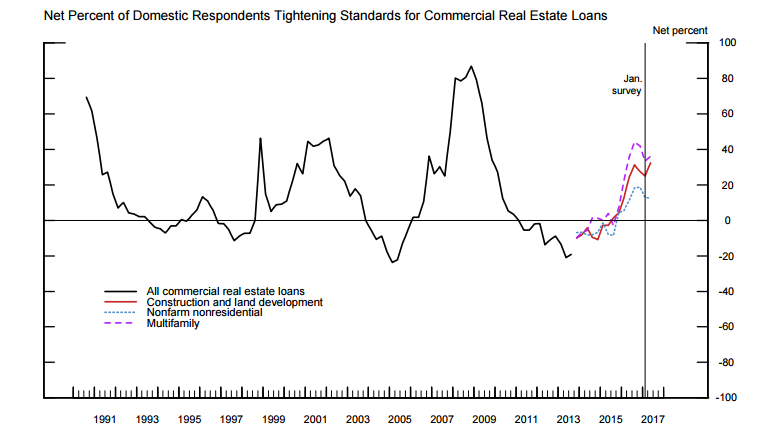
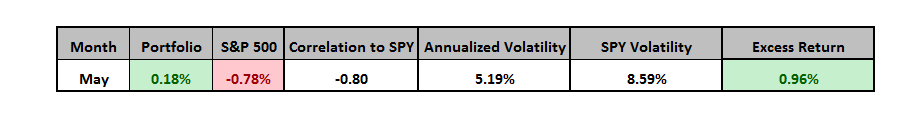


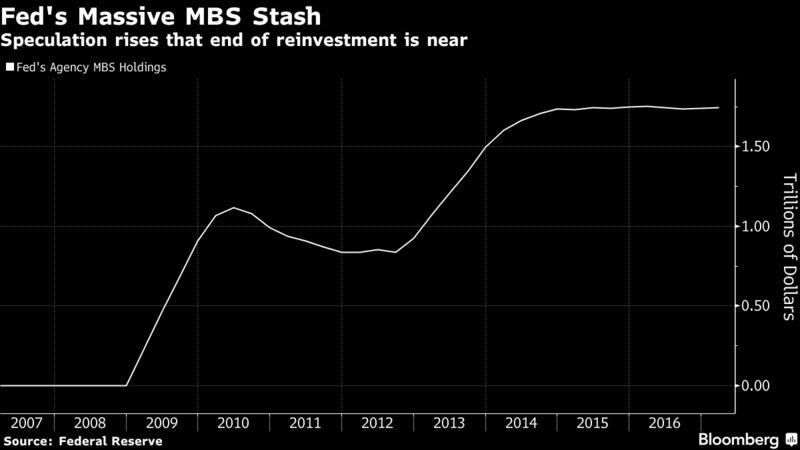
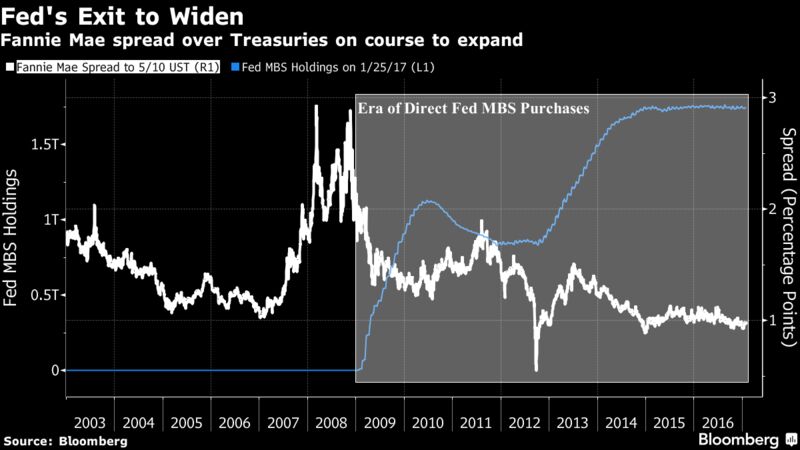
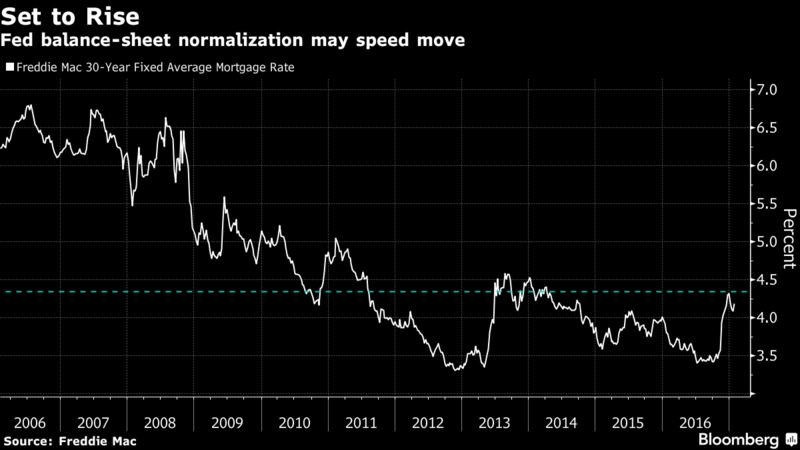
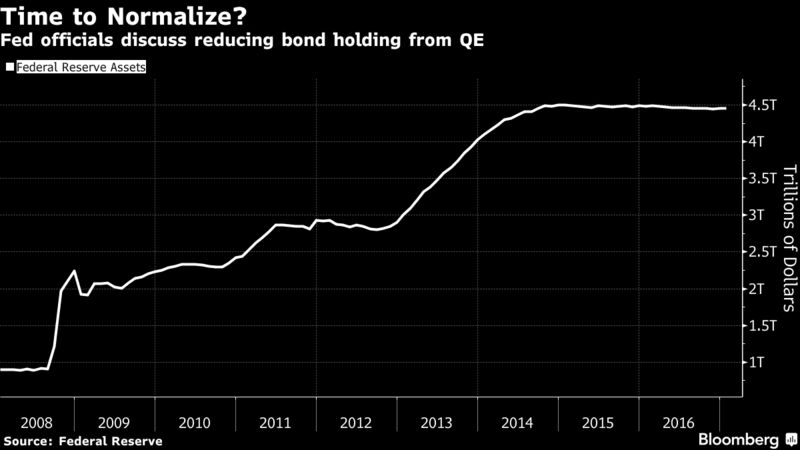


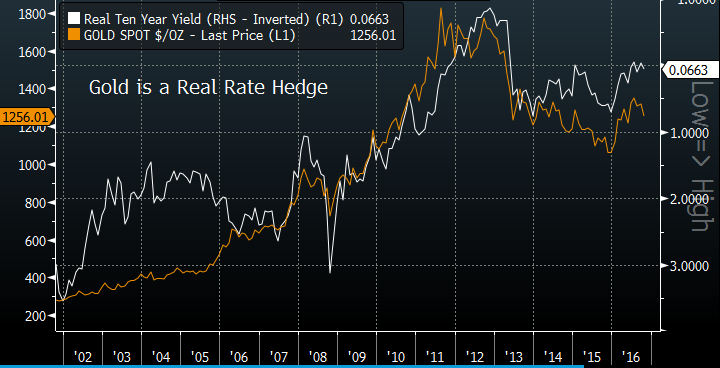
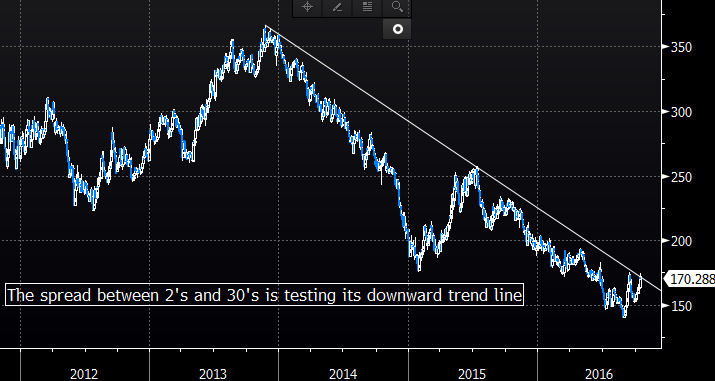
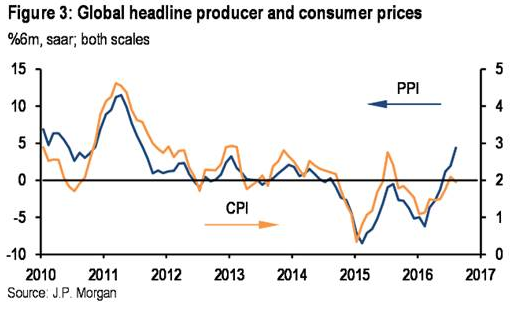
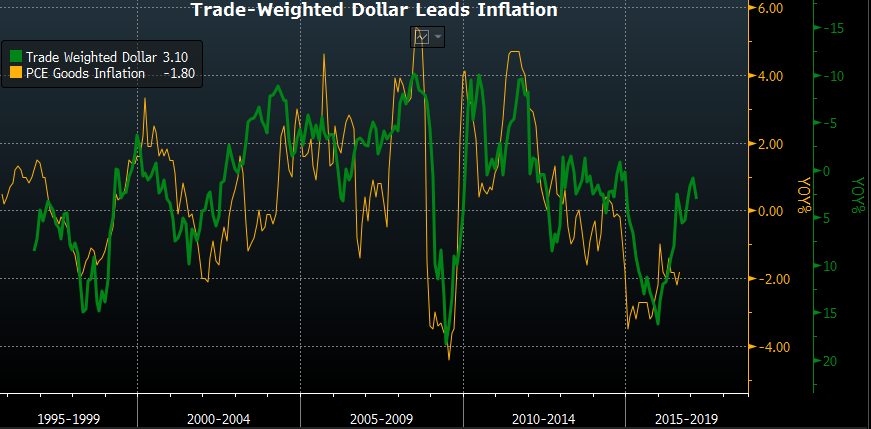


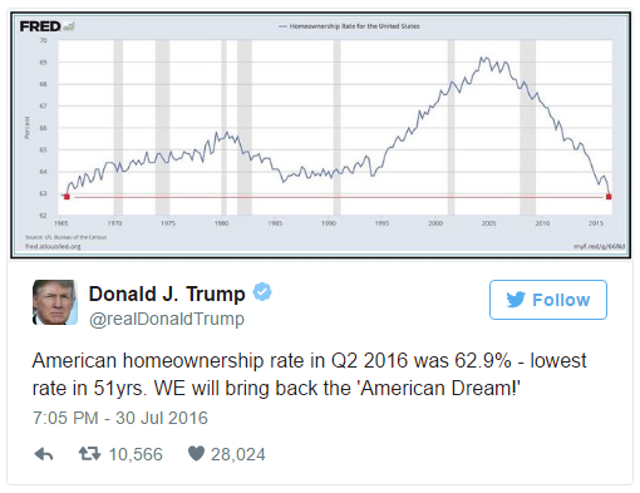
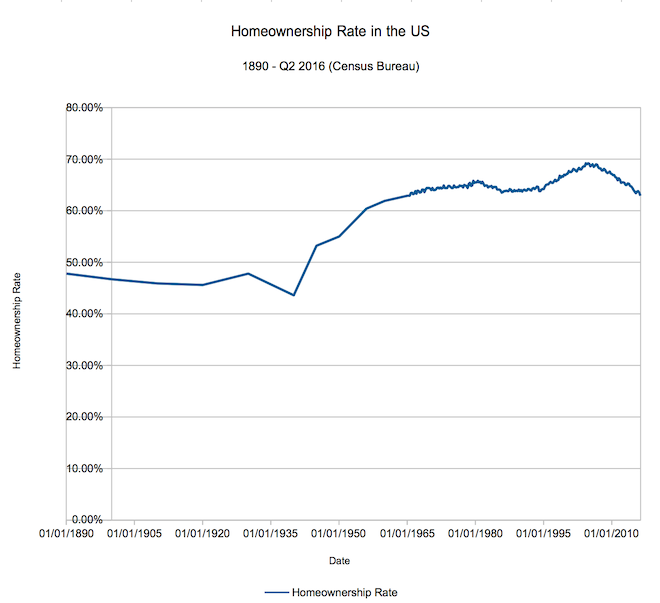

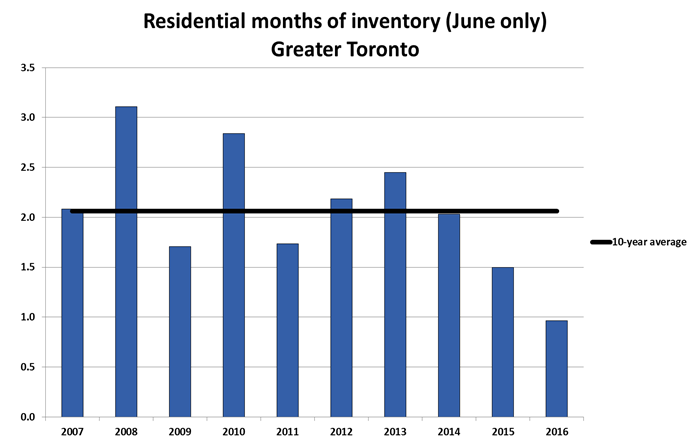
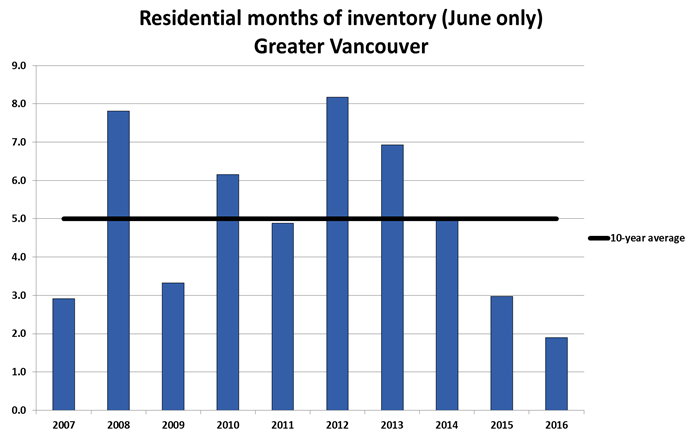
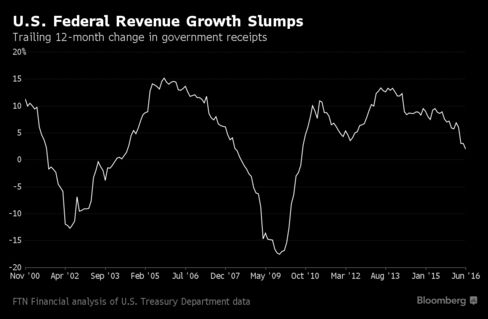
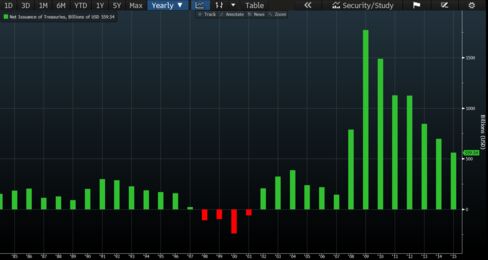
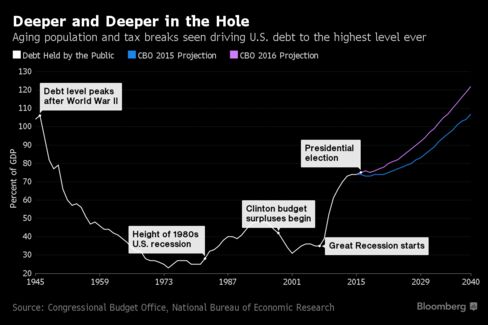
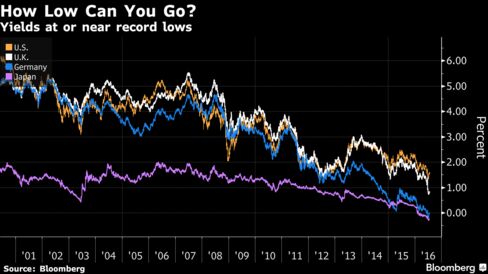


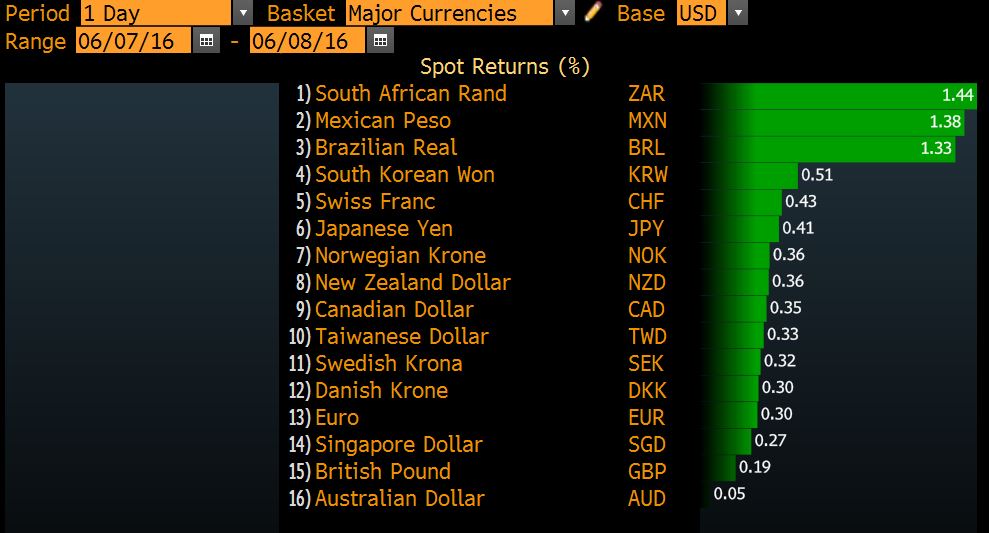


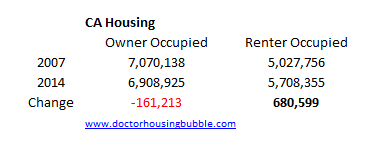
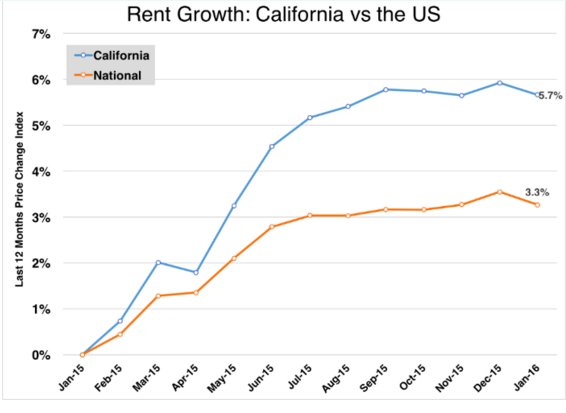
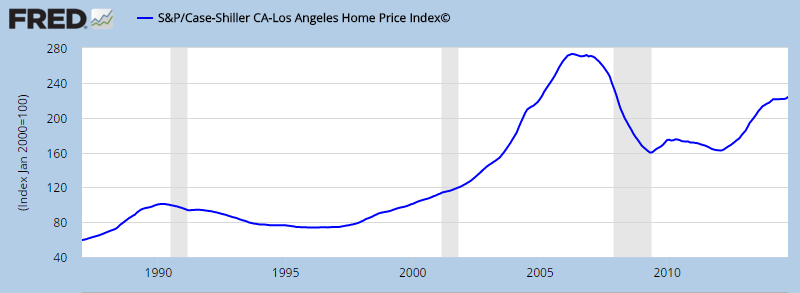
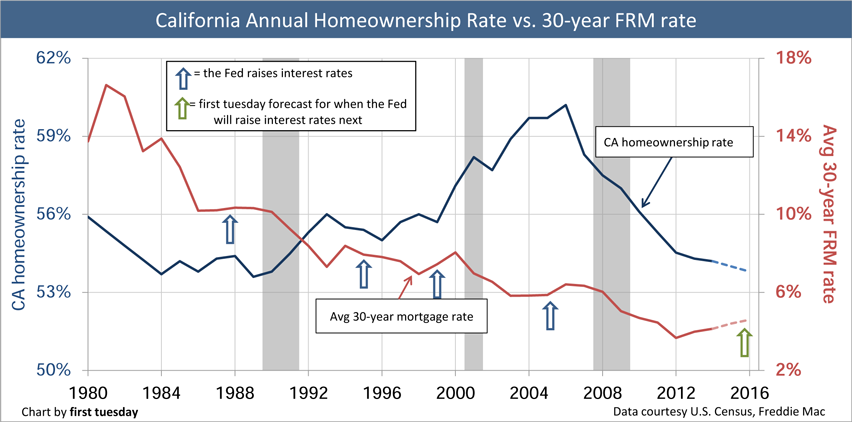


You must be logged in to post a comment.