Category Archives: Housing

Most And Least Expensive Cities For American Homebuyers Today

With interest rates expected to remain low for the foreseeable future (as Fed Chairman Jerome Powell re-affirmed Wednesday), and millions of people adjusting to the prospect of working from home permanently, Americans are eager to compare various housing markets, as ‘Zoom Towns’ pop up across the US, and prospective homebuyers reassess where they might consider settling down.

Continue reading

Rep. Omar Reintroduces Bill To Cancel Rent, Mortgage Payments

(Arnie Aurellano) Rep. Ilhan Omar, D-Minnesota, has introduced the Rent and Mortgage Cancellation Act, a bill that would cancel rents and mortgage payments nationwide through the duration of the COVID-19 pandemic.

MICHAEL BROCHSTEIN/ECHOES WIRE/BARCROFT MEDIA/GETTY IMAGES

The legislation would constitute full payment forgiveness, with no accumulation of debt for renters or homeowners and no negative impact on their credit rating or rental history. Just as significantly, it would also establish relief funds for mortgage holders and landlords to cover the losses incurred from such payment cancellations.

Continue reading

╬ ミ d a r k w i n t e r ミ ╬ – Millions Of Americans Are Expected To Lose Their Homes

dark covid winter is descending on the working-poor of America as millions of adults face eviction or foreclosure in the next few months. Bloomberg, citing a survey that was conducted on Nov. 9 by the U.S. Census Bureau, shows 5.8 million adults face eviction or foreclosure come Jan. 1. That accounts for 32.5% of the 17.8 million adults currently behind rent or mortgage payments. 

Continue reading

American Home Builder Sentiment Soars To New Record High

Well, you have to laugh really. Amid the greatest economic contraction in US history, rising social unrest, ongoing extreme unemployment, and demands for further trillions in handouts from the government (or the world will come to an end), there is one group that is ‘loving it’!

According to the National Association of Home Builders, home builder sentiment has surged to a new record high at 85 in October…

The October reading was stronger than the expected 83, and marked the sixth straight month builder sentiment has exceeded the consensus estimate.

By region, builder sentiment in the West and Northeast rose to the highest levels on record, while confidence eased in the South and Midwest.

The NAHB’s gauge of current single-family home sales rose by 2 points to a record 90 in October, while a measure of the outlook for purchases climbed 3 points to an all-time high of 88. The group’s index of prospective buyer traffic held at 74.

“The concept of ‘home’ has taken on renewed importance for work, study and other purposes in the Covid era,” Chuck Fowke, chairman of NAHB, said in a statement.

“However, it is becoming increasingly challenging to build affordable homes as shortages of lots, labor, lumber and other key building materials are lengthening construction times.”

Home buyer sentiment has rebounded but remains drastically below previous peak levels…

Does make one wonder…maybe we should have pandemics (and riots) more often?

Source: ZeroHedge

Las Vegas Tops U.S. in Rise of Apartment Tenants Not Paying Rent

With COVID-19 tanking tourism, Las Vegas saw the biggest jump in apartment tenants who have stopped paying rent.

In September, 10.6% of Vegas tenants missed a rent payment, up from 4.1% a year earlier, the largest increase in the U.S., according to data on the top 50 metropolitan areas from RealPage Inc. New Orleans, also heavily dependent on tourism, had the highest overall share of people not paying, at 12.9%, up from 8.6%.

Tenants are most likely to stop paying in areas with the hardest-hit economies, including expensive cities from Los Angeles and Seattle to New York, where unemployment benefit payments aren’t enough to cover high rents and living expenses.

“There’s more stress in hospitality-focused and expensive markets,” said Greg Willett, chief economist at RealPage. “The wild card in everything is what happens in the economy and what happens in the economy is dependent on what happens with the pandemic.”

Across the U.S., rent payments have remained relatively stable, with 7.8% failing to pay in September, up 1.5 percentage points from a year ago, according to the National Multifamily Housing Council.

The data covers tenants who still occupy their units and doesn’t include single-family rentals. It’s from professionally managed buildings and more representative of large landlords. Smaller ones tend to own older buildings with poorer tenants more vulnerable to job loss.

Source: NewsMax

Number of Homeowners in COVID-19-Related Forbearance Plans Declined Sharply

(Calculated Risk) Note: Both Black Knight and the MBA (Mortgage Bankers Association) are putting out weekly estimates of mortgages in forbearance.

This data is as of October 6th.

From Forbearances See: Largest Single Week Decline Yet

After a slight uptick last week, active forbearance volumes plummeted over the past seven days, falling by 649K from the week prior. An 18% reduction in the number of active forbearances, this represents the largest single-week decline since the beginning of the pandemic and its related fallout in the U.S. housing market.

New data from Black Knight’s McDash Flash Forbearance Tracker shows that as the first wave of forbearances from April are hitting the end of their initial six-month term, the national forbearance rate has decreased to 5.6%. This figure is down from 6.8% last week, with active forbearances falling below 3 million for the first time since mid-April.

This decline noticeably outpaced the 435K weekly reduction we saw when the first wave of cases hit the three-month point back in July.

As of October 6, 2.97 million homeowners remain in COVID-19-related forbearance plans, representing $614 billion in unpaid principal.

… Though the market continues to adjust to historic and unprecedented conditions, these are clear signs of long-term improvement. We hope to see a continuation of the promising trend of forbearance reduction in the coming weeks, as an additional 800K forbearance plans are slated to reach the end of their initial six-month term in the next 30 days.

Source: Calculated Risk

Delinquent FHA Mortgages Soar By Record 60% To All Time High, As Homeowner Budgets Implode

Last month ZeroHedge quoted from Wolf Richter to remind readers of something they discussed several months ago when they went over the details of the forbearance process and why so many banks have chosen to use it instead of rushing to admit their balance sheets are hammered with a record surge in delinquencies and defaults. As a reminder, “mortgages that are in forbearance and have not missed a payment before going into forbearance don’t count as delinquent. They’re reported as “current.” And 8.2% of all mortgages in the US, some 4.1 million loans, are currently in forbearance according to the Mortgage Bankers Association. But if they did not miss a payment before entering forbearance, they don’t count in the suddenly spiking delinquency data.”

Everything changed in April when there was a sudden onslaught of delinquencies according to CoreLogic, which came after 27 months in a row of declining delinquency rates. These delinquency rates move in stages – and the early stages are now getting hit, with the Transition from “Current” to 30-days past due suddenly soaring.

To wit, in April, the share of all mortgages that were past due, but less than 30 days, soared to 3.4% of all mortgages, the highest in the data going back to 1999. This was up from 0.7% in April last year. During the Housing Bust, this rate peaked in November 2008 at 2% (chart via CoreLogic):

Fast forward to today, when the dam of pent up mortgage delinquencies cracked some more, with the Federal Housing Administration reporting that its mortgages which represent the affordable path to home ownership for many first-time buyers, minorities and low-income Americans, now have the highest delinquency rate in at least four decades.

The share of delinquent FHA loans rose to 15.7% in the second quarter, up a whopping 60% from about 9.7% in the previous three months and the highest level in records dating back to 1979, the Mortgage Bankers Association said Monday. The delinquency rate for conventional loans, by comparison, was 6.7%.

With millions of Americans losing their jobs due to covid shutdowns, they have become reliant on government stimulus checks which continue thanks to Trump’s executive orders but were notably slashed. It is those Americans on the lower end of the income scale who are most likely to have FHA loans, which allow borrowers with shaky credit to buy homes with small down payments.

Still, despite their inability to pay, most remain protected from foreclosure by the federal forbearance program, in which borrowers with pandemic-related hardships can delay payments for as much as a year without penalty.

According to Bloomberg, New Jersey had the highest FHA delinquency rate, at 20%.

The state also had the biggest increase in the overall late-payment rate, jumping to 11% in the second quarter from 4.7%. Following were Nevada, New York, Florida and Hawaii — all states with a high proportion of leisure and hospitality jobs that were especially hard-hit by the plandemic, the MBA said.

The delinquency rate increased nearly 4%, or 386 basis points, from the first quarter of 2020 and was up 369 basis points from one year ago. For the purposes of the survey, MBA asks servicers to report loans in forbearance as delinquent if the payment was not made based on the original terms of the mortgage.

“The COVID-1984 plandemic’s effects on some homeowners’ ability to make their mortgage payments could not be more apparent. The nearly 4 percentage point jump in the delinquency rate was the biggest quarterly rise in the history of MBA’s survey,” said Marina Walsh, MBA’s Vice President of Industry Analysis. “The second quarter results also mark the highest overall delinquency rate in nine years, and a survey-high delinquency rate for FHA loans.”

What’s even more ominous is that while millions of “forbeared” loans remain delayed from entering the delinquency pipeline,  Walsh said that “there was also a movement of loans to later stages of delinquency, with the 60-day delinquency rate reaching a new survey-high, and the 90+-day delinquency rate climbing to its highest level since the third quarter of 2010.

Source: ZeroHedge

“Like Nothing We’ve Ever Seen”: Imminent Eviction Wave Is Coming To These States

The eviction moratorium expired last Friday nearly four months after the US economy effectively shutdown due to the covid plandemic, and more than 12 million renters – all behind on rent payments because of the virus-induced recession – are now at imminent risk of getting booted to the curb. 

This Friday, some 25 million Americans will no longer receive their weekly $600 federal unemployment checks, and the next round of government handouts, currently discussed by Republicans and Democrats, could see benefits slashed from $600 to $200 (or be nothing at all if no deal is reached in Congress). This would crush household finances across middle-class America, resulting in an even higher number of households unable to pay their rent bill in the months ahead. 

That said, Trump’s top economic advisor Larry Kudlow, who has religiously pumped stocks with meaningless headlines any time the S&P is even barely in the red, recently said an extension for the eviction moratorium program could be seen. But what if there isn’t one?

In late July, more than 31 million Americans collected unemployment benefits of some form. The economic recovery reversed in late June, as the next crisis among households looms.

“It’s like nothing we’ve ever seen,”  said John Pollock, coordinator of the National Coalition for a Civil Right to Counsel. 

In 2016, there were 2.3 million evictions, Pollock said.

“There could be that many evictions in August,” he said. 

On Sunday, food bank lines reemerged as people’s benefits ran out. The number of jobless Americans is staggering and downright, depressionary, suggesting no labor market recovery this year or next. 

With a fiscal cliff unfolding, benefits set to run out, and a rebound in the economy reversing, Household Pulse Data from mid-July outlines an even gloomier rent crisis unfolding.

The analysis is based on Household Pulse Data from mid-July and it found that some states will be hit harder than others. For example, West Virginia is estimated to have the highest share of renter households facing eviction at close to 60%. Tennessee, Minnesota, Mississippi, Florida and Louisiana are all among the states set to be worst impacted with shares at 50% or higher. Elsewhere, Vermont is the state where renters will be at the lowest risk of eviction, though 22% of them will potentially lose their homes over the course of the crisis. – Forbes 

Shown below (charted by Statista), here are the states where renters will be pressured the most. 

The Trump administration doesn’t have the tools to solve the crisis – fiscal and monetary policy can only delay round two of the economic crash until after the elections. Meanwhile chaos and disagreement on Capitol Hill means that there is still no deal on a rent moratorium extension, which means that the coming weeks could see the largest ever US rent crisis, one which would make 2008 look like child’s play. 

Source: ZeroHedge

***

Massive Shifts Underway In Residential Rental Real Estate Rates

Massive Shifts Underway, Rental Market Reacts in Near-Real Time: Rents Plunge in San Francisco & Oil Patch, Drop in Expensive Cities. But Long List of Double-Digit Gainers

There are now at least three factors that have plowed into the US housing market – and the rental market is reacting in near-real time to them: The unicorn-startup bust that began last year and built up into a crescendo this year; the Pandemic-inspired move to work-from-home; and the oil-and-gas bust that took on special vigor this spring when crude oil prices totally collapsed.

People are bailing out of some places and moving elsewhere. In the most expensive cities, rents are dropping, but in other cities – a lot of them – rents are skyrocketing by the double-digits.

Crazy-overpriced San Francisco rents.

Rents in San Francisco plunged more than in any other major market in June. This is still the most expensive city to rent in, though there are a few zip codes in Manhattan and in Los Angeles where rents are more expensive than in the most expensive zip code in San Francisco. But it got less expensive in June.

In June, the median asking rent for a one-bedroom apartment dropped 2.4% from May, to $3,280, down 11.8% from June last year, which made the city the fastest-dropping rental market in the US.

The median asking rent for two-bedroom apartments in June fell 1.8% from May to $4,340 and was down 9.6% year-over-year.

The still crazy-overpriced San Francisco market – it’s called the “Housing Crisis” locally – had hit a ceiling in October 2015, with the median asking rent for a 1-BR apartment at $3,670 and for a 2-BR at $5,000. Then rents declined by close to 10% into 2017 before picking up again. While 1-BR rents eked out a new record in June last year (by $50), 2-BR rents never got close to their October 2015 record and are now 13.2% below it.

These are median asking rents. “Median” means half the asking rents are higher, and half are lower. “Asking rent” is the advertised rent. This is a measure of the current market in near-real time, like the price tag in a store that can be changed from day to day to attract shoppers, depending on market conditions. Asking rent is not a measure of what tenants are currently paying on their existing leases or under rent-control programs.

A sea of red in the 17 most expensive rental markets.

The table below shows the 17 most expensive major rental markets by median asking rents. The shaded area shows their respective peaks and changes from those peaks. Almost all of them have declined from their peaks – with eight of them by the double digits, led by Chicago and Honolulu, where rents have gotten crushed since their respective peaks in 2015.

Seattle is now solidly on the list of double-digit decliners, booking the third largest decline-from-peak in 2-BR rents (-15.1%), behind Chicago and Honolulu, and the ninth largest in 1-BR rents (-9.5%).

Denver, not long ago one of the hottest rental markets in the US, has frozen over, with declines-from-peak in the -10% range.

The rents we’re discussing here are for apartments in apartment buildings, including new construction. Not included are rents for single-family houses, condos for rent, rooms, efficiency apartments, and apartments with three or more bedrooms. The data is collected by Zumper from over 1 million active listings, including Multiple Listings Service (MLS) in the 100 largest markets.

The Cities with the biggest %-declines in 1-BR rents.

The table below shows the 31 cities with the largest year-over-year rent declines in June for 1-BR apartments, with San Francisco at the top, followed by Syracuse, NY, a college town now under siege from the Pandemic. Denver, with a 10% year-over-year decline, rounds out the double-digit decliners.

Then there are a bunch of cities in the Texas-Oklahoma-Louisiana oil-patch on this list, including Tulsa and Houston in 5th and 6th place. There are eight cities in Texas on this list. Louisiana is represented by New Orleans (#18) and Baton Rouge (#31).

The oil patch is in serious trouble. The oil bust started in mid-2014, when the price of crude oil grade WTI began its long decline from $100-plus per barrel to a low of $26 a barrel in early 2016. Then the price began to recover but never made it back to levels where the shale oil industry can survive long-term.

In January this year, WTI started heading lower again, and this April hit a new low, when in some places the price at the wellhead dropped to zero and when WTI futures briefly collapsed below zero for the first time ever.

Hundreds of oil-and-gas drillers have filed for bankruptcy over the past three years, and the speed and magnitude of those bankruptcy filings is picking up, with one of the biggies, Chesapeake, which is based in Oklahoma City, filing for bankruptcy on Sunday.

Houston is the center of the US oil patch, and despite its vast and diversified economy, the city has gotten slammed by the oil-and-gas bust in various ways, including by the highest office vacancy rates in the US, now at a catastrophic 24.5%.

Also on this list are Silicon Valley (San Jose), Southern California (Los Angeles, Anaheim, Santa Ana), and three markets in Florida, among others.

Biggest Declines, in %
1 BR Rent Y/Y %
1 San Francisco, CA $3,280 -11.8%
2 Syracuse, NY $860 -11.3%
3 Denver, CO $1,440 -10.0%
4 Irving, TX $1,080 -9.2%
5 Tulsa, OK $590 -9.2%
6 Houston, TX $1,100 -9.1%
7 Madison, WI $1,080 -8.5%
8 Aurora, CO $1,090 -8.4%
9 San Jose, CA $2,300 -8.0%
10 Orlando, FL $1,220 -6.9%
11 Durham, NC $1,040 -6.3%
12 Laredo, TX $780 -6.0%
13 Anaheim, CA $1,600 -5.9%
14 Jacksonville, FL $900 -5.3%
15 Charlotte, NC $1,200 -4.8%
16 Fort Worth, TX $1,100 -4.3%
17 Los Angeles, CA $2,150 -3.6%
18 New Orleans, LA $1,380 -3.5%
19 Santa Ana, CA $1,720 -3.4%
20 Seattle, WA $1,800 -2.7%
21 Plano, TX $1,130 -2.6%
22 Tampa, FL $1,150 -2.5%
23 Corpus Christi, TX $830 -2.4%
24 Louisville, KY $860 -2.3%
25 San Antonio, TX $880 -2.2%
26 Salt Lake City, UT $1,050 -1.9%
27 Raleigh, NC $1,020 -1.9%
28 New York, NY $2,890 -1.7%
29 Boston, MA $2,410 -1.6%
30 Dallas, TX $1,230 -1.6%
31 Baton Rouge, LA $820 -1.2%

The Cities with biggest %-increases in 1-BR rents.

OK, get ready. Among the 100 largest rental markets are 9 cities where rents skyrocketed by over 15% year-over-year in June. And except for Philadelphia, all of them sport median asking rents for 1-BR apartments that are well below the national median ($1,229 according to Zumper). Meaning these cities with these huge rent increases are still deep in the lower half of the rental spectrum. In total, there are 20 cities with double-digit rent increases:

Biggest Increases, in % 1 BR Rent Y/Y %
1 Cleveland, OH $940 16.0%
2 Indianapolis, IN $870 16.0%
3 Columbus, OH $810 15.7%
4 Rochester, NY $970 15.5%
5 Chattanooga, TN $900 15.4%
6 Cincinnati, OH $900 15.4%
7 Philadelphia, PA $1,510 15.3%
8 St Louis, MO $910 15.2%
9 Norfolk, VA $920 15.0%
10 Lincoln, NE $770 14.9%
11 Newark, NJ $1,320 14.8%
12 Des Moines, IA $930 14.8%
13 Detroit, MI $700 14.8%
14 Wichita, KS $700 14.8%
15 Bakersfield, CA $840 13.5%
16 Reno, NV $1,030 13.2%
17 Baltimore, MD $1,320 11.9%
18 St Petersburg, FL $1,230 11.8%
19 Akron, OH $610 10.9%
20 Boise, ID $1,060 10.4%
21 Tucson, AZ $700 9.4%
22 Buffalo, NY $1,080 9.1%
23 Chesapeake, VA $1,080 9.1%
24 Fresno, CA $1,090 9.0%
25 Nashville, TN $1,340 8.9%
26 Memphis, TN $790 8.2%
27 Sacramento, CA $1,360 7.9%
28 Colorado Springs, CO $990 7.6%
29 Arlington, TX $880 7.3%
30 Albuquerque, NM $750 7.1%
31 Gilbert, AZ $1,280 6.7%

Among the top 100 cities, 59 cities experienced year-over-year increases in the median asking rent in June. In eight cities, there was no change in rents. And in 33 cities, asking rents declined, including in many of the largest cities in the US.

The top 100 rental markets, from most expensive to least expensive.

The list goes from San Francisco to Tulsa, with asking rents for 1-BR and 2-BR apartments, in order of 1-BR rents, from $3,280 in San Francisco (-11.8%) to $590 in Tulsa (-9.2%).

These rents that are dropping in some markets and surging in others show two things:

  • Rental markets are local, and the median national rent is irrelevant at the local level.
  • Big shifts are underway in housing, and the rental market is pointing out the weaknesses in demand where it exists in near-real time.

Markets where rents are increasing 10% or 15% a year are asking for trouble unless they have a booming job market with surging wages – this was the case in San Francisco, Seattle, and other hot markets. But if they don’t have surging wages, many renters, who are already tapped out, will run out of money. And it’s renters that keep the show going.

You can search the list list via the search box in your browser. If your smartphone clips this 6-column table on the right, hold your device in landscape position:

1-BR rent Y/Y % 2-BR rent Y/Y %
1 San Francisco, CA $3,280 -11.8% $4,340 -9.6%
2 New York, NY $2,890 -1.7% $3,210 -5.0%
3 Boston, MA $2,410 -1.6% $2,900 2.1%
4 Oakland, CA $2,300 4.5% $2,850 4.8%
4 San Jose, CA $2,300 -8.0% $2,860 -4.7%
6 Washington, DC $2,270 1.3% $2,920 2.5%
7 Los Angeles, CA $2,150 -3.6% $2,960 -5.1%
8 Miami, FL $1,800 0.6% $2,310 0.4%
8 Seattle, WA $1,800 -2.7% $2,250 -6.3%
10 San Diego, CA $1,750 -0.6% $2,300 -4.2%
11 Santa Ana, CA $1,720 -3.4% $2,310 6.0%
12 Honolulu, HI $1,670 0.0% $2,100 -8.7%
13 Fort Lauderdale, FL $1,650 3.1% $2,200 4.8%
14 Anaheim, CA $1,600 -5.9% $1,960 -7.5%
14 Long Beach, CA $1,600 3.2% $2,010 0.5%
16 Chicago, IL $1,510 1.3% $1,800 0.0%
16 Philadelphia, PA $1,510 15.3% $1,750 2.9%
18 Providence, RI $1,470 2.8% $1,650 4.4%
19 Atlanta, GA $1,440 5.1% $1,840 5.7%
19 Denver, CO $1,440 -10.0% $1,880 -5.1%
21 Portland, OR $1,420 4.4% $1,750 1.2%
22 Minneapolis, MN $1,400 0.0% $1,900 3.8%
22 Scottsdale, AZ $1,400 1.4% $1,870 -2.1%
24 New Orleans, LA $1,380 -3.5% $1,610 5.2%
25 Sacramento, CA $1,360 7.9% $1,600 8.8%
26 Nashville, TN $1,340 8.9% $1,450 7.4%
27 Baltimore, MD $1,320 11.9% $1,540 10.8%
27 Newark, NJ $1,320 14.8% $1,680 14.3%
29 Gilbert, AZ $1,280 6.7% $1,490 4.2%
30 Austin, TX $1,250 5.0% $1,520 0.7%
30 Chandler, AZ $1,250 3.3% $1,440 -0.7%
32 Dallas, TX $1,230 -1.6% $1,680 -1.8%
32 St Petersburg, FL $1,230 11.8% $1,600 3.9%
34 Orlando, FL $1,220 -6.9% $1,400 -6.7%
35 Charlotte, NC $1,200 -4.8% $1,370 0.0%
36 Tampa, FL $1,150 -2.5% $1,390 4.5%
37 Plano, TX $1,130 -2.6% $1,540 -0.6%
38 Henderson, NV $1,120 -0.9% $1,350 0.0%
39 Richmond, VA $1,110 2.8% $1,370 11.4%
40 Fort Worth, TX $1,100 -4.3% $1,360 1.5%
40 Houston, TX $1,100 -9.1% $1,310 -6.4%
42 Aurora, CO $1,090 -8.4% $1,350 -9.4%
42 Fresno, CA $1,090 9.0% $1,240 8.8%
44 Buffalo, NY $1,080 9.1% $1,350 14.4%
44 Chesapeake, VA $1,080 9.1% $1,250 4.2%
44 Irving, TX $1,080 -9.2% $1,390 -10.3%
44 Madison, WI $1,080 -8.5% $1,310 -5.1%
44 Pittsburgh, PA $1,080 1.9% $1,350 3.8%
49 Boise, ID $1,060 10.4% $1,120 1.8%
50 Salt Lake City, UT $1,050 -1.9% $1,300 -5.1%
50 Virginia Beach, VA $1,050 0.0% $1,250 1.6%
52 Durham, NC $1,040 -6.3% $1,230 -3.1%
53 Reno, NV $1,030 13.2% $1,350 3.1%
54 Raleigh, NC $1,020 -1.9% $1,200 0.0%
55 Phoenix, AZ $1,010 1.0% $1,280 2.4%
56 Las Vegas, NV $1,000 1.0% $1,200 4.3%
56 Milwaukee, WI $1,000 3.1% $1,170 14.7%
58 Colorado Springs, CO $990 7.6% $1,250 7.8%
59 Rochester, NY $970 15.5% $1,130 15.3%
60 Anchorage, AK $960 5.5% $1,180 2.6%
60 Kansas City, MO $960 0.0% $1,120 0.9%
60 Mesa, AZ $960 4.3% $1,190 3.5%
63 Cleveland, OH $940 16.0% $1,000 14.9%
64 Des Moines, IA $930 14.8% $990 15.1%
65 Norfolk, VA $920 15.0% $1,070 1.9%
66 St Louis, MO $910 15.2% $1,290 12.2%
67 Chattanooga, TN $900 15.4% $1,020 14.6%
67 Cincinnati, OH $900 15.4% $1,200 7.1%
67 Jacksonville, FL $900 -5.3% $1,100 1.9%
70 Arlington, TX $880 7.3% $1,150 5.5%
70 San Antonio, TX $880 -2.2% $1,100 -1.8%
72 Glendale, AZ $870 3.6% $1,100 2.8%
72 Indianapolis, IN $870 16.0% $940 16.0%
74 Louisville, KY $860 -2.3% $940 -1.1%
74 Syracuse, NY $860 -11.3% $1,060 1.0%
76 Omaha, NE $850 1.2% $1,020 -2.9%
77 Bakersfield, CA $840 13.5% $1,070 15.1%
78 Corpus Christi, TX $830 -2.4% $1,050 -0.9%
79 Baton Rouge, LA $820 -1.2% $940 1.1%
80 Columbus, OH $810 15.7% $1,050 -1.9%
80 Knoxville, TN $810 1.3% $950 5.6%
80 Spokane, WA $810 0.0% $1,070 7.0%
83 Winston Salem, NC $800 3.9% $880 6.0%
84 Augusta, GA $790 5.3% $880 8.6%
84 Memphis, TN $790 8.2% $840 9.1%
86 Laredo, TX $780 -6.0% $890 0.0%
87 Lincoln, NE $770 14.9% $920 3.4%
88 Tallahassee, FL $760 0.0% $900 2.3%
89 Albuquerque, NM $750 7.1% $900 7.1%
89 Lexington, KY $750 0.0% $950 -3.1%
89 Oklahoma City, OK $750 4.2% $880 0.0%
92 Greensboro, NC $720 1.4% $840 1.2%
93 Detroit, MI $700 14.8% $800 15.9%
93 Tucson, AZ $700 9.4% $930 5.7%
93 Wichita, KS $700 14.8% $750 0.0%
96 El Paso, TX $680 4.6% $800 0.0%
97 Lubbock, TX $650 3.2% $840 7.7%
97 Shreveport, LA $650 0.0% $800 14.3%
99 Akron, OH $610 10.9% $730 0.0%
100 Tulsa, OK $590 -9.2% $810 1.3%

Source: by Wolf Richter | Wolf Street Report

30% Of Americans Didn’t Make Their Housing Payment In June

A stunning 30% of Americans didn’t make their housing payment for June – a figure that is likely going to ripple through the housing industry in coming months. According to a new survey by Apartment List, the rate is similar to May and shows that even though other industries are rebounding, the situation has not yet improved meaningfully in housing.

These figures stood at 24% in April and 31% in May, before falling slightly to 30% in June. One third of the 30% in June made a partial payment, while two thirds made no payment at all.

“Missed payment rates are highest for renters (32 percent), households earning less than $25,000 per year (40 percent), adults under the age of 30 (40 percent), and those living in high-density urban areas (35 percent). While the missed payment rate for mortgaged homeowners is just 3 percentage points lower than renters,” the survey showed.

Despite the trend of missing payments at the beginning of the month, households have been able to play catch-up later in the month and “narrow the gap” by making payments in the middle of the month. This was the case in May, where the missed payment rate “dropped from 31 percent at the beginning of the month to 11 percent at the end.”

We’ll see how long people can play catch up. 

Meanwhile, as the survey notes, delayed payments in one month are a strong indicator for coming months. 83% of those who paid on time in May did so in June. Meanwhile, only 30% of those who were late in May have made their payment in full for June.

This means the data for the beginning of July is likely to be just as ugly as June.


And, rightfully so, there continues to be concern over eviction notices in the coming months. The survey found that: “over one-third of renters are at least ‘somewhat concerned’ that they will be served an eviction notice in the coming six months.”

The number rises to 56% when polled just among those who have not yet paid their full rent for June.

Recall, just days ago ZeroHedge wrote that Americans had already skipped payments on more than 100 million loans while, at the same time, job losses continue to accelerate. 

“The number of Americans that filed new claims for unemployment benefits last week was much higher than expected,” we noted.

To put this in perspective, let me once again remind my readers that prior to this year the all-time record for a single week was just 695,000.  So even though more than 44 million Americans had already filed initial claims for unemployment benefits before this latest report, there were still enough new people losing jobs to more than double that old record from 1982.

That is just astounding.  We were told that the economy would be regaining huge amounts of jobs by now, but instead job losses remain at a catastrophic level that is unlike anything that we have ever seen before in all of U.S. history.

Source: ZeroHedge

China Home Sales Crash

Bloomberg cited a new report via China Merchants Securities (CMSC) that said new apartment sales crashed 90% in the first week of February over the same period last year. Sales of existing homes in 8 cities plunged 91% over the same period.

Wuhan, Hubei, China Sunrise

“The sector is bracing for a worse impact than the 2003 SARS pandemic,” said Bai Yanjun, an analyst at property-consulting firm China Index Holdings Ltd. “In 2003, the home market was on a cyclical rise. Now, it’s already reeling from an adjustment.”

Long before the coronavirus outbreak, China’s housing market has been on shaky grounds amid declining demand, stricter mortgage requirements, and price discounts.

The latest shock: two-thirds of China’s economy has come to a standstill, could generate enough pessimism to pop the country’s massive housing bubble. 

The CPC failed to stimulate the economy last year, with credit impulse not turning up as expected. The virus outbreak has allowed the CPC to scapegoat the slowdown and the inevitable crash.   

Real estate transactions have been forbidden in many cities. This means fire sales could be seen once selling restrictions end.  

E-House China Enterprise Holdings Ltd.’s research institute said four units per day were being sold in Beijing last week, and this is down from several hundred per day during the same period in the previous year. 

China International Capital Corp. analyst Eric Zhang said demand could pick back up in April, assuming the virus outbreak is under control. 

However, residents in major cities are frightened by the virus outbreak and how easily it spreads in apartment buildings

The downturn in China’s property market could get a lot worse, and without proper liquidity from the central bank, once selling restrictions end, it could trigger a liquidity gap where housing prices face a deep correction. 

But remember, the CPC can now blame the virus for a housing market crash or a downturn in the economy. 

Source: ZeroHedge

Why Manhattan’s Skyscrapers Are Empty

Approximately half of the luxury-condo units that have come onto the market in the past five years remain unsold.

In Manhattan, the homeless shelters are full, and the luxury skyscrapers are vacant.

Such is the tale of two cities within America’s largest metro. Even as 80,000 people sleep in New York City’s shelters or on its streets, Manhattan residents have watched skinny condominium skyscrapers rise across the island. These colossal stalagmites initially transformed not only the city’s skyline but also the real-estate market for new homes. From 2011 to 2019, the average price of a newly listed condo in New York soared from $1.15 million to $3.77 million.

But the bust is upon us. Today, nearly half of the Manhattan luxury-condo units that have come onto the market in the past five years are still unsold, according to The New York Times.

What happened? While real estate might seem like the world’s most local industry, these luxury condos weren’t exclusively built for locals. They were also made for foreigners with tens of millions of dollars to spare. Developers bet huge on foreign plutocrats—Russian oligarchs, Chinese moguls, Saudi royalty—looking to buy second (or seventh) homes.

But the Chinese economy slowed, while declining oil prices dampened the demand for pieds-à-terre among Russian and Middle Eastern zillionaires. It didn’t help that the Treasury Department cracked down on attempts to launder money through fancy real estate. Despite pressure from nervous lenders, developers have been reluctant to slash prices too suddenly or dramatically, lest the market suddenly clear and they leave millions on the table.

The confluence of cosmopolitan capital and terrible timing has done the impossible: It’s created a vacancy problem in a city where thousands of people are desperate to find places to live.

From any rational perspective, what New York needs isn’t glistening three-bedroom units, but more simple one- and two-bedroom apartments for New York’s many singlesroommates, and small families. Mayor Bill De Blasio made affordable housing a centerpiece of his administration. But progress here has been stalled by onerous zoning regulations, limited federal subsidies, construction delays, and blocked pro-tenant bills.

In the past decade, New York City real-estate prices have gone from merely obscene to downright macabre. From 2010 to 2019, the average sale price of homes doubled in many Brooklyn neighborhoods, including Prospect Heights and Williamsburg, according to the Times. Buyers there could consider themselves lucky: In Cobble Hill, the typical sales price tripled to $2.5 million in nine years.

This is not normal. And for middle-class families, particularly for the immigrants who give New York City so much of its dynamism, it has made living in Manhattan or gentrified Brooklyn practically impossible. No wonder, then, that the New York City area is losing about 300 residents every day. It adds up to what Michael Greenberg, writing for The New York Review of Books, called a new shameful form of housing discrimination—“bluelining.”

We speak nowadays with contrition of redlining, the mid-twentieth-century practice by banks of starving black neighborhoods of mortgages, home improvement loans, and investment of almost any sort. We may soon look with equal shame on what might come to be known as bluelining: the transfiguration of those same neighborhoods with a deluge of investment aimed at a wealthier class.

New York’s example is extreme—the squeezed middle class, shrink-wrapped into tiny bedrooms, beneath a canopy of empty sky palaces. But Manhattan reflects America’s national housing market, in at least three ways.

First, the typical new American single-family home has become surprisingly luxurious, if not quite so swank as Manhattan’s glassy spires. Newly built houses in the U.S. are among the largest in the world, and their size-per-resident has nearly doubled in the past 50 years. And the bathrooms have multiplied. In the early ’70s, 40 percent of new single-family houses had 1.5 bathrooms or fewer; today, just 4 percent do. The mansions of the ’70s would be the typical new homes of the 2020s.

Second, as the new houses have become more luxurious, homeownership itself has become a luxury. Young adults today are one-third less likely to own a home at this point in their lives than previous generations. Among young black Americans, homeownership has fallen to its lowest rate in more than 60 years.

Third, and most important, the most expensive housing markets, such as San Francisco and Los Angeles, haven’t built nearly enough homes for the middle class. As urban living has become too expensive for workers, many of them have either stayed away from the richest, densest cities or moved to the south and west, where land is cheaper. This is a huge loss, not only for individual workers, but also for these metros, because denser cities offer better matches between companies and workers, and thus are richer and more productive overall. Instead of growing as they grow richer, New York City, Los Angeles, and the Bay Area are all shrinking.

Across the country, the supply of housing hasn’t kept up with population growth. Single-family-home sales are stuck at 1996 levels, even though the United States has added 60 million people—or two Texases—since the mid-’90s. The undersupply of housing has become one of the most important stories in economics in the past decade. It explains why Americans are less likely to movewhy social mobility has declinedwhy regional inequality has increasedwhy entrepreneurship continues to fallwhy wealth inequality has skyrocketed, and why certain neighborhoods have higher poverty and worse health.

In 2010, one might have thought that the defining housing story of the century would be the real-estate bubble that plunged the U.S. economy into a recession. But the past decade has been defined by the juxtaposition of rampant luxury-home building with the cratering of middle-class-home construction. The future might restore a measure of sanity, both to New York’s housing crisis and America’s. But for now, the nation is bluelining itself to death.

Source: by Derek Thompson | The Atlantic

Sonoma County California Plans To Evict Renters To Buy Million Dollar Housing For Hobos

SANTA ROSA (KPIX) — A controversial plan to solve the homeless crisis has people fired up in Sonoma County where officials plan to spend millions of dollars to buy three properties that would be used to house the homeless.

All three properties have one thing in common. They’re big and have multiple units, but many of those units are currently occupied by tenants.

“I’m sure the tenants have been asked to leave,” said Allen Thomas.  He lives near one of the three properties, 811 Davis Street in Santa Rosa.

Neighbors said it’s counterproductive to evict renters to house the homeless.

“It’s just insanity,” said Karen Sanders, who also lives in Santa Rosa.

Sonoma County leaders plan to buy two properties in Santa Rosa and one in Cotati. They’ll spend roughly one million dollars for each property. One county worker said they’re already in contract to buy the property on Davis Street.

“Million dollar homes; million dollar homes for these transients living on the trail,” said Sanders.

The county wants to get the homeless out of an encampment on the Joe Rodota Trail. Many neighbors of those three properties worry the new neighbors will bring along crime and other quality of life issues.

“I’m not NIMBY, but we’ve done enough,” said Sher Ennis, a neighbor who lives near the Davis street property.

She said she was attacked in her home by a man from a re-entry housing program years ago.  She worries about her safety.

“We don’t know. Are we getting dangerous criminals? Are we getting felons? Or are we getting people who are simply down on their luck,” said Ennis.

Another neighbor supports the county’s plan.

“I don’t think that it makes [the neighborhood] any less safe, no,” said Andrew Atkinson.

He said the county has to act now.

“It’s going to take more than this, I think, to solve the problem. But I’m glad to see they’re trying,” said Atkinson.

Many upset neighbors voiced their concerns at a community meeting Friday night in Santa Rosa. County leaders will talk about the plan to buy the houses and other solutions to house the homeless.

Source: by Da Lin | KPIX CBS SF Bay Area

Los Angeles Homelessness Czar to Resign After Homelessness Grows by 33%

Los Angeles’ head of homelessness announced on Tuesday, December 10, 2019 that he will be resigning after presiding over a 33 percent increase in homelessness during the last five years.

Peter Lynn, the head of the Los Angeles Homeless Service Authority, revealed that he would leave at the end of the year.

According to Paul Joseph Watson of Summit News, LAHSA reportedly spent $780 million with no effect.

The city’s homeless population grew even larger from 2018 to 2019, where it witnessed a 12 percent increase in that period.

Even with these unsavory facts in front of him, L.A. Mayor Eric Garcetti believed he did an amazing job and presided over “historic action.”

Lynn was apparently making $242,000 while homelessness went up along with cases of leprosy, typhoid fever, and even bubonic plague.

A few months ago, Dr. Drew Pinsky said L.A.’s public health infrastructure was a complete mess.

Source: by Jose Nino | Big League Politics

NJ To Become Wasteland: 44% Of Residents Plan To Flee State

Thanks to the highest property taxes in the nation and an unsustainable cost of living, 44% of New Jersey residents plan to leave the state in the ‘no so distant future,’ according to a recent survey from the Garden State Initiative (GSI) and Fairleigh Dickenson University School of Public & Global Affairs.

Committing to a more solid time frame, 28% say they are planning to leave within five years, and 39% say they will do so over the next decade, according to Insider NJ.

Unsurprisingly, Property Taxes and the overall Cost of Living were cited as the main drivers. The results also debunk two issues frequently cited in anecdotal accounts of out migration, weather and public transportation, as they ranked 8th and 10th respectively, out of 11 factors offered.

The desire to leave the Garden State was reflected most strongly among young residents (18-29) with almost 40% anticipating leaving the state within the next five years. At the other end of the spectrum, a third (33%) of those nearing retirement (50-64) plan to leave within the next five years. –Insider NJ

These results should alarm every elected official and policymaker in New Jersey, said GSI’s president, former Chris Christie Chief of Staff Regina Egea. GSI focuses on providing “research-based answers to fiscal and economic issues” facing the state.

“We have a crisis of confidence in the ability of our leaders to address property taxes and the cost of living whether at the start of their career, in prime earning years, or re-positioning for retirement, New Jersey residents see greener pastures in other states.  This crisis presents a profound challenge to our state as we are faced with a generation of young residents looking elsewhere to build their careers, establish families and make investments like homeownership.”

After taxes and a high cost of living, government corruption and concerns about crime and drugs concerned citizens the most. Insider notes that there were no significant differences in responses across income levels.

Source: Garden State Initiative | ZeroHedge

“It’s Cozy” – Los Angeles Imports Are Paying $800/Month To ‘Live In Coffins

First it was the unaffordability of ‘real’ homes (combined with massive student loan debt) that spoiled the living-the-Dream narrative for America’s young people.

Remember this 350-square foot studio in NYC that cost $645,000?

Then it was a shift to “tiny homes” – which became popular with millennials since their standard of living has collapsed.

But while they could virtue signal with solar panels and wind power systems, an eco-friendly bathroom, and a kitchen with everything needed to make avocado and toast, living in with post-industrial feel using an old shipping container for $37,000 was too much for many

So ‘podlife’ sprung up on the coasts – as the housing affordability crisis deepened on the West Coast, a new style of living, one that reminds millennials of their college dormitory days, sprang up in cities across California.

But, residents were upset by having to adhere to house rules, one being that lights go out at 10 pm each night, and no guests are allowed inside.

And so, as AFP reports, young Americans flocking to LA and NYC are now resorting to “Capsule Living” as the only affordable option

Inspired by the famous hotels in Japan, each room contains up to six capsules, described by residents as “cozy,” containing a single bed, a bar for hanging clothes, a few compartments for storing shoes and other items and an air vent.

By most standards, the coffin-like accommodation is still not cheap – $750 per month plus taxes. That works out at around $800 and there are still rules… women and men sleep apart, and having sex is not an option.

For Dana Cuff, an architect and professor at the University of California, Los Angeles (UCLA), this type of community presents only a short-term solution.

“We basically need to be developing a huge range of options for the kinds of housing that are available,” she said.

“To me, co-living pods… are symptoms of this deep need for a much greater range of housing alternatives.”

Alejandro Chupina, 27, left home as a teenager because his parents did not support his career as an actor and musician.

“We have so many different amenities… for what we’re paying, I feel like we’re getting way more, in different ways,” said the young man with a handlebar mustache, who can recite the musical “Hamilton” by heart.

We give the final word to Kay Wilson, who packed up her life in a hurry and moved to Los Angeles… only to find that what she paid in Pennsylvania for a nice studio apartment would only get her a 2.9-square-meter box in California.

“I sold all my belongings and I moved here to be in this pod… I’m finding comfort in being uncomfortable,”

The American Dream indeed…

Source: ZeroHedge

How Pricey Urban Meccas Become Crime-Ridden Ghost Towns

As the exodus gathers momentum, all the reasons people clung so rabidly to urban meccas decay.

The lifestyle you ordered is not just out of stock, the supplier closed down.

(Charles Huge Smith) If there is any trend that’s viewed as permanent, it’s the enduring attraction of coastal urban meccas: despite the insane rents and housing costs, that’s where the jobs, the opportunities and the desirable urban culture are.

Nice, but like many other things the status quo considers permanent, this could reverse very quickly, and all those pricey urban meccas could become crime-ridden ghost towns. How could such a reversal occur?

1. Those in the top 10% who can leave reach an inflection point and decide to leave. The top 1% who live in enclaves filled with politicians, celebrities and the uber-wealthy see no reason to leave, as the police make sure no human feces land on their doorstep.

It’s everyone who lives outside these protected enclaves, in neighborhoods exposed to exasperating (and increasingly dangerous) decay who will reach a point where the “urban lifestyle” is no longer worth the sacrifices and costs.

It might be needles and human feces on the sidewalk, it might be petty crime such as your mail being stolen for the umpteenth time, it might be soul-crushing commutes that finally do crush your soul, or in Berkeley, California, it might be getting a $300 ticket for not bringing your bicycle to a complete stop at every empty intersection on a city bikeway. (I’ve personally witnessed motorcycle officers nailing dozens of bicyclists with these $300 tickets.)

It might be something that shreds the flimsy facade of safety and security complacent urban dwellers have taken for granted, something that acts as the last grain of sand on the growing pile of reasons to get the heck out that triggers the decision.

Not everyone can move, but many in the top tier can, and will. Living in a decaying situation is not a necessity for these lucky few, it’s an option.

2. Those who have to leave when they lose their job. A funny thing happens in all economies, even those with central banks: credit-cycle / business-cycle recessions are inevitable, regardless of how many times financial pundits say, “the Fed has our back” and “don’t fight the Fed.”

As I’ve noted here numerous times, a great many small businesses in these pricey urban meccas are one tiny step from closing: one more rent increase, one more bad month, one more regulatory burden, one more health issue and they’re gone. They will move to greener pastures for the same reason as everyone else–they can’t afford to live in urban meccas.

Once enough of the top 10% leave (by choice or because they can no longer afford it), the food/beverage service industry implodes. Wait staff and bartending have been a major source of jobs in these urban meccas, and when hundreds of struggling establishments fold due to a 10% decline in their sales, thousands of these employees will lose their jobs and the prospects of getting hired elsewhere decline with every new closure.

The vast majority of these service employees are renters, paying sky-high rents that unemployment can’t cover. They will hang on for a few months and then cash in their chips and move to more affordable climes.

3. Once the stock market returns to historic norms, the gargantuan capital gains that supported local tax revenues and spending dry up. WeWork is the canary in the coal mine; from a $50 billion IPO to insolvency in six weeks.

Once tax revenues plummet (no more IPOs, hundreds of restaurants closing, etc.), cities and counties will have to trim their work forces to maintain their ballooning pension payments for retirees. This will leave fewer police and social workers available to deal with everyone with little motivation (or option) to leave: thieves, those getting public services and the homeless.

4. Housing prices and rents are sticky: sellers and landlords won’t believe the good times have ended, and so they will keep home prices and rents at nosebleed valuations even as vacancies soar and the market is flooded with listings.

Neighborhoods that had fewer than 100 homes for sale will suddenly have 500 and then 1,000, as sellers realize the boom has ended and they want out–but only at top-of-the-bubble prices.

Ironically, this stubborn attachment to boom-era prices for homes and rents accelerates the exodus. As incomes decline, costs remain sky-high, so the only option left is to move away, the sooner the better.

By the time sellers grudgingly reduce prices, it’s too late: the market has soured. The Kubler-Ross dynamic is in full display, as sellers go through the stages of denial, anger, bargaining and acceptance: they grudgingly drop the price of the $1.2 million bungalow or flat to $1.15 million, then after much anger and anguish, to $1.1 million, but the market has imploded while they processed a reversal they didn’t think possible: now sales have dried up, and prices are sub-$800,000 while they ponder dropping their asking price to $995,000.

Vacant apartments pile up, as the number of laid-off and downsized employees who can still afford high rents collapses. (Recall that tens of thousands of recent arrivals in urban meccas rely heavily on tips for their income, and as service and gig-economy business dries up, so do their tips.)

5. As the exodus gathers momentum, all the reasons people clung so rabidly to urban meccas decay: venues and cafes close, street life fades, job opportunities dry up, and yet prices for everything remain high: transport, rent, taxes, employees, etc.

Friends move away, favorite places close suddenly, streets that were safe now seem foreboding, and all the friction, crime, grime and dysfunction that was once tolerable becomes intolerable.

6. In response to deteriorating city and county finances, local government jacks up fees, tickets, permits and taxes, accelerating the exodus. How many $300 tickets, fees and penalties does it take to break the resolve to stick it out?

7. Those on the cusp cave in and abandon the mecca. Once those who had the option to leave have left, and those who can no longer afford to stay leave, the decay causes those on the cusp of bailing out to abandon ship.

Renters move out in the middle of the night, homeowners who have watched their equity vanish as prices went into free fall jingle-mail the keys to the house to the lender and small businesses that had clung on, hoping for a turn-around close their doors.

8. Each of these dynamics reinforce the others. Soaring taxes, decaying services, declining business, rising insecurity and stubbornly high costs all feed on each other.

And that’s how pricey urban meccas turn into ghost towns inhabited by those who can’t leave and those living on public services, i.e. those too poor to support the enormously costly infrastructure of public spending in the urban mecca.

Source: by Charles Hugh Smith | ZeroHedge

Pod People – The Future Of Housing In America’s ‘Sharing’ Economy

Urban millennials are shelling out half their income to inhabit pods in decaying mega cities.

For the low-low price of $1400/month, you can live in Venice Beach at a PodShare

Away from the glossy PR, it doesn’t look so great…

No privacy, no pets, no family.

Cheek by jowel with other pod-dwellers on prison-style bunk beds.

Forced to live like ants in colonies because none of them can afford to buy a home anymore.

As Paul Joseph Watson explains in his inimitable way, millennials are “living the dream!

*  *  *

Of course, images of ‘pod people’ sparked a large response from the twitterati as the scenes reminded them of horrors from the past…

https://twitter.com/peakeman/status/1171416105853890561?ref_src=twsrc%5Etfw%7Ctwcamp%5Etweetembed%7Ctwterm%5E1171416105853890561&ref_url=https%3A%2F%2Fwww.zerohedge.com%2Fpersonal-finance%2Fpod-people-future-housing-americas-sharing-economy


https://twitter.com/dirtytruckerhat/status/1171438037785464833?ref_src=twsrc%5Etfw%7Ctwcamp%5Etweetembed%7Ctwterm%5E1171438037785464833&ref_url=https%3A%2F%2Fwww.zerohedge.com%2Fpersonal-finance%2Fpod-people-future-housing-americas-sharing-economy

Although it beats this…

Source: ZeroHedge

The Rise of the New Left Urbanists

(City Journal) America’s big cities are, without exception, politically blue cities, with a new class of progressive politicians doing real damage to public order. When it comes to urban development, however, the blue monolith breaks down: socialists, city planners, cyclists, environmentalists, pragmatists, and social-justice activists are often at odds with one another. They might all support more housing, more density, and more public transportation, but they disagree sharply on the means for getting there.

In recent years, a new faction has emerged in city politics: what one might call the new Left urbanists. These activists believe that local governments must rebuild the urban environment—housing, transit, roads, and tolls—to produce a new era of city flourishing, characterized by social and racial justice and a net-zero carbon footprint. The urbanists rally around provocative slogans like “ban all cars,” “raze the suburbs,” and “single-family housing is white supremacy”—ironically, since they’re generally white, affluent, and educated themselves. They’re often employed in public or semipublic roles in urban planning, housing development, and social advocacy. They treat public housing, mass transit, and bicycle lanes as a kind of holy trinity—and they want to impose their religion on you.

Housing is the central political battleground for these progressive activists. As David Madden and Peter Marcuse write in their book, In Defense of Housing: “The residential is political—which is to say that the shape of the housing system is always the outcome of struggles between different groups and classes.” Their goal is not simply to get new housing built but to build new housing owned, operated, and controlled by the state. If they can dictate how cities construct new housing, their logic goes, they can dictate how people live—and set right society’s economic, social, and moral deficiencies.

The urbanists laid out their plans in a widely circulated report from the People’s Policy Project, a crowd-funded organization founded in 2017 that seeks to “fill the holes left by the current think tank landscape with a special focus on socialist and social democratic economic ideas.” They envision the construction of 10 million “municipal homes” over the next ten years. Under this proposal, government would become the nation’s largest landlord and residential construction firm, building more housing units than the entire private construction industry. The abysmal record of public housing in the United States, from the Cabrini-Green Homes in Chicago to the Foote Homes in Memphis, where crime and blight prevailed, makes no difference to these urbanists. They have simply rebranded “housing projects” to “municipal homes,” arguing that public housing has been “unjustly stigmatized” and that these new units will somehow avoid the fate of American public-housing ventures over the past half-century. They believe that the new “municipal homes” will resemble neighborhoods in Stockholm, Vienna, or Helsinki rather than in Detroit, Newark, or Oakland.

The question for the activists is not just how much new housing gets built but who builds it and who will live in it. That is, new developments must also tick off the boxes of identity politics. In cities like San Francisco, some activists have taken the hardline position of opposing all private housing construction, regardless of how it might reduce the cost of housing for middle-class residents. In an essay in the San Francisco Examiner, public-housing activists Andrew Szeto and Toshio Meronek called advocates for more private-market housing part of a “libertarian, anti-poor campaign to turn longtime sites of progressive organizing into rich-people-only zones” and compared them with alt-right white nationalists.

One might dismiss this as radical posturing in a local alt-weekly, but public-housing advocates have seized real power in city hall. They have learned how to use the zoning and permitting bureaucracy to achieve their goals of no new private development. In San Francisco’s Mission District, activists forced Laundromat owner Bob Tillman to spend $1.4 million and nearly five years to gain permission to convert his business into an apartment building. Activists and their enablers in city hall claimed that Tillman’s project would cause gentrification and displace minority residents, and forced him through a gauntlet of Kafkaesque legal proceedings. At one point, the planning commission even hired a “shadow consultant” to offer an expert opinion on whether the shadows cast by the proposed building would create social and racial inequities. To the new Left urbanists, housing isn’t just housing; it must be evaluated on social-justice standards. If it fails to measure up, it must go.

In New York City, progressive urbanists have seized on public transportation as a primary instrument of “social, environmental, immigrant, and economic justice.” New York’s subway system was designed in the early twentieth century to serve the practical needs of city residents, but today’s activists have come to see its tunnels and trains as grand mechanisms for cosmic justice. In its annual “Transportation and Equity” report, for example, the Straphangers Campaign argues that “the most vulnerable New Yorkers suffer disproportionately from high fares, long commutes, polluted air, and dangerous streets,” and therefore, “equity demands that state leaders prioritize transit in the public budget and policymaking process.”

The Straphangers estimate that an additional $30 billion in tax revenues would be needed to complete its desired overhaul of the mass-transit system, with a ten-year goal of upgrading 11 subway lines, building 130 new accessible subway stations, and purchasing 3,000 new subway cars and 5,000 new buses. While state and local leaders haven’t signed up for such an ambitious plan, they do support some of the Straphangers’ funding proposals to expand the transit system—including congestion pricing, a “millionaire’s tax,” marijuana tax, stock-transfer tax, and even a $3-per-package tax on Amazon deliveries.

Most New Yorkers would agree that investment in mass transit is a necessity, and there is a reasonable argument for congestion pricing in traffic-glutted Manhattan—but the activists don’t formulate their arguments on these practical grounds. A close reading of their reports reveals that the long-term vision involves elimination of the automobile, which remains a staple for middle-class residents in New York’s outer boroughs. In the Straphangers’ plan, activists want to restrict curbside space for cars dramatically by building “protected bike lanes on all major arterial streets across the five boroughs,” “giving developers incentives to contribute toward sustainable transportation over private vehicle usage,” and eliminating parking requirements for new housing projects. Activists deploy euphemisms like “transportation alternatives” and “transportation choices”; but at heart, their vision for mass transportation is not about choice but control. They want to remake the urban infrastructure in their own image: green, moral, healthy, just, and in solidarity with the masses—at least as those masses exist in their imagination.

The new Left urbanists’ fatal mistake is their failure to absorb the reality that cities are not just buildings, roads, tunnels, and bike lanes, but living entities. The urbanists can demolish and rebuild the physical environment, but they cannot pave over the people who make up our cities. Life in a metropolis is simply too complex, too variable, and too ephemeral—it will evade even the most careful planning. If we want better, more beautiful, cities, we must bring neighbors, developers, employers, and governments into the conversation. Our cities must be built through cooperation, not compulsion.

Source: by Christopher F. Rufo | City Journal

(Australia) Banks Are Now Referring Borrowers to Foodbank to Help Keep Up On Mortgage Payments

Foodbank South Australia has been approached by banks wanting to refer their clients to the charity, in the hope it will prevent people from defaulting on mortgage payments.

It comes as a new report has shown mental distress is increasing in older Australians, with nearly half of all homeowners aged 55 to 64 still paying off a mortgage — up from just 14 per cent 30 years ago.

Foodbank South Australia is now working on a new agreement which would enable clients to access its food services directly, with a voucher funded by the major bank.

However, Foodbank South Australia chief executive Greg Pattinson told ABC Radio Adelaide it was still exploring how the program would work.

“That’s what we are exploring with some of the banks at the moment … it hasn’t started yet because we are still working through the process.

“We’ve never been approached by financial institutions in the past and the banks, to their credit, are doing the right thing in trying to find a way of keeping people in their houses.”

He said traditionally, Foodbank worked through charities and the welfare sector but it had seen an increase in the number of people who require food assistance that are working.

“Increasingly we are being approached now by organisations other than traditional charities, so schools for example, where the schools have identified the children of parents who are doing it tough,” he said.

“Each year we’ve seen an increase in South Australia of anywhere up to 20 per cent in the number of people seeking food assistance.”

‘Cost of living’ is causing a shift

Mr Pattinson said the stereotype of a person or family that required food assistance was diminishing.

He said more people must be suffering from mortgage stress because more of those needing help were from working families.

“We certainly do provide services to the unemployed and to people who are homeless,” he said.

“But we are seeing an increase in the numbers of working families and working Australians who are needing to seek food assistance because of cost of living increases.

“We see an increase in demand, for example every three months, when people get their electricity bills.

“It’s a case of those weeks where people are saying, ‘we’ll make sure the kids are fed, the roof is over our head but mum and dad don’t eat this week’.”

Trying to help clients ‘balance their budget’

Mr Pattinson said the fact it had been approached by the banks had shown a significant shift and Foodbank was working on a project to support those in need.

“We’re getting inquiries from schools, pastoral care workers, from principals at various schools around the state,” he said.

“And increasingly, we are now seeing inquiries from banks and financial institutions who are looking to try and find a way of helping their clients balance their budget.”

He said the program was still in its early stages, but he hoped Foodbank would have a concrete program in place within the next two to three months.

“It may even be as simple as the banks referring their clients to the Foodbank food hubs,” he said.

“But there would obviously be conditions to that which would have to be assessed by the bank to make sure those people … are genuinely in need of those services.

“We don’t want to shift the food away from people who are genuinely needing it.”

Source: by Brittany Evans | ABC.net.au

Walmart Sues Tesla Over Solar Panel Fires, Claims SolarCity Purchase Was A Bailout

Until now, the general public was only aware of the remarkable ability of Tesla cars to spontaneously combust, that is at least when they are not smashing into random things while on autopilot. It now appears that Tesla’s solar panels (some may be unaware that several years ago, Elon Musk tried to unsuccessfully pivot Tesla into a solar power company as well as that’s where a few billion in government subsidies were to be found) are just as combustible.

On Tuesday, Walmart sued Tesla, after its solar panels atop seven of the retailer’s stores allegedly caught fire, alleging breach of contract, gross negligence and failure to live up to industry standards. Walmart is asking Tesla to remove solar panels from more than 240 Walmart locations where they have been installed, and to pay damages related to all the fires Walmart says that Tesla caused.

Walmart said it had leased or licensed roof space on top of more than 240 stores to Tesla’s energy operations unit, formerly known as SolarCity (which was basically a bailout by Elon Musk for Elon Musk who was also the largest SolarCity shareholder), for the installation and operation of solar systems. But as of November, fires had broken out at no fewer than seven of the stores, forcing the disconnection of all the solar panel systems for the safety of the public.

The breach-of-contract suit by Walmart, which was filed in the state of New York, alleges that: “As of November 2018, no fewer than seven Walmart stores had experienced fires due to Tesla’s solar systems-including the four fires described above and three others that had occurred earlier.” The fires resulted in evacuations, damaged property and inventory.

Walmart’s inspectors additionally found that Tesla “had engaged in widespread, systemic negligence and had failed to abide by prudent industry practices in installing, operating and maintaining its solar systems.’

Walmart also claimed that “Tesla routinely deployed individuals to inspect the solar systems who lacked basic solar training and knowledge and also alleged that Tesla failed to ground its solar and electrical systems properly, and that Tesla-installed solar panels on-site at Walmart stores contained a high number of defects that were visible to the naked eye, including loose and hanging wires at several locations, and which Tesla should have found and repaired before they led to fires.

It gets better: according to the suit, Tesla’s own inspection reports revealed “improper wire management, including abraded and hanging wires,” as well as “poor grounding” and “solar panel modules that were broken or contained dangerous hot spots.”

To state the obvious, properly designed, installed, inspected and maintained solar systems do not spontaneously combust, and the occurrence of multiple fires involving Tesla’s solar systems is but one unmistakable sign of negligence by Tesla,” Walmart said in the suit. “To this day, Tesla has not provided Walmart with the complete set of final ‘root cause’ analyses needed to identify the precise defects in its systems that caused all of the fires described above.”

Walmart said the first fire broke out at a store in Beavercreek, Ohio, a suburb of Dayton, in March 2018, and two more fires occurred at stores in California and Maryland in May of that year. While Tesla disconnected the panels at Walmart’s request that same month, it wasn’t enough to stop fires from occurring, and another blaze broke out in November at a store in Yuba City, California.

Ironically, the lawsuit comes at a time when Tesla has been trying to salvage its collapsing solar business; on Sunday, Elon Musk announced in a string of tweets which reeked of desperation that customers in some states can now rent Tesla’s residential, solar rooftop systems without a contract. The offer is available in six states, and will cost customers at least $50 a month (or $65 a month in California). And although Musk touted the ease of cancelling a rented roof at anytime, CNBC noted that the fine print on Tesla’s website mentions a $1,500 fee to take out the solar panels and restore the customer’s roof.

There is a reason why Tesla is basically giving the spontaneously combustible solar panels away: In the second quarter, Tesla installed a mere 29 megawatts of solar, a record low for the company in a single quarter. In its heyday, Tesla’s solar division (formerly SolarCity) installed over 200 megawatts in a single quarter.

But wait there is more.

As if allegations of shoddy quality control, dismal workmanship and overall blatant lack of professionalism weren’t enough, Walmart also “went there” and in the “explosive”, pun not intended 114-page lawsuit, piled onto a long-running controversy according to which Tesla bailed out a failing SolarCity in 2016 when it purchased the company for $2.6 billion (Elon Musk was also the biggest shareholder of SolarCity at the time, while Tesla’s Elon Musk bought out SolarCity in a gross conflict of interest), with WalMart highlighting the familial ties between Tesla and SolarCity as the underpinnings of a flawed merger that allegedly produced shoddy craftsmanship and led to fires at seven Walmart stores.

“On information and belief, when Tesla purchased SolarCity to bail out the flailing company (whose executives included two of Tesla CEO Elon Musk’s first cousins), Tesla failed to correct SolarCity’s chaotic installation practices or to adopt adequate maintenance protocols, which would have been particularly important in light of the improper installation practices,” Walmart claimed in a suit that is sure to draw regulators attention to the 2016 deal that should never have been allowed. As shown in the diagram above, SolarCity co-founders Lyndon Rive and Peter Rive are Musk’s cousins, while Musk was the largest shareholder of both companies.

So already facing a slumping stock price from dozens of lawsuits and investigations, store closings, delayed loan repayments and the departure of key executives, CNBC notes that the Walmart suit lands at a particularly difficult time for Tesla and Musk. Specifically in regards to SolarCity, Musk was slated to be deposed earlier this month in a complaint brought by shareholders over the deal.

The name “SolarCity” shows up 46 times in the lawsuit, which alleges the company had a failed business model, stemming from a goal to speed up revenue growth at all costs.

“Walmart’s experience bears out Tesla, Inc.’s and Tesla’s inability to turn around and bail out the solar panel operations acquired from SolarCity,” the suit says.

* * *

Walmart is asking a judge to declare Tesla in breach of contract, order the company to remove the solar panels from all of its stores and award damages equal to its costs and consulting fees in connection with the fires.

Tesla shares fell as much as 1.7% to $222.70 as of 6:45 p.m. in after hours trading. The stock is down 32% this year.

The case is Walmart Inc. v. Tesla Energy Operations, New York State Supreme Court, New York County; Index No.  654765/2019.

The full lawsuit is below

Source: ZeroHedge

FHA Eases Condo Rules, Expanding The Purchase And Reverse Mortgage Market

Through a new rule announced Wednesday, the Federal Housing Administration (FHA) is making it easier for aspiring entry level housing buyers and condo owners to get reverse mortgages with FHA insured financing. 

The FHA published a final regulation and policy implementation guidance this week establishing a new process for condominium approvals which will expand FHA financing for qualified first time home buyers as well as seniors looking to age in place, the Department of Housing and Urban Development said in a press memo. 

In a stated Trump Administration effort to “reduce regulatory barriers restricting affordable home ownership,” the new rule introduces a new single-unit approval procedure that eases the ability for individual condominium units to become eligible for FHA-insured financing. It also extends the recertification requirement for approved condominium projects from two years to three.

The rule will also allow more mixed-use projects to be eligible for FHA insurance, the department said in a press release. HUD Secretary Ben Carson touted the rule’s ability to assist both first-time home buyers, as well as seniors aiming to age in place.

“Condominiums have increasingly become a source of affordable, sustainable home ownership for many families and it’s critical that FHA be there to help them,” said Carson in a press release announcing the new rule. “Today, we take an important step to open more doors to home ownership for younger, first-time American buyers as well as seniors hoping to age-in-place.”

Acting HUD Deputy Secretary and FHA Commissioner Brian D. Montgomery added that this rule is being implemented partially in response to the demands of the housing market.

“Today we are making certain FHA responds to what the market is telling us.
Montgomery said in the release. “This new rule allows FHA to meet its core mission to support eligible borrowers who are ready for home ownership and are most likely to enter the market with the purchase of a condominium.”

The last notable action taken by FHA in terms of condominium approvals took place in the fall of 2016, when the agency proposed new rules that would allow individual condo units to become eligible for FHA financing, including Home Equity Conversion Mortgages (HECMs).

FHA estimated this new policy will notably increase the amount of condominium projects that can now gain FHA approval. 84 percent of FHA-insured condominium buyers have never owned a home before, according to agency data. Only 6.5 percent of the more than 150,000 condominium projects in the United States are approved to participate in FHA’s mortgage insurance programs.

“As a result of FHA’s new policy, it is estimated that 20,000 to 60,000 condominium units could become eligible for FHA-insured financing annually,” the press release said.

Read the final rule in the Federal Register.

Source: by Chris Clow | Reverse Mortgage Daily

Coastal Cities Lead In Apartment Rents

Not surprisingly, apartment rents in the US are the highest in land-use restricted coastal cities like San Francisco, New York city, San Jose CA, Boston and Washington DC. Other west coast cities and Miami round out the remaining top ten most expensive apartment rents.

According to Zumper, North Carolina (Raleigh and Charlotte) and Arizona (Glendale and Scottsdale) along with Fort Worth TX saw the biggest increases in apartment rents.

Raleigh, NC saw one bedroom rent climb 5.1%, which was the largest monthly rental growth rate in the nation, to $1,040. This large bump moved the city up 2 positions to become 49th most expensive rental market.

Charlotte, NC took a 5 ranking bump up to 26th with one bedroom rent climbing 5% to $1,260 and two bedrooms increasing 2.2% to $1,370.

Glendale, AZ jumped up 7 spots to rank as the 67th most expensive city. One bedroom rent grew 5% to $840, while two bedrooms were up 1.9% to $1,070.

Scottsdale, AZ saw one bedroom rent climb 4.5%, settling at $1,380, and up 3 positions to become the 21st priciest city.

Fort Worth, TX moved up 3 spots to rank as 40th with one bedroom rent jumping 4.5% to $1,150 and two bedrooms increasing 2.3% to $1,340.

On the downward side, tax- and pension-crazy Chicago has fastest declining rents. And it is Always Sunny In Philadelphia for rents!

Chicago, IL fell 2 spots to rank as the 17th priciest city with one bedroom rent dropping 5.1%, which is tied with Bakersfield’s growth rate as the largest dip in the nation, to $1,490.

Bakersfield, CA saw one bedroom rent drop 5.1%, settling at $740, and down 7 positions to become 86th.

Anchorage, AK moved down 3 spots to 62nd with one bedroom rent falling 4.2% to $910. Two bedrooms, on the other hand, were flat at $1,150.

Atlanta, GA took a 4 ranking dip to 22nd with one bedroom rent decreasing 4.2% to $1,370 and two bedrooms down 3.3% to $1,740.

Philadelphia, PA one bedroom rent dropped 3%, settling at $1,310, and down 2 spots to rank as the 24th priciest city. Two bedrooms stayed stable at $1,700.

Of the top 100 cities, LeBron James’s home town of Akron has the lowest apartment rents in the nation. Followed closely by other non-coastal cities like Wichita, Detroit, Lubbock TX and Tucson AZ. And if you are taken back to Tulsa, you will find relatively inexpensive apartment rents.

Source: Confounded Interest

Rent Unaffordability Continues To Grow For Americans

The National Low Income Housing Coalition has published its latest “Out of Reach” report which shows that renting is becoming increasingly unaffordable for countless Americans.

https://www.zerohedge.com/s3/files/inline-images/2019-07-01_4-59-30.jpg?itok=8fjTZnmJ

Its central statistic is the Housing Wage which is an estimate of the hourly wage a full-time worker must earn to rent a home without spending more than 30 percent of his or her income on housing costs. As Statista’s Niall McCarthy notes, for 2019, the Housing Wage is $22.96 and $18.65 for a modest two and one-bedroom flat respectively based on the “fair market rent”.

A worker earning the federal wage would have to put in 127 hours every week – equivalent to more than two full-time jobs – to afford a two-bedroom apartment. It isn’t just a regional issue – there isn’t a single state, metro area or county in the U.S. where a full-time worker earning the minimum wage can afford to rent a two-bedroom property.

It isn’t just workers on the minimum wage who are effected.

The report also states that the average renter’s hourly wage is $1.08 less than the Housing Wage for a one-bedroom rental and $5.39 less than a two-bedroom rental. That means that an average renter in the U.S. has to work a 52 hour week, something that becomes increasingly difficult if that renter is a single parent of someone struggling with a disability. When it comes to the situation in different occupations, a median-wage worker in eight of the country’s largest ten occupations does not earn enough to afford a one-bedroom apartment.

https://infographic.statista.com/normal/chartoftheday_18485_housing_wage_compared_to_median_hourly_wages_n.jpg(source)

Software developers, general managers and nurses are able to meet both Housing Wages but for many other occupations and accomodations, renting is becoming increasingly difficult. Medical assistants, laborers and janitors are among those falling short while the gap back to minimum wage workers is even greater still. Worryingly, these are the ten jobs that are expected to see the biggest growth over the coming decade and that is likely to result in an even greater disparity between wages and housing costs by 2026.

Source: ZeroHedge

The Evolution Of Mortgage Policy, 1970-1999

“A Crack in The Foundation?” Part 2: Three Decades of Red Flags — Mortgage Policy & Praxis, 1970-1999

Welcome to “A Crack in the Foundation?”, a four-part series in which Maxwell Digital Mortgage Solutions will examine the evolution of the mortgage industry and homeownership in America, with an eye on government policies and how GSEs can promote (or prohibit) periods of economic growth.

Part 2 begins at the start of the 1970s and follows the uneasy path of government policy and economic turmoil as we creep towards the end of the century. (Missed Part 1? Read it here).  This section will follow the astronomical growth in the secondary market, the mounting government pressure put on Fannie and Freddie to increase their offerings to lower- and moderate-income borrowers, as well as a widespread shift towards deregulation in the market that (spoiler alert) will prove to have disastrous consequences as the new millennium begins.

Continue reading

California’s Housing Bubble’s So Bad, 100s Forced To Live On Boats

California’s housing affordability crisis is getting worse. Affordability in San Francisco is now at 10-year lows, and only one in five households can afford to purchase a median-priced single-family home in the Bay Area. The crisis has driven many people onto the water, living on makeshift boats, outside marinas, and wealthy communities.

Sausalito officials and other agencies have been stepping up efforts to manage ‘anchor out’ mariners and floating debris in Richardson Bay. (Robert Tong/Marin Independent Journal)

Continue reading

The Evolution Of Mortgage Policy, 1930-1960

“A Crack in The Foundation?” Part 1: Fannie & Friends — The Evolution of Mortgage Policy from 1930-1960

Welcome to “A Crack in the Foundation?”, a four-part series in which Maxwell Digital Mortgage Solutions will examine the evolution of the mortgage industry and homeownership in America, with an eye on government policies and how GSEs can promote (or prohibit) periods of economic growth.

Part I starts at the turn of the 20th century and traces the establishment of the Federal Housing Administration (FHA), as well as the birth of Fannie and Ginnie, to look at the inception of the modern mortgage and its impact on home ownership.

Continue reading

Attention Millennials: You Can Now Buy Tiny Homes On Amazon

One of the main goals of the Federal Reserve’s monetary policies of the past decade was to generate the “wealth effect”: by pushing the valuations of homes higher, would make American households feel wealthier. But it didn’t. Most Americans can’t afford the traditional home with a white picket fence around a private yard (otherwise known as the American dream), and as a result, has led to the popularity of tiny homes among heavily indebted millennials.

Tiny homes are popping up across West Coast cities as a solution to out of control rents and bubbly home prices, also known as the housing affordability crisis.

https://www.zerohedge.com/s3/files/inline-images/tiny%20homes%20san%20fran.jpg?itok=fZ8EmDnq

Amazon has recognized the hot market for tiny homes among millennials and has recently started selling DIY kits and complete tiny homes.

One of the first tiny homes we spotted on Amazon is a $7,250 kit for a tiny home that can be assembled in about eight hours.

https://www.zerohedge.com/s3/files/inline-images/2019-05-16_14-30-04.png?itok=ssdiD-Ct

A more luxurious tiny home on the e-commerce website is selling for $49,995 +$1,745.49 for shipping. This one is certified by the RV Industry Association’s standards inspection program, which means millennials can travel from Seattle to San Diego in a nomadic fashion searching for gig-economy jobs.

https://www.zerohedge.com/s3/files/inline-images/2019-05-16_14-30-46.png?itok=v2XAJ5QF

Those who want a 20 ft/40 ft expandable container house with solar energy, well, Amazon has that too. This tiny home has it all: a post-industrial feel using an old shipping container, virtue signaling with solar panels, full bathroom, and a kitchen to make avocado and toast.

https://www.zerohedge.com/s3/files/inline-images/2019-05-16_14-31-41.png?itok=N9ksRa5o

With almost two-thirds of Millennials living paycheck to paycheck and less than half of them have $500 in savings, we’re sure this lost generation could afford one of these trailers tiny homes with their Amazon credit card. Nevertheless, the tiny home craze among millennials is more evidence that living standards are collapsing.

Source: ZeroHedge

Gavin Newsom Wants To Fix California’s Housing Crisis. So What Are His Options?

Gov. Gavin Newsom says California’s housing affordability crisis is so severe that he wants a bit of everything to solve it.

https://www.sacbee.com/latest-news/u8se2p/picture228456934/alternates/FREE_1140/SAC_RCB_20190326_Newsom_Housing156.JPG

California Governor Gavin Newsom and Megan Colbert compare notes on raising toddlers as she shares her struggles as a single parent while talking about affordable housing issues on Tuesday, March 26, 2019 in Sacramento. Newsom held a round table discussion to address housing affordability and rising rents. Renée C. Byer rbyer@sacbee.com

That means seeding construction for millions of new residences, opening the door to a new rent control law and finding ways to protect low-income families from eviction.

Continue reading

Where Home Prices Are Rising the Fastest (Slowest) In America

Since the end of the great recession, home prices in America have rebounded substantially. Since the dark days of 2009, prices have steadily climbed and are up over 50% on average from the lowest point.

This is great news for homeowners whose homes may be worth more than their pre-recession values, but less great news for homebuyers who can afford less house for the dollar. What’s more is that in some places, home prices have spiked much faster than average, while in other places, home prices have remained depressed.

So where in America are home prices increasing the fastest and the slowest? In light of fluctuating mortgage interest rates, tax reform that’s limited many homeowner deductions, and an affordability crisis in many urban areas, along with Priceonomics customer RefiGuide.org thought we’d dive deeper into the home price data published, aggregated and made available by Zillow.

Over the last year, the median home prices increased the fastest at the state level in Idaho, where prices increased by a staggering 17.2%. In just two states did home prices actually fall last year (Alaska and Delaware). The large cities with the fastest home appreciation were Newark, Dallas, and Buffalo where prices increased more than 15% in each place. The large city where prices decreased the fastest was Seattle, where home prices actually fell 2.4%.

Lastly, we looked at the expensive markets (where homes cost more than a million dollars) that had the highest price appreciation. St. Helena, CA, Quogue, NY and Stinson Beach, CA all had prices increase over 20% last year.

***

For this analysis, we looked at data from the beginning of March 2019 compared to prices one year earlier. We looked at Zillow’s seasonally adjusted median price estimate as published by Zillow Research Data.

Nationally, home prices increased 7.2% last year or about $15,000 more than the year before. However, in some states prices spiked much more than that.

https://www.zerohedge.com/s3/files/inline-images/state1.jpg?itok=FY7fZuHw

Idaho leads the country with home prices increasing by 17.2% last year, driven by strong demand in the Boise market. In Utah the impact of a thriving economy and growing population is that prices increased 14% in just one year. Nevada, likewise is seeing strong home price growth as people migrate from California and the state’s low taxes are more favorable under the most recent tax reform. Alaska and Delaware have the distinction of being the only states where home prices fell over the last year.

Next, we looked at home prices in the top one hundred largest housing markets, as measured by population. Which cities were experiencing rapid home equity appreciation and which ones are not? 

https://www.zerohedge.com/s3/files/inline-images/states2.jpg?itok=6VBwCrMd

At the city level, home prices have increased the fastest in Newark, NJ where prices have increased more than 17% as buyers who are priced out of New York City have purchased in this area. Dallas, a city with a strong economy and low taxes has seen home prices increase nearly 17% as well.

Notably, some of the most expensive and desirable cities like Seattle, Oakland and Portland have seen their prices decrease in the last year. Each of these locations has experienced price appreciation during this decade, however.

Were there any smaller cities and towns that experienced home prices rising faster than the big cities? Below shows the fifty places in the United States where home prices increased the most this last year:

https://www.zerohedge.com/s3/files/inline-images/states3.jpg?itok=m0ox7MnB

Across the Midwest and South, numerous smaller cities experienced price appreciation much greater than 25% last year. In Nettleton, MS prices increased 49% in just one year! Notably, almost none of these high-price growth cities are located on the coasts.

Lastly, what are expensive places to buy a home in America that are just getting more expensive? To conclude we looked at locations where the median home price was over one million dollars and the prices keep rising:

https://www.zerohedge.com/s3/files/inline-images/state4.jpg?itok=mLMpJ2ww

In this rarefied group, prices increased the most in Saint Helena, CA. In this tony town in Napa Valley, prices increased over 25% last year. In second place was Quogue, NY a town in the Hamptons. In fact, 9 out of the top 10 expensive cities with high price appreciation are in California or New York. More specifically, many of these locations are in the vicinity of San Francisco and New York City, the two very large economic engines that are driving home prices.

***

After nearly a decade of vibrant stock market and real estate returns, this year home prices have continued to climb at a steady clip. In only two states in America did prices actually fall, and in five states prices grew more than 10% in a year. As the economy has continued roaring, places that were once known for being affordable like Idaho, Utah, and Nevada have seen home prices spike. While expensive cities like Seattle, Portland and Oakland have seen prices level off in the last year, and places like Newark, Dallas and Buffalo have become less affordable. In this stage of American economic expansion, the once affordable places are seeing their prices escalate.

Source: ZeroHedge | by Priceonomics

Mapped: The Salary Needed To Buy A Home In 50 U.S. Metro Areas

Over the last year, home prices have risen in 49 of the biggest 50 metro areas in the United States.

At the same time, mortgage rates have hit seven-year highs, making things more expensive for any prospective home buyer.

With this context in mind, today’s map comes from HowMuch.net, and it shows the salary needed to buy a home in the 50 largest U.S. metro areas.

https://www.zerohedge.com/s3/files/inline-images/salary-needed-house-u-s-metro-areas_edit2.jpg?itok=7NPM9G4n

The Least and Most Expensive Metro Areas

As a reference point, Visual Capitalist’s Jeff Desjardins points out that the median home in the United States costs about $257,600, according to the National Association of Realtors.

https://www.zerohedge.com/s3/files/inline-images/2019-04-29_19-08-23.jpg?itok=i9734hd-

With a 20% down payment and a 4.90% mortgage rate, and taking into account what’s needed to pay principal, interest, taxes, and insurance (PITI) on the home, it would mean a prospective buyer would need to have $61,453.51 in salary to afford such a purchase.

However, based on your frame of reference, this national estimate may seem extremely low or quite high. That’s because the salary required to buy in different major cities in the U.S. can fall anywhere between $37,659 to $254,835.

The 10 Lowest Cost Metro Areas

Here are the lowest cost metro areas in the U.S., based on data and calculations from HSH.com:

https://www.zerohedge.com/s3/files/inline-images/2019-04-29_19-08-55.jpg?itok=qiNBNZFB

After the dust settles, Pittsburgh ranks as the cheapest metro area in the U.S. to buy a home. According to these calculations, buying a median home in Pittsburgh – which includes the surrounding metro area – requires an annual income of less than $40,000 to buy.

Just missing the list was Detroit, where a salary of $48,002.89 is needed.

The 10 Most Expensive Metro Areas

Now, here are the priciest markets in the country, also based on data from HSH.com:

https://www.zerohedge.com/s3/files/inline-images/2019-04-29_19-09-45.jpg?itok=izlHuYly

Topping the list of the most expensive metro areas are San Jose and San Francisco, which are both cities fueled by the economic boom in Silicon Valley. Meanwhile, two other major metro areas in California, Los Angeles and San Diego, are not far behind.

New York City only ranks in sixth here, though it is worth noting that the NYC metro area extends well beyond the five boroughs. It includes Newark, Jersey City, and many nearby counties as well.

As a final point, it’s worth mentioning that all cities here (with the exception of Denver) are in coastal states.

Notes on Calculations

Data on median home prices comes from the National Association of Realtors and is based on 2018 Q4 information, while national mortgage rate data is derived from weekly surveys by Freddie Mac and the Mortgage Bankers Association of America for 30-year fixed rate mortgages.

Calculations include tax and homeowners insurance costs to determine the annual salary it takes to afford the base cost of owning a home (principal, interest, property tax and homeowner’s insurance, or PITI) in the nation’s 50 largest metropolitan areas.

Standard 28% “front-end” debt ratios and a 20% down payments subtracted from the median-home-price data are used to arrive at these figures.

Source: ZeroHedge

Americans Can’t Afford To Buy A Home In 70% Of The Country

Even at a time of low interest rates and rising wages, Americans simply can’t afford a home in more than 70% of the country, according to CBS. Out of 473 US counties that were analyzed in a recent report, 335 listed median home prices were more than what average wage earners could afford. According to the report from ATTOM Data Solutions, these counties included Los Angeles and San Diego in California, as well as places like Maricopa County in Arizona.

New York City claimed the largest share of a person’s income to purchase a home. While on average, earners nationwide needed to spend only about 33% of their income on a home, residents in Brooklyn and Manhattan need to shell out more than 115% of their income. In San Francisco this number is about 103%. Homes were found to be affordable in places like Chicago, Houston and Philadelphia.

This news is stunning because homes are considerably more affordable today than they were a year ago. Although prices are rising in many areas, they are also falling in places like Manhattan. Unaffordability in the market has been the result of slower home building and owners staying in their homes longer. Both have reduced the supply of homes in the market.

And the market may continue to create better conditions for buyers. Affordability could improve because of the fact that homes are out of reach for so many seekers, according to Todd Teta, chief product officer at ATTOM Data Solutions. Today’s market is also more affordable than it was a decade ago, before the crisis. Home prices were about the same prior to the crisis, even though income adjusted for inflation was lower.

“What kept the market going was looser lending standards, so that was compensating for affordability issues,” Teta said. Since then, standards have toughened (for now, at least).

We recently wrote about residents of New York City who simply claimed they couldn’t afford to live there.

More than a third of New York residents complained that they “can’t afford to live there” anymore (and yet they do). On top of that, many believe that economic hardships are going to force them to leave the city in five years or less, according to a Quinnipiac poll published a couple weeks ago. The poll surveyed 1,216 voters between March 13 and 18.

In total, 41% of New York residents said they couldn’t cope with the city’s high cost of living. They believe they will be forced to go somewhere where the “economic climate is more welcoming”, according to the report.

Ari Buitron, a 49-year-old paralegal from Queens said: “They are making this city a city for the wealthy, and they are really choking out the middle class. A lot of my friends have had to move to Florida, Texas, Oregon. You go to your local shop, and it’s $5 for a gallon of milk and $13 for shampoo. Do you know how much a one-bedroom, one-bathroom apartment is? $1700! What’s wrong with this picture?”

Source: ZeroHedge

HUD Planning Crackdown On Illegal Aliens Taking Advantage Of Public Housing

The Department of Housing and Urban Development (HUD) will be proposing a new rule that further prevents illegal immigrants from taking advantage of public housing assistance, The Daily Caller has learned.

https://i0.wp.com/www.gopusa.com/wp-content/uploads/2019/04/section_8.jpg

Section 214 of the Housing and Community Development Act prevents non-citizens from obtaining financial housing assistance. However, the presence of so-called “mixed families” has complicated the enforcement of the rule. Illegal immigrants have previously been able to skirt the restrictions by living with family members who are U.S. citizens and receive subsidized housing through HUD. (RELATED: Trump’s HUD Official Moves To The Projects In The Bronx)

HUD intends to roll out a proposal over the next few weeks that prohibits any illegal immigrant from residing in subsidized housing, even if they are not the direct recipient of the benefit. HUD currently estimates that tens of thousands of HUD-assisted households are headed by non-citizens.

Families who are caught gaming the system by allowing illegal immigrants to stay with them either have to comply with the new rule or they will be forced to move out of their residence.

Households will be screened through the Systematic Alien Verification for Entitlements, or “SAVE,” program.

An administration official told the Caller that this is a continuation of the president’s “America First” policies.

“This proposal gets to the whole point Cher was making in her tweet that the President retweeted. We’ve got our own people to house and we need to take care of our citizens,” the official said. “Because of past loopholes in HUD guidance, illegal aliens were able to live in free public housing desperately needed by so many of our own citizens. As illegal aliens attempt to swarm our borders, we’re sending the message that you can’t live off of American welfare on the taxpayers’ dime.”

According to HUD, there are currently millions of American citizens on the waitlist for government-assisted housing because the department does not have enough resources to provide every eligible family with financial assistance.

The president has repeatedly lamented the drain that illegal immigration has on resources for American families.

Source: by Amber Athey | The Daily Caller

***

HUD moves to cancel illegal aliens’ public housing access

https://martinhladyniuk.com/wp-content/uploads/2019/04/03c40-1402448651971.jpg


The Trump administration is proposing a new rule to try to block some 32,000 illegal immigrant-led families from claiming public housing assistance, saying it’s unfair to hundreds of thousands of Americans who are stuck on waiting lists.

41% Of New York Residents Say They Can No Longer Afford To Live There

More than a third of New York residents complaint that they “can’t afford to live there” anymore (and yet they do). On top of that, many believe that economic hardships are going to force them to leave the city in five years or less, according to a Quinnipiac poll published Wednesday. The poll surveyed 1,216 voters between March 13 and 18. 

In total, 41% of New York residents say they can’t cope with the city’s high cost of living. They believe they will be forced to go somewhere where the “economic climate is more welcoming”, according to the report.

Ari Buitron, a 49-year-old paralegal from Queens said: “They are making this city a city for the wealthy, and they are really choking out the middle class. A lot of my friends have had to move to Florida, Texas, Oregon. You go to your local shop, and it’s $5 for a gallon of milk and $13 for shampoo. Do you know how much a one-bedroom, one-bathroom apartment is? $1700! What’s wrong with this picture?”

https://www.zerohedge.com/s3/files/inline-images/apartments%20for%20rent%20new%20york.jpg?itok=BSU4QTYO

In response to a similar poll in May 2018, only 31% of respondents said they felt as though they would be forced to move, indicating that the outlook among residents is getting much worse – very quickly.

New York native Dexter Benjamin said: “I am definitely not going to be here five years from now. I will probably move to Florida or Texas where most of my family has moved.”

Many of those who have moved, prompted by New York’s tax burden and new Federal law that punishes high tax states, aren’t looking back. Robert Carpenter, 50, who moved from Brooklyn to New Jersey told the Post: “Moving to New Jersey has only added 15 minutes to my commute! And I am still working in Downtown Brooklyn. I save about $300 extra a month, which in the long run it matters.”

He continued: “Because of the city tax and the non-deductibility of your real estate taxes, we’re seeing a lot more people with piqued interest.”

The poll also found that minorities have an even more pessimistic outlook on things. Non-whites disproportionately ranked their situations as “poor” and “not good” according to the poll.

Clifton Oliver, 43, who is black and lives in Washington Heights, said: “When I moved here there was no H&M, no Shake Shack — it was authentically African-American New York Harlem. Now Neil Patrick Harris lives down the block. People are going down south to Florida, Alabama, Baltimore.”

Source: ZeroHedge

Basement-Dwelling Millennials Beware: Reverse Mortgages May Evaporate Your Inheritance

With nearly 90% of millennials reporting that they have less than $10,000 in savings and more than 100 million Americans of working age with nothing in retirement accounts, we have bad news for basement-dwelling millennials invested in the “waiting for Mom and Dad to die” model;

Reverse mortgages are set to make a comeback if a consortium of lenders have their way, according to Bloomberg.

https://www.zerohedge.com/s3/files/inline-images/adult%20at%20home.jpg?itok=__UGDfV9

Columbia Business School real estate professor Chris Mayer – who’s also the CEO of reverse mortgage lender Longbridge Financial, says the widely-panned financial arrangements deserve a second look. Mayer is a former economist at the Federal Reserve of Boston with a Ph.D. from MIT. 

In 2012, Mayer co-founded Longbridge, based in Mahwah, New Jersey, and in 2013 became CEO. He’s on the board of the National Reverse Mortgage Lenders Association. He said his company, which services 10,000 loans, hasn’t had a single completed foreclosure because of failure to pay property taxes or insurance. –Bloomberg

Reverse mortgages allow homeowners to pull equity from their home in monthly installments, lines of credit or lump sums. Over time, their loan balance grows – coming due upon the borrower’s death. At this point, the house is sold to pay off the loan – typically leaving heirs with little to nothing

Elderly borrowers, meanwhile, must continue to pay taxes, insurance, maintenance and utilities – which can lead to foreclosure.

While even some critics agree that reverse mortgages make sense for some homeowners – they have been criticized for excessive fees and tempting older Americans into spending their home equity early instead of using it for things such as healthcare expenses. Fees on a $100,000 loan on a house worth $200,000, for example, can total as much as $10,000 – and are typically wrapped into the mortgage. 

The profits are significant, the oversight is minimal, and greed could work to the disadvantage of seniors who should be protected by government programs and not targeted as prey,” said critic Dave Stevens – former Obama administration Federal Housing Administration commissioner and former CEO of the Mortgage Bankers Association. 

To support his claims that reverse mortgages are far less risky than they used to be, Mayer cites a 2014 study by Alicia Munnell of Boston College’s Center for Retirement Research. Munnell, a professor and former assistant secretary of the Treasury Department in the Clinton Administration (who once invested $150,000 in Mayer’s company and has since sold her stake). Munnell concluded that industry changes requiring lenders to assess a prospective borrower’s ability to pay property taxes and homeowner’s insurance significantly reduces the risk of a reverse mortgage

The number of reverse mortgages, or Home Equity Conversion Mortgages (HECM) in the United States between 2005 and 2018 has not shown a recent upward trend – however that may change if Mayer and his cohorts are able to convince homeowners that reverse mortgages aren’t what they used to be.

https://www.zerohedge.com/s3/files/inline-images/reverse%20mortgages.png?itok=RB-pSImm

Cleaning up their image

For years, the reverse mortgage industry has relied on celebrity pitchmen to convince Americans to part with the equity in their homes in order to maintain their lifestyle. 

The late Fred Thompson, a U.S. senator and Law & Order actor, represented American Advisors Group, the industry’s biggest player. These days, the same company leans on actor Tom Selleck.

Just like you, I thought reverse mortgages had to have some catch,” Selleck says in an online video. Then I did some homework and found out it’s not any of that. It’s not another way for a bank to get your house.

Michael Douglas, in his Golden Globe-winning performance on the Netflix series The Kominsky Method, satirizes such pitches. His financially desperate character, an acting teacher, quits filming a reverse mortgage commercial because he can’t stomach the script. –Bloomberg

https://youtu.be/JxqWAWNs6V4

In 2016, American Advisers and two other companies were accused by the US Consumer Financial Protection Bureau of running deceptive ads. Without admitting guilt, American Advisers agreed to add more caveats to its promotions and paid a $400,000 fine. 

As a result, the company has made “significant investments” in compliance, according to company spokesman Ryan Whittington, adding that reverse mortgages are now “highly regulated, viable financial tools,” which require homeowners to undergo third-party counseling before participating in one. 

The FHA has backed more than 1 million such reverse mortgages. Homeowners pay into an insurance fund an upfront fee equal to 2 percent of a home’s value, as well as an additional half a percentage point every year.

After the last housing crash, taxpayers had to make up a $1.7 billion shortfall because of reverse mortgage losses. Over the past five years, the government has been tightening rules, such as requiring homeowners to show they can afford tax and insurance payments. –Bloomberg

As a result of tightened regulations, the number of reverse mortgage loans has dropped significantly since 2008. 

Making the case for reverse mortgages is Shelly Giordino – a former executive at reverse mortgage company Security 1 Lending, who co-founded the Funding Longevity Task Force in 2012. 

Giordino now works for Mutual of Obama’s reverse mortgage division as their “head cheerleader” for positive reverse mortgages research. One Reverse Mortgage CEO Gregg Smith said that the group is promoting “true academic research” to convince the public that reverse mortgages are a good idea. 

Mayer under fire

University of Massachusetts economics professor Gerald Epstein says that Columbia may need to scrutinize Mayer’s business relationships for conflicts of interest. 

They really should be careful when people have this kind of dual loyalty,” said Epstein. 

Columbia said it monitors Mayer’s employment as CEO of the mortgage company to ensure compliance with its policies. “Professor Mayer has demonstrated a commitment to openness and transparency by disclosing outside affiliations,” said Chris Cashman, a spokesman for the business school. Mayer has a “special appointment,” which reduces his salary and teaching load and also caps his hours at Longbridge, Cashman said.

Likewise, Boston College said it reviewed Professor Munnell’s investment in Mayer’s company, on whose board she served from 2012 through 2014. Munnell said another round of investors in 2016 bought out her $150,000 stake in Longbridge for an additional $4,000 in interest.

“Anytime I had a conversation like this, I had to say at the beginning that I have $150,000 in Longbridge,” said Munnell. “I had to do it all the time. I’m just as happy to be out, for my academic life.” 

Source: ZeroHedge

The Most Splendid Housing Bubbles in America Get Pricked

San Francisco Bay Area & Seattle lead with biggest multi-month drops since 2012; San Diego, Denver, Portland, Los Angeles decline. Others have stalled. A few eke out records.

San Francisco and San Diego are catching the Seattle cold, and others are sniffling too, as the most splendid housing bubbles in America are starting to run into reality.

House prices in the Seattle metro dropped 0.6% in December from November, according to S&P CoreLogic Case-Shiller Home Price Index, released this morning, and have fallen 5.7% from the peak in June 2018, the biggest six-month drop since the six-month drop that ended in February 2012 as Housing Bust 1 was bottoming out. The index is now at the lowest level since February 2018. After the breath-taking spike into June, the index is still up 5.1% year-over-year, and is 27% higher than it had been at the peak of Seattle’s Housing Bubble 1 (July 2007):

https://wolfstreet.com/wp-content/uploads/2019/02/US-Housing-Case-Shiller-Seattle-2019-02-26.png

So Seattle’s Housing Bubble 2 is unwinding, but more slowly than it had inflated. Many real estate boosters simply point at the year-over-year gain to say that nothing has happened so far — which makes it a picture-perfect “orderly decline.”


San Francisco Bay Area:

The Case-Shiller index for “San Francisco” includes five counties: San Francisco, San Mateo (northern part of Silicon Valley), Alameda, Contra Costa (both part of the East Bay ), and Marin (part of the North Bay). In December, the index for single-family houses fell 1.4% from November, the steepest month-to-month drop since January 2012. The index is now down 3% from its peak in July, the biggest five-month drop since March 2012.

Given the surge in early 2018, the index is still up 3.6% from a year ago and remains 37% above the peak of Housing Bubble 1, fitting into the theme of a perfect orderly decline:

https://wolfstreet.com/wp-content/uploads/2019/02/US-Housing-Case-Shiller-San-Francisco-Bay-Area-2019-02-26.png

Case-Shiller also has separate data for condo prices in the five-county San Francisco Bay Area, and this index fell 0.9% in December from November, after an blistering 2.4% drop in the prior month. From the peak in June 2018, the index has now dropped 4.2%, the steepest six-month drop since February 2012:

https://wolfstreet.com/wp-content/uploads/2019/02/US-Housing-Case-Shiller-San-Francisco-Bay-Area-Condos-2019-02-26.png

The Case-Shiller Home Price Index is a rolling three-month average; this morning’s release tracks closings that were entered into public records in October, November, and December. By definition, this causes the index to lag more immediate data, such as median prices, by several months.

The index is based on “sales pairs,” comparing the sales price of a house in the current month to the prior transaction of the same house years earlier (methodology). This frees the index from the issues that plague median prices and average prices — but it does not indicate prices.

It was set at 100 for January 2000; a value of 200 means prices as tracked by the index have doubled since the year 2000. Every index on this list of the most splendid housing bubbles in America, except Dallas and Atlanta, has more than doubled since 2000.

The index is a measure of inflation — of house-price inflation. It tracks how fast the dollar is losing purchasing power with regards to buying the same house over time.

So here are the remaining metros on this list of the most splendid housing bubbles in America.

San Diego:

House prices in the San Diego metro declined 0.7% in December from November and are now down 2.6% from the peak in July, the biggest five-month drop since March 2012, leaving the index at the lowest level since February 2018, and just one hair above the peak of Housing Bubble 1:

https://wolfstreet.com/wp-content/uploads/2019/02/US-Housing-Case-Shiller-San-Diego-2019-02-26.png

Los Angeles:

The Case-Shiller index for the Los Angeles metro was about flat in December with November but down 0.5% from the peak in August — don’t laugh, the largest four-month decline since March 2012. What this shows is just how relentless Housing Bubble 2 has been. The index is up 3.7% year-over-year:

https://wolfstreet.com/wp-content/uploads/2019/02/US-Housing-Case-Shiller-Los-Angeles-2019-02-26-B.png

Portland:

The Case-Shiller Index for the Portland metro inched down in December from November for the fifth month in a row and is now down 1.4% from the peak in July 2018. And that was the steepest five-month drop since March 2012. Year-over-year, the index was up 3.9%:

https://wolfstreet.com/wp-content/uploads/2019/01/US-Housing-Case-Shiller-Portland-2019-01-29.png

Denver:

House prices in the Denver metro edged down in December from November for the fourth month in a row, after an uninterrupted 33-month run of monthly increases. The four-month drop amounted to 0.9%, which, you guessed it, was the steeped such drop since March 2012. The index is at the lowest level since May 2018 but is still up 5.5% year-over-year:

https://wolfstreet.com/wp-content/uploads/2019/02/US-Housing-Case-Shiller-Denver-2019-02-26.png

Dallas-Fort Worth:

The Case-Shiller Index for the Dallas-Fort Worth metro in December ticked up by less than a rounding error to a new record, leaving it essentially flat for the seventh month in a row. The index is up 4.0% year-over-year:

https://wolfstreet.com/wp-content/uploads/2019/02/US-Housing-Case-Shiller-dallas-2019-02-26.png

Boston:

In the Boston metro, house prices dipped 0.5% in December from a record in November and are now back where they’d been in June. The Case-Shiller Index is up 5.3% from a year ago:

https://wolfstreet.com/wp-content/uploads/2019/02/US-Housing-Case-Shiller-Boston-2019-02-26.png

Atlanta:

The Case-Shiller Home Price Index for the Atlanta metro inched up a smidgen in December, to a new record, and is up 5.9% from a year ago:

https://wolfstreet.com/wp-content/uploads/2019/02/US-Housing-Case-Shiller-Atlanta-2019-02-26.png

New York City Condos:

The Case-Shiller index for condo prices in the New York City metro ticked down in December for the second month in a row after a mighty bounce in September and an uptick in October. This index can be volatile, but after all these bounces and declines, the index was up just 1.5% from a year ago, the smallest year-over-year price gain on this list of the most splendid housing bubbles in America:

https://wolfstreet.com/wp-content/uploads/2019/02/US-Housing-Case-Shiller-New-York-condos-2019-02-26.png

On a national basis, these individual markets get averaged out with other markets that didn’t quite qualify for this list since their housing bubble status has not reached the ultimate splendidness yet. Some of those markets, such as the huge metro of Chicago, remain quite a bit below their Housing Bubble 1 peaks and are now declining, while others are shooting higher.

So the Case-Shiller National Home Price Index has been about flat since July, but is still up 4.7% year-over-year and is 11% higher than it had been at its prior peak in July 2006 during Housing Bubble 1:

https://wolfstreet.com/wp-content/uploads/2019/02/US-Housing-Case-Shiller-National-Index-2019-02-26.png

It always boils down to this: Regardless of how thin you cut a slice of bologna, there are always two sides to it. When home prices drop after a housing bubble, there are many losers. But here are the winners – including a whole generation. Listen to my latest podcast, an 11-minute walk on the other side…

Enjoy reading WOLF STREET and want to support it? Using ad blockers – I totally get why – but want to support the site? You can donate “beer money.” I appreciate it immensely. Click on the beer mug to find out how:

Would you like to be notified via email when WOLF STREET publishes a new article? Sign up here.

Why Are An Increasing Number Of High-Income Americans Choosing To Rent?

(MishTalk) The percentage of high-income households choosing to rent is on the rise. High-income is defined as $150,000 and up.

https://www.zerohedge.com/s3/files/inline-images/https___s3-us-west-2.amazonaws%20%2814%29.jpg?itok=mVkK1F7g

The Rent Cafe reports High-Income Americans Are the Fastest Growing Renter Segment — Up by 1.35 Million in a Decade.

The most recent U.S. Census data tells us that the annual increase in the number of high-income renter-occupied households – defined here as those earning $150,000 or more – has been consistently faster than owner-occupied households. As a matter of fact, from 2007 to 2017, the numbers of those rich enough to own, yet who still prefer to rent grew by 175%. That’s compared to a decade-long increase of 67% in homeowners within the same income bracket.

Top-Earning Renters Are Growing Faster than Any Other Renter Income Bracket

Of the 43.3 million renters nationwide, 2.1 million are top earners. High-income renters represent the demographic that experienced the largest boom across the U.S. given that, back in 2007, there were only 774,000.

Breakdown

  • Over $150K — ↑175%
  • $100K – $150K — ↑111%
  • $75K – $100K — ↑66%
  • $50K – $75K — ↑32%
  • Under $50K —↓0.2%

High-Income Renter-Occupied vs Homeowner-Occupied Households 2007-2017

https://www.zerohedge.com/s3/files/inline-images/https___s3-us-west-2.amazonaws%20%2815%29.jpg?itok=og0hQlCI

Debate Over High-Income Definition

Arguably, $150K may not be enough to qualify as high-income in places like San Francisco or New York City, which is probably why the two cities have the largest numbers of renter-occupied households inside this bracket.

NYC’s upper-bracket renters outpace owners not only in net numbers but also in the rate of increase. Wealthy renter-occupied households in New York doubled in the course of a decade, going from 125,000 in 2007 to the largest number of wealthy renters in the U.S. today — 249,000. As for people earning $150K or more who own a home in the Big Apple, their numbers have increased by a lesser 63% over the course of a decade (189,000 in 2007 to 306,000 ten years later).

Top 10 Cities With High-Income Renters

https://www.zerohedge.com/s3/files/inline-images/https___s3-us-west-2.amazonaws%20%2816%29_0.jpg?itok=eNMXepdt

American Dream

The Rent Cafe concluded. “The attitude toward renting at any income level is changing. With renters becoming the majority population in many U.S. cities, the spike in the national population of wealthy renter households could mean a change in attitude toward an American Dream that no longer belongs to this generation of renters.”

Marriage Rates Down, Cohabitation Up

https://www.zerohedge.com/s3/files/inline-images/https___s3-us-west-2.amazonaws%20%2817%29.jpg?itok=Oy6khVgc

Not Just Student Debt

The Rent Cafe article ties in nicely with my previous report: Marriage Rates Down, Cohabitating Rates Up: It’s Not Just Student Debt to Blame

Attitudes, Attitudes, Attitudes

A Fed study on Consumers and Communities released last month had an interesting comment on homeownership.

“We estimate that roughly 20 percent of the decline in homeownership among young adults can be attributed to their increased student loan debts since 2005. Our estimates suggest that increases in student loan debt are an important factor in explaining their lowered homeownership rates, but not the central cause of the decline.”

The rest is explained by changing attitudes and affordability.

Attitudes about marriage, having kids, mobility, and debt have all changed.

This is not 1960 or 1971.

To top it off, houses simply are not affordable. That’s what the cohabitation rate shows. Wages have not kept up with home prices even without the burden of student debt.

American Dream

Even when high-income households can afford a house, many choose to rent instead. Why?

  1. Changing attitudes about the “American Dream”.
  2. The Marriage Tax Penalty
  3. The Remarriage Penalty

Reader “Cecilia” thoughtfully added “Liquidity and Walk Away Arbitrage”, which also ties into the remarriage issue.

Remarrying can greatly complicate divorce financial arrangements. It’s easier to live with someone. No one wants a second divorce, especially if the first one was messy.

Source: ZeroHedge


Oregon Defies Logic With Statewide Rent Control

It is often said by cynical economists and political commentators, usually of the right or libertarian persuasion, that the road to hell is paved with good intentions. There is no more odious and damaging economic policy that comes from the heart than rent control. For years, limiting the cost of living spaces was done at the local level, but one West Coast state aims to be the first to implement statewide rent controls.

https://www.zerohedge.com/s3/files/inline-images/rent1.png?itok=vibPikMf

Oregon’s Proposed Rent Controls

Oregon is set to pass SB 608, legislation that prohibits landlords from raising rents in the first year of a resident’s tenancy. The bill would also cap future rent hikes at 7% annually, plus inflation. This will target all rental properties 15 years or older but exempt units that are a part of a government housing project.

It should be noted that SB 608 does not have vacancy controls, which means buildings can jack up the rent by any amount once the tenant gives his or her notice. Because of this, the legislation bans no-cause evictions, so any landlord must offer a government-approved excuse for evicting a tenant.

With Democratic supermajorities in both chambers of the legislature, SB 608 is likely to pass, making Oregon the first state with statewide rent control.

Gov. Kate Brown (D-OR) is proud of the move, saying in her inaugural address:

“We also need to help Oregonians who have homes but are struggling with the high cost of rent. We can help landlords and tenants navigate this tight housing market. Speaker [Tina] Kotek and Sen. [Ginny] Burdick have innovative proposals that will give renters some peace of mind.”

Lawmakers are jubilant over the bill, but economic experts call the Beaver State’s policy proposal risky, including Mike Wilkerson of ECONorthwest, an economics consulting firm, telling Reason: “You’d be hard-pressed to find any economist who comes out in favor of rent control as a means to help improve whatever failure you are experiencing.”

Rent Control Hurts the Poor

First, it is important to examine the justification for rent controls. Advocates contend that it is immoral for someone who has lived in a neighborhood his entire life to be suddenly priced out of it. It is also wrong, they assert, that landlords are just sitting on their rear ends, enjoying higher rents, because there is a greater demand to reside in New York, San Francisco, or Boston than in Jerome, AZ, or Bonanza, CO.

Proponents will ignore the unintended consequences of rent control. New properties are not erected, vacancy rates plunge, existing landlords exit the market, and the small supply of housing diminishes. Landlords will try to evade regulations by transforming their units into condominiums, luxury apartments, furnished suites, or offices.

Advocates also overlook two other important facts: Real estate can be utilized for a diverse array of purposes (commercial, housing, or industrial), and these laws distort pricing signals.

Ultimately, the state plays a game of cat-and-mouse, coming up with intrusive ways to rein in the evaders. Regulation begets regulation.

New York City

When World War II ended and peacetime reigned supreme in America again, things were not what they used to be, at least for the thousands of troops returning home. After being engaged in battles overseas, soldiers had a new front to fight at home: life – and everything it had to offer.

Despite the inflation rate either contracting or rising in single digits between 1947 and 1952, the cost of living ballooned for the returning heroes of the Armed Forces. One area of the country that increasingly priced these men out of the market was New York City, where real estate values were skyrocketing – and still are!

Officials had an idea to help everyone affected by rising housing costs: rent controls. While the goal was to make units more affordable, the city made the situation worse by introducing temporary relief.

Like economist Milton Friedman once quipped, “There is nothing more permanent than a temporary government program.” This relic of 1947 is still around today, exacerbating the housing affordability crisis. It is estimated that approximately 50,000 apartments and one million rent-stabilized units are controlled by a 70-year-old law.

To understand how egregious this policy is, look no further than former Rep. Charles Rangel (D-NY). The Wall Street Journal reported in September 2008 that he occupied “four rent-stabilized apartments in a posh New York City building,” living in three and using another as an office. By holding four properties, he took advantage of valuable resources at below-market prices at the expense of others.

Controls

Is there a difference between bombs and rent control? Economists often pose this question when debating the efficacy of government controls. The Mises Institute’s Joseph Salerno delivered a lecture a few years ago, showing pictures of urban areas and asking his audience if these dilapidated units were the victims of a bombing campaign or rent controls.

When you even pose the question, you know it’s necessary to second-guess the prescription.

Any time officials use “controls,” you know the policy is going to be a failure. Whether it is preceded by “price” or “rent,” this economically defiant measure produces destitution, deterioration, and destruction. It’s too bad politicians and bureaucrats never learn their lesson.

Source: ZeroHedge

Over 150 People Move Out Of Chicago Every Day

With its nation-leading murder rate, lake-effect weather, endemic corruption and financial mismanagement, who really wants to live in Chicago? Well, the data is in, and as Mayor Rahm Emmanuel prepares to hand power to a new administration next year, his legacy – already marred by the above-mentioned scourges – has accrued another ignominious distinction. According to Census data analyzed by Bloomberg, Chicago experienced the highest daily net migration in the US, losing 156 residents a day (strictly due to migration, not murder) a day in 2017.

After Chicago, Los Angeles came second with 128, followed by New York with 132.

On the other side of that coin were cities across the US sun belt, like Dallas (No. 1, with 246 net incoming), followed by Phoenix (with 174) and Atlanta (No. 3 with 147).

https://www.zerohedge.com/sites/default/files/inline-images/2018.12.14tripledigits.JPG?itok=2ikoSSfuhttps://www.zerohedge.com/sites/default/files/inline-images/2018.12.14bbgtwo.JPG?itok=NGSUAKFp

In terms of total net migration for the year, the tallies differed only slightly. While the sun belt was the biggest beneficiary of Americans’ growing preference for sunnier weather, lower rents and plentiful job opportunities…

Dallas was the greatest beneficiary of this domestic migration, adding nearly 59,000 domestic movers in 2017, followed by Phoenix (51,000) and Tampa (41,000), which serve as anchors for the western and southern regions that got the bulk of the gains.

…some of America’s largest cities saw net outflows as rising rents, crumbling (or inadequate) public infrastructure. The city with the biggest outflow was NYC, followed by Los Angeles and – in third place – beautiful Bridgeport, Conn.

On the flip side, more than 208,000 residents left the New York City metropolitan area last year. This was nearly twice as many as the second biggest loser, Los Angeles, which had a decline of nearly 110,000. Chicago fell by 85,000. Honolulu, San Jose, New York and Bridgeport, CT lost the highest shares of their residents to other parts of the country.

In Chicago, New York and Los Angeles, the three areas with a triple-digit daily exodus, people are fleeing at a greater rate than just a few years earlier. Soaring home prices and high local taxes are pushing local residents out and scaring off potential movers from other parts of the country.

But maybe if Emmanuel’s successor can successfully implement the outgoing mayor’s plans for a city wide UBI (which we imagine would go a long way toward offsetting its hated ‘amusement tax’ and other levies needed to pay off the city’s brutal debt burden), maybe he can bribe residents into staying.

Source: ZeroHedge

“A Rough Decade Ahead” – ‘Math’ & The Future Of The US Housing Market

Authored by Chris Hamilton via Econimica blog,

Summary

  • New Housing is being Created at an Unprecedented 2.5x’s the pace of the Growth of the 15 to 64yr/old Population
  • Total Annual Population Growth Has Slowed 25% from Peak Growth, 2 Decades Ago
  • However, Annual Population Growth Among 15 to 64yr/olds Has Slowed Over 80% From Peak Growth & Will Continue Decelerating Through 2030
  • 15 to 64yr/olds Do Nearly all the Net Home Buying, 65+yr/olds Net Home Selling
    • 15 to 64yr/olds Have a 70% Labor Force Participation Rate vs. 27% for 65-74yr/olds, just 8% for 75+yr/olds
    • 15 to 64yr/olds Earn and Spend Double that of 65-74yr/olds & triple that of 75+yr/olds
    • 65+yr/olds Have Highest Home ownership Rate at 78% vs. Just 36% for Group with Lowest Rate, 15 to 34yr/olds
    • 15-64yr/olds are Credit Willing Relative to Credit Averse 65+yr/olds

I read an article a few days ago that got me thinking.  The article’s author claimed,

“At 5% mortgage rates and with today’s level of affordability, history shows that there is nothing in the way from having a home building boom over the next ten years to satisfy this demographic demand.”

I found the claim contrary to everything I think I know, so I thought I’d lay out the counter argument.

The chart below shows annual growth of the 15+yr/old US population (blue columns) vs. the annual growth of the 15 to 64yr/old population (red balls).  The 15+yr/old annual population growth has fallen 25% (decline of a half million annually) since the 1998 peak but more significantly, the 15 to 64yr/old annual population growth has fallen over 80% (decline of 1.8 million/yr) due to a combination of lower immigration rates and lower birth rates.

https://www.zerohedge.com/sites/default/files/inline-images/40246456-1540573727993815.png?itok=TOw6SAp-

These population growth trends will only continue to slow through 2030, according to UN and Census estimates (not really estimates, since this population is already born and simply advancing into adulthood).  The future estimates for 15 to 64yr/old population growth (presented above) include estimated immigration well above present rates.  Most, if not all (net) of the assumed 15 to 64yr/old minimal population growth is premised on ongoing immigration that continues slowing.  Thus the forward looking 15 to 64yr/old growth estimates are likely to be lower and perhaps even turning to outright annual declines.

The chart below shows average income, spending, and LFP (labor force participation) rates by age segment.  No shocker, those actively working make and spend more than those with low rates of employment.  Those who have worked longer earn more than those new to the labor force.  Elderly expenditures come into very close alignment with their (generally) fixed incomes.

https://www.zerohedge.com/sites/default/files/inline-images/40246456-15405775019409947.png?itok=pGk1ZXnO

Noteworthy is that 75+yr/olds have only an 8% LFP rate but will make up over half of the total 65+yr/old population growth through 2030.  The next largest growth segment is among 70 to 74yr/olds with a 19% LFP rate, and the smallest increase is among the 65 to 69yr/olds with a 32% LFP.   As an aside, 65+ year olds have the highest home ownership rates at 78% vs. 36% for those aged 15 to 34. So while the more affluent portion (5% to 20%?) of 65+yr/olds may be interested in a second home in the desert, the mountains, or beach…the majority already own and are eventually looking to downsize.  Simply stated, nearly all the coming growth is among those that work the least, earn the least, spend the least, already own homes, and are more likely to downsize than buy a second home.

https://www.zerohedge.com/sites/default/files/inline-images/40246456-15405820325401883.png?itok=tYwxN_9R

Putting it all together (chart below), annual 15+yr/old total population growth (blue columns), 15 to 64yr/old population growth (red line), housing starts (yellow line), and federal funds rate (black line).  Given it is the 15 to 64yr/old population that does the net home buying, (and growth among them continues decelerating…coupled with rising rates and elevated valuations versus most population growth among 75+yr/olds who are more likely to sell via downsizing and/or willing properties to their heirs) I contend the US is creating too many homes presently, not too few.  Of course, this doesn’t even factor in things like the lack of income growth among the vast majority those working, high student debt loads, slowing household formation, continued delayed family formation and the lowest birth rates in US history which were just recorded in the first quarter of 2018 (according to CDC…HERE), etc. etc.

https://www.zerohedge.com/sites/default/files/inline-images/40246456-15405930794152036.png?itok=DjqawWsJ

Contrary to the author of the article that inspired me, I contend that housing is in for another very rough decade (at the very least)… likely worse than the period during the GFC.  The math is pretty straightforward on this one.

Source: ZeroHedge

Record Inventory Floods Seattle, Sending Home Prices Significantly Lower

This is how housing markets turn. Slowly, then all at once.

Seven years of Seattle home prices outpacing wage growth because of low rates; bidding wars replaced by sales at the asking price; days or weeks on the market turning into months; sellers reduce home prices; surging mortgage rates; buyers disappear, and wallah – a classic turning point in an auction, otherwise known as an unfair high that is now rippling through the real estate food chain in the Seattle area.

As a reminder, before we dive into the faltering real estate market in Seattle. Back in September, we outlined a significant clue about the overall health of America’s housing industry: Bank of Ameria called it: “The Peak In-Home Sales Has Been Reached; Housing No Longer A Tailwind.”

With that in mind, it comes as no surprise that inventory countywide soared 86% among single-family homes and 188% among condos in October compared to a year prior, according to newly published data by the Northwest Multiple Listing Service. It was the most massive year-over-year increase on record, dating back to the Dotcom bust, a rhythm that has some asking: Is the housing industry about to go bust?

Mike Rosenberg, a Seattle Times real estate reporter, has been documenting the rise and fall of the real estate market on the West Coast.

Rosenberg said the median home price plummeted to $750,000, down $25,000 in one month and down $80,000 from all-time highs in spring.

He warned, “that is not a normal seasonal drop — prices in the city actually went up during those time frames last year.”

Compared to 2017, prices inched up about 2%. He said interest rates had moved higher in that span have increased monthly mortgage costs.

On the Eastside, the median home sold for $890,000, unchanged from the previous month, but down $87,000 from the all-time high in late summer. On a year-over-year basis, prices were still up 5.3%.

https://www.zerohedge.com/sites/default/files/inline-images/sales%20map.png?itok=wGv4JCCX

Rosenberg notes that prices dipped on a month-over-month basis in South King County but surged at the northern end of the county. He said inventory is flooding the market at the same time as buyer demand evaporates.

https://www.zerohedge.com/sites/default/files/inline-images/Oct%20home%20sales.png?itok=HokTF4vt

As we highlighted in the BofA report, sellers across the country are unloading properties into a weakening market will trigger downward momentum in prices.

Back to Seattle, that is precisely what is happening, as sellers have reacted by cutting asks faster than any other metro area in the country. To make matters worse, buyers are now negotiating prices down even further, as the average home is selling for below list price for the first time in four years, said Rosenberg.

Rising interest rates, declining demand, and flat-lining rents have been the main drivers of failing home buyer demand in the second half of 2018.

Into the fall months, brokers told Rosenberg that buyers are now pausing as they wait for the storm to blow over. 

Ken Graff, a broker with Coldwell Banker Bain in Seattle, listed a townhouse in Magnolia on the market in April, “right before the apparent peak of the market,” and had 11 bidders who ferociously fought for the home, with a winning bid for $800,000. In September, he listed an identical town home in the same neighborhood, it stood on the market for three weeks before selling for $725,000.

“Buyers are still having to pay a premium for Seattle-area properties, but it lacks the frenzy we’ve seen in the last few years,” Graff said.

“People can be a little more measured now, which is a good thing.”

Among other regions where home prices have dropped in October on a year-over-year basis: West Bellevue, Southeast Seattle, Burien-Normandy Park, and the Skyway area. On the other end, prices rose more than 10% from a year ago in Jovita-West Hill Auburn, Auburn, Kent, Renton-Benson Hill, Mercer Island, Kirkland-Bridle Trails and Juanita-Woodinville.

Elsewhere, the rest of the Puget Sound region also saw expanding inventory, including a 65% increase in Snohomish County.

https://www.zerohedge.com/sites/default/files/inline-images/home%20price%20activity.png?itok=Vh7i0Cad

The slowdown in Seattle housing shows little signs of abating as the Federal Reserve is expected to hold rates on Thursday before a hike in December. At their most recent meeting in late September, Fed officials communicated a plan for three more hikes in 2019. With one more rate hike forecasted in 2018 and three more in 2019, it seems that Seattle and much of the country’s real estate market could be at a significant turning point into the 2020 presidential elections. Let us hope real estate prices do not fall even further, as many home buyers could vote with their home prices.

Source: ZeroHedge


The Cycle That Has Been Saving Home Buyers $3,000 Per Year Just Ran Out Of Fuel

Summary

  • After five years of supporting rising home prices, the latest phase of a long-term financial cycle is nearing its end.
  • While little followed in the real estate market, this cycle of yield curve spread compression has been one of the largest determinants of home affordability and housing prices.
  • Using a detailed analysis of national statistics, it is demonstrated that average home buyers in 2018 have been saving about $250 per month, or $3,000 per year.
  • The reasons why the cycle is ending are mathematically and visually demonstrated.

(Daniel Amerian) Home buyers in every city and state have been benefiting from a powerful financial cycle for almost five years. Most people are not aware of this cycle, but it has lowered the average monthly mortgage payment for home buyers on a national basis by about $250 per month since the end of 2013.

The interest rate cycle in question is one of “yield curve spread” expansion and compression, with yield curve spreads being the difference between long-term and short-term interest rates. This interest rate spread has been going through a compression phase in its ongoing cycle, meaning that the gap between long-term interest rates and short-term interest rates fell sharply in recent years.

https://static.seekingalpha.com/uploads/2018/11/2/566013-15411612062108982.jpg

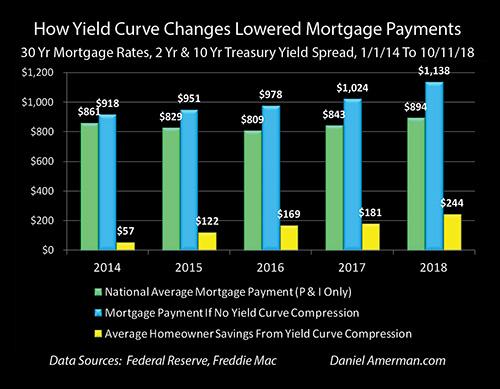
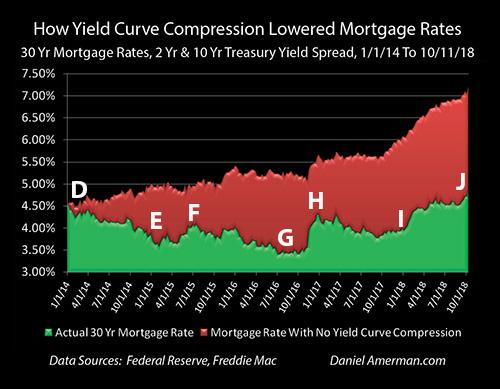
The green bars in the graph above show national average mortgage payments (principal and interest only), and they fell from $861 a month in 2013 to $809 a month in 2016 and have now risen to $894 per month. However, without the narrowing of the spread between short-term rates and long-term rates, mortgage payments would have been entirely different (and likely home prices as well).

Without the cycle of yield curve spread compression then, as shown with the blue bars, average mortgage payments would have been above $900 per month even in 2014, and they would have risen every year since without exception. If it had not been for compression, national average mortgage payments would have reached $978 per month in 2016 (instead of $809) and then $1,138 per month in 2018 (instead of $894).

The yellow bars show the average monthly savings for everyone buying a home during the years from 2014 to 2018. The monthly reduction in mortgage payments has risen from $57 per month in 2014 to $169 per month in 2016, to $244 per month by 2018 (through the week of October 11th).

In other words, the average home buyer in the U.S. in 2018 is saving almost $3,000 per year in mortgage payments because of this little-known cycle, even if they’ve never heard of the term “yield curve.” Indeed, while the particulars vary by location, home affordability, home prices and disposable household income have been powerfully impacted in each of the years shown by this interest rate cycle, in every city and neighborhood across the nation.

While knowledge of this cyclical cash flow engine has not been necessary for home buyers (and sellers) to enjoy these benefits in previous years, an issue has developed over the course of 2018 – the “fuel” available to power the engine has almost run out. That means that mortgage payments, home affordability and housing prices could be traveling a quite different path in the months and years ahead.

https://static.seekingalpha.com/uploads/2018/11/2/566013-15411612537910333.jpg

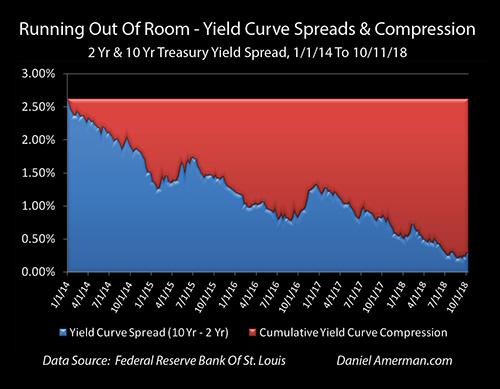
The yield curve spread is shown in the blue area above, and it was quite wide at the beginning of this particular cycle, equaling 2.62% as of the beginning of 2014. It has been steadily used up since that time, however, with the compression of the spread being shown in red. As of the current time, the yield curve compression which has powered the reduction in mortgage payments has almost maxed out, the blue area is almost gone and the ability to further compress (absent an inversion) is almost over.

This analysis is part of a series of related analyses; an overview of the rest of the series is linked here.

(More information on the data sources and calculations supporting the summary numbers above can be found in the rest of series, as well as in the more detailed analysis below. A quick summary is that mortgage rates are from the Freddie Mac Primary Mortgage Market Survey, Treasury yields are from the Federal Reserve, the national median home sale price is from Zillow for the year 2017 and the assumed mortgage LTV is 80%.)

A Cyclical Home Buyer Savings Engine

A yield curve spread is the difference in yields between short-term and long-term investments, and the most common yield curve measure the markets looks to is the difference between the 2-year and 10-year U.S. Treasury yields.

An introduction to what yield curves are and why they matter can be found in the analysis “A Remarkably Accurate Warning Indicator For Economic And Market Perils.” As can be seen in the graph below and as is explored in more detail in some of the linked analyses, there is a very long history of yield curve spreads expanding and compressing as part of the overall business cycle of economic expansions and recessions, as well as the related Federal Reserve cycles of increasing and decreasing interest rates.

https://static.seekingalpha.com/uploads/2018/11/2/566013-1541161506247822.jpg

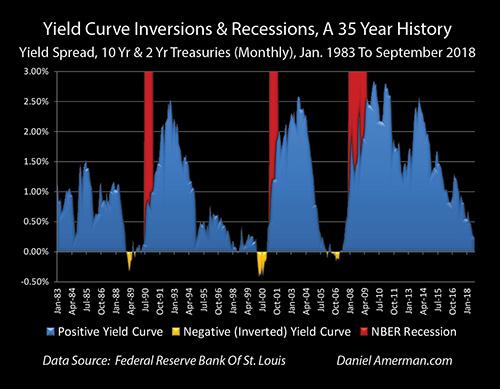
Since the beginning of 2014, the rapid shrinkage of the blue area shows the current compression cycle, and a resemblance (in broad strokes) can be seen with the compression cycles of 1992-2000 and of 2003-2006.

What has seized the attention of the markets in recent months is what followed next in some previous cycles, which is that yield curve spreads went to zero and then became negative, creating “inversions” where short-term yields are higher than long-term yields (as shown in the golden areas). This is important because, while such inversions are quite uncommon, when they do occur they have had a perfect record in recent decades (over the last 35 years) of being followed by economic recessions within about 1-2 years.

However, yield curves don’t have to actually invert in order to turn the markets upside down, and as explored in the analysis linked here, when the Fed goes through cycles of increasing interest rates, we have a long-term history of yield curve spreads acting as a counter cyclical “shock absorber” and shielding long-term interest rates and bond prices from the Fed actions.

That only works until the “shock absorber” is used up, however, and as of the end of the third quarter of 2018, the yield curve “shock absorber” has been almost entirely used up. So, when the Fed increased short-term rates in late September of 2018, there was almost no buffer, and that increase passed straight through to 10-year Treasury yields. The results were painful for bond prices, stock prices and even the value of emerging market currencies.

The same lack of compression led to a sudden and sharp leap to the highest mortgage rates in seven years. Unfortunately, that jump may also potentially be just a taste of what could be on the way, with little further room for the yield curve to compress (without inverting).

Understanding The Relationships Between Mortgage Rates, Treasury Yields and Yield Curve Spreads

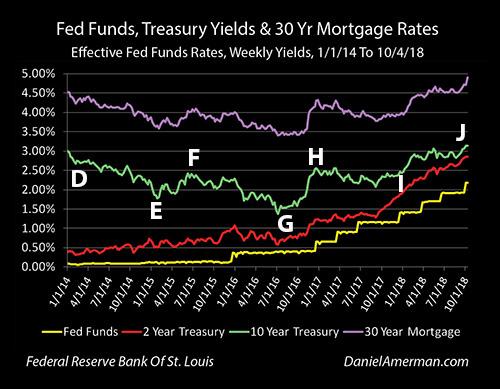
The graphic below shows weekly yields for Fed Funds, 2-year Treasuries, 10-year Treasuries and 30-year fixed-rate mortgages since the beginning of 2014.

https://static.seekingalpha.com/uploads/2018/11/2/566013-1541161602671874.jpg

The first relationship is the visually obvious close correlation between the top purple line of mortgage rates and the green line of 10-year Treasury yields. Mortgage amortization and prepayments mean that most mortgage principal is returned to investors well before the 30-year term of the mortgage, and therefore, investors typically price those mortgage rates at a spread (the distance between the green and purple lines) above 10-year Treasury yields. It isn’t a perfect relationship – the 10-year Treasury tends to be a bit more volatile – but is a close one.

The bottom two lines are the short-term yields, with the yellow line being effective overnight Fed Funds rates, and the red line being 2-year Treasury yields. Because the yield curve has been positive over the entire time period shown (as it almost always is), long-term rates have consistently been higher than short-term rates, and 10-year Treasury yields have been higher than 2-year Treasury yields, which have been higher than Fed Funds rates.

Now, the long-term rates have been moving together, and while the relationship is not quite as close, the short-term rates have also been generally moving together, with the 2-year Treasury yield more or less moving up with the Fed’s cycle of increasing interest rates (each “step” in the yellow staircase is another 0.25% increase in interest rates by the Federal Reserve).

However, the long-term rates have not been moving with the short-term rates. As can be seen with point “D,” 10-year Treasury yields were 3.01% at the beginning of 2014, 2-year Treasury yields were a mere 0.39% and the yield curve spread – the difference between the yields – was a very wide 2.62%.

About a year later, by late January of 2015 (point “E”), 10-year Treasury yields had fallen to 1.77%, while 2-year Treasury yields had climbed to 0.51%. The yield curve spread – the distance between the green and red lines – had narrowed to only 1.26%, or a little less than half of the previous 2.62% spread.

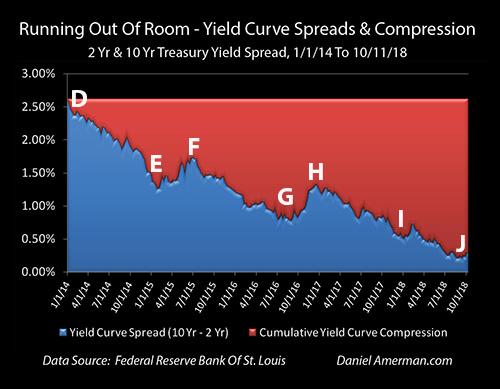
It can be a little hard to accurately track the relative distance between two lines that are each continually changing, so the graphic below shows just that distance. The top of the blue area is the yield curve spread; it begins at 2.62% at point “D” and falls to 1.26% by point “E.” The great reduction between points “D” and “E” is now visually obvious.

https://static.seekingalpha.com/uploads/2018/11/2/566013-15411616451828508.jpg

So, if there had been no change in yield curve spreads, and the 2-year Treasury had risen to 0.51% while the spread remained constant at 2.62%, then the 10-year Treasury yields would have had to have moved to 3.13%.

But they didn’t – the yield curve compressed by 1.36% (2.62% – 1.26%) between points “D” and “E,” and the compression can be seen in the growing size of the red area labeled “Cumulative Yield Curve Compression.” If we start with a 2.62% interest rate spread, and that spread falls to 1.26% (the blue area), then we have used up 1.36% (the red area) of the starting spread and it is no longer available for us.

The critical importance of this yield curve compression for homeowners and housing investors, as well as some REIT investors, can be seen in the graphic below:

https://static.seekingalpha.com/uploads/2018/11/2/566013-15411616777403066.jpg

The top of the green area is the national average 30-year mortgage rate as reported weekly by Freddie Mac. That rate fell from 4.53% in the beginning of 2014 (point “D”) to 3.66% in late January of 2015.

But remember the tight relationship between the green and purple lines in the graph of all four yields / rates. Mortgage investors demand a spread above the 10-year Treasury, mortgage lenders will only lend at rates that will enable them to meet that spread requirement (and sell the mortgages), and therefore, it was the reduction in 10-year Treasury yields that drove the reduction in mortgage rates. And if the yield curve compression had not occurred, then neither would have the major reduction in mortgage rates.

As we saw in the “Running Out Of Room” graphic, the red area of yield curve compression increased by 1.36% between points “D” and “E.” If we simply take the red area of yield curve compression from that graph and we add it to the green area of actual mortgage rates, then we get what mortgage rates would have been with no yield curve compression (all else being equal).

With no yield curve compression, mortgage rates of 3.66% at point “E” would have been 5.02% instead (3.66% + 1.36% – 5.02%).

With a $176,766 mortgage in late January of 2015, a monthly P&I payment at a 3.66% rate is $810. (This is based on a national median home sale price for 2017 of $220,958 (per Zillow) and an assumed 80% mortgage LTV.)

At a 5.02% mortgage rate – which is what it would have been with no yield curve compression – the payment would have been $951. This meant that for any given size mortgage, monthly payments were reduced by 15% over the time period as a result of yield curve spread compression ($810 / $951 = 85%).

Now, at that time, housing prices were still in a somewhat fragile position. The largest decrease in home prices in modern history had just taken place between the peak year of 2006 and the floor years of 2011-2012. Nationally, average home prices had recovered by 9.5% in 2013, and then another 6.4% in 2014.

Here is a question to consider: Would housing prices have risen by 6.4% in 2014 if mortgage rates had not reduced monthly mortgage payments by 15%?

The Next Yield Curve Spread Compression

https://static.seekingalpha.com/uploads/2018/11/2/566013-15411617409541132.jpg

Our next key period to look at is between points “E” and “G,” late January of 2015 to late August of 2016. We are now beginning a rising interest rate cycle when it comes to short-term rates. The Fed had done its first slow and tentative 0.25% increase in Fed Funds rates, and 2-year Treasury yields were up to 0.80%, which was a 0.29% increase.

All else being equal, when we focus on the yellow and red lines of short-term interest rates, mortgage rates should have climbed as well. (Graphs are repeated for ease of scrolling.)

https://static.seekingalpha.com/uploads/2018/11/2/566013-15411617690603347.jpg

However, that isn’t what happened. After a brief jump upwards at point “F,” yield curve spreads had substantially fallen to 0.78% by point “G,” as can be seen in the reduction of the blue area above. For this to happen, the compression of yield curve spreads had to materially increase to 1.84%, as can be seen in the growth of the red area.

https://static.seekingalpha.com/uploads/2018/11/2/566013-15411618029250658.jpg

In the early stages of a cycle of rising interest rates (as part of the larger cycle of exiting the containment of crisis), mortgage rates did not rise, but fell from the very low level of 3.66% at point “E” to an even lower level of 3.46% at point “G,” as can be seen in the reduction of the green area.

To get that reduction in the green area during a rising interest rate cycle required a major growth in the red area of yield curve compression. To see what mortgage rates would have been without yield curve compression (all else being equal), we add the red area of cumulative yield curve compression of 1.84% to the green area of actual mortgage rates of 3.46% and find that mortgage rates would have been 5.30%.

Returning to our $176,766 mortgage example, the monthly mortgage payment (P&I only) is $790 with a 3.46% mortgage rate, and is $982 with a 5.30% mortgage rate. Yield curve compression was responsible for a 20% reduction in mortgage payments for any given borrowing amount by late August of 2016.

However, a problem is that by late August of 2016, the 1.84% cumulative cyclical compression of the yield curve meant that only 0.78% of yield curve spreads remained. A full 70% of the initial yield curve spread had been used up.

(Please note that the mortgage payments in this section of the analysis are calculated based on historical mortgage rates for the particular weeks identified. The annual average payments presented in the beginning of this analysis are the average of all weekly payment calculations for a given year, and therefore, do not correspond to any given week.)

Using Up The Rest Of The Fuel (Yield Curve Spreads):

https://static.seekingalpha.com/uploads/2018/11/2/566013-1541161855409905.jpg

After its slow and tentative start, the Federal Reserve returned to 0.25% Fed Funds rate increases in December of 2016, and has kept up a much steadier pace since that time. As of October of 2018, Fed Funds rates are now up a total of 2% from their floor. As can be seen in the line graph of the yield curve over time, 2-year Treasury yields have also been steadily climbing and were up to 2.85% by point “J,” the week ending October 11th.

However, 10-year Treasury yields are not up by nearly that amount. By late August of 2018, 10-year Treasury yields were only up to 2.87%, which was 1.29% above where they had been two years before.

https://static.seekingalpha.com/uploads/2018/11/2/566013-15411618892487876.jpg

The difference can be found by looking at the very small amount of blue area left by point “J” – yield curve spreads were down to a mere 0.22% by the week ending August 29th, or less than one 0.25% Fed Funds rate increase. This meant that the red area of total cumulative yield curve compression was up to 2.40%, which means that 92% of the “fuel” that had been driving the compression profit engine had been used up – before the Fed’s 0.25% Fed Funds rate increase of September 2018.

As explored in much more detail in the previous analysis linked here, when the Federal Reserve raised rates for the eighth time in September, the yield curve did not compress. Such a compression could have been problematic, as the yield curve would have been right on the very edge of inverting, and there is that troubling history when it comes to yield curve inversions being such an accurate warning signal of coming recessions.

Instead, the short-term Fed Funds rate increase went straight through to the long-term 10-year Treasury yields, full force, with no buffering or mitigation of the rate increase by yield curve compression. The resulting shock as the 10-year Treasury yield leaped to 3.22% led to sharp losses in bonds, stocks and even emerging market currencies.

The same shock also passed through in mostly un-buffered form to the mortgage market via the demand for mortgage investors to be able to buy mortgages at a spread above the 10-year Treasury bond. Thirty-year mortgage rates leaped from 4.71% to 4.90%, an increase of 0.19%, and the highest rate seen in more than seven years.

(I’ve concentrated on the 2- to 10-year yield curve spread in this analysis to keep things simple, to correspond to the market norm for the most commonly tracked yield curve spread and because it has a strong explanatory power for the big picture over time. If one wants to get more precise (and therefore, quite a bit messier), there are also the generally much smaller spread fluctuations between 1) Fed Funds rates and 2-year Treasury yields; and 2) 10-year Treasury yields and mortgage rates.)

https://static.seekingalpha.com/uploads/2018/11/2/566013-1541161992846963.jpg

When we look at the period between points “G” and “J,” it looks quite different than either of the previous periods we looked at. Mortgage rates have been rising, with the largest spike occurring at the time that the Federal Reserve proved it was serious about actually materially increasing interest rates with the Fed Funds rate increase of December 2016 (point “H”).

However, this does not mean that the money saving power of yield curve compression had lost its potency. Between points “D” and “J,” early January of 2014 and early October of 2018, average annual mortgage rates rose from 4.53% to 4.90%, as can be seen in the green area – which is an increase of only 0.37%. Meanwhile, the yield curve spread between the 2- and 10-year Treasuries was compressing from 2.62% to 0.29%, which was a yield curve compression of 2.33%. Adding the red area of cumulative yield curve compression to the green area of actual mortgage rates shows that current mortgage rates would be 7.23% if there had been no yield curve compression (all else being equal).

Mortgage principal and interest payments on a 30-year $176,766 mortgage with 4.90% interest rate are $938 per month, and they are $1,203 per month with a 7.23% mortgage rate. This means that yield curve compression has reduced the national average mortgage payment by about 22%.

Turning The Impossible Into The Possible:

This particular analysis is a specialized “outtake” from the much more comprehensive foundation built in the Five Graphs series linked here, which explores the cycles that have created a very different real estate market over the past twenty or so years.

https://static.seekingalpha.com/uploads/2018/11/2/566013-1541162095131646.jpg

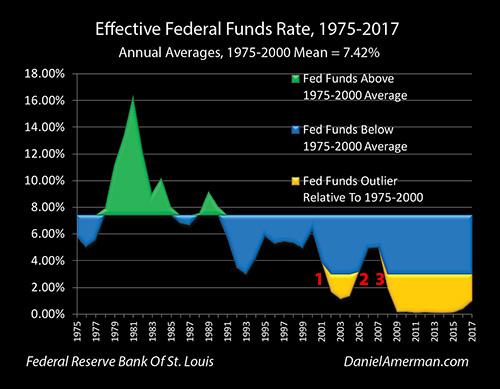
As developed in that series, as part of the #1 cycle of the containment of crisis, the attempts to cure the financial and economic damage resulting from the collapse of the tech stock bubble and the resulting recession, the Federal Reserve pushed Fed Funds rates down into an outlier range (shown in gold), the lowest rates seen in almost 50 years.

As part of the #3 cycle of the containment of crisis, in the attempt to overcome the financial and economic damage from the Financial Crisis of 2008 and the resulting Great Recession, the Federal Reserve pushed interest rates even further into the golden outlier range, with near-zero percent Fed Funds rates that were the lowest in history.

By the time we reach early January of 2014 to late January of 2015, points “D” to “E,” Fed Funds rates were still where they had been the previous five to six years – near zero. Mathematically, there was no room to reduce interest rates, without the U.S. going to negative nominal interest rates.

But yet, mortgage rates fell sharply, from an already low 4.53% to an extraordinarily low 3.66%. This sharp reduction in rates transformed the housing markets and would steer extraordinary profits to homeowners and investors over the years that followed. However, none of it would have been possible without the compression of yield curve spreads.

Once the past has already happened, it is easy to not only take it for granted, but to internalize it and to make it the pattern that we believe is right and natural. Once this happens, the next natural step is to then either explicitly or implicitly project this assumed reality forward, as that trend line then becomes the basis for our financial and investment decisions.

However, where this natural process can run into difficulties is when what made the past possible becomes impossible. Yield curve spread compression took what would have been impossible – a plunge in mortgage rates even as short-term rates remained near a floor – and made it possible. But that pattern can’t repeat (at least not in that manner) when there is no longer the spread to compress.

Source: by Daniel Amerian | Seeking Alpha

Home Price Growth Slows Most Since 2011 As Case-Shiller Rolls Over

Amid the collapse on US home sales, as mortgage rates surge above 5.00%, August’s Case-Shiller home price data plunged to its weakest annual growth since Dec 2016, dramatically missing expectations).

Against expectations of a 5.80% YoY rise, August home prices rose 5.49% (slowing from July’s 5.90% YoY) to its weakest since Dec 2016…

https://www.zerohedge.com/sites/default/files/inline-images/2018-10-30_6-02-10.jpg?itok=N0TP2Lt_

This is the biggest two-month slowdown in Case-Shiller home price growth since 2014…

https://www.zerohedge.com/sites/default/files/inline-images/2018-10-30.png?itok=k6MAWHOy

On a non-seasonally-adjusted basis, home prices rose 5.77%, down from 5.99%, the lowest since June 2017.

And judging by mortgage rates, it’s about to get a whole lot worse…

https://www.zerohedge.com/sites/default/files/inline-images/2018-10-30_6-12-59.jpg?itok=8UhvPbfH

Of course, the establishment is saying this is “contained”:

“Following reports that home sales are flat to down, price gains are beginning to moderate,” David Blitzer, chairman of the S&P index committee, said in a statement. “There are no signs that the current weakness will become a repeat of the crisis, however.”

Las Vegas had the biggest annual increase at 13.9 percent, followed by San Francisco at 10.6 percent and Seattle at 9.6 percent,

https://www.zerohedge.com/sites/default/files/inline-images/2018-10-30%20%281%29.png?itok=vPBTu7Dq

But Seattle’s price appreciation slumped MoM…the biggest drop since Feb 2011…

https://www.zerohedge.com/sites/default/files/inline-images/2018-10-30_6-23-32.jpg?itok=bTwOj3sb

Is it any surprise that home builder stocks have collapsed along with US housing data?

https://www.zerohedge.com/sites/default/files/inline-images/2018-10-30_5-58-59.jpg?itok=U2x9OqyF

Source: ZeroHedge

The “Rental Affordability Crisis” Explained In Three Charts

Four years ago, the United States Department of Housing and Urban Development (HUD) warned of “the worst rental affordability crisis ever,” citing data that:

“About half of renters spend more than 30% of their income on rent, up from 18% a decade ago, according to newly released research by Harvard’s Joint Center for Housing Studies. Twenty-seven percent of renters are paying more than half of their income on rent.”

This is a significant problem for US consumers, and especially millennials, because as we have noted repeatedly over the past year, and a new report confirms, “rent increases continue to outpace workers’ wage growth, meaning the situation is getting worse.”

In the second quarter of 2017, median asking rents jumped 5% from $864 to $910. In the first half of 2018, they have remained at levels crushing the American worker.

https://www.zerohedge.com/sites/default/files/styles/inline_image_desktop/public/inline-images/Median%20Asking%20Rent%20for%20Vacant%20Units.jpg?itok=bFd4Hwut

While the surge in median asking rents has triggered an affordability crisis, new data now shows just how much a person must make per month to afford rent.

According to HowMuch.Net, an American should budget 25% to 30% of monthly income for rent, but as shown by the New Deal Democrat, workers are budgeting about 50% more of their salaries than a decade earlier. The report specifically looked at the nation’s capital, where a person must make approximately $8,500 per month to afford rent.

https://www.zerohedge.com/sites/default/files/styles/inline_image_desktop/public/inline-images/Rent%20map.png?itok=HHeBBKrU

In California, the state with the largest housing bubble, the monthly income to afford rent is roughly $8,300, followed by Hawaii at $7,800 and New York at $7,220.

https://www.zerohedge.com/sites/default/files/styles/inline_image_desktop/public/inline-images/Rent%20Map%202_0.png?itok=czp0y6sD

In contrast, the Rust Belt and the Southeastern region of the United States, one needs to make only $3,500 per month to afford rent.

“Based on the rule of applying no more than one-third of income to housing, people living in the Northeast must earn at least twice as much as those living in the South just to afford rent for what each market considers an average home,” HowMuch.net’s Raul Amoros told MarketWatch.

Which, however, is not to say that owning a house is a viable alternative to renting. In fact, as Goldman notes in its latest Housing and Mortgage Monitor, “buying is looking increasingly less affordable vs. renting with home prices growing faster than rents.”

https://www.zerohedge.com/sites/default/files/inline-images/goldman%20rental%20affordability.jpg?itok=nuiZGj-s

In short: the situation is not likely to improve in the short-term.

A sign of relief could be coming in the second half of 2019 or entering into 2020 when the US economy is expected to enter a slowdown, if not outright recession. This would reverse the real estate market, thus providing a turning point in rents that would give renters relief after a near decade of overinflated prices.

Source: ZeroHedge

San Francisco Bay Area Expats Are Driving Up Home Prices From Boise To Reno

In the not-too-distant future, it’s not improbable that low-wage laborers in San Francisco will be replaced by ubiquitous machines (the city is already home to the first restaurant run by a robot). And not just fast food workers, either – the jobs of teachers, fire fighters and law enforcement will all be assumed by robots, as NorCal’s prohibitively high cost of living and astronomical home prices spark a mass exodus of families earning less than $250,000 a year.

https://www.zerohedge.com/sites/default/files/inline-images/2018.10.24cali.JPG?itok=aZQnQjNE

While this scenario might seem like an exaggeration (and it very well might be), we’ve paid close attention to the flight of Californians who are abandoning the Bay Area for all of the reasons mentioned above, as well as what Peter Thiel (himself a Bay Area emigre) once described as a political “monoculture” that has made California inhospitable for conservatives. And as if circumstances weren’t already dire enough for would-be homeowners (even miles away from San Francisco, relatively modest homes still sell for upwards of $2 million), a report published earlier this year by realtor.com illustrated how a lapse in new home construction has led to a serious imbalance between home supply and the increasing demand of the state’s ever-growing population, leading to a cavernous supply gap.

https://www.zerohedge.com/sites/default/files/inline-images/2018.10.24california.jpg?itok=ltrugbRz

With this in mind, it shouldn’t be surprising that Californians comprise a majority of the residents moving into other states in the American West – even states like Idaho where the culture is very different from the liberal Bay Area. This week, Bloomberg published a story about how Californians constitute an increasing share of out-of-state homebuyers in small cities like Boise, Phoenix and Reno, which are significantly more affordable than California, and offer some semblance of the walkable urban environment that nesting millennials crave.

https://www.zerohedge.com/sites/default/files/inline-images/2018.10.24maptwo.JPG?itok=fB95lYCO

As Californians sell their homes in the Bay Area in search of roomier, cheaper locales, they’re bringing the curse of surging property prices with them. In fact, the influx of Californians is the primary factor leading to some of the largest YoY price increases in the country, as Bloomberg explains:

About 29 percent of the Idaho capital’s home-listing views are from Californians, according to Realtor.com. Reno and Prescott, Ariz., also were popular. These housing markets are soaring while much of the rest of the country cools. In Nevada, where Californians make up the largest share of arrivals, prices jumped 13 percent in August, the biggest increase for any state, according to CoreLogic Inc. data. It was followed closely by Idaho, with a 12 percent gain.

Even in places like deep-red Idaho, these transplants are beginning to remake the terrain in their own image, as food co-ops and Women’s Marches starting to populate the landscape. Businesses are rushing to Boise to meet every desire of the newly arrived Cali transplants.

D’Agostino, the Bay Area transplant, isn’t ashamed of her progressive views and is finding her place: at the natural foods co-op downtown, the Boise’s Women’s March last year, and with the volunteer group she founded to collect unused food for the needy. But it was also good to get out of her comfort zone, she says. “I can’t remember a time when it’s ever been this divided, so the fact that I can have some interaction with people who might not have exactly the same beliefs as me, that’s fine,” she says. “As long as we can respect each other.”

It’s not new for politics to factor into moving decisions—it’s just that in the age of Trump, tensions get magnified. “What’s different now is how far apart the parties are ideologically,” says Matt Lassiter, a professor of history at the University of Michigan.

Politics aside, businesses are rushing into Boise to fill every West Coast craving. In nearby Eagle, the new Renovare gated community is selling 1,900- to 4,000-square-foot homes with floor-to-ceiling glass and “wine walls” that start at $650,000—a bargain by California standards, says sales agent Nik Buich. About half of buyers are from out of state, he says.

One couple even opened a “boutique taqueria” and another transplant is preparing to start a blog about his experience moving to Idaho.

Julie and John Cuevas left Southern California a year ago to open Madre, a “boutique taqueria” in Boise that would make many of their fellow transplants feel at home. It’s more fusion than typical Mexican fare, with taco fillings including kimchi short rib and the popular “Idaho spud & chorizo.” It would have cost them three times as much to open a restaurant in California, says John, a former chef at a Beverly Hills hotel.

John Del Rio, a real estate agent sporting a beard, baseball cap, and sunglasses, just registered moving2idaho.com, where he’s planning to blog about all the things that make his new home great. He left Northern California two years ago with his wife in search of a place with less crime, lighter regulation, and more open space. Del Rio, a conservative with a libertarian bent, is reassured to see average people walking through Walmart with handguns in their holsters. In Idaho, he says, “nobody even flinches.”

In Boise alone, Californians made up 85% of new arrivals, and have driven home prices up nearly 20% in the span of a year. One realtor described the attitude of transplants as like “they’re playing with monopoly money.”

Nestled against the foothills of the Rocky Mountains, Boise (pop. 227,000) has drawn families for decades to its open spaces and short commutes. It’s been particularly attractive to Californians, who accounted for 85 percent of net domestic immigration to Idaho, according to Realtor.com’s analysis of 2016 Census data. While it has always prided itself on being welcoming, skyrocketing housing costs fueled by the influx is testing residents’ patience. In his state of the city speech last month, Mayor David Bieter outlined steps to keep housing affordable and asked Boise to stay friendly: “Call it Boise kind, our kindness manifesto,” he said.

It’s especially easy for buyers who have sold properties in the Golden State to push up prices in relatively cheap places because they feel like they’re playing with Monopoly money, Kelman says. The median existing-home price in Boise’s home of Ada County was $299,950 last month—up almost 18 percent from a year earlier, but still about half California’s. The influx is great news for people who already own homes in the area, says Danielle Hale, chief economist for Realtor.com. “But if you’re a local aspiring to home ownership, it feels very much that Californians are bringing high prices with them.”

And now that Trump’s tax reform package has been implemented, it’s only a matter of time before a whole new batch of Californian home owners, unwilling to forego their SALT tax write offs, start looking for greener pastures in low-cost red states.

Source: ZeroHedge

SF Bay Area Realtor Caters To Mass Exodus Out Of The Region

A real estate brokerage near San Francisco is capitalizing on the mass exodus out of the Bay Area. 

https://d33wjekvz3zs1a.cloudfront.net/wp-content/uploads/2018/06/CAL-EXIT.gif

According to an April report by a Bay Area advocacy group, 46% of locals say they want to move out of the area within the next few years, citing the high cost of living and skyrocketing housing prices as main reasons for wanting out. In February, CBS San Francisco reported that the number of people packing up and leaving the Bay Area has reached its highest level in more than a decade. And fo the first time in ages, the number of people leaving are outnumbering the people coming in.

Meanwhile, a statewide poll conducted by UC Berkeley last year revealed that 56 percent of voters have considered moving due to the housing crisis – and 1 in 4 of those residents said they’d leave the state.

Some are already making good on that promiseData from earlier this year confirms that Sacramento is experiencing its highest rate of domestic migration in over a decade.

https://www.zerohedge.com/sites/default/files/inline-images/state-migration_2_0.png?itok=Vaz6Zi9a

Catering to the exodus

To serve the real estate needs of soon-to-be former Bay Area residents, East-Bay broker Scott Fuller – a real estate broker of 18 years, launched LeavingTheBayArea.com, which helps clients design a relocation strategy. After helping clients sell their home “within a timeframe that works for you,” Fuller will “partner you up with a real estate specialist” in the desired destination city in order to perform an “in-depth needs analysis” in order to coordinate the move.

https://www.zerohedge.com/sites/default/files/inline-images/exodus%20chart.png?itok=iuMQFTpJ

Fuller says that the majority of his clientele are retirees looking to cash out and move to cheaper pastures in areas such as Portland, Las Vegas, Reno, Dallas, Austin and cities in Arizona. Those looking to remain in California have been moving to Folsom and El Dorado Hills.

Source: ZeroHedge

Strategic Relocation: Are You Missing Out?

https://i0.wp.com/www.americanpartisan.org/wp-content/uploads/2018/08/homestead-780767_960_720.jpg?resize=960%2C560

The concept of strategic relocation is not new, but it’s recently become more popular, as more and more liberty-loving folks get tired of being crammed into crowded public transportation or spending hours on the road in the daily snail-pace commute. For many, the thought of leaving everything can be a bit terrifying, and if you have a family who doesn’t want to leave, you might be thinking that your Big Move is more of a pipe dream than a real possibility, even though you see the death grip on your everyday freedoms tightening by the day. Here’s the truth: it can be done. And yes, you can be amazingly happy in a new location that is more conducive to the type of life you want to live.

Just like changing your physical condition requires time, discipline, and effort, so does changing your permanent residence. Add to that a lot of planning, and you’ll see yet another reason why a lot of people don’t do it. Before we get into how to effectively and efficiently plan such a move, however, let’s look at why you might choose that path — or at least, why you’re probably interested in the idea. Over the next few days we’ll go through the process of aligning your thought process, getting down to brass tacks, and even what you should be doing when you get to your new location.

Why Move?

Maybe you live in a high-crime neighborhood. Contrary to what society will tell you these days, moving because you don’t want to deal with crime, homeless camps, drug addicts, or other social problems and vices does not make you a racist. If you want a safer environment for your family, then moving might be your best bet. When I first purchased my home in a quiet lake community north of Seattle, it was a great environment for my kid to grow up, with lots of opportunities. A few short years later, within a five block radius, there was a convicted rapist, a chop shop, a meth house, two shootings, and a hotbed of criminal activity on the next corner. That’s not counting the commute, which more than doubled in time due to exploding population. It was time to go, and I don’t regret making that move one bit. It was hard — and it continues to be. For us, it’s worth it, and we would never even consider leaving our little farm.

There is a long list of reasons why moving out of the city is an excellent choice; if you’re already considering it, then you’ve probably already thought of at least some of these:

  • Crowds
  • Crime
  • Traffic/Long commutes
  • Nosy neighbors
  • Inability to become truly sustainable
  • Lack of room for storing preps or other necessities
  • Higher prices and cost of living
  • Draconian HOAs and suburban “beautification” organizations
  • Gun laws
  • Overregulation, ordinances, taxes, levies, and all the related idiocy
  • Wanting to get your kids out of public schools
  • Lack of like-minded attitudes or political/religious ideals

Another thing you might be dealing with in your area is the locale’s natural disaster type. Everything is a trade, and while preparing for natural disaster is somewhat the same regardless of where you live, each area has its own specific challenges that you might not be okay with.

If you live in an urban or even suburban area, you might also find that you’re having a hard time finding people who believe as you do, whether that be your worldview, politics, or religious belief. Like it or not, harassment is a very real thing—and not in the ways the media would have you believe. Being liberty-minded, religious, or even just the wrong color in certain areas can get you in big trouble—and that goes for anyone. Regardless of what race you are, there are places you aren’t welcome.

The reasons to move are many, and the bottom line is that you don’t need to justify those reasons to anyone. What matters is what’s best for you and your family, and if that means pulling stakes, then so be it. If you’re set on moving, let’s talk about how to make it happen.

Choosing a Location

Once you’ve outlined your reasons for moving (thereby outlining what you’d need in a new location), you’ll need to figure out where to go. Do you just move to a different neighborhood? Out of the city into a nearby suburb? Do you stay in the same state but move to a rural locale? Or do you go all out and move to a different part of the country?

A lot of this will depend on what your reasons for moving are. If state gun laws are an issue for you, for instance, then you’ll probably need to move out of state. If you just want to be able to see your kids go to a less violent or better school, you may be able to get away with just moving to a different neighborhood. If you’ve ever wanted to try your hand at homesteading, you’ll be looking at states where that’s being done successfully.

If you use social media, you can look at groups that are local to the area you’re interested in moving to, to get a feel for the culture. Read their local paper, maybe even pull up the radio frequencies for their local police and fire and listen to the type of calls they’re dealing with on a daily basis. Are they getting a lot of overdoses? Shootings? What area of the town or county are the calls coming from? Are they places you can avoid? Is the crime location-based (such as a specific block or business) or is it widespread all over the county? If you notice over the course of a few weeks of paying attention that a specific street gets a lot of calls, or maybe the cops get called to a certain bar for fights, you can avoid that problem by simply not going to that location.

Look up the laws in your proposed new locale and see what’s considered legal and what’s not. You may very well choose to ignore certain laws in your quest for more freedom, but you should at least be able to make an informed decision about what you’re choosing, and what the potential consequences are so you can mitigate any potential fallout.

Check the county zoning laws and building permit requirements, too. One person I know found the perfect off-grid home—only to find that it was sitting just on the wrong side of the county line, in a location where the county wanted permits for everything and lots of taxes and fees. They chose to pass on that house and went to a county where there are no building permits, and no one cares what they do on their land.

Before choosing a location, you can also pull up all manner of data on everything from average income and education level to demographics, home prices, economic growth, and anything else you’d like to know. It all depends on what kinds of information you seek, and whether you’re willing to do the research. You’re never going to find the perfect place; you can, however, find something that fits the non-negotiables. Check out the local weather too, and keep in mind what will be expected in that area. Are you choosing a place with hard winters? Super-hot summers? Higher altitude? Before you throw out the idea of living in a place with rough winter, for instance, keep in mind that there are positives to everything. Snow runoff, for instance, can help you water your garden months later during a drought if you’ve thought ahead in terms of collection. And after the busyness of spring and summer, you’ll look forward to winter, when you have a freezer full of meat, shelves and root cellar packed with food, enough firewood to keep the house warm, and lots of time to work on indoor projects or study new skills in preparation for spring thaw.

One more thing—be aware of any tourist attractions, natural wonders, or other curiosities in your area. They draw crowds and everything that goes with them. You might have your heart set on living in the mountains of Wyoming—only to later realize that you moved too close to Yellowstone National Park and now have tens of thousands of people clogging your local area for half the year.

Taking the Next Step

Once you’ve decided on a location (or at least narrowed it down to 2), it’s time to talk funding. Look at average rents/mortgage payment amounts. You may need to rent a smaller place until you can buy. You may want a bit of land to raise animals. You may choose to live remotely or in a small town near a larger area. If your ultimate goal is to get as off-grid as possible, understand that you’re not going to want to go directly from an urban or suburban environment directly to a place where you have no electricity and have to haul water. You and your family will get frustrated very fast, and you’ll be tempted to move back. Start small; rent a place with a well and power.

Above all, be realistic about how it’ll be. The first year is really, really hard. The second year is a bit easier but it’s still difficult. Don’t be tempted to show up and assume you’ll be able to be fully sustainable within a year. You’ll learn some hard lessons; those lessons, however, will not only make you stronger, but you’ll find that you’re able to adapt better for the next situation. You’ll learn to use what you have instead of running to the store for everything. Depending on where you end up, you may find that certain times of the year require you to prepare, or forego certain activities in favor of making your life easier later. You’ll learn that at least part of each season is spent preparing for the next one, or getting done various tasks that need doing. There’s a routine to it, however, and over time you’ll also find that you are emotionally attached and invested in your homestead. It’s something you’ve worked on and sweated over, and it helps you survive. If you can find your spot in a state or area that is also more liberty-minded than where you are, you’re doubly blessed.

If you’ve read this far and aren’t interested in taking the leap of faith, that’s fine too — there are those who believe that freedom can be found anywhere. Ultimately, it’s your choice, and you don’t have to defend that to anyone either. For those who can smell the fresh air and imagine a different life for yourself and your family, however, stay tuned. Tomorrow we’ll talk about where you’ll find the money to make it happen.

Source: by Kit Perez | American Partisan

“Largest Ever Homeless Camp” Suddenly Appears In Minneapolis

The Associated Press (AP) has revealed a troubling story of the largest ever homeless encampment site mostly made up of Native Americans has quickly erected just south of downtown Minneapolis, Minnesota.

City officials are scrambling to contain the situation as two deaths in recent weeks, concerns about disease and infection, illicit drug use and the coming winter season, have sounded the alarm of a developing public health crisis.

https://www.zerohedge.com/sites/default/files/styles/inline_image_desktop/public/inline-images/Homelessness.png?itok=7iP_da9A

“Housing is a right,” Mayor Jacob Frey said. “We’re going to continue working as hard as we can to make sure the people in our city are guaranteed that right.”

The AP said approximately 300 people are living in the camp that is situated beside 16th Ave S & E Franklin Ave.

https://www.zerohedge.com/sites/default/files/styles/inline_image_desktop/public/inline-images/homeless%20location.png?itok=gZ0oGSlR

Earlier this month, a team of AP reporters visited the camp and found dozens of tents lining the city street.

To their amazement, most of the residents were Native American.

The homeless camp — called the “Wall of Forgotten Natives” because it lined a highway sound barrier, is in a section of the city with a large concentration of American Indians that are suffering from extreme wealth, health, and education inequality. The AP said the tents stand on what was once considered Dakota land.

https://www.zerohedge.com/sites/default/files/styles/inline_image_desktop/public/inline-images/Homelessness3.png?itok=b4cPdOeN

“They came to an area, a geography that has long been identified as a part of the Native community. A lot of the camp residents feel at home, they feel safer,” said Robert Lilligren, vice chairman of the Metropolitan Urban Indian Directors.

The camp illuminates the inequalities (mentioned above) that face American Indians in the state. AP provides a shocking statistic that American Indians make up 1.1% of Hennepin County’s residents, but 16% of the homeless population, according to government data from April.

It is also a community that is being decimated by opioids. Minneapolis officials in July sued a group of opioid manufacturers and distributors, alleging their actions to promote prescription opioid drugs, such as OxyContin, have caused an addiction crisis straining the city’s resources.

https://www.zerohedge.com/sites/default/files/styles/inline_image_desktop/public/inline-images/Drone%20view%20of%20homeless.png?itok=sbI0VJXO

AP said one end of the camp had been designated for families, while adults — some of whom were high on drugs — were on the other end. In the middle, an organization called Natives Against Heroin, a tent where volunteers handed out bottles of water, food, and clothing. The group also provides addicts with clean needles, and most volunteers carry naloxone to treat overdoses.

“People are respectful,” said group founder James Cross. “But sometimes an addict will be coming off a high… We have to de-escalate. Not hurt them, just escort them off. And say “Hey, this is a family setting. This is a community. We’ve got kids, elders. We’ve got to make it safe.”

With hundreds of people living in close quarters, health officials fear an outbreak of infectious diseases like hepatitis A. Local support groups have started administering vaccines. Earlier this month, a woman died when she did not have an asthma inhaler, and one man died from a drug overdose.

https://www.zerohedge.com/sites/default/files/styles/inline_image_desktop/public/inline-images/homelessness4.png?itok=VIZV3thD

Local government agencies have set up areas to provide medical assistance, antibiotics, hygiene kits or other supplies. There are tents advertising free HIV testing, a place to apply for housing, and temporary showers. Portable restrooms and hand-sanitizing stations had also been positioned around the camp.

The Minneapolis City Council voted Wednesday to move the camp to a 1.5-acre commercial property owned by the Red Lake Nation. The decision came five days after Mayor Jacob Frey and representatives of ten tribes said the industrial site was the best place to relocate the tent city.

The new site at 2105-2109 Cedar Ave. South will not be ready until December because demolition work will take several months, according to David Frank, the city’s Community Planning and Economic Development director.

“We will go as quick as we can to have the interim navigation center operational and ready,” Frank said. “We have our permitting people standing by. We have our housing team, our facilities team and our projects management all lined up to do this work.”

The cost of preparing the site with living accommodations for dozens of people will be between $2 million and $2.5 million, Frank added.

Minneapolis’ homeless explosion comes as no surprise. The much larger trend at play is the nation’s homeless population increasing for the first time since 2010 — driven by housing affordability issues, and widening inequalities. But do not tell President Trump the real economy continues to deteriorate.

In 40 different venues over the last three months, President Trump declared the economy is the greatest, the best or the strongest in US history.

— Trump, in a speech at a steel plant in Illinois, July 26

“This is the greatest economy that we’ve had in our history, the best.”

— Trump, in a rally in Charleston, W.Va., Aug. 21

“You know, we have the best economy we’ve ever had, in the history of our country.”

— Trump, in an interview on “Fox and Friends,” Aug. 23

“It’s said now that our economy is the strongest it’s ever been in the history of our country, and you just have to take a look at the numbers.”

— Trump, in remarks on a White House vlog, Aug. 24

“We have the best economy the country’s ever had and it’s getting better.”

In a recent, Bank of America note titled “The Thundering World,” a major theme in development for the 2020s could be “the epic wealth inequality” that is plaguing the economy.

BofA says quantitative easing amplified income and wealth inequality over the last decade. The distribution of wealth is the widest ever. The top 1% own 40% of the global wealth; the bottom 80% own 7%.

What does this all mean? Well, decades of failed economic and social policies are about to come home to roost. The explosion of homelessness in Minneapolis over a short period, is an example of the breakdown of the social fabric that will strain many more municipalities across the country in the years ahead. The America that we knew will not be the same by 2030.

Source: ZeroHedge

Home Builder Stocks Decline As Fed Hikes Rates And Unwinds

The bloom is off the rose for home builders. Yes, it had been a great run, fueled by The Fed’s zero-interest rate policy (ZIRP) and asset purchases (QE). But despite a roaring economy, SPDR S&P Home builders ETF have been falling since January as The Federal Reserve Open Market Committee (FOMC) sticks to their guns and keeps normalizing interest rates.

https://confoundedinterestnet.files.wordpress.com/2018/10/spdrhbfed.png

Yes, the Fed Dots Plot project indicates that there is still upside momentum to short-term interest rates.

https://confoundedinterestnet.files.wordpress.com/2018/10/feddotsplots.png

And the Fed’s System Open Market Accounts (SOMA) show a declining inventory of Treasury Notes and Bonds to let mature.

https://confoundedinterestnet.files.wordpress.com/2018/10/somadist.png

Source: Confounded Interest


New York Millennials Paying $1800 Per Month To Cram Into 98-Square-Foot Rooms

Millennials in New York are known for living in a state of perpetual brokeness – between student loans, $20 nightclub drinks and $15 avocado toast, it’s easy to understand why 70% of millennials have less than $1,000 in savings. 

Now we can add expensive, glorified closets to the mix, as the Wall Street Journal reports.

https://www.zerohedge.com/sites/default/files/inline-images/98%20sqft.jpg?itok=rlCCvxi2

30-year-old marketing manager Scott Levine lives in an $1,800 per month, 98-square-foot room in a postage-stamp of an apartment – “basically, a kitchen” – with two roomates. Every week, someone from Ollie – his property manager, stops by to drop off towels and toiletries. 

A “community-engagement team” at Ollie helps plan Mr. Levine’s social calendar. A live-in “community manager”—sort of like a residential adviser for a college dorm—gets to know Mr. Levine and everyone else living on the 14 Ollie-managed floors of the Alta LIC building, known as Alta+, and finds creative ways to get them engaged in shared activities, like behind-the-scenes tours of Broadway shows or trips to organic farms. –WSJ

“Life in general can be a bit of a headache,” says Mr. Levine. Thanks to Ollie, he adds, “Everything is done for you, which is convenient.”

https://www.zerohedge.com/sites/default/files/inline-images/murphy%20bed.jpg?itok=-JTje33p

https://www.zerohedge.com/sites/default/files/inline-images/alta3.jpg?itok=Rj8LFD1D

Ollie’s business model is all about convenience and roommates – usually single people in their 20s and 30s who have all amenities provided for them, while sharing a kitchen and common area. 

For city-dwellers accustomed to living cheek-by-jowl with people whose names they’ll never bother to learn, this might seem strange. But for young people still forming their postcollege friend groups—in an era when participation in civic life is down and going to a bar can mean huddling in a corner swiping on Tinder—it makes sense. So much sense that people put up with apartments so small they’re called “micro.” But hey, free shampoo. –WSJ

Meanwhile, startups such as Ollie and Common are competing with big-city real-estate developers. Common manages 20 co-living properties in six cities where roommate situations are more common, such as New York, Los Angeles and Washington DC. They have approximately 650 renters according to CEO Brad Hargreaves. 

“Our audience is people who make $40,000 to $80,000 a year, who we believe are underserved in most markets today,” Mr. Hargreaves says.

Other startups are managing existing homes and apartments, “Airbnb-style” as the WSJ puts it. 

Bungalow, which just announced $64 million in funding, wants property owners to offer space to “early-career professionals” looking for a low-maintenance place to stay. It charges rent that’s “slightly higher” than what it pays those owners, a company spokeswoman says. It currently maintains over 200 properties—housing nearly 800 residents—across seven big cities, says co-founder and CEO Andrew Collins.

As with Common and Ollie, Bungalow advertises that it furnishes the common areas in its homes, installs fast free Wi-Fi, and cleans them regularly. The company also organizes events and outings to help you “build a community with… your new friends.” –WSJ

One of the underlying aspects of the co-living startup models is a technology platform that both advertises to prospective tenants and takes care of their needs once they’re living on-site. Ollie’s “Bedvetter” system, for example, shows apartments to potential tenants – and shows who’s already signed up to live there with links to their personal profiles in order to match roommates. Bedvetter also matches people into “pods” of “potential roommates” before they begin an apartment hunt. 

“It’s like online dating,” says Levine – while his roommate, Joseph Watson, 29, compares it to eHarmony or Match.com vs. Tinder, as it’s designed for long term pairings.

https://www.zerohedge.com/sites/default/files/inline-images/hey%20bud.jpg?itok=uERNlT0U

“Micro Economics” 

While millennials in New York and other urban areas scramble to make ends meet, developers are making hand over fist on the co-living movement – even though the renters themselves are paying less than they would for a private studio. 

The Alta LIC building also has conventional apartments, but the co-living units are filling up faster, says Matthew Baron, one of the Alta LIC building’s developers. What’s more, he adds, he can get more than $80 a square foot for Ollie units compared with around $60 a square foot for the others, even though the Ollie ones are on the lower, less-desirable floors. –WSJ

Another complication with co-living arrangements is tricky community management. L.A.’s PodShare, for example, vets potential tenants beforehand – however issues with problem tenants are unavoidable. “We’ve hosted 25,000 people at this point, so there’s bound to be some problems,” says founder Elvina Beck. 

Common building tenant Teiko Yakobson said that the “community vibe broke down after Common eliminated the paid “house leader,” complaining that “We all just became strangers, and it was no better than living in any other apartment.” Common instead replaced the program with “centralized” community managers at the corporate level – which Hargreaves says is “more coherent” for them. 

It’s not all bad, however…

When it does work, co-living can re-create the kind of communities tenants seek online—ones grounded in common interests and shared socioeconomic status.

Mr. Levine, who not only lives in a co-living building but also works in a co-working space—and in whose social circle most people do either one of those or the other—is aware that, while this isn’t for everyone, he is hardly a standout. “One thing I’ve heard before is that I’m a stereotype of a New York millennial,” he says.

Just make sure you have earplugs in case your roommate is able to get laid in their respectively expensive, tiny room. 

Source: ZeroHedge

The Millennial Crisis

https://d33wjekvz3zs1a.cloudfront.net/wp-content/uploads/2018/09/millennials-phones.jpg

There is a serious economic crisis brewing that few seem to be paying attention. According to a new survey from Zillow Group Inc. (ZG  Get Report), approximately 22.5% of millennials ages 24 through 36 are living at home with their moms or both parents, up nine percentage points since 2005  which was 13.5% and the most in any year in the last decade. Between the student loans which cannot be discharged thanks to the Clintons (to get the support of bankers) even after they find that degrees are worthless when 60% of graduates cannot find employment with such a degree and the fact that taxes have escalated to nearly doubling over the last 20 years that is predominantly state and local, the affordability of buying a home has been fading fast. Despite the fact that millennials are eager to enter the real estate market, they’re bearing the brunt of the challenge directly caused by the combination of taxes and non-dischargeable student loans.

https://d33wjekvz3zs1a.cloudfront.net/wp-content/uploads/2016/02/Hillary-Students.jpg

Now 63% of millennials under the age of 29 cannot even afford the cost of home ownership, according to a CoreLogic and RTi Research study. The expense, in fact, is their number one reason for remaining a renter. In their research, they concluded that one-third of millennial renters reported feeling they cannot afford a down payment to buy a home. This is a sad response that is not being taken into consideration by governments.

Where home prices have not risen sharply, taxes have. First-time home buyers face ever-growing challenges to find and buy affordable entry-level homes as the economics of inefficient governments at the state and local levels have refused to reform and raise taxes to meet pension costs they promised themselves. Politicians from London to Vancouver have increased taxes to try to bring home prices down rather than looking at the problem objectively. All they are accomplishing is punishing people who have owned homes and destroying their future when home values were their retirement savings.

California and Illinois are just two major examples at the top of the list of grossly mismanaged state governments. It is this net affordability factor that has begun to encumber sales of real estate, softening prices and turning many millennials into renters rather than home buyers. Then add the rise of interest rates and we have an economic cocktail of taxes that is beginning to kill the real estate market in a slow death drip by drip. Depressions take place when the debt and real estate markets collapse – not equities and commodities. The amount of money invested in debt markets dwarfs equities, It is ALWAYS the debt market that you undermine when you want to destroy an economy.

Taxes and the rise in interest rates will further erode affordability and is beginning to slow existing-home sales in many markets already. As this trend continues, home prices and mortgage rates over the next couple of years will likely dampen sales and home price growth. There was another study conducted by Freddie Mac which also found that affordability challenges are contributing to a downtrend in young adult home ownership. Long-term, real estate prices will decline as taxes and interest rates rise. The next crop of buyers is being culled and as that unfolds, real estate cannot rise when banks also begin to curtail the availability of mortgages.

Source: by Martin Armstrong | Armstrong Economics

Millennials Are Flocking To Cheap Rust Belt Cities

Educated, but poor, millennials are transforming neighborhoods in several Rust Belt states like Ohio, Michigan, and Wisconsin in search for affordable communities.

Since the end of the American high (the late 1960s), the Rust Belt had experienced decades of de-industrialization and a mass exodus of residents. Manufacturing plants closed down, jobs disappeared, and communities disintegrated, as this once vibrant region is now a symbol of decay and opioids.

However, this trend has reversed in recent years, as some millennials have abandoned big cities for Rust Belt communities, in hopes to catch the falling knife and invest in real estate that could be near its lows.

https://www.zerohedge.com/sites/default/files/styles/inline_image_desktop/public/inline-images/lead_720_405_2.jpg?itok=fBQu3Xua

It is a massive risk, and the narrative behind this “attractive investment bet” are affordable communities, unlike the Washington Metropolitan Area, San Francisco, New York, San Diego County, and Boston.

Yet this revitalization of the Rust Belt economy could not have come at the worse time: Last week, Bank of America rang the proverbial bell on the US real estate market, saying existing home sales have peaked, reflecting declining affordability, greater price reductions and deteriorating housing sentiment.

While it is difficult to say what exactly happens in Rust Belt communities in the next downturn, one should understand that housing prices in these regions will probably stay depressed for the foreseeable future. So, if the millennial who was hoping for a Bitcoin-style like move, they should think again as investing in Rust Belt communities is a long-term strategy.

https://www.zerohedge.com/sites/default/files/styles/inline_image_desktop/public/inline-images/rust-belt-map.jpg?itok=M2wfvc-s

Constantine Valhouli, Director of Research for the real estate research and analytics firm NeighborhoodX, told CNBC that millennials are flocking to these areas not just for home ownership, but rather rebuilding these communities from the bottom up.

“It is about having roots and contributing to the revival of a place that needs businesses that create jobs and create value.”

According to Paul Boomsma, president and CEO of Leading Real Estate Companies of the World (LeadingRE), some of these formerly blighted towns are gradually coming back to life. The latest influx of millennials view these regions as financial opportunities and places to construct new economies – especially with real estate prices far below the Case–Shiller 20-City Composite Home Price Index.

“Millennials are swiping up properties for next-to-nothing prices near downtown city areas that have completely revitalized,” Boomsma said. LendingRE has listed a three-bedroom Victorian home in Mansfield, Ohio, with an asking price of $39,900.

The median home value in Mansfield is $60,300, now compare that to the median home value of nearly $700,000 in New York City and a whopping $1.3 million in San Francisco, and it is obvious why millennials are flocking to the Rust Belt. Experts add that there is more to consider than discounted prices.

“There is a community-mindedness with millennials that attracts them to the smaller Rust Belt towns,” said Peter Haring, president of Haring Realty in Mansfield, Ohio.

“We are seeing an intense interest in participating in the revitalization of our towns and being a part of the community. It’s palpable, and it’s exciting,” he added.

https://www.zerohedge.com/sites/default/files/styles/inline_image_desktop/public/inline-images/40730_78456570_0.jpg?itok=ezCTm4_3

Haring said affordable homes in Mansfield comes with a significant drawback: distance. The closest large cities, Cleveland and Columbus, are each an hour’s drive, and amenities are lacking.

“For people working in those cities, they are sacrificing drive time,” Haring said. “In some cases, they are sacrificing the convenience of nearby shopping and restaurants.”

But for millennials that is a little concern: they have the luxury of working remotely and ordering consumable goods from Amazon.

“More and more people are now working virtually, which means they do not need to be in their office and can work from almost anywhere,” said Ralph DiBugnara, senior vice president at Residential Home Funding. “So why not find somewhere to live where your city dollars can go a lot further?”

CNBC points out that some large corporations are moving back into these areas, the same areas that they left decades ago for cheap labor overseas. One example is home appliance manufacturer Whirlpool, whose corporate headquarters are in Benton Harbor, Michigan.

“It helped revitalize surrounding areas with new lifestyle and cultural amenities,” said LendingRe’s Boomsma. “This type of corporate commitment draws a young workforce, who are attracted by the lifestyle, paired with the relative affordability.”

Todd Stofflet, a Managing Partner at the KIG CRE brokerage firm, said for the millennials who still cannot afford to buy a home, the Rust Belt also has a robust rental market. Millennials who are heavily indebted with student loans, auto debt, and high-interest credit card loans could discover that these low-cost regions are perfect strategies to break free from the debt ball and chain and start saving again. Restore capitalism and say goodbye to creditism, something the Federal Reserve and the White House would not be happy about.

Millennials are creating demand for new apartments, which is a “a catalyst for retail, grocery and office development,” Stofflet added. “As downtown populations experience a resurgence, so does the dining, entertainment and lifestyle of the area.”

https://www.zerohedge.com/sites/default/files/styles/inline_image_desktop/public/inline-images/103504185-GettyImages-498901956.530x298.jpg?itok=S2tb6hTu

Although discounted real estate prices in Rust Belt regions are appealing in today’s overinflated Central Bank controlled markets, Daniela Andreevska, a marketing director at real estate data analytics company Mashvisor, cautioned millennials to learn about the dynamics of why these communities have low prices.

“One should keep in mind that many of the homes there are foreclosures or other types of distressed properties,” she said. “You should analyze and inspect the property well in order to know how much exactly you will have to pay in repairs before buying it.”

These migration trends indicate both positive and negative shifts: on one hand millennials are fleeing unaffordable large cities to Rust Belt regions, in an adverse reaction to failed economic policies to reinflate the housing market. On the other hand, for millennials with insurmountable debt, migrating to these low-cost regions could be the most viable solution to get their finances under control.

https://youtu.be/z6FNrLLGqNw

Source: ZeroHedge


Existing Home Sales At Lowest In 30 Months, Inventories Rise First Time In 3 Years

Following continued weakness in July, analysts once again hope for a rebound in home sales in August but once again they were disappointed. August existing home sales were unchanged from July’s -0.7% drop, hovering at 5.34mm SAAR – the lowest since Feb 2016.

Expectations were for a 0.5% jump in August, but printed unchanged (home sales haven’t seen a monthly increase since March)

https://www.zerohedge.com/sites/default/files/inline-images/2018-09-20_7-03-05.jpg?itok=ocoIiuiK

Both single-family and multi-family units were unchanged in August as median prices dipped for the second month in a row (up 4.6% YoY still).

The West saw a 5.9% slump MoM in existing home sales as Northeast sales rose 7.6% MoM.

Inventory of available properties rose 2.7% y/y to 1.92m, which was the first increase in more than three years. At the current pace, it would take 4.3 months to sell the homes on the market, compared with 4.1 months a year earlier; Realtors group considers less than five months’ supply consistent with a tight market.

“While inventory continues to show modest year over year gains, it is still far from a healthy level and new home construction is not keeping up to satisfy demand,” said Yun.

“Homes continue to fly off the shelves with a majority of properties selling within a month, indicating that more inventory – especially moderately priced, entry-level homes – would propel sales.”

Hope is high for NAR however…

“There are buyers on the sidelines” ready to re-enter the market, Lawrence Yun, NAR’s chief economist, said at a press briefing accompanying the report.

“The housing market can turn for the better” as long as inventory continues to rise, he said.

And despite NAHB sentiment near cycle highs, home builder stocks and housing data continues to tumble…

https://www.zerohedge.com/sites/default/files/inline-images/2018-09-20_6-58-13.jpg?itok=XHjfUvNm

Time for more rate-hikes, right?

“Rising interests rates along with high home prices and lack of inventory continues to push entry-level and first time home buyers out of the market,” said Yun.

“Realtors continue to report that the demand is there – that current renters want to become homeowners – but there simply are not enough properties available in their price range.”

Source: ZeroHedge

What’s Driving The Housing Market Today?

The Housing Picture Is Not Brightening – Part I

https://martinhladyniuk.com/wp-content/uploads/2018/09/81ebf-to2bbe2bearned.jpeg
A house should be earned – It is not a right

The future of the housing market is a topic that has been subject to a great deal of debate and can be somewhat confusing. The intention of this post is to dispel some of the myths that have been generated and add some clarity to the discussion. One of the charts below clearly shows that new construction is still far below levels prior to 2008. It should also be noted that much of the new construction is in apartments and not single family dwellings. In much of the country, housing units are being built using cheap money flowing from the Fed and Wall Street under the idea that if it is built “they will come.” While many people claim the formation of new households and pent-up demand drives this construction I beg to differ. I contend it is a combination of too much money looking for a place to hide and buyers looking for a safe place to put their money.

https://martinhladyniuk.com/wp-content/uploads/2018/09/56451-home-ownership-debt-071218.png

As I wrote this post I tried to do a bit of additional research to supplement what I know as a contractor and Apartment owner but what I found was more like a pack of lies and half-truths spun to fit an agenda. In America, the government, coupled with a slew of builder and Realtor associations control the housing narrative. Huge discrepancies exist in the cost of housing in the various markets across America and while price variations are not uncommon they should be seen as a red flag and reason for caution. Many of the messages being promoted as common knowledge do not pass serious scrutiny. Those of us in the trenches and with our boots on the ground often see things from a different perspective than the economist in their ivory towers, Washington politicians, Wall Street elite, or the media. Home ownership in America is in decline and demographics are not supportive of higher prices. If prices rise it most likely it will be a result of inflation.

https://martinhladyniuk.com/wp-content/uploads/2018/09/f5b93-housing_charts.jpg

Note the amount of traffic, or calls an apartment complex receives may have little to do with the strength of the market. A well qualified potential tenant only has to apply at one complex while those who are rejected continue time after time. Government subsidized housing through programs such as section 8 have cannibalized the market often taking the “best of the worse” and leaving those landlords who choose not to participate with a rather unsavory pool of potential tenants from which to choose. This often includes those denied government housing, nearly bankrupt, or chronically unemployed. The city where I live ranks 23rd in the nation for having the most “zombie foreclosures” however, markets in other parts of the nation are often not as strong as the media claims. A relative of mine who sold a home with an extra lot that was on a golf course north of Houston several years ago took a severe beating. Weak pricing in a market that was touted as very solid is more proof that what many claim is a “boom” is far from spectacular.

A Bloomberg article years ago titled “Wall Street Unlocks Profits From Distress With Rental Revolution” looked behind the curtain and pointed out that a great deal of this housing recovery that has driven the average home price up 30% since 2012 has been the result of Wall Street hedge funds buying in bulk foreclosed houses in order to turn them into rentals. Like many people, I find it totally objectionable these deals were “bundled” and offered in such a way that allowed big business to crowd the average American out of the housing market. In parts of the country, cash fleeing China and other troubled countries has flowed into the market pumping up prices. These type of situations create a questionable base for higher home prices when we consider the low end of the market is driven by Fannie, Freddie, and the FHA all insuring 3.5% down payments from borrowers that lack substantial collateral. History has shown that such special financing simply encourages people to rush out and buy homes they cannot afford. It is important to remember that low-interest rates do not necessarily bring about quality growth or prosperity, decades of slow growth in Japan has proven this.

https://martinhladyniuk.com/wp-content/uploads/2018/09/e8e4c-wsj2bm.jpg

One of the sad accomplishments of current Fed policy is that low-interest rates often do not create all that much new demand but simply moves what does exist forward. To make the situation worse the FHA is busy issuing and guaranteeing risky mortgages written by thinly capitalized non-banks. In 2012 the large Wall Street banks represented over 65% of FHA backed loans, today that number has cratered. Even they have realized loaning money to people that won’t pay it back is a recipe for disaster. America is preparing for a replay of the 2008 housing crisis. Our politically motivated government has insured subprime mortgages with down payments of as little as 3.5% while using weak underwriting standards. We are even seeing restrictions raised on borrowers with past foreclosures in a housing market that may drop 20% when this Fed Wall Street bubble pops. Years ago Lee Iacocca who brought Chrysler back from the brink and made the company viable said something to the effect of when you special out all your cars on Monday you have no sales for the rest of the week. In the current situation, low-interest rates are only one of the factors distorting and skewing America’s housing markets, others will be discussed in part two.

Housing In America – Part II

https://martinhladyniuk.com/wp-content/uploads/2018/09/e56db-screen2bshot2b2016-11-292bat2b855392bam.png

When it comes to real estate, low-interest rates at some point becomes a double edge sword, that affects both its value by making it easier to purchase thus driving up prices, and at the same time allowing more building to take place and increasing the supply. Often we reach or exceed demand, this eventually has a dampening effect on rents and people stop buying it as an “investment”. Rents from real estate and the prices it brings when sold must appreciate more than the natural depreciation from the wear and tear from age or the main driver for owning it as an investment quickly vanishes. Oversupply is the bane of real estate and crushes the value of this hard and expensive to maintain commodity. History has generally shown homes that are paid for and un-leveraged to be a better than average place to store wealth when purchased for a good price, as to whether now is a good time to buy that is difficult to say.

How does the reality of a half-empty apartment complex and a slew of empty houses gel with what we hear about soaring rents, the demand for more housing, and more affordable housing? Those declaring housing has fully recovered must admit housing prices vary greatly across the nation and this is a problem that can be difficult to get your head around. Only politicians in Washington would be silly enough to think that landlords who have to compete against subsidized housing would be eager to remain in the game or that someone working for a living enjoys paying more for an older apartment than someone on the dole who moves into a brand new unit for a fraction of the cost. By not rewarding those who do the right thing our current policies have a corrosive effect on both housing and society.

America has built a lot of housing units over the years, now we must face the fact that they need to be maintained. Instead of focusing and creating policies to rebuild our cities by encouraging homeowners to invest more in upgrading windows, adding insulation and improving the existing housing stock, Washington has doled out low-interest money to Wall Street and home builders in an effort to kick-start the economy by building new housing to generate the illusion of growth and rising prices. Currently, we are in uncharted waters and where this market is headed is anyone’s guess but one thing is certain it is not straight up. Speculating on housing is dangerous and should not be encouraged through bad policy. When people leave older neighborhoods and move to a new house in the suburbs enticed by current artificially low-interest rates they in effect hollow out our cities.

https://martinhladyniuk.com/wp-content/uploads/2018/09/440c6-old-house-crazy-painting-the-porch-diy-05.jpgOld houses need to be maintained

Adding to our housing problems is low down payments and other policies often put people in older houses that they have no interest or knowledge in how to maintain. This can cause even more people to flee the area and brings about further decay. When offered the choice many people find moving easier than repairing and maintaining their homes or neighborhoods and low-interest rates power this trend forward.  Policies should be geared toward creating jobs that maintain these units instead of making them prematurely obsolete. This is a flashing red light warning of danger ahead. By choosing the easy answers America has not faced its housing problems with long-term solutions and encouraging this bodes poorly for the future.

Get your financing in order and get the project started before the market dries up has been how developers everywhere have operated for decades. I have owned an apartment complex in the Midwest for many years and many houses in my area are empty or under leased. In 2005 and 2006 prior to the housing collapse, many people were looking at second homes, today not only have they shed the extra home many have doubled up with family or friends reducing the need for housing. This has left me busy trying to sort out and make sense of the current economy. This is no easy task, it seems we are pushing on a string and calling it demand when someone who can barely pay the rent is encouraged by the government to buy a house they can neither afford or maintain. Currently, we have a shortage of “qualified” buyers and renters.

A close look of permits and starts shows many of the future housing starts are multi-family units, these are being built with cheap “Wall Street” money for the markets of tomorrow with little regard for the realities of today. A new report by Yardi Systems Inc indicates apartment construction is far outpacing demand in many markets, this overbuilding of multi-family will have ramifications on the cost of living and the resale value of homes going forward. It is a fact that single-family housing starts have languished as the percentage of multi-unit buildings under construction has risen. Some of these may be slated as condos but another name for an unsold condo that is being leased is “apartment.”  Let us call a spade a spade, much of what we see today is not a housing market, it is a place where too much money has gone to hide under the impression and hope it will pay off when inflation awakes and comes out roaring from its quiet slumber.

Source: by Bruce Wilds | Advancing Time | Part 1 | Part 2

Permits Plunge But Starts Surge As Housing Data Suggests Rough Future Ahead

After small rebounds in July (after three ugly months prior), August was expected to see those gains consolidate but the picture was extremely mixed with Starts spiking 9.2% MoM and Permits plunging 5.7% MoM.

  • The surge in Starts is the best month since January 2018
  • The plunge in Permits is the worst month since Feb 2017

https://www.zerohedge.com/sites/default/files/inline-images/2018-09-19_5-31-18.jpg?itok=ozQU_ELj

This suggests a rough time ahead for housing as Permits plummet to the lowest since May 2017…

https://www.zerohedge.com/sites/default/files/inline-images/2018-09-19_5-36-59.jpg?itok=vEXNBuVo

All of which suggests home builder stocks have further to fall…

https://www.zerohedge.com/sites/default/files/inline-images/2018-09-19_5-39-33.jpg?itok=J-i2yULd

Probably time for some more rate hikes!

Source: ZeroHedge

Meet America’s First “Shipping Container” Apartment Building For Millennials

“Live with your friends in these Shipping Container Apartments!” the Craigslist, Inc. post reads 

As President Trump’s trade war seizes up global supply chains, one side-effect is an overabundance of shipping containers. And, with just one simple click on eBay, there are pages and pages of 40-foot shipping containers for sale ranging from $1,500 to $3,500. 

Intertwined in the pages, dozens of pre-fab architecture firms are offering tiny modern homes built with containers. 

Some pre-fab container homes are more luxurious than others, ranging from $30,000 to $449,000 for a massive luxury duplex.  While most Americans are too blind to understand their living standards are in decline, on a post-great financial crisis basis, the search trend among Americans for “shipping container homes for sale” has rapidly grown in the past decade.

https://www.zerohedge.com/sites/default/files/inline-images/Screen%20Shot%202018-09-13%20at%203.11.21%20PM_0.png?itok=yey4JhUs

The American dream has transformed from a McMansion of the 1990s and 2000s to a tiny modern container home built with relics from the industrial past of a once vibrant economy.

Enter the brave new world of shipping container apartment buildings.

https://www.zerohedge.com/sites/default/files/inline-images/Screen%20Shot%202018-09-13%20at%203.54.05%20PM.png?itok=MHsbovxr

About 16 days ago, someone posted an ad on Craigslist, offering “units” for rent in a brand new container apartment building in Washington, D.C. where each unit costs about $1,099 per month, and in light of DC’s unaffordable rents, this seems like a good deal for heavily indebted millennials.

https://www.zerohedge.com/sites/default/files/inline-images/Screen%20Shot%202018-09-13%20at%203.54.45%20PM_0.png?itok=NWclWv0q

“This uniquely constructed 4 unit building is truly one of a kind. Welcome to DC’s first shipping container residential building. Constructed using repurposed steel shipping containers, this brand new modern apartment is one of the most memorable multi-family buildings in all of DC. You can rent a bedroom for yourself or bring a group of friends!” the ad stated.

https://www.zerohedge.com/sites/default/files/inline-images/Screen%20Shot%202018-09-13%20at%203.55.43%20PM.png?itok=HsvTYdbu

As shown above, residents share a “large restaurant style kitchen,” and have a large communal area, sort of like a dormitory (below).

https://www.zerohedge.com/sites/default/files/inline-images/Screen%20Shot%202018-09-13%20at%203.56.40%20PM.png?itok=_lbfxb3d

Could shipping container “apartments” be the solution for cities battling a housing affordability crisis? If the experiment proves successful in Washington, expect the metal crate buildings to show up in a port city neighborhood near you housing several dozen broke, if entitled, young Americans, and owned by – who else – Blackstone.

… meanwhile, realtors are getting nervous about sustainability of the Las Vegas area housing market for good reason.

https://youtu.be/Di-KXedpfPU

Source: ZeroHedge

Average US Rent Hits All Time High Of $1,412

With core CPI printing at a frothy 2.4%, and the Fed’s preferred inflation metric, core PCE finally hitting the Fed’s 2.0% bogey for the first time since 2012, inflation watchers are confused why Jerome Powell’s recent Jackson Hole speech was surprisingly dovish even as inflation threatens to ramp higher in a time of protectionism and tariffs threatening to push prices even higher.

https://www.zerohedge.com/sites/default/files/inline-images/core%20PCE%20YoY.jpg?itok=t81BjqZJ

But the biggest concern from an inflation “basket” standpoint has little to do with Trump’s trade war, and everything to do with shelter costs, and especially rent, the single biggest contributor to the Fed’s inflation calculation. It’s a concern because according to the latest report from RentCafe and Yardi Matrix, which compiles data from actual rents charged in the 252 largest US cities, fewer than expected apartment deliveries this year increased competition among existing units, pushing up the national average rent by another 3.1% – the highest monthly increase in 18 months –  to $1,412 in August, an all time high.

https://www.zerohedge.com/sites/default/files/inline-images/National-Average-Rent-August-2018.png?itok=ooITslbh

The national average monthly rent swelled by $42 since last August and $2 since last month. Above-average numbers of renters renewing leases at the end of the summer and heightened demand from college-age renters also contributed to the rise in rents this time of year.

The rental market is so hot right now – perhaps a continue sign that most Americans remain priced out of purchasing a home – that rents increased in 89% of the nation’s biggest 252 cities in August, stayed flat in 10% of cities, and dropped in only 1% of cities compared to August 2017. Queens (NYC), Las Vegas, and Phoenix rents increased the most in one year, while Baltimore, San Antonio, and Washington, DC rents have changed the least among the nation’s largest cities.

Here are the main highlights for large, mid-size and small markets:

  • Renter Mega-Hubs: The largest increases were in Orlando (7.7%) and Phoenix (6.8%), while Manhattan (1.9%) and Washington, D.C. (2.1%) saw some of the slowest growing rents in this category. The biggest net changes were felt by renters in Los Angeles, which pay $102 more per month this August compared to last year.
  • Large cities: Rents in Queens and Charlotte surge by 8.4% and 5.2% respectively, but barely move in Baltimore (0.2%) and San Antonio (1.5%).
  • Mid-size cities: Mesa (6.9%), Tampa (6.4%), and Sacramento (5.5%) rents increase at the fastest pace. At the other end of the spectrum, rents only ticked up in Virginia Beach (1.4%) and Albuquerque (1.7%).
  • Small cities: Due to limited stock and high demand, Lancaster and Reno rents soared by 9.7% and 11.3% respectively. Apartment prices in Midland (31.9%) and Odessa (30%) are over $300 per month more expensive than in August 2017. Brownsville (-2%) and Baton Rouge (-0.7%) saw rents decrease over the past year.

Orlando’s fast-growing rents outpaced the nation’s largest renter hubs

Of the top 20 largest renter hubs in the U.S., Orlando apartments are seeing the highest increase in rent over the past year, 7.7%, reaching $1,393 in August, while San Antonio apartments saw the weakest rent growth of the 20 cities, 1.5% in one year, posting an average rent of $996 per month in August. The biggest net changes in rent compared to August 2017 were felt by renters in Los Angeles, who are paying on average $102 per month more this August compared to the same month last year. Orlando rents increased by no less than $99 per month, and Tampa, Chicago, and Manhattan (New York City) rents are $77 above last year’s average. At the opposite end, rents in San Antonio saw the smallest uptick, only $15 more per month than they were one year ago.

https://www.zerohedge.com/sites/default/files/inline-images/apartment%20prices%20yoy%20change%20sept%202018%20rentcafe.jpg?itok=5KOahFz8

NATIONAL LEVEL: Rents in Nevada and Arizona feel the heat from increased demand

Housing in the Permian Basin continues to see the steepest price increases in the country. Apartments for rent in Midland, TX now cost $1,595 per month, a 31.9% leap from one year prior. Likewise, rentals in neighboring Odessa, TX cost $1,365 on average, having jumped 30% in one year.

  • Reno, NV‘s housing crunch is worsening due to limited land development and high demand for rentals. Rents in Reno are the third fastest rising in the country, behind only Midland and Odessa. The average rent in Reno is $1,253 per month, a massive 11.3% increase year over year, or $127 more per month compared to the same time last year. The average rent in Reno was around $900 just three years ago but has jumped by more than $300 in 36 months, making it increasingly unaffordable for renters. Nevada’s growing popularity as a destination for those moving out of California is reflected in rapidly-growing real estate prices. Besides Reno, apartments in Las Vegas are also getting expensive, with the third fastest growing rents in the U.S. compared to other large cities.
  • Peoria, AZ is facing a similar situation. What used to be an affordable town in the Phoenix area, with an average rent of about $900 per month no more than three years ago, now has apartments that go for $1,114 per month on average, over $200 more expensive, a big leap and a heavy burden for the area’s renters. Compared to August 2017, the average rent in Peoria is 10.1% or $102/month more expensive, the fourth fastest growing this August out of 252 cities surveyed. Likewise, rents in other parts of the Phoenix metro are also rising faster than most other parts of the country, as a consequence of strong demand boosted by big increases in population.
  • Lancaster, CA is fifth in the U.S. in terms of fastest-growing rents. The average rent in Lancaster shot up 9.7% year over year, reaching $1,274 per month. The likely reason? Not enough apartments are being built to keep up with the surge in renter population in this town located on the northern fringes of Los Angeles County.

On the other end of the national spectrum, rent prices have decreased in August in border town Brownsville, TX (-2% y-o-y), Orange County’s Irvine, CA (-0.9% y-o-y), Norman, OK (-0.9% y-o-y), Baton Rouge, LA  (-0.7%) and Dallas suburb Richardson, TX (-0.6%). Amarillo, TX, New Haven, CT, Baltimore, MD, Frisco, TX and Stamford, CT round up the 10 slowest growing rent prices in the U.S. in August.

https://www.zerohedge.com/sites/default/files/inline-images/National-map_august-monthly-report.png?itok=Gl8byreK

LARGE CITIES: Rents rise the fastest in Queens, NY, Phoenix, AZ and Las Vegas, NV

  • Step aside Brooklyn: rent prices are now racing in the NYC borough of Queens, up 8.4% compared to last year, with an average rent of $2,342, behind Manhattan’s average rent of $4,119 and Brooklyn’s $2,801. Rents in Manhattan are among the slowest growing in the U.S., 1.9%, while in Brooklyn rents were up 3.9%.
  • The second fastest growing rents among the nation’s largest cities are in Phoenix, AZ, up 6.8% over the year. The area has seen a surge in population in search of affordable housing and job opportunities. Even with prices of apartments growing at annual rates of 6-7%, the average rent is still affordable at $996 per month, especially when compared to most other major cities in the country.
  • Las Vegas is an increasingly popular place to move to, as Census population estimates show, but the local real estate market is slow to respond. New apartment construction is low, causing rents to go up significantly. An apartment in Las Vegas costs on average $1,011, up 6.2% since August 2017.

At the same time, rents decreased in August in border town Brownsville, TX (-2% y-o-y), Orange County’s Irvine, CA (-0.9% y-o-y), Norman, OK (-0.9% y-o-y), Baton Rouge, LA  (-0.7%) and Dallas suburb Richardson, TX (-0.6%). Amarillo, TX, New Haven, CT, Baltimore, MD, Frisco, TX and Stamford, CT round up the 10 slowest growing rent prices in the U.S. in August.

https://www.zerohedge.com/sites/default/files/inline-images/Monthly-Report-August-2018-Large-cities-map.png?itok=phNr2DNp

MID-SIZE CITIES: Mesa and Tampa apartments see steepest rises in rents

Apartments in Mesa, AZ and Tampa, FL are seeing price increases above 6% in August. Rents in Mesa reached $965 per month, and in Tampa the average rent is $1,287. Sacramento, Pittsburgh, and Fresno wrap up the top 5, with annual price increases of above 5%.

  • Pittsburgh, PA is emerging as a hot rental market, as the city’s job market is gaining traction in tech-related fields. The average rent in Steel City is $1,216, but it is expected to keep growing as apartment construction is not yet in line with the sudden increase in demand.

At the other end of the chart are Wichita, KS, with rents decreasing by 0.8%, Lexington, KY, where prices for apartments moved by 1.1% in one year, Tulsa, OK, where rents changed by 1.3%, Virginia Beach, with prices up by only 1.4% and Albuquerque, NM, where rents saw a 1.7% uptick. The average rent in Lexington sits at $889 per month, in Virginia Beach it is slightly higher, at $1,169 per month, and in Albuquerque, it averages $852 per month.

https://www.zerohedge.com/sites/default/files/inline-images/Monthly-Report-August-2018-Mid-cities-map.png?itok=7G50vpuL

SMALL CITIES: Rents in Midland and Odessa are over $300 per month more expensive than last year

The most fluctuating prices are in small cities at both ends of the list. The top 20 list of highest annual rent increases is dominated by small cities (17 out of 20). Midland and Odessa,  however, stand out from the rest of them, with annual percentage increases of over 30%, which translate into an additional $300 or more per month to the average rent check. The region is economically centered around the shale/oil industry and it’s booming, and real estate prices are taking off as well.

Small cities make up most of the bottom of the list, as well, in terms of slowest growing rents: Brownsville, TX, Irvine, CA, Norman, OK, Baton Rouge, LA, and Richardson, TX saw rents stagnate over the past year. Akron, OH, Thousand Oaks, CA, and McKinney, TX are in the same boat.

https://www.zerohedge.com/sites/default/files/inline-images/Small-Cities-map_august-monthly-report.png?itok=xGn5eYLC

In terms of absolute prices, the top cities with the 10 highest rents in the country remains unchanged. Manhattan is still the most expensive, with apartment rents at $4,119, San Francisco is second, with an average rent of $3,579, and Boston is third, with an average rent of $3,388. San Mateo, CA and Cambridge, MA also have an average rent above $3,000 per month. The cheapest rents of the 252 cities surveyed are in Wichita, Brownsville, and Tulsa, all below $700 per month.

https://www.zerohedge.com/sites/default/files/inline-images/highest%20lowest%20rents.jpg?itok=2w-MnMnp

According to RentCafe, much of the change in rent prices we see this year is driven by how much demand there is in a specific area and what that area does to deal with it. However, the underlying factors are more complex. The housing market continues to change as a result of the 2007 subprime crisis, according to Doug Ressler, Director of Business Intelligence at Yardi Matrix. Furthermore, markets are undergoing a significant change driven by dramatically different demographic trends. Trends vary by market and will be impacted by population aging, population growth, immigration and home ownership trends, says Ressler.

Naturally, they will also be impacted by the state of the economy, the Fed’s monetary policy and the level of the capital markets.

However, should the current rental surge continue, the Fed will have no choice but to hike rates far higher than the general market consensus expects, especially following Powell’s “dovish” Jackson Hole speech.

Source: ZeroHedge

Facebook Removes Their Favorite Ad Options After HUD Complaint

Facebook is removing thousands of targeting options from its advertising platform after the Department of Housing and Urban Development accused the social media giant of discriminatory practices with its housing ads.

HUD filed a complaint last Friday against Facebook that claimed the social network’s advertising platform allowed users to discriminate against prospective renters and buyers by being able to limit who saw their ads based on the users’ race, color, religion, sex, family status, national origin, disability, ZIP code, and other factors.

“There is no place for discrimination [on our advertising platform],” Facebook stated in response to the HUD complaint. So far, they’ve removed more than 5,000 ad target options to “help prevent misuse,” according to the company. Facebook removed options such as “limiting the ability for advertisers to exclude audiences that relate to attributes such as ethnicity or religion.”

The company also announced that all advertisers in the U.S. will be required to comply with its non-discrimination policy if they wanted to advertise on Facebook.

“While these options have been used in legitimate ways to reach people interested in a certain product or service, we think minimizing the risk of abuse is more important,” Facebook said of its decision to remove the target options within its ad platform.

Facebook said it will share more updates to its targeted advertising tool over the next few months as it continues to “refine” it.

The National Association of REALTORS® released a statement this week in support of HUD’s enforcement of the Fair Housing Act and actions against Facebook. This year marks the 50th anniversary of the Fair Housing Act.

“As various online tools and platforms continue to transform the real estate industry in the 21st century, our understanding of how this law is enforced and applied must continue to evolve as well,” Elizabeth Mendenhall, NAR president, said in a statement. “REALTORS® commend the Department of Housing and Urban Development and Secretary Ben Carson for taking decisive action to defend fair housing laws, and for working to ensure its intended consumer protections extend to wherever real estate is marketed.”

Source: Realtor Magazine

BOOM: HUD Files Housing Discrimination Complaint Against Facebook

Secretary-initiated complaint alleges platform allows advertisers to discriminate

WASHINGTON – The U.S. Department of Housing and Urban Development (HUD) announced today a formal complaint against Facebook for violating the Fair Housing Act by allowing landlords and home sellers to use its advertising platform to engage in housing discrimination.

HUD claims Facebook enables advertisers to control which users receive housing-related ads based upon the recipient’s race, color, religion, sex, familial status, national origin, disability, and/or zip code. Facebook then invites advertisers to express unlawful preferences by offering discriminatory options, allowing them to effectively limit housing options for these protected classes under the guise of ‘targeted advertising.’ Read HUD’s complaint against Facebook.

“The Fair Housing Act prohibits housing discrimination including those who might limit or deny housing options with a click of a mouse,” said Anna María Farías, HUD’s Assistant Secretary for Fair Housing and Equal Opportunity. “When Facebook uses the vast amount of personal data it collects to help advertisers to discriminate, it’s the same as slamming the door in someone’s face.”

The Fair Housing Act prohibits discrimination in housing transactions including print and online advertisement on the basis of race, color, national origin, religion, sex, disability, or familial status. HUD’s Secretary-initiated complaint follows the Department’s investigation into Facebook’s advertising platform which includes targeting tools that enable advertisers to filter prospective tenants or home buyers based on these protected classes. 

For example, HUD’s complaint alleges Facebook’s platform violates the Fair Housing Act. It enables advertisers to, among other things:

  • display housing ads either only to men or women;
  • not show ads to Facebook users interested in an “assistance dog,” “mobility scooter,” “accessibility” or “deaf culture”;   
  • not show ads to users whom Facebook categorizes as interested in “child care” or “parenting,” or show ads only to users with children above a specified age;
  • to display/not display ads to users whom Facebook categorizes as interested in a particular place of worship, religion or tenet, such as the “Christian Church,” “Sikhism,” “Hinduism,” or the “Bible.”
  • not show ads to users whom Facebook categorizes as interested in “Latin America,” “Canada,” “Southeast Asia,” “China,” “Honduras,” or “Somalia.”
  • draw a red line around zip codes and then not display ads to Facebook users who live in specific zip codes.

Additionally, Facebook promotes its advertising targeting platform for housing purposes with “success stories” for finding “the perfect homeowners,” “reaching home buyers,” “attracting renters” and “personalizing property ads.”

In addition, today the U.S. Attorney for the Southern District of New York (SDNY) filed a statement of interest, joined in by HUD, in U.S. District Court on behalf of a number of private litigants challenging Facebook’s advertising platform.

HUD Secretary-Initiated Complaints

The Secretary of HUD may file a fair housing complaint directly against those whom the Department believes may be in violation of the Fair Housing Act. Secretary-Initiated Complaints are appropriate in cases, among others, involving significant issues that are national in scope or when the Department is made aware of potential violations of the Act and broad public interest relief is warranted or where HUD does not know of a specific aggrieved person or injured party that is willing or able to come forward. A Fair Housing Act complaint, including a Secretary initiated complaint, is not a determination of liability.

A Secretary-Initiated Complaint will result in a formal fact-finding investigation. The party against whom the complaint is filed will be provided notice and an opportunity to respond. If HUD’s investigation results in a determination that reasonable cause exists that there has been a violation of the Fair Housing Act, a charge of discrimination may be filed. Throughout the process, HUD will seek conciliation and voluntary resolution. Charges may be resolved through settlement, through referral to the Department of Justice, or through an administrative determination.

This year marks the 50th anniversary of the Fair Housing Act. In commemoration, HUD, local communities, and fair housing organizations across the country have coordinated a variety of activities to enhance fair housing awareness, highlight HUD’s fair housing enforcement efforts, and end housing discrimination in the nation. For a list of activities, log onto www.hud.gov/fairhousingis50.


Persons who believe they have experienced discrimination may file a complaint by contacting HUD’s Office of Fair Housing and Equal Opportunity at (800) 669-9777 (voice) or (800) 927-9275 (TTY).

Source: HUD.gov

Homeownership Losing Edge To Renting

Owning a home is generally viewed as a better deal than renting, but in cities with exploding home prices and relatively flat rents, that may not be the case anymore.

According to Trulia, it now makes more financial sense to rent than buy in the nation’s two most expensive markets — San Jose and San Francisco. The balance is also shifting in favor of renting in a few other high-cost cities, such as Honolulu, Seattle and Portland, Oregon, according to a recent study by the San Francisco-based company.

Trulia said the overall U.S. market still solidly provides buyers with a financial benefit. But in the five years since Trulia began estimating the financial advantages of buying versus renting, this is the first time renters have come out ahead in any of the major metros it tracks.

In San Jose and San Francisco, renting was 12 percent and 6 percent cheaper, respectively, for the consumer than buying a home, Trulia said. San Francisco and San Jose are outliers, though. The National Association of Realtors, for example, has estimated that for a person earning $100,000, just 2.5 percent of the June listings in San Jose and 9 percent in San Francisco were affordable. Trulia reported that buyers still have a significant advantage over renters in places like Detroit. 

Trulia estimated that on a nationwide basis, buying a home was 26 percent cheaper for a consumer than renting as of last month. This is the narrowest gap in five years, and has come down from 41 percent in 2016, according to Trulia. The key factor in closing the gap is that house prices have increased steeply along with mortgage rates, while rents are remaining relatively stable. In San Jose, for example, home prices have jumped up 29 percent in a year, while rents were unchanged. Home values rose 14 percent in San Francisco, and rents fell by 3 percent. 

“There are a lot of factors,” Trulia’s Senior Economist Cheryl Young said during an interview on Thursday. “Obviously, mortgage rates are going up. That is going to tip the scales a little bit toward renting, but also home value appreciation is far outpacing rent growth right now. So, rents are pretty much cooling out. As they cool down and home prices track up, that margin between buying and renting starts closing.”     

 Young said the balance could tip in favor of renters in other cities as well.  

 “There are markets that are always close to that margin, and things that could tip it,” she said. “If mortgage rates were to rise and we still see rents flattening and even decreasing as they have been in some places relative to rising home prices, we may see some markets tip.” 

Trulia’s calculations include forecasts on future rent and price appreciation, and also estimates on how much a renter can potentially earn by investing in other vehicles. Trulia assumes that the buyer will stay in the home for seven years, put 20 percent down on a 30-year fixed mortgage.

Other housing analysts told Scotsman Guide News that gauging the advantages of buying versus renting can be a tricky exercise. 

“The housing market doesn’t necessarily favor either one right now, as the choice of whether to be an owner or the renter is not a purely economic decision, but often includes the lifestyle decisions of an individual,” said Mark Fleming, chief economist for First American Corp.

Fleming also noted that in some of these high-cost cities, renters are in better position now to buy than when home prices were near their low point seven years ago.

“While housing prices are on the rise across the country, by historical standards they are still within reach in many markets,” Fleming said. “In fact, when you account for the historically low interest rate environment and rising incomes, consumer house-buying power is up nearly 24 percent since 2011,” he added.

Len Kiefer, deputy chief economist for Freddie Mac, said that rising home values tend to give the buyer a financial edge over the renter, who is gaining no equity.

“Certainly if we look back historically, homeowners have done pretty well relative to renters,” Kiefer said. “It doesn’t mean that it is going to be true in the future, but if you look at where our forecast is for the overall economy, we are still forecasting home prices to continue to rise at a pretty healthy pace over the next couple of years.”

Kiefer said in a few high-cost cities with high property taxes, homeowners will be hurt by new tax changes that eliminated or reduced homeownership perks in the federal tax code. This may give renters some advantage. He said the tax changes so far don’t seem to have reduced homebuyer demand significantly, though.

“Certainly in the high-cost, high-tax markets, places like parts of California, New Jersey, Illinois,  the cost of homeownership is going to be a little bit negative,” Kiefer said. “But if we look at actual data on what has happened in those markets,  it is hard to see a discernible impact in terms of slower overall activity that you could attribute to the tax law,” he said. Kiefer said rising prices and higher rates were likely making homebuying less appealing, however.

Renters have been less sold on the financial benefits of owning a home, according to recent Fannie Mae surveys. In January 2010, for example, 76 percent of surveyed renters saw an advantage in buying. That number has fallen to 68 percent as of the end of June. 

“Renters’ view of the financial benefit of owning has come down a little bit,” said Mark Palim, deputy chief economist for Fannie Mae. “That probably reflects that home prices are up substantially.”

Palim said that renters are still expressing a strong desire in buying homes for non-financial, quality-of-life factors. He said the improved economy and a surge in household formation has kept the buyer demand up in spite of rising home prices and rates. 

“Millennials have really moved into the market in a big way, and they are closing the gap relative to other generations,” Palim said. “People have far more financial means to afford a home and go out and buy a home, and that has translated into pretty brisk demand.”

Source: Scotsman Guide

The Number Of Americans Living In Their Vehicles “Explodes” As The Middle Class Collapses

If the U.S. economy is really doing so well, then why is homelessness rising so rapidly?

https://www.zerohedge.com/sites/default/files/inline-images/Sleeping-In-Car-By-Spaetz-The-Entertainer-On-Flickr.jpg?itok=f7Y9s5Iu

As the gap between the rich and the poor continues to increase, the middle class is steadily eroding.  In fact, I recently gave my readers 15 signs that the middle class in America is being systematically destroyed.  More Americans are falling out of the middle class and into poverty with each passing day, and this is one of the big reasons why the number of homeless is surging.  For example, the number of people living on the street in L.A. has shot up 75 percent over the last 6 years.  But of course L.A. is far from alone.  Other major cities on the west coast are facing similar problems, and that includes Seattle.  It turns out that the Emerald City has seen a 46 percent rise in the number of people sleeping in their vehicles in just the past year

The number of people who live in their vehicles because they can’t find affordable housing is on the rise, even though the practice is illegal in many U.S. cities.

The number of people residing in campers and other vehicles surged 46 percent over the past year, a recent homeless census in Seattle’s King County, Washington found. The problem is “exploding” in cities with expensive housing markets, including Los Angeles, Portland and San Francisco, according to Governing magazine.

Amazon, Microsoft and other big tech companies are in the Seattle area.  It is a region that is supposedly “prospering”, and yet this is going on.

Sadly, it isn’t just major urban areas that are seeing more people sleeping in their vehicles.  Over in Sioux Falls, South Dakota, many of the homeless sleep in their vehicles even in the middle of winter

Stephanie Monroe, managing director of Children Youth & Family Services at Volunteers of America, Dakotas, tells a similar story. At least 25 percent of the non-profit’s Sioux Falls clients have lived in their vehicles at some point, even during winter’s sub-freezing temperatures.

“Many of our communities don’t have formal shelter services,” she said in an interview. “It can lead to individuals resorting to living in their cars or other vehicles.”

It is time to admit that we have a problem.  The number of homeless in this country is surging, and we need to start coming up with some better solutions.

But instead, many communities are simply passing laws that make it illegal for people to sleep in their vehicles…

A recent survey by the National Law Center on Homelessness and Poverty (NLCHP), which tracks policies in 187 cities, found the number of prohibitions against vehicle residency has more than doubled during the last decade.

Those laws aren’t going to solve anything.

At best, they will just encourage some of the homeless to go somewhere else.

And if our homelessness crisis is escalating this dramatically while the economy is supposedly “growing”, how bad are things going to be once the next recession officially begins?

We live at a time when the cost of living is soaring but our paychecks are not.  As a result, middle class families are being squeezed like never before.

A recent Marketwatch article highlighted the plight of California history teacher Matt Barry and his wife Nicole…

Barry’s wife, Nicole, teaches as well — they each earn $69,000, a combined salary that not long ago was enough to afford a comfortable family life. But due to the astronomical costs in his area, including real estate — a 1,500-square-foot “starter home” costs $680,000 — driving for Uber was a necessity.

“Teachers are killing themselves,” Barry says in Alissa Quart’s new book, “Squeezed: Why Our Families Can’t Afford America” (Ecco), out Tuesday. “I shouldn’t be having to drive Uber at eight o’clock at night on a weekday. I just shut down from the mental toll: grading papers between rides, thinking of what I could be doing instead of driving — like creating a curriculum.”

Home prices are completely out of control, but that bubble should soon burst.

However, other elements of our cost of living are only going to become even more painful.  Health care costs rise much faster than the rate of inflation every year, food prices are becoming incredibly ridiculous, and the cost of a college education is off the charts.  According to author Alissa Quart, living a middle class life is “30% more expensive” than it was two decades ago…

“Middle-class life is now 30% more expensive than it was 20 years ago,” Quart writes, citing the costs of housing, education, health care and child care in particular. “In some cases the cost of daily life over the last 20 years has doubled.”

And thanks to the trade war, prices are going to start going up more rapidly than we have seen in a very long time.

On Tuesday, we learned that diaper and toilet paper prices are rising again

Procter & Gamble said on Tuesday that it was in the process of raising Pampers’ prices in North America by 4%. P&G also began notifying retailers this week that it would increase the average prices of Bounty, Charmin, and Puffs by 5%.

P&G is raising prices because commodity and transportation cost pressures are intensifying. The hikes to Bounty and Charmin will go into effect in late October, and Puffs will become more expensive beginning early next year.

I wish that I had better news for you, but I don’t.  We are all going to have to work harder, smarter and more efficiently.  And we are definitely going to have to tighten our belts.

Many middle class families are relying on debt to get them from month to month, and consumer debt in the United States has surged to an all-time high.  But eventually a day of reckoning comes, and we all understand that.

The U.S. economy is not going to be getting any better than it is right now.  So it is time to be a lean, mean saving machine, because it will be important to have a financial cushion for the hard times that are ahead of us.

Source: ZeroHedge

Lumber Futures Dump As US Construction Spending Slumps – Worst June In 18 Years

Lumber futures prices are limit down today, falling to their lowest price since Dec 2017, erasing much of the post-tariff surge in prices as US construction spending unexpectedly tumbles in June.

Lumber prices are free falling back towards pre-tariff levels…

https://www.zerohedge.com/sites/default/files/inline-images/2018-08-01_7-38-46.jpg?itok=WEVTZg02

And with home starts, permits, and sales all weaker…

https://www.zerohedge.com/sites/default/files/inline-images/2018-08-01_7-45-25.jpg?itok=knD1u4BA

It is no surprise that US construction spending tumbled in June…

https://www.zerohedge.com/sites/default/files/inline-images/2018-08-01_7-25-56.jpg?itok=TlGGU9Qz

Bearing in mind the upward revision for May, this is the worst construction spending drop for a June since the year 2000…

https://www.zerohedge.com/sites/default/files/inline-images/2018-08-01_7-22-40.jpg?itok=zAgBawuQ

Still seem like a sustainable 4% economy?

Source: ZeroHedge

Philadelphia Plunders Its Property-Owners For Cash

Like a lot of major cities in the United States, Philadelphia is in pretty rough financial condition.

https://www.zerohedge.com/sites/default/files/inline-images/2018-07-31_9-29-43.jpg?itok=OVXH5_rj

One of the city’s biggest problems is its woefully underfunded public pension, which has a multi-billion dollar funding gap.

In 2001, Philadelphia’s pension fund was still in decent shape with a funding level of 77%, meaning that it had sufficient assets to meet 77% of its long-term obligations.

By 2017 the funding level had dropped to less than 50%.

Part of this is just blatant mismanagement; while most of the market soared in 2016, for example, Philadelphia’s pension fund lost about $150 million on its investments, roughly 3.17% of its capital.

It’s interesting that, along the way, the city has actually tried to fix the problem. Between 2001 and 2017, the amount of money that the city contributed to the pension fund actually increased by 230%.

Yet despite increasing contributions to the fund, the fund’s solvency level keeps shrinking.

Mayor Jim Kenny summed up the grim situation in his budget address last year:

The City’s annual pension contribution has grown by over 230 percent since fiscal year 2001. . . These increasing pension costs have caused us to cut important public services while the pension fund’s health has grown weaker. In fact, our pension fund has actually dropped from 77 percent funded to less than 50 percent funded during the same time our contributions were so rapidly increasing.

So, desperate for revenue, the local government has been relying on an old tactic to get their hands on every spare penny they can.

The city of Philadelphia owns the local gas company – Philadelphia Gas Works (PGW). It’s essentially a local government monopoly.

And over the last few years, PGW developed an automated system to comb its billing records, find delinquent accounts, and file a lien on those properties.

If you’re not familiar with real estate law, a ‘lien’ is a formally-registered security interest in which your property serves as collateral for a debt.

When you borrow money from the bank to buy a home, for example, the bank registers a lien over your home for the value of the mortgage.

The lien prevents you from selling the home until you satisfy the debt. It also means that if you don’t pay the debt, the lien

holder (the bank, or the gas company) can seize the property.

In PGW’s case, the gas company is filing liens over people’s properties due to unpaid gas bills for as little as $300.

https://www.zerohedge.com/sites/default/files/inline-images/pickpocket.png?itok=F9ehygk-

There is essentially zero due process here.

It’s not like the gas company has to go in front a jury and prove that there’s an unsatisfied debt.

They just have their automated system file some papers, and, poof, the lien is registered.

So someone could have their home encumbered for a $300 late bill that ended up being an administrative error.

More importantly, it’s curious why the gas company is filing a lien against the property… because it’s entirely possible that the delinquent customer isn’t even the property owner.

Let’s say you’re a landlord and renting out your investment property to a tenant… and the tenant doesn’t pay his gas bill: PGW will put a lien on your property, even though it’s not your bill.

Even worse, you wouldn’t even know about it, because PGW would be sending the late notices to the tenant… not to you.

At that point it turns into a total bureaucratic nightmare.

If you’re lucky enough to even find out about it, you call PGW to try and get the lien removed.

But (according to court documents), PGW tells angry landlords that they have no control over the lien process, and tell people to file a complaint with the Pennsylvania Public Utility Commission.

But then the Pennsylvania Public Utility Commission tells you that they have no jurisdiction over liens in Philadelphia, and that you should talk to the utility company.

Classic government bureaucracy. You just get bounced around between various departments and nothing ever gets resolved from a problem that you didn’t even create.

Well, a bunch of landlords finally had enough of this nonsense, so they got together and sued the city in federal court.

It seemed like a slam dunk case. Why should property owners be held liable for the actions of their tenants?

If tenants don’t pay for their own gas, the tenants should be held responsible… not the property owners.

Common sense, right?

Wrong. The landlords lost the case.

Two weeks ago the US District Court for the Eastern District of Pennsylvania ruled that the City of Philadelphia was well within its rights to hold property owners responsible… and to file a lien on the property without even notifying the owner to begin with.

This is a pretty strong reminder of how low governments will sink when they become financially desperate.

Source: ZeroHedge

Mortgage Prison: Sydney Home Prices Suffer Largest Annual Decline Since 2008

Home prices in Sydney and Melbourne are back to 2016 levels. That is a tiny down payment as to what is coming.

https://www.zerohedge.com/sites/default/files/inline-images/https_%252F%252Fs3-us-west-2.amazonaws_14.jpg?itok=-mPQZNYZ

News AU reports House Prices Drop in Sydney, as Melbourne Prices Stall.

Tumbling house prices in Sydney and Melbourne are the main drivers behind the first annual drop in national property prices in six years, a new report shows. The national median house price fell 1.0 per cent over the June quarter and year, according to a report by property classifieds group Domain released on Thursday.

It is the first time values have fallen on an annual basis since June 2012.

The negative national growth rate reflects weakening house prices in Sydney and Melbourne, which together represent about two thirds of Australia’s housing market by value.

Sydney house prices fell by 4.5 per cent in the 12 months to the end of June for their largest annual drop since 2008. Sydney units also fell by 3.5 per cent over the same period.

The figures chime with those released this week by property data firm CoreLogic, which said overall Sydney prices fell 5.0 per cent in the 12 months to July 22.

“House and unit prices in Sydney are now back to values seen at the end of 2016,” Domain property analyst Nicola Powell told AAP. Tighter credit availability and a high number of units being built are key factors behind the dive, Dr Powell said.

Apartment Boom Comes to End

Next up, please consider Construction Set for Biggest Decline Since the Global Financial Crisis

Australia’s building commencements, fueled by investor apartment construction, look like heading from boom to bust, according to forecaster BIS Oxford Economics.

In a reality check for investors who bought at the top of the apartment boom, BIS is predicting the biggest correction since the global financial crisis hit in 2008, with housing starts set to fall by almost 23 per cent by 2020.

Associate director Adrian Hart told the ABC’s AM program that the slump would be led by high-density dwelling construction, which is set to halve over the next two years

A key factor in the residential slowdown has been tougher regulation by the Australian Prudential Regulation Authority (APRA) to curb investor lending, while the Foreign Investment Review Board (FIRB) and tax office has been clamping down on overseas buyers.

Mortgage Prison

Finally, and most importantly, please consider Aussie Homeowners Trapped in ‘Mortgage Prison’.

Australian homeowners are trapped in “mortgage prison” because of a rule change. And there is no easy way out.

Changes in bank rules around living expenses calculations have effectively wiped huge amounts off the maximum a bank will allow you to borrow.

Many people are now finding they originally borrowed more than a bank would lend them under current conditions, meaning they haven’t got the option of shopping around to get a better interest rate — no bank will lend them the amount they need.

Precise numbers of Australia’s mortgage prisoners are hard to come by, but Mozo investment and lending expert Steve Jovcevski told news.com.au that he expected most of them are those who have borrowed and bought in the last five years.

Oops!

Jovcevski gave an example in which a couple was able to borrow $800,000 a year ago can now only borrow $680,000 under the same rules.

They are now trapped in a mortgage with no way to refinance and no buyers because of declining prices.

Mortgage Slaves for Life

This is precisely what some us foresaw years ago. It’s finally come home to roost, and at a time China is highly unlikely to bail out these buyers.

People may be trapped for decades. So expect to see more articles like this as desperation sets in: Australia Housing Insanity: Tent Outside, Full Use of Apartment, Cheap, $90 Per Week.

That was from a year ago. Rates will drop fast. Buyers will need tenants to stay afloat.

Special Mention

https://www.zerohedge.com/sites/default/files/inline-images/https_%252F%252Fs3-us-west-2.amazonaws%20%281%29_13.jpg?itok=hvJhIunV

Dateline July 23, 2017

13-Year-Old Kid Buys $552,000 Home

Meet Akira Ellis a 13-year-old kid. He just bought his first piece of real estate, a $552,000 four-room one bath house in Melbourne’s Frankston.

Right at the peak of the market a 13-year-old kid (with obvious help from his parents), bought a house costing over half a million dollars.

I noted “Akira is already looking for his next property.”

I asked “What can possibly go wrong?”

Today, we found out.

Source: ZeroHedge

If California Is Split Into 3, What New State Will Have The Hottest Housing?

https://www.mercurynews.com/wp-content/uploads/2018/07/0715-BUS-SPLIT-CA-01.jpg?w=842In this June 18, 2018, photo, venture capitalist Tim Draper points to a computer screen at his offices in San Mateo, showing an initiative to split California into three states qualified for the ballot. Opponents of an initiative are asking the state Supreme Court to pull the measure from the ballot. (AP Photo/Haven Daley)

Voters will decide in November on a proposition that calls for California to be split into three new and separate states.

This column isn’t the place to debate the merits of the idea. Nor will I ponder its odds at the ballot box. And I’ll leave to other pundits the vast legal, political and operational impacts of such a historic change — and that’s only if the breakup ever got all the necessary approvals after a winning vote.

We are here to talk one thing: What might these three new state housing markets look like based on historical trends. Geographically speaking, the plan creates new state borders along county lines.

There’s the retooled “California,” essentially the coastal counties from Los Angeles to Monterey. There’s the oddly named “Southern California” combining Orange, San Diego, Riverside and San Bernardino counties up through the interior to Lake Tahoe. And there’s “Northern California,” everything else or basically the Bay Area plus everything up to Oregon.

Knowing the new county lineup, I filled my trusty spreadsheet with historical housing data provided by Attom Data Solutions. Looking at stats from 2000 through 2018’s first quarter, here are 10 things you should know about the housing markets within each of the new proposed states.

1. Price tags: When you shuffle the counties into three states, what does a sales-weighted median for 2018’s first-quarter selling prices for all properties look like? It’s no surprise that it would cost the most to buy in Northern California at $580,200. Next was the new coastal California at $571,900. Southern California was most affordable — remember all the cheaper inland properties are in this new state — at $426,000.

2. Best bet: Where was the best performance this century, as measured by growth in median selling prices for all properties, 2000 through this year? Well, seaside property rocks. The Pacific-hugging new California’s 181 percent gain was tops vs. Southern California at 148 percent and Northern California’s 120 percent.

3. Most pain: Split or not, don’t forget the pain of housing’s bubble bursting! What new state’s housing market would have fared the worst in the 2006-2011 downturn? Northern California’s 46 percent price drop was the largest loss and a shade ahead of Southern California’s fall of 45.6 percent and new California’s 41.4 percent tumble.

4. Top recovery: Where was the post-recession rebound the best, measured by the 2011-2018 selling price upswing? Northern California produced 108 percent in gains in seven years vs. Southern California at 84 percent and new California’s 83 percent.

5. Predictability: Split the state into three, expect the same crazy real estate. Just peek at the nearly uniform best and worst 12-month periods since 2000! New California’s best was up 30 percent vs. its worst of down 35 percent; Southern California ran from up 29 percent to down 37 percent; and Northern California ranged from up 29 percent to down 42 percent.

6. Big sellers: Ponder the size of these markets, in terms of purchase transactions closed in the past 18 years. Most sales activity in 2000-2018 was Southern California’s 3.2 million sales followed by Northern California’s 2.9 million and new California’s 2 million.

7. Sales dips: Home buying is down since the turn of the century as homeowners choose to move less and ownership is less affordable. New California’s sales pace is down 19 percent since 2000; Northern California is off 10 percent; Southern California is down 4.5 percent.

https://www.mercurynews.com/wp-content/uploads/2018/07/splitca-0413181.jpg?w=810

8. Home sweet home: Now let’s think about single-family homes under the proposed three-way split. Southern California would have 2.77 million single-family homes worth a combined $1.44 trillion. New California gets 1.84 million single-family homes worth $1.41 trillion. Northern California is home to 2.87 million homes worth $2.18 trillion.

9. Price extremes: Where’s the budget-busting housing in the proposed new states  … and where are the bargains? Southern California’s priciest single-family homes are in Orange County at an average value of $871,635 vs. the cheapest county, Kings, at $202,699. New California’s priciest is Santa Barbara County at $804,942 vs. San Benito County’s $541,434 low. Of course, Northern California has an insane gap: the highest prices are in San Mateo County at $1.61 million vs. the cheapest county, Modoc, at $89,158.

10. Tax bite: Ownership equals property taxes. How would that cost for single-family homes slice up among the three proposed states? Southern California’s 2017 tax collections for single-family homes ran $12.13 billion or $4,372 per average taxpayer. Northern California property taxes totaled $15.53 billion or $5,419 per average taxpayer. And the biggest individual tax bills were in the new California where $10.38 billion in collections translates to an average $5,636 per property.

Source: by Johnathan Lansner | Mercury News

From Cash-Strapped Roommates To Airbnb Billionaires

https://martinhladyniuk.com/wp-content/uploads/2018/07/36be7-1456938255765.jpg

A decade ago a pair of San Francisco roommates decided to make rent money by using air mattresses to turn their place into a bed-and-breakfast when a conference in the city made hotel rooms scarce.

The brainwave led to the creation of Airbnb, a startup now valued at more than $30 billion which boasts millions of places to stay in more than 191 countries, from apartments and villas to castles and tree houses.

Here are some key facts about the sharing-economy star, which has sent tremors through the hotel industry:

– Humble beginnings –

– In late 2007, with hotel rooms selling out due to a design conference in San Francisco, Brian Chesky and Joe Gebbia decide to make some extra money to help cover the rent in the apartment they share, by using air mattresses to turn it into a bed-and-breakfast.

– A third former roommate of theirs, Nathan Blecharczyk, teams with Chesky and Gebbia in a venture they call “Air Bed and Breakfast,” launching a website in August of 2008.

– Struggling to get the business off the ground, the startup founders stage a quirky stunt at the Democratic National Convention in late 2008, selling boxes of cereal custom-branded “Obama-O’s” and “Cap’n McCains” for $40 each — raising enough money to stay afloat, and earning much-needed publicity.

– The startup name is changed in March of 2009 to Airbnb as it envisions being about more than sleeping on air mattresses.

– In April of 2009 Airbnb gets $600,000 in seed funding from Sequoia Capital after a string of rejections from other venture capitalists.

– Disrupting an industry –

– In 2011, Airbnb boasts of being in 89 countries and of booking more than a million nights’ lodgings. The startup becomes a Silicon Valley “unicorn” valued at a billion dollars based on some $112 million pumped into it by venture capitalists.

– In June of 2012, Airbnb announces that more than 10 million nights of lodging have been booked on its service, with some three-quarters of that business coming from outside the US.

– In 2012, Airbnb is hit with the problem of some guests leaving homes in dismal condition due to parties or other raucous activities. The startup puts in place a million-dollar damage coverage policy as a “Host Guarantee.”

– In September of 2016, Airbnb raises funding in a round that values the company at $30 billion.

– In November of 2016, Airbnb launches Trips, tools that tourists can use to book local offerings or happenings.

– Growth, and backlash –

– Airbnb begins facing trouble as cities and landlords crack down on “hosts” essentially turning homes into hotels.

– In late 2016, Airbnb implements policies aimed at preventing racial discrimination by hosts and creates a permanent team aimed at fighting bias, following growing complaints.

– In early 2017, Airbnb announces plans to double its investment in China, triple its workforce there and change its name to “Aibiying” in Chinese.

– In September of 2017, Airbnb teams with Resy, which becomes a minority shareholder in the new venture, to offer table reservations at 700 restaurants in 16 US cities.

– Airbnb is reported to have made a profit of $93 million on $2.6 billion in revenue in the year 2017.

– In 2018, battling a global backlash against “sharing economy” startups disrupting traditional industries, Airbnb is forced to cancel thousands of reservations in Japan to comply with a new law regulating short-term rentals.

This fellow has a series of videos about how to run your own Airbnb business…

Source: Yahoo News

Wealthy Blue-Staters Are Using Shady Alaskan Trusts To Dodge SALT-Deduction Caps

Wealthy Americans living in blue states are scrambling to find tax loopholes that will help them get around one of the most controversial (and for some, infuriating) provisions in President Trump’s tax plan: The capping of the so-called SALT deduction. Enter real-estate planner Jonathan Blattmachr, who this week made the mistake of explaining to a Bloomberg reporter about a plan he’s devised for his clients who are trying to get out of paying the additional taxes on their summer homes in the Hamptons or Cape Cod. According to the Bloomberg story, Blattmachr is planning on transferring the interest in his two New York residences – one in Garden City and one in Southampton – into LLCs, which he will then divide up into five separate trusts that will be based in Alaska. He can then use the trusts to take the maximum $10,000 deduction five separate times. In this way, he can deduct $50,000 in mortgage taxes from his federal tax bill instead of $10,000.

“This is an under-the-radar thing and it’s novel,” said Blattmachr. (Or at least it was under-the-radar until you went blabbing to the media). The trusts that Blattmachr and other savvy estate planners are using to take advantage of this loophole are called non-grantor trusts. While trusts are typically used by the wealthiest Americans to preserve their wealth as it’s handed down from generation to generation, the tax law is giving the merely wealthy an incentive to explore setting up these trusts to pay taxes at rates found in low-tax red states. The trusts can help property owners avoid paying an additional $100,000 in taxes across their properties.

However, the plan isn’t practical for everybody, and even those who can reap the benefits over the long term must take an up-front risk because they must pay the maintenance costs for the trusts – which can be as high as $20,000 – up front. If the IRS ever issues guidance invalidating the loophole, there’s no way to recover those costs.

Setting up dozens of non-grantor trusts for those with six-figure plus property taxes can be impractical and burdensome. Plus, those whose taxes are under six figures feel the new cap most acutely, according to Steffi Hafen, a tax and estate planning lawyer at Snell & Wilmer in Orange County, California. Those clients often have monthly mortgage payments that eat up a big chunk of their take-home pay, Hafen said.

More than 10 percent of taxpayers in New Jersey will see a tax hike under the new law – the highest percentage in the U.S. – followed by Maryland and the District of Columbia at 9.4 percent, 8.6 percent in California and 8.3 percent in New York, according to an analysis earlier this year by the Tax Policy Center. Those who’ll pay more are mostly being affected by the state and local tax deduction limit.

Mark Germain, founder of Beacon Wealth Management in Hackensack, New Jersey, said the strategy is “absolutely viable,” adding that he has about a dozen clients who want to create non-grantor trusts.

Building and administering the trusts could cost about $20,000, according to Brad Dillon, a senior wealth planner at Brown Brothers Harriman. But those expenses would be justified after a few years, said Scott Testa, a lawyer who leads the estates and trusts tax practice at Friedman LLP in East Hanover, New Jersey.

Already, it’s unclear just how much longer individuals will be able to take advantage of the loophole. As Bloomberg explains, an existing provision in the US tax code could easily be revived to prohibit Americans from using trusts to avoid paying SALT taxes. Though it would take effort on the IRS’s part.

Still, the Internal Revenue Service could issue guidance that would prevent taxpayers from using the trusts to get around the SALT cap. An existing provision says that multiple non-grantor trusts with identical beneficiaries and identical grantors – and whose primary purpose is to avoid taxes – can potentially be considered a single entity, with just one $10,000 SALT deduction. But the measure has never been bolstered by regulations, leaving it vague.

That IRS provision could potentially derail the whole strategy, Dillon said. But compared to the other workarounds that have been proposed by high-tax states, the non-grantor trust “is the only one that’s come out of the fray that seems like a viable structure,” Dillon said.

Furthermore, people with large mortgages might have difficulty convincing their lender to allow them to transfer ownership over to an LLC.

The strategy isn’t for everybody: People with large mortgages on their homes might not be able to win approval from the bank to transfer ownership to an LLC. Also taxpayers with a primary residence in Florida, which like Alaska doesn’t have an income tax, can’t take advantage of the scheme because of complex rules surrounding the state’s homestead exemption.

But for those who are curious, here’s an in-depth explanation of how the process works:

Here’s how it works: First, you set up an LLC in a no-tax state such as Alaska or Delaware. Then, you transfer fractions of that LLC into multiple non-grantor trusts, which are trusts that are treated as independent taxpayers (unlike grantor trusts, where the person who creates them are generally taxed on the trust income). Each trust can take a deduction up to $10,000 for state and local taxes.

If a spouse is designated as the beneficiary, another “adverse” party – meaning someone who may want the money also — has to approve any distributions.

Keep in mind that you no longer control or can benefit from anything placed in the trust. And you have to put investment assets in the trust that will generate enough income to balance out the $10,000 deduction. One option would be a vacation home that generates rental income, according to Steve Akers, chair of the estate planning committee at Bessemer Trust. Marketable securities could also work.

Some caveats: If the home placed in the non-grantor trust is sold, the trust recognizes the gains on the sale and has to pay taxes on it – and it won’t be able to take advantage of a special home sale exclusion that’s available under a separate tax rule. For those with New York residences, putting the home in the LLC or the trust could potentially trigger the state’s 1 percent mansion tax, which is levied on sales of homes of at least $1 million.

As we pointed out earlier this year (citing research from BAML), the Northeast and West coast – traditionally liberal bastions and, according to some, explicitly targeted by the Trump administration – generally have higher average amounts and will feel most of the pain. The chart below shows a heat map for average amount claimed under SALT deductions, with redder states farther above $10k and greener states below.

https://www.zerohedge.com/sites/default/files/inline-images/2018.06.15salt.jpg?itok=I0kc76vc

For those who are still getting up to speed on the new tax law, Goldman offered this guide earlier in the year to the most important provisions. Of course, estate planners aren’t the only ones searching for loopholes. Several blue-state governors have threatened “economic civil war” on Washington by devising loopholes for their residents that will allow them to take advantage of a “charitable” fund being set up by certain states that will essentially allow them to convert some of their taxes into charitable contributions that can still be deducted from their federal tax bill. However, the IRS has already warned states not to try and circumvent the SALT deduction caps. The retaliation has sent state lawmakers scrambling for an alternate solution. As next year’s tax deadline draws closer, expect the conflict between blue states and the federal government to intensify.

Source: ZeroHedge

***

The Sources Of Tax Revenue For Every US State, In One Chart

In the aftermath of Trump’s tax reform, which many mostly coastal states complained would cripple state income tax receipts and hurt property prices, S&P offered some good news: in a May 30 report, the rating agency said that “[s]tate policymakers have a lot to cheer,” noting the current slowdown in Medicaid signups and dramatically higher revenue collections, to the tune of 9.4%, are significantly boosting state fiscal positions.

https://www.zerohedge.com/sites/default/files/inline-images/S%26P%20states.jpg?itok=b_rsP1fm

Still, the agency’s view is that current conditions are “most likely only a temporary respite” (very much the same as what is going on at the federal level) means that the agency is likely to focus on “a state’s financial management and budgetary performance during these ‘good’ times” to determine its “resilience to stress when the economy eventually softens” according to BofA.

To that end, S&P warns that:

“For those [states] that either stumble into political dysfunction or – out of expedience – assume recent trends will persist, this moment of fiscal quiescence could prove to be a mirage.”

For now, however, let the good times roll, and with real GDP growth tracking at 3.8% for 2Q18, state tax receipts should grow at a rate of over 10% based on historical correlation patterns, with the growth continuing at 9% and 8% in Q3 and Q4.

https://www.zerohedge.com/sites/default/files/inline-images/state%20taxes.jpg?itok=lpbVNyfL

This is good news for states that had expected a sharp decline in receipts, and is especially important for states heavily skewed to the personal income tax since revenue from that source should rise by over 14%, according to BofA calculations.

Finally, the BofA chart below is useful for two reasons, first, it shows the states most reliant on individual income taxes from the Census Bureau’s most recent annual survey of tax statistics. Oregon – at 69.4% of total tax collections – is most reliant on individual income taxes, followed by Virginia (57.7%), New York (57.2%), Massachusetts (52.9%) and California (52.0%). More notably, it shows the full relative breakdown of how states collect revenues, from the Individual income tax-free states such as Florida, Texas, Washington, Tennessee, and Nevada, to the sales tax-free Alaska, Vermont and Oregon, to the severance-tax heavy Wyoming, North Dakota and Alaska, and everyone in between: this is how America’s states fund themselves.

https://www.zerohedge.com/sites/default/files/inline-images/state%20revenue.jpg?itok=PBD-1Mn5
(click here for larger image)

Source: ZeroHedge

Affordability Crisis: Low-Income Workers Can’t Afford A 2-Bedroom Rental Anywhere In America

https://i0.wp.com/houzbuzz.com/wp-content/uploads/2016/02/Transformarea-unui-apartament-de-2-camere-in-unul-de-3-How-to-turn-a-2-bedroom-into-a-3-bedroom-apartment-980x600.jpg

The National Low Income Housing Coalition’s (NLIHC) annual report, Out of Reach, reveals the striking gap between wages and the price of housing across the United States. The report’s ‘Housing Wage’ is an estimate of what a full-time worker on a state by state basis must make to afford a one or two-bedroom rental home at the Housing and Urban Development’s (HUD) fair market rent without exceeding 30 percent of income on housing expenses.

With decades of declining wages and widening wealth inequality via the financialization of corporate America, and thanks to the Federal Reserve’s disastrous policies (whose direct outcome is the ascent of Trump), the recent insignificant countertrend in wage growth for low-income workers has not been enough to boost their standard of living.

The report finds that a full-time minimum wage worker, or the average American stuck in the gig economy, cannot afford to rent a two-bedroom apartment anywhere in the U.S.

According to the report, the 2018 national Housing Wage is $22.10 for a two-bedroom rental home and $17.90 for a one-bedroom rental. Across the country, the two-bedroom Housing Wage ranges from $13.84 in Arkansas to $36.13 in Hawaii.

The five cities with the highest two-bedroom Housing Wages are Stamford-Norwalk, CT ($38.19), Honolulu, HI ($39.06), Oakland-Fremont, CA ($44.79), San Jose-Sunnyvale-Santa Clara, CA ($48.50), and San Francisco, CA ($60.02).

For people earning minimum wage, which could be most millennials stuck in the gig economy, the situation is beyond dire. At $7.25 per hour, these hopeless souls would need to work 122 hours per week, or approximately three full-time jobs, to afford a two-bedroom rental at HUD’s fair market rent; for a one-bedroom, these individuals would need to work 99 hours per week, or hold at least two full-time jobs.

The disturbing reality is that many will work until they die to only rent a roof over their head.

The report warns: “in no state, metropolitan area, or county can a worker earning the federal minimum wage or prevailing state minimum wage afford a two-bedroom rental home at fair market rent by working a standard 40-hour week.”

The quest to afford rental homes is not limited to minimum-wage workers. NLIHC calculates that the average renter’s hourly wage is $16.88. The average renter in each county across the U.S. makes enough to afford a two-bedroom in only 11 percent of counties, and a one-bedroom, in just 43% .

FIGURE 1: States With The Largest Shortfall Between Average Renter Wage And Two-Bedroom Housing Wage

https://www.zerohedge.com/sites/default/files/inline-images/Screen-Shot-2018-06-15-at-7.20.19-AM.png?itok=KaVotzhn

Low wages and widespread wage inequality contribute to the widening gap between what people earn and mandatory outlays, in the price of their housing. The national Housing Wage in 2018 is $22.10 for a two-bedroom rental home and $17.90 for a one-bedroom, the report found.

FIGURE 3: Hourly Wages By Percentile VS. One And Two-Bedroom Housing Wages 

https://www.zerohedge.com/sites/default/files/inline-images/Screen-Shot-2018-06-15-at-7.35.24-AM.png?itok=iHn8hTTb

Here is how much it costs to rent a two-bedroom in your state:

https://www.zerohedge.com/sites/default/files/inline-images/Screen-Shot-2018-06-15-at-7.31.37-AM-768x656.png?itok=SXGF28_H
https://www.zerohedge.com/sites/default/files/inline-images/Screen-Shot-2018-06-15-at-7.38.14-AM-768x523.png?itok=XbVW_WOH

Case Shiller House Prices have continued to surge to bubble levels with growing demand for rental housing in the decade post the Great Recession.

https://www.zerohedge.com/sites/default/files/inline-images/DeaHhBBVAAAeXNU-1-768x822.jpg?itok=YoWejOTe(Click here for larger image)

The report indicates that new rental construction has shifted toward the luxury market because it is more profitable for homebuilders. The number of rentals for $2000 or more per month has more than doubled between 2005 and 2015.

Here are the Most Expensive Jurisdictions for Housing Wage for Two-Bedroom Rentals

https://www.zerohedge.com/sites/default/files/inline-images/Screen-Shot-2018-06-15-at-8.30.11-AM.png?itok=U4SbvhkU(click here for larger image)

Here is how your state ranks regarding Housing Wage: 

https://www.zerohedge.com/sites/default/files/inline-images/Screen-Shot-2018-06-15-at-8.31.40-AM.png?itok=OEREudkr(click here for larger image)

“While the housing market may have recovered for many, we are nonetheless experiencing an affordable housing crisis, especially for very low-income families,” said Bernie Sanders quoted in the report.

The fact is, the low-wage workforce is projected to soar over the next decade, particularly in unproductive service-sector jobs and odd jobs in the gig economy, as increasingly more menial jobs are replaced by automation/robots. This is not sustainable for a fragile economy where many are heavily indebted with limited savings; this should be a warning, as many Americans do not understand their living standards are in decline. American exceptionalism is dying.

https://www.zerohedge.com/sites/default/files/inline-images/Screen-Shot-2018-06-15-at-7.39.37-AM.png?itok=bqrovzMC

The bad news is that for the government to combat the unaffordability crisis, deficits would have to explode because even more Americans would demand housing subsidies, setting the US debt on an even more unsustainable trajectory. Even though Congress marginally increased the 2018 HUD budget, the change in funding levels for some housing programs have declined.

Changes In Funding Levels For Key HUD Programs (FY10 Enacted To F18 Enacted) 

https://www.zerohedge.com/sites/default/files/inline-images/Screen-Shot-2018-06-15-at-8.12.49-AM.png?itok=ZdxA6T54

But wait a minute, something does not quite add up: consider President Trump’s cheer leading on Twitter calling today’s economy the “greatest economy in History of America and the best time EVER to look for a job.”

https://youtu.be/whDDJTr6tZc

Source: ZeroHedge

Consumer Credit Expansion Continues During Q1, 2018

https://www.newyorkfed.org/medialibrary/media/images/v4/press_center/home-prices-homeownership-and-housing-wealth.jpg?h=320&w=640&la=en

Total Household Debt Rises for 15th Straight Quarter, Led by Mortgages, Student Loans

Just Released: New York Fed Press Briefing Highlights Changes in Home Equity and How It’s Used

Household Debt And Credit Report Q1, 2018

Remarks at the Economic Press Briefing on Homeownership and Housing Wealth

A Close Look at the Decline of Home Ownership


San Francisco Sues Airbnb Users For $5.5M

https://imagesvc.timeincapp.com/v3/mm/image?url=http%3A%2F%2Fcdn-image.travelandleisure.com%2Fsites%2Fdefault%2Ffiles%2Fstyles%2F1600x1000%2Fpublic%2F1525361502%2Fsan-francisco-ARBNBFNE0518.jpg%3Fitok%3DbAbkJyCJ&w=800&q=85

The city of San Francisco is seeking $5.5 million from two Airbnb owners who illegally rented out 14 apartments for nearly one year. They made more than $700,000 from the illegal rentals.

Darren and Valerie Lee own 45 apartments in 17 buildings across the city. San Francisco law restricts building owners to one short-term rental per building — and that apartment must be the owner’s home. According to the city’s lawyer, 14 of the Lees’ apartments were short-term rentals, rented under the names of friends and associates who pretended to be genuine tenants.

During inspection, the couple went through elaborate motions to make it appear like people actually lived there. But it was evident that it was a fraud.

“Every apartment had the same staging: the same Costco food items scattered about, the same arrangement of dirty breakfast dishes in every kitchen sink, same personal products in each bathroom, same damp towels artfully draped over doors as though someone had recently showered, the same collection of shoes and clothes in closets, and same houseplants in each apartment,” city lawyers wrote in the court filing.

The motion to the court seeks a penalty of $750 for every day that each apartment was available and $1,500 for every day that an apartment was rented. The penalty comes out to a grand total of $5.5 million. (Under state law, the penalty could have been as high as $30 million.)

San Francisco first sued the Lees in 2014 when they evicted tenants to turn their building into a collection of rentals to list on Airbnb. A year later, they settled for $276,000 and a promise to abide by short-term rental law.

The couple’s “greed, fraud and deceit was breathtaking,” city attorney Dennis Herrera said in a statement.

The case will be heard in court on June 12.

Airbnb did not immediately respond to request for comment.

Source: by Cailey Rizzo | Travel And Leisure

Housing Starts, Permits Tumble In April

Having bounced notably in March, both Housing Starts and Building Permits in April tumbled (-3.7% MoM and -1.78% MoM respectively).

  • March building permits growth was upwardly revised from +2.5% MoM to +4.1% MoM
  • March housing starts growth was upwardly revised from +1.9% MoM to +3.6% MoM

Starts dropped 3.7% MoM in April – far worse than the 0.7% drop expected but while permits also dropped 1.8% MoM, this was slightly better than the expected 2.1% drop…

https://www.zerohedge.com/sites/default/files/inline-images/2018-05-16_5-34-03.jpg?itok=8B4H7_68

For some context, Starts and Permits remain over 40% below their 2005/6 peaks…

https://www.zerohedge.com/sites/default/files/inline-images/2018-05-16_5-32-15.jpg?itok=i-6Djf8L

Housing Permits breakdown…

https://www.zerohedge.com/sites/default/files/inline-images/2018-05-16.png?itok=OoA8ZcQy

The driver of the tumble in housing starts is a 11.3% plunge in multi-family.. (single-family 893k vs 894k prior and multi-family 374k from 428k)

https://www.zerohedge.com/sites/default/files/inline-images/2018-05-16%20%281%29.png?itok=wf60mKdp

Three of four regions posted declines in starts, led by a 16.3 percent decrease in the Midwest and a 12 percent drop in the West.

Construction climbed 6.4 percent in the South, reflecting the fastest pace of single-family starts since July 2007.

As always, weather is blamed for any downside.

Source: ZeroHedge

WSJ Sounds The Alarm: “There’s No Getting Over” Gas at $4 a Gallon

Consumers, who are already being squeezed by rising interest rates (even as the return on their cash deposits remains anchored near zero), are facing another potential constraint on their already limited purchasing power. And that constraint is  rising gasoline prices, which, as we pointed out last month, could erode the stimulative impact of President Trump’s tax plan as rising prices sop up what little money the middle class is saving.

As prices rise and banks scramble to update their forecasts, the Wall Street Journal has become the latest publication to sound the alarm over what is, in our view, one of the biggest threats facing the US economy in the ninth year of its post-crisis expansion. 

In its story warning about $3 a gallon gas (of course, we’re already seeing $4 a gallon in parts of California and other high-tax states), WSJ cited Morgan Stanley’s latest projection that rising gas prices could wipe out about a third of the annual take-home pay generated by the tax cuts.

Rising fuel costs can also feed inflation and pressure interest rates. Even though the Federal Reserve typically looks past volatile energy prices in the short term, higher energy costs help shape consumer confidence. And with the central bank poised to be more active this year, rising energy costs pose an additional risk to the economy.

Morgan Stanley estimates that if gas averages $2.96 this year, it would take an annualized $38 billion from spending elsewhere, an upward revision from the bank’s $20 billion estimate in January. That would wipe out about a third of the additional take-home pay coming from tax cuts this year, the analysts said.

Patrick DeHaan, petroleum analyst at GasBuddy”Three dollars is like a small fence. You can get through it, you can get over it,” said Patrick DeHaan, petroleum analyst at GasBuddy, a fuel-tracking app. “But $4 is like the electric fence in Jurassic Park. There’s no getting over that.”

Of course, MS’s take appears downright pollyannaish when compared with a Brookings Center report that we highlighted last month.

The left-of-center think tank, which of course has every reason to hope that the next recession will materialize on President Trump’s watch, projected that consumers would soon spend about half of the money saved from tax cuts on fuel costs.

And in a report published in April, Deutsche Bank illustrated how rising fuel costs will disproportionately squeeze the most vulnerable among us – a cohort of consumers who already shoulder an outsize share of the country’s household debt.

https://www.zerohedge.com/sites/default/files/inline-images/2018.05.15db.jpg?itok=H0g5_RQa

The FT put it another way…

https://www.zerohedge.com/sites/default/files/inline-images/2018.05.15ft.jpg?itok=HdnzBFje

As the chart above shows, middle-income families – aka the engine of consumption – will be the hardest hit by rising gas prices.

Indeed, small business owners in California, where gas prices are the fifth highest in the nation thanks to taxes and stringent emissions standards, say they’ve seen their energy bills shoot higher in the past few months. Car salesmen say consumers are asking more questions about mileage, according to WSJ.

Robert Lozano, a car salesman in Los Angeles where some gas prices are already above $4, said the dealership’s gas bill has climbed from about $9,000 to about $12,000 a month recently.

Customers are inquiring more about electric vehicles, he said.

“It’s more in the consumer’s mind as to what the most efficient vehicle is.”

With oil already at $70 a barrel, early indicators imply that the summer driving season could see an unusually large spike in demand for gas…

https://www.zerohedge.com/sites/default/files/inline-images/2018.05.15vacations.png?itok=oOyR1nG8

…As the number of Americans intending to take vacations in the next six months climbs to its highest level in decades.

Heightened vacation intentions suggest the number of vehicle miles driven will also climb (because people tend to travel greater distances when they go on vacation). As the chart below shows, fluctuations in miles driven – a close proxy for gas demand – are quickly reflected in prices at the pump.

https://www.zerohedge.com/sites/default/files/inline-images/2018.05.14gascorrelation.png?itok=Q3j2fPOJ

While the US’s increasing prominence in the oil-export market could soften some of the economic blow as the energy business booms, other large business from airlines to shipping companies would feel the pinch at a time when costs are already rising.

But some economists say the growing importance of energy to the U.S. economy could blunt some of the impact from rising oil prices.

The country has become a more prominent supplier of crude oil and fuel. Domestic production has reached record weekly levels of 10.7 million barrels per day and a lot of it is being exported.

[…]

“People don’t understand how we could double crude oil production” and see higher gas prices, said Tom Kloza, global head of energy analysis at the Oil Price Information Service. “The answer lies in the balance of payment. We are an exporting power right now.”

[…]

Airlines and shipping companies will also be paying more for jet fuel and diesel – costs that may be passed along to consumers. Even companies such as Whirlpool Corp. have noted that higher oil prices have boosted the cost of materials.

Refiner Valero Energy Corp. said it wouldn’t expect consumer demand to drop off until oil prices are at $80 to $100.

But demand is only one factor driving up oil prices. Supply issues have also weighed on oil traders’ minds. Traders pushed oil prices higher as the US pulled out of the Iran deal as some worried that it could impact global supplies (though, as we’ve pointed out, there are plenty of other buyers waiting to step in and buy Iranian crude). Even if the Iranian crude trade isn’t impacted by sanctions, plummeting production capacity in Venezuela could ultimately have a bigger impact on global supply.

Conflicts in other oil producing regions could also impact supplies, pushing prices higher.

Last week, Bank of America became the first Wall Street bank to call $100/bbl for Brent crude (at the time, it was trading around $77/bbl) in 2019. That could send prices to highs not seen since 2008. Other banks have been scrambling to raise their forecasts as well. 

With the Fed changing its language in its latest policy statement to reflect rising inflation expectations, rising oil prices could also inspire the Fed to hike interest rates more quickly for fear that the economy might overheat. That could result in four – or perhaps five – rate hikes this year.

The resulting effect would be like economic kudzu strangling the buying power of consumers and possibly forcing a long-overdue debt reckoning as millennials, who are already drowning in debt, are forced to put off home ownership and family formation until they’re in their late 30s or even their 40s.

Source: ZeroHedge

Eviction Courts Overwhelmed As Housing Crisis Unfolds In Colorado

https://s16-us2.startpage.com/cgi-bin/serveimage?url=https%3A%2F%2Fd2t1047w253zzm.cloudfront.net%2Fcities%2Fdenver-co-apartments-for-rent.jpg&sp=5512f46074c635c978a362621f2b53ba

It is official. Consumers in Colorado appear to be tapped out.

This comes at a time when the recovery is now tied for the second-longest economic expansion in American history. The stock market is near an all-time high, unemployment is the lowest in two decades, consumer confidence is beyond euphoric, and Trump tax cuts are stoking the best earnings quarter since 2011 — unleashing a record amount of corporate stock buybacks.

While a real economic recovery could be plausible this late in the business cycle, the unevenness of the recovery has left many residents in Colorado without a paddle. Accelerating real estate and rent prices across Colorado are squeezing residents out of their homes at an alarming pace.

According to ABC Denver 7, Denver metro area’s skyrocketing cost of living, stagnate wage growth, and lack of affordable real estate has fueled an enormous housing crisis — overwhelming the state’s eviction courts.

Colorado Center on Law and Policy (CCLP), which has spent decades advocating for tenant rights, warns that an eviction crisis is underway in the Denver region.

ABC Denver 7 said, “27 percent of all civil cases filed in Colorado in 2017 were evictions, which represents 45,000 cases.” In Denver alone, eviction cases accounted for nearly 18 percent (8,000 eviction cases) of all evictions across the state. Arapahoe County, the third-most populated county outside of Denver, experienced the most significant number of eviction cases at nearly 22 percent (10,000 eviction cases) in 2017.

https://www.zerohedge.com/sites/default/files/inline-images/Screen-Shot-2018-05-04-at-7.53.11-AM-600x334_0.png?itok=UuTxB6Q6

Jack Regenbogen, attorney and policy advocate for the Colorado center on Law and Policy, told ABC Denver 7 that most tenants are underrepresented in eviction court cases. In return, this has led to more evictions forcing tenants out onto the streets. He says about 90 percent of landlords are represented by legal counsel during an eviction process, but less than one percent of tenants have legal assistance.

“Traditionally, Colorado has been a very friendly state towards landlords. We really need our policymakers to begin investing meaningful resources to address this issue,” said adds.

ABC Denver 7 indicates that more than 50 percent of Coloradans are renting, and as court dockets continue to expand with evictions in 2018, the crisis is far from over.

According to the Denver Metro Association of Realtors (DMAR) May housing trends report, the average cost of a single-family home in the Denver metro area edged up, as it hit $543,059 in April. More and more homes are listing in the range between $500,000 to $750,000 than all of the price ranges below $500,000 combined. A spokesman from DMAR said homes priced between $500,000 and $749,000, is now considered the “new norm.”

https://www.zerohedge.com/sites/default/files/inline-images/2018-05-04_09-10-30-768x372.png?itok=eIfKB9Xb

“This demonstrates home buyer demand remains robust,” said Steve Danyliw, Chairman of the DMAR Market Trends Committee. “As new listings poured into the market, buyers that were waiting for them quickly gobbled them up, driving the average days on market down to 20 days.”

Danyliw, further said housing activity remains stable, but increasing interest rates could have an eventual impact on the real estate market.

Evidence continues to build that housing affordability is getting worse, particularly for everyday Americans. Colorado is the latest example of consumers physically tapping out, as they can no longer afford soaring real estate/rent prices – which is now overwhelming state courts in Denver. 

Source: ZeroHedge

Pending Home Sales Decline For 4th Straight Month, Weather Blamed

Pending Home Sales rose just 0.4% MoM (missing expectations of 0.7% MoM) and saw prior months revised notably lower (Feb down from +3.1% to +2.8%).

https://www.zerohedge.com/sites/default/files/inline-images/2018-04-30_7-10-03.jpg?itok=-F_JYU-p

Weather remains the ‘go to’ blame factor from realtors as the regional differences suggest…

  • Northeast fell 5.6%; Feb. rose 10.3%
  • Midwest up 2.4%; Feb. rose 0.7%
  • South up 2.5%; Feb. rose 2.9%
  • West fell 1.1%; Feb. fell 0.7%

Unadjusted pending home sales dropped 4.4% YoY (the 4th straight month of declines – the longest streak since 2014)…

https://www.zerohedge.com/sites/default/files/inline-images/2018-04-30_7-12-14.jpg?itok=wm1BUV5v

“Healthy economic conditions are creating considerable demand for purchasing a home, but not all buyers are able to sign contracts because of the lack of choices in inventory,” Lawrence Yun, NAR’s chief economist, said in a statement.

“Prospective buyers are increasingly having difficulty finding an affordable home to buy.”

“It is an absolute necessity for there to be a large increase in new and existing homes available for sale in coming months to moderate home price growth,” he said.

“Otherwise, sales will remain stuck in this holding pattern and a growing share of would-be buyers — especially first-time buyers — will be left on the sidelines.”

Purchases dropped 5.6 percent in the Northeast, reflecting multiple winter storms…

“As anticipated, the multiple winter storms and unseasonably cold weather contributed to the decrease in contract signings in the Northeast.”

As a reminder, economists consider pending sales a leading indicator because they track contract signings.

Source: ZeroHedge

California’s Most Controversial Housing Bill In Years Just Died With A Thud

Listen to an excellent podcast at the end of this article.https://calmatters.org/wp-content/uploads/ThinkstockPhotos-468601463-1280x800.jpg?x74105Dense housing makes San Francisco one of the most compact cities in America. Photo via Thinkstock

The most controversial state housing bill in recent memory died with a pretty resounding thud.

Senate Bill 827, which would have forced cities to allow taller, denser development around public transit, got only four votes on the 13-member Senate Committee on Transportation and Housing. Both Democrat and Republican lawmakers voted against the bill.

Authored by state Sen. Scott Wiener, Democrat from San Francisco, the bill would have allowed developers to build five-story apartment buildings near major public transit stops, including neighborhoods previously zoned for single family homes. The bill received a ton of media attention, including a fairly flattering write-up on the front page of the New York Times.

The most controversial state housing bill in recent memory died with a pretty resounding thud.

Senate Bill 827, which would have forced cities to allow taller, denser development around public transit, got only four votes on the 13-member Senate Committee on Transportation and Housing. Both Democrat and Republican lawmakers voted against the bill.

Authored by state Sen. Scott Wiener, Democrat from San Francisco, the bill would have allowed developers to build five-story apartment buildings near major public transit stops, including neighborhoods previously zoned for single family homes. The bill received a ton of media att

Urbanist “Yes In My Backyard” (YIMBY) groups mourned the bill’s death as yet another roadblock to building the new housing the state so desperately needs. Cities and anti-gentrification groups cheered the demise of what they viewed as an unprecedented inroad on local control.

What to make of all the hubbub? Some key takeaways:

Enemies, enemies, got a lot of enemies

It’s tough for anyone to take on cities and counties, who wield enormous power in Sacramento and to whom state legislators often give considerable deference. It’s tough for anyone to take on the construction trades’ union, a major source of campaign contributions for Democratic lawmakers. It’s tough for anyone to take on equity and social justice groups, who can bend the ear of progressive legislators.

It’s really tough to take on all three at the same time. That likely wasn’t Sen. Wiener’s strategy when he first introduced SB 827, but that’s ultimately what helped doom the bill. The support of realtors, developers, YIMBYs and a handful of affordable housing advocates couldn’t muster the votes he needed.

Supporters of the bill arguably made a misstep in not courting social justice groups early enough. A flurry of amendments to protect renters from being displaced and to force developers to include units reserved for lower-income tenants failed to calm their concerns.

Last year, Wiener was able to push through a bill that stripped local control over some housing developments by getting labor and affordability advocates on his side. That bill was also part of a larger package of housing legislation that had something for everyone, including a new revenue source. Gov. Jerry Brown was a driving force behind that package.

None of that that happened this time.

The bill did spark a statewide debate on whether to up density to help remedy our housing crisis

https://calmatters.org/wp-content/uploads/IMG_0577-600x357.jpg?x74105Opponents came from San Francisco and its environs to lobby against the bill—and the gentrification they feared it would bring. Photo by Matt Levin for CALmatters

What Wiener was attempting was truly revolutionary. You can debate how dramatically the character of a city would change by building a five-story apartment building next to a single family home. But taking away the power of local governments to block those types of developments was a pretty radical step—a step that a growing number of Californians think is necessary to prevent cities from obstructing new housing.

The bill received a ton of media attention, both in California and nationally. It garnered support from prominent urban planners, environmentalists and civil rights advocates. It’s both cliche and premature to say it shifted the needle on the housing debate. But it certainly framed the conversation squarely around the state’s role in compelling cities to build.

Expect something like this to come back soon.  

Nearly every Democratic legislator who voted against SB 827 caveated their opposition by praising the bill’s vision and audacity. Sen. Jim Beall, Democrat from San Jose and chair of the housing committee, said at the hearing that while he couldn’t support the bill in its current form, he was eager to work on something like it in the months ahead.

Could SB 827 ever rise from the dead? Well for his part, Wiener has vowed to re-introduce something like it in the future. Combining his push for density around transit stations with a broader mix of tenant protections and new funding for affordable housing could make it more palatable to the interest groups Wiener needs to succeed.

Source: By Matt Levin | Cal Matters


No Relief In Sight: Housing affordability is weakening at the fastest pace in a quarter century

https://i0.wp.com/www.stylemotivation.com/wp-content/uploads/2013/10/20-Cute-Small-Houses-That-Look-So-Peaceful-4.jpg

  • Rising home prices, rising mortgage rates and rising demand are colliding with a critical shortage of homes for sale. And all of that is slamming housing affordability.
  • This year, affordability — based on the amount of the monthly mortgage payment will weaken at the fastest pace in a quarter century, according to researchers at Arch Mortgage Insurance.
  • Other studies that factor in median income also show decreasing affordability because home prices are rising far faster than income growth.

It is the perfect storm: Rising home prices, rising mortgage rates and rising demand are colliding with a critical shortage of homes for sale.

And all of that is slamming housing affordability, which is causing more of today’s buyers to overstretch their budgets. This year, affordability — a metric based solely on the amount of the monthly mortgage payment — will weaken at the fastest pace in a quarter century, according to researchers at Arch Mortgage Insurance.

The average mortgage payment, based on the median-priced home, increased by 5 percent in the first quarter of 2018 nationally and could go up another 10 to 15 percent by the end of the year, according to their report.

Researchers looked at the median-priced home, now $250,000, and estimated price gains this year of 5 percent in addition to mortgage rates going from 4 percent to 5 percent on the 30-year fixed. Other studies that factor in median income also show decreasing affordability because home prices are rising far faster than income growth.

That is a national picture – but all real estate is local, and some markets will see affordability weaken more dramatically. The average monthly payment in Tacoma, Washington, is estimated to increase 25 percent this year, given sharply rising prices. In Baltimore and Boston, it could rise 21 percent in each. Philadelphia, Detroit and Las Vegas could all see 20 percent increases in the average monthly payment.

“If mortgage rates and home prices continue to rise as expected, affordability will get hammered by year-end as demand continues to outstrip supply,” said Ralph DeFranco, global chief economist-mortgage services at Arch Capital Services. “A strong U.S. economy combined with a housing shortage in many markets means that there is little hope of any price drop for buyers. Whether someone is looking to upgrade or purchase their first home, the window to buy before rates jump again is probably closing fast.”

Barely a decade after home values crashed especially, they are now hovering near their historical peak, accounting for inflation. Prices are being driven by record low inventory of homes for sale. Home builders are still producing well below historical norms, and demand for housing is very hot. The economy is stronger, which is giving younger buyers the incentive and the means to buy homes.

Stretching budgets and pushing limits

Maryland real estate agent Theresa Taylor said the supply shortage is hitting buyers hard. She is seeing more clients stretch their budgets to win a deal amid multiple offers.

“People are having to escalate offers on top of rates going up. I’m seeing it in all price ranges,” said Taylor, an agent at Keller Williams. “I am seeing it when I’m getting five offers, and people are trying to package up an offer where they’re pushing their limits.”

Buyers are taking on much higher debt levels today to be able to afford a home. In fact, the share of mortgage borrowers with more than 45 percent of their monthly gross income going to debt payments more than tripled in the second half of last year. Part of that was because Fannie Mae raised that debt-to-income threshold to 50 percent, but clearly there was demand waiting.

“Family income is rising more slowly than home prices and mortgage rates, meaning that the mortgage payment takes a bigger bite out of income for new home buyers,” said Frank Martell, president and CEO of CoreLogic. “CoreLogic’s Market Conditions Indicator has identified nearly one-half of the 50 largest metropolitan areas as overvalued. Often buyers are lulled into thinking these high-priced markets will continue, but we find that overvalued markets will tend to have a slowdown in price growth.”

CoreLogic considers a market overvalued when home prices are at least 10 percent higher than the long-term, sustainable level. High demand makes the likelihood of a national home price decline very slim, but certain markets could see prices cool if supply grows or if there is a hit to the local economy and local employment.

In any case, the more home buyers stretch, the more house-poor they become, and the less money they have to spend in the rest of the economy.

With no relief in either inventory or home price appreciation in sight, the housing market is likely to become even more competitive this year.

At some point, however, there will come a breaking point when sales slow, which is already beginning to happen in some cities. Home prices usually lag sales, so if history holds true, price gains should start to ease next year.

(video interview)

Source: By Diana Olick | CNBC

Economists Who Push Inflation Stunned That Rising Home Prices Have Put Buyers Deeper Into Debt

Once again, when the government intervenes – this time in housing – the left hand is starting a fire that the right hand is trying to put out. Rising prices for homes are once again pricing out prime borrowers and nobody can “figure out” why this is happening.

It is news like this article reported this morning by the Wall Street Journal that continues to perpetuate the hilarious notion of Keynesian economics as giving a job to one man digging a hole and another job to another man filling it, simply so that they both have jobs.

There is nothing funnier (or sadder) than “economists” struggling to understand how housing prices got so high and why people are taking on more debt in order to purchase them. However, that is the great mystery that the Wall Street Journal reported on Tuesday morning, making note of the fact that people are “stretching“ in order to purchase homes. What’s the solution to this problem? How about just easing lending standards again? After all, what could go wrong?

Apparently blind to the obvious – that forced inflation could amazingly make things more expensive relative to income – “economists” have hilariously blamed this price/debt delta on lack of supply. Of course, no one has mentioned the credit worthiness of borrowers getting worse or the fact that homes prices are being manipulated in order to offer home ownership to people who otherwise may not be in the market.

More Americans are stretching to buy homes, the latest sign that rising prices are making homeownership more difficult for a broad swath of potential buyers.

Roughly one in five conventional mortgage loans made this winter went to borrowers spending more than 45% of their monthly incomes on their mortgage payment and other debts, the highest proportion since the housing crisis, according to new data from mortgage-data tracker CoreLogic Inc. That was almost triple the proportion of such loans made in 2016 and the first half of 2017, CoreLogic said.

Economists said rising debt levels are a symptom of a market in which home prices are rising sharply in relation to incomes, driven in part by a historic lack of supply that is forcing prices higher.

The “lack of supply” argument is just wonderful – a bunch of “economists” finding a basic free market capitalism solution to a problem that has nothing to do with free market capitalism. Perhaps “economists” can also argue that building more, despite the lack of prime borrower demand, will also have the added benefit of puffing up GDP. From there, it’s only a couple more steps down the primrose path that leads to China’s ghost cities.

https://www.zerohedge.com/sites/default/files/inline-images/chart1_0_0.jpg?itok=X7gskNoZ

And of course, people are worried that we could have a “weak selling season” upcoming. In a free market economy, weakness is necessary and normal. In Keynesian theory, it’s the devil incarnate. The Wall Street Journal continued:

Real-estate agents worry that buyers’ weariness from being priced out of the market could make this one of the weakest spring selling seasons in recent years.

Consumers are growing more optimistic about the economy and their personal financial prospects but less hopeful that now is the right time to buy a home, according to results of a survey released in late March by the National Association of Realtors.

At the same time, the average rate for a 30-year, fixed-rate mortgage has risen to 4.40% as of last week from 3.95% at the beginning of the year, according to Freddie Macputting still more pressure on affordability.

These factors “are working against affordability and that’s why you get the pressure to ease credit standards,” said Doug Duncan, chief economist at Fannie Mae. He said that pressure has to be balanced against the potential toll if underqualified buyers eventually default on their mortgages.

CoreLogic studied home-purchase loans that generally meet standards set by Fannie Mae and Freddie Mac, the federally sponsored providers of 30-year mortgage financing.

The amount of these loans packaged and sold by Fannie and Freddie increased 73% in the second half of 2017, compared with the first half of the year, according to Inside Mortgage Finance, an industry research group. In that same period, overall new mortgages rose 15%.

As if the signs weren’t clear enough that manipulating the economy and manipulating the housing market has a detrimental effect, the article continued that Fannie Mae and Freddie Mac are “experimenting with how to make homeownership more affordable, including backing loans made by lenders who agree to help pay down a buyer’s student debt“. Sure, solve one government subsidized shit show (student loan debt) with another one!

Is it any wonder that the entire supply and demand environment for housing has been thrown completely out of order?  On one hand, the government wants to make housing affordable so that everybody can have it, which closely resembles socialism. On the other hand, they are targeting prices to rise 2% every single year and claim that this is normal and healthy economic policy that we should all be buying into and applauding. The left hand doesn’t know what the right hand is doing!

We were on this case back in October 2017 when we wrote an article pointing out that home prices had again eclipsed their highest point prior to the financial crisis. We knew this was coming. We at the time that the ratio of the trailing twelve month averages of median new home sale prices to median household income in the U.S. had risen to an all time high of 5.454, which following revisions in the data for new home sale prices, was recorded in July 2017. The initial value for September 2017 is 5.437.

In other words, the median new home in the US has never been more unaffordable in terms of current income.

https://www.zerohedge.com/sites/default/files/inline-images/ratio-ttma-median-new-home-sale-prices-and-median-household-income-annual-1967-2016-monthly-200012-to-201709_0.png?itok=D3_lX6IP

Here we are 6 months later and “economists” are just figuring this out. What’s wrong with this picture?

What’s really happening is clear. Instead of letting the free market determine the pricing and availability of housing, the government has continued to try and manipulate the market in order to give everyone a house. This is simply going to lead to the same type of behavior that led Fannie Mae and Freddie Mac to fail during the housing crisis.

If we are going to have free market capitalism, the reality of the situation is that not everybody is going to own a house.

Furthermore, while there are many benefits to owning a house, there are also many reasons why people rent. Peter Schiff, for instance, often makes the case that renting is generally worth it because you’re saving yourself on upkeep and it allows you to be flexible with where you live and when you have the opportunity to move. He himself rents property for these reasons, which he often notes in his podcast. Sure, there are some benefits of homeownership, namely that a homeowner is supposed to be building equity in something, but looking again at the situation we are in today, is it worth investing in the equity of a home that might see its price crash significantly again, similar to the way housing prices did in 2008?

The government is creating both the problem and the solution here and instead of trying to continually fix the housing market, they should just keep their nose out of it and allow the free market to determine who should own a house and at what price. Call us crazy, but we don’t think that’s going to happen.

Source: ZeroHedge

How Much Income You Need to Afford the Average Home in Every State

The housing market has not only recovered its pre-recession levels, but some observers are actually starting to worry about yet another housing bubble. Housing prices are on the rise, thanks in large part to extremely tight inventory, so it’s worth asking: are potential home buyers getting priced out of the market? The answer depends on where they live and how much money they make.

https://cdn.howmuch.net/articles/salary-need-to-afford-home-2018-8426.png(click here for larger image)

We collected average home prices for every state from Zillow which we then plugged into a mortgage calculator to figure out monthly payments. Remember, mortgage payments consist of both the principal and the interest for the loan. The interest rate we used varied from 4 to 5% in each state, depending on the market. The lower the interest rate, the lower the monthly payment. To keep things simple, we assumed buyers could contribute a 10% down payment. Another thing to keep in mind is that financial advisors commonly recommend the total cost of housing take up no more than 30% of gross income (the amount before taxes, retirement savings, etc.). Using this rule as our benchmark, we calculated the minimum salary required to afford the average home in each state.

Top Five Places Where You Need the Highest Salaries to Afford the Average Home

1. Hawaii: $153,520 for a house worth $610,000

2. Washington, DC: $138,440 for a house worth $549,000

3. California: $120,120 for a house worth $499,900

4. Massachusetts: $101,320 for a house worth $419,900

5. Colorado: $100,200 for a house worth $415,000

Top Five Places Where You Need the Lowest Salaries to Afford the Average Home

1. West Virginia: $38,320 for a house worth $149,500

2. Ohio: $38,400 for a house worth $149,900

3. Michigan: $40,800 for a house worth $160,000

4. Arkansas: $41,040 for a house worth $161,000

5. Missouri: $42,200 for a house worth $165,900

Our map creates a quick snapshot of housing affordability across the United States. There are several pockets in which only the upper middle class and above can afford to own even the average home, most notably across the West and in the Northeast. There are only two states west of the Mississippi River where a worker with an annual salary under $40,000 can afford a mid-level home:  Missouri and Oklahoma. Colorado stands out as the only landlocked state requiring a significant amount of income ($100,200), thanks in large part to the housing market around Denver.

Homes tend to be more affordable in the eastern half of the country, with a notable pocket of “green” (less expensive) states located in the upper Midwest. The North is generally more affordable than the South and the typical home is significantly easier to buy in places like Michigan or Ohio than in Louisiana or Arkansas.  Additionally, our map indicates that workers can more easily afford homes in the East than in the West, which is surprising given how much more land is available out West. It is important to note that there are certainly deep pockets of poverty in all of these places, which suggests that our map obscures the inequality behind averages.

The best takeaway from our map is that housing remains affordable in large swaths of the country, even though there will always be places like California and New York where there is simply too much demand for the available inventory. Thankfully, that doesn’t mean that buying a home is suddenly out of reach for average Americans in Ohio or Mississippi, for example.

Source: HowMuch

Progressive Property Tax Spikes Throwing Thousands of Seattle Seniors Out of Their Homes

https://static.seattletimes.com/wp-content/uploads/2018/03/2f8b0bc0-33c0-11e8-9316-bc6406bfcffc-960x640.jpgDennis and Patricia Hall stand beside their Kirkland family home, built by Dennis in 1980. They raised their daughter there and planned to stay for the rest of their lives. But now on a fixed income will be forced out of their home due to parabolic government property tax hikes.

The Seattle Times has collected hundreds of reader responses to the tax hikes. Many who said they’re retired or disabled, and living on fixed incomes, offered emotional stories of being unable to afford the heftier rate.

Dennis Hall imagined living his whole life in the country-style home he and his wife built in Kirkland for $55,000 in 1980. But the couple, now retirees on a fixed income, say the latest tax bill for their property — valued at $1.2 million — is forcing them to rethink their golden years, sell the beloved home and move. “This year was the breaking point. Enough is enough,” said Hall, 65, thinking about the big tax increase, a reflection of skyrocketing home values, voter-approved levies and a plan by state lawmakers to fully fund public schools. “We were hoping on dying here.” With this round of property-tax notices, the couple are not alone in their worries. As the effects of the higher rates spread statewide, some homeowners are calling the tax increase a tipping point in a period of financial stress that’s forcing too-soon goodbyes to longtime homes. Over the course of weeks, The Seattle Times collected hundreds of emails, phone calls and responses on social media from people like Hall, many of whom identified as retired or disabled, saying they have limited options for paying the heftier amounts. “Should anything happen to me like an illness or injury, I will be homeless pretty quick,” wrote a 61-year-old homeowner in Seattle’s Ballard neighborhood. “There is no way I can make it; have to sell our home,” another person said in a voicemail. “I don’t know what to say or do.”  

Property-tax increases vary greatly from city to city.

A handful of people shared less emotional stories of budgeting without lattes or expansive cable packages to cover the larger bills. A few said the spike is a result of Washington’s regressive tax structure. And in a region with a growing housing- affordability and homelessness crisis, a couple of respondents acknowledged their status as “well-paid” and fortunate enough to afford the tax by simply shifting around their spending.

With Social Security, some seniors hoping to qualify for assistance reported annual incomes that barely surpass the state’s maximum of $45,000 for tax deferrals or $40,000 for exemptions. Recipients of the former eventually have to repay with interest, while tax exemptions reduce amounts due based on various criteria, including income and home value. According to numbers provided by the Washington State Department of Revenue, about 107,000 seniors participated in the exemption program last year — or roughly 7 percent of the state’s total senior population. The department, meanwhile, received 558 applications for deferrals.

House for settling down

Surrounded by spacious fields and livestock, the Kirkland home was ideal for Hall and his wife, Patricia, to settle down in and raise a family, with college and the military behind them. Born and raised in the suburb, he worked in construction while she managed the home. They adopted a baby girl in 1985. “That’s when the house came alive,” he recalled. Nearly four decades later, a time span that included the birth of their grandson, the couple’s budget tightened significantly when he retired in 2010 at age 58. The latest tax increase of $1,500 on the property — not far from Microsoft’s campus — hit hard. They sold the land and home to a local developer soon after and started making plans to move to the Duvall area, where their daughter’s family lives. “I’m not against paying taxes,” Dennis Hall said, so long as the government services he sees are on par with how much he pays. These days, relocating for more affordable living is not a phenomenon unique to Washington retirees. New U.S. census data show populations of retiree-friendly communities rising faster than national population growth, The Wall Street Journal reports. But the shift for homeowners here, in the metropolitan area of King, Snohomish and Pierce counties, comes with incomparable pressure. Single-family-home values in the three counties have been rising faster than anywhere else in the country. Median house prices recently hit records of $777,000 in Seattle and $950,000 on the Eastside. Beyond the surging values, this year’s property-tax increases are largely a result of last year’s bipartisan deal by lawmakers to shift spending on public schools.

In an effort to comply with the state Supreme Court’s 2012 McCleary ruling, which found the state has neglected its constitutional duty to pay for public schooling, lawmakers voted to raise the state property-tax levy for schools to $2.70 per $1,000 of assessed value, up from $1.89 in 2017. The plan will reduce local school levies, but not until next year. “Wondering if ‘laptops for kids’ is worth losing homeowners,” a Bothell reader wrote to the newspaper, saying her family picked the city in 2009 because of its lower taxes compared with the Seattle area.

“Guess that was nine years ago — not the future.”

Property-tax insider

Michelle LeMay, 64, of Seattle, knows the effects of property taxes well. She worked almost two decades in the King County Assessor’s Office as an administrative specialist, mailing tax notices to homeowners, fielding phone calls and helping people such as seniors with exemption paperwork. But the tables have turned. Now, she and her husband, on a fixed income, feel they’re being pushed out of their house in Greenwood with this year’s property-tax increase of 22 percent. Their income is barely above the maximum to qualify for a senior tax exemption, she said. “You can’t live in Seattle for $40,000.”In many poorer and rural school districts across Washington, projections for the new law on school spending show cuts in property taxes in future years, while taxes remain higher in richer areas like Seattle, Bellevue and Mercer Island. Voter-approved levies make up a large portion of the hikes in some areas, too, including King County, where the increases range from 9 percent in Normandy Park to 31 percent in Carnation. Among U.S. states, a 2016 report by the Tax Foundation found Washington had the 26th-highest property-tax rate (0.94 percent). That compared with the highest rate of 2.11 percent in New Jersey. It’s unclear how the new taxes may change Washington’s rank. As LeMay and her husband go through their belongings and contemplate selling their home eventually, they told The Times they feel overwhelmed and are looking at possibilities outside King County. “Arizona seems like the place a lot of people are relocating,” LeMay said.Beyond tax exemptions and deferrals for qualified seniors, widows and people with low incomes or disabilities can apply through the state for tax help. Also, homeowners can appeal the assessor’s valuation of their homes, which determines tax increases, by July 1 or within 60 days of receiving notification of their assessment. Kathleen Dellplain, 72, formerly of Seattle’s Fauntleroy neighborhood, moved away before the pack. A retired widow, she noticed herself losing financial ground as the owner of a waterfront home years ago. She put the house on the market after receiving this year’s assessment and moved to a farmhouse in Enumclaw, in Southeast King County. “If I could’ve frozen my tax or kept it with the regular rate of inflation, I would have probably stayed there for the rest of my life,” she said. But costs rose too quickly for her income, she said, especially with her commitment to help grandkids through college.

Source: Seattle Times


National Apartment Rents Stabilize As Small Cities Boom

After years of torrid growth that has far outstripped wages, national apartment rents have finally plateaued, climbing a scant 2.5% YOY to $1,371 in March, according to RentCafe‘s latest monthly rent report.

Interestingly, the hottest rental markets (Brooklyn, for example), have seen rents retreat from record highs as they grapple with too much development at the high end of the housing market.

Meanwhile, mid-sized cities like Sacramento, Colorado Springs and Tampa have seen strong growth. But by far the strongest growth has been recorded in small cities like Midland, Texas (famously the home of George W Bush) and Yonkers, New York. Midland saw rents increase by a staggering 29% over the past 12 months, while nearby Odessa recorded a nearly 40% rent increase. Meanwhile, Reno, Tacoma and Orlando are in the top ten fastest growing rental markets.

https://www.zerohedge.com/sites/default/files/inline-images/2018.04.02rentcafe.JPG?itok=JAM0P2ng

Still, despite a slight year-over-year drop, Manhattan still has the highest average rent in the country, followed by San Francisco, which saw rents rise 2.4% year-over-year.

https://www.zerohedge.com/sites/default/files/inline-images/2018.04.02chart.JPG?itok=c0dqvS4b

Of the 250 cities surveyed by RentCafe, Wichita, Kansas had the lowest average rent at $632 a month.

Source: ZeroHedge

Intolerant California Woman Refuses To Sell Her House To Trump Supporters

A Sacramento, California woman selling a house which has been in her family for half a century will sell to just about anyone – unless they’re a Trump supporter.

https://www.zerohedge.com/sites/default/files/inline-images/notrum_0.JPG?itok=jYsR50Mz

The homeowner, who declined to give her name, told CBS Sacramento “I told her [the realtor] that I didn’t want her to sell it to a Trump supporter.”

https://www.zerohedge.com/sites/default/files/inline-images/house12_0.JPG?itok=dqgEODQ0

https://www.zerohedge.com/sites/default/files/inline-images/ho2_0.JPG?itok=tfU3Uqs_

The woman’s realtor, Elizabeth Weintraub, says that the “no Trump supporter” caveat is a first for her. “We can ask somebody how they voted, but they don’t have to tell us,” said Weintraub.

But is it actually legal? Attorney Allen Sawyer thinks not: “That’s an unlawful contractual term that infringes the freedom of association and first amendment rights,” said Sawyer.

According to the Fair Housing Act, political party affiliation doesn’t fall into one of the seven protected classes. They include race, religion, color, disability. National origin, sex and familial status. –CBS Sacramento

“People have a right to believe what they want to believe and they shouldn’t be restricted from purchasing property based on that,” said Sawyer.

https://www.zerohedge.com/sites/default/files/inline-images/hou4_1.JPG?itok=3JoEhVY1

Either way – the seller is clearly limiting the buying pool according to certified appraiser Ryan Lundquist – who notes that “39 percent of voters voted for Donald Trump in the Sacramento region. That’s an absolute fact.”

The homeowner doesn’t care: “When you’re talking about principals, morals, and ethics, it’s very very deep,” she said.

Source: ZeroHedge

In Nearly 70% Of US Counties, The Average Worker Can’t Afford To Buy A Home

Housing, as we’ve pointed out in the past, is perhaps the most reliable bellwether of widening economic inequality in the US. And in its latest quarterly report on housing affordability in the US, ATTOM discovered that median-priced homes aren’t affordable to average wage earners in an astounding 68% of US housing markets.

In its report, the company calculated affordability by incorporating the amount of income needed to make monthly home payments – including mortgage payments, property tax payments and insurance – on a median-priced home, assuming a 3% down payment and a 28% maximum “front-end” debt-to-income ratio.

That required income was then compared with the median home price.

https://www.zerohedge.com/sites/default/files/inline-images/2018.03.28attom.png?itok=_HEVQClg

The 304 counties where a median-priced home in the first quarter was not affordable for average wage earners included Los Angeles County, California; Maricopa County (Phoenix), Arizona; San Diego County, California; Orange County, California; and Miami-Dade County, Florida. Meanwhile, the 142 counties (32 percent of the 446 counties analyzed in the report) where a median-priced home in the first quarter was still affordable for average wage earners included Cook County (Chicago), Illinois; Harris County (Houston), Texas; Dallas County, Texas; Wayne County (Detroit), Michigan; and Philadelphia County, Pennsylvania.

https://www.zerohedge.com/sites/default/files/inline-images/2018.03.28attomtwo.JPG?itok=H0lrGUce

Already, the “hottest” housing markets are seeing an exodus of working- and middle-class individuals who can no longer afford to pay the high rents – let along afford to set aside enough money for a down payment.

Eight of the top 10 counties with the highest median home prices in Q1 2018 posted negative net migration in 2017: Kings County (Brooklyn), New York (25,484 net migration decrease); Santa Clara County (San Jose), California (5,559 net migration decrease); New York County (Manhattan), New York (3,762 net migration decrease); Orange County, California (3,750 net migration decrease); and San Mateo, Marin, Napa and Santa Cruz counties in Northern California.

Furthermore, ATTOM’s data found that this problem is getting worse, not better, with 41% of housing markets less affordable than their historical average during the first quarter. That’s up from 35% the quarter before.

Meanwhile, a staggering 73% of markets posted worsening affordability compared with a year ago, including Los Angeles, Cook County (home to Chicago), Maricopa County (Phoenix) and Kings County (Brooklyn).

https://www.zerohedge.com/sites/default/files/inline-images/2018.03.28attommthree.png?itok=eqPPxf-3

The counties where the average wage earner would need to spend the highest share of their income to buy a median-priced home are Baltimore, Bibb County (Macon, Georgia) and Wayne County (Detroit).

Continuing with the trend of home prices rising more than twice as quickly as wages, home-price appreciation outpaced wage growth in 83% of housing markets.

When Fed Chairman Jerome Powell warned last month that “valuations are still elevated across a range of asset classes” and that he fears “signs of rising non-financial leverage” it’s possible that he was still understating the problem.

Source: ZeroHedge


Median Home Price In San Francisco Hits $1.42 million: A Standard Condo In San Francisco Is Now Selling For $1.15 Million.

San Francisco housing has entered into a new reality.  Tech money and foreign cash continues to flood the market and pushing prices to astronomical levels.  The typical San Francisco crap shack now will cost you $1.42 million, a new record high with condos going for $1.15 million.  The city is entering into escape velocity of gentrification.  You have older Taco Tuesday baby boomers with rudimentary tech knowledge that bought decades ago living next to a new generation of wealth and tech savvy professionals.  You see this as well in Los Angeles.  Some real estate “experts” barely have a working understanding of tech but definitely know how to navigate to Zillow to view their inflated prices. San Francisco is such an odd case study.  A city that outwardly states it supports the poor but when you look at prices even making $100,000 a year makes you part of a new high income poor – at that income level a sizable amount of your net income is going to go to simply paying for housing unless you want to be part of the mega commuting culture that is now emerging in California.  What is going on in San Francisco?

The new ultra rich in San Francisco

It is hard for people to wrap their minds around the cost of housing in a place like California.  Not so much that it is expensive, but once you look at the property and price you realize people are paying high prices for crap shacks.

Take a look at prices in San Francisco:

https://i0.wp.com/www.doctorhousingbubble.com/wp-content/uploads/2018/03/1968-2010_US-CA-SF_Median_Price.jpg

And people are still active and buying. You’ll notice that prices for the U.S. and California overall are merely back to their previous peak price points. Adjusting for inflation, things are moving along more carefully. In San Francisco, we are in a different dimension.

You have foreign money flooding the market and you also have dual income high tech households trying to buy up what little inventory exists. This new class of wealth would rather live in a million dollar dump than spend horrendous hours in a commute. The new sign of status is living near your work, not a McMansion out in the middle of nowhere.

And properties are moving along nicely in San Francisco even at a median price of $1.42 million:

https://i0.wp.com/www.doctorhousingbubble.com/wp-content/uploads/2018/03/property-sold.png

What is telling is that the media is now in unison championing why real estate is a great buy, even at these prices.  Forget about the multitude of factors that now face our economy including jobs that don’t last for a lifetime or the necessity for mobility with the new workforce.  You have the Taco Tuesday baby boomer mentality where people want to stay put forever and assume everyone is going to follow in their same footsteps.  Apple wasn’t built following the old.  Facebook wasn’t built by following the old.  Tesla wasn’t built by following the old.  This generation is different and their need in housing are reflecting a changing tone.

Beyond the obvious, even at $1.42 million most are not going to have the money to buy these properties.  So what does this do to the current market? What does it do to neighborhoods?  Or how about the local school systems?

I think people just assume that high prices are always going to be part of the equation in California.  But recent history shows that we go in booms and busts.  For those that seem to think the market can only go up they should be out in the market buying real estate.  That is their position.  For those renting, you are already taking a position.  And many parts of the state are becoming renting majority counties.

San Francisco real estate continues to go up.  Who is buying right now?  Funny how those buying real estate at these levels don’t see it as speculation but think stocks or crypto are “crazy” – everyone picks their “investment” product and the market seems frothy across all areas.

Source: Dr.HousingBubble

HUD’s Top Tech Employee Resigns Amid Corruption Scandal

https://upload.wikimedia.org/wikipedia/commons/thumb/2/2e/Seal_of_the_United_States_Department_of_Housing_and_Urban_Development.svg/548px-Seal_of_the_United_States_Department_of_Housing_and_Urban_Development.svg.png

On the same day Ben Carson, head of The United States Department of Housing and Urban Development (Commonly known as HUD) testified before Congress about the dire need to upgrade the Department of Housing and Urban Development’s computer systems, its chief information officer resigned amid corruption allegations.

Johnson Joy submitted his resignation to Carson on Tuesday, according to a report from The Guardian, and the secretary accepted. Whistleblower Katrina Hubbard, Joy’s former executive assistant, filed a complaint about potential corruption in the CIO’s office, including suspicious over payments of a subcontractor.

Hubbard also claims that she was transferred and then fired after reporting the suspected fraud, with HUD citing job performance issues.

Joy first came under scrutiny last weekend, when The Guardian reported his connection to GJH Global Ministries, a religious charity that solicited donations but did not have a clear objective. The group’s website had mission statements copied from other churches, and was soon locked after The Guardian began asking questions about it.

“We literally did nothing,” GJH Global Ministries director Stephen Austin told a Guardian reporter.

Another HUD official who resigned amid questions about his background, Naved Jafry, was also involved in the charity; Jafry was a subcontractor associated with the same firm that allegedly received inflated payments.

The DC palace intrigue comes as Carson, a former Republican US Presidential Candidate and Trumps pick to head up HUD tries to weather the MSM (main stream media) hype controversy surrounding his office’s attempted purchase of a $31,000 dining room set, which was cancelled amid critical news coverage. Carson was again thumped in the MSM for his response to the situation during a Congressional hearing Tuesday, in which he appeared to blame his wife — who is not a HUD employee — for arranging the purchase and claiming that the old furniture was a safety hazard.

During the same hearing, Carson repeatedly emphasized the importance of upgrading the Federal Housing Administration’s aging information technology infrastructure, which he claimed weathers 2,000 to 3,000 hacking attempts per week — and is based on software that dates back decades. 

“We have to get the IT systems at FHA up to par. We are putting a lot of money and a lot of people in jeopardy by continuing this,” he said.

Source: By Alex Spanko | Reverse Mortgage Daily

U.S. Starter Homes Are Scarcer, Pricier, Smaller and More Run-Down

Homebuyers in the U.S. have plenty to grouse about these days. Prices have climbed steeply in many metro areas, mortgage rates are rising and inventory is thin. But for people looking to purchase their first home, it’s ugly out there.

“Starter homes have become scarcer, pricier, smaller, older and more likely in need of some TLC” than they were six years ago, the real estate website Trulia reported Wednesday after analyzing housing stock across the country. Trulia began tracking prices and inventory in 2012.

 Oh, Give Me a Home …

The supply of U.S. homes is up 3.3%, driven by a 13.3% jump in the premium category, while starter-home inventory has hit its lowest level since Trulia started keeping track in 2012.

It’s grim all over. American homes are at their least affordable in the report’s history. But the median listing price of available starter homes has risen 9.6 percent in the past year, easily beating out the trade-up and premium categories, while starter-home supply has fallen to a new low this quarter, Trulia reported.

Perhaps the most striking finding is that the very buyers who are typically least able to plunk down a lot of money are confronted with the least affordable homes. The share of income needed by those in the market for a premium home was 15 percent, and for a trade-up home 27 percent. For a starter it was 41 percent.

https://assets.bwbx.io/images/users/iqjWHBFdfxIU/iVs8QzMqucbs/v1/1000x-1.png

Adding insult to injury, the homes aimed at first-time buyers are less likely to be ready for human habitation than others, with fixer-uppers accounting for 11.2 percent of the category. They’re about nine years older than they were in 2012, and 2 percent smaller.

On the bright side, 2 percent isn’t a whole lot smaller. Until you learn that homes overall are more than 8 percent bigger.

Source: By Noah Buhayar | Bloomberg


U.S. Home Ownership Rate Slips Versus Other Developed Nations

https://s-media-cache-ak0.pinimg.com/564x/42/0e/8d/420e8d69c3a0b9e5aa2f5ce7d261e01d.jpgVersus other developed nations, the United States is losing ground in terms of the rate of home ownership, new research finds. 

Compared to 17 other first-world countries around the globe, the U.S. home ownership rate has fallen over time, an indicator that the American Dream is becoming less attainable, according to research published by the Urban Institute.

Researchers Laurie Goodman, vice president for housing finance policy at the Urban Institute, and Chris Mayer, professor of real estate at Columbia Business School and CEO of reverse mortgage company Longbridge Financial, prepared the findings.

Among the 18 countries for which home ownership was considered, the U.S. ranked 10th in 1990 with a 63.9% home ownership rate compared with its ranking of 13th in 2015. Several European countries followed a similar shift, with Bulgaria, Ireland, and the United Kingdom seeing slides between 1990 and 2015; the proportion of homeowners also declined in Mexico over that span.

Thirteen of the countries saw increases in their rate of home ownership, including a 39.6% spike in the Czech Republic and a 29.6% gain in Sweden. 

“While cross-country comparisons are difficult, the slip in US home ownership relative to the rest of the world, and the historically low home ownership rates for Americans ages 44 and younger, should motivate us to look at US housing policies,” the researchers wrote in a blog post on the research published by the Urban Institute. 

https://1srv2m1khi3n2z1u013n6cpg-wpengine.netdna-ssl.com/wp-content/uploads/2018/03/NewImage.png

Home ownership among the senior demographic has been touted within the reverse mortgage industry as a clear retirement windfall.

Yet even for those who choose not to tap into their home equity, the option to use the property rent-free once the mortgage is paid can play an important role in retirement savings, the researchers noted in discussing the amount of home equity currently held among seniors in European countries.

By Elizabeth Ecker | Reverse Mortgage Daily

‘Rent-For-Sex’: How Landlords Exploit Broke Millennials

https://stockboardasset.com/wp-content/uploads/2018/03/572333fe403d0_Rentsex1.jpg

It is now time to sound the alarm bells on the economic prospects for the Millennial Generation in the Western world, but more importantly, in the United Kingdom. This generation of citizens aged 18 to 36, is the first in modern developed economies on course to have a lower standard of living than their parents.

Housing affordability and a decaying job environment are some of the most pressing issues affecting Millennials. The future is bleak for this avocado and toast generation, as Western world economies have likely plateaued regarding economic growth. Surging debt and rising government bond yields are producing an environment that could lead to more hardships for this lost generation.

Landlords in the United Kingdom have taken full advantage of broke Millennials by offering “adult arrangements” for a roof over their heads. Yes, you heard this correctly, Millennials are trading sex for a place to sleep — unearthed in a new documentary by the British Broadcasting Corporation (BBC), which provides a chilling insight into just how bad the Millennial generation has it.

BBC reporter Ellie Flynn went undercover to expose the scale of the ‘Rent For Sex’ issue in the United Kingdom, in which landlords on Craigslist are advertising “free” accommodation in exchange for sexual acts.

Ellie portrayed herself as a broke, 24-year-old nursing student with very little alternatives. She confronted one man in a Newcastle cafe who defended his actions and told cameras: “I’m not doing anything wrong… it’s not just about sex, it’s about companionship.

https://stockboardasset.com/wp-content/uploads/2018/03/49AB5F4900000578-5446141-image-a-1_1519841267519.jpg

“BBC Three’s Ellie Undercover: Rent For Sex also met up with a landlord who had built a log cabin in his garden where tenants could sleep if the agreed to have sex in return for a ‘physical arrangement once a week,” the Daily Mail reported.

https://stockboardasset.com/wp-content/uploads/2018/03/49AB5F6100000578-5446141-image-a-4_1519841347238.jpg

“The man offers to show Ellie around after saying: ‘That’s where you sleep, it’s a log cabin, alright,” the Daily Mail reported.

https://stockboardasset.com/wp-content/uploads/2018/03/49AB5F6C00000578-5446141-image-a-5_1519841349778.jpg

He later denied knowing the practice of asking for sex in exchange for housing is a serious offense in the United Kingdom, saying: “I don’t know, I can’t truthfully answer that .”

One landlord put Ellie in touch with a former tenant who told of “how he tried touching her while she was staying rent-free with him,” said the Daily Mail.

“I would just feel almost paralyzed every time he tried to touch me but he didn’t force himself on me,” said the unnamed woman.

https://stockboardasset.com/wp-content/uploads/2018/03/49AB5F7C00000578-5446141-image-a-6_1519841386051.jpg

The woman added: “The idea of consent gets mashed up because a woman thinks this is the exchange I have to give this man in order for me to have a roof over my head.”

In fact, the number of listings on Craigslist and social media websites offering rent for sex is exploding. Latest figures from the Housing Charity Shelter are absolutely mind-numbing, more than 250,000 women over the last five years have been asked for “adult arrangements” in exchange for housing.

UK Millennials lack a living wage, therefore, this generation sees nothing wrong in offering their bodies to landlords for a roof over their heads. Apparently, the smartest generation to ever step foot on planet earth is the first generation since the 1950s to fail to do better than their parents, as this chart shows:

https://stockboardasset.com/wp-content/uploads/2018/03/Screen-Shot-2018-03-03-at-7.19.49-AM.png

The home ownership rate for UK Millennials is so low that these levels have not been seen since World War I:

https://stockboardasset.com/wp-content/uploads/2018/03/Screen-Shot-2018-03-03-at-7.24.03-AM.png

According to the Office for National Statistics, millennials have largely been priced out of the real estate market as prices soar above 2008 levels.

https://stockboardasset.com/wp-content/uploads/2018/03/2018-03-03_07-27-05.png

Over the same period of rising real estate prices, UK Millennials have dealt with stagnating wages:

https://stockboardasset.com/wp-content/uploads/2018/03/Screen-Shot-2018-03-03-at-7.29.18-AM.png

Real estate price increases and low personal savings rate for U.K. Millennials have been mostly fueled by low-interest rates, set by the Bank of England (BoE). Some ten years ago, the BoE decided to juice the economy by suppressing UK lending rates to a zero lower bound with cheap money after the 2008 crisis:

https://stockboardasset.com/wp-content/uploads/2018/03/Screen-Shot-2018-03-03-at-7.32.35-AM.png

“In our society, it seems acceptable for people to wield their power over the vulnerable in order to get what they want, no questions asked,” explains Ellen Moran of Acorn, a tenants union and anti-poverty group.

“That power is entrenched and such actions are ignored by law enforcers. Sometimes, though, this happens because people are alienated in their society to such an extent that they crave physical affection without knowing considerate ways to get it. Sometimes it is a mixture of those two things,” she added.

Unfortunately, the ‘Rent For Sex’ issue in the United Kingdom will only get worse as the economic prospects continue to deteriorate for the Millennial generation. There is no end in sight for this madness, and it will only be a matter of time before this trend washes up on the shores of the United States. It seems as failed Central Bank policy has given landlords one new perk to owning real estate: sex with millennials.

Source: ZeroHedge

BOOM: 848 Square Foot Sunnyvale CA Home Shatters Record With $2M Price Tag…

https://www.mercurynews.com/wp-content/uploads/2018/02/sjm-l-sunnyvale-0301-1.jpg?w=810This home on Plymouth Drive in Sunnyvale, Calif. recently set the highest price per square foot ever recorded by the Multiple Listing Service. The two bedroom, two bath home – 848 square feet in size – sold in two days for $2 million. It had been listed for $1.45 million. That means it sold for $2,358 per square foot, which is the highest price per square foot in Sunnyvale recorded by MLS Listings which has data going back to Jan. 1, 2000.

SUNNYVALE — The small, unassuming home in the Cherry Chase neighborhood was on the market just two days before it sold for $2 million, a whopping $550,000 over its asking price.]

In this red-hot real estate market, the price tag barely caused a stir. What did was the other number that turned the home into another Bay Area record-breaker: It sold for the highest square-foot price recorded in Sunnyvale — a stunning $2,358, according to MLSListings, which tracks homes sales going back to 2000.

The jaw-dropping price tag suggests Sunnyvale, which has traditionally been less expensive than neighboring cities Cupertino or Palo Alto, is becoming a real estate destination in itself.

“I was blown away by it,” Doug Larson of Coldwell Banker, the real estate agent who sold the home, said of the price it fetched.

There’s nothing particularly breathtaking about the modest, one-story house on quiet, tree-lined Plymouth Drive. But it sits nestled at the center of one of the country’s most expensive real estate markets. As prices continue to increase throughout the Bay Area, pushing out even some highly paid tech workers, experts say more residents are flocking to relatively affordable Sunnyvale, driving up prices there.

“It’s become the new hot market,” said Jim Harrison, president and CEO of MLSListings.

Homes in Sunnyvale sold for a median price of $1.57 million in January, according to Zillow. That’s affordable compared to neighboring Cupertino, with a median sale price of $2.2 million, or Palo Alto, with a median price of $3 million.

But it may not stay that way for long. So far this year, homes in Sunnyvale are selling for an average of 28 percent over their listed price and are spending just nine days on the market, Harrison said. A four-bedroom, two-bath, 2,000 square foot house in the city recently sold for close to $800,000 over its listing price, fetching $2.47 million.

The Plymouth Drive house is small by comparison, just 848 square feet, which contributed to its high per-square-foot price. But it’s on a large lot — 6,000 square feet. That makes it a prime candidate for the new owner to tear it down and build something else, Harrison said.

Realtor Juliana Lee of Keller Williams, who represents the buyer of the Plymouth Drive home, declined to comment on behalf of herself and her client.

Listing photos of the home show a small, beige house with a huge backyard, hardwood floors and a large front window with white shutters. Before the sale, the most expensive per-square-foot price recorded in Sunnyvale was $2,175, according to MLSListings. That was for a 1,839-square-foot, two-bedroom home on a 36,155 square foot lot, which sold for $4 million.

Sunnyvale has become popular in part because of its proximity to Silicon Valley’s tech jobs, said realtor James Morris of James Morris Homes, which has offices in San Jose and Saratoga. LinkedIn is headquartered in the city, Apple is just next door in Cupertino, and Google is on the other side in Mountain View.

Millennials don’t want to endure long commutes on the Bay Area’s clogged freeways, Morris said.

“They will pay that premium to be close to their jobs and not have to drive,” he said.

When Larson put the Plymouth Drive house on the market on Feb. 7, he asked for $1.45 million and assumed his client would get about $1.6 million. The next day, he opened the house for a realtor tour so the community’s agents could check out the property and determine if it was something their clients might want. It generated a lot of interest, Larson said, with some agents indicating they had buyers willing to offer as much as $1.8 million.

Friday morning, a realtor called Larson and told him she was sending over an offer. Larson told her his client wasn’t accepting offers until the following Wednesday, but the persistent realtor refused to take no for an answer and sent her client’s offer that afternoon.

It was too tempting to pass up — $2 million, all cash, closing in 10 days. The seller was shocked.

“She said, ‘What?’” Larson said. “She was as taken aback as I was.”

https://www.mercurynews.com/wp-content/uploads/2018/02/sjm-l-sunnyvale-0301-2.jpg?w=810

https://www.mercurynews.com/wp-content/uploads/2018/02/sjm-l-sunnyvale-0301-11.jpg?w=810

Pictured is a view of the kitchen inside a home on Plymouth Drive in Sunnyvale, Calif. which recently set the highest price per square foot ever recorded by the Multiple Listing Service. The two bedroom, two bath home - 848 square feet in size - sold in two days for $2 million. It had been listed for $1.45 million. That means it sold for $2,358 per square foot, which is the highest price per square foot in Sunnyvale recorded by MLS Listings which has data going back to Jan. 1, 2000. (Courtesy Michael Silver)

Pictured is a view of the kitchen inside a home on Plymouth Drive in Sunnyvale, Calif. which recently set the highest price per square foot ever recorded by the Multiple Listing Service. The two bedroom, two bath home - 848 square feet in size - sold in two days for $2 million. It had been listed for $1.45 million. That means it sold for $2,358 per square foot, which is the highest price per square foot in Sunnyvale recorded by MLS Listings which has data going back to Jan. 1, 2000. (Courtesy Michael Silver)

Pictured is a view of the kitchen, looking out toward the back yard and patio of a home on Plymouth Drive in Sunnyvale, Calif. which recently set the highest price per square foot ever recorded by the Multiple Listing Service. The two bedroom, two bath home - 848 square feet in size - sold in two days for $2 million. It had been listed for $1.45 million. That means it sold for $2,358 per square foot, which is the highest price per square foot in Sunnyvale recorded by MLS Listings which has data going back to Jan. 1, 2000. (Courtesy Michael Silver)

Pictured is the livingroom of the home on Plymouth Drive in Sunnyvale, Calif. which recently set the highest price per square foot ever recorded by the Multiple Listing Service. The two bedroom, two bath home - 848 square feet in size - sold in two days for $2 million. It had been listed for $1.45 million. That means it sold for $2,358 per square foot, which is the highest price per square foot in Sunnyvale recorded by MLS Listings which has data going back to Jan. 1, 2000. (Courtesy Michael Silver)

Source: The Mercury News

Existing Home Sales Extend Plunge, Biggest Annual Drop Since 2014

After new- and existing-home sales tumbled in December, expectations were for a modest 0.5% rebound in January (despite plunging mortgage applications and soaring rates). But that did not happen as existing home sales tumbled 3.2% MoM to its lowest level since Aug 2016.

https://www.zerohedge.com/sites/default/files/inline-images/2018-02-21_7-02-30.jpg?itok=nohBLCql

NOTE – this data is based on signed contracts from Nov/DEC, which means the recent spike in rates is not even hitting this yet)

Existing home sales are down 4.8% YoY – the biggest drop since August 2014.

https://www.zerohedge.com/sites/default/files/inline-images/2018-02-21_7-12-57.jpg?itok=qlkJcTOR

The West (-5.0%) and Midwest (-6.0%) saw the biggest drop in sales and while the blame (see below) was put on inventories, data shows a 4.1% increase in “available for sale” homes?

Of course NAR is careful to blame inventories – and not soaring rates affecting affordability: Lawrence Yun, NAR chief economist, says January’s retreat in closings highlights the housing market’s glaring inventory shortage to start 2018.

“The utter lack of sufficient housing supply and its influence on higher home prices muted overall sales activity in much of the U.S. last month,” he said.

“While the good news is that Realtors® in most areas are saying buyer traffic is even stronger than the beginning of last year, sales failed to follow course and far lagged last January’s pace.

“It’s very clear that too many markets right now are becoming less affordable and desperately need more new listings to calm the speedy price growth.”

The median existing-home price in January was $240,500, up 5.8% from January 2017.

First-time buyers were 29 percent of sales in January, which is down from 32 percent in December 2017 and 33 percent a year ago.

“The gradual uptick in wages over the last few months is a promising development for the housing market, but there’s risk these income gains could be offset by the recent jump in mortgage rates,” said Yun.

“That is why the pace of added new and existing supply in the months ahead is worth monitoring. If inventory conditions can improve enough to cool the swift price growth in several markets, most prospective buyers should be able to absorb the higher borrowing costs.

So, will higher rates break housing market momentum?

The following chart suggest ‘yes’ – that surge in rates will have a direct impact on home sales (or prices will be forced to adjust lower) as affordability collapses…

https://www.zerohedge.com/sites/default/files/inline-images/2018-02-08_8-20-26.jpg

Source: ZeroHedge

Rents Increase In 89% Of Largest US Cities

The number of US renters is growing much more rapidly than the number of homeowners, so it shouldn’t come as a surprise that rents in the vast majority of American cities climbed again last month – continuing a trend that has largely persisted since the financial crisis, according to data compiled by RentCafe, a website that provides rental listings nationwide. RentCafe occasionally analyzes the reams of data it collects to provide insightful clues about the US housing market. And as markets puked following a robust headline increase in average hourly earnings – one of the first signs that stagnant consumer prices might once again rise – RC’s latest report shows that the national average rent was $1,361, 2.8% higher than this time last year, but flat on a monthly basis.

Nearly 90% of the nation’s biggest cities have seen rents grow in January; in 9% of cities rents remained unchanged, while only 2% experienced price declines…

Contrary to the conventional wisdom, it was actually America’s smaller cities that saw the greatest increases (to be sure, that’s probably because markets like San Francisco are already well past the boundaries of what typical middle-class workers can afford). These markets include Gilbert, AZ rose 8.5%, Roseville, CA (8.5%), and Fort Collins, CO (7.9%) breaking the top 10.

Meanwhile, in a sign that some of the hottest housing markets in the country are starting to buckle under the weight of over development, RC found that the only major market where rents dropped year-over-year was Brooklyn, where rents decreased by 14%.

Read RentCafe’s entire report below:

The price of apartments has gone up in 89% of the nation’s 250 largest cities in January 2018, as demand for rentals remains elevated throughout the country, sustained by an improving economy and low unemployment. Renters continue to embrace apartment life, as rent prices are increasing at a strong and steady annual rate of 2.8%, nationwide, reaching $1,361/month in January 2018.

The price of two-bedroom units is increasing the fastest

One and two-bedroom apartments remain the most in-demand apartment sizes in the U.S. The price of two-bedroom rentals has climbed the most over the year, with a 3.5% increase in rates, exceeding $1,400/month on average, while the price for one-bedroom units has increased by 3.4%, renting for $1,225/month on average in January. The slowest growing apartment type in January were studio apartments, renting for 2.5% more than this time last year.

https://www.zerohedge.com/sites/default/files/inline-images/2018.02.02rcchartone.JPG

Rents in 6 cities, including Brooklyn, NY, continue to slide

In only six cities out of the 250 studied are rents cheaper than they were one year ago. With a large new inventory of apartments to fill, the rental market in Lubbock, TX has seen the biggest drop in prices year over year, -6.3%, with an average apartment now renting for less than $900/month. Norman, OK is also seeing a slight decrease in the average rent (-2.3%), as a result of thousands of new apartments hitting the market in just the past few years, with an average rent of $861/month as of January 2018.

Diminished demand for housing has affected prices in McAllen, TX, which have declined by -2.2% year-over-year. Rents in Kansas City, KS and Baton Rouge, LA are also sliding slightly this month, by less than 2%. The only large market to see a decrease in rents is Brooklyn, NY, which had wrapped up last year -1.7% below the previous year’s levels, maintaining the downward direction in January as well, with rents down by -1.1% year over year.

U.S. Cities Where Rents Decreased Y-o-Y in January 2018

https://www.zerohedge.com/sites/default/files/inline-images/2018.02.02rccharttwo.JPG

Three new cities break the top 10 with greatest rent increases

At the beginning of the year, we have three new cities entering the top 10 for fastest growing rents in the U.S. Fueled by increasing demand, Gilbert, AZ (8.5%), Roseville, CA (8.5%) and Fort Collins, CO (7.9%) saw big rent bumps over the past year. Rental prices in Gilbert, AZ are rising fast, clocking in at $1,156/month in January, as its population has been growing at extremely high rates, demand for housing has skyrocketed, and a big portion of the Gilbert population is renting.

Sacramento Metropolitan Area’s City of Roseville is joining Sacramento — where apartment prices have been on a steep climb for a while now — as one of the top 10 cities in the country with the fastest rising rents. The price of apartments in Roseville, CA has jumped by as much as 8.5% year-over-year, with the average rent currently exceeding $1,600/month. Fort Collins, CO has also become one of the country’s fastest growing rental markets, with residents and Colorado State students competing for a limited number of rental apartments. Rates are up almost 8% from the same time last year, a Fort Collins rental apartment costing on average $1,436/month at the moment.

Oil centers Odessa and Midland, TX are still at the top of the list with the highest rent rebounds over the year, 35% and 31.4% respectively. Buffalo, NY (12.1%) and Lancaster, CA (10.2%) also struggling with double-digit price hikes year-over-year.

U.S. Cities with the Fastest Growing Rents in January 2018:

https://www.zerohedge.com/sites/default/files/inline-images/2018.02.02chartthree.JPG

The most expensive California rents push the limits again in January

The priciest cities for renters remain big urban job centers on both coasts, with Manhattan, NY at the top of the list with an average apartment rent of $4,079, unchanged from the previous month and down slightly by -1% over the year.

If renters living in The Golden State where hoping for a respite from high rents in the new year, they’re not getting it yet. Prices went up again in January in all 5 California cities in the top 10 most expensive for renters, with the highest rates in the state being in San Francisco, $3,448/month. Jersey City apartments, the sixth most expensive in the U.S., also saw increased rates this month, reaching $2,855.

Wichita, KS, Tulsa, OK, and Toledo, OH remain the country’s top 3 most affordable cities for renters, alongside 7 other Midwestern and Texan towns where average rents do not exceed $730/month, a fraction of the prices in coastal cities. In fact, things have been quiet in these parts of the country, as rents remained flat or grew slower than the national average in 9 out of 10 cities. Fort Wayne, IN was the only one to see a significant jump in prices for the year, 4.5%

https://www.zerohedge.com/sites/default/files/inline-images/2018.02.02chartfour.JPG

At the start of the new year, rents are expected to continue rising throughout the country slightly above inflation, as demand for apartments remains strong from all generations of renters. Doug Ressler, senior analyst at Yardi Matrix, offered his opinion as to what renters can expect as we begin a new year:

You can find the average rent in your city at RentCafe.

Source: ZeroHedge

U.S. Cities with the Most Magnificent Housing Bubbles

But some flat spots are showing up!

Just after Wolf Richter reported on the minuscule 1.4% year-over-year growth of per-capita “real” disposable income and the lowest saving rate in 12 years — for the lucky ones — there’s another asset-bubble doozie: The S&P CoreLogic Case-Shiller National Home Price Index for November, released this morning, rose 6.2% year-over-year (not-seasonally-adjusted). The index has now surpassed by 6.1% what was afterwards called the crazy peak of Housing Bubble 1 in July 2006 and is up 46% from the bottom of Housing Bust 1:

https://wolfstreet.com/wp-content/uploads/2018/01/US-Housing-Case-Shiller-National-Index-2018-01-30.png

Real estate prices are a result of local dynamics but are also impacted by national and global factors, including monetary policies and foreign non-resident investors trying to get their money out of harm’s way. This causes local housing bubbles, operating on their own schedules. When enough of them occur simultaneously, it becomes a national housing bubble. See chart above.

The Case-Shiller Index is based on a rolling three-month average; today’s release was for September, October, and November data. Instead of median prices, the index uses “home price sales pairs,” for example for a house that sold in 2010 and then again in 2017. The index provider incorporates other factors and uses algorithms to adjust the price movement into an index data point. The index was set at 100 for January 2000. An index value of 200 means prices as figured by the algorithm have doubled since then.

Here are the most magnificent leaders among the housing bubbles in major metro areas:

Boston:

The index for the Boston metro area edged down again on a monthly basis, the second decline in a row after 22 months in a row of increases. It has essentially been flat for four months but is still up 6.3% year-over-year. The slight monthly decline could be within the normal seasonal variations but there were no seasonal variations during the relentless surge in 2016 and 2015. During Housing Bubble 1, from January 2000 to October 2005, the index for Boston soared 82% before plunging. The index now exceeds the peak of Housing Bubble 1 by 12.5%:

https://wolfstreet.com/wp-content/uploads/2018/01/US-Housing-Case-Shiller-Boston-2018-01-30.png

Seattle:

The Case-Shiller home price index for the Seattle metro ticked up a smidgen on a month-to-month basis, after the first two back-to-back declines since the end of 2014! It has now been flat for the past five months. However, flat spots or slight declines in the index this time of the year were not unusual before 2015. The index is up 12.7% year-over-year, 20% from the peak of Housing Bubble 1 (July 2007), and 79% from the bottom of Housing Bust 1 in February 2011:

https://wolfstreet.com/wp-content/uploads/2018/01/US-Housing-Case-Shiller-Seattle-2018-01-30.png

Denver:

The index for the Denver metro ticked up again on a monthly basis, the 25th increase in a row. It is up 7.0% year-over-year and has surged 45% above the prior peak in July 2006. Instead of the craziness of Housing Bubble 1, Denver experienced more “normal” home-price increases, and was therefore also spared the ravages of Housing Bust 1. But in 2012, Housing Bubble 2 erupted in full force:

https://wolfstreet.com/wp-content/uploads/2018/01/US-Housing-Case-Shiller-Dener-2018-01-30.png

Dallas-Fort Worth:

The index for the Dallas-Fort Worth metro ticked up again on a monthly basis — the 46th month in a row of increases. It is up 7.0% year-over-year and 43% from the prior peak in June 2007. Like Denver, Dallas experienced saner times during Housing Bubble 1. But prices began to surge relentlessly in 2012:

https://wolfstreet.com/wp-content/uploads/2018/01/US-Housing-Case-Shiller-dallas-2018-01-30.png

Atlanta:

The home price index for the Atlanta metro has now been flat (actually down a tiny bit) for three months in a row, in line with prior seasonal declines, but is still up 5.2% year-over-year and 2.6% above the peak of Housing Bubble 1 in July 2007. From that peak, the index plunged 37%. It’s now up 70% since February 2012:

https://wolfstreet.com/wp-content/uploads/2018/01/US-Housing-Case-Shiller-Atlanta-2018-01-30.png

Portland:

The Case-Shiller index for Portland was flat in November, and has now been flat or slightly down for five months in a row, and for now still in the range of normal seasonal patterns. The index is up 6.9% year-over-year and has skyrocketed 73% in five years. It’s 20% above the crazy peak of Housing Bubble 1 and has ballooned 123% since 2000:

https://wolfstreet.com/wp-content/uploads/2018/01/US-Housing-Case-Shiller-Portland-2018-01-30.png

San Francisco Bay Area:

The index for “San Francisco” covers the county of San Francisco plus four other Bay Area counties — Alameda, Contra Costa, Marin, and San Mateo (the northern part of Silicon Valley). It jumped 1.4% for the month, after jumping 1.2% in the prior month. It’s up 9.1% year-over-year, up 31.3% from the insane peak of Housing Bubble 1, and up 85% from the end of Housing Bust 1. The index has surged 151% since 2000:

https://wolfstreet.com/wp-content/uploads/2018/01/US-Housing-Case-Shiller-San-Francisco-Bay-Area-2018-01-30.png

Los Angeles:

Home prices in the Los Angeles metro, as tracked by the index, rose 0.7% for the month, and 7.0% year-over-year. LA’s Housing Bubble 1 was in a category of its own in its steepness on both sides, with home prices skyrocketing 174% from January 2000 to July 2006, before collapsing and surrendering much of the gains. The index has skyrocketed since Housing Bust 1 and is now within a smidgen of the prior insane peak:

https://wolfstreet.com/wp-content/uploads/2018/01/US-Housing-Case-Shiller-Los-Angeles-2018-01-30.png

New York City Condos:

Case-Shiller has a special index for New York City’s condo because this is such a vast market. And this index rose another notch in November and is up 4.4% year-over-year. The index soared 131% from 2000 to February 2006 during Housing Bubble 1, barely deflated during the bust before QE unleashed money from around the world which then re-floated Wall Street more than anything else. The index is 18% above the peak of Condo Bubble 1 and has nearly tripled over the past 17 years:

https://wolfstreet.com/wp-content/uploads/2018/01/US-Housing-Case-Shiller-New-York-condos-2018-01-30.png

This is asset-price inflation at work — now that “homes” have become a global asset class. These homes didn’t get 50% bigger or 50% nicer over the past few years. Instead the purchasing power of the dollar with regards to these assets has been purposefully demolished by the Fed’s monetary policies that resulted in practically no wage inflation, moderate consumer price inflation, but massive asset-price inflation. Asset-price inflation without corresponding wage inflation means that the value of labor (wages earned) with regards to homes and other assets has been crushed — a phenomenon now hypocritically called the “affordability crisis” in many big urban areas in the US.

Source: By Wolf Richter | Wolf Street

What Low Inventory Means For The Housing Market

The housing market continues to operate in a very lean environment.  Home builders are building but are focusing their efforts on multi-family units to cater to a growing renting population.  Builders are also shy about placing big bets given the recent memory of the previous housing bubble.  Places where they can build freely like Arizona, Nevada, and Florida are known to pop as quickly as they go up in value.  And in areas like California, where NIMBYism rules the day, people are now convinced that prices will never go down so the ratio of bulls to bears is extremely high.  The sentiment seems to be that there could be no wrong in purchasing real estate even if it means leveraging up into a crap shack.  Yet what is very telling is that inventory is still very low after many years.

Bouncing at the bottom

Inventory has been bouncing near the lows for almost six years now:

https://i0.wp.com/www.doctorhousingbubble.com/wp-content/uploads/2018/01/nationwide-inventory-and-la.png

Nationwide inventory is down 10 percent year-over-year from an already low year.

In Los Angeles, inventory is down 22 percent year-over-year from an already low year.

What this means for house buyers is that you are going to encounter slim pickings, house lusting shoppers, and a market sentiment favoring sellers.  If you are buying, you are not in the driver’s seat.  If you are selling, you can command top dollar even for a shanty crap shack.

One thing that has changed since the late 1990s is that we now seem to live in a perpetual boom and bust cycle.  Housing being a safe investment that tracks inflation is no longer the case.  Real estate is now like a hot stock with big leverage behind it.  When things are good, it can be very good.  When things go bad, they can turn quickly.  And for most people, the challenge in the last housing bust was simply making the mortgage payment.  Recessions tend to expose those who are over leveraged in debt.

People seem to think this hot market is because of the current administration which is hard to believe.  Timothy Geithner set the markets on fire in 2009 with QE:

https://i0.wp.com/www.doctorhousingbubble.com/wp-content/uploads/2018/01/All-About-the-QE-5.jpg

Quantitative Easing essentially reversed the market and we have yet to look back since 2009.  But this happened nearly a decade ago which is hard to believe.  Yet to think all of this euphoria is happening because of current policy is incorrect.  And clearly anyone in power is going to leverage positive factors to their side, regardless of party affiliation.  But one things is clear and that is things are looking frothy across multiple asset classes.

The housing market is deep into a FOMO stage.  There is a deep seated fear now that people will miss out:  That $700,000 crap shack will be $1 million.  Bitcoin will be $30,000.  The Dow will hit 30,000.  Everything seems to be going up yet the homeownership rate is stagnant and housing inventory is in the dumps.

The continued drought in inventory means that people will be bidding up crap shacks.  The typical home in the US costs $206,000.  The typical L.A. home is $632,000.  It’ll be interesting to see how much more this market can sustain because the bull fever is definitely out:

https://i0.wp.com/www.doctorhousingbubble.com/wp-content/uploads/2018/01/EconomicGreenfield-1-8-18-VIX-daily-vs-SPX-since-2003.png

The VIX Index shows near record low volatility meaning people expect the party to go on forever. The index nearly looks as low as housing inventory.

Source: Dr. Housing Bubble

US Home Prices Surge Most Since 2014

For the 29th month in a row, US home prices rose at a faster pace than incomes with November prices rising a better than expected 6.41% – the highest since July 2014.

The 20-City Composite rose 6.41% YoY in November (above the 6.30% expectations)

https://www.zerohedge.com/sites/default/files/inline-images/20180130_CS.jpg

The 20-City Composite price index is within 1% of its record highs from 2006…

https://www.zerohedge.com/sites/default/files/inline-images/20180130_CS1.jpg

“Top”? or “Breakout”?

Source: ZeroHedge


“Micro-Homes” Sprout Up All Over Bay Area To House The Growing Homeless Population

Roughly one year ago we shared the plans of a billionaire real estate developer in San Francisco who wanted to build communities for the homeless in Bay Area neighborhoods using stackable steel shipping containers (see: San Fran Billionaire Luanches Plan To House Homeless In Shipping Containers).  Not surprisingly, the efforts were met with some resistance from the liberal elites of Santa Clara who, despite their vocal support of any number of federal subsidy programs for low-income families, would prefer that those low-income families, and their subsidies, stay far away from their posh, suburban, “safe places.”

Alas, as the San Francisco Chronicle points out today, like it or not, the boom in “micro-houses” is just getting started in the Bay Area with nearly 1,000 tiny homes, with less than 200 square feet of living space, currently being planned in San Francisco, San Jose, Richmond, Berkeley, Oakland and Santa Rosa.

Planners say that’s just the beginning. “We’re very excited about micro-homes,” said Lavonna Martin, director of Contra Costa County’s homeless programs. “They could be a big help. They have a lot of promise, and our county is happy to be on the cutting edge of this one. We’re ready.”

Contra Costa has a $750,000 federal homelessness grant to pay for 50 stackable micro-units of supportive housing, and Richmond Mayor Tom Butt would like to see them in his city. Developer Patrick Kennedy brought a prototype of his MicroPad unit to Richmond in November, and county and city leaders say they are leaning toward choosing it.

“They’re very fine, and they make a nice-looking building,” Butt said. “They’d be good for anybody looking for housing.”

The beauty of the tiny units is that they can be built in a fraction of the time it takes to construct typical affordable housing, and at a sliver of the cost, which means a lot of homeless folks can be housed quickly.

The homes have also caught on in San Jose where the City Council just approved $2.4 million to build a village of 40 units to help house the homeless.  Of course, just like in Santa Clara, San Jose residents are lashing out at city officials over plans that they say will only serve to increase neighborhood crime.

San Jose resident Sue Halloway told the council she was afraid putting the village near residences would increase “neighborhood crime, neighborhood blight (and) poor sanitation,” and predicted that it would be “a magnet for more homeless.”

City Councilman Raul Peralez said he understands such concerns, but that “there are no facts surrounding these tiny homes and whatever blight or crime they might bring, because we haven’t done them yet.”

“I tell people you really have two options,” said Peralez, who said he wants the village in his downtown district. “You can allow the homeless to live on the streets, or you can provide not only shelter but services in a confined area — with security. In my mind, that’s a way better option for managing this community in an organized way.”

So, what do the stackable units look like?  As seen in the video below, prototypes from one manufacturer, MicroPad, come complete with full bathrooms and kitchens and have up to 160-180 square feet of living space…

“These micro-homes may seem small at 160 to 180 square feet, but they’re actually pretty spacious when you’re in them,” she said. “And they go up very fast.”

Kennedy’s MicroPads have showers, beds and kitchens. Individually they resemble shipping containers, but once they’re bolted together with siding and utilities, they look like a regular building.

…which is more or less considered a mansion by struggling New York artist standards.

Source: ZeroHedge

Turmoil Grows Over Prepayment Of Property Taxes

A  matter of immediate importance to many property owners – prepayment of property taxes – is rapidly descending into chaos and unfairness.

https://i0.wp.com/www.zerohedge.com/sites/default/files/images/user3303/imageroot/2017/12/22/20171224_taxes.jpg

Can you prepay property taxes before the end of this year or not? You can for purposes of getting a deduction in 2017 under the new federal tax law, but the problem is whether your county will accept prepayment. It varies by county, which is obviously unfair, and reports are very confusing on what the rules are.

If you own in Cook County, try to prepay your 2017 taxes (due in two halves in 2018) and you’ll find that the county is only set up to allow you to pay 55% of the prior year’s tax. The place to do so is linked here.

But look here and you’ll see suburban McHenry County allows you to prepay a full year’s taxes, apparently, but you have to sign an agreement by Dec. 29. In fact, this article says you can prepay two years worth of taxes. (I don’t know how far out the federal tax code would allow deductibility, however.)

Nearby Kendall County, however, reportedly, is “taking a beating” from irate taxpayers because they can’t accept any prepayments!

Here’s a Daily Herald article discussing disparate rules in a few other suburban counties.

Compare that to Wisconsin. It was easy to prepay a full year based on one county I looked at — Walworth. Bills there came out a couple weeks ago for 2017 taxes due in two installments in 2018, but you could send in a full check anytime.

We’re not alone. “Residents can’t prepay property taxes in Montgomery County in Maryland, but they can in Fairfax and D.C,” according to a Washington Post article linked here. So, Montgomery County just announced a special session to to change its rules. In New Jersey, a state lawmaker is pushing the governor to expedite help to allow early prepayments.

This is important because many, many taxpayers will not be able to deduct property taxes under the new federal tax law after this year, or they will find that of no value because of the big increase in the standard deduction. Either way, prepaying to make them deductible this year will save many taxpayers thousands of dollars.

I’ve marked this article “story developing” because I expect a firestorm to develop over the unfairness of having different rules. Also, most of those rules appear not to be a matter of law but instead just an issue of what procedures various counties happen to have set up. I suspect there will be litigation over whether those different administrative procedures can properly be the basis for very different federal tax liabilities. Maybe Congress or state legislatures will act somehow to impose consistency in how much can be prepaid.

Source: ZeroHedge

What’s Hot: Home Trends in the Pipeline for 2018

Every industry tracks innovations in its field, and housing is no different. As a real estate pro, here are the need-to-know products and services promising to transform homes and your clients’ lifestyles over the next year or so.

https://i0.wp.com/realtormag.realtor.org/sites/realtormag.realtor.org/files/imagecache/400xY/dec17_HD_trends.jpg

The big-picture view on housing trends in 2018 center around integrating technology and creating healthy and connected living environments. That’s why building materials, systems, and products that speak to these concerns are expected to generate greater buzz in the coming year. And with more generations living under the same roof, home-related features that provide an extra pair of hands or calming—even spiritual—influence are also being enthusiastically embraced. Here’s a sampling of coming trends that are important to understand and share with clients.

The Rise of the Tech Guru

https://i0.wp.com/realtormag.realtor.org/sites/realtormag.realtor.org/files/rmo_files/images/2017_dec/DEC17_AC_guru.jpg

Why now: Smart homes are getting smarter, with homeowners increasingly purchasing devices and apps that perform tasks such as opening blinds, operating sprinkler systems, and telling Alexa what food to order. But not all these helpers speak the same language, nor do they always work together harmoniously. “Even plugs and chargers aren’t necessarily universal for different appliances and phones,” says Lisa Cini, senior living designer and author of The Future is Here: Senior Living Reimagined (iUniverse, 2016). Also, with more devices competing for airtime, Wi-Fi systems may not be strong enough to operate throughout a home, which results in dead spots, she says. “What many homeowners need is a skilled tech provider who makes house calls, assesses what’s needed, and makes all the tech devices hum effortlessly at the same time.”

What you should do: More buyers want to see listings updated to take advantage of all technological possibilities from the moment they move in. Add a home technology source to your list of trusted experts. You might even be able to offer a free first visit as a closing gift.

* * *

Smart Glass Adds Privacy, Energy Savings

https://i0.wp.com/realtormag.realtor.org/sites/realtormag.realtor.org/files/rmo_files/images/2017_dec/DEC17_AC_tint.jpg

Why now: As more homes feature bigger and more numerous windows, homeowners will naturally look for ways to pare down the energy costs, lack of privacy, and harmful ultraviolet rays that can accompany them. Next year, glass company Kinestral will begin offering a residential option to their line of windows and skylights. Called Halio, the technology allows users to tint glazing electronically up to 99.9 percent opacity. The company claims this can eliminate the need for blinds, shades, and curtains. “You’ll be able to tell Alexa to tint your windows, which will also provide privacy,” says Craig Henricksen, vice president of product and marketing for Halio. He notes that previously, the commercial version only offered the choice between yellow, brown, or blue casts, but that they’ll now add in an appealing gray tint to the mix. Windows come in a variety of sizes, and contractors can install the cable and low voltage system required to change the tinting. Homeowners can control the tint by voice command through an app, manual operation with switch, or with preset controls. Henricksen says Halio can save homeowners up to 40 percent off their energy bill, and that while the initial cost is around five to six times greater than similar low-E glass, the fact that traditional window treatments won’t be needed means the investment gap narrows.

What you should do: This is an important option to keep in mind if buyers are unsure about big, long runs of windows in a listing. It may make sense to price out options for your particular listing to help home shoppers understand how much it might cost to retrofit the space with such technology.

* * *

Spiritual Gardens That Lift the Soul

https://i0.wp.com/realtormag.realtor.org/sites/realtormag.realtor.org/files/rmo_files/images/2017_dec/DEC17_AC_garden.jpg

Why now: Homeowners have long seen their gardens as a place for quiet reflection, so choosing plants and designs that have a physical tie to spirituality is a natural next move. The trend may have started with Bible gardens, which use any number of the more than 100 plants mentioned in the Christian text to populate a restful repose. “So many are good choices because they are hardy, scented, edible, and can withstand harsh climates and environments,” says F. Nigel Hepper, with the Herbarium at the Royal Botanic Gardens in Kew, England, and author of Illustrative Encyclopedia of Biblical Plants (Inter-Varsity Press, 1992). But people of all faiths, or even those simply drawn to botanical history, can appreciate such spaces. “Around for generations, they feed the body and the soul,” says landscape designer Michael Glassman, who designed such a garden in the shape of a Jewish star as a meditative spot at one of Touro University’s campuses. He filled it with mint, pomegranate trees, sage, and other plants that are mentioned in ancient religious texts. Hepper says labeling and providing detailed context to plantings can transform a miscellaneous, obscure collection into an instructive experience.

What you should do: Find out if your local area has a peace garden that could provide examples of this trend. Homeowners might also find inspiration on the grounds of hospitals and assistance care facilities, which often create healing gardens for patients and family members.

* * *

Kitchens That Do More Than Just Look Pretty

https://i0.wp.com/realtormag.realtor.org/sites/realtormag.realtor.org/files/rmo_files/images/2017_dec/DEC17_AC_kitchen.jpg

Why now: An emphasis on eating fresh, healthy foods may mean more frequent trips to grocery stores and farmers markets, but it could also change the architecture of our kitchens. Portland, Ore.–based designer Robin Rigby Fisher says many of her higher-end clients want a refrigerator-only column to store their fresh foods, installing a freezer or freezer drawer in a separate pantry or auxiliary kitchen. The container-gardening industry is vying for counter space with compact growing kits that often feature self-watering capabilities and grow lights. Fisher is also getting more requests for steam ovens that cook and reheat foods without stripping them of key nutrients, though she notes that these ovens can cost $4,000 and have a steeper learning curve than conventional ones. Homeowners also want to be able to use their kitchen comfortably, which means having different or variable counter heights that work for each member of the family, ample light for safe prepping, easy-to-clean counter tops, and flooring that’s softer underfoot, such as cork.

What you should do: Be able to point out the beneficial elements of appliances and features in your listing, such as the antimicrobial nature of surfaces like quartzite and copper.

* * *

Home Robots to the Rescue

https://i0.wp.com/realtormag.realtor.org/sites/realtormag.realtor.org/files/rmo_files/images/2017_dec/DEC17_AC_robot.jpg

Why now: With lifestyles that seem busier by the day and many families inviting elders who require assistance to live with them, robots that can perform multiple services are gaining in popularity. IRobot’s Braava robots mop and vacuum floors, while Heykuri’s Kuri robot captures short videos of key life moments, including pets’ antics when owners are away. Some robots offer health benefits that mimic real pets, which the U.S. Centers for Disease Control and Prevention says can lower blood pressure and cholesterol, says Cini. She says Hasbro’s Joy for All line of furry robot dogs and cats can provide companionship for the elderly with dementia.

What you should do: Ask buyers about pain points in their current homes that might be mitigated by these new interactive technologies.

* * *

Black Is the New Gray

https://i0.wp.com/realtormag.realtor.org/sites/realtormag.realtor.org/files/rmo_files/images/2017_dec/DEC17_AC_black.jpg

Why now: Palettes change all the time, and some feel the interest in black is a welcome contrast after years of off-whites, grays, and beiges. The hue is coming on strong in every category—appliances, plumbing fixtures, lighting, metal finishes, hardware, and soft goods, according to commercial interior designer Mary Cook of Mary Cook Associates. She appreciates black’s classic, neutral, sophisticated touch and notes it can be a universal mixer. “Black is a welcome accent in any palette,” she says. Marvin Windows and Doors launched its Designer Black line this year, incorporating a hip industrial vibe. Designer Kristie Barnett, owner of the Expert Psychological Stager training company in Nashville, loves how black mullions draw the eye out toward exterior views more efficiently than white windows can. Kohler has released its popular Numi line and Iron Works freestanding bath in black. Even MasterBrand cabinets are available in black stains and paints. For homeowners who prefer to step lightly into the trend, Chicago designer Jessica Lagrange suggests painting a door black.

What you should do: Suggest black accents as an option for sellers looking to update their homes to appear more modern.

* * *

Air Locks Preserve Energy, Increase Security

https://i0.wp.com/realtormag.realtor.org/sites/realtormag.realtor.org/files/rmo_files/images/2017_dec/DEC17_AC_air.jpg

Why now: Incorporating two airtight doors has become a popular way for homeowners to cut energy costs. The double barrier helps keep outside air from entering the main portion of the house and provides a better envelope seal. “We rarely design a house nowadays without one,” says Orren Pickell, president of Orren Pickell Building Group in Northfield, Ill. It’s not just energy homeowners save, though; Pickell says it also supports the trend of more people shopping online. “It keeps packages safer than being left in full view” because delivery services can leave them inside the first door. Homeowners will need a minimum area of five feet squared in order to make this work. Costs vary by project size but it could run homeowners as much as $10,000 to add a small space beyond a front or back door. This usually costs less in new construction or as part of a larger remodeling project, Pickell says.

What you should do: If homeowners are thinking about making changes to their main entryway, be sure to alert them to this trend so they can decide if it makes sense to incorporate it. It may be expensive, but it’s not likely to go out of fashion anytime soon.

* * *

Maximized Side Yards

https://i0.wp.com/realtormag.realtor.org/sites/realtormag.realtor.org/files/rmo_files/images/2017_dec/DEC17_AC_side.jpg

Why now: As a national trend toward smaller lot sizes combines with surging interest in maximizing outdoor space, one area that’s often neglected is the side yard. But designers are beginning to pay attention, transforming these afterthoughts into aesthetically pleasing, functional places that buffer a home from neighbors, says Glassman. He suggests growing plants such as star jasmine, climbing roses, and clematis vertically along the siding or a fence. He has created a pleasant pass-through to a backyard, with meandering walkways flanked by ornamental grasses or honeysuckle. Homeowners who have extra space here might consider adding a small recirculating water feature or a tiny sitting area.

What you should do: Pay special attention to side yards when evaluating a home that’s about to go up on the market. Sellers don’t need to spend much to make this space stand out, and any little thing is better than the feeling that the space has been “thrown away, since real estate is so valuable,” Glassman says.

* * *

Battery Backup Systems Offer Resilience

https://i0.wp.com/realtormag.realtor.org/sites/realtormag.realtor.org/files/rmo_files/images/2017_dec/DEC17_AC_power.jpg

Why now: Any home owner who’s experienced a weather-related disaster, such as hurricanes, forest fires, and torrential downpours, understands the peace of mind that comes from having systems in place to help withstand Mother Nature’s worst punches. One example of this is a battery backup that integrates into a home’s electric system and operates during power outages, says architect Nathan Kipnis of Kipnis Architecture + Planning in Chicago. The backup batteries can store either electricity from the grid or renewable energy generated onsite by solar panels or other means. A key advantage is that the system doesn’t create the noise and pollution you get with an old-school generator, because it doesn’t use natural gas or diesel fuel. While they’re generally more expensive than traditional fossil fuel systems, prices do continue to drop.

What you should do: Understand the difference between a battery backup system and a typical generator, even if you’re not working in an area that sees frequent extreme weather events.

* * *

Missing Middle Housing

https://i0.wp.com/realtormag.realtor.org/sites/realtormag.realtor.org/files/rmo_files/images/2017_dec/DEC17_AC_housing-r.jpg

Why now: Architect Daniel Parolek, principal at Opticos Design in Berkeley, Calif., sees a solution emerging for the mismatch between demand and the housing that’s actually been delivered over the last 20 to 30 years. “Thirty percent of home buyers are single, and their numbers may swell to 75 to 85 percent by 2040, yet 90 percent of available housing is designed for families and located in single-family home neighborhoods,” he says. Parolek says builders must fill in this demand with smaller housing of 600 to 1,200 square feet, usually constructed in styles such as duplexes and cottages communities, and preferably in walkable areas. He cites Holmes Homes’ small townhouses at Daybreak in South Jordan, Utah, as an affordable transit-oriented development that follows missing middle principles.

What you should do: Know where existing missing middle housing may be hiding in your community, so you can help buyers of all ages seeking smaller homes. Also, look for opportunities to invest, either for yourself or your clients, in a type of housing that will likely see more demand than supply in the coming years. 

By Barbara Ballinger | RealtorMag

New Home Sales Smash Expectations: Spike To 10 Year Highs As Average Price Tops $400k For First Time

Following the bounce in exisitng home sales (albeit lower YoY), new home sales ripped back higher in October (up 6.2% vs expectations of a 6.1% drop) following a big downward revision of last month’s manic spike. This is the highest print for new home sales since Nov 2007.

The 6.2% surge is a six standard deviation beat of expectations…

https://i0.wp.com/www.zerohedge.com/sites/default/files/images/user3303/imageroot/2017/11/25/20171127_home2.jpg

September’s 18.9% spike was revised notably lwoer to a 14.2% jump to 685k SAAR…

https://i0.wp.com/www.zerohedge.com/sites/default/files/images/user3303/imageroot/2017/11/25/20171127_home.jpg

This is the highest new home sales SAAR print since Nov 2007… but still has a long way to go back to ‘normal’…

https://i0.wp.com/www.zerohedge.com/sites/default/files/images/user3303/imageroot/2017/11/25/20171127_home1.jpg

And finally, we note that the average new home sales price hit a new record high, above $400K for the first time ever – $400,200.

Source: ZeroHedge

“Granite Islands And Backsplashes”: Even Singlewide Trailers Are No Longer “Affordable”


https://martinhladyniuk.com/wp-content/uploads/2016/06/cutetrailer72.jpg?w=625&zoom=2

Since the early 1900s, millions of Americans have relied on trailers as a source of no-frills, affordable housing.  In fact, roughly 22 million Americans live in trailer parks today, but the industry is hardly the stable source of affordable housing that it used to be…a lesson that 73-year-old Judy Goff of Naples, Florida recently discovered the hard way after Hurricane Irma ripped through her park and destroyed her home, along with roughly 1.8 million others.

As Bloomberg points out, when Goff went to a local LeeCorp dealer lot to replace her $46,000, 1,200 square foot trailer with something of similar size and value, what she found instead was “manufactured homes” stuffed with high-end upgrades like granite counter-tops and vaulted ceilings that rendered them too expensive for her $23,000 per year of income.

Last month, Judy Goff, a 73-year-old hardware store clerk whose double-wide in Naples, Fla., was blown to bits, pulled into a LeeCorp Homes Inc. sales lot and wandered through models with kitchen islands and vaulted ceilings. In the salesman’s office, she got the total price, including a carport, taxes, and removal of her destroyed trailer: $140,000. “I don’t have that kind of money,” said Goff as she stood amid the wreckage of her old home, whose walls and ceiling were stripped away, leaving her leather furniture and a lifetime of possessions to bake in the sun. “That was all I had.”

Goff—who just wants to replace the wrecked 1,200-square-foot trailer that she bought 17 years ago for $46,000, including the cost of land—says she feels boxed in. Her mobile-home community won’t allow single-wide homes or older used models as replacements. And every home must have a carport. She’s willing to give up such upgrades as the higher-end countertops, but that probably won’t be enough. Between her Social Security check and income from her job at Ace Hardware Corp., she earns only about $23,000 a year. “I just want a home that’s equal to what I had,” she says. “My home was a beauty.”

“I get that higher-end countertops and kitchen islands are where the better margins are, but that’s also going to put homes out of reach for a lot of buyers,” says Doug Ryan, director of affordable homeownership at the Washington nonprofit Prosperity Now. “The storm is revealing a whole lot of problems in the low-cost housing market.”

https://i0.wp.com/www.zerohedge.com/sites/default/files/images/user230519/imageroot/2017/11/21/2017.11.21%20-%20Trailer.JPG

Meanwhile, as we note frequently, while the cost of manufactured homes has surged, the pay for the bottom fifth of American wage earners has been somewhat stagnant for nearly two decades now. Even after a modest uptick recently, the bottom 20% of households have seen their income fall 9% since 2000, in real terms.

But, as low-income households have found it increasingly difficult to rebuild after devastating hurricanes, the surge in manufacturing home pricing has been a boon for billionaire Warren Buffett who made a big financial bet on the largest manufactured housing builder, Clayton Homes, back in 2003.

The industry, led by Warren Buffett’s Clayton Homes Inc., is peddling such pricey interior-designer touches as breakfast bars and his-and-her bathroom sinks. These extras, plus manufacturers’ increased costs for labor and materials, have pushed average prices for new double-wides up more than 20 percent in five years, putting them out of reach for many of the newly homeless.

Phil Lee, the 74-year-old founder of LeeCorp, has been riding a wave of retiring baby boomers who want affordable luxury. Driving a reporter in his black BMW SUV through Bayside Estates in Fort Myers Beach, where many of the fanciest homes he sells are installed, Lee points out units with pitched roofs that look almost indistinguishable from conventional homes, facing canals with boats tied outside. Their owners, former dentists, doctors, executives, and others, spent upwards of $150,000 to buy aging units just to clear the way for something more luxurious. On a palm-lined street flanked by ranks of 1970s-era trailers, Lee sees profit. “There’s no end to replacing these homes,” he says. “You get a hurricane in there and it really accelerates things.”

Terms such as “mobile home” or “trailer” are now verboten in an industry striving to break free of its downscale origins. Buffett’s Clayton Homes, which produces almost half of all new manufactured housing in the U.S. and competes with such companies as Cavco Industries Inc. and Champion Home Builders Inc., still builds lower-priced units, but there’s barely a sign of them on its website, which is mostly devoted to high-price models. The 2,000-square-foot Bordeaux features a separate tub and shower, a computer station, and a mud room, with prices starting at $121,000 and ranging as high as $238,000, not including delivery and installation costs. Clayton declined to comment.

https://i0.wp.com/www.zerohedge.com/sites/default/files/images/user230519/imageroot/2017/11/21/2017.11.21%20-%20Trailer%202.JPG

Of course, while mobile homes are becoming increasingly cost-prohibitive for low-income families in Florida and Texas, Silicon Valley’s future tech billionaires can’t seem to get enough of them.

Source: ZeroHedge

Beware The Marginal Buyer, Borrower, And Renter


Bubbles always look unstoppable, yet they always burst.

When times are good, the impact of the marginal buyer, borrower and renter on the market is often overlooked. By “marginal” I mean buyers, borrowers and renters who have to stretch their finances to the maximum to afford the purchase, loan or rent.

In bubble manias, buyers of real estate reckon the potential appreciation gains are worth the risk of buying a house they really can’t afford with the intention of flipping the home for a profit.

Workers moving to high-rent cities reckon they’ll either make more money going forward or find a cheaper flat later, so they pony up the high rent.

When there’s steady overtime or generous tips adding to the household income, buying a new car or getting a new auto lease looks do-able.

It’s difficult to assess how many recent buyers, borrowers and renters are marginal, but given the stagnation in household incomes and rising debt loads, it seems reasonable to guess that a substantial number of recent buyers, borrowers and renters are one lay-off or one missed bonus or one unexpected expense away from being unable to pay their mortgage, loan payment or rent.

On the surface, home and auto sales and the rental market all look robust because there’s no differentiation in sales data between people paying cash, qualified buyers/renters and marginal buyers/renters for whom every month is a stretch.

There have been times in my life when I was down to my last $100, and if things don’t turn up very quickly and in a sustained fashion when finances are that fragile, then payments will be missed at the first unexpected drop in income or first unexpected expense. Budget-killers include medical emergency, illness/lost work time, major car repairs and a host of other everyday risks.

There’s another layer of recent buyers who don’t feel they’re marginal–but their financial stability is more contingent than they realize. Their employment seems solid, but their employers sales and profits are more contingent and fragile than they realize.

When good times reverse to bad times, every enterprise with marginal sales takes a hit, and layoffs follow as night follows day. When times are good, layoffs are not even on the horizon. But when the economic tides recede, skittish, hollowed-out, and/or debt-burdened employers push the layoff button sooner rather than later because their own financial structure is so fragile.

Those laid off assume they will find another job quickly because in good times, there appears to be a labor shortage. But when the tide ebbs, the job offers dry up seemingly overnight.

The Grand Illusion being pushed by central bankers and conventional pundits is that another round of interest rate cuts and quantitative easing (QE) will restart the economy should it falter. This is illusion because it ignores how much of the market is dependent on marginal businesses, buyers, borrowers and renters who will not benefit from QE or a tiny decline in interest rates.

Conventional economists don’t quantify marginal businesses, buyers, borrowers and renters, and so the rapidity of the next drop in the economy will come as a great surprise to them. There is little to no awareness of how many enterprises, buyers, borrowers and renters are hanging on by a slender thread–and how many who reckon their finances are robust are one layoff away from insolvency.

Bubbles always look unstoppable, yet they always burst. The symmetry in this chart of the Case Shiller Housing Index for San Francisco suggests the clock is ticking on markets being propped up by marginal buyers, borrowers and renters:

https://i0.wp.com/www.oftwominds.com/photos2017/SF-Case-Shiller4-17a.png

By Charles Hugh Smith | Of Two Minds

Rental Insecurity: Survey Finds 1 in 5 American Renters Missed a Payment in Past 3 Months

A new survey conducted by ApartmentList.com recently found that Americans, despite historically low unemployment levels and surging stock indices which would both seem to suggest that ‘everything is awesome’, are having a very difficult time making ends meet.  Per the survey, some 20% of renters admit they were unable to make their monthly payments on time at least once over the preceding three months with the results being even worse among minorities and those lacking a college degree.


  • Analyzing data from Apartment List users, we find that nearly one in five renters were unable to pay their rent in full for at least one of the past three months. We estimate that 3.7 million American renters have experienced an eviction.
  • Evictions disproportionately impact the most vulnerable members of our society. Renters without a college education are more than twice as likely to face eviction as those with a four-year degree.
  • Additionally, we find that black households face the highest rates of eviction, even when controlling for education and income. Perhaps most troublingly, households with children are twice as likely to face an eviction threat, regardless of marital status.
  • The impacts of eviction are severe and long-lasting. Evictions are a leading cause of homelessness, and research has tied eviction to poor health outcomes in both adults and children. These effects are persistent, and experiencing an eviction makes it difficult to get back on one’s feet.
  • Performing a metro-level analysis, we find that evictions are most common in metros hit hard by the foreclosure crisis and in those experiencing high rates of poverty. Perhaps counterintuitively, expensive coastal metros have comparatively low rates of eviction, in part because strong job markets with high median wages offset expensive rents in those areas.

As ApartmentList notes, some 3.7 million Americans, of roughly 118 million total renters, have experienced an eviction at some point in their life.  Meanwhile, “rent insecurity” is even more prevalent with nearly 30% of folks making less than $30,000 per year saying they have difficultly making monthly rent payments.

3.7 million Americans have experienced eviction, with rental insecurity affecting nearly one in five.

Our Apartment List estimates show that 3.3 percent of renters have experienced an eviction at some point in the past, and 2.4 percent were evicted from their most recent residence. With an estimated 118 million renters in the U.S. today, we estimate that 3.7 million Americans have been affected by eviction at some point. If we assume that some share respondents fail to report informal evictions, this estimate is most likely understated.

While experiencing eviction is a worst-case scenario with dire effects, a much larger share of renters still struggle with some form of rental insecurity. Our analysis shows that 18 percent of respondents had difficulty paying all or part of their rent within the past three months. The issue is particularly acute for low-income renters, 27.5 percent of whom were recently unable to pay their full rent.

https://i0.wp.com/www.zerohedge.com/sites/default/files/images/user230519/imageroot/2017/10/26/2017.10.26%20-%20Rent%204.JPG

Renters with just a high school diploma are more than three times as likely to have faced an eviction threat in the past year than those with a Bachelor’s degree.

Of those who did not attend college, 4.1 percent cited an eviction as the reason for their last move, compared to just 1.9 percent of those with at least some college education. This trend points to a broader issue of the housing market leaving behind less educated Americans. A recent Apartment List study showed that the gap in homeownership rates between high school and college graduates widened from 1.6 percent in 1980 to 14.9 percent in 2015.

A similar trend holds when broken down by income. Of those earning less than $30,000 per year, 11 percent faced an eviction threat in the past year, and 3.4 percent were evicted from their previous residence. In contrast, for those earning more than $60,000 per year, these figures are 3.1 percent and 1.5 percent, respectively.

https://i0.wp.com/www.zerohedge.com/sites/default/files/images/user230519/imageroot/2017/10/26/2017.10.26%20-%20Rent%205.JPG

Meanwhile, households with children were found to be twice as likely to face an eviction threat, regardless of marital status.

Single parent households are at the highest risk, with 30.1 percent reporting difficulty paying rent within the past three months. However, married couples with children do not fare much better, with 27.2 percent struggling to pay rent. For those without children, the rates are 14.7 percent for single respondents and 13.3 percent of married respondents. Our findings are consistent with previous research showing that, among tenants who appear in eviction court, those with children are significantly more likely to be evicted.

This result points to the fact the child care represents an essential but often overwhelming expense for many families, even those with both parents in the house. Analysis from Care.com shows that average daycare costs for toddlers range from $8,043 to $18,815 per year. Furthermore, one-third of families surveyed reported that childcare costs take up 20 percent or more of their household income.

https://i0.wp.com/www.zerohedge.com/sites/default/files/images/user230519/imageroot/2017/10/26/2017.10.26%20-%20Rent%206.JPG

Not surprisingly, evictions were found to be most prevalent in metro areas where poverty rates are the highest.  

Of the 50 largest metros in the nation, evictions are most prevalent in Memphis, with 6.1 percent of users reporting a prior eviction. Most of the metros with the highest eviction rates are located in the South and Midwest and include Atlanta, Indianapolis and Dallas. We find that the factors most strongly correlated with eviction rates include (1) the rate of foreclosures from 2007 to 2008, during the height of the foreclosure crisis, and (2) current poverty rates.

Memphis, for example, has the highest share of its population living in poverty at 19.4 percent, and it also has the highest eviction rate. In metros with high poverty rates, many households may qualify for assistance through programs such as Section 8, but, unfortunately, only a small share of those eligible for such benefits actually receive them, leaving the majority of low-income households struggling to pay rent.

Las Vegas had the second highest foreclosure rate from 2007 to 2008 at 9.2 percent and now has the sixth-highest eviction rate at 5.5 percent. This correlation suggests that many of the areas hit hardest by the foreclosure crisis have had a difficult time recovering. Despite lower housing costs, renters in these areas — some of whom are likely former owners who had their homes foreclosed upon — face a lack of opportunity that makes it difficult for them to pay their rent.

https://i0.wp.com/www.zerohedge.com/sites/default/files/images/user230519/imageroot/2017/10/26/2017.10.26%20-%20Rent%207.JPG

Of course, with rental rates steadily climbing since the great recession, in spite of stagnant wages, it’s hardly surprising that the Federal Reserve Bank’s controlled “recovery” hasn’t helped all Americans equally.

Source: ZeroHedge


This $1.1 Million Silicon Valley Shack Is A Steal, But There’s A Bizarre Catch

The owner of one tiny, unassuming cottage in Mountain View, California just sold his house for well below the asking price of $1.6 million – but asked the new buyers to agree to one highly unusual condition: They must allow him to continue living there, rent free, for seven years, NBC News reported.

The Silicon Valley property went for $1.1 million after being on the market for only a few weeks, which is surprising, considering the house – little more than a shotgun shack – hardly has room for multiple tenants.

https://i0.wp.com/www.zerohedge.com/sites/default/files/images/user245717/imageroot/2017/10/04/2017.10.14shack.JPG

The property’s realtor said the home’s elderly former owner will continue living in the home for seven more years ‘rent back at no charge.’

Realtor Joban Brown said that while the price is not unusual for the hot spot location, the former owner’s request to continue living at the property is ‘not a typical situation.’

Erika Enos, another realtor, said she’d never heard of this type of a deal during her multi-decade career as a realtor:

‘In almost 40 years as a realtor, I have never seen terms of sale that included seven years free rent back, not even seven months free rent back,’ Enos said.

‘What if the property does not close or the seller is unhappy with the results or work men don’t get paid and put a lien the property?’

‘The asking price reflects market value, which is essentially lot value, for this area … I empathize with the seller, but the terms and conditions for this sale I feel are unrealistic and may have negative legal ramifications.’

The listing for the 976 square-foot cottage also included a requirement for the buyer to pay for the expensive repairs needed.

https://i0.wp.com/www.zerohedge.com/sites/default/files/images/user245717/imageroot/2017/10/04/2017.10.14listings.JPG

However, Mountain View’s status as a well-heeled tech hub – Google’s headquarters is located in the town, and companies including Microsoft and Samsung have offices there – has caused real-estate prices to explode over the past two decades, reflecting similar gains throughout the tech-focused Bay Area.

The realtor in charge of selling the location described it as having “all the conveniences of urban living” but in a secluded setting.

‘This is a location that’s hard to beat, tucked away in a quiet corner at the end of a small street,’ listing agent Daniel Berman said.

‘You’ve got all the conveniences of urban living, nestled in a secluded country-like enclave.’

We wonder: With Silicon Valley home prices soaring well beyond the means of most middle-class families, will we start to see more deals like this one? Already, a startup called Loftium has hit upon a similar concept. The commpany will front you the entire down payment if you just agree to rent out one of the rooms in your new house over Airbnb for a specified period of time.  But there’s a catch … for now Loftium is only available in Seattle.

Source: ZeroHedge

Jerry Brown Forbids Landlords from Cooperating with ICE to Deport Illegal Aliens

https://i0.wp.com/media.breitbart.com/media/2017/09/immigrant-640x480.jpg

California Gov. Jerry Brown signed a pair of new laws Thursday designed to protect illegal alien tenants from being threatened with deportation by making it illegal for landlords to report a tenant’s immigration status to Immigrations Customs Enforcement (ICE).

The bills were part of a package of laws pushed by the Democrat majority and signed by Brown ostensibly to protect illegal aliens from any increased enforcement measures under theTrump administration.

According to the Los Angeles Times,

One proposal by Assemblyman David Chiu (D-San Francisco) would bar landlords from disclosing information about immigration status in order to intimidate, harass or evict tenants without following proper procedures. It also would allow immigrant tenants to file civil claims against their landlords if they do.

Another bill by Assembly Majority Leader Ian Calderon (D-Whittier) would ensure that no state office or entity in California could compel a landlord to obtain and disclose information on a tenant’s immigration status.

The rationale behind the latest package of bills protecting illegal aliens, according to the Sacramento Bee, is fear of enforcement by ICE under President Trump, and fear that unscrupulous landlords might use a tenant’s illegal status to harass, intimidate or abuse them.

Chiu argues that tenants should not have to “live in fear” because they’re immigrants or refugees. He cited the legal uncertainty over young immigrants who were brought to the country illegally but have been educated here and hold down jobs as one of several reasons for the legislation.

“Trump’s escalating war on immigrants is ripping apart families and mass deportations could be our new reality,” Chiu said recently.

“This bill will deter the small minority of landlords who unscrupulously take advantage of the real or perceived immigration status of their tenants to engage in abusive acts.”

With the package of bills signed into law Thursday—including SB54 making California a “Sanctuary State” for criminal aliensCalifornia Democrats have kept their word to put the interests of illegal aliens first, ahead of legal, law-abiding California citizens.

By Assemblyman Tim Donnelly | Breitbart

Clayton Unveils New Tiny Home Design (video)

https://bloximages.chicago2.vip.townnews.com/thedailytimes.com/content/tncms/assets/v3/editorial/e/d7/ed7ca55d-2cb3-5afd-b267-a01ec220a42c/59cd4f257d2af.image.jpg?resize=1200%2C766

Alcoa-based home builder Clayton Homes recently unveiled the newest addition to its tiny homes line. The Saltbox, the company’s second tiny home floor plan designed by Alabama architect Jeffrey Dungan, offers a modernized “lean-to” design that’s geared toward simple, yet stylish, living.

At 452-square feet, the structure features 270-degree views, real oak flooring, white quartz countertops, compact appliances, energy-efficient aluminum clad windows and doors, vertical shiplap wood siding and a covered porch.

“This really is a luxury home,” Jim Greer, Clayton’s tiny home brand manager, told The Daily Times during a private tour of The Saltbox model Thursday at Toqua Campground in Vonore. “A lot of the appliances and things like that are geared more toward the high-end.”

Permanent residence

Not only is The Saltbox larger than most other tiny homes, which are typically 400-square feet or less, Greer said the house is also built to state and local codes, meaning it’s affixed to a permanent foundation.

“A lot of the tiny homes out there are what’s considered a ‘tiny home on wheels’ that can be hooked up to the back of a truck and pulled around, so they’re built to an RV code,” he explained. “But the challenge in all that is where they can be placed. … A lot of people want to put one in a subdivision or on a piece of property and live in it permanently, but most of those really aren’t designed for that.”

The Saltbox, however, can be placed at any location and be lived in year-round.

“These houses go on a permanent foundation,” Greer said. “There’s no steel under the frame or wheels or anything like that. It’s basically the same as the foundation you build for a site-built home.”

While Clayton is experienced in site-built foundations, Greer emphasized that the concept is rather new to the tiny home world.

“We’re trying to be more innovative,” he said. “Plus, it gets around a lot of those planning and zoning challenges a lot of people face.”

Reaching new markets

Both The Saltbox and Low Country, the first design released by Clayton’s Tiny Homes division, are now available for public purchase, with pricing starting in the lower $100,000’s.

Greer said the company is exploring additional tiny home design options, including ones at lower prices.

“We’re looking at ways to fill the market for people who are maybe looking for different price points,” he said. “It’s something new and outside-the-box that we’re working on getting through.”

In fact, Greer said Clayton’s tiny homes line was born out of the company’s commitment to creating new products that target different groups.

“The whole company has a goal to keep trying different things and being innovative, and this is just an example of that,” he said. “We’re beginning to expand our reach and look at new areas.”

The main hope, Greer said, is to provide a solution for people who want to live smaller and simpler.

“That’s kind of where the tiny home movement began,” he said. “A lot of people want to just give up their things and live in a tent.”

By Rachael Totten | The Daily Times

Pending Home Sales Plunge; NAR Admits “The Housing Market Has Essentially Stalled”

After dismal drops in existing and new home sales, this morning’s pending home sales data for August was a disaster, tumbling 2.6% MoM (3.1% YoY) to its lowest SAAR since January 2016.

https://i0.wp.com/www.zerohedge.com/sites/default/files/images/user3303/imageroot/2017/09/23/20170926_pend1.jpg

This is the second YoY decline in sales in a row, with SAAR tumbling to its lowest since Jan 2016…

https://i0.wp.com/www.zerohedge.com/sites/default/files/images/user3303/imageroot/2017/09/23/20170926_pend2.jpg

Lawrence Yun, NAR chief economist, says this summer’s terribly low supply levels have officially drained all of the housing market’s momentum over the past year.

“August was another month of declining contract activity because of the one-two punch of limited listings and home prices rising far above incomes,” he said.

“Demand continues to overwhelm supply in most of the country, and as a result, many would-be buyers from earlier in the year are still in the market for a home, while others have perhaps decided to temporarily postpone their search.”

With little relief expected from the housing shortages that continue to plague several areas, Yun believes the housing market has essentially stalled.

Further complicating any sales improvement in the months ahead is the fact that Hurricane Harvey’s damage to the Houston region contributed to the South’s decline in contract signings in August, and will likely continue to do so in the months ahead. Furthermore, the temporary pause in activity in Florida this month in the wake of Hurricane Irma will slow overall sales even more in the South.

Yun now forecasts existing-home sales to close out the year at around 5.44 million, which comes in slightly below (0.2 percent) the pace set in 2016 (5.45 million). The national median existing-home price this year is expected to increase around 6 percent. In 2016, existing sales increased 3.8 percent and prices rose 5.1 percent.

“The supply and affordability headwinds would have likely held sales growth just a tad above last year, but coupled with the temporary effects from Hurricanes Harvey and Irma, sales in 2017 now appear will fall slightly below last year,” said Yun.

“The good news is that nearly all of the missed closings for the remainder of the year will likely show up in 2018, with existing sales forecast to rise 6.9 percent.”

Of course, none of those fun-durr-mentals matter…

https://i0.wp.com/www.zerohedge.com/sites/default/files/images/user3303/imageroot/2017/09/23/20170926_pend.jpg

Source: ZeroHedge

U.S. Cities With The Biggest Housing Bubbles

This is how monetary policies have crushed the value of labor.

For the good folks who hope fervently that the Fed doesn’t have reasons to raise rates or unwind QE because there isn’t enough inflation, here is an update on one aspect of inflation – asset price inflation, and particularly house price inflation – where the value of your hard-earned dollars has collapsed over a given number of years to where it takes a whole lot more dollars to pay for the same house.

So here are some visuals of amazing house price bubbles, city by city. Bubbles really aren’t hard to recognize, if you want to recognize them. What’s hard to predict accurately is when they will burst. Normally the Fed doesn’t want to acknowledge them. But now it has its eyes focused on them.

The S&P CoreLogic Case-Shiller National Home Price Index for June was released today. It jumped 5.8% year-over-year, not seasonally adjusted, once again outpacing growth in household incomes, as it has done for years. At 192.6, the index has surpassed by 5% the peak in May 2006 of crazy Housing Bubble 1, which everyone called “housing bubble” after it imploded (data via FRED, St. Louis Fed):

https://wolfstreet.com/wp-content/uploads/2017/08/US-Housing-Case-Shiller-National-Index-2017-08-29.png

The Case-Shiller Index is based on a rolling-three month average; today’s release was for April, May, and June data. Instead of median prices, it uses “home price sales pairs,” for example, a house sold in 2011 and then again in 2017. Algorithms adjust this price movement and add other factors. The index was set at 100 for January 2000. An index value of 200 means prices have doubled in the past 17 years, which is what most of the metros in this series have accomplished, or are close to accomplishing.

Real estate is local. Therefore real estate bubbles are local. If enough local bubbles balloon at the same time, it becomes a national housing bubble. As the above chart shows, the US national Housing Bubble 2 now exceeds the crazy levels of Housing Bubble 1, and in all ten major metro areas, home prices are setting new records.

In the Boston metro, the home price index is now 11% above the peak of Housing Bubble 1 (Nov 2005):

https://wolfstreet.com/wp-content/uploads/2017/08/US-Housing-Case-Shiller-Boston-2017-08-29.png

Home prices in the Seattle metro have spiked over the past year, pushing the index 20% above the peak of Housing Bubble 1 (Jul 2007):

https://wolfstreet.com/wp-content/uploads/2017/08/US-Housing-Case-Shiller-Seattle-2017-08-29.png

Then there’s Denver’s very special house price bubble. The index has soared a stunning 43% above the peak of Housing Bubble 1 (Aug 2006):

https://wolfstreet.com/wp-content/uploads/2017/08/US-Housing-Case-Shiller-Dener-2017-08-29.png

People in the Dallas-Fort Worth metro felt left out during Housing Bubble 1, when prices rose only 13% in five years, while folks in other parts of the country were getting rich just sitting there. They also skipped much of the house price crash. But they know how to party when time comes. The index has now surged by 42% from the peak in June 2007:

https://wolfstreet.com/wp-content/uploads/2017/08/US-Housing-Case-Shiller-dallas-2017-08-29.png

The Atlanta metro, where home prices had plunged 36% after Housing Bubble 1, has now finally squeaked past the prior peak by 2%, with a near-perfect V-shaped bubble recovery:

https://wolfstreet.com/wp-content/uploads/2017/08/US-Housing-Case-Shiller-Atlanta-2017-08-29.png

Portland’s home prices have kicked butt since 2012, with the index soaring 71% in five years – not that homes were cheap in Portland in 2012. Portland’s house price bubble is now 20% above the peak of Housing Bubble 1:

https://wolfstreet.com/wp-content/uploads/2017/08/US-Housing-Case-Shiller-Portland-2017-08-29.png

The San Francisco Case-Shiller Index, which covers the five-county Bay Area and not just San Francisco, is now 10% above the insane peak of Housing Bubble 1. During the last housing crash, the index plunged 43%. Eight years of global monetary craziness has sent liquidity from around the world sloshing knee-deep through the streets, which has performed miracles:

https://wolfstreet.com/wp-content/uploads/2017/08/US-Housing-Case-Shiller-San-Francisco-Bay-Area-2017-08-29.png

Los Angeles home prices performed similar feat, doubling from 2002 to July 2006, before giving up two-thirds of those gains, then soaring once again. The index is now 3% above the peak of totally insane Housing Bubble 1:

https://wolfstreet.com/wp-content/uploads/2017/08/US-Housing-Case-Shiller-Los-Angeles-2017-08-29.png

New York City condo bubble never saw the crash in its full bloom. Prices are now 19% above the peak of the prior bubble (Feb. 2006). Over the past 15 years, the index has soared 112%:

https://wolfstreet.com/wp-content/uploads/2017/08/US-Housing-Case-Shiller-New-York-condos-2017-08-29.png

While the monetary policies of the past eight years have had no impact on wage inflation in the US, and only moderate impact on consumer price inflation, they’ve been a rip-roaring success in creating asset price inflation.

Asset price inflation means that the dollar loses its value when it comes to buying assets. Wage earners, when they’re trying to buy assets today – not just homes but any type of asset, including buying into retirement plans – are finding out that their labor is buying only a fraction of the assets that their labor could buy eight years ago. This is how these monetary policies have crushed the value of labor.

By Wolf Richter | Wolf Street


Professional Woman Quits Expensive Rents To Live In A Van

A 31-year-old professional woman has turned her back on expensive rents and property prices – by living full time in a van. With an interior measuring just 13ft 2in long, 5ft 8in wide and 6ft 2in high, Eileah Ohning’s home is her Freightliner Sprinter High Top van. The photographic producer from Columbus, Ohio, has lived in her compact four-wheel home since May 2017. Complete with a memory foam mattress, storage compartments, a desk and a camping stove, she even has plans to add in a shower, toilet and fridge. Eileah parks her van close enough to her workplace that she never needs to worry about the morning commute and showers at her local gym.

Housing Starts Unexpectedly Sink, Multi-Family in Huge 34% Retreat Year-Over-Year

Construction spending for the second quarter is off to a slow start as judged by housing starts. The Econoday consensus was for a 1% rise. Instead, starts declined nearly 5% from the initial June report, now revised lower.

Construction Indicators Slide

Mortgage News Daily reports Construction Indicators Slide, Housing Starts Suffer.

After posting unexpectedly high numbers in June, all three residential construction indicators lost ground in July, and one, housing starts, is now running below its year-ago rate. While the softening is primarily in the multi-family sector, starts have declined in four of the last five months and permits in three of the last four.

The U.S. Census Bureau and the Department of Housing and Urban Development said privately owned housing starts were at a seasonally adjusted annual rate of 1,155,000 units, a 4.8 percent decline from June’s estimate of 1,213,000, which was revised down from 1,215,000. July starts were down 5.6 percent from the 1,223,000-unit annual rate in July 2016.

Starts failed to meet even the lowest predictions of analysts polled by Econoday. Their estimates ranged from 1.174 million to 1.250 million with a consensus of 1.225 million.

Single family starts were at a rate of 856,000, down 0.5 percent from a month earlier but 10.9 percent higher than the same month in 2016. Multifamily starts plunged 17.1 percent to 287,000 units and are down 35.2 percent year-over-year.

The performance of permits was like that of housing starts, down 4.1 percent to a seasonally adjusted annual rate of 1,223,000 units. Permits however held on to an annual increase of 4.1 percent. The June permitting rate was revised higher, from 1,254,000 to 1,275,000.

Analysts had expected permits to decline, with a consensus estimate of 1.246 units. Here again the drop was outside the low end of the range of 1.230 to 1.270 million units.

Authorizations for single-family homes were at a seasonally adjusted rate of 811,000, unchanged from June and 13.0 percent higher on an annual basis. Multi-family permits were 12.1 percent lower than the previous month at 377,000. This was down 11.7 percent year-over-year.

Permits:

https://mishgea.files.wordpress.com/2017/08/residential-construction-2017-08-19c1.png

Starts:

https://mishgea.files.wordpress.com/2017/08/residential-construction-2017-08-19b1.png

Units Under Construction:

https://mishgea.files.wordpress.com/2017/08/residential-construction-2017-08-19a.png

Second-Half Outlook:

Econoday came up with this overall assessment: “Putting all the pieces together: starts are down 5.6 year-on-year in weakness offset by permits which are up 4.1 percent. Permits are the forward looking indication in this report and today’s news, despite July weakness and general volatility in the data, is good. The housing sector, even with starts being soft, looks to be a contributor to the second-half economy.”

While it’s true that it takes a permit to begin construction, a permit does not guarantee construction will start anytime soon. At economic turns, they won’t.

Even assuming those permits turn into starts, the data still does not look to be a contributor to the second-half economy.

The number of permits and starts for multifamily explains what you need to know. 5-unit or more buildings will add more to construction spending numbers than 1-unit buildings. Permits and starts for multifamily structures plunged.

By Mike “Mish” Shedlock

Number Of Homebuyers Putting Less Than 10% Down Soars To 7-Year High

A really long, long time ago, well before most of today’s wall street analysts made it through puberty, the entire international financial system almost collapsed courtesy of a mortgage lending bubble that allowed anyone with a pulse to finance over 100% of a home’s purchase price…with pretty much no questions asked.

And while the millennial titans of high finance today may consider a decade-old case study on mortgage finance to be about as useful as a Mark Twain novel when it comes to underwriting mortgage risk, they may want to considered at least taking a look at the ancient finance scrolls from 2009 before gleefully repeating the sins of their forefathers.

Alas, it may be too late.  As Black Knight Financial Services points out, down payments, the very thing that is supposed to deter rampant housing speculation by forcing buyers to have ‘skin in the game’, are once again disappearing from the mortgage market.  In fact, just in the last 12 months, 1.5 million borrowers have purchased a home with less than 10% down, a 7-year high.

Over the past 12 months, 1.5M borrowers have purchased a home by putting down less than 10 percent, which is close to a seven-year high in low down payment purchase volumes

– The increase is primarily a function of the overall growth in purchase lending, but, after nearly four consecutive years of declines, low down payment loans have ticked upwards in market share over the past 18 months

– Looking back historically, we see that half of all low down payment lending (less than 10 percent down) in 2005-2006 involved piggyback second liens rather
than a single high LTV first lien mortgage

– The low down payment market share actually rose through 2010 as the GSEs and portfolio lenders pulled back, the PLS market dried up, and FHA lending buoyed
the purchase market as a whole

– The FHA/VA share of purchase lending rose from less than 10 percent during 2005-2006 to nearly 50 percent in 2010

– As the market normalized and other lenders returned, the share of low-down payment lending declined consistent with a drop in the FHA/VA share of the purchase market

https://i0.wp.com/www.zerohedge.com/sites/default/files/images/user230519/imageroot/2017/08/14/2017.08.14%20-%20Mortgage%20Bubble.JPG

On the bright side, at least Yellen’s interest rate bubble means that today’s housing speculators don’t even have to rely on introductory teaser rates to finance their McMansions...Yellen just artificially set the 30-year fixed rate at the 2007 ARM teaser rate…it’s just much easier this way.

“The increase is primarily a function of the overall growth in purchase lending, but, after nearly four consecutive years of declines, low down payment loans have ticked upward in market share over the past 18 months as well,” said Ben Graboske, executive vice president at Black Knight Data & Analytics, in a recent note. “In fact, they now account for nearly 40 percent of all purchase lending.”

At that time half of all low down payment loans being made involved second loans, commonly known as “piggyback loans,” but today’s mortgages are largely single, first liens, Graboske noted.

The loans of the past were also far riskier – mostly adjustable-rate mortgages, which, according to the Black Knight report, are virtually nonexistent among low down payment mortgages today. Instead, most are fixed rate. Credit scores of borrowers taking out these loans today are also about 50 points higher than those between 2004 and 2007.

Finally, on another bright note, tax payers are just taking all the risk upfront this time around…no sense letting the banks take the risk while pretending that taxpayers aren’t on the hook for their poor decisions…again, it’s just easier this way.

https://i0.wp.com/www.zerohedge.com/sites/default/files/images/user230519/imageroot/2017/08/14/2017.08.14%20-%20Mortgage%20Bubble%202.JPG

Source: ZeroHedge

Rents Across The US Hit A New All Time High

After dropping to an all time low 62.9% in Q2 of 2016, the US home ownership rate rebounded modestly in the subsequent two quarters, then dropped again at the start of the year, before once again rising fractionally to 63.7% in Q2 of 2017 from 63.6% in the previous quarter, just 1% from the all time lows in the series history going back to the mid 1960s.

https://i0.wp.com/www.zerohedge.com/sites/default/files/images/user5/imageroot/2017/07/20/homeownership%20q2%202017_0.jpg

A breakdown of the data by age group reveals that the primary driver for this decline has been the youngest age cohort. While older Americans, especially those 65 and older, have predictably seen only modest declines in their home ownership in recent decades, it was the youngest age group, those 35 and younger, the Millennials, who over the past decade have seen their home ownership decline steadily from the low 40%’s to the mid-30%, although in Q2 there was a glimmer of good news, as the home ownership rate for Americans 35 and younger posted its first increase in 3 quarters, rising from 34.3% to 35.3%.

As shown in the chart below, the homeownership rate for Millennials has declined from 43.6% in June 2004 to 35.3% in the latest qua rter, and just shy of the lowest rate reported by the Census Bureau going back nearly a quarter century. Of note: while Millennials finally splurged on houses in the latest quarter, the home ownership rates for every other age cohort declined.

https://i0.wp.com/www.zerohedge.com/sites/default/files/images/user5/imageroot/2017/07/20/homeownership%20by%20age%20group.jpg

But what was most notable in the latest Census data is that for yet another quarter, more Americans opted not to own, but rather rent, and in Q1 the median asking rent jumped by 7.4% Y/Y, from $864 in Q1 to $910.

https://i0.wp.com/www.zerohedge.com/sites/default/files/images/user5/imageroot/2017/07/20/asking%20rent%20average%20q2%202017_0.jpg

Broken down by region, the sharpest spike in asking rents was in the Northeast and Western regions, whose median asking rents were nearly identical, at $1,182 and $1,192, an increase of 21% and 16%, respectively.

https://i0.wp.com/www.zerohedge.com/sites/default/files/images/user5/imageroot/2017/07/20/asking%20rent%20by%20region%20q2%202017.jpg

Finally, what makes the latest spike in rents curious is that while the homeownership vacancy rate declined in the latest quarter, the rental vacancy rate actually increased to 7.3% from 7.0%, the highest since Q1 2016. The rental vacancy has been increasing since Q2 2016 when it troughed at 6.7%, and has since posted four quarters of consecutive growth. It would seem counter intuitive that the vacancy rate is rising even as median asking rents are hitting new all time highs.

https://i0.wp.com/www.zerohedge.com/sites/default/files/images/user5/imageroot/2017/07/20/rental%20vacancy%20q2%202017.jpg

While a new record in rents is hardly what Americans want to hear, it will be music to the Fed’s ears as it means that contrary to various other calculations and imputations, inflation in the US is alive and well.

Source: ZeroHedge

Fannie Mae Says Economy Will Slow in 2nd Half Of 2017

WASHINGTON, DC – Expectations for 2017 economic growth remain at 2.0 percent amid a projected second half slowdown, according to the Fannie Mae Economic & Strategic Research (ESR) Group’s July 2017 Economic and Housing Outlook. With the expansion having entered its ninth year, incoming data point to a second quarter economic growth rebound to 2.7 percent annualized, up from 1.4 percent in the first quarter. However, the full percentage point rise in the saving rate since December signals increased caution among consumers, despite elevated consumer confidence. Decelerating corporate profit growth, commonly seen in the late stages of an expansion, presents a challenge to business investment that is compounded by tax policy uncertainty. In addition, residential investment will likely contribute less to second half growth due to lackluster homebuilding activity and tight for-sale inventory that is restraining home sales. Consequently, se cond half growth is expected to slow slightly to 1.9 percent. Moderate growth is expected to continue in 2018, with potential changes to fiscal and monetary policy posing both upside and downside risks to the forecast.

“While second quarter growth is poised to rebound, we expect growth to moderate through the remainder of 2017. Consumer spending, traditionally the largest contributor to economic growth, is sluggish and is lagging positive consumer sentiment and solid hiring,” said Fannie Mae Chief Economist Doug Duncan. “While labor market slack continues to diminish, wage growth is not accelerating and inflation has moved further below the Fed’s target. These conditions support our call that the Fed will continue gradual monetary policy normalization, announce its balance sheet tapering policy in September, and wait until December for additional data, especially on inflation, before raising the fed funds rate for the third time this year.”

“Construction activity has lost some steam following the first quarter’s weather-driven boost,” Duncan continued. “Meanwhile, very lean inventory continues to act as a boon for home prices and a bane for affordability, particularly among potential first-time homeowners. According to our second quarter Mortgage Lender Sentiment Survey, lenders expect to ease credit standards further. However, we continue to project that the pace of growth in total home sales will slow to 3.3 percent this year, as we believe rapid home price gains amid scarce supply will remain a hurdle for potential homebuyers despite improvements in credit access.”

Visit the Economic & Strategic Research site at www.fanniemae.com to read the full July 2017 Economic Outlook, including the Economic Developments Commentary, Economic Forecast, Housing Forecast, and Multifamily Market Commentary. To receive e-mail updates with other housing market research from Fannie Mae’s Economic & Strategic Research Group, please click here.

By Matthew Classick | FNMA

Record Apartment Building-Boom Meets Reality: First CRE Decline Since The Great Recession

Even the Fed put commercial real estate on its financial-stability worry list.

No, the crane counters were not wrong. In 2017, the ongoing apartment building-boom in the US will set a new record: 346,000 new rental apartments in buildings with 50+ units are expected to hit the market.

How superlative is this? Deliveries in 2017 will be 21% above the prior record set in 2016, based on data going back to 1997, by Yardi Matrix, via Rent Café. And even 2015 had set a record. Between 1997 and 2006, so pre-Financial-Crisis, annual completions averaged 212,740 units; 2017 will be 63% higher!

These numbers do not include condos, though many condos are purchased by investors and show up on the rental market. And they do not include apartments in buildings with fewer than 50 units. This chart shows just how phenomenal the building boom of large apartment developments has been over the past few years:

https://i0.wp.com/www.zerohedge.com/sites/default/files/images/user5/imageroot/2017/07/20/US-Apartment-construction.png

The largest metros are experiencing the largest additions to the rental stock. The chart below shows the number of rental apartments to be delivered in those metros in 2017. But caution in over-interpreting the chart – the population sizes of the metros differ enormously.

The New York City metro includes Northern New Jersey, Central New Jersey, and White Plains and is by far the largest metro in the US. So the nearly 27,000 apartments it is adding this year cannot be compared to the 5,400 apartments for San Francisco (near the bottom of the list). The city of San Francisco is small (about 1/10th the size of New York City itself), and is relatively small even when part of the Bay Area is included.

Other metros on this list are vast, such as the Dallas-Fort Worth metro which includes the surrounding cities such as Plano. Driving through the area on I-35 East gives you a feel for just how vast the metro is. However, I walk across San Francisco in less than two hours:

https://i0.wp.com/www.zerohedge.com/sites/default/files/images/user5/imageroot/2017/07/20/US-Apartment-construction-by-city-metro-2017_0.png

Special note: Chicago is adding 7,800 apartments even though the population has begun to shrink. So this isn’t necessarily going to work out.

This building boom of large apartment buildings is starting to have an impact on rents. In nearly all of the 12 most expensive rental markets, median asking rents have fallen from their peaks, and in several markets by the double digits, including Chicago (-19%!), Honolulu, San Francisco, and New York City.

And it has an impact on the prices of these buildings. Apartments are a big part of commercial real estate. They’re highly leveraged. Government Sponsored Enterprises such as Fanny Mae guarantee commercial mortgages on apartment buildings and package them in Commercial Mortgage-Backed Securities. So taxpayers are on the hook. Banks are on the hook too.

This is big business. And it is now doing something it hasn’t done since the Great Recession. The Commercial Property Price Index (CPPI) by Green Street, which tracks the “prices at which commercial real estate transactions are currently being negotiated and contracted,” plateaued briefly in December through February and then started to decline. By June, it was below where it had been in June 2016 – the first year-over-year decline since the Great Recession:

https://i0.wp.com/www.zerohedge.com/sites/default/files/images/user5/imageroot/2017/07/20/US-Commercial-Property-Index-GreenStreet-2017-06_0.png

Some segments in the CPPI were up, notably industrial, which rose 9% year over year, benefiting from the shift to ecommerce, which entails a massive need for warehouses by Amazon [Is Amazon Eating UPS’s Lunch?] and other companies delivering goods to consumers.

But prices of mall properties fell 5%, prices of strip retail fell 4%, and prices of apartment buildings fell 3% year-over-year.

So for renters, there is some relief on the horizon, or already at hand – depending on the market. There’s nothing like an apartment glut to bring down rents. See what the oil glut in the US has done to the price of oil.

Investors in apartment buildings, lenders, and taxpayers (via Fannie Mae et al. that guarantee commercial mortgage-backed securities), however, face a treacherous road. Commercial real estate goes in cycles as the above chart shows. Those cycles are not benign. Plateaus don’t last long. And declines can be just as sharp, or sharper, than the surges, and the surges were breath-taking.

Even the Fed has put commercial real estate on its financial-stability worry list and has been tightening monetary policy in part to tamp down on the multi-year price surge. The Fed is worried about the banks, particularly the smaller banks that are heavily exposed to CRE loans and dropping collateral values.

But the new supply of apartment units hitting the market in 2018 and 2019 will even be larger. In Seattle, for example, there are 67,507 new apartment units in the pipeline.

Source: ZeroHedge


Angelinos Spend Nearly 50% On Their Rent

The rental apocalypse continues in Los Angeles.  It is interesting to see how far some house humpers will go trying to justify prices.  Some are arguing future weed sales are going to create another boom which is somewhat ironic since the benefits are actually to mellow you out, not turn you into a Taco Tuesday baby boomer that becomes a cubicle stressed slave just to purchase a home.  And many times people plan on having a family shortly after which means higher childcare costs which they tend to forget.  However, Los Angeles once again continues to be the worst place to rent in terms of affordability (and own for that matter). Zillow put out some interesting research and of course as you would expect, those spending nearly half of their income on rent are simply not saving for retirement.

L.A. is the Whole Foods of rental markets

I liken the L.A. housing market to Whole Foods.  Great and healthy items that usually break the bank.  L.A. has a large number of young and healthy hipsters and Millennials but most can’t buy a home.  Heck, most Uber and Lyft drivers have nicer cars than most of us.  So we live in this market where the perception is that everyone is well off and healthy when in reality many homeowners are stuck in a ridiculous commute for a crap shack and that is bad for your health.

Of course this isn’t some made up figure.  Just take a look at how much income is dumped on rent in various markets:

https://i0.wp.com/www.doctorhousingbubble.com/wp-content/uploads/2017/07/la-rents-768x577.png

Los Angeles by far is the worst market for renters surpassing even New York and San Francisco.  I’ve made this argument multiple times and that has to do with incomes being far lower in this area compared to San Francisco and New York.  Of course to house humpers they only see coastal Santa Monica and somehow use this as the reference for every other hood in the area where most of the plebs live.  They forget that L.A. County has 10,000,000 people with most not living on the coast.

So it is also telling that L.A. is largely a renting household dominated county.  You have millions of Millennials across the state living at home with their parents because rents are too expensive.  There is also this romantic idea that many people are stashing millions of dollars away by doing this but the stats show a different story.  Some are, but most are not.

What you have is Taco Tuesday baby boomers now stuck in granite countertop HGTV upgraded sarcophagi that they can’t leave for a variety of reasons including locked in Prop 13 tax assessments and adult children back in their nursery rooms.  You also have the issue of low inventory that is plaguing the country:

https://i0.wp.com/www.doctorhousingbubble.com/wp-content/uploads/2017/07/inventory-768x582.png

The low inventory dilemma is not only a SoCal phenomenon but has also impacted most urban metro markets.  This is why housing as an entire asset class has soared with the stock market since 2009.  Unlike the stock market however, scarcity has been a large factor driving prices up in real estate.

The issue of rents is problematic however.  As the percentage of households that rent grows, you are going to get those in the middle being squeezed.  What do renter households care if taxes get increased on property if they don’t own?  Back in 1978 when Prop 13 passed you had a much larger percentage of California homeowners.  Today that is clearly not the case.  “Well we’ll just increase the rent and pass it on!”  Do you think people think like this?  Of course not!  Just take a look at New York City where only 31 percent of households own.  And look at how they tax people there.  That is the future.  Where only the uber elite will be comfortable in their homes.  Grandfathered in Taco Tuesday baby boomer homeowners will live in million dollar crap shacks and shop at the 99 Cents Store.

The idea that broke Millennials were going to buy in mass in Los Angeles never made sense.  Many would rather eat out, work out, and live a more Spartan life (many by necessity).  Ironically more are healthier than those pot belly cubicle dwellers that are stuck in obscene traffic everyday having to make that massive 30-year mortgage commitment.  But hey, we do live in the Whole Foods of housing markets.

By Dr.HousingBubble

When Does A Home Become A Prison?

https://i0.wp.com/fourwinds10.com/resources/uploads/images/cell%20in%20norway.jpg

The housing market is suffering from a supply shortage, not a demand dilemma. As Millennial first-time homebuyer demand continues to increase, the inventory of homes for sale tightens. At the same time, prices are increasing, so why aren’t there more homeowners selling their homes?

In most markets, the seller, or supplier, makes their decision about adding supply to the market independent of the buyer, or source of demand, and their decision to buy. In the housing market, the seller and the buyer are, in many cases, actually the same economic actor. In order to buy a new home, you have to sell the home you already own.

So, in a market with rising prices and strong demand, what’s preventing existing homeowners from putting their homes on the market?

“Existing homeowners are increasingly financially imprisoned in their own home by their historically low mortgage rate. It makes choosing a kitchen renovation seem more appealing than moving.”

The housing market has experienced a long-run decline in mortgage rates from a high of 18 percent for the 30-year, fixed-rate mortgage in 1981 to a low of almost 3 percent in 2012. Today, five years later, mortgage rates remain just a stone’s throw away from that historic low point. This long-run decline in rates encouraged existing homeowners to both move more often and to refinance more often, in many cases refinancing multiple times between each move.

https://i0.wp.com/blog.firstam.com/hubfs/071917%20blog.png

It’s widely expected that mortgage rates will rise further. This is more important than we may even realize because the housing market has not experienced a rising rate environment in almost three decades! No longer is there a financial incentive to refinance for most homeowners, and there’s more to consider when moving. Why move when it will cost more each month to borrow the same amount from the bank? A homeowner can re-extend the mortgage term another 30 years to increase the amount one can borrow at the higher rate, but the mortgage has to be paid off at some point.  Hopefully before or soon after retirement. Existing homeowners are increasingly financially imprisoned in their own home by their historically low mortgage rate. It makes choosing a kitchen renovation seem more appealing than moving.”

There is one more possibility caused by the fact that the existing-home owner is both seller and buyer. In today’s market, sellers face a prisoner’s dilemma, a situation in which individuals don’t cooperate with each other, even though it is seemingly in their best interest to do so.

Consider two existing homeowners. They both want to buy a new house and move, but are unable to communicate with each other. If they both choose to sell, they both benefit because they increase the inventory of homes available, and collectively alleviate the supply shortage. However, if one chooses to sell and the other doesn’t, the seller must buy a new home in a market with a shortage of supply, bidding wars and escalating prices. Because of this risk, neither homeowner sells (non-cooperation) and neither get what they wanted in the first place – a move to a new, more desirable home. Imagine this scenario playing out across an entire market. If everyone sells there will be plenty of supply. But, the risk of selling when others don’t convinces everyone not to sell and produces the non-cooperative outcome.

https://i0.wp.com/blog.firstam.com/hs-fs/hubfs/071917%20blog%202.jpg

Possible Outcomes

  1. Owner moves, but pays a price escalated by supply shortages for a more desirable home
  2. Owner stays in current house and does not get a more desirable home
  3. Owner moves, finding a more desirable home without paying a price escalated by supply shortages

Rising mortgage rates and the fear of not being able to find something affordable to buy is imprisoning homeowners and causing the inventory shortages that are seen in practically every market across the country. So, what gives in a market short of supply relative to demand? Prices. According to the First American Real House Price Index, the fast pace of house price growth, combined with rising rates, has had a material impact on affordability. In our most recent analysis in April, affordability was down 11 percent compared to a year ago. It was once said that a man’s home is his castle.  In today’s market, a man’s home may be his prison, but he is getting wealthier for it.

By MarK Fleming | First American Economic Blog


Can’t Afford A Shanghai Apartment? Try Sleeping In A “Shared Compartment”

(ZeroHedge) Shanghai’s status as an emerging tech hub is bringing with it problems related to overcrowding experienced by US cities like San Francisco and certain parts of New York City – namely out-of-control rents and home prices.

But now, the cities’ mid-tier office drones, some of whom may not have enough cash saved to “commit” to an apartment, have a new low-cost housing alternative. They’re called shared compartments, and they’re are popping up in office buildings around Shanghai. Users pay to sleep in the compartments for a set amount of time. They’re given disposable bedding to make sleeping more comfortable, and the compartments are disinfected automatically by ultraviolet light after each use.

Photos of these compartments have been circulating on Chinese media:

https://i0.wp.com/www.zerohedge.com/sites/default/files/images/user245717/imageroot/2017/2017.07.15Shanghaione_0.JPGPeople can enjoy a rest in the compartment by scanning the QR codes for payment.

https://i0.wp.com/www.zerohedge.com/sites/default/files/images/user245717/imageroot/2017/2017.07.15Shanghaitwo.JPG
A man experiences a shared compartment in Shanghai…

https://i0.wp.com/www.zerohedge.com/sites/default/files/images/user245717/imageroot/2017/2017.07.15Shanghaithree_0.JPG
The inside of a shared compartment…

https://i0.wp.com/www.zerohedge.com/sites/default/files/images/user245717/imageroot/2017/2017.07.15Shanghaifour_0.JPG
The disposable bedding…

https://i0.wp.com/www.zerohedge.com/sites/default/files/images/user245717/imageroot/2017/2017.07.15shanghaifive.JPG

They have been rising precipitously now for at least a decade, with an average 1,000 square foot apartment in Shanghai going for $725,000, or around five million yuan. Shanghai’s average salary per month is 7,108 yuan ($1,135) or 85,300 yuan a year. That puts local property in Shanghai at about 50 times median salaries in the city, according to Forbes. By comparison, housing prices in New York City are 32 times salaries of average New Yorkers.

With those figures in mind, showering at the company gym doesn’t sound so bad.


Living in a box: The desperate workers forced to live in tiny ‘coffin’ apartments of Tokyo – which still cost up to £400 a month to rent

  • Japanese capital is one of the most crowded cities in the world
  • ‘Geki-sema’ or share houses are mainly used by young professionals
  • No windows and enough room for one person and a few possessions
They are barely large enough for a single person to squeeze into at all, let alone swing a cat.

But incredibly these tiny ‘coffin’ apartments in central Tokyo still command rents of up to £400 a month.

The Japanese capital is one of the most crowded cities in the world, and to cash in on the chronic housing problem, landlords have developed what are known as ‘geki-sema’ or share houses.

https://i0.wp.com/i.dailymail.co.uk/i/pix/2013/02/28/article-0-1859C822000005DC-752_634x356.jpgTight squeeze: A Tokyo local shows a Japanese news crew around her tiny ‘coffin apartment’

https://i0.wp.com/i.dailymail.co.uk/i/pix/2013/02/28/article-2286069-1859C813000005DC-388_634x356.jpg
Pokey: People are paying up to £400-a-month to live in the tiny ‘coffin’ apartments

https://i0.wp.com/i.dailymail.co.uk/i/pix/2013/02/28/article-2286069-1859C9A4000005DC-913_634x356.jpg
Party time: The news team somehow manage to all squeeze inside the miniscule apartment

They are little more than cupboards, tiny cubicles stacked on top of each other with just enough room for one person and a few of their possessions.

Definitely not for the claustrophobic, many don’t even have windows and the doors and anyone over 6ft tall would have trouble stretching their legs.

Most are used by young professionals who spend most of their time at work and outdoors, using these tiny accommodations just for sleeping.

The photo’s of the apartments in the Tokyo’s Shibuya district come from a recent Japanese news program showed

https://i0.wp.com/i.dailymail.co.uk/i/pix/2013/02/28/article-2286069-1859B531000005DC-145_634x356.jpg

Tight squeeze: A man shows off his tiny Tokyo apartment with just enough room to stretch out and hang his clothes.

https://i0.wp.com/i.dailymail.co.uk/i/pix/2013/02/28/article-2286069-1859B546000005DC-411_634x356.jpg
Cosy: The tiny cubicles are often stacked on top of each other and contain just enough room for one person to stretch out

https://i0.wp.com/i.dailymail.co.uk/i/pix/2013/02/28/article-2286069-1859B4BA000005DC-190_634x356.jpg
Entertaining friends: The apartments tend to be used by young professionals who spend most of their time at work and outdoors

https://i0.wp.com/i.dailymail.co.uk/i/pix/2013/02/28/article-2286069-1859B4D9000005DC-674_634x356.jpg
No space like home: Many of the ‘geki-sema’ share houses don’t even have windows

NAR Cites “Housing Emergency” as Starts Unexpectedly Dive 5.5 Percent: NAR “Befuddled”

https://s14-eu5.ixquick.com/cgi-bin/serveimage?url=http%3A%2F%2Fblog.newinhomes.com%2Fwp-content%2Fuploads%2F2017%2F05%2Fconstruction-6-642x336.jpg&sp=e923574909156e73634c83abbc3a079a

The second-quarter economic report misery continues in a major way today with housing starts and permits unexpectedly falling.

The Econoday consensus was was for starts to rise 4.35%. Instead, starts fell 5.5%. Adding insult to injury, April was revised lower by 1.37 percentage points making the consensus estimate off by an amazing 11.22 percentage points.

The bad economic news keeps building, this time in the housing sector. Housing starts fell an unexpected 5.5 percent in May to a far lower-than-expected annualized rate of 1.092 million with permits likewise very weak, down 4.9 percent to a 1.168 million rate.

All components show declines with single-family starts down 3.9 percent to a 794,000 rate and permits down 1.9 percent to 779,000. Multi-family starts fell 9.7 percent to 298,000 with permits down 10.4 percent to 389,000. Total completions did rise 5.6 percent to a 1.164 million rate, which adds supply to a thin market, but homes under construction slipped 0.7 percent to 1.067 million.

Adding to the bad news are downward revisions to starts including April which is now at 1.156 vs an initial 1.172 million. Looking at the quarter-to-quarter comparison, starts have averaged 1.124 million so far in the second quarter, down a very sizable 9.2 percent from 1.238 million in the second quarter. Permits, at an average of 1.198 million, are down 4.9 percent.

Residential investment looks to be yet another negative for second-quarter GDP.

Housing Emergency?

Mortgage News Dailly has some amusing comments by Lawrence Yun, the National Association of Realtors chief economist, in its report Drop in Housing Starts Could Intensify Inventory Issues.

The negative report prompted the following statement from the National Association of Realtor’s Chief Economist Lawrence Yun. “Housing shortages look to intensify and may well turn into a housing emergency if the discrepancy between housing demand and housing supply widens further. The falling housing starts and housing permits in May are befuddling given the lack of homes for sale and the quick pace of selling a newly-constructed homes. Meanwhile, job creations of a consistent 2 million a year will push up housing demand further. One thing that moving up is the housing costs for consumers: higher home prices and higher rents.”

NAR “Befuddled”

Yun is befuddled. That’s hardly surprising given that it does not take much to befuddle economists.

Let me clear up the confusion:

  • People cannot afford homes so they are not buying them.
  • Builders will not purposely build homes to sell at a loss.
  • The alleged demand for new homes is imaginary.

Such analysis is beyond the scope of most economists, so I am happy to help out.

By Mike “Mish” Shedlock

Vancouver House For Sale: Only 2,099 Bitcoin

https://s17-us2.ixquick.com/cgi-bin/serveimage?url=https%3A%2F%2Fi.ytimg.com%2Fvi%2F2_FlE-3g8C0%2Fmaxresdefault.jpg&sp=ece4171b1dbc1501fe05f47645f9b770

In February 2016 we explained, correctly in retrospect, that the reason behind the unprecedented surge in Vancouver home prices was the seemingly constant flood of “hot Chinese money” desperate to park itself as far away from China’s banking system, and into offshore real-estate. This is how we laid out the stylized sequence of events that culminated with Vancouver home prices surging by over 20%:

  1. Chinese investors smuggled out millions in embezzled cash, hot money or perfectly legal funds, bypassing the $50,000/year limit in legal capital outflows.
  2. They make “all cash” purchases, usually sight unseen, using third parties intermediaries to preserve their anonymity, or directly in person, in cities like Vancouver, New York, London or San Francisco.
  3. The house becomes a new “Swiss bank account”, providing the promise of an anonymous store of value and retaining the cash equivalent value of the original capital outflow.
  4. Then the owners disappear, never to be heard from or seen again.

Separately, in mid-2015, when bitcoin was still trading in the low $200s, we also predicted that in an attempt to bypass China’s increasingly more draconian capital controls, Chinese oligarchs and ordinary savers would increasingly turn to what at the time was a largely unregulated medium of exchange: bitcoin.

we would not be surprised to see another push higher in the value of bitcoin: it was earlier this summer when the digital currency, which can bypass capital controls and national borders with the click of a button, surged on Grexit concerns and fears a Drachma return would crush the savings of an entire nation. Since then, BTC has dropped (in no small part as a result of the previously documented “forking” with Bitcoin XT), however if a few hundred million Chinese decide that the time has come to use bitcoin as the capital controls bypassing currency of choice, and decide to invest even a tiny fraction of the $22 trillion in Chinese deposits in bitcoin (whose total market cap at last check was just over $3 billion), sit back and watch as we witness the second coming of the bitcoin bubble, one which could make the previous all time highs in the digital currency, seems like a low print.

With one bitcoin now going for roughly $1,800 – and with the PBOC repeatedly cracking down on all forms of bitcoin cross-border flow – this prediction also turned out to be right.

So putting the two together, at least one enterprising Canadian homeowner has decided to make life for potential Chinese buyers especially easy, and in a posting on the Hong Kong edition of Craigslist, has listed a relatively modest Vancouver house for the price of 2,099 bitcoin.

https://i0.wp.com/www.zerohedge.com/sites/default/files/images/user5/imageroot/2017/05/12/vancouver%20house%20craigs_0.jpg

At today’s exchange rate of US$1,737 for one bitcoin, the US dollar equivalent price is roughly $3.6 million or C$4.9 million. So what does nearly five million Canadian dollars buy enterprising Chinese investors who are willing to pay up for the convenience of bypassing currency conversion into Canadian dollars altogether? This:

https://i0.wp.com/www.zerohedge.com/sites/default/files/images/user5/imageroot/2017/05/12/00E0E_gnzeuLmeD2K_600x450.jpg

https://i0.wp.com/www.zerohedge.com/sites/default/files/images/user5/imageroot/2017/05/12/00000_kM7OIBuDw1h_600x450.jpg

https://i0.wp.com/www.zerohedge.com/sites/default/files/images/user5/imageroot/2017/05/12/00D0D_kC0voEX3eF4_600x450.jpg

Source: ZeroHedge

A Look At Our Older Population, Higher Interest Rate Trend

https://s16-us2.ixquick.com/cgi-bin/serveimage?url=http%3A%2F%2Fmedia4.s-nbcnews.com%2Fj%2FMSNBC%2FComponents%2FSlideshows%2F_production%2Fss-120912-jeff-levine%2Fss-120912-jeff-levine-GERI-RACE.today-ss-slide-desktop.jpg&sp=49cee5343304e0923d7b382a86a90b18

The United States of America, 2047: The population bumps up against 400 million people, with a full 22 percent of folks aged 65 and older — or 85.8 million seniors. The national debt rises so high that the country spends more money on interest payments than all of its discretionary programs combined, a scenario that’s never been seen in a half-century of tracking such metrics. And that’s all assuming that elected officials even find a way to keep Social Security and Medicare funded at their current levels.

This stark vision comes courtesy of the Congressional Budget Office and its most recent Long-Term Budget Outlook. The nonpartisan CBO looks into its crystal ball and predicts the economic picture for the next 30 years, and the results could prove fascinating for folks who work in financial planning and lending — or, perhaps, send them screaming into the night.

Interest Rates Creep Higher, But Not Historically So

For instance, the CBO joins the chorus of other financial analysts by projecting steady increases in interest rates over the coming decades as the economy improves and the Federal Reserve moves away from the historically low federal funds rates instituted during the depths of the Great Recession. But mirroring the attitudes of many in the reverse mortgage industry after the Fed last hiked its interest rate target back in March, the office also puts these trends in the larger context of recent history, 

“CBO anticipates that interest rates will rise as the economy grows but will still be lower than the average of the past few decades,” the report notes. “Over the long term, interest rates are projected to be consistent with factors such as labor force growth, productivity growth, the demand for investment, and federal deficit.”

As RMD reported at the time, rising interest rates have diverse effects on Home Equity Conversion Mortgage originators and lenders, potentially hampering needs-based borrowers with lower principal limits, but also providing opportunities to market the growing HECM line of credit and strengthening the HECM-backed securities market. 

Though the CBO doesn’t address specific numbers for federal funds rate targets, the office offers projections for the interest rate on 10-year Treasury notes, predicting a rise from 2.1% at the end of last year to 3.6% in 2027 and 4.7% in 2047. That’s still a percentage point below the average of 5.8% recorded between 1990 and 2007, a period that the CBO notes was free of major fiscal crises or spikes in inflation.

The current federal funds rate target of 0.75% to 1% still falls on the historically low side of the spectrum; prior to the economic collapse in the late 2000s, the number sat at 5.25%, and it climbed as 20% during the inflationary malaise days of the Carter and early Reagan administrations.

Rising interest rates could spell bad news for the federal government, however, as they also determine the amount of money that Uncle Sam must pay on his debts. According to the CBO’s estimates, the amount of federal debt held by the public will balloon to 150% of the gross domestic product, up from 77% now — reaching figures never seen in the history of the United States. For reference, the national debt has only ever exceeded GDP during and after World War II, when the government embarked on an unprecedented defense spending spree.

A Changing Population

In the CBO’s estimate, a variety of factors will conspire to expand the American population to about 390 million as compared to around 320 million today — while simultaneously making it grayer.

The net immigration rate, which balances out the amount of people leaving and entering the U.S., is expected to rise ever-so-slightly from 3.2 per 1,000 in 2017 to 3.3 per 1,000 in 2047, while the fertility rate for folks already in America will sit at an average of 1.9 births per woman for the next 30 years, down from the pre-recession level of 2.1.

Couple that with declines in mortality rates and gains in life expectancy, and you’ve got the recipe for an older America: A baby born in 2047 can expect to live an average of 82.8 years according to the CBO’s estimates, compared with 79.2 for children born this year. And good news for readers born in 1982: You can expect an average of 21.5 more years on this mortal coil once you turn 65 in 2047, as compared to 19.4 more years for those celebrating their 65th birthdays by the end of 2017.

The Takeaway

Interestingly, the CBO notes that it bases its entire report on the assumption that the two key pillars of Social Security and Medicare will remain funded “even if their trust funds are exhausted” — a formidable “if” given political realities and the general pitfalls of making assumptions about the future of government from 30 years out.

As Jamie Hopkins, an associate professor of taxation at the American College of Financial Services, recently told a HECM industry event, Social Security and Medicare will remain funded through 2034, and any attempts to make unpopular decisions that could benefit their long-term health — such as raising the retirement age — would spell political disaster for those who attempt a change.

Perhaps none of this comes as a surprise to originators, lenders, and others who work in the reverse mortgage space: Americans as a unit are getting older, the economic outlook remains uncertain, and no one’s really sure what’s going to become of the social safety net. Meanwhile, down on the micro level, this growing crop of seniors will need to figure out ways to remain comfortable and safe in their retirement years.

By Alex Spanko | Reverse Mortgage Daily

L.A. to Worsen Housing Shortage with New Rent Controls

https://mises.org/sites/default/files/styles/slideshow/public/apartments.JPG?itok=W2nfy-A2

Los Angeles, home to one of the least affordable housing markets in North America, is now proposing to expand rent control to “fix” its housing problem. 

As with all price control schemes, rent control will serve only to make housing affordable to a small sliver of the population while rendering housing more inaccessible to most. 

Specifically, city activists hope that a new bill in the state legislature, AB1506, will allow local governments, Los Angeles included, to expand the number of units covered by rent control laws while also restricting the extent to which landlords can raise rents. 

Unintended Consequences 

Currently, partial rent control is already in place in Los Angeles and landlords there are limited in how much they can raise rents on current residents. However, according to LA Weeklylandlords are free to raise rents to market levels for a unit once that unit turns over to new residents. 

This creates a situation of perverse incentives that do a disservice to both renters and landlords. Under normal circumstances, landlords want to minimize turnover among renters because it is costly to advertise and fill units, and it’s costly to prepare units for new renters. (Turnover is also costly and inconvenient for renters.) 

By limiting rent growth for ongoing renters, however, this creates an incentive for landlords to break leases with residents — even residents who the landlords may like — just so the landlords can increase rents for new incoming renters in order to cover their costs of building maintenance and improvements. The only upside to this current regime is that at least this partial loophole still allows for some profit to be made, and thus allows for owners to produce and improve housing some of the time

But, if this loophole is closed, as the “affordable housing” activists hope to do, we can look forward to even fewer housing units being built, current units falling into disrepair, and even less availability of housing for residents. 

Why Entrepreneurs Bring Products to Market 

The reason fewer units will be built under a regime of harsher rent control, is because entrepreneurs (i.e., producers) only bring goods and services to market if they can be produced at a cost below the market price. 

Contrary to the myth perpetuated by many anti-capitalists, market prices — in this case, rents are not determined by the cost of producing a good or service. Nor are prices determined by the whims of producers based on how greedy they are or how much profit they’d like to make. 

In fact, producers are at the mercy of the renters who — in the absence of price controls — determine the price level at which entrepreneurs must produce housing before they can expect to make any profit. 

However, when governments dictate that rent levels must be below what would have been market prices — and also below the level at which new units can be produced and maintained — then producers of housing will look elsewhere. 

Henry Hazlitt explains many of the distortions and bizarre incentives that emerge from price control measures: 

The effects of rent control become worse the longer the rent control continues. New housing is not built because there is no incentive to build it. With the increase in building costs (commonly as a result of inflation), the old level of rents will not yield a profit. If, as often happens, the government finally recognizes this and exempts new housing from rent control, there is still not an incentive to as much new building as if older buildings were also free of rent control. Depending on the extent of money depreciation since old rents were legally frozen, rents for new housing might be ten or twenty times as high as rent in equivalent space in the old. (This actually happened in France after World War II, for example.) Under such conditions existing tenants in old buildings are indisposed to move, no matter how much their families grow or their existing accommodations deteriorate.

Thus, 

Rent control … encourages wasteful use of space. It discriminates in favor of those who already occupy houses or apartments in a particular city or region at the expense of those who find themselves on the outside. Permitting rents to rise to the free market level allows all tenants or would-be tenants equal opportunity to bid for space. 

Nor surprisingly, when we look into the current rent-control regime in Los Angeles, we find that newer housing is exempt, just as Hazlitt might have predicted. Unfortunately, housing activists now seek to eliminate even this exemption, and once these expanded rent controls are imposed, those on the outside won’t be able to bid for space in either new or old housing.

Newcomers will be locked out of all rent-controlled units — on which the current residents hold a death grip — and they can’t bid on the units that were never built because rent control made new housing production unprofitable. Thus, as rent control expands, the universe of available units shrinks smaller and smaller. Renters might flee to single-family rental homes where rent increases might still be allowed, or they might have to move to neighboring jurisdictions that might not have rent controls in place. 

In both cases, the effect is to reduce affordability and choice. By pushing new renters toward single-family homes this makes single-family homes relatively more profitable than multi-family dwellings, thus reducing density, and robbing both owners and renters of the benefits of economies of scale that come with higher-density housing. Also, those renters who would prefer the amenities of multi-family communities are prevented from accessing them. Meanwhile, by forcing multi-family production into neighboring jurisdictions, this increases commute times for renters while forcing them into areas they would have preferred not to live in the first place. 

But, then again, for many local governments — and the residents who support them — fewer multi-family units, lower densities, and fewer residents in general, are all to the good. After all, local government routinely prohibit developers from developing more housing through zoning laws, regulation of new construction, parking requirements, and limitations on density. 

And these local ordinances, of course, are the real cause of Los Angeles’s housing crisis. Housing isn’t expensive in Los Angeles because landlords are greedy monsters who try to exploit their residents. Housing is expensive because a large number of renters are competing for a relatively small number of housing units. 

And why are there so few housing units? Because the local governments usually drive up the cost of housing. As this report from UC Berkeley concluded: 

In California, local governments have substantial control over the quantity and type of housing that can be built. Through the local zoning code, cities decide how much housing can theoretically be built, whether it can be built by right or requires significant public review, whether the developer needs to perform a costly environmental review, fees that a developer must pay, parking and retail required on site, and the design of the building, among other regulations. And these factors can be significant – a 2002 study by economists from Harvard and the University of Pennsylvania found strict zoning controls to be the most likely cause of high housing costs in California.

Contrary to what housing activists seem to think, declaring that rents shall be lower will not magically make more housing appear. Put simply, the problem of too little housing — assuming demand remains the same — can be solved with only one strategy: producing more housing

Rent control certainly won’t solve that problem, and if housing advocates need to find a reason why so little housing is being built, they likely will need to look no further than the city council.

By Ryan McMaken | Mises Institute

HUD Audit Reveal BILLIONS In Bookkeeping Discrepancies

https://i0.wp.com/cdn01.dailycaller.com/wp-content/uploads/2017/01/2017-01-12T164450Z_1_LYNXMPED0B17R_RTROPTP_4_USA-CONGRESS-CARSON-e1488837063804.jpg

Dr. Ben Carson testifies before a Senate Banking, Housing and Urban Affairs Committee confirmation hearing on his nomination to be Secretary of the U.S. Department of Housing and Urban Development on Capitol Hill in Washington, U.S. January 12, 2017. REUTERS/Kevin Lamarque

Department of Housing and Urban Development’s (HUD’s) financial books are in such bad shape that HUD’s Inspector General (IG) can’t complete an audit even after HUD officials corrected $520 billion in bookkeeping errors, according to a new IG report.

Officials at HUD fixed $3.4 billion in errors from its 2015 books and $516.4 billion in errors from its 2016 books after the IG in December was unable to issue an opinion on either year’s financial statements and highlighted 11 material weaknesses, seven significant deficiencies and five instances of failure to comply with laws and regulations.

These same problems have been reported for three straight years by the IG.

One can only stand aghast at the incompetence on display.  No wonder the government has put us all near the brink of financial ruin.  If this was a private company, you can guarantee people would be going to prison.

So pretty much everything the law requires be done for financial accountability was totally ignored.  Given the deplorable state of his former department, you would think Castro would hang his head in shame.  You would be wrong!  He actually tried to give Ben Carson advice on how not to screw up his department.  What a joke!

https://i0.wp.com/2unlvw5itup20j1gt23wbwih.wpengine.netdna-cdn.com/wp-content/uploads/2016/03/Castro_Julian_Obama-300x205.jpg

Former HUD Secretary Julian Castro

This department seems to have a great mission, but as usual, Democrats have totally ruined it.  Let’s hope Ben Carson can use some of that brilliance he’s known for to clean this department from top to bottom.  The first thing he should do is fire all the Obama appointees who are doing shady things with our tax dollars.

http://dailycaller.com/2017/03/07/hud-can-fix-520-billion-in-accounting-errors-but-still-cant-document-its-spending/ *** http://readmeeveryday.com/audit-hud-discovers-billions/

Economic Support For Housing Industry In Shale Oil States Has Arrived

How OPEC Lost The War Against US Shale, In One Chart

At the start of March we showed a fascinating chart from Rystad Energy, demonstrating how dramatic the impact of technological efficiency on collapsing US shale production costs has been: in just the past 3 years, the wellhead breakeven price for key shale plays has collapsed from an average of $80 to the mid-$30s…

https://i0.wp.com/www.zerohedge.com/sites/default/files/images/user5/imageroot/2017/03/03/breakven%20wellhead.jpg

.. resulting in drastically lower all-in break evens for most US shale regions.

Today, in a note released by Goldman titled “OPEC: To cut or not to cut, that is the question”, the firm presents a chart which shows just as graphically how exactly OPEC lost the war against US shale: in one word: the cost curve has massively flattened and extended as a result of “shale productivity” driving oil breakeven in the US from $80 to $50-$55, in the process sweeping Saudi Arabia away from the post of global oil price setter to merely inventory manager.

https://i0.wp.com/www.zerohedge.com/sites/default/files/images/user5/imageroot/2017/03/20/oil%20cost%20curve.jpg

This is how Goldman explains it:

Shale’s short time to market and ongoing productivity improvements have provided an efficient answer to the industry’s decade-long search for incremental hydrocarbon resources in technically challenging, high cost areas and has kicked off a competition amongst oil producing countries to offer attractive enough contracts and tax terms to attract incremental capital. This is instigating a structural deflationary change in the oil cost curve, as shown in Exhibit 2. This shift has driven low cost OPEC producers to respond by focusing on market share, ramping up production where possible, using their own domestic resources or incentivizing higher activity from the international oil companies through more attractive contract structures and tax regimes. In the rest of the world, projects and countries have to compete for capital, trying to drive costs down to become competitive through deflation, FX and potentially lower tax rates.

The implications of this curve shift are major, all of which are very adverse to the Saudis, who have been relegated from the post of long-term price setter to inventory manager, and thus the loss of leverage. Here are some further thoughts from Goldman:

  • OPEC role: from price setter to inventory manager In the New Oil Order, we believe OPEC’s role has structurally changed from long-term price setter to inventory manager. In the past, large-scale developments required seven years+ from FID to peak production, giving OPEC long-term control over oil prices. US shale oil currently offers large-scale development opportunities with 6-9 months to peak production. This short-cycle opportunity has structurally changed the cost dynamics, eliminating the need for high cost frontier developments and instigating a competition for capital amongst oil producing countries that is lowering and flattening the cost curve through improved contract terms and taxes.
  • OPEC’s November decision had unintended consequences: OPEC’s decision to cut production was rational and fit into the inventory management role. Inventory builds led to an extreme contango in the Brent forward curve, with 2-year fwd Brent trading at a US$5.5/bl (11%) premium to spot. As OPEC countries sell spot, but US E&Ps sell 30%+ of their production forward, this was giving the E&Ps a competitive advantage. Within one month of the OPEC announcement, the contango declined to US$1.1/bl (2%), achieving the cartel’s purpose. However, the unintended consequence was to underwrite shale activity through the credit market.
  • Stability and credit fuel overconfidence and strong activity: A period of stability (1% Brent Coefficient of Variation ytd vs. 6% 3-year average) has allowed E&Ps to hedge (35% of 2017 oil production vs. 21% in November) and access the credit market, with high yield reopen after a 10- month closure (largest issuance in 4Q16 since 3Q14). Successful cost repositioning and abundant funding are boosting a short-cycle revival, with c.85% of oil companies under our coverage increasing capex in 2017.

That said, the new equilibrium only works as long as credit is cheap and plentiful. If and when the Fed’s inevitable rate hikes tighten credit access for shale firms, prompting the need for higher margins and profits, the old status quo will revert. As a reminder, this is how over a year ago Citi explained the dynamic of cheap credit leading to deflation and lower prices:

Easy access to capital was the essential “fuel” of the shale revolution. But too much capital led to too much oil production, and prices crashed.  The shale sector is now being financially stress-tested, exposing shale’s dirty secret: many shale producers depend on capital market injections to fund ongoing activity because they have thus far greatly outspent cash flow.

This is the key ingredient of what Goldman calls the shift to a new “structural deflationary change in the oil cost curve” as shown in chart above. As such, there is the danger that tighter conditions will finally remove the structural pressure for lower prices. However, judging by recent rhetoric by FOMC members, this is hardly an imminent issue, which means Saudi Arabia has only bad options: either cut production, prompting higher prices and even greater shale incursion and market share loss for the Kingdom, or restore the old status quo, sending prices far lower, and in the process collapsing Saudi government revenues potentially unleashing another budget crisis.

Source: ZeroHedge

Who’s Supporting The “New Normal” Housing Market in 2017?

https://martinhladyniuk.com/wp-content/uploads/2016/10/10-5-15_sbharbor_boats_lowrres.jpg?w=625

“A housing recovery that is highly dependent on real estate investors is a bit of a double-edged sword,” explained Daren Blomquist, senior VP at ATTOM Data Solutions. “Rapidly rising home values have been good for homeowner equity, but also have caused an affordability crunch for the first-time home buyers the housing market typically relies on for sustained, long-term growth.”

So the housing market is “starkly different than a decade ago,” said Alex Villacorta, VP of research and analytics at Clear Capital. “As such, it’s imperative for all market participants to understand the nuances of the New Normal Real Estate Market.”

They were both commenting on a joint white paper by ATTOM and Clear Capital, titled “Landlord Land,” that analyzes who is behind the US housing boom that drove home prices to new all-time highs, and in many markets far beyond the prior crazy bubble highs – even as homeownership has plunged and remains near its 50-year low.

First-time buyers are the crux to a healthy housing market, but they aren’t buying with enough enthusiasm. In 2012, buyers with FHA-insured mortgages – “who are typically first-time home buyers with a low down payment,” according to the report – accounted for 25% of all home purchases. In 2013, their share dropped to about 20%, in 2014 to 18%. Then hope began rising, briefly:

However, in January 2015, FHA lowered its insurance premium 50 basis points, and there was a modest resurgence in FHA buyers – a trend perhaps indicative of loosening credit requirements or of a desire to re-enter the housing market for those displaced during the crash.

Their share of home purchases ticked up to 22.3%. Alas, “the FHA resurgence was short lived” and in 2016 eased down to 21.7%.

With first-time buyers twiddling their thumbs, who then is buying? Who is driving this housing market?

Institutional investors? Defined as those that buy at least 10 properties a year, they include the largest buy-to-rent Wall Street landlords, some with over 40,000 single-family homes, who’ve “picked up the low-hanging fruit of distressed properties available at a discount between 2009 and 2013,” as the report put it. That was during the foreclosure crisis, when they bought these properties from banks.

In Q3, 2010, institutional investors bought 7% of all homes. In Q1 2013, their share reached 9.5%. As home prices soared, fewer foreclosures were taking place. By 2014, when home prices reached levels where the large-scale buy-to-rent scheme with its heavy expense structure wasn’t working so well anymore, these large buyers began to pull back. In 2016, the share of institutional investors dropped to just 2% of all home sales.

But as institutional investors stepped back, smaller investors jumped into the fray in large numbers, “willing to purchase in a wider variety of market landscapes and operate on thinner margins.”

To approximate total investor purchases of homes, the report looks at the share of purchases where the home is afterwards occupied by non-owner residents. In 2009, according to this metric, 28% of all home purchases were investor-owned properties. In 2010, it rose to 30%. In 2011, 32%. Then as big investors pulled out, it fell back to 30%. But by 2015, small investors arrived in large numbers, and by 2016, investor purchases jumped to 37%, an all-time high in the ATTOM data series going back 21 years.

The chart shows the share of purchases in a given year. Note the declining share of first-time buyers (blue line), the declining share of institutional investors (gray bars), and the surging share of smaller investors (green line). In other words, smaller investors are now driving this housing boom:

https://i0.wp.com/wolfstreet.com/wp-content/uploads/2017/02/us-home-buyers-by-category.png

The pie chart below shows the share of properties owned by investor size. Among investors in today’s housing market, small landlords that own one or two properties own in aggregate the largest slice of the rental housing pie – 79%:

https://i0.wp.com/wolfstreet.com/wp-content/uploads/2017/02/US-landlords-by-number-of-properties.png

However, Wall Street landlords are concentrated in just a few urban areas. For example, Invitation Homes, the 2012 buy-to-rent creature of private-equity firm Blackstone, which owns over 48,000 single-family homes and has nearly unlimited financial resources, including government guarantees on some of its debt, is concentrated in just 12 urban areas, where it has had an outsized impact.

Whereas small investors own properties across the entire country, in urban and rural areas, in cheap markets and ludicrously expensive markets. They own condos, detached houses, duplexes, and smaller multi-unit buildings.

So when the industry tells us about low inventories and strong demand in the housing market, it’s good to remember where a record 37% of that demand in 2016 came from: investors, most of them smaller investors. And when the financial equation no longer works for them, they’ll pull back, just like institutional investors have already done.

By Wolf Richter | Wolf Street

CFPB Director Cordray caught using Private Device and NO RECORD OF MESSAGES!!!

Richard Cordray, head of the Consumer Financial Protection Bureau (CFPB), used a private device for government communications, and didn’t create appropriate records of those messages with the bureau, according to documents obtained exclusively by The Daily Caller.

A longtime Democrat from Ohio, Cordray has served as head of the CFPB since January 2012, a position he is scheduled to hold through July 2018.

A source told The DC that he submitted a Freedom of Information Act (FOIA) request in August 2016 for more than a year’s worth of text messages on official devices to and from various CFPB staffers.

The bureau responded that there were no records on any “CFPB issued or CFPB reimbursed devices” for any text messages sent or received associated with Cordray.

A recent court decision in October 2016 ruled that the structure of the CFPB is unconstitutional because the president doesn’t have power to fire the director. The CFPB was a creation of Elizabeth Warren and created so that directors can only be dismissed with cause.

It’s not clear if President Donald Trump has the power to dismiss Cordray without cause.

Read more: http://dailycaller.com/2017/01/23/exclusive-cfpb-head-cordray-used-private-device-didnt-create-records-of-messages/#ixzz4WqCQ7SQc

Rent: Santa Monica Tops New York & Silicon Valley

Now referred to as “Silicon Beach,” Santa Monica’s rent rates for a one-bedroom apartment are approaching $5,000 per month.

https://s15-us2.ixquick.com/cgi-bin/serveimage?url=http%3A%2F%2Fcdn.rentcafe.com%2Fdmslivecafe%2F3%2F188180%2FCA_SantaMonica_21stStreetApartments_p0194856_2_img02_1_PhotoGallery.jpg%3Fwidth%3D580%26amp%3Bheight%3D385%26amp%3Bmode%3Dpad%26amp%3Bbgcolor%3D333333%26amp%3Bscale%3Dboth&sp=9fb8f03493f043d5a46451db62044986

According to the Apartment Guide, the average monthly rent for a one-bedroom in Santa Monica is the most expensive in the nation, at $4,799.20. Comparable rents in the local area are $3,922.67 in Venice; $3,780 in Playa Vista; and $3,320.67 in Marina del Rey.

New York is now the second-most expensive market, with an average one-bedroom apartment costing $4,562.72 per month. San Francisco, once the highest cost market, has fallen to an average $3,880.44 per month. New tech companies, including Snap, Inc., are drawing wealthy young professionals to the area.

Breitbart News has chronicled how apartment rental prices in New York City and Silicon Valley have fallenn about 8 percent, due to a glut of luxury unit construction. But the effective rent rates are down substantially more, because developers are giving multiple month rent concessions “to get heads in beds as quickly as possible,” according to Alexander Goldfarb, a San Francisco analyst with Sandler O’Neill + Partners.

In San Francisco’s trendy South of Market neighborhood, referred to as SoMa, four new high-rise apartment buildings are also offering super high-end amenities that include rooftop decks, state-of-the-art gyms and bike rooms. But despite free rent and nicer digs, none of the four buildings that opened in the last 18 months has achieved the 90 percent occupancy rate that developers need to flip their short-term high-interest rate development loans into low-rate long-term “take-out” financing.

Rent.com and the Apartmentguide.com websites predict that high rental prices should stay strong due to L.A.s’ median home price rising 348.1 percent in the last 30 years, from $116,061 to $520,000. The price jump was an even higher 349.3 percent in Orange County, where the price jumped from $143,210 to $643,483.


But according to mortgage banker Bruce Lawrence, the “term” period for construction loans is usually limited to 36 months, and the cost of that type of financing is at least twice the interest rate of 30-year “take-out financing.” Although the default rate for long-term apartment loans has been a tiny .01 percent, he believes that has been due to a “chronic lack of apartment supply,” which supply is beginning to overwhelm.

In the quarter ending December 31, 2016, Lawrence observed that a record 50,000 new apartment units in the U.S. were rented by tenants, or about six times the number in the year-earlier period. But new apartments completed and renting during the quarter hit 88,000, the highest number since the 1980s.

Looking forward, Lawrence believes that at least 378,000 new apartment units will be completed and start renting in 2017. With construction financing in place, he expects there will be no slowdown in building. Lawrence projects that by mid-year 2017, the U.S. will have a national glut of 100,000 new apartments, and in two years that number could be over 300,000. At that point, Lawrence sees rent “getting whacked.”

Bruce Lawrence comments that Santa Monica is a special case for high rents, because the city adopted rent control three decades ago. But with no limit on the rents for new units, California’s state bird is now the “construction crane.”

by Chriss W. Street | Breitbart

Top Questions about Mobile Home Investing

1. What is a mobile home good for?

Why would we buy these things? Do people actually want to live in a mobile home? They’re undesirable right? Aren’t mobile homes often in bad neighborhoods? I wouldn’t want to live there myself so why would I want to buy one? Well here’s the answer. Mobile homes are good for cash flow. I know everybody that gets started in real estate investing often try to do flipping because they want these big paychecks but the big paychecks, they come and they go. Reality television makes lots of money off showcasing how easy and fun rehabbing a home can be. However, cash flow doesn’t go anywhere, it stays there for a long time and it’s the way you obtain your financial freedom. So the more cash flow, the more mobile home investments you have, the more assets you acquire means the more post office paychecks you’re going to have coming in. Imagine having to go to your post office every month for your paycheck. So, that’s why mobile homes can be a good investment and not just something to disregard in your investment portfolio, you invest in mobile homes for the cash flow alone.

2. Do I need money to get started?

No. You do not need money to get started in mobile home investing. This is the biggest myth ever and some of the worst talk you can hear from some of your peers or your family is that you need to have money to make money. That’s a self-defeating prophecy.
This is False!!!!!
If you do not have time to invest in learning how to make cash off real estate investing then you will need money…. But, if you are sitting on a large savings account then you just need to put more time and effort on your part to make investing profitable for you. Put forth a little bit of effort to go out and find some deals, wholesale some deals, help out sellers, find some motivated sellers who need help and pocket thousands of dollars. Take that money and put it into your assets and keep doing the same thing over, over and over again until you have enough to acquire your financial freedom. Easy enough, right??? If you are laughing just keep reading and learning.

3. Do I need a dealer’s license to be a mobile home investor?

No. No you do not. Now if you ask a dealer this they’ll say yes. Yes you do, why do they say this? Just like if you ask a realtor if wholesaling properties is okay, they might say its illegal, because without a realtor they make no money. You do not need a dealer’s license to be a mobile home investor. Now if you’re selling, or flipping a certain amount of mobile homes every year you’re going to qualify for needing to get your dealer’s license but if you’re just dealing the properties or using them as rentals you need not have your dealer’s license.

4. Can I rent mobile homes in a mobile home parks?

Yes you can, But this is the number one mistake I see mobile home investors do is that they will pick up the phone and call all the mobile home parks in their area and t say, “Can I rent a mobile home in your park?” You know what they’re going to say? “No because I don’t want the problems of you coming into my park and doing a rental agreement with somebody and then your tenant thinking what’s in your rental agreement is more important than what is in my lot agreement. You understand? That causes problems. So just by picking up the phone and calling around asking everybody if you can rent in their park shows that you do not know what you are doing. Do not do that. Do not make this newbie mistake. Can you rent in parks? Yes. If they tell you that you can rent in their park go ahead. Just don’t ask them. Rule of thumb, don’t ask them. However, be smart enough to read the parks contract on lot rent and mobile home usage within their park.

5. Will a mobile home appreciate in value?

Well the Manufacturing Housing Institute says yes. I say no, not at all. The longer you own a mobile home the less its worth until eventually one day it’s going to be worth very little. That’s going to be the maximum value that you can get for the home in your area. Now other than that can they appreciate? In theory, well if there is mobile home parks in Florida where mobile home junkers go for $10,000 a piece but yet there’s mobile home parks in South Carolina where the mobile homes go for $500 or even free, so obviously there’s a difference in value being the different areas. So now all of a sudden if South Carolina real estate switched to be like Florida real estate well in theory then a mobile home could appreciate but does a mobile home appreciate? Generally, no. However, if you have read the first part of this post then you already realize that appreciation is not what you are striving for with mobile homes.

6. Should I buy a mobile home that needs to be moved?

Generally, no. You don’t want to do that because if you have to buy a mobile home and then it has to be moved, then you are now paying the amount to purchase the mobile home and also paying for the mobile home to be moved. You really do not want to do that. This extra expense could make your numbers go into the red. You will be adding all that extra expense into the purchase price of your mobile home. So what does this mean?? Well, what that means is that it is now going to take twice as long to get all your money back that you have invested into your mobile home. Do you want to wait 2-3 years before you actually make a buck or do you want to make it now? Do you want to do it in 6 months or 12 months, me I prefer 6 months so I try not to move mobile homes.
Now in my system “The Keys to Cash Flow”, I teach you how to get a mobile home moved for free. That’s right, for free. I show you how you can still go out and buy a mobile home that needs to be moved and use a different strategy where somebody else will be paying to move it instead of you. Yes, there are ways that you can buy a mobile home if it has to be moved and still make it into a deal. Just remember that the rule of thumb is that if you’re going to go out and buy a mobile home that has to be moved, it is going to increase the cost of the asset and delay your profits.

7. What kind of financing is available?

Generally, not much and usually none is available. No bank or finance company wants to finance mobile homes. When you get a whole bunch of mobile homes and you go into the bank and you say, “Well I’ve got a bunch of these mobile homes that I’m going to use as collateral towards something else.” No, the banks will not use them as collateral. Really a mobile home, is really only worth how much money it is getting in every single month or how much money it can be wholesaled or flipped for. So that’s the true value of the property, how much money does it get monthly and beyond that the banks really do not care how much it is worth. It is a mobile home. It’s a wobbly box. That’s the way they look at it. Banks will not refinance them and a lot of them have a hard time even giving you financing on them. If you go into a mortgage officer they are not going to be able to do a loan for you. Some try to go to a branch bank and they might do a loan for you or there is actually a smarter route out there called private moneylenders. Now when you start getting involved in being a mobile home investor other investors see what you are doing and they will say, “Wow, there’s some really big numbers there. Why don’t you let me give you the cash to go ahead and fix that deal and put some money in it.” Well that all works out great. You give them a better interest rate than they can get any place else bar none and still have a great deal on your hands. If you can give someone clear up to 15% on a 12-month or even a 3-month then that’s amazing. Now imagine if you had your deal with them where they were making 15% every 3 months imagine if you have that with them for a full 12 months that could be up to a 60% return per year. Who offers that? This makes it a win win situation for private moneylenders and for the average investor to make monthly cash flow off a small investment.

8. Singlewides or doublewides?

Singlewides!! Doublewides are double the expense. You think, “Oh, if it’s a double wide is it going to be double the amount of money I get each month for it?” Nope, not really. Often what’s going to happen is doublewides are going to have a mortgage payment on them. So every month there is nobody paying you rent, you will still have to pay a note to someone. This stops the benefits of investing in mobile homes as the benefit is the large monthly rent and the money you can make flipping the homes. If you are constantly making a payment on a large note then you might as well invest in a single family home where you will get equity. Stay away from doublewides in mobile home parks; they are not good investments and do not produce enough cash to invest in them.

9. Can I buy mobile homes, no money down?

Absolutely. Here’s the neat thing about mobile home investing is that there are people out there that are having really big problems and very motivated to sell. Maybe they have to move out of state, maybe they have got behind on their payments, maybe they have to sell it immediately and they have to move someplace else. Whatever reason they have, they are now motivated sellers. Now, even with a percentage of our population living in mobile homes and being motivated to sell you still do not see realtors fighting over mobile home listings. Most of the time the motivated seller’s only choice is to go to the dealer and see if the dealer will take it back and do you think they are? No. No of course they are not, so here’s what happens, it either sits there and it gets taken back by the bank or they try to rent it out to a family member who will end up shagging the place out or you know just a number of negative things that will happen there. So really the only help that they have is you and I. We are the only ones that will cater to this population. We are the only ones that will help them. So you can make a lot of money just solving someone’s problems by buying mobile homes, no money down.

10. How old should the mobile homes be?

Well, I spoke earlier that we don’t want this huge bill looming over our heads because the longer it takes us to pay off the mobile home the longer it’s going to take for us to actually get any money off the deal. Generally, you want a home that’s really close to being paid off or is already paid off so that you can start reaping cash flow off the property immediately. So what you’re looking for is probably 15,20 year old mobile homes but of course we said no doublewides so keep it to singlewides and that is your honey hole properties.

by Robert Woodruff

Fed Raised Rates Once During Obama Years, Yet Promises Constant Rate Hikes During Trump Era?

https://i0.wp.com/theeconomiccollapseblog.com/wp-content/uploads/2016/12/Janet-Yellen-Public-Domain.jpg

Now that Donald Trump has won the election, the Federal Reserve has decided now would be a great time to start raising interest rates and slowing down the economy.  Over the past several decades, the U.S. economy has always slowed down whenever interest rates have been raised significantly, and on Wednesday the Federal Open Market Committee unanimously voted to raise rates by a quarter point.  Stocks immediately started falling, and by the end of the session it was their worst day since October 11th.

The funny thing is that the Federal Reserve could have been raising rates all throughout 2016, but they held off because they didn’t want to hurt Hillary Clinton’s chances of winning the election.

And during Barack Obama’s eight years, there has only been one rate increase the entire time up until this point.

But now that Donald Trump is headed for the White House, the Federal Reserve has decided that now would be a wonderful time to raise interest rates.  In addition to the rate hike on Wednesday, the Fed also announced that it is anticipating that rates will be raised three more times each year through the end of 2019

Fed policymakers are also forecasting three rate increases in 2017, up from two in September, and maintained their projection of three hikes each in 2018 and 2019, according to median estimates. They predict the fed funds rate will be 1.4% at the end of 2017, 2.1% at the end of 2018 and 2.9% at the end of 2019, up from forecasts of 1.1%, Federa1.9% and 2.6%, respectively, in September. Its long-run rate is expected to be 3%, up slightly from 2.9% previously. The Fed reiterated rate increases will be “gradual.”

So Barack Obama got to enjoy the benefit of having interest rates slammed to the floor throughout his presidency, and now Donald Trump is going to have to fight against the economic drag that constant interest rate hikes will cause.

How is that fair?

As rates rise, ordinary Americans are going to find that mortgage payments are going to go up, car payments are going to go up and credit card bills are going to become much more painful.  The following comes from CNN

Higher interest rates affect millions of Americans, especially if you have a credit card or savings account, or want to buy a home or a car. American savers have earned next to nothing at the bank for years. Now they could be a step closer to earning a little more interest on savings account deposits, even though one rate hike won’t change things overnight.

Rates on car loans and mortgages are also likely to be affected. Those are much more closely tied to the interest on a 10-year U.S. Treasury bond, which has risen rapidly since the election. With a Fed hike coming at a time when interest on the 10-year note is also rising, that won’t help borrowers.

The higher interest rates go, the more painful it will be for the economy.

If you recall, rising rates helped precipitate the financial crisis of 2008.  When interest rates rose it slammed people with adjustable rate mortgages, and suddenly Americans could not afford to buy homes at the same pace they were before.  We have already been watching the early stages of another housing crash start to erupt all over the nation, and rising rates will certainly not help matters.

https://s17-us2.ixquick.com/cgi-bin/serveimage?url=http%3A%2F%2Fi.imgur.com%2FAkc7u.jpg&sp=eb95abd9301bb4c4d88dfdda92ec9f36

But why does the Federal Reserve set our interest rates anyway?

We are supposed to be a free market capitalist economy.  So why not let the free market set interest rates?

Many Americans are expecting an economic miracle out of Trump, but the truth is that the Federal Reserve has far more power over the economy than anyone else does.  Trump can try to reduce taxes and tinker with regulations, but the Fed could end up destroying his entire economic program by constantly raising interest rates.

Of course we don’t actually need economic central planners.  The greatest era for economic growth in all of U.S. history came when there was no central bank, and in my article entitled “Why Donald Trump Must Shut Down The Federal Reserve And Start Issuing Debt-Free Money” I explained that Donald Trump must completely overhaul how our system works if he wants any chance of making the U.S. economy great again.

One way that Trump can start exerting influence over the Fed is by nominating the right people to the Federal Open Market Committee.  According to CNN, it looks like Trump will have the opportunity to appoint four people to that committee within his first 18 months…

Two spots on the Fed’s committee are currently open for Trump to nominate. Looking ahead, Fed Chair Janet Yellen’s term ends in January 2018, while Vice Chair Stanley Fischer is up for re-nomination in June 2018.

Within the first 18 months of his presidency, Trump could reappoint four of the 12 people on the Fed’s powerful committee — an unusual amount of influence for any president.

By endlessly manipulating the economy, the Fed has played a major role in creating economic booms and busts.  Since the Fed was created in 1913, there have been 18 distinct recessions or depressions, and now the Fed is setting the stage for another one.

And anyone that tries to claim that the Fed is not political is only fooling themselves.  Everyone knew that they were not going to raise rates during the months leading up to the election, and it was quite clear that this was going to benefit Hillary Clinton.

But now that Donald Trump has won the election, the Fed all of a sudden has decided that the time is perfect to begin a program of consistently raising rates.

If I was Donald Trump, I would be looking to shut down the Federal Reserve as quickly as I could.  The essential functions that the Fed performs could be performed by the Treasury Department, and we would be much better off if the free market determined interest rates instead of some bureaucrats.

Unfortunately, most Americans have come to accept that it is “normal” to have a bunch of unelected, unaccountable central planners running our economic system, and so it is unlikely that we will see any major changes before our economy plunges into yet another Fed-created crisis.

By Michael Snyder | The Economic Collapse

The Dramatic Impact Of Surging Rates On Housing In One Chart

https://martinhladyniuk.com/wp-content/uploads/2015/06/5273f-murrietatemeculabankruptcyattorneydavidnelsonpitfalls.jpgTo visualize the impact the recent spike in mortgage rates will have on the US housing market in general, and home refinancing activity in particular, look no further than this chart from the October Mortgage Monitor slidepack by Black Knight

The chart profiles the sudden collapse of the refi market using October and November rates. As Black Knight writes, it looks at the – quite dramatic – effect the mortgage rate rise has had on the population of borrowers who could both likely qualify for and have interest rate incentive to refinance. It finds it was cut in half in just one month.

Some more details from the source:

  • The results of the U.S. presidential election triggered a treasury bond selloff, resulting in a corresponding rise in both 10-year treasury and 30-year mortgage interest rates
  • Mortgage rates have jumped 49 BPS in the 3 weeks following the election, cutting the population of refinanceable borrowers from 8.3 million immediately prior to the election to a total of just 4 million, matching a 24-month low set back in July 2015
  • Though there are still 2M borrowers who could save $200+/month by refinancing and a cumulative $1B/month in potential savings, this is less than half of the $2.1B/ month available just four weeks ago
  • The last time the refinanceable population was this small, refi volumes were 37 percent below Q3 2016 levels

https://i0.wp.com/www.zerohedge.com/sites/default/files/images/user5/imageroot/2016/11/29/black%20knight%202_0.jpg

Which is bad news not only for homeowners, but also for the banks, whose refi pipeline – a steady source of income and easy profit – is about to vaporize.

It’s not just refinancings, however, According to the report, as housing expert Mark Hanson notes, here is a summary of the adverse impact the spike in yields will also have on home purchases:

  • Overall purchase origination growth is slowing, from 23% in Q3’15 to 7% in Q3’16.
  • The highest degree of slowing – and currently the slowest growing segment of the market – is among high credit borrowers (740+ credit scores).
  • The 740+ segment has been mainly responsible for the overall recovery in purchase volumes and in fact, currently accounts for 2/3 of all purchase lending in the market today.
  • Since Q3’15 the growth rate in this segment has dropped from 27% annually to 5% in Q3’16. (NOTE, Q3/Q4’15 included TRID & interest rate volatility making it an easy comp).
  • This naturally raises the question of whether we are nearing full saturation of this market segment.
  • Low credit score growth is still relatively slow, and only accounts of 15% of all lending (as compared to 40% from 2000-2006), the lowest share of purchase originations for this group on record.
    ITEM 2) The “Refi Capital Conveyor Belt” has ground to a halt, which will be felt across consumer spend. AND Rates are much higher now than in October when this sampling was done.

Source: ZeroHedge | Data Source

Mortgage Applications Crash 30% As Borrowing Rates Surge

Dear Janet…

In the last few months, as The Fed has jawboned a rate hike into markets, mortgage applications in America have collapsed 30% to 10-month lows – plunging over 9% in the last week as mortgage rates approach 4.00%.

https://i0.wp.com/static4.businessinsider.com/image/582f57bcba6eb6d3008b54a0-1200/30-year-mortgage.png?quality=80&strip=info&w=720

https://i0.wp.com/www.zerohedge.com/sites/default/files/images/user3303/imageroot/2016/11/16/120161115_jgb3_0.jpg

We suspect the divergent surge in homebuilders is overdone…

https://i0.wp.com/www.zerohedge.com/sites/default/files/images/user3303/imageroot/2016/11/16/20161116_mba_0.jpg

Source: ZeroHedge

Secular Trend In Rates Remain Lower: Yield Bottom Still Ahead Of Us

Donald Trump’s victory sparked a tremendous sell-off in the Treasury market from an expectation of fiscal stimulus, but more broadly, from an expectation that a unified-party government can enact business-friendly policies (protectionism, deregulation, tax cuts) which will be inflationary and economically positive. It doesn’t take too much digging to show that the reality is different. The deluge of commentaries suggesting ‘big-reflation’ are short-sighted. Just as before last Tuesday we thought the 10yr UST yield would get below 1%, we still think this now.

https://i0.wp.com/www.kesslercompanies.com/sites/default/files/media/images/10yrlong.png

Business Cycle

No matter the President, this economic expansion is seven and a half years old (since 6/2009), and is pushing against a difficult history. It is already the 4th longest expansion in the US back to the 1700’s (link is external). As Larry Summers has pointed out (link is external) after 5 years of recovery, you add roughly 20% of a recession’s probability each year thereafter. Using this, there is around a 60% chance of recession now.

History also doesn’t bode well for new Republican administrations. Certainly, the circumstances were varied, but of the five new Republican administrations replacing Democrats in the 19th and 20th centuries, four of them (Eisenhower, Nixon, Reagan, and George W. Bush) faced new recessions in their first year. The fifth, Warren Harding, started his administration within a recession.

Fiscal Stimulus 

Fiscal stimulus through infrastructure projects and tax cuts is now expected, but the Federal Reserve has been begging for more fiscal help since the financial crisis and it has been politically infeasible. The desire has not created the act. A unified-party government doesn’t make it any easier when that unified party is Republican; the party of fiscal conservatism. Many newer House of Representatives members have been elected almost wholly on platforms to reduce the Federal debt. Congress has gone to the wire several times with resistance to new budgets and debt ceilings. After all, the United States still carries a AA debt rating from S&P as a memento from this. Getting a bill through congress with a direct intention to increase debt will not be easy. As we often say, the political will to do fiscal stimulus only comes about after a big enough decrease in the stock market to get policy makers scared.

Also, fiscal stimulus doesn’t seem to generate inflation, probably because it is only used as a mitigation against recessions. After the U.S. 2009 Fiscal stimulus bill, the YoY CPI fell from 1.7% to 1% two years later. Japan has now injected 26 doses (link is external) of fiscal stimulus into its economy since 1990 and the country has a 0.0% YoY core CPI, and a 10yr Government bond at 0.0%.

Rate Sensitive World Economy

A hallmark of this economic recovery has been its reliance on debt to fuel it. The more debt outstanding, the more interest rates influence the economy’s performance. Not only does the Trump administration need low rates to try to sell fiscal stimulus to the nation, but the private sector needs it to survive. The household, business, and public sectors are all heavily reliant on the price of credit. So far, interest rates rising by 0.5% in the last two months is a drag on growth.

https://i0.wp.com/www.kesslercompanies.com/sites/default/files/media/images/debt.png

Global Mooring

Global policies favoring low rates continue to be extended, and there isn’t any economic reason to abandon them. Just about every developed economy (US, Central Europe, Japan, UK, Scandinavia) has policies in place to encourage interest rates to be lower. To the extent that the rest of the world has lower rates than in the US, this continues to exert a downward force on Treasury yields.

https://i0.wp.com/www.kesslercompanies.com/sites/default/files/media/images/germus.png

Demographics

As Japan knows and we are just getting into, aging demographics is an unmovable force against consumption, solved only with time. The percent of the population 65 and over in the United States is in the midst of its steepest climb. As older people spend less, paired with slowing immigration from the new administration, consumer demand slackens and puts downward pressure on prices.

https://i0.wp.com/www.kesslercompanies.com/sites/default/files/media/images/oldpop.png

Conclusion

We haven’t seen such a rush to judgement of boundless higher rates that we can remember. Its noise-level is correlated with its desire, not its likelihood. While we cannot call the absolute top of this movement in interest rates, it is limited by these enduring factors and thus, we think it is close to an end. In a sentence, not only will the Trump-administration policies not be enacted as imagined, but even if they were, they won’t have the net-positive effect that is hoped for.  We think that a 3.0% 30yr UST is a rare opportunity buy.

Source: ZeroHedge

The Mythical Housing Affordability Crisis

https://martinhladyniuk.com/wp-content/uploads/2016/10/ecd701_b058db6e816f48268bd11a2bd567c359mv2.jpg?w=625

California is expensive to anyone who wants to move here, but is that a “crisis”? State Treasurer John Chiang and the bureaucrats in Sacramento want you to believe this so they can add another 5 million people to the state, and they don’t want to stop there. More people everywhere, more cars on the jam-packed streets and freeways, more kids in already crowded schools, more water resources drained, more pollution, and more environmental damages. The character and nature of our state and every community changed forever. Sacramento wants them to live in your neighborhood. Why should we let them ruin the good thing we’ve sacrificed for?

Let’s examine homeownership affordability in the state. According to records from the California Association of REALTORS, their Affordability index is currently at 34, meaning 34% of California families – using traditional metrics – can afford to buy the median priced California home. In the past 28 years, this index has been as low as 22% in 1991 and as high as 56% in 2012. For comparison, the national affordability index is at 60%. So California is expensive, but it has been for decades. If home ownership, currently 54% in California, were truly unaffordable we should be seeing massive mortgage defaults. But only 1.41% of California mortgages are at risk of foreclosure, meaning 98.59% of California homeowners with a mortgage are affording them. Does that sound like a crisis or a reason to add another 5 million people to the state?

The definition of “unaffordable” is “too expensive for people to be able to buy or pay for.” At California’s current median price, homes are selling so fast the current statewide inventory of unsold homes would last only 3.5 months if new inventory didn’t regularly come on the market. This sales pace is with nearly every loan requiring very strict qualifying standards.

State Treasurer Jon Chiang wants your community to grow because not everyone who wants to live in it can afford it. There will always be people who can’t afford to live wherever they want. I would love to live in Montecito, so should Sacramento make that affordable for me, for everyone else in the state, or in the country? The state is not one median house price. It has expensive areas and cheap neighborhoods, many a relatively short commute between. In Santa Barbara county the median price on the south coast is $1,200,000 for a single family home. Less than an hour away in Lompoc the median single-family home sales price is $310,000 and two bedroom apartments that rent for $1,950 a month in Santa Barbara go for $1,050 in Lompoc. But of course, there are still people who can’t afford even that. Though renters tend to stay in a residence for a median of 4 years, but up to 40% move in less than a year and they can leave for more affordable digs with just a 30-day notice.

So, maybe California isn’t for everyone? But should it be? Should we have everyone in the United States living here? Maybe there are better opportunities in other parts of our great country for those who find us too expensive? According to Bloomberg median price for starter homes in Atlanta, GA is $87,000; St. Louis, MO $65,000; and Detroit, MI $33,075. Many homes can be had for less! Employment is even more plentiful than in California with the unemployment rates for these cities averaging 5.3%. My best friend from Dos Pueblos High School in Goleta moved his wife, who grew up in Ventura, and their two children, to Colorado Springs for a more affordable home purchase. A close friend from Goleta Valley Junior High moved to Dallas and found a wife, job, and homeownership. One of my brothers, who grew up Santa Barbara, is very happy with his family in Denver, owning a $450,000 home that would cost at least $1,300,000 in Santa Barbara.

If you don’t build them they won’t come, and the ones who can’t afford to live here will move to less expensive communities. Let’s not spoil the good state we have to make Sacramento and developers happy.

By Edward Muller | The ECSB

Canadian Housing Bubble Debt Stiring Financial Crisis Fears

https://s15-us2.ixquick.com/cgi-bin/serveimage?url=http%3A%2F%2Fd3exkutavo4sli.cloudfront.net%2Fwp-content%2Fuploads%2F2015%2F06%2FToronto-condo-boom.jpg&sp=d7cedb4c66de62e9f5c87c31189a7e6f

Toronto Condo Boom.

Everyone is fretting about the Canadian house price bubble and the mountain of debt it generates – from the IMF on down to the regular Canadian. Now even the Bank for International Settlement (BIS) and the Organization for Economic Co-operation and Development (OECD) warn about the risks.

Every city has its own housing market, and some aren’t so hot. But in Vancouver and Toronto, all heck has broken loose in recent years.

In Vancouver, for example, even as sales volume plunged 45% in August from a year ago – under the impact of the new 15% transfer tax aimed at Chinese non-resident investors – the “benchmark” price of a detached house soared by 35.8%, of an apartment by 26.9%, and of an attached house by 31.1%. Ludicrous price increases!

In Toronto, a similar scenario has been playing out, but not quite as wildly. In both cities, the median detached house now sells for well over C$1 million. Even the Bank of Canada has warned about them, though it has lowered rates last year to inflate the housing market further – instead of raising rate sharply, which would wring some speculative heat out of the system. But no one wants to deflate a housing bubble.

During the Financial Crisis, when real estate prices in the US collapsed and returned, if only briefly, to something reflecting the old normal, Canadian home prices barely dipped before re-soaring. And this has been going on for years and years and years.

The OECD in its Interim Economic Outlook warned:

Over recent years, real house prices have been growing at a similar or higher pace than prior to the crisis in a number of countries, including Canada, the United Kingdom, and the United States. The rise in real estate prices has pushed up price-to-rent ratios to record highs in several advanced economies.

Canada stands out. Even on an inflation-adjusted basis, Canadian home prices have long ago shot through the roof. The OECD supplied this bone-chilling chart. The top line (orange) represents Canadian house price changes, adjusted for inflation:

https://i0.wp.com/wolfstreet.com/wp-content/uploads/2016/09/Canada-house-price-changes-v-US-UK-Germany-OECD.png

In the US, several national indices have now exceeded the crazy prices of the Housing Bubble that started blowing up in 2006. In some cities, the median price has shot way past the prior bubble highs – in San Francisco, by over 50%! But other cities have lagged behind, and the national averages paper over the local bubbles.

In Canada, real estate is more concentrated. The Canadian market is about one-tenth the size of the US market. But the two largest local markets, Toronto and Vancouver, together make up 54% of the Teranet National Bank House Price Index. So when these two local bubbles begin to deflate – or implode – they will create enormous havoc across Canada.

Real estate is highly leveraged. It’s funded with debt. Many folks cite down-payment requirements in rationalizing why the Canadian market cannot implode, and why, if it does implode, it won’t pose a problem for the banks. However, an entire industry has sprung up to help homebuyers get around the down-payment requirements.

So household debt has been piling up for years, driven by mortgage debt. Statistics Canada reported two weeks ago that the ratio of household debt to disposable income has jumped to another record in the second quarter, to a breath-taking 167.6%:

https://i0.wp.com/wolfstreet.com/wp-content/uploads/2016/09/Canada-household-debt-to-income-ratio-2016-Q2.png

The BIS now too, in its Quarterly Review, jumped on the bandwagon of issuing ineffectual warnings about this pile of debt, fingering particularly China – and in the same breath Canada:

According to the BIS early warning indicators, which are intended to capture financial overheating and potential financial distress over medium-term horizons, credit growth continues to be unusually high relative to GDP in several Asian economies as well as in Canada.

Estimated debt service ratios, which attempt to capture principal and interest payments relative to income, appear to be at manageable levels at current interest rates for most countries, although they point to potential concerns in Brazil, Canada, China, and Turkey.

The BIS developed a metric – the “credit-to-GDP gap” – that compares current credit levels to long-term trends and serves as an early warning indicator for financial crises.

Everyone wants to know when the next financial crisis happens. It will happen, but once again, it will surprise the economic establishment because, in the eloquent words of the BIS, debts always “appear to be at manageable levels” – until suddenly, they’re not.

The country with the highest credit-to-GDP gap is China (30.1), and the second highest is Canada (12.1). When it comes to debt creation, it’s not a good idea to be mentioned in the same breath with China. Turkey (9.6) is next in line. Then Mexico (8.8). And Brazil (4.6). Oh, and Australia (4.4)! So housing-bubble Canada is in excellent company!

The only saving grace is the permanently near-zero-interest-rate environment. Because that’s what it takes to keep this thing from deflating, according to the BIS, and even then there are “concerns.” But these countries, particularly Canada, are going to be in trouble when rates rise even a little.

So have central banks painted themselves and their entire bailiwicks into a corner with their ingenious emergency policies that have been dragging on for eight years? You bet. Is there a way out? Nope. Not a good one, at least. It’s just a question of when and how – and who gets to pay.

By Wolf Richter | Wolf Street


Crowdfunded House Flipper Raises $1 Million In 12 Hours

… and It Only Costs Him 14%

https://s17-us2.ixquick.com/cgi-bin/serveimage?url=http%3A%2F%2Fwww.bankingsense.com%2Fwp-content%2Fuploads%2F2015%2F02%2Fhouse-flipping.png&sp=3c2b8eebe342ca2e5dd773b56b9888fd

“It’s the greatest thing in the world,” exclaims Alex Sifakis – the 33 year old Florida ‘flipper’ – saying he has never raised this much money this fast (despite teh 14% cost of capital). As Bloomberg reports, house flippers and property developers are increasingly crowdfunding — tapping the virtual wallets of anonymous internet backers on various platforms – because “the amount of money you can raise isn’t limited by anything but their investor base.” As one of the ‘investors’ in this crowdfunded flipfest notes “if something goes bad, you have the asset to fall back on,” but, as Bloomberg rebukes, speed and property loans may not mix — remember 2008?

Bloomberg points out that the house flipper from Jacksonville, Florida, crowdfunded nine deals totaling more than $9 million through RealtyShares over the last two and a half years. A July deal for $1 million took him just 12 hours.

“Generally, raising money takes so much time,’’ said Sifakis, 33. “This offers so much flexibility and time savings. It’s so much better than going to family offices, banks or Wall Street firms.’’

House flippers and property developers are increasingly crowdfunding — tapping the virtual wallets of anonymous internet backers on platforms such as RealtyShares, LendingHome, PeerStreet and Patch of Land. For riskier ventures, such as building new homes and buying, renovating and selling existing ones, they’re finding quick financing can be easier to get online than from banks.

That’s contributed to an increase in home flipping. In the second quarter, 39,775 investors bought and sold at least one house, the most since 2007, according to ATTOM Data Solutions.

https://i0.wp.com/www.zerohedge.com/sites/default/files/images/user3303/imageroot/2016/09/20/20160921_flip1_0.jpg

The ease of fundraising through these nontraditional lenders could be a warning sign, according to Erik Gordon, a law professor at the University of Michigan in Ann Arbor.

 “Whenever you see a big difference between the terms on which you can raise money in one market versus another market, something is wrong in at least one of those markets,” Gordon said.

“It usually is the market with the least-experienced players, and they usually end up wishing they hadn’t played.”

Sifakis said he’s borrowing money at an annual rate of 14 percent over two and a half years. He keeps all the profit he makes from selling homes, he said.

So far, Bloomberg notes that there have been few defaults in real estate crowdfunding deals. When they happen, the platforms say they’ll pay investors the proceeds from property sales.

The business has other potential pitfalls.

When it comes to real estate, faster isn’t always better. Wall Street’s home-mortgage machine of the mid-2000s valued speed over accuracy, with disastrous results, though most crowdfunding sites cater to investors and not homebuyers. Also, clicking for capital can be exploited by fraudsters who may not be who they say they are, according to Sara Hanks, co-founder and CEO of CrowdCheck, which provides due-diligence services for online investors.

“We’ve seen some things where the entity that’s supposed to own the property doesn’t actually own it,’’ she said.

What could go wrong?

Jeff Bullian, a Boston-based consultant, has invested in about 30 deals on RealtyShares and in a handful of others on websites such as Patch of Land. So far, only one deal has gone bad, he said. In that instance, the platform, which Bullian declined to identify, went to bat for investors so everyone could get their money back along with a small return.

Bullian said he contributes an average of $10,000 in each deal for returns of about 10 percent to 20 percent, similar to what he was getting from a marketplace lender.

“I really like the risk profile of real estate deals compared with some other investments because they’re secured,” Bullian said. “If something goes bad, you have the asset to fall back on.”

Sifakis, the Florida flipper, said he typically gets a $3 million line of credit from an investment firm for about every $1 million he raises on RealtyShares, giving him added buying power.

“It’s the greatest thing in the world,’’ Sifakis said. “The amount of money you can raise isn’t limited by anything but their investor base. And the investor base is growing and growing.”

The Fed has fostered this idiocy by manipulating everything and memories are short in housing markets. This will not end well…speed and property loans may not mix — remember 2008?

Source: Zero Hedge

Did North Dakota Boom Towns Overbuild?

https://s16-us2.ixquick.com/cgi-bin/serveimage?url=http%3A%2F%2Ffinance-commerce.com%2Ffiles%2F2015%2F02%2FND-Boomtown.jpg&sp=46f43e8995fbd0ac676c2e5d97838f92

The oil boom caused a housing shortage in North Dakota’s Bakken oilfield. And towns rushed to build more homes and apartments. Now the price of oil is low, and the thousands who rushed to North Dakota for work are leaving. But new houses are still going up. Inside Energy’s Emily Guerin asks: Are these towns overbuilding?

Profile of a stretch of North Dakota highway witnesses oil’s boom and bust


Palo Alto Says Zuckerberg Can’t Build Compound Intended For His Family’s Privacy

Social media mogul Mark Zuckerberg’s life seems to always revolve around houses in Palo Alto.

A house in Palo Alto is where he grew Facebook from a seed harvested at Harvard into one of the defining companies of 21st century Silicon Valley. A house in Palo Alto is where Zuckerberg and his family presently call home. And four houses in Palo Alto adjacent to his own are now a perhaps rare check on the authority of the sixth richest man in the world.

https://cdn0.vox-cdn.com/thumbor/fU25TnvHEeIfFQhwq-4tFeI6olg=/1000x0/filters:no_upscale()/cdn0.vox-cdn.com/uploads/chorus_asset/file/7115411/palo%20alto1.jpg

The contentious parcels. City of Palo Alto

In 2013, Zuckerberg bought the houses bordering his property, eventually revealing plans to demolish them. He was worried about his privacy. (You can all insert your own ironic “Facebook data mining privacy” joke here.)

Unfortunately, the city isn’t proving keen on his idea. We can’t imagine why they’d be a tiny bit sensitive about sacrificing perfectly good housing stock for the sake of its wealthiest resident’s desire not to live next to anyone.

To be fair, Zuckerberg also planned to build new homes on the four parcels—smaller ones that wouldn’t be able to peer into his own house. But Palo Alto’s Architectural Review Board didn’t like the looks of his proposed new homes and bounced the plan at Thursday’s meeting.

https://cdn1.vox-cdn.com/uploads/chorus_asset/file/7115415/palo%20alto2.jpg

The board is an advisory committee, and Palo Alto’s director of planning Hillary Gitelman can override their decision and approve the proposals if she wants to. But architects who work in Palo Alto tell Curbed SF that this rarely happens. Railroading unpopular projects through wouldn’t be smart politics, after all.

Zuckerberg will probably have to come up with some new designs, resign himself to keeping the houses the way they are, or just start spending most of his time crashing in one of those sleep pods at the office.

https://cdn0.vox-cdn.com/thumbor/o9DMC1ttM-8O1mQ5yM1tlOZIzVk=/1000x0/filters:no_upscale()/cdn0.vox-cdn.com/uploads/chorus_asset/file/7115423/palo%20alto3.jpg

By Adam Brinklow | Curbed San Francisco


Palo Alto Mayor Wants to ‘Meter’ ‘Reckless Job Growth’

https://i0.wp.com/media.breitbart.com/media/2016/09/35799714_49fd1950a5_z-640x480.jpg

Palo Alto mayor Patrick Burt says: “Palo Alto’s greatest problem right now is the Bay Area’s massive job growth.” And he wants to “meter” businesses to control “reckless job growth” in the Silicon Valley suburb.

Palo Alto has long been the center of Silicon Valley’s tech start-ups, and features 14 of the world’s top 25 venture capital firms within a 10-mile radius. But in an interview with the real estate blog Curbed.com, Mayor Burt talked about how “Our community will not accept deterioration in our mobility.”

As a tech CEO that sold out for big bucks, Burt seems to want to keep out the riff-raff:

“First, we’re in a region that’s had extremely high job growth at a rate that is just not sustainable if we’re going to keep [Palo Alto] similar to what it’s been historically. Of course we know that the community is going to evolve. But we don’t want it to be a radical departure. We don’t want to turn into Manhattan.”

Burt claims it is the role of local government to avoid “reckless job growth”:

“We want metered job growth and metered housing growth, in places where it will have the least impact on things like our transit infrastructure. We look at the rates and we balance things.”

To “meter” housing growth, 97 percent of the non-commercial portion of Palo Alto is zoned R1 single family residence, while only 3 percent is zoned for multi-family apartments. The least expensive “starter home” in Palo Alto is listed at $995,000.

But according to the Planning Department, 45 percent of Palo Alto workers live in multi-unit housing, which means almost half of Palo Alto workers must commute in every day.

Mark Zuckerberg is believed to be the wealthiest resident of Palo Alto. He is a well known liberal, and made his fortune as the CEO of Facebook. The company data-mines the deepest secrets of 1.7 billion users, then sells those secrets to the highest bidder. Zuckerberg contributes heavily to liberal causes, advocates for unlimited immigration, and says he hates the wall Republican presidential nominee Donald Trump wants to build along the U.S./Mexican border.

But after Mr. Zuckerberg bought the three houses bordering surrounding his own Palo Alto home, he recently built an 8-foot high privacy wall around the compound for himself, his wife and young daughter.

Zuckerberg quietly submitted architectural drawings to the Palo Alto Planning Department this summer that were expected to be favored for approval, because the plan reduced density by demolishing four houses to build a mansion and three casitas.

However, they were rejected amidst a local controversy over gentrification that erupted when Palo Alto Planning and Transportation Commissioner Kate Vershov Downing announced in early September that her family is leaving Palo Alto for Santa Cruz, because they, like many other residents, can no longer afford the area.

Downing’s resignation letter bemoaned that despite splitting a house with another couple, her rent is still $6200 a month. She estimates that to buy the house and share it with children would cost $2.7 million. The monthly cost of a home mortgage, tax and insurance payment would be $12,177, or $146,127 per year. Downing laments that sum is too much for her as an attorney and her husband as a software engineer.

Downing’s resignation put unwelcome pressure on the Palo Alto’s Architectural Review Board to start being more family friendly. On September 15, the Board rejected Mr. Zuckerberg’s plans because they would seriously undermine the city’s housing stock.

The Architectural Board is only an advisory committee, and Palo Alto’s Director of Planning Hillary Gitelman can override their decision and approve the proposals. But local architects familiar with Palo Alto told the Curbed.com this rarely happens, because “railroading unpopular projects through wouldn’t be smart politics.”

It is unclear how widespread Mayor Burt’s feelings are, but there is at least some backlash.

By Chriss W. Street | Brietbart


Why Are So Many Conservatives, Preppers And Christians Moving To The Great Northwest?

https://i0.wp.com/endoftheamericandream.com/wp-content/uploads/2016/09/Montana-Landscape-Public-Domain-400x267.jpg

Thousands of Americans are flocking to “Big Sky” country, and this movement has become so prominent that it has even caught the attention of the mainstream media. Within the last several weeks, both The Chicago Tribune and The Economist have done major articles on this phenomenon. From all over the country, conservatives, preppers and Bible-believing Christians are moving to Montana, Wyoming, Idaho and the eastern portions of Oregon and Washington. As you will see below, this region has become known as the “American Redoubt”, and for a variety of reasons it is considered by many survivalists to be one of the top “safe zones” for when things really start falling apart in this nation.

Many of you that are reading this article may think that it is quite strange that families are quitting their jobs, packing up everything they own and moving to the middle of nowhere, but for those that are doing it this actually make perfect sense. A recent Chicago Tribune article on this phenomenon began by profiling an ex-California couple that decided to flee the state for the friendly confines of north Idaho…

Don and Jonna Bradway recently cashed out of the stock market and invested in gold and silver. They have stockpiled food and ammunition in the event of a total economic collapse or some other calamity commonly known around here as “The End of the World As We Know It” or “SHTF” – the day something hits the fan.

The Bradways fled California, a state they said is run by “leftists and non-Constitutionalists and anti-freedom people,” and settled on several wooded acres of north Idaho five years ago. They live among like-minded conservative neighbors, host Monday night Bible study around their fire pit, hike in the mountains and fish from their boat. They melt lead to make their own bullets for sport shooting and hunting – or to defend themselves against marauders in a world-ending cataclysm.

The original article that the Chicago Tribune picked up came from the Washington Post.  It was authored by Kevin Sullivan and photos were done by Matt McClain.  If you would like to read the entire article you can find it right here.

And of course the Bradways are far from alone. Over the past 10 years, approximately five million people have fled the state of California. If I was living there, I would want to move out too. Once upon a time, countless numbers of young people were “California Dreaming”, but those days are long gone. At this point, the California Dream has become a California Nightmare.

Only a very small percentage of those leaving California have come up to the Great Northwest, but it is a sizable enough number to make a huge impact. Unfortunately, many of those that have come from California want to turn their new areas into another version of what they just left, and that is often firmly resisted by the locals.

https://s-media-cache-ak0.pinimg.com/564x/4e/84/af/4e84af5ae14b35dba910a0b3fac0b318.jpg

But it isn’t just California – there are people streaming into the “American Redoubt” from all over the nation, and many of them are some of the finest people that you could ever hope to meet.

An article in The Economist points to a 2011 manifesto posted by James Wesley Rawles as the beginning of the “American Redoubt” movement…

In a widely read manifesto posted in 2011 on his survivalblog.com, Mr Rawles, a former army intelligence officer, urged libertarian-leaning Christians and Jews to move to Idaho, Montana, Wyoming and a strip of eastern Oregon and Washington states, a haven he called the “American Redoubt”.

Thousands of families have answered the call, moving to what Mr Rawles calls America’s last big frontier and most easily defendable terrain. Were hordes of thirsty, hungry, panicked Americans to stream out of cities after, say, the collapse of the national grid, few looters would reach the mostly mountainous, forested and, in winter, bitterly cold Redoubt. Big cities are too far away. But the movement is driven by more than doomsday “redoubters”, eager to homestead on land with lots of water, fish, and big game nearby. The idea is also to bring in enough strongly conservative voters to keep out the regulatory creep smothering liberty in places like California, a state many redoubters disdainfully refer to as “the C-word”.

Who wouldn’t want to live where the air is clear, the water is clean and the sky is actually brilliantly blue and not the washed out grayish blue that you get in most major cities?

And just having some breathing space is reason enough for some people to move to the Great Northwest. If you can get at least a few acres, you will quickly discover the joy of not having neighbors crammed in around you on every side.

Others wish to move to an area with a low population density for more practical reasons. As the New York Times recently reported, crime is rising in large cities all over America…

Murder rates rose significantly in 25 of the nation’s 100 largest cities last year, according to an analysis by The New York Times of new data compiled from individual police departments.

The findings confirm a trend that was tracked recently in a study published by the National Institute of Justice. “The homicide increase in the nation’s large cities was real and nearly unprecedented,” wrote the study’s author, Richard Rosenfeld, a criminology professor at the University of Missouri-St. Louis who explored homicide data in 56 large American cities.

Sadly, this is just the beginning. The chaos that we have seen in Dallas, Baton Rouge, Milwaukee, Ferguson, Baltimore, Chicago and elsewhere is going to get much worse. As the economy continues to unravel, we are going to see civil unrest on a scale that none of us have ever seen before. When that time comes, those that have moved to the middle of nowhere will be very thankful that they got out while the getting was good.

Over the last several years, my wife and I have met countless numbers of people that have moved up to the Great Northwest. All of their stories are different, but there is one common theme that we have noticed.

In the vast majority of cases, families tell us that they moved to the Great Northwest because they felt that God was calling them to do so. Individuals from many different churches and denominations have all felt the same call, and that creates a sort of kinship that is quite unusual these days.

Something big is happening in the Great Northwest. If you have never been up here, you might want to check it out some time.

By Michael Snyder | End Of The American Dream


American Redoubt — Move to the Mountain States

Updated: June 2, 2016

Recognizing both the fact that “all politics are local”, and the international readership of SurvivalBlog, I naturally de-emphasize politics in my blog. However, an article got my blood boiling: Motorists illegally detained at Florida tolls – for using large bills! So, not only are Federal Reserve Notes not redeemable “on demand” for specie, but effectively they are now no longer “…legal tender for all debts public and private.” It is often hard to pinpoint a breaking point–the proverbial “straw that broke the camel’s back”–as impetus for a paradigm shift, but reading that news article was that last straw for me. Consider my paradigm fully shifted. I’m now urging that folks Get Out of Dodge for political reasons–not just for the family preparedness issues that I’ve previously documented. There comes a time, after a chain of abuses when good men must take action. We’ve reached that point, folks!

Voting With Our Feet

I concur that Pastor Chuck Baldwin was right when he “voted with his feet” and moved his family from Florida to Montana. Like Chuck Baldwin I believe that is time for freedom-loving Christians to relocate to something analogous to “Galt’s Gulch” on a grand scale.

In March 2011, Ol’ Remus of The Woodpile Report quoted an essay by economist Giordano Bruno, titled The Return Of Precious Metals And Sound Money. In it, Bruno stated: “If there is anything good to come out of our present predicament, it is that Americans, from average citizens to elected officials, are beginning to understand the reality of coming collapse and are preempting it with measures designed to insulate their communities from the inevitable firestorm. Eventually, as this movement escalates, certain states will come out ahead of the pack, gaining a kind of “safe haven” status, and attracting liberty minded people from around the country to the protective shelter of their borders.”

Sociologist Albert O. Hirschman in his book Exit, Voice, and Loyalty, identifies the growing libertarian trend of “Exit” strategies, all the way from the individual level up to the level of nation states.

Giordano Bruno identified a trend that has been developing informally for many years: A conscious retrenchment into safe haven states. I strongly recommend this amalgamation, and that it be formalized. I suggest calling it The American Redoubt. I further recommend Idaho, Montana, Wyoming, eastern Oregon, and eastern Washington for the réduit. Some might call it a conglomeration, but I like to call it an amalgamation, since that evokes silver. And it will be a Biblically-sound and Constitutionally-sound silver local currency that will give it unity.

Update: It has been reported that 10 politically conservative counties in northern Colorado are planning on a peaceful partition, to form the new state of North Colorado. Needless to say, if they succeed I will expand the definition of the Redoubt!

redoubt

(For re-use of this image, see the copyright notice, below.)

I anticipate that this nascent movement, and the gulch itself will be a lot bigger than most other pundits anticipate. It could very well be a multi-state amalgamation like The American Redoubt, that I’ve advocated.

Why Not Some Adjoining States?

I’m sure that I’ll get e-mail from folks, suggesting expanding the Redoubt concept to include Utah, the Dakotas, and Colorado. Let me preemptively state the following: Utah is a conservative state, but its desert climate makes it unsuitable to feed its current population, much less one swelled by in-migration. North and South Dakota have some promise, but I have my doubts about how defendable they would be if ever came down to fight. Plains and steppes are tanker country. It is no coincidence that the armies of the world usually choose plains for their maneuver areas, for large scale war games. Some might argue that I shouldn’t have included eastern Oregon and eastern Washington. The population densities are suitably low, and the populace is overwhelmingly conservative, but the folks there are still at mercy of the more populous regions west of the Cascades, that dictate their state politics. But who is to say that their eastern counties won’t someday partition to form new states, like West Virginia? This same factor is just as pronounced in rural Colorado. Just a few large cities call the political shots, and they have been assimilated by ex-Californians. For this reason I reluctantly took Colorado off the list.

Take a few minutes to look at a map that shows unpopulated regions in the United States. As you can see, a lot of that is in The American Redoubt.

To Clarify: Religious, Not Racial Lines

I’m sure that this brief essay will generate plenty of hate mail, and people will brand me as a religious separatist. So be it. I am a separatist, but on religious lines, not racial ones. I have made it abundantly clear throughout the course of my writings that I am an anti-racist. Christians of all races are welcome to be my neighbors. I also welcome Orthodox Jews and Messianic Jews, because we share the same moral framework. In calamitous times, with a few exceptions, it will only be the God fearing that will continue to be law abiding. Choose your locale wisely. I can also forthrightly state that I have more in common with Orthodox Jews and Messianic Jews than I do with atheist Libertarians. I’m a white guy, but I have much more in common with black Baptists or Chinese Lutherans than I do with white Buddhists or white New Age crystal channelers.

I also expect that my use of the term Redoubt will inspire someone to accuse me of some sort of neo-Nazism. Sorry, but I use the term in honor of Switzerland. When I chose the name I was thinking of the Schweizer Alpenfestung (aka Réduit Suisse), rather than any reference to the Nazi’s “National Redoubt” scheme at the end of World War II. I am strongly anti-totalitarian, and that includes all of its forms, including Nazism and Communism.

I’m inviting people with the same outlook to move to the Redoubt States, to effect a demographic solidification. We’re already a majority here. I’d just like to see an even stronger majority.

One important point: I do not, nor have I ever advocated asking anyone already living here to leave, nor would I deny anyone’s right to move here, regardless of their faith, (or lack thereof).

Closing ranks with people of the same faith has been done for centuries. It is often called cloistering. While imperfect, cloistering got some Catholics in Ireland through the Dark Ages with their skins intact and some precious manuscripts intact. (It is noteworthy that other copies of the same manuscripts were burned, elsewhere in Europe.) Designating some States as a Redoubt is nothing more than a logical defensive reaction to an approaching threat.

Are You With Us?

Read my Precepts page. If you aren’t in agreement with most of those precepts, then I don’t recommend that you relocate to the Redoubt–you probably won’t fit in.

Your Checklist

I suggest that you follow these guidelines, as you prepare and then move to the American Redoubt:

  • Research geography, climate, and micro-climates very carefully.
  • Develop a home-based business.
  • Lighten the load. Keep the practical items but sell your junk and impractical items at a garage sale.
  • Bring your guns.
  • Sell your television.
  • Sell your jewelry and fancy wristwatch. Buy a Stihl chainsaw instead.
  • Choose your church home wisely, seeking sound doctrine, not “programs”
  • Leave your Big City expectations behind. There probably won’t be cell phone coverage, high speed Internet, or Pilates.
  • Expect a long driving distances for work and shopping.
  • Sell your bric-a-brac and collectibles. What is more important? A large collection of Hummel figurines, or having a lot of good hand tools and Mason jars?
  • Switch to a practical wardrobe and “sensible shoes”.
  • After your buy your land, convert the rest of your Dollar-denominated wealth into practical tangibles.
  • Begin homeschooling your children.
  • Sell your sports car and buy a reliable crew cab pickup.
  • Expect persecution and hardship. You will be despised for being true to your faith. (Just read 2 Timothy 3:1-12. and Matthew 5:10-14, and John 15:18-19.)
  • Encourage your kids to XBox and Wii less and read more.
  • Make a clean break by selling your house and any rental properties. You aren’t coming back.
  • If you buy an existing house, get one with an extra bedroom or two. Some relatives may be joining you, unexpectedly.
  • Donate any older bulky furniture to the local charity store before you move.

After you move:

  • Don’t try to change things to be like the suburb that you left behind. You are escaping all that!
  • Pitch in by joining the local Volunteer Fire Department (VFD), Ski Patrol, Sheriff’s Posse, or EMT team.
  • Be a good neighbor.
  • Patronize the local farmer’s market and craft shows.
  • Respect the property rights and the traditions of your neighbors.
  • Be active, politically, but use a pseudonym in letters to the editor an internet posts.
  • Use VPN tunneling, RSA encryption, firewalls, and anonymous remailers.
  • Support local businesses, and companies that are headquartered inside the Redoubt, not Wal-Mart.
  • Encourage like-minded family and friends to join you.
  • Stock up heavily on storage foods for lengthy power failures, or worse.
  • Do your banking locally, preferably with a credit union and/or a farm credit union.
  • Be active in local home school co-ops and service organizations.
  • Find and visit your local second-hand stores. Watch for useful, practical items that don’t need electricity.
  • Conduct as much business as possible via barter or with precious metals.
  • Gradually acquire a home library that includes self-sufficiency books and classic books–history, biographies, and novels.
  • Join the local ham radio club. (Affiliated with the ARRL.)
  • Expect to be the subject of gossip. Live a righteous life so there won’t be much to gossip about.
  • Loyally support your local church with tithes and support your local food bank.
  • Get used to eating venison, elk, moose, antelope, trout, and salmon.
  • Attend some farm auctions in your region to gather a good collection of useful hand tools and a treadle sewing machine.
  • Attend gun shows in your state. (This keeps money circulating in the state and keeps you legal, for private gun purchases.)
  • Choose your fights wisely. Don’t tilt at windmills, but when you feel convicted, don’t back down.

I am hopeful that it is in God’s providential will to extend his covenantal blessings to the American Redoubt. And even if God has withdrawn his blessings from our nation as a whole, he will continue to provide for and to protect His remnant. Pray and meditate on Psalm 91, daily!

Addenda (April, 2011): 33 Ways to Encourage Atlas to Shrug

Ayn Rand’s 1957 novel “Atlas Shrugged” is enjoying renewed popularity following the release of the new Atlas Shrugged movie. Rand’s story describes a group of American industrialists that lose patience with onerous regulation and taxation, and “shrug”–disappearing from their normal lives to relocate to a hidden valley called Galt’s Gulch. While this tale is fictional, it has some strong parallels to modern-day America. And despite the fact that Ayn Rand was an atheist and favored legalized abortion, she was a good judge of both character and the inevitable tendencies of elected governments. When I consider the regulatory and tax burdens that have been implemented in my lifetime–I was born in 1960–I believe that Rand had amazing prescience. Let’s face it: We no longer live in a free market capitalist nation. At best, it could called a “mixed” economy with statist tendencies, and verging on socialism.

Reading the news headlines in recent months has led me to believe that the Galt’s Gulch concept has a lot of merit. If The Powers That Be wanted to encourage the Atlases of the world to shrug, they couldn’t have done a better job. What is the best way to get the most productive Citizens of our nation to go on strike, and retreat to “gulches”? Consider the following “to do” list for those whom Ayn Rand called “The Destroyers”:

  1. Remove the homeowner’s mortgage interest tax deduction. Yes, they’re pushing for it.
  2. Reinstate the Federal estate tax and pre-Bush Administration income tax levels. They want to impose the old tax rates on anyone with an income of $250,000. Oh, and the CBO’s budget predictions are all using the assumption that the 2001 tax cuts are reverted. Is this wishful thinking (to make the increases in the Federal debt not look quite so bad), or a fait accompli?
  3. Nationalize IRAs and 401(k)s. Yes, its under discussion.
  4. Increase taxes for unemployment-insurance funds. This is already in progress.
  5. Drag out approval of new mining operations with endless Environmental Impact studies. They’re already doing it.
  6. Inflate the currency to rob those who save money–a hidden form of taxation. Standard practice for 40 years.
  7. Drag out approval of newly-developed medicines. Now the status quo.
  8. Push up the rates for “sin” taxes on tobacco, alcohol, and other items. Already implemented in 2010.
  9. Increase the Minimum Wage. Several states have done so, but even worse yet, some unions are pushing for more socialist “Living Wage” laws
  10. Raise import tariffs. Each new tariff causes problems. Didn’t they ever hear Ben Stein’s high school Economics lecture on the Hawley-Smoot Tariff Act? (OBTW, Ben Stein is now warning about an economic collapse.)
  11. Increase the tax paperwork burden by requiring “1099-MISC” reporting of all cash transactions over $600. (Attempted, but thankfully set aside for the time being.)
  12. Increase the cost of doing business through mandatory insurance. (The “labor burden” for an employee with a nominal salary of $17 per hour ($35,360 gross, annually) is an additional $20,029 per year.) Workman’s compensation, in particular, is getting painfully expensive.
  13. Increase sales taxes. Several states have increased sales taxes, since 2009.
  14. Increase property taxes, as home values decline. Many counties have hiked their tax rates.
  15. Continue to increase the size of the government (and its debts). The Federal debt increases are looking inexorable.
  16. Push for increased mandatory employer-paid benefits for company employees like mandatory health insurance for part-time employees and European-style long term parental leave. Also, push toward excluding companies from government contracts unless they have expanded health care coverage.
  17. Mandate payment of state sales taxes on out-of-state purchases for Internet and mail orders. Yes, they’re still pushing for these taxes, and for regulation of the entire Internet.
  18. Create a pervasive Nanny State mentality. For example: penalize companies and consumers for high trans-fat foods, and alcoholic beverages that taste too good.
  19. Sue the makers of guns that actually work just as they were designed. (At least a partial law shield law was enacted, in 2005.)
  20. Use taxpayer funds to destroy classic cars that are in running condition, while subsidizing hybrid cars that use batteries that will pollute landfills for centuries.
  21. Over-regulate small firms out of business. Dry cleaners are a prime example.
  22. Fine farmers and ranchers for using traditional practices.
  23. Create a European-style Value Added Tax (VAT). Yes, they’re still pushing for it.
  24. Legislate expansion of company-paid health insurance to cover everything from same sex “domestic partners” and autism to sex change operations.
  25. Lobby for mandating that companies pay for three weeks of paid vacation per year for all employees.
  26. Institute dozens of unfunded mandates from the Federal level, that must be compensated for with higher state, county, and local taxes.
  27. Increase license, permit, and vehicle registration fees. In progress. Meanwhile, institute “temporary” tax increases. These surtaxes on income, sales, or real property are described as “temporary.” (But don’t be surprised if they are not repealed.)
  28. Providing free education to illegal immigrants while levying taxes on home schooling families for services that they don’t use.
  29. Make it illegal for owners to protect their livestock from predators.
  30. Remove the salary cap on Social Security tax “contributions”. The liberal think tanks are pushing for it.
  31. Encourage a litigious society where huge lawsuits are filed over trifles, and where the makers of products can be sued even if product buyers intentionally misuse products.
  32. Implement carbon taxes and credits. Still in early stages of implementation.
  33. And lastly, the big one: Implement socialized medicine. Despite a strong public outcry, it is now Federal law. But thankfully there is a push to rescind part or all of it.

The shrugging and gulching has already begun…

Many folks are now ready to vote with their feet. Atlas is starting to shrug.

Addenda (May, 2011, with several updates in 2012 and 2013):

Finding a Prepper-Friendly Church

Many readers of SurvivalBlog are Christians. For us, the search for a desirable “vote with your feet” relocation locale includes a very important criteria: finding a good church home. I am of the opinion that finding a good church home is our Christian duty, and that it honors God. It is also an important factor in finding acceptance in a new community. By joining a church congregation that shares your world view, you can very quickly become part of a community, rather than being perceived as just “that new guy”. In many locales, this shortens the time required for a high level of acceptance and inclusion as a part of “the we”, by years.

In my experience in the western United States, Reformed churches tend to have a very high percentage of families that are both preppers and home schoolers.

When I put forth my American Redoubt plan, a key aspect was that it would be primarily geared toward fellow Christians, Messianic Jews, and conservative Jews.

Here is a list of my own criteria, for you to consider, perhaps as your baseline. (Note: I come from a Reformed Baptist background, so your criteria may differ):

  1. Reliance upon and belief in the literal truth of the 66 books of the Old and New Testament as the Inspired Word of God.
  2. Sound doctrine, with Christ as the cornerstone, and preferably in accord with the Five Solas and the Five Points of Calvinism. (Or at least four of them.)
  3. A strong emphasis on the Gospel of Christ.
  4. Some interest in family preparedness. (Not a necessity, but a nice plus.)
  5. A commitment to Christian Charity.
  6. An “…in the World but not of the World” outlook.
  7. Biblical evangelism–the pastor, elders, and congregation all take The Great Commission literally. (Avoid churches with any racism or anti-Semitism.)
  8. Expository preaching. (Systematic exposition of scripture.)
  9. An emphasis on teaching and memorizing God’s word with exhortation rather than “programs”.
  10. A congregation where a substantial portion of the body home schools their children. (Not a necessity, but a nice plus.)
  11. Congregants with a conservative outlook, modest dress, humble attitudes, and avoidance of worldly trappings.
  12. An edifying church that gives glory to God.

Reformed Churches in The American Redoubt States:

My initial list has about 25 Reformed churches that I’ve either attended or that have been recommended to me.

Note: The pastors of these churches will undoubtedly soon hear about the mention of their churches. I’d appreciate them sending me an e-mail mentioning whether or not they agree with the Redoubt concept, and with their recommendations for similar churches inside the five Redoubt States. Thanks!

Idaho

Montana

Eastern Oregon

Eastern Washington

Wyoming

Orthodox Jewish Synagogues and Congregations in The American Redoubt States:

Try to find a truly conservative congregation. The word “conservative” (shamrani) has different meanings to different Jewish people! (Political conservatism is not always synonymous with religious conservatism and a traditional moral code.)

SurvivalBlog reader Yorrie in Pennsyvania mentioned in a recent e-mail that conservative Jewish preppers should seek out congregations that are: “…Torah knowledgeable and observant = Orthodox religiously or similar. Which usually overlaps with conservative politically. The more traditional end of the Conservative Jewish movement did not accept the liberal swing [that began in the 1950s] and is called Traditional, Conservadox (Halfway between Conservative and Orthodox), or sometimes Masorti (Hebrew for Traditional). There are Orthodox and Traditional Jews in Flathead County, Montana, and more formal congregations of the Chabad movement (a Torah Judaism movement with roots over 300 or more appropriately over 3,000 years).

Chabad congregations in the Redoubt area are in Bozeman, Montana [The Shul of Bozeman], Jackson, Wyoming, [Chabad-Lubavitch] and elsewhere in most major cities around the world.”

Messianic Jewish Congregations in The American Redoubt States:

Many of these congregations tend to be small “home churches”. Make inquiries, locally.

Here is just one example of what you will find, in eastern Washington:

Kehilat HaMashiach
13506 E. Broadway Ave
Spokane Valley , Washington 99216
509-465-9523 (Phone) / 509-465-0451 (FAX)
Rabbi David D’Auria

Conclusion:

I’m sure that the foregoing will inspire a lot of correspondence. I don’t have plans to create a nationwide directory of prepper-friendly churches and congregations. (That would go beyond the scope of my project.) But I would appreciate your feedback on any of the churches and congregations listed.

I would also appreciate recommendations on specific Jewish and Messianic Jewish congregations inside of the Redoubt region.

Addenda (June, 2011):

The Yellowstone “Super Volcano”

I’m often asked about the Yellowstone supervolcano caldera. There have been plenty of sensationalistic news reports that have exaggerated the risk. More realistically, volcanologists tell us: “It could still be tens of thousands of years before the next eruption”. And, the “rapid uplift” that was widely reported in 2004 in 2005 has slowed, significantly.

Because of the prevailing winds, the anticipated volcanic ash fall is actually more of threat to eastern Montana, eastern Wyoming, the Dakotas and the Plains states than it its to anywhere west of Yellowstone. If you consider it a threat in the next few generations, then simply buy property that is at least 100 miles UPWIND of Yellowstone. If there ever is an eruption, anyone in northern Idaho or Northwestern Montana will only get ash fall that first circles the globe. It it will be people the Plains states that would get buried by several feet of ash.

As a bonus, locating UPWIND of Yellowstone will also put you upwind of Montana’s missile fields. It is noteworthy that Malmstrom AFB (which BTW is a locale in the second sequel to my novel “Patriots“) has dozens of strategic nuclear targets. If we are ever engaged in “nuclear combat toe to toe with the Rooskies”, each silo could be targeted for a nuclear ground burst. (It is ground bursts rather than air bursts that create significant fallout.) Again, I wouldn’t want to live downwind.

And as a further bonus, the climate is also much more livable west of the Great Divide. East of the Great Divide, the winters can be bitterly cold, but west of the Great Divide it is more mild.

But also consider: U.S. Game Changing Renewable – Geothermal Power. Note that the preponderance of the nation’s geothermal potential is in the Rocky Mountain States and the Intermountain West. The Redoubt just keeps looking better….

James Wesley, Rawles

About the Author:
James Wesley, Rawles is a former U.S. Army Intelligence officer and a noted author and lecturer on survival and preparedness topics. He is the author of the best-selling nonfiction book “How to Survive the End of the World as We Know It” and the novel “Patriots: A Novel of Survival in the Coming Collapse” He is also the editor of SurvivalBlog.com–the popular daily web journal for prepared individuals living in uncertain times.


Copyright 2011-2014. All Rights Reserved by James Wesley, Rawles – http://www.SurvivalBlog.com Permission to reprint, repost or forward this article in full is granted, but only if it is not edited or excerpted.

Note: The map image on this web page is my own creation and I personally hold the copyright. This image with resolution no greater than 36 DPI and a width no greater than 250 pixels is licensed under the Creative Commons Attribution-ShareAlike 3.0 License, with intended use on Wikipedia and similar reference web sites, for use in newspaper and magazine articles, in book reviews, and in book catalogs. The rights to any larger or higher resolution image is reserved and are granted only upon request.

By James Wesley, Rawles | SurvivalBlog

Appraisals Are A Hot Topic Impacting Consumers Right Now

 : Consumers and lenders are upset with the current residential appraisal situation. This came from Southern California. “Why isn’t anyone publicizing the appraisal gouging going on in select markets? Due to a lack of appraisers since the financial reform acts (must be college educated and possess certificates) there is a ‘rush’ fee on top of an inflated appraisal fee for purchases topping $2,000. All of this is costing the borrower in fees and in rates since some appraisals are taking 6 weeks thus requiring a longer rate lock period and higher rate.  It seems like the financial and consumer protections are working in reverse order for the borrower. And speaking of appraisers, they are all older folks as the younger generation does not want to pursue a career in a dying industry (full automation).”

And this from one of the Rocky Mountain states. “Just this month, I have more than 4-week turnaround times quoted by most appraisers through the AMCs and appraisals as high as $2,620 for a non-rural basic FHA appraisal. Taking years to fix the problem is not good: we have major problems now. My first time homebuyers can barely afford the $500 appraisals let alone the $2,620 appraisals (most don’t even have credit cards with a limit that high). I even had an appraiser tell me (and it’s someone I know to be an honest hardworking appraiser) that if he can do 3 appraisals a week for $1000 each or 6 appraisals a week for $500 each, which do you think he will pick? Somebody asked me the other day if we did ‘cost plus’ for the AMC appraisals. We can’t do that as appraisals are one of the items we can’t redisclose if it comes in higher unless we can prove we didn’t know something about the property and that is extremely hard to prove. Something must be done.”

From Kentucky Dora Ann Griffin contributed, “The answer is with Collateral Underwriters (CU) – there is no reason we cannot go back to allowing brokers and lenders order appraisals from professional quality appraisers. It would allow small appraisal businesses to thrive and compete. The end result would be a much better pricing and quality. The question is how do we make that happen? I know it would be moving a mountain but is there a way associations, brokers, etc. can affect a movement back to common sense.

“I just closed a loan where the property failed CU. A desk review was done. Then a field review. The whole appraisal process spanned six weeks due to appraisers taking 4 days to accept and missing the delivery by four days. I was told repeatedly the AMC could not push because the appraiser would then not do it at all. That appraiser would be still on the roster if that happened!  Meanwhile my buyer is living in a motel for weeks with two dogs, three kids and her husband spending thousands of dollars to get by.

“In the end the original appraiser had the wrong property ID and even had an address wrong on a comp along with nine other serious or minor corrections. As a consumer that appraisal was faulty but there is no remedy. I suffer the loss of repeat business and referrals for something totally out of my control.

“I dream of the day I can engage a qualified appraiser directly. If that does not happen we are looking at even higher costs and increasingly inferior quality.  All the good appraisers in my market work directly with banks. I get the worst of the worst thru AMCs as a broker – an unfair playing field.”

From Washington Theresa Springer mailed, “In the PDX MSA (including Clark County, WA) it is a travesty with an average 4-6 week turn time with high rush fees to get us to this insane return point. Appraisers are cherry picking jobs based on amount given to receive appraisal back at a somewhat ‘normal’ time frame of 3+ weeks and where it is located, i.e. in town vs. ‘rural’ as in Camas and Ridgefield, like those two are rural (not). I spoke with an appraiser buddy of mine a week ago and he said, ‘I just scroll through my email in the AM to see what is being offered and I take the best fee and locale and go from there.’ He said he is getting offered $1,500- $2,000 to do an in-town appraisal with a 3 week turn time. Appraisers are now quoting mid-October to early November for an appraisal that is being ordered this week. We have a lack of appraisers, and here’s a video about why they’re taking so long. They are over loaded and it is the fault of the feds as they have made the bar to entry for an appraiser so high.

“This is getting so ridiculous and is causing a large uptick in costs to the borrowers and the sellers are so angry as they cannot close in any timely manner.  Most agents now are writing PSA’s for 8 weeks or 6 weeks knowing that they will need an extension(s). VA loans are upwards of 8+ weeks in town and the VA seems to be doing very little to fix this issue on their end.  Just closed a Brigadier General’s VA loan and he called the VA raised a riot and he was able to get his appraisal turned in 3 business days after an 8-week acceptance time lag. But it is taking the borrowers to call the VA to get anything done. The VA is only assigning out appraisals on Monday’s now and is no longer letting you know where you are in line. This is also hurting the Veterans as many sellers will no longer accept VA loans on their homes, which is their right.

“Due to the rules in place where a new appraiser needs a 4-year degree (this was the MOST insipid part of the appraisal license change, then comes the 2 +/- year apprenticeship where the certified appraiser has to personally review EVERY home and its comps in its entirety before approving the report, like they have time) we are not getting any new folks into the business. So much for saving the consumer money as all this is doing is creating more costs for the borrower and a longer wait time for the seller to close. Many sellers are only entertaining cash offers if they have this option due to these issues.”

Mike VanDerWeerd sent, “As a former (still licensed) appraiser, this appraisal discussion is quite interesting. In a nutshell, they took the business out of the profession and made appraisers lapdogs to AMCs. There is no incentive to perform quality work on a client basis. All you get is spoon fed assignments with no way of growing the business. My opinion is once the GSEs figure out an automated valuation method with a home inspection, appraisers will be VCR repairmen!”

And Bill King opined, “I would proffer that a good appraiser cannot do 2 to 3 appraisals per day and do them well. Unfortunately, that very expectation does more to drive down appraisal quality than almost all other things combined. Unless one has two or three of the same floor plan, in the same plat (rare) on the same day a good, competent appraisal isn’t going to happen with just 3 to 4 hours’ work. Without the ‘assembly line’ operation 2 or 3 appraisals per day is just not possible. The elephant in the living room is appraisal process itself. The single point value and single approach appraisal is fundamentally flawed and antiquated. Small data valuations in a big data world is silly.”

From Florida came, “As we all know, according to TRID, a consumer must receive Loan Estimate disclosures within 3 days of submitting all 6 items that comprise a loan application. First, the in-house stall was holding the property address out so more information could be gathered before mandatory disclosures. That worked for a while, except that when we have a purchase contract, we automatically have an address. So that stall doesn’t work anymore though offices do try to bury the contract for a while. Now, local offices are stalling disclosures until the appraisal comes back saying that is the basis for an estimate of property value. The obvious point being ignored by this argument is that if there’s a contract, there’s an estimation of property value. Two people have decided that the property is worth the agreed price and since a copy of the MLS listing is part of the loan file, processors and underwriters can see listed and contract values. The ‘wait for appraisal’ stall is a very thin one, and continues to make consumers wait longer for decisions and closing. As I have said before, every time CFPB tweaks a regulation a new cottage industry opens up in the lending community to try and circumvent the intended benefit to the public.” Thank you to Chris Carter for this note!

Chris Nielsen forecast, “I think in 10 years (maybe less) the Certified Appraiser will be little needed. With The UCDP and EAD portals, drone technology and other new intelligent systems, the routine property appraisal by a Human Being will be unnecessary.”

But those in the appraisal business deserve to be heard.

Mike Ousley, President & CEO of Direct Valuation Solutions, sends, “Being a company that provides solutions for lenders and appraisers to work directly with one another and one that also provides AMC services (DVS-AMC) gives me a unique perspective. On the AMC side we have first-hand knowledge of appraisers purposely and actively trying to damage the AMC by accepting orders, holding them for a week or two or three, then rejecting the order saying, ‘we never accepted the order.’ Recently, we had an appraiser in a well populated area quote a 4 month turn time!!!!  Really? He had 80+ orders in his queue?

“The blogs are full of Appraiser v. AMC drama, and for sure there are good and bad AMCs, just like there are good and bad appraisers and yes, it would seem that some appraisers view the AMC as their shield from the relationships with the lender so they don’t have to ‘face the music’ when due dates are missed, report quality is substandard or errors are made and the lender is left holding the AMC responsible for their ‘inability to manage the independent appraiser.’

“The real rub is that in some cases the same appraiser who intentionally damages the AMC relationship is the same one professing to want the direct relationship with the lender through our software! Having started as a professional appraiser way back in 1979 and hopefully establishing myself as a ‘professional appraiser’ over the decades since, I am entirely flummoxed by the disconnect between saying as an appraiser you are a professional, acting professional and adhering to the Uniform Standards of PROFESSIONAL Appraisal Practice (USPAP) when the purpose of USPAP is ‘to promote and maintain a high level of public trust in appraisal practice by establishing requirements for appraisers.’ I think it is safe to say ‘public’ here includes the consumer who the lender is attempting to assist in securing a home loan for purchase or refinance purposes, and yet aren’t they the ones being damaged by the unprofessional conduct of the intentional actions of appraisers trying to damage the AMC hired by the lender and almost always paid for by the borrower?  All too often, it seems, the word ‘Professional’ has gotten lost and the very public (read consumer) trust lost with it.

Mike wraps up with, “I think everyone, appraisers, lenders & AMCs, need to keep in mind the public we serve and not only maintain their trust but take a big step towards consistent and professional actions. While there is most certainly an issue with the number of appraisers dwindling, the number and frequency of underwriting or lender/investor stipulations and overall volume impacting the appraisal process, keeping professional conduct by ALL parties must be non-negotiable. On a closing note, I hope to drive a conversation with our national representation, the Mortgage Bankers Association, at our upcoming National Convention and bring not only more awareness to these growing issues but discuss forward thinking solutions and inclusion of appraisers & AMCs in the MBA agenda.”

Last Saturday in the commentary I quoted a reader who noted, among other things, “AMCs are keeping 1/3 to 1/2 of the appraisal fee.” Paul Dorman, President of Accurate Group, writes, “I did want to respond to this to dispel a myth. Good AMCs who want to promote partnerships with appraisers and expand their appraisal panels are not taking anywhere close to 1/3 to 1/2 of the appraisal fee. Good AMCs are actually sharing more of the appraisal fee with the appraiser and, when necessary, sharing the entire appraisal fee with the appraiser or taking losses on some orders to ensure service levels are met for both consumers and lenders.

“Yes, there is an appraiser shortage and good AMCs are working on solutions to that shortage – helping appraisers stay in the business, paying appraisers timely, limiting revision requests, looking for ways to educate and train new appraisers and developing products that make appraisers more efficient so they can complete more than 2 or 3 assignments a day. We’re doing all we can to ensure appraisers understand that the right AMCs can add a ton of value for them. We are expecting to see these efforts differentiate us in the market and expect that overtime more appraisers will see that not all AMCs are created equal.”

by Rob Chrisman

The 5000 Sq Ft Cold War Bunker Underneath a Modest, Suburban House in Las Vegas

https://twistedsifter.files.wordpress.com/2016/08/5000-sq-ft-cold-war-bunker-underneath-suburban-house-in-las-vegas-14.jpg?w=1200&h=800

26 feet underneath this modest, 2 story suburban home in Las Vegas you will find a sprawling, 5,000 square foot home—complete with four-hole putting green, swimming pool, jacuzzi and sauna—and designed to withstand a nuclear blast.

The bunker home at 3970 Spencer Street was built in the 1970s by businessman Girard ‘Jerry’ B. Henderson, who fearing attack from the Soviets, built his first underground bunker in the 1960s in Boulder, Colorado during the height of the Cold War.

The only signs of something amiss on the surface of this underground retreat were the ‘unusual’ amount of ground-mounted air conditioning units that were camouflaged by clusters of rocks and boulders…

https://twistedsifter.files.wordpress.com/2016/08/5000-sq-ft-cold-war-bunker-underneath-suburban-house-in-las-vegas-4.jpg?w=1200&h=800

Hmmmm

https://twistedsifter.files.wordpress.com/2016/08/5000-sq-ft-cold-war-bunker-underneath-suburban-house-in-las-vegas-1.jpg?w=1200&h=800

https://twistedsifter.files.wordpress.com/2016/08/5000-sq-ft-cold-war-bunker-underneath-suburban-house-in-las-vegas-11.jpg?w=1200&h=800

https://twistedsifter.files.wordpress.com/2016/08/5000-sq-ft-cold-war-bunker-underneath-suburban-house-in-las-vegas-10.jpg?w=1200&h=800

https://twistedsifter.files.wordpress.com/2016/08/5000-sq-ft-cold-war-bunker-underneath-suburban-house-in-las-vegas-7.jpg?w=1200&h=800

https://twistedsifter.files.wordpress.com/2016/08/5000-sq-ft-cold-war-bunker-underneath-suburban-house-in-las-vegas-6.jpg?w=1200&h=800

https://twistedsifter.files.wordpress.com/2016/08/5000-sq-ft-cold-war-bunker-underneath-suburban-house-in-las-vegas-5.jpg?w=1200&h=800

According to VegasInc.com, the house had been purchased for $2 million in 2005 and was foreclosed by Seaway Bank and Trust Co. in 2012.

The bank listed the property for $1.7 million in 2013, eventually selling the property in March 2014 to a mysterious group called the Society for the Preservation of Near Extinct Species for $1.15 million. [source]

https://twistedsifter.files.wordpress.com/2016/08/5000-sq-ft-cold-war-bunker-underneath-suburban-house-in-las-vegas-15.jpg?w=1200&h=800

https://twistedsifter.files.wordpress.com/2016/08/5000-sq-ft-cold-war-bunker-underneath-suburban-house-in-las-vegas-8.jpg?w=1200&h=800

https://twistedsifter.files.wordpress.com/2016/08/5000-sq-ft-cold-war-bunker-underneath-suburban-house-in-las-vegas-9.jpg?w=1200&h=800

https://twistedsifter.files.wordpress.com/2016/08/5000-sq-ft-cold-war-bunker-underneath-suburban-house-in-las-vegas-2.jpg?w=1200&h=800

https://twistedsifter.files.wordpress.com/2016/08/5000-sq-ft-cold-war-bunker-underneath-suburban-house-in-las-vegas-3.jpg?w=1200&h=800

https://twistedsifter.files.wordpress.com/2016/08/5000-sq-ft-cold-war-bunker-underneath-suburban-house-in-las-vegas-12.jpg?w=1200&h=800

https://twistedsifter.files.wordpress.com/2016/08/5000-sq-ft-cold-war-bunker-underneath-suburban-house-in-las-vegas-13.jpg?w=1200&h=800

The two-bedroom, three-bathroom underground home might be the most peculiar in Las Vegas. Built beneath a typical, suburban two-story house, the bunker home spans more than 5,000 square feet and is part of a 15,200-square-foot basement that also features a casita.

The subterranean refuge seems designed to stave off boredom and claustrophobia. It has a four-hole putting green, a swimming pool, two jacuzzis, a sauna, a dance floor with a small stage, a bar, a barbecue and huge murals of rural, tranquil settings.

The home, with unchanged “Brady Bunch” decor, also has a laundry room, a kitchen, a fireplace, a generator, fake trees, fake flowers, two elevators, fire alarm bells, smoke detectors, an intercom system and several large pantries.

Light switches labeled “Sunset,” “Day,” “Dusk” and “Night” mimic lighting conditions at those times by dimming or brightening lights and stars on the ceiling, which is painted sky blue with white clouds.

A few miles east of the Strip, the home was built in the 1970s by entrepreneur Girard B. “Jerry” Henderson, who feared a nuclear Armageddon during the Cold War. While others built fallout shelters, he wanted to live underground full time, according to news reports.

Henderson co-founded Underground World Home Corp., a subterranean home building company. A brochure for the company boasts that underground living is healthier, cleaner, quieter, cheaper, safer and is “the ultimate in true privacy!”

“How would you like sunshine every day … when you want it?” the brochure asks.

https://martinhladyniuk.com/wp-content/uploads/2013/11/cropped-prepper.jpg?w=625

Source: Twisted Sifter


Housing Starts Jump On Spike In Rental Units As Permits Decline

While the single-family housing stagnation continues, multi-family, or rental, housing starts and permits jumped in the month of July according to the latest Census data.

https://s16-us2.ixquick.com/cgi-bin/serveimage?url=http%3A%2F%2Fnewslanc.com%2Fimages%2Fsandy-housing-relief.jpg&sp=87c5eeffe069f37079ed87129fda40f2

In the latest month, housing starts rose by 2.1% from June, and were higher by 5.6% from a year ago, rising to 1.211MM, above the 1.180MM expected, driven by a 33K jump in rental unit starts, which rose to 433K, while single-family units remained largely unchanged at 770K, up 0.5% from last month’s 766K. As the chart below shows, single-family start have barely budged in the past year even as rental units appear to once again be growing at a solid pace.

https://i0.wp.com/www.zerohedge.com/sites/default/files/images/user5/imageroot/2016/08/13/housing%20starts%20jul_0.jpg

On an annual basis, the rate of change continues to hug the flat line, and after last month’s modest decline, starts rose by 5.6% in the latest month.

https://i0.wp.com/www.zerohedge.com/sites/default/files/images/user5/imageroot/2016/08/13/housing%20starts%20YoY.jpg

Meanwhile, the more important building permits data series, fell modestly to 1.152MM in July from 1.160MM in June, on top of the 1.153MM expected.

https://i0.wp.com/www.zerohedge.com/sites/default/files/images/user5/imageroot/2016/08/13/housing%20permits%20jul.jpg

While these series are notoriously volatile, if indeed multi-family housing is picking up it could provide a modest ray of hope for America’s renters who continue to suffer under record high asking rents, in part due to a lack of supply. Then again, it depends who ends up being the ultimate owner of these buildings, and if the units end up controlled by Wall Street it is likely that there will be no respite from record high rates any time soon as the “curtailing” of supply is set to continue for the indefinite future.

source: ZeroHedge


Wilderness Living: The last big frontier

A Movement Of Staunch Conservatives And Doomsday-Watchers To The Inland North-West Is Quietly Gaining Steam

https://s17-us2.ixquick.com/cgi-bin/serveimage?url=http%3A%2F%2Fmedia-cache-ak0.pinimg.com%2F736x%2F16%2F48%2F94%2F1648940e8fa4e9a8a9fc01a3156cb76a.jpg&sp=e4d3d3cf14af555820cb5fa083f0256e

ASKED by an out-of-stater where the nearest shooting range is, Patrick Leavitt, an affable gunsmith at Riverman Gun Works in Coeur d’Alene, says: “This is Idaho—you can shoot pretty much anywhere away from buildings.” That is one reason why the sparsely populated state is attracting a growing number of “political refugees” keen to slip free from bureaucrats in America’s liberal states, says James Wesley, Rawles (yes, with a comma), an author of bestselling survivalist novels. In a widely read manifesto posted in 2011 on his survivalblog.com, Mr Rawles, a former army intelligence officer, urged libertarian-leaning Christians and Jews to move to Idaho, Montana, Wyoming and a strip of eastern Oregon and Washington states, a haven he called the “American Redoubt”.

Thousands of families have answered the call, moving to what Mr Rawles calls America’s last big frontier and most easily defendable terrain. Were hordes of thirsty, hungry, panicked Americans to stream out of cities after, say, the collapse of the national grid, few looters would reach the mostly mountainous, forested and, in winter, bitterly cold Redoubt. Big cities are too far away. But the movement is driven by more than doomsday “redoubters”, eager to homestead on land with lots of water, fish, and big game nearby. The idea is also to bring in enough strongly conservative voters to keep out the regulatory creep smothering liberty in places like California, a state many redoubters disdainfully refer to as “the C-word”.

Estimates of the numbers moving into the Redoubt are sketchy, partly because many seek a low profile. Mr Rawles himself will not reveal which state he chose, not wanting to be overrun when “everything hits the fan”. But Chris Walsh of Revolutionary Realty says growing demand has turned into such a “massive upwelling” that he now sells about 140 properties a year in the north-western part of the Redoubt, its heart. To manage, Mr Walsh, a pilot, keeps several vehicles at landing strips to which he flies clients from his base near Coeur d’Alene.

Many seek properties served not with municipal water but with a well or stream, ideally both, just in case. More than nine out of every ten Revolutionary Realty clients either buy a home off the grid or plan to sever the connection and instead use firewood, propane and solar panels, often storing the photovoltaic power in big forklift batteries bought second-hand. They also plan to educate their children at home. The remoter land preferred by lots of “off-the-gridders” is often cheap. Revolutionary Realty sells sizeable plots for as little as $30,000. After that, settlers can mostly build as they please.

Lance Etche, a Floridian, recently moved his family into the Redoubt after the writings of Mr Rawles stirred in him “the old mountain-man independence spirit—take care of yourself and don’t complain.” He chose a plot near Canada outside Bonners Ferry, Idaho, cleared an area with a view, put down gravel, “and they dropped the thing [a so-called “skid house”, transported by lorry] right on top of it”, he says—no permit required.

Some newcomers are Democrats keen to get back to nature, grow organic food or, in Oregon and Washington, benefit from permissive marijuana laws. Not all conservatives dislike this as much as Bonny Dolly, a Bonners Ferry woman in her 60s who says: “We don’t want liberals, that’s for sure,” and carries a .45-calibre handgun “because they don’t make a .46”. But lefties who move in and hope to finance tighter regulations with higher taxes often get the cold shoulder. Mr Walsh weeds out lefties from the start, politely declining to show them property, noting that they wouldn’t fit in anyway. This discrimination is legal, he says, because political factions, unlike race or sexual orientation, are not legally protected classes.

https://martinhladyniuk.com/wp-content/uploads/2016/08/82ec0-serveimage.jpg

A Red Dawn:

Todd Savage, who runs Survival Retreat Consulting in Sandpoint, Idaho, works with the more usual sort of client: political migrants who rail against “morally corrupt” nanny government elsewhere. He does a brisk business helping them set up their food-producing fortress-homesteads. Staff train clients in defensive landscaping, how to repel an assault on their property with firearms, and the erection of structures “hardened” to withstand forced entry and chemical, biological, radiological or explosive attack.

Very few redoubters, however, wish to secede from the United States. The Confederacy’s attempt fared badly, notes Mr Rawles. He did, however, exclude the politically conservative but mostly flat Dakotas from the Redoubt because mechanised units could manoeuvre easily there. The same went for swathes of Utah, a state also left out because it has little water.

Purists have criticized him for including eastern Oregon and Washington in the Redoubt, since their larger liberal populations near the west coast dominate state politics. But he believes that the designation will quicken efforts in the eastern reaches to form new, freedom-minded states within a generation. As Mr Walsh puts it, easterners’ taxes get them “nothing back except for a bunch more rules” from socialist bureaucrats.

As for doomsday itself, redoubters differ. Mr Rawles considers the most likely cause to be a geomagnetic solar storm like the Carrington Event in 1859, when a coronal mass ejection from the sun generated sparks in telegraph lines, setting some buildings on fire. Had the nearly 3,000 transformers that underpin America’s grid existed then, a quarter of them would have burned up, according to Storm Analysis Consultants in Duluth, Minnesota. Some redoubters have signed up to receive a National Oceanic and Atmospheric Administration alert of any approaching solar storm like the big one that blew across Earth’s path on July 23rd 2012, missing the planet by days.

Alternatively, a nuclear explosion 450km above the central United States would produce enough high-energy free electrons in the atmosphere below to fry the grid and unshielded electronics in all states except Alaska and Hawaii. Conceivably, and unpredictably, North Korea or Iran might dare to launch such a missile.

A more likely catastrophe, Mr Rawles believes, would be a pandemic virulent enough to cause the breakdown of the national sewerage system as well as the grid. Mr Savage, for his part, worries most about a “slow slide into socialism” akin to “death by a thousand cuts, right, you just keep whittling away at liberty” by, for example, restricting gun sales. Some of his firm’s clients fear that bankers may deliberately collapse the financial system in order to introduce a single global currency.

The dominant view is simply that institutions and infrastructure are more fragile than most believe, says Dave Westbrook, an American Redoubt consultant homesteading north-west of Sandpoint. Videos sold by his firm, Country Lifestyle Solutions, show redoubters how to assess the viability of off-grid properties, plant orchards and tend crops. But paranoia is out there, says Ben Ortize, the pastor of Grace Sandpoint Church. Terrorism, and the widespread belief that President Barack Obama’s progressive agenda is naive, have fuelled strong support for Donald Trump in the Redoubt, which has a disproportionately large population of former policemen, firemen and soldiers. To calm them down, he tells his flock that the Bible advises them to trust in the Lord, rather than in shotguns and Tasers.

The area’s bad rap is sometimes undeserved. “Hate in America: A Town on Fire”, a recent Discovery Channel broadcast about Kalispell, Montana, attempted to conflate gun-lovers who recoil at big government with the few white supremacists shown at the start. In fact, there is much less racism in the inland north-west than in the South, says Alex Barron, founder of the libertarian Charles Carroll Society blog and self-proclaimed “Bard of the American Redoubt”. Some are quick to label ideological opponents as white supremacists, he says. Liberal bloggers have called him one; but Mr Barron is black.

The Redoubt does give refuge to more than its fair share of outlaws, whether ageing draft-dodgers or crooks on the lam. So says Mike “Animal” Zook, a bounty hunter in Spirit Lake, Idaho with a gunslinger image enhanced by his sidearm’s faux-scrimshaw handle. Pointing east from the Riverman Gun Works car park, he notes that a man can trek that way for nearly 150 miles and see nothing but majestic forest and game. Turn south, and the wilderness extends more than double that.

Wanted men can and do disappear here, Mr Zook says. Some pan for gold, hunt, trap game and quietly slip into a town once a year or so for supplies. Nationwide, perhaps only one in 1,000 indicted felons skip bail and run for it, he says, but the percentage is higher in the Redoubt and especially in Lincoln County, in nearby north-western Montana. That provides enough work, he says, for more than 2,000 fugitive-recovery agents—as bounty hunters are also known—who, like himself, operate at least part-time, typically as private contractors for bondsmen in the Redoubt. All in all, the frontier spirit of America’s Old West is still alive and well.

Source: The Economist

U.S. Mortgage Rates Recently Fell to Lowest on Record

https://assets.bwbx.io/images/users/iqjWHBFdfxIU/ievTpIIJQ1k8/v5/-1x-1.png

The national average 30-year fixed home mortgage rate in the U.S. recently fell to 3.36 percent, matching the record low first reached in December 2012, according to Bankrate.com. Would-be home-buyers and homeowners looking to refinance existing mortgages at lower rates have benefited from a drop in U.S. Treasury yields since U.K. voters decided in June to leave the European Union. A comparable Freddie Mac mortgage gauge watched by the industry is near a record low, at 3.48 percent.

by Matthew Boesler | Bloomberg

Tear Downs Are On A Tear

Houston lost its locally famous Bullock-City Federation Mansion in 2014 to a developer who plans to erect townhouses on the site.

The house may not have been worthy of a place on a list of historically significant structures. But the 5,000-square-foot structure that was erected in 1906 on a 30,000-square-foot lot was the first in the sweltering Texas city to have air conditioning. And its demise was mourned by more than a few people.

“It’s a beautiful building,” Ernesto Aguilar, general manager of KPFT Radio, which sits next door, told the Houston Chronicle at the time. “It is sad to see a piece of Houston history going the same way as many others do.”

Tear downs — in which builders or private individuals purchase an aging, outmoded house, then demolish it and replace it with a modern home that will suit today’s homeowners — are currently on a tear in Houston. Permits for tear downs are up by 22% in the city this year.

And that phenomenon isn’t limited to Houston. Barry Sulphor, a real estate agent in the Los Angeles area, counts no less than 100 tear down sites in the so-called beach cities where he plies his trade: Hermosa Beach, Redonda Beach and Manhattan Beach. “And I’m sure there are just as many in Venice, Santa Monica and Beverly Hills,” Sulphor says.

According to the National Association of Home Builders’ best count, nearly 8% of all single-family housing starts in 2015 were attributable to tear down-related construction. That’s roughly 55,000 older houses gone forever, and that’s on top of the 31,800 single-family tear down starts in 2014.

In some instances, the houses that are destroyed are outmoded, functionally obsolete relics that no longer serve a useful purpose. But in other cases, they work just fine and simply lack up-to-date amenities. And some have historical significance that may or may not be worthy of saving.

Usually, the places that replace a tear down are larger, covering more of the lot and rising higher than the old place — often to the maximum height allowable under local zoning rules.

Sulphor recently sold two lots where the old houses were taken down. One was bought for $1.35 million by a builder who plans to put up a house with a nearly $4 million price tag. The other was purchased for $2.15 million by a retired couple who “love the creativity of working with architects to design luxury beach properties,” according to Sulphor. “When the new place is completed, it will fetch close to $5 million.”

Not everyone sees the benefit of tear downs. The leading opponent is the National Trust for Historic Preservation, which argues that they are an “epidemic” that is “wiping out historic neighborhoods one house at a time. As older homes are demolished and replaced with dramatically larger, out-of-scale new structures, the historic character of the existing neighborhood is changed forever.”

Richard Moe, a former president of the National Trust, said, “From 19th-century Victorian to 1920s bungalows, the architecture of America’s historic neighborhoods reflects the character of our communities. Tear downs radically change the fabric of a community. Without proper safeguards, historic neighborhoods will lose the identities that drew residents to put down roots in the first place.”

But the NAHB, which admits that tear downs “have become a significant modus operandi” for its members in some parts of the country, counters that the new houses often “breathe new life into older communities.”

Because tea rdowns are sometimes controversial, folks considering buying an older place with the idea of taking it down and putting up a new house should proceed cautiously. Often, these old homes are not advertised for sale on the open market or in the multiple listing service, so the challenge begins with finding out about one, says Sulphor. And once you do, the agent suggests making absolutely sure the condition of the current home is such that it cannot be salvaged.

Would-be buyers should also determine, before making an offer, whether what they plan to build conforms to local restrictions. Preservationists often use — or try to change — local building codes to push back against tear downs.

On the other hand, people trying to sell old properties that are tear down candidates should make sure whatever offers they receive are legit, Sulphor advises. Look for the proof that they have the funds to close the deal, especially if they say they will pay with cash and have no need of a mortgage.

Sellers should also realize that selling a property “as-is” does not insulate them from their obligation to disclose any issues that might impact value. The term “as-is” means only that the house is being offered and sold in its present condition.

by Lew Sichelman | National Mortgage News

Homes Are Selling Fast This Summer

https://martinhladyniuk.com/wp-content/uploads/2016/07/2ed06-serveimage.jpg

Homes are selling an average of a week faster than they did a year ago, meaning home shoppers should be prepared to move quickly in a competitive housing market, according to the June Zillow Real Estate Market Report.

Tight inventory continues to be a major factor for home shoppers. The supply of homes for sale is nearly 5 percent lower than it was a year ago, and 38 percent lower than its peak level in 2011. With fewer available options, home shoppers are moving quickly to buy homes, with the average U.S. home closing after 78 days on the market.

The 78-day average includes the time it takes to close, which is usually one or two months after the home goes under contract. This means that homes are pending within about a month of being listed.

The length of time homes stay on the market before selling has been steadily decreasing since 2010, when homes took an average of five months to sell. The average time home buyers had in Pittsburgh, Philadelphia and Charlotte, N.C. dropped by at least two weeks, the biggest change among the largest U.S. metros.

The low inventory and quick-moving market combine to create a competitive home shopping market, especially for potential buyers looking for less expensive homes. The most expensive third of the market has experienced the smallest drop in available inventory compared to the rest of the market.

“Homes are selling faster than ever as the home shopping season hits its peak,” said Zillow Chief Economist Dr. Svenja Gudell. “If you’re looking for a home, be prepared to move quickly. Adding to this difficult buying environment is low inventory—there simply aren’t many homes to choose from. And while this looks like a good time to be a seller, potential move-up buyers may hesitate to list their homes and become buyers. Until the supply increases, it will remain a tough market to find a home.”

by National Mortgage Professional

USA Today Reports Existing Home Sales Hit 9-Year High In June

https://s14-eu5.ixquick.com/cgi-bin/serveimage?url=http%3A%2F%2Fwww.botoxbeerbling.com%2Fwp-content%2Fuploads%2F2013%2F03%2Fmillion-dollar-luxury-home.jpg&sp=f67752c4d324e6c2f17de1784201a607

Bolstered by first-time home buyers, existing-home sales rose for the fourth straight month in June, reaching a nine-year high.

Sales of existing single-family homes, townhomes, condominiums and co-ops increased 1.1% to a seasonally adjusted annual rate of 5.57 million, up from May’s downwardly revised 5.51 million, the National Association of Realtors said Thursday. The June pace was the strongest since 2007.

First-time buyers made up 33% of those transactions, the biggest share in four years. That eased concerns that a shortage of affordable houses has been pushing entry-level buyers out of the market.

The median existing-home price also reached a new high as it surged 4.8% to $247,700 from a year ago, above the former peak of $238,900 in May.

June’s sales exceeded the highest forecast of economists polled by Bloomberg, 5.56 million.

Healthy job gains, record-high stock prices and near-record low mortgage rates stoked June’s positive showings, said Lawrence Yun, chief economist at the National Association of Realtors.

“The modest bump in June sales to first-time buyers can be attributed to mortgage rates near all-time lows and perhaps a hopeful indication that more affordable, lower-priced homes are beginning to make their way onto the market,” he said. “The odds of closing on a home are definitely higher right now for first-time buyers living in metro areas with tamer price growth and greater entry-level supply — particularly areas in the Midwest and parts of the South.”

The Midwest has the lowest median existing-home price among all regions, $199,900, followed by the South, at $217,400. The median price in the West climbed 7.2% from a year ago to $350,800.

Total available existing homes for sale dipped 0.9% to 2.12 million, now 5.8% below a year ago.

“Seasonally adjusted, the month’s supply of homes in June 2016 was the lowest since June 2005, indicating that inventory problems still plague home buyers,” said Ralph McLaughlin, Trulia’s chief economist.

by Athena Cao | USA Today

London Housing Bubble Melts Down

But don’t just blame Brexit.

https://s15-us2.ixquick.com/cgi-bin/serveimage?url=https:%2F%2Fwww.cable.co.uk%2Fimages%2Fnews%2F300x300xsouth-london-housing-developments-to-l-700001356.jpg.pagespeed.ic.J1wpbrftPb.jpg&sp=a702a6c51e4b528c39f961bf27de3e8a

In Central London – the 30 most central postal codes and one of the most ludicrously expensive housing markets in the world – eager home sellers are slashing their asking prices to unload their properties. But even that isn’t working.

In the 12 days after the Brexit vote, cuts to asking prices have soared by 163% compared to the 12 days before the vote, according to the Financial Times. Yet sales have plunged 18% from before the Brexit vote. Sales had already taken a big beating before then and are now down a mind-boggling 43% from where they’d been a year ago!

So Brexit did it?

Um, well, sort of. But it’s more than Brexit. Home prices on a £-per-square-foot basis had peaked in Q2 2014, according to real-estate data provider LonRes. Since then, the market in Central London has been hissing hot air. By Q1 2016, prices for homes above £5 million had dropped 8% from their 2014 peak, and prices for homes from £2 million to £5 million had plunged 10%.

Back in December 2015, we reported that luxury housing in London was getting mauled, based on the LonRes report for the third quarter, released at the time. It pointed the finger at folks who, once “awash with cash, don’t have as much to spend” [read…  It Gets Ugly in the Toniest Parts of London].

Then, in its spring review, LonRes called the prime London housing market “challenging.”

It wasn’t just the Brexit referendum and the new stamp duty – In 2014, a change in the stamp duty made buying high-end homes more costly; and in April this year, an additional duty was imposed on purchases beyond a primary residence. Now there’s a third reason, and it originates deep from the bowels of the UK economy. LonRes:

A third is now making itself known to us as it is not something that the chancellor can bury any more. This is the balance of payments which ran at 5.2% of GDP last year and was the largest annual deficit since records began in 1948.

If measures are not taken to bring this under control, then the mini experiment to deflate the London property bubble will seem small change compared to the £32.7bn deficit that exists.

The London residential market has undoubtedly slowed, and this is impacting prices. No one will disagree that London’s prime market needed the steam to be released from it. My guess is that this slower market will be here for some time.

And not just in London…

Last week, the Royal Institution of Chartered Surveyors was spreading gloom with its residential market survey of the UK, conducted after the Brexit vote, that found, as the Telegraph put it, “The number of people wanting to buy a house has fallen to the lowest level since mid-2008 amid post-referendum uncertainty.”

Lucian Cook, head of residential research at Savills, told the Telegraph:

“The current month’s figures suggest countrywide impact on sentiment which is to be expected. However previous months’ results would indicate that a slowdown in London has been on the cards for some time. It looks like the Brexit vote may be the trigger for this to materialize.”

Now all hopes are once again centered on foreigners and their money to bail out the housing bubble before it completely implodes. But this time, it’s different, as they say at the worst possible moment: it’s not the Russians or the Chinese, but people whose investments and incomes are in currencies linked to the US dollar. Over the last 12 months, the pound has lost about 14% against the dollar, most of it since the Brexit vote, which would give these folks an additional discount on UK real estate.

The Financial Times expressed those industry hopes, and its new saviors, citing Anthony Payne, managing director at LonRes:

“We have heard that quite a number of Middle Eastern buyers have been coming back into the market. A lot of them are converting from dollars, and together with any discount they get [plunging prices], the saving in the actual price is quite substantial,” said Mr. Payne. “Some people are concerned by Brexit – others see it as an opportunity.”

London isn’t the only ludicrously overpriced housing market, where prices, once helped along by foreign money, are skidding. And now the industry is hoping for more foreign money to wash ashore, just when the Chinese, by far the largest group of investors in the US housing market, are getting cold feet.

by Wolf Richter | Wolf Street

Case-Shiller Reports Home Prices Rise At Slowest Pace In 8 Months, As San Francisco Sales Volume Slump

April was not a good month for home prices – despite hopeful signs from seasonally adjusted sales data. S&P Case-Shiller 20-City index rose just 0.45% MoM (well below expectations and March’s 0.85% gain) – the weakest rise since Aug 2015. The broader Home Price Index hovered near unchanged for the 2nd month – the weakest since January 2012. Most worrisome, perhaps, is the 18.16% YoY plunge in San Francisco home sales… as perhaps the bubble is finally bursting.

20-City (Seasonally Adjusted) Index…

Broad (Seasonally-Adjusted) Home Price Index…

Source: Zero Hedge

Home Ownership at 48-year low

https://s14-eu5.ixquick.com/cgi-bin/serveimage?url=http%3A%2F%2Fmsue.anr.msu.edu%2Fuploads%2Ftopic_banners%2F_in_topic%2FFamily-Homeownership.jpg&sp=7c4f16b98149364e99892fe8129586c8

Home ownership is at a 48-year low, driven in part by a shocking pattern of foreclosure that put 9.4 million out of their homes during the recent recession, according to a Harvard survey.

In its “State of the Nation’s Housing 2016,” Harvard said that “the U.S. homeownership rate has tumbled to its lowest level in nearly a half-century.”

Figures from the St. Louis Fed showed a home ownership rate of 63.5 percent. The last time it was lower was in 1967.

The Harvard Joint Center on Housing Studies report put a focus on foreclosures.

“A critical but often overlooked factor is the role of foreclosures in depleting the ranks of homeowners. Indeed, CoreLogic estimates that more than 9.4 million homes (the majority owner-occupied) were forfeited through foreclosures, short sales, and deeds-in-lieu of foreclosure from the start of the housing crash in 2007 through 2015,” said the report.

The report also noted that the number of people using at least 30 percent of their income for housing rose, as our Joseph Lawler reported this week. It said, “40.9 million Americans, both homeowners and renters, spend more than 30 percent of their income on housing, including 19.8 million who spend over half of their income for housing.”

At the same time, said Harvard, the drive for the American Dream has been braked by low incomes, higher prices and bad credit.

Harvard:

“Just as exits from homeownership have been high, transitions to owning have been low. Tight mortgage credit is one explanation, with essentially no home purchase loans made to applicants with subprime credit scores (below 620) since 2010 and a sharp retreat in lending to applicants with scores of 620–660 compared with the early 2000s. And given that the homeownership rate tends to move in tandem with incomes, the 18 percent drop in real incomes among 25–34 year olds and the 9 percent decline among 35–44 year olds between 2000 and 2014 no doubt played a part as well.”

by Paul Bedard | Washington Examiner