The stock dropped 17 percent and is now trading at about half its IPO price.
In itssecond earnings reportas a public company,Snapdisappointed Wall Street with its user growth numbers for the second consecutive time and fell short on earnings.
The stock dropped about 17 percent after hours. It’s now off about 33 percent from its IPO price.
Blue Apron and Snap have a lot in common. They’re consumer focused. They have devoted followers. They’re losing money hand over fist.
And both were targeted directly and aggressively by two of tech’s biggest companies.
Between the time Blue Apron filed for its intial public offering, on June 1, and when it went public, on June 28, Amazon announced that it was buying Whole Foods. The speculation thatAmazonwould use the purchase to improve its home delivery service sent demand for Blue Apron’s IPO down, and the company slashed its IPO range from $15-$17 down to $10-$11.
Then, reports emerged that Amazon had already launched a meal kit, which was on sale in Seattle.
In the case of Snap, it was Facebook. Mark Zuckerberg and company had been fighting to blunt Snap’s growth ever since its co-founder, Evan Spiegel, rejected his buyout offer in 2013. It began to see progress with the launch of Instagram Stories in August 2016, which duplicated Snapchat’s own Stories feature. Over the next year, it gradually copied nearly every major Snapchat feature in its own products.
Less than a year after launch, Instagram Stories has 250 million daily users and is growing at a rate of around 50 million every three months. Snap has 173 million and grew only 7 million during the quarter.
The experiences of these companies are discouraging for start-up investors and founders who dream of someday creating an Amazon or Facebook of their own.
The five big tech companies — Alphabet (Google), Apple, Amazon, Facebook, and Microsoft — have attained unprecedented wealth and power, with trillions of dollars in combined market value and tens of billions of dollars in free cash flow.
They also need to satisfy Wall Street’s appetite for growth, which means they have to get new customers or earn more money from existing customers, quarter after quarter, year after year. One way to do that is to expand into new markets.
They’ll gladly outspend their smaller competitors on product development and hiring while undercutting them on price.
That doesn’t mean curtains for Blue Apron or Snap. Both companies could come up with a leapfrog innovation that catapults them (for a while). Young nimble companies overtake older and slower companies all the time — that’s how the Big Five started. Microsoft disruptedIBM. Google and Apple disrupted Microsoft. And so on.
But companies and tech investors need to be wise about the risks of betting on upstarts that are going up against these giants.
If you hope to make money through online advertising, you’ll be challenging Google and Facebook. If you’re doing anything in e-commerce, logistics or delivery, you’ll run into Amazon. In cloud computing, get ready to see Amazon,Microsoftand Google. If you’re building hardware, Apple likely stands in the way.
It might be better to focus on the niches that the Big Five don’t yet dominate. Their health-care efforts are still in early stages, and none is playing heavily in financial tech, drones or robotics. Microsoft’s power in enterprise software is blunted to some degree by other old giants like IBM,OracleandSAP, plus newer players likeSalesforce.
It’s always been hard to build a successful start-up. With the increasing dominance of the Big Five, it’s harder than ever.
Bitcoin is now up almost 35% since the August 1st fork, and up over 90% from the mid-July fork-fears panic low. Buying was heavy in the overnight Asian session but surged once again this morning, seemingly after US CPI data disappointed, lifting the price to a new record high of $3547.
As we noted earlier,“The real demand for bitcoin will not be known until a global financial crisis guts confidence in central banks and politicized capital controls.”
This is Bitcoin’s best week since pre-Brexit anxiety sent the virtual currency surging in June 2016…
Coinbase CEO Brian Armstrong noted: “Digital currencies are having their ‘Netscape’ moment…The pace of innovation has been accelerating and we are now seeing exciting projects and companies being built on top of digital currencies.”
As CoinTelegraph also notes, recent tension between the US and North Korea has played its part on the global market, rattling some of the major asset classes. However, not being pegged, or controlled by any centralized force, Bitcoin was totally unaffected by the news.
Cryptocurrencies are famous for their volatility, but the non-correlation between the global market slipping and cryptocurrencies mostly staying up shows that these decentralized forms of currency won’t be affected like traditional assets.
Concerns over the future of Social Security play a starring role in American seniors’ overall retirement uncertainty — and that’s before considering how much of the benefit might eventually need to go toward unexpected medical expenses.
After factoring in supplemental insurance premiums and other uninsured health costs, the average retiree only takes home 75% of his or her Social Security benefits, according to a new study from researchers at Tufts University and Boston College.
“A substantial share of other households have even less of their benefits left over,” researchers Melissa McInerney of Tufts and Matthew S. Rutledge and Sara Ellen King of BC wrote.
In fact, for three percent of retirees, out-of-pocket health expenses actually exceed their Social Security Old Age and Survivors Insurance (OASI) benefits, the team concludes.
These findings are part of an overall trend: Despite positive steps such as the introduction of Medicare Part D coverage for prescription drugs in 2006, seniors have increasingly paid more for health expenses directly from their pockets.
“Until a slowdown during this decade, out-of-pocket costs for Medicare beneficiaries rose dramatically — costs increased by 44% between 2000 and 2010 — and they are expected to continue to rise faster than overall inflation,” the researchers wrote.
To perform their study, which was introduced at the annual Joint Meeting of the Retirement Research Consortium in Washington, D.C. last week, the team analyzed individual data points for Social Security recipients aged 65 and older between 2002 and 2014. They found a wide range in medical spending among that cohort: For instance, while the median retiree spent $2,400 in 2014, the total group averaged $3,100 per person, with retirees in the 75th percentile logging $4,400.
The researchers also warn that they only analyzed medical expenses, citing a 2017 paper that concluded that housing costs, taxes, and “non-housing debt” eat up about 30% of a retiree’s income.
“Although out-of-pocket medical spending has declined somewhat since the instruction of Part D … these findings suggest that Social Security beneficiaries’ lifestyles remain vulnerable to a likely revival in medical spending growth,” the team concludes.
Read McInerney, Rutledge, and King’s full findingshere.
Having‘nailed’ the price action recently in Bitcoin(calling the recent pull back, extension beyond $3,000, with a target of $3,915), Goldman notes that it’s getting harder for institutional investors to ignore the rise of cryptocurrencies.
Last month Goldman’s chief technician, Sheba Jafari, issued their forecast of where bitcoin is headed next. Recall, that as wefirst reported three weeks ago,Jafari said that “due to popular demand, it’s worth taking a quick look at Bitcoin here” and warned that “the market has come close (enough?) to reaching its extended (2.618) target for a 3rd of V-waves from the inception low at 3,134.” She concluded that she was “wary of a near-term top ahead of 3,134” and urged clients to “consider re-establishing bullish exposure between 2,330 and no lower than 1,915.”
She was right: on the very day the note came out, both bitcoin and ethereum hit their all time highs and shortly after suffered their biggest drop in over two years.
So what does Jafari thinks will happen next? According to the Goldman technician, Bitcoin is now “in wave IV of a sequence that started at the late-’10/early-’11 lows. Wave III came close enough to reaching its 2.618 extended target at 3,135. Wave IV has already retraced between 23.6% and 38.2% of the move since Jan. ‘15 to 2,330/ 1,915.”
What does this mean for the uninitiated? In short, while bitcoin remains in Wave IV, it could go up… or down. She explains:
It’s worth keeping in mind that fourth waves tend to be messy/complex. This means that it could remain sideways/overlapping for a little while longer. At this point, it’s important to look for either an ABC pattern or a more triangular ABCDE. The former would target somewhere close to 1,856; providing a much cleaner setup from which to consider getting back into the uptrend. The latter would hold within a 2,076/3,000 range for an extended period of time.
However, at that point the next major breakout higher would take place, one which would take bitcoin as high as $3,915.
Either way, eventually expecting one more leg higher; a 5th wave. From current levels, [Bitcoin] has a minimum target that goes out to 3,212 (if equal to the length of wave I). There’s potential to extend as far as 3,915 (if 1.618 times the length of wave I). It just might take time to get there.
Goldman’s analyst concludes with the following summary: “[Bitcoin] could consolidate sideways for a while longer. Shouldn’t go much further than 1,857. Eventually targetingat least 3,212.“
And now, Goldman offers an FAQ for the institutional investor…
The debate has shifted from the legitimacy of the ‘fiat of the internet’ to how fast new entrants are raising funds. The hype cycle is in full effect with Bitcoin, the first, largest and most widely recognized cryptocurrency up almost 200% YTD (v 11% for the S&P 500) and a host of other emerging ‘alt coins’ growing in scope and presence (witness the growth of Ethereum).
Whether or not you believe in the merit of investing in cryptocurrencies (you know who you are) real dollars are at work here and warrant watching especially in light of the growing world of initial coin offerings (ICOs) and fundraising that now exceeds Internet Angel and Seed investing.
FAQs:
1. Two Sides To The Coin: Is Cryptocurrency a “Currency” or “Commodity”?
Answer: It depends who you ask. The complexity exists because coins have attributes of a currency (e.g. presented and trusted by some medium of exchange) and commodity (e.g. limited resource). The classification of cryptocurrencies varies by country, government and even application. In the U.S., the IRS has ruled that virtual currency does not have legal tender status in any jurisdiction. For tax purposes, the IRS treats virtual currency as property.
2. How Big Is The Cryptocurrency Market?
Answer: Nearly $120 billion. Bitcoin remains the largest and accounts for nearly 50% of the total market cap (Exhibit 5).
There are currently over 800 cryptocurrencies out there, though just 9 have a market cap in excess of $1 billion.
While its growth has been impressive, the aggregate market cap of cryptocurrencies equates to less than 2% of the value of all the mined gold in the world.
3. What Is Ethereum?
Answer: A Platform 1st, a Cryptocurrency 2nd. Ethereum differs primarily from Bitcoin in the latter is set up to be an alternative to ‘real money’ while the former is more of a platform set up to run any decentralized application and automatically execute “smart contracts” when certain conditions are met. Ethereum offers a digital currency like Bitcoin – called Ether – but this is just one component of its smart contract execution and primarily used to facilitate and reward using the network. However, the rise of Ethereum has not come without setbacks, including the ~$60 million hack of “The DAO”, a venture capital like organization with the mission of “investing” in Ethereum-related start-ups and projects (and is no longer operational today).
4. How Does One Trade Cryptocurrencies in the United States?
Answer: Digital Exchanges, Block Trades and (soon to be) Options. Individual investors can trade virtual coins on various online exchanges. Institutional traders have largely stayed out of the cryptocurrency market due to its relatively small size, structure of mandates and volatility, but block trading exists to facilitate the execution of larger orders. In addition, Bitcoin options exist and are traded on offshore exchanges. Futures and options may also be coming to the US soon. On August 2, 2017, the CBOE entered an agreement with Gemini Trust Co to allow cash-settled Bitcoin futures on CBOE Futures Exchange in 4Q-17 or early 2018.
5. What is an Initial Coin Offering (ICO)?
Answer: Fundraiser through token sales. The amount of money funding ICOs has grown exponentially and the speed at which money is raised via a white paper and internet browser has sounded the alarm bells from parties including the SEC and the People’s Bank of China. According to Coin Schedule, ICOs have raised $1.25 billion this year, outpacing global Angel & Seed stage Internet VC funding in recent months.
The Tezos blockchain raised a record breaking $232 million worth of Bitcoin and Ether through an ICO completed last month. The next closest? Bancor’s ICO which raised $150 million in mid-June. And the speed of ICOs is an added benefit: Gnosis raised more than $12 million in under 15 minutes.
Sin City’s projected 5,000 new apartment units for this year makes no noise nationally in the latest real estate craze. “In 2017, the ongoing apartment building-boom in the US will set a new record: 346,000 new rental apartments in buildings with 50+ units are expected to hit the market,” writes Wolf Richter onWolf Street. That is three times the number of units that came on line in 2011.
Richter continues, “Deliveries in 2017 will be 21% above the prior record set in 2016, based on data going back to 1997, by Yardi Matrix, viaRent Café. And even 2015 had set a record. Between 1997 and 2006, so pre-Financial-Crisis, annual completions averaged 212,740 units; 2017 will be 63% higher!”
I’ve written before about the high-rise crane craze in Seattle, but that’s nothing compared to New York and Dallas, that are adding 27,000 and 25,000 units, respectively. Chicago is adding 7,800 units despite a shrinking population and rents decreasing 19 percent.
Not surprisingly, Fannie Mae and Freddie Mac are financing this rental housing boom. Iwrote recently, the GSEs made 53% of all apartment loans in 2016, down from their combined 68% market share in 2012. “So, their conservator, The Federal Housing Finance Agency (FHFA), recently eased the GSE’s lending caps so they can crank out even more loans.”
Mary Salmonsen writes formultifamilyexecutive.com, “Currently, Fannie and Freddie are particularly dominant in garden apartments [and] in student housing, with 62% and 61% shares, respectively. The two remain the largest mid-/high-rise lenders but hold only 35% of the market.”
Mr. Richter warns us, “Government Sponsored Enterprises such as Fannie Mae guarantee commercial mortgages on apartment buildings and package them in Commercial Mortgage-Backed Securities. So taxpayers are on the hook. Banks are on the hook too.”
But, for the moment, it’s build them and they will come; first renters, then complex buyers. Wall Street giant “The Blackstone Group acquired three Las Vegas Valley apartment complexes for $170 million, property records show,” writes Eli Segall for theLas Vegas Review Journal. “Overall, it bought 972 units for an average of $174,900 each.”
Sales like this has developers going as fast as they can. I heard an apartment developer say Vegas has at least four more good years left in this cycle and is scrambling for new sites. In the land of Starbucks, Microsoft and Amazon, it’s thought the boom will never end. Richter writes, “the new supply of apartment units hitting the market in 2018 and 2019 will even be larger. In Seattle, for example, there are 67,507 new apartment units in the pipeline.”
However, while no one was paying attention, “the prices of apartment buildings nationally, after seven dizzying boom years, peaked last summer and have declined 3% since,” Richter writes. “Transaction volume of apartment buildings has plunged. And asking rents, the crux because they pay for the whole construct, have now flattened.”
As usual, cheap money entices developers to over do it, and the fall will be just as painful.
It’s been about a decade since the term “mortgage arbitrage” made headlines. It’s back.
In the clearest sign yet of just how late far the investing cycle the developed world finds itself,the FT writes that wealthy British homeowners are again borrowing against their property to invest in bonds, equities, alternative investments or commercial property as the low cost of debt creates opportunities for “mortgage arbitrage”. And while taking out a mortgage to invest in “safer” arbs like corporate bonds, commercial real estate or private equity would be at least understandable, if not excusable, in the current low-yield regime, some more extreme “investment” decisions suggest that the madness and euphoria that marked the peak of the last asset bubble is back: because while growing numbers are prepared to risk using their primary residence as collateral, some are ready to gamble on extremely volatile assets like bitcoin, wine and cars.
One broker said a mortgage-free homeowner with a house valued at £10m had taken out a fixed-rate loan of just under £2m to buy bitcoin, the crypto currency that has seen huge volatility in recent months. Others have invested in classic cars or fine wine. One former banker took out a £500,000 mortgage, not for investment purposes, but to provide a fund for routine spending and other eventualities.
To be sure, while these are extreme – and for now rare – examples of investor euphoria, even the more mundane “mortgage arbitrageurs” are willing to take major gambles: “Interest rates of less than 2 per cent on two- and five-year fixed-rate home loans are tempting high-income, mortgage-free homeowners to raise money against their property in the hope they can profit from higher rates of return elsewhere.”
Simon Gammon, director at mortgage broker Knight Frank Finance, said the arbitrage had emerged as a trend among financially sophisticated clients as mortgage rates fell.
“We’re a specialist lender at the top end but we’re seeing up to a dozen of these deals a month,” he said. “This is something that has come about because of the current environment of low rates.”
How prevalent is this behavior which peaked during the last housing/credit bubble?
Mark Pattanshetti, a mortgage manager at broker Largemortgageloans.com, said the number of borrowers taking out loans to fund investments had risen by about 50% since 2009. “Borrowers have realized the cost of debt is cheap and it isn’t going to get much cheaper,” he said. Unfortunately, what borrowers are forgetting is that home prices can drop as mortgage rates rise, while risk assets – impossible as it may sound – can correct sharply, hitting borrowers with the double whammy of rising LTVs as inbound margin calls force them to liquidate into a sliding market.
Ironically, anecdotal evidence suggests that this troubling behavior has been prompted be declining UK home prices – until recently one of the best performing British assets. This has been the result of Brexit-related concerns, a decline in Chinese and other foreign investors rushing after UK real estate, as well as concerns that the BOE will soon raise rates, resulting in increasingly more “for sale” signs.
As the FT notes, “for debt-free homeowners, remortgaging during the years of booming house prices was often a means of raising cash to carry out home improvements or expand a buy-to-let portfolio. But slowing house price growth and a regulatory and tax crackdown on landlords have made these options less attractive.
Hugh Wade-Jones, group managing director of mortgage broker Enness, said: “It’s accepted that property is no longer going to be the all-conquering investment, doubling every 10 years, so people are looking elsewhere for returns.”
In addition to bitcoin, cars and wines, borrowers with housing equity are putting money into everything from bonds and private equity and commercial property, brokers told the FT. David Adams, managing director of John Taylor, a Mayfair-based estate agent, said investors were borrowing against London residential properties to fund investment in commercial and mixed use developments from Southampton to Birmingham at returns of 6 to 7 per cent.
“Wealthy investors are no longer chasing capital gain. There is a switch to yield,” Adams said.
According to Knight Frank’s Gammon, the practice typically appealed to those with investment experience. “People who have not needed to borrow have looked at the rates available — and we’ve now got five-year fixed rates from 1.65 per cent — and said if I can’t make 1.65 per cent or more from my money, then I don’t know what I’m doing.”
Unfortunately, should home prices in the near future tumble while risk assets slide, crushing the “experienced” investors, that’s exactly what one can conclude.
Making it easier for the “smart investors” to bury themselves with margin calls, there are no regulations prohibiting this kind of behavior:
There is nothing in mortgage regulation to prevent someone raising a loan on a mortgage-free property for personal investments, as long as the lender assesses that the loan is affordable and not being used, for instance, to prop up a business generating income for its repayment.
Lenders, however, may choose to apply criteria that restrict the use of capital raised through a mortgage, although private banks are typically more relaxed about non-property investments than high street banks. For bigger mortgages, lenders will also moderate risk by insisting that the size of the loan does not exceed 60 per cent of the property’s value.
Naturally, it doesn’t take a big drop in the value of the property coupled with a slide in the “alternative investment” to wipe out the LTV buffer, pushing the value of the loan above the underlying collateral. That said, “the Financial Conduct Authority, which regulates mortgage lenders, declined to comment on individuals borrowing against their house for personal investments.”
In a tangent, the FT then focuses on the tax considerations of this risky behavior.
Unlike gains on a principal private residence, any gains on investments would be subject to capital gains tax (CGT). A wealthy homeowner may therefore seek to transfer borrowed funds to a spouse who has not used his or her annual CGT allowance. If the investment is designed to provide a stream of income, there could be a case for a transfer to a spouse who pays the basic rate of income tax, advisers said.
Nimesh Shah, a tax adviser at accountants Blick Rothenberg, said that if a homeowner took out a loan to invest in commercial property — and this was specified as the purpose of the loan — residential mortgage interest could potentially be offset against the commercial rental income.
Of course, the above assumes capital appreciation and therefore, capital gains. For now nobody is worrying on the more unpleasant outcome, one where there are no gains to book taxes again. Then again, in a wholesale wipeout at least the “smart money” will have years and years of NOLs carryforward losses to offset any future income taxes. Just like Donald Trump.
(CNBC) Ride-hailing apps such as Uber and Lyft have been so disruptive to New York City’s taxi industry, they are causing lenders to fail.
Three New York-based credit unions that specialized in loaning money against taxi cab medallions, the hard-to-get licenses that allow the city’s traditional cab fleet to operate, have been placed into conservatorship as the value of those medallions has plummeted.
Just three years ago, cab owners and investors were paying as much as $1.3 million for a medallion. Now they are worth less than half that, and some medallion owners owe more on their loans than the medallions are worth.
“You’ve got borrowers who are under water. This is just like the subprime loan crisis,” said Keith Leggett, a credit union analyst and former senior economist at the American Bankers Association.
LOMTO Federal Credit Union, which was founded by taxi drivers in 1936 for mutual assistance, was placed into conservatorship by the National Credit Union Administration on June 26 “because of unsafe and unsound practices.”
New York City has the nation’s largest taxi industry, with more than 13,000 medallions.
Marcelino Hervias bought his medallion in 1990 for about $120,000 and thought its value would hit $2 million by the time he was ready to retire.
Instead, the 58-year-old said he owes $541,000 and is driving 12 to 16 hours a day to make ends meet.
“I celebrate my kids’ birthdays over the phone. Why?” Hervias said.
While some medallions are held by large owners with fleets, owning a single medallion was long seen as a ticket to the middle class for immigrants like Hervias, who is from Peru.
Many of them now owe more on their medallion loans than they originally paid for the medallions because they used their equity in the medallion for a home, a child’s education or other expenses.
Hervias said he borrowed against his medallion to pay for medical care for his mother, a new car and a visit to his homeland.
“Every time we want to go on vacation or do something, where do we go? To the equity of the medallion,” he said.
Other medallion owners tell similar stories.
Constant Granvil bought his medallion for $102,000 in 1987 and said he now owes more than $300,000 to his lender. He could have sold the medallion for two or three times that a few years ago, “but I said no, I’m not going to sell it,” said Granvil, who is 76. “And then I got caught.”
The value of Granvil’s medallion is hard to pinpoint because 2017 sale prices have varied from the $200,000s to the $500,000s depending on whether lenders are willing to finance the purchase.
Meanwhile, Granvil, who no longer drives because of poor health and uses a broker to hire a driver, said he is facing threats from the lender, Melrose Credit Union, to foreclose on not just his medallion, but also his house.
“How am I going to live?” he said. “And now Melrose wants to take my house?”
The New York State Department of Financial Services took possession of Melrose Credit Union in February and appointed the NCUA as conservator.
Critics say the federal agency is playing hardball with medallion owners like Granvil, who have been making their payments, by demanding that they pay off their loans in full or face foreclosure.
“They’re approaching it with this cookie-cutter idea,” said David Beier, head of the Committee for Taxi Safety, an association of taxi leasing agents. “They want you to mortgage your house to them as collateral. It’s forcing borrowers into bankruptcy.”
John Fairbanks, a spokesman for the NCUA, said that the agency has hired a management team to run Melrose and that it would be inappropriate to comment on the management team’s actions.
Supporters of the yellow cab industry have sued and pushed for city legislation to try to level the playing field between taxis and ride-hailing apps, which they say enjoy advantages like not paying a public transportation improvement surcharge that’s levied on yellow cabs and not having to outfit a percentage of cars with disabled-access features.
City Council member Ydanis Rodriguez, who chairs the council’s transportation committee, called this week for a panel to investigate the fall in medallion values.
According to a Morgan Stanley report, there were 11.1 million yellow cab trips in the city in April 2016, compared with 4.7 million Uber trips and 750,000 Lyft trips. The 11.1 million taxi rides were 9 percent fewer than the April 2015 number.
Some observers believe that the yellow cab’s market share will continue to shrink and that the value of a medallion won’t recover.
“This is a commodity that has been fundamentally disrupted,” said Leggett, who has written about medallion loans in his online newsletter Credit Union Watch. “I don’t see the value of the medallions getting close to what they were.”
Equity bears hunting for excess in the stock market might be better off worrying about bond prices, Alan Greenspan says. That’s where the actual bubble is, and when it pops, it’ll be bad for everyone.
“By any measure, real long-term interest rates are much too low and therefore unsustainable,” the former Federal Reserve chairman said in an interview. “When they move higher they are likely to move reasonably fast. We are experiencing a bubble, not in stock prices but in bond prices. This is not discounted in the marketplace.”
While the consensus of Wall Street forecasters is still for low rates to persist, Greenspan isn’t alone in warning they will break higher quickly as the era of global central-bank monetary accommodation ends. Deutsche Bank AG’s Binky Chadha says real Treasury yields sit far below where actual growth levels suggest they should be. Tom Porcelli, chief U.S. economist at RBC Capital Markets, says it’s only a matter of time before inflationary pressures hit the bond market.
“The real problem is that when the bond-market bubble collapses, long-term interest rates will rise,” Greenspan said. “We are moving into a different phase of the economy — to a stagflation not seen since the 1970s. That is not good for asset prices.”
Stocks, in particular, will suffer with bonds, as surging real interest rates will challenge one of the few remaining valuation cases that looks more gently upon U.S. equity prices, Greenspan argues. While hardly universally accepted,the theory underpinning his view, known as the Fed Model, holds that as long as bonds are rallying faster than stocks, investors are justified in sticking with the less-inflated asset.
Right now, the model shows U.S. stocks at one of the most compelling levels ever relative to bonds. Using Greenspan’s reference of an inflation-adjusted measure of bond yields, the gap between the S&P 500’s earnings yield of 4.7 percent and the 10-year yield of 0.47 percent is 21 percent higher than the 20-year average. That justifies records in major equity benchmarks and P/E ratios near the highest since the financial crisis.
If rates start rising quickly, investors would be advised to abandon stocks apace, Greenspan’s argument holds. Goldman Sachs Group Inc. Chief Economist David Kostin names the threat of rising inflation asone reasonhe isn’t joining Wall Street bulls in uppingyear-end estimatesfor the S&P 500.
While persistently low inflation would imply a fair value of 2,650 on the benchmark gauge, the more likely case is a narrowing of the gap between earnings and bond yields, Kostin says. He is sticking to his estimate that the index will finish the year at 2,400, implying a drop of about 3 percent from current levels.
That’s no slam dunk, as stocks have provenresilient to bond routsso far in the eight-year bull market. While the 10-year Treasury yield has peaked above 3 percent just once in the past six years, sudden spikes in yields in 2013 and after the 2016 election didn’t slow stocks from their grind higher.
Those shocks to the bond market proved short-lived, though, as tepid U.S. growth combined with low inflation to keep real and nominal long-term yields historically low.
That era could end soon, with the Fed widely expected to announce plans for unwinding its $4.5 trillion balance sheet and central banks around the world talking about scaling back stimulus.
“The biggest mispricing in our view across asset classes is government bonds,’’ Deutsche Bank’s Chadha said in an interview. “We should start to see inflation move up in the second half of the year.”
After dropping to an all time low 62.9% in Q2 of 2016, the US home ownership rate rebounded modestly in the subsequent two quarters, then dropped again at the start of the year, before once again rising fractionally to 63.7% in Q2 of 2017 from 63.6% in the previous quarter, just 1% from the all time lows in the series history going back to the mid 1960s.
A breakdown of the data by age group reveals that the primary driver for this decline has been the youngest age cohort. While older Americans, especially those 65 and older, have predictably seen only modest declines in their home ownership in recent decades, it was the youngest age group, those 35 and younger, the Millennials, who over the past decade have seen their home ownership decline steadily from the low 40%’s to the mid-30%, although in Q2 there was a glimmer of good news, as the home ownership rate for Americans 35 and younger posted its first increase in 3 quarters, rising from 34.3% to 35.3%.
As shown in the chart below, the homeownership rate for Millennials has declined from 43.6% in June 2004 to 35.3% in the latest qua rter, and just shy of the lowest rate reported by the Census Bureau going back nearly a quarter century. Of note: while Millennials finally splurged on houses in the latest quarter, the home ownership rates for every other age cohort declined.
But what was most notable in the latest Census data is that for yet another quarter, more Americans opted not to own, but rather rent, and in Q1 the median asking rent jumped by 7.4% Y/Y, from $864 in Q1 to $910.
Broken down by region, the sharpest spike in asking rents was in the Northeast and Western regions, whose median asking rents were nearly identical, at $1,182 and $1,192, an increase of 21% and 16%, respectively.
Finally, what makes the latest spike in rents curious is that while the homeownership vacancy rate declined in the latest quarter, the rental vacancy rate actually increased to 7.3% from 7.0%, the highest since Q1 2016. The rental vacancy has been increasing since Q2 2016 when it troughed at 6.7%, and has since posted four quarters of consecutive growth. It would seem counter intuitive that the vacancy rate is rising even as median asking rents are hitting new all time highs.
While a new record in rents is hardly what Americans want to hear, it will be music to the Fed’s ears as it means that contrary to various other calculations and imputations, inflation in the US is alive and well.
Unofficially, Libor died some time in 2012 when what until then was a giant “conspiracy theory” – namely that the world’s most important reference index, setting the price for $350 trillion in loans, credit and derivative securities had been rigged for years – was confirmed.Officially, Libor died earlier today when the top U.K. regulator, the Financial Conduct Authority which regulates Libor, said the scandal-plagued index would be phased out and that work would begin for a transition to alternate, and still undetermined, benchmarks by the end of 2021.
As Andrew Bailey,chief executive of the FCA, explainedthe decision to eliminate Libor was made as the amount of interbank lending has hugely diminished and as a result “we do not think markets can rely on Libor continuing to be available indefinitely.”
He is right: whether as a result of central banks effectively subsuming unsecured funding needs, or simply due to trader fears of being caught “red-handed” for simply trading it, the number of transactions directly involving Libor have virtually ground to a halt.According to the WSJ, “in one case banks setting the Libor rate for one version of the benchmark executed just 15 transactions in that currency and duration for the whole of 2016.”
As the WSJ adds, the U.K. regulator has the power to compel banks to submit data to calculate the benchmark. “But we do not think it right to ask, or to require, that panel banks continue to submit expert judgments indefinitely,” he said, adding that many banks felt “discomfort” at the current set up. The FCA recently launched an exercise to gather data from 49 banks to see which institutions are most active in the interbank lending market.
Commeting on the decision, NatWest Markets’ Blake Gwinn told Bloomberg that the decision was largely inevitable: “There had never been an answer as to how you get market participants to adopt a new benchmark. It was clear at some point authorities were going to force them. The FCA can compel people to participate in Libor. What can ICE do if they’ve lost the ability to get banks to submit Libor rates?”
Gwinn then mused that “in the meantime, what’s today’s trade? The U.K. has Sonia, but the U.S. doesn’t have a market. There’s still so much uncertainty at this point” Yesterday, “a Libor swap meant something. Now you can’t rely on swaps for balance-sheet hedging.”
And so the inevitable decision which many had anticipated, was finally made: after 2021 Libor will be no more.
Below is a brief history of what to many was and still remains the most important rate:
1986: First Libor rates published.
2008: WSJ articles show concerns with Libor. Regulators begin probes.
2012: Barclays becomes first bank to settle Libor-rigging allegations. U.K. regulator pledges to reform the benchmark.
2014: Intercontinental Exchange takes control of administering Libor.
2015: Trader Tom Hayes gets 14-year prison sentence after Libor trial.
2017: U.K. regulator plans to phase in Libor alternatives over five years.
Yet while anticipated, the surprising announcement of Libor’s upcoming death has taken many traders by surprise, not least because so many egacy trades still exist. As BLoomberg’s Cameron Crise writes, “There is currently an open interest of 170,000 eurodollar futures contracts expiring in 2022 and beyond – contracts that settle into a benchmark that will no longer exist. What are existing contract holders and market makers supposed to do?“
Then there is the question of succession: with over $300 trillion in derivative trades, and countless billion in floating debt contracts, currently referening Libor, the pressing question is what will replace it, and how will the transition be implemented seamlessly?
The FCA’s CEO didn’t set out exactly what a potential replacement for Libor might look like but a group within the Bank of England is already working on potential replacements. “However, any shift will have to be phased in slowly.”
Bailey said it was up to the IBA and banks to decide how to move Libor-based contracts to new benchmarks. After 2021 IBA could choose to keep Libor running, but the U.K. regulator would no longer compel banks to submit data for the benchmark.
The Fed has already been gearing up for the replacement: last month the Alternative Reference Rates Committee, a group made up of the largest US banks, voted to use a benchmark based on short-term loans known as repurchase agreements or “repo” trades, backed by Treasury securities, to replace U.S. dollar Libor. The new rate is expected to be phased in starting next year,and the group will hold its inaugural meeting in just days, on August 1.
The problem with a repo-based replacement, however, is that it will take the placidity of the existing reference rate, and replace it with a far more volatile equivalent. As Crise points, out, “since 2010 the average daily standard deviation of three month dollar Libor is 0.7 basis points. The equivalent measure for GC repo is 4.25 bps. That’s a completely different kettle of fish.”
So as the countdown to 2021 begins, what replaces Libor is not the only question: a bigger problem, and perhaps the reason why Libor was so irrelevant since the financial crisis, is that short-term funding costs since the financial crisis were virtually non-existent due to ZIRP and NIRP. Now that rates are once again rising, the concern will be that not does a replacement index have to be launched that has all the functionality of Libor (ex rigging of course), but that short-term interest rates linked to the Libor replacement will be inevitably rising. And, for all those who follow funding costs and the upcoming reduction in liquidity in a world of hawkish central banks, this means that volatility is guaranteed. In other words, this forced transition is coming in the worst possible time.
Then again, as many have speculated, with the next recession virtually assured to hit well before 2021, it is much more likely that this particular plan, like so many others, will be indefinitely postponed long before the actual deadline.
Amazon wiped out billions of dollars worth of grocery store market cap last month when they announced plans to purchase Whole Foods. The announcement sent shares of Kroger, Wal-Mart, Sprouts, and Target, among others, plunging… (WMT -4%, TGT -5.5%, SFM -7.6%, KR -12%).
But, as we pointed out back in May, well before Amazon’s decision to buy Whole Foods, Amazon’s success in penetrating the traditional grocery market was always a matter of when, not if. Concept stores, like Amazon Go, already exist that virtually eliminate the need for dozens of in-store employees which will allow them to generate higher returns at lower price points than traditional grocers. And, with grocery margins averaging around 1-2% at best, if Amazon, or anyone for that matter, can truly create smart stores with no check outs and cut employees in half they can effectively destroy the traditional supermarket business model.
And while the demise of the traditional grocery store will undoubtedly take time (recall that people were calling for the demise of Blockbuster for nearly a decade before it finally happened), make no mistake that the retail grocery market 10-15 years from now will not look anything like the stores you visit today.
And while the demise of the traditional grocery store will undoubtedly take time (recall that people were calling for the demise of Blockbuster for nearly a decade before it finally happened), make no mistake that the retail grocery market 10-15 years from now will not look anything like the stores you visit today.
So, grocers have a choice: (i) adapt to the technological revolution that is about to transform their industry or (ii) face the same slow death that ultimately claimed the life of Blockbuster.
As such, as the theSt. Louis Post-Dispatchpoints out today, the relatively small Midwest grocery store chain of Schnucks has decided to roll out the first of what could eventually be a large fleet of grocery stocking robots.
A slender robot named Tally soon will be roaming the aisles at select Schnucks groceries, on the lookout for out-of-stock items and verifying prices.
Maryland Heights-based Schnuck Markets, which operates 100 stores in five states, on Monday will begin testing its first Tally at its store at 6600 Clayton Road in Richmond Heights. The pilot test is expected to last six weeks. A second Tally will appear in coming weeks at Schnucks stores at 1060 Woods Mill Road in Town and Country and at 10233 Manchester Road in Kirkwood.
The robots are the first test of the technology in Missouri and could ultimately be expanded to more Schnucks stores.
Each 30-pound robot is equipped with sensors to help it navigate the store’s layout and avoid bumping into customers’ carts. When it detects product areas that aren’t fully stocked, the data is shared with store management staff so the retailer can make changes, said Dave Steck, Schnuck Markets’ vice president of IT and infrastructure.
Tally, created by a San Francisco-based company named Simbe, is also being tested at other mass merchants and dollar stores all across the country.
Founded in 2014, Simbe has placed Tally robots in mass merchants, dollar stores and groceries across the country, including some Target stores in San Francisco last year.
“The goal of Tally is to create more of a feedback mechanism,” Bogolea said. “Although most retailers have good supply chain intelligence, and point-of-sale data on what they’ve sold, what’s challenging for retailers is understanding the true state of merchandise on shelves. Everyone sees value in higher quality, more frequent information across the entire value chain.”
The robot does take breaks. When Tally senses it’s low on power, it finds its way to a charging dock. And, the robot is designed to stay out of the way of customers. If it detects a congested area, it’ll return to the aisle when it’s less busy. If a shopper approaches the robot, it’s programmed to stop moving.
Meanwhile, with nearly 40,000 grocery stores in the U.S. employing roughly 3.5mm people, most of whom work at or near minimum wage, Bernie’s “Fight for $15” agitators may want to take note of this development.
When you arise in the morning, think of what a precious privilege it is to be alive, to breathe, to think, to enjoy, to love.
–Marcus Aurelius–
Why is it so hard to do the things that are in line with our goals but not with our desires at that moment? How can we harness the power of our minds to create a steady fountain of self-discipline each day?
Dealing with Negative People: Advice from a Roman Emperor
I believe happiness is 10% circumstances and 90% attitude.
How you react to your circumstances makes the biggest impact – and the way you choose to deal with negative people is no exception.
As the ruler of a vast empire, Marcus Aurelius had to deal with negative people on a daily basis. In his writings – the self-addressed Meditations – Aurelius provides us with a quote about dealing with negative people that I find to be an incredibly helpful reminder for setting my attitude.
WASHINGTON, DC – Expectations for 2017 economic growth remain at 2.0 percent amid a projected second half slowdown, according to the Fannie Mae Economic & Strategic Research (ESR) Group’s July 2017 Economic and Housing Outlook. With the expansion having entered its ninth year, incoming data point to a second quarter economic growth rebound to 2.7 percent annualized, up from 1.4 percent in the first quarter. However, the full percentage point rise in the saving rate since December signals increased caution among consumers, despite elevated consumer confidence. Decelerating corporate profit growth, commonly seen in the late stages of an expansion, presents a challenge to business investment that is compounded by tax policy uncertainty. In addition, residential investment will likely contribute less to second half growth due to lackluster homebuilding activity and tight for-sale inventory that is restraining home sales. Consequently, se cond half growth is expected to slow slightly to 1.9 percent. Moderate growth is expected to continue in 2018, with potential changes to fiscal and monetary policy posing both upside and downside risks to the forecast.
“While second quarter growth is poised to rebound, we expect growth to moderate through the remainder of 2017. Consumer spending, traditionally the largest contributor to economic growth, is sluggish and is lagging positive consumer sentiment and solid hiring,” said Fannie Mae Chief Economist Doug Duncan. “While labor market slack continues to diminish, wage growth is not accelerating and inflation has moved further below the Fed’s target. These conditions support our call that the Fed will continue gradual monetary policy normalization, announce its balance sheet tapering policy in September, and wait until December for additional data, especially on inflation, before raising the fed funds rate for the third time this year.”
“Construction activity has lost some steam following the first quarter’s weather-driven boost,” Duncan continued. “Meanwhile, very lean inventory continues to act as a boon for home prices and a bane for affordability, particularly among potential first-time homeowners. According to our second quarterMortgage Lender Sentiment Survey, lenders expect to ease credit standards further. However, we continue to project that the pace of growth in total home sales will slow to 3.3 percent this year, as we believe rapid home price gains amid scarce supply will remain a hurdle for potential homebuyers despite improvements in credit access.”
Visit theEconomic & Strategic Researchsite atwww.fanniemae.comto read the full July 2017 Economic Outlook, including the Economic Developments Commentary, Economic Forecast, Housing Forecast, and Multifamily Market Commentary. To receive e-mail updates with other housing market research from Fannie Mae’s Economic & Strategic Research Group, pleaseclick here.
Existing Home Sales in June Dive 1.8 Percent: Same Old Problem? Second and Third Quarter Impact?
The wind down to the end of the second quarter is not going very well. Existing home sales in June fell 1.8% to a seasonally adjusted annualized rate of 5.52 million. The Econoday consensus estimate was 5.58 million.
The slip in pending home sales was no false signal as existing home sales fell 1.8 percent in June to a lower-than-expected annualized rate of 5.520 million. Year-on-year, sales are still in the plus column but not by much, at 0.7 percent which is the lowest reading since February.
Compared to sales, prices are rich with the median of $263,800 up 6.5 percent from a year ago. Another negative for sales is supply which fell 0.5 percent in the month to 1.96 million for an on-year decline of 7.1 percent. Relative to sales, supply is at 4.3 months vs 4.2 months in May.
High prices appear to be keeping first-time buyers out of the market with the group representing 32 percent of sales vs 33 percent in May and 35 percent for all of last year.
Rising prices and thin supply, not to mention low wages, are offsetting favorable mortgage rates and holding down sales. Housing data have been up and down and unable to find convincing traction so far this year. Watch for new home sales on Wednesday where general strength is the expectation.
Existing Homes Sales Month-Over-Month and Year-Over-Year
Existing home sales slipped in June, with the blame again placed on low levels of inventory. The decline in sales, announced on Monday by the National Association of Realtors® (NAR), was anticipated, as pending home sales have decreased in each of the previous three months, ticking down 0.8 percent in May.
NAR said sales of existing single-family houses, townhouses, condos and cooperative apartments were down 1.8 percent in June, to a seasonally adjusted annual rate of 5.52 million units, the second slowest performance of the year.
Lawrence Yun, NAR chief economist, says the pullback in existing home sales in June reflected the lull in contract activity in March, April, and May. “Closings were down in most of the country last month because interested buyers are being tripped up by supply that remains stuck at a meager level and price growth that’s straining their budget,” he said. “The demand for buying a home is as strong as it has been since before the Great Recession. Listings in the affordable price range continue to be scooped up rapidly, but the severe housing shortages inflicting many markets are keeping a large segment of would-be buyers on the sidelines.”
The median existing-home price for all housing types in June was $263,800, up 6.5 percent from June 2016 ($247,600). This is a new peak price, surpassing the record set in May. June marked the 64th straight month of year-over-year gains.
The median existing single-family home price was $266,200 in June and the median existing condo price was $245,900. Those prices reflected annual increases of 6.6 percent and 6.5 percent respectively.
The tight supply of homes continues to be reflected in short marketing period. Properties typically stayed on the market for 28 days in June, one day more than in May, but six days fewer than in June 2016. Short sales were on the market the longest at a median of 102 days in June, while foreclosures sold in 57 days and non-distressed homes took 27 days. Fifty-four percent of homes sold in June were on the market for less than a month.
“Prospective buyers who postponed their home search this spring because of limited inventory may have better luck as the summer winds down,” said NAR President William E. Brown. “The pool of buyers this time of year typically begins to shrink as households with children have likely closed on a home before school starts. Inventory remains extremely tight, but patience may pay off in coming months for those looking to buy.”
First-time buyers accounted for 32 percent of existing home sales in June, down from 33 percent the previous month and a year earlier, while individual investors purchased 13 percent, unchanged from a year ago.
Convoluted Logic
Supposedly buyers may have better luck because the pool of buyers is shrinking as summer winds down. Really? By that logic, if there was only one person looking there would be a 100% success rate.
Yun says “The demand for buying a home is as strong as it has been since before the Great Recession.”
Really? By what measure?
Attitudes and Price
This is not a case of inventory or strong unmet demand. Here are the real factors.
The Fed re-blew the housing bubble and wages did not keep up. People cannot afford the going prices. Thus, the number of first-time buyers keeps shrinking.
Millenials do not have the same attitudes towards debt, housing, and family formations as their parents.
Millenials are unwilling to spend money they do not have, for a place that will keep them tied down. They would rather be mobile.
Second and Third Quarter Impact
The decline in existing home purchases portends weakness in consumer spending.
There will be fewer people painting, buying furniture, updating appliances, remodeling kitchens, adding landscaping etc. The pass through effect will be greatest in the third quarter unless there is a rebound.
College graduates and other young Americans are increasingly clustering in urban centers like New York City, Chicago and Boston. And now, American companies are starting to follow them. Companies looking to appeal to, and be near, young professionals versed in the world of e-commerce, software analytics, digital engineering, marketing and finance are flocking to cities. But in many cases, they’re leaving their former suburban homes to face significant financial difficulties, according tothe Washington Post.
Earlier this summer, health-insurer Aetna said it would move its executives, plus most of technology-focused employees to New York City from Hartford, Conn., the city where the company was founded, and where it prospered for more than 150 years.GE said last year it would leave its Fairfield, Conn., campus for a new global headquarters in Boston. Marriott International is moving from an emptying Maryland office park into the center of Bethesda.
Meanwhile, Caterpillar is moving many of its executives and non-manufacturing employees to Deerfield, Ill. from Peoria, Ill., the manufacturing hub that CAT has long called home. And McDonald’s is leaving its longtime home in Oak Brook, Ill. for a new corporate campus in Chicago.
“Visitors to the McDonald’s wooded corporate campus enter on a driveway named for the late chief executive Ray Kroc, then turn onto Ronald Lane before reaching Hamburger University, where more than 80,000 people have been trained as fast-food managers.
Surrounded by quiet neighborhoods and easy highway connections, this 86-acre suburban compound adorned with walking paths and duck ponds was for four decades considered the ideal place to attract top executives as the company rose to global dominance.
Now its leafy environs are considered a liability. Locked in a battle with companies of all stripes to woo top tech workers and young professionals, McDonald’s executives announced last year that they were putting the property up for sale and moving to the West Loop of Chicago where “L” trains arrive every few minutes and construction cranes dot the skyline.”
The migration to urban centers, according toWaPo,threatens the prosperity outlying suburbs have long enjoyed, bringing a dose of pain felt by rural communities and exacerbating stark gaps in earnings and wealth that Donald Trump capitalized on in winning the presidency.
Many of these itinerant companies aren’t really moving – or at least not entirely. Some, like Caterpillar, are only moving executives, along with workers involved in technology and marketing work, while other employees remain behind.
“Machinery giant Caterpillar said this year that it was moving its headquarters from Peoria to Deerfield, which is closer to Chicago. It said it would keep about 12,000 manufacturing, engineering and research jobs in its original home town. But top-paying office jobs — the type that Caterpillar’s higher-ups enjoy — are being lost, and the company is canceling plans for a 3,200-person headquarters aimed at revitalizing Peoria’s downtown.”
Big corporate moves can be seriously disruptive for a cohort of smaller enterprises that feed on their proximity to big companies, from restaurants and janitorial operations to other subcontractors who located nearby. Plus, the cancellation of the new headquarters was a serious blow. Not to mention the rollback in public investment.
“It was really hard. I mean, you know that $800 million headquarters translated into hundreds and hundreds of good construction jobs over a number of years,” Peoria Mayor Jim Ardis (R) said.
For the village of Oak Brook, being the home of McDonald’s has always been a point of pride. Over the year’s the town’s brand has become closely intertwined with the company’s. But as McDonald’s came under pressure to update its offerings for the Internet age, it opened an office in San Francisco and a year later moved additional digital operations to downtown Chicago, strategically near tech incubators as well as digital outposts of companies that included Yelp and eBay. That precipitated the much larger move it is now planning to make.
“The village of Oak Brook and McDonald’s sort of grew up together. So, when the news came, it was a jolt from the blue — we were really not expecting it,” said Gopal G. Lalmalani, a cardiologist who also serves as the village president.
Lalmalani is no stranger to the desire of young professionals to live in cities: His adult daughters, a lawyer and an actress, live in Chicago. When McDonald’s arrived in Oak Brook, in 1971, many Americans were migrating in the opposite direction, away from the city. In the years since, the tiny village’s identity became closely linked with the fast-food chain as McDonald’s forged a brand that spread across postwar suburbia one Happy Meal at a time.
“It was fun to be traveling and tell someone you’re from Oak Brook and have them say, ‘Well, I never heard of that,’ and then tell them, ‘Yes, you have. Look at the back of the ketchup package from McDonald’s,’ ” said former village president Karen Bushy. Her son held his wedding reception at the hotel on campus, sometimes called McLodge.
The village showed its gratitude — there is no property tax — and McDonald’s reciprocated with donations such as $100,000 annually for the Fourth of July fireworks display and with an outsize status for a town of fewer than 8,000 people.”
Robert Gibbs, the former White House press secretary who is now a McDonald’s executive vice president, said the company had decided that it needed to be closer not just to workers who build e-commerce tools but also to the customers who use them.
“The decision is really grounded in getting closer to our customers,” Gibbs said.
Some in Oak Brook have begun to invent conspiracy theories about why McDonald’s is moving, including one theory that the company is trying to shake off its lifetime employees in Oak Brook in favor of hiring cheaper and younger urban workers.
“The site of the new headquarters, being built in place of the studio where Oprah Winfrey’s show was filmed, is in Fulton Market, a bustling neighborhood filled with new apartments and some of the city’s most highly rated new restaurants.
Bushy and others in Oak Brook wondered aloud if part of the reasoning for the relocation was to effectively get rid of the employees who have built lives around commuting to Oak Brook and may not follow the company downtown. Gibbs said that was not the intention.
‘Our assumption is not that some amount [of our staff] will not come. Some may not. In some ways that’s probably some personal decision. I think we’ve got a workforce that’s actually quite excited with the move,’ he said.”
Despite Chicago’s rapidly rising murder rate and one would think its reputation as an indebted, crime-ridden metropolis would repel companies looking for a new location for their headquarters. But crime and violence rarely penetrate Chicago’s tony neighborhoods like the Loop, where most corporate office space is located.
“Chicago’s arrival as a magnet for corporations belies statistics that would normally give corporate movers pause. High homicide rates and concerns about the police department have eroded Emanuel’s popularity locally, but those issues seem confined to other parts of the city as young professionals crowd into the Loop, Chicago’s lively central business district.
Chicago has been ranked the No. 1 city in the United States for corporate investment for the past four years by Site Selection Magazine, a real estate trade publication.
Emanuel said crime is not something executives scouting new offices routinely express concerns about. Rather, he touts data points such as 140,000 — the number of new graduates local colleges produce every year.
“Corporations tell me the number one concern that t: Zerohey have — workforce,” he said.”
Chicago Mayor Rahm Emanuel said the old model, where executives chose locations near where they wanted to live has been upturned by the growing influence of technology in nearly every industry. Years ago, IT operations were an afterthought. Now, people with such expertise are driving top-level corporate decisions, and many of them prefer to live in cities.
“It used to be the IT division was in a back office somewhere,” Emanuel said. “The IT division and software, computer and data mining, et cetera, is now next to the CEO. Otherwise, that company is gone.”
Even the Fed put commercial real estate on its financial-stability worry list.
No, the crane counters were not wrong. In 2017, the ongoing apartment building-boom in the US will set a new record: 346,000 new rental apartments in buildings with 50+ units are expected to hit the market.
How superlative is this? Deliveries in 2017 will be 21% above the prior record set in 2016, based on data going back to 1997, by Yardi Matrix,via Rent Café. And even 2015 had set a record. Between 1997 and 2006, so pre-Financial-Crisis, annual completions averaged 212,740 units; 2017 will be 63% higher!
These numbers do not include condos, though many condos are purchased by investors and show up on the rental market. And they do not include apartments in buildings with fewer than 50 units. This chart shows just how phenomenal the building boom of large apartment developments has been over the past few years:
The largest metros are experiencing the largest additions to the rental stock. The chart below shows the number of rental apartments to be delivered in those metros in 2017. But caution in over-interpreting the chart – the population sizes of the metros differ enormously.
The New York City metro includes Northern New Jersey, Central New Jersey, and White Plains and is by far the largest metro in the US. So the nearly 27,000 apartments it is adding this year cannot be compared to the 5,400 apartments for San Francisco (near the bottom of the list). The city of San Francisco is small (about 1/10th the size of New York City itself), and is relatively small even when part of the Bay Area is included.
Other metros on this list are vast, such as the Dallas-Fort Worth metro which includes the surrounding cities such as Plano. Driving through the area on I-35 East gives you a feel for just how vast the metro is. However, I walk across San Francisco in less than two hours:
Special note: Chicago is adding 7,800 apartments even though the population has begun to shrink. So this isn’t necessarily going to work out.
This building boom of large apartment buildings is starting to have an impact on rents. In nearly all of the 12 most expensive rental markets, median asking rents have fallen from their peaks, and in several markets by the double digits,including Chicago (-19%!), Honolulu, San Francisco, and New York City.
And it has an impact on the prices of these buildings. Apartments are a big part of commercial real estate. They’re highly leveraged. Government Sponsored Enterprises such as Fanny Mae guarantee commercial mortgages on apartment buildings and package them in Commercial Mortgage-Backed Securities. So taxpayers are on the hook. Banks are on the hook too.
This is big business. And it is now doing something it hasn’t done since the Great Recession. The Commercial Property Price Index (CPPI) byGreen Street, which tracks the “prices at which commercial real estate transactions are currently being negotiated and contracted,” plateaued briefly in December through February and then started to decline. By June, it was below where it had been in June 2016 – the first year-over-year decline since the Great Recession:
Some segments in the CPPI were up, notably industrial, which rose 9% year over year, benefiting from the shift to ecommerce, which entails a massive need for warehouses by Amazon [Is Amazon Eating UPS’s Lunch?] and other companies delivering goods to consumers.
But prices of mall properties fell 5%, prices of strip retail fell 4%, and prices of apartment buildings fell 3% year-over-year.
So for renters, there is some relief on the horizon, or already at hand – depending on the market. There’s nothing like an apartment glut to bring down rents. See what the oil glut in the US has done to the price of oil.
Investors in apartment buildings, lenders, and taxpayers (via Fannie Mae et al. that guarantee commercial mortgage-backed securities), however, face a treacherous road. Commercial real estate goes in cycles as the above chart shows. Those cycles are not benign. Plateaus don’t last long. And declines can be just as sharp, or sharper, than the surges, and the surges were breath-taking.
Even the Fed has put commercial real estate on its financial-stability worry list and has been tightening monetary policy in part to tamp down on the multi-year price surge. The Fed is worried about the banks, particularly the smaller banks that are heavily exposed to CRE loans and dropping collateral values.
But the new supply of apartment units hitting the market in 2018 and 2019 will even be larger. In Seattle, for example, there are 67,507 new apartment units in the pipeline.
Therental apocalypsecontinues in Los Angeles. It is interesting to see how far some house humpers will go trying to justify prices. Some are arguing future weed sales are going to create another boom which is somewhat ironic since the benefits are actually to mellow you out, not turn you into a Taco Tuesday baby boomer that becomes a cubicle stressed slave just to purchase a home. And many times people plan on having a family shortly after which means higher childcare costs which they tend to forget. However, Los Angeles once again continues to be theworst place to rent in terms of affordability(and own for that matter). Zillow put out some interesting research and of course as you would expect, those spending nearly half of their income on rent are simply not saving for retirement.
L.A. is the Whole Foods of rental markets
I liken the L.A. housing market to Whole Foods. Great and healthy items that usually break the bank. L.A. has a large number of young and healthy hipsters and Millennials but most can’t buy a home. Heck, most Uber and Lyft drivers have nicer cars than most of us. So we live in this market where the perception is that everyone is well off and healthy when in reality many homeowners are stuck in a ridiculous commute for acrap shack and that is bad for your health.
Of course this isn’t some made up figure. Just take a look at how much income is dumped on rent in various markets:
Los Angeles by far is the worst market for renters surpassing even New York and San Francisco. I’ve made this argument multiple times and that has to do with incomes being far lower in this area compared toSan Franciscoand New York. Of course to house humpers they only see coastal Santa Monica and somehow use this as the reference for every other hood in the area where most of the plebs live. They forget that L.A. County has 10,000,000 people with most not living on the coast.
So it is also telling that L.A. is largely a renting household dominated county. You havemillions of Millennialsacross the state living at home with their parents because rents are too expensive. There is also this romantic idea that many people are stashing millions of dollars away by doing this but the stats show a different story. Some are, but most are not.
What you have is Taco Tuesday baby boomers now stuck in granite countertop HGTV upgraded sarcophagi that they can’t leave for a variety of reasons including locked in Prop 13 tax assessments and adult children back in their nursery rooms. You also have the issue of low inventory that is plaguing the country:
The low inventory dilemma is not only a SoCal phenomenon but has also impacted most urban metro markets. This is why housing as an entire asset class has soared with the stock market since 2009. Unlike the stock market however, scarcity has been a large factor driving prices up in real estate.
The issue of rents is problematic however. As the percentage of households that rent grows, you are going to get those in the middle being squeezed. What do renter households care if taxes get increased on property if they don’t own? Back in 1978 when Prop 13 passed you had a much larger percentage of California homeowners. Today that is clearly not the case. “Well we’ll just increase the rent and pass it on!” Do you think people think like this? Of course not! Just take a look at New York City where only 31 percent of households own. And look at how they tax people there. That is the future. Where only the uber elite will be comfortable in their homes. Grandfathered in Taco Tuesday baby boomer homeowners will live in million dollarcrap shacksand shop at the 99 Cents Store.
The idea that broke Millennials were going to buy in mass in Los Angeles never made sense. Many would rather eat out, work out, and live a more Spartan life (many by necessity). Ironically more are healthier than those pot belly cubicle dwellers that are stuck in obscene traffic everyday having to make that massive 30-year mortgage commitment. But hey, we do live in the Whole Foods of housing markets.
The housing market is suffering from a supply shortage, not a demand dilemma. As Millennial first-time homebuyer demand continues to increase, the inventory of homes for sale tightens. At the same time, prices are increasing, so why aren’t there more homeowners selling their homes?
In most markets, the seller, or supplier, makes their decision about adding supply to the market independent of the buyer, or source of demand, and their decision to buy. In the housing market, the seller and the buyer are, in many cases, actually the same economic actor. In order to buy a new home, you have to sell the home you already own.
So, in a market with rising prices and strong demand, what’s preventing existing homeowners from putting their homes on the market?
“Existing homeowners are increasingly financially imprisoned in their own home by their historically low mortgage rate. It makes choosing a kitchen renovation seem more appealing than moving.”
The housing market has experienced a long-run decline in mortgage rates from a high of 18 percent for the 30-year, fixed-rate mortgage in 1981 to a low of almost 3 percent in 2012. Today, five years later, mortgage rates remain just a stone’s throw away from that historic low point. This long-run decline in rates encouraged existing homeowners to both move more often and to refinance more often, in many cases refinancing multiple times between each move.
It’s widely expected that mortgage rates will rise further. This is more important than we may even realize because the housing market has not experienced a rising rate environment in almost three decades! No longer is there a financial incentive to refinance for most homeowners, and there’s more to consider when moving. Why move when it will cost more each month to borrow the same amount from the bank? A homeowner can re-extend the mortgage term another 30 years to increase the amount one can borrow at the higher rate, but the mortgage has to be paid off at some point. Hopefully before or soon after retirement. Existing homeowners are increasingly financially imprisoned in their own home by their historically low mortgage rate. It makes choosing a kitchen renovation seem more appealing than moving.”
There is one more possibility caused by the fact that the existing-home owner is both seller and buyer. In today’s market, sellers face a prisoner’s dilemma, a situation in which individuals don’t cooperate with each other, even though it is seemingly in their best interest to do so.
Consider two existing homeowners. They both want to buy a new house and move, but are unable to communicate with each other. If they both choose to sell, they both benefit because they increase the inventory of homes available, and collectively alleviate the supply shortage. However, if one chooses to sell and the other doesn’t, the seller must buy a new home in a market with a shortage of supply, bidding wars and escalating prices. Because of this risk, neither homeowner sells (non-cooperation) and neither get what they wanted in the first place – a move to a new, more desirable home. Imagine this scenario playing out across an entire market. If everyone sells there will be plenty of supply. But, the risk of selling when others don’t convinces everyone not to sell and produces the non-cooperative outcome.
Possible Outcomes
Owner moves, but pays a price escalated by supply shortages for a more desirable home
Owner stays in current house and does not get a more desirable home
Owner moves, finding a more desirable home without paying a price escalated by supply shortages
Rising mortgage rates and the fear of not being able to find something affordable to buy is imprisoning homeowners and causing the inventory shortages that are seen in practically every market across the country. So, what gives in a market short of supply relative to demand? Prices.According to the First American Real House Price Index, the fast pace of house price growth, combined with rising rates, has had a material impact on affordability. In our most recent analysis in April, affordability was down 11 percent compared to a year ago. It was once said that a man’s home is his castle. In today’s market, a man’s home may be his prison, but he is getting wealthier for it.
The formation of a BRICS gold marketplace, which could bypass the U.S. Petrodollar in bilateral trade, continues to take shape as Russia’s largest bank, state-owned Sberbank, announced this week that its Swiss subsidiary had begun trading in gold on the Shanghai Gold Exchange.
Russian officials have repeatedly signaled that they plan to conduct transactions with China using gold as a means of marginalizing the power of the US dollar in bilateral trade between the geopolitically powerful nations. This latest movement is quite simply the manifestation of a larger geopolitical game afoot between great powers.
Sberbank was granted international membership of the Shanghai exchange in September last year and in July completed a pilot transaction with 200 kg of gold kilobars sold to local financial institutions, the bank said.
Sberbank plans to expand its presence on the Chinese precious metals market and anticipates total delivery of 5-6 tonnes of gold to China in the remaining months of 2017.
Gold bars will be delivered directly to the official importers in China as well as through the exchange, Sberbank said.
Russia’s second-largest bank VTB is also a member of the Shanghai Gold Exchange.
To be clear, there is a revolutionary transformation of the entire global monetary system currently underway, being driven by an almost perfect storm. The implications of this transformation are extremely profound for U.S. policy in the Middle East, which for nearly the past half century has been underpinned by its strategic relationship with Saudi Arabia.
THE RISE & FALL OF THE PETRODOLLAR
The dollar was established as the global reserve currency in 1944 with the Bretton Woods agreement, commonly referred to as the gold standard. The U.S. leveraged itself into this power position by holding the largest reserve of gold in the world. The dollar was pegged at $35 an ounce — and freely exchangeable into gold.
By the 1960s, a surplus of U.S. dollars caused by foreign aid, military spending, and foreign investment threatened this system, as the U.S. did not have enough gold to cover the volume of dollars in worldwide circulation at the rate of $35 per ounce; as a result, the dollar was overvalued.
America temporarily embraced a new paradigm in 1971, as the dollar became a pure fiat currency (decoupled from any physical store of value), until the petrodollar agreement was concluded by President Nixon in 1973.
The quid pro quo was that Saudi Arabia would denominate all oil trades in U.S. dollars, and in return, the U.S. would agree to sell Saudi Arabia military hardware and guarantee the defense of the Kingdom.
Areport by the Centre for Research on Globalizationclarifies the implications of these most recent moves by the Russians and the Chinese in an ongoing drive to replace the US petrodollar as the global reserve currency:
Fast forward to March 2017; the Russian Central Bank opened its first overseas office in Beijing as an early step in phasing in a gold-backed standard of trade. This would be done by finalizing the issuance of the first federal loan bonds denominated in Chinese yuan and to allow gold imports from Russia.
The Chinese government wishes to internationalize the yuan, and conduct trade in yuan as it has been doing, and is beginning to increase trade with Russia. They’ve been taking these steps with bilateral trading, native trading systems and so on. However, when Russia and China agreed on their bilateral US$400 billion pipeline deal, China wished to, and did, pay for the pipeline with yuan treasury bonds, and then later for Russian oil in yuan.
This evasion of, and unprecedented breakaway from, the reign of the US dollar monetary system is taking many forms, but one of the most threatening is the Russians trading Chinese yuan for gold. The Russians are already taking Chinese yuan, made from the sales of their oil to China, back to the Shanghai Gold Exchange to then buy gold with yuan-denominated gold futures contracts – basically a barter system or trade.
The Chinese are hoping that by starting to assimilate the yuan futures contract for oil, facilitating the payment of oil in yuan, the hedging of which will be done in Shanghai, it will allow the yuan to be perceived as a primary currency for trading oil. The world’s top importer (China) and exporter (Russia) are taking steps to convert payments into gold. This is known. So, who would be the greatest asset to lure into trading oil for yuan? The Saudis, of course.
All the Chinese need is for the Saudis to sell China oil in exchange for yuan. If the House of Saud decides to pursue that exchange, the Gulf petro-monarchies will follow suit, and then Nigeria, and so on. This will fundamentally threaten the petrodollar.
According to areport by the Russian government media, significant progress has been made in promoting bilateral trade in yuan, between the two nations, as the first step towards an even more ambitious plan—using gold to make transactions:
One measure under consideration is the joint organization of trade in gold. In recent years, China and Russia have been the world’s most active buyers of the precious metal.
On a visit to China last year, deputy head of the Russian Central Bank Sergey Shvetsov said that the two countries want to facilitate more transactions in gold between the two countries.
In April, Sberbank expressed interest in financing the direct import of gold to India—also a BRICS member. Make no mistake that a BRICS gold marketplace could be used to bypass the dollar in bilateral trade, and undermine the hegemonic control enjoyed by the US petrodollar as the global reserve currency.
“In 2014 Russia and China signed two mammoth 30-year contracts for Russian gas to China. The contracts specified that the exchange would be done in Renminbi [yuan] and Russian rubles, not in dollars. That was the beginning of an accelerating process of de-dollarization that is underway today.” according to strategic risk consultant F. William Engdahl.
“A Russian-Chinese alternative to the dollar in the form of a gold-backed ruble and gold-backed Renminbi or yuan, could start a snowball exit from the US dollar, and with it, a severe decline in America’s ability to use the reserve dollar role to finance her wars with other peoples’ money,”
Each new policy destroys another level of prudent fiscal/financial discipline.
The primary driver of our economy–financialization–is in a death spiral. Financialization substitutes expansion of interest, leverage and speculation for real-world expansion of goods, services and wages.
Financial “wealth” created by leveraging more debt on a base of real-world collateral that doesn’t actually produce more goods and services flows to the top of the wealth-power pyramid, driving the soaring wealth-income inequality we see everywhere in the global economy.
As this phantom wealth pours into assets such as stocks, bonds and real estate, it has pushed the value of these assets into the stratosphere, out of reach of the bottom 95% whose incomes have stagnated for the past 16 years.
The core problem with financialization is that it requires ever more extreme policies to keep it going. These policies are mutually reinforcing, meaning that the total impact becomes geometric rather than linear. Put another way, the fragility and instability generated by each new policy extreme reinforces the negative consequences of previous policies.
These extremes don’t just pile up like bricks–they fuel a parabolic rise in systemic leverage, debt, speculation, fragility, distortion and instability.
This accretive, mutually reinforcing, geometric rise in systemic fragility that is the unavoidable output of financialization is poorly understood, not just by laypeople but by the financial punditry and professional economists.
Gordon Long and I cover the policy extremes which have locked our financial system into a death spiral in a new 50-minute presentation, The Road to Financialization. Each “fix” that boosts leverage and debt fuels a speculative boom that then fizzles when the distortions introduced by financialization destabilize the real economy’s credit-business cycle.
Each new policy destroys another level of prudent fiscal/financial discipline.
The discipline of sound money? Gone.
The discipline of limited leverage? Gone.
The discipline of prudent lending? Gone.
The discipline of mark-to-market discovery of the price of collateral? Gone.
The discipline of separating investment and commercial banking, i.e. Glass-Steagall? Gone.
The discipline of open-market interest rates? Gone.
The discipline of losses being absorbed by those who generated the loans? Gone.
And so on: every structural source of discipline has been eradicated, weakened or hollowed out. Financialization has consumed the nation’s seed corn, and the harvest of instability is ripening in the fields of finance and the real economy alike.
(ZeroHedge) Sir Richard Branson once said that the quickest way to become a millionaire was to take a billion dollars and buy an airline. But, as EnerVest Ltd, a Houston-based private equity firm that focuses on energy investments, recently found out, there’s more than one way to go broke investing in extremely volatile sectors.
As theWall Street Journalpoints out today, EnerVest is a $2 billion private-equity fund that borrowed heavily at the height of the oil boom to scoop up oil and gas wells. Unfortunately, shortly after those purchases were made, energy prices plunged leaving the fund’s equity, supplied primarily by pensions, endowments and charitable foundations, worth essentially nothing.
The outcome will leave investors in the 2013 fund with, at most, pennies for every dollar they invested, the people said. At least one investor, the Orange County Employees Retirement System, already has marked its investment down to zero, according to a pension document.
Though private-equity investments regularly flop, industry consultants and fund investors say this situation could mark the first time that a fund larger than $1 billion has lost essentially all of its value.
EnerVest’s collapse shows how debt taken on during the drilling boom continues to haunt energy investors three years after a glut of fuel sent prices spiraling down.
But, at least John Walker, EnerVest’s co-founder and chief executive, expressed some remorse for investors by confirming to the WSJ that they “are not proud of the result.”
All of which leaves EnerVest with the rather unflattering honor of being perhaps the only private equity fund in history to ever raise over $1 billion in capital from investors and subsequently lose pretty much 100% of it.
Only seven private-equity funds larger than $1 billion have ever lost money for investors, according to investment firm Cambridge Associates LLC. Among those of any size to end in the red, losses greater than 25% or so are almost unheard of, though there are several energy-focused funds in danger of doing so, according to public pension records.
EnerVest has attempted to restructure the fund, as well as another raised in 2010 that has struggled with losses, to meet repayment demands from lenders who were themselves writing down the value of assets used as collateral, according to public pension documents and people familiar with the efforts.
So, who’s getting wiped out? Oh, the usual list of pension funds, charities and university endowments.
A number of prominent institutional investors are at risk of having their investments wiped out, including Caisse de dépôt et placement du Québec, Canada’s second-largest pension, which invested more than $100 million. Florida’s largest pension fund manager and the Western Conference of Teamsters Pension Plan, a manager of retirement savings for union members in nearly 30 states, each invested $100 million, according to public records.
The fund was popular among charitable organizations as well. The J. Paul Getty Trust, John D. and Catherine T. MacArthur and Fletcher Jones foundations each invested millions in the fund, according to their tax filings.
Michigan State University and a foundation that supports Arizona State University also have disclosed investments in the fund.
Luckily, we’re somewhat confident that at least the losses accrued by U.S.-based pension funds will be ultimately be backstopped by taxpayers…so no harm no foul.
The three-month average home price in the Toronto area is down a record 14.2% following a flood of new listings and an interest rate hike by the Bank of Canada.
Sales fell most in eight years. Did Canada’s housing bubble just burst?
Total home sales in Greater Toronto dropped to 5,977 in June, the lowest level since 2010 and down 15.1 percent from the month prior, data from the Canadian Real Estate Association show. Average prices are down 14.2 percent since March — the fastest 3-month decline in the history of the data back to 1988 — while the ratio of sales to new listings sits at its lowest level since 2009.
The June data comes after a series of measures by policy makers to tighten access to the market — and before the Bank of Canada hiked its benchmark interest rate last week, the first increase since 2010 that will further pinch mortgage eligibility. Prices and sales also fell in nearby regions such as Hamilton-Burlington and Kitchener-Waterloo, CREA data show.
Lawmakers, concerned that escalating prices could lead to a disorderly correction, imposed measures including tightened mortgage eligibility rules and a tax on foreign buyers. Toronto’s market has lost momentum, while in Vancouver sales plummeted last year on similar measures but have since rebounded.
The economists expect Toronto to follow Vancouver’s path — price adjustment at the top of the market with less impact at lower prices. Meanwhile, cities like Montreal and Ottawa look strong.
Vancouver rebounded after the restrictions and economists expect Toronto will do the same.
But at some point sanity will return. The bottom in both markets is a long way down.
(ZeroHedge) Shanghai’s status as an emerging tech hub is bringing with it problems related to overcrowding experienced by US cities like San Francisco and certain parts of New York City – namely out-of-control rents and home prices.
But now, the cities’ mid-tier office drones, some of whom may not have enough cash saved to “commit” to an apartment, have a new low-cost housing alternative. They’re called shared compartments, and they’re are popping up in office buildings around Shanghai. Users pay to sleep in the compartments for a set amount of time. They’re given disposable bedding to make sleeping more comfortable, and the compartments are disinfected automatically by ultraviolet light after each use.
Photos of these compartments have been circulating on Chinese media:
People can enjoy a rest in the compartment by scanning the QR codes for payment.
A man experiences a shared compartment in Shanghai…
The inside of a shared compartment…
The disposable bedding…
They have been rising precipitously now for at least a decade, with an average 1,000 square foot apartment in Shanghai going for $725,000, or around five million yuan. Shanghai’s average salary per month is 7,108 yuan ($1,135) or 85,300 yuan a year. That puts local property in Shanghai at about 50 times median salaries in the city, according to Forbes. By comparison, housing prices in New York City are 32 times salaries of average New Yorkers.
With those figures in mind, showering at the company gym doesn’t sound so bad.
Living in a box: The desperate workers forced to live in tiny ‘coffin’ apartments of Tokyo – which still cost up to £400 a month to rent
Japanese capital is one of the most crowded cities in the world
‘Geki-sema’ or share houses are mainly used by young professionals
No windows and enough room for one person and a few possessions
They are barely large enough for a single person to squeeze into at all, let alone swing a cat.
But incredibly these tiny ‘coffin’ apartments in central Tokyo still command rents of up to £400 a month.
The Japanese capital is one of the most crowded cities in the world, and to cash in on the chronic housing problem, landlords have developed what are known as ‘geki-sema’ or share houses.
Tight squeeze: A Tokyo local shows a Japanese news crew around her tiny ‘coffin apartment’
Pokey: People are paying up to £400-a-month to live in the tiny ‘coffin’ apartments
Party time: The news team somehow manage to all squeeze inside the miniscule apartment
They are little more than cupboards, tiny cubicles stacked on top of each other with just enough room for one person and a few of their possessions.
Definitely not for the claustrophobic, many don’t even have windows and the doors and anyone over 6ft tall would have trouble stretching their legs.
Most are used by young professionals who spend most of their time at work and outdoors, using these tiny accommodations just for sleeping.
The photo’s of the apartments in the Tokyo’s Shibuya district come from a recent Japanese news program showed
Tight squeeze: A man shows off his tiny Tokyo apartment with just enough room to stretch out and hang his clothes.
Cosy: The tiny cubicles are often stacked on top of each other and contain just enough room for one person to stretch out
Entertaining friends: The apartments tend to be used by young professionals who spend most of their time at work and outdoors
No space like home: Many of the ‘geki-sema’ share houses don’t even have windows
With about 150 projects starting this year or in the pipeline just in the core of the city, construction is as frenzied as ever.
(The Seattle Times) For the second year in a row, Seattle has been named the crane capital of America — and no other city is even close, as the local construction boom transforming the city shows no signs of slowing.
Seattle had 58 construction cranes towering over the skyline at the start of the month, about 60 percent more than any other U.S. city, according to a new semiannual count from Rider Levett Bucknall, a firm that tracks cranes around the world.
The designation has come to symbolize — for better or worse —the rapid growthand changing nature of the city, as mid-rises and skyscrapers pop up where parking lots and single-story buildings once stood.
And the title of most cranes might be here to stay, at least for a while. The city’sconstruction crazeis continuing at the same pace as last year, while cranes are coming down elsewhere: Crane counts in major cities nationwide have dropped 8 percent over the past six months.
During the last count, Seattle had just six more cranes than the next-highest city, Chicago. Now it holds a 22-crane lead over second-place Los Angeles, with Denver, Chicago and Portland just behind.
Seattle has more than twice as many cranes as San Francisco or Washington, D.C., and three times as many cranes as New York. Seattle has more cranes than New York, Honolulu, Austin, Boston and Phoenix combined.
At the same time, Seattle’s construction cycle doesn’t look like it’s letting up. Just in the greater downtown region, 50 major projects are scheduled to begin construction this year, according to the Downtown Seattle Association. An additional 99 developments are in the pipeline for future years. And that’s on top of what is already thebusiest-period everfor construction in the city’s core.
“We continue to see a lot of construction activity; projects that are finishing up are quickly replaced with new projects starting up,” said Emile Le Roux, who leads Rider Levett Bucknall’s Seattle office. “We are projecting that that’s going to continue for at least another year or two years.”
“It mainly has to do with the tech industry expanding big time here in Seattle,” Le Roux said.
Companies that supply the tower cranes say there’sa shortage of both equipment and manpower, so developers need to book the cranesand their operators several months in advance. It costs up to about $50,000 a month to rent one, and they can rise 600 feet into the air.
Most cranes continue to be clustered in downtown and South Lake Union, but several other neighborhoods have at least one, from Ballard to Interbay and Capitol Hill to Columbia City.
A Swiss bank is now offering to buy bitcoins for its clients. As of Wednesday, investors can ask their asset manager atFalcon Private Bank, a boutique investment firm headquartered in Zurich, to purchase and storebitcoinon their behalf – a first for conventional banks. Despite the cryptocurrency’s infamous volatility, this is another indication that is here to stay.
“We have various clients that are interested in buying bitcoin for investment purposes, and we’re making it very convenient for them,” says Arthur Vayloyan, the global head of products and services at Falcon. Because Falcon will be doing the buying and storing of the digital coins, its customers won’t require any specialist knowledge to switchtheir cash into bitcoin. The Swiss financial authority, FINMA, granted Falcon regulatory approval on Tuesday.
But some worry that people may be underestimating the importance of decentralisation to thedigital currency. Traditional banks that hold large sums of bitcoin for their customers will be obvious targets for hackers. “It’s a lot easier to steal digital currency than a traditional currency,” sayAndreas Antonopoulos, host of the Let’s Talk Bitcoin podcast.
Spaced out
“This is why decentralisation is so important,” Antonopoulos says. Indeed, Bitcoin is built on decentralization. Instead of central banks and governments, Bitcoin relies on a network of computers that anyone can join to check the legitimacy of transactions. Every Bitcoin is accounted for on a digital ledger called the blockchain that records how many coins each digital wallet holds.
Whenever currency changes hands, everyone on the network updates their copy of the blockchain too. Underpinning the whole system is some complex mathematics that makes it incredibly difficult to deceive or control without infeasible amounts of computing power.
The wallets are decentralized too. Instead of bank accounts, anyone can create and store their own bitcoin wallet. Because there isno centralised collection of wallets, there is no central target for hackers to try to steal large amounts of digital currency. Or atleast that’s the idea (in practice centralised pockets can emerge).
Put lots of wallets in the same place, and the system may no longer hold. If a thousand people each hold a single bitcoin, a certain level of security will be sufficient protection. However, if one place holds a thousand bitcoin, you increase the appeal to hackers a thousand-fold too, which means you have to similarly up the security. “But there is no way to do this. By putting in more eggs you make the basket weaker,” says Antonopoulos.
Hack attack
We have seen this problem before in exchanges, where people trade different digital and traditional currencies. The biggest of these until 2014 was Mount Gox, which at the time was handling more than half of all bitcoin transactions. In February of that year, 850,000 bitcoins corresponding to $450 million at the time went missing, with most thought to have been stolen by hackers.
Only a few years ago, many conventional banks still thought that bitcoin was doomed to fail, but as the price has soared and it has continued to survive, it hasbecome too attractive for investors to resist. In 2012, you could buy a bitcoin for less than $10, last month they were selling for a record high of $3000. Illustrating the currency’s volatility, it’s currently trading at just under $2500, but overall has tripled in value in the last year alone.
Users of Falcon’s bitcoin service will have to sign a waiver to show that they understand the risks, as they would with other high risk investments. In future, the bank plans to expand to other digital currencies.
Exploring Potential Implications For Company & Market
(SRSrocco Report) The world’s second largest primary silver mine, Tahoe Resources Escobal Mine, was forced to shut down operations in Guatemala by a ruling from the country’s Supreme Court. This was due to a provisional decision by the Guatemalan Supreme court in respect of a request by CALAS, an anti-mining group, for an order to temporarily suspend the license to operate the Escobal Mine until there is a full hearing. (picture courtesy of Tahoe Resources)
While this story has been out for a few days, I believe there is a great deal of misinformation on the Mainstream and Alternative media about the current situation and future outcome of Tahoe’s flagship Escobal Mine. Some analysis suggests that this is just a small speed-bump for Tahoe, so when they are able to address disputed regulatory issues, production and profits will shortly return once again.
However, there also seems to be a another side to the story that could cause more problems for Tahoe with a much longer suspension time than the company is publicly stating. For example, the following was published in the article… Tahoe Resources forced to halt Escobal mine in Guatemala:
While Tahoe is preparing for a three-month mine suspension, Haywood analysts project no production from the mine for the remainder of 2017.
Here we can see that the company (Tahoe) is very optimistic that production at Escobal will start back in three months, while Haywood analysts forecast operations won’t likely resume this year. So, who should we believe, or which forecast is more correct? Before we get into the details, let’s first look at the impact of suspending the 2nd largest primary silver mine in the world on the market.
A Shutdown Of The Escobal Mine, Ranked #2 In The World, Would Remove 21 Million Oz Of Supply
According to the 2017 World Silver Survey, Tahoe Resources Escobal Mine ranked #2, behind Fresnillo PLC’s Saucito Mine in primary silver production in 2016. Here are the top five producing primary silver mines in 2016 (Moz – million ounces):
Saucito (Mexico) = 21.9 Moz
Escobal (Guatemala) = 21.2 Moz
Dukat (Russia) = 19.8 Moz
Cannington (Australia) = 18.2 Moz
Uchucchacua (Peru) = 16.2 Moz
Furthermore, the data in the 2017 World Silver Survey reports that a total of 265 million oz (Moz) of primary silver was produced last year. Thus, the Escobal Mine represents 8% of total global primary silver mine supply. If Haywood Analysts are correct that production at Escobal may not resume in 2017, than the mine is likely to lose nearly half of the 20-21 Moz forecasted for 2017.
While this is not a great deal of silver compared to total world silver supply of 886 Moz (in 2016), if the Escobal Mine is shut for a longer period of time, or indefinitely, it could impact the silver market over the next few years.
So, again… the big question for investors is, HOW LONG will the ESCOBAL MINE be shut down? Well, let’s look at some information and data that seems to be overlooked by the Mainstream and Alternative media.
What Is The True Nature & Future Impact Of The Suspension Of Tahoe’s Escobal Mine?
First… after the Guatemalan Supreme Court suspended operations at Escobal, Tahoe’s stock price took a real beating falling 33% that day. In the past week, Tahoe’s stock price decline 40%:
A lot of investors were caught by surprise as Tahoe Resources has been making a lot of money from its mines, especially from its Escobal Silver Mine in Guatemala. For example, in 2016 Tahoe Resources reported profits of $118 million on revenue of $784 million. That is a stunning 15% margin of profit… and the majority of that profit was from the Escobal Mine.
Second …. the rich profits from the Escobal Mine came at a cost. And the cost was in the way of “serious human rights violations through its operations”, stated by several sources. Unfortunately, many investors that follow the Mainstream financial media do not understand that the Escobal Mine has been, and continues to be, a subject of human rights abuse and violations from day one.
Escobal will become a big player with forecasted silver production in 2014 of 18-20 million oz. Unfortunately for Tahoe Resources, the locals are not too happy with their Escobal mine. There have been murders and killings on both sides of the protest.
This is by no means a small matter by a few disenfranchised locals:
(Guatemala City/Ottawa) Contrary toTahoe Resources’ recent claims, tens of thousands of people oppose its Escobal project in southeastern Guatemala. Repression and violence have been the outcome of company and government efforts to install the project without social support. A recent high-court decision in Guatemala reinforces the legitimacy and importance of local decision-making processes.
More than half of the communities in the municipality of San Rafael las Flores, where the Escobal project is located, have declared opposition to the mine. In five neighbouring municipalities, in the departments of Santa Rosa and Jalapa, a majority have voted against the mine in municipal referenda, in which tens of thousands of people participated. The most recent vote took place on November 10th in the municipality of Jalapa, department of Jalapa. Over 23,000 people participated with 98.3% voting against mining and 1.7% in favour.
This is a perfect example of what Jim Sinclair states “As the wrong way to go about starting up a mining project in a foreign country.” Jim believes you must have the support of the locals, or the project will be doomed for failure.
And it didn’t help Tahoe Resources PR one bit when their contracted head of security, Alberto Rotondo gave direct orders to assassinate members of the community of San Rafael Las Flores.
“The preliminary investigations found that Rotondo gave the order to attack the community, he also ordered the crime scene to be cleaned up and change the police report.”
The information reveals Rotondo making several statements: “God dam dogs, they do not understand that the mine generates jobs”. “We must eliminate these animals’ pieces of shit”. “We can not allow people to establish resistance, another Puya no”. “Kill house sons of Bitches”
Rotondo was apprehended at the airport La Aurora, when he trying to flee the country. Wire tapping of conversations between him and his son reveal that he planned to leave Guatemala for a while, because “I ordered to kill some of these sons of Bitches.”
What seems to be missing from the current license suspension of the Escobal Mine is the extremely negative history it has had with the local community. As stated above, Tahoe’s former contracted head of Security, Alberto Rontondo gave the direct order to assassinate members of the San Rafael Las Flores community.
While the wire-tapped conversation between Alberto Rontondo and his son, where he says, “I ordered to kill some of these sons of Bitches”, was published in the media, it didn’t get much coverage in the Mainstream press. This was BAD NEWS for a large corporate mining company, so many news agencies seemed to just ignore it.
So…. the assumption by many WESTERN investors that Tahoe Resources is only dealing with pesky legal regulatory issues, is a seriously inaccurate assessment that could cost them dearly going forward. Now, I am not saying that Tahoe’s Escobal Mine will not be able to return to operating status, but there are more serious issues that are coming to light that could be quite detrimental for the company going forward.
For example…. according to the website,Tahoe On Trial, they published the following:
The legal cases against Tahoe Resources are being carried out in a larger context of opposition to the Escobal mine. The violence, repression, and criminalization community leaders continue to face is not limited to what transpired on April 27, 2013.
THE ESCOBAL PROJECT DEPENDS ON A MILITARIZED SECURITY STRATEGY TO SUPPRESS OPPOSITION AND HAS LED TO VIOLENCE AND CRIMINALIZATION.
in 2011, Tahoe Resources hired a US security and defense contractor – International Security and Defense Management, LLC – that boasts experience with corporations working in war zones like Iraq and Afghanistan to develop a security plan that has treated peaceful protest and community leaders as if they were armed insurgents.
In June 2012, Tahoe sued the Guatemalan government, stating that protests were hindering its operations and that the State was not doing enough to allow its activities to proceed.
Between 2011 and 2013, some 90 people were slapped with unfounded criminal charges and made to endure legal processes causing them distress and hardship. Several spent months in jail before being cleared of all charges.
This is just the tip of the ESCOBAL MINE PROTEST ICEBERG… I could fill pages. However, those who believe the protests have gone away and now the public is totally supportive of the Escobal Mine, are completely being deluded.
…Police have used teargas to clear a public road near the town of Casillas, in south-east Guatemala, of protesters blocking access to Canadian miner Tahoe Resources’ controversial Escobal mine…
This proves that the public protests continue even as the Escobal Mine in in its fourth year of full commercial production.
I would imagine some readers-investors are probably thinking… “Well, this is just a matter for the local and federal governments to deal with in getting the LOCAL PEOPLE to BEHAVE, so they will leave the Escobal Mine alone to continue producing lots of silver and profits.” Well, that is one opinion, but if you think that is a WISE ONE… think again. Several large Funds have dropped Tahoe Resources from their portfolios due to what they term as, “A HIGH RISK .”
Tahoe Resources is one of fourteen companies featured as a dangerous investment in the fifth edition of ‘Dirty Profits’ launched today in Hamburg, Germany and edited by the organization Facing Finance.
The publication identifies two billion-dollar European pension funds that have divested from the company, the Netherlands’ Pensioenfonds (PGB) and Norway’s Norges Bank Investment Management. The group calls for binding regulations on financial institutions and for the elimination of this and other harmful investments from their portfolios.
Problems cited include Tahoe Resources’ lack of respect for communities that have peacefully and democratically expressed their opposition to its Escobal mine in southeastern Guatemala, and a campaign of persecution through unfounded legal cases, violent incidents and militarization.
….The article about Tahoe Resources further describes how the company was granted a permit to put the mine into operation with disregard for over 200 individual complaints submitted against the license on the basis of environmental concerns. The officials responsible for this decision resigned in mid-2015 over serious allegations of corruption.
As we can see, the disinvestment of Tahoe Resources by two large European Funds should be a WARNING to investors that things may not be ROSEY for the company going forward.
Please understand, I am not only painting a negative picture for Tahoe, but rather providing additional information that seems to be missing from the Mainstream press. Thus, investors are making decisions without the COMPLETE information or story.
To be honest, as a silver analyst, I like the Escobal Mine’s performance. It is one of the most profitable primary silver mines in the world. However, I view this performance in a vacuum. By that, I mean based on the production and financial data alone. If we include the public and environmental issues, the Escobal Mine seems to be a very BAD DEAL for many of the local people that live adjacent to the mine.
I believe the suspension of Tahoe’s Escobal Mine by the Guatemalan Supreme Court may open a CAN OF WORMS that many individuals or companies invested in Tahoe do not realize or understand.
On the other hand, Tahoe might be able to work with the local people and Guatemalan government to resume operations. That being said, investors need to understand that the Escobal primary silver mine is a much HIGHER RISK than other silver mining companies. So, it would be wise to learn as much as one can before making a longer term investment in the company.
(MarketWatch) Bitcoin $55,000? Fundstrat’s Tom Lee, one of the biggest equity bears among the major Wall Street strategists, says it’s possible, but not necessarily for the reasons many bitcoin bulls have suggested.
“One of the drivers is crypto-currencies are cannibalizing demand for gold GCQ7, +0.12% ” Lee wrote in a report. “Based on our model, we estimate that bitcoin’s value per unit could be $20,000 to $55,000 by 2022 — hence, investors need to identify strategies to leverage this potential rise in crypto-currencies.”
That’s a major jump from the $2,530 level that bitcoin BTCUSD, -0.84% fetched recently. Of course, this would be on top of what’s already been an impressive stretch, with the price more than doubling since the start of the year.
Lee predicts investors will look to bitcoin as a gold substitute, and the fact that the amount of available bitcoin is reaching its limit makes this supply/demand story even more compelling for those looking to turn profits in the crypto market.
“Bitcoin supply will grow even slower than gold,” Lee said. “Hence, the scarcity of bitcoin is becoming increasingly attractive relative to gold.”
Another driver could come from central banks, which he expects will consider buying bitcoin if the total market cap hits $500 billion.
“This is a game changer, enhancing the legitimacy of the currency and likely accelerating the substitution for gold,” Lee wrote.
The trick is that there aren’t very many ways to play bitcoin, other than via direct investment or the bitcoin ETF GBTC, -1.75% he said, adding that “we will identify other opportunities in the future.”
How Bitcoin (and other cryptocurrencies) actually work
For the past few years, most retailers have struggled. Of course, it’s easy to blame Amazon.com, but it is only one of many causes. At the same time, for us hedgies living in major cities with luxury malls, there is confusion about the problem itself – my mall is crowded and people are shopping. After having debated with friends endlessly on what the real root of the problem is, I decided it was time to actually go investigate. Every city has its own story and the local mall is the nexus of that story.
In my mind, the only way to get real answers was a 4-day, 1,500 mile meandering road-trip through the lower mid-west, where we planned to hit as many malls and take as many meetings with facility managers and brokers as we could organize along the way. Besides, when an asset class like mall real estate is down 90% in a few years’ time, a different viewpoint can create huge upside.
The overriding question was: is retail suffering because of Amazon.com cannibalizing store-fronts or are rising health care costs, with stagnant wage growth, what’s really cannibalizing disposable spending power in middle-America? Is shopping still America’s pastime or do we prefer food and “experiences” instead? Every industry evolves. Why hasn’t the mall changed in the past three decades – it’s still the same cinema, crappy food court and undifferentiated retailers that I knew when I was a teen—where’s the fun in that? Other countries are perfecting “shoppertainment,” why hasn’t America? In summary, what is the real issue with retail?
When you scroll throughhttp://deadmalls.comthere is a certain eeriness about a million square feet of empty space.
However, the images don’t, in any way, prepare you for an almost-dead mall on its last gasps. As we wandered one facility with the head of leasing, we could look straight ahead at a thousand feet of almost vacant space, dimly lit from sky-lights as none of the lighting fixtures still worked—the air conditioner had long ago failed and it was 95 degrees inside this mall. However, there was one light that drew us forward. As we approached, we heard music and sure enough, it was the Victoria’s Secret that time forgot (corporate probably forgot it too). In a mall with only 7 tenants and even fewer shoppers, Victoria’s Secret was still jamming out. No customers, but 2 girls tending shop, blasting music and throwing light into a dark hallway.
As we rounded another corner, we heard the unmistakable sound of a Zumba Class at 100 decibels. As we drew nearer, we saw the first mall visitors in almost an hour – what looked like an instructor with a half dozen middle-aged women trying to do exercises that they were hopelessly unfit to accomplish.
I turned to the leasing agent;
Me: Any idea how much they pay in rent?
Him: Actually, I think they’re squatting in here. I don’t show any record of them being a tenant.
Me: Is anyone going to make them pay rent?
Him: Why bother, at least it brings people to the mall…
With no security or cleaning staff, who’s watering the plants?
All of this segwayed into the meeting with the leasing agent afterwards.
Me: Can I meet the facility manager when we’re done chatting?
Him: Funny story; actually, she quit a few months back. Unfortunately, the owner only told me last week that I am now in charge of managing this mall. I’m doing my best, but I live an hour away, so I can only come here a few times a week.
Me: So who’s been locking up at the end of the day lately?
Him: Hmmm…. Honestly, I’m not sure. That’s a pretty good question.
Me: Would anyone notice if they never locked the doors?
Him: Probably not…
Of course, you cannot quite put this into context until you realize that I was sitting there in a nearly pitch black food court, in 95 degree heat, with only a beam of light from the sky-light above to guide the conversation – yet despite the odds, one vendor still remained at the food court – ironically it was the sushi place.
I wonder what decade these gumballs are from?? I didn’t know they could turn brown.
While the tour was entertaining, what I really wanted to know was; why did this place, surrounded by a thriving community somehow fail? This is where the story actually deviates from the usual narrative.
This mall was in a community of about 100,000 people. A decade ago, this had been a thriving mall. Then, a new major highway was placed about 5 miles west of the mall, which diverted regional traffic away from the mall. Even worse, a massive open air retailing complex was built alongside the new highway, siphoning shoppers from the mall. In a town that was big enough to support one large shopping complex, the newer one with better access from the highway had ultimately won out. However, this mall was still muddling forward with a handful of national tenants who hadn’t quite thrown in the towel, despite no lighting, air conditioning or adult supervision at the mall. It lead to a real epiphany; malls die a slow strange death—not the cataclysmic collapse depicted by most analysts.
We saw a similar situation on the following day at another mall about 100 miles away. In this situation, a new retailing facility had been built closer to the local university to compete with the mall. This facility had stolen a number of the key tenants from the mall. At the time, it looked like this mall would also surrender to the newer facility in the better location. Instead, the mall was sold to new owners who; injected substantial capital to remodel the mall, offered discounted rent to retain existing tenants and had put up a fight to the death with the newer facility. Now, nearly a decade later, neither facility was full and both were desperately fighting it out for the minds of tenants and shoppers in a winner-take-all battle, a veritable retailing Battle of Verdun in the north of Texas—where even the winner will be a loser for having spent so much capital to win the booby prize of top retail destination in a town of about 125,000 people. Even worse, with no clear winner, new retailing concepts were hesitant to guess wrong in their expansion plans and simply chose to pass this town by when expanding—further sapping the strength of both facilities.
In fact, we continued to see similar stories as we ventured north. Retail may not be dead; instead there may simply be too much retail (both property and competing concepts) fighting it out for too few customers. This is further compounded by too much cheap capital developing more retail as a result of ultra-low interest rates. Naturally, there will be losers in this process – in fact; the losses have only just begun. There will also be huge winners.
Malls are bearing the brunt of changes in retail, but they’re only the canary in the coal mine.
Let’s start with a simple premise; commercial real estate (CRE) will change more in the next decade than it has in the past hundred years. Anyone who thinks they can fully foresee how it will evolve is lying to you. The only certainty is that highly leveraged real estate investors and lenders will be obliterated as current models evolve faster than anticipated.
In the past, retail was retail, warehouse was warehouse and office was office—the same for all other CRE classes. There was some cross-over, but the main commercial real estate components stayed segmented for the most part. Now, with big box stores, the lowest hanging fruit for online shopping to knock off, going to dodo-land, there will be hundreds of millions of feet of well-located space suddenly becoming available. People act as if there are enough Ulta Beauty and Dick’s Sporting Goods to go around. However, you cannot fill all of this space with the few big box retail concepts still expanding—especially as many stalwarts are themselves shrinking.
As a result, a huge game of musical chairs is about to take place. Why pay $20/ft for mid-rise office space, if you can now move into an abandoned Sports Authority for $5/ft. Sure, it doesn’t come with windows, but employees like open plan space and there’s plenty of parking. Besides, with the rental savings, you can offer your staff an in-house fitness facility and cafeteria for free. Does your mega-church need a larger space? There’s probably a former Sears or Kmart that perfectly accommodates you at $3/ft. Have an assisted living facility with an expiring lease? Why not move it to an abandoned JC Penney—the geriatrics will feel right at home, as they’re the only ones still shopping there.
Go onto any real estate website and you will find out that huge plan space is nearly free. No one knows what the hell to do with it and the waves of bankruptcy in big box are just starting. As online evolves, these waves will engulf other segments of retail as well.
Type Macy’s into Loopnet.com and look at how many millions of feet of old Macy’s are available for under $10/ft to purchase. Retail’s problems are about to become everyone’s problems in CRE. When the old Macy’s rents for $2/ft, what happens to everyone else’s rents? EXACTLY!!! What happens if a CRE owner is leveraged at 60% (currently considered conservative) and leasing at $15/ft when the old HHGregg across the street is offered for rent at $3/ft? An office owner can lower his rents a few dollars, but at the new price deck, he cannot cover his interest cost, much less his other operating expenses. What happens to a suddenly emptying mid-rise office building? It has higher operating expenses than the box store due to full-time security and cleaning—maybe it’s a zero—in that future market rents no longer cover the operating expenses of the asset, much less offer a return on investment. I know, crazy—that’s how musical chairs works when demand contracts and the supply stays the same.
What happens to the guys who lent against these assets? Kaplooey!!!
America currently has more feet of retail space per capita than any other country. For that matter, America has more feet of office and other CRE types per capita as well. A decade of low interest rates has made this problem substantially worse. Think of thetwo malls that I spoke about in the last piece— they weren’t done in by the internet, they were done in by a tripling of retail space in a cities that are barely growing. These cities simply ran out of shoppers for all of this space. Now the mall is empty—heck the strip retail is only partly filled in. The next step is that rents will drop—dramatically. The owners of each asset, the mall and the strip center will go bust. Neither has a cap structure that is designed for dramatically lower rents. Neither has an org structure designed for carving up this space for the sorts of eclectic tenants that will eventually absorb it over the next few decades.
CRE has had it so good for the past 35 years, that most owners have never seen a down cycle. Sure, Dallas had too much supply in the early ‘90’s. Silicon Valley over-expanded in the early ‘00’s. It took a few years for it to be absorbed. Anyone who had capital during the bust made a fortune. This time may really be different. There’s too much supply. Short of blowing it up, it will be with us for years into the future. Without dramatic economic or population growth, some of it may NEVER be absorbed.
As an investor, this is all interesting to understand, but you don’t fully comprehend it until you have visited a few dozen of these facilities and seen how owners are trying to cope with the problem. In Miami, space is constricted. In Texas, there’s more CRE than I’ve ever seen. They keep putting it up—even if there isn’t demand currently. For three decades, they’ve always been able to fill it over time. For the first time ever, they can’t seem to fill it—in fact, demand is now declining. It is now obvious; there will be a whole lot of pain for CRE owners and lenders. Of course, someone’s pain can be someone’s gain.
Nasdaq has issued a market-wide trading halt amid what appears to be a “glitch” that sent a number of the largest Nasdaq-listed stocks to crash or spike to exactly $123.47 per share.
This move crashed the value of companies including Amazon and Apple, sparked chaos in Microsoft, while sending Zynga rocketing up more than 3000%.
On the eve of the US Independence Day holiday and in after-hours trading, The FT reports that market data show that companies such as Apple, Amazon, Microsoft, eBay and Zynga were repriced at $123.47.
The Bloomberg data terminal listed either “market wide circuit breaker halt — level 2” or “volatility trading pause” on all the stocks affected.
The glitch did not affect any market trading, including after hours.
The mysterious reset to $123.47 per share meant that Amazon in theory saw its share price marked down 87.2 per cent…
while shares in Apple fell 14.3 per cent…
But Nasdaq-listed Microsoft had jumped 79.1 per cent — which would value the company at nearly $1tn…
As Bloomberg reports,the apparent swings triggered trading halts in some securities, according to automatically generated messages. The halts are a mechanism exchanges use to limit the impact of particularly volatile sessions. A system status alert on Nasdaq’s website said that systems were operating normally at 8:23 p.m. ET. After-market hours on Nasdaq typically last from 4 p.m. to 8:00 p.m.
In a statement, Nasdaq said the glitch was related to “improper use of test data” sent out to third party data providers, and said it was working to “ensure a prompt resolution of this matter”. In cases of any clearly erroneous data, trades made are cancelled.
Speculative booms are often poor guides to future valuations and the maturation trajectory of a new sector.
Charles Hugh Smith recently came across a December 1996 San Jose Mercury News article on tech pioneers’ attempts to carry the pre-browser Internet’s bulletin board community vibe over to the new-fangled World Wide Web.
In effect, the article is talking about social media a decade before MySpace and Facebook and 15 years before the maturation of social media.
(Apple was $25 per share in December 1996. Adjusted for splits, that’s about the cost of a cup of coffee.)
So what’s the point of digging up this ancient tech history?
— Technology changes in ways that are difficult to predict, even to visionaries who understand present-day technologies.
— The sources of great future fortunes are only visible in a rear view mirror.
Many of the tech and biotech companies listed in the financial pages of December 1996 no longer exist. Their industries changed, and they vanished or were bought up, often for pennies on the dollar of their heyday valuations.
Which brings us to cryptocurrencies, which entered the world with bitcoin in early 2009.
Now there are hundreds of cryptocurrencies, and a speculative boom has pushed bitcoin from around $600 a year ago to $2600 and Ethereum, another leading cryptocurrency, from around $10 last year to $370.
Where are cryptocurrencies in the evolution from new technology to speculative boom to
maturation? Judging by valuation leaps from $10 to $370, the technology is clearly in the speculative boom phase.
If recent tech history is any guide, speculative boom phases are often poor guides to future valuations and the maturation trajectory of a new sector.
Anyone remember “push” technologies circa 1997? This was the hottest thing going, and valuations of early companies went ballistic. Then the fad passed and some new innovation became The Next Big Thing.
All of which is to say: nobody can predict the future course of cryptocurrencies, other than to say that speculative booms eventually end and technologies mature into forms that solve real business problems in uniquely cheap and robust ways no other technology can match.
So while we can’t predict the future forms of cryptocurrencies that will dominate the mature marketplace, we can predict that markets will sort the wheat from the chaff by a winnowing the entries down to those that solve real business problems (i.e. address scarcities) in ways that are cheap and robust and that cannot be solved by other technologies.
The ‘Anything Goes’ Speculative Boom
Technologies with potentially mass applications often spark speculative booms. The advent of radio generated a speculative boom just as heady as any recent tech frenzy.
Many people decry the current speculative frenzy in cryptocurrencies, and others warn the whole thing is a Ponzi scheme, a fad, and a bubble in which the gullible sheep are being led to slaughter.
Tribalism is running hot in the cryptocurrencies space, with promoters and detractors of the various cryptocurrencies doing battle in online forums: bitcoin is doomed by FUD (fear, uncertainty and doubt) about its warring camps, or it’s the gold standard; Ethereum is either fundamentally flawed or the platform destined to dominate, and so on.
The technological issues are thorny and obtuse to non-programmers, and the eventual utility of the many cryptocurrencies is still an open question/in development.
It’s difficult for non-experts to sort out all these claims. What’s steak and what’s sizzle? We can’t be sure a new entrant is actually a blockchain or if its promoters are using blockchain as the selling buzzword.
Even more confusing are the debates over decentralization. One of the key advances of the bitcoin blockchain technology is its decentralized mode of operation: the blockchain is distributed on servers all over the planet, and those paying for the electricity to run those servers are paid for this service with bitcoin that is “mined” by the process of maintaining the blockchain. No central committee organizes this process.
Critics have noted that the mining of bitcoin is now dominated by large companies in China, who act as an informal “central committee” in that they can block any changes to the protocols governing the blockchain.
Others claim that competing cryptocurrencies such as Ethereum are centrally managed, despite defenders’ claims to the contrary.
Meanwhile, fortunes are being made as speculators jump from one cryptocurrency to the next as ICOs (initial coin offerings) proliferate. Since the new coins must typically be purchased with existing cryptocurrencies, this demand has been one driver of soaring prices for Ethereum.
As if all this wasn’t confusing enough, the many differences between various cryptocurrencies are difficult to understand and assess.
While bitcoin was designed to be a currency, and nothing but a currency, other cryptocurrencies such as Ethereum are not just currencies, they are platforms for other uses of blockchain technologies, for example, the much-touted smart contracts. This potential for applications beyond currencies is the reason why the big corporations have formed the Enterprise Ethereum Alliance (https://entethalliance.org/).
Despite the impressive credentials of the Alliance, real-world applications that are available to ordinary consumers and small enterprises using these blockchain technologies are still in development: there’s lots of sizzle but no steak yet.
Who Will The Winner(s) Be?
How can non-experts sort out what sizzle will fizzle and what sizzle will become dominant? The short answer is: we can’t. An experienced programmer who has actually worked on the bitcoin blockchain, Ethereum and Dash (to name three leading cryptocurrencies) would be well-placed to explain the trade-offs in each (and yes, there are always trade-offs), but precious few such qualified folks are available for unbiased commentary as tribalism has snared many developers into biases that are not always advertised upfront.
So what’s a non-expert to make of this swirl of speculation, skepticism, tribalism, confusing
technological claims and counterclaims and the unavoidable uncertainties of the exhilarating but dangerously speculative boom phase?
There is no way to predict the course of specific cryptocurrencies, or the potential emergence of a new cryptocurrency that leaves all the existing versions in the dust, or governments’ future actions to endorse or criminalize cryptocurrencies. But what we can do — now, in the present — is analyze present-day cryptocurrencies through the filters of scarcity and utility.
InPart 2: The Value Drivers Of Cryptocurrency, we analyze the necessary success requirements a cryptocurrency will need to excel on in order to become adopted at a mass, mainstream level. Once this happens (which increasingly looks like a matter of “when” not “if”), the resultant price increase of the winning coin(s) will highly likely be geometric and meteoric.
Sadly, the most probable catalyst for this will be a collapse of the current global fiat currency regime — something that increasingly looks more and more inevitable. This will destroy a staggering amount of the (paper) wealth currently held by today’s households. Which makes developing a fully-informed understanding of the cryptocurrency landscape now — today — an extremely important requirement for any prudent investor.
Chris Christie Announces New Jersey Government Shutdown, Orders State Of Emergency
Illinois, Maine, Connecticut: the end of the old fiscal year and the failure of numerous states to enter the new one with a budget, means that some of America’s most populous states have seen their local governments grind to a halt overnight until some spending agreement is reached. Now we can also add New Jersey to this list.
On Saturday morning, New Jersey Gov. Chris Christie declared a state of emergency in the state, and announced a partial state government shutdown as New Jersey become the latest state to enter the new fiscal year without an approved budget after the Republican governor and the Democrat-led Legislature failed to reach an agreement by the deadline at midnight Friday,CBS New York reports.
In a news conference Saturday morning, Christie blamed Democratic State Assembly Speaker Vincent Prieto for causing the shutdown. And, just like Illinois and Connecticut, Christie and the Democrat-led Legislature are returning to work in hopes of resolving the state’s first government shutdown since 2006 and the first under Christie, before NJ is downgraded further by the rating agencies.
Prieto remained steadfast in his opposition, reiterating that he won’t consider the plan as part of the budget process but would consider it once a budget is signed. Referring to the shutdown as “Gov. Christie’s Hostage Crisis Day One,” Prieto said he has made compromises that led to the budget now before the Legislature.
“I am also ready to consider reasonable alternatives that protect ratepayers, but others must come to the table ready to be equally reasonable,” Prieto said. “Gov. Christie and the legislators who won’t vote ‘yes’ on the budget are responsible for this unacceptable shutdown. I compromised. I put up a budget bill for a vote. Others now must now do their part and fulfill their responsibilities.”
Politics aside, the diplomaitc failure has immediate consequences for Jersey residents: Christie ordered nonessential services to close beginning Saturday. New Jerseyans were feeling the impact as the shutdown took effect, shuttering state parks and disrupting ferry service to Liberty and Ellis islands. Among those affected were a group of Cub Scouts forced to leave a state park campsite and people trying to obtain or renew documents from the state motor vehicle commission, among the agencies closed by the shutdown.
As funds run out elsewhere, it will only get worse. Police were turning away vehicles and bicyclists at Island Beach state park in Ocean County.
“If there’s not a resolution to this today, everyone will be back tomorrow,” Christie said, calling the shutdown “embarrassing and pointless.” He also repeatedly referred to the government closure as “the speaker’s shutdown.” Christie later announced that he would address the full legislature later at the statehouse on Saturday.
“From Horrific To Catastrophic”: Court Ruling Sends Illinois Into Financial Abyss
FirstMaine, thenConnecticut, and finally late on Friday, confirming the worst case outcome many had expected, Illinois entered its third straight fiscal year without a budget as Republican Governor Bruce Rauner and Democratic lawmakers failed to agree on how to compromise over the government’s chronic deficits, pushing it closer toward becoming the first junk-rated U.S. state.
By the end of Friday – the last day of the fiscal year – Illinois legislators failed to enact a budget, and while negotiationscontinued amid some glimmers of hopeand lawmakers planned to meet over the weekend, the failure marked a continuation of the historic impasse that’s left Illinois without a full-year budget since mid-2015, and which,recall, S&P warned one month ago will likely result in a humiliating and unprecedented downgrade of the 5th most populous US state to junk status.
Then came the begging.
According toBloomberg, on Friday Illinois House Speaker Michael Madigan, a Democrat who controls much of the legislative agenda, pleaded with rating companies to “temporarily withhold judgment” as lawmakers negotiate. “Much work remains to be done,” the Democrat said on the floor of the House Friday, before the chamber adjourned for the day. “We’ll get the job done.”
Meanwhile, the state remains without a spending plan, its tax receipts and outlays mostly on “autopilot”, leaving it with a record $15 billion of unpaid bills as it spent over $6 billion more than it brought in over the past year, and with $800 million in interest on the unpaid bills alone. The impasse has devastated social-service providers, shuttering services for the homeless, disabled and poor. The lack of state aid has wrecked havoc on universities, putting their accreditation at risk.
However, in a “shocking” development, just hours remaining before the midnight deadline to pass the Illinois budget, and Illinois’ imminent loss of its investment grade rating, federal judge Joan Lefkow in Chicago ordered Illinois to come up with hundreds of millions of dollars it owes in Medicaid payments that state officials say the government doesn’t have, theChicago Tribunereported. Judge Lefkow ordered the state to make $586 million in monthly payments (from the current $160 million) as well as another $2 billion toward a $3 billion backlog of payments – a $167 million increase in monthly outlays – the state owes to managed care organizations that process payments to providers.
While it is no secret that as part of its collapse into the financial abyss, Illinois has accumulated $15 billion in unpaid bills, the state’s Medicaid recipients had had enough, and went to court asking a judge to order the state to speed up its payments. On Friday, the court ruled in their favor. The problem, of course, is that Illinois can no more afford to pay the outstanding Medicaid bills, than it can to payany of its $14,711,351,943.90 in overdue bills as of June 30.
The backlog of unpaid claims the state owes to managed-care companies directly, as well as to the doctors, hospitals, clinics and other organizations “is crippling these providers and thereby dramatically reducing the Medicaid recipients’ access to health care,” Lefkow said in her ruling (attached below).
* * *
Friday’s court ruling, which meant that the near-insolvent state must pay an additional $593 million per month, may have been the straw that finally broke the Illinois camel’s back.
“Friday’s ruling by the U.S. District Court takes the state’s finances from horrific to catastrophic,” Comptroller Susana Mendoza, a Democrat, said in an emailed statement after the ruling.
As a result of the court decision, “payments to the state’s pension funds; state payroll including legislator pay; General State Aid to schools and payments to local governments — in some combination — will likely have to be cut.”
“As if the governor and legislators needed any more reason to compromise and settle on a comprehensive budget plan immediately, Friday’s ruling by the U.S. District Court takes the state’s finances from horrific to catastrophic,” Mendoza said in a statement. “A comprehensive budget plan must be passed immediately.” Realizing where all this is headed, she said that payments to bond holders won’t be interrupted (more below).
Illinois Comptroller Susana Mendoza
Friday night’s legal decisionfollowed a previously discussed ruling,when on June 7, Judge Lefkow ordered lawyers for the state to negotiate with Medicaid recipients to come up with more money, but she stopped short of dictating how much more the state should pay each month, or when. That decision sent Illinois General Obligation bond soaring.
Earlier this week, the parties again went before the judge to say they were at an impasse, with lawyers for Medicaid recipients asking for more than $1 billion a month to cover past and ongoing costs.
Lawyers for Illinois countered that they could only come up with approximately $75 million more a month, which would translate to $150 million with federal matching dollars. Although the state is way behind, state officials said in court filings that they have been making more than $1 billion in Medicaid related payments each month in 2017, “including payments to safety net hospitals, MCOs, and other providers.”
While the state was livid over the decision, plaintiffs were delighted. Tom Yates, one of the lawyers who represented the Medicaid recipients. said the judge’s ruling is a “fair result” that will help them have access to care. “Medicaid is an incredibly important program for 25 percent of the state’s population,” Yates said. It remains unclear, however, where Illinois would find the required funds.
In her ruling, Lefkow said the state must pay the $2 billion toward its past obligations beginning July 1 and ending June 30, 2018. She ordered the state to file monthly reports showing that it’s making the payments consistent with the ruling. The Judge said she considered submissions by managed care organizations, including The Meridian MCO and Aetna Better Health Inc., in reaching her decision. Meridian is owed $540 million and Aetna is owed $700 million, the judge said. In addition, she considered submissions from doctors and clinics.
Adding insult to crippling financial injury, the judge also ordered the state to file monthly reports showing that they are making the payments consistent with the ruling.
* * *
Meanwhile, despite the recent fireworks, things in Illinois remain on autopilot as the state needs a new budget to change financial direction.
Without a budget, Bloomberg writes, the state has continued to spend more than it brings in. That’s forced it to cover “core priority” payments first, including payroll, debt service and pensions that total about $1.85 billion a month. While those bills include some Medicaid-covered payments like health services for children and adults, the state has said there aren’t enough funds to include general payments to managed-care organizations as a top priority.
Also, without a budget that includes borrowing to pay down the bill backlog, Illinois by August will run out of money for key expenses for the first time since the stalemate began, according to Comptroller Mendoza. That means school funding, state payroll, and pension payments could be affected, she said. There won’t be enough money for these mandated or court-ordered payments.
As noted above, Mendoza said that this won’t jeopardize debt-service payments, however she probably should have added “for now.” For now, Illinois hasn’t missed any bond payments and state law requires it to make monthly deposits to its debt-service funds.
For now, despite the Illinois deadline coming and going, the political standoff shows no signs of ending.
And now the market is set to react: investors have already punished Illinois for its fiscal woes. Yields on the state’s 10-year bonds have soared to 4.8%, 2.8% points higher than benchmark debt. That’s the highest yield of all 22 states that Bloomberg tracks.
Summarizing best the chaos in Illinois was John Humphrey, the head of credit research for Gurtin Municipal Bond Management, which oversees about $10.1 billion of state and local debt who said that “recognizing that they’re continuing to work through the weekend, it doesn’t look good to adjourn halfway through your last day.”
Bob Rodriguez: “We Are Witnessing The Development Of A Perfect Storm”
Robert L. Rodriguez was the former portfolio manager of the small/mid-cap absolute-value strategy (including FPA Capital Fund, Inc.) and the absolute-fixed-income strategy (including FPA New Income, Inc.) and a former managing partner at FPA, a Los Angeles-based asset manager. He retired at the end of 2016, following more than 33 years of service.
He won many awards during his tenure. He was the only fund manager in the United States to win the Morningstar Manager of the Year award for both an equity and a fixed income fund and is tied with one other portfolio manager as having won the most awards. In 1994 Bob won for both FPA Capital and FPA New Income, and in 2001 and 2008 for FPA New Income.
The opinions expressed reflect Mr. Rodriguez’ personal views only and not those of FPA.
I spoke with Bob on June 22.
In a recent quarterly market commentary Jeremy Grantham posited that reversion to the mean may not be working as it has in the past. What are your thoughts on mean reversion?
There will be a reversion to the mean. We are in a very difficult and challenging time for active managers, and in particular, value style managers. Many of these managers are fighting for their economic lives.
Given that I am no longer involved professionally in managing money, I believe the standards in the industry are being compromised; monetary policy has so totally distorted the capital markets. You are now into the eighth year of a period that is unprecedented in the likes of human history.
The closest policy period to what we have now would have been between 1942 and 1951, when the Fed and Treasury had an accord to keep interest rates low. Interest rates were artificially held lower to help finance the World War II effort. With the renewal of inflation after the war, a policy war developed between the Treasury and the Fed on the continuation of a low interest rate policy. The Treasury-Fed of 1951 brought this period to a close. But that is the only time we’ve had a period of nine years of manipulated, price-controlled interest rates.
This was a historical policy I discussed with my colleagues upon my return from sabbatical in 2011: what could unfold were controlled, manipulated and distorted pricing that could disrupt the normal functioning of the capital markets. The historical cycles that Jeremy would be referring to that entailed a reversion to the mean could be distorted, for a period of time, by this type of monetary policy action.
But I do not believe the economic laws of gravity have been permanently changed.
At a Grant’s Conference last year Steven Bregman asserted that indexation in general and ETFs in particular were factors in the under-performance of active managers and are potentially a bubble. Are you familiar with his work and what are your thoughts on ETFs? What is driving the flow of mutual fund assets to passive strategies and what can or should fund companies do in the face of this trend?
I go back to a speech I gave in 2009,Reflections and Outrage, and buried within that speech is a section that said that if active managers did not get their act together then the likelihood would be that passive strategies would continue to take market share. When you have a market that is distorted by zero interest rate policy, David Tepper said it very well many years ago, “Well, you’ve got to ride it.”
It’s a rocket ship that’s going up. If you are fully invested in the right areas, you have a shot at out-performing. However, if you are an active manager who has a valuation discipline, given the valuation excesses in the capital markets now and that have been developing for the past several years, then an elevated level of liquidity would be held, if you were allowed to do so. As such, you will likely underperform the market.
Active managers have not demonstrated a value-add to an appreciable extent over the last 20 years. When I look back at what happened prior to 2000, if an active growth stock manager could not see the most extraordinary distortion and elevated, speculative market in history, when will they? In the lead up to the 2007-2009 financial crisis, many value-style managers did not cover themselves in glory either. If you looked at what their major stock ownership concentrations were, they were very much in large banks and various types of financial institutions that were going to get crushed in the credit downturn. If they couldn’t acknowledge or identify the greatest credit excess in history, when will they?
I’m picking on both growth- and value-style managers for missing two of the great bubbles in history. This miss led to capital destruction. Now we have a clueless Fed, in my opinion, that has never known what a bubble is beforehand. It is accentuating one that has been developing as a result of its policy insanity of QE. Markets are going straight up predicated on it.
The public looks at these outcomes and says, “Why should I pay higher fees to managers who can’t outperform or can’t even identify a major speculative blow off. I might as well be fully invested. I might as well be in an ETF or index fund.”
Thus, since 2007, indexing or passive activities have risen from approximately 7% to 9% of total managed assets to almost 40%. As you shift assets from active managers to passive managers, they buy an index. The index is capital weighed, which means more and more money is going into fewer and fewer stocks.
We’ve seen this act before. If you didn’t own the nifty 50 stocks in the early 1970s, you underperformed and, thus, money continued to go into them. If you were a growth stock manager in 1998-1999 and you were not buying “net” stocks, you underperformed and were fired. More and more money went into fewer and fewer stocks. Today you have a similar case with the FANG stocks. More and more money is being deployed into a narrower and narrower area. In each case, this trend did not ended well.
When the markets finally do break, as they always have historically, ETFs and index funds will be destabilizing influences, because fear will enter the marketplace. A higher percentage of assets will be in indexed funds and ETFs. Investors will hit the “sell” button. All you have to ask is two words, “To whom?” To whom do I sell? Index funds and ETFs don’t carry any cash reserves. The active managers have been diminished in size, and most of them aren’t carrying high levels of liquidity for fear of business risk.
We are witnessing the development of a “perfect storm.”
The Wall Street Journal has reported that central banks from Switzerland to South Africa are investing their reserves in equities. How should investors respond to the participation in the price discovery system by players that can print money and may not be performance-driven?
The last thing I ever wanted to do as a professional was allocate capital to areas that government was buying. With governmental-driven decisions there are virtually no penalties for bad decision making. Look at the rank stupidity of Dodd-Frank, or Paulson, Bernanke, and Greenspan. They were clueless before each of the last crises. They helped drive a system off the tracks. What penalty have they paid? None! They get to keep their pensions.
But when you have central banks deploying capital and their cost of money is zero, they destroy the capital-asset pricing mechanism; they destroy comparability; the distortions continue.
As a dedicated contrarian, the last place I want to invest money is where governments are deploying the capital because they are so totally distorting the market.
How did the discipline of value investing as you practiced it at FPA, change over the course of your career, particularly since the financial crisis?
It’s an interesting question and I’ve asked myself that many times.
The markets moved more slowly prior to this century – the ebbs and flows, the decision-making and the conveyance of information. With the advance of electronics and the internet, the speed of dissemination of news accelerated. I don’t believe that judgments have improved; just the speed has accelerated and the time frames of patience have shortened.
I bet my entire business in the spring of 1998 when for the prior 11 or 12 years I ran my mutual fund, the FPA Capital Fund, on fumes, with 1% to 2% cash and sometimes even less than 1%. Had you held liquidity, with short-term bond yields in the high-single to double-digits, you would have underperformed the stock market by anywhere from 900 to 1,100 basis points. By 1998 the consultant’s mantra was to be “fully invested.”
I went out in the spring of 1998 arguing that the equity market was becoming excessively priced, and it continued to do so. I sought permission to move my liquidity limits from 7% to 10% which were the typical maximums, to upward of 30%. I had to fight every client on that. By the spring of 2000, without losing any money and avoiding the carnage, I took a little bit over a 50% reduction in my assets under management. I got fired. In 2007-2009, I did far more preparation and communication prior to that crisis and entered it with 45% cash.
In the first phase of a debacle like what went on in the financial crisis, it doesn’t matter whether you are a virgin or are the opposite. When they raid the entertainment house and you happen to be a person walking by, just out of the church right next door, you get caught with all of the people there.
In the aftermath the police discover, “Oh, you shouldn’t be here.” Well, it’s the same way in a crash; virtually everything gets hit. Then in the second and third stages, the real values start to unfold and you get a greater differentiation. That is what happened with my fund between 2007 and 2009 and subsequently.
A cash level of 45% was a real tough strategy for clients to handle. I had one client say, “Please stay fully invested for my account and just do your thing with the others.” I said, “No, the price you ask me to pay is too high. By being fully invested managing your money, I will contaminate my thinking, which will negatively affect my other clients. I’m sorry, that’s a price too high to pay.” I said, “Where do you want me to return the money?” He said, “Let me think about it.” The next day his response was, “Okay, you’ve got flexibility.” But I still took over a 50% hit in redemptions during that crisis.
Looking back at these two prior major cycles, it is far more difficult for a value manager to hold liquidity today in light of the policies that are being deployed. These are the worst fiscal and monetary policies in human history.
If I were still professionally managing money, despite my background of pain-and-suffering from being redeemed, my liquidity allocation would be north of 60% today.
So-called “smart-beta” products have become very popular, particularly those that incorporate a quantitatively-driven value strategy based on the Fama-French factor models. For investors that want a value-oriented portfolio, what concerns should they have with these strategies?
I have never seen a quantitative strategy succeed longer term. They are predicated on models. The models are predicated on history. When history changes, they have to develop a new factor model.
We witnessed this in the last cycle. There was an article in the WSJ quoting a quant manager who said on a Wednesday, we had experienced a 1-in-10,000 year event. On Thursday, we had a 1-in-10,000 year event. On Friday we had a 1-in-10,000 year event. A former colleague wrote an email that weekend that said, “I have a quick question to ask. On Monday, are we safe for the next 30,000 years?”
All of these strategies are meant to enhance or give an essence of how you are going to try and minimize risk and enhance return. When you are in an environment where the lead entity, the Federal Reserve, has its foot on the scale and is distorting the information coming out of the capital markets, where interest rates can go to zero, what is the proper hurdle rate for budgetary or capital allocation decisions? These actions distort the price comparison or discovery process in the capital asset-pricing model. This is highly disturbing.
By the way, I wrote a piece in 2008 before the Fed even knew they were going to balloon their balance sheet. It said they would have to increase the balance sheet by at least a trillion to a trillion and a half. They hadn’t got to that realization yet.
After 45 years of watching the Fed, the only Fed chairman that was worth spit was Paul Volcker. The last great central banker that we had in the last 110 years other than Volcker was J.P. Morgan. The difference is, when Morgan tried to contain the 1907 crisis, he wasn’t using zeros and ones of imaginary computer money; he was using his own capital. As long as you have anointed centralized bureaucratic decision makers like the Federal Reserve, that in many ways is similar to the concentrated decision making structure of the former Soviet Union, decisions will be late and generally wrong. The Fed is a large organization and like all large organizations, there are internal pressures where they try to come to a consensus, and so they do.
This is not how you make your greatest decisions.
If there is one piece of investment advice you would offer to a young professional embarking on a career now, what would that be?
I will give the same advice that I got when I was a very young professional back in 1973. I was two years into the field and a gentleman spoke before my investment class. After everybody had walked out, I walked up to Mr. Munger and I asked him, “Sir, if I could only do one thing that would make myself a better investment professional, what would you recommend?” He responded, “Read history, read history, read history.” I have done that over the years. Had you read about the banking crisis of 1907 and what preceded it in the 1890s, you would have recognized it in a form in 2007.
If there is one piece of management advice that you could offer to that same person, what would that the?
You must have two things – discipline and integrity. Compromise either and you will fail.
That’s true in all walks of life.
Yes, but it’s very easy to use the justification that this time is different.
The world has changed. I gave a speech in 2001 to some pension advisors. I said, “Look at you people out there.” I hadn’t shown them my chart yet but I said, “Look at what we have just gone through. We had the greatest, the highest level of computerization in the history of man, the most timely acquisition to information, the highest percentage of advanced degreed professionals and college graduates in the field, and we got an outcome no different than 1974, 1929, 1907. There is something more here going on.”
Then I held up two hand-written stick figures – I was not a good artist. They were cows and they were talking to one another. One cow said to the other, “Glad we’re not part of the herd.” The other cow said, “Yea.” The next exhibit was an aerial shot. It showed the two cows are in a ravine, so they can only see themselves. But all around them is the herd. I looked out and said, “People, whether you realize it or not, you are part of the herd. All you have to understand is one word, now let’s say it all together. Moo.” What a way to influence friends and make new clients.
How are you investing your personal assets?
I am at my lowest exposure to equities since 1971. They represent less than a fraction of one percent. Liquidity is north of 65%, all in Treasury-type securities, nothing beyond a three-year term. I do not trust what is going on fiscally or monetarily, and I’ll circle back on this in a moment. The balance is in rare fully paid-for physical assets.
Circling back, after I stepped down from daily money management at the end of 2009, I took a sabbatical. One of my goals was to meet a gentleman by the name of David Walker, the former comptroller general of the U.S. He wrote a book called Comeback America that I read in January of 2010. I sent my review to Dave. Two days later Dave called me and said, “My name is Dave Walker. Is this Bob Rodriguez? If so, I want to thank you for your review.” That’s how we came to know one another. I’d used his work for over 10 years. For the next three and a half years I was a sponsor of his program, Comeback America. He closed it down in 2013, a complete unmitigated failure.
Think about the budgetary battles of 2011; the only thing that was cut was defense. Two thirds of the expenditure cuts that were going to get controlled under the system would not occur until after 2016. Funny how that works. In the presidential debates, only one candidate used a word that I think has now left the English language, “sequester.” That was Bush and it was to eliminate sequestration to raise defense spending.
The 2016 election was one of the most important elections in the last 80 years. Back in 2009 I said if we do not get our economic house in order sometime between 2014 and 2018, we could see a crisis of equal or greater magnitude than the 2007-2009 crisis. I also argued that we would have a substandard recovery that would be no better than 2% real GDP growth for as far as the eye can see. Productivity and capital spending would be substandard. All of those have played out.
Here we are in 2017. I have seen absolutely nothing that would give me any degree of confidence that Washington will get its act together. We are into a period of expanding deficits. We are hitting a time where the entitlements are worsening in terms of their funding status. We are in a decade that is unprecedented from anything that we’ve seen before with monetary policy and fiscal policy.
Why on Earth should I allocate capital into a system where the scales are completely manipulated, price discovery is distorted, and the Fed doesn’t have a clue what’s going on? They’ve missed every economic forecast for the last nine years straight. Why would anybody pay any attention to what those people are doing?
I have confidence in one thing. The Fed will blow it.
My thoughts are very much analogous to those of Lacy Hunt. Where Lacy and I part company is what happens after the deformation hits. He would argue that we will be in a dis- or deflationary period for an extended period of time; therefore, you should own 30- and 20-year Treasury bonds.
I’m not so sure about that scenario. It occurred in Japan because it has a very cohesive society. That is not the case in the United States or in Europe. Our patience will be far shorter. At some point, in no more than one to two years, the Fed would likely panic and panic big time, and we will see QE on steroids. We will see monetary inflation. Lacy and I have a similar view. But the really big question is what the outcomes will be on the other side of this mess. Both of us could be very right, or very wrong, or partially in between.
I am managing my estate in a hedged fashion because what we are going through is without any precedent in human history. How can anybody have confidence that their particular view is the right view?
The bitcoin price is up roughly 10X over the past two years, so it is understandable why some people believe it is overvalued. If you do a Google search on “Bitcoin Bubble,” you will find nearly 700,000 results. People love to proclaim that bitcoin is a bubble, especially those that missed the inflation of said bubble.
But are they correct? Is it too late to get on board the bitcoin rocket?
Only time will tell, but I suspect that the price of bitcoin will climb many multiples higher before reaching a top. We have yet to see a mania phase and in fact, less than 5% of the investing public owns any bitcoin. The vast majority still have no idea what blockchain technology is or how to acquire bitcoin.
The market cap of bitcoin, now that the price has risen to $2,700, is around $45 billion. A decade ago, the term billion meant something. You didn’t really hear much talk of trillions. But thanks to our central planners and their lackeys in government, trillions are now the new billions. At any rate, let’s take a look at bitcoin’s valuation versus other markets in order to put things into perspective:
Despite the rapid rise in the bitcoin price, it is still worth no more than the wealth of Google (NASDAQ:GOOG) co-founder Larry Page alone. Bill Gates could buy all of the bitcoin in existence, twice over. The total value of all bitcoin is just 1/10th of Amazon’s (NASDAQ:AMZN) market cap or 1/17th of Apple’s (NASDAQ:AAPL) market cap.
While the price of a Bitcoin surpasses that of an ounce of gold for the first time earlier this year, the total value of gold is still 200 times the value of bitcoin. Even if we take into account the value of all cryptocurrencies at around $100 billion, Apple is still worth 4 times this number and the gold market is valued at more than 80 times all cryptocurrencies combined!
The total market value of publicly traded shares at stock exchanges around the world is $66.8 trillion. This is nearly 1,500 times the valuation of bitcoin or 670 times the valuation of all cryptocurrencies combined.
When we move into central bank funny money,the total amount of money in the world is $84 trillion,or roughly 800 times the value of all cryptocurrencies in existence. In physical coins and notes, the total global money supply is $31 trillion or 310 times the value of all cryptocurrencies.
So, while the meteoric rise of bitcoin has led to a significant market valuation, it is still small relative to other markets or even relative to the wealth of a single software entrepreneur. What happens when even a small percentage of the $67 trillion invested in stocks or $83.6 trillion in central bank money begins to move into bitcoin and other cryptocurrencies?
This possibility is not nearly as far-fetched as it may seem on the surface. People are losing trust in government/central bank money and other traditional measures of wealth. As this trend accelerates, I believe an increasing amount of money will flow into bitcoin and other cryptocurrencies, pushing their valuations many times higher than today.
Is bitcoin overvalued? Are the cryptocurrency markets in a bubble about to burst?
Nope, not by a long shot. At the very least, I believe these markets need to reach parity with the gold market, which implies an increase in the valuation of cryptocurrenciesof at least 80 times the current valuation. That would turn an investment of just $12,500 into $1 million!
So even if you’ve missed the incredible bull market in cryptocurrencies thus far, I believe there is still plenty of upside ahead. While I continue to hold bitcoin and Ethereum has core positions, I am especially bullish on a number of altcoins that I think will outperform bitcoin by a wide margin over the next 12-24 months.
Meet The Money-Laundering, Nigerian Oil Magnate Behind New York’s $50MM Condo Foreclosure
Yet another luxury condo at Manhattan’s One57 tower, a member of “Billionaire’s Row,” a group of high-end towers clustered along the southern edge of Central Park, had gone into foreclosure – the second in the span of a month. The 6,240-square-foot, full-floor penthouse in question, One57’s Apartment 79, sold for $50.9 million in December 2014, making it the eighth-priciest in the building and likely the largest residential foreclosure in Manhattan’s history.
According toBloomberg,the owner of the apartment attempted to conceal his/her identity by using a shell company (you know how those kooky billionaires can be) but was able to obtain an ‘unusually large’ mortgage with an even more unusual term: one-year.
In September 2015, the company took out a $35.3 million mortgage from lender Banque Havilland SA, based in Luxembourg. The full payment of the loan was due one year later, according to court documents filed in connection with the foreclosure.
The borrower failed to repay, and now Banque Havilland is forcing a sale to recoup the funds, plus interest.
Of course, it was only a matter of time until the mystery man behind Manhattan’s most recent luxury real estate epic fail was exposed. As such, meet Nigerian oil magnate, Kola Aluko.
As it turns out, the world renowned, Nigerian-born, billionaire playboy is about $25,000 behind on his property taxes. But, that is probably the least of his worries as theNew York Postpoints out that he currently wanted by authorities in both Nigeria and Europe for defrauding the Nigerian government out of oil sale profits.
But Aluko has bigger problem, it seems. The 47-year-old tycoon is under investigation in Nigeria and in Europe for alleged money-laundering crimes.
A Nigerian court, according to various reports, tried to freeze Aluko’s assets, including his One57 unit, as part of the alleged scheme to defraud the government of oil sale profits.
Meanwhile, it seems that the only reason Aluko isn’t already in prison is because the Nigerian courts can’t seem to find him to serve papers. Apparently he’s been hiding out on this 213-foot, $100 million yacht, the Galactica Star, for over a year.
Over the past year, the boat has been spotted making port calls in Cancun, Mexico and Turkey.
Of course, if you’re going to be an international playboy then you need to have rich and famous friends and, as it turns out, rappers Jay-Z and P. Diddy seemed to have fulfilled that role for Aluko. Back in 2012 the rap duo apparently hosted Aluko’s birthday party in Beverly Hills. Then, just a few years later in 2015, Jay-Z and wife Beyonce rented Aluko’s mega-yacht for the bargain basement price of just $900,000 per week to sail around the Mediterranean.
Amazon bought Whole Foods today. Widespread carnage in the grocery stock prices followed. Jim Cramer called it a major deflationary disruption saying stores cannot compete.
“If I was the Federal Reserve, I would have a meeting on this. Inflation is going to go down…. You have to rethink food … Costco knows how to compete. It will be in there tooth and nail with toilet paper and paper towels. … But Kroger, a crisis in Cincinnati, crisis.”
TheStreet’s Action Alerts PLUS Portfolio Manager Jim Cramer said Amazon’s move to acquire Whole Foods is a disruption of society, “this is what I regard to be a move by Amazon to destroy the margins and own the business of food and groceries in this country,” Cramer said.
With Amazon putting down $13.7 billion to buy Whole Foods, Bezos is sending a powerful message to his retail rivals;
Food suppliers will now be dealing with an even larger grocery store, meaning potentially pressured profit margins for organic players such as Hain Celestial.
Amazon officially shows intent to enter bricks-and-mortar retail in a larger way than just bookstores. Combine that with its unmatched digital presence, Walmart, Target and others have been put on notice.
Grocer stores like Kroger will now be in an even bigger price war.
Amazon Prime integrated into Whole Foods could hurt Costco over time. Many Costco members are also Prime members.
“What Amazon did to the mall, it will now do to grocery stores,” said Cramer.
Two years ago, Bitcoin was considered a fringe technology for libertarians and computer geeks. Now, Bitcoin and other cryptocurrencies, such as Ethereum, are gaining mainstream adoption. However, mainstream adoption has been propelled by financial speculation instead of by demand for a privately minted and deflationary medium of exchange. After the Fed’s rate hike this week, Bitcoin and alternative cryptocurrencies, such as Ethereum and Dash dropped in value instantly. Bitcoin, for example, dropped by approximately 16% in value while other coins dropped by approximately 25%. However, Bitcoin’s price recovered to the previous high within 18 hours.
Contrary to popular belief that Bitcoin is deflationary, the currency currently has an annual inflation rate of approximately 4%. The reason that Bitcoin allows investors to hedge the expansionary monetary policies adhered to by central banks is because the demand for Bitcoin is growing at a pace that is higher than the increase in the supply of Bitcoin. As explained in aMises Daily article written by Frank Shostak in 2002, the term inflation was originally used to describe an increase in the money supply. Today, the term inflation refers to a general increase in prices.
If the original definition is applied, then Bitcoin is an inflationary currency. However, as I discussed in the 2017 edition ofIn Gold We Trust, the supply of newly minted Bitcoin follows a predictable inflation rate that diminishes over time. Satoshi modeled the flow of new Bitcoin as a Poisson process, which will result in a discernible inflation rate compared to the stock of existing Bitcoin by 2020. Every four years, the amount of Bitcoin minted annually is halved. The last programmed “halving” occurred in June of 2016. Therefore, the next halving will occur in 2020. The inverse of the inflation rate, the StFR, also indicates the decreasing flow of newly minted coins into the Bitcoin economy. The stock to flow ratio (StFR) of Bitcoin is currently 25 years; however, the StFR ratio will increase to approximately 56 years. This means that the StFR of Bitcoin should surpass gold’s during the next five years. Prior to January 3, 2009, no Bitcoin existed. Therefore, Bitcoin’s StFR was effectively zero. However, the rapid reduction in the amount of Bitcoin mining over time results in an increasing StFR over time. By 2024, only 3.125 Bitcoin will be mined every ten minutes resulting in a StFR of approximately 119 years.
If the new meaning of inflation is applied, then Bitcoin is deflationary because the purchasing power of each unit increases overtime.
When I began investing in Bitcoin in 2014, a Model S Tesla worth $70,000 cost 230 Bitcoin. Today, a Model S Tesla worth $70,000 costs 28 Bitcoin. On June 11 of this year, the price of Bitcoin reached a new all-time high above $3,000 after trading at approximately $2,300 two weeks ago. Furthermore, Bitcoin’s market capitalization of $40 billion is expected to rise further as the uncertainty surrounding this technology decreases. Bitcoin’s price data only covers the past six years, which means there is basically no data available for statistical analysis.
Risk Assessments
TheEllsberg paradoxshows that people prefer outcomes with known probability distributions compared to outcomes where the probabilities are unknown. The estimation error associated with forecasts of Bitcoin’s risks and returns may be negatively biasing the price downward. As time passes, people will become more “experienced” with Bitcoin, which may reduce uncertainty and the subsequent discount it wields on the price of Bitcoin.
An economic downturn occurs approximately once every ten years in the US, and it has been a decade since the 2007/2008 financial meltdown. If the economy cannot handle the increase in rates, and the Fed is forced to reverse their decision, the price of Bitcoin and other cryptocurrencies are likely to respond positively. Although the cryptocurrency market took a steep plunge after Janet Yellen’s second rate hike of 2017, prices fully recovered within a day. The quick rebound underscores the lack of assets that allow investors to accumulate wealth safely. Negative interest rates in Europe and fiat demonetization in developing countries are still driving demand for Bitcoin and alternative cryptocurrencies. Although Bitcoin was initially ridiculed as money for computer nerds and a conduit for illegal activity, investors are beginning to see the potential for this technology to be an integral part of wealth management from the perspective of portfolio diversification.
The second-quarter economic report misery continues in a major way today with housing starts and permits unexpectedly falling.
TheEconodayconsensus was was for starts to rise 4.35%. Instead, starts fell 5.5%. Adding insult to injury, April was revised lower by 1.37 percentage points making the consensus estimate off by an amazing 11.22 percentage points.
The bad economic news keeps building, this time in the housing sector. Housing starts fell an unexpected 5.5 percent in May to a far lower-than-expected annualized rate of 1.092 million with permits likewise very weak, down 4.9 percent to a 1.168 million rate.
All components show declines with single-family starts down 3.9 percent to a 794,000 rate and permits down 1.9 percent to 779,000. Multi-family starts fell 9.7 percent to 298,000 with permits down 10.4 percent to 389,000. Total completions did rise 5.6 percent to a 1.164 million rate, which adds supply to a thin market, but homes under construction slipped 0.7 percent to 1.067 million.
Adding to the bad news are downward revisions to starts including April which is now at 1.156 vs an initial 1.172 million. Looking at the quarter-to-quarter comparison, starts have averaged 1.124 million so far in the second quarter, down a very sizable 9.2 percent from 1.238 million in the second quarter. Permits, at an average of 1.198 million, are down 4.9 percent.
Residential investment looks to be yet another negative for second-quarter GDP.
The negative report prompted the following statement from the National Association of Realtor’s Chief Economist Lawrence Yun. “Housing shortages look to intensify and may well turn into a housing emergency if the discrepancy between housing demand and housing supply widens further. The falling housing starts and housing permits in May are befuddling given the lack of homes for sale and the quick pace of selling a newly-constructed homes. Meanwhile, job creations of a consistent 2 million a year will push up housing demand further. One thing that moving up is the housing costs for consumers: higher home prices and higher rents.”
NAR “Befuddled”
Yun is befuddled. That’s hardly surprising given that it does not take much to befuddle economists.
Let me clear up the confusion:
People cannot afford homes so they are not buying them.
Builders will not purposely build homes to sell at a loss.
The alleged demand for new homes is imaginary.
Such analysis is beyond the scope of most economists, so I am happy to help out.
I was wrong about Ethereum because it’s such a good store of value…
no wait, let me try again.
I was wrong about Ethereum because it’s such a decentra…
nope.
I was wrong about Ethereum because everyone is using it as a supercomputer…
No.
I do admit I didn’t see this Ethereum bubble coming, but then again I wrongly assumed that no startup would need or even dare to ask $50 million in funding and I also wrongly assumed that people would use common sense and that leading developers would speak out against this sort of practice. Quite the opposite it seems.
Ethereum’s sole use case at the moment is ICOs and token creation.
What’s driving the Ethereum price?
Greed.
Greed from speculators, investors and developers.
Can you blame them?
Speculators and investors: No.
Developers: Absolutely.
So let’s think for a minute and think what determines the price? Supply + demand. Pretty straightforward.
Supply: the tokens that are available on the market, right? But with every ICO there are more tokens that are being “locked up”. Obviously the projects will liquidate some, to get fiat to pay for development of their project, but they also see the rising price of Ethereum. So at that point greed takes over and they think, totally understandable, “We should probably just cash out what we really need and keep the rest in ETH, that’s only going up anyway it seems.” And obviously there are new coins being mined, but if you look at the amount of ETH these ICOs raise, at this point, it’s just a drop in a bucket.
Demand: You have the normal investors (who are already very late to the game at this point… as usual), but the buy pressure that these ICOs are creating is crazy and scary. Take TenX for example, it’s an upcoming ICO at the end of the month. The cap is 200,000 ETH (at current ETH price of $370) that’s $74,000,000 for a startup. Here’s the best part: it’s only 51% of the tokens. Effectively giving it an instant $150 million valuation (if it sells out, which it probably will). Another example is Bancor, a friend of mine runs a trading group, he collected 1,100+ BTC to put into Bancor. This needs to be converted into ETH before the sale starts. These are decent size players, but not even the big whales who participate in these ICOs.
What will the price do next?
It can go quite a bit higher, there are so many coins being taken off the market by these ICOs, that it can still continue for a while and everyone is seeing this and thinking: “Why aren’t I doing an ICO”. There are lots more coming.
At one point it will crash, hard. What the trigger will be? Bug(s) in smart contracts, major hack, big ICO startup that fails/fucks up, network split, even something as silly as not having a decent ICO for a couple of weeks which creates sell pressure from miners and ICO projects can cause a big crash. It’s not a question of “if”, it’s a question of “when”. That being said: Markets can remain irrational for quite a long time.
Usually when a bubble like this pops we could easily see 70–80% loss of value (for reference: Bitcoin went from $1,200 to $170 after 2013–2014 bubble). This is however quite the unusual situation and I’m not sure to what kind of bubble I can really compare it.
I’m sure most of you have seen “Wolf of Wall Street”. Just re-watch this clip and see if you find any similarities with the current situation. (bonus clip)
What I really find interesting is what the ICO startups will do, Bitcoin had hodlers and investors mainly, individuals who most of the time had a fulltime job and didn’t need to sell. With Ethereum there is this huge amount being held by companies who need to pay bills. Will they panic dump to secure a “healthy” amount of fiat funding, will they try to hold through a bear cycle?
Taking Responsibility:
Everyone loves making money, you can’t blame traders or investors from taking advantage of this hype. That would be silly. People will buy literally anything if they can make a quick buck out of it.
The responsibility here is with the developers, Consensys and the Ethereum Foundation but they don’t take responsibility since they’re getting more money. This will end with the regulators stepping in.
The reason why I say that it’s with developers, Consensys and the Ethereum Foundation is simple:
The developers of a project assign these crazy token sale caps, more money than any startup would ever need.
The Ethereum foundation members+ core developers use their own celeb status to actively promote these projects as advisors, for which they’re compensated well, luring in people who have no clue what they’re buying.
Consensys promotes all of this since it’s the marketing branch of Ethereum. The more fools that buy in, the better.
Let me illustrate this with an example. Have you heard of primalbase? It’s an ICO with a token for shared work spaces. Why would a shared work space need its own token? It doesn’t, it really really really doesn’t. Let’s take a look at the advisors:
First thing that an advisor should’ve said in this case was: “Don’t do it, it’s stupid, it makes no sense.” But well there we have Mr Ethereum himself.
We all know that Vitalik has a cult-like following with the Ethereum investors so it will be very easy for primal base to launch their ICO and use Vitalik’s face and name to get itself funded.
This is just one example, if you go through all of these ICOs you find a lot of familiar names and faces. Nothing wrong with being an advisor, but when you’re just sending people to the slaughterhouse…
The sad part is that a lot of people will lose a lot of money on this, some of them obviously more than they can afford to lose, that’s how it always goes. The regulators will step in after this bubble pops and what scares me is the fact that it will damage all of crypto, including Bitcoin, not just Ethereum and its ICO’s.
But you’re just an Ethereum hater
I’ve heard all the accusations:
I hate Ethereum because I’m a Bitcoin Maximalist. I’m not, I like other projects too, like Siacoin for example.
I hate Ethereum because I missed out. I did miss out on the crowdsale, but I traded plenty of Ethereum and it’s ICOs and made some nice profit.
I hate Ethereum because I don’t understand it. Really? Do you? The only smart contracts running on it are ICO token sales. Or contracts to buy ICO tokens the second they become available.
I hate Ethereum because I’m jealous of Vitalik. No, it’s impressive what he did at his young age. At the same time I think he’s largely responsible for this bubble and he has made a lot of mistakes. We all make mistakes, but bailing out your friends from the DAO while other hacks and losses aren’t compensated or fixed just shows total lack of integrity. Or it’s everything or it’s nothing. And when it comes to immutability in crypto, it should be nothing.
For the people that are scared that Ethereum will replace Bitcoin
Ethereum is not a store of value. It isn’t capped. Yes, I know they’re planning to switch to PoS (which it already kind of is). Do you think they managed to create the first software implementation ever without any bugs? Doing such a major change on a (currently) $30 billion market is completely irresponsible, borderline insanity. Even if we assume that there are no bugs, what about the miners? The miners who bought their equipment to mine Ethereum, the miners that supported the network for years. “But they knew we were switching to PoS.” Of course they knew, and do you think they’ll just give up on such a profitable coin? Some might switch immediately to Zcash and Ethereum Classic but there will be another fork and we’ll have ETHPoS and ETHPoW, with of course all the Ethereum tokens being on both chains. Even Ethereum developers think that his is a very likely scenario.
Ethereum’s fees are lower. They are, sometimes, by a bit. If you’re trying to send something when no token sale is active obviously, else you have people spending $100’s to get in on the token sale and clog up the network. Also doesn’t apply when you send something from exchanges since for example with Poloniex it’s about $1.9 vs $0.28 for Bitcoin. Oh and another exception is when you actually use it for smart contracts, which require more gas to process than a normal transactions from account A to account B. You know.. the actual reason why Ethereum was created.
Ethereum is not decentralized. Bitcoin isn’t as decentralized as it should be, we all know that, but compared to most other coins, Bitcoin is very decentralized. Vitalik has called himself a benevolent dictator in the past. He is the single point of failure in this project and if he gets compromised in any way that’s the end. There is no way of knowing if this happens and since people blindly follow everything he says, he has the power to do anything. Satoshi was smart enough to remove himself from the Bitcoin project.
Ethereum is not immutable. Don’t have to spend much time on this: see DAO and split that lead to Ethereum and Ethereum Classic.
Ethereum has the Enterprise Ethereum Alliance. But but but.. all those big banks use Ethereum. No, they don’t. They use “an” Ethereum, which is a (private) fork of Ethereum. By that definition 99% of all altcoins are using Bitcoin. Still a separate chain. The fact that we’re talking about a private blockchain here actually makes altcoins more like Bitcoin than “an Ethereum” that EEA uses like Ethereum. You can compare it to 2013–2014 when some companies started to get interested in blockchain vs Bitcoin, only difference here is that for Ethereum it’s part of their marketing campaign to lure in potential investors.
If you think I’m just full of crap, which is fair, I am just some random popular guy on Twitter who has been around from before Ethereum. Have a look at what Vlad has to say about the current state of Ethereum here and here. Vlad Zamfir is probably the smartest guy on the Ethereum team, and I say this while I don’t agree with him on many of his opinions, I do respect him.
Conclusion:
If you’re an actual developer, be realistic and honest with your investors. Do you really ever need more than $5 mill? Finish a MVP first and then do a tokensale, if you really really need to do an ICO. Plenty of rich crypto investors and traders now that would love to be part of your project and who would be happy to just invest for equity. Yes, it will probably be less than what you can get in an ICO, but at least you didn’t sell out and it shows you actually really care about your product/service/…
If you’re a trader or investor, be realistic about the bubble. I know you hear this a 100 times when you’re trading but: don’t invest what you can’t afford to lose. I have some Ethereum, not as a long term investment, but because the price is going up and I need it to invest in tokens which I can quickly flip as soon as they come on the market. That’s just the type of market we’re in. Everyone is making a lot of money, awesome right? What could potentially go wrong.
(The International Reporter, Editor’s Note): Let me remind Bundesbank and all the other banks, that after the 2008 crisis and the ‘too big to fail”criminality that since then has stolen tax payers money globally, that nobody is interested in the banking industry anymore. Along with their compounding interest rates they are seen as liars, cheats, thieves and outright criminals cashing in on the misfortune of others. Digital currencies are far safer…so far… and are the only outlet since these same criminals have been rigging the precious metals prices, currencies exchange rates and the markets in general to their own benefit and to the detriment of everyone else.
* * *
(ZeroHedge) When global financial markets crash, it won’t be just “Trump’s fault” (and perhaps the quants and HFTs who switch from BTFD to STFR ) to keep the heat away from the Fed and central banks for blowing the biggest asset bubble in history: according to the head of the German central bank, Jens Weidmann, another “pre-crash” culprit emerged after he warned that digital currencies such as bitcoin would worsen the next financial crisis.
As theFT reports, speaking in Frankfurt on Wednesday the Bundesbank’s president acknowledged the creation of an official digital currency by a central bank would assure the public that their money was safe. However, he warned that this could come at the expense of private banks’ ability to survive bank runs and financial panics.
As Citigroup’sHans Lorenzen showed yesterday, as a result of the global liquidity glut, which has pushed conventional assets to all time highs, a tangent has been a scramble for “alternatives” and resulted in the creation and dramatic rise of countless digital currencies such as Bitcoin and Ethereum. Citi effectively blamed the central banks for the cryptocoinphenomenon.
Weidmann had a different take, and instead he focused on the consequences of this shift towards digitalisation which the Bundesbank president predicted, would be the main challenge faced by central banks. In an ironic twist, in order to challenge the “unofficial” digital currencies that have propagated in recent years, central banks have also been called on to create distinct official digital currencies, and allow citizens to bypass private sector lenders. As Weidmann explained, this will only make the next crisis worse:
Allowing the public to hold claims on the central bank might make their liquid assets safer, because a central bank cannot become insolvent. This is an feature which will become relevant especially in times of crisis – when there will be a strong incentive for money holders to switch bank deposits into the official digital currency simply at the push of a button. But what might be a boon for savers in search of safety might be a bane for banks, as this makes a bank run potentially even easier.
Essentially, Weidmann warned that digital currencies – whose flow can not be blocked by conventional means – make an instant bank run far more likely, and in creating the conditions for a run on bank deposits lenders would be short of liquidity and struggle to make loans.
“My personal take on this is that central banks should strive to make existing payment systems more efficient and still faster than they already are – instant payment is the buzzword here,” the Bundesbank president said. “I am pretty confident that this will reduce most citizens’ interest in digital currencies.”
Which, considering the all time highs in both Bitcoin and Ethereum, would suggest that citizens faith and confidence in the existing “payment systems”, and thus central banks, are at all time lows.
The curious case of the inverted yield curve in China’s $1.7 trillion bond market is worsening asWSJ notesthat an odd combination of seasonally tight funding conditions and economic pessimism pushed long-dated yields well below returns on one-year bonds, the shortest-dated government debt.
10-Year China bond yields fell to 3.55% overnight as the 1-Year yield rose to 3.61% – the most inverted in history, more so than in June 2013, when an unprecedented cash crunch jolted Chinese markets and nearly brought the nation’s financial system to its knees.
This inversion is being exacerbated by seasonally tight funding conditions.
June is traditionally a tight time for banks because of regulatory checks, and, as Bloomberg reports, this year, lenders are grappling with an official campaign to reduce the level of borrowing as well.
Wholesale funding costs climbed to the most expensive in history, and the 30-day Shanghai Interbank Offered Rate has jumped 51 basis points this month to the highest level in more than two years.
And this demand for liquidity comes as Chinese banks’ excess reserve ratio, a gauge of liquidity in the financial system, fell to 1.65 percent at the end of March, according to data from the China Banking Regulatory Commission. The index measures the money that lenders park at the PBOC above and beyond the mandatory reserve requirement, usually to draw risk-free interest.
“Major banks don’t have much extra funds, as is shown by the excess reserve data,” analysts at China Minsheng Banking Corp.’s research institute wrote in a June 5 note. Lenders have become increasingly reliant on wholesale funding and central bank loans this year, they said.
AsThe Wall Street Journal reports,an inverted yield curve defies common understanding that bonds requiring a longer commitment should compensate investors with a higher return. It usually reflects investor pessimism about a country’s long-term growth and inflation prospects.
“But the curve inversion we are seeing right now is one with Chinese characteristics and it’s different from the previous one in the U.S.,” said Deng Haiqing, chief economist at JZ Securities.
The current anomaly in the Chinese bond market is partly the result of mild inflation and expectations of a slowing economy, Mr. Deng said. “At the same time, short-term interest rates will likely stay elevated because the authorities will keep borrowing costs high so as to facilitate the deleveraging campaign,” he said.
Notably, it appears officials are concerned at the potential for fallout from this crisis situation.
In an article published Saturday, the central bank’s flagship newspaper, Financial News, said that the severe credit crunch four years ago won’t repeat itself this month because the central bank will keep liquidity conditions “not too loose but also not too tight.”
Chinese financial markets tend to be particularly jittery come June due to a seasonal surge of cash demand arising from corporate-tax payments and banks’ need to meet regulatory requirements on capital.
On Sunday, the official Xinhua News Agency ran a similar commentary that sought to stabilize markets expectations. “Don’t panic,” it urged investors.
Sounds like exactly the time to ‘panic’ if your money is in this.
(True Activist)As consumers become more educated on the benefits of marijuana — both recreational and medicinal, it continues to bedecriminalized at an increasing pace. So far, 29 states (and DC) in the United States have legalized cannabis for medicinal use and eight for recreational. With the freedom to cultivate the herb and utilize it in numerous ways, entrepreneurs have started experimenting withcannabisand infusing it into a variety of edibles — such as baked goods, candies, soda and now… wine.
That’s right, cannabis-infused wine (otherwise known as Canna Vine) is finally available for sale in California. According to theLos Angeles Times, the beverage is made from organically grown marijuana and bio-dynamically farmed grapes. Because the product is low in THC — the primary psychoactive compound found withincannabis— it delivers a mellow “body high” without large effects.
The innovative wine was developed by cancer survivor Lisa Molyneux, who owns the dispensary Greenway in Santa Cruz, and Louisa Sawyer Lindquist, who owns Verdad Wines in Santa Maria. Molyneux, particularly, was inspired to invent the wine to aid fellowcancersurvivors.
There’s a reason Canna Vine costs anywhere from $120 to $400 for half a bottle. The process to make the product begins with one pound ofmarijuana. After the weed is wrapped in cheese cloth, it is added to a barrel of wine where it sits for approximately one year to ferment and repose.
Though the concept of cannabis-infused wine is nothing new (in ancient China, it was prescribed for pain relief), the fact that it can be legally procured in the modern age is.
The founders of Canna Vine are presently experimenting with the green wine (literally) to find the best balance ofSativaand Indica. Their ultimate aim is to sell a wine that creates “uplifting and relaxing sensations.”
Said Molyneux,
“What’s nice about it is how subtle it is. There’s a little flush after the first sip, but then the effect is really cheery, and at the end of the night you sleep really well. It really is the best of both worlds; you get delicious wines with medicinal benefits.”
Melissa Etheridge, — a prominent advocate of Canna Vine — credits the beverage with helping her throughchemotherapy. She said,
“When I was in my deepest, darkest, last throes of chemo,” says Etheridge, “I couldn’t smoke or use a vaporizer — and I was never really an edibles eater; I didn’t want to be ‘out of it.’”
“It lands in a really beautiful place,” she added.
What’s the catch?
First of all, the infused wine is only legal to purchase in California. Second, one needs amedical marijuana license to purchase the product.
California is presently the only place one can procure alcohol infused with weed. Even states like Washington, Oregon, and Colorado don’t allow the combination to be produced or sold.
Presently, both Molyneux and Lindquist seek to refine the wine to position themselves in the market of high-qualitycannabis-infused products. Said Lindquist,
“Cannabis wine has been so effective as a stress reliever, as a mood elevator, and as a medicineI have no idea what the market will be like for it, but whatever I make I want to be safe, made from pure ingredients and, hopefully, delicious.”
Dutch banking whistle blower Ronald Bernard is back and this time he’s exposing the entire international banking syndicate which controls not only the global monetary system, but the entire planet itself and all of its resources. The Bank For International Settlements sits atop the pyramid of power, followed by the IMF and World Bank. The power and directives flow downward through the big international banks, the multinational corporations, and finally to the governments. As Bernard explains, “All misery on earth is a business model.”
I have read many articles lately claiming that Bitcoin is in a bubble. Some proclaim it similar to the famous Great Tulip bubble of 1637… but that comparison is only for those who do not understand the significance of what is happening currently with blockchain technology. If you are new to Bitcoin and blockchain technology, I would suggest that it’s highly important for you to take the time to research the basics of how it works and why it’s different – simply Google “how does Bitcoin work.”
The main argument of those who proclaim it to be in a bubble is that the people buying it at these prices are not buying it for its original purpose – which they believe to be enabling transactions. Yes, it is being used for transactions, much more than 100,000 businesses now take Bitcoin for transactions. But instead naysayers believe that others are buying it as an “investment” and thus will surely be burned.
For me, and I believe most who understand what is happening, we are not buying it for either of those reasons. We own it because we see it acting as a “store of value,” where nothing else priced in dollars is. With interest rates artificially low (manipulated by central banks), a normal person cannot earn even near the pace of actual inflation with any type of traditional savings account. Bonds are artificially in a bubble, stocks are artificially in a bubble, real estate is in yet another bubble, everywhere one who understands bubble dynamics looks they see a bubble (but not Bitcoin, people are trading in their worth less and less dollars for them). The bubble is the dollar – the world’s “reserve” and “petro” dollar is being drowned by central banks all over the globe, not just our own “FED.”
And thus there is no store of value to be found. This is a terribly ugly situation for people who believe in hard work and saving to get ahead; to someday retire comfortably. Retirees on fixed incomes simply cannot, and will not be able to keep up as the impossible math of dollar debt continues on its vertical ascent.
We would love to love gold and silver, but those too, are manipulated by central banks who own the majority of it. They manipulate and derivative the markets to artificially keep devaluation of the dollar hidden.
Control of the dollar is centralized with the banks, that’s why we refer to them as “central” banks. All the power and control resides with them; as private individuals were wrongly, and illegally, given the power to “coin” money with the Federal Reserve Act of 1913.
What makes Bitcoin a better store of value?
1. It is decentralized. This is huge! It means that it is not under the control of central banks, and thus cannot be manipulated directly by them. This is THE MOST IMPORTANT aspect, it is a game changer as it changes the WHO is behind it – something that gold and silver do not do because central banks have printed “money” to buy the majority of it.
Caution – Central banks may be able to indirectly manipulate blockchain currencies in the future if they create ETFs and other derivatives based upon them. This, however, will not change the underlying store of value, and when it happens I would encourage you not to own the derivative, but to instead buy Bitcoin directly, again because it’s not in control of the central banks, is decentralized versus their centralized everything which makes them vulnerable. Yes – Central Banks can print dollars and use them to buy Bitcoin, but that will only drive the price up and cause others to enter as well. In the end they cannot manipulate what they don’t control.
Even if central banks were to “ban” exchanges in one country, all one will have to do is join an exchange overseas. This has the central banks trumped, it cannot be stopped.
To better understand the power of decentralization, please take the time to watch the video at the end of this post, or (click on this link).
2. Unlike tulips, dollars, or even precious metals, Bitcoin is strictly limited in its supply. This is where the math comes in. Bitcoin was founded in 2008 and there will ultimately be only 21 million Bitcoin ever mined. Today we are approaching the 80% mark, the remaining 20% will take years to mine, and the “mining” gets more difficult and slow as we go.
This is a hard feature built into the coding. It’s what makes Bitcoin a store of value – the more money that comes in, the more each Bitcoin is worth. As I type, that is $2,774.00 per Bitcoin according to Coinbase where you can go to open an account, much like a brokerage account (there are currently 7.3 million Coinbase users). Of course you can buy Bitcoin in any increment, you don’t have to buy them in whole units.
People all over the world can buy, own, and transact in Bitcoin. There are now 7.3 billion people on the planet, so if all 21 million Bitcoin were distributed evenly to every person on the planet, each person would have only .0028767 of one bitcoin!
Another way of stating that math is that only 1 person out of every 347.6 people can possibly ever own a whole Bitcoin.
Today the market cap of Bitcoin is $45.17 Billion. The more money that comes in, the higher the market cap, the higher the price of Bitcoin.
Many analysts start to compare Bitcoin’s market cap with that of large companies like Apple, whose current market cap is 18 times that of Bitcoin’s at $810 Billion.
But here’s the deal. Bitcoin is not a company, it is a form of money. Unlike dollars, there will not be an endless supply. In fact, if you took the entire M2 money supply of the United States, currently $13.5 trillion, and put it all into Bitcoin instead, then each Bitcoin would be worth $642,857. But Bitcoin is not just traded in dollars – it’s traded in every currency in the world. And right now global M2 money supply is calculated as roughly $72 trillion, or $3.4 million per Bitcoin.
It’s true that other blockchain currencies are springing up like daisies, or tulips. But their market caps combined are just now rivaling that of Bitcoin’s. So, yes, they will be “diluting” bitcoin’s math. Not all crypto currencies have hard limits to their supply, and that will mean that they will always be worth less. Right now Ethereum is in second place with a market cap of about $24 billion compared to Bitcoin’s $45 billion. Litecoin is another cryptocurrency designed to be “silver” compared to Bitcoin’s “gold.” There will only be 84 million Litecoins ever mined, exactly 4 times the amount of Bitcoins. However, Litecoins are currently trading for roughly 1/100th the price of Bitcoin, I would expect the math to eventually catch up as more people become aware of Litecoin’s also limited supply.
3. Bitcoin is a better store of value because it is secure. Decentralization and encryption make it secure. It can be stored in electronic cyber “vaults” where you keep a hard copy of the encryption cypher. This means that your exchange can be hacked, your computer hacked, but your bitcoin don’t actually reside in either! They reside on someone else’s computer somewhere – and only you have the code to get to it. Thus they cannot be confiscated by a government, a banker, or a hacker.
I liken this to the pursuit of freedom versus the pursuit of security. When you pursue freedom, you get security at very little cost. That’s what decentralization does. Bitcoin is the pursuit of freedom – whereas centralized systems, such as central banking, or even socialism, are the pursuit of security and the abandonment of freedom.
Pursue freedom!
4. Bitcoin transactions are stored on a public ledger, all confirmed transactions are included in the blockchain. Again, decentralized bookkeeping is less vulnerable and more secure than centralized legers. This is where Ethereum, another blockchain currency, shines. Ethereum is built upon an encrypted ledger and can be used for many purposes, not just as a currency.
One use is that these encrypted ledgers will enable safe and secure online voting one day soon.
Someday Bitcoin will, in fact, be in a bubble. But that day is not now, not even close. The great thing about all cryptocurrencies is that they can and do exist alongside of whatever “money” we use for our transactions. They also exist alongside of gold/silver, and may in fact be drawing money that otherwise would be seeking a store of value there.
So I say, let competition reign! I will use dollars for transactions because I have to (for now), but I will use cryptocurrencies, gold, and silver to park my dollars so that the central banks cannot destroy their value. And that in a nutshell is why Bitcoin is NOT in a bubble, and won’t be for quite some time.
That said, do expect many sharp pullbacks along the way. Remember that NOTHING moves in a straight line, EVERYTHING moves in waves. You need to pullback to fuel the next push higher – this is true with all waves. The chart shape is definitely showing parabolic growth, but I expect that when looked at across many more years this will simply be a part of building a base.
So how will we know that a true bubble has formed? For me I know that cryptocurrencies are the future and that they will trade alongside sovereign currencies and will eventually replace them. I will NOT own any cryptocurrency created or “managed” by a bank. Until the market cap of Bitcoin rivals that of the United States, I will not be convinced that growth has stalled. There are, of course, other signs we can look for.
As a review, here are HYMAN MINSKY’S SEVEN BUBBLE STAGES:
The late Hyman Minsky, Ph.D., was a famous economist who taught for Washington University’s Economics department for more than 25 years prior to his death in 1996. He studied recurring instability of markets and developed the idea that there are seven stages in any economic bubble:
Stage One – Disturbance:
Every financial bubble begins with a disturbance. It could be the invention of a new technology, such as the Internet (Bitcoin). It may be a shift in laws or economic policy. The creation of ERISA or unexpected reductions of interest rates are examples. No matter what the cause, the outlook changes for one sector of the economy.
Stage Two – Expansion/Prices Start to Increase:
Following the disturbance, prices in that sector start to rise. Initially, the increase is barely noticed. Usually, these higher prices reflect some underlying improvement in fundamentals. As the price increases gain momentum, more people start to notice.
*I THINK THIS IS WHERE BITCOIN IS NOW
Stage Three – Euphoria/Easy Credit:
Increasing prices do not, by themselves, create a bubble. Every financial bubble needs fuel; cheap and easy credit is, in most cases, that fuel (central banks creating it still like mad). Without it, there can’t be speculation. Without it, the consequences of the disturbance die down and the sector returns to a normal state within the bounds of “historical” ratios or measurements. When a bubble starts, that sector is inundated by outsiders; people who normally would not be there (not yet with Bitcoin). Without cheap and easy credit, the outsiders can’t participate.
The rise in cheap and easy credit is often associated with financial innovation. Many times, a new way of financing is developed that does not reflect the risk involved. In 1929, stock prices were propelled into the stratosphere with the ability to trade via a margin account. Housing prices today skyrocketed as interest-only, variable rate, and reverse amortization mortgages emerged as a viable means for financing overpriced real estate purchases. The latest financing strategy is 40, or even 50 year mortgages.
Stage Four – Over-trading/Prices Reach a Peak:
As the effects of cheap and easy credit digs deeper, the market begins to accelerate. Overtrading lifts up volumes and spot shortages emerge. Prices start to zoom, and easy profits are made. This brings in more outsiders, and prices run out of control. This is the point that amateurs, the foolish, the greedy, and the desperate enter the market. Just as a fire is fed by more fuel, a financial bubble needs cheap and easy credit and more outsiders.
(I believe stage 4 is still in the distant future for Bitcoin)
Stage Five – Market Reversal/Insider Profit Taking:
Some wise voices will stand up and say that the bubble can no longer continue. They argue that long run fundamentals, the ratios and measurements, defy sound economic practices. In the bubble, these arguments disappear within one over-riding fact – the price is still rising. The voices of the wise are ignored by the greedy who justify the now insane prices with the euphoric claim that the world has fundamentally changed and this new world means higher prices. Then along comes the cruelest lie of them all, “There will most likely be a ‘soft’ landing!”
This stage can be cruel, as the very people who shouldn’t be buying are. They are the ones who will be hurt the most. The true professionals have found their ‘greater fool’ and are well on their way to the next ‘hot’ sector. Those who did not enter the market are caught in a dilemma. They know that they have missed the beginning of the bubble. They are bombarded daily with stories of easy riches and friends who are amassing great wealth. The strong will not enter at stage five and reconcile themselves to the missed opportunity. The ‘fool’ may even realize that prices can’t keep rising forever… however, they just can’t act on their knowledge. Everything appears safe as long as they quit at least one day before the bubble bursts. The weak provide the final fuel for the fire and eventually get burned late in stage six or seven.
Stage Six – Financial Crisis/Panic:
A bubble requires many people who believe in a bright future, and so long as the euphoria continues, the bubble is sustained. Just as the euphoria takes hold of the outsiders, the insiders remember what’s real. They lose their faith and begin to sneak out the exit. They understand their segment, and they recognize that it has all gone too far. The savvy are long gone, while those who understand the possible outcome begin to slowly cash out. Typically, the insiders try to sneak away unnoticed, and sometimes they get away without notice. Whether the outsiders see the insiders leave or not, insider profit taking signals the beginning of the end.
(This is where I believe Stocks, Bonds, Real Estate, Auto prices, Student loans, etc. are today; although it is wise to remember that the best performing markets in terms of percentage rise are the ones where hyperinflation is occurring – Zimbabwe, Nigeria, and today Venezuela. An interesting thought is that we may see cryptocurrencies appear to be inflating while real assets move to another round of deflation – dollars seek safety/store of value)
Stage seven – Revulsion/Lender of Last Resort:
Sometimes, panic of the insiders infects the outsiders. Other times, it is the end of cheap and easy credit or some unanticipated piece of news. But whatever it is, euphoria is replaced with revulsion. The building is on fire and everyone starts to run for the door. Outsiders start to sell, but there are no buyers. Panic sets in, prices start to tumble downwards, credit dries up, and losses start to accumulate.
(When this happens to stocks, I expect Bitcoin and other cryptos to benefit).
Do you have any specific investment picks for the second half?
I don’t. Investors should tighten risk-management strategies to their portfolios. I expect the FANG stocks and the Nasdaq to have a big selloff. They could easily fall 30% or 40%. But I don’t want to end my Roundtable career on a bearish note. [Zulauf announced at the January Roundtable that he is “retiring” from the panel after this year.]
Once the bear market is over and the recession or economic crisis passes, stocks will go up again.
FANG Stocks just took out Friday’s flash-crash lows…
FANG Stocks: Coined by CNBC business pundit Jim Cramer, the term refers to four publicly-traded tech giants Facebook Inc. (FB), Amazon.com Inc. (AMZN), Netflix Inc. (NFLX), and Google (GOOGL), which is now Alphabet Inc. All four of the companies are online or tech-centric, command massive market shares in their respective industries and are valued and traded at very high prices.
As if things weren’t bad enough for America’s mall owners, what with the having to filling their retail space withhigh schools, grocers and churches, it seems that retailers have grown so uncertain about the future of these 1980s relics that they’re only willing to sign 1-2 year leases these days.
AsBloomberg points out this morning, leases renewals used to be 5-10 years in length but are increasingly only being signed with 1-2 year terms. Meanwhile, thousands of stores are closing each year and it’s only expected to get worse over time.
After more than a dozen bankruptcies this year contributed to thousands of store closures, visibility for the industry is so poor that retailers are pushing for lease renewals as short as a year or two — down from five to 10 years.
“You’re certainly seeing the renewals geared toward the shorter term, rather than the five-year renewal,” said Andrew Graiser, head of A&G Realty Partners. Retailers are now struggling to figure out how many stores they actually need, he added, and landlords are looking at them “with a much closer eye than they did before.”
Somewhere between 9,000 and 10,000 stores will close in the U.S. this year, said Garrick Brown, vice president of Americas retail research for commercial broker Cushman & Wakefield — more than twice as many as the 4,000 last year. He sees this figure rising to about 13,000 next year.
“Everyone’s trying to figure out where the bottom of the market’s going to be,” Brown said. He estimates it could occur in 2018 or early 2019.
Not surprisingly, retailers are finding it difficult to sign long-term leases in an environment where 26% of malls around the country are expected to close their doors over the next five years.
Further complicating the lease-length dilemma is the question of which shopping centers will still be around in a decade. Cushman & Wakefield’s Brown sees about 300 of 1,150 U.S. malls shutting down in the next five years.
Perry Mandarino, senior managing director and head of corporate finance at B. Riley & Co., predicts that retail bankruptcies and restructurings will further accelerate in 2018. Some of this will be the result of a long-overdue shakeout of the surfeit of U.S. store space, but the downturn is also compounded by shifts to online shopping and consumers spending on experiences rather than physical stuff, he said.
Meanwhile, landlords are trying to fight back, though it’s a fairly difficult task both arms tied behind their backs.
Landlords “have their backs against the wall, so they’ve been fighting back, hard,” he said. “What you have is a game of chicken up to the end.”
“With all this excess inventory, landlords are trying to do whatever they can to keep malls occupied,” Agran said. “The more empty spaces, the more difficult it is to attract new tenants.”
Frankly, it’s shocking that Abercrombie wouldn’t jump at the opportunity to scoop up some prime square footage in this mall…it already has the Chili’s awning and everything.
One month ago, when observing the record low vol coupled with record high stock prices,we reported a stunning statistic: central banks have bought $1 trillion of financial assets just in the first four months of 2017, which amounts to $3.6 trillion annualized, “the largest CB buying on record” according to Bank of America. Today BofA’s Michael Hartnett provides an update on this number: he writes that central bank balance sheets have now grown to a record $15.1 trillion, up from $14.6 trillion in late April, and says that “central banks have bought a record $1.5 trillion in assets YTD.”
The latest data means that contrary to previous calculations, central banks are now injecting a record $300 billion in liquidity per month, above the $200 billion which Deutsche Bank recently warned is a “red-line” indicator for risk assets.
This, as we said last month, is why “nothing else matters” in a market addicted to what is now record central bank generosity.
What is ironic is that this unprecedented central bank buying spree comes as a time when the global economy is supposedly in a “coordinated recovery” and when the Fed, and more recently, the ECB and BOJ have been warning about tighter monetary conditions, raising rates and tapering QE.
To this, Hartnett responds that “Fed hikes next week & “rhetorical tightening” by ECB & BoJ beginning, but we fear too late to prevent Icarus” by which he means that no matter what central banks do, a final blow-off top in the stock market is imminent.
He is probably correct, especially when looking at the “big 5” tech stocks, whose performance has an uncanny correlation with the size of the consolidated central bank balance sheet.
America’sbiggest as of 2016 generation, the Millennials, has a heavy burden on itscollective 150 million shoulders: its task is to not only step in as a buyer of stocks once the baby boomers begin selling in bulk, but to also provide the much needed support pillar for the recovery of the US housing market. In fact, there have been countless “bullish” housing market theories built upon the premise that sooner or later tens of millions of young American adults will emerge from their parents’ basements, start a household, and buy a house.
So far that theory has not been validated. One simple reason is that Millennials simply can’t afford to buy a house. As we reported last week, a study from Apartment List showed that nearly 70% of young American adults, those aged 18 to 34 years old, said they have saved less than $1,000 for a down payment. This is similar to what a recentGoBanking Survey found last year, according to which 72% of “young millennials”- those between 18 and 24 years old – had $1,000 in their savings accounts and 31% have $0; a sliver (8%) have over $10,000 saved. Of the “older millennials”, those between 25 and 34, 67% had less than $1,000 in their savings accounts, 33% have nothing at all, and 15% had over $10,000.
So does that mean that Millennials can simply be written off as a potential generation of homeowners, and if so, what are the implications for the broader housing market?
That’s the question BofA economist Michelle Meyer asked on Friday, although she phrased it in the proper context: “Is it [still] cool to buy a home.“
To our surprise, Meyer found that while the home ownership rate among young adults has plunged to a record low, helping to explain the slow recovery in single family home building, and confirming empirical observations that Millennials have largely been a ‘renter’ generation, by Bank of America’s calculations, the Millennial generation can afford to buy a home – at least in terms of making the monthly payments. While we – and many others would dispute that – BofA does make some other interesting observations, namely that lifestyle changes, including delayed marriage and child rearing, have led to fewer homeowners and a tendency to live close to city centers. Well, if it’s not money it’s clearly something else. Let’s dig in.
First, here is BofA on a rather trivial, if critical topic: “the importance of the youth”
In order to understand the future of the housing stock, it helps to get a grasp on the growth in population, which is a function of immigration and the rate of births/deaths. The Census Bureau is projecting population growth of 0.8% annually over the next decade and 0.7%, on average, through 2036, showing continued slowing from the 0.9% average last decade. Perhaps even more important, however, is the age composition, with a particular focus on young adults who are the drivers of household formation. There are currently 75 million individuals considered to be Millennials, making up the largest generation. The average age is 27.5, implying that there is a large cohort of young adults coming to age (Chart 1). In theory, this should underpin growth in home ownership. But, it is complicated – we have to understand the ability of Millennials to afford housing and the desire to become homeowners vs. renters.
Can they afford to buy?
The first question to ask is whether the younger generation can afford to buy a home. We turn to the National Association of Realtors (NAR) affordability index which is a ratio between median family income and the qualifying income for a mortgage as a function of median existing single-family home prices and mortgage rates. According to this measure, homeownership is still very affordable relative to history. What about for young adults? Following the NAR’s methodology, we compute an affordability measure for the 25-34 year old age cohort using median household income data from the Census Bureau. Our computed index only goes to 2015 given data limitations, but we extrapolate forward (Chart 2). We find that housing is still affordable for young adults, although not to the extent it is for the overall population. The gap in affordability between the overall population and young adults has widened over the years. That said, the affordability index for young adults is still above the historical average for the aggregate, implying that housing is generally affordable.
So what seems to be the problem? One obstacle is being able to make the downpayment. The NAR measure assumes a 20% down payment, which is a high hurdle for young adults– remember that the bulk of the current 25-34 year old cohort started their careers during the financial crisis and early stages of the recovery, when the economy and labor market were fragile. Plugging in a lower down payment of 10% and the situation looks worse due to increased principal and interest payments.With a 10% downpayment, the index would be at 125.2 in 2015, which is 11% lower than the standard 25-34 year old index and 25% lower than the broad NAR index.
Another challenge is the ability to take on a mortgage loan given high student debt. According to the NY Fed’s credit panel, total outstanding student debt has reached $1.3 trillion, a substantial increase from the $260bn level in 2004. According to the NAR’s Generational Report, nearly 50% of homebuyers under the age of 36 noted that student debt delayed their home purchase, making it harder to afford the downpayment. And, of course, there is the challenge from tighter credit standards which has made it more difficult to achieve homeownership.
But do they want to buy?
Addressing whether Millennials can afford to buy is only one part of the story. We need to understand if they actually want to buy. The homeownership rate has tumbled at a faster rate for 25-34 year olds than for other generations which we do not think can be explained by affordability metrics (Chart 3). We think it also owes to lifestyle changes. Maybe there is something to the stories about Millennials preferring to spend money on avocado toast instead of their home?
The shopping cart of young adults
Using data from the Consumer Expenditure Survey, we can look at the evolution of the consumer basket over time for those aged 24-35 (Table 1). Relative to the peak of the housing bubble in 2004, there has been a decline in the share of dollars spent on owned shelter and an increase in spending on renting. It also seems that this age group is spending more on healthcare and household operations, which include services paid to keep their household running efficiently (think cleaning). This has come at the expense of spending on apparel, transportation and groceries. The young adult in 2004 has a difference shopping cart than one today.
The single life
The change in spending patterns could reflect the fact that young adults are not only less likely to be homeowners, but they are less likely to be married or even live independently. Instead, this age group is living with parents or other relatives more than in the past (Chart 4). This adjustment in living arrangements has been ongoing for years but the Great Recession seemed to have speed up the trend. Today only 55% of those aged 25-34 live with a spouse/partner compared to over 80% in 1967. Life events such as getting married or having children are typical triggers to buying a home. The longer this age group lives with parents or independently, the more home ownership will be delayed.
City slickers
We have also seen a shift toward urban centers and away from rural areas over the years. This goes hand-in-hand with a decline in home ownership for young adults. Interestingly the share of young adults living in the suburbs has been fairly steady at around 41% (Chart 5). Moreover, it appears that there is a flocking toward the major cities, specifically in the city centers which are close to transit, workplaces and restaurants. City centers typically have more rental properties than the suburbs. But we also see greater home sales close to city centers than in the past. According to BuildZoom, new home sales within 5 miles of the centers of the 10 most densely cities have exceeded 2000 levels but if you go another 10 miles out, sales are about 50% below 2000 levels.
There are both cyclical and secular forces behind the drop in the home ownership rate for young adults. While young adults can generally afford housing, there are other constraints including the ability to make a large enough down payment and tighter credit standards. Lifestyle changes are partly to blame.
BofA’ troubling conclusion: “These dynamics won’t change in the medium-term which should translate to a lower equilibrium pace for single family housing starts.”
Bitcoin’s 150% surge since the beginning of the year has caught the attention of “Mrs. Watanabe,” the metaphorical Japanese housewife investor, and a legion of South Korean retirees who’re hoping to escape rock-bottom interest rates by investing in cryptocurrencies,according to Reuters.
Retail investors in Asia, many of whom are already regular investors in stock and futures markets, are turning to bitcoin in droves. Trading volume on Asia-based exchanges exploded following a Japanese law that officially designated bitcoin as legal currency. And now thatthe largest Chinese exchanges have reinstated customer withdrawals,the bitcoin market in China will likely stabilize, and the price will likely rise as a result.
Bitcoin was recently trading in South Korea ata $400 premium to its value on US-based exchanges,in part due to tough money-laundering rules that make it difficult to move bitcoin in and out of those markets, Reuters reports.
One of the retail traders interviewedby Reuterssaid she started with bitcoin because she’s worried she won’t be able to rely on her pension.
“After I first heard about the bitcoin scheme, I was so excited I couldn’t sleep. It’s like buying a dream,” said Mutsuko Higo, a 55-year-old Japanese social insurance and labor consultant who bought around 200,000 yen ($1800) worth of bitcoin in March to supplement her retirement savings.”
“Everyone says we can’t rely on Japanese pensions anymore,” she said. “This worries me, so I started bitcoins.”
Another trader noted that most South Korean buyers see bitcoin as an investment; few plan to use it for payments purposes.
The risks for these traders are high,Reuters says,alluding to the collapse of Mt. Gox, which led to hundreds of millions of dollars in losses for its customers.
The digital currency is largely unregulated in Asia. In Hong Kong, exchanges operate with a money-changer’s license, while in South Korea they are regulated like online shopping malls,Reuters says.
There’s also a burgeoning cottage industry of seminars, social media and blogs all designed to promote bitcoin or bitcoin-like schemes. The cryptocurrency world is rife with scams, and pyramid schemes are becoming increasingly common.
Police in South Korea last month uncovered a $55 million cryptocurrency pyramid scheme that sucked in thousands of homemakers, workers and self-employed businessmen seduced by slick marketing and promises of wealth, Reuters reported.
Seminars in Tokyo, Seoul and Hong Kong promote schemes that require investors to pay an upfront membership fee of as much as $9,000,according to Reuters.Investors in these scams are encouraged to promote the cryptocurrency and bring in new members in return for some bitcoins and other benefits.
One Tokyo scheme offered members-only shopping websites that accept bitcoin, 24-hour car assistance and computer problems, and bitcoin-based gifts when a member gets married, has a baby – or even dies, according to marketing materials seenby Reuters.
Leonhard Weese, president of the Bitcoin Association of Hong Kong and a bitcoin investor, warned amateur investors against speculating in the digital currency.
“Trading carries huge risk: there is no investor protection and plenty of market manipulation and insider trading. Some of the exchanges cannot be trusted in my opinion.”
Regulators in China have already cracked down on money laundering at local exchanges. South Korea’s Financial Services Commission has set up a task force to explore regulating cryptocurrencies, but it has not set a timeline for publishing its conclusions,Reuters reported.
And Japan’s Financial Services Agency (FSA) supervises bitcoin exchanges, but not traders or investors.
“The government is not guaranteeing the value of cryptocurrencies. We are asking for bitcoin exchanges to fully explain the risk of sharp price moves,” an FSA official told Reuters.
Bitcoin was trading $2,529 on Coinbase Sunday, while it traded at $2,593 on Bitflyer, one of the largest Japanese exchanges.
One Japanese finance blogger said his most popular article has been an explanation of bitcoin. Readership of the article doubled last month when bitcoin was on its record run.
Rachel Poole, a Hong Kong-based kindergarten teacher, said she read about bitcoin in the press, and bought five bitcoins in March for around HK$40,000 ($5,100) after studying blogs on the topic. She kept four as an investment and has made HK$12,000 tax-free trading the fifth after classes.
“I wish I’d done it earlier,” she said.
Clif High – Crypto Currencies Break Loose, then Gold & Silver (video)
Where does Internet data mining expert Clif High see Bitcoin going in the hyperinflation we are heading into? Clif High says, “I’ve got what you call a strike point, a numeric value our data sets are aiming at that shows Bitcoin should be about $13,800 sometime in early February of 2018. That will basically be a fivefold increase at what we are at now. . . . I always thought cryptos would have to break out first in order to upset . . . the structure of the central banks so silver and gold could break loose. I suspect silver will break loose. The rocket shot on that will be staggering, but bear in mind I am the Internet’s worst silver forecaster. I have had silver at $600 per ounce in our data since 2003. If that occurs, look at how shocking and rapid that rise is going to be.”
High goes on to say, “Gold and silver are the most undervalued assets on the planet.” . . . And he predicts “by early February, gold will be at $4,800 per ounce and silver will be around $600 per ounce.”
High also says, “The Fed can’t kill crypto currencies . . . The elites are fearful because they can’t control crypto currencies, and they can’t suppress them. There will be no more source of free printed money for bribing people. . . . When the dollar dies, the corruption and crime will be revealed.”
Join Greg Hunter as he goes One-on-One with Internet data mining expert Clif High of HalfPastHuman.com.
The wild card in cryptocurrencies is the role of Big Institutional Money.
Charles Huge Smith has taken the liberty of preparing a projection of bitcoin’s price action going forward:
You see the primary dynamic is continued skepticism from the mainstream, which owns essentially no cryptocurrency and conventionally views bitcoin and its peers as fads, scams and bubbles that will soon pop as price crashes back to near-zero.
Skepticism is always a wise default position to start one’s inquiry, but if no knowledge is being acquired, skepticism quickly morphs into stubborn ignorance.
Bitcoin et al. are not the equivalent of Beanie Babies. Cryptocurrencies have utility value. They facilitate international payments for goods and services.
The primary cryptocurrencies are not a scam. Advertising a flawless Beanie Baby and shipping a defective Beanie Baby is a scam. Advertising a mortgage-backed security as low-risk and delivering a guaranteed-to-default stew of toxic mortgages is a scam.
The primary cryptocurrencies (bitcoin, Ethereum and Dash) have transparent rules for emitting currency. The core characteristic of a scam is the asymmetry between what the seller knows (the product is garbage) and what the buyer knows (garsh, this mortgage-backed security is low-risk–look at the rating).
Both buyers and sellers of primary cryptocurrencies are in a WYSIWYG market: what you see is what you get. While a Beanie Baby scam might use cryptocurrencies as a means of exchange, this doesn’t make primary cryptocurrencies a scam, any more than using dollars to transact a scam makes the dollar itself a scam.
Bubbles occur when everyone and their sister is trading/buying into a “hot” market. Bubbles pop when the pool of greater fools willing and able to pay nose-bleed valuations runs dry. In other words, when everyone with the desire and means to buy in and has already bought in, there’s nobody left to buy in at a higher price (except for central banks, of course).
At that point, normal selling quickly pushes prices off the cliff as there is no longer a bid from buyers, only frantic sellers trying to cash in their winnings at the gambling hall.
While a few of my global correspondents own/use the primary cryptocurrencies, and a few speculate in the pool of hundreds of lesser cryptocurrencies, I know of only one friend/ relative /colleague / neighbor who owns cryptocurrency.
When only one of your circle of acquaintances, colleagues, friends, neighbors and extended family own an asset, there is no way that asset can be in a bubble, as the pool of potential buyers is thousands of times larger than the pool of present owners.
The Network Effect is expressed mathematically inMetcalfe’s Law:the value of a communications network is proportional to the square of the number of connected devices/users of the system.
The Network Effect cannot be fully captured by Metcalfe’s Law, as the value of the network rises with the number of users in communication with others and with the synergies created by networks of users within the larger network, for example, ecosystems of suppliers and customers.
In other words, the Network Effect is not simply the value created by connected users; more importantly, it is the value created by the information and knowledge shared by users in sub-networks and in the entire network.
This is The Smith Corollary to Metcalfe’s Law: the value of the network is created not just by the number of connected devices/users but by the value of the information and knowledge shared by users in sub-networks and in the entire network.
In the context of the primary cryptocurrencies, the network effect (and The Smith Corollary to Metcalfe’s Law) is one core driver of valuation: the more individuals and organizations that start using cryptocurrencies, the higher the utility value and financial value of those networks (cryptocurrencies).
In other words, cryptocurrencies are not just stores of value and means of exchange–they are networks.
The true potential value of cryptocurrencies will not become visible until the global economy experiences a catastrophic collapse of debt and/or a major fiat currency. These events are already baked into the future, in my view; nothing can possibly alter the eventual collapse of the current debt/credit bubble and the fiat currencies that are being issued to inflate those bubbles.
The skeptics will continue declaring bitcoin a bubble that’s bound to pop at $3,000, $5,000, $10,000 and beyond. When the skeptics fall silent, the potential for a bubble will be in place.
When all the former skeptics start buying in at any price, just to preserve what’s left of their fast-melting purchasing power in other currencies, then we might see the beginning stages of a real bubble.
The wild card in cryptocurrencies is the role of Big Institutional Money. When hedge funds, insurance companies, corporations, investment banks, sovereign wealth funds etc. start adding bitcoin et al. as core institutional holdings, the price may well surprise all but the most giddy prognosticators.
The Network Effect can become geometric/exponential very quickly. It’s something to ponder while researching the subject with a healthy skepticism.
Back on February 27, when bitcoin was trading in the mid-teens, we wrote “Step aside bitcoin, there is a new blockchain kid in town.”
In recent days, the world’s second most popular digital currency, Ethereum, has been surging (despite its embarrassing hack last June when some $59 million worth of “ethers” were stolen forcing the blockchain to implement a hard fork to undo the damage), prompting many to wonder if some big announcement was imminent. It appears that yet again someone “leaked” because on Monday, an alliance of some of the world’s most advanced financial and tech companies including JPMorgan Chase, Microsoft, Intel and more than two dozen other companies teamed up to develop standards and technology to make it easier for enterprises to use blockchain code Ethereum – not bitcoin – in the latest push by large firms to move toward the holy grail of a post-central bank world in which every transaction is duly tracked: a distributed ledger systems.
Commenting on the sharp – for the time – rise in ETH price (which hadmoved from $13 to $15), we said “the move may be just the beginning if most corporations adopt Ethereum as the distributed ledger standard: Accenture released a report last month arguing that blockchain technology could save the 10 largest banks $8 billion to $12 billion a year in infrastructure costs — or 30 percent of their total costs in that area.” Since then most corporations have indeed adopted Ethereum as the distributed ledger standard.
* * *
Three months later, and with Ethereum 15x higher at $230,Bloomberg today writes: “Step aside, bitcoin. There’s another digital token in town that’s winning over the hearts and wallets of cryptocurrency enthusiasts across the globe.”
It’s not just the lede that is familiar, it’s everything else too, especially the forecast.
The value of ether – the digital currency linked to the ethereum blockchain – could surpass that of bitcoin by the end of 2018, according to Olaf Carlson-Wee, chief executive officer of cryptocurrency hedge fund Polychain Capital who was interviewed by Bloomberg.
“What we’ve seen in ethereum is a much richer, organic developer ecosystem develop very, very quickly, which is what has driven ethereum’s price growth, which has actually been much more aggressive than bitcoin,” said Carlson-Wee, in an interview on Bloomberg Television Tuesday.
As wepreviously reported, while Ethereum suffered an embarrassing hack last summer resulting in the theft in millions of ether, the cryptocurrency has drawn the interest of industries from finance to health care because its blockchain does far more than let bitcoin users send value from one person to another. “Its advocates think it could be a universally accessible machine for running businesses, as the technology allows people to do more complex actions in a shared and decentralized manner.“
Which is why ethereum is gaining increasingly more converts. Carlson-Wee wasn’t the first to forecast a bright future for ethereum. Fred Wilson, co-founder and managing partner at Union Square Ventures, laid out an even more ambitious timeline for the cryptocurrency in an interview earlier this month.
“The market cap of ethereum will bypass the market cap of bitcoin by the end of the year,” said Wilson, who is also chairman of the board at Etsy.
In fact, if one looks at the relative market share of various cryptocurrencues, and extrapolates current trends, ethereum could surpass bitcoin in just a few months.
Bitcoin currently dominates a little less than half of the digital currency market, down from almost 90 percent three months ago, according to Coinmarketcap.com data. Meanwhile, ethereum has quadrupled its share, which now represents more than a quarter of the pie.
Indicatively, as of this moment, the market cap of Bitcoin is $37 billion, 75% higher than Ethereum. If the optimsitic forecasts are accurate, Ethereum, which is currently offered at $230, will cost roughly $400 next time we look at it, if not more. What is more interesting is that while bitcoin hit an all time high of approximately $2900 one week ago, it has failed to recapture the highs, even as ethereum has continued surging ever higher, perhaps a sign of a broad momentum shift from the legacy “cryptocoin” to the “up and comer.”
“We’re absolutely still in the infrastructure building phase,” Carlson-Wee said. “But I do think within one to two years, we’ll start to see the first viral applications that are user facing.”
In any case, for readers interested in putting money into either extremely volatile crypto, be prepared, in fact assume, a complete loss of your investment as chasing such speculative manias rarely has a happy ending. Then again, trying to time the peak of any bubble is a fool’s endeavor. Just look at the S&P.
Bitcoin’s growth has started to catch up to its fundamentals, which is likely what has been driving its astronomical gain as of late, he said. Others have attributed the surge to speculation, as well as increased interest in Asia and adoption by established companies.
Impressive performance aside, more than $150 has been knocked off bitcoin’s price since late last week amid concerns about transaction speed, safety and a possible price bubble.
The pending home sales index, an estimate of existing home sales, has accurately provided the direction of the monthly home resale reports.
The survey is down for the second month, providing further evidence of a housing slowdown.
TheEconodayconsensus estimate was for the index to rise 0.5%. Instead, the pending home sales index declined 1.3%.
“Spring sales data have not been favorable for the housing sector. Pending home sales are down for a second straight month, 1.3 percent lower in April to an index of 109.8 which is 3.3 percent below this time last year. This index tracks contract signings for resales and the results point to weakness for final sales in May and June. Final resales contracted in April as did new home sales while the month’s housing starts were also weak. Spring is the big season for housing and these are not the results of a sector that will be leading the 2017 economy.”
Pending home sales had been expected to rise slightly in April after declining 0.8 percent in March. Instead, the National Association of Realtors’® (NAR’s) Pending Home Sale Index (PHSI) slumped for the second straight month, dropping 1.3 percent. The PHSI, based on contracts signed for existing home purchases, fell from 111.3 (revised from 111.4) in March to 109.8.
The April dip put the Index 3.3 percent below its level in April 2016. This was the first year-over-year decline since last December and the largest since the Index fell 7.1 percent in June 2014.
Lawrence Yun, NAR chief economist, said the fading contract activity in the normally active spring market is due to significantly weak supply levels. These, in turn, are spurring deteriorating affordability conditions. “Much of the country for the second straight month saw a pullback in pending sales as the rate of new listings continues to lag the quicker pace of homes coming off the market,” he said. “Realtors are indicating that foot traffic is higher than a year ago, but it’s obviously not translating to more sales.”
Yun added, “Prospective buyers are feeling the double whammy this spring of inventory that’s down 9.0 percent from a year ago and price appreciation that’s much faster than any rise they’ve likely seen in their income.”
The economist sees little evidence that the record low levels of inventory will improve anytime soon. Homebuilding activity remains below the necessary levels and too few homeowners are listing their home for sale.
“The unloading of single-family homes purchased by real estate investors during the downturn for rental purposes would also go a long way in helping relieve these inventory shortages,” said Yun. “To date, there are no indications investors are ready to sell. However, they should be mindful of the fact that rental demand will soften as the overall population of young adults starts to shrink in roughly five years.”
NAR expects that existing home sales will increase about 3.5 percent from 2016 to 5.64 million units and the national median existing-home price is expected to increase around 5 percent. In 2016, existing sales increased 3.8 percent and prices rose 5.1 percent.
The decline of sales was nearly nationwide in scope and all four regions are now running lower index numbers than the previous April. The West was the only region enjoying a month-over-main gain. The PHSI in the Northeast decreased 1.7 percent to an index of 97.2, now 0.6 percent lower than the previous April. In the Midwest, the index fell 4.7 percent to 104.4, a decline of 6.1 percent year-over-year.
Supply Issue?
In addition to the decline this month, the Pending Home Sales Index for March was revised lower, from -0.8 % to -0.9 %. The second quarter recovery thesis is dying on the vine.
Once again Yun blames supply. And once again Yun is wrong. If supply was triple and prices remained the same, sales would not be skyrocketing.
Of course, if supply tripled and sales did not soar, prices would drop. That is the real issue. Prices are above what buyers can afford to pay.
Although the number of resales is well below the bubble years, the median price isn’t.
Median Home Prices 1963-Present:
More Trapped Home Buyers:
New home sales are recorded at signing. Existing home sales are recorded at closing.
Thus, the March report has negative implications for April and May, while the April report has negative implications for resales in May and June.
Looking ahead, existing home buyers in the last two to three years overpaid. In some areas, notably California, home buyers overpaid dramatically.
Another round of trapped home buyers unable to sell their homes is right around the corner.
You might have been hearing about Bitcoin more frequently in the past few years. Recently it made a lot of news because of the ransomware attacks that affected countries around the world by demanding Bitcoin ransom to release embargoed documents on computers. So what the heck is Bitcoin, and how does it work?
First, let’s get this out of the way: bitcoin is money. It’s money as much as the dollar or euro or yen is money. And it’s fully interconvertible with these or any other currencies. Bitcoin is different than these national currencies in many key ways, however, because Bitcoin is a type of digital money that basically runs itself without any government intervention and minimal regulation.
Bitcoin is both the network for using the currency as well as the currency itself. It’s usually denoted Bitcoin (big B) when talking about the network and bitcoin (small b) when talking about the actual currency. For example, I have about four bitcoin in my online wallet, and I use the Bitcoin network to send payments.
How do you get bitcoin? There are two ways: Either you buy bitcoin, or you mine bitcoin. Buying bitcoin is quite easy. There are many online exchanges that will sell you bitcoin in exchange for whatever currency you normally use (dollars, etc.). I useCoinbaseto buy my bitcoin, and it’s the most mainstream and scrutinized of the current exchanges. It was founded by Wall Street types in order to help Bitcoin become more mainstream. There aremany others you can use, such as KrakenorCoinMama.
You can also buy bitcoin in person at various bitcoin ATMs around the world. There are now about 1,200 such ATMs in 60 countries around the world, and they’re growing rapidly. Here’s asitethat allows you to find the nearest ATM.
Last, you can buy bitcoin through real people by usinglocalbitcoins.comto find people in your area who will sell you bitcoin without going through an online exchange at all.
The second way to get bitcoin is by ”mining” them. You mine bitcoin using fast computers specially built for doing this. These specialized machines crunch numbers to discover the right codes. Every 10 minutes, the Bitcoin network releases a new block of bitcoin and the party or parties who discovered the right codes gets that block of coins (currently 12.5 coins per block). Bitmain is one of the bigger mining machine manufacturers and their newest model, the T9, sells for about one bitcoin.
This number crunching for “mining” is why bitcoin is referred to as a “crypto currency”: it’s all about using very large numbers that take massive computing power to preserve the integrity of the system and avoid hacking. The Bitcoin system basically turns electricity into money.
Security concerns?
So far, Bitcoin has never been hacked. There’s a common misconception that it has. Many companies that buy and sell bitcoin — bitcoin exchanges — have been hacked. Most famously, MtGox, one of the earliest exchanges, was hacked in 2013 and people lost a lot of money. But even then the Bitcoin network wasn’t hacked. Only the exchange was hacked.
That said, security is very important for those buying and selling bitcoin because the code itself is the currency. It’s a string of numbers and letters called a “hash key.” If someone has your hash keys, they have your bitcoin. There’s nothing extra beyond the hash key.
Your bitcoin are kept generally in an online wallet at an exchange like Coinbase or Xapo. Here’s a site that compares the security of the various means for storing bitcoin. Coinbase wins that comparison currently for online wallets and the Ledger Nano wins for hardware wallets.
You can also keep your bitcoin in an online “vault,” which adds extra layers of security for bitcoin that you don’t plan to use for a while. For example, it takes a couple of days to withdraw bitcoin from the Coinbase vault, and various types of authentication are required before the transaction is complete.
For those who want to take matters more into their own hands and avoid having to trust an online wallet or vault, you can keep your bitcoin in a physical hard drive, or you can even just write your codes by hand on paper and keep them in your physical wallet in your pocket.
Personally, I use a variety of online wallets and vaults in order to prevent any single mishap or hack from hitting me too hard. I can’t be bothered with keeping the codes offline but maybe I will one day as an extra layer of security.
How much is Bitcoin worth?
The price of one bitcoin has grown from nothing in 2009 when the Bitcoin network was created to more than $1,800 in May. If you had invested $1,000 in bitcoin in 2010, you would be sitting on more than $12 million now. How has it gone up so much? Well, because increasing numbers of investors have decided to place their confidence in the system.
We can look at the stats to get a good feel for how fast Bitcoin has grown.Blockchain.infokeeps detailed stats.
» The number of bitcoin in circulation has grown from zero in the beginning of 2009 to almost 16.5 million now, with only about 4.5 million more to mine (but this will take about a century to complete because mining becomes intentionally more and more difficult).
» The Bitcoin price grew from nothing to almost $1,200 at the end of 2013, plummeted to around $200 in 2014, and rose again to more than $1,800 in May.
» Bitcoin’s market capitalization has gyrated similarly, but is now about $30 billion, up from zero in 2009 and $12 billion at the end of 2016, and is enjoying a strong upward trend in 2017.
» All crypto currencies combined now have amarket cap over $60 billion, including Ripple, Ethereum, Litcoin and many others, many of which are also on very strong upward trajectories.
» The number of Bitcoin wallet users (required to buy and conduct business using bitcoin) has grown from zero in 2009 to more than 7 million by mid-2016 and 14 million now.
» Bitcoin daily transactions have grown from nothing in 2009 to 210,000 in mid-2016 and more than 350,000 by May.
So we’re seeing the Bitcoin system roughly doubling in size each year, and there’s little reason to believe that this rate of growth will slow down at this point. If anything, it’s likely to increase.
What does “deflationary” currency mean?
Bitcoin is different than regular money in that there’s a limit to how many can be created: just 21 million. Ever. The idea behind this limit is that the value of this currency can’t be inflated away by policymakers. The dollar loses about 2 percent in value each year because of planned inflation, and this provides a strong incentive to invest rather than save — and that’s literally why the Federal Reserve has a target inflation rate of 2 to 3 percent.
Bitcoin is the opposite: It’s designed to always increase in value, so simply buying and holding may be a very good investment strategy. This is why Bitcoin is described as a “deflationary” currency rather than an inflationary currency.
There’s also a limit on how small each Bitcoin can be divided: into 100 million parts. This tiny part of a bitcoin is called a satoshi, in honor of its mysterious and anonymous creatorSatoshi Nakamoto.
What is the blockchain?
The magic ingredient in Bitcoin is the distribution of trust in a vast electronic network. This distribution moots the need for the “centralization of trust” that is the function of central banks like the Federal Reserve. Central banks issue money, control interest rates and act as a lender of last resort in “fiat currency” systems like in the United States. The distribution of trust to the network performs these roles in the Bitcoin ecosystem. This trust network is called the “blockchain,” and it is the heart of Bitcoin.
The blockchain is an electronic record (ledger) of all bitcoin transactions that is stored on every node of the ever-increasing network of the Bitcoin ecosystem. Because it is completely distributed and constantly updated in real time, using very difficult cryptographic keys that require massive amounts of computing power, the blockchain can’t be shut down by any outside force. This fully decentralized system renders Bitcoin as a system practically immune from hackers. As mentioned above, individual bitcoin exchanges can and have been hacked, but Bitcoin itself has never been hacked.
The beauty of the blockchain and Bitcoin ecosystem is that it allows any person or people using it to avoid the centralized (and often abusive) power of central banks and of national governments entirely. ABN Amro bank chiefsaidit well in 2015: “What the Internet has done for information and the way we communicate, the blockchain will do for value and the way we look at trust. The financial world is going to flip upside-down.”
We are witnessing that upside-down flip right now in real time. This is why we’ve seen literally $30 billion in new money come into the Bitcoin and other crypto currency space in the past six months alone.
Obviously, the decentralized nature and independence from government influence has appealed to libertarians and techno-optimists since Bitcoin’s creation. Bitcoin long has had a bad rep because it’s been used by various versions of the Silk Road website to buy and sell drugs and other illegal items. But there’s far more to Bitcoin than illegal drugs.
Bitcoin is now accepted by thousands of companies and vendors around the world. Japan recently recognized Bitcoin as a legitimate currency, and this means that more than 260,000 stores in Japansoon will startaccepting Bitcoin.
We are very likely seeing the beginning of a very large wave of growth for Bitcoin and other crypto currencies like Ethereum.
Investing in Bitcoin
How should you invest in Bitcoin? I’ve always advised people that you shouldn’t invest anything in Bitcoin that you don’t mind losing. That’s generally still good advice because this currency and the technology behind it are still very new. They could just disappear for a variety of reasons.
But the highly positive trends in terms of wallet growth, acceptance by businesses and governments, as well as market cap and price, discussed above have led me recently to change my mind a little and suggest that Bitcoin should in fact be a part of any smart investor’s portfolio.
It shouldn’t be a large part, but it should definitely be a part of it. With returns like we’ve seen on Bitcoin in the past eight years, it’s reasonable to accept some risk.
Will Bitcoin change the world?
The last thing I’ll look at is the revolutionary potential for Bitcoin and other cryptocurrencies in terms of how they may change the world. Iwrote a piecein 2015 looking at how Bitcoin may stop China from replacing the United States on the world stage. This would be a good thing and could happen if enough Chinese simply start to prefer using bitcoin instead of yuan to conduct business. If China can’t control its currency it can’t control the world.
I also looked in a piece last year at whether Bitcoin is likely to be thefuture of moneymore generally. I concluded then and still believe that Bitcoin (or maybe some other coin built on the blockchain) will probably either grow in the next couple of decades to become a global currency or shrink down such that it becomes just an interesting historical footnote.
What happens if Bitcoin or something like it does replace national fiat currencies around the world? First, it makes it much harder for nations to raise massive amounts of money through printing or borrowing. This means that deficit spending will shrink or even go away. And, according to at least some Bitcoin libertarian optimists, this would also stop nations from waging war as much because they’d have to finance such wars as they go, with real money, rather than using deficit spending. A more peaceful world would indeed be a nice consequence of the Bitcoin revolution.
In closing, Bitcoin is a potentially transformative new type of currency that promises to create a more borderless and peaceful world, and an increasing flow of information and goods. It also may well lead to many unpredictable effects that we’ll simply have to sit back and watch as they unfold.
When it comes to agricultural debt, the numbers aren’t huge enough to take down the global financial system. But this shows how much pain the commodities rout is producing in the farm belt just when the farmland asset bubble that took three decades to create is deflating, and what specialized lenders and the agricultural enterprises they serve – some of them quite large – are currently struggling with in terms of delinquencies.
This is what delinquencies on loans for agricultural production – not including loans for farmland, which we’ll get to in a moment – look like:
From Q4 2014 to Q1 2017, delinquencies have soared by 225% to $1.4 billion, according to the Board of Governors of the Federal Reserve, which just released its report on delinquencies and charge-offs at all banks. This is the highest amount since Q1 2011, as delinquencies were falling after the Financial Crisis. That amount was first breached in Q4 2009.
The delinquency rate rose to 1.5%, the highest since Q3 2012. On the way up, going into the Financial Crisis, delinquencies breached that rate in Q1 2009.
These were the loans associated with agricultural production. In terms of loans associated with farmland, delinquencies have soared by 80% from Q3 2015 to Q1 2017, reaching $2.15 billion:
Farmland values have surged for three decades but are now in decline in many parts of the US. For example in the district of the Federal Reserve of Chicago (Illinois, Indiana, Iowa, Michigan, and Wisconsin), prices soared since 1986, in some years skyrocketing well into the double-digits, including 22% in 2011, and nearly tripling since 2004. It was the Great Farmland Bubble that had become favorite playground for hedge funds. But starting in 2014, prices have headed south.
This chart from the Chicago Fed’sAgLettershows farmland prices in its district in two forms, adjusted for inflation (green line) and not adjusted for inflation (blue line):
Adjusted for inflation, farmland prices in the district fell 9.5% over the past three years. The exception is Wisconsin:
Illinois -11%
Indiana -7%
Michigan -12%
Iowa (since their 2012 peak) -15%
Wisconsin +4%
The Chicago Fed adds this about the deflating farmland asset bubble, in inflation-adjusted terms:
Even after three annual declines, the index of inflation-adjusted farmland values for the District was nearly 60% higher in 2016 than its previous peak in 1979.
Does it mean to say that there is a lot more air to deflate out of the farmland bubble and a lot more pain to come and that this is just the beginning? Or is it saying that this is no big deal?
These falling farmland prices are making the debt much more precarious. So on a nationwide basis, the delinquency rate of farmland loans, according the Fed’s Board of Governors, jumped from 1.46% in Q3 2015 to 2.0% in Q1 2017.
In terms of magnitude of the dollars involved, agricultural and farmland loans pale compared to consumer or commercial loans. So the problems in the farm belt won’t cause the next Global Financial Crisis, and it progresses on its own terms. But it is putting strain on agricultural lenders, growers, and their communities.
Banks have sharply pulled back on lending and have been tightening lending standards.
Banks are saying they see less demand so why are people saying demand is strong?
Overview
We live in a credit driven economy. Most know this to be the case. Individuals and corporations borrow money from banks for homes, cars, real estate projects and other investments. The availability for credit is perhaps the most important driver of economic growth, aside from income growth. Without credit, the economy grinds to a halt. It is not a surprise that banks have a desire to lend money when times are good and pull back lending when times are tough. This seems logical but when times are tough for consumers is exactly when they need credit to push forward with new marginal consumption.
Much of my research lately has been outlining the peak in the economic cycle that occurred in 2015. Many people misconstrue this for an imminent recession call or a stock market crash prediction when that simply is not the case.
The economy follows a sine curve. It peaks and troughs and for the most part follows a nice cyclical wave. Recessions occur when growth is negative but the “peak” of the cycle occurs well before the recession. They are not simultaneous events.
The sine wave below may help illustrate my point:
The most important point to understand is the elapsed time between the peak and the recession, where we live today.
Many confuse the “peak” of the cycle with the end of the cycle when in fact, across all economic cycles, the peak occurred about ~2 years prior to the recession. After the peak of the cycle is in, growth does continue, albeit at a slower pace. It is a dangerous assumption to make when critics of this analysis say we are still growing when we are growing at an ever slowing pace. When growth goes from 3% to -2%, let’s say, it has to hit 2%, 1%, 0%, etc. in the middle. That deceleration is what occurs between the peak and the recession.
There is a large population of investors and analysts that simply look at the nominal growth rate and say 2% is still okay, without regarding that the growth has gone from 3% to 2.5% to 2% and now lower.
The time to prepare for the end of the economic cycle is after the peak in the cycle has been established. The good news, like I said before, is you typically have two years after the peak to prepare yourself.
Preparing yourself does not mean buying canned foods and building a bunker as many raging bulls like to straw-man even the smallest critics into a “doom and gloom” scenario.
Preparing yourself in my view involves reducing equity exposure, raising cash, and increasing defensive exposure.
The good news is that you can still ride the gains of the lasting bull market with an asset allocation that is slightly more defensive. You may slightly under perform the last year or two of the bull market but if offered a scenario in which you gained 3% instead of 10% in the last year of the bull market and then gained another 3% instead of -10% in the following year, I would hope you’d pick the pair of 3% because that in fact leaves you with more money.
In a raging bull market some cannot stomach “leaving” that 7% (these are clearly arbitrary numbers used to make a point) on the table.
For the rest of the piece, I will use the banking loan growth and the banking surveys to prove the peak of the credit cycle is in and we are in a period of decelerating growth, falling down the back of the sine wave as I pointed out above. The recession is in sight despite how hard many want to avoid it.
I will also at the end run through the portfolio I began to recommend on May 1st that will prepare you for slowing growth but also allows you to share in the upside should the market continue higher.
So far, that portfolio is actually outperforming the S&P 500 with a negative correlation and lower volatility. I will go through this at the end.
The Peak in Credit is Behind Us, The Fat Lady is Singing
For the analysis of the credit peak, I will use two main economic reports. First is the “Assets and Liabilities of Commercial Banks” published by the Board of Governors of the Federal Reserve and the second is the Senior Loan Officer Survey also published by the Board of Governors of the Federal Reserve.
Assets and Liabilities
The “Assets and Liabilities” report is a weekly aggregate balance sheet for all commercial banks in the United States. The release also breaks down several banking groups. The most interesting part of the report is the breakdown of loan group in which you can see auto loans, real estate loans, consumer loans and much more.
Most importantly, this is hard data and not subject to sentiment, feeling or bias. Banks are either growing their loan books at a faster pace or a slower pace. This is perhaps one of the biggest economic signals. Banks would experience lower demand or credit issues and tighten up their loan books before that lack of credit leaks into the economy in the form of lower growth.
The following data from the Assets and Liabilities report will indicate just how much banks have reeled in their lending and prove the peak in credit growth is long gone.
All Commercial & Industrial Loans:
This is exactly as it sounds; all loans banks make, the broadest measure of credit availability. This is an aggregation of all the loans made by all the commercial banks in the survey. Currently this report aggregates 875 domestically chartered banks and foreign related institutions.
Rarely do I look at any data series in nominal terms, not year over year that is, but this chart does show the peaks in total credit fairly clearly. Credit rises week after week without ever slowing down. The only times when there was a pause, drop, or large deceleration in credit creation was during times of economic distress. Banks are fairly smart and they won’t lend if risk is too high, uncertainty is too great or credit quality is too low.
Many will speculate on the reason for a drop off in bank lending but the reason truthfully isn’t that important.
The growth rate in total credit shows you exactly when the fat lady began to sing on loan growth.
The question is not whether credit growth has peaked, that is clear. Credit growth is also never negative without a recession and we are getting dangerously close to that. If the prevailing sentiment is that demand is high, why are banks pulling back lending at a record pace?
The rate of the drop in credit growth has been accelerating. Some may point to the current administration and the uncertainty surrounding policy changes but I would push back and say that growth peaked and was falling since 2015, far before this political scenario.
It is very critical to look at the above loan growth chart in the context of the sine curve at the beginning of this piece. If negative growth is a sign of recession, I think you’d be crazy not to shift defensive. Don’t sell all stocks, just know where you are in the cycle.
This is the broadest measure of all credit, so what is the specific sector that is causing the aggregate loan growth to plummet.
The context of the cycle is clear in the above chart so for all the specific loan sectors going forward I will focus on this cycle only from 2009 through today. The report is also on a weekly basis. If a data series does not start from 2009 or prior, that is because that is all the data available as some series began in 2014.
Real Estate Loans:
Credit growth in the real estate sector peaked later than overall credit but has certainly registered its highest growth of the cycle.
Real estate clearly does well in times of credit expansion and less so during times of credit growth contraction.
Mapping home price growth from the Case-Shiller Home Price Index over real estate loan growth should highlight the importance of credit growth for real estate and the dangers of disregarding its rollover.
Not surprisingly, there is a high correlation between real estate loan growth and home price growth. Just briefly skipping ahead (will return to this) the Senior Loan officer survey also shows that banks are claiming lower demand for real estate loans; mortgages and more specifically, commercial real estate.
(Federal Reserve)
(Federal Reserve)
It is hard to overstate the importance of this, specifically the commercial real estate demand. People claim “demand is booming” or something of the sort but banks, the ones who actually make the loans, are claiming demand for real estate loans is the weakest since just before the last housing crisis. Again, not making that call but this drop in loan growth and demand is telling a far different story than those who claim demand is through the roof.
Consumer Loans: Credit Cards:
Consumer loan growth in the credit card space are following trend with the rest of loan growth, still growing but decelerating and months past peak.
With credit card growth rolling over, in order to keep up with the same consumption, consumers need to spend their income. The problem is income growth is falling as well.
Total real aggregate income is near its lowest level of the cycle.
With loan growth slowing and income growth slowing, where is the marginal consumption going to come from? With this data in hand, it should not some as a surprise that GDP growth has gone from 2% to 1% and sub 1% as of the latest Q1 reading.
What are banks saying about consumer demand?
(Federal Reserve)
Across all categories banks are reporting weaker demand. Again, where is the strong demand that everyone keeps talking about? It is not showing up in loan growth data or in banking demand surveys.
I will reiterate this point continually; loans are still growing and income is still growing but at a slower pace and past peak pace. This should put into context where we are in the broader economic cycle.
Auto Loans:
Unfortunately, the auto loan data started in 2015 so there is no previous cycle to use for comparison. Nevertheless, the peak in auto loan growth occurred in the summer of 2016, and like other credit, has been declining to its lowest level of the cycle.
Not much more needs to be discussed on auto loans that is not widely covered in the media. Subprime auto loans and sky-high inventories are a massive issue. In fact, auto inventories are the highest they’ve been since the Great Recession.
(BEA, FRED)
The goal here is not to predict a subprime auto loan issue but rather to point out yet another area of growth that is slowing to its lowest level of the cycle.
Commercial Real Estate:
While the peak in commercial real estate loan growth is in as well, the peak occurred later than the aggregate index. CRE loan growth topped out in 2016 while the aggregate loan growth peaked closer to the beginning of 2015.
As I pointed out above, banks are sending a serious warning sign on the commercial real estate market.
The senior loan survey shows a triple threat of warning signs from the banks. They are claiming falling demand, tighter lending standards and uncertainty about future prices.
Weakening demand:
Tightening Standards:
The following is an excerpt from the senior loan survey on commercial real estate:
A warning from the banks.
The fat lady has been singing on credit growth…So what do you do?
How To Prepare
On May 1st, I put out a recommended portfolio that the average investor can follow. The portfolio is a take on Ray Dalio’s All Weather portfolio.
I strongly believe peak growth is behind us, and when that happens, growth decelerates until the eventual recession. I am not in the game of predicting the exact date of the next recession.
I do not want to be long the market or short the market per se.
The best way to phrase my positioning is I want to be long growth slowing.
The portfolio I recommended (and will continue to update and change asset allocation on a weekly basis. Follow my SA page for continued updates) was the following:
(All analysis on this portfolio is from the time of recommendation, May 1st, to the time of this writing on May 18).
I use SCHD in my analysis as I mentioned I would choose this over SPY for additional safety but either one is fine.
Since the recommendation, the portfolio is up an excess of 0.96% above the S&P 500 with under 2/3 the volatility and a negative correlation.
The weighted beta of this portfolio, given the asset allocations above, is 0.02. This portfolio is nearly exactly market neutral and has a yield of around 2.5%, above the S&P 500. This portfolio protects you in all scenarios. If the stock market continues to rise, your portfolio should rise just slightly and you should continue to clip a nice coupon.
Should the market fall, the bond allocation will provide safety and stability to the portfolio. A portfolio like this allows you to weather the bumpy ride, stay invested, and continue to clip a dividend yield.
Of course, this is not an exact science and past performance is no indication of future results. Also, those who chose to follow a defensive, yet still net long, portfolio such as the one above can replace SPY or SCHD with their favorite basket of stocks. The reason I chose the ETF was for simplicity.
The percentages above are what I feel are best for the current environment we are in. It will allow me to share partially in the upside while mitigating my downside. At the end of the day, the most important thing is to protect capital.
If you want more equity beta, reduce TLT exposure and raise SPY exposure (or your favorite stocks).
This portfolio is the best way in my opinion to not be long, not be short, but be neutral and long growth slowing.
I will continue to update this portfolio and rotate asset allocation as the economic data changes and my positioning becomes more bullish or bearish.
Disclosure:I/we have no positions in any stocks mentioned, but may initiate a long position in TLT, GLD, IEF over the next 72 hours.
I wrote this article myself, and it expresses my own opinions. I am not receiving compensation for it (other than from Seeking Alpha). I have no business relationship with any company whose stock is mentioned in this article.
The Federal Reserve Bank of New York has released its Household Debt and Credit Report for the first quarter of 2017.
According to the report, household debt has now reached an all-time high. Gains in mortgage debt, auto debt and student debt were all cited. This all-time high now stands at $12.73 trillion and was $149 billion higher than in the fourth quarter of 2016. What stands out here is that it is about $50 billion above the previous peak reached back in the third quarter of 2008 — right before the recession kicked into overdrive.
While the New York Fed showed that aggregate delinquency rates were roughly flat in the first quarter of 2017, some 4.8% of outstanding debt was listed as being in some stage of delinquency. Of that total, $615 billion of debt listed as is delinquent, some $426 billion is listed as seriously delinquent — at least 90 days late or “severely derogatory.”
Debt balances climbed in several areas. Mortgage debt rose 1.7% (up $147 billion) to $8.63 trillion. Balances on home equity lines of credit fell slightly in the first quarter, down $19 billion to $456 billion. Car loans were up 0.9% (up $10 billion) and student loans were up 2.6% (up $34 billion).
It may sound impressive that credit card balances were actually down by 1.9% (by $15 billion) in the first quarter, but there is a seasonal aspect to that component and there are some troubling signs on the internal credit card metrics. Of the $764 billion in credit card balances as a whole, the credit card with 90 or more day delinquency rates deteriorated and they now stand at 7.5%.
It was shown that early delinquency flows have improved since the recession, but there has been a slow deterioration in auto loan performance and a more recent uptick in early delinquency rates on credit card debt.
On student debt, the percentage of student loan balances that transition to serious delinquency has remained high, around 10% and that has been the case over the past five years.
Bankruptcy notations and credit inquires also have to be considered here for the full picture. Some 203,000 consumers had a bankruptcy notation added to their credit reports in the first quarter of 2017, which is 1.7% lower than a year earlier, and the New York Fed called it another record series-low. The number of credit inquiries within the past six months, which the New York Fed calls an indicator of consumer credit demand, declined from the previous quarter to 162 million.
Treasury Yields and Rate Hike Odds Sink: Investigating the Yield Curve
The futures market is starting to question the June rate hike thesis. For its part, the bond market is behaving as if the Fed is hiking the economy into a recession. Here are some pictures.
June Rate Hike Odds
No Hike in June Odds
Month ago – 51%
Week Ago – 12.3%
Yesterday – 21.5%
Today – 35.4%
10-Year Treasury Note Yield
The yield on the 10-year treasury note doubled from the low of 1.32% during the week of July 2, 2016, to the high 2.64% during the week of December 10, 2016.
Since March 11, 2017, the yield on the 10-year treasury note declined 40 basis points to 2.24%.
30-Year Long Bond
The yield on the 30-year treasury bond rose from the low of 2.09% during the week of July 2, 2016, to the high of 3.21% during the week of March 11, 2017.
Since March 11, 2017, the yield on the 30-year treasury bond declined 29 basis points to 2.92%
1-Year Treasury Note Yield
The yield on the 1-year treasury more than doubled from the low of 0.43% during the week of July 2, 2016, to the high 1.14% during the week of May 6, 2017.
Since March 11, 2017, the yield curve has flattened considerably.
Action in the treasury yields is just what one would expect if the economy was headed into recession.
InFebruary 2016 we explained, correctly in retrospect, that the reason behind the unprecedented surge in Vancouver home prices was the seemingly constant flood of “hot Chinese money” desperate to park itself as far away from China’s banking system, and into offshore real-estate. This is how we laid out the stylized sequence of events that culminated with Vancouver home prices surging by over 20%:
Chinese investors smuggled out millions in embezzled cash, hot money or perfectly legal funds, bypassing the $50,000/year limit in legal capital outflows.
They make “all cash” purchases, usually sight unseen, using third parties intermediaries to preserve their anonymity, or directly in person, in cities like Vancouver, New York, London or San Francisco.
The house becomes a new “Swiss bank account”, providing the promise of an anonymous store of value and retaining the cash equivalent value of the original capital outflow.
Then the owners disappear, never to be heard from or seen again.
Separately, in mid-2015, when bitcoin was still trading in the low $200s, we also predicted that in an attempt to bypass China’s increasingly more draconian capital controls, Chinese oligarchs and ordinary savers would increasingly turn to what at the time was a largely unregulated medium of exchange: bitcoin.
we would not be surprised to see another push higher in the value of bitcoin: it was earlier this summer when the digital currency, which can bypass capital controls and national borders with the click of a button, surged on Grexit concerns and fears a Drachma return would crush the savings of an entire nation. Since then, BTC has dropped (in no small part as a result of the previously documented “forking” with Bitcoin XT), however if a few hundred million Chinese decide that the time has come to use bitcoin as the capital controls bypassing currency of choice, and decide to invest even a tiny fraction of the $22 trillion in Chinese deposits in bitcoin (whose total market cap at last check was just over $3 billion), sit back and watch as we witness the second coming of the bitcoin bubble, one which could make the previous all time highs in the digital currency, seems like a low print.
With one bitcoin now going for roughly $1,800 – and with the PBOC repeatedly cracking down on all forms of bitcoin cross-border flow – this prediction also turned out to be right.
So putting the two together, at least one enterprising Canadian homeowner has decided to make life for potential Chinese buyers especially easy, and in a posting on the Hong Kong edition of Craigslist, has listed a relatively modest Vancouver house for the price of 2,099 bitcoin.
At today’s exchange rate of US$1,737 for one bitcoin, the US dollar equivalent price is roughly $3.6 million or C$4.9 million. So what does nearly five million Canadian dollars buy enterprising Chinese investors who are willing to pay up for the convenience of bypassing currency conversion into Canadian dollars altogether? This:
Sound money advocates scored a major victory on Wednesday, when the Arizona state senate voted 16-13 to remove all income taxation of precious metals at the state level. The measure heads to Governor Doug Ducey, who is expected to sign it into law.
Under House Bill 2014, introduced by Representative Mark Finchem (R-Tucson), Arizona taxpayers will simply back out all precious metals “gains” and “losses” reported on their federal tax returns from the calculation of their Arizona adjusted gross income (AGI).
If taxpayers own gold to protect themselves against the devaluation of America’s paper currency, they frequently end up with a “gain” when exchanging those metals back into dollars. However, this is not necessarily a real gain in terms of a gain in actual purchasing power. This “gain” is often a nominal gain because of the slow but steady devaluation of the dollar. Yet the government nevertheless assesses a tax.
Sound Money Defense League, former presidential candidate Congressman Ron Paul, and Campaign for Liberty helped secure passage of HB 2014 because “it begins to dismantle the Federal Reserve’s monopoly on money” according to JP Cortez, an alumnus of Mises University.
Ron Paul noted, “HB 2014 is a very important and timely piece of legislation. The Federal Reserve’s failure to reignite the economy with record-low interest rates since the last crash is a sign that we may soon see the dollar’s collapse. It is therefore imperative that the law protect people’s right to use alternatives to what may soon be virtually worthless Federal Reserve Notes.” In early March, Dr. Paul appeared before the state Senate committee that was considering the proposal.
“We ought not to tax money, and that’s a good idea. It makes no sense to tax money,” Paul told the state senators. “Paper is not money, it’s a substitute for money and it’s fraud,” he added, referring to the fractional-reserve banking practiced by the Federal Reserve and other central banks.
After the committee voted to pass the bill on to the full body of the Senate, Dr. Paul held a rally on the grounds of the state legislature, congratulating supporters of the measure and of sound money.
Paul told the crowd that “they were on the right side of history” and that even though those working to restore constitutional liberty to Arizona and all the states “had a great burden to bear,” there are “more than you know” working toward the same goal.
Referring to the bill’s elimination of capital gains taxes on gold and silver, the sponsor of the bill, State Representative Mark Finchem, said, “What the IRS has figured out at the federal level is to target inflation as a gain. They call it capital gains.”
Shortly after the vote in the state Senate, the Sound Money Defense League, an organization working to bring back gold and silver as America’s constitutional money, issued a press release announcing the good news.
“Arizona is helping lead the way in defending sound money and making it less difficult for citizens to protect themselves from the inflation and financial turmoil that flows from the abusive Federal Reserve System,” said Stefan Gleason, the organization’s director
As a reminder, in 1813 Thomas Jefferson warned, “paper money is liable to be abused, has been, is, and forever will be abused, in every country in which it is permitted.” This is also why the men who drafted the Constitution empowered Congress to mint gold and silver, sound money, and why they included not a single syllable authorizing the legislature to “surrender that critical power to a plutocracy with a penchant for printing fiat money.”
Slowly, states may be summoning back the days when money was actually worth something. At least 20 states are currently considering doing as Arizona is about to do and remove the income tax on the capital gains from the buying and selling of precious metals: some state legislatures, including Utah and Idaho, have taken steps toward eliminating income taxation on the monetary metals. Other states are rolling back sales taxes on gold and silver or setting up precious metals depositories to help citizens save and transact in gold and silver bullion.
Debt is serfdom, capital in all its forms is freedom.
If we accept that our financial system is nothing but a wealth-transfer mechanism from the productive elements of our economy to parasitic, neofeudal rentier-cartels and self-serving state fiefdoms, that raises a question: what do we do about it?
The typical answer seems to be: deny it, ignore it, get distracted by carefully choreographed culture wars or shrug fatalistically and put one’s shoulder to the debt-serf grindstone.
There is another response, one that very few pursue: fanatic frugality in service of financial-political independence. Debt-serfs and dependents of the state have no effective political power, as noted yesterday inIt Isn’t What You Earn and Owe, It’s What You Own That Generates Income.
There are only three ways to accumulate productive capital/assets: marry someone with money, inherit money or accumulate capital/savings and invest it in productive assets. (We’ll leave out lobbying the Federal government for a fat contract or tax break, selling derivatives designed to default and the rest of the criminal financial skims and scams used so effectively by the New Nobility financial elites.)
The only way to accumulate capital to invest is to spend considerably less than you earn. For a variety of reasons, humans seem predisposed to spend more as their income rises. Thus the person making $30,000 a year imagines that if only they could earn $100,000 a year, they could save half of their net income. Yet when that happy day arrives, they generally find their expenses have risen in tandem with their income, and the anticipated ease of saving large chunks of money never materializes.
What qualifies as extreme frugality? Saving a third of one’s net income is a good start, though putting aside half of one’s net income is even better.
The lower one’s income, the more creative one has to be to save a significant percentage of one’s net income. On the plus side, the income tax burden for lower-income workers is low, so relatively little of gross income is lost to taxes.
The second half of the job is investing the accumulated capital in productive assets and/or enterprises. The root of capitalism is capital, and that includes not just financial capital (cash) but social capital (the value of one’s networks and associations) and human capital (one’s skills and experience and ability to master new knowledge and skills).
Cash invested in tools and new skills and collaborative networks can leverage a relatively modest sum of cash capital into a significant income stream, something that cannot be said of financial investments in a zero-interest rate world.
Notice anything about this chart of the U.S. savings rate? How about a multi-decade decline? Yes, expenses have risen, taxes have gone up, housing is in another bubble–all these are absolutely true. That makes savings and capital even more difficult to acquire and more valuable due to its scarcity. That means we have to approach capital accumulation with even more ingenuity and creativity than was needed in the past.
Meanwhile, we’ve substituted debt for income. This is the core dynamic of debt-serfdom.
As Aristotle observed, “We are what we do every day.” That is the core of fanatic frugality and the capital-accumulation mindset.
For your amusement: a few photos of everyday fanatic frugality (and dumpster-diving).
The only leverage available to all is extreme frugality in service of accumulating savings that can be productively invested in building human, social and financial capital.
Debt is serfdom, capital in all its forms is freedom. Waste nothing, build some form of capital every day, seek opportunity rather than distraction.
California Governor Gerry Brown warned on Thursday that the state, which generates revenue largely through volatile capital gains taxes, is overdue for a correction after years of economic expansion.
“Over the past four years, we have increased spending by billions of dollars for education, health care, child care and other anti-poverty programs. In the coming year, I don’t think even more spending will be possible,” he said. “We have ongoing pressures from Washington and an economic recovery that won’t last forever.”
On Wednesday, the state’s controller, Betty Yee, said revenues through April for the fiscal year that began July 2016 were $1.83 billion below initial estimates. Income tax in April lagged projections by about $708 million.
“This is another signal that we may be inching toward an economic downturn, and we must tailor our spending accordingly,” Yee said.
The United States of America, 2047: The population bumps up against 400 million people, with a full 22 percent of folks aged 65 and older — or 85.8 million seniors. The national debt rises so high that the country spends more money on interest payments than all of its discretionary programs combined, a scenario that’s never been seen in a half-century of tracking such metrics. And that’s all assuming that elected officials even find a way to keep Social Security and Medicare funded at their current levels.
This stark vision comes courtesy of the Congressional Budget Office and its most recent Long-Term Budget Outlook. The nonpartisan CBO looks into its crystal ball and predicts the economic picture for the next 30 years, and the results could prove fascinating for folks who work in financial planning and lending — or, perhaps, send them screaming into the night.
Interest Rates Creep Higher, But Not Historically So
For instance, the CBO joins the chorus of other financial analysts by projecting steady increases in interest rates over the coming decades as the economy improves and the Federal Reserve moves away from the historically low federal funds rates instituted during the depths of the Great Recession. But mirroring the attitudes of many in the reverse mortgage industry after the Fed last hiked its interest rate target back in March, the office also puts these trends in the larger context of recent history,
“CBO anticipates that interest rates will rise as the economy grows but will still be lower than the average of the past few decades,” the report notes. “Over the long term, interest rates are projected to be consistent with factors such as labor force growth, productivity growth, the demand for investment, and federal deficit.”
As RMD reported at the time, rising interest rates have diverse effects on Home Equity Conversion Mortgage originators and lenders, potentially hampering needs-based borrowers with lower principal limits, but also providing opportunities to market the growing HECM line of credit and strengthening the HECM-backed securities market.
Though the CBO doesn’t address specific numbers for federal funds rate targets, the office offers projections for the interest rate on 10-year Treasury notes, predicting a rise from 2.1% at the end of last year to 3.6% in 2027 and 4.7% in 2047. That’s still a percentage point below the average of 5.8% recorded between 1990 and 2007, a period that the CBO notes was free of major fiscal crises or spikes in inflation.
The current federal funds rate target of 0.75% to 1% still falls on the historically low side of the spectrum; prior to the economic collapse in the late 2000s, the number sat at 5.25%, and it climbed as 20% during the inflationary malaise days of the Carter and early Reagan administrations.
Rising interest rates could spell bad news for the federal government, however, as they also determine the amount of money that Uncle Sam must pay on his debts. According to the CBO’s estimates, the amount of federal debt held by the public will balloon to 150% of the gross domestic product, up from 77% now — reaching figures never seen in the history of the United States. For reference, the national debt has only ever exceeded GDP during and after World War II, when the government embarked on an unprecedented defense spending spree.
A Changing Population
In the CBO’s estimate, a variety of factors will conspire to expand the American population to about 390 million as compared to around 320 million today — while simultaneously making it grayer.
The net immigration rate, which balances out the amount of people leaving and entering the U.S., is expected to rise ever-so-slightly from 3.2 per 1,000 in 2017 to 3.3 per 1,000 in 2047, while the fertility rate for folks already in America will sit at an average of 1.9 births per woman for the next 30 years, down from the pre-recession level of 2.1.
Couple that with declines in mortality rates and gains in life expectancy, and you’ve got the recipe for an older America: A baby born in 2047 can expect to live an average of 82.8 years according to the CBO’s estimates, compared with 79.2 for children born this year. And good news for readers born in 1982: You can expect an average of 21.5 more years on this mortal coil once you turn 65 in 2047, as compared to 19.4 more years for those celebrating their 65th birthdays by the end of 2017.
The Takeaway
Interestingly, the CBO notes that it bases its entire report on the assumption that the two key pillars of Social Security and Medicare will remain funded “even if their trust funds are exhausted” — a formidable “if” given political realities and the general pitfalls of making assumptions about the future of government from 30 years out.
As Jamie Hopkins, an associate professor of taxation at the American College of Financial Services, recently told a HECM industry event, Social Security and Medicare will remain funded through 2034, and any attempts to make unpopular decisions that could benefit their long-term health — such as raising the retirement age — would spell political disaster for those who attempt a change.
Perhaps none of this comes as a surprise to originators, lenders, and others who work in the reverse mortgage space: Americans as a unit are getting older, the economic outlook remains uncertain, and no one’s really sure what’s going to become of the social safety net. Meanwhile, down on the micro level, this growing crop of seniors will need to figure out ways to remain comfortable and safe in their retirement years.
Sen. Dianne Feinstein’s husband, Richard Blum, could bag $1 billion in commissions for his company from a government plan to sell 56 US Postal Service buildings.
As theNew York Postnotes, “Blum’s company, CBRE, was selected in March 2011 as the sole real estate agent on sales expected to fetch $19 billion. Most voters didn’t notice that Blum is a member of CBRE’s board and served as chairman from 2001 to 2014.”
Feinstein’s office denies that she had anything to do with the USPS decision.
This is not the first time Feinstein and her husband have come under fire for engaging incrony capitalism.
In 2013, a construction group partially owned by Blum’s investment firm scored aconstruction contractfor California’s high-speed rail project valued at $985,142,530.
For months we have been getting messages and e-mails about Bitcoin.
We have long been advocate for buying the BTC dips and riding it out for the longer term.
We explain why we think everyone’s BTC strategy should simply be: “Buy one Bitcoin and forget about it”.
By Parke Shall
That is our simple bitcoin advice. “Buy one and forget about it for a while.” Your loss today is going to be capped at about $1400 but, as was said in Back to the Future, “if this thing hits 88 miles per hour, you’re going to see some serious s***.”
We wanted to take the time to write a small note today about our continued thinking on bitcoin and why we think a small investment in perhaps just one bitcoin could be a prudent strategy for asset diversification for any investor.
Hopefully, our track record on the digital currency also helps our credibility today. In the past, we have advocated for buying any and all dips in the digital currency making the argument time and time again that we believed bitcoin would continue to appreciate regardless of small aberrations that have occurred along the way. For instance in December of last year, we predicted bitcoin would soar through $1200 this year.
The conclusion has generally been the same in each of our bitcoin articles: we expect demand for bitcoin to continue to rise and, with a limited supply, and we expected this demand will push the price significantly higher. This is the dynamic we have seen during the course of bitcoin’s life cycle thus far,
Many people have been deterred from investing or purchasing bitcoin at these levels because of how much the prices has appreciated so far. This is akin to not wanting to buy a stock while it is on its way up, despite its best years possibly being ahead of it. If you didn’t buy at $700 like we advocated, then yes, you missed out on a double. But who is to say that if you don’t buy here at around $1400 you won’t miss another double? In fact, we think the reality is that an investment in bitcoin today could pay off many multiples in the future as long as, as an investor, you have patience.
We also don’t think owning gold is a bad idea either. We are not sure why this argument of gold versus bitcoin started, but we own both. We like to think of them as our “old-school” and our “new school” hedges. Gold is an “old-school” hedge because it is actually a physical asset that you can reach out and touch that has been intertwined with economics for thousands of years. It has a great track record of demand and comes in finite amounts, therefore making it a great hedge against anything and everything that is “new school” in the market, from Keynesian theory to bitcoin.
Bitcoin obviously has the biggest track for potential appreciation, we believe. While gold may not go up 10 times in the event of a catastrophe or a risk off event, it still may appreciate significantly. We believe bitcoin, on the other hand, actually has the potential to appreciate over 100 times in the future, if it holds up. By that, we mean that there is definitely a theoretical case for the asset to appreciate this much, although there is probably a cautious likelihood of it happening. In other words, and not to sound hyperbolic, Bitcoin going to $1 million may not prove to be a total impossibility.
This appreciation may occur without a catastrophe or without a risk off event. In other words, we like bitcoin not only as an investment in the financial technology and not only as an investment in a digital currency but also as an investment in a hedge against central banks and the markets.
To explain:
1. We know that blockchain is at the core of what makes Bitcoin tick. Companies and governments have continued to invest in blockchain, and we believe that owning Bitcoin is another way to invest in one of the earliest and possibly the most well known blockchain project out there. Therefore, an investment in Bitcoin is an investment in Blockchain.
2. Not unlike gold, people use Bitcoin because they want less government and less regulation in their lives. Buying Bitcoin is a way to, at least for now, shore up a method of transacting value outside of the “system”. Gold offers the same benefits and is tangible, which is why we like owning both gold and Bitcoin as hedges against the “system”.
We have gotten numerous questions over the last year or so about what our strategy would be if we were new to investing in bitcoin. Put simply, the strategy would be to “buy one bit coin and just leave it”. One of a couple scenarios are going to happen.
The first situation is the worst. Let’s assume bitcoin winds up going to zero eventually and is somehow either rejected as a digital currency or disproven as a financial technology. In that case, you take a 100% loss. Sorry. At least your risk was defined.
The second situation is one where bitcoin is adopted in somewhat of the same fashion as it has been adopted of recent. Its use starts to drift from outside the mainstream to inside the mainstream and the price continues to appreciate. This is a case where you’d likely see appreciation in a bitcoin that you purchased today.
Finally, the third situation. We call this the grand slam. Bitcoin is unanimously excepted as the first and only prominent digital currency. It becomes a full-scale hedge, adopted by a significant portion of the population, against central banking systems and finance as we know it today. Given the fact that only about 20 million bitcoin will be issued in total, there will be a severe dry up in supply as billions of people worldwide look to get their share of the digital currency. This is a situation where the currency could appreciate 100 times what its worth now or more. Obviously, this is the most speculative of the three situations but could be a reality if an investor has enough patience to wait it out. This type of situation could take 15 to 30 years and this is why the title of this article is “buy one bitcoin and forget about it“.
Again, bitcoin does not come without risk.
Relative to other assets you may hold, like stocks, options and other currencies, Bitcoin is going to be extraordinarily volatile. Due to the fact that it is easily in the digital currency’s life cycle and that it has yet to be proven on a wide scale, investors can expect significant volatility, sometimes 20%+ in one day’s time, for the capital they have invested in Bitcoin.
Also, it is an all digital currency meaning that it needs digital infrastructure to survive. In a catastrophic scenario where our infrastructure is compromised, we have no idea what would happen to bitcoin. It isn’t tangible and you can’t physically hold it, which are two of its major detracting points versus gold. However, we see buying bitcoin at $1400 as a speculative investment that could yield immense results in the future if you have the wherewithal and you have the strength to hold it over time.
JPMorgan Chase & Co. has some advice for regional banks: A deposit drain is coming, so merge while you can.
The company’s investment bankers are warning depository clients that they may begin feeling the crunch in December, thanks to a byproduct of how the U.S. Federal Reserve propped up the economy after the financial crisis, according to a copy of a confidential presentation obtained by Bloomberg News and confirmed by a JPMorgan spokesman.
JPMorgan argues that some midsize U.S. banks — those with $50 billion in assets or less — could face a funding problem in coming years as the Fed goes about shrinking its massive balance sheet, according to the 19-page report the New York-based bank has begun sharing with clients.
The Fed is currently holding about $4.5 trillion of securities. The way it will get rid of them is by letting them mature and not buying new ones.
Deposit ‘Destroyed’
JPMorgan’s presentation, titled “Core Deposits Strike Back” illustrates how this process will sap bank deposits using the example of a couple who pays off a mortgage that was bundled with other mortgages and sold to the Fed. Right now, when that couple takes that money out of their bank account for that payment, the Fed uses that cash to buy another mortgage bond, recycling it back into the banking system.
A “deposit is destroyed” if the “Fed does not reinvest,” the presentation states. JPMorgan estimates that a quantitative easing-related deposit-drain could result in loan growth lagging deposit growth by $200 billion to $300 billion a year.
Midsize banks will have an especially hard time growing retail deposits by ramping up advertising and investing in branches, according to JPMorgan’s presentation. That’s because they lack the marketing muscle of mega banks such as JPMorgan itself, as well as Wells Fargo & Co., Citigroup Inc., and Bank of America Corp. JPMorgan, like some other banks, offers depositors cash incentives for opening new checking and savings accounts with five-figure balances.
About 42 percent, or $1.6 trillion, of the new deposits that U.S. banks have amassed since late 2009 have gone to lenders with at least $1 trillion in assets, according to data JPMorgan compiled from regulatory filings and SNL Financial.
“Large banks are making sizable investments in brand, customer acquisition and technology leading to market share gains,” according to the report.
Self-Serving Advice?
Somehow this smacks of self-serving advice. Merge with JPMorgan while you can.
By the way, it seems the banks had the playbook before the report.
Nearly every major regional bank missed its lending estimate. As discussed on April 29, a Regional Lender Loan Crash is underway.
Jobs and wages are on the rise. Buyers are newly urgent, fearful an era of cheap money is ending. And to top it off, there simply aren’t enough homes listed for sale. As a result, bidding wars are common and prices are rising during the popular spring buying season. A report out Tuesday from CoreLogic shows the Southern California median home price jumped 7.1% in March from a year earlier, hitting $480,000 in the six-county area. And despite low inventory, sales rose 7.8%.
A pitched battle
When Elizabeth Rodriguez and her husband realized that the market was white-hot in the Northeast L.A. burbs where they wanted to raise their three children, they devised a strategy.
The couple, who moved from the Bay Area for Rodriguez’s husband’s director job, began writing a “love letter” to sellers describing how much they wanted the house. And then they bid over asking — way, way over asking.
In one case, they offered $102,000 above the $798,000 list price for a three-bedroom Spanish-style home in Mount Washington. The house sold to someone else for $985,000.
“After that I was like, this is insane,” said the 35-year-old mother of three.
The couple bid on 11 homes, she said, before they finally purchased a three-bedroom in the hills of Glassell Park listed at $799,900. To seal the deal, they again bid about $100,000 over asking, this time before an open house was held.
“It was a crazy process,” Rodriguez said. “I’m glad we are on the other side of it.”
For developers, crazy times are good — especially in areas where few new homes are being built.
Last weekend, builder Planet Home Living held a grand opening for a Silver Lake 10-home subdivision built on small lots. Before any prospective buyers showed up, six of the $1-million houses were already in escrow after the Newport Beach firm contacted people who signed a list of interested buyers.
“Four hundred people on an interest list, that’s a lot for 10 homes,” said the company’s chief executive, Michael Marini. “Anything in L.A. that we build, it sells out immediately.”
The buying frenzy isn’t limited to Los Angeles either.
Agents across the region reported heavy demand, even in the Inland Empire, which since the housing bust has recovered more slowly than areas near the coast.
Chino Hills agent Derek Oie said he and others are taking advantage by marketing open houses as a one-time-only event, in a bid to create even more of an auction atmosphere.
At one house in Eastvale he brought a client to earlier this year, 100 people showed up.
“We showed up and literally cars were parked up and down the whole cul-de-sac,” he said.
GM, the No. 1 U.S. automaker, reported a 6% decline in April sales to 244,406 vehicles.
Ford, the No. 2 U.S. automaker, reported a 7.2% decline in April. Ford car sales dropped 21% and trucks declined 4.2%, while SUV sales rose 1.2%.
Toyota reported a drop of 4.4%. Lexus sales slid 11.1%. U.S. car sales at the Japanese automaker were down 10.4%, while truck sales were up 2.1%.
Fiat-Chrysler reported sales were off 7%
“GM said its consumer discounts were equivalent to 11.7 percent of the transaction price. The automaker also said its inventory level rose to 100 days of supply at the end of April versus around 70 days at the end of 2016. Recent levels have worried analysts, and GM has promised inventories will be down by the end of 2017.”
The three red flags according to Automotive News are leasing, incentives, and inventory. I added a fourth: complacency in the face of falling demand and rising incentives.
Effect on GDP
Auto sales make up about 20% of consumer spending. The big second quarter GDP bounce economists expect is highly unlikely, to say the least.
India’s crackdown on cash caused chaos as 86% of the money in circulation vanished overnight. Banks could not cope with the increase in demand. Consumers did not turn to credit cards or debit cards as expected. Instead, consumers turned to mobile apps.
The value of mobile money transactions has more than doubled since the nullification of 86% of India’s cash in circulation in November, while those made with credit and debit cards has fallen, and check purchases have barely budged. Mobile payments still make up only a small percentage of overall transactions, but their surging popularity is being noticed.
At this rate, cards and automated teller machines could be redundant in India by 2020, predicted Amitabh Kant, head of NITI Aayog, the government’s economic policy-making body. India’s government, along with removing paper money, has encouraged electronic payments by loosening regulations and adding infrastructure.
Abdul Aziz Ansari had never accepted anything but rupees at his fish stand in a Mumbai suburb. When notes dried up during the cash crunch last year, his sales plummeted. His business looked set to fail, until he signed up for Paytm.
Still, the value of mobile-wallet payments remains lower than checks and cards, but they are catching up to credit cards. In February, mobile payments totaled 69.11 billion rupees ($1.07 billion), significantly behind checks at 6.4 trillion rupees and debit cards at 2.3 trillion rupees but approaching credit cards at 286 billion rupees.
The Reserve Bank of India has been easing rules and building the infrastructure needed to simplify payments. Last year, it started allowing more types of companies to offer digital wallets and has created a new payment system that allows people to connect their identification numbers, phones and bank accounts, providing them with one number for transfers to merchants or other people.
“Your mobile is not just going to be your wallet, it will be transformed into a bank,” Prime Minister Narendra Modi said at an April event promoting mobile money. “This can be the base of financial revolution for the world.”
India’s mobile-wallet leaders said they are adding millions of new users every month.
The phone makers Samsung and Apple, which are leading the race to enable more seamless mobile payments in the West, could have trouble catching up in India, analysts say, because their systems still require card readers that can communicate with smartphones. Samsung Pay launched in India this year, and Apple Pay has yet to start.
Accepted Here
Not Accepted Here]
Would you tie your bank account to a phone?
Death of Cash Coming
Western central banks will be monitoring these events closely. The death of cash money is coming.
Two days agowe looked at the latest troubling developmentin US home price trends: a new bubble appears to be emerging in all the “usual suspect” places. As we noted on Thursday, “home prices in markets that bubbled over back in 2006/2007, like Las Vegas and San Francisco, got cut in half in 2009 but have since doubled again of their lows. Meanwhile, markets like Denver and Dallas that didn’t participate as much in the 2007 mania are now surging to all-time highs, with Dallas prices up 55% over the past 5 years.”
TheWall Street Journal addedthat some of the home buying behaviors of consumers, like paying prices well above appraisal values and waiving home inspections, are starting to be eerily reminiscent of 2006:
In some markets, bidding wars are breaking out. Agents said some buyers are kicking in extra cash when properties don’t appraise for the asking price, and some are waiving their right to home inspections.
“It can’t be sustained,” said David Berson, chief economist at Nationwide Insurance and a former chief economist at mortgage giant Fannie Mae, referring to the frenzied buying. “It can’t go on forever.”
Other signs of overexuberance have emerged, including surging levels of licensed Realtors all chasing a quick buck.
The number of licensed Realtors has jumped by nearly 25% since 2012, hitting a nine-year high in 2016 and sitting just 9% below the peak in 2006, according to real-estate consultant John Burns. In Denver, homes are selling briskly. The median number of days that homes spent on the market declined to eight in the first three months of the year from 61 in 2012, according to Redfin. Home prices rose 8.5% in Denver over the year ended in February, according to Case-Shiller.
Nicki Thompson, an agent in Denver, said she recently had a listing that was on the market for two weekends at $1.2 million and she received multiple all-cash offers above the listing price.
“It’s just crazy,” she said.
And for a practical example of just how crazy it truly is,take this renovated 2-bedroom, 1,948 sq. ft house first built in 1951 in the Eagle Rock section of Los Angeles, which was listed in mid-March for $699,000, was estimated by Redfin at $780,000, andsold yesterday for $980,888(more than $500/sq foot) and 40% above asking, just over a month after it was first listed.
In the 1960s-80s drums played on some of the most famous pop songs known (Good Vibrations, Mrs. Robinson, A Little Less Conversation, to name a few) were built in this garage in our beloved Eagle Rock. A. F. Blaemire and his wife, Kirsten, filled this home with music and creativity for decades, and now it’s ready for its next inspired owner! With freshly refinished hardwood floors and repainted interior, 5208 Monte Bonito is a blank canvas with great potential. The rooms are bright and spacious, including a downstairs recreation room perfect for a jam room, art studio, den (or all of the above!). The two-car garage has direct access to the house and an additional storage room. The back yard has plenty of space for entertaining and gardening – there is already an avocado tree, an orange tree, and a pitaya to get you started! Views of the Eagle Rock from the master bedroom, and sunset views from the front porch make this the ideal setting to call home.
Then again, maybe not.
So what do you get for just under a million in LA these days? Not much: two bedrooms, less than two bathrooms, a 2 car garage, a decorative fireplace, a rec room, and a 7,195 sq foot lot.
Here are some photos showing what a “million dollar house” looks like in the latest US housing bubble.
(ZeroHedge), contracts to buy previously owned U.S. homes declined in March after rising a month earlier by the most since 2010, as perhaps the seasonal exuberance gives way to affordability constraints. Despite NAR’s comments that “home shoppers are coming out in droves this spring,” it is evident from the chart below that pending home sales have been stagnant for almost two years.
Regionally, only The South saw a sales increase:
The PHSI in the Northeast decreased 2.9 percent to 99.1 in March, but is still 1.8 percent above a year ago.
In the Midwest the index declined 1.2 percent to 109.6 in March, and is now 2.4 percent lower than March 2016.
Pending home sales in the South rose 1.2 percent to an index of 129.4 in March and are now 3.9 percent above last March.
The index in the West fell 2.9 percent in March to 94.5, and is now 2.7 percent below a year ago.
Lawrence Yun, NAR chief economist, says sparse inventory levels caused a pullback in pending sales in March, but activity was still strong enough to be the third best in the past year.
“Home shoppers are coming out in droves this spring and competing with each other for the meager amount of listings in the affordable price range,” he said.
“In most areas, the lower the price of a home for sale, the more competition there is for it. That’s the reason why first-time buyers have yet to make up a larger share of the market this year, despite there being more sales overall.“
Yun worries that the painfully low supply levels this spring could heighten price growth — at 6.8 percent last month — even more in the months ahead. Homes in March came off the market at a near-record pace 1, and indicating an increase in the likelihood of listings receiving multiple offers, 42 percent of homes sold at or above list price (the second highest amount since NAR began tracking in December 2012).
Back in 2007/2008, Wall Street drastically pulled back on mortgage origination for their own balance sheets while ramping up their issuance of RMBS securities. Of course, the goal was very simple: package up all the mortgage-related nuclear waste on your balance sheet into a pretty package, tie a ribbon around it with that AAA-rating from Moody’s and sell it all to unsuspecting pension funds and insurance companies around the globe.
Both banks have grown more reluctant to make new subprime loans using money from their own balance sheets. Wells Fargo tightened its underwriting standards and slashed the volume of all loans it made to car buyers in the first quarter by 29 percent after greater numbers of borrowers fell behind on payments. JPMorgan’s consumer and community banking head Gordon Smith earlier this year said the bank had cut its new lending for subprime auto loans “dramatically.”
At the same time the firms are indirectly funding billions of dollars of the loans by helping companies like Santander Consumer USA Holdings Inc. borrow in the asset-backed securities market, essentially shunting money from bond investors to finance companies. Wall Street banks packaged more loans from finance companies into bonds in the first quarter than the same period last year, and Wells Fargo and JPMorgan remained two of the top underwriters of the securities.
Of course, with only ~$200 billion of auto ABS outstanding, compared to $9 trillion in RMBS, the auto loan market hardly represents the same “systemic risk” to the financial industry today as mortgage loans did back in 2007. That said, deterioration in lending standards could certainly wreak havoc on consumers, investors and the auto industry which will undoubtedly have ripple effects throughout the economy.
The risks to Wall Street firms from subprime auto bonds are smaller. Big banks provide lines of credit to finance companies that make subprime loans, but these tend to be a small part of major firms’ balance sheets. The auto loan bond market is much smaller, too: there were just $192.3 billion of securities backed by auto loans, including prime and subprime, outstanding at the end of March according to the Securities Industry and Financial Markets Association, compared with around $8.9 trillion of residential mortgage bonds at the end of last year.
Banks might not get hurt much by subprime auto securities, but for investors who buy them, the risks are growing. Subprime borrowers are falling behind on their car loan payments at the highest rate since the financial crisis. General Motors Co. expects car prices to drop 7 percent this year and auto lender Ally Financial Inc. reported last month that prices fell that much during its first quarter, so the value of the loans’ collateral is dropping. Even Wells Fargo’s analysts who look at bonds backed by car loans cautioned in March that it may be a good time for investors to cut their exposure.
And while JPM and Wells are pulling back on their own auto loan underwriting, we wonder whether they’re sharing these details regarding auto loan delinquencies with new buyers of their sparkling auto ABS securities?
Or the fact that loss severities are also starting to rise…
Oh well, losses are never possible on those highly-engineered, complex wall street structures…until they are.
Florida’s thesis–that urban zones are the primary incubators of technological and economic growth–is well-supported by data that shows that the large urban regions (NYC, L.A., S.F. Bay Area, Seattle, Minneapolis,etc.) generate the majority of GDP and wage gains.
Cities have always attracted capital, talent and people rich and poor alike. Indeed, “city” is the root of our word “civilization.” So in this sense, Florida is simply confirming the central role cities have played for millennia.
More recently, Florida has addressed the rising wealth/income inequality that is making desirable urban areas un-affordable to all but the top 10% or even 5% wage earners. This is a critical concern, because vitality is a function of diversity: a city of wealthy elites paying low wages to masses of service workers is not an economic powerhouse.
What happens as buying a home in a desirable city becomes out of reach of all but the most highly paid tranche of workers?
The larger question is: what happens to home ownership as housing prices continue higher while the next generation’s wages remain significantly lower than previous generations’ incomes?
Millennials are typically earning less than Baby Boomers and Gen-X did in their 20s and 30s, and if this continues–and history suggests it will–then how many Millennials will be able to buy a pricey house?
One consequence of stagnating wages and rising home valuations is a “nation of homeowners” morphs into a “nation of renters.”
The other big question is: if Millennials aren’t earning enough to buy pricey homes, who is going to buy the tens of millions of houses Baby Boomers will be selling as they downsize/move to assisted living? As for inheriting Mom and Dad’s house–that’s not likely if Mom or Dad need the cash to fund their retirement/assisted living.
This question is especially relevant to suburban homes, especially those far from employment centers. Though data on this trend is sketchy, it seems Millennials strongly favor city living over exurban/suburban living.
Anecdotally, I can’t think of a single individual in their 20s or 30s that I know personally who has bought a house in a distant suburb. Everyone in this age group has bought a house in an urban zone. Not a highrise condo in the city center, but a house in a ring city near public transport.
Though data on this is hard to find (if it exists at all), Millennials seem more willing to make the sacrifices necessary to live in the urban core, either by renting rather than buying a cheaper suburban home, or by purchasing a modest bungalow on a small lot rather than an expansive suburban home on a big lot.
(This could change if Millennials start having lots of children, but to date small bungalows in urban regions appear big enough for families with two children.)
In a turn-around from the postwar era, which saw a mass exodus of the middle class from city centers to suburbia, the upper middle class is moving back to urban centers and the lower-income populace–once the urban poor–are being pushed out to the suburbs. We can now speak of the suburban poor.
To some degree, the suburbs have become victims of their own success. Long commutes in heavy traffic are the inevitable result of the vast expansion of suburban subdivisions, shopping malls and business parks. These killer commutes detract from the desirability of suburbs, especially to auto-agnostics of the Millennial generation, who exhibit low enthusiasm for auto ownership.
Rather than symbolizing freedom, auto ownership is viewed as a burdensome necessity at best.
If we overlay these trends (assuming they continue into the future), we discern the possibility that marginal suburban housing could crash in price and morph into suburban ghettos of isolated low-income residents.
The Pareto Distribution may play a role in this transformation. Should 20% of the suburban housing stock fall into disrepair, that could trigger the collapse of valuation in the remaining 80%.
Not all suburbs are equal. Those with diverse job growth may well act as magnets much like small cities. Those with few jobs and long commutes are less desirable and have smaller tax bases to support services.
The asymmetry between modest/stagnant Millennial wages and the soaring cost of housing cannot be bridged. If these trends continue, only the top tranche of highly paid young workers will be able to afford housing in desirable areas. Given a choice between affordable ownership in a small city or in a distant suburb, Millennials may well choose the affordable small city rather than the distant exurb or low-services suburb.
Note that most incomes have gone nowhere since about 1998. Even the top 5% has made modest gains in real (inflation-adjusted) income.
Meanwhile, home prices are back in bubble territory. “Hot” urban areas such as Seattle, Portland, the San Francisco Bay Area, Los Angeles, Brooklyn NYC, etc. have logged double-digit gains in recent years.
So who’s going to pay bubble-valuation prices for the millions of suburban homes Baby Boomers will be off-loading in the coming decade as they retire/ downsize? We know one part of the answer: it won’t be Millennials, as they don’t have the income or savings to afford homes at these prices.
These trends promise to remake the financial geography of cities (large and small) and suburbia–and in the process, radically shift the financial assets of households, renters and owners alike.
It’s easy to get student loans thanks to the aptly named “Parent Plus” program, a subprime loan trap that ensnares parents plus their college-age children. The program was enacted by Congress in the 1980s, but president Obama promoted it heavily.
The results speak for themselves: Nearly 40% of the loans are subprime. The default rate exceeds the rate for U.S. mortgages at the peak of the housing crisis.
Kids graduate from college with useless degrees, plus parents and kids are stuck with massive bills that cannot be paid back.
Student loans made through parents come from an Education Department program called Parent Plus, which has loans outstanding to more than three million Americans. The problem is the government asks almost nothing about its borrowers’ incomes, existing debts, savings, credit scores or ability to repay. Then it extends loans that are nearly impossible to extinguish in bankruptcy if borrowers fall on hard times.
As of September 2015, more than 330,000 people, or 11% of borrowers, had gone at least a year without making a payment on a Parent Plus loan, according to the Government Accountability Office. That exceeds the default rate on U.S. mortgages at the peak of the housing crisis. More recent Education Department data show another 180,000 of the loans were at least a month delinquent as of May 2016.
“This credit is being extended on terms that specifically, willfully ignore their ability to repay,” says Toby Merrill of Harvard Law School’s Legal Services Center. “You can’t avoid that we’re targeting high-cost, high-dollar-amount loans to people who we know can’t afford to repay them.”
The number of Americans with federal student loans, including through programs for undergraduates, parents and graduate students, grew by 14 million to 42 million in the decade through last year. Overall student debt, most of it issued by the federal government, more than doubled to $1.3 trillion over that period.
The financing fueled a surge in college enrollment. Between 2005 and 2010, enrollment grew 20%, the biggest increase since the 1970s. The Obama administration supported such lending in an effort to widen access to college education.
Nearly four in 10 student loans—the vast majority of them federal ones—went to borrowers with credit scores below the subprime threshold of 620, indicating they were at the highest risk of defaulting, according to a Wall Street Journal analysis of data from credit-rating firm Equifax Inc. That figure excludes borrowers, such as many 18-year-old freshmen, who lacked scores because of shallow credit histories. By comparison, subprime mortgages peaked at nearly 20% of all mortgage originations in 2006.
Roughly eight million Americans owing $137 billion are at least 360 days delinquent on federal student loans, nearly the number of homeowners who lost their homes because of the housing crisis. More than three million others owing $88 billion have fallen at least a month behind or have been granted temporary reprieves on payments because of financial distress.
Joint Effort
In 2005, president Bush signed the bankruptcy reform act of 2005 making student loans not dischargeable in bankruptcy.
President Obama came along next and encouraged parents who had no idea what they were getting into to sign loans to put their kids through college.
Parents plus their kids are mired in debt that cannot be paid back. Thank you Congress, President Bush, and President Obama.
Surefire Way to Discharge the Loans
There is one way to get rid of these loans. Die.
Stop the Madness
Wherever government meddles, costs rise dramatically.
The solution is to stop the meddling: Stop all the loan programs, stop all the aid programs, stop insisting that everyone needs to go to college, and start accrediting programs and course offerings from places like the Khan Academy.
Not a single student aid program aided any students. Rather, escalating costs went to teachers, administrators, and their pensions as student debt piled sky high.
The U.S. 10-Year Treasury Yield has dropped back below the line containing the past decade’s “extraordinarily low-rate” regime.
Among the many significant moves in financial markets last fall in the aftermath of the U.S. presidential election was a spike higher in U.S. bond yields. This spike included a jump in the 10-Year Treasury Yield (TNX) above its post-2007 Down trendline. Now, this was not your ordinary trendline break. Here is the background, as we noted in a post in January when the TNX subsequently tested the breakout point:
“As many observers may know, bond yields topped in 1981 and have been in a secular decline since. And, in fact, they had been in a very well-defined falling channel for 26 years (in blue on the chart below). In 2007, at the onset of the financial crisis, yields entered a new regime.
Spawned by the Fed’s “extraordinarily low-rate” campaign, the secular decline in yields began a steeper descent. This new channel (shown in red) would lead the TNX to its all-time lows in the 1.30%’s in 2012 and 2016.
The top of this new channel is that post-2007 Down trendline. Thus, recent price action has 10-Year Yields threatening to break out of this post-2007 technical regime. That’s why we consider the level to be so important.”
We bring up this topic again today because, unlike January’s successful hold of the post-2007 “low-rate regime” line, the TNX has dropped back below it in recent days. Here is the long-term chart alluded to above.
And here is a close-up version.
As can be seen on the 2nd chart, the TNX has just broken below several key Fibonacci Retracement levels near the 2.30% level – not to mention the post-2007 Down trendline which currently lies in the same vicinity. Does this meant the extraordinarily low-rate environment is back?
Well, first of all, the Federal Reserve only sets the overnight “Fed Funds” rate – not longer-term bond yields (at least not directly). So this is not the Fed’s direct doing (and besides, they’re in the middle of a rate hiking cycle). Therefore, the official “extraordinarily low-rate” environment that the Fed maintained for the better part of a decade is not coming back – at least not imminently. But how about these longer rates?
Outside of some unmistakable influence resulting from Fed policy, longer-term Treasury Yields are decided by free market forces. Thus, this return to the realm of the TNX’s ultra low-rate regime is market-driven, whatever the reason. Is there a softer underlying economic current than what is generally accepted at the present time? Is the Trump administration pivoting to a more dovish posture than seen in campaign rhetoric? Are the geopolitical risks playing a part in suppressing yields back below the ultra low-rate “line of demarcation”?
Some or all of those explanations may be contributing to the return of the TNX to its ultra low-rate regime. We don’t know and, frankly, we don’t really care. All we care about, as it pertains to bond yields, is being on the right side of their path. And currently, the easier path for yields is to the downside as a result of the break of major support near 2.30%.
U.S. home inventory tumbled to a new low in the first quarter of 2017, falling for eight consecutive quarters. Homebuyers have now been stifled by low inventory for the last two years despite prices rising to pre-recession highs in many markets.
In this edition of Trulia’s Inventory and Price Watch, we examine how home value recovery may be limiting supply in markets that have recovered most. We find that homebuyers in markets with the biggest gains are facing the tightest supply.
The Trulia Inventory and Price Watch is an analysis of the supply and affordability of starter homes, trade-up homes, and premium homes currently on the market. Segmentation is important because home seekers need information not just about total inventory, but also about inventory in the price range they are interested in buying. For example, changes in total inventory or median affordability don’t provide first-time buyers useful information about what’s happening with the types of homes they’re likely to buy, which are predominantly starter homes.
Looking at the housing stock nationally and in the 100 largest U.S. metros from Q1 2012 to Q1 2017, we found:
Nationally, the number of starter and trade-up homes continues drop, falling 8.7% and 7.9% respectively, during the past year, while inventory of premium homes has fallen by just 1.7%;
The persistent and disproportional drop in starter and trade-up home inventory is pushing affordability further out of reach of homebuyers. Starter and trade-up homebuyers need to spend 2.9% and 1.6% more of their income than this time last year, whereas premium homebuyers only need to shell out 0.9% more of their income;
A strong recovery may be partly to blame for the large drop in inventory some markets have experienced over the past five years. On average, the more valuable a market’s housing is compared to pre-recession levels, the larger drop in inventory it is has seen.
2017 Ushers in a Dramatic Shortage of Homes
Nationally, housing inventory dropped to its lowest level on record in 2017 Q1. The number of homes on the market dropped for the eighth consecutive quarter, falling 5.1% over the past year. In addition:
The number of starter homes on the market dropped by 8.7%, while the share of starter homes dropped from 26.1% to 25.9%. Starter homebuyers today will need to shell out 2.9% more of their income towards a home purchase than last year;
The number of trade-up homes on the market decreased by 7.9%, while the share of trade-up homes dropped from 23.9% to 23%. Trade-up homebuyers today will need to pay 1.6% more of their income for a home than last year;
The number of premium homes on the market decreased by 1.7%, while the share of premium homes increased from 50% to 51%. Premium homebuyers today will need to spend 0.6% more of their income for a home than last year.
How and Where a Strong Housing Market May Be Hurting Inventory
In the first edition of ourreport, we provided a few reasons why inventory is low: (1) investors bought up much of the foreclosure home inventory during the financial crisis and turned them into rental units, (2) price spread – that is, when prices of homes in different segments of the housing market diverge from each other – makes it difficult for existing homeowners to tradeup to the next the segment, and (3) slow home value recovery was making it difficult for some homeowners to break even on their homes. While there isevidencethat investors indeed converted owner-occupied homes into rentals as well as evidence from our first report that increasing price spread is correlated with decreases in inventory, little work has examined how home value recovery affects inventory. This is perhaps due to the tricky conceptual relationship between home values and inventory: too little recovery might make it difficult for homeowners to sell their home but cheap to buy one, while too much recovery might make it easy for them to sell but difficult to buy.
In fact, we find a negative correlation between how much a housing market has recovered and how much inventory has changed over the past five years. Using the current value of the housing market relative to the peak value as our measure of recovery, we find markets with greater home value recovery have experienced larger decreases in inventory over the past five years. The linear correlation was moderate (-0.36) and statistically significant. We also found that markets with the strongest recovery, on average, have experienced the largest decreases in inventory.
For example, the five-year average change in inventory of housing markets currently valued below their pre-recession peak (< 95% of peak value) isn’t that different from ones that have recovered to 95% – 105% of their peak. (-27.6% vs. -30.1%). However, the average change in inventory in well-recovered markets (> 105%) is 0more drastic at -45.4%.
The disparity also persists when looking at changes in inventory within each segment, although the difference is largest for starter homes. On average, markets with less than 95% recovery or 95% to 105% recovery had a 34.2% and 31.7% decrease in starter inventory, while markets with more than 105% home value recovery had a whopping 58.2% drop. These findings suggest that a moderate home value recovery doesn’t affect inventory much, but a strong recovery does and impacts inventory of starter homes the most.
In the fiscal year beginning in July, local payments to the California Public Employees’ Retirement System will total $5.3 billion and rise to $9.8 billion in fiscal 2023, according to the right-leaning group that examines public pensions.
The increase reflects Calpers’ decision in December to roll back the expected rate of return on its investments. That means the system’s 3,000 cities, counties, school districts and other public agencies will have to put more taxpayer money into the fund because they can’t count as heavily on anticipated investment income to cover future benefit checks.
Including the costs paid by cities and counties that run their own systems, the fiscal 2018 tab will be at least $13 billion to meet retirement obligations for public workers, according to the analysis, which is based on actuarial reports and audited financial statements.
Barring any changes to pensions, “several California cities and counties will find themselves forced to slash other spending,” the group wrote in its report. “The less fortunate will simply be unable to pay the bills they receive from Calpers or their local retirement system.”
Quadruple is More Likely
TheCalifornia Policy Center Report details 20 cities and counties reporting pension contribution-to-revenue ratios exceeding 10%. San Rafael, San Jose, and Santa Barbara County head the list at 18.29%, 13.49%, and 13.06% respectively.
The report “reflects the impact of CalPERS’ recent decision to change the rate at which it discounts future liabilities from 7.5% to 7%“.
Lovely.
A plan assumption of 7.0% is not going to happen. Returns are more likely to be negative than to hit 7% a year for the next five years.
As in 2000 and again in 2007, investors believe the stock market is flashing an all clear signal. It isn’t.
GMO 7-Year Expected Returns
Source: GMO
*The chart represents local, real return forecasts for several asset classes and not for any GMO fund or strategy. These forecasts are forward‐looking statements based upon the reasonable beliefs of GMO and are not a guarantee of future performance. Forward‐looking statements speak only as of the date they are made, and GMO assumes no duty to and does not undertake to update forward looking statements. Forward‐looking statements are subject to numerous assumptions, risks, and uncertainties, which change over time. Actual results may differ materially from those anticipated in forward‐looking statements. U.S. inflation is assumed to mean revert to long‐term inflation of 2.2% over 15 years.
Forecast Analysis
GMO forecasts seven years of negative real returns. Allowing for 2.2% inflation, nominal returns are expected to be negative for seven full years.
Even +3.0% returns would wreck pension plans, most of which assume six to seven percent returns.
If we see the kinds of returns I expect, even quadruple contributions will not come close to matching the actuarial needs.
Although it will not come as a surprise to regular readers that, for various reasons, loan growth in the US hasnot only ground to a halt but, for the all important Commercial and Industrial Segment, has dropped at thefastest rate since the financial crisis, some (until recently) economic optimists, such as Bank of America’s Ethan Harris, are only now start to realize that the post-election “recovery” was a mirage.
A quick recap of where loan creation stood in the last week: according to the Fed’s H.8 statement, things continued to deteriorate, and C&I loans rose just 2.8% Y/Y, the worst reading since the start of the decade and on pace to print a negative number – traditionally associated with recessions – within the next four weeks, while total loans and leases rose by just 3.8% in the last week of March, less than half the stable 8% growth rate observed for much of 2014 and 2015.
Yet while ZeroHedge readers have been familiar with this chart for months, it appears to have been a surprise to BofA’s chief economist. However, in a report titled “Is soft the new hard data?”, Ethan Harris confirms that he has finally observed the sharp swoon lower and is not at all happy by it.
As he writes in his Friday weekly recap note, “this week saw some softness in hard data as auto sales and jobs growth declined sharply. While two observations do not make a trend, this occurrence nevertheless is noteworthy as on the one hand very positive sentiment indicators suggest activity should pick up…
… while on the other hand loan data suggests everybody is in wait-and-see mode pending details of fiscal stimulus (=tax reform) – which highlights the risk of softer hard economic data.”
A frustrated Harris then admits that such a sharp and protracted decline in loan creation has only happened twice before: the 2000 and 2008 recessions.
… the first period of no growth for at least six months since the 2008-2011 aftermath of the financial crisis, and prior to that after the early 2000s recession (Figure 3).
At the same time, consumer loan growth has slowed substantially – just up 1.4% since last November US elections compared with 3.1% the same period the prior year (figure 4).
Then again, with tax reform seemingly dead, not even a formerly uber bullish Harris find much room for optimism…
As tax reform by House Speaker Ryan’s own account is not going to happen anytime soon, and likely will be watered down as the Border Adjustment Tax (BAT) is replaced by a Value Added Tax (VAT) and the elimination of net interest deductibility for corporations, the biggest near term risk to our bullish outlook for credit spreads we maintain is a correction in equities – most likely prompted by weak hard data.
… and concludes by echoingHans Lorenzen’s recent warning, that “the biggest near term risk to our bullish outlook for credit spreads we maintain is a correction in equities – most likely prompted by weak hard data.”
Federal Reserve Shocker! What It Means For Housing
The Federal Reserve has announced it will be shrinking its balance sheet. During the last housing meltdown in 2008, it bought the underwater assets of big banks. It has more than two trillion dollars in mortgage-backed securities that are now worth something because of the latest housing boom. Gregory Mannarino of TradersChoice.net says the Fed is signaling a market top in housing. It pumped up the mortgage-backed securities it bought by inflating another housing bubble. Now, the Fed is going to dump the securities on the market. Mannarino predicts housing prices will fall and interest rates will rise.
The Russian central bank opened its first overseas office in Beijing on March 14, marking a step forward in forging a Beijing-Moscow alliance to bypass the US dollar in the global monetary system, and to phase-in a gold-backed standard of trade.
According to theSouth China Morning Postthe new office was part of agreements made between the two neighbours “to seek stronger economic ties” since the West brought in sanctions against Russia over the Ukraine crisis and the oil-price slump hit the Russian economy.
According to Dmitry Skobelkin, the deputy governor of the Central Bank of Russia, the opening of a Beijing representative office by the Central Bank of Russia was a “very timely” move to aid specific cooperation, including bond issuance, anti-money laundering and anti-terrorism measures between China and Russia.
The new central bank office was opened at a time when Russia is preparing to issue its first federal loan bonds denominated in Chinese yuan. Officials from China’s central bank and financial regulatory commissions attended the ceremony at the Russian embassy in Beijing, which was set up in October 1959 in the heyday of Sino-Soviet relations. Financial regulators from the two countries agreed last May to issue home currency-denominated bonds in each other’s markets, a move that was widely viewed as intended to eventually test the global reserve status of the US dollar.
Speaking on future ties with Russia, Chinese Premier Li Keqiang said in mid-March that Sino-Russian trade ties were affected by falling oil prices, but he added that he saw great potential in cooperation. Vladimir Shapovalov, a senior official at the Russian central bank, said the two central banks were drafting a memorandum of understanding to solve technical issues around China’s gold imports from Russia, and that details would be released soon.
If Russia – the world’s fourth largest gold producer after China, Japan and the US – is indeed set to become a major supplier of gold to China, the probability of a scenario hinted by many over the years, namely that Beijing is preparing to eventually unroll a gold-backed currency, increases by orders of magnitude.
* * *
Meanwhile, as the Russian central bank was getting closer to China, China was responding in kind with the establishment of a clearing bank in Moscow for handling transactions in Chinese yuan. The Industrial and Commercial Bank of China (ICBC) officially started operating as a Chinese renminbi clearing bank in Russia on Wednesday this past Wednesday.
“The financial regulatory authorities of China and Russia have signed a series of major agreements, which marks a new level of financial cooperation,” Dmitry Skobelkin, the abovementioned deputy head of the Russian Central Bank, said.
“The launching of renminbi clearing services in Russia will further expand local settlement business and promote financial cooperation between the two countries,” he added according to.
Irina Rogova, a Russian financial analysttold the Russian magazine Expertthat the clearing center could become a large financial hub for countries in the Eurasian Economic Union.
* * *
Bypassing the US dollar appears to be paying off: according to the Chinese State Administration of Taxation, trade turnover between China and Russia increased by 34% in January, in annual terms. Bilateral trade in January 2017 amounted to $6.55 billion. China’s exports to Russia grew 29.5% reaching $3.41 billion, while imports from Russia increased by 39.3%, to $3.14 billion. Just as many suspected, with Russian sanctions forcing Moscow to find other trading partners, chief among which China, this is precisely what has happened.
The creation of the clearing center enables the two countries to further increase bilateral trade and investment while decreasing their dependence on the US dollar. It will create a pool of yuan liquidity in Russia that enables transactions for trade and financial operations to run smoothly.
In expanding the use of national currencies for transactions, it could also potentially reduce the volatility of yuan and ruble exchange rates. The clearing center is one of a range of measures the People’s Bank of China and the Russian Central Bank have been looking at to deepen their co-operation,Sputnik reported.
One of the most significant measures under consideration is the previouslyreported push for joint organization of trade in gold. In recent years, China and Russia have been the world’s most active buyers of the precious metal. On a visit to China last year, the deputy head of the Russian Central Bank Sergey Shvetsov said that the two countries want to facilitate more transactions in gold between the two countries.
“We discussed the question of trade in gold. BRICS countries are large economies with large reserves of gold and an impressive volume of production and consumption of this precious metal. In China, the gold trade is conducted in Shanghai, in Russia it is in Moscow. Our idea is to create a link between the two cities in order to increase trade between the two markets,” First Deputy Governor of the Russian Central Bank Sergey Shvetsov toldRussia’s TASS news agency.
In other words, China and Russia are shifting away from dollar-based trade, to commerce which will eventually be backstopped by gold, or what is gradually emerging as an Eastern gold standard, one shared between Russia and China, and which may day backstop their respective currencies.
Meanwhile, the price of gold continues to reflect none of these potentially tectonic strategic shifts, just as China – which has been the biggest accumulator of gold in recent years – likes it.
(informative economic commentary video at the end) For months we’ve been talking about the massive lending bubble propping up the U.S. auto market. Now, noting many of the same concerns that we’ve highlighted repeatedly, Morgan Stanley’s auto team, led by Adam Jonas, has just issued a report detailing why they think used car prices could crash by up to 50% over the next 4-5 years.
Here’s the summary (flood of supply, poor lending standards and desperate OEMs who need to keep new car sales elevated at all costs):
Off-lease supply: This has already more than doubled since 2012 and is set to rise another 25% over the next 2 years.
Extended credit terms: Auto loans are at record lengths and lease assumptions (residuals, money factor) are at record levels of accommodation.
Rising rates: Starting from record low levels in auto loans.
Overdependency on auto ABS: The outstanding balance of auto securitizations has surpassed last cycle’s peak.
Record high deep subprime participation:32% of subprime auto ABS deals were deep subprime (weighted average FICO < 550) in 2016 vs. 5% in 2010.
Record high units of new car inventory:2016YE unit inventory levels were near 10% higher than 2015YE, and are continuing to trend higher in 2017.
OEM price competition: Car manufacturers have capacitized to a 19mm or 20mm SAAR. At this point in the cycle we start seeing more money ‘on the hood’ to move the metal. As new car prices fall, used prices look relatively more expensive, which necessitates a decline in used prices to equilibrate the supply/demand imbalance.
Increased ADAS penetration: We expect auto firms to achieve nearly 100% active safety penetration by 2020, creating an unprecedented safety gap between new and used vehicles, accelerating obsolescence of the used stock. Rising insurance premiums on older cars could accelerate this shift.
Trouble in the car rental market: Due to a number of secular shifts, including how consumers access transportation options (e.g. ride sharing), car rental firms are facing stagnant growth, weak pricing and over-fleeted conditions. As these cars hit the auction, the impact on prices could be significant.
All of which Morgan Stanley thinks could spark a 50% decline in used car prices over the next couple of years. So, for all of you pension funds out there scooping up all of the AAA-rated slugs of the latest auto ABS deals for the ‘juicy yield’, now might be a good time to review what happened to the investment grade tranches of MBS structures back in 2009 when home prices crashed by similar amounts.
And here are the stats…
Off-lease volumes have already doubled since 2012 and are only expected to get
worse…meanwhile, lending standards have gradually gotten worse and worse…
…as further revealed by the growing share of ‘deep subprime’ loans in auto ABS deals.
Of course, so far negative equity hasn’t been a problem for car buyers because lenders have been all too willing to roll those debt balances into new loans. And, courtesy of low rates and stretched out terms, consumers haven’t really cared that their debt balances are ballooning so long as their monthly payments remain low.
Meanwhile, none of the warnings about a flood of used car volumes about to hit the market has impacted new car volumes being pushed on to dealer lots.
All of which results in this fairly brutal outlook for used car prices:
Dear OEMs, the first step is admitting you have a problem.
Musktopia Here We Come!
It ought to be sign of just how delusional the nation is these days that Elon Musk of Tesla and Space X is taken seriously. Musk continues to dangle his fantasy of travel to Mars before a country that can barely get its shit together on Planet Earth, and the Tesla car represents one of the main reasons for it — namely, that we’ll do anything to preserve, maintain, and defend our addiction to incessant and pointless motoring (and nothing to devise a saner living arrangement).
Even people with Ivy League educations believe that the electric car is a “solution” to our basic economic quandary, which is to keep all the accessories and furnishings of suburbia running at all costs in the face of problems with fossil fuels, especially climate change. First, understand how the Tesla car and electric motoring are bound up in our culture of virtue signaling, the main motivational feature of political correctness. Virtue signaling is a status acquisition racket. In this case, you get social brownie points for indicating that you’re on-board with “clean energy,” you’re “green,” “an environmentalist,” “Earth –friendly.” Ordinary schmoes can drive a Prius for their brownie points. But the Tesla driver gets all that and much more: the envy of the Prius drivers!
This is all horse shit, of course, because there’s nothing green or Earth-friendly about Tesla cars, or electric cars in general. Evidently, many Americans think these cars run on batteries. No they don’t. Not really. The battery is just a storage unit for electricity that comes from power plants that burn something, or from hydroelectric installations like Hoover Dam, with its problems of declining reservoir levels and aging re-bar concrete construction. A lot of what gets burned for electric power is coal. Connect the dots. Also consider the embedded energy that it takes to just manufacture the cars. That had to come from somewhere, too.
The Silicon Valley executive who drives a Tesla gets to feel good about him/her/zheself without doing anything to change him/her/zhe’s way of life. All it requires is the $101,500 entry price for the cheapest model. For many Silicon Valley execs, this might be walking-around money. For the masses of Flyover Deplorables that’s just another impossible dream in a growing list of dissolving comforts and conveniences.
In fact, the mass motoring paradigm in the USA is already failing not on the basis of what kind of fuel the car runs on but on the financing end. Americans are used to buying cars on installment loans and, as the middle class implosion continues, there are fewer and fewer Americans who qualify to borrow. The regular car industry (gasoline branch) has been trying to work around this reality for years by enabling sketchier loans for ever-sketchier customers — like, seven years for a used car. The borrower in such a deal is sure to be “underwater” with collateral (the car) that is close to worthless well before the loan can be extinguished. We’re beginning to see the fruits of this racket just now, as these longer-termed loans start to age out. On top of that, a lot of these janky loans were bundled into tradable securities just like the janky mortgage loans that set off the banking fiasco of 2008. Wait for that to blow.
What much of America refuses to consider in the face of all this is that there’s another way to inhabit the landscape: walkable neighborhoods, towns, and cities with some kind of public transit. Some Millennials gravitate to places designed along these lines because they grew up in the ‘burbs and they know full well the social nullity induced there. But the rest of America is still committed to the greatest misallocation of resources in the history of the world: suburban living. And tragically, of course, we’re kind of stuck with all that “infrastructure” for daily life. It’s already built out! Part of Donald Trump’s appeal was his promise to keep its furnishings in working order.
All of this remains to be sorted out. The political disorder currently roiling America is there because the contradictions in our national life have become so starkly obvious, and the first thing to crack is the political consensus that allows business-as-usual to keep chugging along. The political turmoil will only accelerate the accompanying economic turmoil that drives it in a self-reinforcing feedback loop. That dynamic has a long way to go before any of these issues resolved satisfactorily.
Los Angeles, home to one ofthe least affordable housing marketsin North America, is now proposing to expand rent control to “fix” its housing problem.
As with all price control schemes, rent control will serve only to make housing affordable to a small sliver of the population while rendering housing more inaccessible to most.
Specifically, city activists hope that a new bill in the state legislature, AB1506,will allow local governments, Los Angeles included, to expand the number of units covered by rent control laws while also restricting the extent to which landlords can raise rents.
Unintended Consequences
Currently, partial rent control is already in place in Los Angeles and landlords there are limited in how much they can raise rents on current residents. However,according to LA Weekly, landlords are free to raise rents to market levels for a unit once that unit turns over to new residents.
This creates a situation of perverse incentives that do a disservice to both renters and landlords. Under normal circumstances, landlords want to minimize turnover among renters because it is costly to advertise and fill units, and it’s costly to prepare units for new renters. (Turnover is also costly and inconvenient for renters.)
By limiting rent growth for ongoing renters, however, this creates an incentive for landlords to break leases with residents — even residents who the landlords may like — just so the landlords can increase rents for new incoming renters in order to cover their costs of building maintenance and improvements. The only upside to this current regime is that at least this partial loophole still allows for some profit to be made, and thus allows for owners to produce and improve housing some of the time.
But, if this loophole is closed, as the “affordable housing” activists hope to do, we can look forward to even fewer housing units being built, current units falling into disrepair, and even less availability of housing for residents.
Why Entrepreneurs Bring Products to Market
The reason fewer units will be built under a regime of harsher rent control, is because entrepreneurs (i.e., producers) only bring goods and services to market if they can be produced at a cost below the market price.
In fact, producers are at the mercy of the renters who — in the absence of price controls — determine the price level at which entrepreneurs must produce housing before they can expect to make any profit.
However, when governments dictate that rent levels must be below what would have been market prices — and also below the level at which new units can be produced and maintained — then producers of housing will look elsewhere.
Henry Hazlittexplainsmany of the distortions and bizarre incentives that emerge from price control measures:
The effects of rent control become worse the longer the rent control continues. New housing is not built because there is no incentive to build it. With the increase in building costs (commonly as a result of inflation), the old level of rents will not yield a profit. If, as often happens, the government finally recognizes this and exempts new housing from rent control, there is still not an incentive to as much new building as if older buildings were also free of rent control. Depending on the extent of money depreciation since old rents were legally frozen, rents for new housing might be ten or twenty times as high as rent in equivalent space in the old. (This actually happened in France after World War II, for example.) Under such conditions existing tenants in old buildings are indisposed to move, no matter how much their families grow or their existing accommodations deteriorate.
Thus,
Rent control … encourages wasteful use of space. It discriminates in favor of those who already occupy houses or apartments in a particular city or region at the expense of those who find themselves on the outside. Permitting rents to rise to the free market level allows all tenants or would-be tenants equal opportunity to bid for space.
Nor surprisingly, when we look into the current rent-control regime in Los Angeles, we find that newer housing is exempt, just as Hazlitt might have predicted. Unfortunately, housing activists now seek to eliminate even this exemption, and once these expanded rent controls are imposed, those on the outside won’t be able to bid for space in either new or old housing.
Newcomers will be locked out of all rent-controlled units — on which the current residents hold a death grip — and they can’t bid on the units that were never built because rent control made new housing production unprofitable. Thus, as rent control expands, the universe of available units shrinks smaller and smaller. Renters might flee to single-family rental homes where rent increases might still be allowed, or they might have to move to neighboring jurisdictions that might not have rent controls in place.
In both cases, the effect is to reduce affordability and choice. By pushing new renters toward single-family homes this makes single-family homes relatively more profitable than multi-family dwellings, thus reducing density, and robbing both owners and renters of the benefits of economies of scale that come with higher-density housing. Also, those renters who would prefer the amenities of multi-family communities are prevented from accessing them. Meanwhile, by forcing multi-family production into neighboring jurisdictions, this increases commute times for renters while forcing them into areas they would have preferred not to live in the first place.
But, then again, for many local governments — and the residents who support them — fewer multi-family units, lower densities, and fewer residents in general, are all to the good. After all, local government routinely prohibit developers from developing more housing through zoning laws, regulation of new construction, parking requirements, and limitations on density.
And these local ordinances, of course, are the real cause of Los Angeles’s housing crisis. Housing isn’t expensive in Los Angeles because landlords are greedy monsters who try to exploit their residents. Housing is expensive because a large number of renters are competing for a relatively small number of housing units.
And why are there so few housing units? Because the local governments usually drive up the cost of housing. Asthis reportfrom UC Berkeley concluded:
In California, local governments have substantial control over the quantity and type of housing that can be built. Through the local zoning code, cities decide how much housing can theoretically be built, whether it can be built by right or requires significant public review, whether the developer needs to perform a costly environmental review, fees that a developer must pay, parking and retail required on site, and the design of the building, among other regulations. And these factors can be significant – a 2002 study by economists from Harvard and the University of Pennsylvania found strict zoning controls to be the most likely cause of high housing costs in California.
Contrary to what housing activists seem to think, declaring that rents shall be lower will not magically make more housing appear. Put simply, the problem of too little housing — assuming demand remains the same — can be solved with only one strategy: producing more housing.
Rent control certainly won’t solve that problem, and if housing advocates need to find a reason why so little housing is being built, they likely will need to look no further than the city council.
One of the most significant financial trends to sweep the country is more of a hit with homeowners than refinance mortgage lenders.
Logically, it sure seems as though a loan application which shows extra income through short-term room rentals would be a winner, something that would greatly please mortgage lenders.
The catch is that it’s not a sure thing, and in some cases, room rentals could actually be a negative.
New Trend Creates Uncertainty
Across the country, a number of electronic platforms now allow those with extra space to provide short-term housing.
National services such as Airbnb, Flipkey, HomeAway and VRBO are at the heart of this new business, one which takes an idle asset – that unused mother-in-law suite or extra bedroom – and puts it to use.
The result is that many homeowners are now getting cash for their quarters, money that can help with monthly bills and even mortgage payments.
At first, short-term home rentals seem like a win-win business proposition: the homeowner earns income while the traveler gets space for a few days, space that might be a lot cheaper than standard-issue hotel rooms.
The catch is that although the cash earned from short-term rentals is real, it may not automatically count on a mortgage application.
Home Rentals And Your Refinance Mortgage
For a very long time, there has been a business which offers short-term rentals — the hotel industry. Like most industries, it has not been shy about seeking legal protections for its products and services.
Check the local rules for virtually all jurisdictions, and you will find laws on the books which prohibit unlicensed short-term rentals or leases of fewer than 30 days.
These laws are largely unenforced, but that is changing. According to the New York Post, on October 21, 2016, New York Governor Cuomo signed a bill that would impose fines of up to $7,500 against hosts who posted short-term rentals. A California couple who had already paid $2,081 for their room found themselves with nowhere to stay when another resident reported their host to the authorities.
Rental Income: Is It Reported?
For lenders, the new surge in short-term rentals raises a number of issues. The money is nice, and congratulations on that, but whether such funds can be counted in a refinance home loan application is uncertain. Here’s why:
First, the lender will want to see that the rental income has been reported on tax returns. If income is not reported, it doesn’t usually count.
Note that if you report short-term rental income, it may not be taxable, depending on how many nights the property was rented. See a tax professional for details.
Is It Legal?
Second, if the income is reported, was it legally obtained? Here we get back to those sticky local rules that ban short-term rentals.
Lenders like to see income that’s ongoing, because mortgages tend to be lengthy obligations lasting 15 or 30 years.
If cash is coming from unlicensed room rentals, there is the possibility that the money might be cut off at any moment by an irate neighbor who reports the matter to local authorities.
Is It Your Primary Residence?
Third, is the property a residence? Mortgage lenders generally are in the business of financing homes with one-to-four units, and the best refinance rates go to those being used as primary residences.
New York state found that six percent of the units it studied captured almost 40 percent of the private short-term rental income.
In other words, some properties did a lot of short term rentals, a volume which will make lenders wonder whether the property is a comfy residence or an unlicensed hotel.
It’s not just lenders who will have such questions. The property will have to be appraised and that’s where problems are likely to arise.
Home, Sweet Boarding House?
Francois (Frank) K. Gregoire, an appraiser based in St. Petersburg and a nationally-recognized valuation authority, notes that “a room rental situation, depending on the number of rooms, may shift the use of the property from single or multifamily to a business use, such as a hotel or rooming house.
“If there are more than four units, the property is outside the one to four units certified residential appraisers are permitted to appraise, and outside the one to four unit limitation for loan purchase by Fannie and Freddie.”
The Future Of Short-Term Rentals
While the current situation is muddled and puzzled, there’s a very great likelihood that short-term home rentals will be increasingly legitimatized.
In the same way that Uber has disrupted the traditional cab industry, the odds are that the same thing will happen with short-term rentals. The reason is that the private rental rules now on the books were passed when no one cared and are largely unenforced.
Now, the landscape has changed. A very large number of homeowners want to be in the short-term rental business, or are at least disinclined to report their neighbors.
The police surely don’t want to break into homes in search of paying guests, and state and local lawmakers really want homeowner votes.
Be Careful Out There
For the moment, homeowners with an interest in earning a few extra dollars from short-term home rentals should get advice and counsel from a local real estate attorney before signing up guests.
In addition, speak with your insurance broker to assure that you have adequate coverage. Some policies allow short-term rentals, some do not, and there are differing definitions regarding what is or is not an allowable short-term rental.
A 56-year-old partner at Paulson & Co., who was best known for losing billions of his clients’ money to Bernie Madoff’s Ponzi scheme when he ran the Fairfield Greenwich fund of funds, leaped to his death from the luxury Sofitel hotel in midtown Manhattan. Charles W. Murphy was wearing a dark business suit when he plunged to his death from the 24th floor of the 45 W. 44th St. building at around 4:42pm on Monday.
Murphy was working at the Fairfield Greenwich Group when Madoff was arrested in December 2008; as a result of the fraud Fairfield Greenwich lost $7.5 billion of its customers’ cash. In December 2013, Fairfield Greenwich settled a class action suit for $80. 2million, according to a website for Madoff’s victims. They were sued for failing to protect investor assets. Almost 3,000 investors claimed a portion of the settlement. Murphy was a Partner and Member of the Executive Committee.
The group’s Fairfield Sentry Fund was the disgraced financier’s biggest feeder fund. Up until the scandal, the fund had been paid more than 11 percent interest each year following a 15-year relationship with Madoff.
At the time of his death, Murphy was working with Paulson & Company.
Founder John Paulson released a statement on Monday night saying ‘We are extremely saddened by this news. Charles was an extremely gifted and brilliant man, a great partner and a true friend.’
Charles Murphy, above with his second wife Annabella. Murphy was renting a room at the time, even though he owns a $36 million townhouse just 20 blocks away on the Upper East Side.
The father-of-two financier, who was married to his second wife, plummeted 20 floors before hitting a fourth floor terrace, according to the NYPD, and died at the sceneaccording to the Mail.
The Sofitel hotel where Murphy killed himself made headlines in 2011, when French politician and head of the IMF, Dominique Strauss-Kahn, was accused of raping a maid in one of the hotel’s suites. Three months later, all charges were dismissed. In 2012, he settled a lawsuit with the maid.
Murphy jumped from the 24th floor of the Sofitel hotel in midtown Manhattan. He landed on a terrace four stories above the street; medics had difficulty reaching him.
Murphy’s limestone townhouse on 67th street is still on the market for $36MM
On the day Madoff was taken into federal custody in 2008, Murphy was working with Fairfield to set up a new fund. The Koch brothers, Charles and David, moved $2 billion overseas that they managed to make from Madoff before his scheme collapsed. Most of that involved transfers from funds that were operated by Fairfield Greenwich Group.
Murphy is now the fourth person connected to Madoff to commit suicide in the years following the Ponzi scheme scandal. French aristocrat Rene Thierry Magon De La Villehuchet was found dead in 2008 just after the news broke. His AIA Group lost $1.5 billion. Ex-U.S. Army major William Foxton, 65, killed himself in 2009. A year later, Madoff’s son Mark was found dead after he hanged himself in his New York apartment.
Murphy was previously a research analyst at Morgan Stanley, and was cohead of the European financial institutions group at Credit Suisse. He graduated from Harvard Law School and MIT Sloan School of Management according to the Mail.
In 2007, before the Madoff collapse, Murphy bought the East 67th Street townhouse of Matthew Bronfman for $33 million. Murphy reportedly tried to off-load the limestone gem, built in 1899, during the Madoff crisis but found no takers. He listed it again in 2016 for $50million, according toThe Real Deal. The house is now for sale at an asking price of $36 million, listed withCorcoran
It appears that at least part of Murphy’s troubles have been financial: a parking attendant at a nearby garage told the New York Post that Murphy’s wife, Annabella , crashed their Honda Odyssey last summer but could not afford to fix it. ‘She didn’t even have enough money to pay for the damage,’ the attendant said.
Murphy’s first wife, former Heather Kerzner, got married to hotel billionaire Sol Kerzner after the pair split. They were married for 11 years before their marriage ended in divorce.
According to theDaily News, Murphy was being treated for depression before his suicide.
Obama administration looted investors to fund Obamacare
WASHINGTON, D.C. – A whistleblower who filed last week a formal complaint with the Federal Housing Finance Authority (FHFA) Office of Inspector General (OIG) provided Infowars.com with a document leaked from Freddie Mac that proves both Freddie Mac and Fannie Mae are currently out-of-compliance with Security and Exchange Commission (SEC) filing requirements.
The whistleblower – a CPA who worked in risk management for Freddie Mac from 2014 to 2016 – explained to Infowars.com the leaked internal document was created by Freddie Mac auditors in the preparation of Freddie Mac’s 2015 filing with the SEC of the Government Sponsored Entities (GSEs) Form 10-Q and 10-K – two SEC forms that require auditors to review and management to submit a comprehensive financial summary of the entity’s performance.
“Freddie Mac management was and is aware that the GSEs equity shares have no value due to the Net Worth Sweep (NSW) but have not disclosed this in any public filing, including not in their 10-Q and 10-K filings,” the whistleblower told Infowars.com.
“At a minimum, Freddie Mac management is complicit with FHFA in the erosion of the property rights of shareholders and likely complicit in securities fraud with FHFA, as Freddie Mac’s management has not disclosed to the public that they are aware Freddie Mac equity has zero value.”
The NWS traces to Aug. 17, 2012, the Federal Housing Financial Agency and the Department of Treasury engineered an amendment to the Senior Preferred Stock Purchase Agreements through which Treasury had invested in Fannie and Freddie to allow the U.S. Treasury to grab ALL Fannie and Freddie earnings, regardless how large Fannie and Freddie’s profits might be.
“The document leaked from Freddie Mac is an internal memo prepared by the auditors (either internal or external) to management discussing their thresholds for materiality for their testing,” the whistleblower explained. “This document was prepared for a ‘review’ (the level below an audit in terms of assurance) and is done in conjunction of filing quarterly SEC filings like the 10-Q.”
“The auditors would have met with management for interviews to allow the auditors to gain an understanding of the organization itself, its operations, financial reporting, and known fraud or error.”
On Page 8 of the leaked report, the Freddie Mac auditors and management write: “We see no value in the common shares or the junior preferred shares as the Net Worth Sweep dividend effectively prohibits Freddie Mac from rebuilding capital despite the return to operating profitability.”
No similar statement from the auditors and management of the GSE effectively considered Freddie Mac as headed toward a situation where the Treasury had robbed Freddie Mac of all shareholder value by confiscating some $260 billion from Freddie Mac and Fannie Mae since 2012 by sweeping all earnings under the NWS from the GSEs into the Treasury’s general fund.
“This is shocking because SEC regulations required the auditors and management of Freddie Mac, when reporting the GSEs audited financial statements (including 10-K and 10-Q Forms) to report their financials not as a ‘going concern,’ but as a liquidation,” the Whistleblower stressed. “Additionally, Freddie Mac management states in the report, ‘The Treasury, which holds a warrant to purchase nearly eighty percent of our common stock, has recommended that our company be wound down.”
“FHFA, as an independent agency, has a fiduciary responsibility to Freddie Mac as it ‘has all rights of stockholders’ and therefore, FHFA as an independent agency, should not be taking direction from another agency,” the Whistleblower emphasized.
“Freddie Mac management was and is aware that the equity shares have no value due to the net worth sweep but have not disclosed this in any public filing,” the Whistleblower concluded.
“At a minimum, Freddie Mac management is complicit with FHFA in the erosion of the property rights of shareholders and likely complicit in securities fraud with FHFA as Freddie Mac’s management has not disclosed that they are aware the equity has zero value.”
New home sales shot up 6.1% in February aided by 39% jump in the mid-west but a 21.4% decline in the Northeast.
Sales came in just a bit below the topEconodayestimate.
New home sales shot 6.1 percent higher in February to a 592,000 annualized rate that easily beats the Econoday consensus for 565,000 and is near the top estimate of 600,000. Sales appeared to have gotten a boost from builder concessions as the median price fell a monthly 3.9 percent to $296,200 for a year-on-year rate that’s suddenly in the negative column at minus 4.9 percent.
Strength is centered in the Midwest where the sales rate surged 21,000 to 89,000 and easily surpassing 11,000 gains for the both the West, at 157,000, and the South at 313,000. Sales in the Northeast fell sharply in yesterday’s existing home sales report and are down 9,000 to a very low 33,000 annualized rate in today’s report.
Supply of new homes did rise slightly in the month, up 4,000 to 266,000 currently on the market, but relative to sales supply fell to 5.4 months from 5.6 months. Supply has been thin all cycle for new homes and was at 5.5 months in February last year.
Most of the news is good in this report underscored by the average price which, reflecting high-end properties, jumped 9.9 percent in the month for a yearly 11.7 percent gain at $390,400 and a new record. Today’s report helps offset weakness in existing home sales and keeps the housing sector on a moderately climbing slope.
New home sales posted a much better February than did existing home sales and, in fact, better than most analysts had expected.
It was the second consecutive month of strength for the indicator which had see-sawed between positive and negative results in the waning months of 2016.
On a non-seasonally adjusted basis, there were 49,000 new homes sold in February compared to 41,000 in January. Thirty-six-thousand of the homes sold were in the $200,000 to 299,000 price tier.
The median price of a new home sold in February was 296,200 compared to $311,300 a year earlier. The average price was $390,400 compared to $349,400.
There were strong geographic differences in the rate of sales. In the Northeast, sales were down 21.4 percent for the month while remaining 13.8 percent higher than the previous February. In contrast, the Midwest posted a 30.9 percent month-over-month improvement and the annual change was 50.8 percent.
Sales in the South rose 3.6 percent from January and 7.9 percent from February 2016 and sales in the West were up 7.5 percent and 6.8 percent from the two earlier periods.
At the end of February, there were an estimated 261,000 homes available for sale on a non-seasonally adjusted basis. This is an estimated 5.4-month supply at the current rate of sale. Sixty-three-thousand of the available homes are completed, construction had not started on 51,000.
Median vs Average Sale
It’s interesting to see the median price dropping with the average price soaring. It’s a tale of two economies and who is and isn’t gaining.
That said, these swings are so wild, I smell revisions.
Dr. Ben Carson testifies before a Senate Banking, Housing and Urban Affairs Committee confirmation hearing on his nomination to be Secretary of the U.S. Department of Housing and Urban Development on Capitol Hill in Washington, U.S. January 12, 2017. REUTERS/Kevin Lamarque
Department of Housing and Urban Development’s (HUD’s) financial books are in such bad shape that HUD’s Inspector General (IG) can’t complete an audit even after HUD officials corrected $520 billion in bookkeeping errors,according to a new IG report.
Officials at HUD fixed $3.4 billion in errors from its 2015 books and $516.4 billion in errors from its 2016 books after the IG in December was unable to issue an opinion on either year’s financial statements and highlighted 11 material weaknesses, seven significant deficiencies and five instances of failure to comply with laws and regulations.
These same problems have been reported for three straight years by the IG.
One can only stand aghast at the incompetence on display. No wonder the government has put us all near the brink of financial ruin. If this was a private company, you can guarantee people would be going to prison.
So pretty much everything the law requires be done for financial accountability was totally ignored. Given the deplorable state of his former department, you would think Castro would hang his head in shame. You would be wrong! He actually tried to give Ben Carson advice on how not to screw up his department. What a joke!
Former HUD Secretary Julian Castro
This department seems to have a great mission, but as usual, Democrats have totally ruined it. Let’s hope Ben Carson can use some of that brilliance he’s known for to clean this department from top to bottom. The first thing he should do is fire all the Obama appointees who are doing shady things with our tax dollars.
U.S. home resales fell more than expected in February amid a persistent shortage of houses on the market that is pushing up prices and sidelining potential buyers.
The National Association of Realtors said on Wednesday existing home sales declined 3.7 percent to a seasonally adjusted annual rate of 5.48 million units last month.
January’s sales pace was un-revised at 5.69 million units, which was the highest level since February 2007. Economists polled by Reuters had forecast sales decreasing 2.0 percent to a pace of 5.57 million units last month.
“Realtors are reporting stronger foot traffic from a year ago, but low supply in the affordable price range continues to be the pest that’s pushing up price growth and pressuring the budgets of prospective buyers,” said Lawrence Yun, the NAR’s chief economist.
Sales were up 5.4 percent from February 2016, underscoring the sustainability of the housing market recovery despite rising mortgage rates. In February, houses typically stayed on the market for 45 days, down from 50 days in January.
U.S. financial markets were little moved by the data as investors increasingly worried whether President Donald Trump would be able to push ahead with his pro-growth policies. The dollar fell against a basket of currencies and U.S. stocks were trading mostly lower. Prices for U.S. government bonds fell.
The 30-year fixed mortgage rate is hovering at 4.30 percent.
Home loans could cost more after the Federal Reserve last week raised its benchmark overnight interest rate by 25 basis points to a range of 0.75 percent to 1.00 percent. The U.S. central bank has forecast two more rate hikes for 2017.
BUOYANT LABOR MARKET
Demand for housing is being buoyed by a labor market that is near full employment. But home sales remain constrained by the dearth of properties available for sale, which is keeping prices elevated.
While the number of homes on the market increased 4.2 percent to 1.75 million units last month, housing inventory remained close to the all-time low of 1.65 million units hit in December. Supply was down 6.4 percent from a year ago.
Housing inventory has dropped for 21 straight months on a year-on-year basis. With supply remaining tight, the median house price surged 7.7 percent from a year ago to $228,400 in February. That marked the 60th consecutive month of year-on-year price gains.
Builders have been unable to fill the housing inventory gap, citing rising prices for materials, higher borrowing costs, and shortages of lots and labor.
Lennar Corp, the second-largest U.S. homebuilder, reported on Tuesday a drop in quarterly gross margin as the company struggled with higher land and construction costs.
The Florida-based builder, however, sold 5,453 homes in the first quarter ended Feb. 28, up from 4,832 homes in the year-earlier period, and reported a 12 percent jump in orders.
The NAR estimates housing starts and completions should be in a range of 1.5 million to 1.6 million units to alleviate the chronic shortage. Housing starts are running above a rate of 1.2 million units and completions around a pace of 1 million units.
At February’s sales pace, it would take 3.8 months to clear the stock of houses on the market, up from 3.5 months in January. A six-month supply is viewed as a healthy balance between supply and demand. Though higher prices are increasing equity for homeowners and might encourage some to put their homes on the market, they could be sidelining first-time buyers from the market. First-time buyers accounted for 32 percent of transactionslast month, well below the 40 percent share that economists and realtors say is needed for a robust housing market.
That was down from 33 percent in January but up from 30 percent a year ago.
How OPEC Lost The War Against US Shale, In One Chart
At the start of Marchwe showed a fascinating chart from Rystad Energy, demonstrating how dramatic the impact of technological efficiency on collapsing US shale production costs has been: in just the past 3 years, the wellhead breakeven price for key shale plays has collapsed from an average of $80 to the mid-$30s…
.. resulting in drastically lower all-in break evens for most US shale regions.
Today, in a note released by Goldman titled “OPEC: To cut or not to cut, that is the question”, the firm presents a chart which shows just as graphically how exactly OPEC lost the war against US shale: in one word: the cost curve has massively flattened and extended as a result of “shale productivity” driving oil breakeven in the US from $80 to $50-$55, in the process sweeping Saudi Arabia away from the post of global oil price setter to merely inventory manager.
This is how Goldman explains it:
Shale’s short time to market and ongoing productivity improvements have provided an efficient answer to the industry’s decade-long search for incremental hydrocarbon resources in technically challenging, high cost areas and has kicked off a competition amongst oil producing countries to offer attractive enough contracts and tax terms to attract incremental capital. This is instigating a structural deflationary change in the oil cost curve, as shown in Exhibit 2. This shift has driven low cost OPEC producers to respond by focusing on market share, ramping up production where possible, using their own domestic resources or incentivizing higher activity from the international oil companies through more attractive contract structures and tax regimes. In the rest of the world, projects and countries have to compete for capital, trying to drive costs down to become competitive through deflation, FX and potentially lower tax rates.
The implications of this curve shift are major, all of which are very adverse to the Saudis, who have been relegated from the post of long-term price setter to inventory manager, and thus the loss of leverage. Here are some further thoughts from Goldman:
OPEC role: from price setter to inventory manager In the New Oil Order, we believe OPEC’s role has structurally changed from long-term price setter to inventory manager. In the past, large-scale developments required seven years+ from FID to peak production, giving OPEC long-term control over oil prices. US shale oil currently offers large-scale development opportunities with 6-9 months to peak production. This short-cycle opportunity has structurally changed the cost dynamics, eliminating the need for high cost frontier developments and instigating a competition for capital amongst oil producing countries that is lowering and flattening the cost curve through improved contract terms and taxes.
OPEC’s November decision had unintended consequences: OPEC’s decision to cut production was rational and fit into the inventory management role. Inventory builds led to an extreme contango in the Brent forward curve, with 2-year fwd Brent trading at a US$5.5/bl (11%) premium to spot. As OPEC countries sell spot, but US E&Ps sell 30%+ of their production forward, this was giving the E&Ps a competitive advantage. Within one month of the OPEC announcement, the contango declined to US$1.1/bl (2%), achieving the cartel’s purpose. However, the unintended consequence was to underwrite shale activity through the credit market.
Stability and credit fuel overconfidence and strong activity: A period of stability (1% Brent Coefficient of Variation ytd vs. 6% 3-year average) has allowed E&Ps to hedge (35% of 2017 oil production vs. 21% in November) and access the credit market, with high yield reopen after a 10- month closure (largest issuance in 4Q16 since 3Q14). Successful cost repositioning and abundant funding are boosting a short-cycle revival, with c.85% of oil companies under our coverage increasing capex in 2017.
That said, the new equilibrium only works as long as credit is cheap and plentiful. If and when the Fed’s inevitable rate hikes tighten credit access for shale firms, prompting the need for higher margins and profits, the old status quo will revert. As a reminder, this is how over a year ago Citi explained the dynamic of cheap credit leading to deflation and lower prices:
Easy access to capital was the essential “fuel” of the shale revolution. But too much capital led to too much oil production, and prices crashed. The shale sector is now being financially stress-tested, exposing shale’s dirty secret: many shale producers depend on capital market injections to fund ongoing activity because they have thus far greatly outspent cash flow.
This is the key ingredient of what Goldman calls the shift to a new “structural deflationary change in the oil cost curve” as shown in chart above. As such, there is the danger that tighter conditions will finally remove the structural pressure for lower prices. However, judging by recent rhetoric by FOMC members, this is hardly an imminent issue, which means Saudi Arabia has only bad options: either cut production, prompting higher prices and even greater shale incursion and market share loss for the Kingdom, or restore the old status quo, sending prices far lower, and in the process collapsing Saudi government revenues potentially unleashing another budget crisis.
Important considerations for those who acquire and leverage real estate with financial market assets.
Another paradoxical observation emerges when combing through the latest Bank of America data.
First, asdiscussed earlier today, while a net 48% of surveyed fund managers had an allocation to equities in March, the highest in two years, this flood into stocks has taken place even as the highest number of respondents since 2000 admitted stocks were overvalued.
That was one part.
The other part is that while fund managers respond that they are loading up on stocks, what they are doing is very different, and as BofA’s Jill Hall reported overnight, the bank’s clients sold stocks for the fifth consecutive week led entirely by institutional clients.
According to the report, last week, during which the S&P 500 climbed 0.2% (but remained below its early-March highs), BofA clients were net sellers of US equities for the fifth consecutive week, in the amount of $891MM. ETFs continued to see muted inflows, while single stocks saw outflows. There was one smallchange: unlike the previous four weeks, when sales had been broad-based across client groups, net sales last week were entirely due to institutional clients, while private clients and hedge funds were net buyers for the first time in five and seven weeks, respectively. These two groups had been the chief buyers of equities post-election prior to the recent selling streak. In other words, while previously the great rotation was out of institutions and hedge funds to “animal spirited” rich retail investors, last week hedge funds joined the buy parade, perhaps pressured by a need to catch up to their benchmark at quarter-end, and buy any overvalued garbage they could find.
More Details:
Clients were net sellers across all three size segments last week. Buybacks by corporate clients slowed from the prior week’s levels, and year-to-date continue to track their lowest of any comparable period since 2013.
Biggest buying of Health Care stocks in over a year
Clients sold stocks in eight of the eleven sectors last week, led by Consumer Discretionary and Industrials (which have both seen net sales for the last five weeks). Real Estate-the worst-performing sector in March-continues to have the longest selling streak (for seven consecutive weeks).
And amid the Fed rate hike last week, Utilities saw their biggest sales in three months. Health Care stocks saw the largest net buying, with the biggest inflows since last January and the first positive flows in six weeks, driven by institutional clients. This sector saw the greatest outflows of any sector in 2016 and has seen the second-largest outflows (after Discretionary) year-to-date.
Bearish sentiment, light positioning and attractive valuations are several reasons we are positive on Health Care stocks, where we see political risks as overly discounted. Other sectors which saw inflows last week were Materials and Telecom, where flows into Materials were the largest since last February.
Other notable flows: Broad-based sales of Disc. & bond proxies
Hedge funds, private clients and institutional clients alike were net sellers of Consumer Discretionary stocks last week-which typically underperform during tightening cycles-along with stocks in the bond-proxy sectors of Utilities and Real Estate. No sector saw net buying by all three groups.
Hedge funds’ net buying last week was spread across five cyclical sectors, while private clients’ net buying was entirely in ETFs and Financials stocks last week.
Pension fund clients were net sellers of US stocks for the second straight week, led by sales of ETFs and Real Estate stocks. Their biggest purchases last week were of Energy stocks. For more details, see Pension fund flows.
Finally, here is the breakdown of institutional, HF and retail client flow prior to US election through present. What it clearly shows is that the whole rally has been one “great rotation” from selling institutional investors to buying “animal spirited” retail traders.
And when institutions sell enough, the bottom from the market is pulled, retail panics to sell as the S&P tumbled, institutions reload, and the whole cycle repeats.
110-Day Streak Is Over – S&P Drops 1% For First Time Since October
The S&P 500 is down over 1% this morning. While in the old normal that would be nothing much to note, in the new normal, this is the biggest drop since October 11th!
The 110-day streak without a 1% drop is over… this was the longest streak since May 1995
Below is a look at historical streaks of trading days without a 1%+ decline going back to 1928:
VIX topped 12.5 for the first time since february and is breaking towards its 100DMA…
And for those expecting The Fed to step in and save the day… Don’t hold your breath!
Don’t care about stock market fall itself. Care abt potential financial instability. Stock market drop unlikely to trigger crisis.#AskNeelhttps://t.co/Cv7ENuJuqU
According to Wells Fargo’s Ike Boruchow, it’s “increasingly clear that retail is under significant pressure” adding that store traffic remains weak (likely to get softer this week due to Easter shift), while markdown rates are not only elevated on an annual basis, but also getting sequentially worse. He concludes that “retailers are running out of time” to reach elevated Q1 numbers as consumption is failing to rebound.
S&P Retail Stocks
Whether due to displacement (from online vendors), due to concerns about border tax, or simply because the US consumer’s plight – despite the recent surge in Trump induced animal spirits – has not changed one bit, the pain for US retailers continues, and as a result, the outlook for malls and other retail-associated secondary industries will remain bleak for the foreseeable future.
Used Vehicles:
Desutche Bank is gravely concerned: We’ve grown increasingly concerned about U.S. Used Vehicle Pricing down 7.7% yoy during February, per NADA. A decline in used prices has been widely anticipated given a significant increase in used vehicle supply (off-lease vehicles). But the magnitude of the recent drop was nonetheless surprising (February’s drop was largest recorded for any month since Nov. 2008). Used prices have a significant impact on New Vehicle demand/pricing through their effect on affordability (most new car purchases involve a trade-in).
Let us hope this is all because consumers are focused on buying houses instead.
It appears, the worse the economy was doing, the higher the odds of a rate hike.
Putting the Federal Reserve’s third rate hike in 11 years into context, if the Atlanta Fed’s forecast is accurate, 0.9% GDP would mark the weakest quarter since 1980 in which rates were raised (according to Bloomberg data).
We look forward to Ms. Yellen explaining her reasoning – Inflation no longer “transitory”? Asset prices in a bubble? Because we want to crush Trump’s economic policies? Because the banks told us to?
For now it appears what matters to The Fed is not ‘hard’ real economic data but ‘soft’ survey and confidence data…
Back in August 2014,we reportedthat in what appeared a suspicious attempt to boost the pool of eligible, credit-worthy mortgage recipients, Fair Isaac, the company behind the crucial FICO score that determines every consumer’s credit rating, “will stop including in its FICO credit-score calculations any record of a consumer failing to pay a bill if the bill has been paid or settled with a collection agency. The San Jose, Calif., company also will give less weight to unpaid medical bills that are with a collection agency.” In doing so, the company would “make it easier for tens of millions of Americans to get loans.” Stated simply, the definition of the all important FICO score, the most important number at the base of every mortgage application, was set for an “adjustment” which would push it higher for millions of Americans.
As theWSJ said at the time, the changes are expected to boost consumer lending, especially among borrowers shut out of the market or charged high interest rates because of their low scores. “It expands banks’ ability to make loans for people who might not have qualified and to offer a lower price [for others],” said Nessa Feddis, senior vice president of consumer protection and payments at the American Bankers Association, a trade group.” Perhaps the thinking went that if you a borrower has defaulted once, they had learned your lesson and will never do it again. Unfortunately, empirical studies have shown that that is not the case.
Now, nearly three years later, in the latest push to artificially boost FICO scores, the WSJ reports that “many tax liens and civil judgments soon will be removed from people’s credit reports, the latest in a series of moves to omit negative information from these financial scorecards. The development could help boost credit scores for millions of consumers, but could pose risks for lenders” as FICO scores remain the only widely accepted method of quantifying any individual American’s credit risk, and determine how much consumers can borrow for a new house or car as well as determine their credit-card spending limit
The transformation is already in proces as the three major credit-reporting firms, Equifax, Experian and TransUnion, recently decided to remove tax-lien and civil-judgment data starting around July 1, according to the Consumer Data Industry Association, a trade group that represents them. The firms will remove the adverse data if they don’t include a complete list of a person’s name, address, as well as a social security number or date of birth, and since most liens and judgments don’t include all three or four, the effect will be like wiping the slate clean for millons of Americans. This change will apply to new tax lien and civil-judgment data that are added to credit reports as well as existing data on the reports.
Civil judgments include cases in which collection firms take borrowers to court over an unpaid debt. Ankush Tewari, senior director of credit-risk assessment at LexisNexis Risk Solutions, says that nearly all judgments will be removed and about half of tax liens will be removed from credit reports as a result of the changed approach. He says LexisNexis will continue to offer the data directly to lenders.
In addition, if public court records aren’t checked for updates on lien and judgment information at least every 90 days, they will have to be removed from credit reports.
The outcome of this change is clear: it “will make many people who have these types of credit-report blemishes look more creditworthy.“
The WSJ notes that the unusual move by the influential firms comes partially in response to regulatory concerns. The three reporting bureaus rarely tinker with the information that goes on credit reports and that lenders consult to gauge consumers’ ability and willingness to pay back debts.
The regulatory push to boost America’s creditworthiness started at the top, under the guise of improving data tracking and collection:
The Consumer Financial Protection Bureau earlier this month released a report citing problems it found while examining credit bureaus and changes it is requiring. Issues the agency cited included improving standards for public-records data by using better identity-matching criteria and updating records more frequently.
Inaccurate information on credit reports, especially if it is negative information, can derail consumers from being able to gain access to credit and even lead to other setbacks like not being able to rent an apartment or get a job.
One in five consumers has an error in at least one of their three major credit reports, according to a 2013 Federal Trade Commission study mandated by Congress. The three credit bureaus received around eight million requests disputing information on credit reports in 2011, according to the CFPB.
It won’t be the first time such an exercise is conducted: in 2015, as part of a settlement with the NY AG, credit-reporting firms were already prompted to remove several negative data sets from reports. These included non-loan related items that were sent to collections firms, such as gym memberships, library fines and traffic tickets. The firms also will have to remove medical-debt collections that have been paid by a patient’s insurance company from credit reports by 2018.
What happens next?
Such changes might help borrowers and could spur additional lending, possibly boosting economic activity. But it could potentially increase risks for lenders who might not be able to accurately assess borrowers’ default risk.
Consumers with liens or judgments are twice as likely to default on loan payments, according to LexisNexis Risk Solutions, a unit of RELX Group that supplies public-record information to the big three credit bureaus and lenders.
For lenders and credit card companies it means one thing: chaos, and the potential of substantial future charge offs: “It’s going to make someone who has poor credit look better than they should,” said John Ulzheimer, a credit specialist and former manager at Experian and credit-score creator FICO.
“Just because the lien or judgment information has been removed and someone’s score has improved doesn’t mean they’ll magically become a better credit risk.”
* * *
So how many US consumers will be impacted by this change? The answer: up to 12 million.
As the WSJ points out “removing this information from credit reports also will lead to changes in people’s credit scores. Roughly 12 million U.S. consumers, or about 6% of the total U.S. population that has FICO credit scores, will see increases in those scores as a result of this change, according to the company that created the FICO system, which is used by lenders in most U.S. consumer underwriting decisions.”
While for many of these consumers, the score increase will be relatively modest, as FICO projects that just under 11 million people will experience a score improvement of less than 20 points, that should be more than sufficient to go out and buy that brand new $60,000 BMW with an 80-month, $0 down, 0% interest rate loan.
Sarcasm aside, ultimately lenders will still be able to check public records on their own to find this information, and since FICO scores will now be “adjusted” just like GAAP, the likely outcome will be the transition of credit vetting in house, as Fair Isaac loses credibility within the loan system, potentially leading to even more draconian credit terms, even if it comes at substantial expense to US-based lenders.
“A housing recovery that is highly dependent on real estate investors is a bit of a double-edged sword,” explained Daren Blomquist, senior VP at ATTOM Data Solutions. “Rapidly rising home values have been good for homeowner equity, but also have caused an affordability crunch for the first-time home buyers the housing market typically relies on for sustained, long-term growth.”
So the housing market is “starkly different than a decade ago,” said Alex Villacorta, VP of research and analytics at Clear Capital. “As such, it’s imperative for all market participants to understand the nuances of the New Normal Real Estate Market.”
They were bothcommenting on a joint white paperby ATTOM and Clear Capital, titled “Landlord Land,” that analyzes who is behind the US housing boom that drove home prices to new all-time highs, and in many markets far beyond the prior crazy bubble highs – even as homeownership has plunged and remains near its 50-year low.
First-time buyers are the crux to a healthy housing market, but they aren’t buying with enough enthusiasm. In 2012, buyers with FHA-insured mortgages – “who are typically first-time home buyers with a low down payment,” according to the report – accounted for 25% of all home purchases. In 2013, their share dropped to about 20%, in 2014 to 18%. Then hope began rising, briefly:
However, in January 2015, FHA lowered its insurance premium 50 basis points, and there was a modest resurgence in FHA buyers – a trend perhaps indicative of loosening credit requirements or of a desire to re-enter the housing market for those displaced during the crash.
Their share of home purchases ticked up to 22.3%. Alas, “the FHA resurgence was short lived” and in 2016 eased down to 21.7%.
With first-time buyers twiddling their thumbs, who then is buying? Who is driving this housing market?
Institutional investors? Defined as those that buy at least 10 properties a year, they include the largest buy-to-rent Wall Street landlords, some with over 40,000 single-family homes, who’ve “picked up the low-hanging fruit of distressed properties available at a discount between 2009 and 2013,” as the report put it. That was during the foreclosure crisis, when they bought these properties from banks.
In Q3, 2010, institutional investors bought 7% of all homes. In Q1 2013, their share reached 9.5%. As home prices soared, fewer foreclosures were taking place. By 2014, when home prices reached levels where the large-scale buy-to-rent scheme with its heavy expense structure wasn’t working so well anymore, these large buyers began to pull back. In 2016, the share of institutional investors dropped to just 2% of all home sales.
But as institutional investors stepped back, smaller investors jumped into the fray in large numbers, “willing to purchase in a wider variety of market landscapes and operate on thinner margins.”
To approximate total investor purchases of homes, the report looks at the share of purchases where the home is afterwards occupied by non-owner residents. In 2009, according to this metric, 28% of all home purchases were investor-owned properties. In 2010, it rose to 30%. In 2011, 32%. Then as big investors pulled out, it fell back to 30%. But by 2015, small investors arrived in large numbers, and by 2016, investor purchases jumped to 37%, an all-time high in the ATTOM data series going back 21 years.
The chart shows the share of purchases in a given year. Note the declining share of first-time buyers (blue line), the declining share of institutional investors (gray bars), and the surging share of smaller investors (green line). In other words, smaller investors are now driving this housing boom:
The pie chart below shows the share of properties owned by investor size. Among investors in today’s housing market, small landlords that own one or two properties own in aggregate the largest slice of the rental housing pie – 79%:
However, Wall Street landlords are concentrated in just a few urban areas. For example, Invitation Homes, the 2012 buy-to-rent creature of private-equity firm Blackstone, which owns over 48,000 single-family homes and has nearly unlimited financial resources,including government guarantees on some of its debt, is concentrated in just 12 urban areas, where it has had an outsized impact.
Whereas small investors own properties across the entire country, in urban and rural areas, in cheap markets and ludicrously expensive markets. They own condos, detached houses, duplexes, and smaller multi-unit buildings.
So when the industry tells us about low inventories and strong demand in the housing market, it’s good to remember where a record 37% of that demand in 2016 came from: investors, most of them smaller investors. And when the financial equation no longer works for them, they’ll pull back, just like institutional investors have already done.
It started with a whimper a couple of years ago and has turned into a roar: foreign governments are dumping US Treasuries. The signs are coming from all sides. The data from the US Treasury Department points at it. The People’s Bank of China points at it in its data releases on its foreign exchange reserves. Japan too has started selling Treasuries, as have other governments and central banks.
Some, like China and Saudi Arabia, are unloading their foreign exchange reserves to counteract capital flight, prop up their own currencies, or defend a currency peg.
Others might sell US Treasuries because QE is over and yields are rising as the Fed has embarked on ending its eight years of zero-interest-rate policy with what looks like years of wild flip-flopping, while some of the Fed heads are talking out loud about unwinding QE and shedding some of the Treasuries on its balance sheet.
Inflation has picked up too, and Treasury yields have begun to rise, and when yields rise, bond prices fall, and so unloading US Treasuries at what might be seen as the peak may just be an investment decision by some official institutions.
The chart below from Goldman Sachs, via Christine Hughes at Otterwood Capital, shows the net transactions of US Treasury bonds and notes in billions of dollars by foreign official institutions (central banks, government funds, and the like) on a 12-month moving average. Note how it started with a whimper, bounced back a little, before turning into wholesale dumping, hitting record after record (red marks added):
The People’s Bank of China reported two days ago that foreign exchange reserves fell by another $12.3 billion in January, to $2.998 trillion, the seventh month in a row of declines, and the lowest in six years. They’re down 25%, or almost exactly $1 trillion, from their peak in June 2014 of nearly $4 trillion (via Trading Economics, red line added):
China’s foreign exchange reserves are composed of assets that are denominated in different currencies, but China does not provide details. So of the $1 trillion in reserves that it shed since 2014, not all were denominated in dollars.
The US Treasury Department provides another partial view, based on data collected primarily from US-based custodians and broker-dealers that are holding these securities for China and other countries. But the US Treasury cannot determine which country owns the Treasuries held in custodial accounts overseas. Based on this limited data, China’s holdings of US Treasuries have plunged by $215.2 billion, or 17%, over the most recent 12 reporting months through November, to just above $1 trillion.
So who is buying all these Treasuries when the formerly largest buyers – the Fed, China, and Japan – have stepped away, and when in fact China, Japan, and other countries have become net sellers, and when the Fed is thinking out loud about shedding some of the Treasuries on its balance sheet, just as nearly $900 billion in net new supply (to fund the US government) flooded the market over the past 12 months?
Turns out, there are plenty of buyers among US investors who may be worried about what might happen to some of the other hyper-inflated asset classes.
And for long suffering NIRP refugees in Europe, there’s a special math behind buying Treasuries. They’re yielding substantially more than, for example, French government bonds, with the US Treasury 10-year yield at 2.4%, and the French 10-year yield at 1.0%, as the ECB under its QE program is currently the relentless bid, buying no matter what, especially if no one else wants this paper. So on the face of it, buying US Treasuries would be a no-brainer.
But the math got a lot more one-sided in recent days as French government bonds now face a new risk, even if faint, of being re-denominated from euros into new French francs, against the will of bondholders, an act of brazen default, and these francs would subsequently get watered down, as per the euro-exit election platform of Marine Le Pen. However distant that possibility, the mere prospect of it, or the prospect of what might happen in Italy, is sending plenty of investors to feed on the richer yields sprouting in less chaos, for the moment at least, across the Atlantic.
The Federal Reserve’s oft-forgotten policy of buying mortgage-backed securities helped keep mortgage rates low over the last several years.
The monthly housing market reports I publish each month became bullish in late 2011 due to the relative undervaluation of properties at the time. I was still cautious due to weak demand, excessive shadow inventory, the uncertainty of the duration of the interest rate stimulus, and an overall skepticism of the lending cartel’s ability to manage their liquidations.
In 2012, the lending cartel managed to completely shut off the flow of foreclosures on the market, and with ever-declining interest rates, a small uptick in demand coupled with a dramatic reduction in supply caused the housing market to bottom.
Even with the bottom in the rear-view mirror, I remained skeptical of the so-called housing recovery because the market headwinds remained, and the low-interest rate stimulus could change at any moment. Without the stimulus, the housing market would again turn down.
It wasn’t until Ben Bernanke, chairman of the federal reserve, took out his housing bazooka and fired it in September 2012 that I became convinced the bottom was really in for housing. Back in September, Bernanke pledged to buy $40 billion in mortgage-backed securities each month for as long as it takes for housing to fully recover. With an unlimited pledge to provide stimulus, any concerns about a decline in prices was washed away.
In addtion to buying new securities, the federal reserve also embarked on a policy of reinvesting principal payments from agency debt and mortgage-backed securities back into mortgages — a policy they continue to this day.
by Liz McCormick and Matt Scully, February 5, 2017
Almost a decade after it all began, the Federal Reserve is finally talking about unwinding its grand experiment in monetary policy.
And when it happens, the knock-on effects in the bond market could pose a threat to the U.S. housing recovery.
Just how big is hard to quantify. But over the past month, a number of Fed officials have openly discussed the need for the central bank to reduce its bond holdings, which it amassed as part of its unprecedented quantitative easing during and after the financial crisis. The talk has prompted some on Wall Street to suggest the Fed will start its drawdown as soon as this year, which has refocused attention on its $1.75 trillion stash of mortgage-backed securities.
While the Fed also owns Treasuries as part of its $4.45 trillion of assets, its MBS holdings have long been a contentious issue, with some lawmakers criticizing the investments as beyond what’s needed to achieve the central bank’s mandate. Yet because the Fed is now the biggest source of demand for U.S. government-backed mortgage debt and owns a third of the market, any move is likely to boost costs for home buyers. …
In the past year alone, the Fed bought $387 billion of mortgage bonds just to maintain its holdings. Getting out of the bond-buying business as the economy strengthens could help lift 30-year mortgage rates past 6 percent within three years, according to Moody’s Analytics Inc.
It’s difficult to imagine that losing a buyer of that magnitude wouldn’t cause prices to fall, thereby raising yields and mortgage interest rates.
The surge in mortgage rates is already putting a dent in housing demand. Sales of previously owned homes declined more than forecast in December, …, according to data from the National Association of Realtors.
People are starting to ask the question, “Gee, did I miss my opportunity here to get a low-rate mortgage?” …
While this may close the door on the opportunity to get a low rate, it opens the door on the opportunity to get a low price.
People can only afford what they can afford. If their payment stretches to finance huge sums like they do today, then prices get bid up to that equilibrium price level. If their payment finances a smaller sum, like they will if mortgage rates rise, then prices will need to “adjust” downward to this new equilibrium price level.
I wouldn’t count on a big drop. Prices are sticky on the way down, particularly without a flood of foreclosures to push them down. Today’s owners with low-rate mortgages won’t sell unless they really need to, and lenders would rather can-kick than cause another foreclosure crisis, so any downward movement would be slow.
As prices creep downward, rents and incomes will rise offsetting some of the pain, and those buyers that are active will substitute downward in quality to something they can afford. It’s a prescription for low sales volumes and unhappy buyers and sellers. The buyers pay too much, and the sellers get too little.
Nevertheless, the consequences for the U.S. housing market can’t be ignored.
The “Fed has already hiked twice and the market is expecting” more, said Munish Gupta, a manager at Nara Capital, a new hedge fund being started by star mortgage trader Charles Smart. “Tapering is the next logical step.”
As the federal reserve tapers its purchases of mortgage bonds, it opens up this market to private investment. Perhaps money will flow out of 10-year treasuries into mortgage-backed securities for a little more yield. It’s also possible that Congress will reform mortgage finance and remove the government guarantee from these securities, making them less desirable.
It’s entirely possible that the yield on the 10-year treasury will drop this year. Higher short term rates and a strengthening economy means the US dollar should appreciate relative to other currencies, attracting foreign capital. Once converted to US dollars, that capital must find someplace to invest, and US Treasuries are the safest investment providing some yield. If a great deal of foreign capital enters the country and buys treasuries, yields will drop, and mortgage rates may drop with them. Rising mortgage rates are not a certainty.
For now, the federal reserve will keep buying mortgage-backed securities, but the messy taper is on the horizon. Apparently, when it comes to boosting housing, Yellen plans to stay the course.
Ladies and gentlemen, I am a banker. That’s right, that evil, fat cat, wall street banker that became such a popular moniker during our last administration and I’m also a prepper. Rather than debate the topic of bugging in/out of an incredibly densely populated area which I contend with all the time, I wanted to write about a topic that I see a lot of op-eds about and that is the impending doom of economic collapse and it being the pretense for TEOTWAWKI.
As anyone who is skilled in their field of practice is, I have the ability (mostly because I’m intricately connected to it every day) to decipher the ongoing fear that we as a nation are teetering on the brink of economic collapse and that you must immediately liquidate all holdings and bank accounts and mattress those funds. I will try to impress upon you below how unlikely and improbable this really is.
As a student of Finance you’re taught words like inflation, bubbles and leverage. You pause and look at “The Market” throughout the day and wonder why Apple is up or why oil is down but you really don’t understand how tightly things are tied together and quite frankly how much reliance on everything a simple stock or sector has on everything else in the global economy. Now don’t get me wrong, any company can have a bad day, or week or year. I’s talked about all the time. But the system crashing down as a result of just the system and not some other calamity like plague or an EMP for that matter is just not going to happen.
Checks and Balances
For an economy like the U.S. to go belly up, that would essentially mean that every other country in the world just doesn’t care about receiving payments on their debt. When I spoke above about things being so tied together, did you know that practically every country in the world owns the United States? That’s right, the Chinese own the statue of liberty, the French own the grand canyon and our friends in the Congo own Mt Rushmore. It’s true, well maybe not exactly but that deficit everyone hears about is nothing more than conceptual money that we owe ourselves not to mention every other country out there. No one is coming to collect.
Every once in a while, corrections are needed.
Do you think there’s a vault out there with trillions of dollars in it? I promise you there’s not. Corporations, foreign governments and independent debt owners care about one thing and one thing only, the interest payment. The interest on the debt they have in the investment they make. That monthly stipend of interest is what’s real and more importantly how people balance the check book. No one ever assumes they’ll get their money back, in fact if they did, we’d be in a far better position. All we’d have to do is print the money but guess what, it wouldn’t be worth very much if there was an excess of it would it? Nobody wants to be paid back these ridiculous sums of money for one simple reason, their value will go down. 1 trillion dollars in owed money is worth 100 times what 1 trillion dollars in cash is. Checks and Balances is just that, what makes the world go round is certainty that you can collect on your debt, not by collecting on what’s owed. The country’s of the world can’t function with trillions of dollars sitting in a vault, they’d essentially be broke.
Value is just perception
If you have a house, and you want to sell it, what’s it worth? Whatever you think your house is worth based on improvements you might have made or what your county is assessing a tax figure on and holding you accountable to pay is really not the answer. Your home and anything for that matter is worth what we call fair market value. Fair market value is the price that some else (the market) is willing to pay (fair value). I bring this up because such is the case with everything when it comes to what things are worth. Now a house is much different from an investment vehicle like a bond for example. You live in your house, it provides you safety, security, memories all of which are equitable things. You might even be willing to put a price tag on that in your mind. A bond or a stock or balance sheet doesn’t really stack up to that house of yours does it? Yet this is what the world economy is made up of, fictional pieces of perceived value. They don’t even print shares of stock or bond anymore so you couldn’t burn it to keep you warm at night. That’s not me being a cynic it’s just the truth. Everything we have with regard to wealth is just in the perception of faith and tied to nothing really tangible. Take a minute to think about that.
Every once in a while, corrections are needed
But banker you ask, what about the next recession, my portfolio might evaporate if it’s not allocated appropriately. Well folks, I’m here to tell you, you losing money is all part of the master plan. Making money is too however. There’s an old adage, maybe you’ve heard it. “Markets can digest good news and bad news but they hate uncertainty”. Isn’t that true of mostly everything come to think of it? Fact is our entire system was built on bull runs (times in which there’s a surge in value) and bear runs (times in which there’s a decline in value). If no one ever lost money the system wouldn’t work. Value wouldn’t change because risk would be taken out of the equation. Everyone would be richer but no one would be richer. What makes the world economy function is that there’s no guarantee that stipend I mentioned that all governments are tied to will be insured and reliable. This is where jockeying comes in and the gambling mentality takes over. Since the dawn of modern finance prospectors and prognosticators have set the benchmark to try to out-earn (even by just the tiniest of margins) their competitors. People wager on perceived value and that’s the x-factor (greed that is) that sets the bulls or bears running and ushers in peaks and valleys. Corrections are there by design and you’ll have to stomach it unless you plan to completely go off grid. That’s not really prepping though, that’s fully prepared. For the rest of us that aspire to “get there”, you have to be prepared to get bounced around with the financial tide.
Conclusion
OK oh ye faithful that have stuck around and for those of you that did, thank you, here’s the synopsis. Unless greed is wiped from the earth OR unless the debt holders want to stop making money, the system will not collapse. Even in the greatest of calamity’s like The Great Depression and or The Great Recession people made money. They just chose the right time to bet against common thought. Point is the system always recovers. We as preppers, for lack of a better way to say it are prepared. We’re prepared beyond what’s in our refrigerator or a minor terrorist crisis in our general vicinity or at least we’re trying to get there. Know this, peaks and valleys within our financial system will always continue but with 100% certainty, the system is rigged.
If things ever got bad enough for the U.S. to the point of bread lines and soup kitchens, we’d just print the money we needed as a government to make our debt payment. If another country couldn’t make their payment, we’d just chisel away at their principal and then auction it off again to the highest bidder for, that’s right you guessed it, another payment plan. Take solace in the fact that there are 100 others ways all of them far more likely to disrupt the balance and cause us to make tough decisions for our family’s. For the ones convinced that the economic system will fail them, you might be caught short-handed in your preps. Invest instead in gas masks or wind turbines or lamp oil, hey, you might just make someone rich.
◆ Fed holds $1.75 Trillion of MBS from quantitative easing program ◆
◆ Comments spur talk Fed may start draw down as soon as this year
Almost a decade after it all began, the Federal Reserve is finally talking about unwinding its grand experiment in monetary policy.
And when it happens, the knock-on effects in the bond market could pose a threat to the U.S. housing recovery.
Just how big is hard to quantify. But over the past month, a number of Fed officials have openly discussed the need for the central bank to reduce its bond holdings, which it amassed as part of its unprecedented quantitative easing during and after the financial crisis. The talk has prompted some on Wall Street to suggest the Fed will start its drawdown as soon as this year, which has refocused attention on its $1.75 trillion stash of mortgage-backed securities.
While the Fed also owns Treasuries as part of its $4.45 trillion of assets, its MBS holdings have long been a contentious issue, with some lawmakers criticizing the investments as beyond what’s needed to achieve the central bank’s mandate. Yet because the Fed is now the biggest source of demand for U.S. government-backed mortgage debt and owns a third of the market, any move is likely to boost costs for home buyers.
In the past year alone, the Fed bought $387 billion of mortgage bonds just to maintain its holdings. Getting out of the bond-buying business as the economy strengthens could help lift 30-year mortgage rates past 6 percent within three years, according to Moody’s Analytics Inc.
Unwinding QE “will be a massive and long-lasting hit” for the mortgage market, said Michael Cloherty, the head of U.S. interest-rate strategy at RBC Capital Markets. He expects the Fed to start paring its investments in the fourth quarter and ultimately dispose of all its MBS holdings.
Unprecedented Buying
Unlike Treasuries, the Fed rarely owned mortgage-backed securities before the financial crisis. Over the years, its purchases have been key in getting the housing market back on its feet. Along with near-zero interest rates, the demand from the Fed reduced the cost of mortgage debt relative to Treasuries and encouraged banks to extend more loans to consumers.
In a roughly two-year span that ended in 2014, the Fed increased its MBS holdings by about $1 trillion, which it has maintained by reinvesting its maturing debt. Since then, 30-year bonds composed of Fannie Mae-backed mortgages have only been about a percentage point higher than the average yield for five- and 10-year Treasuries, data compiled by Bloomberg show. That’s less than the spread during housing boom in 2005 and 2006.
Talk of the Fed pulling back from the market has bond dealers anticipating that spreads will widen. Goldman Sachs Group Inc. sees the gap increasing 0.1 percentage point this year, while strategists from JPMorgan Chase & Co. say that once the Fed actually starts to slow its MBS reinvestments, the spread would widen at least 0.2 to 0.25 percentage points.
“The biggest buyer is leaving the market, so there will be less demand for MBS,” said Marty Young, fixed-income analyst at Goldman Sachs. The firm forecasts the central bank will start reducing its holdings in 2018. That’s in line with a majority of bond dealers in the New York Fed’s December survey.
The Fed, for its part, has said it will keep reinvesting until its tightening cycle is “well underway,” according to language that has appeared in every policy statement since December 2015. The range for its target rate currently stands at 0.5 percent to 0.75 percent.
Mortgage Rates
Mortgage rates have started to rise as the Fed moves to increase short-term borrowing costs. Rates for 30-year home loans surged to an almost three-year high of 4.32 percent in December. While rates have edged lower since, they’ve jumped more than three-quarters of a percentage point in just four months.
The surge in mortgage rates is already putting a dent in housing demand. Sales of previously owned homes declined more than forecast in December, even as full-year figures were the strongest in a decade, according to data from the National Association of Realtors.
People are starting to ask the question, “Gee, did I miss my opportunity here to get a low-rate mortgage?” said Tim Steffen, a financial planner at Robert W. Baird & Co. in Milwaukee. “I tell them that rates are still pretty low. But are rates going to go up? It certainly seems like they are.”
Part of it, of course, has to do with the Fed simply raising interest rates as inflation perks up. Officials have long wanted to get benchmark borrowing costs off rock-bottom levels (another legacy of crisis-era policies) and back to levels more consist with a healthy economy. This year, the Fed has penciled in three additional quarter-point rate increases.
The move to taper its investments has the potential to cause further tightening. Morgan Stanley estimates that a $325 billion reduction in the Fed’s MBS holdings from April 2018 through end of 2019 may have the same impact as nearly two additional rate increases.
Finding other sources of demand won’t be easy either. Because of the Fed’s outsize role in the MBS market since the crisis, the vast majority of transactions are done by just a handful of dealers. What’s more, it’s not clear whether investors like foreign central banks and commercial banks can absorb all the extra supply — at least without wider spreads.
On the plus side, getting MBS back into the hands of private investors could help make the market more robust by increasing trading. Average daily volume has plunged more than 40 percent since the crisis, Securities Industry and Financial Markets Association data show.
“Ending reinvestment will mean there are more bonds for the private sector to buy,” said Daniel Hyman, the co-head of the agency-mortgage portfolio management team at Pacific Investment Management Co.
What’s more, it may give the central bank more flexibility to tighten policy, especially if President Donald Trump’s spending plans stir more economic growth and inflation. St. Louis Fed President James Bullard said last month that he’d prefer to use the central bank’s holdings to do some of the lifting, echoing remarks by his Boston colleague Eric Rosengren.
Nevertheless, the consequences for the U.S. housing market can’t be ignored.
The “Fed has already hiked twice and the market is expecting” more, said Munish Gupta, a manager at Nara Capital, a new hedge fund being started by star mortgage trader Charles Smart. “Tapering is the next logical step.”
CFPB orders Prospect Mortgage to pay $3.5 million for improper mortgage referrals
Regulator calls alleged activity a “kickback” scheme
The Consumer Financial Protection Bureau today ordered Prospect Mortgage, a major mortgage lender, to pay a $3.5 million fine for improper mortgage referrals, in what the regulator calls an alleged “kickback” scheme.
The lender paid illegal kickbacks for mortgage business referrals. But Prospect Mortgage isn’t the only one being fined. The CFPB also dealt out penalties to two real estate brokers and a mortgage servicer who took kickbacks from Prospect. These three will pay a combined total of $495,000 in consumer relief, repayment of ill-gotten gains and penalties.
“Today’s action sends a clear message that it is illegal to make or accept payments for mortgage referrals,” CFPB Director Richard Cordray said. “We will hold both sides of these improper arrangements accountable for breaking the law, which skews the real estate market to the disadvantage of consumers and honest businesses.”
Here are three reasons the CFPB said it is fining Prospect Mortgage:
Paid for referrals through agreements:
Prospect maintained various agreements with over 100 real estate brokers, including ReMax Gold Coast and Keller Williams Mid-Willamette, which served primarily as vehicles to deliver payments for referrals of mortgage business. Prospect tracked the number of referrals made by each broker and adjusted the amounts paid accordingly. Prospect also had other, more informal, co-marketing arrangements that operated as vehicles to make payments for referrals.
Paid brokers to require consumers – even those who had already prequalified with another lender – to pre-qualify with Prospect:
One particular method Prospect used to obtain referrals under their lead agreements was to have brokers engage in a practice of “writing in” Prospect into their real estate listings. “Writing in” meant that brokers and their agents required anyone seeking to purchase a listed property to obtain pre-qualification with Prospect, even consumers who had pre-qualified for a mortgage with another lender.
Split fees with a mortgage servicer to obtain consumer referrals:
Prospect and Planet Home Lending had an agreement under which Planet worked to identify and persuade eligible consumers to refinance with Prospect for their Home Affordable Refinance Program mortgages. Prospect compensated Planet for the referrals by splitting the proceeds of the sale of such loans evenly with Planet. Prospect also sent the resulting mortgage servicing rights back to Planet.
Prospect is prohibited from future violations of the Real Estate Settlement Procedures Act, will not pay for referrals and will not enter into any agreements with settlement service providers to endorse the use of their services, according to the CFPB.
Three of the companies that accepted the illegal money, ReMax Gold Coast, Keller Williams Mid-Willamette and Planet Home Lending, were also fined by the CFPB. ReMax Gold Coast will pay $50,000 in civil money penalties, and Keller Williams Mid-Willamette will pay $145,000 in disgorgement and $35,000 in penalties. Under the consent order filed against Planet Home Lending, the company will directly pay harmed consumers a total of $265,000 in redress.
HousingWire reached out to Prospect Mortgage for comment, but has not yet received a reply. This article will be updated when and if we receive one.
Richard Cordray, head of the Consumer Financial Protection Bureau (CFPB), used a private device for government communications, and didn’t create appropriate records of those messages with the bureau, according to documents obtained exclusively by The Daily Caller.
A longtime Democrat from Ohio, Cordray has served as head of the CFPB since January 2012, a position he is scheduled to hold through July 2018.
A source told The DC that he submitted a Freedom of Information Act (FOIA) request in August 2016 for more than a year’s worth of text messages on official devices to and from various CFPB staffers.
The bureau responded that there were no records on any “CFPB issued or CFPB reimbursed devices” for any text messages sent or received associated with Cordray.
A recent court decision in October 2016 ruled that the structure of the CFPB is unconstitutional because the president doesn’t have power to fire the director. The CFPB was a creation of Elizabeth Warren and created so that directors can only be dismissed with cause.
It’s not clear if President Donald Trump has the power to dismiss Cordray without cause.
In Bel Air, California, ultra-luxury home developer Bruce Makowsky has unveiled his most ambitious project yet, 924 Bel Air Road. Listed at US$250 million it is the most expensive home ever listed in the United States.
To attract the clientele Makowsky is targeting, he is selling more than just a home he is selling a lifestyle. Whoever buys 924 Bel Air not only gets the home, but a full-time, 7-person staff for 2 years, a US$30 million car collection and all of the artwork, wine, furnishings and extras you can imagine.
Below you will find a gallery of this insane property along with a video tour and a list of some of the most unbelievable highlights and inclusions. For more information visit 924belair.com.
– List price: US$250 million (previous US record $195 million mansion in Manalapan, Florida) – 38,000 sq. ft. over 4 floors with 2 commercial elevators lined in alligator skin and handcrafted, polished steel staircase – 12 bedrooms, 21 bathrooms, 3 kitchens, 6 bars, massage and spa room, fitness center, bowling alley – 2 wine and champagne cellars, 85 ft Infinity pool, 40-person home theatre, 18×12 ft retractable outdoor tv screen – Includes $US 30 million car collection, all artworks, wine and champagne collection, helicopter, boat – Comes with 7 pre-paid, full-time staff including chef, chauffeur and masseuse for two years.
In an interview with CNBC, Makowsky likens the home more to a mega yacht than a house, stating:
Megayachts have gone from 150 feet to 300 feet or more and they can cost up to $500 million,” he said. “People spend two weeks a year on a yacht, but they live in a house. I wanted this to be the ultimate megayacht, but on land.” [source]
According to CNBC, the “auto gallery” features some of the rarest, fastest and most expensive cars in the world and come with the home. The collection includes a one-of-a-kind Pagani Huayra ($2 million+); the famous “Von Krieger” 1936 Mercedes 540 K Special Roadster($15 million+); and 10 of the rarest and fastest motorcycles ever built.
The most expensive home ever sold globally is believed to be a US$221 million penthouse in London, England. Globally, there are homes listed for more than US$300 million but none in the U.S. tops Makowsky’s US$250 million listing. [source]
China’s holdings of US Treasury securities plunged by a stunning $66.4 billion in November 2016, after having already plunged $41 billion in October, the US Treasury Department reported today in its Treasury International Capital data release. After shedding Treasuries for months, China’s holdings, now the second largest behind Japan, are down to $1.049 trillion.
At this pace, it won’t take long before China’s pile of Treasuries falls below the $1 trillion mark. It was China’s sixth month in a row of declines. Over the 12-month period, China slashed its holdings by $215.2 billion, or by 17%!
Japan’s holdings of US Treasuries dropped by $23 billion in November. Over the 12-month period, its holdings are down by $36.3 billion.
But we don’t really know all the details. We only get to see part of it. This data is collected “primarily,” as the Treasury says, from US-based custodians and broker-dealers that are holding these securities. Treasury securities in custodial accounts overseas “may not be attributed to the actual owners.” These custodial accounts are in often tiny countries with tax-haven distinctions. And what happens there, stays there. The ones with the largest holdings are (in $ billions):
Total holdings by foreign entities, including by central banks and institutional investors, fell by $96.1 billion in November. China’s decline accounted for 69% of it, and Japan’s for 24%.
This says more about China than it says about the US, or US Treasuries, though November was a particularly ugly month of US Treasuries, when the 10-year yield surged from 1.84% to 2.37%, spreading unpalatable losses among investors. This surge in yields and swoon in prices wasn’t ascribed to China’s dumping of Treasuries, of course, but to the “Trump Trade” that changed everything after the election.
But China’s foreign exchange reserves have been dropping relentlessly, as authorities are trying to prop up the yuan, while trying to figure out how to stem rampant capital flight, even as wealthy Chinese are finding ways to get around every new rule and hurdle. Authorities are trying to manage their asset bubbles, particularly in the property sector. They’re trying to keep them from getting bigger, and they’re trying to keep them from imploding, all at the same time. And they’re trying to keep their bond market duct-taped together. And in juggling all this, they’ve been unloading their official foreign exchange reserves.
They dropped by $41 billion in December to $3.0 trillion. They’re now down 25% from $4.0 trillion in the second quarter of 2014. That’s a $1-trillion decline over 30 months! What’s included in these foreign-exchange reserves is a state secret. But pundits assume that about two-thirds are securities denominated in US dollars (viaTrading Economics):
Japan and China remain by far the largest creditors of the US, and the US still owes them $2.16 trillion combined. But that’s down by $90 billion from a month earlier and down $251 billion from a year earlier. And it’s not because the US is suddenly running a trade surplus with them. Far from it. But it’s because both countries are struggling with their own unique sets of problems, and something has to give.
The fact that the two formerly-largest buyers of US Treasuries are no longer adding to their positions but are instead shedding their positions has changed the market dynamics. And both have a lot more to shed! This is in addition to the changes in the Fed’s monetary policy – now that the tightening cycle has commenced in earnest. And it comes on top of rising inflation in the US. These factors are forming a toxic trifecta for Treasury bondholders.
We have frequently noted the precarious state of the U.S. mall REITs (see “Myopic Markets & The Looming Mall REITs Massacre” and “Is CMBS The Next “Shoe To Drop”? GGP Sales Suggest Commercial Real Estate Crashing“), but the epic collapse of the Galleria at Pittsburgh Mills paints a uniquely horrific outlook for mall operators. The 1.1 million square foot mall, once valued at $190 million after being opened in 2005, sold at a foreclosure auction this morning for $100 (yes, not million…just $100). According to CBS Pittsburgh, the mall was purchased by its lender, Wells Fargo, which credit bid it’s $143 million loan balance, which was originated in 2006, to acquire the property.
Pittsburgh Mills mall auctioned off for a hundred bucks. Bid by Wells Fargo which is holding 149 Mill. Debt on mall.
Like many malls around the country, Pittsburgh Mills has suffered the consequences of weak traffic amid tepid demand from the struggling U.S. consumer resulting in massive tenant losses. According to the Pittsburgh Tribune, the mall is only 55% occupied and was last appraised for $11 million back in August.
The value of the mall has been plummeting since it opened in July 2005. Once worth $190 million, it was appraised at $11 million in August.
The mall has lost a number of key tenants over the years, including a Sears Grand store. The mall’s retail space is nearly half empty, with about 55 percent occupied.
Of course, New York Fed President Bill Dudley laid out a very compelling case for retailers yesterday if he can just convince American homeowners to commit the same mistakes they made back in 2006 by repeatedly withdrawing all of the equity in their homes to fund meaningless shopping sprees. So it’s probably safe to keep buying those mall REITs…after all those 3% dividend yields are amazing alternatives to Treasuries and you’re basically taking the same risk…assuming you overlook the billions of property-level debt that ranks senior to your equity position.
Following a flurry of home sales in November, the total number of homes for sale in December declined to a three-year low, according to data provided by Redfin.
“Prospective sellers were hesitant to list last month,” said Redfin Chief Economist Nela Richardson. “Many of them are also buyers, and two transactions are much harder to pull off in a fast-paced, low-inventory environment than one. We expect sellers to list early in 2017, not only to make top dollar from eager buyers, but also to be in a position to act quickly when it comes time to make their next home purchase.”
Redfin receives current and local data from its agents positioned throughout the country. This allows the firm to have a comprehensive view of general real-estate trends unfolding within the markets it covers.
When compared to November, the number of new listings for December decreased by 26.8 percent. December’s median home price was about 276,000, which represents a 4.7 percent increase over the previous year. Furthermore, the median amount of days for which a home was listed on the market before going under contract was 54, which is the fastest rate for any December since Redfin began tracking the data in 2010.
“We’ve never before seen homes turn over so quickly at a national level,” Richardson said. She also noted that December’s data was rather surprising given existing conditions such as a new president-elect, higher mortgage rates, and low home inventory.
The low inventory should continue to cause an upward movement in the prices of homes in2017, with some regions experiencing higher growth than others.
Seattle was the quickest region for home sales, as half of all homes listed on the market were pending a sale within 19 days. Seattle also had the highest home price growth, increasing by a rate 14.8 percent since 2015.
Rates had been trending higher since hitting all-time lows in early July, and exploded higher following the presidential election
Some investors are increasingly worried/convinced that the decades-long trend toward lower rates has been permanently reversed, but such a conclusion would require YEARS to truly confirm
With the incoming administration’s policies driving a large portion of upward rate momentum, mortgage rates will be hard-pressed to return to pre-election levels until well after Trump takes office. Rates can move for other reasons, but it would take something big and unexpected for rates to get back to pre-election levels.
We’d need to see a sustained push back toward lower rates (something that lasts more than 3 days) before anything less than a cautious, lock-biased approach makes sense for all but the most risk-tolerant borrowers. The beginning of 2017 may be bringing such a push, but there’s no telling how long it will last.
Spain’s biggest banks, it seems, will never learn — not even when the highest court of the land, the European Court of Justice (ECJ), rules against their dodgy practices.
The ECJ ruled just before Christmas that Spain’s major banks would have to refund all the billions of euros they had surreptitiously overcharged borrowers as a result of the so-called “mortgage floor-clauses” that were unleashed across the whole home mortgage sector in 2009 [A Nightmare Before Christmas for Spanish Banks].
These floor clauses set a minimum interest rate, typically of between 3% and 4.5%, for variable-rate mortgages, which are a very common mortgage in Spain, even if the Euribor dropped far below that figure. In other words, the mortgages were only really variable in one direction: upwards! While this is not illegal, most banks failed to properly inform their customers that the mortgage contract included such a clause.
The ECJ’s ruling was an emphatic victory for the almost 1.4 million borrowers who had been fleeced out of thousands of euros, many of whom have spent years trying to recoup the funds through Spain’s creaking legal system. Yet even now, the banks, many of which are struggling against a backdrop of negative interest rates and tightening margins, seem loath to part with the cash.
The president of Spain’s sixth biggest bank, Josep Oliu, today called the ruling against the bank’s floor clauses an “attack against the banks,” likening claimants to “roguish swindlers.” His bank, Sabadell, has been accused of pressuring its mortgage customers to sign a “pact of silence,” by which the customers, knowingly or not, pledge never to speak publicly about the conditions of their mortgage — not even to their lawyers — and in return the bank removes the floor clause from the mortgage, without reimbursing a single cent of what it owes.
Even today, with the law firmly on the borrowers’ side, “poisoned offers” continue to proliferate, warns consumer association Facua-Consumidores en Acción.
“It was entirely predictable that the same entities that had shafted consumers out of millions with their abusive mortgage contracts would try to do the same despite the fact that the European Court of Justice has ruled that they must reimburse absolutely all the money they have overcharged customers,” said Facua’s spokesperson, Rubén Sánchez.
Some banks are pressuring customers to sign documents seemingly designed to strip them of their rights to take the banks to court while reimbursing just part of the money they’re owed.
As usual, the banks have the Rajoy government firmly on their side. At first his coalition government considered passing a law that would have forced all the banks to reimburse all the money they had overcharged customers, as the ECJ had ruled. Unsurprisingly, such an approach was firmly opposed by the banking sector and was duly shelved.
The government then came up with a much more bank-friendly offer that included a voluntary, non-binding arrangement, which all big banks tend to love. However, the proposal was deemed too lenient by the coalition government’s “socialist” faction, which fears being seen by voters as coming down too softly on the banking sector, especially at a time when social-democratic parties are fading into irrelevance all over Europe.
In the latest offering, which could be enacted by Royal Decree as early as Saturday, the banks are not obligated to reimburse affected customers, but merely to enter into bilateral negotiation with them. The two sides will have a maximum period of three months (well over double the initial 36 days tabled) to reach a mutually satisfactory arrangement.
If, after that time, the customer is still unsatisfied, he or she can launch legal action against the bank. However, if in the end the amount awarded is less or equal to the amount initially offered by the bank, it is the customer that must cover the legal costs.
The problem with such an approach is that it treats the banks and their customers as equals, says Fernando Herrero, the secretary general of Adicae, an association representing financial end users. It’s a ludicrous proposition given the vast gulf in financial knowledge and expertise of the two sides, not the mention the fact that for the banks “negotiating means flagrantly deceiving the consumer, signing away his or her rights.”
The new proposed legislation has two main goals: to prevent the collapse of a major, cash-strapped bank (such as, say, this one) from the pressure of having to reimburse all its customers all at once, while also reducing the strain on Spain’s already over-burdened judicial system. According to Herrera, the government hasn’t even bothered to contact consumers or their representatives; “it only liaises with the banks.”
And it tells: the government’s new proposal will allow banks to repay customers not only in cash, which will be the most heavily taxed option available, but also by any other “equivalent means.” That apparently includes offering customers “financial products” (subordinated bank bonds, anyone?) of the equivalent value of the money owed, or the possibility of reducing the interest or principal payable on the mortgage, which will have a much less destructive short-term impact on the bank’s balance sheets.
Banks will also be able to offer to swap a customer’s variable mortgage (with floor clause) for a fixed rate one. The consumer association OCU has advised consumers to reject these types of offers, many of which include clauses preventing signatories from undertaking future legal action against the bank in question.
Whatever happens in the coming months, one thing is certain: regardless of what EU law may hold, the banks will do whatever they can to ensure that they refund as little as possible of the billions of euros they surreptitiously overcharged their customers. And they will have the government’s consent throughout.
Source: WolfStreet.com
While one can argue that both JPM and Bank of America posted results that were ok, with some aspects doing better than expected offset by weakness elsewhere, even if moments ago JPM stock just hit an all time high, there was little to redeem the report from the scandal-ridden largest mortgage lender in America, Wells Fargo. Not only did the company miss revenues significantly, reported $21.6bn in Q4 top line, nearly $1 bn below the $22.4bn consensus, but it had to reach deep into its non-GAAP adjustment bag to convert the $0.96 EPS miss into a $1.03 EPS beat (net of “accounting effect”), but the details of its core business were, well, deplorable, which perhaps was to be expected following the recent drop in new credit card and bank account growth, following last year’s fake account scandal.
Incidentally, Wells Fargo reported its latest customer metrics alongside 4Q earnings, and in December the bank said that the retail public continued to shy away, as new checking accounts plunged 40%Y/Y while new credit card applications tumbled 43%. On the other hand, deposit balances debit card transactions continued growing which probably is not a good sign, if only for the Keynesians in the administration: it means that consumers are saving.
But back to Wells results, which revealed that in Q4, the bank’s ROE, one of Buffett’s favorite indicators, fell to 10.94%. which was the lowest quarterly level posted in years according to the WSJ. “While the return had been grinding lower for some time, largely due to the declining interest-rate environment, the fourth quarter also marked the first, full reporting period since the bank’s sales-tactics scandal erupted in September.”
More troubling however, was that in Q4, Wells overall profit fell to $5.27 billion, or 96 cents a share (excluding the various non-GAAP addbacks, down from $5.58 billion, or EPS of $1 in Q4 2015.
So back to Wells Fargo’s retail banking business. Here the bank reported that while credit cards outstanding rose 5% compared to $33.14 billion last quarter and jumped 8% from $34.04 billion in the year-earlier period, new accounts tumbled 52% to 319,000 from 667,000 last quarter and fell 47% from 597,355 in the year-earlier period, once again this is a reflection of the bank’s ongoing legal scandals.
But it was the bank’s bread and butter, mortgage lending, that was the biggest alarm because as a result of rising rates, Wells’ residential mortgage applications and pipelines both tumbled, and after hitting multi-year highs in the third quarter when mortgage rates were likewise hugging multi-year lows, in Q4 Wells’ mortgage applications plunged by $25bn from the prior quarter to $75bn, while the mortgage origination pipeline plunged by nearly half to just $30 billion, and just shy of all time lows recorded in late 2013 and 2014. Moynihan’s explanation was redundant: “the pipeline is weaker because of fewer refi loans.” This should not come as a surprise: just one month ago, Freddie Mac warned that as mortgage rates continue to surge, “expect mortgage activity to be significantly subdued in 2017.”
Wells Fargo did not even have to wait that long, and as shown in the chart below, the biggest US mortgage lender is already suffering.
Expect even greater declines in the coming quarters should rates continue to rise.
Now referred to as “Silicon Beach,” Santa Monica’s rent rates for a one-bedroom apartment are approaching $5,000 per month.
According to the Apartment Guide, the average monthly rent for a one-bedroom in Santa Monica is the most expensive in the nation, at $4,799.20. Comparable rents in the local area are $3,922.67 in Venice; $3,780 in Playa Vista; and $3,320.67 in Marina del Rey.
New York is now the second-most expensive market, with an average one-bedroom apartment costing $4,562.72 per month. San Francisco, once the highest cost market, has fallen to an average $3,880.44 per month. New tech companies, including Snap, Inc., are drawing wealthy young professionals to the area.
Breitbart News has chronicled how apartment rental prices in New York City and Silicon Valley have fallenn about 8 percent, due to a glut of luxury unit construction. But the effective rent rates are down substantially more, because developers are giving multiple month rent concessions “to get heads in beds as quickly as possible,” according to Alexander Goldfarb, a San Francisco analyst with Sandler O’Neill + Partners.
In San Francisco’s trendy South of Market neighborhood, referred to as SoMa, four new high-rise apartment buildings are also offering super high-end amenities that include rooftop decks, state-of-the-art gyms and bike rooms. But despite free rent and nicer digs, none of the four buildings that opened in the last 18 months has achieved the 90 percent occupancy rate that developers need to flip their short-term high-interest rate development loans into low-rate long-term “take-out” financing.
Rent.com and the Apartmentguide.com websites predict that high rental prices should stay strong due to L.A.s’ median home price rising 348.1 percent in the last 30 years, from $116,061 to $520,000. The price jump was an even higher 349.3 percent in Orange County, where the price jumped from $143,210 to $643,483.
But according to mortgage banker Bruce Lawrence, the “term” period for construction loans is usually limited to 36 months, and the cost of that type of financing is at least twice the interest rate of 30-year “take-out financing.” Although the default rate for long-term apartment loans has been a tiny .01 percent, he believes that has been due to a “chronic lack of apartment supply,” which supply is beginning to overwhelm.
In the quarter ending December 31, 2016, Lawrence observed that a record 50,000 new apartment units in the U.S. were rented by tenants, or about six times the number in the year-earlier period. But new apartments completed and renting during the quarter hit 88,000, the highest number since the 1980s.
Looking forward, Lawrence believes that at least 378,000 new apartment units will be completed and start renting in 2017. With construction financing in place, he expects there will be no slowdown in building. Lawrence projects that by mid-year 2017, the U.S. will have a national glut of 100,000 new apartments, and in two years that number could be over 300,000. At that point, Lawrence sees rent “getting whacked.”
Bruce Lawrence comments that Santa Monica is a special case for high rents, because the city adopted rent control three decades ago. But with no limit on the rents for new units, California’s state bird is now the “construction crane.”
2015 was a spectacular year for the commercial real estate market, and 2016 was a solid year. 2017, however, is likely to be a bit of wildcard, analysts say.
Despite a recent rise in interest rates and the uncertainty surrounding the new regime in Washington, market watchers are forecasting a good year for the market, with stable prices and lots of properties changing hands.
Still, it also could go the other way.
“If interest rates go up much more than they have, transaction volume might come down some more,” said Jim Costello, senior vice president with Real Capital Analytics (RCA). “If sellers aren’t forced to sell, they could just sit on the property for awhile until things look more favorable to them.”
Deal volume in 2016 dropped significantly compared to 2015 for properties valued over $2.5 million. Through November, the 2016 year-to-date transaction volume stood at $424.2 billion, which was down 10 percent compared to same 11-month period in 2015, RCA reported.
RCA’s numbers for the full-year in 2016 were not yet available, but it would take a huge month in December for 2016’s deal volume to match the 2015 levels. Transaction volume was trending down at the end of the year. In November, asset sales totaled $33.9 billion, which was down 6 percent compared to November 2015, RCA reported.
Sales in 2016 were still strong compared to previous years since the recovery. Year-to-date through November, the overall transaction volume in 2016 was 12 percent and 35 percent above the 2014 and 2015 levels, respectively.
2016 saw fewer large mega-deals involving multiple properties compared with 2015, but single-asset sales volume remained solid. “If anything, 2015 was almost an aberration,” Costello said. He was optimistic that sales volumes this year would run ahead of the 2016 pace. He noted that, outside a few pockets of the country, the commercial real estate market hasn’t generally seen a building boom that could flood the market with new space and weaken demand for pre-existing buildings.
The new year brings uncertainty, however. Costello said the higher interest rates could eventually lower property values, causing a standoff between buyers and sellers in 2017. Higher interest rates tend to lower commercial asset prices by driving up capitalization rates. Cap rates in all classes have been at historic lows, which have propelled the market forward in recent years.
Costello also said the policies of President-elect Donald Trump also are not fully known, but will ultimately have some impact on the market.
On the campaign trail, Trump proposed a huge infrastructure spending plan, which could lead to a significant rise in interest rates. However, Trump’s pro-growth tax policies also could spur more activity in the market, Costello said.
“The initial reaction of the market was that, well, President-elect Trump was talking about all these potentially inflationary policies, so we better be careful,” Costello said. “Will that come through? It remains to be seen. I am not sure that [House Speaker] Paul Ryan is going to be happy spending lots of money in a [New Deal-era] WPA-style jobs program for infrastructure. That was the thing that was thrown out there that was making the market spooked.”
Ken Riggs, president of Situs RERC, said that the market ended 2016 in a stable position, with prices perfectly matching the values. He said the performance of each property is highly dependent on its asset class and location, and varies widely. He doesn’t expect an overall market correction next year, although investors are growing more cautious with each passing year.
“There will be continued high interest for commercial real estate,” Riggs told Scotsman Guide News. “Investors will just have to be very selective, not only about the property types, but also where they invest within the capital stack.”
The Mortgage Bankers Association returned from its holiday hiatus today, issuing its first update on mortgage applications’ activity since that for the week ended December 16. The results thus include data for the last two weeks and an adjustment to account for the Christmas holiday.
The Market Composite Index, a measure of application volume, for the week ended December 30 was down 12 percent on a seasonally adjusted basis compared to the December 9 summary. Before the adjustment, the drop in application activity was 48 percent.
The Refinance Index decreased 22 percent from two weeks earlier and the seasonally adjusted Purchase Index declined by 2 percent. The unadjusted Purchase Index was 41 percent lower than the two-week old reading and lost 1 percent when compared to the same week in 2015.
Purchase Applications vs. 30-Year Rates:
Its difficult to say at what point consumers thrown in the towel on new home purchases as a number of factors are in play.
Refinance Window Closing Fast:
Refis show a clear pattern. Only those whose interest rate is above the red dotted line is likely to refi. Given closing costs, it’s only profitable to refi when rates are substantially above the red line.
Bear in mind this data is for a slow holiday period. Nonetheless, refi applications behave as expected.
Mortgage Application Activity Wraps Up 2016 on a Down Note
Residential loan application activity continued its post-election slump, declining for the sixth time in the eight weeks, according to the Mortgage Bankers Association’s survey for the week ending Dec. 30. The results included adjustments to account for the Christmas holiday.
The Market Composite Index, a measure of mortgage loan application volume, decreased 12% on a seasonally adjusted basis from two weeks earlier, the last time the MBA conducted its Weekly Application Survey. On an unadjusted basis, the index decreased 48% compared with two weeks ago. The refinance index decreased 22% from two weeks ago.
The seasonally adjusted purchase index decreased 2% from two weeks earlier, while the unadjusted purchase index decreased 41% compared with two weeks ago and was 1% lower than the same week one year ago.
The refinance share of mortgage activity increased to 52.2% of total applications from 51.8% over the previous seven-day period.
Interest rate comparisons are made with the period ended Dec. 23. The adjustable-rate mortgage share of activity decreased to 5.4%, while the Federal Housing Administration share increased to 11.6% from 10.7% the week prior.
The VA share decreased to 12.3% from 12.4% and the USDA share increased to 1.1% from 1% the week prior.
The average contract interest rate for 30-year fixed-rate mortgages with conforming loan balances ($417,000 or less) decreased to 4.39% from 4.45%. For 30-year fixed-rate mortgages with jumbo loan balances (greater than $417,000), the average contract rate decreased to 4.37% from 4.41%.
The average contract interest rate for 30-year fixed-rate mortgages backed by the FHA remained unchanged at 4.22%, while for 15-year fixed-rate mortgages backed by the FHA, the average decreased to 3.64% from 3.7%.
The average contract interest rate for 5/1 ARMs decreased to 3.28% from 3.41%.
Landlords of upscale properties across the U.S. are bracing for rough conditions in 2017 that will likely force them to slash rents and offer deep concessions as a glut of supply brings a seven-year luxury-apartment boom to an end.
The turnaround follows a more-than-26% jump in U.S. apartment rents since early 2010, far outstripping inflation and income growth. But in 2016, rents rose a modest 3.8%, a significant drop from the recent high of 5.6% year-to-year growth in the third quarter of 2015, according to a report to be released Tuesday by MPF Research, a division of RealPage Inc. that tracks the U.S. apartment market.
Developers in New York are already offering up to three months of free rent on some projects. In Los Angeles, some landlords are offering six months of free parking, and some in Houston are waiving security deposits. Meanwhile, MPF Vice President Jay Parsons said he expects little or no rent growth in urban rental markets this year.
“This will be a very challenged leasing environment almost everywhere,” Mr. Parsons said.
More than 50,000 new units were rented by tenants in the fourth quarter in the U.S., six times the number in the year-earlier period. But that demand was overwhelmed by the 88,000 new units that were completed in the quarter, the most since the mid-1980s, according to MPF.
That gap looks set to widen in 2017. More than 378,000 new apartments are expected to be completed across the country this year, almost 35% more than the 20-year average, according to real estate tracker Axiometrics Inc.
The New York area alone will be flooded with nearly 30,000 new apartments in 2017, double the historical average, according to Axiometrics. Roughly 85% are luxury units.
Dallas is expected to see nearly 25,000 new apartments delivered, compared with the long-term average of roughly 9,000 new apartments a year, according to Axiometrics. Los Angeles is expected to get roughly 13,000 new apartments, nearly double the historical average.
Nashville could see some 8,500 new apartments, more than triple the typical 2,400 apartments completed annually.
John Tirrill, managing partner at SWH Partners, an Atlanta developer that has several projects under way in the Nashville area, is leasing a new five-story property with a fitness center, yoga and barre studio and swimming pool. He has lowered rents from $2.25 a square foot to $2.10 a square foot—a $150 discount on a 1,000-square-foot apartment—and is offering one to two months of free rent.
Banks are pulling back on lending, which could help slow the pace of construction starting in late 2018.
“We’re just being really selective,” said John Cannon, a senior vice president at Pinnacle Financial Partners, a Nashville-based financial-services company that has increased its focus on multifamily lending in the last couple of years. “Multifamily has a large number of units on the ground that they really have to demonstrate some absorption.”
2017 Real Estate Synopsis
New home sales and existing home sales are already slowing because of mortgage rates.
A huge supply of apartments will come online in 2017.
Banks are tightening lending standards for apartments.
Nobody has any idea what will happen, or frankly, what is happening when dealing with artificial, centrally-planned markets …
When we first warned 8 days ago that in the last week of trading a “Red Flag For Markets Has Emerged: Pension Funds To Sell “Near Record Amount Of Stocks In The Next Few Days”, and may have to “rebalance”, i.e. sell as much as $58 billion of equity to debt ahead of year end, many scoffed wondering who would be stupid enough to leave such a material capital reallocation for the last possible moment in a market that is already dangerously thin as is, and in which such a size order would be sure to move markets lower, and not just one day.
Today we got the answer, and yes – pension funds indeed left the reallocation until the last possible moment, because three days after the biggest drop in the S&P in over two months, the equity selling persisted as the reallocation trade continued, leading to the S&P closing off the year with a whimper, not a bang, as Treasurys rose, reaching session highs minutes before the 1pm ET futures close when month-end index rebalancing took effect.
10Y yields were lower by 2bp-3bp after the 2pm cash market close, with the 10Y below closing levels since Dec. 8. Confirming it was indeed a substantial rebalancing trade, volumes surged into the futures close, which included a 5Y block trade with ~$435k/DV01 according to Bloomberg while ~80k 10Y contracts traded over a 3- minute period.
The long-end led the late rally, briefly flattening 5s30s back to little changed at 112.5bps. Month-end flows started to pick up around noon amid reports of domestic real money demand; +0.07yr duration extension was estimated for Bloomberg Barclays Treasury Index. Earlier, TSYs were underpinned by declines for U.S. equities that accelerated after Dec. Chicago PMI fell more than expected.
Looking further back, the Treasury picture is one of “sell in December 2015 and go away” because as shown in the chart below, the 10Y closed 2016 just shy of where it was one year ago while the 30Y is a “whopping” 4 bps wider on the year, and considering the recent drop in yields as doubts about Trumpflation start to swirl, we would not be surprised to see a sharp drop in yields in the first weeks of 2017. Already in Europe, German Bunds are back to where they were on the day Trump was elected.
So with a last minute scramble for safety in Treasures, it was only logical that stocks would slide, closing the year off on a weak note. Sure enough, the S&P500 pared its fourth annual gain in the last five years, as it slipped to a three-week low in light holiday trading, catalyzed by the above mentioned pension fund selling.
The day started off, appropriately enough, with a Dollar flash crash, which capped any potential gains in the USD early on, and while a spike in the euro trimmed the dollar’s fourth straight yearly advance, the greenback still closed just shy of 13 year highs, up just shy of 3% for the year.
Meanwhile, the year’s best surprising performing asset, crude, trimmed its gain in 2016 to 52%.
The S&P 500 Index cut its advance this year to 9.7 percent as it headed for the first three-days slide since the election. The Dow Jones Industrial Average was poised to finish the year 200 points below 20,000 after climbing within 30 points earlier in the week. It appears the relentless cheer leading by CNBC’s Bob Pisani finally jinxed the Dow’s chances at surpassing 20,000 in 2016. Trading volume was at least 34 percent below the 30-day average at this time of day. A rapid surge in the euro disturbed the calm during the Asian morning, as a rush of computer-generated orders caught traders off guard. That sent a measure of the dollar lower for a second day, trimming its rally this year below 3 percent.
Actually, did we say crude was the best performing asset of the year? We meant Bitcoin, the same digital currency which we said in September 2015 (when it was trading at $250) is set to soar as Chinese residents start using it more actively to circumvent capital controls, soared, and in 2016 exploded higher by over 120%.
For those nostalgic about 2016, the chart below breaks down the performance of major US indices in 2016 – what began as the worst start to a year on record, ended up as a solid year performance wise, with the S&P closing up just shy of 10%, with more than half of the gains coming courtesy of an event which everyone was convinced would lead to a market crash and/or recession, namely Trump’s election, showing once again that when dealing with artificial, centrally-planned market nobody has any idea what will happen, or frankly, what is happening.
Looking at the breakdown between the main asset classes, while 30Y TSYs are closing the year effectively unchanged, the biggest equity winners were financials which after hugging the flat line, soared after the Trump election on hopes of deregulation, reduced taxes and a Trump cabinet comprised of former Wall Streeters, all of which would boost financial stocks, such as Goldman Sachs, which single handedly contributed nearly a quarter of the Dow Jones “Industrial” Average’s upside since the election.
The FX world was anything but boring this year: while the dollar soared on expectations of reflation and recovery, the biggest moves relative to the USD belonged to sterling, with cable plunging after Brexit and never really recovering, while the Yen unexpectedly soared for most of the year, only to cut most of its gains late in the year, when the Trump election proved to be more powerful for Yen devaluation that the BOJ’s QE and NIRP.
The largely unspoken story of the year is that while stocks, if only in the US – both Europe and Japan closed down on the year – jumped on the back of the Trump rally, bonds tumbled. The problem is that with many investors and retirees’ funds have been tucked away firmly in the rate-sensitive space, read bonds, so it is debatable if equity gains offset losses suffered by global bondholders.
And speaking of the divergence between US equities and, well, everything else, no other chart shows the Trump “hope” trade of 2016 better than this one: spot thee odd “market” out.
So as we close out 2016 and head into 2017, all we can add is that the Trump “hope” better convert into something tangible fast, or there will be a lot of very disappointed equity investors next year.
And with that brief walk down the 2016 memory lane, we wish all readers fewer centrally-planned, artificial “markets” and more true price discovery and, of course, profits. See you all on the other side.
Why would we buy these things? Do people actually want to live in a mobile home? They’re undesirable right? Aren’t mobile homes often in bad neighborhoods? I wouldn’t want to live there myself so why would I want to buy one? Well here’s the answer. Mobile homes are good for cash flow. I know everybody that gets started in real estate investing often try to do flipping because they want these big paychecks but the big paychecks, they come and they go. Reality television makes lots of money off showcasing how easy and fun rehabbing a home can be. However, cash flow doesn’t go anywhere, it stays there for a long time and it’s the way you obtain your financial freedom. So the more cash flow, the more mobile home investments you have, the more assets you acquire means the more post office paychecks you’re going to have coming in. Imagine having to go to your post office every month for your paycheck. So, that’s why mobile homes can be a good investment and not just something to disregard in your investment portfolio, you invest in mobile homes for the cash flow alone. 2. Do I need money to get started?
No. You do not need money to get started in mobile home investing. This is the biggest myth ever and some of the worst talk you can hear from some of your peers or your family is that you need to have money to make money. That’s a self-defeating prophecy. This is False!!!!! If you do not have time to invest in learning how to make cash off real estate investing then you will need money…. But, if you are sitting on a large savings account then you just need to put more time and effort on your part to make investing profitable for you. Put forth a little bit of effort to go out and find some deals, wholesale some deals, help out sellers, find some motivated sellers who need help and pocket thousands of dollars. Take that money and put it into your assets and keep doing the same thing over, over and over again until you have enough to acquire your financial freedom. Easy enough, right??? If you are laughing just keep reading and learning. 3. Do I need a dealer’s license to be a mobile home investor?
No. No you do not. Now if you ask a dealer this they’ll say yes. Yes you do, why do they say this? Just like if you ask a realtor if wholesaling properties is okay, they might say its illegal, because without a realtor they make no money. You do not need a dealer’s license to be a mobile home investor. Now if you’re selling, or flipping a certain amount of mobile homes every year you’re going to qualify for needing to get your dealer’s license but if you’re just dealing the properties or using them as rentals you need not have your dealer’s license. 4. Can I rent mobile homes in a mobile home parks?
Yes you can, But this is the number one mistake I see mobile home investors do is that they will pick up the phone and call all the mobile home parks in their area and t say, “Can I rent a mobile home in your park?” You know what they’re going to say? “No because I don’t want the problems of you coming into my park and doing a rental agreement with somebody and then your tenant thinking what’s in your rental agreement is more important than what is in my lot agreement. You understand? That causes problems. So just by picking up the phone and calling around asking everybody if you can rent in their park shows that you do not know what you are doing. Do not do that. Do not make this newbie mistake. Can you rent in parks? Yes. If they tell you that you can rent in their park go ahead. Just don’t ask them. Rule of thumb, don’t ask them. However, be smart enough to read the parks contract on lot rent and mobile home usage within their park. 5. Will a mobile home appreciate in value?
Well the Manufacturing Housing Institute says yes. I say no, not at all. The longer you own a mobile home the less its worth until eventually one day it’s going to be worth very little. That’s going to be the maximum value that you can get for the home in your area. Now other than that can they appreciate? In theory, well if there is mobile home parks in Florida where mobile home junkers go for $10,000 a piece but yet there’s mobile home parks in South Carolina where the mobile homes go for $500 or even free, so obviously there’s a difference in value being the different areas. So now all of a sudden if South Carolina real estate switched to be like Florida real estate well in theory then a mobile home could appreciate but does a mobile home appreciate? Generally, no. However, if you have read the first part of this post then you already realize that appreciation is not what you are striving for with mobile homes. 6. Should I buy a mobile home that needs to be moved?
Generally, no. You don’t want to do that because if you have to buy a mobile home and then it has to be moved, then you are now paying the amount to purchase the mobile home and also paying for the mobile home to be moved. You really do not want to do that. This extra expense could make your numbers go into the red. You will be adding all that extra expense into the purchase price of your mobile home. So what does this mean?? Well, what that means is that it is now going to take twice as long to get all your money back that you have invested into your mobile home. Do you want to wait 2-3 years before you actually make a buck or do you want to make it now? Do you want to do it in 6 months or 12 months, me I prefer 6 months so I try not to move mobile homes. Now in my system “The Keys to Cash Flow”, I teach you how to get a mobile home moved for free. That’s right, for free. I show you how you can still go out and buy a mobile home that needs to be moved and use a different strategy where somebody else will be paying to move it instead of you. Yes, there are ways that you can buy a mobile home if it has to be moved and still make it into a deal. Just remember that the rule of thumb is that if you’re going to go out and buy a mobile home that has to be moved, it is going to increase the cost of the asset and delay your profits. 7. What kind of financing is available?
Generally, not much and usually none is available. No bank or finance company wants to finance mobile homes. When you get a whole bunch of mobile homes and you go into the bank and you say, “Well I’ve got a bunch of these mobile homes that I’m going to use as collateral towards something else.” No, the banks will not use them as collateral. Really a mobile home, is really only worth how much money it is getting in every single month or how much money it can be wholesaled or flipped for. So that’s the true value of the property, how much money does it get monthly and beyond that the banks really do not care how much it is worth. It is a mobile home. It’s a wobbly box. That’s the way they look at it. Banks will not refinance them and a lot of them have a hard time even giving you financing on them. If you go into a mortgage officer they are not going to be able to do a loan for you. Some try to go to a branch bank and they might do a loan for you or there is actually a smarter route out there called private moneylenders. Now when you start getting involved in being a mobile home investor other investors see what you are doing and they will say, “Wow, there’s some really big numbers there. Why don’t you let me give you the cash to go ahead and fix that deal and put some money in it.” Well that all works out great. You give them a better interest rate than they can get any place else bar none and still have a great deal on your hands. If you can give someone clear up to 15% on a 12-month or even a 3-month then that’s amazing. Now imagine if you had your deal with them where they were making 15% every 3 months imagine if you have that with them for a full 12 months that could be up to a 60% return per year. Who offers that? This makes it a win win situation for private moneylenders and for the average investor to make monthly cash flow off a small investment.
8. Singlewides or doublewides?
Singlewides!! Doublewides are double the expense. You think, “Oh, if it’s a double wide is it going to be double the amount of money I get each month for it?” Nope, not really. Often what’s going to happen is doublewides are going to have a mortgage payment on them. So every month there is nobody paying you rent, you will still have to pay a note to someone. This stops the benefits of investing in mobile homes as the benefit is the large monthly rent and the money you can make flipping the homes. If you are constantly making a payment on a large note then you might as well invest in a single family home where you will get equity. Stay away from doublewides in mobile home parks; they are not good investments and do not produce enough cash to invest in them. 9. Can I buy mobile homes, no money down?
Absolutely. Here’s the neat thing about mobile home investing is that there are people out there that are having really big problems and very motivated to sell. Maybe they have to move out of state, maybe they have got behind on their payments, maybe they have to sell it immediately and they have to move someplace else. Whatever reason they have, they are now motivated sellers. Now, even with a percentage of our population living in mobile homes and being motivated to sell you still do not see realtors fighting over mobile home listings. Most of the time the motivated seller’s only choice is to go to the dealer and see if the dealer will take it back and do you think they are? No. No of course they are not, so here’s what happens, it either sits there and it gets taken back by the bank or they try to rent it out to a family member who will end up shagging the place out or you know just a number of negative things that will happen there. So really the only help that they have is you and I. We are the only ones that will cater to this population. We are the only ones that will help them. So you can make a lot of money just solving someone’s problems by buying mobile homes, no money down. 10. How old should the mobile homes be?
Well, I spoke earlier that we don’t want this huge bill looming over our heads because the longer it takes us to pay off the mobile home the longer it’s going to take for us to actually get any money off the deal. Generally, you want a home that’s really close to being paid off or is already paid off so that you can start reaping cash flow off the property immediately. So what you’re looking for is probably 15,20 year old mobile homes but of course we said no doublewides so keep it to singlewides and that is your honey hole properties.
Economists, who are generally surprised by everything, were caught off guard once again.
Despite the fact that mortgage rates have been climbing for months, the economists’ consensus expectation was for pending home sales to rise 0.5%. Not a single economist predicted a decline this month. The range of estimates was 0.3% to 2.0%.
Pending sales, which were widely expected to make a good showing in November, pulled back sharply instead. The National Association of Realtors® (NAR) said its Pending Home Sales Index (PHSI), a forward-looking indicator based on contracts for existing home purchases, declined 2.5 percent to 107.3 in November from 110.0 in October. NAR said “the brisk upswing in mortgage rates and not enough inventory dispirited some would-be buyers.” The decrease brought the PHSI to its lowest level since January of this year and it is now 0.4 percent below the index last November which stood at 107.7.
Analysts polled by Econoday had been upbeat about the November outlook. The consensus was for an increase of 0.5 percent with some analysts predicting as much as a 2.0 percent gain.
Lawrence Yun, NAR chief economist said, “The budget of many prospective buyers last month was dealt an abrupt hit by the quick ascension of rates immediately after the election. Already faced with climbing home prices and minimal listings in the affordable price range, fewer home shoppers in most of the country were successfully able to sign a contract.”
Only one of the four regions displayed any strength in November. Pending sales in the Northeast were up 0.6 percent to 97.5 and are 5.7 percent higher than in November 2015.
The Midwest saw contract signings decline 2.5 percent to 103.5, falling behind the previous November by 2.4 percent. Sales in the South were down 1.2 percent to an index of 118.7, this is 1.3 percent behind the level a year earlier. The West posted the largest loss, 6.7 percent, and a year-over-year drop of 1.0 percent.
Yun says higher borrowing costs somewhat cloud the outlook for the housing market in 2017. NAR’s most recent HOME survey, found that renters have less confidence about the present being a good time to buy than they had at the beginning of the year. On the other hand, Yun says that the impact of higher rates will be partly neutralized by stronger wage growth because of the 2 million net new job additions expected next year.
The Pending Home Sales Index is based on a large national sample, typically representing about 20 percent of transactions for existing-home sales. An index of 100 is equal to the average level of contract activity during 2001, which was the first year to be examined. By coincidence, the volume of existing-home sales in 2001 fell within the range of 5.0 to 5.5 million, which is considered normal for the current U.S. population. Pending sales are generally expected to close within two months of contract signing.
The notion that strong wage growth and jobs will partially neutralize rising interest rates is silly. But Yun has a mission: Always be as positive as possible about housing.
In its latest outlook for the U.S. lodging sector, CBRE Hotels’ Americas Research noted that the sector will continue to accrue benefits from achieving the industry’s all-time record occupancy record in 2016 of 65.4%.
However, a range of expected factors, from new hotel supply entering the market to the growing influence of Airbrb, is expected to impact hotel returns in 2017. CBRE forecasts the average daily rate (ADR) will increase 3.3% next year, a strong positive indicator but a lower ADR growth rate than in 2016, and a continuation of a trend since 2014.
According to CBRE, ADR movement will vary by location and chain-scale, with Northern California markets such as Sacramento and Oakland, along with Washington, D.C. and Tampa projected to lead the nation, with ADR gains of more than 6% during 2017.
“Conventional wisdom says that at such high occupancy levels, hoteliers should have the leverage to implement strong price increases,” notes R. Mark Woodworth, senior managing director of CBRE Hotels’ Americas Research. “However, like for much of 2016, you need to throw conventional wisdom out the window.”
In fact, CBRE sees slight declines in occupancy combined with minimal real gains in ADR as the pattern through 2020.
“Lodging is a cyclical business and we continue to see U.S. hotels sit on top of the peak of the cycle after recovering from the Great Recession,” Woodworth said, adding that the positive outlook for lodging demand and resulting high levels of occupancy will continue to keep the sector on a steady but level path.
“While flat performance sounds disappointing, the strong underpinnings supporting continued growth in travel will prevent an outright fall from the peak,” Woodworth added.
For lodging REITs, the current cycle appears to be similar to the 1990s, during which a prolonged economic expansion sustained growth in revenue per available room (RevPAR) or nearly a decade, said Brian H. Dobson, REIT analyst for Nomura.
While lodging is entering the latter stages of its life cycle when RevPAR growth usually plateaus, supply headwinds in urban markets is expected to reduce RevPAR growth by an additional 100 basis points, resulting in 2% growth through 2018, Dobson said.
Chiming in with its hotel outlook, PricewaterhouseCoopers (PwC) said the lodging cycle is expected to moderate after seven years of growth. PwC analysts predicted supply growth will increase at the long-term historical average of 1.9%, but they forecast a decline in demand growth will lead to the first occupancy decline that the U.S. lodging industry has seen in eight years.
“Uncertainty, combined with plateauing growth in corporate profits, is expected to continue to weigh on corporate transient demand,” PwC said in its assessment.
“Additional demand-side concerns, including the strong U.S. dollar, Brexit, and economic weakness in the Eurozone, Zika, and depressed energy sector activity, are all expected to contribute to the continued weakness in lodging sector demand growth.”
The often volatile housing starts numbers took another dive this report, down 18.7% in November according to the Census Bureau New Residential Construction report for November 2016.
Housing starts 1959-Present
Year-Over-Year Detail Since 1994
New Residential Construction Details
Permits down 4.7% from October
Permits down 6.6% from year ago
Starts down 18.7% from October
Starts down 6.9% from year ago
Completions up 15.4% in October
Completions up 25% from year ago
Mortgage Rates Soar
Mortgage rates have risen 104 basis points (1.04 percentage points) since July 8.
As I have pointed out, this is bound to affect the housing market sooner or later. Sooner means now.
Each quarter-point hike will affect mortgage rates correspondingly until the long end of the curve refuses to rise further. At that point, we will be in recession.
Now that Donald Trump has won the election, the Federal Reserve has decided now would be a great time to start raising interest rates and slowing down the economy. Over the past several decades, the U.S. economy has always slowed down whenever interest rates have been raised significantly, and on Wednesday the Federal Open Market Committee unanimously voted to raise rates by a quarter point. Stocks immediately started falling, and by the end of the session it was their worst day since October 11th.
The funny thing is that the Federal Reserve could have been raising rates all throughout 2016, but they held off because they didn’t want to hurt Hillary Clinton’s chances of winning the election.
And during Barack Obama’s eight years, there has only been one rate increase the entire time up until this point.
But now that Donald Trump is headed for the White House, the Federal Reserve has decided that now would be a wonderful time to raise interest rates. In addition to the rate hike on Wednesday, the Fed also announced that it is anticipating that rates will be raised three more times each year through the end of 2019…
Fed policymakers are also forecasting three rate increases in 2017, up from two in September, and maintained their projection of three hikes each in 2018 and 2019, according to median estimates. They predict the fed funds rate will be 1.4% at the end of 2017, 2.1% at the end of 2018 and 2.9% at the end of 2019, up from forecasts of 1.1%, Federa1.9% and 2.6%, respectively, in September. Its long-run rate is expected to be 3%, up slightly from 2.9% previously. The Fed reiterated rate increases will be “gradual.”
So Barack Obama got to enjoy the benefit of having interest rates slammed to the floor throughout his presidency, and now Donald Trump is going to have to fight against the economic drag that constant interest rate hikes will cause.
How is that fair?
As rates rise, ordinary Americans are going to find that mortgage payments are going to go up, car payments are going to go up and credit card bills are going to become much more painful. The following comes from CNN…
Higher interest rates affect millions of Americans, especially if you have a credit card or savings account, or want to buy a home or a car. American savers have earned next to nothing at the bank for years. Now they could be a step closer to earning a little more interest on savings account deposits, even though one rate hike won’t change things overnight.
Rates on car loans and mortgages are also likely to be affected. Those are much more closely tied to the interest on a 10-year U.S. Treasury bond, which has risen rapidly since the election. With a Fed hike coming at a time when interest on the 10-year note is also rising, that won’t help borrowers.
The higher interest rates go, the more painful it will be for the economy.
If you recall, rising rates helped precipitate the financial crisis of 2008. When interest rates rose it slammed people with adjustable rate mortgages, and suddenly Americans could not afford to buy homes at the same pace they were before. We have already been watching the early stages of another housing crash start to erupt all over the nation, and rising rates will certainly not help matters.
But why does the Federal Reserve set our interest rates anyway?
We are supposed to be a free market capitalist economy. So why not let the free market set interest rates?
Many Americans are expecting an economic miracle out of Trump, but the truth is that the Federal Reserve has far more power over the economy than anyone else does. Trump can try to reduce taxes and tinker with regulations, but the Fed could end up destroying his entire economic program by constantly raising interest rates.
Of course we don’t actually need economic central planners. The greatest era for economic growth in all of U.S. history came when there was no central bank, and in my article entitled “Why Donald Trump Must Shut Down The Federal Reserve And Start Issuing Debt-Free Money” I explained that Donald Trump must completely overhaul how our system works if he wants any chance of making the U.S. economy great again.
One way that Trump can start exerting influence over the Fed is by nominating the right people to the Federal Open Market Committee. According to CNN, it looks like Trump will have the opportunity to appoint four people to that committee within his first 18 months…
Two spots on the Fed’s committee are currently open for Trump to nominate. Looking ahead, Fed Chair Janet Yellen’s term ends in January 2018, while Vice Chair Stanley Fischer is up for re-nomination in June 2018.
Within the first 18 months of his presidency, Trump could reappoint four of the 12 people on the Fed’s powerful committee — an unusual amount of influence for any president.
By endlessly manipulating the economy, the Fed has played a major role in creating economic booms and busts. Since the Fed was created in 1913, there have been 18 distinct recessions or depressions, and now the Fed is setting the stage for another one.
And anyone that tries to claim that the Fed is not political is only fooling themselves. Everyone knew that they were not going to raise rates during the months leading up to the election, and it was quite clear that this was going to benefit Hillary Clinton.
But now that Donald Trump has won the election, the Fed all of a sudden has decided that the time is perfect to begin a program of consistently raising rates.
If I was Donald Trump, I would be looking to shut down the Federal Reserve as quickly as I could. The essential functions that the Fed performs could be performed by the Treasury Department, and we would be much better off if the free market determined interest rates instead of some bureaucrats.
Unfortunately, most Americans have come to accept that it is “normal” to have a bunch of unelected, unaccountable central planners running our economic system, and so it is unlikely that we will see any major changes before our economy plunges into yet another Fed-created crisis.
With the Dow Jones just a handful of gamma imbalance rips away from 20,000, the CIO of One River Asset Management, Eric Peters, shares some critical perspective on the market’s recent euphoric surge, going so far as to brand what is going on as America’s “Massive Policy Error”, the biggest in the past 50 years.
His thoughts are presented below, framed in his typical “anecdotal” way.
Anecdote:
“America’s Massive Policy Error,” said the CIO. “That’s the title of the book someone will write in ten years about what’s happening today.” Never in economic history has a government implemented a fiscal stimulus of this size at full employment.
“The Trump team and economic elites believe that anemic corporate capital expenditure is the root cause of today’s lackluster growth.” It’s not that simple.
If credit to first-time homebuyers hadn’t been cut off post-2008, and state and local governments had spent as generously as they had after every other crisis, this recovery would have been like all others.
“People think that if only we cut taxes, kill Obamacare, and build some bridges, then American CEOs will start spending. That’s nonsense.” Ageing demographics, slowing population growth, and massive economy-wide debts have left CEOs unenthusiastic about expanding productive capacity.
“You make the most money in macro investing when there are policy errors and this will be the biggest one in 50yrs. These guys are going to crash the economy.” But not yet. First the anticipation of higher borrowing and rising growth expectations will widen interest rate differentials. Which will lift the dollar. But unlike recent episodes of dollar strength, this one will be accompanied by higher equities as investors ignore tightening financial conditions because they expect offsetting tax cuts and infrastructure spending.
Emboldened by higher equity prices, bond bears will push yields higher, lifting the dollar further, validating people’s belief in a strong economy in the kind of reflexive loop that Soros described in The Alchemy of Finance – the kind that drives extreme macro trends.
“This will be like the 1985 dollar super-spike. And the Fed will eventually be forced to follow the steepening yield curve, hiking rates aggressively, tightening the debt noose, killing the economy. Then rates will collapse, crushing the dollar.”
To visualize the impact the recent spike in mortgage rates will have on the US housing market in general, and home refinancing activity in particular, look no further than this chart from the October Mortgage Monitor slidepack by Black Knight.
The chart profiles the sudden collapse of the refi market using October and November rates. As Black Knight writes, it looks at the – quite dramatic – effect the mortgage rate rise has had on the population of borrowers who could both likely qualify for and have interest rate incentive to refinance. It finds it was cut in half in just one month.
Some more details from the source:
The results of the U.S. presidential election triggered a treasury bond selloff, resulting in a corresponding rise in both 10-year treasury and 30-year mortgage interest rates
Mortgage rates have jumped 49 BPS in the 3 weeks following the election, cutting the population of refinanceable borrowers from 8.3 million immediately prior to the election to a total of just 4 million, matching a 24-month low set back in July 2015
Though there are still 2M borrowers who could save $200+/month by refinancing and a cumulative $1B/month in potential savings, this is less than half of the $2.1B/ month available just four weeks ago
The last time the refinanceable population was this small, refi volumes were 37 percent below Q3 2016 levels
Which is bad news not only for homeowners, but also for the banks, whose refi pipeline – a steady source of income and easy profit – is about to vaporize.
It’s not just refinancings, however, According to the report, as housing expert Mark Hanson notes, here is a summary of the adverse impact the spike in yields will also have on home purchases:
Overall purchase origination growth is slowing, from 23% in Q3’15 to 7% in Q3’16.
The highest degree of slowing – and currently the slowest growing segment of the market – is among high credit borrowers (740+ credit scores).
The 740+ segment has been mainly responsible for the overall recovery in purchase volumes and in fact, currently accounts for 2/3 of all purchase lending in the market today.
Since Q3’15 the growth rate in this segment has dropped from 27% annually to 5% in Q3’16. (NOTE, Q3/Q4’15 included TRID & interest rate volatility making it an easy comp).
This naturally raises the question of whether we are nearing full saturation of this market segment.
Low credit score growth is still relatively slow, and only accounts of 15% of all lending (as compared to 40% from 2000-2006), the lowest share of purchase originations for this group on record. ITEM 2) The “Refi Capital Conveyor Belt” has ground to a halt, which will be felt across consumer spend. AND Rates are much higher now than in October when this sampling was done.
Phone carriers and banks have gained confidence in using mobile data for lending after seeing startups show preliminary success with the method in the past few years.
Financial institutions, overcoming some initial trepidation about privacy, are increasingly gauging consumers’ creditworthiness by using phone-company data on mobile calling patterns and locations.
The practice is tantalizing for lenders because it could help them reach some of the 2 billion people who don’t have bank accounts. On the other hand, some of the phone data could open up the risk of being used to discriminate against potential borrowers.
Phone carriers and banks have gained confidence in using mobile data for lending after seeing startups show preliminary success with the method in the past few years. Selling such data could become a more than $1 billion-a-year business for U.S. phone companies over the next decade, according to Crone Consulting LLC.
Fair Isaac Corp., whose FICO scores are the world’s most-used credit ratings, partnered up last month with startups Lenddo and EFL Global Ltd. to use mobile-phone information to help facilitate loans for small businesses and individuals in India and Russia. Last week, startup Juvo announced it’s working with Liberty Global Plc’s Cable & Wireless Communications to help with credit scoring using cellphone data in 15 Caribbean markets.
And Equifax Inc., the credit-score company, has started using utility and telecommunications data in Latin America over the past two years. The number of calls and text messages a potential borrower in Latin America receives can help predict a consumer’s credit risk, said Robin Moriarty, chief marketing officer at Equifax Latin America.
“It turns out, the more economically active you are, the more people want to call you,” Moriarty said. “That level of activity, that level of usage is what’s really most predictive.”
The new credit-assessment methods could allow more people in areas without bank branches to open accounts online. They could also make credit cards and loans more accessible and prevalent in some parts of the world. In the past, lenders mainly relied on bank information, such as savings and past loan repayments, to judge whether to let someone borrow.
Some of the data financial institutions are using come directly from interactions with potential borrowers, while other information is collected in the background. FICO’s partner EFL sends psychological questionnaires of about 60 questions to potential borrowers’ mobile phones. With Lenddo’s technology, FICO can check if users’ phones were physically present at their stated home or work address, and if they are in touch with other good borrowers — or with people with long histories of fooling lenders.
“We see this as a good opportunity to explore that type of data for risk assessment, as a viable means of extending financial inclusion,” David Shellenberger, a senior director at FICO, said in an interview.
Juvo’s Flow Lend mobile app uses data science and games — like letting users earn points — to build real-time subscriber profiles, to let C&W personalize lending criteria and provide immediate credit extensions. Prepaid customers can request credit advances for airtime and data. Denise Williams, a spokeswoman for C&W, didn’t immediately return a request for comment.
Getting Permission
In most cases, consumers must grant permission for their telecommunications records to be accessed as part of their risk assessment. One reason it’s taken the credit-risk industry some time to work out agreements with phone carriers or their representatives is because of negotiations over how to best protect client privacy.
Companies are also concerned about making sure they don’t make themselves susceptible to claims of bias. By checking phone records to see if a credit applicant associates with people with a poor track record of repaying loans, for example, lenders risk practicing discrimination on people living in disadvantaged neighborhoods. In addition, to comply with the Fair Credit Reporting Act in the U.S., a data provider must have a process in place for investigating and resolving consumer disputes in a timely manner — something that telecommunications carriers abroad may not offer.
Several large phone companies contacted by Bloomberg declined to comment about whether they share data with financial institutions, and few of the startups or financial companies were willing to disclose their telecommunications partners.
Mirror of Life
Startup Cignifi, which helps customers like Equifax crunch data on who phone users are calling and how often, works with phone companies like Bharti Airtel Ltd.’s unit in Ghana. Cignifi scores some 100 million consumers in 10 countries each month, said Chief Executive Officer Jonathan Hakim. Banks typically use such assessments alongside other evaluations to decide whether to grant a loan. Airtel didn’t respond to requests for comment.
“The way you use the phone is a proxy for the way you live,” Hakim said. “We are capturing a mirror of the customer’s life.” His company collects phone data — such as whom the potential borrower is calling and how frequently — from partners like Airtel Ghana, and crunches it for customers like Equifax, as well as marketers. It scores some 100 million consumers in 10 countries each month, Hakim said. Banks typically use such assessments alongside other evaluations to decide whether to grant a loan. Cignifi always gets customers’ permission to use data, he said.
EFL’s questionnaire approach is already used by lenders in Spain, Latin America and Africa. More than 700,000 people have received more than $1 billion in loans thanks in part to its data, CEO Jared Miller said in an interview.
EFL’s default rate varies by country, from low single digits in India to low double digits in Brazil, Miller said. To account for the risk, lenders in Brazil charge much higher interest rates, he said.
Startups like Lenddo, Branch and Tala have collected several years’ worth of data to prove that their methods of using mobile-phone data work — and that customers flock to them for help. Started in 2011, Lenddo, for instance, spent 3 1/2 years giving out tens of thousands of loans, in the amount of $100 to $2,000, in the Philippines, Colombia and Mexico to prove out its algorithms. Its average default rate was in the single digits, CEO Richard Eldridge said in an interview.
The company stopped offering lending in 2014, and stepped into credit-related services to financial institutions and banks in early 2015. Embedded into banking mobile apps, it can collect data on users with their consent. The company’s revenue is up 150 percent from last year, Eldridge said.
“The market is changing,” Eldridge said. “More and more people are seeing examples around the world of how non-traditional data can be used to enter into new market segments that couldn’t be served before.”
The carnage in bonds has consequences. The average interest rate of the a conforming 30-year fixed mortgage as of Friday was quoted at 4.125% for top credit scores. That’s up about 0.5 percentage point from just before the election, according to Mortgage News Daily. It put the month “on a short list of 4 worst months in more than a decade.”
One of the other three months on that short list occurred at the end of 2010 and two “back to back amid the 2013 Taper Tantrum,” when the Fed let it slip that it might taper QE Infinity out of existence.
Investors were not amused. From the day after the election through November 16, they yanked $8.2 billion out of bond funds, the largest weekly outflow since Taper-Tantrum June.
The 10-year Treasury yield jumped to 2.36% in late trading on Friday, the highest since December 2015, up 66 basis point since the election, and up one full percentage point since July!
The 10-year yield is at a critical juncture. In terms of reality, the first thing that might happen is a rate increase by the Fed in December, after a year of flip-flopping. A slew of post-election pronouncements by Fed heads – including Yellen’s “relatively soon” – have pushed the odds of a rate hike to 98%.
Then in January, the new administration will move into the White House. It will take them a while to get their feet on the ground. Legislation isn’t an instant thing. Lobbyists will swarm all over it and ask for more time to shoehorn their special goodies into it. In other words, that massive deficit-funded stimulus package, if it happens at all, won’t turn into circulating money for a while.
So eventually the bond market is going to figure this out and sit back and lick its wounds. A week ago, I pontificated that “it wouldn’t surprise me if yields fall some back next week – on the theory that nothing goes to heck in a straight line.”
And with impeccable timing, that’s what we got: mid-week, one teeny-weeny little squiggle in the 10-year yield, which I circled in the chart below. The only “pullback” in the yield spike since the election. (via StockCharts.com):
Note how the 10-year yield has jumped 100 basis points (1 percentage point) since July. I still think that pullback in yields is going to happen any day now. As I said, nothing goes to heck in a straight line.
In terms of dollars and cents, this move has wiped out a lot of wealth. Bond prices fall when yields rise. This chart (via StockCharts.com) shows the CBOT Price Index for the 10-year note. It’s down 5.6% since July:
The 30-year Treasury bond went through a similar drubbing. The yield spiked to 3.01%. The mid-week pullback was a little more pronounced. Since the election, the yield has spiked by 44 basis points and since early July by 91 basis points (via StockCharts.com):
Folks who have this “risk free” bond in their portfolios: note that in terms of dollars and cents, the CBOT Price Index for the 30-year bond has plunged 13.8% since early July!
However, the election razzmatazz hasn’t had much impact on junk bonds. They’d had a phenomenal run from mid-February through mid-October, when NIRP refugees from Europe and Japan plowed into them, along with those who believed that crushed energy junk bonds were a huge buying opportunity and that the banks after all wouldn’t cut these drillers’ lifelines to push them into bankruptcy, and so these junk bonds surged until mid-October. Since then, they have declined some. But they slept through the election and haven’t budged much since.
It seems worried folks fleeing junk bonds, or those cashing out at the top, were replaced by bloodied sellers of Treasuries.
Overall in bond-land, the Bloomberg Barclays Global Aggregate bond Index fell 4% from Friday November 4, just before the election, through Thursday. It was, as Bloomberg put it, “the biggest two-week rout in the data, which go back to 1990.”
And the hated dollar – which by all accounts should have died long ago – has jumped since the election, as the world now expects rate hikes from the Fed while other central banks are still jabbering about QE. In fact, it has been the place to go since mid-2014, which is when Fed heads began sprinkling their oracles with references to rate hikes (weekly chart of the dollar index DXY back to January 2014):
The markets now have a new interpretation: Every time a talking head affiliated with the future Trump administration says anything about policies — deficit-funded stimulus spending for infrastructure and defense, trade restrictions, new tariffs, walls and fences, keeping manufacturing in the US, tax cuts, and what not — the markets hear “inflation.”
So in the futures markets, inflation expectations have jumped. This chart via OtterWood Capital doesn’t capture the last couple of days of the bond carnage, but it does show how inflation expectations in the futures markets (black line) have spiked along with the 10-year yield (red line), whereas during the Taper Tantrum in 2013, inflation expectations continued to head lower:
Inflation expectations and Treasury yields normally move in sync. And they do now. The futures markets are saying that the spike in yields and mortgage rates during the Taper Tantrum was just a tantrum by a bunch of spooked traders, but that this time, it’s real, inflation is coming and rates are going up; that’s what they’re saying.
In the last few months, as The Fed has jawboned a rate hike into markets, mortgage applications in America have collapsed 30% to 10-month lows – plunging over 9% in the last week as mortgage rates approach 4.00%.
We suspect the divergent surge in homebuilders is overdone…
Donald Trump’s victory sparked a tremendous sell-off in the Treasury market from an expectation of fiscal stimulus, but more broadly, from an expectation that a unified-party government can enact business-friendly policies (protectionism, deregulation, tax cuts) which will be inflationary and economically positive. It doesn’t take too much digging to show that the reality is different. The deluge of commentaries suggesting ‘big-reflation’ are short-sighted. Just as before last Tuesday we thought the 10yr UST yield would get below 1%, we still think this now.
Business Cycle
No matter the President, this economic expansion is seven and a half years old (since 6/2009), and is pushing against a difficult history. It is already the 4th longest expansion in the US back to the 1700’s (link is external). As Larry Summers has pointed out (link is external) after 5 years of recovery, you add roughly 20% of a recession’s probability each year thereafter. Using this, there is around a 60% chance of recession now.
History also doesn’t bode well for new Republican administrations. Certainly, the circumstances were varied, but of the five new Republican administrations replacing Democrats in the 19th and 20th centuries, four of them (Eisenhower, Nixon, Reagan, and George W. Bush) faced new recessions in their first year. The fifth, Warren Harding, started his administration within a recession.
Fiscal Stimulus
Fiscal stimulus through infrastructure projects and tax cuts is now expected, but the Federal Reserve has been begging for more fiscal help since the financial crisis and it has been politically infeasible. The desire has not created the act. A unified-party government doesn’t make it any easier when that unified party is Republican; the party of fiscal conservatism. Many newer House of Representatives members have been elected almost wholly on platforms to reduce the Federal debt. Congress has gone to the wire several times with resistance to new budgets and debt ceilings. After all, the United States still carries a AA debt rating from S&P as a memento from this. Getting a bill through congress with a direct intention to increase debt will not be easy. As we often say, the political will to do fiscal stimulus only comes about after a big enough decrease in the stock market to get policy makers scared.
Also, fiscal stimulus doesn’t seem to generate inflation, probably because it is only used as a mitigation against recessions. After the U.S. 2009 Fiscal stimulus bill, the YoY CPI fell from 1.7% to 1% two years later. Japan has now injected 26 doses (link is external) of fiscal stimulus into its economy since 1990 and the country has a 0.0% YoY core CPI, and a 10yr Government bond at 0.0%.
Rate Sensitive World Economy
A hallmark of this economic recovery has been its reliance on debt to fuel it. The more debt outstanding, the more interest rates influence the economy’s performance. Not only does the Trump administration need low rates to try to sell fiscal stimulus to the nation, but the private sector needs it to survive. The household, business, and public sectors are all heavily reliant on the price of credit. So far, interest rates rising by 0.5% in the last two months is a drag on growth.
Global Mooring
Global policies favoring low rates continue to be extended, and there isn’t any economic reason to abandon them. Just about every developed economy (US, Central Europe, Japan, UK, Scandinavia) has policies in place to encourage interest rates to be lower. To the extent that the rest of the world has lower rates than in the US, this continues to exert a downward force on Treasury yields.
Demographics
As Japan knows and we are just getting into, aging demographics is an unmovable force against consumption, solved only with time. The percent of the population 65 and over in the United States is in the midst of its steepest climb. As older people spend less, paired with slowing immigration from the new administration, consumer demand slackens and puts downward pressure on prices.
Conclusion
We haven’t seen such a rush to judgement of boundless higher rates that we can remember. Its noise-level is correlated with its desire, not its likelihood. While we cannot call the absolute top of this movement in interest rates, it is limited by these enduring factors and thus, we think it is close to an end. In a sentence, not only will the Trump-administration policies not be enacted as imagined, but even if they were, they won’t have the net-positive effect that is hoped for. We think that a 3.0% 30yr UST is a rare opportunity buy.
Online lenders were supposed to revolutionize the consumer loan industry. Instead, they are rapidly becoming yet another “the next subprime.”
We first started writing about the P2P sector in early 2015 with cautionary pieces like and “Presenting The $77 Billion P2P Bubble” and “What Bubble? Wall Street To Turn P2P Loans Into CDOs.” Things accelerated in February of this year when we first noted that substantial cracks were starting to show in the world of P2P lending, and more specifically, with LendingClub’s inability to assess credit risk of its borrowers that were causing the company to experience higher write-off rates than forecast.
Below is a chart that was used in a LendingClub presentation showing just how far off the company was in predicting write-off rates – the bread and butter of its business. It was evident then that their algorithms weren’t “working very well.”
At the time we said that what the slide above shows is that LendingClub is terrible at assessing credit risk. A write-off rate of 7-8% may not sound that bad (well, actually it does, but because P2P is relatively new, we don’t really have a benchmark), it’s double the low-end internal estimate. That’s bad. In other words, we said, the algorithms LendingClub uses to assess credit risk aren’t working. Plain and simple.
Three months later, in May of 2016, our skepticism was proven right when the stock of LendingClub – at the time the largest online consumer lender – imploded when the CEO resigned following an internal loan review.
Since then, despite a foreboding sense of deterioration behind the scenes, there were few material development to suggest that the cracks in the surface of the online lending industry were getting bigger.
Until today, that is, when we learned that – as expected – there has been a spike in online loan defaults by US consumers, sending a shockwave through the online lending industry: a group of online loans that were packaged into bonds is going bad faster than lenders and bond underwriters had expected even after the recent volatility in the P2P market, in what Bloomberg dubbed was “the latest sign that some startups that aimed to revolutionize the banking industry underestimated the risk they were taking.”
In a page taken right out of the CDO book of 2007, delinquencies and defaults on at least four different sets of bonds have reached the “triggers” points. Breaching those levels would force lenders or underwriters to start paying down the bonds early, redirecting cash from other uses such as lending and organic growth. According to Bloomberg, one company, Avant Inc. and its underwriters, will have to begin to repay three of its asset-backed notes, which have all breached trigger levels.
Two of Avant’s securities breached triggers this month for the first time, the person said, asking for anonymity because the data is not public. Another bond, tied to the subprime lender CircleBack Lending Inc., may also soon breach those levels, according to Morgan Stanley analysts. When the four offerings were originally sold last year, they totaled more than $500 million in size. Around $2.8 billion of bonds backed by online consumer loans were sold in 2015, according to research firm PeerIQ.
The breach of trigger points is merely the latest (d)evolutionary event attained by the online lending industry, whose fall promises to be far more turbulent than its impressive rise. Prior to the latest news, LendingClub last month raised interest rates and tightened its standards for at least the second time this year after seeing higher delinquencies among its customers, especially those with the most debt.
However, that was a linear deterioration which had no impact on mandatory cash covenants, at least not yet. With the breach of trigger points, online lenders have officially entered the world of binary outcomes, where the accumulation of enough bad loans will have implications on the underlying business and its use of cash.
Breaching triggers typically forces a company to divert cash flow from assets to paying off bonds instead of making new loans, which often means it has to find new, more expensive funding or to scale down its business. Avant, based in Chicago, cut its monthly target for lending this summer by about 50 percent, and decided to shrink its workforce in line with that, while CircleBack Lending, based in Boca Raton, Florida, stopped making new loans earlier this year.
Setting bond triggers is often up to the security’s underwriters. Some lenders have been working more closely with Wall Street firms to make sure the banks know how loans will probably perform and set triggers at reasonable levels, said Ram Ahluwalia, whose data and analytics firm PeerIQ tracks their loan data.
Indicatively, in the “old days” John Paulson would sit down with Goldman Sachs and determine the “triggers” on CDOs, also known as attachment and detachment points, so he could then be the counter party on the trade, and short it while Goldman syndicated the long side to its clients, also known as muppets. It would be interesting if a similar transaction could take place with online loans as well.
Other industry participants aren’t doing better: “There was a rush to grow,” said Bryan Sullivan, chief financial officer of LoanDepot, a mortgage company that last year began making unsecured loans to consumers online. In the true definition of irony, while Sullivan was speaking about the industry in general, LoanDepot’s own loan losses on a bond in September broke through the ceilings that had been set by underwriters at Jefferies Group.
We are not the only ones to have warned early about the dangers of online lending: Recently Steve Eisman, a money manager who predicted the collapse of subprime mortgage securities, said some firms have been careless and that Silicon Valley is “clueless” about the work involved in making loans to consumers. Non-bank startups arranged more than $36 billion of loans in 2015, mainly for consumers, up from $11 billion the year before, according to a report from KPMG.
And while P2P may be the “next” subprime, there is always the “old” subprime to fall back on to get a sense of the true state of the US consumer :as Bloomberg adds, the percentage of subprime car loan borrowers that were past due reached a six-year high in August according to S&P Global Ratings’ analysis of debts bundled into bonds.
Lenders themselves are talking about the heavy competition for customers. Jay Levine, the chief executive officer of OneMain Holdings Inc., one of America’s largest subprime lenders, said last week that “the availability of unsecured credit is currently the greatest that has been in recent years,” although he said much of the most intense competition is coming from credit card lenders.
And in a surprising twist, OneMain, formerly part of Citigroup, is taking steps to curb potential losses by requiring the weakest borrowers to pledge collateral. In other words, what was until recently an unsecured online loan industry is quietly shifting to, well, secured. Alas, for most lenders it may be too late.
* * *
For those curious, the deals that have or are expected to breach triggers include:
MPLT 2015-AV1, a bond deal backed by Avant loans that Jefferies bought and securitized.
AVNT 2015-A, a bond deal issued by Avant and underwritten by Jefferies.
AMPLT 2015-A, a bond deal backed by Avant loans and underwritten by Morgan Stanley.
MPLT 2015-CB2, backed by subprime loans made by CircleBack Lending Inc. and underwritten by Jefferies.
The California housing market is expected to grow increasingly un-affordable next year, driving would-be home buyers away from high-cost coastal regions and toward the more inexpensive inland stretches of the state, according to an industry forecast.
The California Assn. of Realtors on Thursday predicted that sales will be more robust in the Central Valley and Inland Empire as families look for a home they can afford.
And as more and more families struggle to afford a home, price increases are expected to be more muted than in years past. The state’s median price is projected to end this year at $503,900, up 6.2% from last year. In 2017, prices should climb 4.3% to $525,600.
“Next year, California’s housing market will be driven by tight housing supplies and the lowest housing affordability in six years,” Pat Zicarelli, the association’s president, said in a statement.
The high cost of housing in California has become a growing political issue within the state. And it has spurred calls for increased funding for subsidized housing, as well as efforts to loosen building regulations so the private sector can quickly construct more residential units.
This week, two studies — one from UC Riverside and another from UCLA — warned that the state’s housing shortage threatens to put a drag on economic growth.
Despite those and other fears, the Realtors association predicted that the economy will keep improving and produce enough demand to nudge statewide home sales up 1.4%, compared to 2016.
In contrast, sales this year are projected to inch down 0.4% from 2015.
“The underlying fundamentals continue to support overall home sales growth, but headwinds, such as global economic uncertainty and deteriorating housing affordability, will temper stronger sales activity,” the association’s chief economist, Leslie Appleton-Young, said in a statement.
California is expensive to anyone who wants to move here, but is that a “crisis”? State Treasurer John Chiang and the bureaucrats in Sacramento want you to believe this so they can add another 5 million people to the state, and they don’t want to stop there. More people everywhere, more cars on the jam-packed streets and freeways, more kids in already crowded schools, more water resources drained, more pollution, and more environmental damages. The character and nature of our state and every community changed forever. Sacramento wants them to live in your neighborhood. Why should we let them ruin the good thing we’ve sacrificed for?
Let’s examine homeownership affordability in the state. According to records from the California Association of REALTORS, their Affordability index is currently at 34, meaning 34% of California families – using traditional metrics – can afford to buy the median priced California home. In the past 28 years, this index has been as low as 22% in 1991 and as high as 56% in 2012. For comparison, the national affordability index is at 60%. So California is expensive, but it has been for decades. If home ownership, currently 54% in California, were truly unaffordable we should be seeing massive mortgage defaults. But only 1.41% of California mortgages are at risk of foreclosure, meaning 98.59% of California homeowners with a mortgage are affording them. Does that sound like a crisis or a reason to add another 5 million people to the state?
The definition of “unaffordable” is “too expensive for people to be able to buy or pay for.” At California’s current median price, homes are selling so fast the current statewide inventory of unsold homes would last only 3.5 months if new inventory didn’t regularly come on the market. This sales pace is with nearly every loan requiring very strict qualifying standards.
State Treasurer Jon Chiang wants your community to grow because not everyone who wants to live in it can afford it. There will always be people who can’t afford to live wherever they want. I would love to live in Montecito, so should Sacramento make that affordable for me, for everyone else in the state, or in the country? The state is not one median house price. It has expensive areas and cheap neighborhoods, many a relatively short commute between. In Santa Barbara county the median price on the south coast is $1,200,000 for a single family home. Less than an hour away in Lompoc the median single-family home sales price is $310,000 and two bedroom apartments that rent for $1,950 a month in Santa Barbara go for $1,050 in Lompoc. But of course, there are still people who can’t afford even that. Though renters tend to stay in a residence for a median of 4 years, but up to 40% move in less than a year and they can leave for more affordable digs with just a 30-day notice.
So, maybe California isn’t for everyone? But should it be? Should we have everyone in the United States living here? Maybe there are better opportunities in other parts of our great country for those who find us too expensive? According to Bloomberg median price for starter homes in Atlanta, GA is $87,000; St. Louis, MO $65,000; and Detroit, MI $33,075. Many homes can be had for less! Employment is even more plentiful than in California with the unemployment rates for these cities averaging 5.3%. My best friend from Dos Pueblos High School in Goleta moved his wife, who grew up in Ventura, and their two children, to Colorado Springs for a more affordable home purchase. A close friend from Goleta Valley Junior High moved to Dallas and found a wife, job, and homeownership. One of my brothers, who grew up Santa Barbara, is very happy with his family in Denver, owning a $450,000 home that would cost at least $1,300,000 in Santa Barbara.
If you don’t build them they won’t come, and the ones who can’t afford to live here will move to less expensive communities. Let’s not spoil the good state we have to make Sacramento and developers happy.
Mall Investors Are Set to Lose Billions as America’s Retail Gloom Deepens
The blame lies with online shopping and widespread discounting.
The dramatic shift to online shopping that has crushed U.S. department stores in recent years now threatens the investors who a decade ago funded the vast expanse of brick and mortar emporiums that many Americans no longer visit.
Weak September core retail sales, which strip out auto and gasoline sales, provide a window into the pain the holders of mall debt face in coming months as retailers with a physical presence keep discounting to stave off lagging sales.
Some $128 billion of commercial real estate loans—more than one-quarter of which went to finance malls a decade ago—are due to refinance between now and the end of 2017, according to Morningstar Credit Ratings.
Wells Fargo estimates that about $38 billion of these loans were taken out by retailers, bundled into commercial mortgage-backed securities (CMBS) and sold to institutional investors.
Morgan Stanley, Deutsche Bank, and other underwriters now reckon about half of all CMBS maturing in 2017 could struggle to get financing on current terms. Commercial mortgage debt often only pays off the interest and the principal must be refinanced.
The blame lies with online shopping and widespread discounting, which have shrunk profit margins and increased store closures, such as Aeropostale’s bankruptcy filing in May, making it harder for mall operators to meet their debt obligations.
Between the end of 2009 and this July e-commerce doubled its share of the retail pie and while overall sales have risen a cumulative 31 percent, department store sales have plunged 17 percent, according to Commerce Department data.
According to Howard Davidowitz, chairman of Davidowitz & Associates, which has provided consulting and investment banking services for the retail industry since 1981, half the 1,100 U.S. regional malls will close over the next decade.
TOO MUCH
A surplus of stores are fighting for survival as the ubiquitous discount signs attest, he said.
“When there is too much, and we have too much, then the only differentiator is price. That’s why they’re all going into bankruptcy and closing all these stores,” Davidowitz said.
The crunch in the CMBS market means holders of non-performing debt, such as pensions or hedge funds, stand to lose money.
The mall owners, mostly real estate investment trusts (REITs), have avoided major losses because they can often shed their debt through an easy foreclosure process.
“You have a lot of volume that won’t be able to refi,” said Ann Hambly founder and chief executive of 1st Service Solutions, which works with borrowers when CMBS loans need to be restructured.
Cumulative losses from mostly 10-year CMBS loans issued in 2005 through 2007 already reach $32.6 billion, a big jump from the average $1.23 billion incurred annually in the prior decade, according to Wells Fargo.
The CMBS industry is bracing for losses to spike as loan servicers struggle to extract any value from problematic malls, particularly those based in less affluent areas.
In January, for example, investors recouped just 4 percent of a $136 million CMBS loan from 2006 on the Citadel Mall in Colorado Springs, Colorado.
Investor worries about exposure to struggling malls and retailers intensified in August when Macy’s said it would close 100 stores, prompting increased hedging and widening spreads on the junk-rated bonds made up of riskier commercial mortgages.
Adding to the stress, new rules, set to be introduced on Dec. 24, will make it constlier for banks to sell CMBS debt. The rules require banks to hold at least 5 percent of each new deal they create, or find a qualified investor to assume the risk.
This has already roughly halved new CMBS issuance in 2016 and loan brokers say the packaged debt financing is now only available to the nation’s best malls. Investors too are demanding greater prudence in CMBS underwriting.
Mall owners who failed to meet debt payments in the past would just hand over the keys because the borrowers contributed little, if any, of their own money. The terms often shielded other assets from being seized as collateral to repay the debt.
Dodging the overall trend, retail rents for premier shopping centers located in affluent areas continue to rise. Vacant retail space at malls is at its lowest rate since 2010, according to research by Cushman & Wakefield.
The low vacancy rate reflects the ability of some malls to fill the void left by store closings by offering space to dollar stores and discounters.
That is, however, little consolation for investors.
“With the retail consolidation that we have ahead of us, malls have a fair amount of pain left to come,” Edward Dittmer, a CMBS analyst at Morningstar, said.
✖ Janet Yellen is kicking around the idea of backing off of the Fed’s 2% inflation target.
✖ If the Fed lets the economy run hot, the yield curve will steepen.
✖ Equities should rally.
✖ Gold looks vulnerable with real yields still too low.
Janet Yellen, in a speech on Friday mentioned that the Fed could choose to allow the U.S. economy to “run hot” to allow for an increase in the labor participation rate. In typical Fed fashion, the goalposts are being moved once again, and the implication for the yield curve is important.
“Another scenario, one which Holbrook recognizes but does not represent our base forecast, is that the Federal Reserve will continue to drag its feet and not respond to accelerated wage gains. In this environment, longer-term yields will rise as inflationary expectations rebound. Larry Summers, among others, has recently advocated for such Fed policy, calling for them to increase their inflation targets. If this materializes, short-term rates will remain low, and the yield curve will steepen.” – July 1st, 2016
Janet Yellen’s comments on Friday indicate that this scenario is increasingly likely. It seems that the Federal Reserve, rather than taking a proactive stance against inflation as it has done in the past, it is going to be reactionary. If this is the case, investors can shift their attention from leading indicators like unemployment claims and wage growth, and instead focus on lagging indicators like PPI and CPI when assessing future Fed action.
The fixed income market is still pricing in a 65% likelihood of a rate hike in December, and given the abundance of dissenters at the September meeting, as well as recent remarks from Stanley Fischer, we expect the Fed to raise in December. After which, we presume the Federal Reserve will declare all meetings live and “data-dependent.” We expect that the Federal Reserve will NOT raise rates again until the core PCE deflator (their preferred measure) breaches 2%.
If they do choose to let the economy “run hot,” the market will need to figure out what level of inflation the Federal Reserve considers to be “hot.” Is it 2.5%? Is it 3%? At what level does the labor participation rate need to reach for further Fed normalization?
These questions will be answered in time as investors parse through the litany of Fed commentary over the next couple of months. In any case, a shift in the Fed mandate is gaining traction. Rather than fighting inflation, the Federal Reserve is now fighting the low labor participation rate. Holbrook expects such a policy to manifest itself in the following manner:
Steepening yield curve
Weakening dollar
Further commodity appreciation
In terms of the equity markets, we expect the broad market to rally into year-end after the election – whatever the outcome. Bearish sentiment is still pervasive, and Fed inaction in the face of higher inflation should be welcomed by equity investors, at least in the short run. Holbrook is also cautious regarding gold. Gold is often described as an inflation hedge. However, this is incorrect. It is a real rate hedge. As real rates move lower, gold moves higher, and vice versa. With real rates at historical lows, we think there could be further weakness in the yellow metal.
The fixed income market is in the early stages of pricing in a “run-hot” economy. The spread between the yield on the thirty-year bond (most sensitive to changes in inflation) and the two-year bill (sensitive to Fed action) is testing its five-year downtrend. A successful breach indicates that the market has changed. The Federal Reserve is willing to keep rates low, or inflation is on the horizon, or both.
Holbrook’s research shows that during the current bull market, a bear steepening trade (long yields rise more than short-term yields) has implied solid market returns. The S&P 500 advances an average of 2% monthly in this environment. This environment is second only to a bull steepening trade (where short-term rates fall faster than long-term rates) during which the S&P 500 rose more than 3.5% monthly.
Flattening yield curves were detrimental to equity returns. You can see the analysis in our prior perspective, “Trouble with the Curve.” In any case, a steepening yield curve should bode well for equity prices.
Meanwhile, there is ample evidence that inflation is starting to make a comeback. Global producer price indices generally lead the CPI and they have been spiking this year. CPI will likely follow, and not just in the United States.
And finally, although the dollar has rallied over the last couple of weeks in expectation of a late-year rate hike, much of the deflationary effect from a stronger dollar is behind us. The chart below tracks the year-over-year percentage change in the dollar (green line, inverted) versus the year-over-year change in goods inflation (yellow line). The dollar typically leads by four months and as such is lagged in the graph.
As you can see, the shock of a stronger dollar is behind us and it is likely that the price deflation we have experienced will wane. If, over the next four months, the price of goods is flat year over year, which we expect, the core PCE deflator should register above the Fed’s 2% target. The real question is: How will the Fed react when this happens? Will they initiate additional rate hikes? Or will they let the economy “run hot?”
Spring and summer usually get all the real estate glory with lofty accolades as the best time to buy a home—and, of course, the busiest. Meanwhile, their seasonal sibling, fall, often gets tossed to the leaf pile by potential buyers who might think autumn is just about haunted houses and turkey dinners rather than house hunting.
But surprise! Fall is not only a great time to buy a home, it might also be the best season to find the perfect property (and not just because you can browse the listings while cupping a pumpkin latte).
Read on to discover the many reasons.
Reason No. 1: Lower home prices
The best month to snag a deal when buying a home? October. This isn’t just some random guess; it’s based on RealtyTrac’s analysis of more than 32 million home sales over 15 years. The resulting data showed that on average, October buyers paid 2.6% below estimated market value at the time for their homes.
For a house that would normally be $300,000, 2.6% translates into a $7,800 discount. Those savings are nothing to sneeze at, so bargain hunters should get hopping once autumn rolls around. (For an even better deal, aim for Oct. 8, when buyers get a home, on average, at 10.8% below estimated market value.)
“For buyers looking for a better deal, fall is a great time to make offers,” says NewYorkCity Realtor® JoanneR. Douglas. (In case you’re wondering, the worst month for buyers is April, when homes sell for 1.2% above estimated market value. The worst single day is Jan. 19, with an average 9.6% premium.)
Reason No. 2: Less competition
Like a beach after Labor Day, the realty market clears out as the days turn crisp. Most summer buyers have already found a home, meaning a fall buyer will have way less competition for the available houses on the market, says Bill Golden of Re/Max Metro Atlanta Cityside. And don’t worry about those buyers who didn’t close before August, either.
“Many folks will drop out of the market until after the new year,” says Golden, giving a fall buyer even greater room to roam at open houses. There may not be as many properties to choose from, but as Golden says, “a little patience and perseverance could reap big rewards.”
Reason No. 3: Worn-out home sellers
Say hello to your little friend, leverage. Sellers who have their homes on the market in the fall “are generally people who need to sell, which can make for better negotiations for the buyer,” says Golden. And if a home you have your eye on has been on the market all summer, you’re really in the driver’s seat as far as making an offer the seller can’t refuse. The longer a home sits on the market, the more negotiating power the buyer wields.
Reason No. 4: The holidays are around the corner
Not only are most home sellers worn out after the summer selling season, they’re also caught between a real estate rock and a hard place in that the holidays are barreling down on them. If they want to move and settle down in time to host Thanksgiving and put up their Christmas lights, they’ll have to close, fast. So use this pre-holiday window to your advantage by offering to help them vacate fast if they cut you a deal.
Reason No. 5: Year-end tax credits
No one wants to buy a home purely to make their accountant happy. But there’s a sweet added incentive to closing on a home at the end of the fiscal year. Come the following April 15, you might be able to take some nice tax deductions, including closing costs, property tax, and mortgage interest, to offset your taxable earnings.
Reason No. 6: More quality time with your real estate team
As the year comes to an end, fewer buyers also means you should have the full attention of your real estate agent, mortgage broker, real estate lawyer, and everyone else on your house hunting team. You can take your time to ask all those questions you have about earnest money, due diligence, title transfers, and more without feeling like you’re horning in their busiest season to turn a buck.
Reason No. 7: Home improvement bargains
Once you close on that home you found in the fall, you may want to upgrade your appliances. Luckily, December is when major appliances—refrigerators, stoves, washers, and dryers—are at their very cheapest, according to Consumer Reports. It’s also the best time of year to buy cookware and TVs.
So once you’re settled in (and provided you have any money left), get ready to renovate!
Deutsche Bank is blood in the water… and the sharks smell it.
Yesterday, Bloomberg reported that major hedge funds were reducing their exposure to the German banking behemoth. The smart money is headed for the exits.
That caused the bank’s U.S.-listed shares to hit a new all-time low of $11.27 yesterday. The stock closed down nearly 7% for the day.
And that’s just the most recent bad news for Deutsche…
Earlier this week, Chancellor Angela Merkel said that Germany wasn’t going to bail it out.
That’s on top of $14 billion fine recently imposed by the U.S. Justice Department that the bank can’t afford to pay. Its current market capitalization is just $16.8 billion.
This torrent of negativity has the talking heads warning that Deutsche Bank is careening toward bankruptcy, bringing back memories of Lehman Bros. in 2008.
But it’s more than that…
Leveraged to the Hilt:
What investors are finally realizing is that Deutsche Bank is insolvent, something I told my Trend Following subscribers back in July.
Deutsche has astounding leverage of 40 times. Leverage is the proportion of debts that a bank has compared with its equity/capital. That means Deutsche has 40 times more debt than equity/ capital.
Remember, Lehman Bros. was only 31 times leveraged when it imploded in 2008.
The huge concern for investors right now is whether the bank can make enough profit to start overcoming its liabilities.
But it’s trapped in a low-growth economic environment. And it’s being choked to death by the European Central Bank’s negative interest rate policy (NIRP).
Because of NIRP, EU banks like Deutsche Bank effectively have to pay the central bank to hold cash on their balance sheets. At the same time, they can’t charge high rates on the loans they make. As a result, they’re getting squeezed on net interest margins, which decimates profits.
Plus, Deutsche has more than $72 trillion of risky derivatives exposure. Derivatives are the complex financial instruments that cratered the global economy in 2008.
Santelli exclaims “don’t help anymore!!” How has any of their ‘help’ helped in the last 7 years?
“Central banks buying in the [stock] market… you really think that’s a good idea?” Raging about picking winners, buying Deutsche Bank, and keeping stocks “steady” around elections, the veteran pit trader exploded, “is that the world we really want to live in?”
The Fed’s buying stocks “will completely and utterly and in every possible way destroy and value in the marketplace…”
3 minutes of brutal reality slapped into the face of a ridiculous rumor-driven day…
We first noted Wall Street’s misguided plan to feed its securitization machine with peer-to-peer (P2P) loans back in May 2015 (see “What Bubble? Wall Street To Turn P2P Loans Into CDOs“). Obviously we warned then that the voracious demand for P2P loans was a direct product of central bank policies that had sent investors searching far and wide for yield leaving them so desperate they were willing to gamble on the payment streams generated by loans made on peer-to-peer platforms.
In addition to the pure lunacy of using unsecured, low/no-doc, micro-loans as collateral for a CDO, we pointed out that the very nature of P2P loans meant that borrower creditworthiness likely deteriorated as soon as loans were issued. The credit deterioration stemmed from the fact that many borrowers were simply using P2P loan proceeds to repay higher-interest credit card debt. That said, after paying off that credit card, many people simply proceeded to max it out again leaving them with twice the original amount of debt.
And, sure enough, it only took about a year before the first signs started to emerge that the P2P lending bubble was bursting. The first such sign came in May 2016 when Lending Club’s stock collapsed 25% in a single day after reporting that their write-off rates were trending at 7%-8% or roughly double the forecasted rate (we wrote about it here “P2P Bubble Bursts? LendingClub Stock Plummets 25% After CEO Resigns On Internal Loan Review“).
Now, signs are starting to emerge that Lending Club isn’t the only P2P lender with deteriorating credit metrics. As Bloomberg points out, less than year after wall street launched the P2P CDO, one of the first such securities backed by loans from LoanDepot has already experienced such high default and delinquency rates that cash flow triggers have been tripped cutting off cash flow to the lowest-rating tranches.
The $140mm private security, called MPLT 2014-LD1, was issued by Jefferies in November 2015 and, less than 1 year after it’s issuance, cumulative losses rose to 4.97% in September, breaching the 4.9% “trigger” for the structure. And sure enough, the deal was sold to a group of investors that included life insurance company, Catholic Order of Foresters.
But, as Bloomberg noted, the LoanDepot deal wasn’t the only one to breach covenants in less than a year. Two other Jefferies securitizations backed by loans made by the online startups CircleBack Lending and OnDeck Capital have also breached triggers.
For some reason the following clip from the “Big Short” comes to mind…“short everything that guy has touched.”
Everyone is fretting about the Canadian house price bubble and the mountain of debt it generates – from the IMF on down to the regular Canadian. Now even the Bank for International Settlement (BIS) and the Organization for Economic Co-operation and Development (OECD) warn about the risks.
Every city has its own housing market, and some aren’t so hot. But in Vancouver and Toronto, all heck has broken loose in recent years.
In Vancouver, for example, even as sales volume plunged 45% in August from a year ago – under the impact of the new 15% transfer tax aimed at Chinese non-resident investors – the “benchmark” price of a detached house soared by 35.8%, of an apartment by 26.9%, and of an attached house by 31.1%. Ludicrous price increases!
In Toronto, a similar scenario has been playing out, but not quite as wildly. In both cities, the median detached house now sells for well over C$1 million. Even the Bank of Canada has warned about them, though it has lowered rates last year to inflate the housing market further – instead of raising rate sharply, which would wring some speculative heat out of the system. But no one wants to deflate a housing bubble.
During the Financial Crisis, when real estate prices in the US collapsed and returned, if only briefly, to something reflecting the old normal, Canadian home prices barely dipped before re-soaring. And this has been going on for years and years and years.
Over recent years, real house prices have been growing at a similar or higher pace than prior to the crisis in a number of countries, including Canada, the United Kingdom, and the United States. The rise in real estate prices has pushed up price-to-rent ratios to record highs in several advanced economies.
Canada stands out. Even on an inflation-adjusted basis, Canadian home prices have long ago shot through the roof. The OECD supplied this bone-chilling chart. The top line (orange) represents Canadian house price changes, adjusted for inflation:
In the US, several national indices have now exceeded the crazy prices of the Housing Bubble that started blowing up in 2006. In some cities, the median price has shot way past the prior bubble highs – in San Francisco, by over 50%! But other cities have lagged behind, and the national averages paper over the local bubbles.
In Canada, real estate is more concentrated. The Canadian market is about one-tenth the size of the US market. But the two largest local markets, Toronto and Vancouver, together make up 54% of the Teranet National Bank House Price Index. So when these two local bubbles begin to deflate – or implode – they will create enormous havoc across Canada.
Real estate is highly leveraged. It’s funded with debt. Many folks cite down-payment requirements in rationalizing why the Canadian market cannot implode, and why, if it does implode, it won’t pose a problem for the banks. However, an entire industry has sprung up to help homebuyers get around the down-payment requirements.
So household debt has been piling up for years, driven by mortgage debt. Statistics Canada reported two weeks ago that the ratio of household debt to disposable income has jumped to another record in the second quarter, to a breath-taking 167.6%:
The BIS now too, in its Quarterly Review, jumped on the bandwagon of issuing ineffectual warnings about this pile of debt, fingering particularly China – and in the same breath Canada:
According to the BIS early warning indicators, which are intended to capture financial overheating and potential financial distress over medium-term horizons, credit growth continues to be unusually high relative to GDP in several Asian economies as well as in Canada.
Estimated debt service ratios, which attempt to capture principal and interest payments relative to income, appear to be at manageable levels at current interest rates for most countries, although they point to potential concerns in Brazil, Canada, China, and Turkey.
The BIS developed a metric – the “credit-to-GDP gap” – that compares current credit levels to long-term trends and serves as an early warning indicator for financial crises.
Everyone wants to know when the next financial crisis happens. It will happen, but once again, it will surprise the economic establishment because, in the eloquent words of the BIS, debts always “appear to be at manageable levels” – until suddenly, they’re not.
The country with the highest credit-to-GDP gap is China (30.1), and the second highest is Canada (12.1). When it comes to debt creation, it’s not a good idea to be mentioned in the same breath with China. Turkey (9.6) is next in line. Then Mexico (8.8). And Brazil (4.6). Oh, and Australia (4.4)! So housing-bubble Canada is in excellent company!
The only saving grace is the permanently near-zero-interest-rate environment. Because that’s what it takes to keep this thing from deflating, according to the BIS, and even then there are “concerns.” But these countries, particularly Canada, are going to be in trouble when rates rise even a little.
So have central banks painted themselves and their entire bailiwicks into a corner with their ingenious emergency policies that have been dragging on for eight years? You bet. Is there a way out? Nope. Not a good one, at least. It’s just a question of when and how – and who gets to pay.
“It’s the greatest thing in the world,” exclaims Alex Sifakis – the 33 year old Florida ‘flipper’ – saying he has never raised this much money this fast (despite teh 14% cost of capital). As Bloomberg reports, house flippers and property developers are increasingly crowdfunding — tapping the virtual wallets of anonymous internet backers on various platforms – because “the amount of money you can raise isn’t limited by anything but their investor base.” As one of the ‘investors’ in this crowdfunded flipfest notes “if something goes bad, you have the asset to fall back on,” but, as Bloomberg rebukes, speed and property loans may not mix — remember 2008?
Bloomberg points out that the house flipper from Jacksonville, Florida, crowdfunded nine deals totaling more than $9 million through RealtyShares over the last two and a half years. A July deal for $1 million took him just 12 hours.
“Generally, raising money takes so much time,’’ said Sifakis, 33. “This offers so much flexibility and time savings. It’s so much better than going to family offices, banks or Wall Street firms.’’
House flippers and property developers are increasingly crowdfunding — tapping the virtual wallets of anonymous internet backers on platforms such as RealtyShares, LendingHome, PeerStreet and Patch of Land. For riskier ventures, such as building new homes and buying, renovating and selling existing ones, they’re finding quick financing can be easier to get online than from banks.
That’s contributed to an increase in home flipping. In the second quarter, 39,775 investors bought and sold at least one house, the most since 2007, according to ATTOM Data Solutions.
The ease of fundraising through these nontraditional lenders could be a warning sign, according to Erik Gordon, a law professor at the University of Michigan in Ann Arbor.
“Whenever you see a big difference between the terms on which you can raise money in one market versus another market, something is wrong in at least one of those markets,” Gordon said.
“It usually is the market with the least-experienced players, and they usually end up wishing they hadn’t played.”
Sifakis said he’s borrowing money at an annual rate of 14 percent over two and a half years. He keeps all the profit he makes from selling homes, he said.
So far, Bloombergnotes that there have been few defaults in real estate crowdfunding deals. When they happen, the platforms say they’ll pay investors the proceeds from property sales.
The business has other potential pitfalls.
When it comes to real estate, faster isn’t always better. Wall Street’s home-mortgage machine of the mid-2000s valued speed over accuracy, with disastrous results, though most crowdfunding sites cater to investors and not homebuyers. Also, clicking for capital can be exploited by fraudsters who may not be who they say they are, according to Sara Hanks, co-founder and CEO of CrowdCheck, which provides due-diligence services for online investors.
“We’ve seen some things where the entity that’s supposed to own the property doesn’t actually own it,’’ she said.
Jeff Bullian, a Boston-based consultant, has invested in about 30 deals on RealtyShares and in a handful of others on websites such as Patch of Land. So far, only one deal has gone bad, he said. In that instance, the platform, which Bullian declined to identify, went to bat for investors so everyone could get their money back along with a small return.
Bullian said he contributes an average of $10,000 in each deal for returns of about 10 percent to 20 percent, similar to what he was getting from a marketplace lender.
“I really like the risk profile of real estate deals compared with some other investments because they’re secured,” Bullian said. “If something goes bad, you have the asset to fall back on.”
Sifakis, the Florida flipper, said he typically gets a $3 million line of credit from an investment firm for about every $1 million he raises on RealtyShares, giving him added buying power.
“It’s the greatest thing in the world,’’ Sifakis said. “The amount of money you can raise isn’t limited by anything but their investor base. And the investor base is growing and growing.”
The Fed has fostered this idiocy by manipulating everything and memories are short in housing markets. This will not end well…speed and property loans may not mix — remember 2008?
The oil boom caused a housing shortage in North Dakota’s Bakken oilfield. And towns rushed to build more homes and apartments. Now the price of oil is low, and the thousands who rushed to North Dakota for work are leaving. But new houses are still going up. Inside Energy’s Emily Guerin asks: Are these towns overbuilding?
Profile of a stretch of North Dakota highway witnesses oil’s boom and bust
Even before the latest Chinese home price data was released overnight, it was a pure bubble-buying frenzy.
As Chris Watling, the CEO of Longview Economics, told CNBC Thursday, “I think what’s going on in China is troubling … some of the valuations there are really quite extraordinary… We’ve double checked these numbers about seven times, because I found them quite hard to believe.“
What Watling found is that housing in major cities in China has seen price hikes over the last year that resemble the famous Dutch “Tulip Fever” bubble of 1637, according to new research by economic consultancy firm Longview Economics: the firm found that only San Jose in the Silicon Valley is more expensive than Shenzhen. The Chinese city has seen prices rise 76% since the start of 2015, with the acceleration beginning in April 2015 as the country’s stock market was nearing its peak. The situation in Beijing and Shanghai is similar, albeit less extreme, the company states.
According to Watling, the typical home in Shenzhen costs approximately $800,000. Watling said that the house-income ratio in Shenzhen is now running at 70 times, compared to around 16 times in somewhere like London.
“Housing in some of the tier 1 cities is more expensive than it is in London, which I think itself is on a bubble, Watling added. “The (stock) market exploded to the upside and then crashed dramatically. That money had to go somewhere, so it washed around the system … so a lot of it has gone into housing.”
China, the biggest economic story of the last 30 years, has soured in the eyes of many analysts. A stock market crash that began in the country last summer has highlighted the vast difficulties Chinese lawmakers are now facing. Watling said Chinese housing was a story built on credit, lots of liquidity and lots of debt. He added that all bubbles, though, once established, will eventually burst and deflate.
It will, but not yet.
According to the latest Chinese housing data released overnight, Chinese home prices rose the most in more than six years last month, suggesting local government efforts to avert a housing bubble are having only a limited effect according to Bloomberg. Average new-home prices in the 70 cities rose 1.2% in August from July, the biggest increase since Bloomberg started tracking records in January 2010. The value of home sales jumped 33 percent last month from a year earlier, the fastest pace in four months.
“Price growth accelerated in cities all of tiers,” the statistics bureau said in a statement released with the data. Almost half of the cities where prices increased had larger gains than in July, it added.
New-home prices, excluding government-subsidized housing, in August gained in 64 of the 70 cities the government tracks, compared with 51 in July, the National Bureau of Statistics said Monday. Prices fell in four cities, compared with 16 a month earlier, and were unchanged in two.
As Bloomberg notes, the jump in home prices comes in spite of lending curbs which have spread from major cities such as Shanghai and Shenzhen to regional hubs. That may may lead to further restrictions as policymakers become increasingly concerned about averting an asset bubble, said Xia Dan, a Shanghai-based analyst at Bank of Communications Co.
More importantly, Standard Chartered head of Greater China economic research Ding Shuang the latest surge in Chinese property prices in August suggests further broad-base easing by the PBOC is unlikely this year. He added that the home prices divergence continues with tier 1 and tier 2 cities overheating, whereas smaller cities are struggling to reduce inventory. As a result, Shuang expects PBOC to keep monetary policy prudent; and sees no further interest rate cut for the rest of the year. He also believes the Chinese government will introduce more curbs in major cities, such as a higher down-payment as mortgage loans are growing quickly
Hangzhou, Zhejiang’s provincial capital, on Sunday halted home sales to some non-local residents, adding to similar restrictions introduced last month in Suzhou and Xiamen. China’s top leaders, after a Politburo meeting led by President Xi Jinping, in July pledged to curb asset bubbles amid a renewed focus on financial stability.
However, for most Tier 1 cities, the curvs are having zero impact: prices climbed a record 4.4 percent and 3.6 percent in Shanghai and Beijing respectively, taking the year-on-year gains to 31 percent and 24 percent. Values rose 2.1 percent in Shenzhen and 2.4 percent in Guangzhou, both faster than a month earlier. Home prices climbed the fastest in regional hubs where local authorities haven’t introduced curbs. Zhengzhou, the provincial capital of central Henan province, led gains with a 5.5 percent increase, up from a 2 percent gain in July. Prices in Wuxi, a manufacturing base in southern Jiangsu province, followed with a 4.9 percent gain, compared with 2.7 percent a month earlier.
Some more details from Goldman:
Housing prices in the primary market increased 1.6% month-over-month after seasonal adjustment (weighted by population) in August, higher than the growth rate in July. Almost all cities saw price increases in August from July: Out of 70 cities monitored by China’s National Bureau of Statistics (NBS), 66 saw housing prices increase in August from the previous month (58 in July, on a seasonally-adjusted basis).
On a year-over-year, population-weighted basis, housing prices in the 70 cities were up 9.7% (vs. 8.3% yoy in July).
House price inflation accelerated across all tiers in August. In tier-1 cities, August price growth showed a spike to 3.5% month-over-month after seasonal adjustment, the largest price increase since the series started in Jan 2011. (Total property sales in tier-1 cities accounted for around 5% of nationwide property sales in volume terms.) August housing price growth was also at record high levels in tier-2 and 3 cities, with prices increasing at 1.8% mom sa and 1.1% mom sa respectively. The fast extension of mortgages likely contributed to the housing price rally – in August mortgage loans continued to be strong: medium- to long-term new loans to the household sector were Rmb 529bn, vs. Rmb 477bn in July. (see China: August money and credit data above expectations, reflecting supportive policy, Sep 14, 2016) In response to the fast growth of housing prices, many cities (such as Hangzhou, Suzhou, Xiamen, Zhengzhou) have announced tightening policies to curb the rapid price growth.
Finally, the main reason why tightening measures by local governments are unlikely to rein in prices is that credit remains easily attainable, said Jeffrey Gao, a Hong Kong-based property analyst at Nomura Holdings Inc. “The local curbs have limited impact as home inventory has already fallen to a low level,” Gao said. “Prices will not fall unless the government moves to tighten credit and add more land supply.”
Chinese authorities are facing a monetary policy dilemma amid “rapid” home-price growth, Zhou Hao, an economist at Commerzbank AG in Singapore, wrote in a note Monday. “The overall monetary policy should remain accommodative as inflation remains subdued and growth is still trending down. However, concern about an asset bubble will limit room for further easing.”
And, as we showed two weeks ago, the Chinese housing situation is likely to get even more bubbly in the coming weeks as mortgage loans as a % of total loans, the primary culprit behind the ongoing price surge, continues to rise to all time highs.
Social media mogul Mark Zuckerberg’s life seems to always revolve around houses in Palo Alto.
A house in Palo Alto is where he grew Facebook from a seed harvested at Harvard into one of the defining companies of 21st century Silicon Valley. A house in Palo Alto is where Zuckerberg and his family presently call home. And four houses in Palo Alto adjacent to his own are now a perhaps rare check on the authority of the sixth richest man in the world.
The contentious parcels. City of Palo Alto
In 2013, Zuckerberg bought the houses bordering his property, eventually revealing plans to demolish them. He was worried about his privacy. (You can all insert your own ironic “Facebook data mining privacy” joke here.)
Unfortunately, the city isn’t proving keen on his idea. We can’t imagine why they’d be a tiny bit sensitive about sacrificing perfectly good housing stock for the sake of its wealthiest resident’s desire not to live next to anyone.
To be fair, Zuckerberg also planned to build new homes on the four parcels—smaller ones that wouldn’t be able to peer into his own house. But Palo Alto’s Architectural Review Board didn’t like the looks of his proposed new homes and bounced the plan at Thursday’s meeting.
The board is an advisory committee, and Palo Alto’s director of planning Hillary Gitelman can override their decision and approve the proposals if she wants to. But architects who work in Palo Alto tell Curbed SF that this rarely happens. Railroading unpopular projects through wouldn’t be smart politics, after all.
Zuckerberg will probably have to come up with some new designs, resign himself to keeping the houses the way they are, or just start spending most of his time crashing in one of those sleep pods at the office.
Palo Alto Mayor Wants to ‘Meter’ ‘Reckless Job Growth’
Palo Alto mayor Patrick Burt says: “Palo Alto’s greatest problem right now is the Bay Area’s massive job growth.” And he wants to “meter” businesses to control “reckless job growth” in the Silicon Valley suburb.
Palo Alto has long been the center of Silicon Valley’s tech start-ups, and features 14 of theworld’s top 25 venture capital firms within a 10-mile radius. But in an interview with the real estate blog Curbed.com, Mayor Burt talked about how “Our community will not accept deterioration in our mobility.”
As a tech CEO that sold out for big bucks, Burt seems to want to keep out the riff-raff:
“First, we’re in a region that’s had extremely high job growth at a rate that is just not sustainable if we’re going to keep [Palo Alto] similar to what it’s been historically. Of course we know that the community is going to evolve. But we don’t want it to be a radical departure. We don’t want to turn into Manhattan.”
Burt claims it is the role of local government to avoid “reckless job growth”:
“We want metered job growth and metered housing growth, in places where it will have the least impact on things like our transit infrastructure. We look at the rates and we balance things.”
To “meter” housing growth, 97 percent of the non-commercial portion of Palo Alto is zoned R1 single family residence, while only 3 percent is zoned for multi-family apartments. The least expensive “starter home” in Palo Alto is listed at $995,000.
But according to the Planning Department, 45 percent of Palo Alto workers live in multi-unit housing, which means almost half of Palo Alto workers must commute in every day.
Mark Zuckerberg is believed to be the wealthiest resident of Palo Alto. He is a well known liberal, and made his fortune as the CEO of Facebook. The company data-mines the deepest secrets of 1.7 billion users, then sells those secrets to the highest bidder. Zuckerberg contributes heavily to liberal causes, advocates for unlimited immigration, and says he hates the wall Republican presidential nominee Donald Trump wants to build along the U.S./Mexican border.
But after Mr. Zuckerberg bought the three houses bordering surrounding his own Palo Alto home, he recently built an 8-foot high privacy wall around the compound for himself, his wife and young daughter.
Zuckerberg quietly submitted architectural drawings to the Palo Alto Planning Department this summer that were expected to be favored for approval, because the plan reduced density by demolishing four houses to build a mansion and three casitas.
However, they were rejected amidst a local controversy over gentrification that erupted when Palo Alto Planning and Transportation Commissioner Kate Vershov Downing announced in early September that her family is leaving Palo Alto for Santa Cruz, because they, like many other residents, can no longer afford the area.
Downing’s resignation letter bemoaned that despite splitting a house with another couple, her rent is still $6200 a month. She estimates that to buy the house and share it with children would cost $2.7 million. The monthly cost of a home mortgage, tax and insurance payment would be $12,177, or $146,127 per year. Downing laments that sum is too much for her as an attorney and her husband as a software engineer.
Downing’s resignation put unwelcome pressure on the Palo Alto’s Architectural Review Board to start being more family friendly. On September 15, the Board rejected Mr. Zuckerberg’s plans because they would seriously undermine the city’s housing stock.
The Architectural Board is only an advisory committee, and Palo Alto’s Director of Planning Hillary Gitelman can override their decision and approve the proposals. But local architects familiar with Palo Alto told the Curbed.com this rarely happens, because “railroading unpopular projects through wouldn’t be smart politics.”
It is unclear how widespread Mayor Burt’s feelings are, but there is at least some backlash.
In the history of data from The Fed, this has never happened before…
Aggregate Auto Loan volume actually fell last week… And less loans means one simple thing… less sales (because prices have never been higher and no one is paying cash)…
Which is a major problem since motor vehicle production continues to rise as management is blindly belieiving the Hillbama narrative that everything is (and will be) awesome.
The problem is… inventories are already at near record highs relative to sales (which are anything but plateauing)…
In fact, the last time inventories were this high relative to sales, GM went bankrupt and was bailed out by Obama.
The big picture here is simple… US Automakers face a plunge in auto loans for the first time in this ‘recovery’, and with sales plunging and inventories near record highs, production (i.e. labor) will have to take a hit… and that plays right into Trump’s wheelhouse and crushes Hillbama’s narrative just weeks before the election.
Thousands of Americans are flocking to “Big Sky” country, and this movement has become so prominent that it has even caught the attention of the mainstream media. Within the last several weeks, both The Chicago Tribune and The Economist have done major articles on this phenomenon. From all over the country, conservatives, preppers and Bible-believing Christians are moving to Montana, Wyoming, Idaho and the eastern portions of Oregon and Washington. As you will see below, this region has become known as the “American Redoubt”, and for a variety of reasons it is considered by many survivalists to be one of the top “safe zones” for when things really start falling apart in this nation.
Many of you that are reading this article may think that it is quite strange that families are quitting their jobs, packing up everything they own and moving to the middle of nowhere, but for those that are doing it this actually make perfect sense. A recent Chicago Tribune article on this phenomenon began by profiling an ex-California couple that decided to flee the state for the friendly confines of north Idaho…
Don and Jonna Bradway recently cashed out of the stock market and invested in gold and silver. They have stockpiled food and ammunition in the event of a total economic collapse or some other calamity commonly known around here as “The End of the World As We Know It” or “SHTF” – the day something hits the fan.
The Bradways fled California, a state they said is run by “leftists and non-Constitutionalists and anti-freedom people,” and settled on several wooded acres of north Idaho five years ago. They live among like-minded conservative neighbors, host Monday night Bible study around their fire pit, hike in the mountains and fish from their boat. They melt lead to make their own bullets for sport shooting and hunting – or to defend themselves against marauders in a world-ending cataclysm.
The original article that the Chicago Tribune picked up came from the Washington Post. It was authored by Kevin Sullivan and photos were done by Matt McClain. If you would like to read the entire article you can find it right here.
And of course the Bradways are far from alone. Over the past 10 years, approximately five million people have fled the state of California. If I was living there, I would want to move out too. Once upon a time, countless numbers of young people were “California Dreaming”, but those days are long gone. At this point, the California Dream has become a California Nightmare.
Only a very small percentage of those leaving California have come up to the Great Northwest, but it is a sizable enough number to make a huge impact. Unfortunately, many of those that have come from California want to turn their new areas into another version of what they just left, and that is often firmly resisted by the locals.
But it isn’t just California – there are people streaming into the “American Redoubt” from all over the nation, and many of them are some of the finest people that you could ever hope to meet.
An article in The Economist points to a 2011 manifesto posted by James Wesley Rawles as the beginning of the “American Redoubt” movement…
In a widely read manifesto posted in 2011 on his survivalblog.com, Mr Rawles, a former army intelligence officer, urged libertarian-leaning Christians and Jews to move to Idaho, Montana, Wyoming and a strip of eastern Oregon and Washington states, a haven he called the “American Redoubt”.
Thousands of families have answered the call, moving to what Mr Rawles calls America’s last big frontier and most easily defendable terrain. Were hordes of thirsty, hungry, panicked Americans to stream out of cities after, say, the collapse of the national grid, few looters would reach the mostly mountainous, forested and, in winter, bitterly cold Redoubt. Big cities are too far away. But the movement is driven by more than doomsday “redoubters”, eager to homestead on land with lots of water, fish, and big game nearby. The idea is also to bring in enough strongly conservative voters to keep out the regulatory creep smothering liberty in places like California, a state many redoubters disdainfully refer to as “the C-word”.
Who wouldn’t want to live where the air is clear, the water is clean and the sky is actually brilliantly blue and not the washed out grayish blue that you get in most major cities?
And just having some breathing space is reason enough for some people to move to the Great Northwest. If you can get at least a few acres, you will quickly discover the joy of not having neighbors crammed in around you on every side.
Others wish to move to an area with a low population density for more practical reasons. As the New York Times recently reported, crime is rising in large cities all over America…
Murder rates rose significantly in 25 of the nation’s 100 largest cities last year, according to an analysis by The New York Times of new data compiled from individual police departments.
The findings confirm a trend that was tracked recently in a study published by the National Institute of Justice. “The homicide increase in the nation’s large cities was real and nearly unprecedented,” wrote the study’s author, Richard Rosenfeld, a criminology professor at the University of Missouri-St. Louis who explored homicide data in 56 large American cities.
Sadly, this is just the beginning. The chaos that we have seen in Dallas, Baton Rouge, Milwaukee, Ferguson, Baltimore, Chicago and elsewhere is going to get much worse. As the economy continues to unravel, we are going to see civil unrest on a scale that none of us have ever seen before. When that time comes, those that have moved to the middle of nowhere will be very thankful that they got out while the getting was good.
Over the last several years, my wife and I have met countless numbers of people that have moved up to the Great Northwest. All of their stories are different, but there is one common theme that we have noticed.
In the vast majority of cases, families tell us that they moved to the Great Northwest because they felt that God was calling them to do so. Individuals from many different churches and denominations have all felt the same call, and that creates a sort of kinship that is quite unusual these days.
Something big is happening in the Great Northwest. If you have never been up here, you might want to check it out some time.
Recognizing both the fact that “all politics are local”, and the international readership of SurvivalBlog, I naturally de-emphasize politics in my blog. However, an article got my blood boiling: Motorists illegally detained at Florida tolls – for using large bills! So, not only are Federal Reserve Notes not redeemable “on demand” for specie, but effectively they are now no longer “…legal tender for all debts public and private.” It is often hard to pinpoint a breaking point–the proverbial “straw that broke the camel’s back”–as impetus for a paradigm shift, but reading that news article was that last straw for me. Consider my paradigm fully shifted. I’m now urging that folks Get Out of Dodge for political reasons–not just for the family preparedness issues that I’ve previously documented. There comes a time, after a chain of abuses when good men must take action. We’ve reached that point, folks!
In March 2011, Ol’ Remus of The Woodpile Report quoted an essay by economist Giordano Bruno, titled The Return Of Precious Metals And Sound Money. In it, Bruno stated: “If there is anything good to come out of our present predicament, it is that Americans, from average citizens to elected officials, are beginning to understand the reality of coming collapse and are preempting it with measures designed to insulate their communities from the inevitable firestorm. Eventually, as this movement escalates, certain states will come out ahead of the pack, gaining a kind of “safe haven” status, and attracting liberty minded people from around the country to the protective shelter of their borders.”
Sociologist Albert O. Hirschman in his book Exit, Voice, and Loyalty, identifies the growing libertarian trend of “Exit” strategies, all the way from the individual level up to the level of nation states.
Giordano Bruno identified a trend that has been developing informally for many years: A conscious retrenchment into safe haven states. I strongly recommend this amalgamation, and that it be formalized. I suggest calling it The American Redoubt. I further recommend Idaho, Montana, Wyoming, eastern Oregon, and eastern Washington for the réduit. Some might call it a conglomeration, but I like to call it an amalgamation, since that evokes silver. And it will be a Biblically-sound and Constitutionally-sound silver local currency that will give it unity.
(For re-use of this image, see the copyright notice, below.)
I anticipate that this nascent movement, and the gulch itself will be a lot bigger than most other pundits anticipate. It could very well be a multi-state amalgamation like The American Redoubt, that I’ve advocated.
Why Not Some Adjoining States?
I’m sure that I’ll get e-mail from folks, suggesting expanding the Redoubt concept to include Utah, the Dakotas, and Colorado. Let me preemptively state the following: Utah is a conservative state, but its desert climate makes it unsuitable to feed its current population, much less one swelled by in-migration. North and South Dakota have some promise, but I have my doubts about how defendable they would be if ever came down to fight. Plains and steppes are tanker country. It is no coincidence that the armies of the world usually choose plains for their maneuver areas, for large scale war games. Some might argue that I shouldn’t have included eastern Oregon and eastern Washington. The population densities are suitably low, and the populace is overwhelmingly conservative, but the folks there are still at mercy of the more populous regions west of the Cascades, that dictate their state politics. But who is to say that their eastern counties won’t someday partition to form new states, like West Virginia? This same factor is just as pronounced in rural Colorado. Just a few large cities call the political shots, and they have been assimilated by ex-Californians. For this reason I reluctantly took Colorado off the list.
I’m sure that this brief essay will generate plenty of hate mail, and people will brand me as a religious separatist. So be it. I am a separatist, but on religious lines, not racial ones. I have made it abundantly clear throughout the course of my writings that I am an anti-racist. Christians of all races are welcome to be my neighbors. I also welcome Orthodox Jews and Messianic Jews, because we share the same moral framework. In calamitous times, with a few exceptions, it will only be the God fearing that will continue to be law abiding. Choose your locale wisely. I can also forthrightly state that I have more in common with Orthodox Jews and Messianic Jews than I do with atheist Libertarians. I’m a white guy, but I have much more in common with black Baptists or Chinese Lutherans than I do with white Buddhists or white New Age crystal channelers.
I also expect that my use of the term Redoubt will inspire someone to accuse me of some sort of neo-Nazism. Sorry, but I use the term in honor of Switzerland. When I chose the name I was thinking of the Schweizer Alpenfestung (aka Réduit Suisse), rather than any reference to the Nazi’s “National Redoubt” scheme at the end of World War II. I am strongly anti-totalitarian, and that includes all of its forms, including Nazism and Communism.
I’m inviting people with the same outlook to move to the Redoubt States, to effect a demographic solidification. We’re already a majority here. I’d just like to see an even stronger majority.
One important point: I do not, nor have I ever advocated asking anyone already living here to leave, nor would I deny anyone’s right to move here, regardless of their faith, (or lack thereof).
Closing ranks with people of the same faith has been done for centuries. It is often called cloistering. While imperfect, cloistering got some Catholics in Ireland through the Dark Ages with their skins intact and some precious manuscripts intact. (It is noteworthy that other copies of the same manuscripts were burned, elsewhere in Europe.) Designating some States as a Redoubt is nothing more than a logical defensive reaction to an approaching threat.
Are You With Us?
Read my Precepts page. If you aren’t in agreement with most of those precepts, then I don’t recommend that you relocate to the Redoubt–you probably won’t fit in.
Your Checklist
I suggest that you follow these guidelines, as you prepare and then move to the American Redoubt:
Research geography, climate, and micro-climates very carefully.
Develop a home-based business.
Lighten the load. Keep the practical items but sell your junk and impractical items at a garage sale.
Bring your guns.
Sell your television.
Sell your jewelry and fancy wristwatch. Buy a Stihl chainsaw instead.
Choose your church home wisely, seeking sound doctrine, not “programs”
Leave your Big City expectations behind. There probably won’t be cell phone coverage, high speed Internet, or Pilates.
Expect a long driving distances for work and shopping.
Sell your bric-a-brac and collectibles. What is more important? A large collection of Hummel figurines, or having a lot of good hand tools and Mason jars?
Switch to a practical wardrobe and “sensible shoes”.
After your buy your land, convert the rest of your Dollar-denominated wealth into practical tangibles.
Begin homeschooling your children.
Sell your sports car and buy a reliable crew cab pickup.
Encourage your kids to XBox and Wii less and read more.
Make a clean break by selling your house and any rental properties. You aren’t coming back.
If you buy an existing house, get one with an extra bedroom or two. Some relatives may be joining you, unexpectedly.
Donate any older bulky furniture to the local charity store before you move.
After you move:
Don’t try to change things to be like the suburb that you left behind. You are escaping all that!
Pitch in by joining the local Volunteer Fire Department (VFD), Ski Patrol, Sheriff’s Posse, or EMT team.
Be a good neighbor.
Patronize the local farmer’s market and craft shows.
Respect the property rights and the traditions of your neighbors.
Be active, politically, but use a pseudonym in letters to the editor an internet posts.
Use VPN tunneling, RSA encryption, firewalls, and anonymous remailers.
Support local businesses, and companies that are headquartered inside the Redoubt, not Wal-Mart.
Encourage like-minded family and friends to join you.
Stock up heavily on storage foods for lengthy power failures, or worse.
Do your banking locally, preferably with a credit union and/or a farm credit union.
Be active in local home school co-ops and service organizations.
Find and visit your local second-hand stores. Watch for useful, practical items that don’t need electricity.
Conduct as much business as possible via barter or with precious metals.
Gradually acquire a home library that includes self-sufficiency books and classic books–history, biographies, and novels.
Join the local ham radio club. (Affiliated with the ARRL.)
Expect to be the subject of gossip. Live a righteous life so there won’t be much to gossip about.
Loyally support your local church with tithes and support your local food bank.
Get used to eating venison, elk, moose, antelope, trout, and salmon.
Attend some farm auctions in your region to gather a good collection of useful hand tools and a treadle sewing machine.
Attend gun shows in your state. (This keeps money circulating in the state and keeps you legal, for private gun purchases.)
Choose your fights wisely. Don’t tilt at windmills, but when you feel convicted, don’t back down.
I am hopeful that it is in God’s providential will to extend his covenantal blessings to the American Redoubt. And even if God has withdrawn his blessings from our nation as a whole, he will continue to provide for and to protect His remnant. Pray and meditate on Psalm 91, daily!
Addenda (April, 2011): 33 Ways to Encourage Atlas to Shrug
Ayn Rand’s 1957 novel “Atlas Shrugged” is enjoying renewed popularity following the release of the new Atlas Shrugged movie. Rand’s story describes a group of American industrialists that lose patience with onerous regulation and taxation, and “shrug”–disappearing from their normal lives to relocate to a hidden valley called Galt’s Gulch. While this tale is fictional, it has some strong parallels to modern-day America. And despite the fact that Ayn Rand was an atheist and favored legalized abortion, she was a good judge of both character and the inevitable tendencies of elected governments. When I consider the regulatory and tax burdens that have been implemented in my lifetime–I was born in 1960–I believe that Rand had amazing prescience. Let’s face it: We no longer live in a free market capitalist nation. At best, it could called a “mixed” economy with statist tendencies, and verging on socialism.
Reading the news headlines in recent months has led me to believe that the Galt’s Gulch concept has a lot of merit. If The Powers That Be wanted to encourage the Atlases of the world to shrug, they couldn’t have done a better job. What is the best way to get the most productive Citizens of our nation to go on strike, and retreat to “gulches”? Consider the following “to do” list for those whom Ayn Rand called “The Destroyers”:
Increase the cost of doing business through mandatory insurance. (The “labor burden” for an employee with a nominal salary of $17 per hour ($35,360 gross, annually) is an additional $20,029 per year.) Workman’s compensation, in particular, is getting painfully expensive.
Institute dozens of unfunded mandates from the Federal level, that must be compensated for with higher state, county, and local taxes.
Increase license, permit, and vehicle registration fees. In progress. Meanwhile, institute “temporary” tax increases. These surtaxes on income, sales, or real property are described as “temporary.” (But don’t be surprised if they are not repealed.)
Because many states define “small business” as a company with less than 50 employees, some business owners have frozen their employee headcount at 49, to avoid onerous costs.
There is a Walter Mitty-esque interest in living on “Seasteads” outside of any national boundaries. Although it probably impractical at present, the concept is nonetheless captivating.
Glenn Beck recently mentioned an article about restaurateur Jerry Della Femina selling his business and parking the proceeds in gold and silver. He was quoted as saying: “I’m just not ready to have my wealth redistributed. I’m not ready to pay more tax money than the next guy because I provide jobs and because I work a 60-hour week and I earn more than $250,000 a year.”
Many folks are now ready to vote with their feet. Atlas is starting to shrug.
Addenda (May, 2011, with several updates in 2012 and 2013):
Finding a Prepper-Friendly Church
Many readers of SurvivalBlog are Christians. For us, the search for a desirable “vote with your feet” relocation locale includes a very important criteria: finding a good church home. I am of the opinion that finding a good church home is our Christian duty, and that it honors God. It is also an important factor in finding acceptance in a new community. By joining a church congregation that shares your world view, you can very quickly become part of a community, rather than being perceived as just “that new guy”. In many locales, this shortens the time required for a high level of acceptance and inclusion as a part of “the we”, by years.
In my experience in the western United States, Reformed churches tend to have a very high percentage of families that are both preppers and home schoolers.
When I put forth my American Redoubt plan, a key aspect was that it would be primarily geared toward fellow Christians, Messianic Jews, and conservative Jews.
Here is a list of my own criteria, for you to consider, perhaps as your baseline. (Note: I come from a Reformed Baptist background, so your criteria may differ):
Reliance upon and belief in the literal truth of the 66 books of the Old and New Testament as the Inspired Word of God.
Sound doctrine, with Christ as the cornerstone, and preferably in accord with the Five Solas and the Five Points of Calvinism. (Or at least four of them.)
A strong emphasis on the Gospel of Christ.
Some interest in family preparedness. (Not a necessity, but a nice plus.)
A commitment to Christian Charity.
An “…in the World but not of the World” outlook.
Biblical evangelism–the pastor, elders, and congregation all take The Great Commission literally. (Avoid churches with any racism or anti-Semitism.)
Expository preaching. (Systematic exposition of scripture.)
An emphasis on teaching and memorizing God’s word with exhortation rather than “programs”.
A congregation where a substantial portion of the body home schools their children. (Not a necessity, but a nice plus.)
Congregants with a conservative outlook, modest dress, humble attitudes, and avoidance of worldly trappings.
An edifying church that gives glory to God.
Reformed Churches in The American Redoubt States:
My initial list has about 25 Reformed churches that I’ve either attended or that have been recommended to me.
Note: The pastors of these churches will undoubtedly soon hear about the mention of their churches. I’d appreciate them sending me an e-mail mentioning whether or not they agree with the Redoubt concept, and with their recommendations for similar churches inside the five Redoubt States. Thanks!
Idaho
Columbia Bible Church, Meridian (An anonymous congregant wrote: “Columbia Bible Church is definitely Reformed Baptist in outlook, strong on families, home-schooling, and business minded, as well as many who are preparing. The church’s emphasis is the spread of the Gospel, by word and actions, so any “prep” outlook is based upon developing a comprehensive Christian worldview. Some of us help in that direction.”)
Orthodox Jewish Synagogues and Congregations in The American Redoubt States:
Try to find a truly conservative congregation. The word “conservative” (shamrani) has different meanings to different Jewish people! (Political conservatism is not always synonymous with religious conservatism and a traditional moral code.)
SurvivalBlog reader Yorrie in Pennsyvania mentioned in a recent e-mail that conservative Jewish preppers should seek out congregations that are: “…Torah knowledgeable and observant = Orthodox religiously or similar. Which usually overlaps with conservative politically. The more traditional end of the Conservative Jewish movement did not accept the liberal swing [that began in the 1950s] and is called Traditional, Conservadox (Halfway between Conservative and Orthodox), or sometimes Masorti (Hebrew for Traditional). There are Orthodox and Traditional Jews in Flathead County, Montana, and more formal congregations of the Chabad movement (a Torah Judaism movement with roots over 300 or more appropriately over 3,000 years).
Chabad congregations in the Redoubt area are in Bozeman, Montana [The Shul of Bozeman], Jackson, Wyoming, [Chabad-Lubavitch] and elsewhere in most major cities around the world.”
Messianic Jewish Congregations in The American Redoubt States:
Many of these congregations tend to be small “home churches”. Make inquiries, locally.
Here is just one example of what you will find, in eastern Washington:
I’m sure that the foregoing will inspire a lot of correspondence. I don’t have plans to create a nationwide directory of prepper-friendly churches and congregations. (That would go beyond the scope of my project.) But I would appreciate your feedback on any of the churches and congregations listed.
I would also appreciate recommendations on specific Jewish and Messianic Jewish congregations inside of the Redoubt region.
Because of the prevailing winds, the anticipated volcanic ash fall is actually more of threat to eastern Montana, eastern Wyoming, the Dakotas and the Plains states than it its to anywhere west of Yellowstone. If you consider it a threat in the next few generations, then simply buy property that is at least 100 miles UPWIND of Yellowstone. If there ever is an eruption, anyone in northern Idaho or Northwestern Montana will only get ash fall that first circles the globe. It it will be people the Plains states that would get buried by several feet of ash.
As a bonus, locating UPWIND of Yellowstone will also put you upwind of Montana’s missile fields. It is noteworthy that Malmstrom AFB (which BTW is a locale in the second sequel to my novel “Patriots“) has dozens of strategic nuclear targets. If we are ever engaged in “nuclear combat toe to toe with the Rooskies”, each silo could be targeted for a nuclear ground burst. (It is ground bursts rather than air bursts that create significant fallout.) Again, I wouldn’t want to live downwind.
And as a further bonus, the climate is also much more livable west of the Great Divide. East of the Great Divide, the winters can be bitterly cold, but west of the Great Divide it is more mild.
About the Author: James Wesley, Rawles is a former U.S. Army Intelligence officer and a noted author and lecturer on survival and preparedness topics. He is the author of the best-selling nonfiction book “How to Survive the End of the World as We Know It” and the novel “Patriots: A Novel of Survival in the Coming Collapse” He is also the editor of SurvivalBlog.com–the popular daily web journal for prepared individuals living in uncertain times.
Copyright 2011-2014. All Rights Reserved by James Wesley, Rawles – http://www.SurvivalBlog.com™Permission to reprint, repost or forward this article in full is granted, but only if it is not edited or excerpted.
Note: The map image on this web page is my own creation and I personally hold the copyright. This image with resolution no greater than 36 DPI and a width no greater than 250 pixels is licensed under the Creative Commons Attribution-ShareAlike 3.0 License, with intended use on Wikipedia and similar reference web sites, for use in newspaper and magazine articles, in book reviews, and in book catalogs. The rights to any larger or higher resolution image is reserved and are granted only upon request.
Consumers and lenders are upset with the current residential appraisal situation. This came from Southern California. “Why isn’t anyone publicizing the appraisal gouging going on in select markets? Due to a lack of appraisers since the financial reform acts (must be college educated and possess certificates) there is a ‘rush’ fee on top of an inflated appraisal fee for purchases topping $2,000. All of this is costing the borrower in fees and in rates since some appraisals are taking 6 weeks thus requiring a longer rate lock period and higher rate. It seems like the financial and consumer protections are working in reverse order for the borrower. And speaking of appraisers, they are all older folks as the younger generation does not want to pursue a career in a dying industry (full automation).”
And this from one of the Rocky Mountain states. “Just this month, I have more than 4-week turnaround times quoted by most appraisers through the AMCs and appraisals as high as $2,620 for a non-rural basic FHA appraisal. Taking years to fix the problem is not good: we have major problems now. My first time homebuyers can barely afford the $500 appraisals let alone the $2,620 appraisals (most don’t even have credit cards with a limit that high). I even had an appraiser tell me (and it’s someone I know to be an honest hardworking appraiser) that if he can do 3 appraisals a week for $1000 each or 6 appraisals a week for $500 each, which do you think he will pick? Somebody asked me the other day if we did ‘cost plus’ for the AMC appraisals. We can’t do that as appraisals are one of the items we can’t redisclose if it comes in higher unless we can prove we didn’t know something about the property and that is extremely hard to prove. Something must be done.”
From Kentucky Dora Ann Griffin contributed, “The answer is with Collateral Underwriters (CU) – there is no reason we cannot go back to allowing brokers and lenders order appraisals from professional quality appraisers. It would allow small appraisal businesses to thrive and compete. The end result would be a much better pricing and quality. The question is how do we make that happen? I know it would be moving a mountain but is there a way associations, brokers, etc. can affect a movement back to common sense.
“I just closed a loan where the property failed CU. A desk review was done. Then a field review. The whole appraisal process spanned six weeks due to appraisers taking 4 days to accept and missing the delivery by four days. I was told repeatedly the AMC could not push because the appraiser would then not do it at all. That appraiser would be still on the roster if that happened! Meanwhile my buyer is living in a motel for weeks with two dogs, three kids and her husband spending thousands of dollars to get by.
“In the end the original appraiser had the wrong property ID and even had an address wrong on a comp along with nine other serious or minor corrections. As a consumer that appraisal was faulty but there is no remedy. I suffer the loss of repeat business and referrals for something totally out of my control.
“I dream of the day I can engage a qualified appraiser directly. If that does not happen we are looking at even higher costs and increasingly inferior quality. All the good appraisers in my market work directly with banks. I get the worst of the worst thru AMCs as a broker – an unfair playing field.”
From Washington Theresa Springer mailed, “In the PDX MSA (including Clark County, WA) it is a travesty with an average 4-6 week turn time with high rush fees to get us to this insane return point. Appraisers are cherry picking jobs based on amount given to receive appraisal back at a somewhat ‘normal’ time frame of 3+ weeks and where it is located, i.e. in town vs. ‘rural’ as in Camas and Ridgefield, like those two are rural (not). I spoke with an appraiser buddy of mine a week ago and he said, ‘I just scroll through my email in the AM to see what is being offered and I take the best fee and locale and go from there.’ He said he is getting offered $1,500- $2,000 to do an in-town appraisal with a 3 week turn time. Appraisers are now quoting mid-October to early November for an appraisal that is being ordered this week. We have a lack of appraisers, and here’s a video about why they’re taking so long. They are over loaded and it is the fault of the feds as they have made the bar to entry for an appraiser so high.
“This is getting so ridiculous and is causing a large uptick in costs to the borrowers and the sellers are so angry as they cannot close in any timely manner. Most agents now are writing PSA’s for 8 weeks or 6 weeks knowing that they will need an extension(s). VA loans are upwards of 8+ weeks in town and the VA seems to be doing very little to fix this issue on their end. Just closed a Brigadier General’s VA loan and he called the VA raised a riot and he was able to get his appraisal turned in 3 business days after an 8-week acceptance time lag. But it is taking the borrowers to call the VA to get anything done. The VA is only assigning out appraisals on Monday’s now and is no longer letting you know where you are in line. This is also hurting the Veterans as many sellers will no longer accept VA loans on their homes, which is their right.
“Due to the rules in place where a new appraiser needs a 4-year degree (this was the MOST insipid part of the appraisal license change, then comes the 2 +/- year apprenticeship where the certified appraiser has to personally review EVERY home and its comps in its entirety before approving the report, like they have time) we are not getting any new folks into the business. So much for saving the consumer money as all this is doing is creating more costs for the borrower and a longer wait time for the seller to close. Many sellers are only entertaining cash offers if they have this option due to these issues.”
Mike VanDerWeerd sent, “As a former (still licensed) appraiser, this appraisal discussion is quite interesting. In a nutshell, they took the business out of the profession and made appraisers lapdogs to AMCs. There is no incentive to perform quality work on a client basis. All you get is spoon fed assignments with no way of growing the business. My opinion is once the GSEs figure out an automated valuation method with a home inspection, appraisers will be VCR repairmen!”
And Bill King opined, “I would proffer that a good appraiser cannot do 2 to 3 appraisals per day and do them well. Unfortunately, that very expectation does more to drive down appraisal quality than almost all other things combined. Unless one has two or three of the same floor plan, in the same plat (rare) on the same day a good, competent appraisal isn’t going to happen with just 3 to 4 hours’ work. Without the ‘assembly line’ operation 2 or 3 appraisals per day is just not possible. The elephant in the living room is appraisal process itself. The single point value and single approach appraisal is fundamentally flawed and antiquated. Small data valuations in a big data world is silly.”
From Florida came, “As we all know, according to TRID, a consumer must receive Loan Estimate disclosures within 3 days of submitting all 6 items that comprise a loan application. First, the in-house stall was holding the property address out so more information could be gathered before mandatory disclosures. That worked for a while, except that when we have a purchase contract, we automatically have an address. So that stall doesn’t work anymore though offices do try to bury the contract for a while. Now, local offices are stalling disclosures until the appraisal comes back saying that is the basis for an estimate of property value. The obvious point being ignored by this argument is that if there’s a contract, there’s an estimation of property value. Two people have decided that the property is worth the agreed price and since a copy of the MLS listing is part of the loan file, processors and underwriters can see listed and contract values. The ‘wait for appraisal’ stall is a very thin one, and continues to make consumers wait longer for decisions and closing. As I have said before, every time CFPB tweaks a regulation a new cottage industry opens up in the lending community to try and circumvent the intended benefit to the public.” Thank you to Chris Carter for this note!
Chris Nielsen forecast, “I think in 10 years (maybe less) the Certified Appraiser will be little needed. With The UCDP and EAD portals, drone technology and other new intelligent systems, the routine property appraisal by a Human Being will be unnecessary.”
But those in the appraisal business deserve to be heard.
Mike Ousley, President & CEO of Direct Valuation Solutions, sends, “Being a company that provides solutions for lenders and appraisers to work directly with one another and one that also provides AMC services (DVS-AMC) gives me a unique perspective. On the AMC side we have first-hand knowledge of appraisers purposely and actively trying to damage the AMC by accepting orders, holding them for a week or two or three, then rejecting the order saying, ‘we never accepted the order.’ Recently, we had an appraiser in a well populated area quote a 4 month turn time!!!! Really? He had 80+ orders in his queue?
“The blogs are full of Appraiser v. AMC drama, and for sure there are good and bad AMCs, just like there are good and bad appraisers and yes, it would seem that some appraisers view the AMC as their shield from the relationships with the lender so they don’t have to ‘face the music’ when due dates are missed, report quality is substandard or errors are made and the lender is left holding the AMC responsible for their ‘inability to manage the independent appraiser.’
“The real rub is that in some cases the same appraiser who intentionally damages the AMC relationship is the same one professing to want the direct relationship with the lender through our software! Having started as a professional appraiser way back in 1979 and hopefully establishing myself as a ‘professional appraiser’ over the decades since, I am entirely flummoxed by the disconnect between saying as an appraiser you are a professional, acting professional and adhering to the Uniform Standards of PROFESSIONAL Appraisal Practice (USPAP) when the purpose of USPAP is ‘to promote and maintain a high level of public trust in appraisal practice by establishing requirements for appraisers.’ I think it is safe to say ‘public’ here includes the consumer who the lender is attempting to assist in securing a home loan for purchase or refinance purposes, and yet aren’t they the ones being damaged by the unprofessional conduct of the intentional actions of appraisers trying to damage the AMC hired by the lender and almost always paid for by the borrower? All too often, it seems, the word ‘Professional’ has gotten lost and the very public (read consumer) trust lost with it.
Mike wraps up with, “I think everyone, appraisers, lenders & AMCs, need to keep in mind the public we serve and not only maintain their trust but take a big step towards consistent and professional actions. While there is most certainly an issue with the number of appraisers dwindling, the number and frequency of underwriting or lender/investor stipulations and overall volume impacting the appraisal process, keeping professional conduct by ALL parties must be non-negotiable. On a closing note, I hope to drive a conversation with our national representation, the Mortgage Bankers Association, at our upcoming National Convention and bring not only more awareness to these growing issues but discuss forward thinking solutions and inclusion of appraisers & AMCs in the MBA agenda.”
Last Saturday in the commentary I quoted a reader who noted, among other things, “AMCs are keeping 1/3 to 1/2 of the appraisal fee.” Paul Dorman, President of Accurate Group, writes, “I did want to respond to this to dispel a myth. Good AMCs who want to promote partnerships with appraisers and expand their appraisal panels are not taking anywhere close to 1/3 to 1/2 of the appraisal fee. Good AMCs are actually sharing more of the appraisal fee with the appraiser and, when necessary, sharing the entire appraisal fee with the appraiser or taking losses on some orders to ensure service levels are met for both consumers and lenders.
“Yes, there is an appraiser shortage and good AMCs are working on solutions to that shortage – helping appraisers stay in the business, paying appraisers timely, limiting revision requests, looking for ways to educate and train new appraisers and developing products that make appraisers more efficient so they can complete more than 2 or 3 assignments a day. We’re doing all we can to ensure appraisers understand that the right AMCs can add a ton of value for them. We are expecting to see these efforts differentiate us in the market and expect that overtime more appraisers will see that not all AMCs are created equal.”
Like used cars and retired pro football players, regional shopping malls do not age well.
In a span of no more than a decade, a popular mall with high-end anchor stores and boutique retail tenants can fall into substandard Class B or C property condition, left behind by shifting customer demographics or newer amenities at rival shopping centers. More so today, they also face the reality of more consumers choosing to stay home to shop online.
When these malls become passé, that’s when trouble starts for commercial mortgage bond investors, who can sustain outsized losses on their exposure to these properties, compared with other kinds of collateral such as office buildings, hotels and industrial property.
In a report published Thursday, Moody’s Investors Service warned that loans backed by shopping centers are an increasing cause of concern for mortgage bond investors and provided some criteria for evaluating the long-term viability of regional malls.
“The ability of a mall to adapt to this changing environment and find new ways to attract shoppers is key to its ongoing success,” the report states. “Very few of the top tenants in malls 20 years ago are still strong performers — or even in still in business — today.”
Moody’s looked at the loss severity on loans backed by 30 regional malls that have liquidated since 2008: each averaged 75%, almost twice as severe as the 45% average for all other CMBS loan liquidations in that time period. In the case of 10 of the failed malls, the loss severity was over 100%.
Loans backed by shopping malls are typically structured no differently than other kinds of commercial mortgages: they have 10-year tenors with large balloon payments due at maturity, meaning they amortize very little during their terms. The issue is that malls can have relatively short lives as premier properties, and so may need new capital investments — and thus new financing — within a decade to expand their shelf life.
Individual malls have been under pressure to maintain their appeal and customer interest since the 1980s, but these challenges are now exacerbated by competition from online retailers, which is hitting traditional mall anchor stores like Macy’s and Sears particularly hard. With a business model dependent on traffic driven by magnet department stores, malls could be in significant trouble, and as a result, perform poorly as CMBS collateral.
For example, Macy’s plans to shutter 100 stores this year, a move that Morningstar Credit Ratings estimates could impact $3.64 billion in outstanding securitized commercial mortgages backed by malls with Macy’s as a prime tenant.
So how can CMBS investors assess their risk?
To find out, Moody’s mapped out the capabilities of local and national mall owners to keep their properties viable and profitable during long-term 10- to 20-year leases. Demographics, location and property age were not the only, or the most important, factors. Some properties like The Florida Mall in Orlando having weathered the replacement of four anchor stores over 30 years to remain a competitive shopping mecca in central Florida.
Malls that maintain upscale amenities and ties to national ownership attract high-end, non-anchor stores (or “inline” tenants, with stores under 10,000 square feet), the report noted. The healthiest malls average more than $400 in per-square-feet sales for their non-anchor stores, and have occupancy cost ratios (tenant real estate costs divided by gross sales) above 13% for its inline tenants.
Those gross sales figures for the strongest malls, as measured by Moody’s, exclude the transactions from high-demand boutique retail outlets that skew sales figures, such as Apple Stores. An Apple retail store by itself can boost a mall’s sales per square foot by $100, Moody’s stated.
Weaker malls will usually average inline store sales of no more than $275 per square foot and have locations with limited demographics and fewer national chain tenants. If they do have chain tenants, those stores will likely have lower-than-average sales figures for than sister stores across the country.
Low traffic volume, whether due to mundane store options or too few neighboring entertainment and dining establishments, often gives malls less negotiating power with tenants over rent terms. These property owners might have to accept “gross” leases where the tenant pays a percentage of sales versus a base rent for occupancy.
Net income operating margins could fall below 65%, sometimes 50% for struggling substandard malls, compared to 70%-80% for the stronger malls that can demand excess percentages above base rents. Strong performers can also draw up “triple net” leases that foist some of the real estate expenses onto some tenants.
National sponsorship is considered a key indicator for a strong mall’s performance, with ability to provide more incentives for key anchor tenants to maintain or expand their presence. A sell-off by a national ownership group to a local owner can often trigger a mall’s weakening performance — tenants may ask for rent relief or may exit the mall in the absence of a national ownership backer.
Even if weaker-performing malls demonstrate stability, investors must weigh the cost-effectiveness of when the inevitable, and capital-intensive, rehab of a mall must be undertaken. For “highly productive” malls, Moody’s stated, the high cost of market repositioning or a refresh of the tenant lineup can be justified. For less-productive malls, they are often forced to sell well below par to give new owners the capital space to invest in a revitalization project.
“Depreciation for malls is not just an accounting concept; malls need to stay current and vibrant or risk a reduction in their earnings power,” the report states.
One month ago, ZeroHedge said that “it is not looking good for the US housing market”, when in the latest red flag for the US luxury real estate market, they reported that sales in the Hamptons plunged by halfand home prices fell sharply in the second quarter in the ultra-wealthy enclave, New York’s favorite weekend haunt for the 1%-ers.
Reutersblamed this on “stock market jitters earlier in the year” which damped the appetite to buy, however one can also blame the halt of offshore money laundering, a slowing global economy, the collapse of the petrodollar, and the drastic drop in Wall Street bonuses. In short: a sudden loss of confidence that a greater fool may emerge just around the corner, which in turn has frozen buyer interest.
A beachfront residence is seen in East Hampton, New York, March 16, 2016.
We concluded this is just the beginning, and sure enough, several weeks later a similar collapse in the luxury housing segment was reported in a different part of the country. As the Denver Post reported recently, high-end sales that fuel Aspen’s $2 billion-a-year real estate market are evaporating, pushing Pitkin County’s sales volume down more than 42 percent to $546.45 million for the first half of the year from $939.91 million in the same period of 2015.
The collapse in transactions means that Aspen’s high-end real estate market “one of the most robust in the country, with dozens of options for buyers ready to spend more than $10 million” finds itself in its first-ever sustained nosedive, despite “dense summer crowds, soaring sales tax revenues and high lodging occupancy.”
Like in the Hamptons, the question everyone is asking is “why”? There are many answers:
Ask a dozen market watchers why, and you’ll get a dozen answers. Uncertainty around the presidential election. Fear of Trump. Fear of Clinton. Growing trade imbalances with China. Brexit. Roller-coaster oil prices. Zika. Wobbling economies in South America. The list goes on.
“People are worried about all kinds of stuff these days,” says longtime Aspen broker Bob Ritchie. “I’ve never seen anything like this before.”
The speed of the collapse has been stunning. Until just last year, the local market was beyond robust, with Pitkin County real estate sales hitting $2 billion in 2015, a 33% annual increase driven largely by sales of homes in Aspen, where prices average $7.7 million.
This year, however, “a slowdown in January turned into a free fall.” Sales volume in Pitkin County is down 42%, according to data compiled by Land Title Guarantee Co.
Almost all of that decline is coming from Aspen, where the market is frozen. Sales in the Aspen-Snowmass market in the first half of the year were the bleakest since the first half of 2009, and inventory soared to levels not seen since the recession.
High-end sales that fuel Aspen’s $2 billion-a-year real estate market are evaporating
The statistics are stunning: single-family home sales in Aspen are down 62% in dollar volume through the first-half of the year. Sales of homes priced at $10 million or more — almost always paid for in cash — are down 60%. Last year, super-high-end transactions accounted for nearly a third of sales volume in Pitkin County.
“The high-end buyer has disappeared,” said Tim Estin, an Aspen broker whose Estin Report analyzes the Aspen-Snowmass real estate market.
“Aspen has never experienced such a sudden and precipitous drop in real estate sales,” according to the post.
Worse, it’s not just the collapse in the number of transaction: even more disconcerting for brokers who have always trumpeted Aspen as a safe and lucrative place to park a huge pile of money: Prices are dropping.
In the first half of this year, the average price per square foot of Aspen homes dropped 22 percent to $1,095 from $1,338 in 2015. Recent Aspen sales also closed at more than 15 percent below listing price, a rare discount.
Some brokers suspect that the frenzied sales and pricing pace of 2015 was not sustainable. The present decline is a correction, they say. “I think a lot of people thought we would go to the next level in 2016. Take the next step up and that step got resistance from buyers,” said longtime Aspen broker Joshua Saslove, who just put an Aspen home for more than $10 million under contract. If it closes, it will be just the fourth sale above $10 million in Aspen this year, compared with more than a dozen by this point last year.
“I think a lot of developers thought they would push their, say, $5 million properties to $6 million this year, but no one is buying,” Saslove said. “I don’t see that nonchalance or cavalier attitude any more.”
To be sure, Saslove is hoping that a rebound is coming; that however, may be overly optimistic and first far more pain is in store especially if one considers what is taking place in yet another formerly red-hot housing market, where suddenly things are just as bad, because as Mansion Global reports…
Luxury condo sales in Miami have crashed 44%.
According to the latest report by the Miami Association of Realtors, the local luxury housing market is just as bad, if not worse, than the Hamptons and Aspen.
The latest figures out of Miami this week showed residential sales are down almost 21% from the same time last year. But as bad as this double-digit decline may seem, it pales in comparison to what’s happening at the high end of the market.
A closer look at transactions for properties of $1 million or more in July shows just 73 single-family home sales, representing an annual decline of 31.8%, according to a new report by the Miami Association of Realtors. In the case of condos in the same price range, the number of closed sales fell by an even wider margin: 44.4%, to 45 transactions.
The Miami housing market, and its luxury segment in particular, has been softening for the past year with high-end condos sitting on the market for twice as long as they did a year ago and sellers offering bigger discounts amid an increased supply.
Number of closed sales for Miami condos priced over $1 million fell by 44%
In July, townhouses and condos of $1 million or more waited, on average, 162 days for a buyer, a 1.9% increase over a year ago and the longest time of any other price range, according to the report.
As in the previous two markets, the locals want something to blame, in this case the strong dollar, which has significantly increased the value of properties in other currencies, has been blamed, and perhaps rightfully so as sales to foreigners—an important client base, since international buyers acquire more homes in Florida than in any other state, according to the National Association of Realtors – have tumbled.
Real estate appraiser and data expert Jonathan Miller said that Miami is behaving like most of the rest of the U.S. housing market, which is in fairly good shape overall “but soft at the top.”
As noted here over the years, In the case of Miami, like in other most other coastal markets such as New York and Los Angeles, the housing boom was heavily boosted by foreign buyers, who used US luxury real estate as their new form of anonymous “offshore bank accounts” courtesy of the NAR’s exemption from Anti-Money Laundering Provisions. However, after the recent drops in commodity prices and the spike in the USD, they have scaled back their purchases.
“The international component is not as intense,” Mr. Miller said.
Depsite the slowdown deals are still being done, with cash the preferred form of payment of foreign buyers in the U.S., – some 43% of all sales in Miami in July were closed in cash, however down from 48.1% the same month last year, according to the latest figures.
Other potential buyers are also stepping back: cash sales for townhouses and condominiums, an indicator of investor activity, hit their lowest level in a year last month: 633 transactions, representing a 30.4% year-over-year decline, according to the report.
As for the forecast for the coming months, sales activity doesn’t look likely to surge. There were 1,272 pending sales of townhouses and condos in Miami in July, which means 25.4% fewer transactions waiting to close than in the same month in 2015 and the lowest number so far this year. Meanwhile, as a result of a building boom, luxury condo inventory is up 47.8% from last year, with 2,482 units worth $1 million or more waiting to change hands; this means that sellers of high-end condos will continue to face stiff competition, prompting even fewer transactions and/or lower prices.
So far, the collapse at the luxury end has failed to transmit to the broader market, less impacted by lack of foreign demand, however as we documented two weeks ago,it is only a matter of time before the overall US housing market suffers as well. The only question is whether the NAR and the US Census Bureau, who tabulate the “goal-seeked”, seasonally adjusted data, will admit it before or after the presidential elections. The likely answer: it depends on who the next president is.
26 feet underneath this modest, 2 story suburban home in Las Vegas you will find a sprawling, 5,000 square foot home—complete with four-hole putting green, swimming pool, jacuzzi and sauna—and designed to withstand a nuclear blast.
The bunker home at 3970 Spencer Street was built in the 1970s by businessman Girard ‘Jerry’ B. Henderson, who fearing attack from the Soviets, built his first underground bunker in the 1960s in Boulder, Colorado during the height of the Cold War.
The only signs of something amiss on the surface of this underground retreat were the ‘unusual’ amount of ground-mounted air conditioning units that were camouflaged by clusters of rocks and boulders…
Hmmmm
According to VegasInc.com, the house had been purchased for $2 million in 2005 and was foreclosed by Seaway Bank and Trust Co. in 2012.
The bank listed the property for $1.7 million in 2013, eventually selling the property in March 2014 to a mysterious group called the Society for the Preservation of Near Extinct Species for $1.15 million. [source]
The two-bedroom, three-bathroom underground home might be the most peculiar in Las Vegas. Built beneath a typical, suburban two-story house, the bunker home spans more than 5,000 square feet and is part of a 15,200-square-foot basement that also features a casita.
The subterranean refuge seems designed to stave off boredom and claustrophobia. It has a four-hole putting green, a swimming pool, two jacuzzis, a sauna, a dance floor with a small stage, a bar, a barbecue and huge murals of rural, tranquil settings.
The home, with unchanged “Brady Bunch” decor, also has a laundry room, a kitchen, a fireplace, a generator, fake trees, fake flowers, two elevators, fire alarm bells, smoke detectors, an intercom system and several large pantries.
Light switches labeled “Sunset,” “Day,” “Dusk” and “Night” mimic lighting conditions at those times by dimming or brightening lights and stars on the ceiling, which is painted sky blue with white clouds.
A few miles east of the Strip, the home was built in the 1970s by entrepreneur Girard B. “Jerry” Henderson, who feared a nuclear Armageddon during the Cold War. While others built fallout shelters, he wanted to live underground full time, according to news reports.
Henderson co-founded Underground World Home Corp., a subterranean home building company. A brochure for the company boasts that underground living is healthier, cleaner, quieter, cheaper, safer and is “the ultimate in true privacy!”
“How would you like sunshine every day … when you want it?” the brochure asks.
Last week, we first touched on a topic which, in any non-banana republic, would be a far greater scandal than what Ryan Lochte may or may not have been doing in a Rio bathroom: namely, government corruption, falsification and potential fraud and embezzlement, which has resulted in the Pentagon being unable to account for up to $8.5 trillion in taxpayer funding.
Today, Reuters follows up on this disturbing issue, and reveals that the Army’s finances are so jumbled it had to make trillions of dollars of improper accounting adjustments to create an illusion that its books are balanced. The Defense Department’s Inspector General, in a June report, said the Army made $2.8 trillion in wrongful adjustments to accounting entries in one quarter alone in 2015, and $6.5 trillion for the year. Yet the Army lacked receipts and invoices to support those numbers or simply made them up.
As a result, the Army’s financial statements for 2015 were “materially misstated,” the report concluded. The “forced” adjustments rendered the statements useless because “DoD and Army managers could not rely on the data in their accounting systems when making management and resource decisions.”
For those wondering, this is what $1 trillion in $100 bills looks like.
Now multiply by 6.
This is not the first time the Department Of Defense has fudged its books: disclosure of the Army’s manipulation of numbers is the latest example of the severe accounting problems plaguing the Defense Department for decades. The report affirms a 2013 Reuters series revealing how the Defense Department falsified accounting on a large scale as it scrambled to close its books. As a result, there has been no way to know how the Defense Department – far and away the biggest chunk of Congress’ annual budget – spends the public’s money…. The Army lost or didn’t keep required data, and much of the data it had was inaccurate, the IG said.
In other words, it is effectively impossible to account how the US government has spent trillions in taxpayer funds over the years. It also means that since the money can not be accounted for, a substantial part of it may have been embezzled.
“Where is the money going? Nobody knows,” said Franklin Spinney, a retired military analyst for the Pentagon and critic of Defense Department planning, cited by Reuters.
The significance of the accounting problem goes beyond mere concern for balancing books, Spinney said. Both presidential candidates have called for increasing defense spending amid current global tension; the only issue is that more spending may not be necessary – all that is needed is less government corruption and theft.
An accurate accounting could reveal deeper problems in how the Defense Department spends its money. Its 2016 budget is $573 billion, more than half of the annual budget appropriated by Congress. The Army account’s errors will likely carry consequences for the entire Defense Department. Congress set a September 30, 2017 deadline for the department to be prepared to undergo an audit.
What’s worse is that the “fudging” of the numbers is well known to everyone in the government apparatus. For years, the Inspector General – the Defense Department’s official auditor – has inserted a disclaimer on all military annual reports. The accounting is so unreliable that “the basic financial statements may have undetected misstatements that are both material and pervasive.”
Not surprisingly, trying to figure out where the adjustments are has proven to be impossible.
Jack Armstrong, a former Defense Inspector General official in charge of auditing the Army General Fund, said the same type of unjustified changes to Army financial statements already were being made when he retired in 2010.
The Army issues two types of reports – a budget report and a financial one. The budget one was completed first. Armstrong said he believes fudged numbers were inserted into the financial report to make the numbers match.
“They don’t know what the heck the balances should be,” Armstrong said.
Meanwhile, for government employees, such as those at the Defense Finance and Accounting Services (DFAS), which handles a wide range of Defense Department accounting services, the whole issue is one big joke, and they refer to preparation of the Army’s year-end statements as “the grand plug,” Armstrong said. “Plug”, of course, being another name for made-up numbers.
Finally, how on earth can one possibly “not account” for trillions? As Reuters adds, at first glance adjustments totaling trillions may seem impossible. The amounts dwarf the Defense Department’s entire budget. However, when making changes to one account also require making changes to multiple levels of sub-accounts. That creates a domino effect where falsifications kept falling down the line. In many instances this daisy-chain was repeated multiple times for the same accounting item.
The IG report also blamed DFAS, saying it too made unjustified changes to numbers. For example, two DFAS computer systems showed different values of supplies for missiles and ammunition, the report noted – but rather than solving the disparity, DFAS personnel inserted a false “correction” to make the numbers match.
DFAS also could not make accurate year-end Army financial statements because more than 16,000 financial data files had vanished from its computer system. Faulty computer programming and employees’ inability to detect the flaw were at fault, the IG said.
DFAS is studying the report “and has no comment at this time,” a spokesman said. We doubt anyone else will inquire into where potentially trillions in taxpayer funds have disappeared to; meanwhile the two presidential candidates battle it out on the topic of tax rates when the real problem facing America is not how much money it draws in – after all the Fed can and will simply monetize the deficit – but how it spends it. Sadly, we may never know.
While the single-family housing stagnation continues, multi-family, or rental, housing starts and permits jumped in the month of July according to the latest Census data.
In the latest month, housing starts rose by 2.1% from June, and were higher by 5.6% from a year ago, rising to 1.211MM, above the 1.180MM expected, driven by a 33K jump in rental unit starts, which rose to 433K, while single-family units remained largely unchanged at 770K, up 0.5% from last month’s 766K. As the chart below shows, single-family start have barely budged in the past year even as rental units appear to once again be growing at a solid pace.
On an annual basis, the rate of change continues to hug the flat line, and after last month’s modest decline, starts rose by 5.6% in the latest month.
Meanwhile, the more important building permits data series, fell modestly to 1.152MM in July from 1.160MM in June, on top of the 1.153MM expected.
While these series are notoriously volatile, if indeed multi-family housing is picking up it could provide a modest ray of hope for America’s renters who continue to suffer under record high asking rents, in part due to a lack of supply. Then again, it depends who ends up being the ultimate owner of these buildings, and if the units end up controlled by Wall Street it is likely that there will be no respite from record high rates any time soon as the “curtailing” of supply is set to continue for the indefinite future.
Are you rounding the corner toward retirement age with not nearly enough set aside?
We tell young people to start saving for retirement from their first job and not to quit, because even small sums can grow staggeringly large with enough decades of compound returns. But maybe you bumped along from paycheck to paycheck, never saving much. Or maybe you tried to save but got slammed with unexpected setbacks like a late-in-life job loss.
Let’s be clear: You can’t make up for lost time.
But don’t give up — you do have options. Any money you can set aside can help you make retirement more comfortable. Here’s what you need to do:
REDEFINE RETIREMENT
This means working longer, working part time in retirement or both. You’ll have more time to save, your savings will have more time to grow, and you’ll shorten the full-retirement period you’ll need to cover. That’s a nice way to say you’ll have fewer work-free years before you die.
If working longer in your current job feels like a death sentence, start looking around for paying gigs you might enjoy in retirement. Working longer may have an upside: People who voluntarily work in retirement often say their jobs keep them active and engaged.
If you start taking Social Security benefits before your full retirement age–which is currently 66 and rising to 67 for people born in 1960 and later– the “earnings test” will reduce your benefit by $1 for every $2 you earn over a certain limit ($15,720 in 2016). That reduction will end when you hit full retirement age.
DELAY SOCIAL SECURITY
The benefits of waiting are so great that it may be worth tapping whatever retirement funds you have so you can hold out until your full retirement age. If you sign up at age 62, you’ll lock in a permanently reduced check.
Most people are better off delaying their application at least until their full retirement age, currently 66 but rising to 67 for people born in 1960 or later. That would inflate a $1,500 monthly benefit to at least $2,000. If you waited until age 70, when benefits max out, the same check would grow to about $2,640 each month.
If you’re married, it’s particularly important for the higher earner to put off applying for as long as possible. When one of you dies, the survivor will get the larger of the two benefits you received as a couple. Maximizing that benefit can help keep the survivor’s final years from being a financial nightmare.
Rule of thumb: Every year you wait past age 62 adds about 7 percent to 8 percent to your eventual benefit.
TAP THE HOUSE
If you have substantial home equity, you have a powerful asset to deploy for your retirement. You can:
—Downsize now so you can invest the money freed up from the sale and from lower housing costs. The big advantages to doing it now: Your money will have more time to grow, and you may be better able to handle the disruption of a move than when you’re older.
— Downsize in retirement, when you can relocate someplace with a lower cost of living. Your job may require you to live in an expensive area, but once you retire you can choose to live somewhere cheaper within the States or, as about 1 million U.S. retirees do, abroad.
—Consider a reverse mortgage . Reverse mortgages can give you a lump sum, a stream of monthly checks or a line of credit you can tap as needed. You don’t make payments, but the debt grows over time and is paid off when you move, sell or die. The earliest you can apply is 62, but the longer you wait, the more money you can get.
New Jersey resident Walt Lukasik, 60, is investigating this option to salvage retirement plans that were upended by his wife’s cancer diagnosis 15 years ago. She hasn’t been able to work for the past eight years, and medical bills have sucked away any money they’d hoped to save, Lukasik says.
The combination of care giving and worrying about retirement is taking its toll. “It’s killing me,” he says.
If he applies for a reverse mortgage in two years, it could pay off the $75,000 balance on their current mortgage and give them a monthly payment of about $390, according to the National Reverse Lenders Mortgage Association. If he waits until the mortgage is paid off in five years, the monthly payment would be closer to $800. Other payout options include a lump sum of $93,000 or a line of credit of more than $160,000.
Reverse mortgages are complex and can be costly, so they’re not a good fit for every situation. Counseling is mandatory and typically provided by nonprofit credit counseling agencies.
TURN TO YOUR KIDS
Most U.S. parents are horrified by the notion of asking their children for money. Their kids often don’t feel the same way. A recent survey by Fidelity Investments found nine out of 10 parents think it would be unacceptable to become financially dependent on their offspring, but only three out of 10 adult children agreed with them. If there’s any chance you may need your children to help you make ends meet, consider having the conversation sooner rather than later. Bringing up the issue may be painful and embarrassing. But at least you’ll know whether you can rely on their help, and they will have time to rearrange their finances to better offer it — while, of course, saving for their own retirement.
EXPLORE PUBLIC BENEFITS
If worse comes to worst, Social Security alone can keep you above the poverty line — that’s why it was invented. You also may qualify for public benefits, such as subsidized housing, food benefits and lower-cost utilities. Start your search at Benefits.gov.
RE-EXAMINE YOUR DEBT
If consumer debt such as credit cards, medical bills and unsecured personal loans totals half or more of your gross income, explore your debt-relief options, including talking with an experienced bankruptcy attorney. You may be better off saving that money than using it to chip away at debt you can’t ultimately repay.
SAVE, SAVE, SAVE
You don’t need a fortune. You do need a way to deal with an emergency or the flexibility to time your benefits better. Anything you can save will give you more choices in retirement. Having $10,000 in a savings account could pay for a new furnace or an unexpected medical bill. Boosting your savings more could allow you to delay Social Security or the start of a pension to get bigger checks.
POWER SAVE
This option is a long shot, but it may work for those with sufficient income to make a last, aggressive push to save for retirement.
You may be able to save a big chunk of your income if you’re entering the empty nest years and can funnel into retirement accounts money that you used to spend on raising and educating kids. Or maybe you’re just determined to slash expenses and buckle down to serious saving.
Let’s say you earn around $45,000. According to Social Security, your benefit at full retirement age will replace roughly 40 percent of what you make, or about $18,000 a year. Saving 20 percent to 30 percent of your income during your last 15 years of work could give you a nest egg big enough to prevent your lifestyle from falling off a cliff in retirement. (This assumes that you can manage a 6 percent average annual return, inflation averages 3 percent and that you’ll live on about 60 percent to 70 percent of your pre-retirement income for 20 years.)
If you’re able to pull this off — and that’s a big if — you can go a long way toward closing the retirement gap.


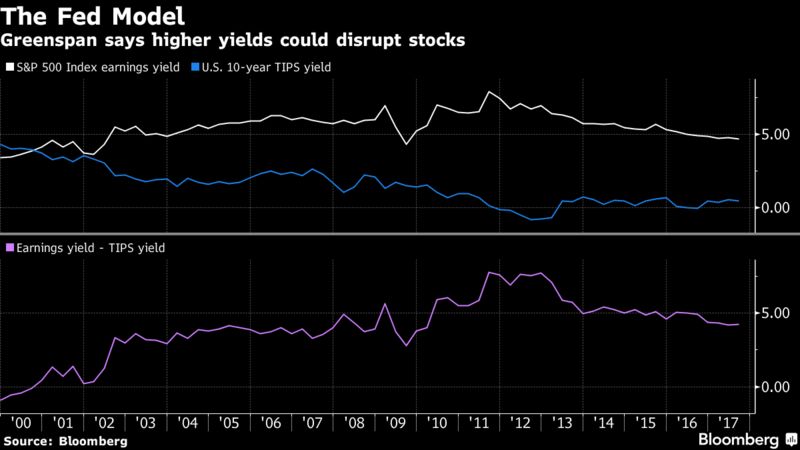


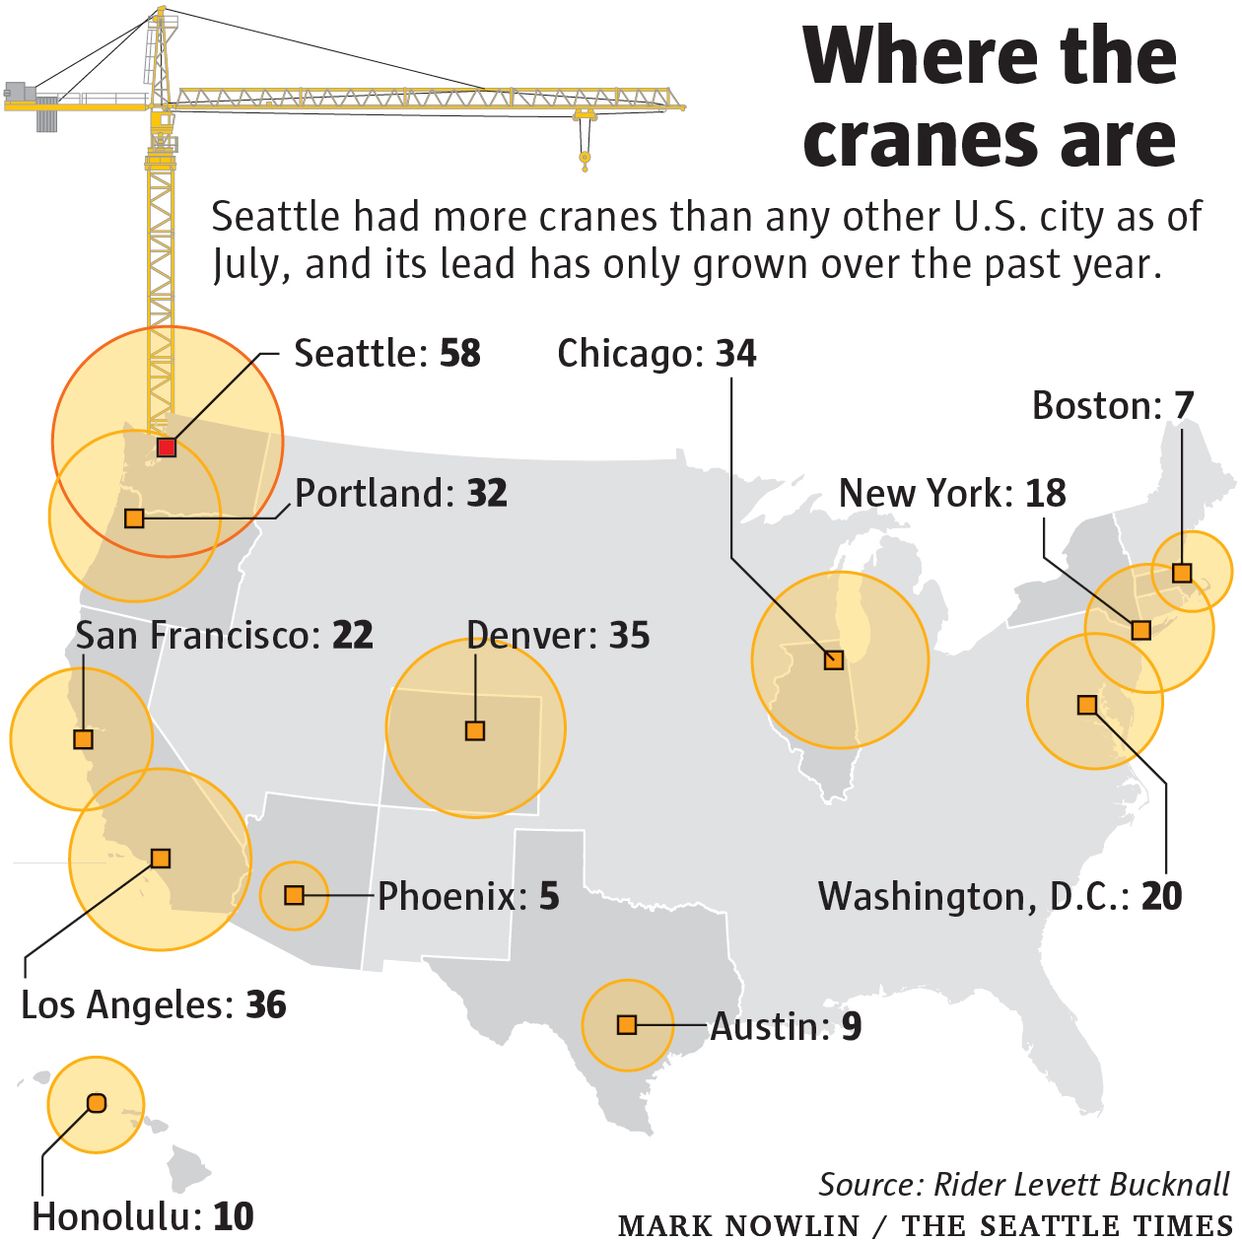


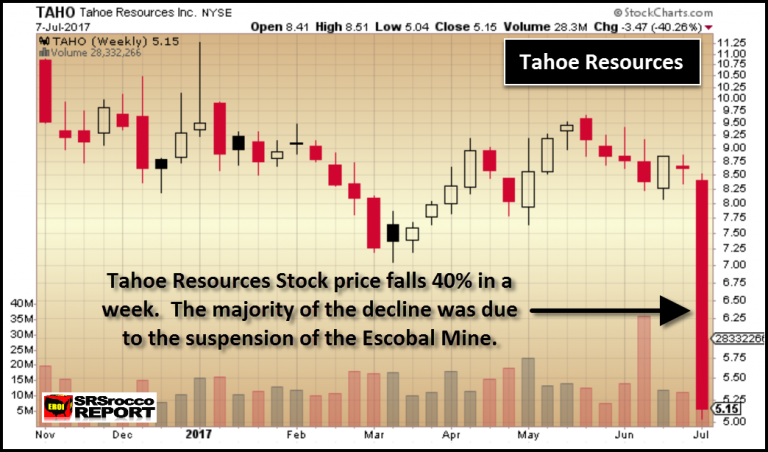


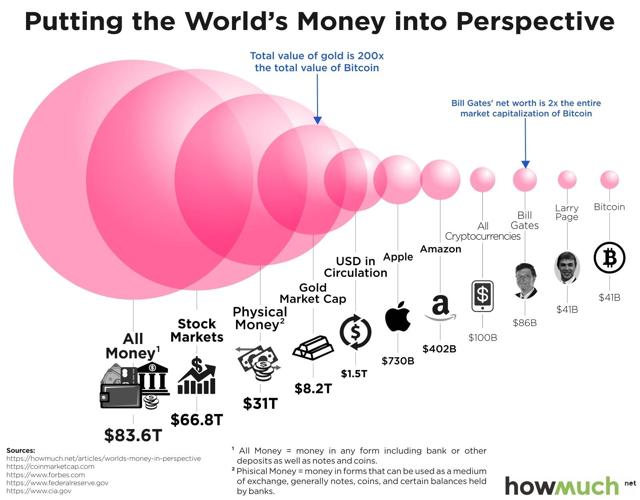


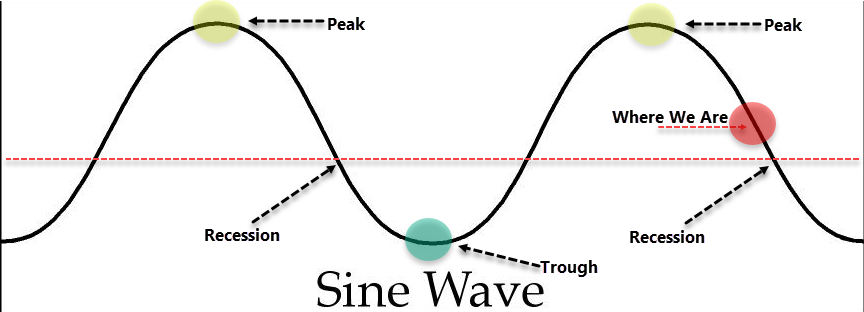


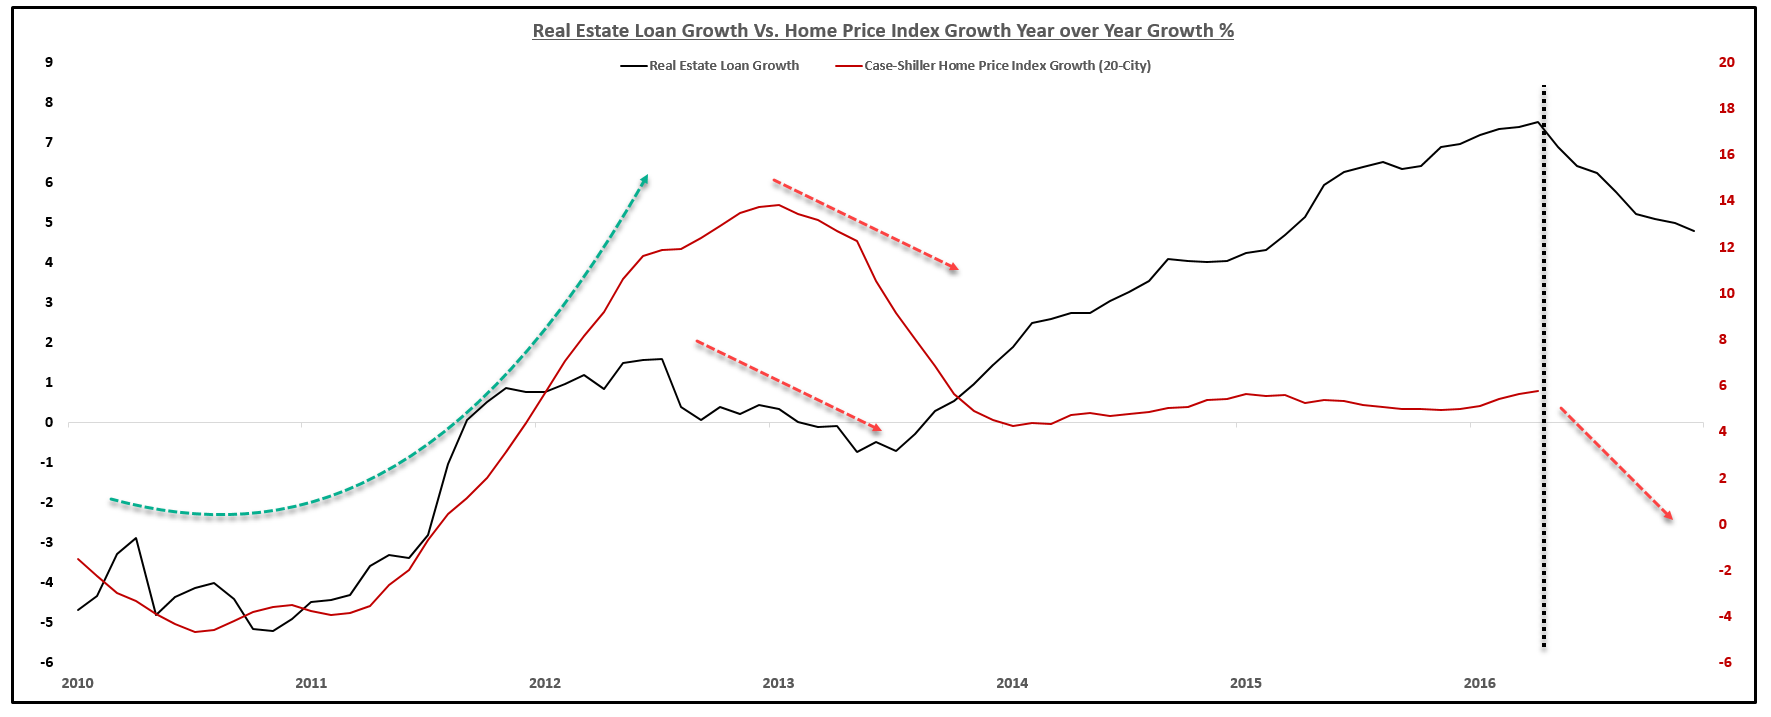
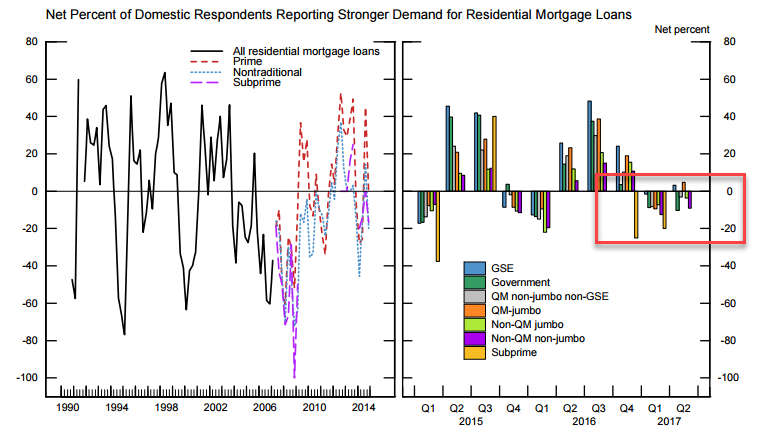
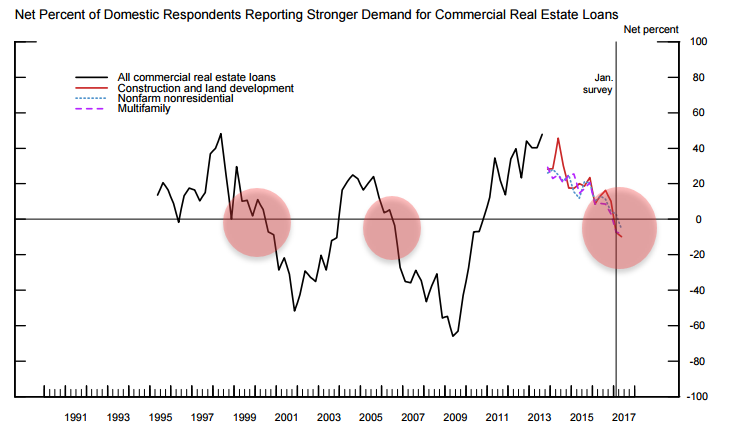
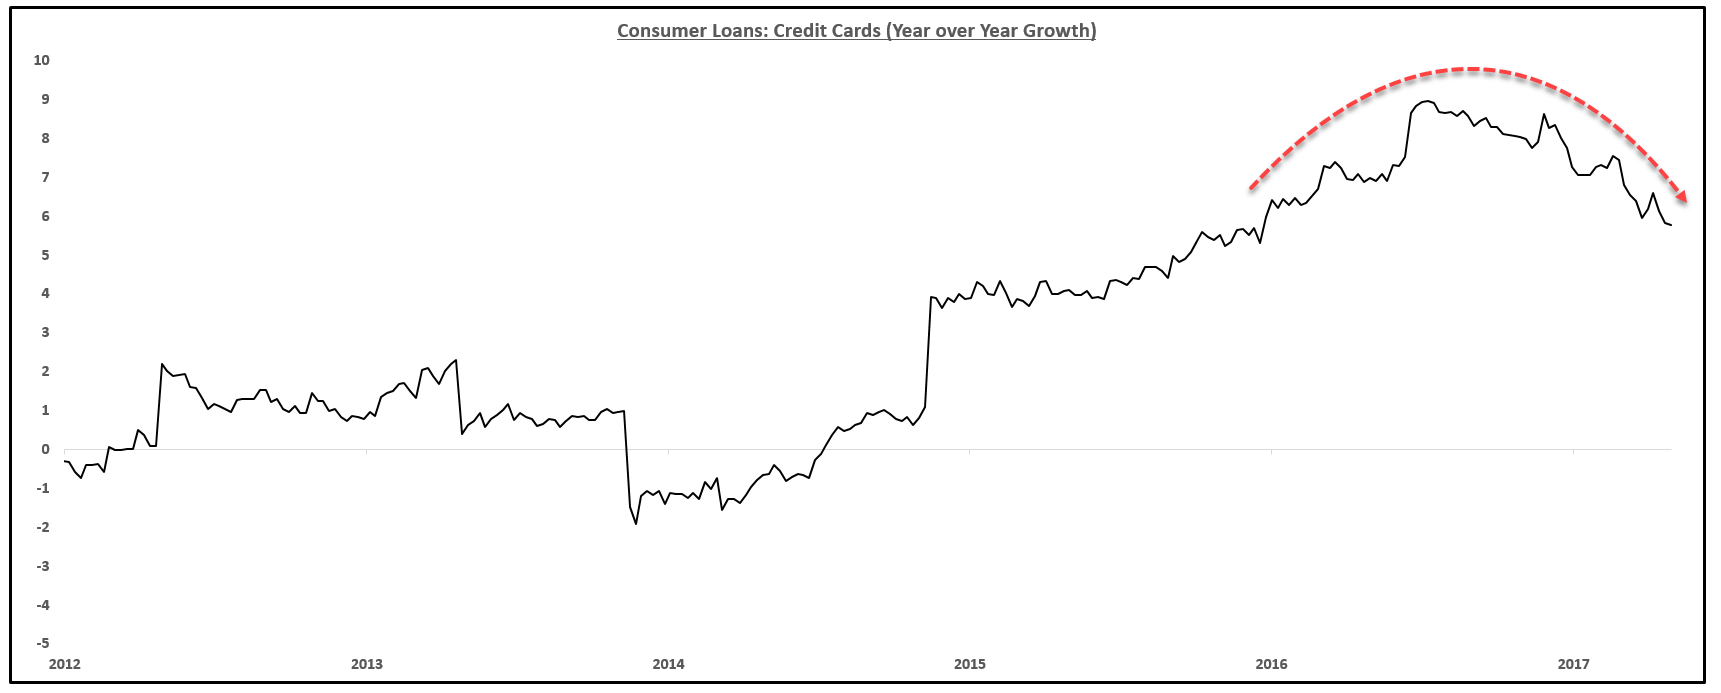
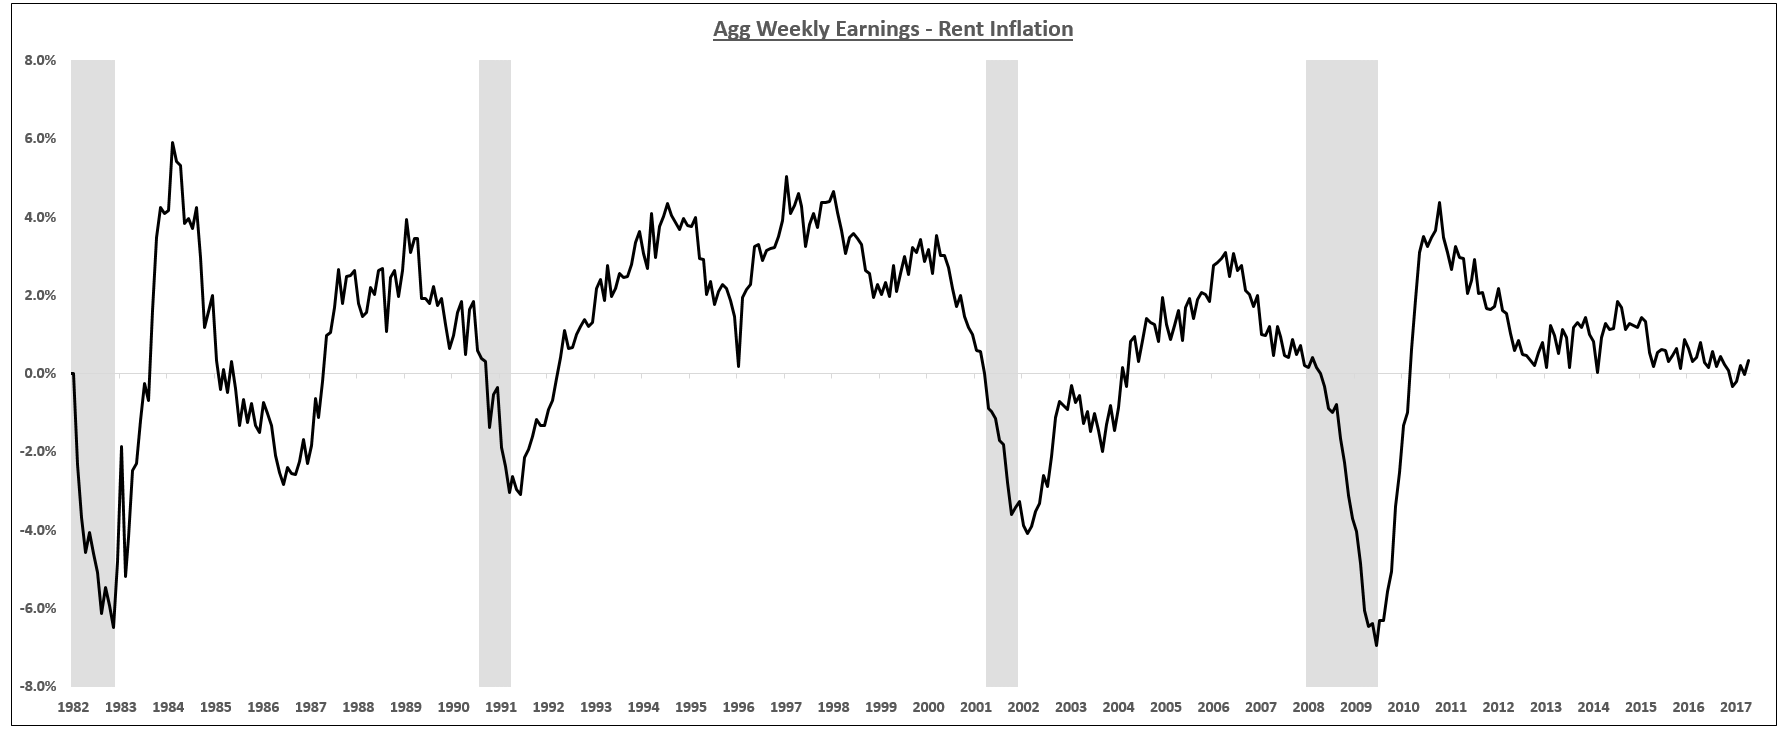
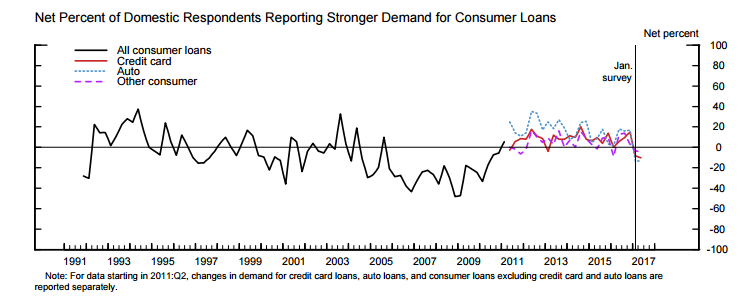
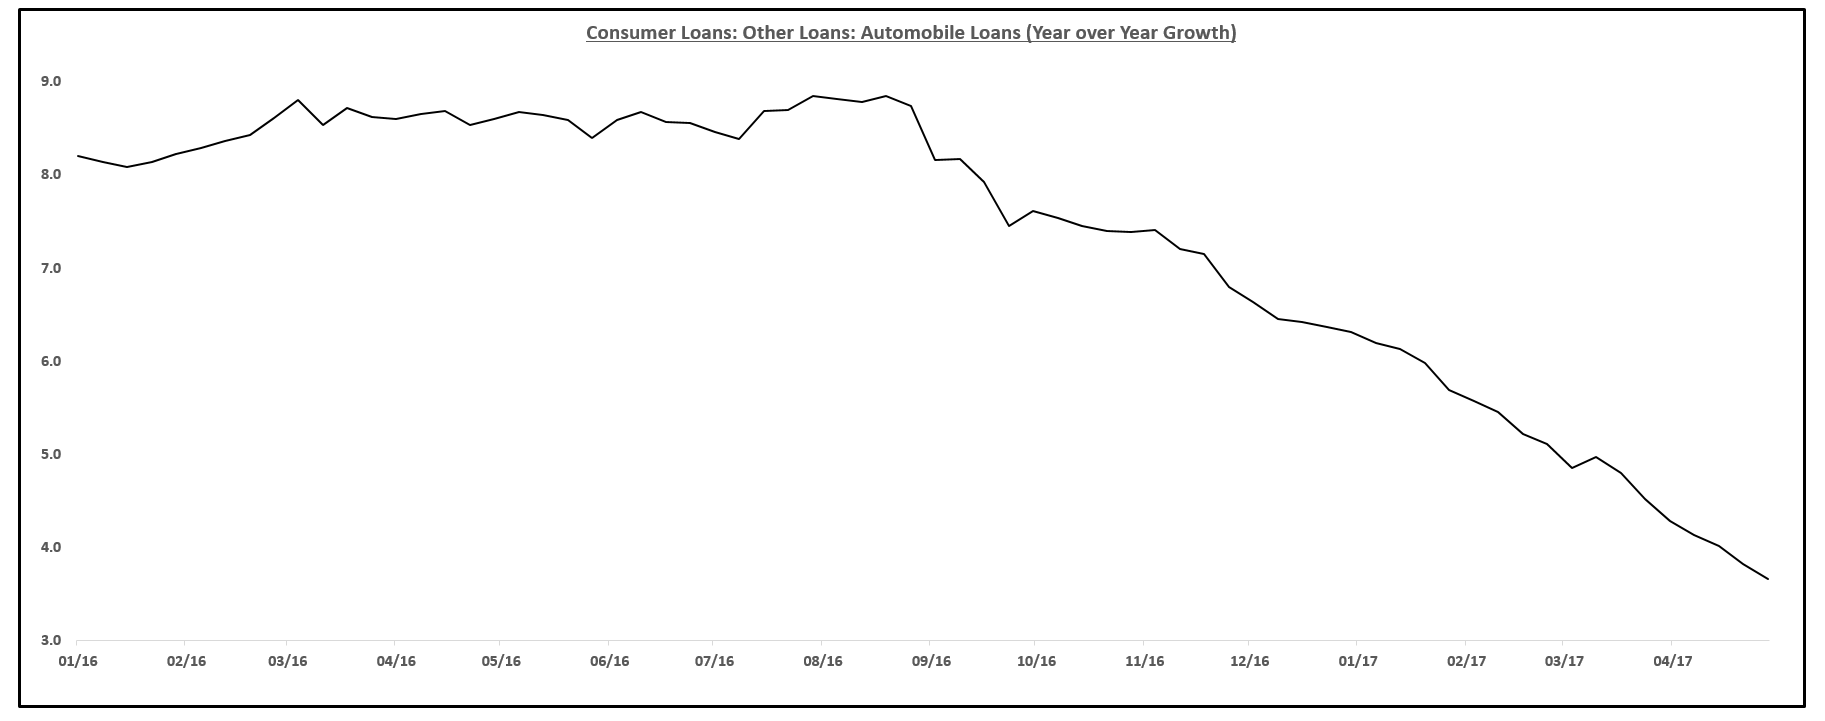
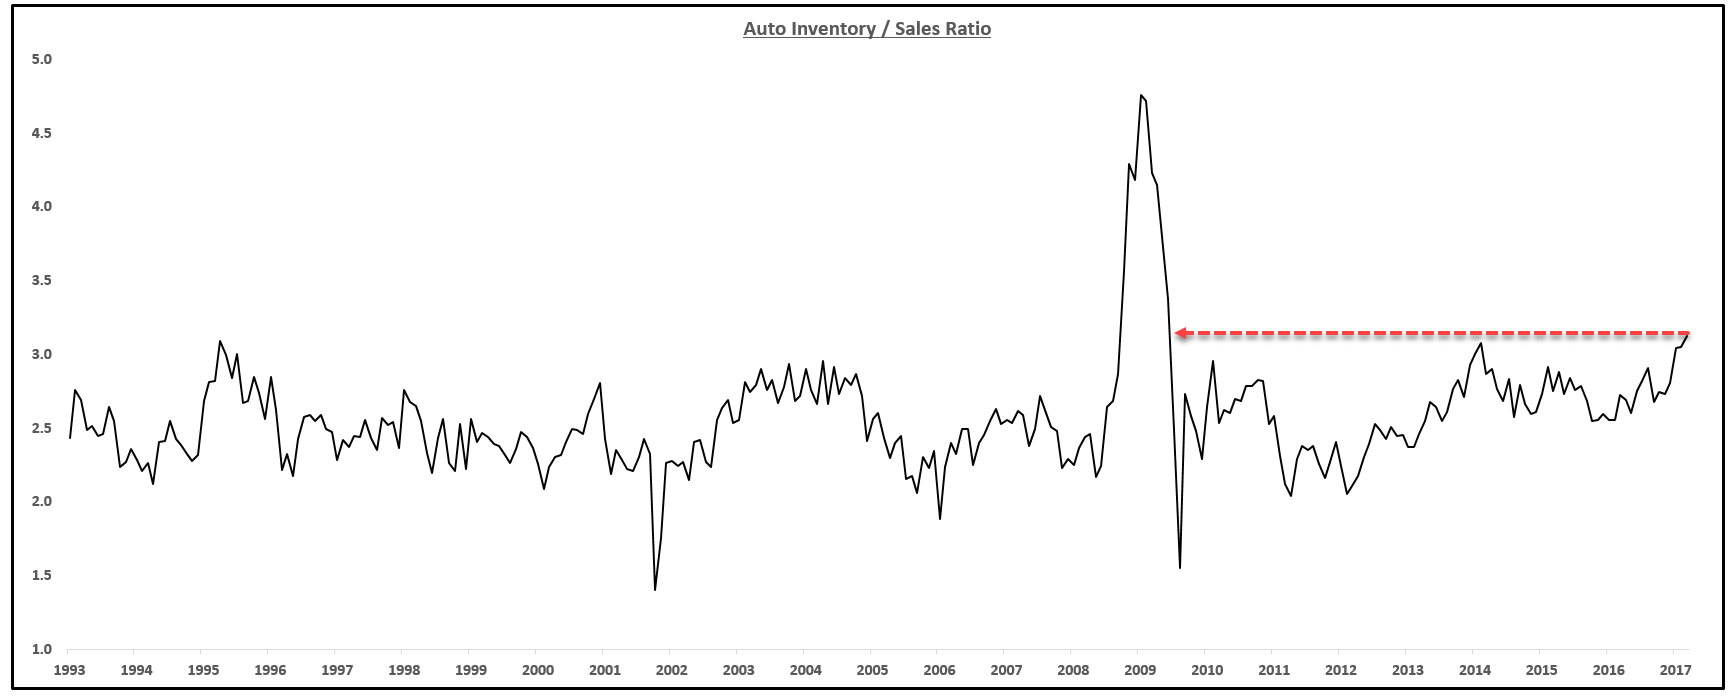
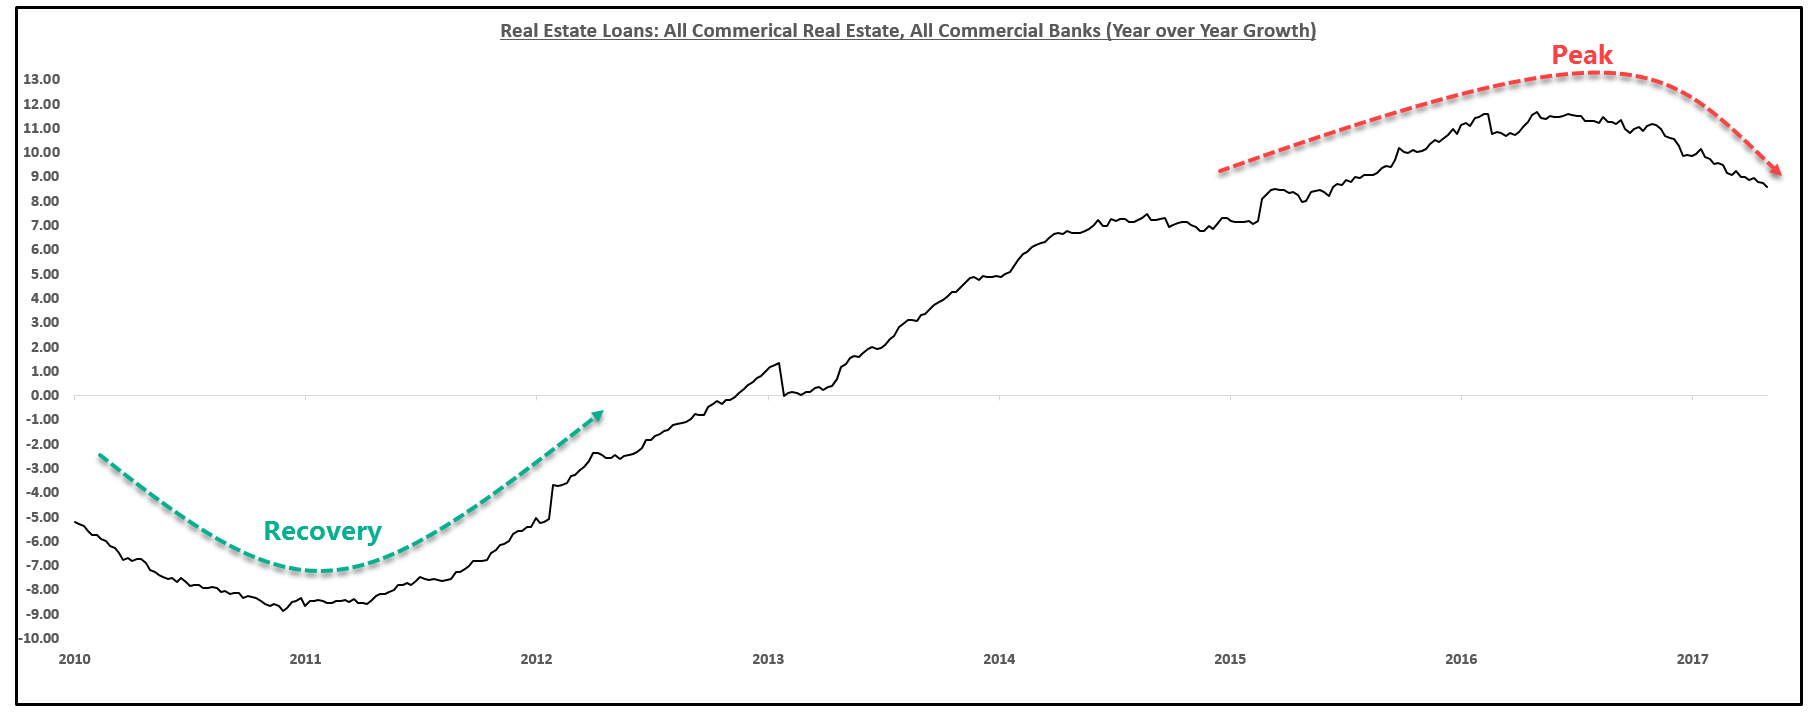
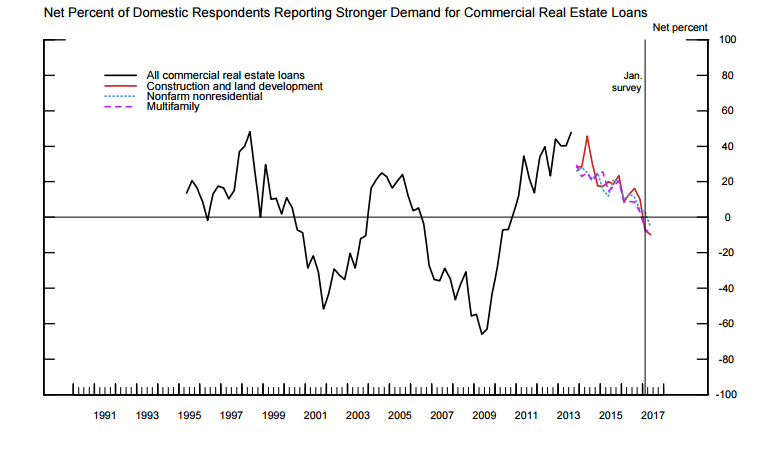
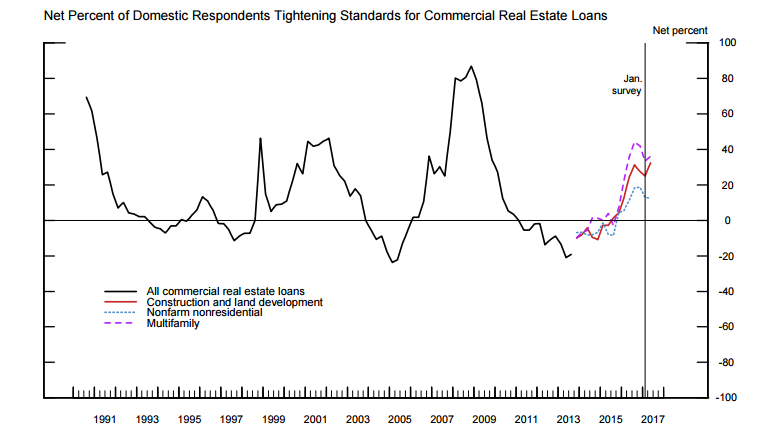
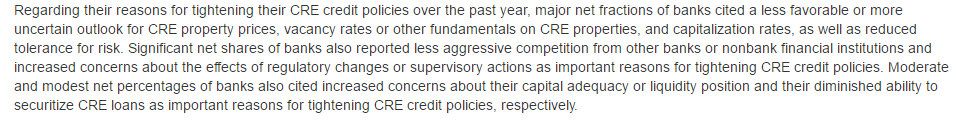
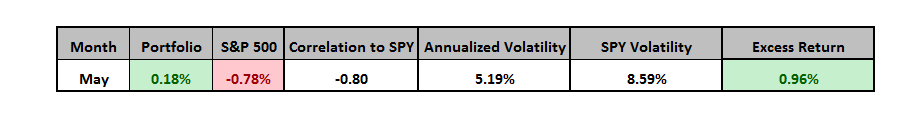


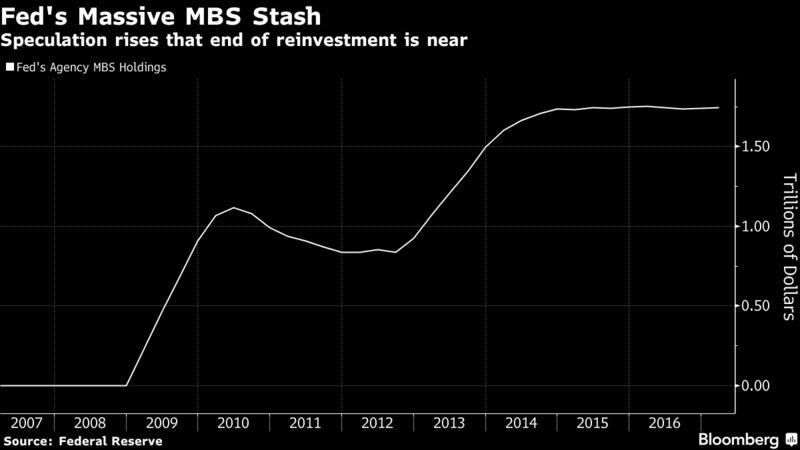
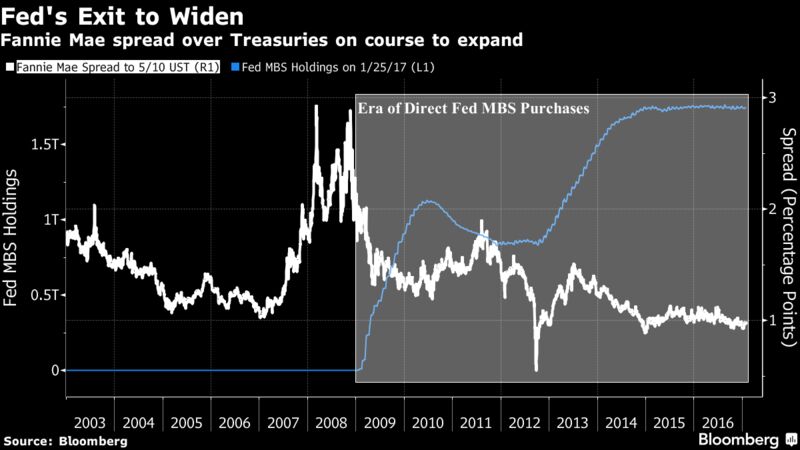
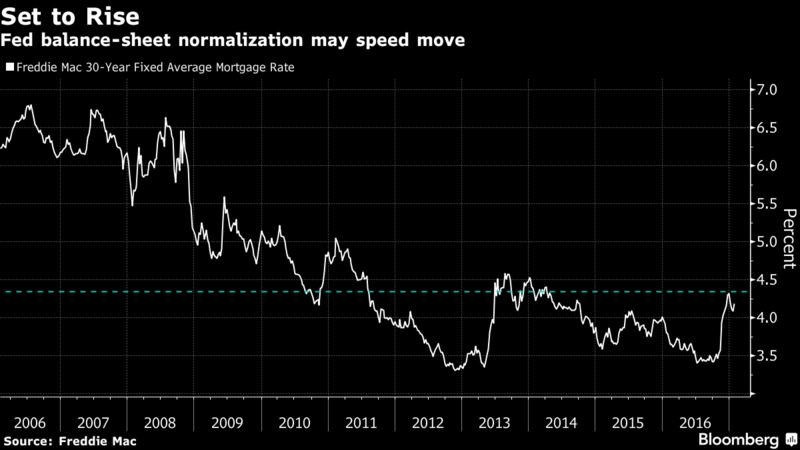
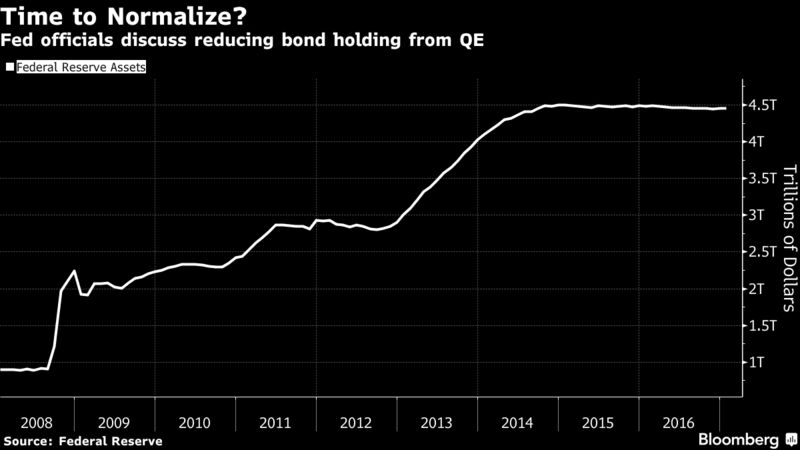


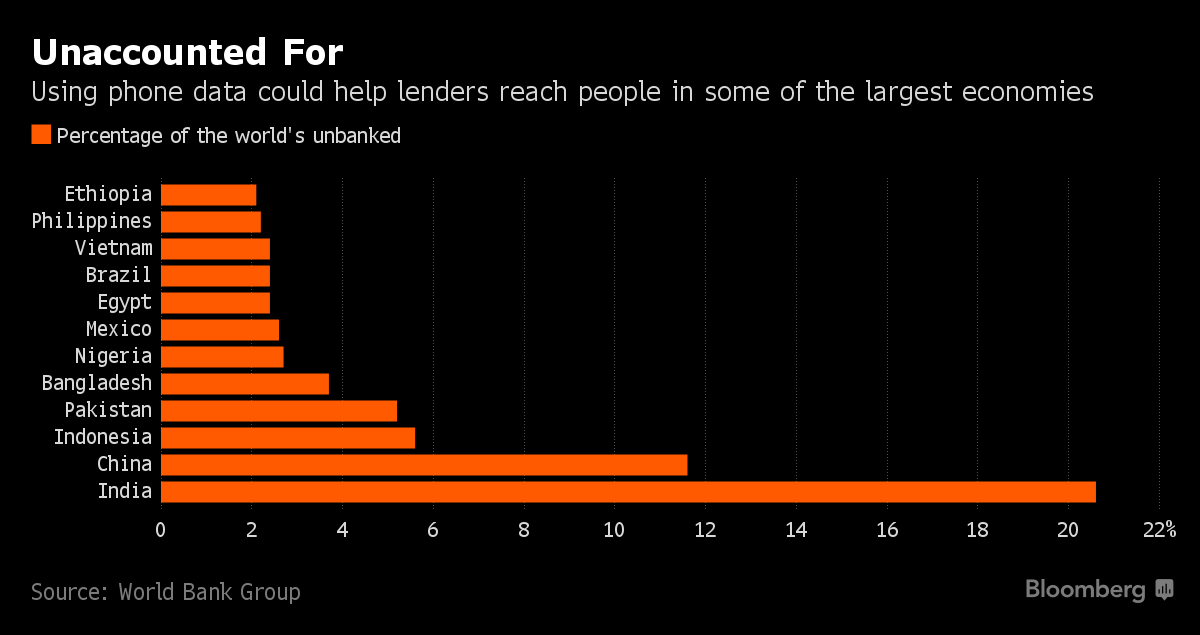


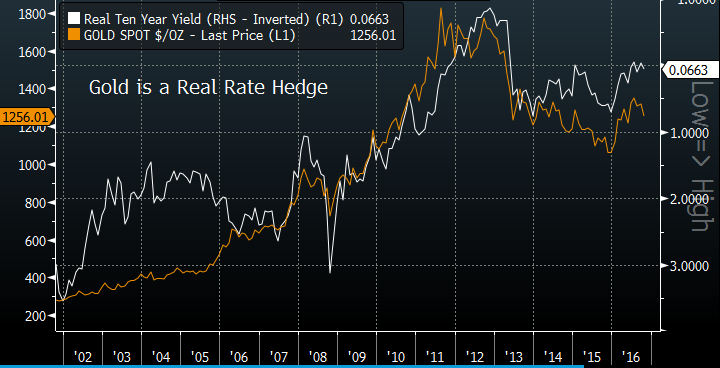
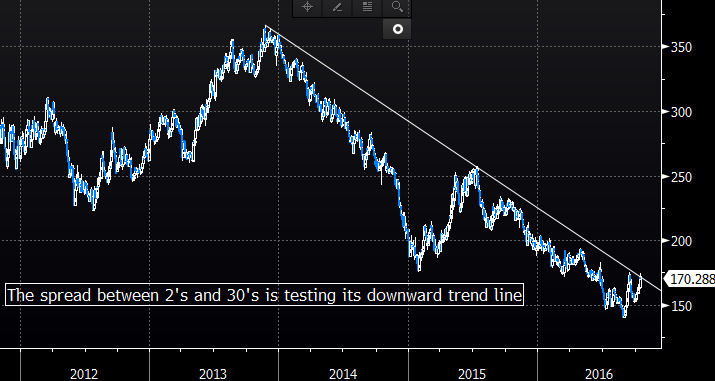
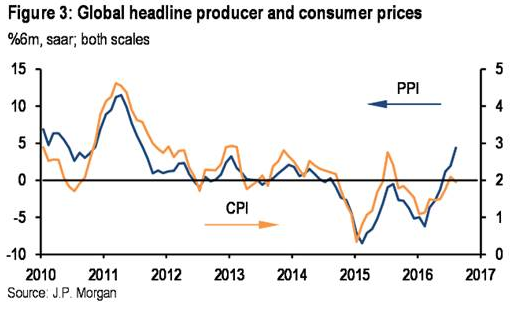
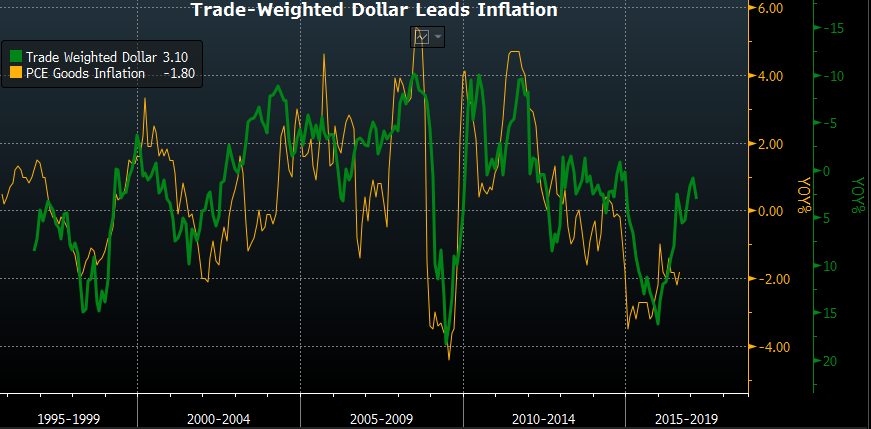


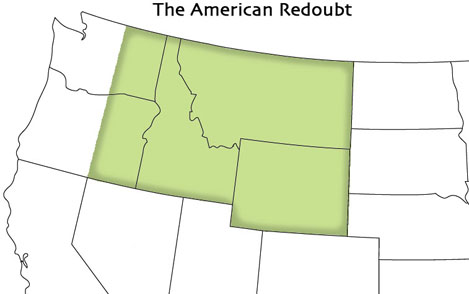


You must be logged in to post a comment.