Author Archives: Bone Fish

Less Than 25% Of College Graduates Can Answer These 4 Simple Money Questions

Americans have become numb to financial intelligence. This is no more evident than a recent Sallie Mae survey, which indicated that college graduates can’t even answer simple questions about financial concepts, such as interest.

https://www.zerohedge.com/s3/files/inline-images/college-debt1.jpg?itok=LmThGrUi

The statistics are not looking good for the United States, a nation deeply indebted, addicted to consumerism, and woefully ignorant about it all.  Not long ago, SHTFPlanreported that a mere 1 in 10 Americans is actually capable of getting an A on a basic financial security test.

And even college graduates, who are likely tens of thousands (if not more) dollars in debt because of school, learned little to nothing about handling their personal finances. The big red flag comes from consumer banking firm Sallie Mae. The firm released its new “Majoring in Money” study which asked hundreds of current and recently graduated college students up to age 29 about basic financial concepts. The results are worrisome.

Sallie Mae asked these individuals four questions related to credit and interest, and fewer than one in four got all four of these correct.

1. Interest accumulation: 
Suppose you had $100 in a savings account and the interest rate was 2% per year. After 5 years, how much do you think you would have in the account if you left the money to grow?
a. More than $102
b. Exactly $102
c. Less than $102
d. Not sure

2. Effects of payment behavior on credit cost: 
Assuming the following individuals have the same credit card with the same interest rate and balance, which will pay the most in interest on their credit card purchases over time?
a. Joe, who makes the minimum payment on his credit card bill every month
b. Jane, who pays the balance on her credit card in full every month
c. Joyce, who sometimes pays the minimum, sometimes pays less than the minimum and missed one payment on her credit card bill
d. All of them will pay the same amount in interest over time
e. Not sure

3. Impact of repayment term on cost of credit: 
Imagine that there are two options when it comes to paying back a loan and both come with the same interest rate. Provided you have the needed funds, which option would you select to minimize your total costs over the life of the loan (i.e., all of your payments combined until the loan is completely paid off)?
a. Option 1 allows you to take 10 years to pay back the loan
b. Option 2 allows you to take 20 years to pay back the loan
c. Both options have the same out-of-pocket cost over the life of the loan
d. Not sure

4. Interest terminology: 
Which of the following best defines the term “interest capitalization”?
a. The type of interest charged on high-balance loans
b. The addition of unpaid interest to the principal balance of a loan
c. Interest that is charged when you postpone payments on your loan

The fact that we have an entire generation, largely college educated, who cannot answer these questions does not bode well for our future as a society.  Not knowing the answers to these could end up costing people a lot of money down the road. According to Market Watch, 83% of college grads carry a credit card as revealed by Sallie Mae, but only about six in 10 say they pay the balance(s) in full and on time each month. Coupled with the fact that nearly seven in 10 college students take out student loans, graduating with an average of nearly $30,000 in debt, the decline in financial intelligence is evident.

There are ways to learn the basics of personal finance. Dave Ramsey’s Total Money Makeover book was of the most help to many people, and Ramsey is perhaps the most well-known personal finance guru out there.  He takes a strick “no debt” approach that has worked not only for himself, buy countless others. He also offers an easy to follow guide which he’s dubbed “the baby steps” that will get people on the path to financial freedom.

Other resources are those such as Robert Kiyosaki’s Rich Dad, Poor Dad: What the Rich Teach Their Kids About Money That the Poor and Middle Class Do Not!

Both books are excellent resources that teach the very basics about money and personal finance that no one is learning about in their public school educations.

*  *  *

The answers are 1: A, 2: C, 3: A, and 4: B

Source: by Mac Salvo | ZeroHedge

Average US Credit Score Hits An All Time High

Something unexpected happened after the financial crisis: Americans have become far more responsible when it comes to their finances. At least that is the conclusion one would derive by looking at the average US credit score, which has increased by nearly 20 points, from 686 in 2009 to 704 in 2018.

https://www.zerohedge.com/s3/files/inline-images/Average%20FICO%20increase.jpg?itok=M6Ul8mAd

Additionally, according to Moody’s, there are around 15 million more consumers with credit scores above 740 today than there were in 2006, and about 15 million fewer consumers with scores below 660.

As we discussed recently, on the surface, this “disappearance” of subprime borrowers is good news. But is there more than meets the eye to the American consumer’s FICO score renaissance? And, separately, are FICO scores subject to “grade inflation“, as the Federal Reserve recently claimed?

To answer these questions, Goldman recently conducted an analysis into the causes behind this welcome development in US credit scores. The bank founds that, as expected, some of this increase reflects legitimate improvements in the credit behavior of US consumers. For example, household debt has declined as a percentage of GDP:

https://www.zerohedge.com/s3/files/inline-images/household%20debt%20to%20GDP.jpg?itok=sjdJoasg

Since measures of indebtedness / over-extension represent roughly 30% of the FICO credit score calculation, this de-leveraging will, appropriately, lead to higher credit scores.

Some of the increase in average FICO scores is also a reflection of the relatively benign macro-economy to which consumers have been exposed in recent years, according to Goldman. Past payment history is the largest driver of most credit score formulas, and low current delinquency rates help drive credit scores higher even if these low rates of delinquency are partly explained by the strong economy.

https://www.zerohedge.com/s3/files/inline-images/consumer%20delinquency%20rates%20gs.jpg?itok=bxbOOTL0

With these two considerations in mind, Goldman cautions that in light of the strong economy and lack of a (recent) stressful economic scenario, with unemployment rates now below 4%, high credit scores for 2019 vintage borrowers might overstate credit quality.

Echoing this point, Cris deRitis, Moody’s deputy chief economist said that “borrowers with low credit scores in 2019 pose a much higher relative risk. Because loss rates today are low and competition for high-score borrowers is fierce, lenders may be tempted to lower their credit standards without appreciating that the 660 credit-score borrower today may be relatively worse than a 660-score borrower in 2009.”

“Borrowers’ scores may have migrated up, but inherently their individual risk, and their attitude towards credit and ability to pay their bills, has stayed the same. You might have thought 700 was a good score, but now it’s just average,” deRitis continued.

Indeed, despite the record high average FICO score, cracks are already starting to show on the surface: there has been a rising number of missed payments by borrowers with the highest risk, despite the past decade of “growth”. And now that the economy is starting to show weakness, these delinquencies could accelerate and lead to larger than expected losses.

Ethan Dornhelm, vice president of scores and predictive analytics at FICO doesn’t seem to notice score inflation and blames the issue on underwriters: “The relationship between FICO score and delinquency levels can and does shift over time. We recognize there’s a lot more context you can obtain beyond a consumer’s credit file. We do not think that score inflation is the issue, but the risk layering on underwriting factors outside of credit scores, such as DTI, loan terms, and even trends in macroeconomic cycles, for example.”

Marketplace and peer to peer lending has also been showing signs of stress. Missed payments and writedowns increased last year, according to NY data and analytic firm PeerIQ. “We don’t see the purported improvement in underwriting just yet,” PeerIQ wrote in a recent report.

And the pressure isn’t just showing up in auto loans and marketplace lending. Private label credit cards, those issued by stores, instead of big banks, saw the highest number of missed payments in seven years last year. “As an investor it’s incumbent on you to do that deep credit work, which means you have to know as much as possible about how things should pay off or default”, said Michelle Russell-Dowe, who invests in consumer asset-backed securities at Schroder Investment Management. “If you don’t think you’re being paid for the risk, you have no business investing in it.”

Of course, with FICO scores rising to new all time highs, it is only logical to expect that virtually no underwriter will actually bother to understand the underlying credit risk(s), which is also why consumers will likely be saddled with even more debt just as the broader economy is set to turn. The only question is whether such inflation FICO scores will be the catalyst behind the next debt-driven meltdown.

Source: ZeroHedge

HUD Planning Crackdown On Illegal Aliens Taking Advantage Of Public Housing

The Department of Housing and Urban Development (HUD) will be proposing a new rule that further prevents illegal immigrants from taking advantage of public housing assistance, The Daily Caller has learned.

https://i0.wp.com/www.gopusa.com/wp-content/uploads/2019/04/section_8.jpg

Section 214 of the Housing and Community Development Act prevents non-citizens from obtaining financial housing assistance. However, the presence of so-called “mixed families” has complicated the enforcement of the rule. Illegal immigrants have previously been able to skirt the restrictions by living with family members who are U.S. citizens and receive subsidized housing through HUD. (RELATED: Trump’s HUD Official Moves To The Projects In The Bronx)

HUD intends to roll out a proposal over the next few weeks that prohibits any illegal immigrant from residing in subsidized housing, even if they are not the direct recipient of the benefit. HUD currently estimates that tens of thousands of HUD-assisted households are headed by non-citizens.

Families who are caught gaming the system by allowing illegal immigrants to stay with them either have to comply with the new rule or they will be forced to move out of their residence.

Households will be screened through the Systematic Alien Verification for Entitlements, or “SAVE,” program.

An administration official told the Caller that this is a continuation of the president’s “America First” policies.

“This proposal gets to the whole point Cher was making in her tweet that the President retweeted. We’ve got our own people to house and we need to take care of our citizens,” the official said. “Because of past loopholes in HUD guidance, illegal aliens were able to live in free public housing desperately needed by so many of our own citizens. As illegal aliens attempt to swarm our borders, we’re sending the message that you can’t live off of American welfare on the taxpayers’ dime.”

According to HUD, there are currently millions of American citizens on the waitlist for government-assisted housing because the department does not have enough resources to provide every eligible family with financial assistance.

The president has repeatedly lamented the drain that illegal immigration has on resources for American families.

Source: by Amber Athey | The Daily Caller

***

HUD moves to cancel illegal aliens’ public housing access

https://martinhladyniuk.com/wp-content/uploads/2019/04/03c40-1402448651971.jpg


The Trump administration is proposing a new rule to try to block some 32,000 illegal immigrant-led families from claiming public housing assistance, saying it’s unfair to hundreds of thousands of Americans who are stuck on waiting lists.

College (As We Knew It) Is Broken In America

The system of higher education in the United States is being rebuilt from the foundation and we’ve only just started to see the impact of this dramatic transformation.

https://www.zerohedge.com/s3/files/inline-images/1_bLQ43HLQRp1r6KGs2G7PsA.jpeg?itok=8ZUw2Azc

  • The way students and parents pay for college is changing
  • The methods and the places students learn are changing (and have been for a while)
  • Our culture is changing to finally accept that “traditional” 4-year college isn’t the answer for everyone

(Alex Mitchell) But before we talk about all of the changes that are happening in higher education right now, let’s talk about why college is, to put it simply, broken in the United States.

College is Broken.

It’s impossible to miss the many ways college is broken today. And I’m not just talking about the high profile bribery scandal that broke several weeks ago.

https://www.zerohedge.com/s3/files/inline-images/0_I8t9FuX3aOfz0Xf4.jpg?itok=23sE11h7

While parents paying hundreds of thousands to millions of dollars to guarantee college admission through a “side door” is concerning, it pales in comparison to these other indicators of college broken-ness.

1. Student Loans Are Crippling Tens of Millions

https://www.zerohedge.com/s3/files/inline-images/1_XWCrOtVijQ8gqcEWKuWMBA.jpeg?itok=-WUgAjr1

44.2 Million Americans currently are carrying close to $1.5 Trillion in student loan debt (this is ~20% of the US adult population).

Even more astonishing, over 11% of these loans are delinquent (90+ days without payment or in default).

This delinquency rate is >5x the credit card delinquency rate!

Student loans have become such a burden that companies have been started to offer student loan repayment as a fringe benefit: Goodly.

Shout out to Goodly for helping the many already in debt, but we need to stop the problem at the source too!

Sources: Federal ReserveBloomberg

2. Tuition Increases Are Relentless

From 1988 to 2008, tuition increased on average by 3.5% per year. From 2008 to 2018, tuition continued to increase at a still-suffocating 3% per year.

In 1998, tuition at a private 4-year college was 77% of the average male income in the United States.

By 2016, this had increased to 116%.

On the public college side, the increase is even more dramatic. In 1998, the costs averaged 29% of the average male income in the United States,increasing to 52% in 2016.

Incomes simply have not kept pace with tuition increases.

Source: ProCon.org

3. Incentives Are Distorted Between Colleges and Students

Students continue to attend college and continue to take on these significant loans because they believe they are making a good investment. College graduates earn substantially more than High School graduates over the course of their career, right? Correct, but…

The fundamental problem is that if the college they attend turns out to be a bad investment, as a growing number of private 4-year colleges do, only the student pays this penalty (and they pay a BIG, often lifelong, one).

The college already got paid by either the government or the student loan company and there is simply no penalty for their lack of performance in student education and career placement (save for some very limited publicly funded university penalties).

There are also no meaningful incentives from the government to provide education in areas where jobs are in the highest demand.

The only true incentive these colleges have is one that is too distant for many: The ability to continue to recruit new students who will pay their ever-increasing tuition rates.

How College is Changing Right Now

Where And How You Learn

https://www.zerohedge.com/s3/files/inline-images/1_FnaWQrD-Ck6oo3kZDTDewA.png?itok=irWRrRA8

  • MOOCs: Massive Open Online Courses aren’t new, but the depth of courses they offer continues to increase dramatically. Between EdX, Coursera, Khan Academy, and Udacity you can learn almost anything from anywhere for free.
  • Code Schools (v2!): Code Schools have already gone through one wave of evolution with ineffective programs and schools failing, new models for sustainable funding and profitability emerging and consolidation accelerating.
  • Technical Trade Schools: Technical school used to mean learning a trade like Carpentry or studying as an Electrician’s apprentice. This concept has been reinvigorated with companies like NextGenT that offer many technical certificate programs in high demand fields like cybersecurity.

How You Pay

https://www.zerohedge.com/s3/files/inline-images/0_EY83JvQcUR1AlUoW.png?itok=xFR1KAN3

  • ISAs: Income Share Agreements. Instead of paying tuition up front, a student agrees to pay a percentage of their future income to the school or lender. There is usually an income “floor” that the student must be above in order for the income share to take effect after graduation. There is also usually a repayment “ceiling” (so the former student doesn’t end up paying an obscene amount if they get a high-salary position immediately out of school). Companies like Vemo Education have started to bring this payment model to significant numbers of both code schools and traditional 4-year colleges.
  • Get Paid to Learn: Several companies are taking the idea of the ISA a step further. In addition to paying nothing upfront, these companies are actually paying you a salary to learn. They are betting on high demand career fields like software development and data science and trying to make it as easy as possible for top candidates to join their schools. Several “get paid to learn” companies include Lambda SchoolModern Labor, and CareerKarma.

Cultural Changes and Pressures

https://www.zerohedge.com/s3/files/inline-images/1__PoBC5GGlnmj_-WPLl9bzA.jpeg?itok=dyAes7AM

  • Reducing the 4 Year College “Pressure”: It’s taken a long time, and particularly affluent parts of our country are still pretty resistant, but code schools and alternative higher education options have begun to gain acceptance as a better option for meaningful percentages of high school graduates.

Thank you for reading. If you’re enjoying this post so far, I think you would enjoy my new book, Disrupt Yourself. For a limited time, I’m offering a free pre-release chapter.

Claim yours now here: I want a free chapter of Disrupt Yourself!

Prediction: College in 10 Years…

  • Mid-tier private colleges cease to exist
  • Code schools will (continue to) consolidate dramatically
  • All colleges remaining offer ISAs and many offer “get paid to learn” options
  • Community College still exists as the low cost higher education option and may even grow in influence and size
  • A small set of top code schools achieve “Ivy League” status and diversify to offer robust curriculum for developers, data scientists, designers, product managers and more (essentially the tech company talent stack)
  • Student loan debt collapses in value as defaults skyrocket

Prediction: College in 20 Years…

  • Ivy League and top research universities are only “old guard” that remain
  • Community college is free everywhere in the USA as a guaranteed, robust, public secondary education (in many states this is the case already)
  • All colleges that remain offer both ISAs and “you get paid to learn” options
  • Code schools look like colleges and colleges look like code schools to the point where they are hard to differentiate

College is Changing and It’s a Good Thing

College is broken today.

But fortunately, many startups, companies, and public figures are starting to pay attention and build the next generation of higher education.

It’s going to be disruptive, it’s going to be scary (at times), but with the right minds focused on this huge problem, our country will build a secondary education system that has:

  • Free options that are robust (Community College)
  • Stronger alignment with high-demand careers
  • True incentive alignment between students and education providers
  • Little to no debt for students (!)

Source: ZeroHedge

***

Warren Proposes $640 Billion Student Debt Forgiveness, Free College

https://www.zerohedge.com/s3/files/inline-images/warren%20ok.jpg?itok=1l-bbRLU


“It’s a problem for all of us”

Confidence In Higher Education Plummets

Confidence in higher education in the United States has dropped significantly since 2015, according to polling company Gallup, which notes that it’s the worst-performing institution they measure

https://www.zerohedge.com/s3/files/inline-images/debt%20college.jpg?itok=TYG5HbL4

The crisis in confidence coincides with a similar decline in the public’s view that higher education is affordable and available to those who need it, according to the report – suggesting that affordability and access are linked to the faith people have in the institution of higher learning.

https://www.zerohedge.com/s3/files/inline-images/confidence_0.png?itok=yJOS-iL2

The waning confidence in higher education isn’t limited to the general public either; academics have begun to lose faith as well

Concerns about the future of higher education also exist within academia. College and university trustees and board members — many of whom are intimately familiar with higher ed’s services, operations and impact — remain concerned about the industry’s future, despite being more confident in their own institution’s future. The AGB 2018 Trustee Index, a recent study conducted by the Association of Governing Boards and Gallup, finds that three in four trustees (74%) are concerned or very concerned about the future of higher education in the U.S. Their concerns remain focused largely on one main challenge: affordability. –Gallup

What do college and university trustees point to as the top issues causing the drop in public confidence? Negative media reports about student debt (72%) and news reports on the cost of tuition (64%). To that end, more than half of trustees (58%) say their top concern about the future of higher education is the cost.

https://www.zerohedge.com/s3/files/inline-images/college%20students.jpg?itok=YQ4oIGXe

When it comes to affordability, the National Center for Education Statistics estimates that the total cost of tuition, fees and living expenses rose 28% between 2005/2006 – 2015/2016 in the United States after account for inflation, while enrollment across all higher education sectors dropped by 1.4% in 2018, which Gallup says is consistent with recent trends. 

Many colleges, universities and even states are attempting to address affordability concerns and related enrollment decreases by freezing or reducing tuition costs. For the seventh year in a row, Purdue University has frozen its tuition rates. Western Governors University has bucked the enrollment trend in higher education for a variety of reasons, including because of its commitment to keep costs contained. In the past five years, WGU has increased the cost of annual tuition by only $600, while total enrollment has more than doubled, to over 100,000 students. –Gallup

The solution? 

Restoring confidence in higher education – and boosting enrollment – can be accomplished by restoring affordability while improving the quality of higher education, according to the report. 

A 2015 Gallup report revealed a clear relationship between student debt levels and graduates’ perceptions that their degree was ‘worth it.’ Graduates drowning in student loan debt were obviously less likely to consider their education a worthwhile investment. 

However, and fortunately for higher education, a high-quality experience in school blunted the negative effect of student debt on graduates’ beliefs that their undergraduate experience was worthwhile, proving that the significant investment can be worth it for some grads. The AGB 2018 Trustee Index also shows that trustees have been asked to make changes to the academic programs offered at their institution to better respond to 21st-century needs. Half of trustees say senior administrators have asked them to increase or introduce STEM programs, and about one-third say they have been asked to increase or introduce applied or experiential learning programs. –Gallup

While the American public largely still believes that higher education is the way to achieve a better life through higher-paying jobs, institutions must figure out how to provide a quality education without saddling grads with debt that takes decades to pay off. 

Source: ZeroHedge

The Biggest Home Price Drops Are In These 10 Cities

As the US housing market deteriorates, the shift to a buyer’s market accelerates, says Knock, a home trade-in online service. The 2Q19 National Knock Deals Report predicts that U.S. markets will have the highest percentage of homes that sell at discount versus the list price, in many years.

https://www.zerohedge.com/s3/files/inline-images/price%20cuts%20sign.jpg?itok=TsLLIrmQ

Knock projects that 75% of current listings will sell below their list price within the current quarter. While this is slightly lower than the 1Q19 forecast of 77%, it reflects a significant y/y increase (7% y/y) as the housing market starts to turn.

“The Q1 Forecast, which may have seemed to be a big jump over 2018, was actually much closer to the reality of home sales in Q1 2019 than home sales at the same time last year, or even at the end of 2018,” said Jamie Glenn, Co-Founder and COO at Knock. “It’s clear that we’re at an inflection point in the shift to more of a buyer’s market, and the Q2 Forecast provides insights into where and how buyers can capitalize on that.”

Six out of the ten cities on the list were located in Southern markets. Knock said the increase of Southern markets is a 40% increase over the last quarter.

Providence, RI; Cleveland, OH; New York, NY; and Chicago, IL were the other four markets that made the list.

The report noted that the four markets in Florida ( Miami, Tampa, Jacksonville, and Orlando) were hit the hardest by price reductions.

In Miami, the report says about 88% of single-family home sales in 1Q19 sold below original list prices. Average days on the market of Miami homes sold in 1Q19 were 82, which plays a significant role in discounting.

https://www.zerohedge.com/s3/files/inline-images/home%20price%20cuts%202q.png?itok=S3qDz-xT

“This seems like an interesting telltale that the market is shifting in favor of buyers,” Knock Chief Executive Officer Sean Black told Bloomberg in a phone interview. “Florida is a popular secondary home destination so it tends to drop faster in a downward market because it’s losing buyers, both domestically and internationally. Everybody needs a primary home. Not everybody needs a second home.”

Back in September, we outlined that “existing home sales have peaked, reflecting declining affordability, greater price reductions, and deteriorating housing sentiment.”

https://www.zerohedge.com/s3/files/inline-images/Screen-Shot-2018-09-22-at-7.20.10-PM_1.png?itok=rTP3ODfl

Greater price reductions, more inventory, and more days on the market is a recipe for a significant downward impulse in home prices across the country.

So if you haven’t called your realtor – maybe now is the time before the market goes bust.

https://youtu.be/sSYcHKw2XWM?t=97

Source: ZeroHedge

Armed Realtors Face Off With Menacing Attacker (VIDEOS)

Two Ohio realtors with concealed carry permits came up against an armed man inside one of their empty properties who said he was going to attack them. The real estate agents, Kyle Morrical and his father Phil Morrical III, encountered Derek Miller inside a vacant house in Hamilton that had been reportedly broken into the day before.

“He told us he had a gun and a knife. He was either going to shoot us or stab us and he punched me in my face,” Kyle told Local 12.

That’s when Kyle pulled his gun and the father-and-son pair held the attacker down while a neighbor called the police. Miller was taken into custody and charged with assault, menacing and trespassing.

The Morrical’s, who showed off a collection of compact semi-autos by Glock, Ruger, and S&W to local media, said they go to the range at least once a month to practice.

“I hoped I would never have to use it because it’s one of those things that you hope you never have to use, but you have it just in case,” Kyle said.

According to the National Association of Realtors, their group’s 2018 safety report found that 43 percent of members choose to carry self-defense weapons. The group represents some 1.3 million members.

The National Rifle Association profiled a group of real estate agents in Ohio in 2015 who chose to get their concealed handgun license following the murder of two realtors on the job.

Source: by Chris Eger | Guns.com

Will “Inflated” FICO Scores Be The Catalyst For The Next Meltdown

Consumer credit scores have been artificially inflated during the past decade and are covering up a very real danger lurking behind hundreds of billions of dollars in debt. And when Goldman Sachs is the one ringing the alarm bell, you know the issue may actually be serious.

Joined by Moody’s Analytics and supported by “research” from the Federal Reserve, the steady rise of credit scores during our last decade of “economic expansion” has led to a dangerous concept called “grade inflation”, according to Bloomberg

Grade inflation is the idea that debtors are actually riskier than their scores indicate, due to metrics not accounting for the “robust” economy, which may negatively affect the perception of borrowers’ ability to pay back bills on time. This means that when a recession finally happens, there could be a larger than expected fallout for both lenders and investors. 

There are around 15 million more consumers with credit scores above 740 today than there were in 2006, and about 15 million fewer consumers with scores below 660, according to Moody’s.

On the surface, this disappearance of subprime borrowers is good news. But is there more than meets the eye to the American consumer’s FICO score renaissance?

Cris deRitis, deputy chief economist at Moody’s Analytics said: “Borrowers with low credit scores in 2019 pose a much higher relative risk. Because loss rates today are low and competition for high-score borrowers is fierce, lenders may be tempted to lower their credit standards without appreciating that the 660 credit-score borrower today may be relatively worse than a 660-score borrower in 2009.”

https://www.zerohedge.com/s3/files/inline-images/credito.png?itok=JNm0oVR2

The problem is most acute for smaller firms that tend to lend more to people with poor credit histories. Many of these firms rely on FICO scores and are unable to account for other metrics, like debt-to-income levels and macroeconomic data. Among the most exposed outstanding debts are car loans, consumer retail credit and personal loans that are doled out online. These types of debt total about $400 billion – and about $100 billion of that sum has been bundled into securities that have been sold to ravenous yield chasers “investors”. 

Meanwhile, cracks are already starting to show on the surface: there has been a rising number of missed payments by borrowers with the highest risk, despite the past decade of “growth”. And now that the economy is starting to show weakness, these delinquencies could accelerate and lead to larger than expected losses. 

Goldman Sachs analyst Marty Young said in an interview: “Every credit model that just relies on credit score now – and there’s a lot of them – is possibly understating the risk. There are a whole bunch of other variables, including the business cycle, that need to be taken into account.”

https://www.zerohedge.com/s3/files/inline-images/csf.png?itok=-GFXI6V6

FICO credit scores are used by more than 90% of U.S. lenders to determine whether a borrower is an acceptable risk. Most scores range from 300 to 850, with a higher score purporting to show that someone is more likely to pay back their debts. Some big banks and lenders have recognized the problem and have included other factors in their underwriting decisions. 

“Borrowers’ scores may have migrated up, but inherently their individual risk, and their attitude towards credit and ability to pay their bills, has stayed the same. You might have thought 700 was a good score, but now it’s just average,” deRitis continued.

Ethan Dornhelm, vice president of scores and predictive analytics at FICO magically doesn’t seem to notice score inflation and blames the issue on underwriters: “The relationship between FICO score and delinquency levels can and does shift over time. We recognize there’s a lot more context you can obtain beyond a consumer’s credit file. We do not think that score inflation is the issue, but the risk layering on underwriting factors outside of credit scores, such as DTI, loan terms, and even trends in macroeconomic cycles, for example.”

Goldman’s Young attributes the rise in missed auto loan payments to the change in scores. The Federal Reserve Bank of New York said the number of auto loans at least 90 days late topped 7 million at the end of last year.

https://www.zerohedge.com/s3/files/inline-images/DBC.png?itok=NjTepdPp

Michelle Russell-Dowe, who invests in consumer asset-backed securities at Schroder Investment Management, said: “Some deep-subprime auto lenders may be deeply reliant on credit scores, although there’s a pretty wide range within the auto industry of how lenders use scores and other metrics. For marketplace lending, regardless of the statistics you collect on borrowers, there is something adversely selective about somebody looking for loans online.”

Marketplace and peer to peer lending has also been showing signs of stress. Missed payments and writedowns increased last year, according to NY data and analytic firm PeerIQ. “We don’t see the purported improvement in underwriting just yet,” PeerIQ wrote in a recent report.

And the pressure isn’t just showing up in auto loans and marketplace lending. Private label credit cards, those issued by stores, instead of big banks, saw the highest number of missed payments in seven years last year.

“As an investor it’s incumbent on you to do that deep credit work, which means you have to know as much as possible about how things should pay off or default. If you don’t think you’re being paid for the risk, you have no business investing in it,” Russell-Dowe concluded, stating what should be – but isn’t – the obvious.

Source: ZeroHedge

Globalist Utopia: Negative Rates Are Coming, Whether You Like It Or Not

There is nothing that a human mind can’t conceive. It can shoot for the stars or dive in the ocean which twinkles in the shadows of stars and ascend back with sparkling mind bearing uncanny ambition, only to float contended.  

https://www.zerohedge.com/s3/files/inline-images/the-wizard-of-oz.jpg?itok=6D0neJ7E(by Ritesh Jain via WorldOutOfWhack.com)

Today, we live in fear of losing wealth, we worry what economic consequences would do to our cash, we look through a microscope and scrutinize every word, every policy, every regulation or find something to put above ‘every’ and list out the glaring negatives with a slight trace of approval. If only one could notice the lens of the microscope, would then one could tell reel and real apart.

Such is the case of negative interest rates. It is dealt differently by different flock of loaded individuals, generally in ways which would not only prevent losses but essentially gain cash. This flock stands on one side of the transaction contemplating means to win regardless of the loss that still deliberating other doomed flock endures. Well, this is how the world works. It is a Bernoulli trial. But there exists a splash of humble wit folks floating beneath the starry sky delighted by the victory of each one and beaten down none.

Theory? Without thinking too much, negative rates indicate that the economy is unable to generate sufficient income to service its debt. Almost always, all roads leads us back to debt sustainability levels. In order for an economic system to reduce debt, it requires growth or inflation or currency devaluation. For an economic system to exercise one of the two (growth not included), capital transfer is to be facilitated. This capital movement in negative rates environment is from the savers to the borrowers. Your invested value, the money you gave to borrowers would have a value lower than the face value. Barbaric! Savers should be the winners not the borrowers!

So each flock as per their liking would act in a way that makes them the gaining side. In real world scenario, one flock could be investors who when yields falls even deeper into negative territory scoop a profit through capital gain. Flock of foreign investors may try to earn through currency appreciation. Another flock would focus on real rates even though they are negative as that would preserve their capital under deflationary conditions when nominal yields would decrease their capital. Who would want that!

Investopedia gave an example, “In 2014, the European Central Bank (ECB) instituted a negative interest rate that only applied to bank deposits intended to prevent the Eurozone from falling into a deflationary spiral.”

Let’s recall a real practical example. The case of Switzerland.

Paul Meggyesi of JP Morgan said, “The defacto negative interest rate regime lasted until October 1973. The negative interest rate was re-introduced in November 1973 at 3% per quarter and then increased to 10% per quarter in February 1978. All though this period capital inflows were being sustained by the global monetary turmoil/inflation that characterized the first years of floating exchange rates, not to mention the SNB’s singular focus on promoting monetary and price stability through money supply targeting. Ultimately the SNB abandoned these purely technical attempts to curb capital inflows and embraced a much more effective policy of currency debasement, namely it abandoned money supply targeting in favor of an explicit exchange rate target that required huge amounts of unsterilized intervention, money supply expansion and ultimately inflation. (Suffice to say this policy lasted only until 1982, when the Swiss realized that inflation was too high a price to pay for a weak currency).”

https://www.zerohedge.com/s3/files/inline-images/2019-04-06_8-34-46.jpg?itok=3SQ7hMZd

He continued “Negative interest rates will only deter capital inflows if they are sufficiently large to offset the capital gain an investor expects to earn through capital appreciation. CHF rose by 8% in nominal and real terms in 1972-1973. Appreciation in 1973 – 1978 was 62% in nominal and 29% in real terms.”

https://www.zerohedge.com/s3/files/inline-images/2019-04-06_8-35-22.jpg?itok=y2bASUGG

In fact, during global financial crisis many central banks reduced their policy interest rates to zero. A decade later, today, still many countries are recovering and have kept interest rates low. Severe recessions in the past have required 3 – 6 percent point cuts in interest rates to revive the economy. If any crisis were to happen today, only a few countries could respond to the monetary policy. For countries with already prevailing low or negative interest rates, this would be a catastrophe.

https://www.zerohedge.com/s3/files/inline-images/2019-04-06_8-36-01.jpg?itok=WTy8K9lG

Today, around $10 trillion of bonds are trading at negative yields mainly in Europe and Japan as per Bloomberg.

https://www.zerohedge.com/s3/files/inline-images/bfmB6CE.jpg?itok=0Qt-XvS1

Poisons have antidotes, and sometimes one need to gulp down the poison to witness the mystique surrounding the life and glide with accidental possibilities, the possibilities which one wouldn’t seek if they remain wary of novel minted cure. 

Here enters a splash of humble wit folks! They want a win – win. So these folks came up with an idea, an idea with legal and operational complication but they have swamped themselves with research to find ways to not stumble in future and yes they do have a long way to go but we have a start. These folks are our very adored IMF Staff.!

They are exploring an option that would help central banks make ‘deeply negative interest rates’ feasible option.

Excerpt from their article ‘Cashing In: How to make Negative Interest Rates Work’:

“In a cashless world, there would be no lower bound on interest rates. A central bank could reduce the policy rate from, say, 2 percent to minus 4 percent to counter a severe recession. When cash is available, however, cutting rates significantly into negative territory becomes impossible.”

“…Cash has the same purchasing power as bank deposits, but at zero nominal interest. Moreover, it can be obtained in unlimited quantities in exchange for bank money. Therefore, instead of paying negative interest, one can simply hold cash at zero interest. Cash is a free option on zero interest, and acts as an interest rate floor.

Because of this floor, central banks have resorted to unconventional monetary policy measures. The euro area, Switzerland, Denmark, Sweden, and other economies have allowed interest rates to go slightly below zero, which has been possible because taking out cash in large quantities is inconvenient and costly (for example, storage and insurance fees). These policies have helped boost demand, but they cannot fully make up for lost policy space when interest rates are very low.”

https://www.zerohedge.com/s3/files/inline-images/2019-04-06_11-47-05.jpg?itok=33IB-Oyu

“… in a recent IMF staff study and previous research, we examine a proposal for central banks to make cash as costly as bank deposits with negative interest rates, thereby making deeply negative interest rates feasible while preserving the role of cash.

The proposal is for a central bank to divide the monetary base into two separate local currencies—cash and electronic money (e-money).

E-money would be issued only electronically and would pay the policy rate of interest, and cash would have an exchange rate—the conversion rate—against e-money. This conversion rate is key to the proposal. When setting a negative interest rate on e-money, the central bank would let the conversion rate of cash in terms of e-money depreciate at the same rate as the negative interest rate on e-money. The value of cash would thereby fall in terms of e-money.

To illustrate, suppose your bank announced a negative 3 percent interest rate on your bank deposit of 100 dollars today. Suppose also that the central bank announced that cash-dollars would now become a separate currency that would depreciate against e-dollars by 3 percent per year. The conversion rate of cash-dollars into e-dollars would hence change from 1 to 0.97 over the year. After a year, there would be 97 e-dollars left in your bank account. If you instead took out 100 cash-dollars today and kept it safe at home for a year, exchanging it into e-money after that year would also yield 97 e-dollars.

At the same time, shops would start advertising prices in e-money and cash separately, just as shops in some small open economies already advertise prices both in domestic and in bordering foreign currencies. Cash would thereby be losing value both in terms of goods and in terms of e-money, and there would be no benefit to holding cash relative to bank deposits. This dual local currency system would allow the central bank to implement as negative an interest rate as necessary for countering a recession, without triggering any large-scale substitutions into cash.”

Negative rates are coming whether we like it or not. There is only so much growth we can get in steady state among rising debt levels. The only hurdle to implementing negative rates is currency in circulation and that’s why more and more countries are trying to outlaw cash. Interesting and profitable times ahead for those who understand the brave new world.

Source: ZeroHedge

Rollercoaster! Global Economic Growth (G10, US, Emerging) Sliding Down Together

The global economy is in a rollercoaster pattern.

And unfortunately the G10, US and Emerging nations are on the downward side.

https://confoundedinterestnet.files.wordpress.com/2019/04/rollercoaster.jpg

This might explain Larry Kudlow’s call for a 50 bps drop in the Fed Funds Target Rate. At least Trump’s nominee for The Fed’s Board of Governors was previously the President of the Kansas City Federal Reserve. And CEO of Godfathers Pizza! Conditional on the US Senate approving his appointment, “Welcome to the party, pal!”

Source: Confounded Interest

***

This week in politicks…

https://youtu.be/jUEeFXSiPCU


Global Trade Growth Slashed Again As Trade Tensions Persist

The World Trade Organization published a new report that shows world trade is projected to “face strong headwinds” into 2020.

https://www.zerohedge.com/s3/files/inline-images/2019-04-03_09-07-12.png?itok=6L_Pee-u

WTO economists expect merchandise trade volume growth to drop to 2.6% in 2019, down from 3% last year. The report said a rebound in global trade is possible if trade tensions dramatically ease.

https://www.zerohedge.com/s3/files/inline-images/chart%201%20world%20merchandise.png?itok=HNHmzWzR

The bearish forecast for 2019/2020 marks the second consecutive year that WTO economists revised their outlook and also follows similar warnings from the World Bank and the International Monetary Fund.

https://www.zerohedge.com/s3/files/inline-images/tariff%20man.jpg?itok=--3SBv2f

“It is increasingly urgent that we resolve tensions and focus on charting a positive path forward for global trade which responds to the real challenges in today’s economy – such as the technological revolution and the imperative of creating jobs and boosting development. WTO members are working to do this and are discussing ways to strengthen and safeguard the trading system. This is vital. If we forget the fundamental importance of the rules-based trading system we would risk weakening it, which would be a historic mistake with repercussions for jobs, growth and stability around the world,” Azevedo said.

The report said current forecasts reflect downgraded GDP projections for North America, Europe, and Asia —  mostly due to waning effects of fiscal stimulus by the Trump administration.

https://www.zerohedge.com/s3/files/inline-images/global%20pmi.png?itok=alOJjjO7

WTO economists noted a “phase-out” of monetary stimulus in Europe and a continuing economic transition of China’s economy from manufacturing to services.

The reported noted that trade growth severely waned in 2H18 by several factors, including several rounds of tariffs and retaliatory tariffs affecting hundreds of goods, an already slowing Chinese economy, volatility in financial markets, and tighter monetary conditions by Central Banks.

Forward-looking trade indicators turned negative in 1Q19, including WTO’s World Trade Outlook Indicator (WTOI). WTOI index dropped to 96.3, below its baseline value of 100, indicating that the global slowdown will persist for some time.

https://www.zerohedge.com/s3/files/inline-images/wtoi%20chart_0.jpg?itok=bDQVUR5b

The sustained loss of trade momentum highlights the urgency of the Trump administration to reduce trade tensions, which together with the rise of nationalism and financial volatility could deepen the synchronized global slowdown well into 2020.

Source: ZeroHedge

The Hidden Cost Of Losing Local Mom-And-Pop Businesses

What cannot be replaced by corporate chains is neighborhood character and variety.

https://www.zerohedge.com/s3/files/inline-images/2019-04-03_9-46-32.jpg?itok=arRLQ1oM

There is much more to this article than first meets the eye: In a Tokyo neighborhood’s last sushi restaurant, a sense of loss

“Eiraku is the last surviving sushi bar in this cluttered neighborhood of steep cobblestoned hills and cherry trees unseen on most tourist maps of Tokyo. Caught between the rarified world of $300 omakase dinners and the brutal efficiency of chain-restaurant fish, mom-and-pop shops like it are fast disappearing.

Chef Masatoshi Fukutsuna and his wife, Mitsue, smile without a word. In the 35 years since they opened up shop, the couple has seen many of their friends move away for a job or family, only to return decades later, often without the job or the family, their absence unspoken.

Absence is a part of life here on what remains of the Medaka shopping street, a road so narrow that cars have to drive up onto the sidewalk to let another vehicle pass.

Once the sky turns pink and the sun sets, the street descends into shadow, save for the faintest glow from halogen lamp posts.

It’s a neighborhood in twilight. More like it are scattered across this city, their corner cafes and stores far from the neon blare of the famous shopping districts. The number of independent, family-owned sushi bars in Tokyo has halved to 750 in the last decade, a trade association says, driven out of business by fast-food joints and a younger generation that doesn’t want to inherit them.

“People would rather pay 100 yen for a plate of sushi at a really cheap place or they’d shell out tens of thousands of yen to go to a famous sushi restaurant in Ginza that they heard about on television,” says the chef, absentmindedly changing the channel of the TV. “But places like ours, shops that are right in the middle, we just can’t seem to survive.”

In the U.S., and presumably elsewhere, there are other financial pressures on small businesses: the complexity of compliance with the ever-increasing thicket of regulations is constantly increasing, as are taxes and fees as local government seeks to extract more revenue from the small-business tax donkeys.

These increases in costs while revenues sag as customers seek cheaper chain meals or simply stop going out at all are a double-whammy.

But look at what’s lost in the demise of local small businesses:

— The loss of neighborhood character and variety, replaced by homogenized chains and lifeless shuttered storefronts.

— the loss of food that’s been prepared by hand with real ingredients.

— the loss of neighborhood cohesion and social circles; residents who were once recognized as individuals and who belonged to loose but important social circles are unknown in faceless chain outlets.

— the loss of local employment. Employees in chain outlets commute from distant places, and their hours and locations may change, making it impossible to know local residents.

— the loss of walkable, interesting neighborhoods. What’s there to explore or provide interest in a string of steel and glass chain outlets?

— the loss of local social gathering places. Once local neighborhood places are lost, people Belfast in a monotonous uniformity of menus and spaces.

What’s scarce and thus valuable are not fast-food outlets; what’s scarce and valuable are walkable, diverse neighborhoods of locally owned and operated stores and cafes which offer social refreshment and bonds as well as home-cooked meals.

Source: by Charles Hugh Smith | Of Two Minds

The Manhattan Housing Market Is On Its Worst Cold Streak In 30 Years

A confluence of factors ranging from stubborn sellers refusing to budge on their asks, the Trump tax plan’s SALT cap, and a glut of luxury apartments prompted sales of Manhattan real estate to drop again in the fourth quarter, according to reports published by a trio of residential brokers. By one broker’s count, Q1 marked the sixth straight quarterly drop in sales volume, the worst streak in at least 30 years.

Per the FT, sales tumbled by 11%, according to broker Stribling & Associates, by 5%, according to Corcoran, and by 2.7% for co-ops and condominium apartments, according to Douglas Elliman and real estate appraisal firm Miller Samuel.

https://www.zerohedge.com/s3/files/inline-images/Screen%20Shot%202019-04-03%20at%204.48.05%20PM.png?itok=PevIY0Zp

While the average sales price for new developments climbed a staggering 89.4% to $7.6 million, that figure was exaggerated by a single purchase: Ken Griffin’s purchase of a $240 million penthouse at 220 Central Park South, which, according to some, was the most expensive home ever sold in America. But depending on the report, the median sales price ranged from 2% lower to 3.2% higher. And although the entry level market in Manhattan – that is, apartments priced at $1 million and below – had held up for most of the past year, it has recently started to suffer.

“It’s like a layer cake,” Jonathan Miller, CEO of Miller Samuel, told CNBC. “When you have softening at the top, it starts to melt into the next layer and the next layer after that, because those buyers further down have to compete on price.”

According to one broker, sellers with unrealistic expectations are the biggest barrier to sales, because they’re refusing to adjust for the fact that listings have been piling up and sitting on the market for longer periods, giving buyers more room to negotiate, and more options. Inventory has climbed 9% over the past nine months, and there’s a glut in new developments that’s only going to get worse.

https://www.zerohedge.com/s3/files/inline-images/Screen%20Shot%202019-04-03%20at%204.47.37%20PM.png?itok=bxNvq8i5

And of course, New York City isn’t helping the market by passing an a one-time “mansion tax” on all apartments selling for $1 million or more – which is a large chunk of apartments sold in the borough. But it could have been worse: As one broker put it, the pied-e-terre tax that was briefly considered would have been a “market stopper.”

“The pied-à-terre tax would have been a market stopper, [the mansion tax] is a market dampener,” said Ms Liebman. “I don’t think New York City is acting very friendly right now to the wealthy buyers,” she said, adding that many are opting to buy in Florida and other states with lower taxes than New York.

But although higher taxes are expected to drive more would-be buyers toward rentals, the number of new leases in Manhattan was also down 3% in Q1. Meanwhile, leases climbed a staggering 38% year-over-year in Brooklyn.

As brokers in New York City and other high end markets like Greenwich, Conn. struggle with slowing sales, we imagine brokers in mid-tier markets are watching with a wary eye to see if the weakness spreads.

Source: ZeroHedge

Hedge Fund CIO: “America’s Yield Curve Inversion Can Mean One Of Three Things”

Three Worlds

America’s yield curve inversion can mean one of three things,” said (Eric Peters, CIO of One River Asset Management). “We’re either living in a world of secular stagnation and investors worry that central banks no longer have sufficient policy tools to spur growth and inflation,” he continued. “Or the economy is simply sliding toward recession and the inversion will persist until the Fed panics and spurs a recovery,” he said. “Or we’re living in a world, where the market is moving in ways that defy historical norms because of global QE. And if that’s the case, the curve is sending a false signal.”

https://www.zerohedge.com/s3/files/inline-images/TSY%20yield%20curve%203.31.jpg?itok=B16pb_qT

“If we’re sliding toward recession, then it seems odd that credit markets are holding up so well,” continued the same CIO. “So keep an eye on those,” he said. “And if the curve is sending a false signal due to German and Japanese government bonds yielding less than zero out to 10yrs, then the recent Fed pivot and these low bond rates in America may very well spur a blow-off rally in stocks like in 1999.” A dovish Fed in 1998 (post-LTCM) and 1999 (pre-Y2K) provided the liquidity without which that parabolic rally could have never happened.

https://www.zerohedge.com/s3/files/inline-images/aligator%20jaws%20march%202019_1.jpg?itok=KGvQ1sIB

“But if investors believe America is succumbing to the secular stagnation that has gripped Japan and Europe, and if they’re growing scared that global central banks are no longer capable of rescuing markets, then we have a real problem,” said the CIO. “Because a recession is bad for markets, but not catastrophic provided that central banks can step in to spur recovery. But with global rates already so low, if investors lose faith in the ability of central banks to do what they have always done, then we’re vulnerable to a stock market crash.”

Sovereignty:

Turkish overnight interest rates squeezed to 300% on Monday. Then 600% on Tuesday. By Wednesday, they hit 1,200%. Downward pressure on the Turkish lira, and the government’s efforts to punish speculators fueled the historic rise. Erdogan allegedly wants to limit lira loses ahead of today’s elections. The pressures that drove the currency lower were mainly of Turkish origin. Of course, the Turks have every right to their own economic policies, but they must bear the consequences. That’s what comes with being a sovereign state.

The Greeks and Turks are neighbors. The Turks began negotiations to join the EU in 2005, with plans to adopt the Euro after their acceptance. Those negotiations stalled in 2016. As they look across the border at their Greek neighbors now, and see their interest rates stuck at -0.40%, are they envious? Perhaps. But having witnessed the 2011 Greek humiliation, would the Turks be willing to forfeit sovereignty for the Euro’s stability and stagnation? And how do the Greeks (and Italians) feel about having forfeited their sovereignty?

Anecdote:

“Only optimists start companies,” I answered. The Australian superannuation CEO had asked if I’m an optimist or pessimist. “I see the potential for technological advances to produce abundance in ways difficult to fathom. But I also see the chance of something profoundly dark,” I continued. He observed that people seemed consumed by the latter but spend so little time on the former. “That’s good. Humans are wonderful at solving problems of our own creation. The more we worry, the less goes wrong,” I said. So he asked what worries me most?

“Not the displacement of human labor by machines, we can solve the resulting social challenges. I worry that the only thing Americans seem to agree on now is that China is our adversary.” And pressing, he asked me to list the things I admire about China. “Okay. I admire China’s work ethic, drive, ambition, economic accomplishments. They’ve overtaken us in many advanced scientific fields. I admire that very much.” He smiled and asked me to carry on. “I’m grateful for their competition. It makes us better. And I admire that they’ve evolved communism to make it work while all others failed. The world is better with diversity of thought, philosophy – diversity increases resiliency, robustness. And democratic free-market capitalism will grow stronger with a formidable competitor.” He smiled.

“But China’s system values the collective over the individual. We value the opposite. And I’m concerned the two systems cannot peacefully coexist now that we’re the world’s two largest economies. I don’t want to live under their system, I don’t want their vision of the future for my children. They probably feel the same way. Both views are valid but incompatible, and increasingly in conflict,” I explained. He nodded and said, “I don’t want that for our children either.”

Source: ZeroHedge

Guess How Much Americans Spend Drunk Shopping Online?

A new survey reveals that nearly 80% of people who drink alcohol have shopped on the web while intoxicated. 

And while the results can be hilarious, drunk shopping is a multi-billion dollar national habit

According to a survey by tech and business newsletter The Hustledrunk Americans spend approximately $45 billion per year, with an average annual spend of $444 per drunk shopper.

Most common? Clothing and shoes, while Amazon remains the shopping platform of choice. 

https://www.zerohedge.com/s3/files/inline-images/wghat%20do.jpg?itok=piw0v9tX

The findings are based on a survey of 2,174 alcohol-consuming readers between March 11-18 of this year. The average respondent was 36-years-old, and has an income of $92,000 per year, more than double the national average. Thus, The Hustle‘s wealthier readers may skew the results when extrapolated – but we’re having fun with this one. 

Overall, 79% of all alcohol-consuming respondents have made at least one drunken purchase in their lifetime — though this varies a bit based on demographics. –The Hustle

https://www.zerohedge.com/s3/files/inline-images/do-you-drunk-shop.jpg?itok=Q4piUbsb

Women (80%) are slightly more likely than men (78%) to drunk shop. This makes sense since women generally shop more than men — especially online.

Drunk shoppers also tend to be younger. Millennials outrank baby boomers by 13%, which might be attributed to the rise of e-commerce (we’ll get to this later).

Certain professionals also seem to be more inclined to shop drunk than others. We limited our data to jobs with the highest response rates then parsed out the 5 industries that are most and least likely to shop under the influence. –The Hustle

What’s the alcohol of choice while drunk shopping? Beer, followed by wine, followed by whiskey.

https://www.zerohedge.com/s3/files/inline-images/type%20of%20alcohol.jpg?itok=wHRGbqVG

Another interesting metric is that people who shop while drunk have around 10 drinks per week, while those who typically shop sober consume half as much

https://www.zerohedge.com/s3/files/inline-images/habits.jpg?itok=mEOupkNH

As far as average spent per year: 

Our average respondent reports dropping $444 per year on drunk purchases — from life-size cut-outs of Kim Jong-un to 30-pound bags of Idaho potatoes.

A little back-of-the-napkin math gives us a rough estimate of the drunk shopping market at large: There are ~130m alcohol-consuming adults in the US. In our survey findings, 79% of alcohol-consuming adults shop drunk at an average annual spend of $444. Assuming these rates hold true at a national level (purely speculative), drunk shopping is a ~$45B per year market.

Extrapolating this further, we determined the average lifetime spend on drunk purchases is $4,187 — good for a total drunken expenditure of nearly half a trillion dollars.

https://www.zerohedge.com/s3/files/inline-images/how%20much%20per%20yerar.jpg?itok=IyoCpfHL

When it comes to drunk shopping by profession, those in the fashion industry are the biggest, richest drunks – at an average of $949 spent per year, followed by writers, medical professionals and those in the fitness industry. 

Who spends the least while shopping drunk? Government workers, engineers and – in last place, those working in retail.

https://www.zerohedge.com/s3/files/inline-images/professions-1.jpg?itok=UDL6j_NE

Geographically speaking Kentucky is oddly at the top along with Connecticut. Though, the survey may have had one really rich respondent in each state that skewed the results. Who knows. 

Kentuckians top the charts with a $742 annual spend. In fact, the entire South — a region known for its fine bourbon — is a blanket of red. California, the country’s wine capital, is the lone over-achiever on the otherwise mediocre West Coast.

This bears little semblance to the CDC’s analysis of the heaviest binge-drinking states (in fact, it’s almost opposite). But it shows that the economics of drunk shopping is a more complex matter than simply parsing out where people drink the most.

https://www.zerohedge.com/s3/files/inline-images/by%20state.jpg?itok=Yy-Wkw4h

As far as platform of choice, Amazon leads the pack, followed by Ebay, Etsy, Target and Walmart. At least two of those are worth an intervention if you ever catch your friends drunk shopping at Walmart, for example.

https://www.zerohedge.com/s3/files/inline-images/by%20platform.jpg?itok=ZUX4J2zx

Clothing and shoes are the goods of choice while drunk.

Studies have shown that people who base their self-worth on appearance are more likely to imbibe alcohol, so there is some tenuous linkage here. But this also ties in with the rapid rise of the direct-to-consumer fashion industry.

Entertainment (movies, games) and tech gadgets are also popular choices — though the party train seems to abruptly halt at software (if you’ve purchased a copy of Microsoft Excel drunk, we need to talk.)

Weirdest purchases, according to The Hustle‘s readers?

  • 200 pounds of fresh, 10-foot tall bamboo
  • A World War 2-era bayonet
  • A full-size inflatable bouncy castle (“For my living room”)
  • A breast pump (“I’m a dude”)
  • A splinter that was removed from the foot of former NBA Star, Olden Polynice
  • The same vest Michael J. Fox had on in Back to the Future
  • A $2,200 pair of night vision goggles
  • Tons of international fights (Azerbaijan, Iceland, Ukraine, Tunisia)
  • An NRA membership
  • A trilogy of Satanic religious books

Who could regret $2,200 night vision goggles?

Source: ZeroHedge

70% Of Consumers With Credit Cards Say They Can’t Pay It Off This Year

Zerohedge readers who follow our monthly consumer credit updates already knew, aggregate household debt balances jumped in 4Q18. As of late December, total household indebtedness was at a staggering $13.54 trillion, $32 billion higher than 3Q18.

https://www.zerohedge.com/s3/files/inline-images/record%20high_0_0.png?itok=cP-u6juj

More troubling is that 37 million Americans had a 90-day delinquent strike added to their credit report last quarter, an increase of two million from the fourth quarter of 2017. These 37 million delinquent accounts held roughly $68 billion in debt, or roughly the market cap of BlackRock, Inc.

* * *

New evidence this week points to a further deterioration in consumer creditworthiness.

To understand the American credit card debt crisis, real estate data company Clever surveyed 1,000 credit card users earlier this month.

Using Consumer Financial Protection credit card complaint data and other forms of consumer metrics, the company was able to gain tremendous insight into the average American’s purchasing habits, dependence on credit cards, and feelings about their debt situation.

The survey found that 47% of Americans have a monthly balance on their credit card. About 30% of respondents with credit card debt believe they’ll extinguish the debt this year, leading many of the respondents stuck in an endless debt cycle.

Fifty-six percent of the respondents say they’ve had credit card debt for more than a year. About 20% estimate their debt will be paid off by 2022, while 8% were unsure about a timeline.

“It’s a big issue,” Ted Rossman, credit industry expert for CreditCards.com, tells CNBC. With credit card APR soaring to about 17.64%, a new high, the interest accrued on monthly balances can quickly add up and trap unsuspecting consumers with insurmountable debt.

https://www.zerohedge.com/s3/files/inline-images/figure%201.png?itok=WzdM47El

The U.S. recovery has been the slowest since WWII. Consumers have been stuck in the gig-economy with low wage and skill jobs. Their wages have not been able to outpace rapid inflation in groceries and rent. So many have resorted to credit cards to supplement their daily expenses. This is especially prevalent with lower-income families, defined here as those earning less than $50,000 a year. Buying groceries” ranked as the top expense that racked up people’s balances, the survey said.

About 28% of respondents say they’re fully dependent on credit cards to pay rent and utilities.

Emergency expenses were also a major contributor to credit card balances. About 30% cite medical bills and 40% say automobile repairs have moved their balances higher.

https://www.zerohedge.com/s3/files/inline-images/figure%202.png?itok=uw86eu9a

Surprisingly, there is some good news. Sixty-two percent of millennials indicate they pay their balance every month. That’s compared to just 48% of Generation X and Baby Boomers.

https://www.zerohedge.com/s3/files/inline-images/figure%203_0.png?itok=uMLvgwup

Credit cards are an integral part of developing credit and proving creditworthiness. Multiple reports show the consumer is on the cusp of a dangerous deleveraging, an ominous sign that the credit cycle has likely turned. Winter is here.

Source: ZeroHedge

“Recap & Release” – Trump Unveils Plan To End Govt Control Of Fannie, Freddie

After months (or years) of on-again, off-again headlines, President Trump is expected to sign a memo on an overhaul of Fannie Mae and Freddie Mac this afternoon, kick-starting a lengthy process that could lead to the mortgage giants being freed from federal control.

https://www.zerohedge.com/s3/files/inline-images/plante.jpg?itok=ivrIc_7m

The White House has been promising to release a plan for weeks, and its proposal would be the culmination of months of meetings between administration officials on what to do about Fannie and Freddie.

Bloomberg reports that while Treasury Secretary Steven Mnuchin has said it’s a priority to return the companies to the private market, such a dramatic shift probably won’t happen anytime soon.

In its memo, the White House sets out a broad set of recommendations for Treasury and HUD, such as increasing competition for Fannie and Freddie and protecting taxpayers from losses.

The memo itself has a worryingly familiar title (anyone else thinking 2007 housing bubble?):

President Donald J. Trump Is Reforming the Housing Finance System to Help Americans Who Want to Buy a Home

“We’re lifting up forgotten communities, creating exciting new opportunities, and helping every American find their path to the American Dream – the dream of a great job, a safe home, and a better life for their children.”

President Donald J. Trump

REFORMING THE HOUSING FINANCE SYSTEM: The United States housing finance system is in need of reform to help Americans who want to buy a home.

  • Today, the President Donald J. Trump is signing a Presidential memorandum initiating overdue reform of the housing finance system.
  • During the financial crisis, Fannie Mae and Freddie Mac suffered significant losses and were bailed out by the Federal Government with billions of taxpayer dollars.
    • Fannie Mae and Freddie Mac have been in conservatorship since September 2008.
  • In the decade since the financial crisis, there has been no comprehensive reform of the housing finance system despite the need for it, leaving taxpayers exposed to future bailouts.
    • Fannie Mae and Freddie Mac have grown in size and scope and face no competition from the private sector.
    • The Department of Housing and Urban Development’s (HUD) housing programs are exposed to high levels of risk and rely on outdated business processes and systems.

PROMOTING COMPETITION AND PROTECTING TAXPAYERS: The Trump Administration will work to promote competition in the housing finance market and protect taxpayer dollars.

  • The President is directing relevant agencies to develop a reform plan for the housing finance system. These reforms will aim to:
    • End the conservatorship of Fannie Mae and Freddie Mac and improve regulatory oversight over them.
    • Promote competition in the housing finance market and create a system that encourages sustainable homeownership and protects taxpayers against bailouts.
  • The President is directing the Secretary of the Treasury and the Secretary of Housing and Urban Development to craft administrative and legislative options for housing finance reform.
    • Treasury will prepare a reform plan for Fannie Mae and Freddie Mac.
    • HUD will prepare a reform plan for the housing finance agencies it oversees.
  • The Presidential memorandum calls for reform plans to be submitted to the President for approval as soon as practicable.
  • Critically, the Administration wants to work with Congress to achieve comprehensive reform that improves our housing finance system.

HELPING PEOPLE ACHIEVE THE AMERICAN DREAM: These reforms will help more Americans fulfill their goal of buying a home.

  • President Trump is working to improve Americans’ access to sustainable home mortgages.
  • The Presidential memorandum aims to preserve the 30-year fixed-rate mortgage.
  • The Administration is committed to enabling Americans to access Federal housing programs that help finance the purchase of their first home.
  • Sustainable homeownership is the benchmark of success for comprehensive reforms to Government housing programs.

*  *  *

Because what Americans need is more debt and more leverage at a time when home prices are at record highs and rolling over.

https://www.zerohedge.com/s3/files/inline-images/bfm7374_0.jpg?itok=3W8iDDOR

Hedge funds that own Fannie and Freddie shares have long called on policy makers to let the companies build up their capital buffers and then be released from government control.

It’s unclear whether the White House would be willing to take such a significant step without first letting lawmakers take another stab at overhauling the companies.

But not everyone is excited about the recapitalizing Fannie Mae and Freddie Mac. Edward DeMarco, president of the Housing Policy Council, warned that releasing them from conservatorship would do nothing to fix the mortgage giants’ charters or alter their implied government guarantee:

“I’m not sure what is good about recap and release,” DeMarco, a former acting director of the Federal Housing Finance Agency, said in a phone interview.

DeMarco also noted that the government stepped in to save the companies in 2008, and they continue to operate with virtually no capital. On Tuesday, DeMarco told the Senate, during the first of two hearings on the housing finance system that “recap and release should not even be on the table.”

But shareholders in the firms were excitedly buying… once again.

https://www.zerohedge.com/s3/files/inline-images/2019-03-27_11-24-00.jpg?itok=xZk_Y8LJ

Deciding the fate of Fannie and Freddie, which stand behind about $5 trillion of home loans, remains the biggest outstanding issue from the 2008 financial crisis.

Source: ZeroHedge

It’s Not Too Soon For A Fed Rate Cut, According To This Chart

  • The time between the Fed’s final interest rate hike and its first rate cut in the past five cycles has averaged just 6.6 months, according to Natixis economist Joseph LaVorgna. 
  • The bond market  has quickly pivoted, and fed funds futures are pricing in a quarter point of easing for this year, just days after the Fed forecast no more hikes for this year. 
  • LaVorgna said there are three conditions required for a Fed reversal, and that of a soft economy could soon be met.

(by Patti Domm) The bond market has quickly priced in a Federal Reserve interest rate cut this year, just days after the Fed said it would stop raising rates.

That has been a surprise to many investors, but it shouldn’t be — if history is a guide.

Joseph LaVorgna, Natixis’ economist for the Americas, studied the last five tightening cycles and found there was an average of just 6.6 months from the Federal Reserve’s last interest rate hike in a hiking cycle to its first rate cut.

The economist points out, however, that the amount of time between hike and cut has been lengthening.

“For example, there was only one month from the last tightening in August 1984 to the first easing in September 1984. This was followed by a four-month window succeeding the July 1989 increase in rates, a five-month gap after the February 1995 hike, an eight-month interlude from May 2000 to January 2001, and then a record 15- month span between June 2006 and September 2007,” he wrote.

The Fed last hiked interest rates by a quarter point in December. Last week, it confirmed a new dovish policy stance by eliminating two rate hikes from its forecast for this year. That would leave interest rates unchanged for the balance of the year, with the Fed expecting one more increase next year.

But the fed funds futures market has quickly moved to price in a full fledged 25 basis point easing, or cut, for this year.

“The market’s saying it’s going to happen in December,” said LaVorgna.

There are three conditions that need to be met for the Fed to reverse course and cut interest rates, LaVorgna said. First, the economy’s bounce back after the first quarter slump would have to be weaker than expected, with growth just around potential. Secondly, there would have to be signs that inflation is either undershooting the Fed’s 2 percent target or even decelerating. Finally, the Fed would have to see a tightening of financial conditions, with stock prices under pressure and credit spreads widening.

LaVorgna said the condition of a sluggish economy could be met.

“I don’t think the economy did very well in the first quarter just based on the fact the momentum downshifted hard from Q4, sentiment was awful, production was soft,” he said. ’I’m worried growth is close to zero in the first quarter.”

LaVorgna said he does not see much of a snap back in the second quarter.

In the current cycle, the Federal Reserve began raising interest rates in December 2015 after taking the fed funds target rate to zero during the financial crisis.

Source: by Patti Domm | CNBC

***

Americans Are Only Now Starting To Seek Higher Deposit Rates… Just As The Fed Prepares To Cut


‘Too Big To Sell’ – Boomers Trapped In McMansions As Retirement Looms

More wealthy baby boomers are finding themselves trapped in homes that are too big to sell. They want to downsize but can’t get what they paid.

This was guaranteed to happen, and did. Baby boomers and retirees built large, elaborate dream homes only to find that few people want to buy them.

https://imageproxy.themaven.net/https%3A%2F%2Fs3-us-west-2.amazonaws.com%2Fmaven-user-photos%2Fmishtalk%2Feconomics%2FzmfATcSa4EegwR7v_znq6Q%2FZVuJ-iAC0k2ooOKn4ZQXvw?w=1026&q=30&h=643&auto=format&fit=crop&crop=focalpoint&fp-x=0.5&fp-y=0.5&fp-z=1&fp-debug=false

Please consider a Growing Problem in Real Estate: Too Many Too Big Houses.

Large, high-end homes across the Sunbelt are sitting on the market, enduring deep price cuts to sell.

That is a far different picture than 15 years ago, when retirees were rushing to build elaborate, five or six-bedroom houses in warm climates, fueled in part by the easy credit of the real estate boom. Many baby boomers poured millions into these spacious homes, planning to live out their golden years in houses with all the bells and whistles.

Now, many boomers are discovering that these large, high-maintenance houses no longer fit their needs as they grow older, but younger people aren’t buying them.

Tastes—and access to credit—have shifted dramatically since the early 2000s. These days, buyers of all ages eschew the large, ornate houses built in those years in favor of smaller, more-modern looking alternatives, and prefer walkable areas to living miles from retail.

The problem is especially acute in areas with large clusters of retirees. In North Carolina’s Buncombe County, which draws retirees with its mild climate and Blue Ridge Mountain scenery, there are 34 homes priced over $2 million on the market, but only 16 sold in that price range in the past year, said Marilyn Wright, an agent at Premier Sotheby’s International Realty in Asheville.

The area around Scottsdale, Ariz., also popular with wealthy retirees, had 349 homes on the market at or above $3 million as of February 1—an all-time high, according to a Walt Danley Realty report. Homes built before 2012 are selling at steep discounts—sometimes almost 50%, and many owners end up selling for less than they paid to build their homes, said Walt Danley’s Dub Dellis.

Kiawah Island, a South Carolina beach community, currently has around 225 houses for sale, which amounts to a three- or four-year supply. Of those, the larger and more expensive homes are the hardest to sell, especially if they haven’t been renovated recently, according to local real-estate agent Pam Harrington.

The problem is expected to worsen in the 2020s, as more baby boomers across the country advance into their 70s and 80s, the age group where people typically exit homeownership due to poor health or death, said Dowell Myers, co-author of a 2018 Fannie Mae report, “The Coming Exodus of Older Homeowners.” Boomers currently own 32 million homes and account for two out of five homeowners in the country.

Not Just the South

It’s not just big houses across the Sunbelt. It’s big houses everywhere. If anything, I suspect it’s worse in the north. There is an exodus of people in high tax states like Illinois who want the hell out.

Already big homes were hard to sell. Now these progressive states are raising taxes.

Triple Whammy

  1. Millennials trapped in debt and cannot afford them
  2. Millennials wouldn’t buy them anyway because tastes have changed.
  3. Taxes are driving people away from states like Illinois

Good luck with that.

For the plight of Illinoisans, please consider Illinois’ Demographic Collapse: Get Out As Soon As You Can.

Authored by Mike Shedlock via MishTalk,
Source: ZeroHedge

The U.S. Economy Is In Big Trouble

Summary

  • Economic data is showing further negative divergence from the rally in the stock market.

  • The Census Bureau finally released January new home sales, which showed a 6.9% drop from December.

  • E-commerce sales for Q4 reported last week showed a 2% annualized growth rate, down from 2.6% in Q3.

  • The economy is over-leveraged with debt at every level to an extreme, and the Fed knows it.

  • I would say the odds that the Fed starts printing money again before the end of 2019 are better than 50/50 now.

“You’ve really seen the limits of monetary and fiscal policy in its ability to extend out a long boom period.” – Josh Friedman, Co-Chairman of Canyon Partners (a “deep value,” credit-driven hedge fund)

(Dave Kranzler) The Fed’s abrupt policy reversal says it all. No more rate hikes (yes, one is “scheduled” for 2020, but that’s fake news), and the balance sheet run-off is being “tapered,” but will stop in September. Do not be surprised if it ends sooner. Listening to Powell explain the decision or reading the statement released is a waste of time. The truth is reflected in the deed. The motive is an attempt to prevent the onset economic and financial chaos. It’s really as simple as that. See Occam’s Razor if you need an explanation.

As the market began to sell off in March, the Fed’s FOMC foot soldiers began to discuss further easing of monetary policy and hinted at the possibility, if necessary, of introducing “radical” monetary policies. This references Bernanke’s speech ahead of the roll-out of QE1. Before QE1 was implemented, Bernanke said that it was meant to be a temporary solution to an extreme crisis. Eight-and-a-half years and $4.5 trillion later, the Fed is going to end its balance sheet reduction program after little more than a 10% reversal of QE and it’s hinting at restarting QE. Make no mistake, the 60 Minutes propaganda hit-job was a thinly veiled effort to prop up the stock market and instill confidence in the Fed’s policies.

Economic data is showing further negative divergence from the rally in the stock market. The Census Bureau finally released January new home sales, which showed a 6.9% drop from December. Remember, the data behind the report is seasonally adjusted and converted to an annualized rate. This theoretically removes the seasonal effects of lower home sales in December and January. The Census Bureau (questionably) revised December’s sales up to 652k SAAR from 621k SAAR. But January’s SAAR was still 2.3% below the original number reported. New home sales are tanking despite the fact that median sales price was 3.7% below January 2018 and inventory soared 18%.

LGI Homes (NASDAQ:LGIH) reported that in January it deliveries declined year-over-year (and sequentially), and Toll Brothers (NYSE:TOL) reported a shocking 24% in new orders. None of the homebuilders are willing to give forward guidance. LGI’s average sale price is well below $200k, so “affordability” and “supply” are not the problem (it’s the economy, stupid).

The upward revision to December’s new home sales report is questionable because it does not fit the mortgage purchase application data as reported in December. New homes sales are recorded when a contract is signed. 90% of all new construction homes are purchased with a mortgage. If purchase applications are dropping, it is 99% certain that new home sales are dropping. With the November number revised down 599k, and mortgage purchase applications falling almost every week in December, it’s 99% likely that new home sales at best were flat from November to December. In other words, the original Census Bureau guesstimate was probably closer to the truth.

The chart to the right shows the year-over-year change in the number of new homes (yr/yr change in the number

https://static.seekingalpha.com/uploads/2019/3/22/saupload_Untitled-10.png

of units as estimated by the Census Bureau) sold for each month. I added the downward sloping trend channel to help illustrate the general decline in new home sales. As you can see, the trend began declining in early 2015.

Recall that it was in January 2015 that Fannie Mae and Freddie Mac began reducing the qualification requirements for government-backed “conforming” mortgages, starting with reducing the down payment requirement from 5% to 3%. For the next three years, the government continued to lower this bar to expand the pool of potential homebuyers and reduce the monthly payment burden. This was on top of the Fed artificially taking interest rates down to all-time lows. In other words, the powers that be connected to the housing market and the policymakers at the Fed and the government knew that the housing market was growing weak and have gone to great lengths in an attempt to defer a housing market disaster. Short of making 0% down payments a standard feature of government-guaranteed mortgage programs, I’m not sure what else can be done help put homebuyers into homes they can’t afford.

I do expect, at the very least, that we might see a “statistical” bounce in the numbers to show up over the couple of existing and new home sale reports (starting with February’s numbers). Both the NAR and the government will likely “stretch” seasonal adjustments imposed on the data to squeeze out reports which show gains, plus it looks like purchase mortgage applications may have bounced a bit in February and March, though the data was “choppy” (i.e., positive one week and negative the next).

E-commerce sales for Q4 reported last week showed a 2% annualized growth rate, down from 2.6% in Q3. Q3 was revised lower from the 3.1% originally reported. This partially explains why South Korea’s exports were down 19.1% last month, German industrial production was down 3.3%, China auto sales tanked 15% and Japan’s tool orders plummeted 29.3%. The global economy is at its weakest since the financial crisis.

It would be a mistake to believe that the U.S. is not contributing to this. The Empire State manufacturing survey index fell to 3.7 in March from 8.8 in February. Wall Street’s finest were looking for an index reading of 10. New orders are their weakest since May 2017. Like the Philly Fed survey index, this index has been in general downtrend since mid-2017. The downward slope of the trendline steepened starting around June 2018. Industrial production for February was said to have nudged up 0.1% from January. But this was attributable to a weather-related boost for utilities. The manufacturing index fell 0.4%. Wall Street was thinking both indices would rise 0.4%. Oops.

The economy is over-leveraged with debt at every level to an extreme and the Fed knows it. Economic activity is beginning to head off of a cliff. The Fed knows that too. The Fed has access to much more in-depth, thorough and accurate data than is made available to the public. While it’s not obvious from its public posture, the Fed knows the system is in trouble. The Fed’s abrupt policy reversal is an act of admission. I would say the odds that the Fed starts printing money again before the end of 2019 are better than 50/50 now. The “smartest” money is moving quickly into cash. Corporate insiders are unloading shares at a record pace. It’s better to look stupid now than to be one a bagholder later.

Source: by Dave Kranzler | Seeking Alpha

41% Of New York Residents Say They Can No Longer Afford To Live There

More than a third of New York residents complaint that they “can’t afford to live there” anymore (and yet they do). On top of that, many believe that economic hardships are going to force them to leave the city in five years or less, according to a Quinnipiac poll published Wednesday. The poll surveyed 1,216 voters between March 13 and 18. 

In total, 41% of New York residents say they can’t cope with the city’s high cost of living. They believe they will be forced to go somewhere where the “economic climate is more welcoming”, according to the report.

Ari Buitron, a 49-year-old paralegal from Queens said: “They are making this city a city for the wealthy, and they are really choking out the middle class. A lot of my friends have had to move to Florida, Texas, Oregon. You go to your local shop, and it’s $5 for a gallon of milk and $13 for shampoo. Do you know how much a one-bedroom, one-bathroom apartment is? $1700! What’s wrong with this picture?”

https://www.zerohedge.com/s3/files/inline-images/apartments%20for%20rent%20new%20york.jpg?itok=BSU4QTYO

In response to a similar poll in May 2018, only 31% of respondents said they felt as though they would be forced to move, indicating that the outlook among residents is getting much worse – very quickly.

New York native Dexter Benjamin said: “I am definitely not going to be here five years from now. I will probably move to Florida or Texas where most of my family has moved.”

Many of those who have moved, prompted by New York’s tax burden and new Federal law that punishes high tax states, aren’t looking back. Robert Carpenter, 50, who moved from Brooklyn to New Jersey told the Post: “Moving to New Jersey has only added 15 minutes to my commute! And I am still working in Downtown Brooklyn. I save about $300 extra a month, which in the long run it matters.”

He continued: “Because of the city tax and the non-deductibility of your real estate taxes, we’re seeing a lot more people with piqued interest.”

The poll also found that minorities have an even more pessimistic outlook on things. Non-whites disproportionately ranked their situations as “poor” and “not good” according to the poll.

Clifton Oliver, 43, who is black and lives in Washington Heights, said: “When I moved here there was no H&M, no Shake Shack — it was authentically African-American New York Harlem. Now Neil Patrick Harris lives down the block. People are going down south to Florida, Alabama, Baltimore.”

Source: ZeroHedge

US Housing Hits A Brick Wall: “The House Price Deceleration Is Staggering”

(by Mark Hanson) RedFin puts out a monthly home sales report, which contains a lot of great data. The chart below shows Feb 2018 year-over-year price growth, which was off the charts, compared to Feb 2019 year-over-year growth, which was very weak.

This y/y growth deceleration is staggering, especially in the high-flying regions.

Very few regions escaped a significant deceleration with some prominent regions like San Jose and San Francisco even getting crushed on a year-over-year absolute basis.

The only thing that even comes close to this sharp of deceleration was circa-2007.

It was data like these I have been tracking that led to my call last year that there was no way the Fed could continue to hike in 2019.

For certain housing and related names, this is a killer unless prices re-accelerate quickly.

https://www.zerohedge.com/s3/files/inline-images/House-Price-Deceleration-Feb-2018.jpg?itok=IGorIP80

Source: ZeroHedge

Yield Curve Inverts For The First Time Since 2007: Recession Countdown Begins

The most prescient recession indicator in the market just inverted for the first time since 2007.

https://www.zerohedge.com/s3/files/inline-images/bfm960.jpg?itok=c0gP8hQC

https://i0.wp.com/northmantrader.com/wp-content/uploads/2019/03/yield.png?ssl=1

Don’t believe us? Here is Larry Kudlow last summer explaining that everyone freaking out about the 2s10s spread is silly, they focus on the 3-month to 10-year spread that has preceded every recession in the last 50 years (with few if any false positives)… (fwd to 4:20)

As we noted below, on six occasions over the past 50 years when the three-month yield exceeded that of the 10-year, economic recession invariably followed, commencing an average of 311 days after the initial signal. 

And here is Bloomberg showing how the yield curve inverted in 1989, in 2000 and in 2006, with recessions prompting starting in 1990, 2001 and 2008. This time won’t be different.

https://www.zerohedge.com/s3/files/inline-images/prior%20inversions.jpg?itok=BgnEMjCQ

On the heels of a dismal German PMI print, world bond yields have tumbled, extending US Treasuries’ rate collapse since The Fed flip-flopped full dovetard.

https://www.zerohedge.com/s3/files/inline-images/bfm14B0.jpg?itok=Ez0lIVd_

The yield curve is now inverted through 7Y…

https://www.zerohedge.com/s3/files/inline-images/bfm1EA4.jpg?itok=xPH6zVO8

With the 7Y-Fed-Funds spread negative…

https://www.zerohedge.com/s3/files/inline-images/bfm2864.jpg?itok=HqnSx1RR

Bonds and stocks bid after Powell threw in the towell last week…

https://www.zerohedge.com/s3/files/inline-images/bfmA98E.jpg?itok=D4zUXHf3

But the message from the collapse in bond yields is too loud to ignore. 10Y yields have crashed below 2.50% for the first time since Jan 2018…

https://www.zerohedge.com/s3/files/inline-images/bfm5670.jpg?itok=rocy5sKV

Crushing the spread between 3-month and 10-year Treasury rates to just 2.4bps – a smidge away from flashing a big red recession warning…

https://www.zerohedge.com/s3/files/inline-images/bfm36A8.jpg?itok=3cfUyMJ1

Critically, as Jim Grant noted recently, the spread between the 10-year and three-month yields is an important indicator, James Bianco, president and eponym of Bianco Research LLC notes today. On six occasions over the past 50 years when the three-month yield exceeded that of the 10-year, economic recession invariably followed, commencing an average of 311 days after the initial signal. 

Bianco concludes that the market, like Trump, believes that the current Funds rate isn’t low enough:

While Powell stressed over and over that the Fed is at “neutral,” . . . the market is saying the rate hike cycle ended last December and the economy will weaken enough for the Fed to see a reason to cut in less than a year.

https://www.zerohedge.com/s3/files/inline-images/bfm1B73_0.jpg?itok=iZGfa7C7

Equity markets remain ignorant of this risk, seemingly banking it all on The Powell Put. We give the last word to DoubleLine’s Jeff Gundlach as a word of caution on the massive decoupling between bonds and stocks…

“Just because things seem invincible doesn’t mean they are invincible. There is kryptonite everywhere. Yesterday’s move created more uncertainty.”

Source: ZeroHedge

10Y Treasury Yield Tumbles Below 2.50% As 7Y Inverts

The bond bull market is alive and well with yesterday’s bond-bear-battering by The Fed extending this morning.

10Y Yields are back below 2.50% for the first time since Jan 2018…

https://www.zerohedge.com/s3/files/inline-images/bfmCA1F.jpg?itok=_jgnif7R

…completely decoupled from equity markets….

https://www.zerohedge.com/s3/files/inline-images/bfm51AD.jpg?itok=s4YZh3r-

The yield is now massively inverted to Fed Funds…

https://www.zerohedge.com/s3/files/inline-images/bfm8BAA.jpg?itok=hEx0M8LV

With 7Y yields now below effective fed funds rate…

https://www.zerohedge.com/s3/files/inline-images/bfm5F7C.jpg?itok=yYvetY6-

Source: ZeroHedge

Under “Basel III” Rules Gold Becomes Money Again

In 2018, central banks added nearly 23 million ounces of gold, up 74% from 2017. This is the highest annual purchase rate increase since 1971, and the second-highest rate in history. Russia was the biggest buyer. And not surprisingly, the lion’s share of gold is flowing into central banks of countries that are in the sights of America’s killing machine—the Military Industrial Complex that Eisenhower warned us about in 1958.

https://www.zerohedge.com/s3/files/inline-images/Central-bank-gold-reserves-March-19.jpg?itok=bLc9J7va

The Bank for International Settlements (BIS), located in Basal, Switzerland, is often referred to as the central bankers’ bank. Related to this issue of central bank hoarding of gold is the fact that on March 29 the BIS will permit central banks to count the physical gold it holds (marked to market) as a reserve asset just the same as it allows cash and sovereign debt instruments to be counted.

There has been a long-term view that China and other nations dishoarding dollars in favor of gold have been quite happy about western banks trashing the gold price through the synthetic paper markets. But one has to wonder if that might not change, once physical gold is marked to market for the sake of enlarging bank balance sheets.

This also raises the question with regard to how much gold the U.S. actually holds as opposed to what it claims to hold. James Sinclair has always argued that the only way the world can overcome the debt that is strangling the global economy is to remonetize gold on the balance sheets of central banks at a price in many thousands of dollars higher. This would mean a major change in the global monetary system away from the dollar, as China has been pushing for the last decade or so.

If banks own and possess gold bullion, they can use that asset as equity and thus this will enable them to print more money. It may be no coincidence that as March 29th has been approaching banks around the world have been buying huge amounts of physical gold and taking delivery. For the first time in 50 years, central banks bought over 640 tons of gold bars last year, almost twice as much as in 2017 and the highest level raised since 1971, when President Nixon closed the gold window and forced the world onto a floating rate currency system.

https://www.zerohedge.com/s3/files/inline-images/gold-vs-fiat-money_0.jpg?itok=WLnwyvvd

But as Chris Powell of GATA noted, that in itself is not news. The move toward making gold equal to cash and bonds was anticipated several years ago. However, what is news is the realization by a major Italian Newspaper, II Sole/24 Ore, that “synthetic gold,” or “paper gold,” has been used to suppress the price of gold, thus enabling countries and their central banks to continue to buy gold and build up their reserves at lower and lower prices as massive amounts of artificially-created “synthetic gold” triggers layer upon layer of artificially lower priced gold as unaware private investors panic out of their positions.

The paper concludes that,

“In recent years, but especially in 2018, a jump in the price of gold would have been the normal order of things. On the contrary, gold closed last year with a 7-percent downturn and a negative financial return. How do you explain this? While the central banks raided “real” gold bars behind the scenes, they pushed and coordinated the offer of hundreds of tons of “synthetic gold” on the London and New York exchanges, where 90 percent of the trading of metals takes place. The excess supply of gold derivatives obviously served to knock down the price of gold, forcing investors to liquidate positions to limit large losses accumulated on futures. Thus, the more gold futures prices fell, the more investors sold “synthetic gold,” triggering bearish spirals exploited by central banks to buy physical gold at ever-lower prices”.

The only way governments can manage the levels of debt that threaten the financial survival of the Western world is to inflate (debase) their currencies. The ability to count gold as a reserve from which banks can create monetary inflation is not only to allow gold to become a reserve on the balance sheet of banks but to have a much, much higher, gold price to build up equity in line with the massive debt in the system.

Source: ZeroHedge

US Department Store Sales Lowest Since 1992 (Retail REIT and CMBS Alert!)

The US Commerce Department reported that Department stores are a “wipeout.”

E-commerce continue to wipeout brick and mortar store sales.

https://confoundedinterestnet.files.wordpress.com/2019/03/screen-shot-2019-03-15-at-11.59.42-am.png

At the same time, e-commerce sales continue to rise.

https://confoundedinterestnet.files.wordpress.com/2019/03/screen-shot-2019-03-15-at-12.00.35-pm.png

It’s not the end of the world for bricks and mortar shopping. Consumers still eat out at restaurants, use fitness clubs, bars, etc. But, it does cause a rethinking of retail REIT and CMBS valuation and growth projections.

https://confoundedinterestnet.files.wordpress.com/2019/03/wipo.jpg

Source: Confounded Interest

Basement-Dwelling Millennials Beware: Reverse Mortgages May Evaporate Your Inheritance

With nearly 90% of millennials reporting that they have less than $10,000 in savings and more than 100 million Americans of working age with nothing in retirement accounts, we have bad news for basement-dwelling millennials invested in the “waiting for Mom and Dad to die” model;

Reverse mortgages are set to make a comeback if a consortium of lenders have their way, according to Bloomberg.

https://www.zerohedge.com/s3/files/inline-images/adult%20at%20home.jpg?itok=__UGDfV9

Columbia Business School real estate professor Chris Mayer – who’s also the CEO of reverse mortgage lender Longbridge Financial, says the widely-panned financial arrangements deserve a second look. Mayer is a former economist at the Federal Reserve of Boston with a Ph.D. from MIT. 

In 2012, Mayer co-founded Longbridge, based in Mahwah, New Jersey, and in 2013 became CEO. He’s on the board of the National Reverse Mortgage Lenders Association. He said his company, which services 10,000 loans, hasn’t had a single completed foreclosure because of failure to pay property taxes or insurance. –Bloomberg

Reverse mortgages allow homeowners to pull equity from their home in monthly installments, lines of credit or lump sums. Over time, their loan balance grows – coming due upon the borrower’s death. At this point, the house is sold to pay off the loan – typically leaving heirs with little to nothing

Elderly borrowers, meanwhile, must continue to pay taxes, insurance, maintenance and utilities – which can lead to foreclosure.

While even some critics agree that reverse mortgages make sense for some homeowners – they have been criticized for excessive fees and tempting older Americans into spending their home equity early instead of using it for things such as healthcare expenses. Fees on a $100,000 loan on a house worth $200,000, for example, can total as much as $10,000 – and are typically wrapped into the mortgage. 

The profits are significant, the oversight is minimal, and greed could work to the disadvantage of seniors who should be protected by government programs and not targeted as prey,” said critic Dave Stevens – former Obama administration Federal Housing Administration commissioner and former CEO of the Mortgage Bankers Association. 

To support his claims that reverse mortgages are far less risky than they used to be, Mayer cites a 2014 study by Alicia Munnell of Boston College’s Center for Retirement Research. Munnell, a professor and former assistant secretary of the Treasury Department in the Clinton Administration (who once invested $150,000 in Mayer’s company and has since sold her stake). Munnell concluded that industry changes requiring lenders to assess a prospective borrower’s ability to pay property taxes and homeowner’s insurance significantly reduces the risk of a reverse mortgage

The number of reverse mortgages, or Home Equity Conversion Mortgages (HECM) in the United States between 2005 and 2018 has not shown a recent upward trend – however that may change if Mayer and his cohorts are able to convince homeowners that reverse mortgages aren’t what they used to be.

https://www.zerohedge.com/s3/files/inline-images/reverse%20mortgages.png?itok=RB-pSImm

Cleaning up their image

For years, the reverse mortgage industry has relied on celebrity pitchmen to convince Americans to part with the equity in their homes in order to maintain their lifestyle. 

The late Fred Thompson, a U.S. senator and Law & Order actor, represented American Advisors Group, the industry’s biggest player. These days, the same company leans on actor Tom Selleck.

Just like you, I thought reverse mortgages had to have some catch,” Selleck says in an online video. Then I did some homework and found out it’s not any of that. It’s not another way for a bank to get your house.

Michael Douglas, in his Golden Globe-winning performance on the Netflix series The Kominsky Method, satirizes such pitches. His financially desperate character, an acting teacher, quits filming a reverse mortgage commercial because he can’t stomach the script. –Bloomberg

https://youtu.be/JxqWAWNs6V4

In 2016, American Advisers and two other companies were accused by the US Consumer Financial Protection Bureau of running deceptive ads. Without admitting guilt, American Advisers agreed to add more caveats to its promotions and paid a $400,000 fine. 

As a result, the company has made “significant investments” in compliance, according to company spokesman Ryan Whittington, adding that reverse mortgages are now “highly regulated, viable financial tools,” which require homeowners to undergo third-party counseling before participating in one. 

The FHA has backed more than 1 million such reverse mortgages. Homeowners pay into an insurance fund an upfront fee equal to 2 percent of a home’s value, as well as an additional half a percentage point every year.

After the last housing crash, taxpayers had to make up a $1.7 billion shortfall because of reverse mortgage losses. Over the past five years, the government has been tightening rules, such as requiring homeowners to show they can afford tax and insurance payments. –Bloomberg

As a result of tightened regulations, the number of reverse mortgage loans has dropped significantly since 2008. 

Making the case for reverse mortgages is Shelly Giordino – a former executive at reverse mortgage company Security 1 Lending, who co-founded the Funding Longevity Task Force in 2012. 

Giordino now works for Mutual of Obama’s reverse mortgage division as their “head cheerleader” for positive reverse mortgages research. One Reverse Mortgage CEO Gregg Smith said that the group is promoting “true academic research” to convince the public that reverse mortgages are a good idea. 

Mayer under fire

University of Massachusetts economics professor Gerald Epstein says that Columbia may need to scrutinize Mayer’s business relationships for conflicts of interest. 

They really should be careful when people have this kind of dual loyalty,” said Epstein. 

Columbia said it monitors Mayer’s employment as CEO of the mortgage company to ensure compliance with its policies. “Professor Mayer has demonstrated a commitment to openness and transparency by disclosing outside affiliations,” said Chris Cashman, a spokesman for the business school. Mayer has a “special appointment,” which reduces his salary and teaching load and also caps his hours at Longbridge, Cashman said.

Likewise, Boston College said it reviewed Professor Munnell’s investment in Mayer’s company, on whose board she served from 2012 through 2014. Munnell said another round of investors in 2016 bought out her $150,000 stake in Longbridge for an additional $4,000 in interest.

“Anytime I had a conversation like this, I had to say at the beginning that I have $150,000 in Longbridge,” said Munnell. “I had to do it all the time. I’m just as happy to be out, for my academic life.” 

Source: ZeroHedge

New Home Sales Slump In January, Despite Drop In Prices

Following a rebound in November and December, January’s (delayed due to the govt shutdown) new home sales plunged 6.9% MoM despite a jump in homebuilder sentiment.

https://www.zerohedge.com/s3/files/inline-images/2019-03-14_7-05-01.png?itok=z81jYHNO

This pushes year-over-year growth in new home sales back into decline.

https://www.zerohedge.com/s3/files/inline-images/2019-03-14_7-06-40.png?itok=iI2VJQa9

Sales of new U.S. homes in January fell to the weakest pace since October, driven by a decline in the Midwest as still-elevated prices keep buyers on the sidelines.

https://www.zerohedge.com/s3/files/inline-images/2019-03-14_7-01-56.png?itok=8wOcford

The number of properties sold for which construction hadn’t yet started declined to 183,000, the lowest in three months, showing a weaker pipeline of building for the coming months.

The sales drop occurred despite a drop in the median sales price, down 3.8% from a year earlier to $317,200.

https://www.zerohedge.com/s3/files/inline-images/2019-03-14_7-12-07.png?itok=8Te0gwF0

As a reminder, new-home purchases are seen as a timelier barometer of the market, as they’re calculated when contracts are signed rather than when they close, like the previously-owned homes data.

Source: ZeroHedge

Millennials Are More Than A Trillion Dollars In Debt, And Most Of Them Don’t Even Own A Home

When compared to a similar point in time, Millennials are deeper in debt than any other generation that has come before them.  And the biggest reason why they are in so much debt may surprise you.

https://www.zerohedge.com/s3/files/inline-images/Student-Loan-Debt-Public-Domain-1.png?itok=31QRYyzc

We’ll get to that in a minute, but first let’s talk about the giant mountain of debt that Millennials have accumulated.  According to the New York Fed, the total amount of debt that Millennials are carrying has risen by a whopping 22 percent in just the last five years

New findings from the New York Federal Reserve reveal that millennials have now racked up over US$1 trillion of debt.

This troubling amount of debt, an increase of over 22% in just five years, is more than any other generation in history. This situation may leave you wondering how millennials ended up in such a sorry state.

Many young adults are absolutely drowning in debt, but the composition of that debt is quite different when compared to previous generations at a similar point in time.

Mortgage debt and credit card debt levels are far lower for Millennials, but the level of student loan debt is far, far higher

While the debt levels accumulated by millennials eclipse those of the previous generation, Generation X, at a similar point in time, the complexion of the debt is very different.

According to a 2018 report from the St. Louis Federal Reserve Bank, mortgage debt is about 15% lower for millennials and credit card debt among millennials was about two-thirds that of Gen X.

However, student loan debt was over 300% greater.

Over the last 10 years, the total amount of student loan debt in the United States has more than doubled.

It is an absolutely enormous financial problem, and there doesn’t seem to be an easy solution.  Some politicians on the left are pledging to make college education “free” in the United States, but they never seem to explain who is going to pay for that.

But what everyone can agree on is that student loan debt levels are wildly out of control.  The following statistics come from Forbes

The latest student loan debt statistics for 2019 show how serious the student loan debt crisis has become for borrowers across all demographics and age groups. There are more than 44 million borrowers who collectively owe $1.5 trillion in student loan debt in the U.S. alone. Student loan debt is now the second highest consumer debt category – behind only mortgage debt – and higher than both credit cards and auto loans. Borrowers in the Class of 2017, on average, owe $28,650, according to the Institute for College Access and Success.

What makes all of this even more depressing is the fact that the quality of “higher education” in the U.S. has gone down the toilet in recent years.  For much more on this, please see my recent article entitled “50 Actual College Course Titles That Prove That America’s Universities Are Training Our College Students To Be Socialists”.

Our colleges and universities are not adequately preparing our young people for their future careers, but they are burdening them with gigantic financial obligations that will haunt many of them for decades to come.

We have a deeply broken system, and we desperately need a complete and total overhaul of our system of higher education.

Due to the fact that so many of them are swamped by student loan debt, the homeownership rate for Millennials is much, much lower than the homeownership rate for the generations that immediately preceded them.  The following comes from CNBC

The homeownership rate for those under 35 was just 36.5 percent in the last quarter of 2018, compared with 61 percent for those aged 35 to 44, and 70 percent for those aged 45 to 54, according to the U.S. Census. The millennial homeownership rate actually dropped in the fourth quarter compared with the third quarter, but was unchanged year over year.

This is one of the big reasons why “Housing Bubble 2” is beginning to burst.  There are not enough Millennials buying homes, and it looks like things could be even worse for Generation Z.

If you are a young adult, I would encourage you to limit your exposure to student loan debt as much as possible, because the debt that you accumulate while in school can have very serious long-term implications that you may not even be considering right now.

Source: ZeroHedge

US Residential Construction Spending Slumps For 6th Straight Month As US Banks Report $251 Billion of “Unrealized Losses” On Securities Investments in 2018

Today is a double whammy for bad news for the US economy.

First, The Census Bureau monthly construction spending report reveals that highway and street spending rose 11.7% in January. The biggest decline was communication spending.

https://confoundedinterestnet.files.wordpress.com/2019/03/constspending.png

BUT, US residential construction spending slumped for the 6th straight month. It is beginning to resemble “The Matterhorn” plunge of the 2000s.

https://confoundedinterestnet.files.wordpress.com/2019/03/usconsrtuspen.png

The second whammy is the FDIC report  revealing that US banks reported $251 billion of “unrealized losses” on securities investments in 2018, the most since 2008.

https://confoundedinterestnet.files.wordpress.com/2019/03/us-fdic-banks-unrealized-losses-2018-q4.png

For a less grim chart from The Federal Reserve (and a different metric), here is US Commercial Bank Liabilities Net Unrealized Gains (Losses) Available for Sale.

https://confoundedinterestnet.files.wordpress.com/2019/03/unrelvvl.png

Source: Confounded Interest

***

Residential Spending Slumps For 6th Straight Month As Infrastructure Spending Soars Most Since 2003

https://www.zerohedge.com/s3/files/inline-images/2019-03-13_7-19-16.png?itok=o5Y2plu8

…government spending rescued the headline as public construction rose 4.9% in Jan… thanks to a massive surge in infrastructure spending on Highway and Street improvements…

AOC: Wells Fargo ‘Involved’ In Caging Children; Thinks Banks Should Assume Borrowers’ Liabilities

More than two years after Wells Fargo & Co. erupted into scandals, Chief Executive Officer Tim Sloan returned to Capitol Hill to lay out his efforts to clean up the mess. The bank has apparently made little progress in winning over lawmakers.

However, all eyes were on Rep. Alexandria Ocasio-Cortez (D-NY) after she suggested Wells Fargo was “involved” in the caging of migrant children because the bank used to finance private prison companies CoreCivic and Geo Group during congressinal hearing.

It was a brilliant distraction…

https://www.zerohedge.com/s3/files/inline-images/oac%201b.jpg?itok=FvAbbpRw

“Mr. Sloan, why was the bank involved in the caging of children and financing the caging of children to begin with?” the freshman House Democrat and economics major asked Wells Fargo CEO Timothy Sloan. 

“Uh, I don’t know how to answer that question because we weren’t,” Sloan replied. 

“Uh, so in finance — you, you were financing and involved in financing of debt of CoreCivic and Geo Group, correct?” she shot back. 

To which Sloan replied: “For a period of time, we were involved in financing one of the firms — we’re not anymore and the other. I’m not familiar with the specific assertion that you’re making, but we weren’t directly involved in that.”

“OK, so these companies run private detention facilities run by ICE, which is involved in caging children, but I’ll move on,” AOC retorted.

Of note, Wells Fargo was prominently featured in a November 2016 report along with nine other banks for lending CoreCivic and GEO Group $444 million and $450 million respectively during the Obama administration – the same period of time during which a a photo of caged children misattributed to the Trump administration was taken. 

Wells Fargo and other banks have decided to reevaluate their lending activities to private prisons amid controversy over the Trump administration’s immigration policies. 

Ultimate liability

AOC then shifted gears, asking Sloan if Wells Fargo should be involved in paying for environmental cleanup if a bank-financed oil project such as the Dakota Pipeline were to leak

“So hypothetically, if there was a leak from the Dakota Access Pipeline, why shouldn’t Wells Fargo pay for the cleanup of it, since it paid for the construction of the pipeline itself?” asked AOC – suggesting that the pipeline is “widely seen to be environmentally unstable.” 

Sloan looked a bit puzzled, replying: “Again the reason we were one of the 17 or 19 banks that financed that is because our team reviewed the environmental impact and we concluded that it was a risk that we were willing to take.” 

The responses to AOC’s line of questioning have been entertaining to say the least.  

Source: ZeroHedge

***

Review/Summary of The Brains Behind AOC Alexandria Ocasio-Cortez

https://youtu.be/zQYVrOPIKDE

Homeowners With Negative Equity Increased First Time Since 2015

  • The quarterly increase in negative equity was the first increase in 12 quarters
  • The number of owners with negative equity has decreased during the last four quarters by 350,000, or 14 percent
  • The average homeowner gained $9,700 in home equity over the last four quarters

CoreLogic® (NYSE: CLGX), a leading global property information, analytics and data-enabled solutions provider, today released the Home Equity Report for the fourth quarter of 2018. The report shows that U.S. homeowners with mortgages (which account for roughly 63 percent of all properties) have seen their equity increase by 8.1 percent year over year, representing a gain of nearly $678.4 billion since the fourth quarter of 2017.

Additionally, the average homeowner gained $9,700 in home equity between the fourth quarter of 2017 and the fourth quarter of 2018. While home equity grew in almost every state in the nation, western states experienced the most significant annual increases. Nevada homeowners gained an average of approximately $29,400 in home equity, while Hawaii homeowners gained an average of approximately $26,900 and Idaho homeowners gained an average of $24,700. California homeowners experienced the fourth-highest growth with an average increase of approximately $19,600 in home equity (Figure 1).

From the third quarter of 2018 to the fourth quarter of 2018, the total number of mortgaged homes in negative equity increased 1.6 percent to 2.2 million homes or 4.2 percent of all mortgaged properties. This was the first quarterly increase since the fourth quarter of 2015. Despite that quarter-over-quarter increase, on a year-over-year basis, the number of mortgaged properties in negative equity fell 14 percent, or by 351,000, from 2.6 million homes – or 4.9 percent of all mortgaged properties – in the fourth quarter of 2018.

“Our forecast for the CoreLogic Home Price Index predicts there will be a 4.5 percent increase in our national index from December 2018 to the end of 2019,” said Dr. Frank Nothaft, chief economist for CoreLogic. “If all homes experience this gain, this would lift about 350,000 homeowners from being underwater and restore positive equity.”

Negative equity, often referred to as being underwater or upside down, applies to borrowers who owe more on their mortgages than their homes are worth. Negative equity can occur because of a decline in a home’s value, an increase in mortgage debt or both. Negative equity peaked at 26 percent of mortgaged residential properties in the fourth quarter of 2009, based on the CoreLogic equity data analysis, which began in the third quarter of 2009.

The national aggregate value of negative equity was approximately $300.3 billion at the end of the fourth quarter of 2018. This is up approximately $17.4 billion from $282.9 billion in the third quarter of 2018 and up year over year by approximately $14.4 billion from $285.9 billion in the fourth quarter of 2017.

“As home prices rise, significantly more people are choosing to remodel, repair or upgrade their existing homes. The increase in home equity over the past several years provides homeowners with the means to finance home remodels and repairs,” said Frank Martell, president and CEO of CoreLogic. “With rates still ultra-low by historical standards, home-equity loans provide a low-cost method to finance home-improvement spending. These expenditures are expected to rise 5 percent in 2019.”

Source: CoreLogic

Economists Cut Global Growth Forecast In Half, Admit Slowdown “Has Taken Us By Surprise”

This is probably the last chart that Mario Draghi wants to see.

Bloomberg economics’ global GDP tracker has been downgraded to its slowest pace since the financial crisis, with world economic growth slumping to 2.1% on a quarterly basis. That’s down from 4% in the middle of last year.

https://www.zerohedge.com/s3/files/inline-images/Screen%20Shot%202019-03-11%20at%2011.13.57%20AM.png?itok=RBdADjv_(enlarge)

And while there’s a chance that a US-China trade deal, the Fed’s “pause”, and a fading of the pressures plaguing Europe might stave off a global recession, Bloomberg economists Dan Hanson and Tom Orlik said the risks appear to be tilted toward the downside. “The risk is that the downward momentum will be self-sustaining.”

“The cyclical upswing that took hold of the global economy in mid-2017 was never going to last. Even so, the extent of the slowdown since late last year has surprised many economists, including us.”

To be sure, the economists aren’t the only ones lowering their outlook on global growth. Last week, the OECD joined the IMF in slashing its 2019 growth forecast, cutting its projection for aggregate global growth to just 1%, just over half of its previous outlook of 1.8%.

While Draghi’s gloomy outlook and decision to push back the timeline for ECB rate cuts last week sent a shock through markets, some ECB officials are apparently still desperately trying to reassure the world that everything is going to be just fine (despite a dearth of economic data implying the opposite).

Executive Board member Benoit Coeure said in an interview with Italian newspaper Corriere della Sera published Monday that “we are still seeing robust economic growth, though it’s less strong than before.”

“It will take longer for inflation (moar money printing) to reach our objective, but it will get there. We are reacting to the developments we have seen so far.”

And although Jerome Powell said during an interview with 60 minutes last night that the US economy is “in a good place”, a raft of economic data, including Friday’s shockingly disappointing jobs report, would suggest otherwise.

The extent of the slowdown in recent months has taken many economists by surprise. But as more central banks opt to retreat into the safety of stimulus, or at least back off their hawkish rhetoric, we’ll see if disaster can be averted once again.

Source: ZeroHedge

NYC’s Chrysler Building Sold For Massive Discount

Signa Holding, Austria’s largest privately owned real estate company, has reached an agreement to purchase the iconic Chrysler Building in New York City in partnership with property firm RFR Holding for about $150 million, according to Reuters.

https://www.zerohedge.com/s3/files/inline-images/chysler%20building.jpg?itok=LA9qSufC

The price is at a steep discount compared to the $800 million the Abu Dhabi Investment Council paid for a 90% stake in the building right before the 2008 financial crisis. Shortly after the investment arm of the Government of Abu Dhabi bought the property, commercial real estate prices crashed.

https://www.zerohedge.com/s3/files/inline-images/chrysler-nyc%20view.jpg?itok=3T3jXqFz

Sources told Reuters that the deal includes both the office building and the pyramid-topped Trylons on the land between the tower and 666 Third Avenue.

https://www.zerohedge.com/s3/files/inline-images/TrylonTowers.jpg?itok=_JQAgsAF

The Art Deco–style skyscraper, was completed in 1930 on the East Side of Midtown Manhattan in New York City. It is a recognizable symbol of Manhattan’s skyline, was for a short time in the early 1930s the tallest building in the world, only to be surpassed by the Empire State Building.

https://www.zerohedge.com/s3/files/inline-images/1930s%20chysler%20building.jpg?itok=AjjVpOFt

The most significant factor weighing on the price is out of control expenses tied to the building’s ground lease. The land under the tower is owned by the Cooper Union school, which raised the rent to $32.5 million last year from $7.75 million in 2017.

“The ground lease is a glaringly obvious negative,” Adelaide Polsinelli, a broker at New York City-based Compass, told Bloomberg. “The other negatives are that the space is not new and it is landmarked, therefore it’s twice as hard to get anything done.”

Tishman Speyer Properties and the Travelers Insurance Group bought the Chrysler Building in 1998 for about $230 million. In 2001, a 75% stake in the building was sold, for $300 million to TMW, the German arm of an Atlanta-based investment fund. Abu Dhabi bought the German fund’s share as well as part of Tishman’s in June 2008. Reuters said Signa and RFR were extremely close to a deal to purchase the tower.

Signa has an extensive portfolio of landmark buildings in prime locations. Its holdings include KaDeWe and the Upper West Tower in Berlin, Goldenes Quarter with the Park Hyatt Hotel in Vienna, Alte Akademie in Munich, and Alsterhaus and Alsterarkaden in Hamburg.

RFR has also made a name for itself in commercial real estate by owning and managing some of Manhattan’s most prestigious commercial properties, including the Seagram Building and Lever House, which are located on Park Avenue.

Signa and RFR had completed several deals together in the past,  including in 2017, when Signa bought five landmark properties from RFR in Berlin, Hamburg, Frankfurt, and Munich for about 1.5 billion euros.

Source: ZeroHedge

Alarm! Europe’s And US Bond Volatility Grinding To A Halt (Precursor To Recession)

European bond volatility (according to the Merrill Lynch 3-month EUR option volatility estimate) has plunged to the lowest level on record.

https://confoundedinterestnet.files.wordpress.com/2019/03/dyingvol.png

A similar chart for the US bond market is the Merrill Lynch Option Volatility Estimate for 3-months shows exactly the same thing. The US bond market is grinding to a halt.

https://confoundedinterestnet.files.wordpress.com/2019/03/move3.png

Note that the US MOVE 3-month estimate hit a low in May 2007, just ahead of The Great Recession of 2007-2009.

Alarm!

Source: Confounded Interest

***

Stocks End Week With Five Days Of Declines

  • U.S. stocks almost clawed their way to break-even, shaking off concerns over slowing global growth, a weak hiring report in the U.S., and disappointing China trade data.
  • S&P fell 0.2% as did the  Nasdaq, and the Dow nudged down 0.1%.
  • For the week, the Nasdaq declined 2.5%, while the S&P 500 and the Dow each slipped 2.2%.
  • Among industry sectors, utilities (+0.4%) and materials (+0.2%) gained the most on Friday, while energy (-2.0%) and consumer discretionary (-0.7%) were the biggest underperformers.
  • 10-year Treasury yield fell is down about 1 basis point to 2.63%.

US Consumer Credit Storms Above $4 Trillion, As Credit Card Debt Hits Record High

After a few months of wild swings, in January US consumer credit normalized rising by $17 billion, in line with expectations, following December’s $15.4 billion increase. The continued increase in borrowings saw total credit storm above $4 trillion, and hitting a new all time high of $4.034 trillion on the back of a America’s ongoing love affair with auto and student loans, and of course credit cards.

https://www.zerohedge.com/s3/files/inline-images/household%20credit%20feb%202019.jpg?itok=WshxuMrd

Revolving credit increased by $2.6 billion, a rebound from December’s downward revised $939 million, and rising to $1.058 trillion, a new all time high in total credit card debt outstanding.

https://www.zerohedge.com/s3/files/inline-images/revolving%20credit%203.7.jpg?itok=gqAtEPB-

There was barely a change in the monthly increase in non-revolving credit, i.e. student and auto loans, which jumped by $14.5 billion, up from the $14.4 increase in December, and bringing the nonrevolving total also to a new all time high of $2.977 trillion.

https://www.zerohedge.com/s3/files/inline-images/nonrevolving%20credit%203.7.jpg?itok=c0raI5Wl

And while January’s rebound in credit card use may assuage some concerns about the sharp slowdown in spending in the end of 2018 and start of 2019, and the subsequent plunge in retail sales, as the household savings rate surged by the most in years, one place where there were no surprises, was in the total amount of student and auto loans: here as expected, both numbers hit fresh all time highs, with a record $1.569 trillion in student loans outstanding, an impressive increase of $10.3 billion in the quarter, while auto debt also hit a new all time high of $1.155 trillion, an increase of $9.5 billion in the quarter.

https://www.zerohedge.com/s3/files/inline-images/student%20auto%20loans%20feb%202019.jpg?itok=gUBIx0_-

In short, whether they want to or not, Americans continue to drown even deeper in debt, and enjoying every minute of it.

Source: ZeroHedge

ADP Employment Gains Slow Dramatically As Small Business Cut Most Jobs SInce 2013

https://martinhladyniuk.com/wp-content/uploads/2017/10/rules-for-a-happy-marriage.jpg

ADP has dramatically revised January’s job gains upward to +300k but February’s print came in at a slightly disappointing +183k (below the 190k exp).

https://zh-prod-1cc738ca-7d3b-4a72-b792-20bd8d8fa069.storage.googleapis.com/s3fs-public/styles/inline_image_mobile/public/inline-images/2019-03-06_5-23-08.jpg

Small business (1-19) saw job losses (-8k) in February and Education (-2k) was the only industry to see job cuts.

This is the biggest drop in Small Business jobs since Dec 2013…

https://zh-prod-1cc738ca-7d3b-4a72-b792-20bd8d8fa069.storage.googleapis.com/s3fs-public/styles/inline_image_mobile/public/inline-images/2019-03-06_5-26-56.jpg

“We saw a modest slowdown in job growth this month,” said Ahu Yildirmaz, vice president and co-head of the ADP Research Institute. 

“Midsized companies have been the strongest performer for the past year.   There was a sharp decline in small business growth as these firms continue to struggle with offering competitive wages and benefits.”

Mark Zandi, chief economist of Moody’s Analytics, said,

The economy has throttled back and so too has job growth. The job slowdown is clearest in the retail and travel industries, and at smaller companies. Job gains are still strong, but they have likely seen their high watermark for this expansion.”

Source: ZeroHedge


US Trade Deficit Soars To $621BN, Highest Since 2008 As Goods Deficit Hits Record

Confirming last week’s advance goods data which saw the biggest trade deficit on record in December, moments ago the BEA reported that the U.S. trade deficit soared to a 10-year high of $621 billion in 2018, jumping by $68.8 billion, or 12.5 percent in the year, and crushing Trump’s pledges to reduce it, as tax cuts boosted domestic demand for imports while the strong dollar and retaliatory tariffs weighed on exports.

https://zh-prod-1cc738ca-7d3b-4a72-b792-20bd8d8fa069.storage.googleapis.com/s3fs-public/styles/inline_image_mobile/public/inline-images/trade%20balance%202019.jpg

The data release was originally delayed a month by the partial government shutdown. January figures are due March 27.

Worse, for goods only, the deficit with the world surged to a record $891.3 billion in 2018 from $807.5 billion the prior year, as merchandise deficits with Mexico and the European Union also hit records. Offsetting the record good deficit was the surplus in services which kept rising, and also hit a a record – in the other direction – rising to a $270.2 billion surplus in 2018.

https://zh-prod-1cc738ca-7d3b-4a72-b792-20bd8d8fa069.storage.googleapis.com/s3fs-public/styles/inline_image_mobile/public/inline-images/US%20goods%20service%20trade%20balance.jpg

The reason for the massive jump in the deficit is that while exports increased $148.9 billion or 6.3% as shipments of goods including crude oil, petroleum products and aircraft engines increased. However, imports increased even more, some 7.5%, or $217.7 billion, on purchases of items from pharmaceuticals to computers, along with services such as travel.

On a monthly basis, the December deficit soared from $50.3 billion to $59.8 billion, also a 10-year high and far worse than the consensus estimate of $57.9 billion.

https://zh-prod-1cc738ca-7d3b-4a72-b792-20bd8d8fa069.storage.googleapis.com/s3fs-public/styles/inline_image_mobile/public/inline-images/monthly%20trade%20deficit%202019.jpg

How did the deficit soar so much in one month? Simple: less exports, more imports, as exports fell 1.9% from the prior month, the biggest decline since early 2016, to $205.1 billion, on lower shipments of civilian aircraft, petroleum products and corn. 

  • December exports were $205.1 billion, $3.9 billion less than November exports. December imports were $264.9  billion, $5.5 billion more than November imports.
  • As a result, the December increase in the goods and services deficit reflected an increase in the goods deficit of $9.0 billion to $81.5 billion and a decrease in the services surplus of $0.5 billion to $21.8 billion.

Also worth noting: the December goods deficit hit an all time high.

Ironically, the biggest culprit was China, as the deficit with Beijing – the target of Trump’s trade war – hit a record $419.2 billion in 2018, following the previously noted plunge in Chinese imports from the US.

https://zh-prod-1cc738ca-7d3b-4a72-b792-20bd8d8fa069.storage.googleapis.com/s3fs-public/styles/inline_image_mobile/public/inline-images/china%20imports%20from%20US_0.jpg

Ironically, as Bloomberg notes, while Trump has repeatedly cited the deficit as evidence of the failure of his predecessors’ trade policies, the gap has surged by $119 billion during his two years as president. Even if he completes an accord to end the tariff war with China, substantially shrinking the deficit may prove tough as cooling global growth weighs on exports while domestic demand keeps driving shipments from abroad.

Some more records:

  • The December goods deficit ($80.4 billion) was the highest on record.
  • The December non-petroleum deficit ($79.1 billion) was the highest on record.
  • December exports of foods, feeds, and beverages ($9.6 billion) were the lowest since 2010 ($9.3 billion).
  • December imports of foods, feeds, and beverages ($12.6 billion) were the highest on record.
  • December imports of automotive vehicles, parts, and engines ($32.1 billion) were the highest on record.
  • December non-petroleum imports ($200.2 billion) were the highest on record.

And so Trump is trapped: if he concedes the trade war to China just to keep his precious stock market higher, the deficit will continue rising; if on the other hand, Trump pushes for a hard line on trade, the S&P – which has now priced in the end of the trade war – will tumble. The ball is now in Trump’s court which option to choose.

… and the oldest index is telling us that moving things from A to B is slowing down again

Source: ZeroHedge

It Begins: China’s Largest Property Developer Will Sell All Homes At A 10% Discount

Back in 2017, ZeroHedge explained why the “fate of the world economy is in the hands of China’s housing bubble.” The answer was simple: for the Chinese population, and growing middle class to keep spending vibrant and borrowing elevated, it had to feel comfortable and confident that its wealth would keep rising. However, unlike the US where the stock market is the ultimate barometer of the confidence boosting “wealth effect”, in China it has always been about housing as three quarters of Chinese household assets are parked in real estate, compared to only 28% in the US, with the remainder invested in financial assets.

Beijing knows this, of course, which is why China periodically and consistently reflates its housing bubble any time it feels the broader economy is slowing, hoping that any subsequent popping of the bubble, which happened in late 2011 and again in 2014, will be a controlled, “smooth landing” process. For now, Beijing has been successful in maintaining price stability at least according to official data, allowing the air out of the “Tier 1” home price bubble which peaked in early 2016, while preserving modest home price appreciation in secondary markets.

https://www.zerohedge.com/s3/files/inline-images/china%20housing.png?itok=0vmkt2rm

How long China will be able to avoid a sharp price decline remains to be seen, but in the meantime another problem faces China’s housing market: in addition to being the primary source of household net worth – and therefore stable and growing consumption – it has also been a key driver behind China’s economic growth, with infrastructure spending and capital investment long among the biggest components of the country’s goalseeked GDP. One result has been China’s infamous ghost cities, built only for the sake of Keynesian spending to hit a predetermined GDP number that would make Beijing happy.

Meanwhile, in the process of reflating the latest housing bubble, another dangerous byproduct of this artificial housing “market” has emerged: tens of millions of apartments and houses standing empty across the country. As we reported recently, according to recent research, roughly 22% of China’s urban housing stock is unoccupied, according to Professor Gan Li, who runs the main nationwide study. That amounts to more than 50 million empty homes.

https://zh-prod-1cc738ca-7d3b-4a72-b792-20bd8d8fa069.storage.googleapis.com/s3fs-public/inline-images/china%20empty%20housing.jpg

The reason for the massive empty inventory glut: to keep supply low and prices artificially elevated by taking out as much inventory off the market as possible. This, however, works both ways, and while it helps boost prices on the way up as the economy grow and speculators flood the housing market with easy money, the moment the trend flips the spike in supply as empty units are offloaded will lead to a panic liquidation of homes, resulting in what may be the biggest housing market crash ever observed, and putting the US home bubble of 2006 to shame.

Indeed, as Bloomberg noted, the “nightmare scenario” for Chinese authorities is that owners of unoccupied dwellings rush to sell when cracks start appearing in the property market, causing a self-reinforcing downward price spiral.

Which is why preserving the narrative (or rather myth) of constantly rising prices is so critical for China: any cracks in the facade of the price appreciation story could have a dire consequence first for the housing market, and then, the broader economy whose growth is already the slowest in modern Chinese history, as any scramble to liquidate inventory could promptly result in a bidless market as the tens of millions of empty units are suddenly exposed for both buyers and sellers to see.

* * *

While the key role of China’s housing market in the country’s economy, and thus the world’s, has long been known, a recent troubling development is that despite what Beijing deems stable home prices, the foundations behind the housing market are starting to crack. As the WSJ recently reported, in early December, a group of homeowners stormed the sales office of their Shanghai complex, “Central Washington”, whose developer, Shanghai Zhaoping Real Estate Development, was advertising new apartments at a fraction of the prices of the ones sold earlier in the year. One apartment owner said the new prices suggested the value of the apartment she bought from the developer in March had dropped by about 17.5%.

“There are people who bought multiple homes who are now trying to sell one to pay off the mortgage on another,” said Ran Yunjie, a property agent. One of his clients bought an apartment last year for about $230,000. To find a buyer now, the client would have to drop the price by 60%, according to Ran.

Meanwhile, in a truly concerning demonstration of what will happen when the bubble finally bursts, in October we reported that angry homeowners who paid full price for units at the Xinzhou Mansion residential project in Shangrao attacked the Country Garden sales office in eastern Jiangxi province last week, after finding out it had offered discounts to new buyers of up to 30%.

“Property accounts for roughly 70 per cent of urban Chinese families’ total assets – a home is both wealth and status. People don’t want prices to increase too fast, but they don’t want them to fall too quickly either,” said Shao Yu, chief economist at Oriental Securities. “People are so used to rising prices that it never occurred to them that they can fall too. We shouldn’t add to this illusion,” Shao added, echoing Ben Bernanke circa 2005.

The bottom line is that just like true price discovery for US capital markets is prohibited (and sees Fed intervention any time there is an even modest, 10-20% drop in asset prices) or else the risk of an all out panic is all too real, in China true price discovery is also not permitted, however when it comes to the country’s all important, and wealth effect boosting, real estate.

Which is a problem, because whereas China suddenly appears to be suffering from all the conventional signs of deflation in the auto retail sector, where as we noted previously, neither lower prices nor easier loans have managed to put a dent the ongoing demand plunge…

https://zh-prod-1cc738ca-7d3b-4a72-b792-20bd8d8fa069.storage.googleapis.com/s3fs-public/inline-images/chart_1.jpg

… the same ominous price cuts – which are clearly meant to boost flagging demand – are starting to emerge in China’s housing sector.

Case in point, according to China’s Paper, Hui Ka Yan, the Chairman of Evergrande, China’s biggest property developer, and China’s second richest person announced it must ramp up home sales and to do that it would sell all its properties at a 10% discount after its home sales tumbled in January amid a cooling market.

https://zh-prod-1cc738ca-7d3b-4a72-b792-20bd8d8fa069.storage.googleapis.com/s3fs-public/inline-images/evergrande%20Hui%20Ka%20Yan.jpg?itok=bNqhX9XU

Evergrande Chairman Hui Ka Yam

The fact that Evergrande has had financial difficulties for the past year is not new. In November, Evergrande, which carries the industry’s largest debt pile of any Chinese housing developer, was caught in a vicious funding squeeze and raised eyebrows with a $1.8BN, 5-year bond deal, which it had to pay a whopping 13.75% coupon, prompting analysts to say the move “carried a whiff of desperation.” The fact that chairman Hui Ka Yan, China’s second-richest person, bought $1bn of it himself, added to a sense that outside investors were shunning the company.

In many ways, Evergrande had no choice: after the property market boomed for the past three years, helping to power the economy through Xi Jinping’s crucial political transition year of 2017, in 2018 the market slowed sharply, after local governments shifted focus to controlling frothy prices and China Development Bank, the policy lender, phased out a $1 trillion subsidy program for homebuyers in smaller cities, where Evergrande’s projects are concentrated, the FT reported.

https://www.zerohedge.com/s3/files/inline-images/china%20evergrande%20debt.jpg?itok=bvj4wh7p

Even the official China News Service, usually a cheerleader for the economy, acknowledged recently that the property market “was a bit chilly”. Nomura chief China economist Ting Lu put it more starkly, forecasting a “frigid winter”.

The bigger problem for Evergrande, which had $208 billion in total liabilities at the end of June 2018 — the most of any Chinese developer — including $43bn maturing in 2019, is that should China’s housing market suffer a steep downturn, it will likely be the company to suffer the most, if for no other reason than its massive leverage which stood at a net debt to equity ratio of 400%.

Commenting on the bond sale, a high-yield debt underwriter at a western bank in Hong Kong told the FT that “Evergrande is very levered, so, yes, they do need cash,” said “That said, they are not a name we see as having a near-term liquidity crisis. That cannot be said about other smaller players.”

That was in November; and while there are no signs that the funding situation at Evergrande has deteriorated sharply since then – especially since the company is widely seen as systematically important and Beijing would never let it fail (although the same was said about Kaisa, another Chinese property developer that did default not too long ago), it now appears that the company has decided to start liquidating properties in an unexpected scramble to either gain market share, or to obtain much needed funding.

In any case, the fact that China’ largest property developer is now slashing prices across the board by as much as 10%, means that a deflationary hurricane is about to blow across what most see as the most important sector in China’s economy, and worse, should other property developers follow in slashing prices launching a race to the bottom, nobody knows how far prices could truly fall should a liquidation domino effect ensue.

What is most troubling however, is that as recently as November, the property slowdown was seen to be in large part due to efforts by city governments to restrain runaway price increases, which has included draconian interventions such as price controls and sales bans.

However, now that Evergrande is rushing to slash prices, it appears that runaway home prices are no longer a concern for Beijing, and in fact, a far greater concern is how Beijing may intervene to prevent what could soon be a price plunge spiral; many have already speculated that Beijing will have no choice but to bar Evergrande’s sales. If it doesn’t, or if homeowners have already figured out that their home prices are floating in the sky on a bubbly foundation that has now burst, the knock on effect could be devastating as instead of an asset, China’s most popular and aspirational “wealth effect” product could turn into a liability overnight.

If that happens, no amount of intervention by Beijing could stop the avalanche of selling that would ensue, not to mention the deflationary shock wave that a hard landing – i.e. crash – in China’s housing market would launch across the entire world…

Source: ZeroHedge

The US Consumer Just Hit A Brick Wall: Here’s Why In 15 Charts

When it comes to the growth dynamo behind the global economy, nobody can match the US consumer – not even China: accounting for trillions in annual spending, the US consumer, who represents roughly 70% of US GDP, is also responsible for roughly 17% of global GDP, slightly ahead of the entire country of China.

https://zh-prod-1cc738ca-7d3b-4a72-b792-20bd8d8fa069.storage.googleapis.com/s3fs-public/styles/inline_image_mobile/public/inline-images/US%20consumer%20crushed%201.jpg

However, as recent economic data has shown, the future of the US consumer is suddenly looking ominously cloudy, for two big reasons: rising interest rates, which as Deutsche Bank notes are “beginning to bite” as observed in the number of working hours in sector selling big ticket items…

https://zh-prod-1cc738ca-7d3b-4a72-b792-20bd8d8fa069.storage.googleapis.com/s3fs-public/styles/inline_image_mobile/public/inline-images/fed%20hikes%20begin%20to%20bite.jpg

… and increasingly tighter loan terms, which coupled with softer loan demand means that the purchasing power of the US consumer is suddenly facing a very troubling air pocket.

https://zh-prod-1cc738ca-7d3b-4a72-b792-20bd8d8fa069.storage.googleapis.com/s3fs-public/styles/inline_image_mobile/public/inline-images/US%20consumer%20credit%20conditions.jpg

One driver behind the sudden drop in loan demand may also be the most obvious one: interest rates on credit cards have soared to the highest in over two decades…

https://zh-prod-1cc738ca-7d3b-4a72-b792-20bd8d8fa069.storage.googleapis.com/s3fs-public/styles/inline_image_mobile/public/inline-images/US%20Consumer%20crushed%202.jpg

… while auto loan interest rates are now the highest since 2011 and rapidly rising, making the average auto loan payment the highest on record as reported recently.

https://zh-prod-1cc738ca-7d3b-4a72-b792-20bd8d8fa069.storage.googleapis.com/s3fs-public/styles/inline_image_mobile/public/inline-images/US%20consumer%20crused%20soaring%20auto%20loan%20rates.jpg

It’s not just credit cards and auto loans: the aggregate household interest payment has soared at a 15% Y/Y rate. Virtually every prior time when interest payments spiked this much, a recession promptly followed.

https://zh-prod-1cc738ca-7d3b-4a72-b792-20bd8d8fa069.storage.googleapis.com/s3fs-public/styles/inline_image_mobile/public/inline-images/Consumer%20household%20interest%20payments.jpg

And while not quite at “redline levels” just yet, interest payments as a share of total household spending has jumped to the highest level since the financial crisis.

https://zh-prod-1cc738ca-7d3b-4a72-b792-20bd8d8fa069.storage.googleapis.com/s3fs-public/styles/inline_image_mobile/public/inline-images/interest%20payments%20as%20share%20of%20household%20spending.jpg

Meanwhile, as US purchasing power shrinks, so do intentions to purchase both cars…

https://zh-prod-1cc738ca-7d3b-4a72-b792-20bd8d8fa069.storage.googleapis.com/s3fs-public/styles/inline_image_mobile/public/inline-images/us%20consumer%20downside%20risk%20car%20sales.jpg

… and houses.

https://zh-prod-1cc738ca-7d3b-4a72-b792-20bd8d8fa069.storage.googleapis.com/s3fs-public/styles/inline_image_mobile/public/inline-images/US%20consumer%20risk%20home%20sales.jpg

And while many legacy economists and pundits have said to ignore the dismal December retail sales print, considering the collapse in spending intentions for most other goods and services, it is only a matter of time before consumer spending slides into recession (and the latest retail sales print is confirmed as the accurate one).

https://zh-prod-1cc738ca-7d3b-4a72-b792-20bd8d8fa069.storage.googleapis.com/s3fs-public/styles/inline_image_mobile/public/inline-images/retail%20sales%20consumer%20spending.jpg

With rates rising, and with ever greater monthly payments, both credit card…

https://zh-prod-1cc738ca-7d3b-4a72-b792-20bd8d8fa069.storage.googleapis.com/s3fs-public/styles/inline_image_mobile/public/inline-images/US%20consumer%20credit%20card%20loans%20delinquent.jpg

… and auto delinquencies are surging.

https://zh-prod-1cc738ca-7d3b-4a72-b792-20bd8d8fa069.storage.googleapis.com/s3fs-public/styles/inline_image_mobile/public/inline-images/US%20delinquent%20auto%20loans%20consumer.jpg

And so, with the credit cycle having peaked and absent rate cuts (and QE) by the Fed, only set to make life for US consumers even more difficult, it is just a matter of time before the economic slowdown follows.

https://zh-prod-1cc738ca-7d3b-4a72-b792-20bd8d8fa069.storage.googleapis.com/s3fs-public/styles/inline_image_mobile/public/inline-images/us%20consumer%20credit%20cycle%20vs%20economic%20cycle.jpg

As usually happens, one generation is especially exposed to the upcoming period of economic weakness: the millennials, whose delinquency rate is already the highest among all age cohorts.

https://zh-prod-1cc738ca-7d3b-4a72-b792-20bd8d8fa069.storage.googleapis.com/s3fs-public/styles/inline_image_mobile/public/inline-images/US%20consumer%20millennial%20facing%20financial%20challenges.jpg

Finally, while all of the above have yet to hit the US economy where GDP recently printed at a solid 2.6% in Q4, in Q1 GDP is expected to plunge below 1% (Atlanta Fed has it at a paltry 0.3%); once that happens, US small business confidence which is already plunging at the fastest rate since the financial crisis after having soared higher after the Trump election, will crater sending the US economy into a steep recession if not worse.

https://zh-prod-1cc738ca-7d3b-4a72-b792-20bd8d8fa069.storage.googleapis.com/s3fs-public/styles/inline_image_mobile/public/inline-images/US%20consumer%20domestic%20sentiment.jpg

Source: ZeroHedge

American Farm Debt Reaches 1980s Crisis Levels

Debt among American farmers has increased to $409 billion, Agriculture Secretary Sonny Perdue warned Wednesday. That is up from $385 billion last year and is currently at levels not seen since the agricultural recession (farm crisis) of the 1980s, reported Reuters.

“Farm debt has been rising more rapidly over the last five years, increasing by 30% since 2013 – up from $315 billion to $409 billion, according to USDA data, and up from $385 billion in just the last year – to levels seen in the 1980s,” Perdue said in his testimony to the House Agriculture Committee.

Purdue told lawmakers: “Relatively firm land values have kept farmer debt-to-asset levels low by historical standards at 13.5%, and continued low-interest rates have kept the cost of borrowing relatively affordable.”

“But those average values mask areas of greater vulnerability,” he added.

The agricultural sector has experienced tremendous headwinds in the last five years amid deflationary trends in commodity prices, storms damaging crops, and more recent – supply chain disruptions into China due to President Donald Trump’s trade war.

“As producers are not able to cover year to year expenses with operating loans, they are forced into transforming operating loans into term debt which erodes their creditworthiness,” said Luis Ribera, an agricultural economist at Texas A&M University.

“On top of all that then we have the trade war which reduces the demand of US commodities given that tariffs make them more expensive and then depress the prices even more.”

US Department of Agriculture chief economist Robert Johansson said farm exports are expected to drop by as much as $1.9 billion this year, citing the deepening trade war.

China has been a significant buyer of corn, soybeans and other agricultural commodities for at least three decades, but since President Trump launched protectionist policies, Beijing responded by imposing tariffs on American agriculture products which caused trade between both countries to decline. While Beijing has promised to buy hundreds of billions of dollars in agricultural items, it has offered little relief to soybean farmers who are teetering on bankruptcy even with President Trump’s farm bailout money in hand. But as recent trade negotiations might result in an upcoming lasting agreement, it might not be enough to save hundreds of heavily indebted American farms from sliding into bankruptcy. 

https://www.zerohedge.com/s3/files/inline-images/farm%20map.png?itok=ZKqc3yif

The number of farmers filing for bankruptcy has soared to its highest level in a decade. And with high levels of debt, bankruptcies are expected to rise into the 2020s.

Perdue said land values have helped some farmers maintain a low debt-to-asset ratio of 13.5%. However, in the next recession, land values are expected to dip, which could trigger a deleveraging period for farmers on par with the 1980s farm crisis.

Source: ZeroHedge

American Retail Apocalypse: 465 Store Closures In 48 Hours

Following government shutdown delays, data for Dec and Jan spending and income collapsed on Friday. This was one of the most significant drops in consumer spending since the financial crash.

https://www.zerohedge.com/s3/files/inline-images/2019-03-01_5-31-13_0.jpg?itok=9fvdwL42

As if the situation wasn’t already dire enough, US consumers dialed back their spending in the last several months has put a sizeable dent into sales growth and foot traffic at US malls.

Last month, we noted that the “Retail Apocalypse” Isn’t Over: It Is Only Just Getting Started”.

We were right.

Fox 5 NY is reporting that major chains such as Gap, JCPenney, Victoria’s Secret and Foot Locker have all announced massive closures, totaling more than 465 stores in the last 48 hours.

https://www.zerohedge.com/s3/files/inline-images/dead%20mall%20walking.jpg?itok=-Q6T8e5C

All four companies reported its fourth-quarter results last week for the holiday period, with three of them (Gap, JCPenney and Victoria’s Secret) reporting a sizeable decline in same-store sales, while Foot Locker had modest growth.

With somewhat decent growth, because apparently, consumers still need to walk, Foot Locker shocked investors Friday with 165 store closures across the country.

That comes less than 24 hours after Gap told investors it would close 230 over the next several years after the company’s same-store sales plunged 7% during the holiday quarter.

https://www.zerohedge.com/s3/files/inline-images/dead%20mall.jpg?itok=dNQz4g-T

If the hemorrhaging wasn’t enough, JCPenney was back on the chopping block with 18 more department store closures through the second half of this year, including three from January.

Bob Phibbs, CEO of New York-based consultancy the Retail Doctor, believes JCPenney will announce another round of stores closures in the second half.

“It is mind boggling that JC Penney still thinks they have time when the clock has run out and there’s no real plan. Closing 18 stores is barely a drop in the bucket of JC Penney’s more than 850 stores. If this was a big, bold effort to reinvigorate the brand, they would have announced they were closing hundreds of stores and investing in an outstanding experience at their other locations,” Phibbs told FOX Business.

That builds on recent store closure announcements by Gymboree, Payless ShoeSource, Charlotte Russe and Ann Taylor, to name a few. Even Tesla last week announced it would be closing most of its US showrooms.

A whopping 4,500 store closures have been announced by retailers so far this year. The number is expected to increase in the coming months, as growth prospects for the US economy are expected to be at near zero for the first quarter.

Source: ZeroHedge

Bond Illiquidity, LIBOR and You

Summary
  • A letter to the Alternative Reference Rates Committee (ARRC) from the Secured Finance Industry Group (SFIG) put an end to the fiction that major financial institutions support SOFR.
  • Financial institutions are justly concerned that SOFR could fatally squeeze bank margins in a crisis.
  • Nevertheless, other proposed alternatives, such as the changes to LIBOR proposed by Intercontinental Exchange (ICE), do not fit the regulators’ requirement that the replacement be determined by liquid market transactions prices.
  • Regulators cannot introduce a new financial instrument. LIBOR’s replacement must be the result of private sector innovation.

(Kurt Dew) A recent Secured Finance Industry Group (SFIG) comment letter is SFIG’s response to a request for comment by the Alternative Reference Rates Committee (ARRC) – a Fed-appointed committee of bankers tasked to solve the LIBOR problem. The Fed’s ARRC creation was an embarrassingly transparent attempt by the regulators to co-opt industry objections to their LIBOR replacement. ARRC proposes to replace LIBOR by the Secured Overnight Financing Rate (SOFR) – a Fed-created version of the overnight repurchase agreement rate. The SFIG comment details the objections of financial institutions to SOFR. Importantly, SFIG serves as chair of ARRC. The critical comment letter is thus the final blow to the regulators’ failed effort to gain the appearance of financial institution support for SOFR.

However, more importantly, neither financial institutions nor their regulators have a clear plan to resolve the need to replace LIBOR. If replacing LIBOR were not such a critical matter, the Byzantine machinations of the bank regulators and financial institutions around SOFR would be amusing. However, the pricing of tens of trillions in debt instruments and hundreds of trillions in derivative instruments depends on a smooth transition to some reference rate other than LIBOR. I contend that this enormous magnitude is a low estimate of the financial market assets at risk due to poorly governed debt markets.

Financial markets’ failure to solve the LIBOR replacement problem is the result of a misunderstanding of the reasons for the LIBOR problem. Understanding of LIBOR suffers from journalistic misdirection, on one hand, and a misunderstanding of the root problem that the LIBOR brouhaha exemplifies, on the other.

The failure of LIBOR is a market structure failure. However, the financial press bills LIBOR’s failure mistakenly as a failure of ethics among bankers. Recorded transcripts of telephone, email, and chat room conversations of small groups of traders provided the evidence of ethical weaknesses leading to attempted market manipulation that drove the post-Financial Crisis LIBOR embarrassment.

However, markets themselves typically are the best antidote to attempted market manipulation. The market solution to trader cabals formed to alter prices has always been a simple one. In a liquid market, larger market forces inevitably swamp organized efforts to manipulate prices. Cabals don’t work in a liquid market because the manipulators lose money.

The split over a LIBOR is an enormous opportunity.

Financial institutions have quite reasonably insisted on two key properties that SOFR lacks.

  • The LIBOR replacement should be forward-looking. That is, the rate should reflect the market’s opinion of overnight interest costs on average in the coming three months.
  • The LIBOR replacement should reflect the interest cost of private unsecured borrowers, instead of the lower interest costs of the Treasury.

Thus, coupled with the TBTF banks’ endorsement of the Intercontinental Exchange Inc. (ICE) candidate for a LIBOR replacement, the SFIG letter shows that ARRC’s SOFR proposal does not represent the banks and other financial institutions that are ARRC members. Worse, it raises a serious threat. If regulators seize on an index that might potentially bankrupt one or more major financial institutions during a financial crisis, those institutions do not plan to allow the Fed to pass the blame for this disastrous decision to them.

However, the banks (or a third party) will, I believe, have to do more than provide another bank-calculated index. The self-acknowledged problem with the ICE (TBTF endorsed) LIBOR replacement is that any index the procedure produces is the result of a transaction selection process by banks themselves. Thus, the ICE fix remains vulnerable to the same ethical vulnerabilities that LIBOR itself faced.

In short, any satisfactory LIBOR replacement must be a form of debt that doesn’t exist now. We could throw up our hands and use the hazardous SOFR, but this seems to be a negative way of looking at the situation.

This is an obvious opportunity to seize an enormous chunk of the financial markets in one fell swoop by addressing bond market illiquidity more generally. Moreover, it is an opportunity that anybody with the courage and the capital could pursue. The problem is one of creating a new debt market with a different structure. Such a new market would have no incumbent oligopolies and no reactionary regulators. Capital, a few hotshot IT professionals, and some people with skills of persuasion would be enough ammunition to get the job done. Island overwhelmed the incumbent stock exchanges with less.

Interestingly, in all likelihood, TBTF banks, incumbent exchanges, and regulators are at a disadvantage in the pursuit of a debt market innovation since they are married to old ways of generating revenues. An incumbent TBTF bank pursuing a new market structure, for example, would not find management friendly to ideas such as putting an end to collateral hypothecation in the repo market.

Why are we getting LIBOR wrong?

SFIG and the TBTF banks also concede that there is no existing instrument that meets the minimal standards required of a LIBOR replacement – the replacement should be a term (probably three-month, or six-month) unsecured debt instrument, traded in a liquid marketplace where recorded transaction prices are the result of the combined forces of supply and demand. SFIG’s comment letter to ARRC’s request to comment on SOFR points to a central quandary that neither SOFR nor its detractors have addressed. No financial instrument meets these criteria today.

Don’t blame the Fed. The Fed did everything imaginable to get industry support for repurchase agreements, the only existing liquid instrument where an honest broker (the Fed) records market transactions. Blame the markets themselves. Organized market participants are adopting the time-honored “See no evil; hear no evil; speak no evil.” approach. Once ARRC had endorsed SOFR, CME Group (CME) helpfully created a futures contract based on SOFR.

All that remained was for the markets to begin trading the SOFR-based instruments. However, that didn’t happen. CME volume in SOFR futures remains a small fraction of Eurodollar (LIBOR) futures volume. In itself, this is not a failing of the marketplace. It’s simply the market’s recognition that SOFR futures don’t provide adequate protection for their existing risks.

How big is the LIBOR problem?

No matter how dire you believe the LIBOR problem to be, the underlying problem of debt market illiquidity that the LIBOR problem reveals is many times bigger. A LIBOR fix only resolves the issue of illiquidity in the short-term end of the market for unsecured debt.

LIBOR became important to society when it began to appear as a factor in the cost of mortgages, municipal debt, and credit card debt. In other words, LIBOR is different from the interest cost of a corporate bond because of LIBOR’s visibility. However, of course, all bank debt, no matter how obscure, is a factor in the cost of consumer borrowing.

An exchange trading liquid tailor-made debt issues that capture the primary price risks associated with debt issuance at all maturities would have a massive beneficial effect on the cost of financing. This market would generate transactions comparable to the combined volume of the stock exchanges, assuming turnover in the two markets to be comparable.

What flaw in market structure creates the LIBOR/debt market liquidity problem? In the markets for corporate liabilities, the issuer is concerned about the market appeal of the terms upon which debt is sold only once – the issue date. After that, any action the corporation might take that benefits its stockholders at the expense of its debtholders faces a single low hurdle – is it legal? Investors are wise to devote more time and attention to debt acquisition than to share acquisition.

If bondholders could devise an instrument that liberates its holder from the negative effects on debt valuation of the decision-making power of a single issuer, it would be interesting to see what effect that would have on the position within corporate politics of debtholders relative to stockholders. One could imagine the popularity of this buyer-friendly instrument growing relative to the popularity of the current issuer-centric debt issues. As this form of debt grows as a share of the market for debt, the management of this debt would become gatekeepers for bond market liquidity. They might gradually induce issuers to write more buyer-friendly forms of debt.

The legal obligation of corporate management to consider the interest of stockholders when these interests conflict with the interests of debtholders is writ in stone. Nevertheless, there is no legal barrier to investors – the final constituency for all corporate obligations – using their influence to discriminate among debt issues. If debtholders confront stockholders with a positive payoff to pleasing debtholders, there might be multiple systemic improvements. The value of buyer-friendly debt would rise relative to issuer-friendly issues, driving down its interest cost and resulting in capital gains to both debt and shareholders. The result would be an altogether safer financial system as a whole.

Source: by Kurt Dew, Think Twice Finance | Seeking Alpha

The Man Behind Billionaires’ Row Battles to Sell the World’s Tallest Condo

(The Wall Street Journal) Gary Barnett was sitting in his Manhattan office one morning in the fall when his old-fashioned flip phone started to buzz. On the line was a real-estate agent who was marketing the New York developer’s latest condo project, a soaring 1,550-foot tall building known as Central Park Tower. With a total projected sellout of more than $4 billion, the skyscraper is the country’s priciest-ever condominium project and, when complete, will be the tallest residential building in the world.

The agent had bad news. Mr. Barnett had…

Gary Barnett was sitting in his Manhattan office one morning in the fall when his old-fashioned flip phone started to buzz. On the line was a real-estate agent who was marketing the New York developer’s latest condo project, a soaring 1,550-foot tall building known as Central Park Tower. With a total projected sellout of more than $4 billion, the skyscraper is the country’s priciest-ever condominium project and, when complete, will be the tallest residential building in the world.

The agent had bad news. Mr. Barnett had agreed to reduce a condo’s asking price, but now the client refused to sign a non-disclosure agreement concealing the details of the deal. Mr. Barnett’s response: Turn him away. “If we’re going to give someone a special deal, we don’t want them saying it all over the market,” he said.

This is a harsh new reality for Mr. Barnett, who has made a fortune fulfilling the real-estate dreams of the world’s elite. The Extell Development Co. founder kicked off the U.S. condo boom with One57, the first of the supertall towers that line the 57th Street corridor now known as Billionaire’s Row. The building’s penthouse sold for $100.5 million in 2014 to tech mogul Michael Dell, the record high for New York City.

His success opened the door for other high-end towers across the city, permanently altering the Manhattan skyline. “The frenzy around One57 gave everyone the idea that this was a market that was ripe to be harvested,” said real-estate appraiser Jonathan Miller.

Central Park Tower is by some measures more audacious than anything that’s preceded it. The supertall skyscraper will feature panoramic views of the city and offer amenities like indoor and outdoor swimming pools, a 1,000-foot-high private club and a basketball court. Of the building’s 179 units, no fewer than 18 are priced above $60 million.

Gary Barnett kicked off the U.S. condo boom with One57. Central Park Tower, shown in a rendering, is the company’s latest project on Manhattan’s Billionaire’s Row.

Mr. Barnett is marketing this super-luxury tower in a challenging climate: Manhattan home sales plunged by 14% in 2018, the steepest drop the industry has seen since the financial crisis in 2009, according to a report by brokerage Douglas Elliman Real Estate. Today, developers are slashing prices amid an oversupply of new luxury condos.

Some people wonder if Mr. Barnett will become a victim of the condo explosion he helped create. The great Manhattan condo boom “started with One57,” said Mr. Miller, “and it may end with Central Park Tower.”

Earlier this week, Mr. Barnett announced that he had hired Sush Torgalkar, formerly the chief operating officer of Westbrook Partners, as CEO to assist in managing the company’s growth. Mr. Barnett will stay on as the company’s chairman.

A self-described “poor boy from the Lower East Side,” Mr. Barnett grew up as Gershon Swiatycki, the son of a Talmudic scholar. His entry into the world of luxury goods came in 1980s, when he met his first wife Evelyn Muller, whose father owned a diamond business. Mr. Barnett traded precious stones in Belgium for over a decade before starting to invest in U.S. real estate.

Arriving at the sales office in a dark suit with black sneakers and a bold, flowered tie that he said is “probably 20 years old,” the 63-year-old developer is an unlikely purveyor of luxury homes. An observant Jew who largely eschews the flashy trappings of the industry, Mr. Barnett lived in Queens until moving recently with his wife and children to the heavily Orthodox suburb of Monsey, N.Y., about an hour’s drive north of the city. (He keeps a one-bedroom unit at One57 to make more time for work.)

Mr. Barnett’s refusal to give up the antiquated flip phone is a source of indulgent eye-rolling from colleagues. He often avoids computers, said a person who has worked with him; instead, his assistant prints out his emails and leaves them on his desk, where he annotates them in what one employee describes as “serial-killer scrawl” for staff to decipher.

He’s “a total nerd,” real-estate agent Nikki Field said affectionately. “He’s not a New York developer personality in any way.”

Other Manhattan developers thought Mr. Barnett was crazy when he started building One57 in 2010, the depths of the real-estate downturn. And after no major U.S. lenders would back him, he turned to the Middle East to obtain financing from two of Abu Dhabi’s wealthiest investment funds.

His gamble paid off handsomely. As One57 started sales, U.S. economic growth snapped back. As one of the few new luxury condo buildings on the market, One57 attracted billionaires from Russia, China and the Middle East. The condominium is the first ever New York City building to break the $100 million threshold for a single condo.

Central Park Tower faces a far more crowded field of competitors—including One57, where Extell still has units to sell. Approximately 3,763 new Manhattan condo units are in the pipeline for 2019, followed by an additional 4,539 in 2020, new development marketing firm Corcoran Sunshine said late last year. By contrast, in 2011 when One57 started sales, only 277 Manhattan new units launched.

Today, the builders of pricey mega-towers “are going to find themselves in a lot of trouble,” said Andrew Gerringer of the Marketing Directors, a development-marketing firm. “Those are just going to be really difficult to sell.”

But Mr. Barnett is pulling out all the stops. In a newly opened sales office at Central Park Tower, potential buyers sip Champagne and Johnnie Walker Black Label amid a onyx-clad walls and Lalique crystal chandelier. In a dimly lighted room with 14-foot ceilings, strains of Gershwin’s “Rhapsody in Blue” fill the air as New York City landmarks are projected on the walls—Yankee Stadium, the Statue of Liberty, the Empire State Building. “Is there any place that has symbolized individual success and collective ambition as boldly as New York?” booms the voiceover, describing Central Park Tower as “1,550 feet of steel, ambition and aspiration anchored to 40,000 square feet of Manhattan schist…a shimmering beacon of class, optimism and chutzpah.”

Central Park Tower has already overcome some hurdles. When real-estate company Vornado Realty Trust started planning a competing condo two blocks north, Mr. Barnett stalled the project by taking control of a parking garage on Vornado’s property in addition to other property and air rights it owned on the block. Then Mr. Barnett refused to let Vornado tear down the parking garage to make way for its tower. The dispute was eventually resolved in 2013 when Vornado agreed to pay Extell $194 million for development rights on the block. As part of the settlement, both developers agreed to move their towers slightly so they both could have Central Park views.

Lining up financing for Central Park Tower was also a challenge, since banks have pulled back from financing ultra-luxury condos amid worries of oversupply. Mr. Barnett cobbled together debt from a public offering on the Israeli bond market and tapped the EB-5 program, which grants green cards to foreigners who invest in the U.S. He also brought on SMI USA, the U.S. subsidiary of the real estate investment firm Shanghai Municipal Investment, as a co-developer. Ultimately, Mr. Barnett began construction on Central Park Tower using Extell’s own funds before securing the money to finish it, an unusual move on such a large project. He had built more than 10 stories before J.P. Morgan Chase & Co. agreed to provide a $900 million construction loan. Now he must sell $500 million in apartments at Central Park Tower by December 2020 and pay down $300 million of his loan to J.P. Morgan Chase by the following year, according to information disclosed to Israeli bond investors, who have money in the project. If he fails to meet those deadlines, the bank can increase his interest payments.

Extell has many units to sell in addition to Central Park Tower, including One Manhattan Square on the Lower East Side, which has roughly 800 units.

Of the 179 units in Central Park Tower, no fewer than 18 are priced above $60 million.Photo: Dorothy Hong for The Wall Street Journal

In an email to brokers last month, Extell advertised major incentives at its projects, saying it would pay three to five years of common charges on any Extell condo purchased before the end of 2018—at Central Park Tower, that could save the buyer of a full-floor apartment about $120,000 per year. That incentive wasn’t renewed for 2019, although Extell is still paying a 50% commission to brokers and says it will roll out new incentives soon. With buyers “saying they’ll wait a little bit and see if prices come down more,” Mr. Barnett explained, “we want to give them an incentive to act.”

He declined to say how many units he’s sold at Central Park Tower, noting only that traffic had been “decent” and that he isn’t concerned about missing financing deadlines. “We’re certainly going through a dip in the market, but we’re priced for that dip,” Mr. Barnett said confidently. In the current market, he added, “you’ve got to be a little more flexible on price.”

Extell is also leveraging the roster of billionaires it accumulated during One57’s glory days. But the strategy could backfire, especially as sellers who bought condos there a couple of years ago are suffering losses. In one instance, Canadian billionaire Lawrence Stroll sold a One57 unit for $54 million, over $1 million less than what he paid in 2014. One57 has even seen a foreclosure, a rarity in New York’s high-end real estate. In 2017, an apartment that had been owned by shell companies linked to a Nigerian businessman sold in a foreclosure auction for $36 million, far less than the $50.9 million purchase price in 2014.

But these challenges seem to be part of the allure for Mr. Barnett, who said in comparison to his former business, he relishes the complexity of New York City real-estate deals. “These buildings are amazing buildings—they’re complicated, they’re fine-tuned,” he said. “Diamonds are a much simpler business.”

‘Billionaire’s Row’ Boom

Completed in 2015, One57 helped turn nondescript 57th Street into ‘Billionaire’s Row.’ Photo: Dorothy Hong for The Wall Street Journal

Since the emergence of ‘Billionaire’s Row’ in Manhattan, home values in the area have skyrocketed.

An analysis of sales data looked at transactions between 2010 to 2018 of homes from 57th to 59th streets between Park Avenue and Broadway. During that time, the median sale prices leapt 64.3%, from $1,261,406 in 2010 to $2,072,500 eight years later, according to Streeteasy.com. By comparison, the median home sale price across Manhattan rose 25.7%, from $835,000 to $1.05 million, during that same period.

Source: by Katherine Clarke and Candace Taylor | The Wall Street Journal

The Most Splendid Housing Bubbles in America Get Pricked

San Francisco Bay Area & Seattle lead with biggest multi-month drops since 2012; San Diego, Denver, Portland, Los Angeles decline. Others have stalled. A few eke out records.

San Francisco and San Diego are catching the Seattle cold, and others are sniffling too, as the most splendid housing bubbles in America are starting to run into reality.

House prices in the Seattle metro dropped 0.6% in December from November, according to S&P CoreLogic Case-Shiller Home Price Index, released this morning, and have fallen 5.7% from the peak in June 2018, the biggest six-month drop since the six-month drop that ended in February 2012 as Housing Bust 1 was bottoming out. The index is now at the lowest level since February 2018. After the breath-taking spike into June, the index is still up 5.1% year-over-year, and is 27% higher than it had been at the peak of Seattle’s Housing Bubble 1 (July 2007):

https://wolfstreet.com/wp-content/uploads/2019/02/US-Housing-Case-Shiller-Seattle-2019-02-26.png

So Seattle’s Housing Bubble 2 is unwinding, but more slowly than it had inflated. Many real estate boosters simply point at the year-over-year gain to say that nothing has happened so far — which makes it a picture-perfect “orderly decline.”


San Francisco Bay Area:

The Case-Shiller index for “San Francisco” includes five counties: San Francisco, San Mateo (northern part of Silicon Valley), Alameda, Contra Costa (both part of the East Bay ), and Marin (part of the North Bay). In December, the index for single-family houses fell 1.4% from November, the steepest month-to-month drop since January 2012. The index is now down 3% from its peak in July, the biggest five-month drop since March 2012.

Given the surge in early 2018, the index is still up 3.6% from a year ago and remains 37% above the peak of Housing Bubble 1, fitting into the theme of a perfect orderly decline:

https://wolfstreet.com/wp-content/uploads/2019/02/US-Housing-Case-Shiller-San-Francisco-Bay-Area-2019-02-26.png

Case-Shiller also has separate data for condo prices in the five-county San Francisco Bay Area, and this index fell 0.9% in December from November, after an blistering 2.4% drop in the prior month. From the peak in June 2018, the index has now dropped 4.2%, the steepest six-month drop since February 2012:

https://wolfstreet.com/wp-content/uploads/2019/02/US-Housing-Case-Shiller-San-Francisco-Bay-Area-Condos-2019-02-26.png

The Case-Shiller Home Price Index is a rolling three-month average; this morning’s release tracks closings that were entered into public records in October, November, and December. By definition, this causes the index to lag more immediate data, such as median prices, by several months.

The index is based on “sales pairs,” comparing the sales price of a house in the current month to the prior transaction of the same house years earlier (methodology). This frees the index from the issues that plague median prices and average prices — but it does not indicate prices.

It was set at 100 for January 2000; a value of 200 means prices as tracked by the index have doubled since the year 2000. Every index on this list of the most splendid housing bubbles in America, except Dallas and Atlanta, has more than doubled since 2000.

The index is a measure of inflation — of house-price inflation. It tracks how fast the dollar is losing purchasing power with regards to buying the same house over time.

So here are the remaining metros on this list of the most splendid housing bubbles in America.

San Diego:

House prices in the San Diego metro declined 0.7% in December from November and are now down 2.6% from the peak in July, the biggest five-month drop since March 2012, leaving the index at the lowest level since February 2018, and just one hair above the peak of Housing Bubble 1:

https://wolfstreet.com/wp-content/uploads/2019/02/US-Housing-Case-Shiller-San-Diego-2019-02-26.png

Los Angeles:

The Case-Shiller index for the Los Angeles metro was about flat in December with November but down 0.5% from the peak in August — don’t laugh, the largest four-month decline since March 2012. What this shows is just how relentless Housing Bubble 2 has been. The index is up 3.7% year-over-year:

https://wolfstreet.com/wp-content/uploads/2019/02/US-Housing-Case-Shiller-Los-Angeles-2019-02-26-B.png

Portland:

The Case-Shiller Index for the Portland metro inched down in December from November for the fifth month in a row and is now down 1.4% from the peak in July 2018. And that was the steepest five-month drop since March 2012. Year-over-year, the index was up 3.9%:

https://wolfstreet.com/wp-content/uploads/2019/01/US-Housing-Case-Shiller-Portland-2019-01-29.png

Denver:

House prices in the Denver metro edged down in December from November for the fourth month in a row, after an uninterrupted 33-month run of monthly increases. The four-month drop amounted to 0.9%, which, you guessed it, was the steeped such drop since March 2012. The index is at the lowest level since May 2018 but is still up 5.5% year-over-year:

https://wolfstreet.com/wp-content/uploads/2019/02/US-Housing-Case-Shiller-Denver-2019-02-26.png

Dallas-Fort Worth:

The Case-Shiller Index for the Dallas-Fort Worth metro in December ticked up by less than a rounding error to a new record, leaving it essentially flat for the seventh month in a row. The index is up 4.0% year-over-year:

https://wolfstreet.com/wp-content/uploads/2019/02/US-Housing-Case-Shiller-dallas-2019-02-26.png

Boston:

In the Boston metro, house prices dipped 0.5% in December from a record in November and are now back where they’d been in June. The Case-Shiller Index is up 5.3% from a year ago:

https://wolfstreet.com/wp-content/uploads/2019/02/US-Housing-Case-Shiller-Boston-2019-02-26.png

Atlanta:

The Case-Shiller Home Price Index for the Atlanta metro inched up a smidgen in December, to a new record, and is up 5.9% from a year ago:

https://wolfstreet.com/wp-content/uploads/2019/02/US-Housing-Case-Shiller-Atlanta-2019-02-26.png

New York City Condos:

The Case-Shiller index for condo prices in the New York City metro ticked down in December for the second month in a row after a mighty bounce in September and an uptick in October. This index can be volatile, but after all these bounces and declines, the index was up just 1.5% from a year ago, the smallest year-over-year price gain on this list of the most splendid housing bubbles in America:

https://wolfstreet.com/wp-content/uploads/2019/02/US-Housing-Case-Shiller-New-York-condos-2019-02-26.png

On a national basis, these individual markets get averaged out with other markets that didn’t quite qualify for this list since their housing bubble status has not reached the ultimate splendidness yet. Some of those markets, such as the huge metro of Chicago, remain quite a bit below their Housing Bubble 1 peaks and are now declining, while others are shooting higher.

So the Case-Shiller National Home Price Index has been about flat since July, but is still up 4.7% year-over-year and is 11% higher than it had been at its prior peak in July 2006 during Housing Bubble 1:

https://wolfstreet.com/wp-content/uploads/2019/02/US-Housing-Case-Shiller-National-Index-2019-02-26.png

It always boils down to this: Regardless of how thin you cut a slice of bologna, there are always two sides to it. When home prices drop after a housing bubble, there are many losers. But here are the winners – including a whole generation. Listen to my latest podcast, an 11-minute walk on the other side…

Enjoy reading WOLF STREET and want to support it? Using ad blockers – I totally get why – but want to support the site? You can donate “beer money.” I appreciate it immensely. Click on the beer mug to find out how:

Would you like to be notified via email when WOLF STREET publishes a new article? Sign up here.

US Pending Homes Sales Tumble YoY For 13th Straight Month

After plunging further in December, January Pending Home Sales rebounded more than expected (+4.6% MoM vs +1.0% MoM exp) but remains lower YoY for the 13th straight month.

https://www.zerohedge.com/s3/files/inline-images/2019-02-27_7-03-55.jpg?itok=9ismcUUK

“A change in Federal Reserve policy and the reopening of the government were very beneficial to the market,” NAR Chief Economist Lawrence Yun said in a statement.

“Homebuyers are now returning and taking advantage of lower interest rates, while a boost in inventory is also providing more choices for consumers.”

On a Year-over-year basis, the rebound left Pending Home Sales down just 2.27% YoY, but that is still the 13th annual drop in a row…

https://www.zerohedge.com/s3/files/inline-images/2019-02-27_7-05-13.jpg?itok=7nDh-48k

https://youtu.be/MbmM1WzcwxY

Source: ZeroHedge

***

More Home-Sellers are Dropping Their Prices Than in Previous Winters as Buyers Seize More Control of the Market

https://www.redfin.com/blog/wp-content/uploads/2019/02/price-drops-national_february-2019.png

More than one in five homes for sale nationwide dropped its price in the last month. In Fresno it was two in five.

Recession Signal Getting Louder: 5-Year Yield Inverts With 3-Month Yield

The yield curve is inverted in 11 different spots. The latest is 5-year to 3-month inversion.

https://www.zerohedge.com/s3/files/inline-images/2019-02-27_5-47-38.jpg?itok=PW46u5cc

The yield curve recession signal is louder and louder. Inversions are persistent and growing.

https://www.zerohedge.com/s3/files/inline-images/https___s3-us-west-2.amazonaws%20%2810%29_1.jpg?itok=a4nvYnOV

Let’s compare the spreads today to that of December 18, the start of the December 2018 FOMC meeting.

Yield Curve 2019-02-26 vs December and October 2018

https://www.zerohedge.com/s3/files/inline-images/https___s3-us-west-2.amazonaws%20%2811%29_1.jpg?itok=fBQyAcf-

Yield Curve Spread Analysis

https://www.zerohedge.com/s3/files/inline-images/https___s3-us-west-2.amazonaws%20%2812%29_1.jpg?itok=rSGh9O9m

Spread Changes

  • Yellow: Spreads Collapsed Since October (1 Month to 5 Years)
  • Pink: Spreads Remained Roughly the Same (7 Year)
  • Blue: Spreads Increased (30-Year and 10-Year)

Something Happening

Something is happening. What is it?

https://www.zerohedge.com/s3/files/inline-images/2019-02-27_5-51-51.jpg?itok=EnviRvls

Possibilities

  1. The bond market is staring to worry about trillion dollar deficits as far as the eye can see
  2. The bond market has stagflation worries
  3. The bond bull market is over or approaching

My take is number one and possibly all three.

An in regards to recession the economy is weakening fast.

Source: by Mike Shedlock via MishTalk| ZeroHedge

***

Core US Factory Orders Suffer Worst Slump In 3 Years

US core factory orders (ex transports) fell for the second month in a row in December. This is the worst sequential drop since Feb 2016.

New orders ex-trans fell 0.6% in Dec. after falling 1.3% the prior month.

https://www.zerohedge.com/s3/files/inline-images/2019-02-27_7-13-00.jpg?itok=bUbibSEj

The headline factory orders rose 0.1% MoM (well below the 0.6% MoM gain expected).

Capital goods non-defense ex aircraft new orders for Dec. fall 1% after falling 1.1% in Nov.

Non-durables shipments for Dec. fall 1% after falling 2% in Nov.

Not a pretty picture, but it was an 8.0% drop in Defense spending that triggered the weakness – so we’re gonna need moar war.

How Low Will Housing Prices Go?

Now that Housing Bubble #2 Is Bursting… How Low Will It Go?

Unless the Fed is going to start buying millions of homes outright, prices are going to fall to what buyers can afford.

There are two generalities that can be applied to all asset bubbles:

1. Bubbles inflate for longer and reach higher levels than most pre-bubble analysts expected

2. All bubbles burst, despite mantra-like claims that “this time it’s different”

The bubble burst tends to follow a symmetrical reversal of very similar time durations and magnitudes as the initial rise. If the bubble took four years to inflate and rose by X, the retrace tends to take about the same length of time and tends to retrace much or all of X.

If we look at the chart of the Case-Shiller Housing Index below, this symmetry is visible in Housing Bubble #1 which skyrocketed from 2003-2007 and burst from 2008-2012.

Housing Bubble #1 wasn’t allowed to fully retrace the bubble, as the Federal Reserve lowered interest rates to near-zero in 2009 and bought $1+ trillion in sketchy mortgage-backed securities (MBS), essentially turning America’s mortgage market into a branch of the central bank and federal agency guarantors of mortgages (Fannie and Freddie, VA, FHA).

These unprecedented measures stopped the bubble decline by instantly making millions of people who previously could not qualify for a privately originated mortgage qualified buyers. This vast expansion of the pool of buyers (expanded by a flood of buyers from China and other hot-money locales) drove sales and prices higher for six years (2012-2018).

As noted on the chart below, this suggests the bubble burst will likely run from 2019-2025, give or take a few quarters.

The question is: what’s the likely magnitude of the decline? Scenario 1 (blue line) is a symmetrical repeat of Housing Bubble #2: a retrace of the majority of the bubble’s rise but not 100%, which reverses off this somewhat higher base to start Housing Bubble #3.

Since the mainstream consensus denies the possibility that Housing Bubble #2 even exists (perish the thought that real estate prices could ever–gasp–drop), they most certainly deny the possibility that prices could retrace much of the gains since 2012.

More realistic analysts would probably agree that if the current slowdown (never say recession, it might cost you your job) gathers momentum, some decline in housing prices is possible. They would likely agree with Scenario 1 that any such decline would be modest and would simply set the stage for an even grander housing bubble #3.

But there is a good case for Scenario 2, in which price plummets below the 2012 lows and keeps on going, ultimately retracing the entire housing bubble gains from 2003.

Why is Scenario 2 not just possible but likely? There are no more “saves” in the Fed’s locker. Dropping interest rates to zero and buying another trillion in MBS won’t have the same positive effects they had in 2009-2018. Those policies have run their course.

https://www.oftwominds.com/photos2019/Case-Shiller2-19a.png

Among independent analysts, Chris Hamilton is a must-read for his integration of demographics and economics. Please read (via Zero Hedge) Demographics, Debt, & Debasement: A Picture Of American Insolvency if you want to understand why near-zero interest rates and buying mortgage-backed securities isn’t going to spark Housing Bubble #3.

Millennials are burdened with $1 trillion in student loans and most don’t earn enough to afford a home at today’s nosebleed prices. When the Fed drops the Fed Funds Rate to zero, it doesn’t follow that mortgage rates drop to zero. They drop a bit, but not enough to transform an unaffordable house into an affordable one.

Buying up $1 trillion in sketchy mortgages worked in 2009 because it bailed out everyone who was at risk of absorbing huge losses as a percentage of those mortgages defaulted. The problem now isn’t one of liquidity or iffy mortgages: it’s the generation that would like to buy homes finds they don’t earn enough, and their incomes are not secure enough, to gamble everything on an overpriced house that chains them to a local economy they might want to leave if opportunities arise elsewhere.

In other words, the economy has changed, and the sacrifices required to buy a house in hot markets at today’s prices make no sense. The picture changes, of course, in areas where 2X or 3X a typical income will buy a house, and 1X a pretty good income will buy a house.

Unless the Fed is going to start buying millions of homes outright, prices are going to fall to what buyers can afford. As China’s debt bubble implodes, the Chinese buyers with cash (probably not even cash, just money borrowed in China’s vast unregulated Shadow Banking System) who have propped up dozens of markets from France to Vancouver will vanish, leaving only the unwealthy as buyers.

The only question of any real interest is how low prices will drop by 2025. We’re so accustomed to being surprised on the upside that we’ve forgotten we can surprised on the downside as well.

https://youtu.be/w75Wl66eG8Y

Source: by Charles Hugh Smith | Of Two Minds

***

US Home Price Growth Weakest Since 2012

https://zh-prod-1cc738ca-7d3b-4a72-b792-20bd8d8fa069.storage.googleapis.com/s3fs-public/styles/teaser_desktop_2x/public/2019-02/2019-02-26_6-01-23.jpg?itok=W11ixPOh


“A decline in interest rates in the fourth quarter was not enough to offset the impact of rising prices on home sales,” 


US Housing Starts Crashed In December

https://zh-prod-1cc738ca-7d3b-4a72-b792-20bd8d8fa069.storage.googleapis.com/s3fs-public/styles/teaser_desktop_2x/public/2019-02/2019-02-26_5-37-48.jpg?itok=rMJrlaQ0


Year-over-year, housing starts tumbled 10.9% – the biggest drop since March 2011…


Debt Among Millennials Rockets Past $1 Trillion

https://zh-prod-1cc738ca-7d3b-4a72-b792-20bd8d8fa069.storage.googleapis.com/s3fs-public/styles/teaser_desktop_2x/public/2019-02/debt%20student.jpg?h=361ea814&itok=Kp6oBBxo

“Student loans make up the majority of the $1,005,000,000,000″, a massive handicap on ability to mortgage a home purchase at today’s prices.

How To Discover Who Is Visiting Your Real Estate IDX Website

You cannot find out individual visitors to your site, but you can use some freely available software, such as Google Analytics, to find out how many visitors come to your site, when they are most likely to browse, and their preferred content.

In traditional brick and mortar real estate, you want to know everyone who walks through your office door. You want to greet them personally, gather their contact information, and learn how you can help them. Online real estate is a bit different. Because you cannot talk to them face to face, you need to use software tools to “get to know” your website visitors.

The easiest and most widely used is Google Analytics. Launched in 2005, Google Analytics is now used on more than 50 million sites around the web. The software works by adding tracking code to your website. This code registers activity on your site and sends it to Google where it is aggregated and presented in the Google Analytics reports page.

Google Analytics and similar software can help you understand the type of content that is most popular on your site and the type of visitors it attracts. This can help you develop more targeted content and generate more leads.

To set up Google Analytics, you will need to have a Google account. Then, you will use a plugin to install the tracking code on your website. Once it starts gathering data, you will be able to view and analyze your website traffic by logging into the Google Analytics reports portal.

Step 1: Log into Google Analytics

If you don’t have a Google account already you should create one.

Step 2: Provide Website Information

On the New Account page, you should select Website.  Then, provide a name for you account and website, as well as, your website url and your time zone.

Step 3: Copy Tracking ID

Your Google Analytics account is now ready. Google will provide a tracking code. You should keep a copy of this because in the next steps you will be adding it to your website.

Step 4: Connect Your Site and Google Analytics Account

There are several plugins available to connect your website and Analytics account. Choose the one that best fits your web platform and analytics needs. Then, install it and follow the prompts to authenticate your account.

Google Analytics is now running on your site and the software will begin collecting information about your website visitors. To see the reports, you should log into your Google Analytics page. Here are some key panels in your Google Analytics reports. The best users regularly monitor these panels and make adjustments on their site to maximize lead generation.

https://realtyna.com/wp-content/uploads/2019/02/Who-Is-Visiting-IDX-Real-Estate-Website-1-min.jpg

Audience

The audience panel shows you the number of users on your site over the last week with breakdowns for language, web browser, desktop/mobile, and new visitor/returning visitor. You can use this information to adjust your content schedule to post new content when your traffic is highest.

Demographics

The demographics panel provides breakdowns by age and gender, including the share of your website visitors each category represents over time. You can use this information to get a better sense of your typical website visitors and tailor content to them.

Location

The location panel provides the home country of your website visitors. This can be particularly useful if you are seeking to attract international buyers. The panel also session duration and the number of pages viewed per session for each country.

Pages

The pages panel allows you to call information about a page or pages with specific content. Simply type in a search term, and the panel will return page views, entrances, and bounce rate for all the pages on your site containing that term in the url.

Source: by Morgan Taylor | Active Rain

U.S. Mint Runs Out Of Silver Eagle Bullion Coins… 2nd Time In Six Months

https://www.govmint.com/media/catalog/product/cache/59c770a61d95489145d19fac4c100131/3/1/317101_1.jpg

(Kitco News) The silver market is seeing a turn in fortunes as demand for physical bullion picks up, with the U.S. Mint selling out of 2018 and 2019 American Eagle silver coins.

The mint issued a statement late Thursday saying they had run out of last year’s and this year’s dated one-ounce coins. “Market fluctuations have resulted in a temporary sellout of 2018 and 2019 silver bullion. Production at the Mint’s West Point facility continues and when sales resume, silver bullion will be offered under allocation,” the mint said.

Year to date the U.S. Mint has sold more than six million coins, the best start since 2017. The surge in sales comes after a dismal 2018 which saw the lowest coin sales in 11.

According to some analysts, silver is attracting renewed investor attention as both precious metals and base metals trade near multi-month highs.

Following in gold’s footsteps, silver prices saw some selling pressure Thursday as momentum traders took profits as the market was trading near a nine-month high earlier in the week. Spot silver futures on Kitco.com last traded at $15.77 an ounce, relatively unchanged on the day.

https://www.clivemaund.com/charts/silver6month170219.jpghttps://www.clivemaund.com/charts/silver10year170219.jpg

However, analysts have noted that despite Thursday’s selling pressure, technical momentum points to further upside.

“The silver bulls still have the overall near-term technical advantage. Prices are in a three-month-old price uptrend on the daily bar chart. Silver bulls’ next upside price breakout objective is closing prices above solid technical resistance at the January high of $16.20 an ounce,”said Jim Wyckoff, senior technical analyst at Kitco.com.

Andrew Hecht, creator of the Weekly Hecht report, said that investors have been quietly accumulating silver since the start of the year with open interest has risen 25%.

“Silver is the kind of metal that sits hidden in the brush like a wild beast waiting for an opportunity to pounce,” he said in a report Thursday.

He added that he thinks silver has the potential to push to $21 an ounce in 2019. However, he said that the first level of significant resistance he is watching is at $17.35 an ounce.

Source: by Neils Christensen | Kitco

Illinois Considering Taxing IRA’s To Supplement State Employee Pensions

Is Illinois’ desire to tax (steal from) private retirement accounts to supplement state employee pension promises a Modern Monetary Theory experiment to measure voter acceptance? If this happens and voters roll over, how long until other states like NY, NJ, CA and others rush in to raid their residents self-funded retirement accounts? How about couching a Federal bill along the same lines because don’t Federal retirees deserve the most they can get from wherever they can get it too?

If you can’t touch it, you don’t own it. If you don’t believe this simple fact, just wait.

Modern Monetary Theory Explained

Over the past few months MMT, or Modern Monetary Theory, has exploded onto the financial scene. And not withstanding the Orwellian Newspeak that is encompassed in its title, MMT is simply Keynesian money printing on steroids.

https://martinhladyniuk.com/wp-content/uploads/2019/02/49e3b-mmt.jpg

Japan of course is the poster child for Modern Monetary Theory, as they have been expanding their monetary base for more than two decades without having to experience the normal repercussions of inflation and economic decline.  And because so many modern day academics and ‘economists’ have swallowed hook, line, and sinker Japan’s ‘success’, this theory is now being touted as the way for government’s to provide unlimited benefits to all their citizens. Is it any wonder economic advisers to Democratic Political candidates are all pushing for free everything?

But of course what is missed in all of this is the fact that as of today, all credit begins at the Federal Reserve, and is loaned or sold to the banks FIRST before it is distributed to the government, small businesses, or to consumers.  Thus like in Japan, where the central bank has to use its monetary credit expansion to buy market assets rather than provide liquidity to its real economy in order to avoid inflation, so too would MMT do what is occurring now already following 6-8 years of central bank stimulus.

It would make those who receive the money FIRST… which are the 1%ers, even richer while indebting those who receive it afterwards.

Since central banks began QE (2008):

National Debt on Dec. 31, 2008:  11.5 trillion
National Debt as of today:  22 trillion

Corporate Debt on Dec. 31, 2008:  2.5 trillion
Corporate Debt as of today:  9 trillion

Consumer Debt on Dec. 31, 2008:  2.69 trillion
Consumer Debt as of today:  3.979 trillion

Now, let’s look at how much the 1% has grown their wealth in that same period.

https://martinhladyniuk.com/wp-content/uploads/2019/02/700b2-wealth2bdisparity.jpg

As you can see, the amount of wealth acquired by the top 1% moved exponentially over the past decade when the central banks began their QE programs of monetary expansion.

Of course many Socialists will say that THEIR programs would sufficiently put the new money almost ‘directly’ into the pockets of the people.  But all one has to do is look at the longstanding Food Stamp or (EBT) program and how the money is actually issued first to JP Morgan (who gets its cut), and after that it is distributed piece meal to the masses.

The reality is, when money is created through a fiat system of CREDIT rather than from a resource backed one like Gold or Silver, those who get access to that money first will always increase their wealth while those who are allowed to access it after will either break even, or as in the case of governments, corporations, and consumers, lose ground via debt and real inflation. 

So when individuals on bubblevision or who wear titles in the halls of academia try to sell you a bill of goods that TODAY is different, and that that they can provide everyone everything because nations are allowed to print as much money as they want at will, simply provide them those pesky little things called ‘facts and evidence’ and tell them that Americans don’t want to be like Venezuela and Zimbabwe when it all comes tumbling down.

Source: Shotgun Economics

Business Spending Suffers Longest Contraction Since 2015

After no January Durable Goods report as the government was shut down one month ago, today we got a double whammy of a Durables report, with both November and December data, and as many had warned, it was disappointing, rising just 1.2%, below the 1.7% expectations, if up from 1.0% in November (revised up from 0.7%).

https://www.zerohedge.com/s3/files/inline-images/durable%20goods%20new%20orders%20feb%202019.jpg?itok=iZYeC2w5

However, much of the upside was once again due to transportation orders, read Boeing defense and airplane spending. Indeed, new orders for non-defense aircraft and parts soared 28.4%, by far the biggest contributor of December spending. Ex airplanes, under the hood things were even uglier:

  • New orders ex-trans. rose 0.1% in Dec. after 0.2% fall
  • New orders ex-defense rose 1.8% in Dec. after being unchanged

Most importantly for those following the buyback vs capex debate, non-defense capital goods orders ex-aircraft, i.e. core capex spending, fell 0.7% in Dec. after falling 1.0% in Nov (revised lower from -0.7%).

This was the third consecutive month of declines, the longest stretch of contraction since late 2015 when China nearly dragged the entire world into a recession and only the early 2016 Shanghai accord saved the world from what would have been a certain contraction.

https://www.zerohedge.com/s3/files/inline-images/core%20capex%20feb%202019.jpg?itok=inESv3qR

Source: ZeroHedge

U.S. Existing Home Sales Fall 8.5% YoY In January

The housing market is cooling, both in terms of existing home sales YoY and median price YoY.

(Bloomberg) — Sales of previously owned U.S. homes fell to the weakest pace since November 2015, indicating that the housing market remained in a slowdown despite a drop in mortgage rates.

Contract closings decreased 1.2 percent in January from the prior month to an annual rate of 4.94 million, the National Association of Realtors said Thursday, below economists’ estimates for 5 million. The median sales price rose 2.8 percent from a year ago, the smallest increase since February 2012.

Is this a trend in median prices YoY for existing home sales?

https://confoundedinterestnet.files.wordpress.com/2019/02/medianpriceehsyoy.png

Milage in your town will vary.

Existing home sales YoY dropped 8.50% in January, continuing the cooling trend that started in 2017.

https://confoundedinterestnet.files.wordpress.com/2019/02/ehsyoy.png

I Dont Even Know What This Is Leonardo Dicaprio GIF

Source: Confounded Interest

Meet Generation Z: Newest Member Of The Workforce

Every generation approaches the workplace differently.

While talk over the last decade has largely focused on understanding the work habits and attitudes of Millennials, Visual Capitalist’s Jeff Desjardins points out that it’s already time for a new generation to enter the fold.

Generation Z, the group born after the Millennials, is entering their early adult years and starting their young careers. What makes them different, and how will they approach things differently than past generations?

MEET GENERATION Z

Today’s infographic comes to us from ZeroCater, and it will help introduce you to the newest entrant to the modern workforce: Generation Z.

https://2oqz471sa19h3vbwa53m33yj-wpengine.netdna-ssl.com/wp-content/uploads/2019/02/workforce-generation-z.jpg

Source: by Jeff Desjardins | Visual Capitalist

Over Half Of Houses Listed In NYC Last Year Never Sold

A torrid post-crisis recovery in the NYC housing market came to a screeching halt last year as a chasm opened between what sellers were asking and what buyers were willing to pay.

https://ap.rdcpix.com/238832139/34d0af005e3bf18106be433233553738l-m0xd-w1020_h770_q80.jpg

But in the clearest post-mortem showing just how bad last year was for one of the world’s most unaffordable real estate markets, Property Shark found in a recent analysis that less than half of the housing inventory available sold last year. According to PS, 48% of the homes listed between March through May of last year had been sold as of Feb. 1.

It’s a symptom of New York’s softening market, where a glut of inventory has given buyers major bargaining power, said Grant Long, senior economist for StreetEasy. Of the homes that didn’t sell, only 14% are still listed. But most of the homes that were pulled off the market could easily reemerge

And of the homes from last spring that did sell, roughly 70% of them closed for less than their owners initially sought. That’s up from 62% of sales a year earlier and 61% in 2016.

The resulting glut in unsold inventory is creating problems for sellers who are facing another tidal wave of inventory.

https://www.zerohedge.com/s3/files/inline-images/Screen%20Shot%202019-02-08%20at%203.01.50%20PM.png?itok=xc33bN-d

Here’s a breakdown of the report’s findings (text courtesy of Property Shark):

1. Of All Homes Listed for Sale in Spring 2018, Fewer Than Half Sold

Just 48 percent of the homes listed during March, April, and May 2018 had sold as of February 2019. While weakness at the top of the NYC sales market has been grabbing headlines, the sluggish pace of sales has extended to homes across boroughs and price points. Manhattan homes fared slightly worse than others, with just 44 percent selling, but even in the comparably strong market in Queens, just 54 percent of homes found buyers. This is not only about price: Though 61 percent of all homes listed for $1 million or more failed to sell, so did 45 percent of all homes priced under $1 million. (Nonetheless, units priced at or above $5 million fared far worse, with just 140 of 656 units, or 21 percent, finding buyers.)

The Greenwich Club condominium in the Financial District exemplifies this trend. A total of 31 units in the building were listed for sale in March, April, and May 2018, but only six have sold. One more entered contract in December, and another six have since relisted, but many — including a 1-bedroom asking $1.25 million, 25 percent above its 2016 purchase price — left the market without fanfare in late 2018.

2. Many Homes Listed Last Spring Were Taken Off-Market

Most sellers who were unable to find buyers at suitable prices have simply pulled their listings from the market. Of all listings created in spring 2018, 40 percent are either paused, delisted, or otherwise no longer available on StreetEasy. Only 7.5 percent of all the listings from the peak months, or 14 percent of the total unsold units, are still actively seeking buyers. Listing agents marked another 4.5 percent of homes as in-contract, with the majority entering deals in late 2018 and presumably closing in early 2019. Yet with many more unsold, we will likely continue to see heightened inventory heading into the spring home-shopping season, as these sellers try again to find a buyer.

3. The Majority of 2018 Sales Closed Below Asking Price

Of homes listed last spring that managed to find a buyer, we estimate that 70 percent closed below their initial asking price[1]. The median difference between the recorded closing price (as reflected in public records) and the initial listing price on StreetEasy was 5.5 percent, for a $44,000 discount off the $800,000 median listing price for homes sold. Buyers enjoyed particularly high negotiating power in Manhattan, where 77 percent of homes sold below their initial asking price, compared to 68 percent of homes in Queens and 61 percent of homes in Brooklyn.

Homes selling below their initial asking price is not a new phenomenon, but with heightened competition for buyer interest, spring 2018 was particularly painful for sellers. In 2017 and 2016, 62 and 61 percent, respectively, of homes listed in the spring sold below ask in a comparable time period.

4. Aggressively Priced Homes Stand Out

Though these numbers make selling a home seem daunting, a significant chunk of homes – 19 percent of all sales – closed above their original asking price. While these home sales ranged across price points and neighborhoods, they tended to be among the cheapest in their respective neighborhoods for their bedroom count. Homes that ultimately sold above ask were initially listed for a median of 8.8 percent below the respective 2018 median price for their neighborhood and bedroom count. Meanwhile, homes that sold below asking price were listed a median of 1.2 percent above the respective median for their neighborhood and bedroom count. Homes that went unsold were initially listed for a median of 6.4 percent above their respective benchmark median.

* * *

To be sure, the property glut has given buyers serious bargaining power. And while sellers are hoping for a rebound (particularly if Trump does manage to repeal the SALT deduction cap, which the Senate has already said won’t happen), with more inventory set to hit the market, the downturn could persist for some time, particularly with median home values still well above the range that NYC’s population of indebted, cash-poor millennials are willing/able to pay.

Source: ZeroHedge

What Caused the Recession of 2019-2021?

The banquet of consequences is now being served, but the good seats have all been taken.

(Charles Hugh Smith) As I discussed in We’re Overdue for a Sell-Everything/No-Fed-Rescue Recession, recessions have a proximate cause and a structural cause. The proximate cause is often a spike in energy costs (1973, 1990) or a financial crisis triggered by excesses of speculation and debt (2000 and 2008) or inflation (1980).

Structural causes are imbalances that build up over time: imbalances in trade or currency flows, capital investment, debt, speculation, labor compensation, wealth-income inequality, energy supply and consumption, etc. These structural distortions and imbalances tend to interact in self-reinforcing dynamics that overlap with normal business / credit cycles.

The current recession has not yet been acknowledged, but this is standard operating procedure: recessions are only declared long after they actually start due to statistical reporting lags. Maybe the recession of 2019-21 will be declared at some point in the future to have begun in Q2 or Q3, but the actual date is not that meaningful; what matters is what caused the recession and how the structural imbalances are resolved.

So what caused the recession of 2019-21? Apparently nothing: oil costs are relatively low, U.S. banks are relatively well-capitalized, geopolitical issues are on the backburner and stocks, bonds and real estate are all well-bid (i.e. there is no liquidity crisis).

This lack of apparent trigger will mystify conventional economists who generally avoid the enormous structural imbalances in our economy because those imbalances are the only possible output of our Neofeudal Power Structure in which a New Nobility/Oligarchy dominates financial and political power and skims the vast majority of gains the economy generates.

The cause of the recession of 2019-21 is exhaustion: exhaustion of the pell-mell expansion of credit (i.e. credit exhaustion/saturation), exhaustion in the household and small business sectors as real-world price increases continue exceeding wage and revenue gains, exhaustion of margin expansion in stocks, and exhaustion of Corporate America’s policy of masking inflation by reducing quality and quantity: at some point, the toilet paper roll is so visibly diminished (i.e. stealth inflation) that companies can no longer reduce the quantity: at that point, they must raise prices to remain profitable, and this explains the recent surge in the sticker price of consumer staples.

Conventional economics has no answer for exhaustion: the only “solution” in a Keynesian universe is to goose borrowing by lowering interest rates and sluicing limitless liquidity into the financial system.

But if everyone who is qualified to borrow more has no interest in borrowing more, lenders turn to unqualified borrowers who will soon default. This sets up a destruction of debt, collateral and wealth that also has no policy answer. The credit impulse doesn’t expire, it simply fades away, along with “growth,” rising stock markets, higher tax revenues, etc.

The second “solution” is to substitute government spending for private spending. But in case nobody noticed, please observe that state/local and federal borrowing and spending has been soaring at insanely unsustainable rates since 2008.

https://www.oftwominds.com/photos2018/federal-debt2-19a.png

Exhaustion overtook the global economy in 2016, but central banks injected massive doses of financial adrenaline to shock the comatose patient. This “solution” continues to this day, as China’s central bank reportedly injected an unprecedented $1.2 trillion into credit markets in January alone.

The problem with financial adrenaline is that every dose reduces the impact of the next dose. At some point, the patient fails to respond. The positive effects of the stimulus become toxic, and attempts to increase dosage will only push the patient into collapse.

That’s where the global economy is today. The exhaustion that was taking hold in 2016 was stimulated away by unprecedented injections of monetary stimulus. The response to current massive injections is between tepid and zero. Adding debt to stimulate “growth” no longer works, and injecting the patient with higher doses of stimulus will only cause collapse.

https://www.oftwominds.com/photos2018/TCMDO3-18.png

The banquet of consequences is now being served, but the good seats have all been taken by those with no debt, unimpaired collateral and little dependence on central bank stimulus or central state legerdemain. All that’s left are the bad seats with horrendous consequences for perverse, distorting policies that refused to deal directly with painfully obvious imbalances.

Source: by Charles Hugh Smith | Of Two Minds

Mortgage Applications Drop Despite Lower Mortgage Rates

Ah, the problems of trying to model residential mortgage purchase and refinancing applications. When mortgage rates fall, models predict a rise in both purchase and refinancing applications. This has left mortgage modelers dazed and confused.

But the recent Mortgage Bankers Association report, revealed that mortgage applications DROPPED 4.78% WoW despite mortgage rates dropping as well.

https://confoundedinterestnet.files.wordpress.com/2019/02/mbastats021519.png

Mortgage rates have been dropping since November, yet mortgage purchase applications dropped in for the latest week. Very likely this was the displacement of purchase applications was simply the “start of the year” effect after a sleepy holiday season.

https://confoundedinterestnet.files.wordpress.com/2019/02/mbappot.png

Ditto for mortgage refinancing applications. Despite mortgage rates declining. there was “start of the year” surge. But continued rate decreases have resulted in generally declining purchase applications after the surge.

https://confoundedinterestnet.files.wordpress.com/2019/02/mbarefiugh.png

On a long term view, purchase applications have remained sedate following the financial crisis and new regulations.

https://confoundedinterestnet.files.wordpress.com/2019/02/lymbap.png

Mortgage refinancing applications remain in Death Valley.

https://confoundedinterestnet.files.wordpress.com/2019/02/mbarefiltdd.png

Perhaps there is a communications breakdown?

Source: Confounded Interest

US Retail Sales Collapse In December: Biggest Drop In A Decade

While Bank of America had warned investors to brace for a dismal retail spending print in January, expectations remained positive (albeit just a 0.1% MoM move) for December’s (delayed due to shutdown) official spending data today. As a reminder, on Tuesday ZeroHedge reported that retail sales ex-autos, as measured by the aggregated BAC credit and debit card data, tumbled 0.3% month-over-month seasonally adjusted in January – the biggest drop in three years. This followed a flat reading in retail sales ex-autos in December.

https://zh-prod-1cc738ca-7d3b-4a72-b792-20bd8d8fa069.storage.googleapis.com/s3fs-public/inline-images/bac%20spending%20data.jpg

retalinferno

Turning to the January BAC internal data, in January, spending for 4 only out of 14 sectors increased in the month, showing broad-based weakening.

As a reminder, Retail Sales for the Control Group soared in November (+0.9% MoM) so some slowdown was expected; but, the government’s official retail spending data for December confirmed BofA’s concerns and plunged…

  • Headline Retail Sales -1.2% MoM (+0.1% MoM exp)
  • Control Group Retail Sales -1.7% MoM (+0.4% MoM exp)

That is the biggest MoM drop in retail sales since 2009 for the headline and the biggest drop in the control group since the 9/11 attacks in 2001!

https://www.zerohedge.com/s3/files/inline-images/2019-02-14_5-34-53.jpg?itok=q0K03wIp

https://confoundedinterestnet.files.wordpress.com/2019/02/retsales2009.png

Which sent the Year-over-year retail sales data reeling…

https://www.zerohedge.com/s3/files/inline-images/2019-02-14_5-32-02.jpg?itok=O9W6kJru

“These numbers are horrible,” said Ward McCarthy, chief financial economist at Jefferies LLC.

“It appears to contrast quite sharply with reports of Christmastime sales that were generally seen as quite healthy,” and for the Fed, “rate normalization is on the back burner for a long time to come.”

This is the worst December retail sales print since 2008 (and 2nd worst in history)…

https://www.zerohedge.com/s3/files/inline-images/2019-02-14_5-58-27.jpg?itok=BOuNw-Ys

The collapse was broad-based…

https://www.zerohedge.com/s3/files/inline-images/2019-02-14_6-12-33.jpg?itok=6L5UopKW

But most notably, December online internet sales (non-store retailers) tumbled 3.9% MoM – the biggest drop ever

https://www.zerohedge.com/s3/files/inline-images/online%20retailers%20feb%202019.png?itok=O5FZB7SVOdd considering Amazon claimed record holiday sales for the same month

https://www.zerohedge.com/s3/files/inline-images/2019-02-14_6-18-13.jpg?itok=0DZut7lQ

Needless to say, this will be a disaster for Q4 GDP forecasts which we now expect to print in the low 1% range.

BofA remains pessimistic:

“While there are a number of special factors that skew the data, the softening of late has revealed the weakest trend for consumer spending since mid-2016.”

Source: ZeroHedge

Housing Market Crisis 2.0: The Jury Is In For 2018-2019

Summary

  • Here is a play-by-play review of a housing crisis that began exploding one story at a time last summer.
  • What is different this time from last is that the 2007-2009 crisis started in the US and pretty much stayed in the US.
  • This one is developing all over the world simultaneously – in the US, Canada, Australia, the UK, etc.

https://static.seekingalpha.com/uploads/2019/2/10/saupload_2016-Economic-Predictions-Symbol.jpg

(by David Haggith) As happened with the first housing market crash that began in 2007 but didn’t become widely recognized until mid-2008, the present housing crisis began exploding one story at a time last summer, and this blog was perhaps the first to state that summer’s change was the turning point from decades of ascent into a collapse in housing sales and prices. I said the same thing back in 2007, and people didn’t believe me then either.

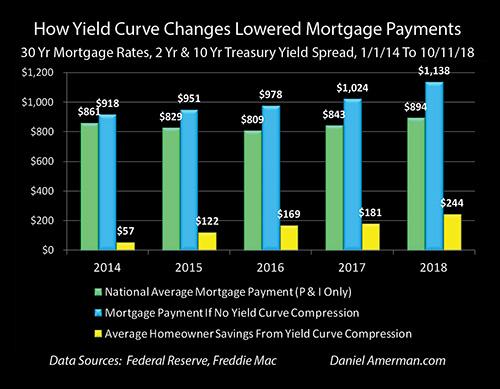
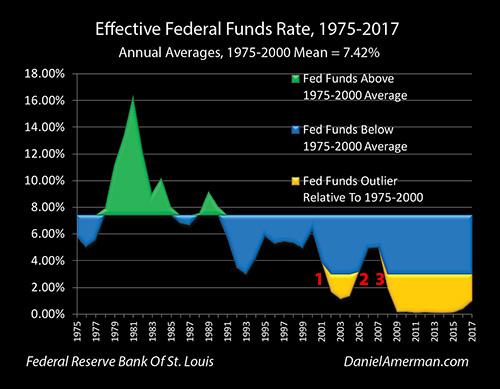
The present housing market crash, like the last, was created by the Federal Reserve artificially pressing mortgage rates down, then down further, and then down as deep they dared push for years and years. Falling interest allowed people with flat incomes to keep purchasing increasingly expensive homes. Since people buy payments more than house prices, housing prices kept rising as payments were kept in line via these artificial interest reductions.

The Fed’s ill-conceived plan, however, was never sustainable prior to the last housing market crash and is not now. I’ve said throughout the Great Recession and ensuing years that, sooner or later, we’d get to the point where the Fed would have to raise rates, and I’ve said its quantitative tightening will certainly raise rates as much as it increases its stated interbank lending interest targets. I’ve also said that, by the time the Fed started raising rates, housing prices would be unaffordable without the Fed’s artificially lowered interest; therefore, the market would have to crash all over again because, all over again, people would find themselves underwater on their mortgages.

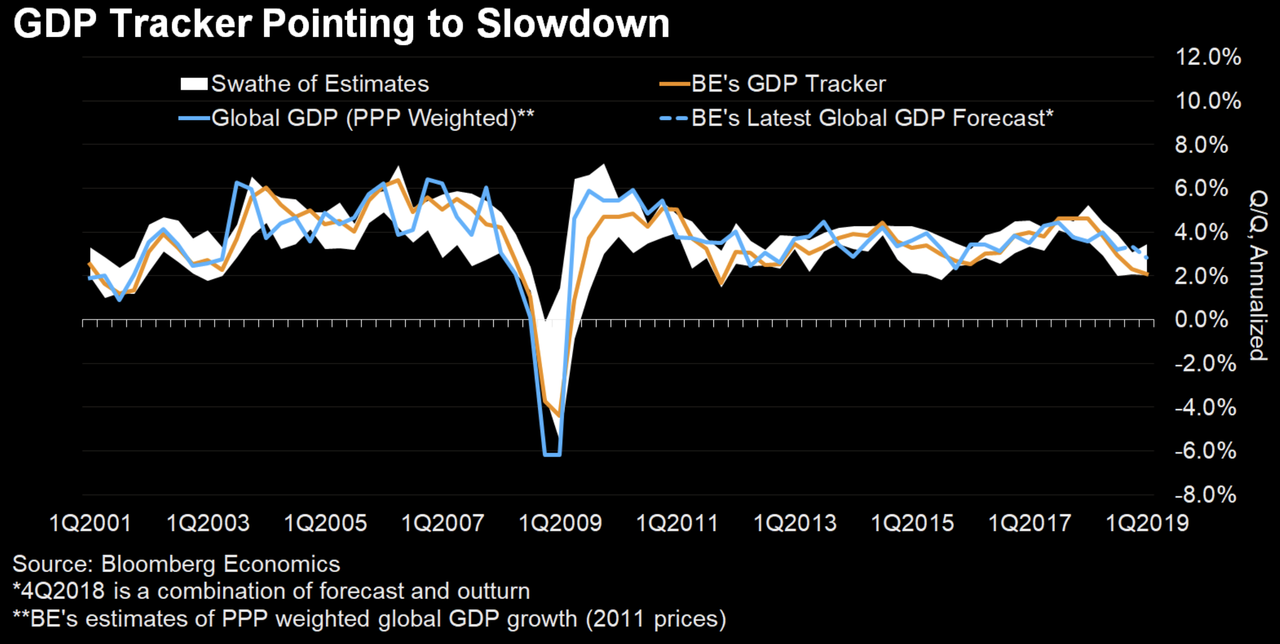
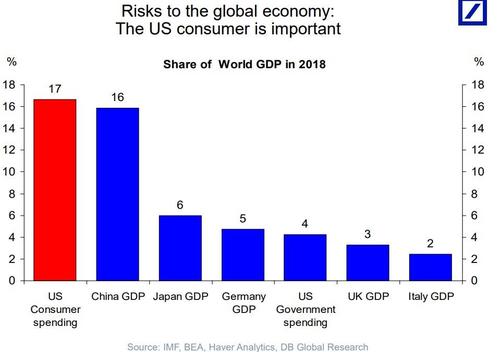
And now, here we are. US banks have not started to go down, but they are feeling serious pressure as this article will point out, while eight months of statistics now prove housing is relentlessly falling with NO hint of letting up. As I wrote in my first Premium Post, “2019 Economic Headwinds Look Like Storm of the Century,” Housing Market Crash 2.0 is one of the numerous forces that will be knocking the US economy down in 2019. The rest of the global economy is already down further than the US.

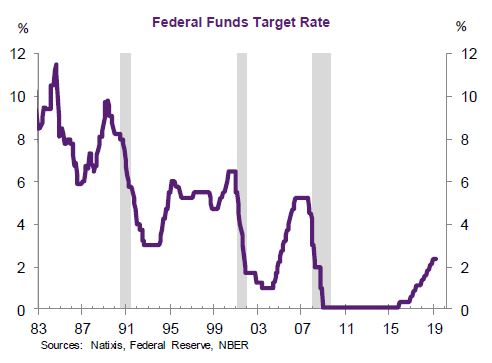
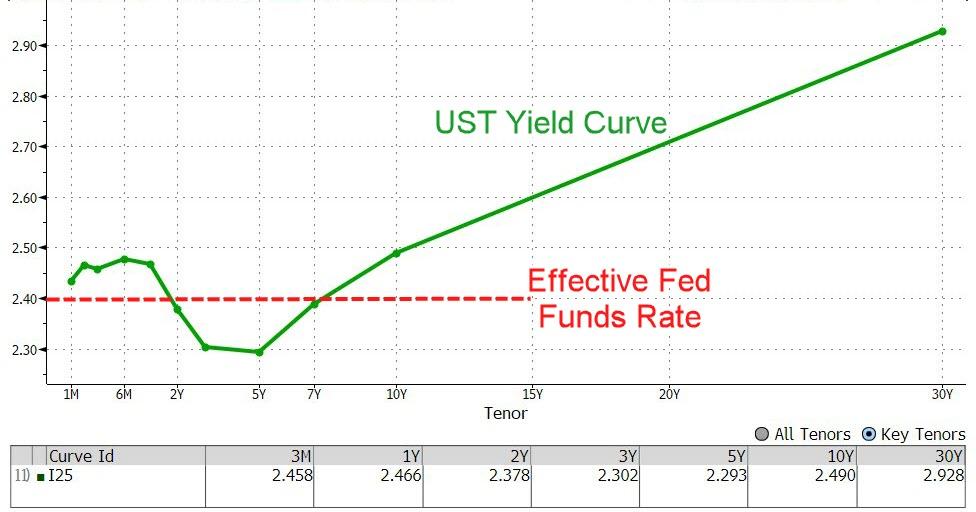
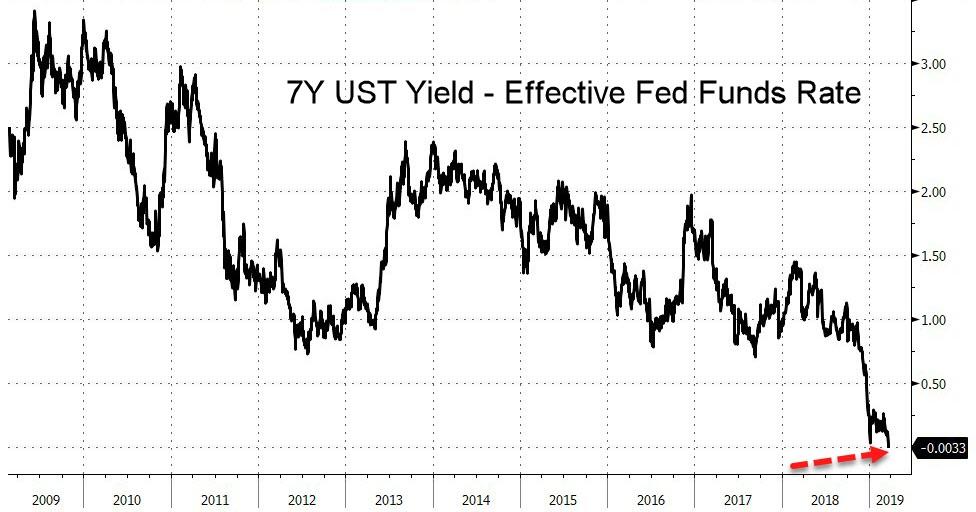
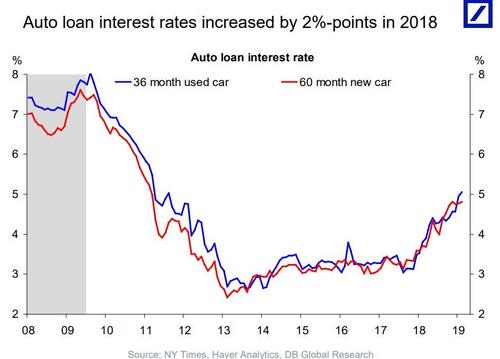
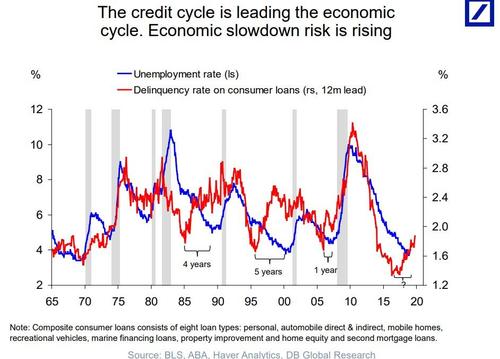
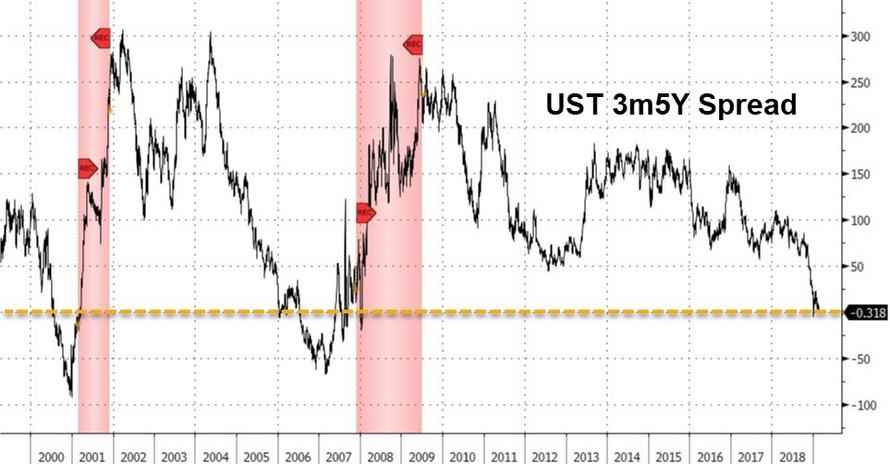
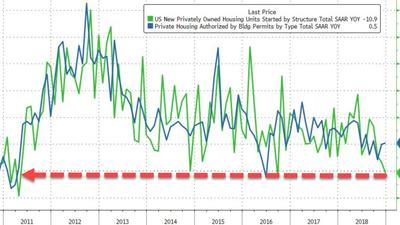
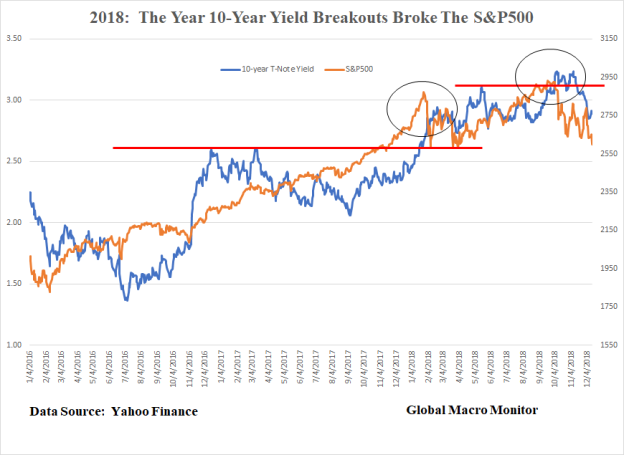
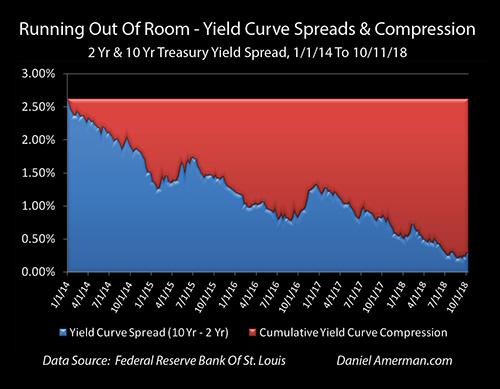
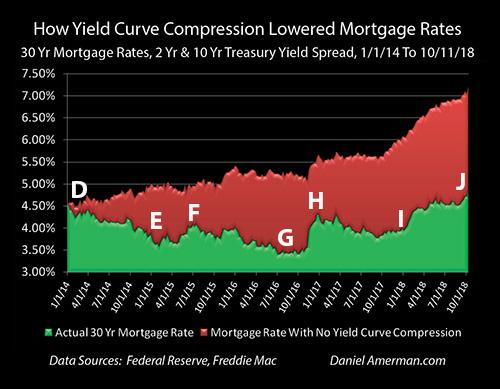
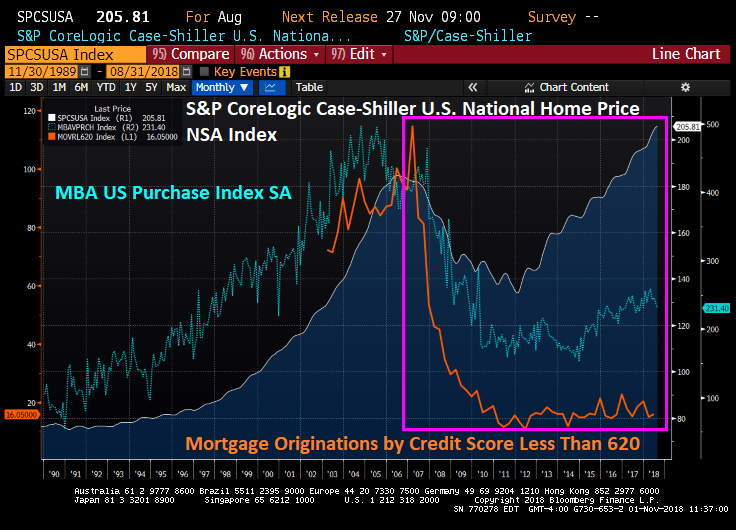
The principal driver in Housing Market Crash 2.0 is the Federal Reserve’s Great Recovery Rewind (the downsizing of its balance sheet, which tightens financial conditions). This, I said two years ago, would cause mortgage rates to start rising one year ago, and you can now see that mortgage rates did exactly that all of last year:

https://static.seekingalpha.com/uploads/2019/2/10/saupload_Mortgage-rates-Aug-18.jpg

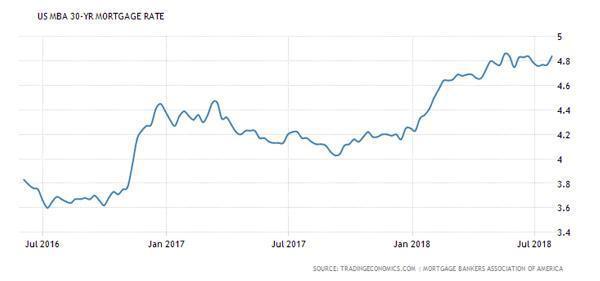
Mortgage rates rose only a minuscule blip when the Fed started with a tiny rolloff (tightening) near the end of 2017, even as I had said the Fed’s unwind would not likely cause any serious damage to the economy until January 2018. Rates, however, immediately ramped up steeply when the Fed doubled its roll-off rate in January (which was when I said the balance sheet unwind would start to have serious market impacts). This has hit stocks, bonds, and housing the worst… so far.

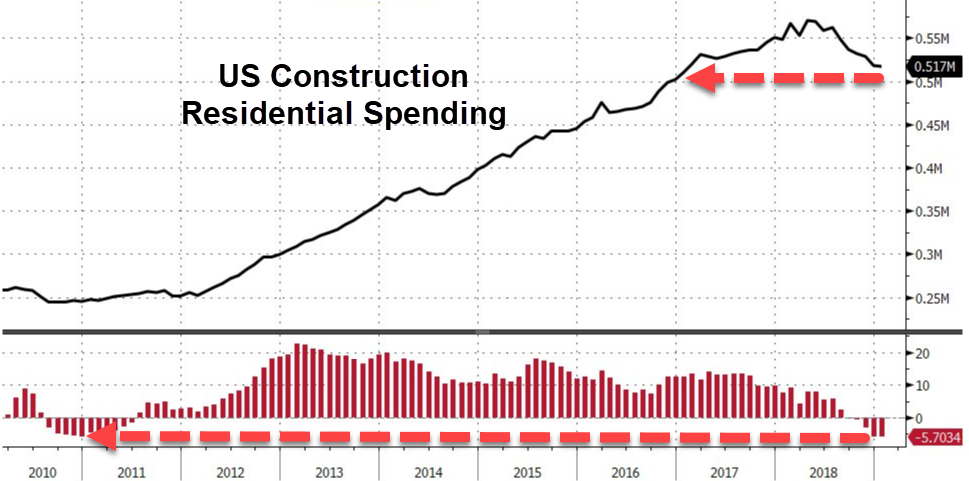
Since the housing market is one of the major areas where Americans store wealth and since it is an industry that buys products and labor from a multitude of other industries, a decline in housing impacts the economy more than any other industry.

US Housing Market Crash 2.0

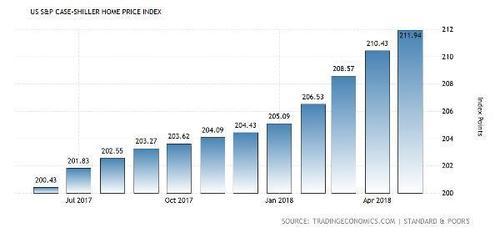
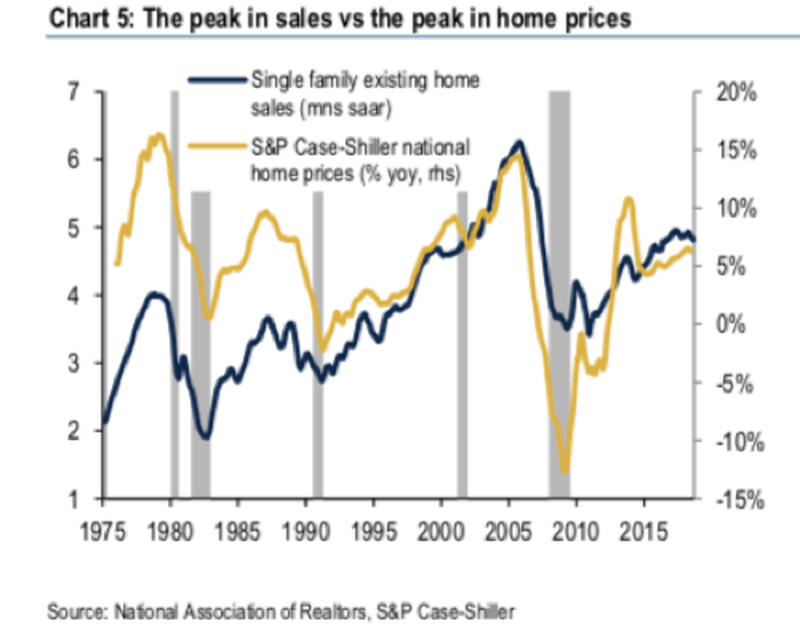
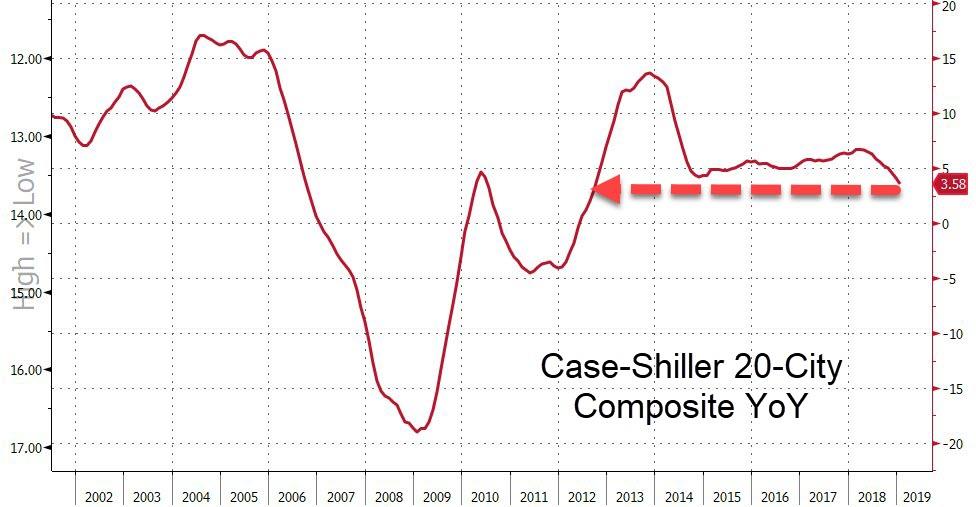
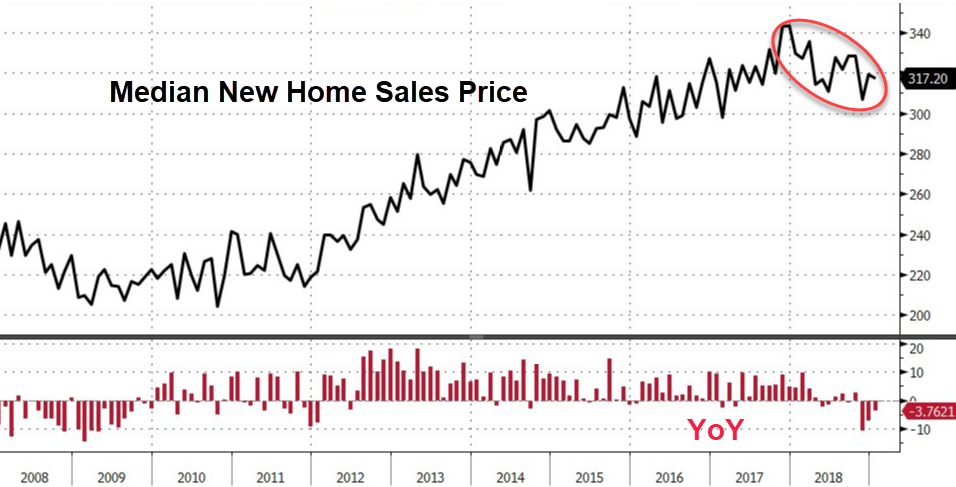
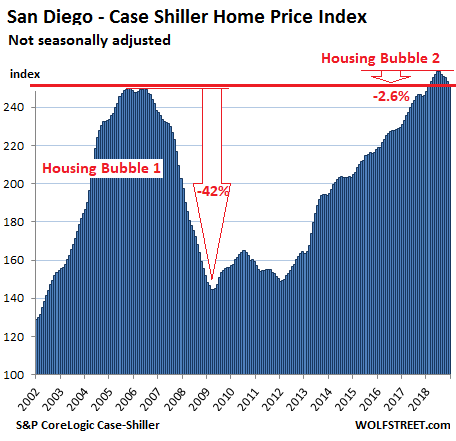
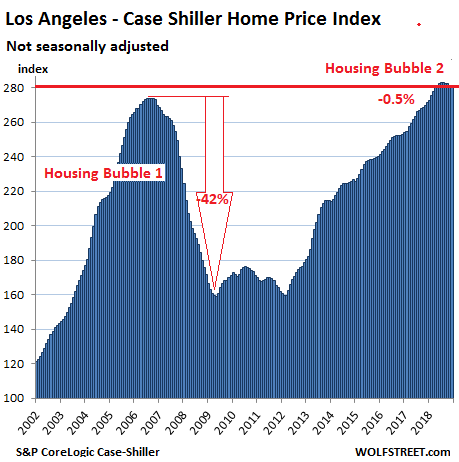
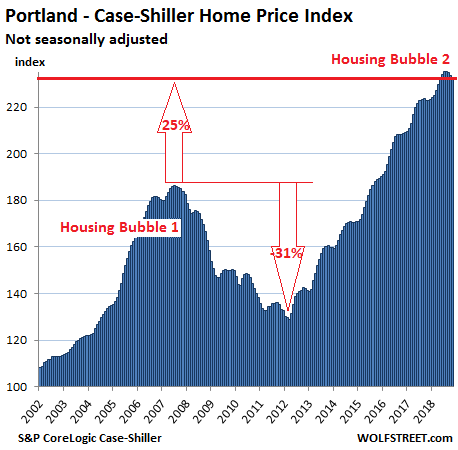
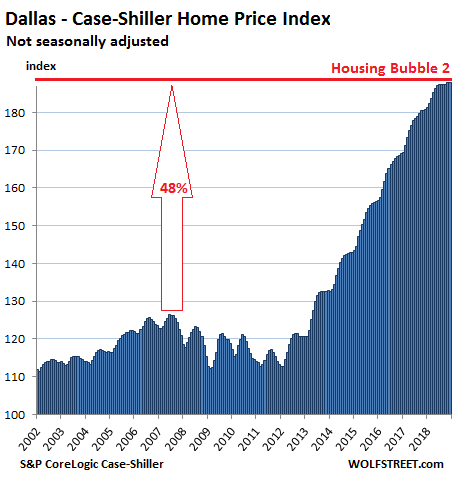
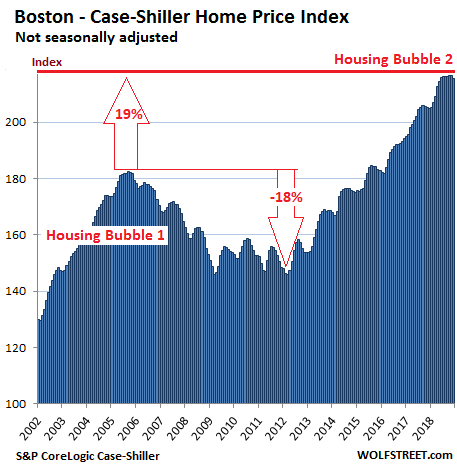
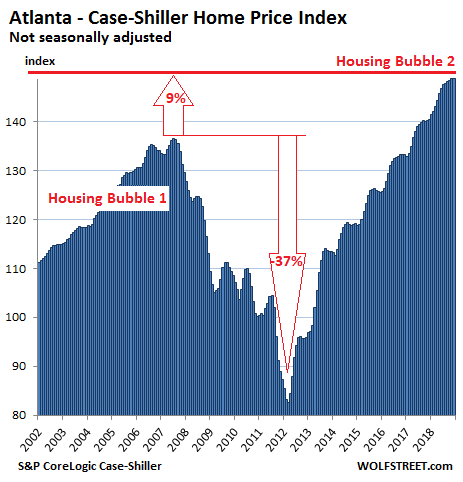
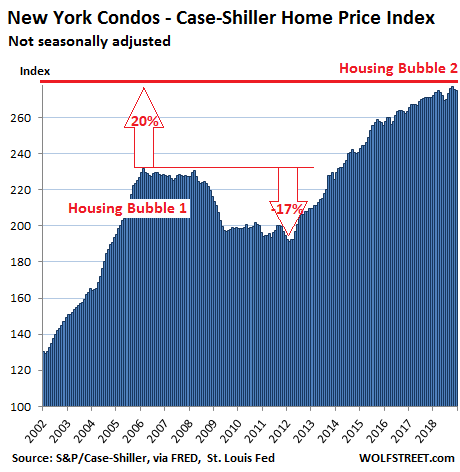
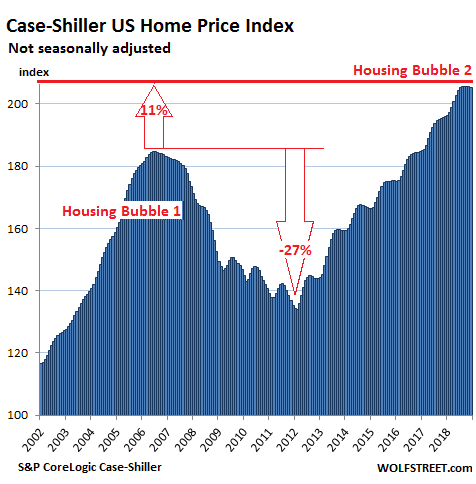
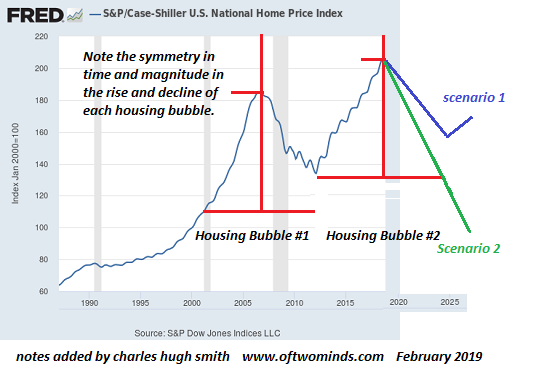
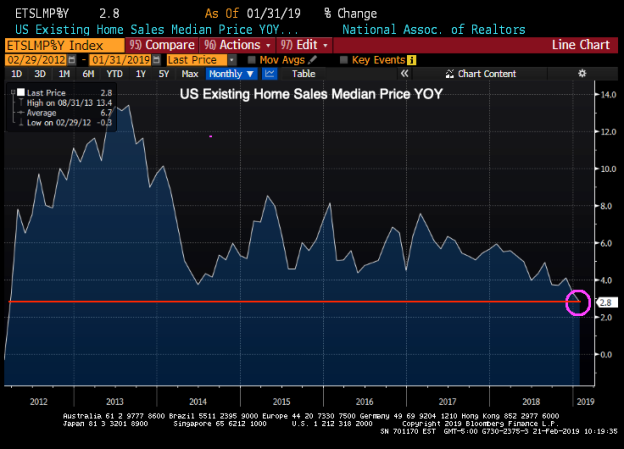
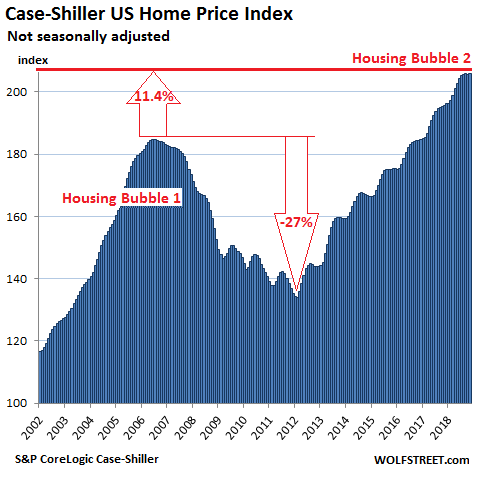
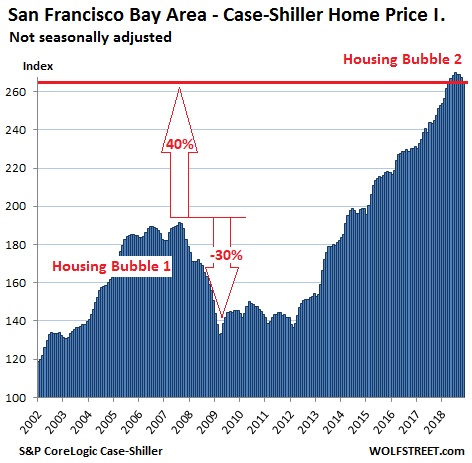
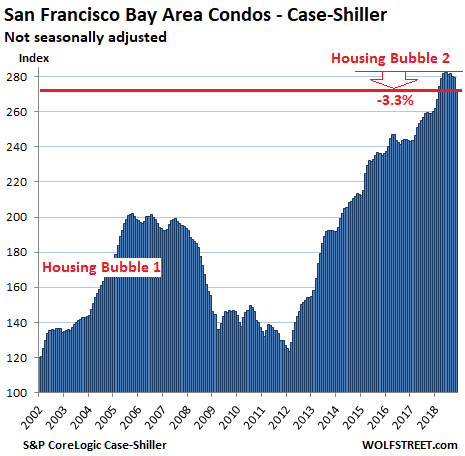
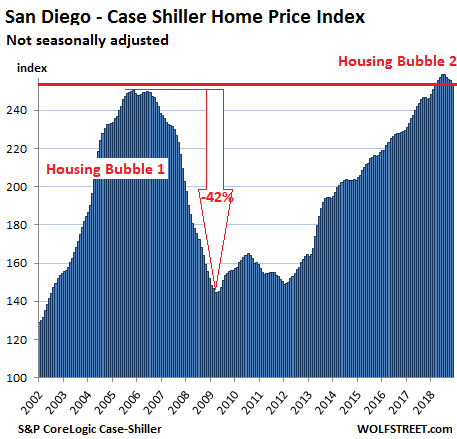
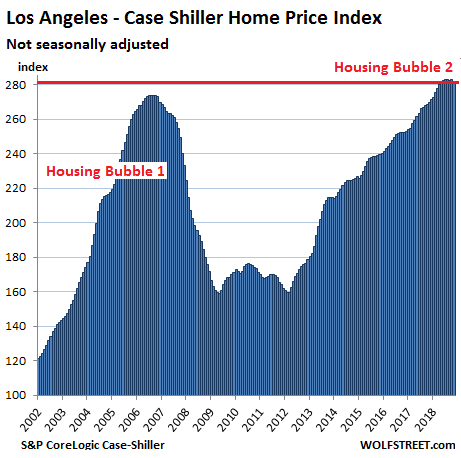
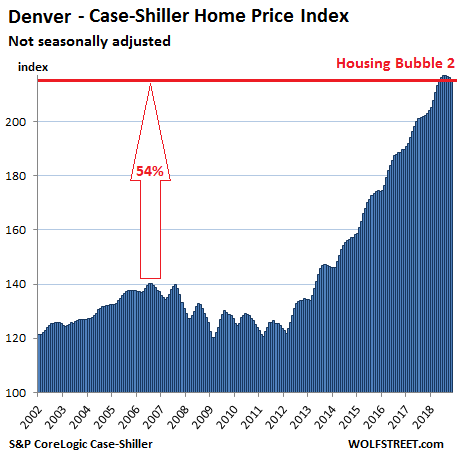
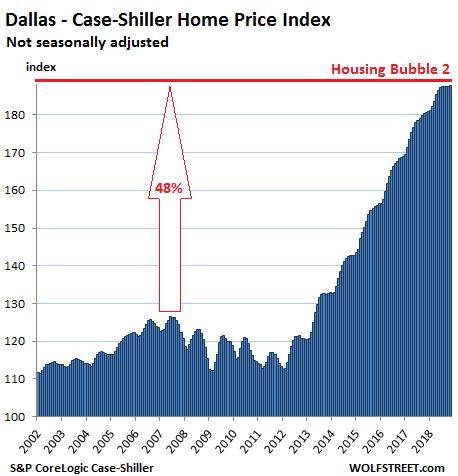
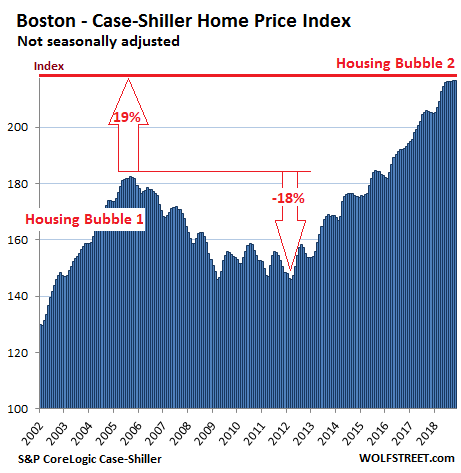
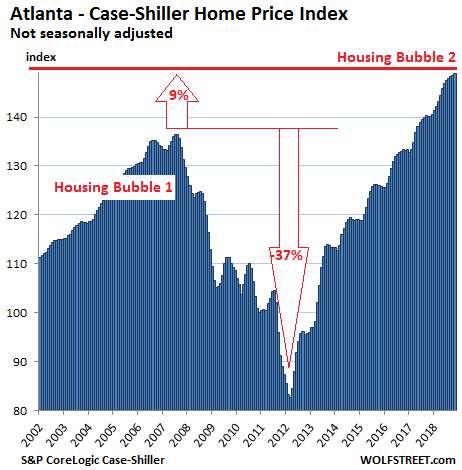
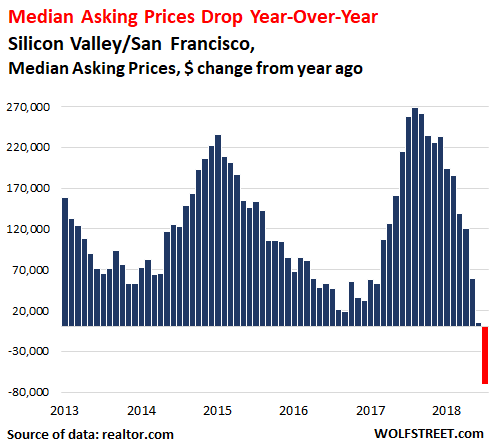
Here is the path US housing prices had been following until the market rolled over:

https://static.seekingalpha.com/uploads/2019/2/10/saupload_Home-prices-Aug-18.jpg

And here is a play-by-play of how the housing market crash has gone since I made my brazen 2018 summer proclamation that it had arrived on schedule:

June-July, 2018: Average housing demand in the US was reported to have fallen 9.6 percent in June YoY, while the number of listings increased. Overall, 15% fewer offers were made on homes, which is probably why the inventory grew. In many major markets, however, inventory declined. Agents in So. Cal reported bidding wars were cooling down. Where homes had been getting 10-15 offers (causing a bidding war), they were now just getting one or two.

Prices continued to climb or remained high because sales have to slump a lot before sellers become willing to accept the harsh reality that their homes, in which they have so much of their wealth invested, are not worth as much as they were. As inventory rises, buyers become more choosy and make offers on only the best-priced homes, rather than bid prices up. As a result, prices stall so do buyers until eventually their waiting overcomes seller inertia and sellers start to move down to find the more deeply coalesced pool of buyers.

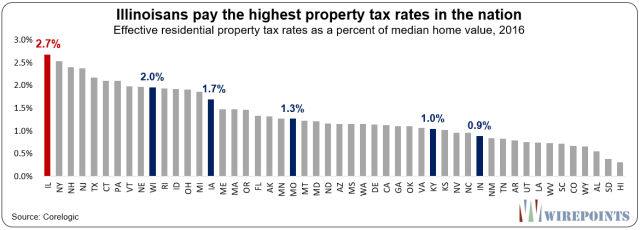
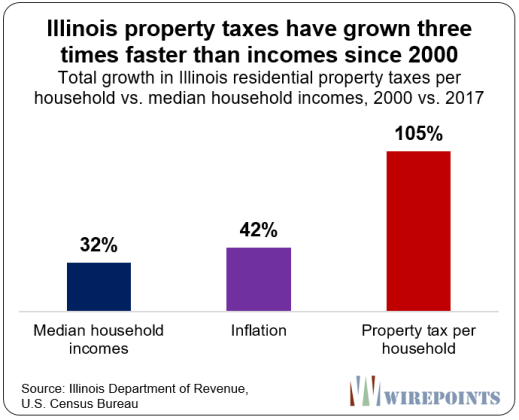
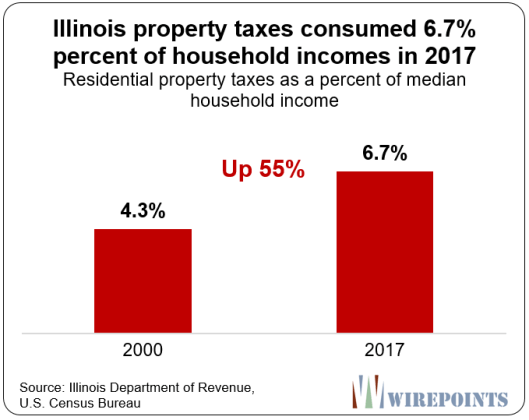
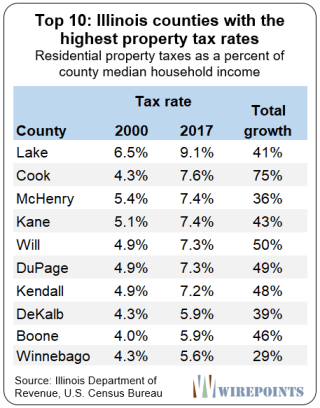
In affluent areas, however, prices already began to fall. In part, this jolt down at the top was due to the Trump Tax Cuts, which funded some cuts by curbing deductions for mortgage interest and particularly for property tax. That hit areas like Manhattan, Westchester County, New Jersey, and Connecticut the hardest because of their high property taxes that had been paid on behalf of the wealthy via income-tax breaks. (Property-tax bills in Westchester County, one of the highest in the nation, commonly hit $50,000 per year or more.)

On a quarterly basis, purchases nationally plunged 18% in the second quarter.

August 2018: Near the end of summer, reports like the following started to appear for the first time in almost a decade:

“We all think next year is going to be a tough year for real estate sales,” said Matthew Roach, a property attorney in Yorktown Heights, New York…. Some buyers are saying, “‘Look, I’m not going to spend more than $35,000 in taxes,’ ” said Angela Retelny, a broker at Compass. “Houses … have to be reduced – because their taxes are just way too high for the price range….” The state of the market is such that you’re seeing “dramatic price reductions every single day – every hour, pretty much,” she said.”

Bloomberg

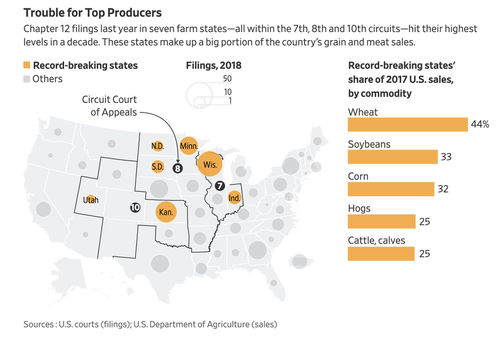
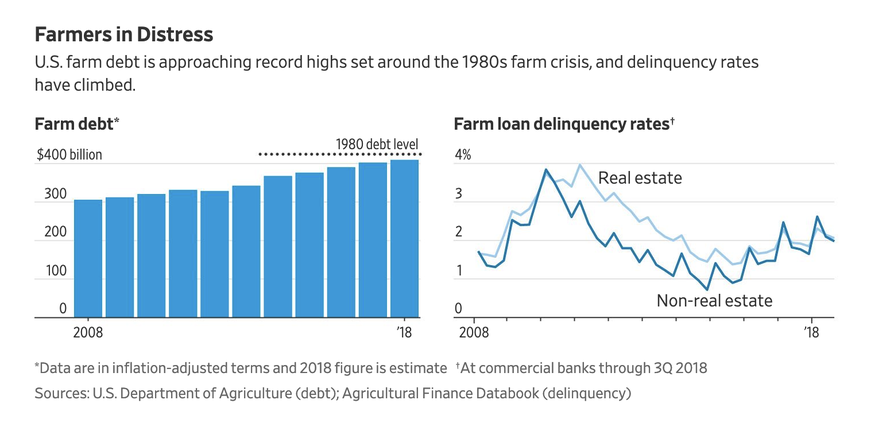
But it was not just high-end markets that hit the skids. Farms in the midwest had been seeing rising bankruptcies for a few years and finally broke above the peak they hit in the last housing market crash:

https://static.seekingalpha.com/uploads/2019/2/10/saupload_chart_4.png

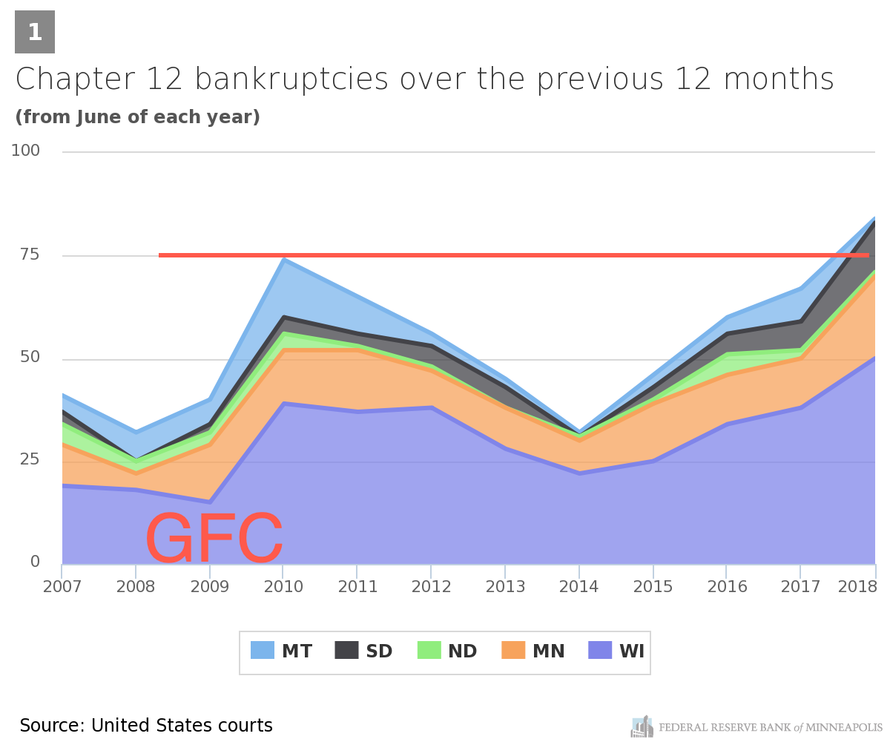
The rise in farm bankruptcies, however, had little to do with mortgage rates or housing prices, and everything to do with commodity prices (particularly dairy); however, as goes the farm business, so goes the sale of the farm. More people selling in distressed conditions coupled to fewer people interested in buying into a failing industry equals tougher sales; and, so, this distress was certain to flow out into declining sales and prices. (Fire sales of land and equipment due to distress last summer are now well underway.)

The impact hit first in delinquent Ag. loans in the upper midwest, which rose (when measured against the farm capital backing those loans) to strike a level worse than what was seen in the pit of the Great Recession. The Kansas City Fed predicted farm income would worsen into 2019. The Trump Trade War certainly isn’t helping.

(During this same time, my wife and I – putting my belief in a housing market crash to practice – listed our farm in the hope of selling near the peak, possibly renting and then buying back in at a lower price in a couple of years. We hope to retire our mortgage so that we can more easily retire five years from now. We both have jobs that are fairly recession proof, so we’re not too concerned about needing to grow our own food. Still, if we can’t sell at near-peak value, we’ll happily hold on here since the farm produces relatively passive income. (We let other people rent agricultural use and do 90% of the work.) If things ever did go extremely bad, we can grow a huge amount of food in a valley that always has abundant mountain water. So, we’ll be happy to sell at peak value, but happy to sit it out here if we’re already too late to get that value.)

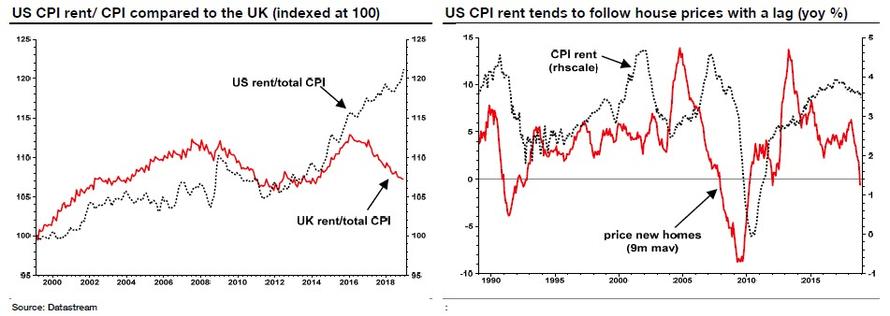
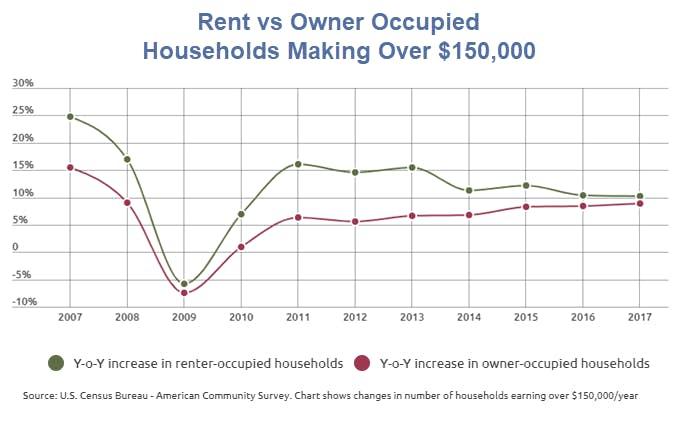
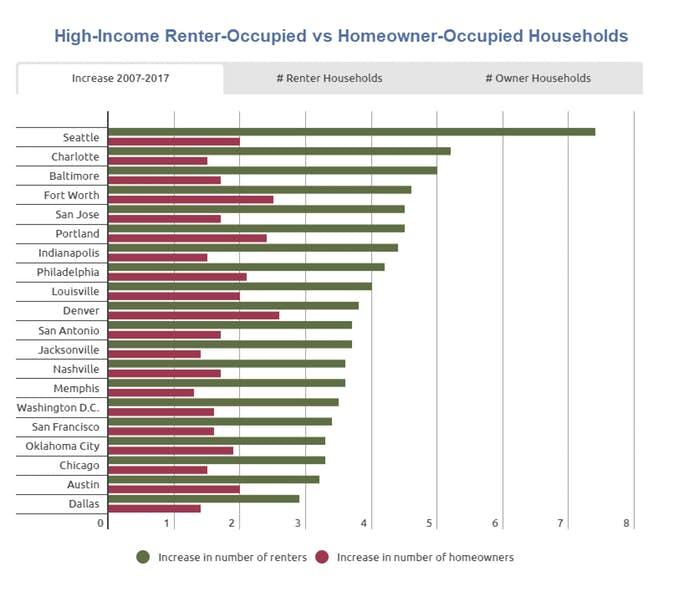
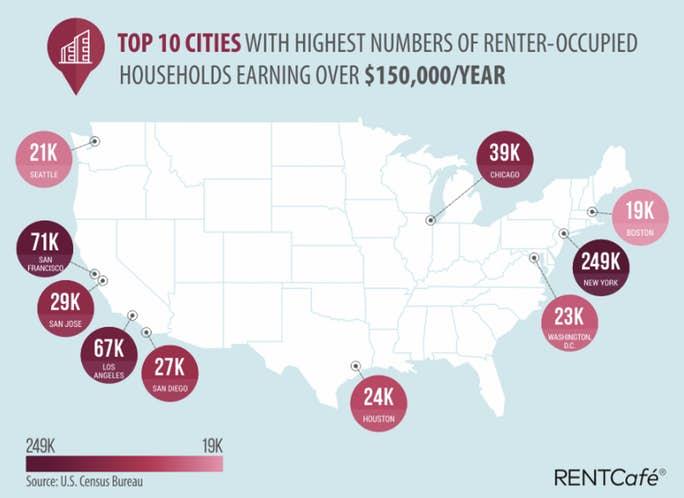
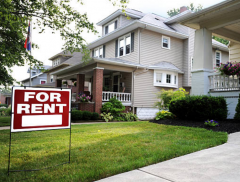
September 2018: By the end of summer on the east coast, some markets like Connecticut saw a rise in people choosing to wait out the foreseeable housing market crash by renting, even at $10,000 a month for higher-end homes, in hopes of buying low at the bottom of the market in a not-too-distant future. Several east-coast counties saw rentals rising sharply as sales fell just as sharply. Owners also began choosing to rent out homes rather than sell them at a loss because losses on a primary residence are not deductible; but if a home has been rented for two years, it can be converted into an investment property so that, at least, the loss can be deducted from taxes. (They may have also hoped that, by renting, they could wait out the decline in prices.)

Todd David Miller, a vice president of sales at the Higgins Group, said that of the $57 million in sales his team has done so far this year, primarily in the towns of Westport and Fairfield, almost all of the sellers have either moved out of state or are renting in the area. Those who are staying in the area are gravitating toward home rentals near the beach.

“These are mainly higher-end transactions, and the majority of them had to sell at a loss,” Mr. Miller said. “They don’t want to put any more money into real estate right now….”

“We’re going through this era of uncertainty. And what do buyers do when the near-term seems uncertain? They pause. People are just nervous that values will continue to decline, and for that reason, more people are opting to rent, if they are not forced to buy”, Miller said.

The New York Times

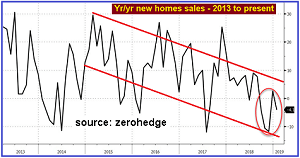
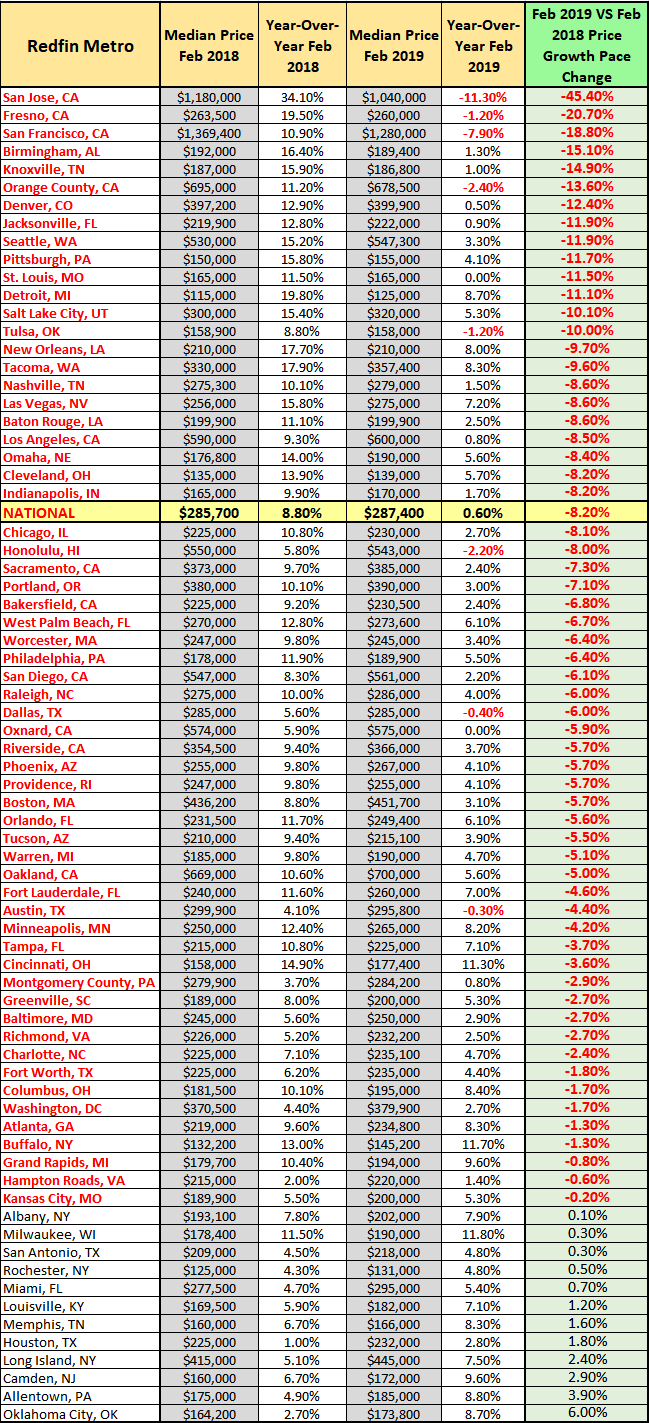
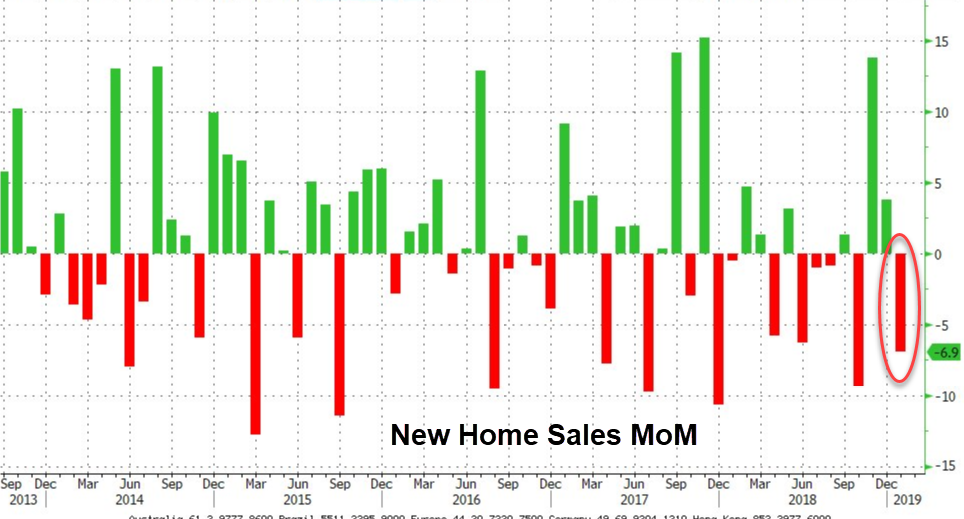
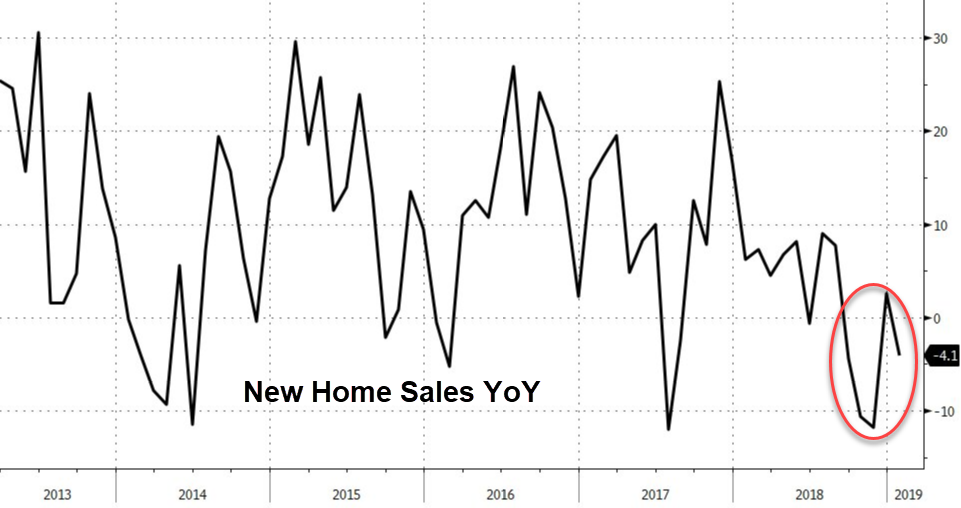
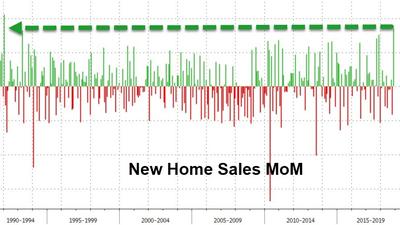
October 2018: New home sales were expected to start rising again in October but, instead, fell miserably (8.9% MoM). That marked the seventh month of missed expectations. The midwest led the slump that month, falling a hard 22%, but the fall was bad in all parts of the US. At this point, median prices began dropping nationally, too (down 3. 6%). As a result of a backlog from declining sales, inventory began to soar (climbing 7.4 in one month). Sentiment, too, had taken a bad plunge by October with the number of people who said they planned to buy a house in the next twelve months falling by half over the past year.

Sales of new U.S. single-family homes tumbled to a more than 2-1/2-year low in October amid sharp declines in all four regions, further evidence that higher mortgage rates were hurting the housing market.

Reuters

The Fed crush was fully on.

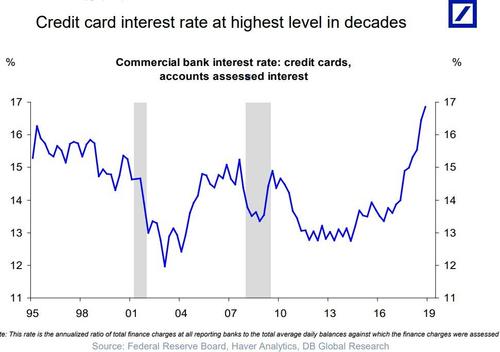
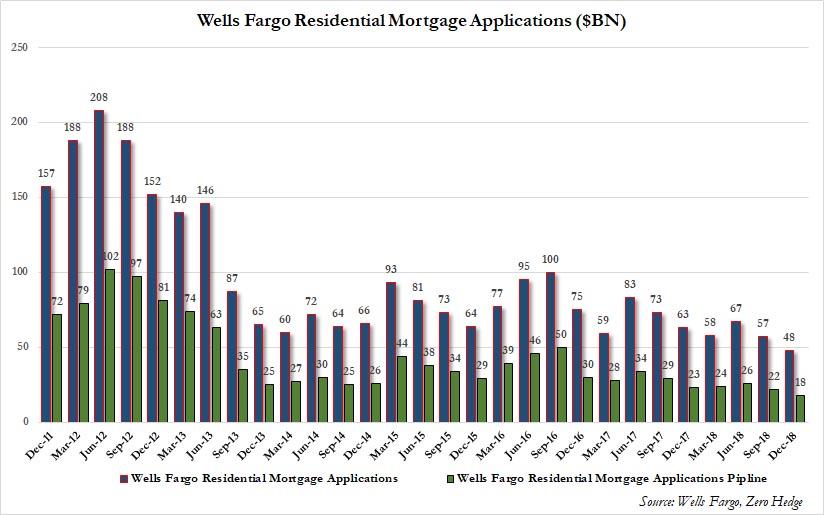
November 2018: By November, mortgage rates across the United States had hit their highest level since the Great Recession 8-1/2 years earlier. As a result, new mortgage applications across the US fell to their lowest level since December 2014. Since refinancing mostly happens when mortgage interest is lower than it was when a mortgage was taken out, refis hit their lowest point since the year 2000. So, clearly, the Fed has crushed mortgage activity.

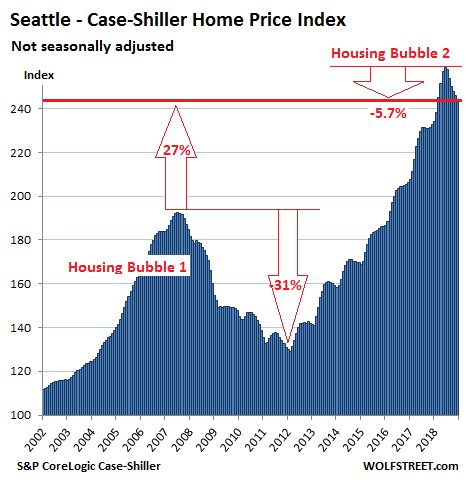
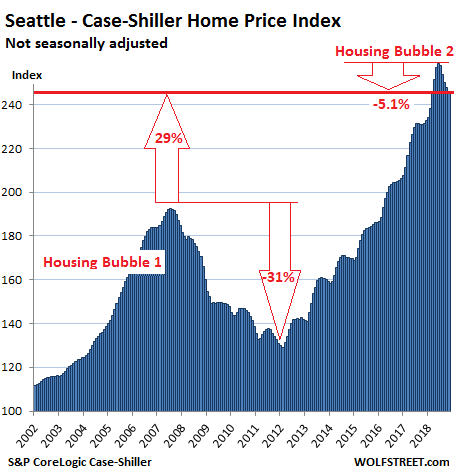
By this point, year-on-year sales had fallen for eight straight months across the nation. The west coast – with Seattle leading the earlier procession in sales and prices – had long been one of the nation’s hottest markets, which is why I stated at the start of last summer the housing market’s initial decline in Seattle was a “bellwether” for the whole US market. While my one crow on a wire (detractor) insisted I didn’t know a thing, time has proven my summer proclamation that Housing Market Crash 2.0 had begun to be dead on with Seattle leading the recession in sales and prices:

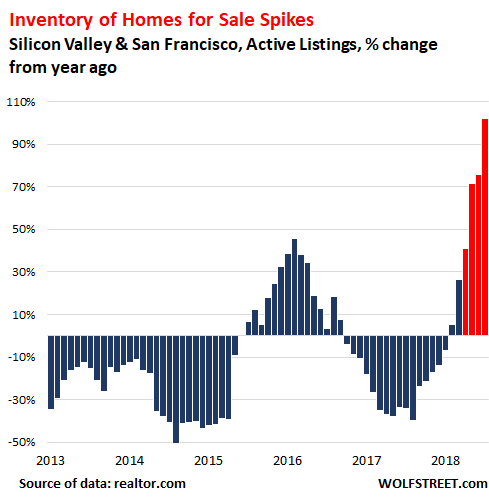
Since that proclamation, inventories in the region have soared due to a buildup from declining sales. Lending limits have increased due to falling prices and less assurance on the part of banks that collateral will hold its value or that repossessions won’t be the next wave. King County where Seattle is located has led the decline to where the number of single-family homes on the market has doubled in just a year.

Since my summer declaration, King County has recorded a bruising fall. In just half a year, the median price plunged from its peak of $726,000 last spring to $644,000 in November. According to Mike Rosenberg, a Seattle Times real estate reporter, this was the fastest price drop anywhere in the nation (over 11% in half a year – a crushing reversal from years before when rises 10% in a full year were seen as evidence of a superheated market; so, doesn’t that make this flash-frozen fall?) The last drop that steep was back at the start of the Great Recession in 2008! Not a time for housing anyone wants to compare to.

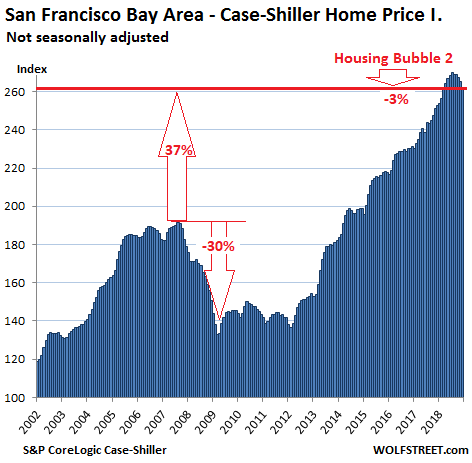
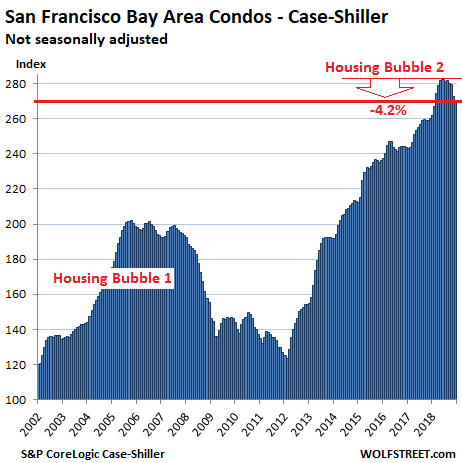
In Southern California, home sales in November plunged 12% YoY. In California, however, prices remain above their 2008 summit and have so far largely resisted following sales down. Nevertheless, Bank of America proclaimed, “We are calling it: existing home sales have peaked.”

LA Times noted if volatility in the stock market and Washington significantly affects consumer confidence and business investment decisions in 2019, the housing market could be due for significant correction into 2020…. Richard K. Green, director of the USC Lusk Center for Real Estate, told the LA Times, he is very pessimistic about the housing situation in Southern California. Green warns prices could plunge 5% to 10% into 2020, even with the current level of economic growth.

Zero Hedge

Things looked just as stark in Las Vegas by November where, out of the 10,000 homes on the market, 7,000 of those had not received a single offer, a figure 50% worse than the year before. Realtors started warning sellers not to panic, which, in itself, easily becomes a self-fulfilling warning. In the last few years, Las Vegas had risen to become one of the most overvalued markets in the nation. It looks like prices have finally peaked now that they have risen out of site on the back of low-interest loans and now that interest is higher and now that the Trump Tax cuts have stripped away some of the benefits of home ownership in favor of a larger general deduction that goes equally to renters or buyers.

By the end of November, the US Census Bureau reported that new home sales had rolled off a cliff. New homes sitting on the market were at their highest point in five years, and unsold supply per quarter was growing at an alarming annualized rate of 33% (meaning should it continue).

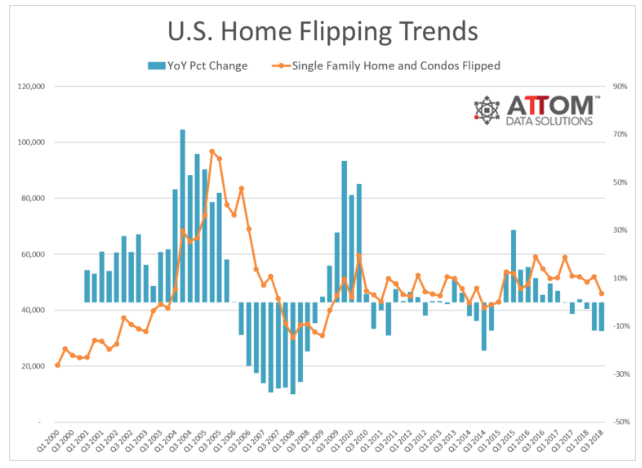
In another sign the market has turned under, housing flips have flopped in the Chicago area. The flipper boom has nearly gone bust. With properties taking longer to sell, higher interest on loans to acquire and repair those fixers eats up more profit and increases the risk involved in flipping homes. With profits sometimes now shifting into reverse, flippers are backing out of the market. The number of homes turned around by flippers in the Chicago area went from a high of 7,600 in the first three quarters of 2017 to 4,000 in the first three quarters of 2018. Across the nation, the number of homes flipped dropped 12%.

https://static.seekingalpha.com/uploads/2019/2/10/saupload_flipping_20trends.png

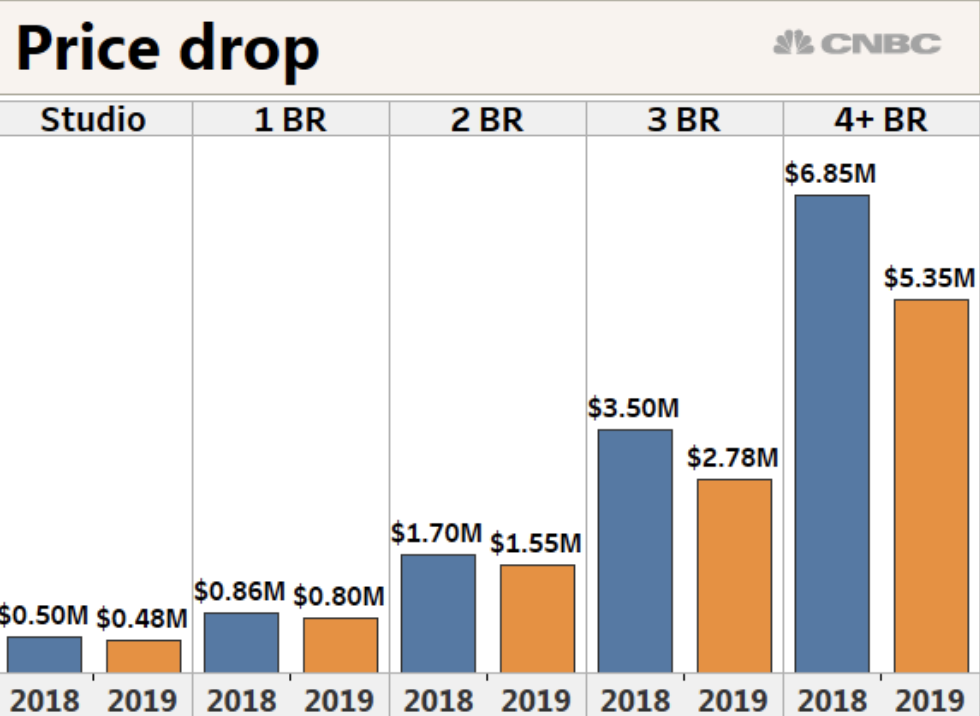
December 2018: The median price of a home in Manhattan fell below the one-million-dollar market for the first time in four years, and it took 15% longer to sell even at those lower prices. Again, real estate agents noted that the Trump Tax Cuts were making the situation worse, but particularly in high-end markets.

Relief started spreading to the boroughs, too. Most of Brooklyn’s trendiest neighborhoods saw more than a fifth of sellers pressed to lower their asking price. And in the pricey Hamptons, home purchases in the 4th quarter of 2018 crashed a full 35%, the biggest quarterly fall since … you guessed it, the Great Recession in 2009!

Inventory is piling up across the city, and that’s good news for buyers in search of a bargain. For sellers with dreams of making a big profit, it’s time for a reality check.

Bloomberg

Most of us don’t care what banksters are paying (or getting) for a home near their Wall Street office, but the massive year-end plunge in NYC and its surrounds is further evidence that the fall in home prices is not only unabated but worsening. What started showing up at the top of the market in the hottest markets like Seattle last summer is now, as I said would be the case, trending down to lower sectors just as seen in the spread from Manhattan to the boroughs.

This is all terrible news for my crow. If he had any integrity, he’d cannibalize and eat crow. Of course, neither crows nor trolls ever have integrity. However, for those who would like to become first-time home buyers someday, this is news to crow about. How you look at it depends on where you’re standing. Someone might even be able to become a first-time home buyer in Manhattan in a couple of years if the Fed doesn’t quickly spin on its heels and reverse its Great Recovery Rewind, as it is already sounding ready to do.

Nationally, sales dropped 11% in December, but the most valuable thing about December stats is that we get a final tally to reveal how the entire year went. A total of 5.34 million homes sold in 2018, proving the year to have the largest annual drop (about 10%) in total home sales since … you guessed it … the bottom of the Great Recession eight years ago.

Business Insider summarized 2018 as the year that…

The US housing market took a dark turn … as homebuying fell off a cliff and mortgage lenders saw a steep decline in applications, originations,and profits. Interest rates are partly to blame for the slide in housing, but that’s only half of the equation, according to analysts. It’s too soon to panic, but a deeper drought in housing is bad news for just about everybody, not just the banks. Significant housing declines have foreshadowed nine of the 11 post-war US recessions, according to UBS…. The decline has been broad, affecting every region in the US.

https://static.seekingalpha.com/uploads/2019/2/10/saupload_Home-Sales-2009-2018-1024x607.jpg

2018-2019 Housing Market Crash 2.0 appears inevitable, given how far off the cliff we’ve already fallen and how fast we’re going down.

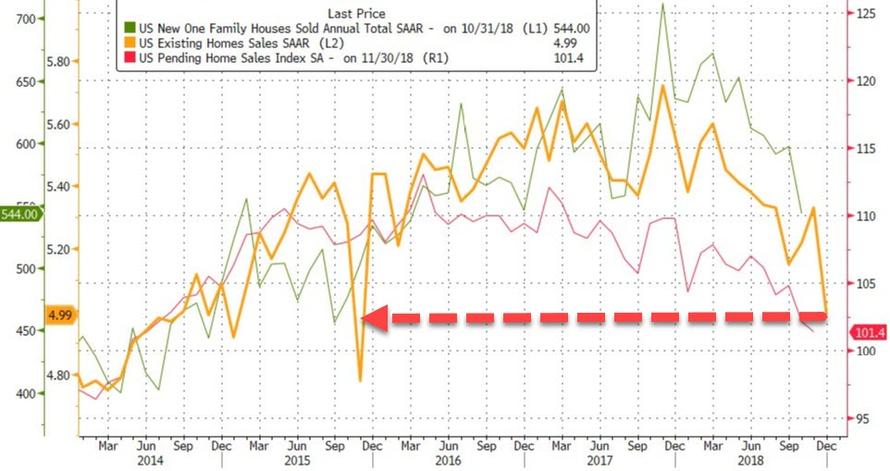
And here is where home-buying sentiment now lies:

https://static.seekingalpha.com/uploads/2019/2/10/saupload_consumer_20housing_20sentiment.png

So, eat crow, Crow. In short, sentiment across the nation is as bad as it has ever been. It looks like how people feel after they’ve already fallen off a cliff.


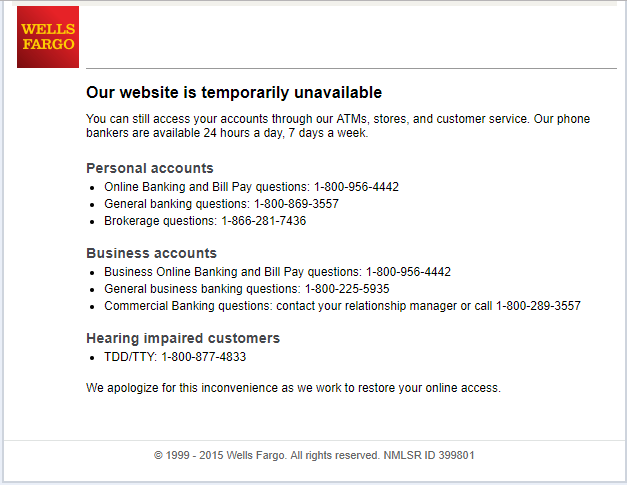
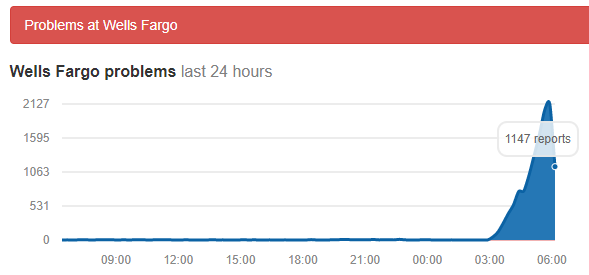
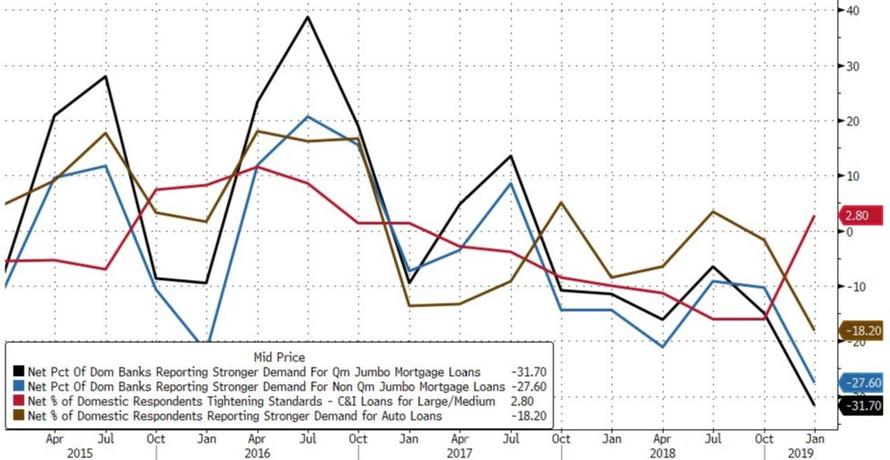
How hard is Housing Market Crash 2.0 hitting banks?

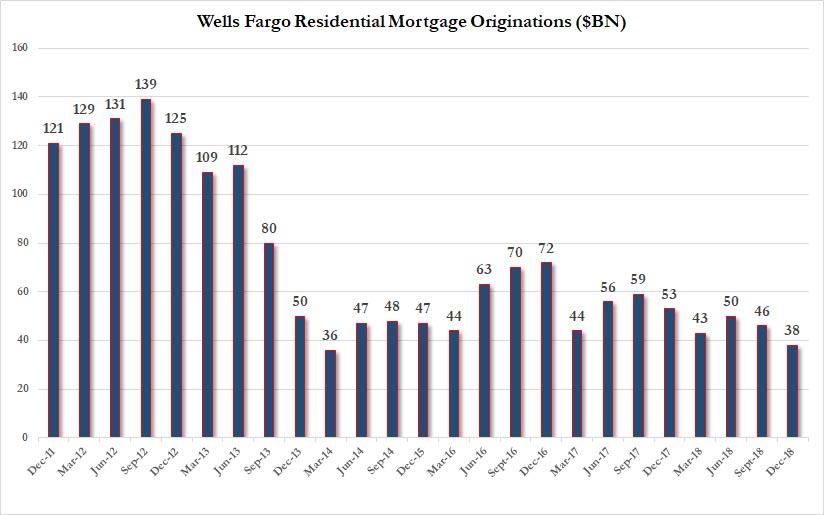
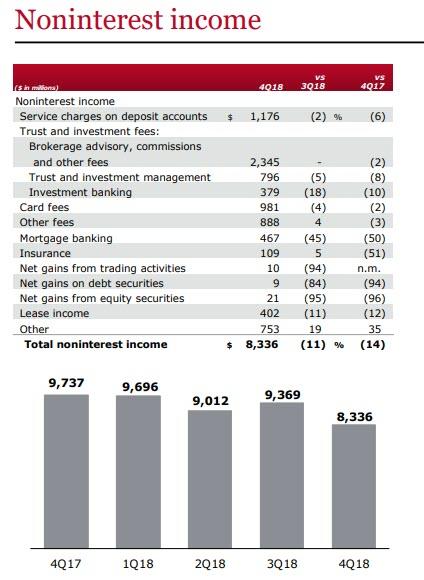
At Wells Fargo, mortgage banking revenues fell 50% to $467 million in the fourth quarter, while originations declined 28% to $38 billion. JPMorgan, meanwhile, saw mortgage income fall to $203 million, a 46% drop from the same period last year. Originations fell 30% to $17.2 billion.

that’s Fifty percent!

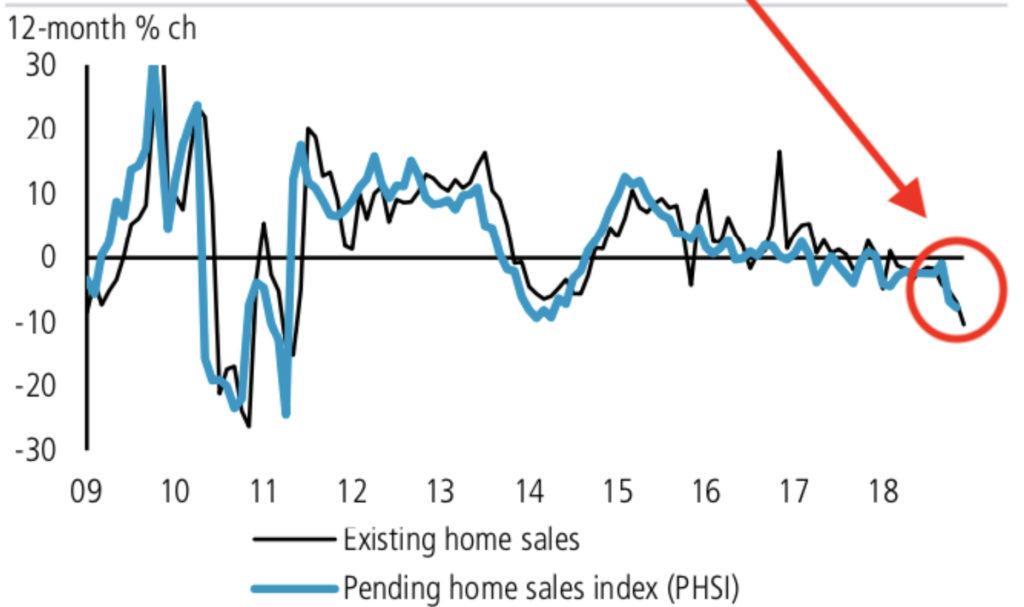
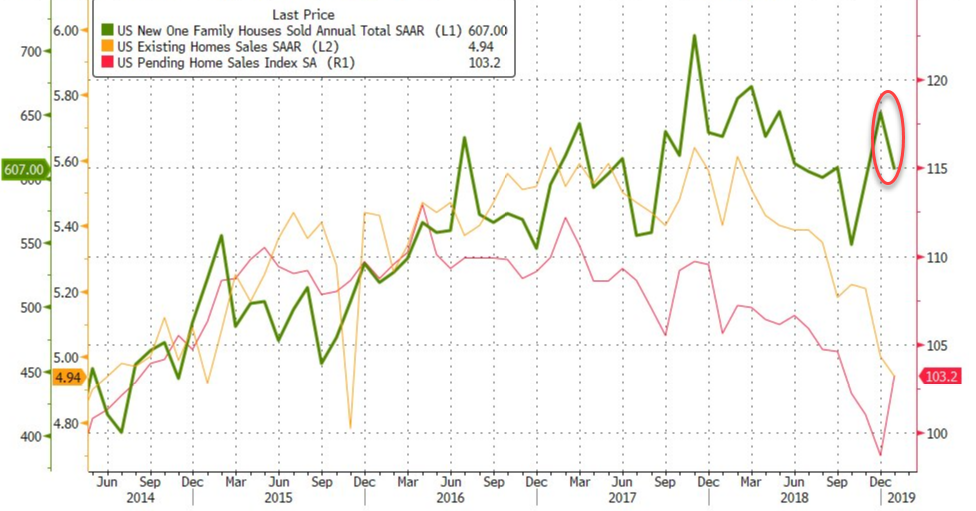
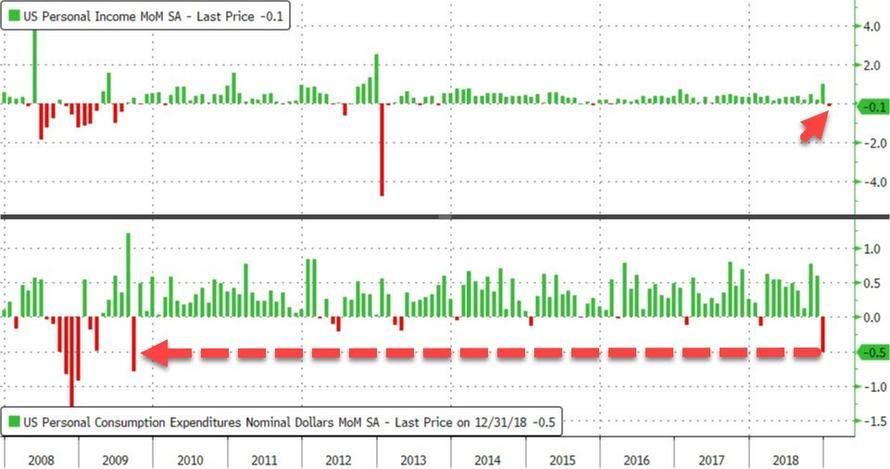
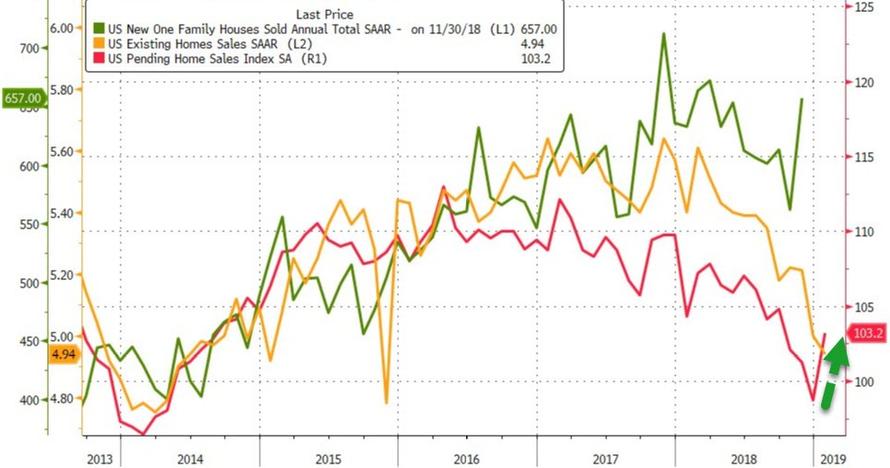
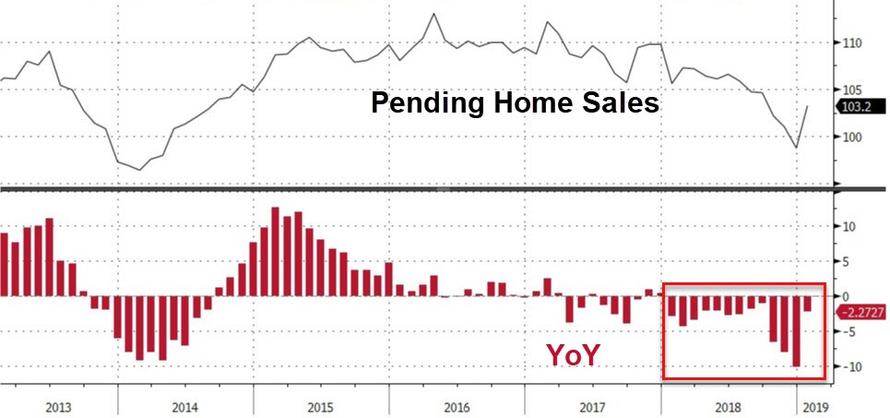
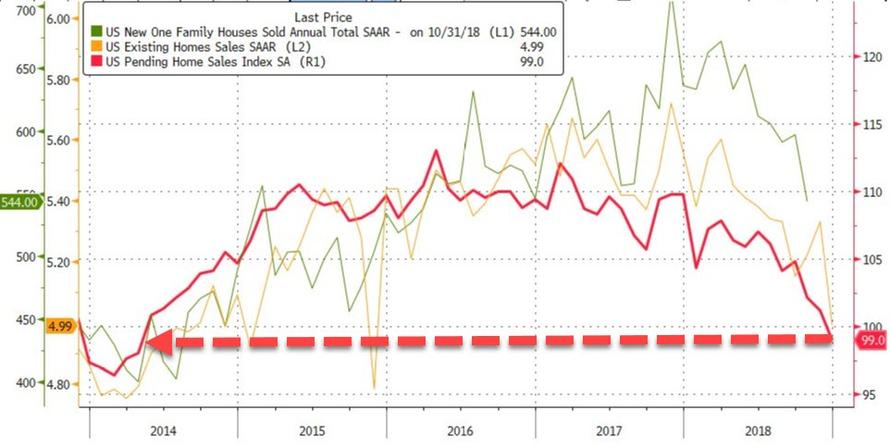
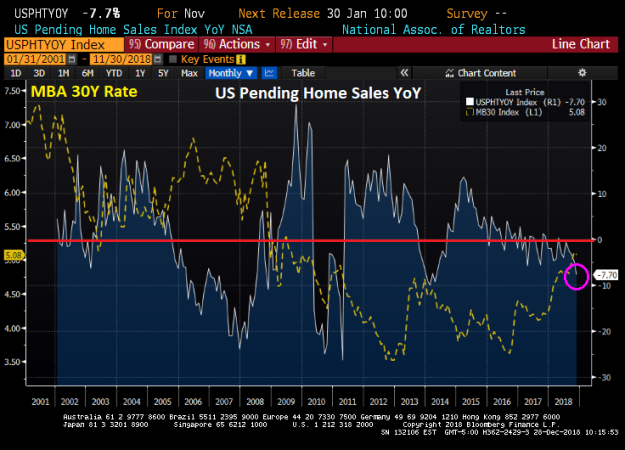
Looking forward: Pending sales are a forward-looking indicator. Due to the lag of a month or two between a pending contract and closing, the direction of movement in pending sales tells us where we’ll most likely be in final sales a month or two down the road. November’s pending sales told us that sales in January when all reporting is completed in February will likely be down to their lowest since May 2014. And December’s sales, which were way down in November’s pending report, already came in worse way worse than November’s actuals, falling a whopping 2.2% from where they were in an already bad November. So, we can expect January’s to do no better once all reports are in.

Real estate bimbos had expected a 0.5% rise in December! Of course, they were also ebulliently predicting a warm spring market for 2019 and recently were forced by facts to temper their predictions. In my opinion, real-estate sales people (as a group, not all individuals) fit somewhere among the following groups for lying: 1) transportation sales people (car dealers and horse traders); 2) banksters; 3) stock brokers; and 4) politicians.

https://static.seekingalpha.com/uploads/2019/2/10/saupload_US-housing-Pending-home-sales-2018-12-yoy-change.png
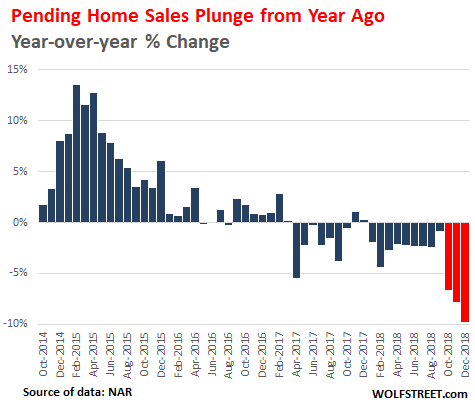
Graph by Wolf Street

“It’s been dripping down, down, down,” NAR chief economist Lawrence Yun said…. “Frustrating that the housing market is not recovering.”
Wolf Street

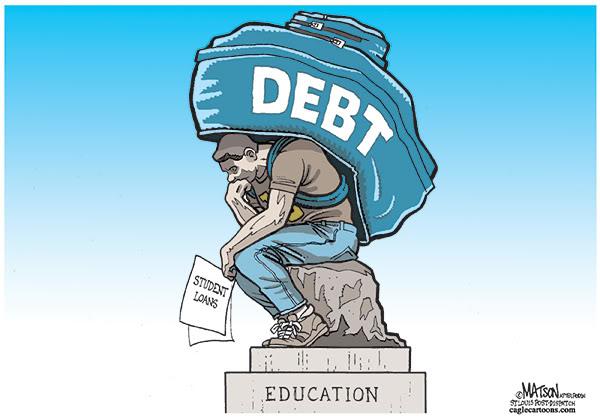
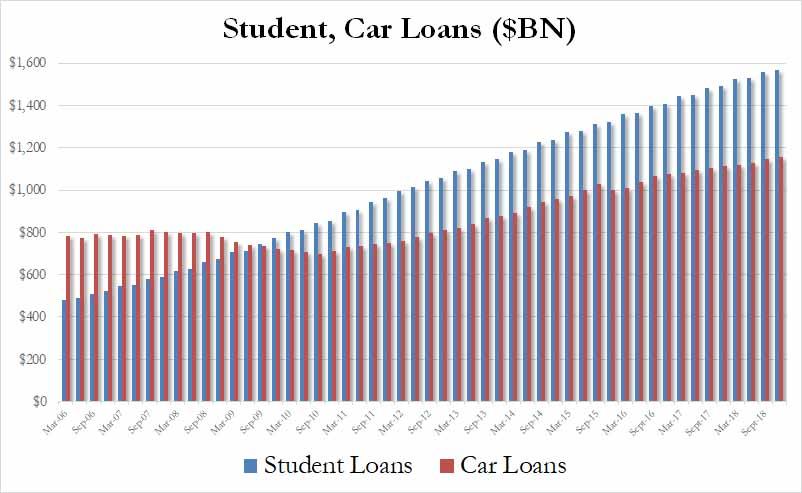
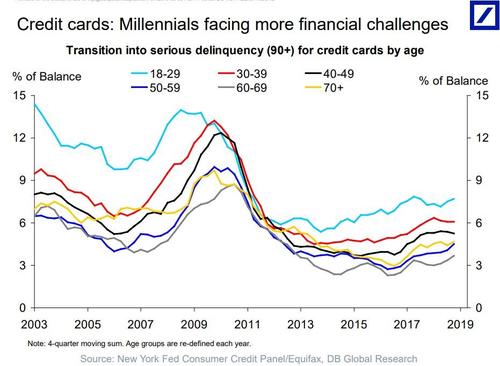
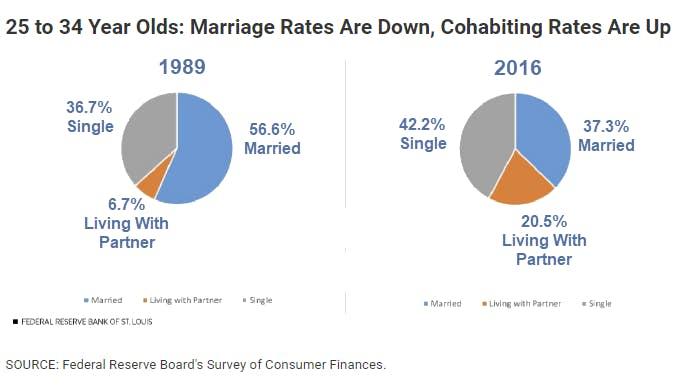
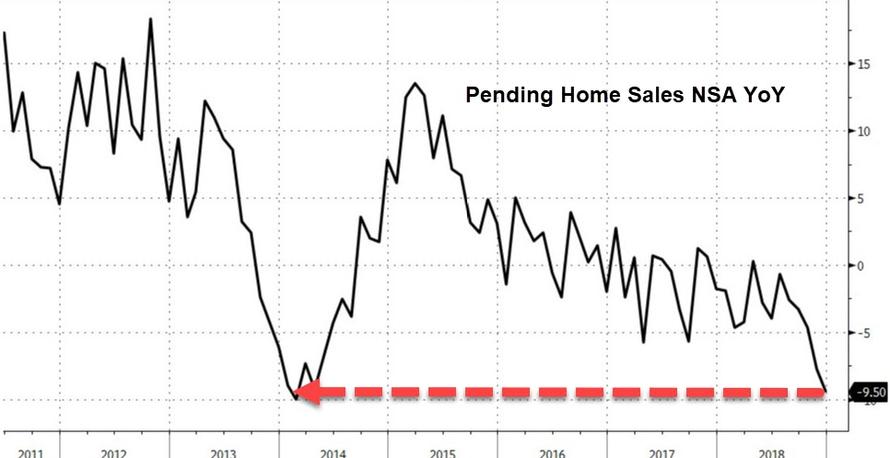
Pending sales strongly indicate that Housing Market Crash 2.0 is still fully on track for 2019. Moreover, year-on-year declines have been worsening each month since the start of October even though interest rates improved in November. That, to me, supports my view that the Fed has already gone too far to stop the damage, even if it quits tightening altogether.On a longer-term perspective, consider the demographics: School-debt-ridden, under-employed millennials, who are more into buying experiences in life than things, are not inclined to buy homes that are in the housing-bubble price zone. Neither are baby-boomers looking to retire, which often involves downsizing.


None of this bothers me because my wife and I have the best of all worlds – very low fixed interest, a home we bought at the bottom of the market last time around, a chance to sell now high or stay and keep reaping the rewards of living in a beautiful place.

I benefited from the last crash. I hope others are able to reap the same reward by turning the next bottom into their blessing. It’s all about seeing clearly what is coming so you can sell high and buy low. It is what can happen to those who see reality clearly and don’t live in economic denial like my crow who could only see what he wanted to see in praise of his choice for president. My lone crow on a wire, who scoffed at a good call because he didn’t like it, now looks like the fool I warned last summer he would prove to be. He has fallen off the wire because he hasn’t a leg left to stand on. All reports everywhere have come in against consistently month after month for over half a year.

(I’m not advising anyone as everyone’s particular situation is different – just saying what I’ve done, what I’m doing and why. I’m saying what I believed would happen and is now happening so you can weigh all risks and possible rewards for yourself in your own context and your own ability to take risk in order to do as you feel best.)

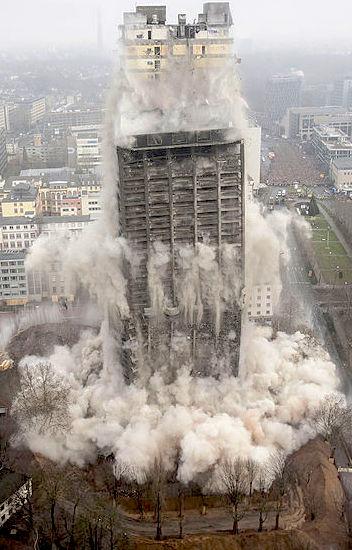
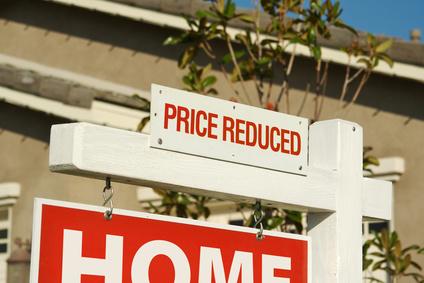
Here is a picture of where we are in our developing 2018-2019 housing market crash:

https://static.seekingalpha.com/uploads/2019/2/10/saupload_Seattle_-_House_damaged_in_Perkins_Lane_landslide_1954.png

After 2018, we look about like this. 2018 pushed us just over the edge into a housing market crash that is as likely to continue sliding as the house in this picture at the top of a bluff that is giving way. (And I’ve seen places in Seattle that look exactly like that.)

Canada Housing Market Crash

One major difference between Housing Market Crash 2.0 and the last time is that this one is already global. The last one started in the US and mostly stayed in the US. This one is rapidly building in several nations because it is part of the bursting of the “Everything Bubble.”

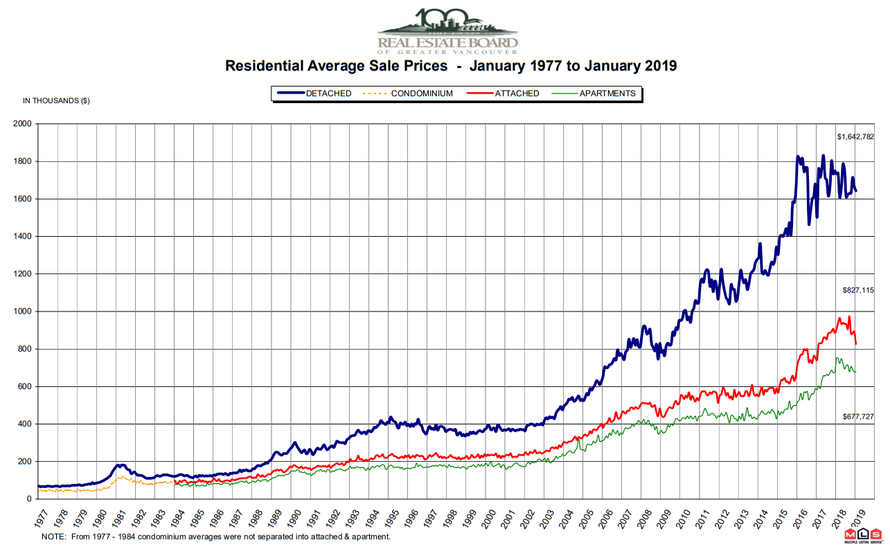
Vancouver, June-July, 2018: Residential property sales fell 14.6% from June 2018 to July but a massive 30.1% from a year before. The 2,070 transactions that took place were the fewest since the end of the last millennium. Buyers and sellers were both reportedly sitting things out in confusion as to whether recent price gains would continue or whether the housing bubble had already burst. (As of August, prices had not started to drop.)

Sales of detached properties in July decreased 32.9% from a year before, and apartments dropped 26.5%. In fact, July’s sales were 29.3% below the 10-year average for July. Much of the plunge was attributed to Vancouver’s new law aimed at shutting out absentee Asian buyers that were ramming up housing prices while leaving the homes abandoned to become derelict in high-end neighborhoods. So, the decline is, in large part, intentional; but, if declining sales bring down prices, the dangers of falling prices to people who find themselves underwater and to their banks remain just as high.

The topping of the Canadian housing market looked like this:

https://static.seekingalpha.com/uploads/2019/2/10/saupload_vancouver_20home_20prices.jpg
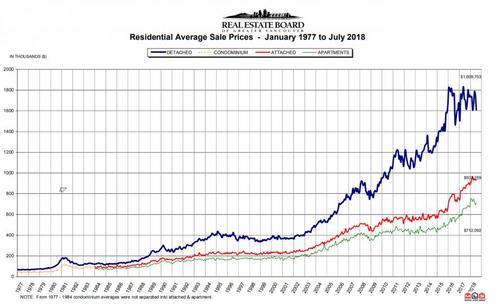
Canadian market looks like a bus crashing into a brick wall.

January 2019: The B.C. Real Estate Association claimed the huge drop in British Columbia housing sales was due to mortgage stress testing. In spite of the plunge, prices are holding in the province, though no longer rising since last spring. Inventory is building to a level that will probably force prices down by or before summer.

Australia Housing Market Crash

Australia is faring even worse. Melbourne housing prices have plummeted at their fastest quarterly pace ever recorded! Less than two months ago, Australian housing regulators were warned to prepare “contingency plans for a severe collapse in the housing market” that could lead to a “crisis situation.” The Australian market peaked back in October 2017. It’s been downhill ever since with momentum now hitting break-neck speed. Sidney prices are down 12% from their peak.

Experts have been left stunned after Aussie house prices plunged at “the fastest rate of decline ever seen”. And there’s more pain to come…. “We have seen the downturn accelerate over the last three months. At 4 per cent down in Melbourne that’s the fastest rate of decline we’ve ever seen of any rolling three-month period, and Sydney is virtually (the fastest outside) a really brief period in the ’80s.” Sydney’s total decline is now the worst since [CoreLogic] began collecting records in 1980… One analyst has even tipped falls of up to 30 per cent, based on the revelation from the banking royal commission that almost all mortgages written between 2012 and 2016 … over-assess borrowing capacity.
News.com.au

The defaults will be cascading in soon. While Melbourne and Sidney are in an all-out housing crash, other cities in Australia are feeling the pinch, too. Every capital city marked declines, except Canberra. As in the US and Canada, the most expensive end of the market is taking the biggest fall first. Melbourne and Sidney, however, constitute half the value of Australia’s total housing market; so a drop in only those two cities if the plunge were isolated could still be devastating to Australian banks.

Hong Kong Housing Market Crash

Even the world’s hottest housing market is in decline. In stock market terms, one could say it has “entered a correction.” After its longest streak of falling values since 2016, the price of existing homes is down almost 10% from their August peak. This is actually seen by many, including some Chinese government officials, as relief to a market that had long run too hot.

The article above would have been one of my Premium Posts. Such articles are long to readbut are intended to present the most comprehensive overviews you’ll find anywhere. I chose to make this one available to all for two reasons: 1) to show the depth and breadth of Premium Post articles so readers can assess what they are like; and 2) because it concludes an argument made last summer over a prediction made almost two years ago for last summer.

Source: by David Haggith | Seeking Alpha
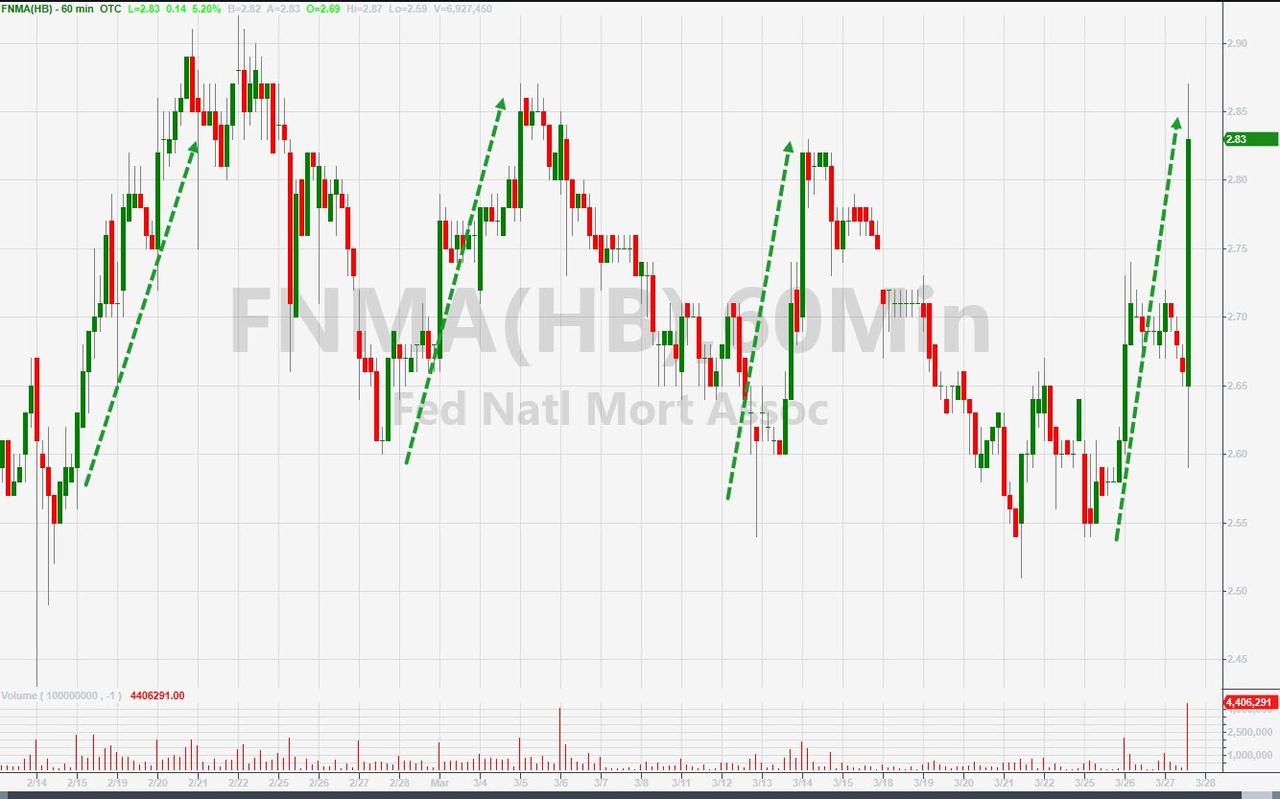
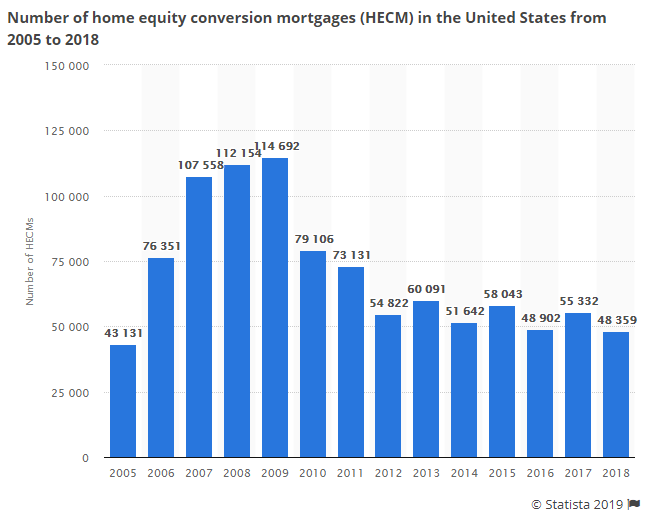
“They’re Running Out Of Options” – U.S. Farm Bankruptcies Surge To 10-Year High As Trade War Bites

The Farm Belt helped cement President Trump’s historic electoral triumph over Hillary Clinton. But even before Trump started his trade war with China nearly one year ago, Trump’s protectionist bent has added to the collective woes of farmers, who were already struggling with low prices for corn, soy beans and other agricultural commodities.

China’s decision to purchase millions of soybeans (after orders ground to halt late last year following another round of tariffs) offered some relief to soybean producers who were teetering on the brink even with President Trump’s farm bailout money in hand. But even if negotiations result in a lasting agreement, it might not be enough to save hundreds of American family farms from collapsing into bankruptcy, as the Wall Street Journal pointed out in a story published Wednesday.

https://www.zerohedge.com/s3/files/inline-images/Screen%20Shot%202019-02-06%20at%204.26.01%20PM.png?itok=yL2oJsJ4According to a WSJ analysis of federal data, the number of farmers filing for bankruptcy has climbed to its highest level in a decade…

https://www.zerohedge.com/s3/files/inline-images/Screen%20Shot%202019-02-06%20at%204.25.28%20PM.png?itok=AR7pPbXg

…driven by a lasting slump in agricultural commodity prices due in large part to the rise of rival producers like Brazil and Russia.

Bankruptcies in three regions covering major farm states last year rose to the highest level in at least 10 years. The Seventh Circuit Court of Appeals, which includes Illinois, Indiana and Wisconsin, had double the bankruptcies in 2018 compared with 2008. In the Eighth Circuit, which includes states from North Dakota to Arkansas, bankruptcies swelled 96%. The 10th Circuit, which covers Kansas and other states, last year had 59% more bankruptcies than a decade earlier.

And Trump’s trade wars – not just with China, but more broadly – aren’t helping.

Trade disputes under the Trump administration with major buyers of U.S. farm goods, such as China and Mexico, have further roiled agricultural markets and pressured farmers’ incomes. Prices for soybeans and hogs plummeted after those countries retaliated against U.S. steel and aluminum tariffs by imposing duties on U.S. products like oilseeds and pork, slashing shipments to big buyers.

Low milk prices are driving dairy farmers out of business in a market that’s also struggling with retaliatory tariffs on U.S. cheese from Mexico and China. Tariffs on U.S. pork have helped contribute to a record buildup in U.S. meat supplies, leading to lower prices for beef and chicken.

Because of this, the level of farm debt is approaching levels last seen in the 1980s.

https://www.zerohedge.com/s3/files/inline-images/Screen%20Shot%202019-02-06%20at%204.25.05%20PM.png?itok=rS1-EabO

The stress on American farmers is also affecting agribusinesses giants like Archer Daniels Midland, Bunge and Cargill, who are feeling the heat even as lower crop prices translate into less-expensive raw materials for the commodity buyers.

What’s worse is that even after working side jobs to try and make ends meet, some farmers are still winding up more than $1 million in debt.

Mr. Duensing has managed to keep farming, hiring himself out to plant crops for other farmers for extra income and borrowing from an investment group at an interest rate twice as high as offered by traditional lenders. Despite selling some land and equipment, Mr. Duensing remains more than $1 million in debt.

“I’ve been through several dips in 40 years,” said Mr. Duensing. “This one here is gonna kick my butt.”

Even more shocking than the number of bankruptcies, the number of farms that continue to operate while losing money has risen to more than half of all farms, even as the level of productivity has never been higher.

More than half of U.S. farm households lost money farming in recent years, according to the USDA, which estimated that median farm income for U.S. farm households was negative $1,548 in 2018. Farm incomes have slid despite record productivity on American farms, because oversupply drives down commodity prices.

And bankers who lend to farms warn that there will likely be more bankruptcies to come as more producers “are running out of options.”

Agricultural lenders, bankruptcy attorneys and farm advisers warn further bankruptcies are in the offing as more farmers shed assets and get deeper in debt, and banks deny the funds needed to plant a crop this spring.

“We are seeing producers who are running out of options,” said Tim Koch, senior vice president at Omaha, Neb.-based Farm Credit Services of America, which lends to farmers and ranchers in Iowa, Nebraska, South Dakota and Wyoming.

Perhaps the only silver lining – if you can even call it that – is that bankruptcy lawyers in states where farms are prevalent are doing their best business in years.

Mounting stress in the Farm Belt has meant big, if somber, business for the region’s bankruptcy attorneys. In Wichita, Kan., the firm of bankruptcy attorney David Prelle Eron filed 10 farm bankruptcies in 2018, the most it has ever handled in one year. Wade Pittman, a bankruptcy attorney based in Madison, Wis., said his firm filed about 20 farm bankruptcies last year, ahead of past years, and he said he expects the numbers to continue to rise as milk prices remain stagnant.

Joe Peiffer, a Cedar Rapids, Iowa-based attorney, said his office is the busiest—and most profitable—it has ever been. Just before Christmas, he sent letters to eight farmers declining to represent them because he didn’t have sufficient staff to handle their cases promptly. He is doubling his office space and interviewing new attorneys to join the firm.

One factor driving bankruptcies is tighter lending standards, said Mr. Peiffer, including at agricultural banks, which are under pressure from regulators to exercise greater caution over their farm-loan portfolios.

“I’m dealing with people on century farms who may be losing them,” said Mr. Peiffer, whose own father sold his farm in the late 1980s.

One anecdote featured in the story recalls the rash of suicides among NYC cab drivers, who have struggled to pay the hefty loans attached to their taxi medallions thanks to the rise of Uber, Lyft and other ride sharing apps.

Darrell Crapp, the fifth-generation owner of a hog and cattle farm in Lancaster, Wis., returned to his home one day with a queasy feeling in his stomach, only to find his wife unconscious on their bathroom floor. She had swallowed a handful of pills. She survived, but Crapp attributed the incident to financial stressors as their farm teetered on the brink of bankruptcy.

It was a Sunday in April 2017 when a queasy feeling in Darrell Crapp’s stomach sent him rushing home. He found his wife, Diana, lying crumpled on the floor of their Lancaster, Wis., bathroom. She had swallowed a handful of pills.

Overwhelmed with debt and with little prospect of turning a profit that year, the Crapps knew BMO Harris Bank NA wouldn’t lend them money to plant. The bank had frozen the farm’s checking account.

Mrs. Crapp managed the fifth-generation corn, cattle and hog farm’s books. She had stayed up nights drafting dozens of budgets to try to stave off disaster, including 30-day, 60-day and 90-day budgets.

“It was too much for her,” Mr. Crapp, 63, said of his wife, who survived the incident.

Crapp Farms filed for chapter 11 bankruptcy the next month, with a total debt of $36 million.

After filing for bankruptcy, the last of Crapp’s land, a 197-acre patch that was homesteaded by his ancestors in the 1860s, will be auctioned off in the near future.

And after all that, Crapp may still need to declare Chapter 12 bankruptcy, a personal bankruptcy provision available to farmers and fishermen, to wipe his remaining debts.

“We haven’t won very many battles,” said Mr. Crapp. “The bank pretty much owns us.”

Unfortunately for American farmers hoping to reclaim the market share they’ve lost during the trade war with China, even if Trump can strike a trade deal with the Chinese that mandates purchases of US agricultural products – which the Chinese have already pledged to do – there’s still another wrinkle: Japan recently signed a revamped version of the TPP that will offer preferential treatment to Australia, New Zealand and other rivals to American farmers, potentially sealing off another market from US agricultural products.

Source: ZeroHedge

Netflix Paid NOTHING In Federal and State Taxes In 2018 Despite Record Profits of $845MM – And A $22MM Rebate

  • The Institute on Taxation and Economic Policy said corporations like Netflix are still ‘exploiting loopholes’ under the Tax Cuts and Jobs Act
  • Senior fellow Matthew Gardner said ‘Netflix is precisely the sort of company that should be paying its fair share of income taxes’ and called the figures ‘troubling’
  • Donald Trump promised ‘the biggest tax cut, the biggest reform of all time’
  • Netflix, which has just announced a price hike, now has 139 million subscribers
  • The streaming site says despite report they paid $131 million in taxes in 2018

(DailyMail) Netflix didn’t pay a cent in state or federal income taxes last year, despite posting its largest-ever U.S. profit in 2018 of $845million, according to a new report.

In addition, the streaming giant reported a $22 million federal tax rebate, according to the Institute on Taxation and Economic Policy (ITEP). 

Senior fellow at ITEP Matthew Gardner said corporations like Netflix, which has its headquarters in Los Gatos, California, are still ‘exploiting loopholes’ and called the figures ‘troubling’.

Netflix says they paid $131 million in taxes in 2018 and this is declared in financial documents. But Gardner says this figure relates to taxes paid abroad, according to a separate part of their statements.   

He told DailyMail.com: ‘It is pretty clearly true that Netflix’s cash payment of worldwide income taxes in 2018 was $131 million. But that is a worldwide number—the amount Netflix actually paid to national, state and local governments worldwide in 2018. This tells us precisely nothing about the amount Netflix paid to any specific government, including the U.S.’ 

Gardner added: ‘Fortunately, however, there is another, more complete geographic disclosure of income tax payments. 

‘The notes to the financial statements have a detailed section on income taxes. And what this tells us is that all of the income taxes Netflix paid in 2018 were foreign taxes. Zero federal income taxes, zero state income taxes in the US.’ 

Gardner said the public is now ‘getting its first hard look at how corporate tax law changes under the Tax Cuts and Jobs Act affected the tax-paying habits of corporations’.

He said: ‘With a record number of subscribers, the company’s profit last year equaled its haul in the previous four years put together. When hugely profitable corporations avoid tax, that means smaller businesses and working families must make up the difference.

Netflix CEO Reed Hastings. The company didn’t pay a dime in state or federal income taxes last year despite posting its largest-ever U.S. profit in 2018 of $845 million, a new report says.

Netflix, which has just announced a price hike, now has 139 million subscribers.

President Donald Trump promised ‘the biggest tax cut, the biggest reform of all time’ and said ‘the numbers will speak’ for themselves when he signed the bill in December 2017.

The GOP argued their tax overhaul plan would mean middle class Americans will get a big tax cut and see their wages go up because of a slash on the rate paid by corporations.

But Gardner argued ‘many corporations are still able to exploit loopholes and avoid paying the statutory tax rate—only now, that rate is substantially lower’.

He added: ‘Netflix appears to be every bit as unaffected by corporate tax laws now as it was before President Trump’s ‘reform’. 

‘This is especially troubling because Netflix is precisely the sort of company that should be paying its fair share of income taxes.’

Hit movies like Bird Box saw the company reach 139 million subscribers worldwide.

Users can pay up to $15.99 for Netflix’s premium package to access their hit shows, movies and documentaries. There are now 139 million subscribers worldwide to the service which announced a price hike earlier this month.

The online streaming service announced it would bump costs by 13 to 18 percent depending on the plan. The website’s most standard and most popular package will cost $12.99 moving forward, compared to today’s price of $10.99.

Customers who typically pay $7.99 with the basic plan will have to pay $8.99 with the new pricing. And those with the premium plan at $13.99 will now pay $15.99 each month for the service.

Netflix says they paid $131 million in taxes in 2018. Gardner says this figure relates to taxes paid outside the US. 

Source: By Lauren Fruen For Dailymail.com


Wells Fargo Experiences 2nd Major Systems Outage In Six Days: Websites, apps, ATMs offline

Wells Fargo is experiencing a system outage that is disrupting access to the firm’s website, mobile apps, ATMs and debit and credit cards.

Wells Fargo customers took to Twitter Thursday morning to report their frustration about their transactions being declined and being unable to withdraw money from their accounts or check their balances online.

The Wells Fargo Advisors website appears to still be up and running. However, investors are unable to check their brokerage accounts via the Wells Fargo mobile app.

InvestmentNews reached out to Wells Fargo to ask whether advisers’ internal systems are similarly impacted and what is causing the system outage.

https://www.zerohedge.com/s3/files/inline-images/unavailable.png?itok=LmgpSJaChttps://www.zerohedge.com/s3/files/inline-images/wf%20down%20detector.png?itok=eo0Xeubnhttps://zh-prod-1cc738ca-7d3b-4a72-b792-20bd8d8fa069.storage.googleapis.com/s3fs-public/styles/inline_image_desktop/public/inline-images/outagemap.png?itok=VdfmDv8X

“Wells Fargo Advisors is aware of the issue and technical teams are working to resolve the issue as quickly as possible,” spokeswoman Jackie Knolhoff wrote in an email.

At 9:06 a.m. EST, Wells Fargo tweeted an apology to customers. An hour later, the company followed with a tweet saying, “We’re experiencing a systems issue that is causing intermittent outages, and we’re working to restore services as soon as possible. We apologize for the inconvenience.”

TradePMR, a custodian that recently partnered with Wells Fargo on its growing RIA channel, said connectivity to First Clearing, Wells Fargo’s subsidiary for RIA services, is not affected.

“Advisers using TradePMR’s technology have not experienced any service issues,” said Robb Baldwin, founder and CEO of TradePMR, adding that his platform is completely separate from Wells Fargo Advisor technology. “It is business as usual for our advisers.”

Regional news outlet KULR 8 reported that the outage could be tied to a fire at a Wells Fargo server farm in Shoreview, Minn. The Shoreview fire department later clarified on Twitter that the server farm’s fire suppression system was triggered by dust from construction. It is unclear whether or not this is responsible for the entire system outage.

This is the second time in a week the firm experienced a digital disruption. A similar disruption occurred last Friday.

InvestmentNews will update this article as the story progresses.

Source: by Ryan W. Neal | Investment News

Société Générale’s Albert Edwards: Investors Should Brace For A World Of Negative Rates, 15% Budget Deficits And Helicopter Money

Eariler this week, when the San Fran Fed published a paper that suggested that the recovery would have been stronger if only the Fed had cut rates to negative, we proposed that this is nothing more than a trial balloon for the next recession/depression, one in which the Federal Reserve will seek affirmative “empirical evidence” that greenlights this unprecedented NIRPy step (in addition to QE of course).

Today, in his latest note to clients after returning from a 2 week vacation in Jamaica, SocGen’s Albert Edwards picks up on this point and cranks it up to 11 writing that “as central banks thrash around for new tools, I have long thought the next recession would trigger the adoption of helicopter money and deeply negative Fed Funds. Clients have been sceptical of the latter because of the negative impact on bank margins, but now I am more convinced than ever that we will see negative Fed Funds.”

Predictably, Edwards takes aim at the SF Fed “analysis”, writing that “just because the San Fran Fed has published this paper doesn’t mean the Washington Fed will adopt the policy in the next recession, but with this economic cycle clearly now in its final act, one can sense that a number of trial balloons are being floated on what the Fed might do in the next recession. This is just one of them.

More to the point, Edwards also focuses on the recent resurgence of interest in Modern-Money Theory, i.e., MMT, or government-mandated helicopter money, which is predictably a “theory” espoused by socialists everywhere most notably Bernie Sanders and his economic advisors…

https://www.zerohedge.com/s3/files/inline-images/MMT%20spike.jpg?itok=_k1YiwHo

… and writes that “many of the more radical Democrats in the US seem to be adopting the idea and since I expect the US budget deficit to soar to 15% of GDP in the next recession, the ideas of MMT will surely become even more popular.” Edwards is convinced that “the Fed and other central banks will be desperate enough to adopt outright monetisation (aka helicopter money, that is to say the direct central bank financing of public sector deficits) in the next recession. And as that will coincide with public sector deficits in the mid teens, we will be conducting a live MMT experiment. Welcome to a brave new world!”

As validation of his (not all that controversial) view, Edwards believes that in recent weeks we have seen the Fed “take a large step away from Quantitative Easing (QE) and towards outright monetisation.”

When QE was introduced the central bankers vehemently denied that QE was monetisation as the latter sounded too scary. Their argument was QE is different from outright monetisation because they (the central banks) were absolutely going to unwind QE as soon as practical (aka Quantitative Tightening or QT – remember how they told us it was going to be so easy with minimal consequences!). And as economic agents knew QE would be reversed and did not regard it permanent, QE could not be equated to monetisation. My own view has always been that until QE is actually fully reversed, it is to all intents and purposes the equivalent of outright monetisation, and so the central banks are merely splitting hairs.

Naturally, Powell’s recent commentary which switched off the balance sheet unwind “autopilot” caught Edwards’ attention, and the recent trial balloons by the WSJ – and the Fed – hinting at the like likely abandonment of QT, just as it was getting started- removes any doubt in Edwards’ mind “that what we have seen since 2008 is in fact outright monetization” and asks rhetorically, “does anyone really think these bloated central bank balance sheets will ever be reduced before the next recession brings yet another tidal wave of QE?”

The answer: of course not, especially if it only took a 20% drop in stocks for the Fed to immediately reverse its “autopilot” course.

Which brings us to the topic of the next inevitable recession, in which Edwards expects our “all-knowing” central bankers will pull any and every policy lever they have to hand and that in my view includes the Fed pursuing deeply negative interest rates.”

Here the SocGen strategist concedes that the reason most clients reject this outcome is “the destructive impact negative interest rates would have on bank margins, which might exacerbate any credit crunch. Hence policy makers would therefore shy away from negative rates.”

Needless to say, Edwards himself disagrees, reasoning that unlike in the 2008 Global Financial Crisis he does not expect banks to be at the apex of the next recession, perhaps as a result of an ocean of liquidity thanks to the $1.5 trillion in excess reserves currently in the system.

I have long said that in the next recession the main toxic asset to avoid will be US corporate bonds – most especially Investment Grade. In the next recession, banks will inevitably lose money if commercial and residential property prices decline and corporate and consumer loans default – although we have been reassured that banks are better capitalised than before and that they have been vigorously stress-tested.

But more importantly due to the Volker Rule and other macro-prudent regulations, banks do not sit on mountains of corporate and mortgage paper as they did in 2007. It is pension funds, insurance companies – and via ETFs, mom and pop – who bought the avalanche of US corporate bonds issued since the last GFC.

So the good news, according to the grumpy SocGen permabear, is that banks are unlikely to be a systemic risk as the next crisis drives a rapid unravelling of the global economy, like they were in 2008 (sarcastically, he then notes that he is “not known for seeing a cup half full!”).

That is why he is confident that central bankers will not care if bank profits are squeezed as interest rates are pushed deep into negative territory – including the sort of adverse market reaction towards the banking sector we saw when Japan cut interest rates from +0.1% to -0.1% in early 2016 (Japanese banks fell around 25% relative to the market as did the eurozone banks as the ECB pushed interest rates to minus 0.4%, see charts below).

https://www.zerohedge.com/s3/files/inline-images/banks%20in%20NIRP%20edwards.jpg?itok=BEiUYdwl

Addressing just this hot topic, moments ago Dallas Fed president Robert Kaplan said that he is “skeptic about whether that’s a viable option” although he quickly added that the central bank should “not take any option off the table” even as he admitted that deploying negative interest rates in the U.S. could cause problems for the financial system.

Perhaps that’s some advice the Fed could have given the ECB, SNB and BOJ before they launched NIRP, but we digress, especially since Edwards is ultimately right, and with fears about banks off the table, banks will be driven by just one prerogative (the same one that Nomura’s Charlie McElligott hinted at earlier) – doing everything to preserve inflation, and avoid deflation, to wit:

The primary central bank objective will be to avoid outright deflation. The inability of the ECB, in particular, to escape the gravitational pull of zero core inflation, despite its continual predictions of success, has been truly shocking

https://www.zerohedge.com/s3/files/inline-images/ecb%20forecasting.jpg?itok=07iNe5Mh

However, it is not just the eurozone that risks falling into outright deflation in the next recession: according to Edwards, the US is also vulnerable, and while core CPI and core PCE have remained relatively healthy in recent months, and roughly at the
Fed’s 2% target, this has been mostly a function of strong rents and Owner Equivalent Rent, i.e. housing prices, which dominate the core CPI calculation.

However, the risk is that US rent inflation “tends to broadly follow the fortunes of the housing market overall and there is no doubt that the US housing market has begun to unravel quickly over the past six months. New home prices are now actually falling yoy (even with a heavy 9-month moving average, see right-hand chart below). The last two occasions this happened were Nov 1990 and Dec 2007 when the US economy had entered recession! Rent inflation slumped shortly afterwards. In the next recession, the reality of outright deflation will dominate investors’ fears.

https://www.zerohedge.com/s3/files/inline-images/US%20CPI%20rent.jpg?itok=Ifk7b1pS

Meanwhile, in addition to inflation, central banks will be keeping a close eye on the dollar (recall we noted earlier that only two factors matter for the fate of the current rally: inflation and the dollar).

The reason for that, according to Edwards, is that one key policy lesson from Japan in the 1990s (and the GFC of 2008) when the economy slipped towards outright deflation is that a strong currency must be avoided at all costs as it exacerbated the deflation impulse still further.

Finance 101 dictates that a strong currency means import prices begin to decline and what we found in Japan, was that even where an industry was dominated by domestic Japanese producers, the marginal importer was able to undercut domestic producers and became the price setter for the whole sector. “Economists’ models could just not pick up this behavior and were unable to foresee the strong deflationary pull.”

So while Edwards predicts that the Fed does not want to rush to cut Fed Funds into negative territory, the cost of delaying will be very high if others are doing it (via a strong dollar).

The Fed will be forced to participate as avoiding deflation will be the number 1 priority – not the profitability of the banking sector. Investors should contemplate a brave new world of negative Fed Funds, negative US 10y and 30y bond yields, 15% budget deficits and helicopter money. Sounds ridiculous doesn’t it? What I said in 2006 sounded ridiculous too.

Concluding, as he often does, Edwards says that he hopes he is wrong, but fears that he will be proved right (again… eventually).

Source: ZeroHedge

Why Are An Increasing Number Of High-Income Americans Choosing To Rent?

(MishTalk) The percentage of high-income households choosing to rent is on the rise. High-income is defined as $150,000 and up.

https://www.zerohedge.com/s3/files/inline-images/https___s3-us-west-2.amazonaws%20%2814%29.jpg?itok=mVkK1F7g

The Rent Cafe reports High-Income Americans Are the Fastest Growing Renter Segment — Up by 1.35 Million in a Decade.

The most recent U.S. Census data tells us that the annual increase in the number of high-income renter-occupied households – defined here as those earning $150,000 or more – has been consistently faster than owner-occupied households. As a matter of fact, from 2007 to 2017, the numbers of those rich enough to own, yet who still prefer to rent grew by 175%. That’s compared to a decade-long increase of 67% in homeowners within the same income bracket.

Top-Earning Renters Are Growing Faster than Any Other Renter Income Bracket

Of the 43.3 million renters nationwide, 2.1 million are top earners. High-income renters represent the demographic that experienced the largest boom across the U.S. given that, back in 2007, there were only 774,000.

Breakdown

  • Over $150K — ↑175%
  • $100K – $150K — ↑111%
  • $75K – $100K — ↑66%
  • $50K – $75K — ↑32%
  • Under $50K —↓0.2%

High-Income Renter-Occupied vs Homeowner-Occupied Households 2007-2017

https://www.zerohedge.com/s3/files/inline-images/https___s3-us-west-2.amazonaws%20%2815%29.jpg?itok=og0hQlCI

Debate Over High-Income Definition

Arguably, $150K may not be enough to qualify as high-income in places like San Francisco or New York City, which is probably why the two cities have the largest numbers of renter-occupied households inside this bracket.

NYC’s upper-bracket renters outpace owners not only in net numbers but also in the rate of increase. Wealthy renter-occupied households in New York doubled in the course of a decade, going from 125,000 in 2007 to the largest number of wealthy renters in the U.S. today — 249,000. As for people earning $150K or more who own a home in the Big Apple, their numbers have increased by a lesser 63% over the course of a decade (189,000 in 2007 to 306,000 ten years later).

Top 10 Cities With High-Income Renters

https://www.zerohedge.com/s3/files/inline-images/https___s3-us-west-2.amazonaws%20%2816%29_0.jpg?itok=eNMXepdt

American Dream

The Rent Cafe concluded. “The attitude toward renting at any income level is changing. With renters becoming the majority population in many U.S. cities, the spike in the national population of wealthy renter households could mean a change in attitude toward an American Dream that no longer belongs to this generation of renters.”

Marriage Rates Down, Cohabitation Up

https://www.zerohedge.com/s3/files/inline-images/https___s3-us-west-2.amazonaws%20%2817%29.jpg?itok=Oy6khVgc

Not Just Student Debt

The Rent Cafe article ties in nicely with my previous report: Marriage Rates Down, Cohabitating Rates Up: It’s Not Just Student Debt to Blame

Attitudes, Attitudes, Attitudes

A Fed study on Consumers and Communities released last month had an interesting comment on homeownership.

“We estimate that roughly 20 percent of the decline in homeownership among young adults can be attributed to their increased student loan debts since 2005. Our estimates suggest that increases in student loan debt are an important factor in explaining their lowered homeownership rates, but not the central cause of the decline.”

The rest is explained by changing attitudes and affordability.

Attitudes about marriage, having kids, mobility, and debt have all changed.

This is not 1960 or 1971.

To top it off, houses simply are not affordable. That’s what the cohabitation rate shows. Wages have not kept up with home prices even without the burden of student debt.

American Dream

Even when high-income households can afford a house, many choose to rent instead. Why?

  1. Changing attitudes about the “American Dream”.
  2. The Marriage Tax Penalty
  3. The Remarriage Penalty

Reader “Cecilia” thoughtfully added “Liquidity and Walk Away Arbitrage”, which also ties into the remarriage issue.

Remarrying can greatly complicate divorce financial arrangements. It’s easier to live with someone. No one wants a second divorce, especially if the first one was messy.

Source: ZeroHedge


Vancouver Home Prices Post Biggest Drop In Six Years As Foreign Bid Vanishes

When China started tightening its capital controls on both its upper-crust investors and its public and private companies back in 2016, we anticipated that the bubble in popular urban markets (markets like London, New York City, Sydney, Hong Kong and Vancouver) was officially doomed to burst in the not-too-distant future.

And as a flood of stories over the past year have confirmed, once the foreign (mostly Chinese) bid was withdrawn, property prices started to drop. It’s happening in Australia (and especially in Melbourne and Sydney), it’s happening in New York, it’s happening in London and – as we’ve catalogued over the past few quarters, it’s happening in Vancouver, which for a while held the ignominious title of world’s most overpriced housing market.

https://www.zerohedge.com/s3/files/inline-images/Screen%20Shot%202019-02-05%20at%201.58.03%20PM.png?itok=vFypmMTo

After a chasm opened up between bids and asks in the Vancouver housing market last year, the halt in home sales has finally started filtering through to prices as reluctant sellers finally cave and cut their prices. According to data from the Real Estate Board of Greater Vancouver, the city’s composite home price (which incorporates prices of houses, condominiums and townhouses) fell 4.5% in January from a year earlier to C$1.02 million ($780,000), the biggest decline since May 2013 and down about 8% from the June 2018 peak.

https://www.zerohedge.com/s3/files/inline-images/2019.02.05vancouver.png?itok=3mqaMpV3

As we noted above, the drop in prices follows a decline in sales – the biggest drop in two decades – that many have attributed to new taxes, higher interest rates and a crackdown on dark money flowing into the Vancouver area real estate market. Meanwhile, outbound investment, Bloomberg confirms, has slumped.

Ultimately, the Fed-led global monetary stimulus sent prices in these markets roaring to dizzying new highs during the QE era. But now that the Fed is reining in its balance sheet (and until signaling a “pause”, had been raising interest rates, too) prices that rose on the back of a tidal wave of liquidity are now coming back down.

“Today’s market conditions are largely the result of the mortgage stress test that the federal government imposed at the beginning of last year,” Phil Moore, the realtor group’s president said in a statement Monday.

[…]

“Vancouver real estate was one of the largest benefactors,” of that stimulus, says Steve Saretsky, a Vancouver realtor and author of a local real estate blog. “It may be simple to summarize the slowdown as a few local tax policies and tightening of lending standards, but in reality it’s much more complicated,” says Saretsky, who’s now trying to explain the darkening macro picture in a market where many locals have long considered home price appreciation unstoppable.

The very top end of the market has been the hardest hit: Prices in tony West Vancouver have fallen 14% yoy as of January. And as one real estate agent confirmed to BBG, now that foreign buyers are pulling back, sellers who were once asking for C$12 million or C$13 million are asking for…significantly less.

“These homes in West Van were selling for C$12 million, C$13 million two years ago,” says Adil Dinani, a realtor with Royal LePage, a unit of Brookfield Real Estate Services Inc. “Agents are asking me to throw them off for anything – C$8 million, C$8.5 million, whatever it is.”

Dinani, who’s been in the business for 14 years, says there are fewer speculative investors, and foreign buyers have really pulled back. “And what local buyer has C$6 million, C$7 million to put towards a home?” he said.

Still, with Vancouver’s housing market extremely unaffordable when benchmarked to local wages, no local buyers have the money for these homes.

Which can mean only one thing: Prices have further to fall before the equilibrium point is found.

Source: ZeroHedge

Oregon Defies Logic With Statewide Rent Control

It is often said by cynical economists and political commentators, usually of the right or libertarian persuasion, that the road to hell is paved with good intentions. There is no more odious and damaging economic policy that comes from the heart than rent control. For years, limiting the cost of living spaces was done at the local level, but one West Coast state aims to be the first to implement statewide rent controls.

https://www.zerohedge.com/s3/files/inline-images/rent1.png?itok=vibPikMf

Oregon’s Proposed Rent Controls

Oregon is set to pass SB 608, legislation that prohibits landlords from raising rents in the first year of a resident’s tenancy. The bill would also cap future rent hikes at 7% annually, plus inflation. This will target all rental properties 15 years or older but exempt units that are a part of a government housing project.

It should be noted that SB 608 does not have vacancy controls, which means buildings can jack up the rent by any amount once the tenant gives his or her notice. Because of this, the legislation bans no-cause evictions, so any landlord must offer a government-approved excuse for evicting a tenant.

With Democratic supermajorities in both chambers of the legislature, SB 608 is likely to pass, making Oregon the first state with statewide rent control.

Gov. Kate Brown (D-OR) is proud of the move, saying in her inaugural address:

“We also need to help Oregonians who have homes but are struggling with the high cost of rent. We can help landlords and tenants navigate this tight housing market. Speaker [Tina] Kotek and Sen. [Ginny] Burdick have innovative proposals that will give renters some peace of mind.”

Lawmakers are jubilant over the bill, but economic experts call the Beaver State’s policy proposal risky, including Mike Wilkerson of ECONorthwest, an economics consulting firm, telling Reason: “You’d be hard-pressed to find any economist who comes out in favor of rent control as a means to help improve whatever failure you are experiencing.”

Rent Control Hurts the Poor

First, it is important to examine the justification for rent controls. Advocates contend that it is immoral for someone who has lived in a neighborhood his entire life to be suddenly priced out of it. It is also wrong, they assert, that landlords are just sitting on their rear ends, enjoying higher rents, because there is a greater demand to reside in New York, San Francisco, or Boston than in Jerome, AZ, or Bonanza, CO.

Proponents will ignore the unintended consequences of rent control. New properties are not erected, vacancy rates plunge, existing landlords exit the market, and the small supply of housing diminishes. Landlords will try to evade regulations by transforming their units into condominiums, luxury apartments, furnished suites, or offices.

Advocates also overlook two other important facts: Real estate can be utilized for a diverse array of purposes (commercial, housing, or industrial), and these laws distort pricing signals.

Ultimately, the state plays a game of cat-and-mouse, coming up with intrusive ways to rein in the evaders. Regulation begets regulation.

New York City

When World War II ended and peacetime reigned supreme in America again, things were not what they used to be, at least for the thousands of troops returning home. After being engaged in battles overseas, soldiers had a new front to fight at home: life – and everything it had to offer.

Despite the inflation rate either contracting or rising in single digits between 1947 and 1952, the cost of living ballooned for the returning heroes of the Armed Forces. One area of the country that increasingly priced these men out of the market was New York City, where real estate values were skyrocketing – and still are!

Officials had an idea to help everyone affected by rising housing costs: rent controls. While the goal was to make units more affordable, the city made the situation worse by introducing temporary relief.

Like economist Milton Friedman once quipped, “There is nothing more permanent than a temporary government program.” This relic of 1947 is still around today, exacerbating the housing affordability crisis. It is estimated that approximately 50,000 apartments and one million rent-stabilized units are controlled by a 70-year-old law.

To understand how egregious this policy is, look no further than former Rep. Charles Rangel (D-NY). The Wall Street Journal reported in September 2008 that he occupied “four rent-stabilized apartments in a posh New York City building,” living in three and using another as an office. By holding four properties, he took advantage of valuable resources at below-market prices at the expense of others.

Controls

Is there a difference between bombs and rent control? Economists often pose this question when debating the efficacy of government controls. The Mises Institute’s Joseph Salerno delivered a lecture a few years ago, showing pictures of urban areas and asking his audience if these dilapidated units were the victims of a bombing campaign or rent controls.

When you even pose the question, you know it’s necessary to second-guess the prescription.

Any time officials use “controls,” you know the policy is going to be a failure. Whether it is preceded by “price” or “rent,” this economically defiant measure produces destitution, deterioration, and destruction. It’s too bad politicians and bureaucrats never learn their lesson.

Source: ZeroHedge

More Alarm Bells As Banks Report Tightening Lending Standards While Loan Demand Slides

The latest alarm signal that the US economy is on collision course with a recession came after today’s release of the latest Senior Loan Officer Opinion Survey (SLOOS) by the Federal Reserve, which was conducted for bank lending activity during the fourth quarter of last year, and which reported a double whammy of tightening lending standards and terms for commercial and industrial loans on one hand, and weaker demand for those loans on the other. Even more concerning is that banks also reported weaker demand for both commercial and residential real estate loans, echoing the softer housing data in recent months.

This tightening in C&I lending standards coupled with sharp declines loan demand, especially for mortgage and auto loans, is shown below.

https://www.zerohedge.com/s3/files/inline-images/2019-02-04%20%284%29.jpg?itok=LlvltzyK

Here are the details via Goldman:

  • 20% of banks surveyed reportedly widened spreads of loan rates over the cost of funds for large- and medium-sized firms, while 16% narrowed spreads. 14% of banks surveyed reported higher premiums charged on riskier loans, while 4% reported lower premiums. Other terms, such as loan covenants and collateralization requirements, remained largely unchanged. Demand for loans reportedly weakened on balance.
  • Relative to the last survey, standards on commercial real estate (CRE) loans tightened on net over the fourth quarter of the year. On net, 17% of banks reported tightening credit standards on loans secured by multifamily residential properties, while 13% of banks on net reported tightening standards for construction and land development loans. As above, banks reported that demand for CRE loans across a broad range of categories moderately weakened on net.
  • Banks reported that lending standards for residential mortgage loans remained largely unchanged on net in 2018Q4 relative to the prior quarter. However, this benign environment was largely as a result of slumping demand for credit, as banks reported weaker demand across all surveyed residential loan categories, including home equity lines of credit.
  • While banks reported that lending standards on consumer installment loans and autos remained largely unchanged, banks reported that lending standards for credit cards had tightened slightly. Here too demand – for all categories of consumer loans – was moderately weaker, while respondent willingness to make consumer installment loans tumbled to the lowest value since the financial crisis.

https://www.zerohedge.com/s3/files/inline-images/installment%20loans.jpg?itok=xsclC3ru

Finally, and most concerning of all, is that in their response to special questions on their 2019 outlook, assuming that economic activity continues to be in line with consensus forecasts, banks reported they plan to tighten lending standards somewhat for C&I loans, commercial real estate loans, and residential mortgage loans, in other words the most important credit would become even more difficult to attain. As a result, or perhaps due to the slowdown in the economy, banks also expect demand for C&I, CRE, and residential mortgage loans to weaken somewhat in 2019.

Banks also reported expecting delinquencies and charge-offs to increase somewhat on C&I, CRE, and residential mortgage loans; as Bloomberg’s Andrew Cinko muses “if America was heading toward an economic contraction that would be a typical expectation. But this doesn’t seem to be the case for the foreseeable future. So what gives?”

Perhaps “what gives” is that the economy is not nearly as strong as consensus would make it appear, and behind closed door, loan officers are already batting down the hatches and preparing for a recession. 

* * *

Here would be a good time to remind readers that according to a Reuters investigation conducted in mid-December, when looking behind headline numbers showing healthy loan books, “problems appear to be cropping up in areas such as home-equity lines of credit, commercial real estate and credit cards” according to federal data reviewed by the wire service and interviews with bank execs.

Worse, banks are also starting to aggressively cut relationships with customers who seem too risky, which is to be expected: after all financial conditions in the real economy, if not the markets which just enjoyed the best January since 1987, are getting ever tighter as short-term rates remain sticky high and the result will be a waterfall of defaults sooner or later. Here are the all too clear signs which Reuters found that banks are starting to prepare for the next recession by slashing and/or limiting risky loan exposure:

  • First, nearly half of the applications from customers with low credit scores were rejected in the four months ending in October, compared with 43 percent in the year-ago period, according to a survey released by the Federal Reserve Bank of New York.
  • Second, banks shuttered 7 percent of existing accounts, particularly among subprime borrowers, the highest rate since the Fed started conducting surveys in 2013.
  • Third, home-equity lines of credit declined 8 percent across the industry, with growth slowing in areas such as credit cards and commercial-and-industrial loans, the survey showed.

Then there are the bank-specific signs, starting with Capital One – one of the biggest U.S. card lenders – which is restricting how much it lends to each customer even as it aggressively recruits new ones, CEO Richard Fairbank said last December.

We have been more cautious in the extension of credit, initial credit lines, the broad-based credit line increase programs,” he said. “At this point in the cycle, we’re going to hold back on that option a bit.”

Regional banks have become more cautious lately as well, as they avoid financing riskier projects like early-stage construction loans and properties without pre-lease agreements (here traders vividly recall the OZK commercial real estate repricing fiasco that sent the stock crashing). New Jersey’s OceanFirst Bank also pulled back on refinancing transactions that let customers cash out on their debt, and has started reducing exposure to industrial loans, CEO Chris Maher told Reuters.

“In a downturn, industrial property is extremely illiquid,” he said. “If you don’t want it and it’s not needed it could be almost valueless.”

What happens next?

While a recession is looking increasingly likely, especially as it becomes a self-fulfilling prophecy with banks slashing loans resulting in even slower velocity of money, while demand for credit shrinks in response to tighter loan standards and hitting economic growth, the only question whether a recession is a 2019 or 2020 event, bankers and analysts remain optimistic that the next recession will look much more like the 2001 tech bubble bursting than the 2007-09 global financial crisis.

We wonder why they are so confident, and statements such as this one from Flagship Bank CFO Schornack will hardly instill confidence:

“I lived through the pain of the last recession. We are much more prudent today in how we underwrite deals.”

We disagree, and as evidence we present Exhibit A: the shock write down that Bank OZK took on its commercial real estate, which nobody in the market had expected. As for banks being more “solid”, let’s remove the $1.5 trillion buffer in excess reserves that provides an ocean of artificial liquidity, and see just how stable banks are then. After all, it is this $1.5 trillion in excess reserves that prompt Powell to capitulate and tell the markets he is willing to slowdown or even pause the Fed’s balance sheet shrinkage.

Source: ZeroHedge

US New Home Sales Fall 7.7% YoY In November, But Rise 16.9% MoM, Most Since 1992 (Months Supply Still Elevated, Median Price Falls)

Let’s start with the +16.9% MoM number, a more cheery, pop the champagne bottle headline.

https://confoundedinterestnet.files.wordpress.com/2019/01/nhsstatsnov18-1.png

But on a YoY basis, new home sales fell 7.7% in November.

https://confoundedinterestnet.files.wordpress.com/2019/01/nhsmb30.png

Months supply of new home sales fell in November, but are still at elevated levels.

https://confoundedinterestnet.files.wordpress.com/2019/01/monthssupply.png

And the median price of new home sales fell in November as The Fed’s normalization grabs the housing market with its icy grip.

https://confoundedinterestnet.files.wordpress.com/2019/01/nhsmedpricenov18.png

“The weather started getting rough, the tiny ship was tossed….”

https://confoundedinterestnet.files.wordpress.com/2019/01/gilligansisland.png

Source: by Anthony B. Sanders | Confounded Interest

***

November New Home Sales Surge By The Most Since 1992

https://zh-prod-1cc738ca-7d3b-4a72-b792-20bd8d8fa069.storage.googleapis.com/s3fs-public/styles/teaser_desktop_2x/public/2019-01/2019-01-31_7-07-10.jpg?h=db43e95e&itok=KtWHgQee


…as the median price plunged to $302,400 – the lowest since Feb 2017…

The Most Splendid Housing Bubbles in America Shrink

Seattle prices drop 5.1% in five months, most since Housing Bust 1; San Francisco Bay Area, Los Angeles, San Diego, Denver, Portland all decline.

(WolfStreet) This is the most obvious one: Seattle. House prices in the Seattle metro dropped 0.7% in November from prior month, according to the Case-Shiller Home Price Index released this morning. It brought the index down 5.1% from the peak in June 2018, the biggest five-month drop since the five-month period that ended in January 2012 during the final throes of Housing Bust 1.

The historic spike through June is getting systematically unwound. The pace of the price declines over the past five months pencils out to be an annual rate of decline of 12%. The index is now at the lowest level since March 2018. Over the past 12 months, given the phenomenal spike into June, the index is still up 6.3% year-over-year and up 29% from the peak of Seattle’s Housing Bubble 1 (July 2007):

https://wolfstreet.com/wp-content/uploads/2019/01/US-Housing-Case-Shiller-Seattle-2019-01-19.png

So some of the markets in this select group of the most spending housing bubbles in America have turned south, according to the S&P CoreLogic Case-Shiller Home Price Index, confirming other more immediate data. This includes, in addition to the Seattle metro, the five-county San Francisco Bay Area, the San Diego and Los Angeles metros, the Denver metro, and the Portland metro. In these markets, house prices have dropped the fastest since Housing Bust 1. In other markets, house prices have been flat for months, such as Dallas. And in a few markets on this list of the most splendid housing bubbles in America, the bubble remained intact and prices rose.

On a national basis, individual markets get averaged out. Single-family house prices in the US, according to the Case-Shiller National Home Price Index, have now been flat on a month-to-month basis for four months in a row, and are up 5.2% compared to a year ago (not seasonally-adjusted). This year-over-year growth rate has been ticking down gradually from the 6%-plus range prevalent through July 2018.

The index is now 11.4% above the July 2006 peak of “Housing Bubble 1” — as I named it because it was the first housing bubble in this millennium. It came to be called “bubble” and “unsustainable” only after it had begun to implode during “Housing Bust 1”:

https://wolfstreet.com/wp-content/uploads/2019/01/US-Housing-Case-Shiller-National-Index-2019-01-29.png

The Case-Shiller Home Price Index is a rolling three-month average; this morning’s release is for September, October, and November data. And thus the index lags several months behind more immediate data, such as median prices. Based on “sales pairs,” it compares the sales price of a house in the current month to the prior transaction of the same house years earlier. It also incorporates other factors and formulas.

The index tracks single-family houses. In some large markets, Case-Shiller provides an additional index for condos. Unlike median-price indices, the Case-Shiller index does not indicate dollar-price levels. It was set at 100 for January 2000; a value of 200 means prices as tracked by the index have doubled since the year 2000. For example, the index value of the National Home Price Index for November is 205.85, indicating that house prices have risen 105.8% since the year 2000. Every index on this list of the most splendid housing bubbles in America, except Dallas and Atlanta, has more than doubled since 2000.

The index is a measure of inflation — of house-price inflation, where the same house requires more dollars over the years to be purchased. In other words, it tracks how fast the dollar is losing purchasing power with regards to buying the same house over time.

So here are the remaining metros in this list of the most splendid housing bubbles in America.

San Francisco Bay Area:

The Case-Shiller index for “San Francisco” includes five counties: San Francisco, San Mateo (northern part of Silicon Valley), Alameda, Contra Costa (both part of the East Bay ), and Marin (part of the North Bay). In November, the index for single-family houses fell 0.7% from October and 1.4% from September, to the lowest level since April. Since the peak in July 2018, the index is down 1.6%, the biggest four-month drop since March 2012.

The index was still up 5.6% from a year ago, after the surge in prices early 2018, and remains nearly 40% above the peak of Housing Bubble 1:

https://wolfstreet.com/wp-content/uploads/2019/01/US-Housing-Case-Shiller-San-Francisco-Bay-Area-2019-01-29.png

Also in the five-county San Francisco Bay Area, the Case-Shiller index for condo prices fell an ear-ringing 2.4% in November from October to the lowest level since February 2018, and is down nearly 3.3% from the peak in June 2018, the steepest five-month decline since the five months ended in February 2012, as Housing Bust 1 was winding down.

https://wolfstreet.com/wp-content/uploads/2019/01/US-Housing-Case-Shiller-San-Francisco-Bay-Area-Condos-2019-01-29.png

San Diego:

House prices in the San Diego metro declined 0.6% in November from October and are now down 1.2% from the peak in June, the biggest five-month drop since March 2012. This pushed the index to the lowest level since February 2018:

https://wolfstreet.com/wp-content/uploads/2019/01/US-Housing-Case-Shiller-San-Diego-2019-01-29.png

Los Angeles:

The Case-Shiller index for the Los Angeles metro edged down in November from October and is now down 0.4% from the peak in August. This sounds like nothing,  but it was the largest three-month decline since the three months ended March 2012. The index is still up 4.2% from a year earlier:

https://wolfstreet.com/wp-content/uploads/2019/01/US-Housing-Case-Shiller-Los-Angeles-2019-01-29.png

Portland:

House prices for the Portland metro in November fell for the fourth month in a row and are down 1.2% from the peak in July 2018, according to the Case-Shiller Index. And that was the steeped four-month drop since March 2012. Year-over-year, the index was up 4.4%:

https://wolfstreet.com/wp-content/uploads/2019/01/US-Housing-Case-Shiller-Portland-2019-01-29.png

Denver:

The index for the Denver metro edged down in November for the fourth month in a row, after a perfect run of 33 monthly increases in a row. It took the index to the lowest level since May 2018. The four-month drop, small as it was at 0.8%, was the steeped such drop since March 2012. The index is still up 6.2% from a year ago:

https://wolfstreet.com/wp-content/uploads/2019/01/US-Housing-Case-Shiller-Denver-2019-01-29.png

Dallas-Fort Worth:

House prices in the Dallas-Fort Worth metro in November were essentially flat for the sixth month in a row, after an uninterrupted run of 54 monthly increases. The year-over-year gain, at 4.0%, is down from the 5.0% range early and mid-2018:

https://wolfstreet.com/wp-content/uploads/2019/01/US-Housing-Case-Shiller-dallas-2019-01-29.png

Boston:

In the Boston metro, house prices have been essentially flat for five months, and remain up 5.6% from a year ago, according to the Case-Shiller Index:

https://wolfstreet.com/wp-content/uploads/2019/01/US-Housing-Case-Shiller-Boston-2019-01-29.png

Atlanta:

House prices in Atlanta inched up a wee bit to a record in November and were up 6.2% from a year ago, according to the Case-Shiller Index:

https://wolfstreet.com/wp-content/uploads/2019/01/US-Housing-Case-Shiller-Atlanta-2019-01-29.png

New York City Condos:

The Case-Shiller index for condo prices in the New York City metro can be a little volatile. After ticking down several months in a row in mid-2018, they then jumped three months in a row, but in November, they fell again. The end-effect is that the index is up 2.1% from November 2017, which is the lowest year-over-year price gain in this list of the most splendid housing bubbles in America:

https://wolfstreet.com/wp-content/uploads/2019/01/US-Housing-Case-Shiller-New-York-condos-2019-01-29.png

With Seattle’s economy still strong, the downturn in its housing market isn’t caused by layoffs & defaulting mortgages. The fabulous bubble has run out of steam on its own.

Source: by Wolf Richter | Wolf Street


US Pending Home Sales Fall 9.5% YoY In December To Lowest Level Since 2014 As Fed Unwinds

As The Federal Reserve continues to unwind its balance sheet, pending home sales YoY declined 9.5% YoY, the worst since 2014.\

https://confoundedinterestnet.files.wordpress.com/2019/01/phsyoydec18.png

Pending home sales got a big boost from The Fed’s third round of asset purchases (QE3), but PHS are feeling the pain of The Fed’s unwind.

https://confoundedinterestnet.files.wordpress.com/2019/01/rollercoasterphs.png

Source: Confounded Interest

***

US Pending Home Sales Crash Most In 5 Years

Following Case-Shiller’s report that home price gains are the weakest in four years, Pulte Homes’ CEO admission that 2019 will be a “challenging year,” and existing home sales carnage, Pending Home Sales were expected to very modestly rebound in December.

But they didn’t!

Pending home sales dropped 2.2% MoM (versus a 0.5% expected rise) to the lowest since 2014…

https://www.zerohedge.com/s3/files/inline-images/2019-01-30_7-03-04.jpg?itok=b2uJtbFc

This is the 12th month in a row of annual sales declines… and the biggest annual drop in 5 years…

https://www.zerohedge.com/s3/files/inline-images/2019-01-30_7-02-09.jpg?itok=kLOcP43c

Yet another sign the housing market is struggling amid elevated property prices and borrowing costs – but there’s always hope…

“The stock market correction hurt consumer confidence, record high home prices cut into affordability and mortgage rates were higher in October and November for consumers signing contracts in December,” NAR Chief Economist Lawrence Yun said in a statement.

But with mortgage rates declining recently and the Fed less likely to raise borrowing costs, “the forecast for home transactions has greatly improved.”

Finally,  the Realtors group forecasts a decline in annual home sales to 5.25 million this year from 5.34 million in 2018, which would mark the first back-to-back drops since the last recession.

Source: ZeroHedge

The Fall Of Facebook Has Only Just Begun

Their platform is broken and neither human nor machine can fix it.

Even after losing roughly a third of its market cap, it still may prove one of the great shorts of all time.

https://www.zerohedge.com/s3/files/inline-images/1_HagRF3FUkll6wLqx0bcLmA.jpeg?itok=pPpNa24c

(ZeroHedge) “There’s no mental health support. The employee suicide rate is extremely high,” one of the directors of the documentary, “The Cleaners” told CBS News last May. The film is an investigative look at the life of Facebook moderators in the Philippines. Throughout his 2018 apology tour, Mark Zuckerberg regularly referenced the staff of moderators the company had hired as one of two key solutions — along with AI — to the platform’s content evils. What he failed to disclose is that the majority of that army is subcontractors employed in the developing world.

For as long as ten hours a day, viewing as many as 25,000 images or videos per day, these low-paid workers are buried in the world’s horrors — hate speech, child pornography, rape, murder, torture, beheadings, and on and on. They are not experts in the subject matter or region they police. They rely on “guidelines” provided by Facebook — “dozens of unorganized PowerPoint presentations and Excel spreadsheets with bureaucratic titles like ‘Western Balkans Hate Orgs and Figures’ and ‘Credible Violence: Implementation standards’,” as The New York Times reported last fall. The rules are not even written in the languages the moderators speak, so many rely on Google Translate. As a recent op-ed by John Naughton in The Guardian declares bluntly in its headline, “Facebook’s burnt-out moderators are proof that it is broken.”

As we noted in last week’s issue, 41 of the 53 analysts tracked by Bloomberg currently list Facebook as a buy, with “the average price target… $187, which implies upside of nearly 36%.” That optimism springs from a basic assumption: the company’s monopolistic data dominance means it can continue extracting more from advertisers even if controversy after controversy continues to sap its user growth. Given the depth and intractability of Facebook’s problems, this is at best short-sighted.

The platform’s content ecosystem is too poisoned for human or machine moderators to cleanse. Users are fleeing in droves, especially in the company’s most valuable markets. Ad buyers are already shifting dollars to competitors’ platforms. Governments are stepping up to dramatically hinder Facebook’s data-collection capabilities, with Germany just this week banning third-party data sharing. The company is under investigation by the FTC, the Justice Department, the SEC, the FBI, and several government agencies in Europe. It has been accused by the U.N. of playing a “determining role” in Myanmar’s genocide. An executive exodus is underway at the company. And we believe, sooner or later, Facebook’s board will see no option but to remove Sheryl Sandberg and Mark Zuckerberg.

The market is drastically underestimating the peril the company is in. In the very short term, the user backlash may simply hinder its revenue growth. In the longer-term, however, the institutionalized failure to see and respond to the platform’s downsides may render Facebook the Digital Age’s Enron — a canonized example of how greed and corruption can fell even the mightiest.

According to data recently released by Statcounter, Facebook’s global social media market share dropped from 75.5% in December 2017 to 66.3% in December 2018. The biggest drop was in the U.S., from 76% to 52%. As Cowen survey results released this week suggest, these engagement declines will continue to depress the company’s earnings. Surveying 50 senior U.S. ad buyers controlling a combined $14 billion in digital ad budgets in 2018, 18% said they were decreasing their spend on Facebook. As a result, Cowen estimates the Facebook platform will lose 3% of its market share.

No doubt Facebook’s struggles are not just about the headline scandals. For years, one innovation priority after another has fallen flat, from VR to its video push to its laggard position in the digital-assistant race. The company’s most significant “innovation” success of the past few years was copying the innovation of a competitor — pilfering Snapchat’s ephemerality for its “moments” feature.

However, it’s the scandals that have most crippled the company’s brand and revealed the cultural rot trickling down from its senior ranks. Consider just the most-sensational revelations that emerged in 4Q18:

  • Oct. 17: The Verge reports that Facebook knew about inaccuracies in the video viewership metrics that it provided to advertisers and brands for more than a year. “The inflated video views led both advertisers and media companies to bet too much on Facebook video.”
  • Nov. 14: The New York Times publishes an investigative report that reveals Facebook hired a conservative PR firm to smear competitors and minimize the company’s role in Russia’s 2016 election meddling.
  • Dec. 5: British lawmakers release 250 pages of internal Facebook emails that show that, “the company’s executives were ruthless and unsparing in their ambition to collect more data from users, extract concessions from developers and stamp out possible competitors,” as The New York Times reported.
  • Dec. 14: Facebook reveals that a bug allowed third-party app developers to access photos people may not have shared publicly, with as many as 6.8 million users potentially affected.
  • Dec. 17: Two Senate reports reveal the shocking extent of Russia’s efforts on social media platforms during the 2016 election, including the fact thatInstagram was their biggest tool for misinformation.
  • Dec. 18: The New York Times reports that Facebook gave the world’s largest technology companies far more intrusive access to user data than previously disclosed, including the Russian search firm Yandex.
  • Dec. 20: TechCrunch reports that, “WhatsApp chat groups are being used to spread illegal child pornography, cloaked by the app’s end-to-end encryption.”
  • Dec. 27: The New York Times obtains 1,400 pages of Facebook’s moderation guidelines and discovers an indecipherable mess of confusing language, bias, and obvious errors.

Scandal after scandal, the portrait of the company is the same: Ruthlessly and blindly obsessed with growth. Overwhelmed by that growth and unwilling to take necessary steps to compensate. Willing to lie and obfuscate until the truth becomes inescapable. And all the time excusing real-world consequences and clear violations of user and client trust because of the cultish belief that global interconnectedness is an absolute good, and therefore, Facebook is absolutely good.

The scale of Facebook’s global responsibility is staggering. As Naughton writes for The Guardian:

Facebook currently has 2.27bn monthly active users worldwide. Every 60 seconds, 510,000 comments are posted, 293,000 statuses are updated and 136,000 photos are uploaded to the platform. Instagram, which allows users to edit and share photos as well as videos and is owned by Facebook, has more than 1bn monthly active users. WhatsApp, the encrypted messaging service that is also owned by Facebook, now has 1.5bn monthly active users, more than half of whom use it several times a day.

Relying on tens of thousands of moderators to anesthetize the digital commons is both inadequate, and based on the reported working conditions, unethical and exploitative. AI is not the solution either, as we explored in WILTW April 12, 2018. According to Wired, Facebook has claimed that 96% of the adult and nude images users try to upload are now automatically detected and taken down by AI. That sounds like a success until you consider that that error rate means 1.3 million such images made it to the public in the third quarter of 2018 alone (30.8 million were taken down).

In fact, the company has acknowledged that views with nudity or sexual content have nearly doubled in the 12 months ending in September. And detecting nudity is a far easier task for a rules-based algorithm than deciding the difference between real and fake news, between hate speech and satire, or between pornography and art.

Facebook has economically and culturally empowered hundreds of millions of people around the world. It cannot be blamed for every destabilized government, war, or murder in every region it operates. However, more and more, it’s clear that one profit-driven platform that connects all of the world’s people to all of the world’s information — the vision Zuckerberg has long had for his invention — is a terminally-flawed idea. It leads to too much power in the hands of too few. It allows bad actors to centralize their bad actions. And it is incompatible with a world that values privacy, ownership, and truth.

Governments are waking up to this problem. So is the public. And no doubt, so are competitive innovators looking to expand or introduce alternatives. Collectively, they will chip away at Facebook’s power and profitability. Given the company’s leaders still appear blinded by and irrevocably attached to their business model and ideals, we doubt they can stave off the onslaught coming.

Source: ZeroHedge

Clearing Out A Walmart Then Reselling It On Amazon Can Make You Millions

Turns out, clearing out a Target or Walmart, then reselling it all on Amazon, can make you enough money to pay off your house.

(MEL Magazine) On one of my more recent voyages down a YouTube wormhole, I was introduced to a suspiciously profitable practice called retail arbitrage. The concept is fairly simple: You purchase products from a retail store, like Walmart or Target, and then you sell them somewhere else, like Amazon, for a higher price.

Here’s an example: In one video that I stumbled upon, an arbitrager purchases 182 ‘Monopoly for Millennials’ board games from several local Walmarts, for $19.82 each. Then, within less than 24 hours, he managed to sell 131 of them on Amazon for $77.29 each, which leaves him with an impressive profit of $2,500, even after deducting shipping costs and fees (he presumably sold the remaining 51 board games on a later date for even more profit).

After watching this video, I had so many questions — namely, does this actually work for most people, and if so, why aren’t more people doing it? I also couldn’t help but wonder whether employees (and other customers) get upset when you walk out of the store with 182 ‘Monopoly for Millennials’ board games. To answer these questions, and to get a better sense of how retail arbitrage actually works, I sat down with YouTuber and retail arbitrager Shane Myers, who also made a killing flipping the same ‘Monopoly for Millennials’ game.

First things first: How’d you even get into retail arbitrage?

I actually have a retail background — I worked in retail management for nine years, and I was also an executive manager for Target. I learned a lot of this business through retail, and I just apply it as retail arbitrage. I know a lot about inventory systems and stuff like that. If you have a little bit of that knowledge, you’re going to have a leg up on everybody else trying to make money online.

Can you tell me about some of your more recent retail-arbitrage endeavors?

I actually just picked up, about one or two weekends ago, a bunch of light bulbs. A light bulb is an everyday item that people use, so there’s always a need for them, and I picked them up on clearance at Walmart for $2 each. I was actually able to identify the markdown before Walmart caught it: They were assigned at $9 each, and I bought them for $2 each, which is a huge, huge thing — you’re almost guaranteed that nobody else has bought them, since they’re still assigned at full price.

So I bought 218 packages of light bulbs after travelling around to several Walmarts within a 150-mile radius, and I was able to send them all into Amazon FBA, which is Fulfillment by Amazon. I’m going to net anywhere between $4 and $5 of profit for each package, which comes to about $1,100 or $1,200, give or take.

Another example, which you can see in my most current YouTube video [above], involves me going around to Walmarts to buy iHome vanity mirrors. They were on a Christmas special, and I bought them for $12.45. But they sell on Amazon for anywhere between $75 and $90, so I’m probably looking at a profit of around $4,000.

You said you noticed the markdown before Walmart did. Um, how?

I use a site called BrickSeek, and I pay $30 a month for an extreme plan. It doesn’t only help people who do retail arbitrage, it also helps people who just love good deals. But it helps retail arbitrageurs, because we can actually see the markdowns at local Walmarts — it’s tied into their corporate somehow, and it gives us on-hand item counts in the store and tells us which stores have them.

How the hell do you even ship 218 packs of light bulbs?

I have a business license, and I’m registered on Amazon as a third-party seller, meaning I can leverage Amazon FBA. I just print out some labels to stick on every item, and then I put a bunch of items in a box — the boxes can weigh no more than 50 pounds and can only be 24 inches long. Then, I send them to Amazon, where they stock the items in their warehouse, and as they sell, Amazon fulfills them for you and takes care of customer service.

Doesn’t all that shipping dip into your profits, though?

No! I shipped out 298 pounds of light bulbs for about $65. Amazon leverages FedEx and UPS corporate shipping to give people a good deal.

Have you ever bought a bunch of stuff that just didn’t sell?

You’re always worried, especially when you’re putting down a large investment. For the light bulbs, I was out about $600, and for the iHomes, I was out about $1,200. But I’ve actually made bigger purchases than that: I have a video where I went out and bought 136 “Monopoly for Millennials” games, and the cost was probably around $3,000.

So you always worry, but you can leverage tools to help you build data to know that it’s a good product that selling. On Amazon, when you scan the item on the seller app, it’s going to give you a rank — it might say that you’re ranked 100,000 for that item. But I use two free programs that are amazing: camelcamelcamel.com and keepa.com. You can take the Universal Product Code, look up the item on those websites, and you can see a year’s worth of data (if the data exists) on price, like whether the price has dropped significantly during certain times of the year. You can also look up a sales rank chart to narrow down about how many times an item sells per month.

Do store employees ever get upset when you come in and buy everything?

Not usually. Walmart actually loves to sell clearance — if it’s clearance, they want it out of their store. Once in a while, though, you’ll run into a store that gives you a super hard time or won’t sell you the items. But for Walmart, that’s very few and far between. Different retail stores are different, though: I know that Target is very against resellers. If it’s clearance, they usually don’t care, but if it’s a normal-priced item, they’ll probably limit you.

Seems like you have this all figured out, so is this your full-time gig?

I actually work a full-time job, and I do this on the side. About a year from now, I’ll be doing this full time. Last month, on Amazon alone, I sold $10,000 worth of products. I’ve paid off about 78 percent of my debt doing this, so I’m playing the long game. I’m paying off debt, and in a couple years, I should have my house paid off. That way, I can just leave my job, do this full-time and not have to worry about bills and debt.

Impressive! Do you think people will be upset to find out that you’re making money by essentially selling items for more than they would be at the store?

If you go to a retail store and buy all of one item, some of the customers might be a little upset at you. But you have to realize that, when you sell online and do retail arbitrage, you’re doing the exact same thing that Walmart or Target is doing. They’re buying an item at a low price, and they’re selling it to a user for more. It’s the exact same thing, but it has a negative connotation, because people don’t understand that Walmart is doing that, since they’re so used to going to the store to buy stuff.

Source: ZeroHedge

Authored by Ian Lecklitner of MEL Magazine

Existing Home Sales Plunge 10.25% In December As Global Economy Slips Into Darkness

And no, that was not a seasonal effect. Existing home sales declined 6.4% MoM in December, the largest decline since November 2015.

https://confoundedinterestnet.files.wordpress.com/2019/01/ehsdec18.png

And on a YoY basis, existing home sales plunge 10.25%.

https://confoundedinterestnet.files.wordpress.com/2019/01/ehs10.png

US existing homes are very expensive compared to household income and the surge in mortgage rates during 2018 made housing ever less affordable.

The median price for existing home sales shows a seasonal pattern with June typically being the highest for the calendar year and January being the lowest.

Let’s see how Euro Zone and Japan slipping into darkness impacts the US economy and housing market.

https://confoundedinterestnet.files.wordpress.com/2019/01/phillip.jpg

Source: Confounded Interest

***

Existing Home Sales Crash In December

https://www.zerohedge.com/s3/files/inline-images/2019-01-22_7-03-38.jpg?itok=hSiVp-Kb

Regional breakdown:

  • December existing-home sales in the Northeast decreased 6.8 percent to an annual rate of 690,000, 6.8 percent below a year ago. The median price in the Northeast was $283,400, up 8.2 percent from December 2017.
  • In the Midwest, existing-home sales fell 11.2 percent from last month to an annual rate of 1.19 million in December, down 10.5 percent overall from a year ago. The median price in the Midwest was $191,300, unchanged from last year.
  • Existing-home sales in the South dropped 5.4 percent to an annual rate of 2.09 million in December, down 8.7 percent from last year. The median price in the South was $224,300, up 2.5 percent from a year ago.
  • Existing-home sales in the West dipped 1.9 percent to an annual rate of 1.02 million in December, 15 percent below a year ago. The median price in the West was $374,400, up 0.2 percent from December 2017.

The latest results brought the 2018 tally to 5.34 million, the weakest pace since 2015. This is the biggest annual drop in existing home sales in 8 years…

Illinois’ Lethal Combination: Rising Property Taxes & Stagnant Incomes

A lethal combination of rising property taxes and stagnant incomes has forced many Illinoisans to rethink their relationship with their state. More than 1.5 million net residents have already fled the state since 2000 – and you can’t blame others for thinking about joining them.

Property taxes have become punitive in Illinois. We’ve written about how these taxes have destroyed the equity in people’s homes across the state. Many families have done the math, and whether they’re in the struggling south suburbs of Chicago or the affluent North Shore, they’ve decided to leave Illinois behind.

The traditional method for measuring the burden of property taxes is to look at a household’s property tax bill and compare it to a home’s value. Under this method, Illinoisans pay the highest property taxes in the nation. At 2.7 percent, Illinoisans pay far more than residents in neighboring states – twice more than those in Missouri and three times more than residents in Indiana.

https://www.zerohedge.com/s3/files/inline-images/Illinoisans-pay-the-highest-property-tax-rates-in-the-nation.png?itok=TySk9EJ4

That fact is outrageous on its own.

But to really understand the pain that these taxes inflict on Illinoisans, it’s important to compare property tax bills to household incomes. After all, those bills are paid straight from people’s earnings.

The unfortunate reality is that Illinois incomes have been stagnant for years – and falling when you consider the impact of inflation.

Between 2000 and 2017, Illinois median household incomes increased just 34 percent, far short of inflation. In contrast, household property tax bills are up 105 percent, according to Illinois Department of Revenue data.

https://www.zerohedge.com/s3/files/inline-images/Illinois-property-taxes-have-grown-three-times-faster-than-incomes.png?itok=pxu4sFvb

The net result: Property tax bills per household have grown three times faster than household incomes since 2000.

That means more of Illinoisans’ hard-earned incomes are going toward property taxes and less towards groceries, college tuition, and retirement savings. In 2017, 6.73 percent of household incomes went toward property taxes, up from 4.3 percent in 2000.

https://www.zerohedge.com/s3/files/inline-images/Illinois-property-taxes-consumed-6.7-percent-of-household-incomes-in-2017.png?itok=wNlz9IY8

That’s a 55 percent increase in the effective tax rate.

The detailed data is below:

https://www.zerohedge.com/s3/files/inline-images/Illinois-property-taxes-consume-more-of-household-incomes-when-compared-to-2000.png?itok=ncfCS74C

Property taxes, county by county

https://www.zerohedge.com/s3/files/inline-images/Top-10-Illinois-counties-with-the-highest-property-tax-rates.png?itok=DdaYf29G

Residents of Lake County pay the highest property taxes in Illinois when measured as a percentage of household incomes. In 2000, Lake County residents paid 6.5 percent of their household incomes toward property taxes. Today, residents pay 9.1 percent. That’s a 40 percent increase. The average Lake County property tax bill is now over $7,500 per household.

Meanwhile the residents of the other collar counties and Cook pay more than 7 percent of their incomes to property taxes, with average bills ranging from $4,500 to $6,200 a year.

Overall, the collar counties pay the highest taxes as a percent of income in the state. But it’s not just the Chicago suburbs that are taking a hit. Taxpayers statewide have seen their taxes rise.

https://www.zerohedge.com/s3/files/inline-images/Top-10-Illinois-counties-with-the-highest-growth-in-property-tax-rates.png?itok=ZF6tO_IT

In fact, most of the counties that have had the biggest tax growth, in percentage terms, are found downstate. Hardin County residents, though they pay low rates, have seen them jump 97 percent since 2000. Residents in Pulaski County, have seen their rates go up by 78 percent.

Cook County comes next at 75 percent, but after that it’s all deep downstate again: Calhoun (70 percent), Greene (66 percent), Jersey (65 percent), and Pope County (62 percent).

Taxes too high

Any way you cut it, Illinoisans are being punished by property taxes.

That’s prompted some, including new Gov. J.B. Pritzker, to propose a reduction in property taxes by increasing income taxes.

But that would do Illinoisans no good. Illinoisans already pay the nation’s 6th-highest rates when you lump all state and local taxes together.

https://www.zerohedge.com/s3/files/inline-images/Illinoisans-pay-the-6th-highest-state-local-tax-rate-in-the-nation.png?itok=DtJreRql

Shifting them around won’t help when the total tax bill is too high to begin with. What Illinoisans need is tax cut, not a tax shift.

Source: ZeroHedge
By Ted Dabrowski and John Klingner via WirePoints.com

Will Globalists Sacrifice The Dollar To Get Their ‘New World Order’?

Trade is a fundamental element of human survival. No one person can produce every single product or service necessary for a comfortable life, no matter how Spartan their attitude. Unless your goal is to desperately scratch an existence from your local terrain with no chance of progress in the future, you are going to need a network of other producers. For most of the history of human civilization, production was the basis for economy. All other elements were secondary.

At some point, as trade grows and thrives, a society is going to start looking for a store of value; something that represents the man-hours and effort and ingenuity a person put into their day. Something that is universally accepted within barter networks, something highly prized, that is tangible, that can be held in our hands and is impossible to replicate artificially. Enter precious metals.

Thus, the concept of “money” was born, and for the most part it functioned quite well for thousands of years. Unfortunately, there are people in our world that see economy as a tool for control rather than a vital process that should be left alone to develop naturally.

The idea of “fiat money”, money which has no tangibility and that can be created on a whim by a central source or authority, is rather new in the grand scheme of things. It is a bastardization of the original and much more stable money system that existed before that was anchored in hard commodities. While it claims to offer a more “liquid” store of value, the truth is that it is no store of value at all.

Purveyors of fiat, central banks and globalists, use ever increasing debt as a means to feed fiat, not to mention the hidden tax of price inflation. When central bankers get a hold of money, it is no longer a representation of work or value, but a system of enslavement that crushes our ability to produce effectively and to receive fair returns for our labor.

There are many people today in the liberty movement that understand this dynamic, but even in alternative economic circles there are some that do not understand the full picture when it comes to central banks and fiat mechanisms. There is a false notion that paper currencies are the life blood of the establishment and that they will seek to protect these currencies at all costs. This might have been true 20 years ago or more, but it is not true today. Things change.

The king of this delusion is the US dollar. As the world reserve currency it is thought by some to be “untouchable”, a pillar of the globalist structure that will be defended for many decades to come. The reality, however, is that the dollar is nothing more than another con game on paper to the globalists; a farce that they are happy to sacrifice in order to further their goals of complete centralization of world trade and therefore the complete centralization of control over human survival.

That is to say, the dollar is a stepping stone for them, nothing more.

The real goal of the globalists is an economic system in which they can monitor every transaction no matter how small; a system in which there is eventually only one currency, a currency that can be tracked, granted or taken away at a moment’s notice. Imagine a world in which your “store of value” is subject to constant scrutiny by a bureaucratic monstrosity, and there is no way to hide from them by using private trade as a backstop. Imagine a world in which you cannot hold your money in your hand, and access to your money can be denied with the push of a button if you step out of line. This is what the globalists really desire.

Some people might claim that this kind of system already exists, but they would be fooling themselves. Even though fiat currencies like the dollar are a cancer on free markets and true production, they still offer privacy to a point, and they can still be physically allocated and held in your hand making them harder to confiscate. The globalists want to take a bad thing and make it even worse.

So, the question arises – How do they plan to make the shift from the current fiat paper system to their “new world order” economy?

First and foremost, they will seek a controlled demolition of the dollar as the world reserve currency. They have accomplished this in the past with other reserve currencies, such as the Pound Sterling, which was carefully diminished over a period of two decades just after WWII through the use of treasury bond dumps by France and the US, as well as the forced removal of the sterling as the petro-currency. This was done to make way for the US dollar as a replacement after the Bretton Woods agreement in 1944.

The dollar did not achieve true world reserve status, though, until after the gold standard was completely abandoned by Nixon in the early 1970’s, at which point a deal was struck with Saudi Arabia making the dollar the petro-currency. Once the dollar was no longer anchored to gold and the world’s energy market was made dependent on it, the fate of the US economy was sealed.

Unlike Britain and the sterling, the US economy is hyper-dependent on the dollar’s world reserve status. While Britain suffered declining conditions for decades after the loss, including inflation and high interest rates, the US will experience far more acute pain. A complete lack of adequate manufacturing capability within US borders has turned our nation into a consumer based society rather than a society of producers. Meaning, we are dependent on the demand for our currency as a reserve in order to enjoy affordable goods from outside sources (i.e. other manufacturing based countries).

Add to this lack of production ability the fact that for the past decade the Federal Reserve has been pumping trillions of dollars into financial markets around the globe. This means trillions of dollar held overseas only on the promise that those dollars will be accepted by major exporters as a universal store of value. If faith in that promise is lost, those trillions could come flooding back into the US through various channels, and the buying power of the currency would crumble.

There is a delusion within the American mainstream that even if such an event were to occur, the transition could be handled with ease. It’s fantastical, I know, but never underestimate the cognitive dissonance of people blinded by bias.

The rebuilding of a production base within the US to offset the crisis of losing the world reserve currency would take many years; perhaps decades. And this is in the best case scenario. With a plummeting currency and extreme price inflation, the cost of establishing new production on a large scale would be immense. While local labor might become cheap (in comparison with inflation), all other elements of the economy would become very expensive.

In the worst case scenario there would be complete societal breakdown likely followed by an attempted totalitarian response by government. In which case, forget any domestically funded economic recovery. Any future recovery would have to be funded and managed from outside the US. And here is where we see the globalist plan taking shape.

The banking elites have hinted in the past how they might try to “reset” the global economy. As I’ve mentioned in many articles, the globalist run magazine The Economist in 1988 discussed the removal of the dollar to make way for a global currency, a currency which would be introduced to the masses by 2018. This introduction did in fact take place as The Economist declared it would. Blockchain and digital currency systems, the intended foundation of the next globalist monetary structure, received unprecedented coverage the past two years.  They are now a part of the public consciousness.

Here is how Brandon Smith, Alt-Market believes the process will unfold:

The 2008 crash in credit and housing markets led to unprecedented stimulus by central banks, with the Federal Reserve leading the pack as the greatest source of inflation. This program of bailouts and QE stimulus conjured an even bigger bubble, which many alternative analysts have dubbed “the everything bubble”.

The growing “everything bubble” encompasses not just stock markets or housing, but auto markets, credit markets, bond markets, and the dollar itself. All of these elements are now tied directly to Fed policy. The US economy is not only addicted to stimulus measures and near-zero interest rates; it will die without them.

The Fed knows this well. Chairman Jerome Powell hinted at the crisis that would evolve if the Fed ever cut off stimulus, unwound its balance sheet and hiked rates in the October 2012 Fed minutes.

Without constant and ever expanding stimulus measures, the false economy will implode. We are already seeing the effects as the Fed cuts tens-of-billions per month in assets from its balance sheet and hikes interest rates to their “neutral rate of inflation”. Auto markets, housing markets, and credit markets are in reversal, and stocks are witnessing the most instability since the 2008 crash. All of this was triggered by the Fed simply exerting incremental rate hikes and balance sheet cuts.

It is also important to note that almost every US stock market rally the past several months has taken place while the Fed’s balance sheet cuts were frozen.  For example, for the past two-and-a-half weeks the Fed’s assets have only dropped by around $8 billion; this is basically a flat line in the balance sheet.  It should not be surprising given this pause in cuts (in tandem with convenient stimulus measures by China) that stocks spiked through early to mid-January.

That said, Fed tightening will start again, either by rate hikes, asset cuts, or both at the same time. The Fed’s purpose is to create a crisis. The Fed’s goal is to cause a crash. The Fed is a suicide bomber that does not care what happens to the US system.

But what about the dollar, specifically?

The Fed’s tightening policies do not only translate to crisis for US stocks or other markets. I see three primary ways in which the dollar can be dethroned as the world reserve.

1) Emerging economies have become addicted to Fed liquidity over the past ten years. Without continued access to the Fed’s easy money, nations like China and India are beginning to seek out alternatives to the dollar as a world reserve. Contrary to the popular belief that these countries would “never” be able to decouple from the US, the process has already begun. And, it is the Fed that has actually created the necessity for emerging markets to seek out other sources of liquidity besides the dollar.

2) Donald Trump’s trade war is yet another cover event for the loss of reserve status. I would note that the primary rationale for tariffs was to balance the trade deficit.  The trade deficit with China has done the opposite and is continually expanding each month.  This suggests much higher tariffs on China would be required to reduce the imbalance.

It must also be understood that the trade deficit with China has long been part of a larger agreement.  China is one of the largest buyers of US debt in the world and has continued to utilize the dollar as the world reserve currency.  If the trade war continues through this year, it is only a matter of time before China, already seeking dollar alternatives as the Fed tightens liquidity, will start using its US treasury and dollar holdings as leverage against us.

Bilateral agreements between multiple nations that cut out the dollar are being established regularly today. If China, the largest exporter/importer in the world, stops accepting the dollar as the world reserve, or if they start accepting other currencies in competition, then numerous other nations will follow their lead.

3) Finally, if the war of words between Trump and the Fed becomes something more, then this could be used by the establishment to undermine faith in US credit.  If Trump seeks to shut down the Fed entirely, the globalists are handed yet another perfect distraction for the death of the dollar. I can see the headlines now – The “reset” could then be painted as a “rescue” of the global economy after the “destructive actions of populists” who “bumbled into fiscal destruction” because they were blinded by an “obsession with sovereignty” in a world that “requires centralization to survive”.

The specifics of the shift to a global currency are less clear, but again, we have hints from the globalists. The Economist suggests that the US economy will have to be taken down a few pegs, and that the IMF would step in as the arbiter of Forex markets through its SDR basket system. This plan was echoed recently by globalist Mohamed El-Erian in an article he wrote titled “New Life For The SDR?”. El-Erian also suggests that a global currency would help to combat the “rise of populism”.

The Economist notes that the SDR would only act as a “bridge” to the new global currency. Paper currencies would still exist for a time, but they would be pegged to the SDR exchange rates. Currently, the dollar is only worth around .71 SDR’s. In the event of the loss of world reserve status, expect this exchange rate to drop significantly.

As the global crisis deepens the IMF will suggest a “reset” to a more manageable monetary framework, and this framework will be based on blockchain technology and a crypto currency which the IMF has likely already developed. The IMF hints at this outcome in at least two separate white papers recently published which herald a new age in which crypto as the next phase of evolution for global trade.

I predict according to the current pace of the trade war, Fed liquidity tightening and de-dollarization that threats to the dollar’s world reserve status will hit the mainstream by 2020.  The process of “resetting” the global monetary system would likely take at least another decade to complete.  The globalist preoccupation with their “Agenda 2030” sustainable development initiatives suggests a decade long timeline.

Without ample resistance, the introduction of the cashless society will be presented as a natural and even “heroic” response by the globalists to save humanity from the “selfishness” of destructive nationalists. They will strut across the world stage as if they are saviors, rather than the villains they really are.

Source: ZeroHedge
By Brandon Smith | Alt-Market.com

***

Mathematically possible…?

Shock Survey: 59 Percent Of Americans Support Alexandria Ocasio-Cortez’s Proposal To Raise The Top Tax Rate To 70%

https://i0.wp.com/theeconomiccollapseblog.com/wp-content/uploads/2019/01/Alexandria-Ocasio-Cortez-YouTube-Screenshot-768x432.jpg

Although she has only been in Congress for less than a month, Alexandria Ocasio-Cortez is getting more attention than any other member of the U.S. House of Representatives.  She has been setting social media ablaze with her posts about the inner workings of Congress, the mainstream media is constantly gushing about her, and now she has been tapped to teach her fellow Democrats “how to be good at Twitter”.  She is getting rave reviews for taking on the corrupt establishment in both political parties, but the bad news is that she literally doesn’t know what she is talking about on virtually every single important issue.  She is like a five-year-old kid that has been set free to run wild in a toy store, and her misdirected enthusiasm is bound to get her into all sorts of trouble.

It is a good thing to be idealistic, as long as you have the right ideals

Unfortunately for Ocasio-Cortez, her head has been filled with all sorts of socialist nonsense.  During a recent interview with 60 Minutes, she proposed raising the top income tax rate to “as high as 60 or 70 percent”

“You look at our tax rates back in the ’60s and when you have a progressive tax rate system, your tax rate, let’s say from zero to $75,000, may be 10 percent or 15 percent, etc. But once you get to the tippy-tops —  on your 10 millionth dollar — sometimes you see tax rates as high as 60 or 70 percent. That doesn’t mean all $10 million are taxed at an extremely high rate, but it means that as you climb up this ladder, you should be contributing more.”

Do you think that anyone is going to want to work hard to earn an extra dollar once their income reaches a level where each extra dollar is being taxed at 70 percent?

The truth is that socialism kills the incentive to work hard, and it is hard work that fuels economic growth.

If somebody works really hard to earn a dollar, it is immoral for somebody else to come in and grab 70 percent of that dollar just because they can.  But an increasing percentage of Americans are fully embracing the idea of “radical wealth redistribution”, and a shocking new poll contains some numbers that are almost too crazy to believe.

According to this new survey, 59 percent of all Americans support raising the highest tax rate to 70 percent

Rep. Alexandria Ocasio-Cortez (D-N.Y.) and her Republican critics have both called her proposal to dramatically increase America’s highest tax rate “radical” but a new poll released Tuesday indicates that a majority of Americans agrees with the idea.

In the latest The Hill-HarrisX survey — conducted Jan. 12 and 13 after the newly elected congresswoman called for the U.S. to raise its highest tax rate to 70 percent — a sizable majority of registered voters, 59 percent, supports the concept.

Even as I write this article, I am still having a hard time wrapping my head around the fact that most Americans want tax rates to be that high.

But this is the reality of the “Robin Hood mentality” that is sweeping the nation.  Most people seem to think that we should “take from the rich” and “give to the poor”, and that even includes a lot of so-called “conservatives”.

In fact, that same survey found that 45 percent of Republicans actually support what Ocasio-Cortez is proposing…

Increasing the highest tax bracket to 70 percent garners a surprising amount of support among Republican voters. In the Hill-HarrisX poll, 45 percent of GOP voters say they favor it while 55 percent are opposed to it.

Independent voters who were contacted backed the tax idea by a 60 to 40 percent margin while Democratic ones favored it, 71 percent to 29 percent.

What in the world has happened to us?

We have already traveled very far down the road toward socialism, and now key leaders on the left such as Ocasio-Cortez want to take us the rest of the way.

This is why we need a new generation of leaders in America that are willing to do more than just get elected to office.  We need educators that are willing to work hard to win the battle for hearts and minds.  We need men and women of character that will be able to communicate why the values that America was founded upon are so great and why we need to return to them.  And we need fighters that have the courage to intellectually contend for the future of our nation while there is still time to do so.

Even though virtually everything that she believes is wrong, at least Alexandria Ocasio-Cortez has enough passion to stand up for what she believes.  That is more than can be said for the soy latte drinking wimps on the right that never want to offend anyone so that they can extend their political careers for as long as possible.

At this point the left is rapidly taking control of the national conversation, and Rasmussen just released a national survey that shows that if Ocasio-Cortez ran for president in 2020 she would almost have as much support as Trump

A new Rasmussen Reports national telephone and online survey finds that, if the 2020 presidential race was between Trump and Ocasio-Cortez, 43% of Likely U.S. Voters would vote for Trump, while 40% would vote for Ocasio-Cortez. A sizable 17% are undecided.

Fortunately, Ocasio-Cortez is not old enough to run for president yet.

But someday she will be

We are in a tremendous amount of trouble as a nation, and we are rapidly running out of time to do anything about it.

Source: by Michael Snyder | Economic Collapse

Chinese Workers Forced to Crawl in Street After Missing Sales Targets

Shock video shows staffers suffering cruel punishment

https://www.infowars.com/wp-content/uploads/2019/01/Crawl.jpg

Workers from a Chinese beauty products company have been forced to crawl on the street after failing to reach their annual targets.

https://youtu.be/qEE9UWjnLX4

The staff were on all fours as they made their way through busy traffic in the Chinese city of Tengzhou, according to local reports.

Pedestrians of the city in eastern China were shocked by the scene as they stopped to watch as the employees moving forward on their hands and knees, videos show.

Source: by Tracy You | Daily Mail

What Happened To The $1 Billion Tax Revenue Expected From Licensed Marijuana Sales In California?

https://media.ktvu.com/media.ktvu.com/photo/2018/01/12/Screen%20Shot%202018-01-12%20at%2011.28.58%20AM_1515785372611.png_4804379_ver1.0_640_360.jpg

A customer shows his receipt for recreational marijuana in Berkeley (KTVU.com).

$1 billion: that’s how much California initially anticipated receiving in annual tax revenue by legalizing the sale of recreational marijuana. Here’s what actually happened:

  • CA will likely bring in just under $500 million in marijuana tax revenue this fiscal year.
  • That’s lower than the $630 million forecasted in former Governor Jerry Brown’s budget.
  • Current Governor Gavin Newsom’s new budget projects the state will generate $355 million in marijuana excise taxes by the end of June according to press accounts.

That is worse than underwhelming. Consider that Washington State received $319 million in legal marijuana taxes and license fees in fiscal year 2017, while Colorado collected $247 million in 2017. They have populations of just 7.5 million and 5.7 million respectively. California is the largest US state with nearly 40 million people.

Why is this important? There was a wave of Democratic gubernatorial candidates that ran on legalizing recreational marijuana to boost state tax revenue in the last midterm elections. Many of them won and are trying to pass a bill through their state legislatures as soon as this year. These include: New York, Illinois, Connecticut, Minnesota, New Mexico, and New Jersey.

If new states want to legalize retail cannabis sales and meet their respective tax revenue goals, they need to heed the lessons of California and public equity investors in the space likewise should understand the issue as they assess the size of the addressable market here. Marijuana legalization in the US is far more complex than either group likely realizes.

With that said, there’s three major issues at play in California:

#1 – The taxes are too high, allowing the black market to remain relevant. Fitch predicted this consequence in 2017: “California’s high cannabis taxes will encourage black market sales and limit potential local government revenues from this new market… Effective tax rates on nonmedical cannabis will be as high as 45% when accounting for both state and local levies… By comparison, Oregon taxes nonmedical cannabis at approximately 20% and Alaskan taxes range from 10% to 20%.”

The upshot: Colorado, Washington and Oregon all had to reduce their marijuana tax rates after legalization to better compete with the black market. California should follow suit, but other states should learn and get it right out of the gate.

#2 – California may have legalized the sale of retail cannabis, but most cities still prohibit it. Fewer than 20% of cities in the state allow stores to sell recreational marijuana (89 out of 482). For example, 93% of Los Angeles County’s 88 cities ban retail sales. One solution that’s supposed to go into effect: businesses will be allowed to deliver anywhere in the state aside from public land in the hopes that people use those services rather than buy from the black market in communities where they don’t have access to legal adult-use sales.

#3 – The regulations are too onerous and complicated. There are a lot of problems here, so we’ll just highlight a couple.

  • The Bureau of Cannabis Control has issued about 550 temporary and annual licenses to marijuana retail stores compared to initial projections of upwards of 6,000 in the first few years. To put this in perspective, the Los Angeles Times reports that “some 1,790 stores and dispensaries were paying taxes on medicinal pot sales before licenses were required starting Jan. 1.”
  • Why haven’t they issued more licenses? Marijuana businesses need a local license before getting one from the state. That’s tough to do when retail sales are banned in most cities. Obviously, this is not an issue for the black market, which is not restricted by location or burdened by regulatory and compliance costs.
  • Moreover, California’s marijuana market is still governed by a slew of emergency regulations. The Bureau of Cannabis Control, California Department of Public Health and California Department of Food and Agriculture have tweaked these regulatory provisions over the past year, and are still working on final non-emergency regulations to adopt. In the meantime, marijuana businesses have been left confused and forced to adapt to regulatory changes, such as different labeling requirements on marijuana products.

To sum up, we’ve covered the legal retail marijuana industry since its infancy five years ago and remain enthusiastic about its prospects. That said, California is a key example of how the same regulations that made the recreational cannabis market possible can also hurt its growth. The right deregulation will ultimately drive growth rates for the industry and valuations for public pot companies over time. This is why it is taking so long for New Jersey, for example, to legalize retail marijuana sales through its state legislature. Lawmakers have the benefit of learning from states like California that missed the mark, even with the tailwind of an entrenched medical market with existing infrastructure and a distribution pipeline.

The bottom line for investors in public pot stocks: pay attention to state and local tax rates and regulations as new markets open up because this under appreciated factor will profoundly affect the industry’s total addressable market.

Source: ZeroHedge

The “Failing Angels” Are Back

Lehman, WorldCom And Now PG&E

https://zh-prod-1cc738ca-7d3b-4a72-b792-20bd8d8fa069.storage.googleapis.com/s3fs-public/styles/teaser_desktop_2x/public/2019-01/failing%20angel.jpg?h=579ef2d9

(ZeroHedge) One week ago when we wrote that with PG&E facing a threat of an imminent bankruptcy (which we now know will soon be realized), the most bizarre development in this latest corporate fiasco was that until the first week of January, both S&P and Moody’s had rated the California utility with over $30 billion in debt as investment grade even as its bonds and stocks were cratering ahead of what investors deemed to be an imminent Chapter 11 filing.

And while we have extensively discussed the multi-trillion threat posed by “falling angel” companies, or those corporations rated BBB – the lowest investment grade equivalent rating – as they slide into junk territory, the recent events surrounding PG&E highlight an even greater blind spot in the corporate bond arsenal: that of the failing angel.

As Bank of America’s Hans Mikkelsen wrote in a recent research note, Investment Grade defaults – defined as defaults within one year of being rated IG – are “rare and unpredictable” (even if in the case of PG&E, its downfall was quite obvious to many) as globally in more than half of years historically there were no HG defaults at all.

https://www.zerohedge.com/s3/files/inline-images/PG%26EBOFA1.jpg?itok=76YRhTp2

As such, Monday’s pre-announcement by The Pacific Gas and Electric Company (PCG) that it intends to file Chapter 11 by January 29th…

https://www.zerohedge.com/s3/files/inline-images/PG%26EBOFA2.jpg?itok=LPUASg8i

… is a singular event and if the company follows through, it will become the third largest IG default since 1999, behind Lehman and Worldcom, with $17.5bn of index eligible debt.

The chart below lists all US index defaults since 1999 that occurred within one year of being included in ICE BofAML benchmark US high grade index. The three largest defaults in terms of index notional were Lehman ($34.9bn), WorldCom ($22.9bn) and CIT Group ($12.4bn).

https://www.zerohedge.com/s3/files/inline-images/PG%26E%20BOFA4.jpg?itok=I3W3gy_w

In fact, as BofA adds, if PG&E does file before the end of the month the company will become a member of a much more exclusive group of “Failing Angel”, formerly-IG companies consisting of Enron, Lehman and MF Global that defaulted directly out of IG, before making it into the HY index as Fallen Angels.

https://www.zerohedge.com/s3/files/inline-images/PG%26E%20BOFA3.jpg?itok=L-y4cUJ4

Ironically, as Mikkelsen adds, until recently he had looked at PCG as set to become a large Fallen Angel from BBB accounting for 1.4% of the HY market. Now it appears the company plans to bypass the HY market, and proceed straight to default.

So as the world obsesses over the risk of “falling angels”, just how many other “failing angels” are hiding in the shadows, waiting for their moment to wipe out billions in stakeholder value as the economy continues to slowdown to what is now an inevitable recession, and just what will the knock-on effects of this “historic” default be? We will find out in less than two weeks.

Source: ZeroHedge

Wells Just Reported Their Worst Mortgage Number Since The Financial Crisis

(Wells Fargo Earnings Supplement) When ZeroHedge reported Wells Fargo’s Q3 earnings back in October, they drew readers’ attention to one specific line of business, the one they have repeatedly dubbed the bank’s “bread and butter“, namely mortgage lending, and which as they then reported was “the biggest alarm” because “as a result of rising rates, Wells’ residential mortgage applications and pipelines both tumbled, sliding just shy of the post-crisis lows recorded in late 2013.”

Well, unfortunately for Wells, despite the sharp drop in yields in Q4 which many had expected would boost mortgage lending or at least refi activity for the bank that was until recently America’s largest mortgage lender, the decline in mortgage activity has continued,  because buried deep in its presentation accompanying otherwise unremarkable Q4 results (modest EPS best; sizable revenue miss), Wells just reported that its ‘bread and butter’ is once again missing, and in Q4 2018 the amount in the all-important Wells Fargo Mortgage Application pipeline shrank again, dropping to $18 billion, the lowest level since the financial crisis.

https://www.zerohedge.com/s3/files/inline-images/wells%20applications%20q4%202018.jpg?itok=KEVjN8iQ

Meanwhile, Wells’ mortgage originations number, which usually trails the pipeline by 3-4 quarters, was just as bad, dropping a whopping $12BN sequentially from $46 billion to just $38 billion, and effectively tied for the lowest print since the financial crisis.  Putting this number in context, just six years ago, when the US housing market was actually solid, Wells was originating 4 times as many mortgages, or about $120 billion.

https://www.zerohedge.com/s3/files/inline-images/Wells%20origiantions%20q4%202018.jpg?itok=26bJj1Sr

And since this number lags the mortgage applications, we expect it to continue posting fresh post-crisis lows in the coming quarter especially if rates resume their rise.

Going back to the headline numbers, here is a recap of the key metrics:

  • 4Q adj. EPS $1.21, est. $1.19
  • 4Q revenue $20.98 billion, Exp. $24.7BN
  • 4Q net interest income $12.64 billion
  • 4Q loans $953.11 billion vs. $942.3 billion q/q
  • 4Q mortgage non-interest income $467 million
  • 4Q residential mortgage originations $38 billion
  • 4Q margin on residential held-for-sale mortgage originations 0.89%
  • 4Q non- performing assets $6.95 billion
  • 4Q net charge-offs $721 million, estimate $736.8 million (BD)
  • 4Q total avg. deposits $1.27 trillion

There was more bad news for Wells. First, as the chart below shows, Noninterest Income has been a disaster and is only getting worse with virtually every revenue category posting Y/Y declines.

https://www.zerohedge.com/s3/files/inline-images/wells%20noninterest%20income%20q4%202018.jpg?itok=6nAL-W9q

Things were not better on the interest income side where the bank’s Net Interest Margin managed ended its recent streak of increases, and was unchanged at 2.94% resulting in $12.644 billion in Net Interest Income, and missing expectations of an increase to 2.95%. This is what Wells said: “NIM of 2.94% stable LQ as a benefit from higher interest rates and favorable hedge ineffectiveness accounting results were offset by the impacts of all other balance sheet mix and lower variable income.

https://www.zerohedge.com/s3/files/inline-images/NIM%20Wells%20Q4%202018.jpg?itok=WF4DdIH5

While Wells loss provisions declined modestly in Q4, its actual charge-offs jumped from $680MM to $721MM, the highest since Q1.

https://www.zerohedge.com/s3/files/inline-images/Wells%20charge%20offs%20q4%202018.jpg?itok=E1Jkk2Lr

There was another problem facing Buffett’s favorite bank: while NIM failed to increase, deposits costs are rising fast, and in Q4, the bank was charged an average deposit cost of 0.55% on $914.3MM in interest-bearing deposits, double what its deposit costs were a year ago.

https://www.zerohedge.com/s3/files/inline-images/wells%20deposit%20cost%20q4%202018.jpg?itok=NBzR9GZt

There was a silver lining however: amid concerns over the ongoing slide in the scandal-plagued bank’s deposits, which declined 3% or $40.1BN in Q3 Y/Y (down $2.3BN Q/Q) to $1.27 trillion, in Q4 Wells finally succeeded in getting a modest increase in deposits, which rose to $1.286 trillion, if still down 4% Y/Y. This was driven by growth in Wealth & Investment Management deposits driven by higher retail brokerage sweep deposits, “partially reflecting a change in our customers’ risk appetite, as well as higher private
banking deposits.” Offsetting this were declines in small business banking deposits, partially offset by growth in retail banking consumer deposits.

https://www.zerohedge.com/s3/files/inline-images/wells%20depositgs%20q4%202018.jpg?itok=sHfMWQmz

And some more good news: the recent ongoing shrinkage in the company’s balance sheet appears to have finally reversed, because one quarter after average loans declined from $944.3BN to $939.5BN, the lowest in years, and down $12.8 billion YoY, average loans outstanding increased fractionally to $946.3BN, up $6.8BN, or 1% Q/Q. This rebound was entirely due to commercial loans , which were up $7.7 billion LQ on higher commercial & industrial loans. Meanwhile, consumer loans continued to decline, and were down $835 million LQ as growth in nonconforming first mortgage loans and credit card loans was more than offset by declines in legacy consumer real estate portfolios including Pick-a-Pay and junior lien mortgage loans due to run-off and sales, as well as lower auto loans.

https://www.zerohedge.com/s3/files/inline-images/wells%20avg%20loans%20out.jpg?itok=JTJXxS5o

And finally, there was the chart showing the bank’s overall consumer loan trends: these reveal that the troubling broad decline in credit demand continues, as consumer loans were down a total of $13.7BN Y/Y across most product groups.

https://www.zerohedge.com/s3/files/inline-images/wells%20loans%20total%20q4%202018.jpg?itok=o07QLBIm

What these numbers reveal, is that the average US consumer can barely afford to take out a new mortgage even at a time when rates are once again sliding. It also means that if the Fed is truly intent in engineering a parallel shift in the curve of 2-3%, the US can kiss its domestic housing market goodbye.

Source: ZeroHedge


Did Russia Just Trigger A Global Reserve Currency Reset Process?

Russia De-Dollarizes Deeper: Shifts $100 Billion To Yuan, Yen, And Euro

(Listen to the report here)

Russia is continuing to ramp up its efforts to move away from the American dollar (Federal Reserve Notes). The country just shifted $100 billion of its reserves to the yuan, the yen, and the euro in their ongoing effort to ditch the US Dollar.

The Central Bank of Russia has moved further away from its reliance on the United States dollar and has axed its share in the country’s foreign reserves to a historic low, transferring about $100 billion into euro, Japanese yen, and Chinese yuan according to a report by RT. The share of the U.S. dollar in Russia’s international reserves portfolio has dramatically decreased in just three months between March and June 2018. The holding decreased from 43.7 percent to a new low of 21.9 percent, according to the Central Bank’s latest quarterly report, which is issued with a six-month lag.

The money pulled from the dollar reserves was redistributed to increase the share of the euro to 32 percent and the share of Chinese yuan to 14.7 percent. Another 14.7 percent of the portfolio was invested in other currencies, including the British pound (6.3 percent), Japanese yen (4.5 percent), as well as Canadian (2.3 percent) and Australian (1 percent) dollars.

The Central Bank’s total assets in foreign currencies and gold increased by $40.4 billion from July 2017 to June 2018, reaching $458.1 billion. –RT

Russian and others have been consistently moving away from the dollar and toward other currencies. Economic sanctions, which are losing their power as more countries move from the dollar, and trade wars seem to be fueling the dollar’s uncertainty.

Peter Schiff warns that as the supply of dollars is going to grow and grow, the demand for the American currency can fall, while the US Fed will be unable to stop the dollar’s demise. Schiff says that what is coming for Americans, is massive inflation.

“Eventually, what’s going to happen is it’s going to be the demand for those dollars is going to collapse, not the supply. And when the demand for dollars collapses, then the price of the dollar collapses. You get massive inflation. That is what is coming.”

Russia began its unprecedented dumping of U.S. Treasury bonds in April and May of last year. Russia appears to be moving on from the rise in tensions with the United States. The massive $81 billion spring sell-off coincided with the U.S.’s sanctioning of Russian businessmen, companies, and government officials. But Russia has long had plans to “beat” the U.S. when it comes to sanctions by stockpiling gold.

The Russian central bank’s First Deputy Governor Dmitry Tulin said that Moscow sees the acquisition of gold as a “100-percent guarantee from legal and political risks.”

As reported by RT, the Kremlin has openly stated that American sanctions and pressure are forcing Russia to find alternative settlement currencies to the U.S. dollar to ensure the security of the country’s economy. Other countries, such as China, India, and Iran, are also pursuing steps to challenge the greenback’s dominance in global trade.

Source: ZeroHedge

***

India Begins Paying For Iranian Oil In Rupees Instead Of US Dollars

Three months ago, in Mid-October, Subhash Chandra Garg, economic affairs secretary at India’s finance ministry, said that India still hasn’t worked out yet a payment system for continued purchases of crude oil from Iran, just before receiving a waiver to continue importing oil from Iran in its capacity as Iran’s second largest oil client after China.

https://www.zerohedge.com/sites/default/files/inline-images/iran%20oil%20clients_0.jpg?itok=DURuMPHn

That took place amid reports that India had discussed ditching the U.S. dollar in its trading of oil with Russia, Venezuela, and Iran, instead settling the trade either in Indian rupees or under a barter agreement. One thing was certain: India wanted to keep importing oil from Iran, because Tehran offers generous discounts and incentives for Indian buyers at a time when the Indian government is struggling with higher oil prices and a weakening local currency that additionally weighs on its oil import bill.

Fast forward to the new year when we learn that India has found a solution to the problem, and has begun paying Iran for oil in rupees, a senior bank official said on Tuesday, the first such payments since the United States imposed new sanctions against Tehran in November. An industry source told Reuters that India’s top refiner Indian Oil Corp and Mangalore Refinery & Petrochemicals have made payments for Iranian oil imports.

To be sure, India, the world’s third biggest oil importer, has wanted to continue buying oil from Iran as it offers free shipping and an extended credit period, while Iran will use the rupee funds to mostly pay for imports from India.

“Today we received a good amount from some oil companies,” Charan Singh, executive director at state-owned UCO Bank told Reuters. He did not disclose the names of refiners or how much had been deposited.

Hinting that it wants to extend oil trade with Tehran, New Delhi recently issued a notification exempting payments to the National Iranian Oil Company (NIOC) for crude oil imports from steep withholding taxes, enabling refiners to clear an estimated $1.5 billion in dues.

Meanwhile, in lieu of transacting in US Dollars, Iran is devising payment mechanisms including barter with trading partners like India, China and Russia following a delay in the setting up of a European Union-led special purpose vehicle to facilitate trade with Tehran, its foreign minister Javad Zarif said earlier on Tuesday.

As Reuters notes, in the previous round of U.S. sanctions, India settled 45% of oil payments in rupees and the remainder in euros but this time it has signed deal with Iran to make all payments in rupees as New Delhi wanted to fix its trade balance with Tehran.  Case in point: Indian imports from Iran totaled about $11 billion between April and November, with oil accounting for about 90 percent.

Singh said Indian refiners had previously made payments to 15 banks, but they will now be making deposits into the accounts of only 9 Iranian lenders as one had since closed and the U.S has imposed secondary sanctions on five others.

It’s all about control… Robert Fripp

Source: ZeroHedge

What Gen Z Learned From Millennials: Skip College

Generation Z is already learning from the millennial generation’s mistakes…

(LibertyNation) For years, millennials have scoffed at the notion of fixing someone else’s toilet, installing elevators, or cleaning a patient’s teeth. Instead, they wanted to get educated in lesbian dance theory, gender studies, and how white people and western civilization destroyed the world. As a result, student loan debt has surpassed the $1 trillion mark, the youth unemployment rate hovers around 9%, and the most tech-savvy and educated generation is delaying adulthood.

But their generational successors are not making the same mistakes, choosing to put in a good day’s work rather than whining on Twitter about how “problematic” the TV series Seinfeld was. It appears that young folks are paying attention to the wisdom of Mike Rowe, the American television host who has highlighted the benefits and importance of trade schools and blue-collar work – he has also made headlines for poking fun at man-babies and so-called Starbucks shelters.

Will Generation Z become the laughing stock of the world, too? Unlikely.

https://www.zerohedge.com/sites/default/files/styles/inline_image_desktop/public/inline-images/2019-01-06_11-34-15.jpg?itok=DEbbl6_q

Z Is Abandoning University

A new report from VICE Magazine suggests that Generation Z – those born around the late-1990s and early-2000s – are turning to trade schools, not university and college, for careers. Ostensibly, a growing number of younger students are seeing stable paychecks in in-demand fields without having to collapse under the weight of crushing debt.

Because Gen Zers want to learn now and work now, they are abandoning the traditional four-year route, a somewhat precocious response to the ever-evolving global economy.

Cosmetologist, petroleum technician, and respiratory therapist are just some of the positions that this generation of selfies, Snapchat, and emoticons are taking. And this is an encouraging development, considering that participation in career and technical education (CTE) has steadily declined since 1990.

David Abreu, a teacher at Queens Technical High School, told a class of young whippersnappers at the start of the semester:

“When you go out there, there’s no reason why anyone should be sitting on mommy’s couch, eating cereal, and watching cartoons or a telenovela. There’s tons of construction, and there’s not enough people. So they’re hiring from outside of New York City. They’re getting people from the Midwest. I love the accents, but they don’t have enough of you.”

While students feel the pressure of attaining a four-year degree in a subject that offers fewer employment opportunities, the blue-collar jobs are out there to be filled. It iestimated that more than one-third of businesses in construction, manufacturing, and financial services are unable to fill open jobs, mainly because of a skills shortage and a paucity of qualifications.

This could change in the coming years.

The Future Of College

Over the last decade or so, the college experience has turned into a circus. At Evergreen College, the inmates ran the asylum. The University of Missouri staff requested “some muscle over here” to suppress journalists. Harvard University has turned into a politically correct institution. What do all these places of higher learning have in common? They’re losing money, whether it’s from fewer donations or tumbling enrollment.

Not only are these places of higher learning metastasizing into leftist indoctrination centers, their rates for graduates obtaining employment are putrid. And parents and students are realizing this.

With the trend of Gen Zers embracing the trades, the future of post-secondary education might be different. Since colleges need to remain competitive in the sector, they will have to offer alternative programs and eliminate eclectic courses, and the administration will be required to justify their utility.

A pupil seeking out a STEM education will not be subjected to the inane ramblings of an ecofeminism teacher or the asinine curriculum of a queer theory course.

Moreover, colleges could no longer afford to spend chunks of their budgets on opulent settings. A student interested in the trades is unlikely to be attracted to in-house day spas, luxury dorms, and exorbitant gyms. They want the skills, the tools, and the training to garner a high-paying career without sacrificing 15 years’ worth of earnings just so they could enjoy lobster for lunch twice a week.

Generation Smart?

Millennials are typically the butt of jokes, known for texting in the middle of job interviews, demanding complicated Starbucks beverages, and ignoring their friends at the restaurant. Perhaps Generation Z doesn’t want to experience the same humiliation and stereotypes. This could explain why they are dismissing the millennial trends and instead adopting common sense, conservatism, tradition, and anything else that is contrary to those who need to be coddled.

The next 20 years should be fascinating.

In 2039, Ryder, who prefers the pronoun “xe,” is employed as a barista, a position he claims is temporary to pay off his student debt. He lives on his friend’s sofa, still protests former President Donald Trump, and spends his disposable income on tattoos. In the same year, Frank operates an HVAC business, owns his home without a mortgage, and has a wife and three children who enjoy their summer weekends at the ballpark with the grandparents.

https://www.zerohedge.com/sites/default/files/inline-images/Millennial-Barista-vs-Gen-Z-Carpenter-compressed.png?itok=0xwsv_28

One went to college for feminist philosophy, the other went to trade school. You decide who.

Source: ZeroHedge

Global Housing Markets From Hong Kong To Sydney Join Global Rout

It’s not just stocks: the global housing market is in for a rough patch, which has turned ugly for many homeowners and investors from Vancouver to London, with markets in Singapore, Hong Kong, and Australia already showing increased signs of softening.

Macro factors have triggered a global economic slowdown that is unraveling luxury marketplaces worldwide, according to Bloomberg. As a result, a turning point has been reached, with home prices globally now under pressure, and rising mortgage rates leading to depressed consumer optimism, while also triggering a housing affordability crisis, S&P Global Ratings said in a December report. To make matters worse, a simultaneous drop in house prices globally could lead to “financial and macroeconomic instability,” the IMF warned in a report last April.

While each metropolis globally has its distinct characteristics of what triggered its real estate slowdown, there are a few common denominators at play: rising borrowing costs, quantitative tightening, a crackdown on money laundering and increased government regulation, emerging market capital outflows and volatile financial markets. Bloomberg notes that there is also declining demand from Chinese buyers, who were the most powerful force in many housing markets globally over the course of this cycle.

“As China’s economy is affected by the trade war, capital outflows have become more difficult, thus weakening demand in markets including Sydney and Hong Kong,” said Patrick Wong, a real estate analyst at Bloomberg Intelligence.

One of the first dominoes to fall has been in Hong Kong, home values in the city have plummeted for 13 weeks straight since August, the longest losing streak since the 2008 financial crash, data from Centaline Property Agency show. Homeowners and investors have taken great caution due to a jump in borrowing costs, a looming vacancy tax, and the trade war that has derailed economic growth in mainland China.  

“The change in attitude can be explained by a slowing mainland economy,” said Henry Mok, JLL’s senior director of capital markets. “Throw in a simmering trade war between China and the U.S., the government has taken actions to restrict capital outflows, which in turn has increased difficulties for developers to invest overseas.”

https://www.zerohedge.com/sites/default/files/inline-images/on%20the%20turn.png?itok=3eachZYW

Home prices in Singapore, which rank among the world’s most expensive places to live, logged the first decline in six quarters in the three months ended December. Bloomberg said luxury experienced the worst declines, with values in prime areas dropping 1.5%.

Most of the slowdown was caused by government policies to cool the overinflated housing market. Cooling measures were implemented in July included higher stamp duties and tougher loan-to-value rules. The policies enacted by the government have halted the home-price recovery that only lasted for five quarters, the shortest since data became available.

“Landed home prices, being bigger ticket items, have taken a greater beating as demand softened,” said Ong Teck Hui, a senior director of research and consultancy at JLL.

https://www.zerohedge.com/sites/default/files/inline-images/singapore%20on%20sales.png?itok=oQ0T7Ney

The downturn in Sydney’s housing market is expected to continue this year as tighter lending standards and the worst plunge in values since the late 1980s has spooked buyers. Average Sydney home values had dropped 11.1% since their 2017 top, according to a recent CoreLogic Inc. report — surpassing the 9.6% peak to trough decline when Australia was on the cusp of entering its last recession.

Nationwide, home values declined 4.8% last year, marking the weakest housing market conditions since the 2008 financial crash.

“Access to finance is likely to remain the most significant barrier to an improvement in housing market conditions in 2019,” CoreLogic’s head of research Tim Lawless said. Weak consumer sentiment toward the property market is “likely to continue to dampen housing demand.”

https://www.zerohedge.com/sites/default/files/inline-images/aussies.png?itok=MsxjSfkC

Bloomberg notes that home prices in the country are still 60% higher than in 2012, if prices plunge another 10% in 2019, well, it could spark mass panic.

The Reserve Bank of Australia is terrified that an extended downturn will crimp consumption and with the main opposition Labor party pledging to curb tax perks for property investors if it wins an election expected in May, economic optimism would further deteriorate. Treasurer Josh Frydenberg on Thursday told the nation’s top banks not to tighten credit any more as the economic downturn is expected to get much worse.

But all eyes are on what is going on in arguably the most important housing markets in the world – those of Shanghai and Beijing. A government crackdown on leverage and overheating prices have damaged sales and triggered a 5% tumble in home values from their top. Rules on multiple home purchases, or how soon a property can be flipped once it is acquired, are starting to be relaxed, and the giveaways by home builders to lure buyers are starting to get absurd.

https://www.zerohedge.com/sites/default/files/inline-images/end%20of%20ever%20upward%20.png?itok=aRbU64mF

One developer in September was giving away new BMWs to new homebuyers at its townhouses in Shanghai. Down-payments have been slashed, with China Evergrande Group asking for 5% rather than the normal 30% deposit required.

“It’s not a surprise to see Beijing and Shanghai residential prices fall given the curbing policies currently on these two markets,” said Henry Chin, head of research at CBRE Group Inc.

As a whole, Bloomberg’s compilation of global housing data showing the unraveling of many housing markets is a sobering reminder that a synchronized global slowdown has started.

Source: ZeroHedge

***

Vancouver Condo Sales In December Drop To 10 Year Low

https://www.zerohedge.com/sites/default/files/styles/teaser_desktop_2x/public/2019-01/Vancouver-conod-sales-December-2018.png?h=3ebc4796&itok=o24C8Hrm


Vancouver condo sales fell to a 10 year low in December with sales plunging 47.5% year-over-year, the sharpest annual decline since 2008…

Are You Prepared For A Credit Freeze?

2, 3 and 5-Year Treasury Yields All Drop Below The Fed Funds Rate

Things are getting increasingly more crazy in bond land, where moments ago the 2Y Treasury dipped below 2.40%, trading at 2.3947% to be exact, and joining its 3Y and 5Y peers, which were already trading with a sub-2.4% handle. Why is that notable? Because 2.40% is where the Effective Fed Funds rate is, by definition the safest of safe yields in the market, that backstopped by the Fed itself. In other words, for the first time since 2008, the 2Y (and 3Y and 5Y) are all trading below the effective Fed Funds rate.

That the curve is now inverted from the Fed Funds rate all the way to the 5Y Treasury position suggests that whatever is coming, will be very ugly as increasingly more traders bet that one or more central banks may have no choice but to backstop risk assets and they will do it – how else – by buying bonds, sending yields to levels last seen during QE… i.e., much, much lower.

https://confoundedinterestnet.files.wordpress.com/2019/01/5eff.png

Explained…

Source: ZeroHedge

***

Gold Soars Above $1,300; Nikkei, JGB Yields Tumble As Rout Goes Global

https://www.zerohedge.com/sites/default/files/inline-images/gold%20futs%201.3.jpg?itok=Wll68K3N

Double Irish With A Dutch Sandwich

https://s14-eu5.startpage.com/cgi-bin/serveimage?url=http%3A%2F%2Fwww.abc.net.au%2Freslib%2F201211%2Fr1039486_11965856.jpg&sp=ed9ffffc08f46bdccb9b4438d597f927

What is the Double Irish With A Dutch Sandwich?

(Investopedia) The double Irish with a Dutch sandwich is a tax avoidance technique employed by certain large corporations, involving the use of a combination of Irish and Dutch subsidiary companies to shift profits to low or no tax jurisdictions. The scheme involves sending profits first through one Irish company, then to a Dutch company, and finally to a second Irish company headquartered in a tax haven. This technique has made it possible for certain corporations to reduce their overall corporate tax rates dramatically.

BREAKING DOWN Double Irish With A Dutch Sandwich

The double Irish with a Dutch sandwich is just one of a class of similar international tax avoidance schemes. Each involves arranging transactions between subsidiary companies to take advantage of the idiosyncrasies of varied national tax codes. These techniques are most prominently used by tech companies, because these firms can easily shift large portions of profits to other countries by assigning intellectual property rights to subsidiaries abroad.

The double Irish with a Dutch sandwich is generally considered to be a very aggressive tax planning strategy. It is, however, famously used by some of the world’s largest corporations, such as Google, Apple and Microsoft. In 2014, it came under heavy scrutiny, especially from the United States and the European Union, when it was discovered that this technique facilitated the transfer of several billion dollars annually tax-free to tax havens.

How it Works

The process involves two Irish companies, a Dutch company, and an offshore company located in a tax haven. The first Irish company is used to receive large royalties on goods, such as iPhones sold to U.S. consumers. The U.S. profits, and therefore taxes, are dramatically lowered, and the Irish taxes on the royalties are very low. Due to a loophole in Irish laws, the company can then transfer its profits tax-free to the offshore company, where they can remain un-taxed for years.

The second Irish company is used for sales to European customers. It is also taxed at a low rate and can send its profits to the first Irish company using a Dutch company as an intermediary. If done right, there is no tax paid anywhere. The first Irish company now has all the money and can again send it onward to the tax haven company.

The End of the Double Irish With a Dutch Sandwich

Due largely to international pressure and the publicity surrounding Google’s and Apple’s use of the double Irish with a Dutch sandwich, the Irish finance minister, in the 2015 budget, passed measures to close the loopholes and effectively end the use of the double Irish with a Dutch sandwich for new tax plans. Companies with established structures will continue to benefit from the old system until 2020.

Source: by Julia Kagen | Investopedia

Proposition 13 Is No Longer Off-Limits In California

https://s.hdnux.com/photos/75/11/15/16028529/7/gallery_xlarge.jpgGov. Jerry Brown, left, with Proposition 13 co-author Howard Jarvis at a news conference in July 1978, one month after California voters passed the measure. Photo: ROBBINS / AP

Proposition 13 Is Untouchable.

(San Francisco Chronicle) That’s been the thinking for 40 years in California. Politicians have feared for their careers if they dared suggest changes to the measure that capped property taxes, took a scythe to government spending and spawned anti-tax initiatives across the country.

However, that is beginning to change. With Republican influence in California on the wane and ascendant Democrats making tax fairness an issue, advocates are confident that the time is right to take a run at some legacies of the 1978 measure.

High on their list: making businesses pay more and ending a sweetheart deal for people who inherit homes and their low tax bills, then turn a profit by renting them out.

Legislative Democrats hold so many seats that they don’t have to worry about the GOP blocking such ideas from going before voters. Gov.-elect Gavin Newsom has said that “everything would be on the table,” including Prop. 13, as he formulates a plan to reform the state’s tax structure.

Perhaps most important, Prop. 13’s age is becoming an advantage to would-be reformers: California’s voting demography is changing. The generation of homeowners that grew up with Prop. 13 is well into retirement now, and some younger Californians blame flaws in the measure for everything from the under funding of public schools to growing wealth inequality.

“For Californians who grew up in the public education system that came after Prop. 13, their education was robbed from them. They didn’t get the same education their parents did,” said Catherine Bracy, executive director of TechEquity Collaborative, which is trying to rally the tech community to support changes to the state’s tax structure.

Bracy, 38, moved to the state six years ago from Chicago. “For newcomers (to California) like me, who were born after Prop. 13, we want to experience the California dream, too,” she said. “But we don’t have the opportunity to, because all the goodies have been locked up by the older generations.”

Prop. 13 was a remedy for a side-effect of one of California’s first housing bubbles — spiking property taxes. Moved by their own tax bills and horror stories of longtime homeowners being forced to sell because of skyrocketing assessments, voters overwhelmingly passed the measure. It rolled back assessments for homes and businesses to 1976 levels and capped annual tax increases at 2 percent.

Jon Coupal is president of Prop. 13’s fiercest defender — the Howard Jarvis Taxpayers Association, named after the initiative’s co-author. He agreed that “the number of homeowners who were around in 1978 is shrinking. And many younger people don’t remember the fear and anger about losing your home.”

But Coupal said that “notwithstanding the leftward movement of politics in California,” his organization’s internal polling shows support for Prop. 13 remains strong. And a survey in March by a nonpartisan group unaffiliated with Coupal’s organization, the Public Policy Institute of California, found that 65 percent of likely voters surveyed said Prop. 13 “turned out to be mostly a good thing for the state.”

Under Prop. 13, residential and commercial property alike is reassessed only when it is sold. But while homes often change hands every few years, many large businesses remain in the same ownership for a long time. Some businesses are paying property taxes based on assessments that haven’t changed in 40 years.

That’s one main target of people who want to tweak Prop. 13. The League of Women Voters of California says it has gathered enough signatures for a 2020 ballot measure that would create a so-called split roll system, under which businesses’ property would be reassessed every three years. Agricultural land and businesses with 50 or fewer employees would be exempt. Residential property would not be affected.

The change could raise $11 billion in tax revenue statewide, including $2.4 billion for Alameda, Contra Costa, Marin, San Francisco and San Mateo counties, according to a January study by the USC Program for Environmental and Regional Equity. The study found that 56 percent of all Bay Area commercial properties had not been reassessed for 20 years, and 22 percent had assessments dating back to the 1970s.

Could a split-roll measure pass? It might be close. Forty-six percent of likely voters surveyed by the Public Policy Institute of California in January said they supported the idea, while 43 percent were against it. Support was far higher among likely voters under 35 (57 percent) than with those over 55 (41 percent).

However, the split-roll concept has actually been growing less popular over the years, the institute said: Six years ago, 60 percent of likely voters backed it.

Helen Hutchison, president of the League of Women Voters of California, acknowledged that changing the law will be difficult because “Prop. 13 still has some kind of magical pull. But we think the time is right to do this.”

https://s.hdnux.com/photos/77/52/12/16687798/5/940x940.jpgState Sen. Jerry Hill has introduced a ballot initiative that would limit a tax break for heirs of residential property. Photo: Max Whittaker / Getty Images 2009

So does state Sen. Jerry Hill, D-San Mateo. He has introduced a ballot initiative that would tweak a different part of Prop. 13’s legacy.

Hill’s proposal, Senate Constitutional Amendment 3, takes aim at Proposition 58, which voters approved in 1986. The measure allowed parents to give their residential property to their heirs without triggering a tax reassessment. The intent of the measure was to insulate children from absorbing a huge spike in property taxes and help them stay in the family home. California is the only state to offer this tax break.

Hill proposed the change after learning that many heirs are using their inherited properties as second homes or renting them out for many times more than what they’re paying in Prop. 13-controlled property taxes.

The proposed ballot measure would require people who inherit property in this way to move into the home within a year if they wanted the property tax break. The change would apply to future heirs, not those who have already inherited homes.

Getting this measure on the ballot in 2020 requires Hill to corral a two-thirds majority from both houses of the Legislature. If it makes it to the ballot, it could be passed by a simple majority of voters.

Hill is mindful of the politics around property taxes.

We’re not touching Prop. 13. We’re touching Prop. 58,” Hill said. “The goal is to get people to pay their fair share.”

Coupal, head of the Howard Jarvis Taxpayers Association, doesn’t think Hill’s measure is the biggest threat to Californians concerned about taxes.

Source: by Joe Garofoli | San Francisco Chronicle

Southern California Home Sales Plunge 12% In November As Prices Peak

Southern California region home sales plunged in November from a year earlier, while year over year prices increased at the slowest pace in three years amid a housing market slowdown, reported Los Angeles Times.

The 12% decline in November sales from a year earlier was the fourth consecutive monthly drop for the eight southern counties, including Imperial, Los Angeles, Orange, Riverside, San Bernardino, San Diego, Santa Barbara, and Ventura.

The decline in sales for 2018 is still less pronounced than in 2014. Across the eight counties, year over year, lagging median price is still rising — 3.5% from November 2017, to $522,750, but the trend is starting to plateau.

Some housing markets experts are not convinced that a housing bust is materializing. “The housing market is slowing, but… a slowdown does not mean the sky is falling,” said Aaron Terrazas, an economist with Zillow.

LA Times noted if volatility in the stock market and Washington significantly affects consumer confidence and business investment decisions in 2019, the housing market could be due for significant correction into 2020. However, for now, Terrazas and other economists believe the factors that have led to past housing market crashes in Southern California are not visible.

https://www.zerohedge.com/sites/default/files/inline-images/Screen%20Shot%202018-12-28%20at%209.13.59%20AM.png?itok=z7PXLg1g

While some economists do not expect a crash, Bank of America rang the proverbial bell on the broader US real estate market in September, warning existing home sales have peaked, reflecting declining affordability, greater price reductions and deteriorating housing sentiment. 

“Call your realtor,” the BofA note proclaimed: “We are calling it: existing home sales have peaked.”

Richard K. Green, director of the USC Lusk Center for Real Estate, told the LA Times, he is very pessimistic about the housing situation in Southern California.

Green warns prices could plunge 5% to 10% into 2020, even with the current level of economic growth. He argues a similar tune that was said in BofA’s recent housing note: the affordability crisis is topping out the market.

Here are other factors pushing homes further out of reach of Americans:  “The tax law President Trump signed last year limited the amount of deductions for property tax and mortgage interest. Meanwhile, mortgage rates are elevated. The average rate for a 30-year fixed mortgage was 4.55% this week, according to Freddie Mac. That’s down from a recent high of 4.94%, but it’s far higher than the 3.99% level of a year ago,” LA Times said.

There are signs across Southern California that suggest buyers are holding back. 

In Los Angeles County, the median time on the market increased from 41 days in November 2017 to 45 days last month, according to online brokerage Redfin. Moreover, the number of listings with price reductions jumped from 15.9% to 22.2%.

Real estate agents have said buyers have been concern about buying a home as many see the housing market shifting in real time. 

“People are sidelining themselves,” said San Fernando Valley real estate agent Jaswant Singh.

On Thursday, more evidence showed a downward shift in the market. Real estate firm CoreLogic reported a 12% decline in November sales, with the annual rise in the median price coming in at the slowest pace since 2015. 

Southern California median price slipped 0.4% from October and is now $14,250 below the all-time high reached from summer. Inventory is now flooding the market as S&P CoreLogic Case-Shiller index shows a sharp deceleration in price appreciation. 

These are the markings of a turning point in the Southern California real estate market. What comes next you might ask? Well, the start of downward momentum in prices – likely to start in 2019 as the US economy is expected to rapidly slow.

Source: ZeroHedge

California Faces Pension Showdown

Governor Jerry Brown, as he leaves office is warning that California and its public agencies are on the road to “fiscal oblivion” if pension benefits can’t be adjusted down.

The media have been celebrating Governor Brown’s management skills at reversing the $27-billion state deficit he inherited from in 2010 from his predecessor, Arnold Schwarzenegger, to leave office in January with an alleged $13.8-billion surplus and a $14.5-billion rainy-day fund balance.

But Brown recently told reporters that California will be financially distressed again if the California Supreme Court rules in a case titled Cal Fire Local 2881 v. California Public Employees’ Retirement System against Brown’s 2012 California’s Public Employees’ Pension Reform Act that stopped the state and local selling of “airtime” that allowed public employees to spike their pension benefits by purchasing up to five years of un-worked service credit seniority.

California drastically increased public employee pension benefits in the fall of 2003, when the state allowed employees to purchase “airtime.”  Prior to the pension spike, a 50-year-old fireman making $89,000 a year could retire at age 50 after 30 years of service and collect an $80,100-a-year pension with life expectancy of 76.3 years. 

But under “airtime,” the fireman could purchase extra years of seniority at a cost per of $0.18022 per year for every $1 of salary.  For $80,197.90, the fireman could increase his pension by $13,350 to $93,450.  Such an investment in “airtime” would return a spectacular income stream of $351,105 over the next 26.3 years of life expectancy.

With many California public employees purchasing “airtime” to retire at 50 and make more than when employed, Democrat Brown ended the practice in 2013 for new hires after criticism that the practice amounted to a “gift of public funds” to his union allies.

Stanford University’s Institute for Economic Policy Research found that despite the state terminating “airtime” for new employees in 2013, the annual cost of funding the California Public Employee Retirement System (CalPERS) rose by 400 percent from 2003 to 2018 and would be up by 704 percent by 2030.

With an estimated unfunded pension liability of $464.4 billion in 2015, Stanford researchers estimated that the average unfunded liability per California household jumped from $9,127 in 2008; jumped to $21,491 in 2015; and would be over $40,000 in 2030.

The California Supreme Court heard testimony in Cal Fire v. CalPERS on December 5 over claims by the union that a 1955 decision set a precedent, referred to as the “California Rule,” that bars state and local government from reducing any promised retirement benefits without equivalent new compensation. 

Lawyers for the state argued that the California Constitution is not a “straitjacket” and that making pension benefit changes should not be illegal under the California Constitution:

If the impairment is limited and does not meaningfully alter an employee’s right to a substantial or reasonable pension or if it is reasonable and necessary to serve an important public purpose, it may be permissible under the contract clause.

The biggest challenge for Brown’s effort to eliminate the California Rule is that he successfully lobbied the state legislature to pass collective bargaining for public employees in 1982, just as he was retiring from his second four-year term as governor.

The Bureau of Labor Statistics reported that average cost for the average private sector employee contribution for retirement and savings was 3.9 percent, and the average public-sector cost was 11.6 percent.

But even if the California’s Public Employees’ Pension Reform Act survives it Supreme Court appeal, CalPERS’ 2018 average cost for pensions as a percentage of worker compensation was 20.4 percent for State Industrial; 21.5 percent for State Safety; 43.5 percent for State Peace Officer/Fireman; and 55.2 percent for Highway Patrol.

The California Supreme Court is expected to release a decision regarding the California Rule in early 2019, just after Brown leaves office on January 7.

Source: by Chriss Street | American Thinker

“Everything Is Fake”: Ex-Reddit CEO Confirms Internet Traffic Metrics Are All Bullshit

“It’s all true: Everything is fake,” tweeted Former Reddit CEO Ellen Pao regarding a Wednesday New York Magazine article which reveals that internet traffic metrics from some of the largest tech companies are overstated or fabricated. In other words; they’re bullshit.

https://www.zerohedge.com/sites/default/files/inline-images/pao1.jpg?itok=hbPEP0dDEx-Reddit CEO turned truth teller, Ellen Pao

Pao was responding to a tweet by the Washington Post‘s Aram Zucker-Schariff, quoting the following segment of the article: 

The metrics are all fake.

Take something as seemingly simple as how we measure web traffic. Metrics should be the most real thing on the internet: They are countable, trackable, and verifiable, and their existence undergirds the advertising business that drives our biggest social and search platforms. Yet not even Facebook, the world’s greatest data–gathering organization, seems able to produce genuine figures. In October, small advertisers filed suit against the social-media giant, accusing it of covering up, for a year, its significant overstatements of the time users spent watching videos on the platform (by 60 to 80 percent, Facebook says; by 150 to 900 percent, the plaintiffs say). According to an exhaustive list at MarketingLand, over the past two years Facebook has admitted to misreporting the reach of posts on Facebook Pages (in two different ways), the rate at which viewers complete ad videos, the average time spent reading its “Instant Articles,” the amount of referral traffic from Facebook to external websites, the number of views that videos received via Facebook’s mobile site, and the number of video views in Instant Articles.

Can we still trust the metrics? After the Inversion, what’s the point? Even when we put our faith in their accuracy, there’s something not quite real about them: My favorite statistic this year was Facebook’s claim that 75 million people watched at least a minute of Facebook Watch videos every day — though, as Facebook admitted, the 60 seconds in that one minute didn’t need to be watched consecutively. Real videos, real people, fake minutes. –NYMag

It’s all true: Everything is fake,” tweeted Pao, adding “Also mobile user counts are fake. No one has figured out how to count logged-out mobile users, as I learned at Reddit. Every time someone switches cell towers, it looks like another user and inflates company user metrics.” 

The New York Magazine article by Max Read goes much deeper, however, asserting; “The people are fake” , “The businesses are fake” , “The content is fake” , “Our politics are fake,” and finally “We ourselves are fake.”

Tell us how you really feel Max! 

For starters Read notes that “Studies generally suggest that, year after year, less than 60 percent of web traffic is human.” Some years, “a healthy majority of it is bot.” In fact, half of all YouTube traffic in 2013 was bots according to the Times

The internet has always played host in its dark corners to schools of catfish and embassies of Nigerian princes, but that darkness now pervades its every aspect: Everything that once seemed definitively and unquestionably real now seems slightly fake; everything that once seemed slightly fake now has the power and presence of the realNYMag

Also of interest, the Times found in their August investigation that there is a flourishing business buying clicks. In fact, one can buy 5,000 video clicks in 30-second increments – for as little as $15, with the traffic typically coming from bots or “click farms.”

So what constitutes “real” traffic, Read asks? 

If a Russian troll using a Brazilian man’s photograph to masquerade as an American Trump supporter watches a video on Facebook, is that view “real”? Not only do we have bots masquerading as humans and humans masquerading as other humans, but also sometimes humans masquerading as bots, pretending to be “artificial-intelligence personal assistants,” like Facebook’s “M,” in order to help tech companies appear to possess cutting-edge AI. We even have whatever CGI Instagram influencer Lil Miquela is: a fake human with a real body, a fake face, and real influence NYMag

Read the rest here – including Max Read’s thoughts on navigating a world of deep fakes,” bullshit propaganda which purports to “redpill” people to the “truth” of everything, and how utterly fake people have become.

Source: ZeroHedge

Pending Home Sales Crash 7.7%, Biggest Drop In Four Years

There was some hope for a rebound in US housing indicators, after the recent existing home sales print rebounded, but that was promptly dashed after pending home sales dropped again in November, sliding -0.7% vs the expected 1.0% increase, declining in six of the last eight months, with a cumulative loss since March of -5.9% (-8.9% annualized)…

https://www.zerohedge.com/sites/default/files/inline-images/pending%20home%20sales%20dec%202018.jpg?itok=Wcgsp9YWhttps://confoundedinterestnet.files.wordpress.com/2018/12/phsyoy770.png

…and crashed a whopping 7.7% compared to last year, the biggest annual drop since April 2014.

https://www.zerohedge.com/sites/default/files/inline-images/2018-12-28_7-13-03_0.jpg?itok=DCzMbfsY

This is the worst pending home sales print since June 2014.

https://www.zerohedge.com/sites/default/files/inline-images/pending%20home%20sales%202.jpg?itok=NxyhV0sh

Always eager to put lipstick on a pig, commenting on the collapse NAR chief economist Larry Yun said “the latest decline in contract signings implies more short-term pullback in the housing sector and does not yet capture the impact of recent favorable conditions of mortgage rates.”

Yun added that while pending contracts have reached their lowest mark since 2014, there is no reason to be overly concerned, and he predicts solid growth potential for the long-term.

Not everyone agrees: as Bloomberg notes, the poor results underscore the challenges as elevated prices and higher mortgage rates keep many  Americans on the sidelines of the housing market. Economists consider pending-home sales a leading indicator because they track contract signings; purchases of existing homes are tabulated when deals close, typically a month or two later.

Pending home sales fell in the Midwest and South, which both dropped more than 2 percent from the prior month, while the Northeast and West saw increases. At the same time, all four major regions sustained a drop when compared to one year ago, with the West taking the brunt of the decrease. “The West crawled back lightly, but is still experiencing the biggest annual decline among the regions because of unaffordable conditions,” Yun said.

Yun suggests that affordability challenges in the West are part of the blame for the drop in sales. Home prices in the West region have risen too much, too fast, according to Yun. “Land cost is expensive, and zoning regulations are too stringent. Therefore, local officials should consider ways to boost local supply; if not, they risk seeing population migrating to neighboring states and away from the West Coast.”

While the report doesn’t signal a dramatic collapse in housing, the recovery may have trouble gaining traction. Previously released NAR data showed purchases of previously owned houses rose for a secondstraight month and exceeded forecasts in November.

Finally, not even Larry could spin the report as bullish admitting that the latest government shutdown will harm the housing market. “Unlike past government shutdowns, with this present closure, flood insurance is not available. That means that roughly 40,000 homes per month may go unsold because purchasing a home requires flood insurance in those affected areas,” Yun said. “The longer the shutdown means fewer homes sold and slower economic growth.”

That said, he did leave off on a positive note, with Yun saying he believes that there are good longer-term prospects for home sales. “Home sales in 2018 look to close out the year with 5.3 million home sales, which would be similar to that experienced in the year 2000. But given the 17 million more jobs now compared to the turn of the century, the home sales are clearly under performing today. That also means there is steady longer-term growth potential.”

Source: ZeroHedge


C.A.R. Report: California Housing Market Sputtered In November

California Association Of Realtors Report, Absent Seasonal Adjustments

– Existing, single-family home sales totaled 381,400 in November on a seasonally adjusted annualized rate, down 3.9 percent from October and down 13.4 percent from November 2017.

– November’s statewide median home price was $554,760, down 3.0 percent from October and up 1.5 percent from November 2017.

– Statewide active listings rose for the eighth straight month, increasing 31 percent from the previous year.

– The statewide Unsold Inventory Index was 3.7 months in November, up from 3.6 months in October.

– As of November, year-to-date sales were down 4.6 percent.


LOS ANGELES (Dec. 18) – California home sales remained on a downward trend for the seventh consecutive month in November as prospective buyers continued to wait out the market, according to the CALIFORNIA ASSOCIATION OF REALTORS® (C.A.R.).  

Closed escrow sales of existing, single-family detached homes in California totaled a seasonally adjusted annualized rate of 381,400 units in November, according to information collected by C.A.R. from more than 90 local REALTOR® associations and MLS’ statewide. The statewide annualized sales figure represents what would be the total number of homes sold during 2018 if sales maintained the November pace throughout the year. It is adjusted to account for seasonal factors that typically influence home sales.

November’s sales figure was down 3.9 percent from the revised 397,060 level in October and down 13.4 percent from home sales in November 2017 of a revised 440,340. November marked the fourth month in a row that sales were below 400,000.

“While many home buyers continue to sit on the sidelines, serious buyers who are in a position to purchase should take advantage of this window of opportunity,” said C.A.R. President Jared Martin. “Now that interest rates have pulled back, home prices have tapered, and inventory has improved, home buyers’ prospects of getting into a home are more positive.”

The statewide median home price declined to $554,760 in November. The November statewide median price was down 3.0 percent from $572,000 in October and up 1.5 percent from a revised $546,820 in November 2017.

“The slowdown in price growth is occurring throughout the state, including regions that have strong economic fundamentals such as the San Francisco Bay Area,” said C.A.R. Senior Vice President and Chief Economist Leslie Appleton-Young. “The deceleration in home price appreciation should be a welcome sign for potential buyers who have struggled in recent years against low inventory and rapidly rising home prices.” 

Other key points from C.A.R.’s November 2018 resale housing report include:

  • On a region wide, non-seasonally adjusted basis, sales dropped double-digits on a year-over-year basis in the San Francisco Bay Area, the Central Coast, and the Southern California regions, while the Central Valley region experienced a relatively small sales dip of 3.9 percent.
  • Forty-one of the 51 counties reported by C.A.R. posted a sales decline in November with an average year-over-year sales decline of 16.8 percent. Twenty-six counties recorded double-digit sales drops on an annual basis.
  • Sales for the San Francisco Bay Area as a whole fell 11.5 percent from a year ago. All nine Bay Area counties recorded annual sales decreases, with Marin, San Francisco, San Mateo, and Sonoma counties posting double-digit annual declines.
  • The Los Angeles Metro region posted a year-over-year sales drop of 10.1 percent, as home sales fell 11.2 percent in Los Angeles County and 14.4 percent in Orange County.
  • Home sales in the Inland Empire decreased 6.7 percent from a year ago as Riverside and San Bernardino counties posted annual sales declines of 9.0 percent and 3.2 percent, respectively.
  • Home prices in the San Francisco Bay Area are no longer climbing at the double-digit pace that occurred throughout much of this year. On a year-over-year basis, the Bay Area median price ticked up 0.6 percent from November 2017. While home prices in Marin, San Francisco, San Mateo, and Santa Clara counties continued to remain above $1 million, all but San Mateo County recorded a year-over-year price decline.
  • Statewide active listings rose for the eighth consecutive month after nearly three straight years of declines, increasing 31 percent from the previous year. November’s listings increase was the largest since April 2014.
  • The unsold inventory index, which is a ratio of inventory over sales, increased year-to-year from 2.9 months in November 2017 to 3.7 months in November 2018. The index measures the number of months it would take to sell the supply of homes on the market at the current sales rate.
  • The median number of days it took to sell a California single-family home edged up from 22 days in November 2017 to 28 days in November 2018.
  • C.A.R.’s statewide sales price-to-list-price ratio* declined from a year ago at 98.9 percent in November 2017 to 97.9 percent in November 2018.
  • The average statewide price per square foot** for an existing, single-family home statewide was $282 in November 2018, up from $277 in November 2017.
  • The 30-year, fixed-mortgage interest rate averaged 4.87 percent in November, up from 3.92 percent in November 2017, according to Freddie Mac. The five-year, adjustable mortgage interest rate also increased in November to an average of 4.11 percent from 3.24 from November 2017.

Key Graphics (click links to open):

Note: The County MLS median price and sales data in the tables are generated from a survey of more than 90 associations of REALTORS® throughout the state and represent statistics of existing single-family detached homes only. County sales data are not adjusted to account for seasonal factors that can influence home sales. Movements in sales prices should not be interpreted as changes in the cost of a standard home. The median price is where half sold for more and half sold for less; medians are more typical than average prices, which are skewed by a relatively small share of transactions at either the lower-end or the upper-end. Median prices can be influenced by changes in cost, as well as changes in the characteristics and the size of homes sold. The change in median prices should not be construed as actual price changes in specific homes.

*Sales-to-list price ratio is an indicator that reflects the negotiation power of home buyers and home sellers under current market conditions. The ratio is calculated by dividing the final sales price of a property by its last list price and is expressed as a percentage.  A sales-to-list ratio with 100 percent or above suggests that the property sold for more than the list price, and a ratio below 100 percent indicates that the price sold below the asking price.

**Price per square foot is a measure commonly used by real estate agents and brokers to determine how much a square foot of space a buyer will pay for a property.  It is calculated as the sale price of the home divided by the number of finished square feet.  C.A.R. currently tracks price-per-square foot statistics for 50 counties.

Leading the way…® in California real estate for more than 110 years, the CALIFORNIA ASSOCIATION OF REALTORS® (www.car.org) is one of the largest state trade organizations in the United States with more than 190,000 members dedicated to the advancement of professionalism in real estate. C.A.R. is headquartered in Los Angeles.

# # #

November 2018 County Sales and Price Activity
(Regional and condo sales data not seasonally adjusted)

November 2018 Median Sold Price of Existing Single-Family Homes Sales
State/Region/County Nov.

2018

Oct.

2018

  Nov.

2017

  Price MTM% Chg Price YTY% Chg Sales MTM% Chg Sales YTY% Chg
Calif. Single-family home $554,760 $572,000   $546,820   -3.0% 1.5% -3.9% -13.4%
Calif. Condo/Townhome $465,770 $476,440   $451,250   -2.2% 3.2% -19.1% -17.4%
Los Angeles Metro Area $512,000 $516,000   $500,500   -0.8% 2.3% -14.0% -10.1%
Central Coast $672,500 $669,500   $685,000   0.4% -1.8% -15.9% -18.0%
Central Valley $320,000 $320,000   $310,000   0.0% 3.2% -11.7% -3.9%
Inland Empire $363,620 $359,000   $340,000   1.3% 6.9% -12.2% -6.7%
San Francisco Bay Area $905,000 $958,800   $900,000 r -5.6% 0.6% -12.7% -11.5%
                   
San Francisco Bay Area                  
Alameda $900,000 $900,000   $880,000   0.0% 2.3% -10.9% -6.7%
Contra Costa $641,000 $657,000   $615,000   -2.4% 4.2% -5.8% -8.0%
Marin $1,172,940 $1,450,000   $1,230,000   -19.1% -4.6% -25.7% -26.8%
Napa $683,500 $709,500   $682,000   -3.7% 0.2% -11.5% -6.1%
San Francisco $1,442,500 $1,600,000   $1,500,000   -9.8% -3.8% -14.0% -12.2%
San Mateo $1,500,000 $1,588,000   $1,486,000   -5.5% 0.9% -22.1% -13.7%
Santa Clara $1,250,000 $1,290,000   $1,282,500   -3.1% -2.5% -10.9% -9.9%
Solano $450,000 $430,000   $410,000   4.7% 9.8% -2.7% -3.6%
Sonoma $612,500 $650,000   $655,000   -5.8% -6.5% -25.5% -29.1%
Southern California                  
Los Angeles $553,940 $614,500   $530,920   -9.9% 4.3% -17.5% -11.2%
Orange $795,000 $810,000   $785,000   -1.9% 1.3% -7.5% -14.4%
Riverside $400,000 $400,000   $383,000   0.0% 4.4% -14.8% -9.0%
San Bernardino $299,450 $289,000   $280,000   3.6% 6.9% -8.0% -3.2%
San Diego $626,000 $635,500   $619,900   -1.5% 1.0% -8.4% -11.0%
Ventura $643,740 $650,000   $640,000   -1.0% 0.6% -18.8% -11.7%
Central Coast                  
Monterey $630,000 $620,000   $618,120   1.6% 1.9% -6.1% -11.2%
San Luis Obispo $624,000 $586,000   $615,000   6.5% 1.5% -14.4% -17.5%
Santa Barbara $550,000 $659,000   $742,000   -16.5% -25.9% -20.3% -18.8%
Santa Cruz $862,500 $885,000   $870,000   -2.5% -0.9% -24.0% -26.1%
Central Valley                  
Fresno $265,750 $272,000   $264,000   -2.3% 0.7% -6.4% -2.9%
Glenn $225,000 $253,000   $232,000   -11.1% -3.0% 12.5% -5.3%
Kern $235,250 $240,000   $235,000   -2.0% 0.1% -14.8% -1.8%
Kings $222,000 $229,000   $230,000   -3.1% -3.5% -3.4% 6.3%
Madera $265,000 $254,950   $245,000   3.9% 8.2% 2.1% -2.0%
Merced $261,930 $271,850 r $255,000   -3.6% 2.7% -22.5% -13.0%
Placer $461,000 $470,000   $450,000   -1.9% 2.4% -5.1% -13.6%
Sacramento $365,000 $360,000   $349,900   1.4% 4.3% -10.2% -7.1%
San Benito $583,200 $597,000   $649,880   -2.3% -10.3% -4.3% 10.0%
San Joaquin $365,000 $369,200   $360,500   -1.1% 1.2% -20.1% 17.5%
Stanislaus $310,000 $319,000   $298,750   -2.8% 3.8% -17.2% -9.2%
Tulare $237,400 $232,000   $215,000   2.3% 10.4% -16.2% -2.5%
Other Calif. Counties                  
Amador NA NA   $348,950   NA NA NA NA
Butte $326,940 $318,000   $315,000   2.8% 3.8% -7.1% 8.3%
Calaveras $325,000 $302,500   $318,000   7.4% 2.2% -33.6% -31.9%
Del Norte $250,000 $223,000   $214,000   12.1% 16.8% -20.0% -42.9%
El Dorado $461,750 $500,000   $470,000   -7.7% -1.8% -28.6% -27.5%
Humboldt $310,000 $315,000   $310,000   -1.6% 0.0% -24.0% 3.2%
Lake $255,000 $265,250   $262,000   -3.9% -2.7% -11.4% -23.5%
Lassen $184,000 $148,000   $189,000   24.3% -2.6% -40.0% -48.3%
Mariposa $355,000 $305,500   $250,000   16.2% 42.0% -12.5% 180.0%
Mendocino $414,000 $420,000   $374,500   -1.4% 10.5% -13.1% 6.0%
Mono $725,000 $599,900   $400,000   20.9% 81.3% -47.1% -35.7%
Nevada $399,000 $401,500   $405,750   -0.6% -1.7% -30.6% -13.9%
Plumas $289,500 $310,000   $302,000   -6.6% -4.1% -44.7% -42.2%
Shasta $283,000 $261,000   $250,000   8.4% 13.2% -17.2% 7.1%
Siskiyou $226,000 $181,500   $189,500   24.5% 19.3% -19.6% -15.9%
Sutter $296,000 $290,000   $270,000   2.1% 9.6% -16.9% -14.7%
Tehama $199,000 $233,250   $224,500   -14.7% -11.4% -38.1% -46.9%
Tuolumne $288,500 $304,000   $325,000   -5.1% -11.2% -15.4% -9.6%
Yolo $429,500 $443,750   $440,000   -3.2% -2.4% -12.5% -26.3%
Yuba $263,000 $282,000   $285,000   -6.7% -7.7% -1.3% 14.5%

r = revised
NA = not available

November 2018 County Unsold Inventory and Days on Market
(Regional and condo sales data not seasonally adjusted)

November 2018 Unsold Inventory Index Median Time on Market
State/Region/County Nov. 2018 Oct. 2018   Nov. 2017   Nov. 2018 Oct. 2018   Nov. 2017  
Calif. Single-family home 3.7 3.6   2.9   28.0 26.0   22.0  
Calif. Condo/Townhome 3.4 3.1   2.2   25.0 21.0   17.0  
Los Angeles Metro Area 4.2 4.0 3.3   32.0 30.0   27.0  
Central Coast 4.4 4.1   3.4   34.0 30.0   30.0  
Central Valley 3.3 3.3   2.9   25.0 21.0   18.0  
Inland Empire 4.7 4.3   3.9   37.0 35.0   31.0  
San Francisco Bay Area 2.3 2.5   1.5   23.0 19.0   15.0  
                     
San Francisco Bay Area                    
Alameda 1.9 2.1   1.2   17.0 15.0   13.0  
Contra Costa 2.2 2.6   1.7   19.0 16.0   14.0  
Marin 3.0 3.0   1.6   35.0 22.0   36.0  
Napa 4.6 5.0   3.8   49.0 41.0   57.5  
San Francisco 1.7 1.9   1.1   16.5 15.0   16.0  
San Mateo 1.9 1.9   1.2   16.0 12.0   12.0  
Santa Clara 2.1 2.4   1.2   18.0 14.0   9.0  
Solano 3.0 3.4   2.4   41.0 39.0   32.5  
Sonoma 3.8 3.3   1.7   49.0 47.5   44.0  
Southern California                    
Los Angeles 3.9 3.7   2.9   27.0 25.0   22.0 r
Orange 3.9 4.1   2.8   28.0 29.0   24.0  
Riverside 4.9 4.3   3.9   36.0 34.0   29.0  
San Bernardino 4.3 4.3   3.9   42.0 35.0   34.0  
San Diego 3.9 3.9   2.7   22.0 24.0   17.0  
Ventura 5.4 5.1   4.4   53.0 51.0   51.0  
Central Coast                    
Monterey 4.3 4.4   3.8   25.0 25.0   28.0  
San Luis Obispo 4.6 4.3   3.7   40.0 29.0   30.0  
Santa Barbara 5.2 4.5   3.7   41.0 40.0   35.0  
Santa Cruz 3.2 3.1   2.2   30.5 21.0   22.5  
Central Valley                    
Fresno 3.5 3.6 r 3.0   19.0 19.0   18.0  
Glenn 4.8 4.9   3.8   73.5 22.5   45.0  
Kern 3.1 2.9   3.3   26.0 21.0   25.0  
Kings 3.5 3.8   3.5   23.5 26.0   16.0  
Madera 5.1 5.7 r 4.4 r 34.0 30.0   28.0  
Merced 4.8 3.7   3.6   23.0 22.0   25.0  
Placer 3.0 3.4   2.3   27.0 25.0   17.0  
Sacramento 2.7 2.8   2.3   24.0 19.0   17.0  
San Benito 3.1 3.6   4.1   41.5 23.0   23.5  
San Joaquin 3.6 3.1   2.9   24.0 22.0   14.0  
Stanislaus 3.3 3.1   2.6   25.0 21.0   18.0  
Tulare 4.1 3.6   3.9   35.0 28.0   29.5  
Other Counties in California                    
Amador NA NA   5.4   NA NA   69.0  
Butte 2.9 3.3   2.8   24.0 21.0   18.0  
Calaveras 6.5 4.7   4.3   53.0 43.5   60.0  
Del Norte 5.6 5.0   4.0   110.0 95.0   111.0  
El Dorado 4.4 3.6   2.7   41.5 48.0   40.0  
Humboldt 5.8 4.9   5.3   24.5 27.0   28.0  
Lake 7.0 6.7   4.7   60.5 51.0   54.0  
Lassen 8.6 6.1   5.0   110.0 109.0   85.0  
Mariposa 4.8 4.6   12.2   147.0 24.0   6.0  
Mendocino 7.9 7.3   5.7   66.0 87.0   63.5  
Mono 8.4 4.8   4.9   127.0 115.0   153.5  
Nevada 5.7 4.3   3.9   41.0 40.5   33.0  
Plumas 9.8 6.1   5.1   152.0 87.0   143.0  
Shasta 4.4 3.9   4.3   26.5 34.5   33.0  
Siskiyou 7.1 6.6   5.5   60.5 20.0   60.5  
Sutter 2.9 3.1   3.0   29.5 34.0   32.0  
Tehama 9.2 5.4   4.0   49.5 48.5   63.0  
Tuolumne 5.8 5.6   3.9   58.5 47.0   42.0  
Yolo 3.7 3.7   1.9   27.0 22.0   22.0  
Yuba 2.9 3.0   3.4   30.0 33.0   17.0  

r = revised
NA = not available

Source: California Association Of Realtors

“Residents Should Not Panic”: Thousands Of Las Vegas Homes Get ZERO Offers For November

New data published by the Greater Las Vegas Association of Realtors shows 10,000 single-family homes were on the market and by the end of November, 7,000 of those homes had zero offers, up 54% compared to 2017 and the highest number of homes in Las Vegas Valley to not get a bid in more than two years.

https://www.zerohedge.com/sites/default/files/inline-images/inventory%20.png?itok=7jkuP9Nl

Realtors are warning Las Vegas residents that they should not panic.

However, it is becoming increasingly clear that the real estate market is at a turning point, in one of the most overvalued markets in the country.

https://www.zerohedge.com/sites/default/files/inline-images/price%20chart%20real%20estate%20.png?itok=S2ZuaoVh

https://i0.wp.com/s3.amazonaws.com/glvar-photos/avatars/main/495/CROPPED-Keith_lynam_2013.jpg

“I mean that’s still crazy fast for markets across this country,” said Nevada Realtors newly elected president, Keith Lynam.

“Are we as fast as we were six months ago? No, but we couldn’t sustain that, it was not sustainable, it was never going to be sustainable. So we’re back to pretty much a normal market.”

Lynam has recognized the shift in the market and suggested a slowdown in the quarters ahead: He predicts homes will now average four to six months on the market into 2019. Before, Lynam said homes were on the market between 2.5 to 3 weeks.

While thousands of homes are going no bid in November, some homes are still selling, but not as often as they used to, a sign that the housing market is headed for trouble. Buyers acquired about 2,300 houses in November, down 12% from November 2017, the Greater Las Vegas Association of Realtors (GLVAR) reported.

The pullback in demand could be linked to fast-rising home prices, higher borrowing costs, and an affordability crisis.

Home prices were up “13.5% year-over-year in September, more than double the national rate,” according to the latest S&P CoreLogic Case-Shiller index. Nevada’s growth rate was the fastest among all other cities in the CoreLogic Case-Shiller index for the fourth straight month, a move that is not sustainable. 

In the last several months, sellers have responded with more price cuts. 

This is right in line to Bank of America’s forecast in September: Existing home sales have peaked, reflecting declining affordability, greater price reductions and deteriorating housing sentiment.

https://www.zerohedge.com/sites/default/files/inline-images/price%20cuts.png?itok=YLGKGwQK

This year’s housing market slowdown has hit the hottest markets like San Diego, San Francisco, Seattle, Denver, and New York City.

The slowdown is now spreading into less expensive markets—Tampa, Philadelphia, Phoenix, and Las Vegas. 

Las Vegas was “the poster child of the housing crash in 2008,” said Vivek Sah, director of the LIED Institute for Real Estate Studies at the University of Nevada, Las Vegas.

“There are some buyers who are not pulling the trigger because of that.”

The deceleration in less expensive housing markets like Las Vegas, suggests that the slowdown is now broad base and the entire US economy is headed for trouble in 2019.

Source: ZeroHedge

Over 150 People Move Out Of Chicago Every Day

With its nation-leading murder rate, lake-effect weather, endemic corruption and financial mismanagement, who really wants to live in Chicago? Well, the data is in, and as Mayor Rahm Emmanuel prepares to hand power to a new administration next year, his legacy – already marred by the above-mentioned scourges – has accrued another ignominious distinction. According to Census data analyzed by Bloomberg, Chicago experienced the highest daily net migration in the US, losing 156 residents a day (strictly due to migration, not murder) a day in 2017.

After Chicago, Los Angeles came second with 128, followed by New York with 132.

On the other side of that coin were cities across the US sun belt, like Dallas (No. 1, with 246 net incoming), followed by Phoenix (with 174) and Atlanta (No. 3 with 147).

https://www.zerohedge.com/sites/default/files/inline-images/2018.12.14tripledigits.JPG?itok=2ikoSSfuhttps://www.zerohedge.com/sites/default/files/inline-images/2018.12.14bbgtwo.JPG?itok=NGSUAKFp

In terms of total net migration for the year, the tallies differed only slightly. While the sun belt was the biggest beneficiary of Americans’ growing preference for sunnier weather, lower rents and plentiful job opportunities…

Dallas was the greatest beneficiary of this domestic migration, adding nearly 59,000 domestic movers in 2017, followed by Phoenix (51,000) and Tampa (41,000), which serve as anchors for the western and southern regions that got the bulk of the gains.

…some of America’s largest cities saw net outflows as rising rents, crumbling (or inadequate) public infrastructure. The city with the biggest outflow was NYC, followed by Los Angeles and – in third place – beautiful Bridgeport, Conn.

On the flip side, more than 208,000 residents left the New York City metropolitan area last year. This was nearly twice as many as the second biggest loser, Los Angeles, which had a decline of nearly 110,000. Chicago fell by 85,000. Honolulu, San Jose, New York and Bridgeport, CT lost the highest shares of their residents to other parts of the country.

In Chicago, New York and Los Angeles, the three areas with a triple-digit daily exodus, people are fleeing at a greater rate than just a few years earlier. Soaring home prices and high local taxes are pushing local residents out and scaring off potential movers from other parts of the country.

But maybe if Emmanuel’s successor can successfully implement the outgoing mayor’s plans for a city wide UBI (which we imagine would go a long way toward offsetting its hated ‘amusement tax’ and other levies needed to pay off the city’s brutal debt burden), maybe he can bribe residents into staying.

Source: ZeroHedge

The Bond Market Has Frozen: For The First Month Since 2008, Not A Single Junk Bond Prices

Late last week, we reported that in the aftermath of a dramatic drop in loan prices, a record outflow from loan funds, and a general collapse in investor sentiment that was euphoric as recently as the start of October, the wheels had come off the loan market which was on the verge of freezing after we got the first hung bridge loan in years, after Wells Fargo and Barclays took the rare step of keeping a $415 million leveraged loan on their books after failing to sell it to investors.

https://www.zerohedge.com/sites/default/files/inline-images/levloan%20index%2012.13.jpg

The two banks now “plan” to wait until January – i.e., hope that yield chasing desperation returns – to offload the loan they made to help finance Blackstone’s buyout of Ulterra Drilling Technologies, a company that makes bits for oil and gas drilling.

The reason the banks were stuck with hundreds of millions in unwanted paper is because they had agreed to finance the bridge loan whether or not there was enough demand from investors, as the acquisition needed to close by the end of the year. The delayed transaction means the banks will have to bear the risk of the price of the loans falling further, as well as costs associated with holding loans on their books.

The pulled Ulterra deal wasn’t alone.

As ZeroHedge reported previously, in Europe the market appears to have already locked up, as three loans were scrapped over the last two weeks. To wit, movie theater chain Vue International withdrew a 833 million pound-equivalent ($1.07 billion) loan sale. While the deal was meant to mostly refinance existing debt, around 100 million pounds was underwritten to finance the company’s acquisition of German group CineStar.

More deals were pulled the prior week when diversified manufacturer Jason Inc. became at least the fourth issuer to scrap a U.S. leveraged loan. Additionally, Perimeter Solutions also pulled its repricing attempt, Ta Chen International scrapped a $250MM term loan set to finance the company’s purchase of a rolling mill, and Algoma Steel withdrew its $300m exit financing. Global University System in November also dropped its dollar repricing.

Today, the FT picks up on the fact that the junk bond market – whether in loans or bonds – has frozen up, and reported that US credit markets have “ground to a halt” with fund managers refusing to fund buyouts and investors shunning high-yield bond sales as rising interest rates and market volatility weigh on sentiment (ironically it is the rising rates that assure lower rates as financial conditions tighten and the Fed is forced to resume easing in the coming year, that has been a major hurdle to floating-rate loan demand as the same higher rates that pushed demand for paper to all time highs are set to reverse).

Meanwhile, things are even worse in the bond market, where not a single company has borrowed money through the $1.2tn US high-yield corporate bond market this month according to the FT. If that freeze continues until the end of the month, it would be the first month since November 2008 that not a single high-yield bond priced in the market, according to data providers Informa and Dealogic.

Separately, as we already reported, the FT notes that in the loan market at least two deals – including the Barclays/Wells bridge loan – were postponed and could be the first of several transactions pulled from the market this year, bankers and investors said, as mutual funds and managers of collateralised loan obligations — the largest buyer by far in the leveraged loan sector — wait out the uncertainty.

https://www.zerohedge.com/sites/default/files/inline-images/CLO%20dec.jpg?itok=Zhenh08L

“This is clearly more than year-end jitters,” said Guy LeBas, a strategist at Janney Montgomery Scott. “What we’re seeing now is pretty typical for end-of-credit-cycle behaviour.”

A prolonged period of low interest rates since the financial crisis a decade ago has seen companies binge on cheap debt. However, as financial conditions have tightened, the high level of corporate leverage has raised widespread concern among regulators, analysts and investors.

In the loan market, it’s not a total disaster just yet, because even as prices have slumped over the past two months, banks that committed to finance highly leveraged buyouts – including JPMorgan Chase and Goldman Sachs –  have offered loans at substantial discounts to entice investors. As the chart below shows, the average new issue yield by month has exploded to the highest in years, with CCC-rated issuers forced to pay the most in 7 years to round up investor demand.

https://www.zerohedge.com/sites/default/files/inline-images/new%20issue%20yields.jpg?itok=VCSjIuLD

Still, as the following table from Bank of America shows, quite a few deals have priced, if only in the loan market:

https://www.zerohedge.com/sites/default/files/inline-images/loan%20issuance.jpg?itok=bafJsKvo(Click image to enlarge)

Even so, other banks including Barclays, Deutsche Bank, UBS and Wells Fargo, have had to pull deals altogether as they just couldn’t find enough buyers no matter how generous the concessions.

In addition to the Ulterra deal, technology services provider ConvergeOne postponed a $1.3bn leveraged loan offering that backed its takeover by private equity group CVC last week. As the FT notes, Deutsche Bank and UBS had marketed the deal to investors in a package that included senior and subordinated loans, with the junior debt expected to yield as much as 12 per cent in November when prices were first floated. While the banks attracted some bids for the debt, orders failed to surpass the overall size of the deal, which was postponed to the new year, according to people with knowledge of the transaction.

Why delaying deals into 2019? One word: hope.

One person familiar with the deal said the banks would market the loans again in January, when they hope market conditions will improve, and that other leveraged loans being marketed could be postponed to 2019.

The trouble lenders have faced in the leveraged loan market has mirrored the exasperation felt by investors in other asset classes. Higher-quality investment-grade bonds have also sold off, with a number of planned deals pulled from the market in recent weeks.

That said, for now the junk bond freeze and loan indigestion has remained confined to lower-rated issuers. However, that may change too, and should the “Ice-9” spread to the high-grade sector, where the bulk of issuance is to fund buybacks and M&A, that’s when the real pain begins.

Source: ZeroHedge

Home Builder Optimism Collapses

Upton Sinclair once noted: “It is difficult to get a man to understand something, when his salary depends on his not understanding it.”

But at some point, as Mike Tyson opined “someone punches you in the face.”

And it appears from the latest NAHB Sentiment Index that home builders in America just got ‘punched in the face’.

For the second month in a row, home builder optimism crashed amid broad-based declines across sales, expectations and buyer traffic (down 4 to 56 and well below the 60 print expected) as hope begins to collapse back to the housing market’s reality…

https://www.zerohedge.com/sites/default/files/inline-images/2018-12-17_7-04-59.jpg?itok=tCr_ZLGf

Additionally, as Bloomberg notes, a gauge of the NAHB six-month sales outlook dropped to the lowest since March 2016 while a measure of current sales for single-family homes decreased to a three-year low. That suggests demand will remain soft as there’s still a shortage of affordably-priced listings, in addition to property values that have been outpacing wage gains.

Three of four geographic regions showed a decline, led by the Northeast, where sentiment plunged by the most since June 2010.

“We are hearing from builders that consumer demand exists, but that customers are hesitating to make a purchase because of rising home costs,” NAHB Chairman Randy Noel, a custom-home builder from Louisiana, said in a statement.

“However, recent declines in mortgage interest rates should help move the market forward in early 2019.”

All eyes on Powell once again.

Source: ZeroHedge

US Federal Reserve Bank’s Net Worth Turns Negative, They’re Insolvent, A Zombie Bank, That’s All Folks

While the Fed has been engaging in quantitative tightening for over a year now in an attempt to shrink its asset holdings, it still has over $4.1 trillion in bonds on its balance sheet, and as a result of the spike in yields since last summer, their massive portfolio has suffered substantial paper losses which according to the Fed’s latest quarterly financial report, hit a record $66.453 billion in the third quarter, raising questions about their strategy at a politically charged moment for the central bank, whose “independence” has been put increasingly into question as a result of relentless badgering by Donald Trump.

https://www.zerohedge.com/sites/default/files/inline-images/Fed%20P%26L%20dec%202018.jpg?itok=DRsSjcAj

What immediately caught the attention of financial analysts is that the gaping Q3 loss of over $66 billion, dwarfed the Fed’s $39.1 billion in capital, leaving the US central bank with a negative net worth…

https://www.zerohedge.com/sites/default/files/inline-images/Fed%20BS%2012.12.jpg?itok=f5WkIqu4

… which would suggest insolvency for any ordinary company, but since the Fed gets to print its own money, it is of course anything but an ordinary company as Bloomberg quips.

It’s not just the fact that the US central bank prints the world’s reserve currency, but that it also does not mark its holdings to market. As a result, Fed officials usually play down the significance of the theoretical losses and say they won’t affect the ability of what they call “a unique non-profit entity’’ to carry out monetary policy or remit profits to the Treasury Department. Indeed, confirming this the Fed handed over $51.6 billion to the Treasury in the first nine months of the year.

The risk, however, is that should the Fed’s finances continue to deteriorate if only on paper, it could impair its standing with Congress and the public when it is already under attack from President Donald Trump as being a bigger problem than trade foe China.

Commenting on the Fed’s paper losses, former Fed Governor Kevin Warsh told Bloomberg that “a central bank with a negative net worth matters not in theory. But in practice, it runs the risk of chipping away at Fed credibility, its most powerful asset.’’

Additionally, the growing unrealized losses provide fuel to critics of the Fed’s QE and the monetary operating framework underpinning them, just as central bankers begin discussing the future of its balance sheet. And, as Bloomberg cautions, the metaphoric red ink also could make it politically more difficult for the Fed to resume QE if the economy turns down.

“We’re seeing the downside risk of unconventional monetary policy,’’ said Andy Barr, the outgoing chairman of the monetary policy and trade subcommittee of the House Financial Services panel. “The burden should be on them to tell us why this does not compromise their credibility and why the public and Congress should not be concerned about their solvency.’’

Of course, the culprit for the record loss is not so much the holdings, as the impact on bond prices as a result of rising rates which spiked in the summer as a result of the Fed’s own overoptimism on the economy, and which closed the third quarter at 3.10% on the 10Y Treasury. Indeed, with rates rising slower in the second quarter, the loss for Q3 was a more modest $19.6 billion.

And with yields tumbling in the fourth quarter as a result of the current growth and markets scare, it is likely that the Fed could book a major “profit” for the fourth quarter as the 10Y yield is now trading just barely above the 2.86% where it was on June 30.

Meanwhile, the Fed continues to shrink its bond holdings by a maximum of $50 billion per month, an amount that was hit on October 1, not by selling them, which could force it to recognize but by opting not to reinvest some of the proceeds of securities as they mature.

The Fed is expected to continue shrinking its balance sheet at rate of $50BN / month until the end of 2020 (as shown below) unless of course market stress forces the Fed to halt QT well in advance of its tentative conclusion.

https://www.zerohedge.com/sites/default/files/inline-images/Fed%20Soma%20Nov%202018_1.jpg?itok=i1IAr1B1

In any case, the Fed will certainly never return to its far leaner balance sheet from before the crisis, which means that it will continue to indefinitely pay banks interest on the excess reserves they park at the Fed, with many of the recipient banks being foreign entities.

Barr, a Kentucky Republican, has accurately criticized that as a subsidy for the banks, one which will amount to tens of billions in annual “earnings” from the Fed, the higher the IOER rate goes up. He is not alone: so too has California Democrat Maxine Waters, who will take over as chair of the House Financial Services Committee in January following her party’s victory in the November congressional elections.

* * *

Going back to the Fed’s unique treatment of losses on its income statement and its under capitalization, in an Aug. 13 note, Fed officials Brian Bonis, Lauren Fiesthumel and Jamie Noonan defended the central bank’s decision not to follow GAAP in valuing its portfolio. Not only is the central bank a unique creation of Congress, it intends to hold its bonds to maturity, they wrote.

Under GAAP, an institution is required to report trading securities and those available for sale at fair or market value, rather than at face value. The Fed reports its balance-sheet holdings at face value.

The Fed is far less cautious with the treatment of its “profits”, which it regularly hands over to the Treasury: the interest income on its bonds was $80.2 billion in 2017. The central bank turns a profit on its portfolio because it doesn’t pay interest on one of its biggest liabilities – $1.7 trillion in currency outstanding.

The Fed’s unique financial treatments also extends to Congress, which while limiting to $6.8 billion the amount of profits that the Fed can retain to boost its capital has also repeatedly “raided” the Fed’s capital to pay for various government programs, including $19 billion in 2015 for spending on highways.

Still, a negative net worth is sure to raise eyebrows especially after Janet Yellen said in December 2015 that “capital is something that I believe enhances the credibility and confidence in the central bank.”

* * *

Furthermore, as Bloomberg adds, if it had to the Fed could easily operate with negative net worth – as it is doing now – like other central banks in Chile, the Czech Republic and elsewhere have done, according to Nathan Sheets, chief economist at PGIM Fixed Income. That said, questionable Fed finances pose communications and mostly political problems for Fed policymakers.

As for long-time Fed critic and former Fed governor, Kevin Warsh, he zeroed in on the potential impact on quantitative easing.

“QE works predominantly through its signaling to financial markets,’’ he said. “If Fed credibility is diminished for any reason — by misunderstanding the state of the economy, under-estimating the power of QE’s unwind or carrying a persistent negative net worth — QE efficacy is diminished.’’

The biggest irony, of course, is that the more “successful” the Fed is in raising rates – and pushing bond prices lower – the greater the un-booked losses on its bond holdings will become; should they become great enough to invite constant Congressional oversight, the casualty may be none other than the equity market, which owes all of its gains since 2009 to the Federal Reserve.

While a central bank can operate with negative net worth, such a condition could have political consequences, Tobias Adrian, financial markets chief at the IMF said. “An institution with negative equity is not confidence-instilling,’’ he told a Washington conference on Nov. 15. “The perception might be quite destabilizing at some point.”

That point will likely come some time during the next two years as the acrimonious relationship between Trump and Fed Chair Jerome Powell devolves further, at which point the culprit by design, for what would be the biggest market crash in history will be not the Fed – which in the past decade blew the biggest asset bubble in history – but President Trump himself.

Source: ZeroHedge

***

Diagnosing What Ails The Market

https://macromon.files.wordpress.com/2018/12/Yields_SP.png


USA Inc., Reports Biggest Ever Budget Deficit For November

Two months after the US Treasury reported the widest annual deficit in six years for fiscal 2018, moments ago the US posted the biggest November budget deficit on record as total government spending came in twice as much as revenue.

November outlays surged 18.4% to $411 billion last month from $347 billion a year ago, while receipts actually declined 1% to $206 billion from $208 billion in 2017, the Treasury Department said in a monthly report on Thursday. The biggest spending categories were Social Security ($84BN), Medicare ($77BN), National Defense ($62BN), Income security ($46BN) and Health ($42BN). Net interest on the US debt of nearly $22 trillion came in at a hefty $33BN. Meanwhile, Individual Income Taxes and Social Security Taxes both generated $93BN in income each.

https://www.zerohedge.com/sites/default/files/inline-images/Nov%202018%20statement.jpg?itok=Xu-5wERJ

The result was a November deficit of $205 billion, a 48% increase from the $139 billion shortfall a year earlier, and the biggest November deficit on record.

https://www.zerohedge.com/sites/default/files/inline-images/Nov%202018%20deficit.jpg?itok=y98W6Bux

For the first two months of the fiscal year which began Oct. 1, the deficit widened to $305.4 billion, up 50% compared with $201.8 billion the same period a year earlier.

On a LTM basis, the US deficit has more than doubled from the $405BN it hit in February 2016 to $883BN as of the 12 months ended November. It was the second highest LTM number since early 2013.

https://www.zerohedge.com/sites/default/files/inline-images/Nov%202018%20LTM%20deficit.jpg?itok=apAAmAay

In Fiscal 2018, the first full year of Donald Trump’s presidency in which he enacted a tax-cut package and enacted a $1+ trillion stimulus, the U.S. ran the largest deficit in six years. The various spending programs and tax cuts have added to the growing federal deficit, which is expected to hit $1 trillion some time in fiscal 2019, one year sooner than disclosed in the CBO’s most recent forecast ; in April the agency didn’t expect the deficit to reach $1 trillion until 2020.

Then again, over the long run none of this matters…

https://www.zerohedge.com/sites/default/files/inline-images/jpm%20debt%20cbo%20forecast_1.jpg

Spirits lost in a material world

Source: ZeroHedge

“Canary In The Coal Mine”: House Flipping Returns Crash To Six-Year Low

Real-estate speculation has long been a characteristic of booming housing markets, and in this current cycle of artificially suppressed rates, investors have been furiously flipping homes which peaked in the first few months of 2018. The number of companies flipping houses also hit a decade high, as HGTV programming and house flipping seminars across the country suckered in the broad base of the American people. 

Now the house flipping industry has gone bust, and many investors are left holding the bag. Flipping dropped for the third consecutive quarter, due to mortgage rate increases, according to Attom Data Solutions. At the same time, the average return on investment crashed to a six-year low.

“A total of 45,901 single-family homes and condos were flipped in 3Q18, signaling a 12% drop from a year ago to a 3.5-year low from the first quarter of 2015. Houses flipped sold for an average of $63,000 more than what the home flipper purchased them for, down from the all-time high of $68,000 achieved in the first quarter and from $65,000 a year ago,” said Attom Data Solutions.

https://www.zerohedge.com/sites/default/files/inline-images/flip.png?itok=63Zy1m4r

The gross flipping profit in 3Q18 was about 42.6% ROI, the lowest level seen since the first quarter of 2012. Despite the recent market plateau, some flippers are finding it unprofitable in the current market environment.

With home price appreciation stalling, many flippers have started to notice margin compression and to make matters worse, President Trump’s tariffs have made the cost of materials just that more expensive.

The amount of flipped homes purchased with financing held steady at 38.8% in the third quarter, down from 39.2% a year ago and 40.7% the previous quarter.

“Home flipping acts as a canary in the coal mine for a cooling housing market because the high velocity of transactions provides home flippers with some of the best and most real-time data on how the market is trending,” Daren Blomquist, senior vice president at Attom, said in a press release.

We’ve now seen three consecutive quarters with year-over-year decreases in home flips. The last time that happened was in 2014 following the mortgage rate jump in the second half of 2013, but it’s still far from the 11 consecutive quarters with year-over-year decreases in home flips extending from 2Q 2006 through 4Q 2008 and leading up to the last housing crash,” he said.

Total houses flipped in the third quarter represented 5% of all single-family homes and condos sold in that quarter – the lowest reading in more than two years. The flipping rate declined from 5.1% a year ago and 5.2% from the previous quarter.

It also seems the popularity of “how to flip a house” in Google Search across the US peaked in 2017 and has since stalled.

https://www.zerohedge.com/sites/default/files/inline-images/google%20trends.png?itok=nGLqD1jo

Source: ZeroHedge

Australia Warned To Prepare For “Severe Housing Collapse” And “Banking Crisis”

Just weeks after ZeroHedge noted that Australia’s household debt to income ratio has ballooned to shocking levels over the past three decades as Sydney is ranked as one of the most overvalued cities in the world, Australia’s regulators have been warned to prepare “contingency plans for a severe collapse in the housing market” that could lead to a “crisis situation” in one or more financial institutions.

https://www.zerohedge.com/sites/default/files/inline-images/4F0EFB8500000578-6053367-image-a-50_1534137161804-1_0.jpg?itok=X9A7DJcz

Australia has transitioned from the lowest household debt-to-income ratio to the highest in the world, in just three decades.

https://www.zerohedge.com/sites/default/files/inline-images/Home-prices-global-Oct-18_0.jpg?itok=SQNAVQfs

And now Australia’s News.com.au reports that The Organisation for Economic Co-operation and Development’s (OECD) latest in-depth assessment of Australia maintains that while the “current trajectory” of house price declines “would suggest a soft landing… some risk of a hard landing remains.”

https://www.zerohedge.com/sites/default/files/inline-images/Australia-home-prices-Sydney-2018-08-01_0.png?itok=fUj7l3I2

Wage stagnation and elevated home prices have turned into the perfect storm that will bring forward a housing crisis.

The Paris-based global forum recommends the Aussie Reserve Bank begin raising the cash rate from its record low as soon as possible to prevent “imbalances accumulating further”.

The RBA last cut the cash rate to 1.5 per cent in August 2016, following an earlier cut to 1.75 per cent in May. There has not been an official cash rate increase since November 2010.

Australia’s housing market is a source of vulnerabilities due to elevated prices and related household debt. A direct hit to the financial sector from a wave of mortgage defaults is unlikely,” the report says.

“However, if house prices collapse consumer spending could suffer, via negative impact on wealth, including from exposures to bank shares, which would encourage deleveraging. Together with reduced housing-related expenditures, this would put pressure on the whole economy.”

Additionally, News.com reports that while describing the housing market slowdown as “welcome” after a period where prices were overvalued by 5 to 15 per cent and noting current evidence pointed to a soft landing, the OECD said its research in the past “has found soft landings are rare”.

The OECD report recommends contingency plans in the form of “a loss-absorbing regime in the case of financial-institution insolvency”, including controversial “bail-in provisions”.

“… the possibility of financial-institution crisis should not be discounted entirely.”

Finally, the OECD notes, unlike in the US or EU, the law does not include provisions that would automatically convert some unsecured senior bonds and deposits from other banks into equity in the event of a crisis

 “The absence of explicit bail-in provisions could slow down the speed of resolution and risk encouraging financial institutions to gamble for resuscitation.”

Notably, OECD’s ominous warnings come after RBA deputy governor Guy Debelle raised alarms (after Q3 GDP dramatically undershot expectations at just 2.8%) by suggesting the next move in rates could be down, not up, and floated the possibility of controversial money printing policies known as quantitative easing in the event of a crisis.

As John Rubino recently noted, for the past few years, homeowners just about everywhere have been able to finesse life’s problems by thinking “at least my house is going up.”… But now that’s ending, and a reverse wealth effect is kicking in. Homeowners are seeing their home equity – aka their net worth – stop growing and in some cases drop by shocking amounts. In Australia it’s $1,000 a week, which is enough to darken the mood of pretty much anyone not in the 1%. A consumer with a dark mood is an unenthusiastic shopper because new debt accelerates the decline in net worth.

As home prices fall, so therefore does “discretionary” spending. Australians will continue to eat and to air condition their bedrooms, but they’ll cut way back on vacations, new cars, etc. And the debt-based part of the economy will suffer. This will cause stock prices to fall, knocking another leg out from under the average citizen’s net worth and making them even less likely to splurge. And so on.

Credit-bubble capitalism depends on mood, which makes it fragile. That fragility is about to be on full display pretty much everywhere.

Source: ZeroHedge

Credit “Death Spiral” Accelerates As Loan ETF Sees Record Outflow, Primary Market Freezes

One week after even the IMF joined the chorus of warnings sounding the alarm over the unconstrained, unregulated growth of leveraged loans, and which as of November included the Fed, BIS, JPMorgan, Guggenheim, Jeff Gundlach, Howard Marks and countless others, we reported that investors had finally also joined the bandwagon and are now fleeing an ETF tracking an index of low-grade debt as credit spreads blow out and cracks appeared across virtually all credit products.

Specifically, we noted that not only had the $6.4 billion Invesco BKLN Senior Loan ETF seen seven straight days of outflows to close out November, with investors pulling $129 million in one day alone and reducing the fund’s assets by 2% to the lowest level in more than two years, but over 800 million has been pulled in last current month, the biggest monthly outflow ever as investors are packing it in.

https://www.zerohedge.com/sites/default/files/inline-images/bkln%20loan.jpg

Fast forward to today, when another major loan ETF, the Blackstone $2.9BN leverage-loan ETF, SRLN, just suffered its largest ever one-day outflow since its 2013 inception.

https://www.zerohedge.com/sites/default/files/inline-images/SRLN%20dec%20v%202018.jpg?itok=FU8x72Fm

Year to date, the shares of this ETF backed by the risky debt have dropped 2.6%, hitting their lowest level since February 2016; the ETF’s underlying benchmark, the S&P/LSTA Leveraged Loan Index, has also been hit recently and is down 2.3% YTD, effectively wiping out all the cash interest carry generated YTD and then some.

https://www.zerohedge.com/sites/default/files/inline-images/srln%2012.7.2018.jpg?itok=93ymkOSL

BLKN and SRLN aren’t alone: investors have pulled over $4 billion from leveraged loan funds in the three weeks ended Dec. 5, the largest cash bleed in almost four years for such a period, according to Lipper data.

https://www.zerohedge.com/sites/default/files/inline-images/Lev%20loan%20outflows%2012.7.jpg?itok=jp4pwY7v

“The price action in the ETF hasn’t warranted investors to justify keeping it on to collect the monthly coupon it pays,” said Mohit Bajaj, director of exchange-traded funds at WallachBeth Capital. “The risk/reward hasn’t been there compared to short-term treasury products like JPST,” he added, referring to the $4.2 billion JPMorgan Ultra-Short Income ETF, which hasn’t seen a daily outflow since April 9.

Analysts have pointed to widening credit spreads and the fact that loan ETFs have floating-rate underlying instruments, assets that become less attractive than fixed-rate ones should the Fed skip its March rate hike, which after Powell’s latest dovish turn and today’s weak payrolls may – or may not – happen.

The ongoing loan ETF puke comes at a time when both US investment grade and junk bond spreads have blown out, while yields spiked to a 30-month high this month. In November, investment grade bonds suffered their worst year in terms of total returns since 2008 and December isn’t looking much better. Meanwhile in high yield, junk bonds yields just had their biggest one-day jump since April.

https://www.zerohedge.com/sites/default/files/inline-images/IG%20vs%20HY%2012.7.jpg?itok=Y3rIc4KA

According to a note from Citi strategists Michael Anderson and Philip Dobrinov, leveraged loans in the U.S. may no longer be the “star performer” amid a potential pause in rate hikes by the Fed, while the recent redemption scramble has caused ETFs to offload better quality loans to raise cash, according to the Citi duo. That’s despite leveraged loan issuance being at its highest since 2008 largely as a result of insatiable CLO demand.

If investors are, indeed, unloading to raise cash, Anderson and Dobrinov write “this is a bearish sign, particularly if outflows persist and managers eventually turn to deep discount paper for cash. Furthermore, as we get closer to the end of the Fed’s hiking cycle, we expect further outflows as traditional fixed-rate credit products become more in vogue.”

Incidentally the behavior described by Citi’s strategists, in which ETF administrators first sell high quality paper then shift to deep discount holdings, was one of the catalysts that hedge fund manager Adam Schwartz listed three weeks ago as a necessary condition for credit ETFs to enter a “death spiral.” And with virtually everyone – including the Fed, BIS and IMF – all warning that the next crisis will begin in the leverage loan sector, the question to ask is “has it begun“?

One answer comes from the primary market, and it hardly reassuring.

As we discussed last week, while the leveraged-loan party isn’t quite over, jitters around the world have made lenders and investors less willing to give loans to heavily indebted companies, with numerous loan offerings getting pulled and lenders are demanding – and getting – sweeter terms.

As Bloomberg reports, on Tuesday JPMorgan had to slash the price on a $210 million loan to 93 cents on the dollar from par to sweeten investor demand and help finance a private jet takeover.  Specifically, JPMorgan offloaded loans financing the takeover of XOJET at 93 cents on the dollar, one of the steepest discounts seen in the leveraged loan market this year. And with the market on the verge of freezing, the size of the deal was cut by $70 million from the originally targeted amount.

In Europe, the market appears to have already locked up, as three loans were scrapped over the last two weeks, victims of the Brexit tensions gripping the UK. To wit, movie theater chain Vue International withdrew a 833 million pound-equivalent ($1.07 billion) loan sale. While the deal was meant to mostly refinance existing debt, around 100 million pounds was underwritten to finance the company’s acquisition of German group CineStar.

Last week more deals were pulled when diversified manufacturer Jason Inc. became at least the fourth issuer to scrap a U.S. leveraged loan. Additionally, Perimeter Solutions also pulled its repricing attempt, Ta Chen International scrapped a $250MM term loan set to finance the company’s purchase of a rolling mill, and Algoma Steel withdrew its $300m exit financing. Global University System in November also dropped its dollar repricing.

Fears of a slowing global economic growth even as rates continue to rise, combined with anxiety over trade talks between the U.S. and China, reluctance to take risk before year end and the recent rout in credit products, have all led to a widespread fear across markets; investors are also concerned about higher interest rates weighing on corporate profits. These fears are spreading across credit markets, from investment-grade debt to junk bonds.

“No one thinks this is the big one,” said Richard Farley, chair of the leveraged finance group at Kramer Levin told Bloomberg. “But on the fear to greed continuum we have definitely moved closer to fear.”

The fear has resulted in the S&P/LSTA leverage loan price index tumbling to a two year low.

https://www.zerohedge.com/sites/default/files/inline-images/lev%20loan%20index%2012.7.jpg?itok=mKAf1QUt

The sharp shift in sentiment has been remarkable: for most of 2018, investors couldn’t get enough of floating-rate products like leveraged loans based on the assumption that they will fare better in a rising-rate environment. As a result of blistering demand, companies were able to sell new debt with virtually no covenant protections and higher leverage, triggering warnings about deteriorating standards from regulators and bond graders in recent months (see above).

And, in the aftermath of Chair Powell infamous Oct 3 speech which sent risk assets tumbling and tightened financial conditions, leveraged loan price indexes in Europe and the U.S. have dropped to their lowest level in over two years, while nearly all of the loans outstanding are now trading below their face value. According to JPM, the percentage of loans trading above face value has dropped to just 3.9%, a 29-month low, down from 65.4% in early October. This suggests that virtually all leverage loan investors are now underwater on a total return basis.

* * *

With the leveraged loan market freezing up – and potentially entering a death spiral – the recent weakness has raised concerns that other debt sales currently in the works may be sold at discounts that are so deep underwriters may have to book a loss, if they can be sold at all. This is precisely what happened in late 2007 and early 2008 when underwriters found themselves with pipelines of debt sales that sudden got blocked, and were forced to take massive haircuts to keep the credit flowing.

Still, optimists remain: “The downdraft in loans has been very orderly thus far,” said Chris Mawn, head of the corporate loan business at investment manager CarVal Investors. “We anticipate most managers will keep buying in this market trying to be opportunistic and those who don’t have to sell will just hold.”

Of course, speaking of flashbacks to 2007/2008 it was just this kind of investor optimism that died last…

Source: ZeroHedge

Chinese Firms Dumped $1 Billion Of US Real Estate Last Quarter

After being one of the most steadfast buyers of American real estate for years, large Chinese firms continued dumping high-profile US real estate in the third quarter, the Wall Street Journal reports, selling more than $1 billion of property as Beijing forced insurers, conglomerates, and other big investors into debt-reduction programs.

Chinese investors dumped $1.05 billion worth of prime US real estate in the third quarter while purchasing only $231 million of property, according to data firm Real Capital Analytics. This marks the second consecutive quarter where investors were net sellers of US commercial real estate, and the first time investors sold more US property than they bought since the 2008 crash.

https://www.zerohedge.com/sites/default/files/inline-images/wsj%20chart%20.png?itok=xBKb-mmR

In the last decade, Chinese investors plowed tens of billions of dollars into US real estate, with a concentration in major metro areas like New York, Los Angeles, San Francisco, and Chicago. The Journal notes that Chinese buyers “never represented more than a fraction of the buying power in any U.S. market,” however they made headlines for paying massive premiums. 

Now, the party has unexpectedly ended.

Rising corporate debt levels and concerns over currency stability has forced the Chinese government to tighten capital outflows and clamp down on overseas acquisitions. 

As ZeroHedge discussed last month, total Chinese Credit Creation unexpectedly collapsed, resulting in shock waves of weakness across the domestic and global economy. Amid speculation that Beijing is engineering a “slow landing” through a significant slowdown in credit issuance, investors – hungry for liquidity – are unloading US properties at a rapid clip. In global markets, this will likely create a deflationary chill and lead to a further slowdown in 2019.

https://www.zerohedge.com/sites/default/files/inline-images/TSF%20GS%20chart%20nov%202018_0.jpg?itok=_0m1zT6m

Trade tensions between Beijing and the Trump administration have not helped the situation, as more Chinese firms sold properties amid worries the trade war could deepen in the coming quarters, and potentially lead to more aggressive blow back at Chinese investors. 

“This has to do more with a change in how capital is permitted to behave rather than Chinese investors saying ‘I don’t like the U.S.’,” said Jim Costello, senior vice president at Real Capital Analytics.

“Ping An Insurance Group Co. of China and partners in August sold a 13-story Boston office building for $450 million, the largest sale by a Chinese investor during the third quarter, Real Capital Analytics said. Its U.S. partner Tishman Speyer said it was the one that drove the decision to sell the building.

China’s retreat showed signs of continuing in the fourth quarter. Dalian Wanda Group sold a glitzy development site in Beverly Hills, Calif., last month for more than $420 million. The Chinese conglomerate purchased the eight-acre parcel in 2014 for $420 million and had planned to develop luxury condominiums and a boutique hotel on the site, but feuds with a local union and contractors stalled progress.

Anbang recently engaged Bank of America Corp. to help it sell a portfolio of luxury hotels that it acquired two years ago for $5.5 billion, though the Waldorf isn’t part of that sale, according to a person familiar with the matter,” said the Journal.

“Anbang is reviewing the company’s U.S. real estate portfolio after seeing price recovering in local property market due to strong recovery of the U.S. economy,” said Shen Gang, a spokesman for Anbang.

Still, some strategists believe that Chinese selling may slow in the months ahead.

“I do not think it will be a tidal wave of sales,” said Jerome Sanzo, managing director and head of U.S. Real Estate Finance for Industrial & Commercial Bank of China. “Some of them are not able to move forward for various reasons and will take gains now while waiting for future changes.”

In a highly leveraged economy such as China’s, growth is a lagged result of changes in the supply of credit. And with credit creation waning in China, it is less of a mystery why local corporations are rushing to “liquify” as fast as possible: the Chinese credit squeeze is well underway. Prepare for a global slowdown in 2019, one which has already hit the US housing market hard.

Source: ZeroHedge

Revealing The Naked Truth Of China’s Real Estate Slowdown

Warren Buffett has famously told Berkshire Hathaway investors: “You only find out who is swimming naked when the tide goes out.”

Buffett’s market wisdom can be applied to the Chinese property market.

Now, the tide is going out and the boom days are over, the industry is rapidly slowing as credit growth is the slowest on record – pointing to a weakening in the economy in coming months.

As for “swimming naked when the tide goes out,” well, it seems like one real estate firm, in southwest China used topless models covered in body paint as a last-ditch effort to unload a new property development before the market implodes.

https://www.zerohedge.com/sites/default/files/inline-images/models%20real%20estate.jpg?itok=Req8pfzX

Nanning Weirun Investment Company, a real estate developer in Nanning, capital of the southwestern Guangxi Zhuang, hired a bunch of models to advertise its condominiums by using their bare skin as a canvas, said Asia Times.

https://www.zerohedge.com/sites/default/files/inline-images/models.png?itok=EuyUbaud

Floor plans of the condos were painted on the back of each model, and their breasts were painted with logos and other advertising slogans.

https://www.zerohedge.com/sites/default/files/inline-images/buy%20a%20home%3F.png?itok=xNc7GmRG

While it is unclear if the topless models helped to spur sales, Asia Times indicated that the stunt attracted many people to the showroom last Friday.

https://www.zerohedge.com/sites/default/files/inline-images/condo%20layout.jpg?itok=lrm-K1hX

Hundreds of Sina Weibo users, China’s Twitter, criticized the promotion and called it disgusting, as others thought it was an interesting method, in the attempt to generate sales in a slowing market.

An employee at Nanning Weirun told the website Btime.com that the bodypainting promotion was a one-off event to drive sales.

The strategy is one of the more unconventional approaches being taken by desperate developers to attract new buyers as GDP growth, and the housing market are expected to fall in the first half of 2019.

Was the marketing stunt worth it for the developer?

Probably not, as the city planning authority suspended the firm’s marketing permit on Monday.

Video: Revealing the naked truth of China’s real estate slowdown

Source: ZeroHedge

Home Builder Toll Brothers Shocks With 13% Plunge In Orders As California Falls A Staggering 39%

Toll Brothers announced its fourth quarter results on Tuesday, unleashing a fresh flood of concerns about the state of the housing market after it disclosed its first drop in orders since 2014. Orders were down 13% from the year prior, missing the analyst estimate of a 5% increase in dramatic fashion.

The company focuses much of its business on the California high-end home segment, which – as a result of the housing bubble in most west coast cities and rising rates, is facing an “affordability crisis” coupled with a sharp drop in overseas demand. According to the company, orders for the state were down an astounding 39%.

https://www.zerohedge.com/sites/default/files/inline-images/toll%20orders.jpg?itok=fju7d_NC

The company blamed rising rates for the drop off in buyer demand, as well as sinking stock prices. What is odd is that stock prices haven’t really “sunk” – unless the company was referring to its own stock…

https://www.zerohedge.com/sites/default/files/inline-images/toll%2012.4.jpg?itok=IMfGjqZK

... with the CEO blaming “the effect on buyer sentiment of well-publicized reports of a housing slowdown” for the plunge in orders. You see, it’s not the housing market that is slowing: it is perceptions about the market slowing, that is hitting the company.

That said, “perceptions” are correct: as we noted last week, new home sales crashed in October, suffering the biggest plunge since 2011.

https://www.zerohedge.com/sites/default/files/inline-images/2018-11-28_7-01-59.jpg

Even so, the atrocious quarter didn’t deter all analysts, who promptly defended the stock. Drew Reading, Bloomberg Intelligence analyst stated that “there are many positive factors underpinning the economy that we believe are supportive of the housing sector longer-term, and our affluent markets particularly.”

Tolls dismal results follows signs that we have been discussing for much of the past year, which have confirmed that the luxury housing market is cooling off across the country.

Recently, we profiled a mansion in Chicago that was taken off the market after being listed for $50 million and only being assessed for $19.4 million. United Automobile Insurance Chairman and CEO Richard Parrillo constructed the 25,000 sq ft Lincoln Park mansion a decade ago, after buying the property in 2005 for $12.5 million from the Infant Welfare Society.

After two years on the market, Parrillo and his wife held firm at $50 million, a record for the region, their original listing agent told the Chicago Tribune. The agent said the couple plowed more than $65 million into the estate, including land cost.

https://www.zerohedge.com/sites/default/files/inline-images/mansion_0.jpg?itok=jN4nFo9W
$50 million Lincoln Park mansion — Chicagoland’s priciest listing — taken off the market

Cook County Assessor’s Office reports shows the mansion’s $50 million asking price was hugely overinflated versus its most recent estimated market value, which stood some 60% lower, at $19.4 million. The report notes the 2018 property value is significantly higher from the assessor’s $14 million estimated market value for the mansion in 2017, due to a quick burst in high-end home sales in the last several years that had since cooled.

Source: ZeroHedge

Bubble Trouble: Silicon Valley & San Francisco Housing Markets Head South

The underlying dynamics changed in August and have worsened since. And, this is still the tech boom.

It’s high time to unload houses and condos in Silicon Valley and San Francisco, one of the most expensive housing markets in the US. Sellers are now flooding the market with properties. Inventory listed for sale in those three counties that make up the area – San Francisco, San Mateo, and Santa Clara – surged by 102% in November compared to November last year, to 3,931 listings.

In each of the past three months, the number of active listings (new listings plus old listings that have not sold yet but haven’t been pulled from the market) was the highest since August 2014. The chart below shows the year-over-year percentage change in active listings. The red bars in the chart mark the beginning of bubble trouble in this housing market (all data via the National Association of Realtors at realtor.com):

https://wolfstreet.com/wp-content/uploads/2018/12/US-Silicon-Valley-San-Francisco-active-listings-percent-change-2018-11.png

When inventories are piling up because sales are slowing, sellers have to figure out where the market is, and the market is where the buyers are, but buyers have become listless and refuse to participate in bidding wars. They see the prices and they do the math with higher mortgage rates, and they walk. So, motivated sellers have to do something to move the properties. And they started cutting prices.

In November, the number of properties on the market with price cuts, at 1,038, skyrocketed by over 400% year over year.

The chart of the year-over-year percentage changes in price cuts in Silicon Valley and San Francisco shows that the change of direction in the market occurred around August. By September, price cuts hit the highest level since Housing Bust 1:

https://wolfstreet.com/wp-content/uploads/2018/12/US-Silicon-Valley-San-Francisco-price-reductions-percent-2018-11-.png

The median asking price for the three counties had peaked in May at $1,369,200 and has since fallen by $132,100 or by nearly 10% from the peak, to 1,237,100. Median asking price means half are listed for more and half are listed for less. It differs from the median selling price at which homes are actually sold. Compared to November last year, the median asking price dropped by $71,200 or 5.4%:

https://wolfstreet.com/wp-content/uploads/2018/12/US-Silicon-Valley-San-Francisco-median-asking-price-2018-11.png

The chart below shows the percentage change of median asking prices, which clarifies further the underlying dynamics in the market:

https://wolfstreet.com/wp-content/uploads/2018/12/US-Silicon-Valley-San-Francisco-median-asking-price-yoy-change-2018-11-.png

After years of blaming the surging home prices in the area on a shortage of inventory for sale, the industry is suddenly faced with all kinds of inventory coming out of the woodwork, just as sales are slowing and as mortgage rates are rising, while the affordability crisis bites the market.

Buyers have lost their blind enthusiasm. They’re still buying, but at lower prices, and they’re taking their time.

Yet the hiring slowdowns – or worse, layoffs – at area tech companies and the broad wind-down of countless and hopelessly cash-burning start-ups – both a prominent feature of every tech downturn here – haven’t even started yet. The area is still booming and companies are still hiring, and this housing downturn is starting during the tech boom, and not as a consequence of a tech meltdown. Though share prices of local companies such as Google, Apple, Facebook, and many others have taken a big hit since the summer, we’re still far from a classic tech meltdown. That is yet to come.

The Case-Shiller home price index lags by about three months, but it too is now picking up the changes in the market: Seattle home prices dropped at fastest pace since Housing Bust 1, while the first price declines cropped in San Francisco, Denver, Portland, and other markets. Read…  The Most Splendid Housing Bubbles in America Deflate

Source: by Wolf Richter | Wolf Street

***

New-Home Prices Drop Nearly 7%, Supply Spikes to Highest since Housing Bust 1

Home builders not amused.

***

Update on the Housing Bust in Sydney & Melbourne, Australia

This is not exactly slow motion anymore.

Farm Bankruptcies Soar In American Midwest

Eighty-four farms in the US Midwest region covered by the Minneapolis Fed’s Ninth District states (Minnesota, Montana, North and South Dakota, Wisconsin and the Upper Peninsula of Michigan) filed for chapter 12 bankruptcy in the 12 months that ended in June – more than twice the level observed in June 2014, according to a new report from the Federal Reserve, surpassing the prior peak hit just after the GFC.

https://www.zerohedge.com/sites/default/files/inline-images/chart_4.png?itok=hqpoMJzA

“Current numbers are not unprecedented, even in the recent past, having reached 70 bankruptcies in 2010. However, current price levels and the trajectory of the current trends suggest that this trend has not yet seen a peak,” Ron Wirtz, an analyst at the Minneapolis Fed, wrote.

Bankruptcy numbers inversely correlate with the rise and fall of soft commodity prices. After an abrupt spike in chapter 12 filings during the GFC – which peaked in 2010 – soft commodity prices started to rise across the board and bankruptcies declined. Farm bankruptcies bottomed out in 2014, but that was at the point when prices peaked then began to drop.

https://www.zerohedge.com/sites/default/files/inline-images/chart%202.png?itok=c3ThwD_M

As shown in the chart above, some of the problems predate President Trump’s trade war with China. 

One culprit is that demand for corn and soybeans has not kept pace with increasing supply from industrialized farms over the current economic expansion. 

Some chapter 12 filings reflect low price levels for corn, soybeans, milk and even beef, but the situation had dramatically worsened since the trade war started earlier this year, and accelerated when China began slapping retaliatory tariffs on American soybeans. 

Meanwhile, as the Fed notes, not all Ninth District states are feeling the same effects. 

Wisconsin, for example, is seeing about 60% of all bankruptcies. It appears that bankruptcy filings have been unusually high among dairy farms. Mark Miedtke, the president of Citizens State Bank in Hayfield, Minn., said bankruptcy had not reared its head for borrowers in his region of southeast Minnesota, but farmers are certainly feeling the pinch. 

“Dairy farmers are having the most problems right now,” Miedtke said quoted by AP. “Grain farmers have had low prices for the past three years but high yields have helped them through. We’re just waiting for a turnaround. We’re waiting for the tariff problem to go away.”

“The underlying problem, which existed before the trade war, was overproduction. Farmers are almost too efficient for their own financial good,” Miedtke added.

The bankruptcy wave of farms is also spilling into the ag loans market as the Ninth District’s 531 banks have reported an alarming rise in nonperforming ag loans. 

“Asset quality of ag loans at these banks in the bottom quarter of the performance distribution worsened significantly after the recession. They improved markedly by 2012 and saw a couple of years of very healthy rates (Chart 3). But by 2014, asset quality in this cohort of banks was worsening again. By the second quarter of this year, asset quality would fall below levels seen in the aftermath of the recession—a trend not seen in any other standard loan category, like residential and commercial real estate, or construction and industrial, or even consumer loans,” said Minneapolis Fed. 

https://www.zerohedge.com/sites/default/files/inline-images/chart%203_0.png?itok=gKlp-uYo

The farm bust is not isolated to Ninth District states but also is showing up in other parts of the Midwest.

A new report from the Federal Reserve Bank of Kansas City, which includes Colorado, Kansas, Nebraska, Oklahoma, Wyoming, and portions of Missouri and New Mexico, shows how farms in its district reported much lower income than a year ago.

Kansas City Fed said farm incomes were expected to weaken into early 2019. The worst ag banking conditions were in states with the heaviest concentrations of corn and soybeans.

https://www.zerohedge.com/sites/default/files/inline-images/Reuters%20soybeans.png?itok=QH2QrxUe

The report also notes how farmers have started to deleverage, taking a page out of the GE playbook, with fire sales of land or equipment to make loan payments.

In short, it appears that America’s farm bust has arrived; while it has been festering for years starting under the Obama administration, with President Trump’s trade war and China shutting out US farmers to its market the perfect storm has arrived.

Source: ZeroHedge

HUD Is Preparing To Address Rising FHA Loan Portfolio Risk With Tighter Credit

https://www.scotsmanguide.com/uploadedImages/ScotsManGuide/News/News/2018/11/FHAloan.1.jpg

(Source: by Victor Whitman | Scotsman Guide) Changes are likely to come soon that will make it harder for prospective borrowers to obtain Federal Housing Administration (FHA) loans. It’s all part of an effort to dial back loosening credit standards that have seen FHA borrower debt loads and cash-out refinancing activity rise to record levels, top officials with the U.S. Department of Housing and Urban Development (HUD) told reporters on Thursday.

“We will be making some additional changes soon,” said FHA Commissioner Brian Montgomery during a morning conference call. HUD released its fiscal 2018 annual report to Congress on the health of the FHA insurance fund.

“I couldn’t give you an exact date, but again we want to find that critical balance between providing people with the opportunity for sustainable home ownership, but again we have to maintain the right balance and protect taxpayers against risk.”  

Montgomery didn’t reveal any specific plans on where the tightening may occur, but indicated cash-out refinancing activity was in the cross-hairs of the agency.

In a year where refinances dropped dramatically, FHA’s cash-out counts rose 6percent, to 150,883, in fiscal 2018.

“Cash-out refinances, both as a percentage of our over all business and our refinance endorsement volume, are growing astronomically,”Montgomery said. Cash-out refinances comprised nearly 63 percent of all refinance transactions in fiscal 2018, up from nearly 39 percent last year, he said.

“The increase in cash-outs presents a potential future risk for us, but also challenges the core tenants of FHA’s taxpayer-backed mission.”

Montgomery said rising debt-to-income (DTI) ratios are another major concern.

“Almost a quarter of our forward-purchase business was comprised of mortgages in which a borrower had a DTI ratio above 50 percent,”he said. “That is the highest percentage since 2000. When you couple that with a trend of decreasing average credit scores — 670 this year versus 676last year and the lowest average since 2008 — most underwriters and housing-finance experts will say that managing this type of risk without corresponding scrutiny becomes problematic.”

Montgomery also said HUD has concerns about the jurisdictional right and the extent to which government entities, such as state housing-finance agencies, provide down payment assistance to FHA borrowers.  

Montgomery also indicated that HUD will not be cutting FHA insurance rates in the near future.

“While the [insurance] fund is sound at this point in time,I think we are still far away from being in a position to consider any reduction in our mortgage-insurance premium,” he said.

HUD’s insurance fund ended the 2018 fiscal year in September in better shape than the end of fiscal 2017. The net worth of the fund increased to $34.9 billion, up $8.12 billion at the end of fiscal 2017. The fund’s capital ratio, a closely watched metric that compares the net worth of the fund to the dollar balance of all active insured loans, stood at a 2.76 percent, up from 2.18 percent at the end of fiscal 2017. This was the fourth-consecutive year that the capital ratio has been above Congress’s mandated 2 percent threshold, a level it considers sufficient to sustain losses without government intervention.

The overall fund, however, was once again dragged down by FHA’s reserve-mortgage program, known as the Home Equity Conversion Mortgage (HECM). Reverse mortgages are loans that allow seniors to tap their home equity and remain in their homes for life. They represent a small portion of all FHA-insured loans, but have had an out sized impact on the risk to the fund.

The FHA portfolio of HECM-insured mortgages was estimated to have a negative value of $16.3 billion. The reverse portfolio also had a negative capital ratio of 18.83 percent.

By contrast, FHA’s regular forward-loan portfolio — loans commonly taken out by first-time home buyers  — had an estimated positive value of $46.8 billion and a healthy positive capital ratio of 3.93 percent.  

Montgomery and HUD Secretary Ben Carson, who also joined the morning call with reporters, said that elderly borrowers in the reverse program are being subsidized to an unsustainable degree by the typically lower-income,often minority, first-time home buyers in the FHA’s forward-loan program.

“We are committed to maintaining a viable HECM program, so seniors can continue to age in place, but we can’t continue to see future HECM books being subsidized by our forward-mortgage programs,” Montgomery said. “It is not beneficial to anyone, including taxpayers.”

HUD has taken steps to tighten the program already,including most recently requiring a second appraisal on homes where the value could have been inflated. Montgomery said FHA is working on a plan to conduct a census of all families who live in homes with a HECM mortgage.

Mortgage Bankers Association President Robert Broeksmit said HUD’s scrutiny of FHA’s credit standards was “prudent.” 

“We are glad to see that FHA is closely monitoring the increasing risk in the forward portfolio, indicated by rising debt-to-income ratios, declining credit scores, and the increasing use of down payment-assistance programs,” Broeksmit said. “While current FHA delinquencies are quite low, it is prudent to keep an eye on these trends to ensure the program does not face undue challenges if, and when, the economy and job market cool.”

Broeksmit also noted that MBA has previously drawn attention to the HECM portfolio’s drain on the fund, and supported recent tightening moves.

“Policy makers should continue considering ways to insulate the forward program from the volatility in the reverse program,” he said.  

That HUD might crack down on FHA-lending standards is worrisome for non-banks, however. Non-banks are now originating the bulk of FHA loans today. Reacting to the report,  non-bank trade group the Community Home Lenders Association (CHLA) said HUD should loosen restrictions on the program by eliminating an Obama-era requirement that borrowers hold FHA insurance for the life of the loan.

“CHLA also renews its call for a cut in annual premiums, a move justified by FHA’s strong financial performance,” CHLA Executive Director Scott Olson said.

US New Home Sales Fall 12% YoY In October, Down 9% MoM

Another Indicator Bites The Dust

The good news? US GDP rose 3.5% QoQ, even though Personal Consumption was lower than expected at 3.6% and lower than September’s growth.

The bad news? New home sales fell 8.9% MoM in October.

https://confoundedinterestnet.files.wordpress.com/2018/11/econov2818.png

New home sales declined 12% YoY, tied for the worst reading since 2011.

https://confoundedinterestnet.files.wordpress.com/2018/11/nhsyoyovt18.png

Yes, as The Fed withdraws monetary stimulus, home building companies are taking the Nestea plunge.

https://confoundedinterestnet.files.wordpress.com/2018/11/hbldfed.png

Another housing indicator bites the dust.

https://confoundedinterestnet.files.wordpress.com/2018/10/powellfrown.jpg

Source: Confounded Interest

This Time Is Different

Bubble Burst? Smart Money Flow Index Continues To Decline To 1995 Levels

The Smart Money Flow Index, measuring the movement of the Dow in two time periods: the first 30 minutes and the last hour, has just declined AGAIN.

https://confoundedinterestnet.files.wordpress.com/2018/11/smartdow.png

The Smart Money Flow Index, like the DJIA, has been around for decades. But it has just fallen to the lowest level since 1995.

https://confoundedinterestnet.files.wordpress.com/2018/11/smfdow31.png

Is the asset bubble starting to burst? Or is it just one lone indicator getting sick?

https://confoundedinterestnet.files.wordpress.com/2018/11/008-sick-of-this-party-2132469.jpg

Source: Confounded Interest

Chinese Fetanyl Kingpins Laundered Over $5BN Through Vancouver Homes Since 2012

https://www.zerohedge.com/sites/default/files/inline-images/Vancouver%20skyline.jpg?itok=Ur85d6IyDowntown Vancouver Skyline

A new “secret” police study has found that Chinese crime networks could have laundered over $1B through Vancouver homes in 2016 alone, and that a surge in the city’s home prices are simultaneously tied to a surge in opioid deaths. 

The report examined over 1,200 luxury real estate purchases in British Columbia’s Lower Mainland during that year, and concluded that over 10% were tied to buyers with criminal records. Crucially 95% of those transactions could be definitively traced by police intelligence back to Chinese crime networks.

While the study only looked at property purchases in 2016, an analysis by Global News suggests the same extended crime network may have laundered about $5-billion in Vancouver-area homes since 2012Fentanyl: Making a Killing

Since 2016 we’ve chronicled the “dark side” behind the Vancouver real estate bubble, which it turns out has long been a bubbling melange of criminal Chinese oligarch “hot money”, desperate to get parked offshore in any piece of real estate, but mostly in British Columbia regardless of price.

A number of investigations have since uncovered extensive links – including money laundering and underground banking – between China’s criminal underworld and British Columbia drug and casino cash and VIPs, as well as their connections to China, Macau and the notorious triads. These investigations have found much of the B.C. real estate bubble can be explained as nothing more than the “layering” and “integration” aspect of a giant money laundering scheme involving billions of dollars of Chinese hot money and the criminals behind it.

On Monday the new bombshell study revealed just how extensive and growing this Chinese underworld racket remains and how it continues to impact average citizens and regular home buyers, as well as fueling the continuing opioid crisis across the US and Canada, which has claimed tens of thousands of lives across North America, including nearly 4,000 Canadians in 2017 alone. The figures are so stunning that what is “known” years after the story first came to light could merely be the tip of the iceberg. 

The study published by Canada’s Global News begins by painting a disturbing scenario that suggests some of Vancouver’s priciest homes are nothing more than a new “Swiss bank account” of sorts providing the promise of an anonymous store of value and retaining the cash equivalent value of the original capital outflow from initial criminal transactions overseen for Chinese crime syndicates — all the while fueling Metro Vancouver’s housing affordability crisis.

The ultimate end result of the sophisticated and massive money laundering scheme is that middle-class families have been priced out of the city, per the report:

The stately $17-million mansion owned by a suspected fentanyl importer is at the end of a gated driveway on one of the priciest streets in Shaughnessy, Vancouver’s most exclusive neighborhood.

A block away is a $22-million gabled manor that police have linked to a high-stakes gambler and property developer with suspected ties to the Chinese police services.

Both mansions appear on a list of more than $1-billion worth of Vancouver-area property transactions in 2016 that a confidential police intelligence study has linked to Chinese organized crime.

https://www.zerohedge.com/sites/default/files/inline-images/Vancouver%20properties.jpg?itok=CDpjoivaNine Vancouver properties subject of a prior Globe and Mail investigation linking them to fentanyl laundering. Via The Globe and Mail

Previous investigations had quoted concerned residents describing that: “Vancouver seems to be evolving from a residential city into almost like a lockbox for money… but I have to live among the empty houses. I’m a resident, not just an investor.”

The snapshot that the new police study provides is based on analysis of a sample of about 1,200 high-end sales in 2016. Investigators cross-referenced databases of criminal records and confidential police intelligence with those high-end property records, which revealed the shocking 10% organized crime ties figure. 

But the implications for prior years going all the way back to the early 2000’s and even into the 1990’s, when Canadian police believe the current kingpins of fentanyl  which is the powerful and extremely addictive narcotic added to heroin to increase its potency (said to be 100 times more potent than morphine)  began to dominate Canada’s heroin markets, are equally as startling.

For starters, the report finds, fentanyl-related money laundering which funnels illicit funds through the luxury housing market has been so pervasive that researchers “didn’t have the time or resources to study the over 20,000 transactions”. During the course of these some 20,000 transactions home prices in Vancouver have tripled since 2005

From the new “Fentanyl: Making a Killing” extensive report

https://www.zerohedge.com/sites/default/files/inline-images/Vancouver%20Fentanyl%20crisis%20report.jpg?itok=-QljNhJV

And further illustrating just how extensive the whole scheme remains, there is this bombshell section from the report:

While the study only looked at property purchases in 2016, an analysis by Global News suggests the same extended crime network may have laundered about $5-billion in Vancouver-area homes since 2012.

At the centre of the money laundering ring is a powerful China-based gang called the Big Circle Boys. Its top level “kingpins” are the international drug traffickers who are profiting most from Canada’s deadly fentanyl crisis.

The crime network, according to police intelligence sources, is a fluid coalition of hundreds of wealthy criminals in Metro Vancouver, including gangsters, industrialists, financial fugitives and corrupt officials from China.

The report is so full of specific examples of multi-tens of million dollar homes that are actually money laundering conduits for fentanyl drug kingpins that it puts President Trump’s recent accusations against China for fueling the opioid crisis into fresh perspective.

At that time Trump attempted to lay out the case that Chinese suppliers had been fueling America’s opioid crisis, saying in part “It is outrageous that Poisonous Synthetic Heroin Fentanyl comes pouring into the U.S. Postal System from China.”

However judging by breadth and depth of figures merely from one major North American city (some American cities have been named in other investigations), it appears that Trump’s words actually understated the role of China and Chinese organized crime, of which it appears Beijing authorities have long been only too happy to look the other way while it takes deep roots on the American continent. 

After all we can’t imagine China’s all-pervasive advanced surveillance systems and powerful domestic intelligence apparatus could miss this: “Police say that almost every drug seizure they now make in Vancouver turns up some form of synthetic opioid produced at factories in China,” according to the report.

Source: ZeroHedge

***

Fentanyl kings in Canada allegedly linked to powerful Chinese gang, the Big Circle Boys


2018 Will End With Too Many SoCal Homes For House Hunters To Choose From

(Ben Jones) A report from the Orange County Register in California. “When 2018 started, the housing buzz was ‘where’s the supply?’ Now with the year almost complete, the industry now wonders ‘where did all the buyers go?’ Ponder that in housing-starved Southern California, builders have the largest standing supply of completed homes to sell in six years. Yes, newly constructed residences are a pricey niche that’s not for everyone. Still, the change of momentum is remarkable.”

“Housing tracker MetroStudy reports that at the end of the third quarter, 3,401 new homes were finished but unsold in the four-county region covered by the Southern California News Group. That’s up 428 homes in 12 months, or 14 percent, and was the highest inventory level since 2012’s second quarter.”

“But this year, house hunters have pulled back — for both new and existing residences. If you need a stark measurement of the buyer reluctance, look at this: CoreLogic reported Southern California home sales of all types in September suffered their largest year-over-year decline in nearly eight years.”

“It adds up to a situation where not too long ago local builders had many buyers waiting months for homes to be completed. Today, most housing projects offer new homes ready for immediate occupancy — with special pricing, no less.”

“Look at the market upheaval in Orange County. It’s got the region’s biggest boost in new-home supply, according to MetroStudy. As of Sept. 30, O.C. had 1,074 finished residences for sale, up 277 or 35 percent in a year. It’s O.C.’s largest new-home inventory in nearly 12 years.”

“Builders, faced with their own industry competition, also are up against homeowners in the region who rushed to list their homes. As that new-home supply swelled in the third quarter, Southern California owners averaged 35,333 listings, according to ReportsOnHousing. That’s 4,568 more existing homes on the market than a year earlier — or 10 times the growth of unsold new homes.”

“Yet this is an autumn period when many owners typically take homes off the market. Who knew that 2018 would be the year when house hunters had too many homes to choose from?”

From Curbed Los Angeles. “The number of homes for sale in the Los Angeles area climbed more than 30 percent in October, according to Zillow. That suggests the region’s sky-high home prices could continue to fall, as they did in September.”

“During the month of October, inventory (the total number of houses and condos on the market) in Los Angeles and Orange counties jumped nearly 32 percent above levels recorded in October of last year. A bump in the number of homes available for sale often corresponds with falling prices, since sellers have more competition when listing their homes and are less likely to be overwhelmed with offers above asking price.”

“The spike in the number of homes available for purchase mirrors—and far exceeds—a nationwide trend. Across the country, inventory went up 3 percent since last year, marking the first yearly increase since 2014.”

“‘This is a phenomenon we’re seeing in several pricey markets throughout the country,’ says Zillow economist Aaron Terrazas. He points out that inventory has also risen by double digit percentages in San Francisco, Seattle, and San Jose.”

“Terrazas tells Curbed that much of the inventory growth in LA and other markets is driven by homes that take longer to sell, suggesting that buyers may be less willing to pay bloated prices.”

“‘This is a reflection of how poor affordability is in those areas,’ says Terrazas. ‘Buyers are starting to pull back a little bit from where they were a year ago.’”

Source: Ben Jones The Housing Bubble Blog

GM To Fire 15% Of Salaried Workers, Close 7 Plants

Update 4: The massive job cuts that GM is undertaking as it closes five plants in North America have infuriated politicians in Ontario and the US who will be stuck grappling with the consequences of how to help thousands of soon-to-be unemployed blue-collar (and white collar) workers. As they have vowed to fight the cuts, autoworkers unions in both countries have raised questions about whether firing thousands of workers violates the terms of the 2009 Treasury funded bailout that saved the “Big Three” US carmakers from bankruptcy. 

Now, one former Obama official has weighed in: Steve Rattner, who led Obama’s auto task force, which helped organize and oversee the bailouts, said he doesn’t believe they do. It was always the Obama Administration’s intention that GM and its peers run their businesses responsibly, including implementing meaningful cost-cutting measures to adjust for changes in their business environment.

“I don’t think these violate the 2009 agreement, in part because we always made clear that GM should be free to run its business in the ordinary course,” Steve Rattner, former chief of President Obama’s auto task force, says in an email.

“The passage of more than nine years is an important factor – there has been much change in the auto world over that period and it’s important for GM to be free to adjust its business accordingly,” he added.

As a reminder, the federal government took over GM and Chrysler in March 2009, fired GM CEO Rick Wagoner and forced Chrysler to merge with Fiat before distributing nearly $100 billion in subsidies that eventually left US taxpayers with a $10.2 billion loss.

https://www.zerohedge.com/sites/default/files/inline-images/2018.11.26bailoutchart.JPG?itok=9Xp6WQXP(Chart courtesy of the Balance)

The bailout ended on December 18, 2014, when the Treasury Department sold its last remaining shares of Ally Financial, formerly known as General Motors Acceptance Corporation, which it had bought for $17.2 billion during the depths of the crisis to infuse cash into the failing GM subsidiary. The Treasury Department sold the shares for $19.6 billion, earning a tidy $2.4 billion profit that wasn’t nearly enough to offset the losses on GM and Chrysler.  

Circling back to the present day, GM workers at the plants slated for closure walked off the job on Monday after the company formally announced the cutbacks.

It used to be that “what’s good for the country is good for General Motors, and vice versa.” As any of these workers would tell you, that’s clearly no longer the case.

* * *

Update 3: In case you were wondering why GM would be doing this amid ‘the greatest recovery’ of all time and global synchronized growth; this chart should help!!

https://www.zerohedge.com/sites/default/files/inline-images/2018-11-26_8-48-17_0.jpg?itok=aENozWFZh/t @M_McDonough

*  *  *

Update 2: The cutbacks announced by GM Monday morning were more severe than most analysts expected – and were certainly steeper than leaked reports published late Sunday and early Monday had suggested.

After GM shares were halted pending news following a 2%+ jump after the open, Barra revealed that the company would shutter 7 plants (5 in North America and 2 international) after 2019, fire 15% of its salaried workforce and shift hiring priorities to more tech workers in a cost-cutting drive intended to save the company some $6 billion by the end of 2020 ($4.5 billion will come from cost savings, $1.5 billion from lower capital spending). As GM seeks more workers with “different skills”, it also plans to shift its investment focus toward electric and autonomous vehicles.

Canadian Prime Minister Justin Trudeau has expressed “deep disappointment” at GM’s decision to close its plant in Oshawa, Ontario. He reportedly spoke with Barra over the weekend.

The company’s shares ripped higher after the trading halt ended, climbing 7.6% in their strongest one-day jump since Oct. 31, when the company announced some of its cost cutting plans and said it expected EPS for 2018 toward the high end of its guidance.

https://www.zerohedge.com/sites/default/files/inline-images/2018.11.26gmthree.jpg?itok=9u9XWS4m

Here’s a quick rundown of the closures:

  • 1. Oshawa Assembly in Oshawa, Ontario, Canada.
  • 2. Detroit-Hamtramck Assembly in Detroit.
  • 3. Lordstown Assembly in Warren, Ohio.
  • 4. Baltimore Operations in White Marsh, Maryland.
  • 5. Warren Transmission Operations in Warren, Michigan.
  • 6/7. In addition to the previously announced closure of the assembly plant in Gunsan, Korea, GM will cease the operations of two additional plants outside North America by the end of 2019.

Barra said the cutbacks are a response to sagging car sales in domestic and international markets (sedan sales have floundered while pickup truck sales remain robust) and the impact of Trump’s trade war. The steel tariffs alone have already cost GM some $1 billion this year, the company said.

“We are taking this action now while the company and the economy are strong to keep ahead of changing market conditions,” Barra said during a conference call with reporters.

The firm will cut 15% of its salaried workforce, including a 25% reduction in the number of executives to streamline decision making. All told, the company is expected to cut nearly 15,000 salaried and hourly jobs. The company last month offered buyouts to 18,000 last month to try and reduce headcount.

The UAW, the union that represents most of GM’s hourly labor force in the US, says it will do everything it can to resist GM’s plans. Canada’s innovation minister Navdeep Bains also decried GM’s plans.

  • *BAINS: IMPACT OF GM MOVE `COMPLETELY DEVASTATING’
  • *CANADA INNOVATION MINISTER BAINS SPEAKS TO REPORTERS IN OTTAWA
  • *UAW SAYS GM PRODUCTION DECISION “WILL NOT GO UNCHALLENGED”

The company’s white collar workers number roughly 54,000 in North America, according to WSJ, which speculated that most of the job cuts would come from GM’s bloated product-development division.

GM outlined the cut backs in an investor deck:

https://www.scribd.com/document/394181986/GM-Investor-Call-Deck-11-26-2018

Read the company’s full press release:

General Motors will accelerate its transformation for the future, building on the comprehensive strategy it laid out in 2015 to strengthen its core business, capitalize on the future of personal mobility and drive significant cost efficiencies.

Today, GM is continuing to take proactive steps to improve overall business performance including the reorganization of its global product development staffs, the realignment of its manufacturing capacity and a reduction of salaried workforce. These actions are expected to increase annual adjusted automotive free cash flow by $6 billion by year-end 2020 on a run-rate basis.

“The actions we are taking today continue our transformation to be highly agile, resilient and profitable, while giving us the flexibility to invest in the future,” said GM Chairman and CEO Mary Barra. “We recognize the need to stay in front of changing market conditions and customer preferences to position our company for long-term success.”

Contributing to the cash savings of approximately $6 billion are cost reductions of $4.5 billion and a lower capital expenditure annual run rate of almost $1.5 billion. The actions include:

Transforming product development – GM is evolving its global product development workforce and processes to drive world-class levels of engineering in advanced technologies, and to improve quality and speed to market. Resources allocated to electric and autonomous vehicle programs will double in the next two years.

Additional actions include:

Increasing high-quality component sharing across the portfolio, especially those not visible and perceptible to customers.
Expanding the use of virtual tools to lower development time and costs.
Integrating its vehicle and propulsion engineering teams.
Compressing its global product development campuses.

Optimizing product portfolio – GM has recently invested in newer, highly efficient vehicle architectures, especially in trucks, crossovers and SUVs. GM now intends to prioritize future vehicle investments in its next-generation battery-electric architectures. As the current vehicle portfolio is optimized, it is expected that more than 75 percent of GM’s global sales volume will come from five vehicle architectures by early next decade.

Increasing capacity utilization – In the past four years, GM has refocused capital and resources to support the growth of its crossovers, SUVs and trucks, adding shifts and investing $6.6 billion in U.S. plants that have created or maintained 17,600 jobs. With changing customer preferences in the U.S. and in response to market-related volume declines in cars, future products will be allocated to fewer plants next year.

Assembly plants that will be unallocated in 2019 include:

  • Oshawa Assembly in Oshawa, Ontario, Canada.
  • Detroit-Hamtramck Assembly in Detroit.
  • Lordstown Assembly in Warren, Ohio.

Propulsion plants that will be unallocated in 2019 include:

  • Baltimore Operations in White Marsh, Maryland.
  • Warren Transmission Operations in Warren, Michigan.
  • In addition to the previously announced closure of the assembly plant in Gunsan, Korea, GM will cease the operations of two additional plants outside North America by the end of 2019.

These manufacturing actions are expected to significantly increase capacity utilization. To further enhance business performance, GM will continue working to improve other manufacturing costs, productivity and the competitiveness of wages and benefits.

Staffing transformation – The company is transforming its global workforce to ensure it has the right skill sets for today and the future, while driving efficiencies through the utilization of best-in-class tools. Actions are being taken to reduce salaried and salaried contract staff by 15 percent, which includes 25 percent fewer executives to streamline decision making.
Barra added, “These actions will increase the long-term profit and cash generation potential of the company and improve resilience through the cycle.”

GM expects to fund the restructuring costs through a new credit facility that will further improve the company’s strong liquidity position and enhance its financial flexibility.

GM expects to record pre-tax charges of $3.0 billion to $3.8 billion related to these actions, including up to $1.8 billion of non-cash accelerated asset write-downs and pension charges, and up to $2.0 billion of employee-related and other cash-based expenses. The majority of these charges will be considered special for EBIT-adjusted, EPS diluted-adjusted and adjusted automotive free cash flow purposes. The majority of these charges will be incurred in the fourth quarter of 2018 and first quarter of 2019, with some additional costs incurred through the remainder of 2019.

* * *

Update 1: Former Nissan Chairman Carlos Ghosn is locked up in a Tokyo jail cell, but GM CEO Mary Barra is apparently channeling the spirit of the auto executive nicknamed “Le Cost Killer”. 

GM shares climbed 0.6% at the open after the company announced production cutbacks that were larger than initially reported. In addition to shuttering the Oshawa plant, the company is also planning to halt production at its Warren Transmission plant in Michigan, as well as another plant in Ohio (in addition to the closure in Oshawa). The company also plans to stop selling some of the company’s least popular models.

Lagging sales had already forced GM to cut production to one shift at its Hamtramck Assembly plant in Detroit and its Lordstown, Ohio, assembly plant. According to Reuters, the company is weighing whether to end production of the Chevrolet Volt hybrid, Buick LaCrosse, Cadillac CT6, Cadillac XTS, Chevrolet Impala and Chevrolet Sonic after 2020, amid a broader shift toward fully electric and autonomous vehicles.

General Motors Co will significantly cut car production in North America and stop building some low-selling car models, and was expected to announce significant planned reductions to its North American salaried, executive workforce, sources said on Monday.

GM plans to halt production at three assembly plants in Canada and in Ohio and Michigan in the United States by not allocating future new products, putting the future of those plants in doubt, the sources added.

The plants – Lordstown Assembly in Ohio, Detroit-Hamtramck Assembly and Oshawa Assembly – all build slow-selling cars.

The issue will be addressed in talks with the United Auto Workers union next year. GM Chief Executive Mary Barra made calls early on Monday to disclose the plans, the sources said.

The company is expected to officially announce its latest round of ‘cost cutting’ measures on Monday.

* * *

With car sales in the US and China locked in a precipitous slowdown that is only expected to worsen, GM on Monday announced the closure of one of its oldest Canadian plants as the company hopes to move more production to Mexico and (hopefully) bolster its lagging shares, Reuters reported. The company’s plant in Oshawa, Ontario – the plant in question – produces slow-selling Chevrolet Impala and Cadillac XTS sedans, while also completing final assembly of the better-selling Chevy Silverado and Sierra pickup trucks, which are shipped from Indiana.

https://www.zerohedge.com/sites/default/files/inline-images/2018.11.26gm.JPG?itok=Z1UvlW9C

The outcry from the union and local officials is already causing political pressure on GM to mount after the carmaker accepted billions of dollars in subsidies from the Canadian and US governments after filing for bankruptcy nearly a decade ago. But the company must weigh these considerations against the demands of Wall Street analysts, who believe that GM has too many plants in North America. Signaling the start of the car maker’s latest cost-cutting initiative, the company said on Oct. 31 that about 18,000 of its 50,000 salaried employees in North America would soon be eligible for buyouts.

Two sources told Bloomberg that the announcement of the plant’s closure is expected on Monday.

The closure is not unexpected. In a message to employees last month, GM CEO Mary Barra cited the stagnant share price as a reason for tougher restructuring measures.

Unifor, the Canadian autoworkers union that represents the plant’s employees, told Bloomberg that it has been told there is no car production planned at the factory beyond next year, raising the prospect of talks to preserve jobs. Unifor National President Jerry Dias said back in April that the Oshawa complex had been slated for closure in June of this year. But he added that one top GM Canada executive had vowed that it wouldn’t close on his watch.

“We have been informed that, as of now, there is no product allocated to the Oshawa assembly plant past December 2019,” Unifor said in a written statement Sunday night. “Unifor does not accept this announcement and is immediately calling on GM to live up to the spirit” of a contract agreement reached in 2016, the union said.

[…]

The survival of the factory was a key issue in the automaker’s 2016 labor talks with Unifor, the union that represents tens of thousands of autoworkers in Canada. As part of that settlement, GM had agreed to spend some C$400 million ($302 million) in the Oshawa operations, Bloomberg News reported at the time. The union hailed the agreement as part of an effort to stem the loss of jobs to Mexico.

During its latest earnings call, GM CEO Mary Barra said at the New York Times DealBook conference earlier this month that the company had negative cash flow for the first nine months of the year and it needed to cut costs, according to the Detroit News.

Canadian lawmakers said they’re fighting to keep the plant open because thousands of jobs are on the line.

“We are aware of the reports and we will be working in the coming days to determine how we can continue supporting our auto sector and workers,” a Canadian government official said.

“The jobs of many families are on the line,” said Colin Carrie, a Member of Parliament for Oshawa. “Communities all over Ontario would be devastated if this plant were to close.”

Oshawa Mayor John Henry told CBC that he hopes the planned closure is “just a rumor”, and that he had not spoken to anyone from GM. According to the carmaker’s website, the Assembly plant in Oshawa employs roughly 2,800 workers – down from ten times that number in the early 1980s. Production at the plant began in November 1953.

“It’s going to affect the province, it’s going to affect the region…the auto industry’s been a big part of the province of Ontario for over 100 years,” Henry said.

As the CBC pointed out, the Oshawa plant was a talking point during the negotiations for Trump’s USMCA (Nafta 2.0) deal. “Every time we have a problem…I hold up a photo of the Chevy Impala,” Trump once said about the negotiations.

In a tweet, one conservative Canadian lawmaker lamented the news of the closure.

And while this closure would certainly be bad news for Canada, the situation could always get worse – particularly if Congress refuses to pass Trump’s USMCA trade deal, raising the possibility that the US, Canada and Mexico would revert to WTO rules, potentially throwing GM’s foreign North American operations into chaos.

Source: ZeroHedge

***

Market Shifts – Major North American GM Workforce Reduction Announced Due to Declining Sales of Sedan Vehicles…

What the best solution for North American workers?

Desperate Home Builders Offering $100,000 Discounts, Free Vacations Amid Cooling Market

As US home sales begin to cool off, homebuilders have begun to panic – offering price cuts of more than $100,000 along with free upgrades such as media rooms, cabinets and blinds – reports Bloomberg

https://www.zerohedge.com/sites/default/files/inline-images/price%20reduced.jpg?itok=9-FrnmTFThat’s not all, real estate brokers are being enticed with free vacations such as trips to Lake Tahoe, Santa Barbara, Cabo San Lucas and even a dude ranch in Wyoming – all in the hopes that they will steer buyers towards houses in slowing markets.

This generosity flows from increasingly desperate home builders. Hot markets are cooling fast as interest rates rise. In the great housing slowdown of 2018, shoppers are reclaiming the upper hand, after years of soaring prices that placed most inventory out of reach for many families. “Everybody is hungry for the buyers,” Konara says. –Bloomberg

https://www.zerohedge.com/sites/default/files/inline-images/nhsl.png?itok=nSkT70icBuilders are definitely feeling the heat right now, as new home purchases dropped in September to the weakest pace since December 2016. Meanwhile, previously owned home sales dropped for a sixth straight month – the worst streak since 2014, according to Bloomberg. Investors in home building stocks are also feeling the pain, as the sector has lost more than a third of its value this year. 

There are pockets of robust housing activity still, however – as rising wages have put more homes in reach; starter homes are still in demand, while some smaller and more affordable markets – such has Grand Rapids, MI and Columbus, Ohio remain strong. Still, the overall trend does not look good.

https://www.zerohedge.com/sites/default/files/inline-images/housing%20stocks.png?itok=kgzThkDS

On top of interest rates, sellers in some regions face added challenges. President Trump’s tax overhaul places caps on tax deduction for mortgage interest and property taxes, hurting high-tax regions such as New York’s suburbs. In Manhattan, added supply is about to hit the market, with 4,000 new condo units to be listed for sale in 2019, almost twice as many as this year, according to brokerage Corcoran Sunshine Marketing Group. –Bloomberg

Another factor hindering home sales, according to Bloomberg, are restrictions on immigration which have made high-skilled workers in places like San Jose and Austion hesitant to buy, while a strengthening dollar has made US investment properties less appealing to wealthy buyers in South America, and Chinese buyers snapping up homes up and down the West Coast. 

In Seattle, where home prices have doubled since 2012, builders are offering cash for customers to “buy down” mortgage rates—that is, pay to get a lower interest rate. “Builders are calling us,” says Andy McDonough, senior vice president at HomeStreet Bank, which works with the companies on such promotions. “They weren’t doing this earlier because buyers were lining up.” –Bloomberg

The shifting real estate tide is perhaps most noticeable in previously sizzling markets – such as Fricso, Texas. Located 30 miles north of Dallas and full of newly constructed master planned communities, its population nearly doubled over the past decade to 177,000, while its jump of 8% last year made it the fastest-growing city in America. 

https://www.zerohedge.com/sites/default/files/inline-images/house%20being%20built.jpg?itok=9o9Fj67pAll is not well in Frisco, however, as home sales have all but ground to a screeching halt. 

On a recent weekday, Konara, the real estate broker, drives his Dodge minivan along Highway 380, a builder battleground, where national giants such as Lennar, Toll Brothers, and PulteGroup go head to head with Texas companies. He stops at sales offices, where balloons festoon posts in a vain effort to spur sales. He points to empty houses that he says were completed six months ago.

His own sales are half what they were in 2016. In many cases, he’s rebating to customers all but $1,000 of his commission on each home sale. He walks into an Indian restaurant for lunch and looks up at the television screen. A competitor, the “Maximum Cash Back Realtor,” says he’ll take only $750. “You know what that means,” Konara says. “I’ll have to do the same.” –Bloomberg

Konara received a call from Raj Patel, a 35-year-old pharmacist with two young children. Weeks away from finalizing a purchase of a $699,000 new home with “four bedrooms, a grand staircase, two patios, a balcony, a game room, a media room, and a three-car garage,” the buyer is paying $90,000 less than the advertised price – and still has reservations considering that a builder in the same community is selling a similar house with the same “bells and whistles” for $75,000 less than that

https://www.zerohedge.com/sites/default/files/inline-images/rediuced%202.jpg?itok=Gy-s3HoL
Konara tells Patel “the market is getting soft,” to which the pharmacist replies “Hopefully the market doesn’t dip much more than this.” 

Nearby, Jennifer Johnson Clarke relaxes on a couch in the living room of a model home in Frisco. There’s a wet bar to her right, a 23-foot ceiling above and an indoor Juliet balcony. Not long ago, the $1.2 million house would have been a hot commodity. Clarke, director of sales for Shaddock Homes, a 50-year-old family-owned builder, will have to work harder to sell homes based on this model. –Bloomberg

“We have an oversupply. Too many lots came on the market in the last 12 to 16 months, and demand has fallen off a cliff,” says Clarke. “I’ve not offered incentives on any scale like I’ve offered this year.” 

Source: ZeroHedge

Credit “Death Spiral” Begins As Loan ETF Sees Massive Outflows, Liquidates Quality Paper

One week after even the IMF joined the chorus of warnings sounding the alarm over the unconstrained, unregulated growth of leveraged loans, and which as of November included the Fed, BIS, JPMorgan, Guggenheim, Jeff Gundlach, Howard Marks and countless others, it appears that investors have finally also joined the bandwagon and are now fleeing an ETF tracking an index of low-grade debt as credit spreads blow out and cracks appear across virtually all credit products.

Not only has the $6.4 billion BKLN Senior Loan ETF seen seven straight days of outflows, with investors pulling $129 million on Wednesday alone and reducing the fund’s assets by 2% to the lowest level in more than two years, but over 800 million has been pulled in last current month, the biggest monthly outflow ever as investors are packing it in.

https://www.zerohedge.com/sites/default/files/inline-images/bkln%20loan.jpg?itok=lKtR3fpZ

Year to date, the shares of the largest ETF backed by the risky debt are down 1.7% and reached their lowest since April 2016; the ETF’s underlying benchmark, the S&P/LSTA Leveraged Loan Index, has also been hit recently and is down 0.6% YTD.

What is more concerning is that what has been a mere trickle of selling appears to be evolving into a full blown liquidation: some 29 million shares of BKLN, worth $654 million, traded on Tuesday – mostly on the downside – resulting in a record trading day for the fund and more than eight times its average daily turnover for the past five years.

https://www.zerohedge.com/sites/default/files/inline-images/BKLN%20etf%20volume.jpg?itok=YylVppR2

Speaking to Bloomberg, Yannis Couletsis, principal at Credence Capital Management said that “outflows for BKLN have most probably to do with the most recent deterioration of the credit environment,”; he ascribed the ETF’s drift on the deterioration of low-grade credit and “repricing of investors’ forecast regarding the path of Federal Reserve’s interest rate hikes.”

Couletsis pointed to widening credit spreads and the fact that BKLN has floating-rate underlying instruments, assets that become less attractive than fixed-rate ones should the Fed skip its March rate hike, as some are anticipating.

The loan ETF puke comes at a time when both US investment grade and junk bond spreads have blown out this week the most in nearly two years, while yields spiked to a 30-month high this month. In fact, investment grade bonds are on track for their worst year in terms of total returns since 2008.

“The price action in the ETF hasn’t warranted investors to justify keeping it on to collect the monthly coupon it pays,” said Mohit Bajaj, director of exchange-traded funds at WallachBeth Capital. “The risk/reward hasn’t been there compared to short-term treasury products like JPST,” he added, referring to the $4.2 billion JPMorgan Ultra-Short Income ETF, which hasn’t seen a daily outflow since April 9.

https://www.zerohedge.com/sites/default/files/inline-images/HY%20and%20IG%20nov%2023.jpg?itok=bwBgL1Y1

BLKN isn’t alone: investors have pulled $1.5 billion from loan funds since mid-October. According to a note from Citi strategists Michael Anderson and Philip Dobrinov, leveraged loans in the U.S. may no longer be the “star performer” amid a potential pause in rate hikes by the Fed, while the recent redemption scramble has caused ETFs to offload better quality loans to raise cash, according to the Citi duo. That’s despite leveraged loan issuance being at its highest since 2008 and returns on the S&P/LSTA Leveraged Loan Index at about 3.5 percent so far this year.

If investors are, indeed, unloading to raise cash, Anderson and Dobrinov write “this is a bearish sign, particularly if outflows persist and managers eventually turn to deep discount paper for cash. Furthermore, as we get closer to the end of the Fed’s hiking cycle, we expect further outflows as traditional fixed-rate credit products become more in vogue.”

Incidentally the behavior described by Citi’s strategists, in which ETF administrators first sell high quality paper then shift to deep discount holdings, was one of the catalysts that hedge fund manager Adam Schwartz listed three weeks ago as a necessary condition for credit ETFs to enter a “death spiral.” And with virtually everyone – including the Fed, BIS and IMF – all warning that the next crisis will begin in the leverage loan sector, the question to ask is “has it begun.”?

Source: ZeroHedge


Home Builders Come Clean – Admit Housing Market Optimism Has Collapsed

As Upton Sinclair once famously said:

“It is difficult to get a man to understand something, when his salary depends on his not understanding it.”

But, after a couple of years of exuberant ignorance, home builders have finally started to face reality – or admit reality – slashing their optimism about the US housing market dramatically…

Against expectations of a 67 print, NAHB’s optimism index crash from 68 to 60 in November – its biggest drop since 2014 (to its lowest since Aug 2016) as the highest borrowing costs in eight years restrain demand, adding to signs of a cooling housing market.

Of course the ‘hard’ housing data has been collapsing for months…

https://www.zerohedge.com/sites/default/files/inline-images/2018-11-19_7-07-07.png?itok=GQ7B8OBT

The home builder index represents one of the first breaks in high levels of business and consumer confidence that have persisted since Trump was elected.

“Rising mortgage interest rates in recent months coupled with the cumulative run-up in pricing has caused housing demand to stall,” NAHB Chief Economist Robert Dietz said in a statement accompanying the data.

“Given that housing leads the economy, policy makers need to focus more on residential market conditions.”

Under the covers, the NAHB sub-index measuring current sales fell seven points to 67, the lowest since August 2016, while the index for the six-month outlook for transactions dropped 10 points to 65, the lowest since May 2016. A measure of prospective buyer traffic declined eight points to 45, also the lowest since August 2016.

Optimism fell across all regions with The West and Northeast falling the most.

Source: ZeroHedge

US Household Debt Hits Record $13.5 Trillion As Delinquencies Hit 6 Year High

Total household debt hit a new record high, rising by $219 billion (1.6%) to $13.512 trillion in Q3 of 2018, according to the NY Fed’s latest household debt report, the biggest jump since 2016. It was also the 17th consecutive quarter with an increase in household debt, and the total is now $837 billion higher than the previous peak of $12.68 trillion, from the third quarter of 2008. Overall household debt is now 21.2% above the post-financial-crisis trough reached during the second quarter of 2013.

Mortgage balances—the largest component of household debt—rose by $141 billion during the third quarter, to $9.14 trillion. Credit card debt rose by $15 billion to $844 billion; auto loan debt increased by $27 billion in the quarter to $1.265 trillion and student loan debt hit a record high of $1.442 trillion, an increase of $37 billion in Q3.

https://www.zerohedge.com/sites/default/files/inline-images/total%20household%20debt%20q3%202018.jpg?itok=opBhuGsn

Balances on home equity lines of credit (HELOC) continued their downward trend, declining by $4 billion, to $432 billion. The median credit score of newly originating mortgage borrowers was roughly unchanged, at 760.

https://www.zerohedge.com/sites/default/files/inline-images/household%20debt%20q3%202018.jpg?itok=cL23-bYh

Mortgage originations edged up to $445 billion in the second quarter, from $437 billion in the second quarter. Meanwhile, mortgage delinquencies were unchanged improve, with 1.1% of mortgage balances 90 or more days delinquent in the third quarter, same as the second quarter.

Most newly originated mortgages continued went to borrowers with the highest credit scores, with 58% of new mortgages borrowed by consumers with a 760 credit score or higher.

https://www.zerohedge.com/sites/default/files/inline-images/originations%20q3%202018.jpg?itok=qy4GKtMH

The median credit score of newly originating borrowers was mostly unchanged; the median credit score among newly originating mortgage borrowers was 758, suggesting that with half of all mortgages going to individuals with high credit scores, mortgages remain tight by historical standards. For auto loan originators, the distribution was flat, and individuals with subprime scores received a substantial share of newly originated auto loans.

In what will come as a surprise to nobody, outstanding student loans rose $37BN to a new all time high of $1.44 trillion as of Sept 30. It should also come as no surprise – or maybe it will to the Fed – that student loan delinquencies remain stubbornly above 10%, a level they hit 6 years ago and have failed to move in either direction since…

https://www.zerohedge.com/sites/default/files/inline-images/delinquent%20balances%20q3%202018.jpg?itok=EOHP5Bnm

… while flows of student debt into serious delinquency – of 90 or more days – spiked in Q3, rising to 9.1% in the third quarter from 8.6% in the previous quarter, according to data from the Federal Reserve Bank of New York.

https://www.zerohedge.com/sites/default/files/inline-images/transitions%20into%20delinq.jpg?itok=rV_NSyqF

The third quarter marked an unexpected reversal after a period of improvement for student debt, which totaled $1.4 trillion. Such delinquency flows have been rising on auto debt since 2012 and on credit card debt since last year, which has raised a red flag for economists.

Auto loan balances also hit an all time high, as they continued their six-year upward trend, increasing by $9 billion in the quarter, to $1.24 trillion. Meanwhile, credit card balances rose by $14 billion, or 1.7%, after a seasonal decline in the first quarter, to $829 billion.

Despite rising interest rates, credit card delinquency rates eased slightly, with 7.9% of balances 90 or more days delinquent as of June 30, versus 8.0% at March 31. The share of consumers with an account in collections fell 23.4% between the third quarter of 2017 and the second quarter of 2018, from 12.3% to 9.4%, due to changes in reporting requirements of collections agencies.

Auto loan balances also hit an all time high, as they continued their six-year upward trend, increasing by $27 billion in the quarter, to $1.265 trillion. Meanwhile, credit card balances rose by $15 billion to $844 billion. In line with rising interest rates, credit card delinquency rates rose modestly, with 4.9% of balances 90 or more days delinquent as of Sept 30, versus 4.8% in Q2.

Overall, as of September 30, 4.7% of outstanding debt was in some stage of delinquency, an uptick from 4.5% in the second quarter and the largest in 7 years. Of the $638 billion of debt that is delinquent, $415 billion is seriously delinquent (at least 90 days late or “severely derogatory”). This increase was primarily due to the abovementioned increase in the flow into delinquency for student loan balances during the third quarter of 2018. The flow into 90+ day delinquency for credit card balances has been rising for the last year and remained elevated since then compared to its recent history, while the flow into 90+ day delinquency for auto loan balances has been slowly trending upward since 2012. About 215,000 consumers had a bankruptcy notation added to their credit reports in 2018Q3, slightly higher than in the same quarter of last year. New bankruptcy notations have been at historically low levels since 2016.

This quarter, for the first time, the Fed also broke down consumer debt by age group, and found that debt balances remain more concentrated among older borrowers. The shift over the past decade is due to at least three major forces. First, demographics have changed with large cohorts of baby boomers entering into retirement. Second, demand for credit has shifted, along with changing preferences and borrowing needs following the Great Recession. Finally, the supply of credit has changed: mortgage lending has been tight, while auto loans and credit cards have been more widely available.

https://www.zerohedge.com/sites/default/files/inline-images/borrowing%20age%20group.jpg?itok=5PLsESYJ

In addition to an overall increase in the share of debt held by older borrowers, there has been a noticeable shift in the composition of debt held by different age groups. Student and auto loan debt represent the majority of debt for borrowers under thirty, while housing-related debt makes up the vast majority of debt owned by borrowers over sixty.

https://www.zerohedge.com/sites/default/files/inline-images/loans%20by%20age%20group%20q3%202018.jpg?itok=ygoRLkGs

Confirming what many know, namely that Millennial borrowers are screwed, the Ny Fed writes that older borrowers have longer credit histories with more borrowing experience, as well as higher and typically steadier incomes; “thus, they often have higher credit scores and are safer bets for lenders.” Tighter mortgage underwriting during the years following the Great Recession has limited mortgage borrowing by younger and less creditworthy borrowers; meanwhile, student loan balances – and as most know “student” loans are usually used for anything but tuition – and participation rose dramatically and credit standards loosened for auto loans and credit cards. Consequently, there has been a relative shift toward non-housing balances among younger borrowers, while housing balances moved to the older and more creditworthy borrowers with lower delinquency rates and better performance overall.

And since this is a circular Catch 22, absent an overhaul of how credit is apportioned by age group, Millennials and other young borrowers will keep getting squeezed out of the credit market resulting in a decline in loan demand – and supply – which is slow at first and then very fast.

Source: ZeroHedge

“A Rough Decade Ahead” – ‘Math’ & The Future Of The US Housing Market

Authored by Chris Hamilton via Econimica blog,

Summary

  • New Housing is being Created at an Unprecedented 2.5x’s the pace of the Growth of the 15 to 64yr/old Population
  • Total Annual Population Growth Has Slowed 25% from Peak Growth, 2 Decades Ago
  • However, Annual Population Growth Among 15 to 64yr/olds Has Slowed Over 80% From Peak Growth & Will Continue Decelerating Through 2030
  • 15 to 64yr/olds Do Nearly all the Net Home Buying, 65+yr/olds Net Home Selling
    • 15 to 64yr/olds Have a 70% Labor Force Participation Rate vs. 27% for 65-74yr/olds, just 8% for 75+yr/olds
    • 15 to 64yr/olds Earn and Spend Double that of 65-74yr/olds & triple that of 75+yr/olds
    • 65+yr/olds Have Highest Home ownership Rate at 78% vs. Just 36% for Group with Lowest Rate, 15 to 34yr/olds
    • 15-64yr/olds are Credit Willing Relative to Credit Averse 65+yr/olds

I read an article a few days ago that got me thinking.  The article’s author claimed,

“At 5% mortgage rates and with today’s level of affordability, history shows that there is nothing in the way from having a home building boom over the next ten years to satisfy this demographic demand.”

I found the claim contrary to everything I think I know, so I thought I’d lay out the counter argument.

The chart below shows annual growth of the 15+yr/old US population (blue columns) vs. the annual growth of the 15 to 64yr/old population (red balls).  The 15+yr/old annual population growth has fallen 25% (decline of a half million annually) since the 1998 peak but more significantly, the 15 to 64yr/old annual population growth has fallen over 80% (decline of 1.8 million/yr) due to a combination of lower immigration rates and lower birth rates.

https://www.zerohedge.com/sites/default/files/inline-images/40246456-1540573727993815.png?itok=TOw6SAp-

These population growth trends will only continue to slow through 2030, according to UN and Census estimates (not really estimates, since this population is already born and simply advancing into adulthood).  The future estimates for 15 to 64yr/old population growth (presented above) include estimated immigration well above present rates.  Most, if not all (net) of the assumed 15 to 64yr/old minimal population growth is premised on ongoing immigration that continues slowing.  Thus the forward looking 15 to 64yr/old growth estimates are likely to be lower and perhaps even turning to outright annual declines.

The chart below shows average income, spending, and LFP (labor force participation) rates by age segment.  No shocker, those actively working make and spend more than those with low rates of employment.  Those who have worked longer earn more than those new to the labor force.  Elderly expenditures come into very close alignment with their (generally) fixed incomes.

https://www.zerohedge.com/sites/default/files/inline-images/40246456-15405775019409947.png?itok=pGk1ZXnO

Noteworthy is that 75+yr/olds have only an 8% LFP rate but will make up over half of the total 65+yr/old population growth through 2030.  The next largest growth segment is among 70 to 74yr/olds with a 19% LFP rate, and the smallest increase is among the 65 to 69yr/olds with a 32% LFP.   As an aside, 65+ year olds have the highest home ownership rates at 78% vs. 36% for those aged 15 to 34. So while the more affluent portion (5% to 20%?) of 65+yr/olds may be interested in a second home in the desert, the mountains, or beach…the majority already own and are eventually looking to downsize.  Simply stated, nearly all the coming growth is among those that work the least, earn the least, spend the least, already own homes, and are more likely to downsize than buy a second home.

https://www.zerohedge.com/sites/default/files/inline-images/40246456-15405820325401883.png?itok=tYwxN_9R

Putting it all together (chart below), annual 15+yr/old total population growth (blue columns), 15 to 64yr/old population growth (red line), housing starts (yellow line), and federal funds rate (black line).  Given it is the 15 to 64yr/old population that does the net home buying, (and growth among them continues decelerating…coupled with rising rates and elevated valuations versus most population growth among 75+yr/olds who are more likely to sell via downsizing and/or willing properties to their heirs) I contend the US is creating too many homes presently, not too few.  Of course, this doesn’t even factor in things like the lack of income growth among the vast majority those working, high student debt loads, slowing household formation, continued delayed family formation and the lowest birth rates in US history which were just recorded in the first quarter of 2018 (according to CDC…HERE), etc. etc.

https://www.zerohedge.com/sites/default/files/inline-images/40246456-15405930794152036.png?itok=DjqawWsJ

Contrary to the author of the article that inspired me, I contend that housing is in for another very rough decade (at the very least)… likely worse than the period during the GFC.  The math is pretty straightforward on this one.

Source: ZeroHedge

Aussie Home Prices Could Collapse 30%: UBS

https://cdn.newsapi.com.au/image/v1/af3759af717e8fe89dd7def8708517ab

Queensland Australia

A new analysis by UBS concludes that housing prices in Australia could fall as much as 30% in a deep recession scenario. UBS analyst Jonathan Mott assembled five different scenarios to predict the direction that Australia’s housing market could go. The worst case includes the first recession in 27 years, a 30% collapse in house prices and widespread litigation against the banks for mortgage mis-selling. The bear case would also include the central bank cutting rates to zero before embarking on its own version of quantitative easing, the suspension of dividends and equity raisings from the big banks.

Mott thinks that current conditions are already reflecting the very real possibility of a housing correction and also warns that risk of a credit crunch “is real and rising.”

Mott stated: “The rapidly deteriorating housing market is a signal of even tougher times ahead. The housing credit squeeze experienced over the last six months is expanding. The outlook for the banks has not been as challenged since at least 2008.”

UBS dire forecast comes at a time when tighter lending standards have restricted the availability to borrow in Australia, causing the country to enter its second year of a housing slide. Major cities like Sydney and Melbourne are leading the declines, down 7.4% and 4.7% in October from the previous year, respectively. These were the two hottest markets when prices were on their way up in years prior. Meanwhile, the Australia House Price Index has posted its first sequential decline only for the first time since 2011.

https://www.zerohedge.com/sites/default/files/inline-images/australia%20house%20price%20index.jpg?itok=1kr6GoqM

Meanwhile, the Reserve Bank of Australia has kept its rate cash rate unchanged and at a relatively low 1.5% since the middle of 2016. The crunch is coming mainly from regulators cracking down on riskier loans, such as interest-only mortgages, that are more popular with speculators than traditional buyers. On top of that, Australian Regulators have enforced more stringent verification on expenses that is tightening the amount of money people are able to borrow as Australians already have some of the highest household debt in the world, something we pointed this in August.

https://www.zerohedge.com/sites/default/files/inline-images/aussie%20household%20debt.jpg?itok=cD15MvYd

As a reminder, the Australian household debt to income ratio has ballooned to shocking levels over the past three decades as Sydney is ranked as one of the most overvalued cities in the world. According to the Daily Mail Australia, credit card bills, home mortgages, and personal loans now account for 189 percent of an average Australian household income, compared with just 60 percent in 1988:

https://www.zerohedge.com/sites/default/files/inline-images/Australia%20household%20leverage.jpg?itok=_9Eq_LU_

An additional reason Australia’s housing prices boomed was the influx of overseas capital. We recently discussed the urgency with which the Chinese middle class was trying to get capital out of the country. And one of the main ways to do this involved investing in homes in places like Australia (and Canada). Those looking to buy real estate outside of the country have negatively impacted many local economies, sometimes causing housing markets to bubble.

https://www.zerohedge.com/sites/default/files/inline-images/china%20residency%20australia_0_0.jpg?itok=DNhX9E37

In response, Australia has tightened its foreign investment rules. In 2016, the land Down Under even made it illegal for the country’s four major banks to lend to foreign property buyers without domestic incomes. New Zealand went so far as to simply prohibit foreigners from buying property altogether because the demand was driving property prices out of the reach of locals. Canada did something similar, canceling its Canadian Federal Immigrant Investor program because of the huge backlog and bubbly real estate markets in places like Vancouver and Toronto.

Source: ZeroHedge

“Things Are Getting Worse”: Mall Owners Hand Over The Keys To Lenders Before They Even Default

For years, traditional malls around the United States have been in a state of partial or full collapse thanks to “the Amazon effect”: deteriorating conditions, bankrupt or cash-bleeding tenants, with some even transforming into homeless shelters as the retail industry “evolves”. 

In other words, as Bloomberg writes, “things are getting worse for malls across America.” So much worse, in fact, that their owners are simply walking away early from struggling properties, a trend that has sparked fears of material losses among mortgage bond investors.

https://www.zerohedge.com/sites/default/files/inline-images/mall_1_0.jpg?itok=EtE2X3FQ

Investors in and lenders to malls across America are bracing for the fallout from the disappearance of the brick and mortar sub-sector of the industry. With the recent bankruptcy of retail giant Sears, mall operators are continuing to see accelerating defaults in the wake of numerous other retail bankruptcies from stores like Bon-Ton, Wet Seal and RadioShack, and many others, resulting in abrupt declines in rental and lease payments.

And amid the ongoing collapse in what was once a staple source of shopping and entertainment for “middle America”, many mall owners are simply turning over the keys to lenders even before their lease is over, according to Bloomberg. That puts the loan servicing companies in a position to either try to run the properties themselves or turn around and sell them. If they can’t make the debt payments, the new owners of the commercial mortgage backed securities in turn end up facing the consequences themselves.

While much of the noise surrounding the “big mall short” which dominated the 2017 airwaves has faded, the number of mall loans issued since the financial crisis that identified as “highest risk” has almost tripled to 29 this year. And the consequences are becoming painfully visible. The Washington Prime Group REIT last month simply gave up on two malls in Kansas where the loans had either defaulted or were close to default. This month, Pennsylvania REIT announced that it left a mall in Wilkes-Barre that also had a loan ready for default. The PA REIT is considering abandoning another mall in Wisconsin for the same reason.

Ben Easterlin, head of commercial lending at Atlanta-based Angel Oak Companies, told Bloomberg that many small town malls are no longer being included in CMBS packages. “It’s easier to value a mall in L.A. than it is in Sheboygan,” he said. “We talk about these malls all day long. We have not seen any of these malls in a CMBS lately and don’t expect to, frankly.

Meanwhile, even though the delinquency rate right in the commercial mortgage backed securities market is at post-crisis lows now, the pain will likely take a couple of years to show up due to maturities that won’t occur for several years.

Adding to the pain, stores leaving these malls often cause a waterfall effect because of co-tenancy clauses that are included in many small mall leases. These clauses mean that if there aren’t enough tenants in a mall at a given time, other tenants have the option to leave. So when a “major” anchor-store company – like Sears – closes a bunch of stores, it can triggers clauses releasing other stores from their contractual leases, further hitting the mall and its creditors.

Still, not all investors see this as Armageddon.

The Galleria at Pittsburgh Mills was seen as an investment opportunity by New York-based Namdar Realty Group and Mason Asset Management, who bought the property for $11.35 million earlier this year after it was once valued at $190 million in 2006, before it was packaged into a commercial mortgage backed securities pool.

https://www.zerohedge.com/sites/default/files/inline-images/PA%20mall%20mortgages.jpg?itok=pAd1ixn0

Steve Plenge, managing principal of Pacific Retail, is another optimist who sees today’s climate as opportunistic. His firm has taken over at least two malls that have been returned to lenders after defaults. He told Bloomberg: “we think this sector, the servicing business, will get bigger for us. There will be more defaults, more foreclosures.”

We agree. In fact, at the beginning of October we noted that mall vacancies had hit 7 year highs. And, according to a WSJ report, the average rent for malls in the third-quarter fell 0.3% to $43.25 a square foot. This is down from $43.36 in the second quarter and is the first time this number has fallen sequentially since 2011, according to research firm Reis, Inc.

At the same time, vacancy rates are on the ascent, rising to 9.1% in the third quarter from 8.6% in the second quarter, and the highest they’ve been since the third quarter of 2011, when these rates hit 9.4%. 

Barbara Denham, senior economist with Reis, told the Journal: “The retail sector is still correcting”. And, as long as ever more people continue to migrate to online retailers (or buying less stuff in general), it will be for years.

Source: ZeroHedge

Is The Corporate Debt Bubble Bursting? GE’s 5% Perpetual Bond Falls To $79 While Stock Goes Sub-$10

Last decade, there was a residential mortgage credit bubble that burst. While there doesn’t appear to be a residential mortgage credit bubble (well, just a little), there is most definitely a corporate debt credit bubble that appears to be bursting.

Take General Electric. Their stock price has slipped to under $10 per share from over $30 per share back in early 2017 while the 5% perpetual bond has rapidly gone from around par ($100) to $79 in the wink of The Fed’s eye.

https://confoundedinterestnet.files.wordpress.com/2018/11/geperp.png

Of course, GE’s earnings-per-share have been tanking as interest rates have been rising.

https://confoundedinterestnet.files.wordpress.com/2018/11/geearn.png

And to make matters worse, US investment grade debt is on track for worst year since 2008.

https://confoundedinterestnet.files.wordpress.com/2018/11/corpbondpain.png

Like Robot Monster, the Federal Reserve has helped to create bubbles in the corporate bond market.

Source: Confounded Interest


“The Collapse Has Begun” – GE Is Now Trading Like Junk

Two weeks after we reported that GE had found itself locked out of the commercial paper market following downgrades that made it ineligible for most money market investors, the pain has continued, and yesterday General Electric lost just over $5bn in market capitalization. While far less than the $49bn wiped out from AAPL the same day, it was arguably the bigger headline grabber.

The shares slumped -6.88% after dropping as much as -10% at the lows after the company’s CEO, in an interview with CNBC yesterday, failed to reassure market fears about a weakening financial position. The CEO suggested that the company will now urgently sell assets to address leverage and its precarious liquidity situation whereby it will have to rely on revolvers – and the generosity of its banks – now that it is locked out of the commercial paper market.

https://www.zerohedge.com/sites/default/files/inline-images/GE%20CP%20hole.jpg

Indeed, shares hit levels first seen in 1995 yesterday and have only been lower since, very briefly, during the financial crisis when they hit $6.66 in March 2009. For a bit of perspective, Deutsche Bank notes that the market cap of GE now is $69.5bn and it’s the 80th largest company in the S&P 500. Yet in August 2003, GE was the largest company in the index (and regularly the world between 1993-2005) at a market cap of $296bn, $12bn more than Microsoft in second place. Since then, the tech giant has grown to be a $826bn company well over 10 times the size, while GE’s market cap peaked (ironically) during the dot com bubble in August 2000 at $594BN before tumbling first in the tech crash and then the GFC.

But while most investors have been focusing on GE’s sliding equity, the bigger concern is what happens to the company’s giant debt load, especially if it is downgraded to junk.

First, some background: GE had about $115 billion of debt outstanding as of the end of September, down from $136 billion a year earlier. And while GE is targeting a net EBITDA leverage ratio of 2.5x, this hasn’t been enough to appease credit raters, which have expressed concern recently that GE’s beleaguered power business and deteriorating cash flows will continue to weaken the company’s financial position. As a result, Moody’s downgraded GE two levels last month to Baa1, three steps above speculative grade. S&P Global Ratings and Fitch Ratings assign the company an equivalent BBB+, all with stable outlooks.

The problem is that while the rating agencies still hold GE as an investment grade company, the market disagrees.

GE – a top 15 issuer in both the US and EU indices – was recently downgraded into the BBB bucket, and as recently as September it was trading 20bps inside BBB- bonds. However they crossed over at the end of that month and now trade up to 50bps wide to the average of the weakest notch of IG.

https://www.zerohedge.com/sites/default/files/inline-images/GE%20vs%20BBB.png?itok=NBrvx6Au

In other words, GE is already trading like junk, and has become the proverbial canary in the coalmine for what many have said could be the biggest risk facing the bond market: over $1 trillion in potential “fallen angel” debt, or investment grade names that end up being downgraded to high yield, resulting in a junk bond crisis.

As Deutsche Bank’s Jim Reid notes, GE’s recent collapse has come at time when much discussion in recent months has been about BBBs as a percentage of the size of the HY market. Since 2005, BBBs have been steadily rising as a percentage of HY climbing back above the previous peak in 2014 (175%) before extending that growth to a current level of 274%. Meanwhile, the total notional of BBB investment grade debt has grown to $2.5 trillion in par value today, a 227% increase since 2009, and now represents 50% of the entire IG index. 

https://www.zerohedge.com/sites/default/files/inline-images/BBB%20as%20percentage%20of%20total%20debt.jpg?itok=PQMc5UWr

Next, to get a sense of just how large the risk of fallen angels in the US is, consider that the BBB part of the IG index is now ~2.5x as large as the entire HY index.

https://www.zerohedge.com/sites/default/files/inline-images/BBB%20par%20vs%20HY%20par.jpg

So large BBB companies – and none are larger than GE – with a deteriorating credit story are prone to additional widening pressure as investors fear the risks of an eventual downgrade to HY and a swamping of paper into that market. This, as Deutsche Bank writes, isn’t helping GE at the moment and may be a dress rehearsal for what happens for weaker and large BBB issuers in the next recession.

Meanwhile, while GE is not trading as a pure play junk bond just yet, it is well on its way as the following chart of GE’s spread in the context of both IG and HY shows.

https://www.zerohedge.com/sites/default/files/inline-images/GE%20spread%20IG%20vs%20HY.jpg?itok=xpv-KlGJ

Which is both sad, and ironic: as Bloomberg’s Sebastian Boyd writes this morning, “the company’s CEOs boasted of its AAA rating as a key strategic asset, but it was more than that. The rating, which it maintained for more than half a century, was symbolic of the company’s status as a champion of American commerce. Now, Microsoft and Johnson & Johnson are the only U.S. corporates with the top rating from S&P.”

And while rating agencies have yet to indicate they are contemplating further cuts to the company’s investment grade rating, the bond market has clearly awoken, and nowhere more so than in the swap space, where GE’s Credit Default Swaps have exploded in recent weeks.

https://www.zerohedge.com/sites/default/files/inline-images/2018-11-13%20%282%29.png?itok=0F9w25ah

What kind of an impact would GE’s downgrade have? With $48 billion of bonds in the Bloomberg Barclays US Corporate index, GE would become almost 9% of the BB universe. And one look at Boyd’s chart below shows that the market is increasingly pricing GE’s index-eligible bonds as junk, especially in the context of the move over the past month.

https://www.zerohedge.com/sites/default/files/inline-images/GE%20bonds%20vs%20BB%2B.jpg?itok=opTII-vm

An additional risk to the company’s credit profile: GE has more debt coming due in the next 18 months than any other BBB rated borrower: that fact alone makes it the most exposed to higher rates according to Boyd.

Meanwhile, GE’s ongoing spread blow out, and junk-equivalent price, has not escaped unnoticed, and as we have been warning for a while, could portend a broader repricing in the credit sector. As Guggenheim CIO commented this morning, “the selloff in GE is not an isolated event. More investment grade credits to follow. The slide and collapse in investment grade debt has begun.”

Then again, Minerd’s concern pales in comparison to what some other credit strategists. In an interview with Bloomberg TV on November 8, Bruce Richards, chairman and chief executive officer of the multi-billion Marathon Asset Management warned that over leveraged companies “are going to get crushed” in the next recession.  Richards also warned that when the cycle does turn, “with no liquidity in the high-yield market to speak of, when these tens of billions or potentially hundreds of billions falls into junk land, it’s “Watch out below!” because there’s going to be enormous price adjustments.”

Echoing what we said above, Richards noted that about $1 trillion of bonds are rated as BBB, as investment- grade, when they has leverage ratios worthy of junk, adding that “the magnifying glass is now shifting” toward ratings companies.

https://youtu.be/U2ct33ckcMU

For now the “magnifying glass” appears to have focused on GE, and judging by the blow out in spreads for this “investment grade” credit, what it has found has been unexpected. Which brings us to the question we asked at the top: will GE be the canary in the credit crisis coalmine and, when the next crisis finally does strike, the biggest fallen angel of them all?

Source: ZeroHedge

***

“There Is No Corner To Hide”: $100 Billion Fund Manager Warns Credit Rout Is Just Starting

Without that central bank support and transitioning off the fiscal stimulus, our long-term outlook for investment grade is definitely on the more bearish side over the last two to three years.”

Wells Fargo: ‘Shareholders Can’t Sue Us Because They Should Have Known We Were Lying’

Wells Fargo is adopting an unusual defense against a shareholder lawsuit: claiming, essentially, that shareholders can’t hold the bank accountable for CEO Tim Sloan’s statements that it was “working to restore trust” and be “more transparent” about its scandals – because it should have been obvious that Sloan was lying.

The defense, which Wells Fargo put forth in a legal filing aimed at getting a shareholder lawsuit dismissed, relies on the legal concept of “puffery,” according to a Los Angeles Times report.

Generally, businesses engage in “puffery” when they make advertising claims that are vague or transparently untrue – a restaurant claiming it has “the world’s best burgers,” for instance. Judges and regulators have ruled that claims like that are so obviously inflated that consumers won’t take them seriously. Such claims aren’t actionable in court, the Times reported.

The thing is, “puffery” usually applies to out sized advertising claims. Wells Fargo is now claiming that the “puffery” defense should be applied to statements CEO Tim Sloan made to investors, and that a lawsuit filed by shareholders should be dismissed on those grounds.

The lawsuit stems from one of the bank’s many scandals – in particular the July 2017 revelation that Wells Fargo had for years been charging auto loan customers for unnecessary insurance. The lawsuit is seeking class certification for all investors who bought the company’s stock after Nov. 3, 2016, through Aug. 3, 2018, the Times reported.

It was on Nov. 3, 2016, that Sloan announced at an investor’s conference that he was “not aware” of any undisclosed scandals. In fact, Wells Fargo already knew that its improper auto insurance charges had pushed as many as 275,000 customers into delinquency and resulted in 25,000 improper repossessions. In fact, top bank executives allegedly knew of the problem as early as 2012, but took no action until 2016, according to the Times. Regulators have already slammed the bank for its inaction; earlier this year, the Consumer Financial Protection Bureau and the Office of the Comptroller of the Currency fined Wells Fargo $1 billion for the auto-insurance scandal and a rash of improper mortgage fees.

The shareholder lawsuit focuses on efforts by Sloan and other Wells Fargo executives to conceal the auto-loan scandal, the Times reported. Wells Fargo execs were, at the time, already dealing with the bank’s massive fake-accounts scandal. They insisted that Wells Fargo would be “more transparent” about its scandals even while failing to disclose the auto-insurance issue.

During an investor call in January 2017, Sloan said that the bank wanted “to leave no stone un-turned. If we find something that’s important, we’ll communicate that.”

By that time, Sloan had already received an independent report on the auto-insurance scandal, the Times reported. The scandal did not become public, however, until the independent report was leaked to the media in July 2017.

The shareholder lawsuit contends that Wells Fargo lied about its intent to be transparency. Wells Fargo, however, maintains that Sloan’s statements were “puffery.” According to the bank’s legal filing, Sloan’s comments were generic statements “on which no reasonable investor could rely.”

“This is just another example of corporate actors making statements to the market, and then trying to avoid liability for the representations they made,” Darren Robbins, the attorney bringing the shareholder suit, told the Times.

Source: by Ryan Smith | Mortgage Professional America

Yet Another Unfunded Trillion Dollar Liability, California Wildfire Damage

( John Rubio-DollarCollapse) Yesterday an entire California town burned down. Paridise, CA has (had) 27,000 residents and over 1,000 buildings, and now it’s pretty much gone. A fire started nearby on a windy day and within hours everything was ash and cinders.

That fire and several others are still expanding across the state, threatening tens of thousands of homes. The sets of the TV show WestWorld are gone. Malibu has been evacuated. And dry, windy conditions persist, so the story is nowhere near over.

If this sounds familiar, it’s because massive, sometimes uncontrollable California wildfires are now an annual occurrence, due in part to gradual warming and persistent drought which combine to suck the moisture out of vegetation and turn the landscape into a tinderbox. Here’s a chart showing the recent take-off in the number of fires reported in the state (2013 was most recent year I could find, but the trend is clear – and since then the number of fires has apparently soared).

https://www.zerohedge.com/sites/default/files/inline-images/California-wild-fires.jpg?itok=0gvK61MZ

The reason this rates coverage in a financial blog is population. We’ve been moving millions of people into a place that has always had and always will have wildfires. California’s population is now about four times what it was in 1950, and the influx continues.

https://www.zerohedge.com/sites/default/files/inline-images/California-population.jpg?itok=LGv98-Gl

Fire is a crucial part of that and many other ecosystems, clearing out dead plants to make room for living. But add 40 million humans along with their buildings and vehicles, and a healthy, resilient semi-desert becomes a hellscape.

A very expensive hellscape. What does it cost to rebuild a town of 27,000 people from scratch? A back-of-the-envelope calculation (1,000 buildings at $100,000 a pop, 15,000 cars at $25,000 per, $10,000 per person for roads, sewers, landscaping, etc) yields several hundred million dollars. For one little town.

Is California budgeting for this? Are the insurance companies? Is Washington? All probably say they are, but only the insurance companies actually are – and even they are probably under-reserved for the past few years’ natural disasters.

This is a massive public planning failure, and yet another unfunded liability – that is, a future cost incurred but not saved for – to go alongside public pensions, government debt and multiplying environmental time bombs.

The result: A future of unpleasant surprises, in which governments are constantly saying “Oops, there’s this huge new expense that no one could have foreseen, and we’re all going to have to tighten our belts to cover it, sorry about the bad roads and closed libraries” – or – “Oops, there’s a huge unforeseen expense and we’re going to have to create a trillion new dollars to cover it, sorry about the inflation.”

But isn’t this mostly a private sector issue, between homeowner and insurance company, you ask? In many cases that’s true. But insurance companies have to make a profit, which means homeowner policy premiums have to be high enough to cover expected losses. As the latter rise, so necessarily do the former. Which means the part of our cost of living that’s devoted to insurance will soar as a direct result of California’s asleep-at-the-switch population management policy.

Are California wildfires as big an unfunded liability as the one resulting from the Right Coast’s soaring Hurricane Alley population? Probably not, because fires, even big ones, are smaller than tropical storms. Still, it could easily exceed a trillion dollars (let’s see what today’s fires end up costing) which – hitting a state that’s already overburdened with unfunded pensions and crumbling infrastructure – will probably end up being added to the federal government’s balance sheet via some kind of bail-out.

All of which makes a currency reset that much more likely in the not too distant future. Paying off this mountain of debts, promises and “guaranteed surprises” with current dollars is mathematically impossible. But after a 70% devaluation the numbers might work.

Source: ZeroHedge

***

SoCal Fire May Have Ejected “Incredibly Dangerous” Radioactive Particles Into The Atmosphere

https://www.zerohedge.com/sites/default/files/styles/teaser_desktop_2x/public/2018-11/DrxFk1kU4AEHvnA.jpg?h=b9a135cd&itok=cUcfW8S8
Nearby resident: “Every person on our street has had cancer

***

California Utilities Implode, Lose A Third Of Their Value In 2 Days On Massive Fire Damages

https://www.zerohedge.com/sites/default/files/styles/teaser_desktop_2x/public/2018-11/cali%20utilities.jpg?h=3c579df2&itok=wz0WN69m

With the two giant wildfires in northern and southern California projected to result in $25 billion in damages, the shares of California’s two largest utility owners have crashed the most in nearly two decades.


***

California Wildfires Set For $25 Billion In Damages As Death Toll Hits 31; Suspected Looters Arrested

https://www.zerohedge.com/sites/default/files/styles/inline_image_desktop/public/inline-images/35256ad1-7310-462b-9b95-e2c772771d7a.jpg?itok=e8K5JwZm

***

California Wildfires: Cars Filled with Dead Bodies – Burnt Skeletons

https://i0.wp.com/halturnerradioshow.com/images/Nov-2018/CaliforniaWildfire-CarsFilledWithSkeletons.jpg?w=731

Fire Swept Through Santa Susana Nuclear Testing Site In California

The “Nightmare Scenario” For Beijing: 50 Million Chinese Apartments Are Empty

Back in 2017, we explained why the “fate of the world economy is in the hands of China’s housing bubble.” The answer was simple: for the Chinese population, and growing middle class, to keep spending vibrant and borrowing elevated, it had to feel comfortable and confident that its wealth would keep rising. However, unlike the US where the stock market is the ultimate barometer of the confidence boosting “wealth effect”, in China it has always been about housing as three quarters of Chinese household assets are parked in real estate, compared to only 28% in the US, with the remainder invested financial assets.

Beijing knows this, of course, which is why China periodically and consistently reflates its housing bubble, hoping that the popping of the bubble, which happened in late 2011 and again in 2014, will be a controlled, “smooth landing” process. For now, Beijing has been successful in maintaining price stability at least according to official data, allowing the air out of the “Tier 1” home price bubble which peaked in early 2016, while preserving modest home price appreciation in secondary markets.

How long China will be able to avoid a sharp price decline remains to be seen, but in the meantime another problem faces China’s housing market: in addition to being the primary source of household net worth – and therefore stable and growing consumption – it has also been a key driver behind China’s economic growth, with infrastructure spending and capital investment long among the biggest components of the country’s goal seeked GDP. One result has been China’s infamous ghost cities, built only for the sake of Keynesian spending to hit a predetermined GDP number that would make Beijing happy.

Meanwhile, in the process of reflating the latest housing bubble, another dire byproduct of this artificial housing “market” has emerged: tens of millions of apartments and houses standing empty across the country.

According to Bloomberg, soon-to-be-published research will show that roughly 22% of China’s urban housing stock is unoccupied, according to Professor Gan Li, who runs the main nationwide study. That amounts to more than 50 million empty homes.

The reason for the massive empty inventory glut: to keep supply low and prices artificially elevated by taking out as much inventory off the market as possible. This, however, works both ways, and while it helps boost prices on the way up as the economy grow and speculators flood the housing market with easy money, the moment the trend flips the spike in supply as empty units are offloaded will lead to a panic liquidation of homes, resulting in what may be the biggest housing market crash ever observed, and putting the US home bubble of 2006 to shame.

Indeed, as Bloomberg notes, the “nightmare scenario” for Chinese authorities is that owners of unoccupied dwellings rush to sell when cracks start appearing in the property market, causing a self-reinforcing downward price spiral.

Worse, the latest data, from a survey in 2017, also suggests Beijing’s efforts to curb property speculation – which alongside shadow banking and the persistent threat of sudden bank runs (like the one discussed last week) is considered by Beijing a key threat to financial and social stability – have failed.

“There’s no other single country with such a high vacancy rate,” said Gan, of Chengdu’s Southwestern University of Finance and Economics. “Should any crack emerge in the property market, the homes to be offloaded will hit China like a flood.”

How did the Chinese researcher obtain this troubling number? To find the percentage of vacant housing, thousands of researchers spread out across 363 Chinese counties last year as part of the China Household Finance Survey, which Gan runs at the university.

Gan said that the vacancy rate, which excludes homes yet to be sold by developers, was little changed from a 2013 reading of 22.4%. And while that study showed 49 million vacant homes, Gan puts the number now at “definitely more than 50 million units.

Meanwhile, Beijing – which is fully aware of these stats, and is also aware that even a modest price decline could be magnified instantly as millions of “for sale” units hit the market at the same time – is worried. That’s why Chinese authorities have imposed buying restrictions and limited credit availability, only to see money flooding into other areas. Rampant price gains also mean millions of people are shut out from the market, exacerbating inequality.

In fact, China’s president Xi famously said in October last year that “houses are built to be inhabited, not for speculation”, and yet a quarter of China’s housing is just that: empty, and only serves to amplify speculation.

While holiday homes and the empty dwellings of migrants seeking work elsewhere account for some of the deserted properties, Gan found that investment purchases have been the biggest factor keeping the vacancy rate high. That’s despite curbs across the country meant to discourage buying of multiple dwellings.

There is another economic cost to this speculative frenzy: the drop in supply puts upward pressure on prices and crowds young buyers out of the market, according to Kaiji Chen, who co-authored a Fed paper called “The Great Housing Boom of China.” 

And, as Americans so fondly recall, the result of chasing unaffordable homes for the purpose of price speculation has resulted in yet another unprecedented debt bubble: according to Caixin, outstanding personal home mortgages in China have exploded seven fold from 3 trillion yuan ($430 billion) in 2008 to 22.9 trillion yuan in 2017, according to PBOC data

By the end of September, the value of outstanding home mortgages had surged another 18% Y/Y to a record 24.9 trillion yuan, resulting in a trend that as Caixin notes, has turned many people into what are called “mortgage slaves.”

It has also resulted in yet another housing bubble: home mortgage debt now makes up more than half of total household debt in China. As of the third quarter, it accounted for 53% of the 46.2 trillion yuan in outstanding household debt.

For now, few are losing sleep over what will be the next massive housing bubble to burst. An example of a vacant home is a villa on the outskirts of Shanghai that 27-year-old Natalie Feng’s parents bought for her. The two-story residence was meant to be a weekend escape for the family of three. In reality, it’s empty most of the time, and Feng says it’s too much trouble to rent it out.

“For every weekend we spend there, we need to drive for an hour first, and clean up for half a day,” Feng said. She joked that she sometimes wishes her parents hadn’t bought it for her in the first place. That’s because any apartment she buys now would count as a second home, which means she’d have to make a bigger down payment.

* * *

What is troubling is that despite relatively stable home prices, the foundations behind the housing market are cracking. As the WSJ recently reported, in early December, a group of homeowners stormed the sales office of their Shanghai complex, “Central Washington”, whose developer, Shanghai Zhaoping Real Estate Development, was advertising new apartments at a fraction of the prices of the ones sold earlier in the year. One apartment owner said the new prices suggested the value of the apartment she bought from the developer in March had dropped by about 17.5%.

“There are people who bought multiple homes who are now trying to sell one to pay off the mortgage on another,” said Ran Yunjie, a property agent. One of his clients bought an apartment last year for about $230,000. To find a buyer now, the client would have to drop the price by 60%, according to Ran.

Meanwhile, in a truly concerning demonstration of what will happen when the bubble finally bursts, last month we reported that angry homeowners who paid full price for units at the Xinzhou Mansion residential project in Shangrao attacked the Country Garden sales office in eastern Jiangxi province last week, after finding out it had offered discounts to new buyers of up to 30%.

“Property accounts for roughly 70 per cent of urban Chinese families’ total assets – a home is both wealth and status. People don’t want prices to increase too fast, but they don’t want them to fall too quickly either,” said Shao Yu, chief economist at Oriental Securities. “People are so used to rising prices that it never occurred to them that they can fall too. We shouldn’t add to this illusion,” Shao added, echoing Ben Bernanke circa 2005.

But the biggest surprise once the music finally stops may be that – as a fascinating WSJ report revealed one year ago –  China’s housing downturn is likely far, far worse than meets the eye, as under Beijing’s direction more than 200 cities across China for the last three years have been buying surplus apartments from property developers and moving in families from condemned city blocks and nearby villages. China’s Housing Ministry, which is behind the purchases, said it plans to continue the program through 2020. The strategy, supported by central-government bank lending, has rescued housing developers and lifted the property market.

In other words, while China already has a record 50 million empty apartments, the real number – when excluding the government’s own stealthy purchases of excess inventory – is likely significantly higher. It is this, and not China’s stock market, that has long been the biggest time bomb for Beijing, and if Trump and Peter Navarro truly want to crush China in their ongoing trade war, they should focus on destabilizing the housing market: the Chinese stock market was, and remains just a distraction.

To summarize:

  • China has more than 50 million vacant apartments
  • Mortgage loans have grown 8-fold in the past decade
  • Prices are kept steady thanks to constant government purchases of surplus inventory
  • Home prices are already cracking, with some homebuilders forced to cut prices by 30%.
  • Homebuyers revolt, forming angry militias and storm homesellers’ offices when prices dip

For now, China has been able to maintain the illusion of stability to preserve social order. However, should the housing slowdown accelerate significantly and tens of millions in empty units suddenly hit the market, then the “working class insurrection” that China has been preparing for since 2014…

… will become an overnight reality, with dire consequences for the entire world.

Source: ZeroHedge

U.S. National Trade Council Director Peter Navarro Warns Wall Street Globalists: “Stand Down” Or Else…

(TheLastRefuge) The words from Peter Navarro will come as no surprise to any CTH reader who is fully engaged and reviewing the multi-trillion stakes, within the Globalist (Wall St-vs- Nationalist (Main Street) confrontation.

For several decades Wall Street, through lobbying arms such as the U.S. Chamber of Commerce (Tom Donohue), has structurally opposed Main Street economic policy in order to inflate profits and hold power – “The Big Club”. This manipulative intent is really the epicenter of the corruption within the DC swamp.

U.S. National Trade Council Director Peter Navarro discusses how Wall Street bankers and hedge-fund managers are attempting to influence U.S.-China trade talks. He speaks at the Center for Strategic and International Studies in Washington, D.C.

This article was built around the following short news clip…

Originally outlined a year ago. At the heart of the professional/political opposition the issue is money; there are trillions at stake.

President Trump’s MAGAnomic trade and foreign policy agenda is jaw-dropping in scale, scope and consequence. There are multiple simultaneous aspects to each policy objective; however, many have been visible for a long time – some even before the election victory in November ’16.

https://theconservativetreehouse.files.wordpress.com/2018/11/trump-tweet-trade-deals-waiting-me-out-2.jpg

If we get too far in the weeds the larger picture is lost. CTH objective is to continue pointing focus toward the larger horizon, and then at specific inflection points to dive into the topic and explain how each moment is connected to the larger strategy.

If you understand the basic elements behind the new dimension in American economics, you already understand how three decades of DC legislative and regulatory policy was structured to benefit Wall Street and not Main Street. The intentional shift in fiscal policy is what created the distance between two entirely divergent economic engines.

https://theconservativetreehouse.files.wordpress.com/2018/03/lobbyist-1.jpg

REMEMBER […] there had to be a point where the value of the second economy (Wall Street) surpassed the value of the first economy (Main Street).

Investments, and the bets therein, needed to expand outside of the USA. hence, globalist investing.

However, a second more consequential aspect happened simultaneously. The politicians became more valuable to the Wall Street team than the Main Street team; and Wall Street had deeper pockets because their economy was now larger.

As a consequence Wall Street started funding political candidates and asking for legislation that benefited their interests.

When Main Street was purchasing the legislative influence the outcomes were -generally speaking- beneficial to Main Street, and by direct attachment those outcomes also benefited the average American inside the real economy.

When Wall Street began purchasing the legislative influence, the outcomes therein became beneficial to Wall Street. Those benefits are detached from improving the livelihoods of main street Americans because the benefits are “global”. Global financial interests, multinational investment interests -and corporations therein- became the primary filter through which the DC legislative outcomes were considered.

There is a natural disconnect. (more)

As an outcome of national financial policy blending commercial banking with institutional investment banking something happened on Wall Street that few understand. If we take the time to understand what happened we can understand why the Stock Market grew and what risks exist today as the monetary policy is reversed to benefit Main Street.

https://theconservativetreehouse.files.wordpress.com/2017/05/trump-mnuchin-banks1-e1495162388382.jpg?w=600&h=298

President Trump and Treasury Secretary Mnuchin have already begun assembling and delivering a new banking system.

Instead of attempting to put Glass-Stegal regulations back into massive banking systems, the Trump administration is creating a parallel financial system of less-regulated small commercial banks, credit unions and traditional lenders who can operate to the benefit of Main Street without the burdensome regulation of the mega-banks and multinationals. This really is one of the more brilliant solutions to work around a uniquely American economic problem.

♦ When U.S. banks were allowed to merge their investment divisions with their commercial banking operations (the removal of Glass Stegal) something changed on Wall Street.

Companies who are evaluated based on their financial results, profits and losses, remained in their traditional role as traded stocks on the U.S. Stock Market and were evaluated accordingly. However, over time investment instruments -which are secondary to actual company results- created a sub-set within Wall Street that detached from actual bottom line company results.

The resulting secondary financial market system was essentially ‘investment markets’. Both ordinary company stocks and the investment market stocks operate on the same stock exchanges. But the underlying valuation is tied to entirely different metrics.

Financial products were developed (as investment instruments) that are essentially wagers or bets on the outcomes of actual companies traded on Wall Street. Those bets/wagers form the hedge markets and are [essentially] people trading on expectations of performance. The “derivatives market” is the ‘betting system’.

♦Ford Motor Company (only chosen as a commonly known entity) has a stock valuation based on their actual company performance in the market of manufacturing and consumer purchasing of their product. However, there can be thousands of financial instruments wagering on the actual outcome of their performance.

There are two initial bets on these outcomes that form the basis for Hedge-fund activity. Bet ‘A’ that Ford hits a profit number, or bet ‘B’ that they don’t. There are financial instruments created to place each wager. [The wagers form the derivatives] But it doesn’t stop there.

Additionally, more financial products are created that bet on the outcomes of the A/B bets. A secondary financial product might find two sides betting on both A outcome and B outcome.

Party C bets the “A” bet is accurate, and party D bets against the A bet. Party E bets the “B” bet is accurate, and party F bets against the B. If it stopped there we would only have six total participants. But it doesn’t stop there, it goes on and on and on…

The outcome of the bets forms the basis for the tenuous investment markets. The important part to understand is that the investment funds are not necessarily attached to the original company stock, they are now attached to the outcome of bet(s). Hence an inherent disconnect is created.

Subsequently, if the actual stock doesn’t meet it’s expected P-n-L outcome (if the company actually doesn’t do well), and if the financial investment was betting against the outcome, the value of the investment actually goes up. The company performance and the investment bets on the outcome of that performance are two entirely different aspects of the stock market. [Hence two metrics.]

♦Understanding the disconnect between an actual company on the stock market, and the bets for and against that company stock, helps to understand what can happen when fiscal policy is geared toward the underlying company (Main Street MAGAnomics), and not toward the bets therein (Investment Class).

The U.S. stock markets’ overall value can increase with Main Street policy, and yet the investment class can simultaneously decrease in value even though the company(ies) in the stock market is/are doing better. This detachment is critical to understand because the ‘real economy’ is based on the company, the ‘paper economy’ is based on the financial investment instruments betting on the company.

Trillions can be lost in investment instruments, and yet the overall stock market -as valued by company operations/profits- can increase.

Conversely, there are now classes of companies on the U.S. stock exchange that never make a dime in profit, yet the value of the company increases. This dynamic is possible because the financial investment bets are not connected to the bottom line profit. (Examples include Tesla Motors, Amazon and a host of internet stocks like Facebook and Twitter.) It is this investment group of companies that stands to lose the most if/when the underlying system of betting on them stops or slows.

Specifically due to most recent U.S. fiscal policy, modern multinational banks, including all of the investment products therein, are more closely attached to this investment system on Wall Street. It stands to reason they are at greater risk of financial losses overall with a shift in fiscal policy.

That financial and economic risk is the basic reason behind Trump and Mnuchin putting a protective, secondary and parallel, banking system in place for Main Street.

Big multinational banks can suffer big losses from their investments, and yet the Main Street economy can continue growing, and have access to capital, uninterrupted.

Bottom Line: U.S. companies who have actual connection to a growing U.S. economy can succeed; based on the advantages of the new economic environment and MAGA policy, specifically in the areas of manufacturing, trade and the ancillary benefactors.

Meanwhile U.S. investment assets (multinational investment portfolios) that are disconnected from the actual results of those benefiting U.S. companies, and as a consequence also disconnected from the U.S. economic expansion, can simultaneously drop in value even though the U.S. economy is thriving.

https://theconservativetreehouse.files.wordpress.com/2018/04/trump-friends-trade-team-ross-mnuchin-navarro-lighthizer.jpghttps://theconservativetreehouse.files.wordpress.com/2018/01/trump-dow-25k.jpg

Source: by Sundance | The Conservative Tree House

GSE Loan Purchases Continue To Trend Down

Fannie Mae and Freddie Mac are bankrolling significantly fewer loans this year, reflecting the general slowdown in the residential U.S. mortgage market.

In the nine months through the third quarter, the government-sponsored enterprises (GSEs) purchased a combined 2.47 million home loans, down 9 percent for the same nine months in 2017, the companies reported last week in quarterly reports.

The GSEs bankroll around 45 percent of all residential mortgages, according to the Urban Institute, by purchasing loans from lenders, wrapping them with a government guarantee and securitizing most of them for sale in the secondary market.

fanncountsq3The combined balance of these loans through the third quarter was $577 billion, down 7 percent from the 2017 level for the same nine months.

freddvolq3GSE funding activity has dropped for the second consecutive year.

freddcountq3The 2018 year-to-date counts and volume balances were down 16 percent and 15 percent, respectively, compared to same nine months in 2016.

During a conference call last week, Fannie Mae Chief Financial Officer Celeste Brown alluded to tough conditions for lenders. 

“At a high level, what I see is that our customers are facing a lot of headwinds in the market,” she said. “Rates are up, volumes are down, and margins are tight, so lender profitability is challenged. New housing supply is up but not all the supply has been created where it’s needed. While we do see income growth nationally, in many markets home-price growth has outstripped income growth so affordability for home buyers remains a challenge,” Brown said. 

The numbers have waned as a result of the big drop in refinancing activity. The combined GSE refinance counts totaled 909,000, down 26 percent from the 1.23 million refinance loans acquired by the GSEs through the first nine months of 2017. The GSE reports indicate that cash-out refinancing levels have remained fairly stable, whereas rate-reduction and term refinances are falling steeply. 

Meanwhile, the home-purchase market hasn’t grown at anywhere near the pace that refinance activity has been falling.The combined GSE home-purchase loan counts through the third quarter totaled 1.56 million, up 5 percent over the 2017 level.

U.S. home sales are expected to be flat this year or even decline marginally due to rising prices; a lack of affordable, entry-level homes for sale; and rising rates.

“Our expectations for housing have become more pessimistic,” Fannie Mae Chief Economist Doug Duncan said in October. “Rising interest rates and declining housing sentiment from both consumers and lenders led us to lower our home sales forecast over the duration of 2018 and through 2019. Meanwhile, affordability, especially for first-time home buyers, remains atop the list of challenges facing the housing market.”

Fannie Mae’s most recent forecast calls for the origination volume for the entire market to fall 10.5 percent year over year in 2018, to $1.63 trillion. Refinance volume is predicted to decline by 30 percent over the 2017 level to $454 billion. Purchase volume in 2018 will remain essentially flat with the 2017 level at $1.18 trillion, Fannie forecasts. 

Source: by Victor Whitman | Scotsman Guide

Record Inventory Floods Seattle, Sending Home Prices Significantly Lower

This is how housing markets turn. Slowly, then all at once.

Seven years of Seattle home prices outpacing wage growth because of low rates; bidding wars replaced by sales at the asking price; days or weeks on the market turning into months; sellers reduce home prices; surging mortgage rates; buyers disappear, and wallah – a classic turning point in an auction, otherwise known as an unfair high that is now rippling through the real estate food chain in the Seattle area.

As a reminder, before we dive into the faltering real estate market in Seattle. Back in September, we outlined a significant clue about the overall health of America’s housing industry: Bank of Ameria called it: “The Peak In-Home Sales Has Been Reached; Housing No Longer A Tailwind.”

With that in mind, it comes as no surprise that inventory countywide soared 86% among single-family homes and 188% among condos in October compared to a year prior, according to newly published data by the Northwest Multiple Listing Service. It was the most massive year-over-year increase on record, dating back to the Dotcom bust, a rhythm that has some asking: Is the housing industry about to go bust?

Mike Rosenberg, a Seattle Times real estate reporter, has been documenting the rise and fall of the real estate market on the West Coast.

Rosenberg said the median home price plummeted to $750,000, down $25,000 in one month and down $80,000 from all-time highs in spring.

He warned, “that is not a normal seasonal drop — prices in the city actually went up during those time frames last year.”

Compared to 2017, prices inched up about 2%. He said interest rates had moved higher in that span have increased monthly mortgage costs.

On the Eastside, the median home sold for $890,000, unchanged from the previous month, but down $87,000 from the all-time high in late summer. On a year-over-year basis, prices were still up 5.3%.

https://www.zerohedge.com/sites/default/files/inline-images/sales%20map.png?itok=wGv4JCCX

Rosenberg notes that prices dipped on a month-over-month basis in South King County but surged at the northern end of the county. He said inventory is flooding the market at the same time as buyer demand evaporates.

https://www.zerohedge.com/sites/default/files/inline-images/Oct%20home%20sales.png?itok=HokTF4vt

As we highlighted in the BofA report, sellers across the country are unloading properties into a weakening market will trigger downward momentum in prices.

Back to Seattle, that is precisely what is happening, as sellers have reacted by cutting asks faster than any other metro area in the country. To make matters worse, buyers are now negotiating prices down even further, as the average home is selling for below list price for the first time in four years, said Rosenberg.

Rising interest rates, declining demand, and flat-lining rents have been the main drivers of failing home buyer demand in the second half of 2018.

Into the fall months, brokers told Rosenberg that buyers are now pausing as they wait for the storm to blow over. 

Ken Graff, a broker with Coldwell Banker Bain in Seattle, listed a townhouse in Magnolia on the market in April, “right before the apparent peak of the market,” and had 11 bidders who ferociously fought for the home, with a winning bid for $800,000. In September, he listed an identical town home in the same neighborhood, it stood on the market for three weeks before selling for $725,000.

“Buyers are still having to pay a premium for Seattle-area properties, but it lacks the frenzy we’ve seen in the last few years,” Graff said.

“People can be a little more measured now, which is a good thing.”

Among other regions where home prices have dropped in October on a year-over-year basis: West Bellevue, Southeast Seattle, Burien-Normandy Park, and the Skyway area. On the other end, prices rose more than 10% from a year ago in Jovita-West Hill Auburn, Auburn, Kent, Renton-Benson Hill, Mercer Island, Kirkland-Bridle Trails and Juanita-Woodinville.

Elsewhere, the rest of the Puget Sound region also saw expanding inventory, including a 65% increase in Snohomish County.

https://www.zerohedge.com/sites/default/files/inline-images/home%20price%20activity.png?itok=Vh7i0Cad

The slowdown in Seattle housing shows little signs of abating as the Federal Reserve is expected to hold rates on Thursday before a hike in December. At their most recent meeting in late September, Fed officials communicated a plan for three more hikes in 2019. With one more rate hike forecasted in 2018 and three more in 2019, it seems that Seattle and much of the country’s real estate market could be at a significant turning point into the 2020 presidential elections. Let us hope real estate prices do not fall even further, as many home buyers could vote with their home prices.

Source: ZeroHedge


The Economy Does Not Care Who Won The 2018 Midterm Elections

(Brandon Smith via Alt-Market.com) Over the past few weeks I received numerous requests from readers to publish my predictions on the outcome of the midterm elections, but I did not do so for a couple of reasons. First and foremost, I view the election process very differently from many people. I do not see it as legitimate in the slightest, therefore my predictions of the past have been based not on voter turnouts, polls or any other such nonsense.  Elections are molded events, framed under the false pretense that the Left/Right paradigm in politics is real. As far as the upper echelons of politics are concerned, the paradigm is completely theatrical.

https://www.zerohedge.com/sites/default/files/inline-images/leftright.jpg?itok=ARK_mmw7

To be sure, the average American does lean either “left” or “right” on the political spectrum. Such divisions are a natural part of social discourse. However, political theater is designed in most cases to drive citizens away from centrally shared principles of freedom and equal opportunity (not equal outcome) and push them to the far ends of the spectrum toward extremism and zealotry. And to be clear, there is no “good” form of zealotry.

Zealots are not self-aware, and they never subject their own positions to scrutiny. They operate on pure assumption that they are divinely correct in everything they do, and anyone who disagrees with them, even in the slightest, is an enemy that must be destroyed by any means necessary. Zealotry is the root of human atrocity. Zealots are a tidal wave of war and genocide. They are a cancer on the soul of mankind.

Certain groups of people within the establishment, namely globalists that desire total centralized control of every aspect of economy and society, prefer that the public remain as radicalized and divided as possible. For them, zealotry is an asset.

To pursue this goal, they purchase allegiance from politicians through various means, including financial favors, media favors and campaign contributions. There are very few people left in politics that are not part of “the club.” Both Democrat and Republican leaders are essentially on the same side — the globalist side. They attack each other with rhetoric, but when it comes down to actual policy and action, they are all very similar.

The outcome of elections is therefore erroneous in the long term. Their only purpose is to manipulate public psychology to a certain reactionary end game.

When I predicted the election of Donald Trump in 2016 many months before voting commenced, I did so based on which election outcome better served the interests of globalists. I concluded with the highest certainty that Donald Trump would “win” based on the same premise that drove me to predict the success of the Brexit vote in the U.K.; that premise being that the globalists would allow “populists” (conservatives) to gain an illusory foothold on political power, only to then collapse the global economy on their heads and blame them for the disaster.

At the time it was unclear whether Trump would play along with the globalist narrative of conservatives as “selfish bumbling villains.” Today, with his consistent relationships with banking elites and globalist think-tank members, it is obvious that Trump intends to play the role he has been given. Trump’s policy actions the past two years indicate that he is following a model very similar to the one Republican President Herbert Hoover used just before the crash of 1929. Trump was a perfect choice for the globalists.

So, the question I had to ask in terms of the midterm elections is, what outcome best serves globalist interests this time? The only conclusion I could come to in this instance was — it didn’t matter who wins the midterms. The globalists will get their economic crash regardless and conservatives will still be blamed.

The ultimate outcome turned out to be mixed, with Democrats taking the House and Republicans holding the Senate.  The assertion in the mainstream being that this will result in “political gridlock”.  In terms of stock markets, the reaction is not surprisingly euphoric, as it has been not long after almost every election event.  But there are many that assume this is a euphoria that will last.  This is a very short-term view of the situation that ignores economic reality.

It is certainly possible that equities will sustain a  jump on the news of a Republican win, but I see this as a very limited event, lasting perhaps one or two weeks. In the long run as December approaches, stocks and every other sector of the economy will continue accelerated declines seen in October.

Here are the facts:

New home sales, an indicator highly valued by mainstream economists, has been in decline for the past year, hitting two-year lows in September.

This has come as a surprise to many mainstream analysts because the story thus far has been that the U.S. is in advanced recovery which should continue the supposed rejuvenation of the housing market. Alternative economists will give you the real story on home sales, though.

The housing “boom” hailed in the mainstream over the past few years was a farce driven primarily by corporate behemoths like Blackstone.  Companies buying up distressed properties across the U.S. using cheap loans and bailouts through the Federal Reserve and turning them into rentals hardly constitutes a “recovery” in housing.

Regular home buyers have also enjoyed artificially low mortgage rates for many years. But now, mortgage costs are spiking as the Fed raises interest rates, and corporate debt is becoming more expensive, making it less profitable for companies to continue vacuuming up properties.  Add to this the fact that the Fed is now dumping Mortgage Backed Securities (MBS) from its balance sheet. These are the same securities that constituted a “toxic” influence that led to the mortgage and derivatives bubble. It is hard to say exactly what the effects will be as they add to existing ARM-style mortgages and derivatives already on the market, but I suspect the result will be destabilizing.

Auto sales, another fundamental indicator used in the mainstream as a signal for economic health, is also failing recently. U.S. auto sales plunged in September from 11 percent to 25 percent depending on the company and make of vehicle. While the mainstream media argues this massive year-over-year decline was due to destructive hurricanes in 2017 creating overt demand, the truth is that the average monthly payment on new vehicles has rocketed to over $525 and interest rates rise due to the Federal Reserve.

Car sales, new and used, have thrived in recent years in most part because of artificially low rates and ARM-like loans to people who cannot afford them. Much like the mortgage bubble in 2008, the auto bubble is set to implode as car payments become too expensive for the average buyer and defaults increase.

The US budget deficit climbed to six year highs under Donald Trump’s watch in 2018 as fiscal spending skyrockets.  Conservatives hoping for budget responsibility and reduced government spending are given a rude awakening once again, as Republicans and Democrats and Trump ALL seek bigger government.  This is hardly gridlock.  In fact, there has been resounding unity in Washington for ever increasing power, and ever increasing costs.

The trade deficit, which was supposed to decline aggressively in the face of Trump’s trade war, has actually climbed to record highs with China (among other nations).  I have heard claims that the outcome of the midterms will force Trump to end the trade war because he is no longer receiving backing from the Federal Reserve or Congress.  The trade war will not stop.  It provides perfect cover for central banks as they continue to remove artificial support from the overall economy.

Perhaps the biggest factor in economic decline in the U.S. will be corporate debt, as mentioned earlier. Corporate debt has jumped to record highs not seen since 2008, with debt-to-cash levels in 2017 hitting lows of 12 percent. Meaning, on average for every $1 of cash a company has in reserve it owes $8 in debt.

How is all this debt being generated? It’s all about stock buybacks. In 2018, U.S. corporations increased spending on stock buybacks by 48%, while only increasing spending on development by 19%. Meaning, corporations are spending far more capital, and borrowing far more money, just to keep their stock prices artificially propped up than they are spending money to invest in future growth.

For almost a decade stock markets have been dependent on two pillars: near zero interest rates and asset purchases by the Fed. Stock buybacks are reliant on low rates and the corporate ability to borrow essentially free money, which they then cycle into equities to buy up shares, reducing the amount of existing shares on the market and thereby increasing the value of the remaining shares through a form of legal manipulation.

But as the Fed raises rates and stops acting as the buyer of last resort, corporate borrowing becomes more expensive and buybacks will decline. In fact, the last half of 2018 shows a marked drop in announced buybacks, as the apparent peak in July fades.  As December approaches, the Fed is set to match interest rates with their official inflation rate, or the “neutral rate”.  This is something that has not been done for decades.

I believe stock buybacks will falter at this time, as the cost of the exorbitant debt needed to continue propping up stocks will become too high.

In 2016, globalists needed a “conservative” president to sit in the Oval Office as the Federal Reserve pulled the plug on artificial economic life support by raising interest rates into the greatest corporate debt crisis since 2008. At this point, that program seems to be in full swing.

The midterms are now over, but it is important to understand that where economic consequences are concerned, the result would have been the same no matter who came out on top. It makes sense for the globalists to desire a dominant Republican party, for when they crash markets the blame would fall entirely on the heads of conservatives. On the other hand, it also makes sense for globalists to introduce a Democratic takeover of Congress, for they can continue to push citizens to further political extremes as the Left blames the Right for the financial crisis while the Right blames the Left for political interference.

In the meantime, the banking elites can simply blame the extreme political divide, wait until the crash runs its course and then sweep in after the dust settles to admonish the “capitalist structure,” barbaric nationalism, populism, etc. They will shake their fingers at all of us as if we should be ashamed and then offer their own solution to the disaster, which will surely include even more centralization and more power for the banking class.

The Fed will continue to raise rates and cut assets.  The trade war will escalate. The housing market will continue to falter, auto markets will implode, and corporate debt will become a millstone on the neck of stock markets.

Economic function and repair are far beyond the scope of any political body to fix when the dysfunction reaches the point we are at today. To believe otherwise is foolhardy.  To believe that the political elites actually want to fix the economy is even more foolhardy. The answer is not replacing one set of political puppets with another set of political puppets, but for regular people to begin localizing their own production and trade — to decouple from dependency on the existing system and start their own system. Only through this, and the removal of the globalist tumor from its position of power and influence, will anything ever change for the better.

Source: ZeroHedge

Mortgage Applications Plummet To 18-Year Lows As Rates Hit 2010 Highs

With purchase applications tumbling alongside the collapse in refinancings, the headline mortgage application data slumped to its lowest level since September 2000 last week.

This should not be a total surprise as Wells Fargo’s latest results shows the pipeline is collapsing – a forward-looking indicator on the state of the broader housing market and how it is impacted by rising rates, that was even more dire, slumping from $67BN in Q2 to $57BN in Q3, down 22% Y/Y and the the lowest since the financial crisis.

https://www.zerohedge.com/sites/default/files/inline-images/wells%20originations%20q3%202018.jpg

But in the month since those results, mortgage rates have gone higher still… (this is now the biggest 2Y rise in mortgage rates since 2000)…

https://www.zerohedge.com/sites/default/files/inline-images/2018-11-07_6-09-14.jpg?itok=LzR03TeD

Sparking further weakness in the housing market…

https://www.zerohedge.com/sites/default/files/inline-images/2018-11-05_6-07-54_0.jpg?itok=8OzM0s81

And absent Christmas weeks in 2000 and 2014, this is the weakest level of mortgage applications since September 2000…

https://www.zerohedge.com/sites/default/files/inline-images/2018-11-07_5-14-48.jpg?itok=Te5Jq7L_

What these numbers reveal, is that the average US consumer can barely afford to take out a new mortgage at a time when rates continued to rise – if not that much higher from recent all time lows. It also means that if the Fed is truly intent in engineering a parallel shift in the curve of 2-3%, the US can kiss its domestic housing market goodbye. 

And, as famed housing-watcher Robert Shiller recently noted, the weakening housing market is similar to the last market high, just before the subprime housing bubble burst a decade ago.

The economist, who predicted the 2007-2008 crisis, told Yahoo Finance that current data shows “a sign of weakness.”

“This is a sign of weakness that we’re starting to see. And it reminds me of 2006 … Or 2005 maybe,”

Housing pivots take more time than those in the stock market, Shiller said, adding that:

“the housing market does have a momentum component and we’re seeing a clipping of momentum at this time.”

The Nobel Laureate explained:

 If the markets go down, it could bring on another recession. The housing market has been an important element of economic activity. If people start to get pessimistic about housing and pull back and don’t want to buy, there will be a drop in construction jobs and that could be a seed for another recession.” 

When reminded that 2006 predated the greatest financial crisis in a lifetime, RT notes that Shiller acknowledged that any correction would likely be far less severe.

“The drop in home prices in the financial crisis was the most severe drop in the US market since my data begin in 1890,” the Yale economist said.

“It could be that we’re primed to repeat it because it’s in our memory and we’re thinking about it but still I wouldn’t expect something as severe as the Great Financial Crisis coming on right now. There could be a significant correction or bear market, but I’m waiting and seeing now.”

Tick, tick, Mr Powell.

Source: ZeroHedge

JP Morgan BUSTED for Rigging Precious Metals Markets For Years

https://s16-us2.ixquick.com/cgi-bin/serveimage?url=http%3A%2F%2Fmedia.salon.com%2F2013%2F02%2Fjamie_dimon.jpg&sp=0b75c357def09705e3b7052650b2dcb9JP Morgan is the custodian responsible for safe keeping physical silver backing the SLV ETF

  • John Edmonds, 36, pleaded guilty to one count of commodities fraud and one count of conspiracy to commit wire fraud, price manipulation and spoofing.
  • Edmonds, a 13-year J.P. Morgan veteran, said that he learned how to manipulate prices from more senior traders and that his supervisors at the firm knew of his actions.

An ex-J.P. Morgan Chase trader has admitted to manipulating the U.S. markets of an array of precious metals for about seven years — and he has implicated his supervisors at the bank.

John Edmonds, 36, pleaded guilty to one count of commodities fraud and one count each of conspiracy to commit wire fraud, price manipulation and spoofing, according to a Tuesday release from the U.S. Department of Justice. Edmonds spent 13 years at New York-based J.P. Morgan until leaving last year, according to his LinkedIn account.

As part of his plea, Edmonds said that from 2009 through 2015 he conspired with other J.P. Morgan traders to manipulate the prices of gold, silver, platinum and palladium futures contracts on exchanges run by the CME Group. He and others routinely placed orders that were quickly cancelled before the trades were executed, a price-distorting practice known as spoofing.

“For years, John Edmonds engaged in a sophisticated scheme to manipulate the market for precious metals futures contracts for his own gain by placing orders that were never intended to be executed,” Assistant Attorney General Brian Benczkowski said in the release.

Of note for J.P. Morgan, the world’s biggest investment bank by revenue: Edmonds, a relatively junior employee with the title of vice president, said that he learned this practice from more senior traders and that his supervisors at the firm knew of his actions.

Edmonds pleaded guilty under a charging document known as an “information.” Prosecutors routinely use them to charge defendants who have agreed to cooperate with an ongoing investigation of other people or entities.

His sentencing is scheduled for Dec. 19. Edmonds faces up to 30 years in prison but is likely to receive less time than that. The guilty plea was entered under seal Oct. 9 and unsealed on Tuesday.

New York-based J.P. Morgan declined to comment on the case through a spokesman. It was reported earlier by the Financial Times.

J.P. Morgan learned about this case only recently, according to a person with knowledge of the matter. A recent regulatory filing from the bank didn’t make any mention of the issue.

https://youtu.be/yue0AoMBtsU

Source: by Hugh Son & Dan Mangan | CNBC

The Cycle That Has Been Saving Home Buyers $3,000 Per Year Just Ran Out Of Fuel

Summary

  • After five years of supporting rising home prices, the latest phase of a long-term financial cycle is nearing its end.
  • While little followed in the real estate market, this cycle of yield curve spread compression has been one of the largest determinants of home affordability and housing prices.
  • Using a detailed analysis of national statistics, it is demonstrated that average home buyers in 2018 have been saving about $250 per month, or $3,000 per year.
  • The reasons why the cycle is ending are mathematically and visually demonstrated.

(Daniel Amerian) Home buyers in every city and state have been benefiting from a powerful financial cycle for almost five years. Most people are not aware of this cycle, but it has lowered the average monthly mortgage payment for home buyers on a national basis by about $250 per month since the end of 2013.

The interest rate cycle in question is one of “yield curve spread” expansion and compression, with yield curve spreads being the difference between long-term and short-term interest rates. This interest rate spread has been going through a compression phase in its ongoing cycle, meaning that the gap between long-term interest rates and short-term interest rates fell sharply in recent years.

https://static.seekingalpha.com/uploads/2018/11/2/566013-15411612062108982.jpg

The green bars in the graph above show national average mortgage payments (principal and interest only), and they fell from $861 a month in 2013 to $809 a month in 2016 and have now risen to $894 per month. However, without the narrowing of the spread between short-term rates and long-term rates, mortgage payments would have been entirely different (and likely home prices as well).

Without the cycle of yield curve spread compression then, as shown with the blue bars, average mortgage payments would have been above $900 per month even in 2014, and they would have risen every year since without exception. If it had not been for compression, national average mortgage payments would have reached $978 per month in 2016 (instead of $809) and then $1,138 per month in 2018 (instead of $894).

The yellow bars show the average monthly savings for everyone buying a home during the years from 2014 to 2018. The monthly reduction in mortgage payments has risen from $57 per month in 2014 to $169 per month in 2016, to $244 per month by 2018 (through the week of October 11th).

In other words, the average home buyer in the U.S. in 2018 is saving almost $3,000 per year in mortgage payments because of this little-known cycle, even if they’ve never heard of the term “yield curve.” Indeed, while the particulars vary by location, home affordability, home prices and disposable household income have been powerfully impacted in each of the years shown by this interest rate cycle, in every city and neighborhood across the nation.

While knowledge of this cyclical cash flow engine has not been necessary for home buyers (and sellers) to enjoy these benefits in previous years, an issue has developed over the course of 2018 – the “fuel” available to power the engine has almost run out. That means that mortgage payments, home affordability and housing prices could be traveling a quite different path in the months and years ahead.

https://static.seekingalpha.com/uploads/2018/11/2/566013-15411612537910333.jpg

The yield curve spread is shown in the blue area above, and it was quite wide at the beginning of this particular cycle, equaling 2.62% as of the beginning of 2014. It has been steadily used up since that time, however, with the compression of the spread being shown in red. As of the current time, the yield curve compression which has powered the reduction in mortgage payments has almost maxed out, the blue area is almost gone and the ability to further compress (absent an inversion) is almost over.

This analysis is part of a series of related analyses; an overview of the rest of the series is linked here.

(More information on the data sources and calculations supporting the summary numbers above can be found in the rest of series, as well as in the more detailed analysis below. A quick summary is that mortgage rates are from the Freddie Mac Primary Mortgage Market Survey, Treasury yields are from the Federal Reserve, the national median home sale price is from Zillow for the year 2017 and the assumed mortgage LTV is 80%.)

A Cyclical Home Buyer Savings Engine

A yield curve spread is the difference in yields between short-term and long-term investments, and the most common yield curve measure the markets looks to is the difference between the 2-year and 10-year U.S. Treasury yields.

An introduction to what yield curves are and why they matter can be found in the analysis “A Remarkably Accurate Warning Indicator For Economic And Market Perils.” As can be seen in the graph below and as is explored in more detail in some of the linked analyses, there is a very long history of yield curve spreads expanding and compressing as part of the overall business cycle of economic expansions and recessions, as well as the related Federal Reserve cycles of increasing and decreasing interest rates.

https://static.seekingalpha.com/uploads/2018/11/2/566013-1541161506247822.jpg

Since the beginning of 2014, the rapid shrinkage of the blue area shows the current compression cycle, and a resemblance (in broad strokes) can be seen with the compression cycles of 1992-2000 and of 2003-2006.

What has seized the attention of the markets in recent months is what followed next in some previous cycles, which is that yield curve spreads went to zero and then became negative, creating “inversions” where short-term yields are higher than long-term yields (as shown in the golden areas). This is important because, while such inversions are quite uncommon, when they do occur they have had a perfect record in recent decades (over the last 35 years) of being followed by economic recessions within about 1-2 years.

However, yield curves don’t have to actually invert in order to turn the markets upside down, and as explored in the analysis linked here, when the Fed goes through cycles of increasing interest rates, we have a long-term history of yield curve spreads acting as a counter cyclical “shock absorber” and shielding long-term interest rates and bond prices from the Fed actions.

That only works until the “shock absorber” is used up, however, and as of the end of the third quarter of 2018, the yield curve “shock absorber” has been almost entirely used up. So, when the Fed increased short-term rates in late September of 2018, there was almost no buffer, and that increase passed straight through to 10-year Treasury yields. The results were painful for bond prices, stock prices and even the value of emerging market currencies.

The same lack of compression led to a sudden and sharp leap to the highest mortgage rates in seven years. Unfortunately, that jump may also potentially be just a taste of what could be on the way, with little further room for the yield curve to compress (without inverting).

Understanding The Relationships Between Mortgage Rates, Treasury Yields and Yield Curve Spreads

The graphic below shows weekly yields for Fed Funds, 2-year Treasuries, 10-year Treasuries and 30-year fixed-rate mortgages since the beginning of 2014.

https://static.seekingalpha.com/uploads/2018/11/2/566013-1541161602671874.jpg

The first relationship is the visually obvious close correlation between the top purple line of mortgage rates and the green line of 10-year Treasury yields. Mortgage amortization and prepayments mean that most mortgage principal is returned to investors well before the 30-year term of the mortgage, and therefore, investors typically price those mortgage rates at a spread (the distance between the green and purple lines) above 10-year Treasury yields. It isn’t a perfect relationship – the 10-year Treasury tends to be a bit more volatile – but is a close one.

The bottom two lines are the short-term yields, with the yellow line being effective overnight Fed Funds rates, and the red line being 2-year Treasury yields. Because the yield curve has been positive over the entire time period shown (as it almost always is), long-term rates have consistently been higher than short-term rates, and 10-year Treasury yields have been higher than 2-year Treasury yields, which have been higher than Fed Funds rates.

Now, the long-term rates have been moving together, and while the relationship is not quite as close, the short-term rates have also been generally moving together, with the 2-year Treasury yield more or less moving up with the Fed’s cycle of increasing interest rates (each “step” in the yellow staircase is another 0.25% increase in interest rates by the Federal Reserve).

However, the long-term rates have not been moving with the short-term rates. As can be seen with point “D,” 10-year Treasury yields were 3.01% at the beginning of 2014, 2-year Treasury yields were a mere 0.39% and the yield curve spread – the difference between the yields – was a very wide 2.62%.

About a year later, by late January of 2015 (point “E”), 10-year Treasury yields had fallen to 1.77%, while 2-year Treasury yields had climbed to 0.51%. The yield curve spread – the distance between the green and red lines – had narrowed to only 1.26%, or a little less than half of the previous 2.62% spread.

It can be a little hard to accurately track the relative distance between two lines that are each continually changing, so the graphic below shows just that distance. The top of the blue area is the yield curve spread; it begins at 2.62% at point “D” and falls to 1.26% by point “E.” The great reduction between points “D” and “E” is now visually obvious.

https://static.seekingalpha.com/uploads/2018/11/2/566013-15411616451828508.jpg

So, if there had been no change in yield curve spreads, and the 2-year Treasury had risen to 0.51% while the spread remained constant at 2.62%, then the 10-year Treasury yields would have had to have moved to 3.13%.

But they didn’t – the yield curve compressed by 1.36% (2.62% – 1.26%) between points “D” and “E,” and the compression can be seen in the growing size of the red area labeled “Cumulative Yield Curve Compression.” If we start with a 2.62% interest rate spread, and that spread falls to 1.26% (the blue area), then we have used up 1.36% (the red area) of the starting spread and it is no longer available for us.

The critical importance of this yield curve compression for homeowners and housing investors, as well as some REIT investors, can be seen in the graphic below:

https://static.seekingalpha.com/uploads/2018/11/2/566013-15411616777403066.jpg

The top of the green area is the national average 30-year mortgage rate as reported weekly by Freddie Mac. That rate fell from 4.53% in the beginning of 2014 (point “D”) to 3.66% in late January of 2015.

But remember the tight relationship between the green and purple lines in the graph of all four yields / rates. Mortgage investors demand a spread above the 10-year Treasury, mortgage lenders will only lend at rates that will enable them to meet that spread requirement (and sell the mortgages), and therefore, it was the reduction in 10-year Treasury yields that drove the reduction in mortgage rates. And if the yield curve compression had not occurred, then neither would have the major reduction in mortgage rates.

As we saw in the “Running Out Of Room” graphic, the red area of yield curve compression increased by 1.36% between points “D” and “E.” If we simply take the red area of yield curve compression from that graph and we add it to the green area of actual mortgage rates, then we get what mortgage rates would have been with no yield curve compression (all else being equal).

With no yield curve compression, mortgage rates of 3.66% at point “E” would have been 5.02% instead (3.66% + 1.36% – 5.02%).

With a $176,766 mortgage in late January of 2015, a monthly P&I payment at a 3.66% rate is $810. (This is based on a national median home sale price for 2017 of $220,958 (per Zillow) and an assumed 80% mortgage LTV.)

At a 5.02% mortgage rate – which is what it would have been with no yield curve compression – the payment would have been $951. This meant that for any given size mortgage, monthly payments were reduced by 15% over the time period as a result of yield curve spread compression ($810 / $951 = 85%).

Now, at that time, housing prices were still in a somewhat fragile position. The largest decrease in home prices in modern history had just taken place between the peak year of 2006 and the floor years of 2011-2012. Nationally, average home prices had recovered by 9.5% in 2013, and then another 6.4% in 2014.

Here is a question to consider: Would housing prices have risen by 6.4% in 2014 if mortgage rates had not reduced monthly mortgage payments by 15%?

The Next Yield Curve Spread Compression

https://static.seekingalpha.com/uploads/2018/11/2/566013-15411617409541132.jpg

Our next key period to look at is between points “E” and “G,” late January of 2015 to late August of 2016. We are now beginning a rising interest rate cycle when it comes to short-term rates. The Fed had done its first slow and tentative 0.25% increase in Fed Funds rates, and 2-year Treasury yields were up to 0.80%, which was a 0.29% increase.

All else being equal, when we focus on the yellow and red lines of short-term interest rates, mortgage rates should have climbed as well. (Graphs are repeated for ease of scrolling.)

https://static.seekingalpha.com/uploads/2018/11/2/566013-15411617690603347.jpg

However, that isn’t what happened. After a brief jump upwards at point “F,” yield curve spreads had substantially fallen to 0.78% by point “G,” as can be seen in the reduction of the blue area above. For this to happen, the compression of yield curve spreads had to materially increase to 1.84%, as can be seen in the growth of the red area.

https://static.seekingalpha.com/uploads/2018/11/2/566013-15411618029250658.jpg

In the early stages of a cycle of rising interest rates (as part of the larger cycle of exiting the containment of crisis), mortgage rates did not rise, but fell from the very low level of 3.66% at point “E” to an even lower level of 3.46% at point “G,” as can be seen in the reduction of the green area.

To get that reduction in the green area during a rising interest rate cycle required a major growth in the red area of yield curve compression. To see what mortgage rates would have been without yield curve compression (all else being equal), we add the red area of cumulative yield curve compression of 1.84% to the green area of actual mortgage rates of 3.46% and find that mortgage rates would have been 5.30%.

Returning to our $176,766 mortgage example, the monthly mortgage payment (P&I only) is $790 with a 3.46% mortgage rate, and is $982 with a 5.30% mortgage rate. Yield curve compression was responsible for a 20% reduction in mortgage payments for any given borrowing amount by late August of 2016.

However, a problem is that by late August of 2016, the 1.84% cumulative cyclical compression of the yield curve meant that only 0.78% of yield curve spreads remained. A full 70% of the initial yield curve spread had been used up.

(Please note that the mortgage payments in this section of the analysis are calculated based on historical mortgage rates for the particular weeks identified. The annual average payments presented in the beginning of this analysis are the average of all weekly payment calculations for a given year, and therefore, do not correspond to any given week.)

Using Up The Rest Of The Fuel (Yield Curve Spreads):

https://static.seekingalpha.com/uploads/2018/11/2/566013-1541161855409905.jpg

After its slow and tentative start, the Federal Reserve returned to 0.25% Fed Funds rate increases in December of 2016, and has kept up a much steadier pace since that time. As of October of 2018, Fed Funds rates are now up a total of 2% from their floor. As can be seen in the line graph of the yield curve over time, 2-year Treasury yields have also been steadily climbing and were up to 2.85% by point “J,” the week ending October 11th.

However, 10-year Treasury yields are not up by nearly that amount. By late August of 2018, 10-year Treasury yields were only up to 2.87%, which was 1.29% above where they had been two years before.

https://static.seekingalpha.com/uploads/2018/11/2/566013-15411618892487876.jpg

The difference can be found by looking at the very small amount of blue area left by point “J” – yield curve spreads were down to a mere 0.22% by the week ending August 29th, or less than one 0.25% Fed Funds rate increase. This meant that the red area of total cumulative yield curve compression was up to 2.40%, which means that 92% of the “fuel” that had been driving the compression profit engine had been used up – before the Fed’s 0.25% Fed Funds rate increase of September 2018.

As explored in much more detail in the previous analysis linked here, when the Federal Reserve raised rates for the eighth time in September, the yield curve did not compress. Such a compression could have been problematic, as the yield curve would have been right on the very edge of inverting, and there is that troubling history when it comes to yield curve inversions being such an accurate warning signal of coming recessions.

Instead, the short-term Fed Funds rate increase went straight through to the long-term 10-year Treasury yields, full force, with no buffering or mitigation of the rate increase by yield curve compression. The resulting shock as the 10-year Treasury yield leaped to 3.22% led to sharp losses in bonds, stocks and even emerging market currencies.

The same shock also passed through in mostly un-buffered form to the mortgage market via the demand for mortgage investors to be able to buy mortgages at a spread above the 10-year Treasury bond. Thirty-year mortgage rates leaped from 4.71% to 4.90%, an increase of 0.19%, and the highest rate seen in more than seven years.

(I’ve concentrated on the 2- to 10-year yield curve spread in this analysis to keep things simple, to correspond to the market norm for the most commonly tracked yield curve spread and because it has a strong explanatory power for the big picture over time. If one wants to get more precise (and therefore, quite a bit messier), there are also the generally much smaller spread fluctuations between 1) Fed Funds rates and 2-year Treasury yields; and 2) 10-year Treasury yields and mortgage rates.)

https://static.seekingalpha.com/uploads/2018/11/2/566013-1541161992846963.jpg

When we look at the period between points “G” and “J,” it looks quite different than either of the previous periods we looked at. Mortgage rates have been rising, with the largest spike occurring at the time that the Federal Reserve proved it was serious about actually materially increasing interest rates with the Fed Funds rate increase of December 2016 (point “H”).

However, this does not mean that the money saving power of yield curve compression had lost its potency. Between points “D” and “J,” early January of 2014 and early October of 2018, average annual mortgage rates rose from 4.53% to 4.90%, as can be seen in the green area – which is an increase of only 0.37%. Meanwhile, the yield curve spread between the 2- and 10-year Treasuries was compressing from 2.62% to 0.29%, which was a yield curve compression of 2.33%. Adding the red area of cumulative yield curve compression to the green area of actual mortgage rates shows that current mortgage rates would be 7.23% if there had been no yield curve compression (all else being equal).

Mortgage principal and interest payments on a 30-year $176,766 mortgage with 4.90% interest rate are $938 per month, and they are $1,203 per month with a 7.23% mortgage rate. This means that yield curve compression has reduced the national average mortgage payment by about 22%.

Turning The Impossible Into The Possible:

This particular analysis is a specialized “outtake” from the much more comprehensive foundation built in the Five Graphs series linked here, which explores the cycles that have created a very different real estate market over the past twenty or so years.

https://static.seekingalpha.com/uploads/2018/11/2/566013-1541162095131646.jpg

As developed in that series, as part of the #1 cycle of the containment of crisis, the attempts to cure the financial and economic damage resulting from the collapse of the tech stock bubble and the resulting recession, the Federal Reserve pushed Fed Funds rates down into an outlier range (shown in gold), the lowest rates seen in almost 50 years.

As part of the #3 cycle of the containment of crisis, in the attempt to overcome the financial and economic damage from the Financial Crisis of 2008 and the resulting Great Recession, the Federal Reserve pushed interest rates even further into the golden outlier range, with near-zero percent Fed Funds rates that were the lowest in history.

By the time we reach early January of 2014 to late January of 2015, points “D” to “E,” Fed Funds rates were still where they had been the previous five to six years – near zero. Mathematically, there was no room to reduce interest rates, without the U.S. going to negative nominal interest rates.

But yet, mortgage rates fell sharply, from an already low 4.53% to an extraordinarily low 3.66%. This sharp reduction in rates transformed the housing markets and would steer extraordinary profits to homeowners and investors over the years that followed. However, none of it would have been possible without the compression of yield curve spreads.

Once the past has already happened, it is easy to not only take it for granted, but to internalize it and to make it the pattern that we believe is right and natural. Once this happens, the next natural step is to then either explicitly or implicitly project this assumed reality forward, as that trend line then becomes the basis for our financial and investment decisions.

However, where this natural process can run into difficulties is when what made the past possible becomes impossible. Yield curve spread compression took what would have been impossible – a plunge in mortgage rates even as short-term rates remained near a floor – and made it possible. But that pattern can’t repeat (at least not in that manner) when there is no longer the spread to compress.

Source: by Daniel Amerian | Seeking Alpha

Why American Consumers Are About To Be Blindsided By An Inflationary Shockwave

While unsuspecting U.S. consumers continue to expect low, sub-2% inflation according to the latest YTD low breakeven rate, little do they know they are about to be blindsided by a coming inflationary shock, according to a new WSJ report which notes that many U.S. consumer staple and industry-leading companies are either already in the process of raising prices, or have set concrete plans to do so in the very near future. 

Once these price increases are passed through to consumers, it will likely mark the end to a long period of “low inflation” that the Fed has constantly leaned on as an excuse to keep rates low for nearly a decade.

Take Clorox for example, which is raising prices on everyday products like cat litter. Coca-Cola also reported higher prices for the past quarter. Mondelez International also plans to raise prices in North America next year according to an interview with its CEO on Monday. The food giant said that it is passing along rising costs, including ingredient and transportation costs, to consumers.

Airlines are also passing on costs as they are paying about 40% more for jet fuel than they were a year ago. Delta, JetBlue and American have all raised fees, fares, or both. Trucking costs were up 7% annually in September and private sector wages and salaries in the September quarter rose 3.1%.

Arconic was able to widen its operating margins this past quarter on its aluminum products by using tariffs to justify price hikes. Manufacturers are paying about 8% more for aluminum and 38% more for steel than they were a year ago. Looming potential tariffs with China to the tune of $200 billion also continue to weigh on input costs. 

Even such supposedly immune to day-to-day price fluctuation companies as Apple, recently raised prices on its new MacBook Air and iPad Pro products by between 20% and 25%.

The list goes on: Steve Madden said it would be raising prices on handbags and other products that it imports from China. It’s looking to shift production to other countries to avoid tariffs and said that products made in China could rise as much as 10% in price.

An interior designer working for Whiski Kitchen in Royal Oak, Michigan was cited by the Journal as stating that she was paying 15% more for quartz countertops made in China also as a result of U.S. tariffs. She’s also paying about 10% more for imported cabinets. 

Sherwin-Williams and PPG, both in the paint manufacturing business, stated in recent weeks that they would continue to raise prices to cover rising costs for input materials like titanium dioxide. Sherwin-Williams raised prices by as much as 6% this month.

Sherwin-Williams Chief Executive John Morikis said last week that “Raw material inflation has been unrelenting and accelerating.”

Food companies are also hiking prices. McDonalds’ 2.4% SSS comps in Q3 were a result of higher burger prices. Chili’s Restaurants raised the price of its two entree and an appetizer deal from $22 to $25 in the quarter. Habit Restaurants saw its prices rise by 3.9% in May of this year, even while traffic declined 3.4%. Hershey also has plans to sell candy in packaging next year that will raise its price per ounce. 

“Retailers understand that when costs go up, something has to give,” said Michele Buck, chief executive of Hershey, last week. 

https://www.zerohedge.com/sites/default/files/inline-images/chart%202_2_0.jpg?itok=6sMVfAyO

In today’s Manufacturing ISM report, a respondent encapsulated the above sentiment:

“Tariffs are causing inflation: increased costs of imports, increased cost of freight and increased domestic costs from suppliers who import.”

While inflation still technically remains near the Fed’s 2% target, if you believe the CPI number, which as we have discussed previously woefully under counts true inflation which is as much as three times higher than the Fed’s hedonically adjusted, politically motivated number, prices are set to move higher as a result of labor shortages, while headwinds for prices include the recent strength of the dollar, making imports cheaper. And then there are tariffs.

It’s obvious that higher prices will “work” alongside the Fed’s rate hikes to help dampen the United States economy further. Not only that, but higher prices could cause even more damage if the Fed sees raising rates as the main solution to inflation exceeding its expectations.

Diane Swonk, Grant Thornton’s chief economist, previewed what will happen next best: “We might see a pop of inflation in the first quarter.”

Once that happens in what is already a rising rate environment in which the president has made it clear he is solidly against any more Fed tightening, we wonder just what Powell’s next move will be when even higher prices force his bluff?

Source: ZeroZedge

Death Valley Days: Mortgage Applications, Credit Cycles And Excess Reserves

The Mortgage Bankers Association released their weekly survey of members (I don’t know if Quicken Loans is a member or not) and it revealed that mortgage REFINANCING applications remain in Death Valley since mortgage rates started increasing back in mid-2016.

https://confoundedinterestnet.files.wordpress.com/2018/11/deathvalleydays.png

Both purchase and refinancing applications were down from the previous week.

https://confoundedinterestnet.files.wordpress.com/2018/11/mbaapp.png

Of course, subprime borrower originations have declined since the finacial crisis and the housing bubble burst. But home prices continue to soar despite the malaise in mortgage purchase applications.

https://confoundedinterestnet.files.wordpress.com/2018/11/mbapcs.png

Of course, higher capital requirements for commercial banks and the Consumer Financial Protection Bureau helped chill the mortgage market. But with the Federal Reserve encouraging banks NOT to lend by paying interest on bank excess reserves, are we surprised at the malaise in mortgage purchase applications or originations?

https://confoundedinterestnet.files.wordpress.com/2018/11/resioer.png

Hence, it is not surprising to see a slowdown in the growth of bank credit YoY.

https://confoundedinterestnet.files.wordpress.com/2018/11/bankcreditslowdown.png

Yes, it is Death Valley Days … at least for mortgage refinancing.

https://confoundedinterestnet.files.wordpress.com/2018/11/dvdays.gif?w=458&h=340&zoom=2

Source: Confounded Interest

***

Rescuing the Banks Instead of the Economy

“You can’t bail out the banks, leave the debts in place, and rescue the economy. It’s a zero-sum game. Somebody has to lose. That’s what happened in 2009 when President Obama came in. He invited the bankers to the White House and he said, “I’m the only guy standing between you and the mob with pitchforks,” by which he meant the voters that he was bamboozling. He reassured the bankers. He said, “Look, my loyalty is to my campaign donors not to the voters. Don’t worry; my loyalty is with you.”

Luxury Home Prices In Singapore Soar 13% As Vancouver Prices Crash 11%

Singapore has now overtaken Hong Kong as the top city for luxury home price gains in Q3.

https://www.zerohedge.com/sites/default/files/inline-images/BLGKXBKBJBF2JPDUQA77327Q3U.JPG?itok=mmi0UrsQ

Luxury home prices in Singapore were up 13% in the third quarter from the year prior, according to Knight Frank LLP’s Prime Global Cities Index. The rising prices were partly the result of limited supply of higher end properties.

https://www.zerohedge.com/sites/default/files/inline-images/HK1_0.jpg?itok=94IXRb6q

Hong Kong instead fell to 14th place, with just a 5.5% year-over-year gain during the third quarter.

https://www.zerohedge.com/sites/default/files/inline-images/2018-10-31_13-49-38.jpg?itok=aA5r-p95

And the rise in Singapore does little to offer a picture of what the luxury property market looks like globally. Worldwide, luxury properties rose by just 2.7% on average across the 43 cities that make up the index – this is the weakest performance in annual terms in almost 6 years.

https://www.zerohedge.com/sites/default/files/inline-images/2018-10-31_13-49-51.jpg?itok=FVd7VnbB

Cities like Edinburgh and Madrid found themselves in the top five, while London wound up moving into negative territory, watching prices fall 2.9% as a result of the continuing uncertainty around Brexit. Cities like Paris and Berlin posted steady gains of 5.6% and 5.4%, respectively.

https://www.zerohedge.com/sites/default/files/inline-images/HK44_0.png?itok=riTPZJjk

Also among the decliners was Dubai, where prices fell 3.8% resulting in the middle eastern city being the fifth worst on the list. Stockholm, Istanbul and Taipei all registered 6.3% year-over-year declines, tying them all for second worst place.

Finally, pulling up the rear is Vancouver, where we have spent time documenting a collapsing real estate bubble over the last couple of months. Vancouver saw its luxury home prices down 11% as more affluent pockets of the city, like West Vancouver, saw a pronounced slowdown in sales.

At the beginning of October, we asked readers what happens when prices rise so high that a chasm forms between bids and asks in Vancouver? The market grinds to a halt.

That’s what happened in September, when according to the Real Estate Board of Vancouver (REBGV), residential property sales tumbled by 17.3% from August 2018, and a whopping 43.5% from one year ago. In fact, a total of only 1,595 transactions took place as both buyers and sellers continue to sit on their hands amid confusion whether the recent torrid price gains will continue or whether the housing bubble has burst.

Sales of detached properties in July was just 508, a decrease of 40.4% from the 852 recorded in September 2017, and the 812 apartments sold was a 44% drop compared to the 1,451 sales in September 2017.

And no, it’s not seasonal: last month’s sales were a whopping 36.1% below the 10-year September sales average.

Source: ZeroHedge

San Diego Home Sales Collapse To Lowest Level In 11 Years

A combination of rapid mortgage rate increases and decreased affordability, San Diego County home sales collapsed 17.5% to the lowest level in 11 years last month, in the first meaningful sign that one of the country’s hottest real estate markets could be at a turning point, real estate tracker CoreLogic reported Tuesday.

In September, 2,942 homes were sold in the county, down from 3,568 sales last year. This was the lowest number of sales for the month since the start of the financial crisis when 2,152 sold in September 2007.

https://www.zerohedge.com/sites/default/files/styles/inline_image_desktop/public/inline-images/San%20Diego%20home%20sales.png?itok=_dskgP5h

CoreLogic said median home prices dropped in the region to $575,000, the first decline since January, after hitting a record high of $583,000 in August.

Some experts blamed the slowdown on rising mortgage rates, which have drastically increased the per month debt servicing payments for potential new homebuyers.

“The double whammy of higher prices and rising mortgage rates has priced out some would-be buyers and prompted others to take a wait-and-see stance,” said Andrew LePage, a CoreLogic analyst, in the release. “There was one caveat to last month’s sharp annual sales decline — this September had one less business day for recording transactions. Adjusting for that, the year-over-year decline would be about 13 percent, still the largest in four years.”

On a monthly basis, sales declined 22% in September compared with August. Cyclically, sales tend to drop 10% from August to September, but this time, it seems that industry is experiencing late cycle stress.

The report also said sales of newly built homes are suffering more than sales of existing homes because home builder production remains below the historical mean. New home constructions come at a premium. Sales of newly built homes were 47% below the September average dating back to 1988, while sales of existing homes were 22% below their long-term average.

The S&P CoreLogic Case-Shiller San Diego Home Price NSA Index (data via Reuters Eikon) shows a potential double top with 2005 high. Lifetime high occurred in July 2018 of 259.69, with the index now fading into the Fall period.

https://www.zerohedge.com/sites/default/files/styles/inline_image_desktop/public/inline-images/corelogic%20SD.png?itok=GXnYtJdb

Additional S&P CoreLogic Case-Shiller San Diego Home Price data

https://www.zerohedge.com/sites/default/files/styles/inline_image_desktop/public/inline-images/2018-10-31_04-59-49.png?itok=fMbTVa_q

“Price growth is moderating amid slower sales and more listings in many markets,” LePage said. “This is welcome news for potential home buyers, but many still face a daunting hurdle – the monthly mortgage payment, which has been pushed up sharply by rising mortgage rates.”

Last month, Bank of America Called It: “The Peak In Home Sales Has Been Reached; Housing No Longer A Tailwind.” It seems that the San Diego real estate market woes are more evidence that storm clouds are gathering over the broader U.S real estate market.

https://youtu.be/SQsvcVkENeI

Source: ZeroHedge

62% Of All US Jobs Don’t Pay Enough To Support A Middle-Class Life

We just got more evidence that the middle class in America is rapidly disappearing...

https://www.zerohedge.com/sites/default/files/inline-images/image%20%281%29.jpg?itok=lDA8IBhjAuthored by Michael Snyder via The American Dream blog,

According to a shocking new study that was just released, 62 percent of all jobs in the United States do not pay enough to support a middle class life.  That means that “the American Dream” is truly out of reach for most of the country at this point.  Today, Americans are working harder than ever but the cost of living continues to rise much faster than our paychecks are increasing.  Earlier this month, I went and looked at the latest numbers from the Social Security Administration, and I discovered that 50 percent of all American workers make less than $30,533 a year. But that is just above poverty level.  In fact, the federal poverty level for a family of five is currently $29,420. Most families are just barely scraping by from month to month, and most U.S. workers are just one major setback away from falling out of the middle class.

It wasn’t always this way.  At one time, America had the strongest and most vibrant middle class in the history of the world.  But now this latest study has discovered that “it’s only 38 percent of people who get the middle class life or better”

When wages are weighed against the cost of living in the largest 204 metropolitan regions across the nation, 62 percent of jobs don’t pay enough for a dual-income household with children to meet the definition of ‘middle class,’ according to a new ‘Opportunity Indexdeveloped by Third Way, a Washington D.C.-based think tank.

‘We were shocked to find out it’s only 38 percent of people who get the middle class life or better,’ said Ryan Bhandari, a policy advisor for Third Way, in an interview with DailyMail.com.

It is no wonder why so many people are shopping at Wal-Mart and the Dollar Tree these days.

For many Americans, those are the literally the only places they can afford to shop.

https://www.zerohedge.com/sites/default/files/inline-images/636764278871163810-103018-Jobs-ONLINE.png?itok=rsASigOC

When I was growing up, it seemed like literally everyone else around me was “middle class”, but now those days are long gone.  Here is a breakdown of some more of the numbers from this latest study

  • 30 percent of jobs are “hardship jobs,” meaning they don’t allow a single adult to make ends meet.
  • 32 percent are “living wage” jobs, enough to get by but not to take vacations, save for retirement or live in a moderately priced home.
  • 23 percent are middle-class jobs, allowing for dining out, modest vacations and putting some money away for retirement.
  • 15 percent are “professional jobs,” paving the way for a more comfortable life that includes more elaborate vacations and entertainment and a more expensive home.

It sure must be nice to be in that top 15 percent, if you have the right connections.

https://www.zerohedge.com/sites/default/files/inline-images/5614126-6335063-image-a-20_1540993019737.jpg?itok=zWjxAJYw

And the definition of a “middle class income” changes based on where you live.  As the study noted, it is much cheaper to live a middle class lifestyle in the middle of the country than it is to do so on the west coast.  The following comes from the Daily Mail

For example, a worker in San Francisco – one of the most expensive housing markets in the country – must make a minimum of $82,142 to achieve a middle class lifestyle.

By comparison, workers in Cedar Rapids, Iowa can achieve middle class status in a job paying $40,046 or more per year.

So many of us have run ourselves ragged doing the things that we were “supposed” to do, and we assumed that a middle class life would be the reward at the end of the trail.

Unfortunately, that reward has never materialized for millions of hard working Americans. USA Today profiled one of those deeply frustrated workers in a recent article…

Esther Akutekha, who lives in Brooklyn, New York, has a good job as a public relations specialist that pays more than $50,000 a year.

But because of the $1,440 a month rent on her studio apartment in the Prospect-Lefferts Gardens neighborhood, she never takes vacations, dines out just once a month and scrapes together dinner leftovers for lunch the next day.

Can you identify with Esther?

I sure can.

It can be soul crushing to work as hard as you can only to realize that your goals are now farther away than ever.  At this point, Esther is not even sure that she will ever be able to afford to have children

“I’m frustrated with the fact that I’m not going to be able to save anything because my rent is so high,” says Akutekha, who says she’s 30ish. “I don’t even know if I can afford” to have children.

We have been told that the economy has been “booming” in recent years, but the truth is that it has only been booming for people at the very top of the pyramid.

For most Americans it is as if the last recession never ended, and things just seem to keep getting worse

“There’s an opportunity crisis in the country,” says Jim Kessler, vice president of policy for Third Way and editor of the report. “It explains some of the economic uneasiness and, frankly, the political uneasiness” even amid the most robust U.S. economy and labor market since before the Great Recession of 2007 to 2009. But is the economy robust? Or are we being fed a line by the mainstream media? The middle class is not thriving, and increased regulations and higher taxes make it difficult for people to branch out on their own and create their own business.

We definitely need to make it much, much easier for people to start small businesses, and this is something that I have written about extensively. Small business creation has traditionally been one of the primary vehicles for upward mobility in our nation, but right now the rate of small business creation is hovering near all-time lows.  We desperately need to get that turned around if we ever want to have any hope of restoring vitality to our middle class.

If we continue on the path that we are on, we are going to continue to get the same results.  Tonight, more than half a million Americans are homeless, and the ranks of the poor are growing with each passing day.

America needs a strong middle class, but currently our middle class is disintegrating at a startling pace.

If we are not able to reverse this trend, what is the future going to look like for our society?

Source: ZeroHedge

LIBOR’s Phase Out Poses Massive Uncertainty for Adjustable Rate Mortgage Stakeholders

LIBOR, the London Interbank Offered Rate, which sets the rate for 2.8 million adjustable-rate mortgages (ARMs) and most reverse mortgages, is set to expire in three years. The index that appears to be LIBOR’s most likely successor, the Secured Overnight Financing Rate (SOFR), could potentially create a $2.5 to $5.0 billion annual windfall for forward mortgage holders and an equivalent loss for investors.  

Fannie Mae, Freddie Mac (the government-sponsored enterprises, or GSEs), and their regulator, the Federal Housing Finance Agency (FHFA), have the greatest influence on the transition from LIBOR to a new index. Given the scope of the potential impact on investors and consumers, it’s important that the FHFA and the GSEs continue planning for the LIBOR change.

The LIBOR, dubbed “the world’s most important number,” is the rate at which banks report that they lend money to each other. It is a reference index, setting interest rates on mortgages and millions of other financial contracts totaling $200 trillion. Because of the “LIBOR fixing” scandal, in which certain banks deliberately misrepresented their lending rates (which are used to create the LIBOR), LIBOR is expected to be replaced by an alternative index by the end of 2021.

There are about $1 trillion in LIBOR-based adjustable-rate forward mortgages, or 2.8 million mortgages which represent close to 10 percent of the outstanding mortgage market. The greatest concentration is in loans held in bank portfolios and in private-label securities.

https://edit.urban.org/sites/default/files/liborpie.jpg

Approximately 57 percent of these 2.8 million LIBOR-based mortgages were originated pre-crisis. In terms of credit characteristics, LIBOR ARMs tend to look similar to fixed-rate loans originated at the same time, except in the private label securities market, where the characteristics of the pre-crisis LIBOR product were weaker. LIBOR ARMs tend to be larger loans than their fixed rate counterparts. This is particularly pronounced in the bank portfolio space, where the average ARM loan is $582,400 versus $306,200 for all portfolio loans.

https://edit.urban.org/sites/default/files/libortable.jpg

We also need to consider the possibility of a “zombie” LIBOR

LIBOR is apt to disappear at the end of 2021. Regulatory bodies are encouraging banks to continue to submit the numbers used to create the LIBOR through the end of 2021, at which point they are likely to stop. At that point, a substitute index will need to be used.

The legal documents on most adjustable-rate mortgages allow for the substitution of a new index based on comparable information if the original index is no longer available. But contract language for most mortgages is largely silent on how to define a reasonable substitute and what it means for LIBOR to be unavailable. 

On the latter issue, there is also the possibility that the LIBOR will become increasingly unreliable before it expires. As banks begin to pull back from providing information, they may create what has been nicknamed a “Zombie LIBOR,” which would be an unreliable LIBOR index and a real risk.

We believe that Fannie Mae and Freddie Mac, while they play a small role in the LIBOR market for adjustable-rate mortgages (20 percent by loan count), will decide under FHFA guidance how they want to handle GSE adjustable-rate mortgages, and the rest of the market will follow suit.  

What will the SOFR do to mortgage rates?

A group convened by the Federal Reserve has recommended that the SOFR be the successor to the LIBOR, but the SOFR differs from the LIBOR in two important ways:

  1. The SOFR is a secured rate, while the LIBOR is unsecured and, therefore, includes a risk premium. Historically, this has meant that the SOFR has been both lower than the LIBOR and less volatile.
  2. The SOFR is an overnight rate, while the LIBOR is quoted for a variety of terms.

Efforts have been made to encourage the development of a longer-term SOFR, but this market has not yet matured, so it’s not clear how the longer-term SOFR will be priced. But by comparing the historic LIBOR and SOFR rates and comparing one-year LIBORs with one-year Treasuries (as a proxy for the still-emerging longer-term SOFR), we estimate that a one-year SOFR will be 25 to 50 basis points lower than a one-year LIBOR. If this is accurate, substituting the SOFR for the LIBOR could decrease the mortgage rate on the outstanding LIBOR-indexed ARMs by 25 to 50 basis points.

https://edit.urban.org/sites/default/files/liborline.jpg

If SOFR was substituted for LIBOR, we estimate that, over the entire $1 trillion forward ARM market, this differential would give borrowers a change in cumulative payments and investors an increased cost of $2.5 to $5.0 billion a year, or $15 to $30 billion on a present-value basis.

Close to 90 percent of the recent reverse mortgage market originations (home equity conversion mortgages, or HECMs) and 60 percent, or $50 billion, of the overall HECM market is also LIBOR based. In the $50 billion LIBOR HECM market, the likely beneficiary would be the heirs or the Federal Housing Administration (FHA) for any paid insurance claims, and the investors in Ginnie Mae securities would face increased costs. We estimate this transfer could be about $125 million a year, or a present value of $2 billion.

Why not align the SOFR more closely with the LIBOR?

Conceptually, the SOFR rate could be more closely aligned with the LIBOR rate by defining the new index as term SOFR + x basis points. This would leave borrowers, on average, in the same position as they are now. But even here, there are potential issues.

Any add-on may work on average or “ex ante,” but it is subject to dispute. Reasonable people may come up with different estimates of the add-on, and even 1 basis point on $1 trillion is $100 million a year. We have seen litigation over smaller amounts. It may also be difficult for the mortgage market to use an add-on if the larger $200 trillion LIBOR market does not make this adjustment. 

Historically, the GSEs have tried to be considerate of borrowers when reference rates are discontinued, and we would indeed see a benefit to consumers if the GSEs move to the SOFR index without an add-on. 

Given the scope of the potential impact on investors and consumers, it is important that the FHFA and the GSEs continue planning for the LIBOR change in the forward market and that the FHA think about the impact in the reverse market. This is a complicated issue with no easy solution.

Source: by Edward Golding and Laurie Goodman | Urban Institute

Hong Kong Condos Begin Underwater Journey As 20% Drop Results In Negative Equity

https://pix6.agoda.net/city/16808/16808-7x3.jpg?s=1920x

Hong Kong homeowners who bought flats in the last several months have seen their value decline as much as 20% in a matter of recent weeks, according to HSBC, sending values into negative equity which had only left the region from the prior downturn that ended in early 2017, reports the South China Morning Post.

https://www.zerohedge.com/sites/default/files/inline-images/hong%20kong%20housing.jpg?itok=PCFgNQk5Hong Kong’s famously expensive property market has started to feel the strain lately from a fall in demand caused by rising interest rates, a struggling stock market and fears about the impact of the US-China trade war. Negative equity occurs when a home loan exceeds the market value of the property, and has not been seen in Hong Kong since early 2017. –SCMP

“Theoretically, buyers who obtained a mortgage of 90 per cent of the flat’s value will fall into negative equity once home prices have dropped more than 10 per cent,” said Chief Vice-President at mReferral Mortgage Brokerage Services, Sharmaine Lau.

The largest losses are likely to be flat owners who paid sky-high prices for tiny apartments in older tenements, according to industry watchers, who add that banks tend to become very conservative in valuing such properties when the real estate market takes a turn for the worse.

https://assets.bwbx.io/images/users/iqjWHBFdfxIU/ibCYKiHZaaG4/v0/1200x-1.jpgPhotographer: Justin Chin/Bloomberg

“Lower valuations will first apply to flats that have less marketability. Banks’ valuations, which are supported by surveyors, are made in line with market conditions,” said Cushman and Wakefield head of valuation and advisory services for the Asia-Pacific region, Chiu Kam-kuen. 

Meanwhile, SCMP was able to find apartments at older housing developments which are now valued at HSBC far below their recent selling prices. 

A 234 square foot unit at 36-year-old Lee Bo Building in Tuen Mun, which was sold for HK$3.82 million on October 8, is now valued 20 per cent lower at HK$3.08 million. In North Point, a 128 square foot unit at 41-year-old Yalford Building, sold on August 29 for HK$3.1 million, is also valued a fifth lower now by the bank, at HK$2.48 million.

In Kowloon, a 210 square foot unit at 34-year-old Hong Fai Building in Cheung Sha Wan sold for HK$3.87 million on June 20 is already down about 13 per cent, according to HSBC, at HK$3.38 million.

The spectre of negative equity is only going to get worse, according to Louis Chan, Asia-Pacific vice-chairman and chief executive for residential sales at Centaline Property.

“More homeowners will fall into negative equity next year as flat prices may decline by 10 per cent,” he said. –SCMP

The precipitous drop may force companies such as the Hong Kong Mortgage Corporation (HKMC) to adjust their mortgage insurance program in light of market developments. 

Under the program, buyers of flats worth less than HK$4.5 million can get mortgage loans of up to 90 per cent of the unit’s value, capped at HK$3.6 million, while for flats priced between HK$4.5 million and HK$6 million the maximum loan-to-value ratio is 80 per cent, capped at HK$4.8 million.

In the first quarter of 2018, HKMC said 6,955 applicants secured HK$26.86 billion in home loans under the mortgage insurance program. In 2017, a total of HK$32.3 billion in mortgages were granted to 8,829 applicants, up from HK$24.6 billion of 7,145 successful in 2016. –SCMP

Negative equity reached its peak in Hong Kong in 2003 following an outbreak of Severe Acute Respiratory Syndrome (SARS) which sent already-teetering home values plummeting. According to the HKMA, over 105,000 households found themselves in negative equity at the time – all of which were above water as of the first quarter of last year.

Source: ZeroHedge

US Home Ownership Rate Rises To 64.4% As Home Price Growth Slows

The US home ownership rate increased to 64.4% in Q3 2018 after hitting the post-recession bottom in Q2 2016.

https://confoundedinterestnet.files.wordpress.com/2018/10/homeown.png

According to the Case-Shiller home price index, home prices are still growing at over 2x hourly earnings growth. And the growth rate is slowing.

https://confoundedinterestnet.files.wordpress.com/2018/10/csearnsss.png

And like the Cleveland Browns, Washington DC continues to lose in the home price derby, but at least DC is now tied with The Big Apple and Chicago for least place.

https://confoundedinterestnet.files.wordpress.com/2018/10/csurban.png

Source: Confounded Interest

Home Price Growth Slows Most Since 2011 As Case-Shiller Rolls Over

Amid the collapse on US home sales, as mortgage rates surge above 5.00%, August’s Case-Shiller home price data plunged to its weakest annual growth since Dec 2016, dramatically missing expectations).

Against expectations of a 5.80% YoY rise, August home prices rose 5.49% (slowing from July’s 5.90% YoY) to its weakest since Dec 2016…

https://www.zerohedge.com/sites/default/files/inline-images/2018-10-30_6-02-10.jpg?itok=N0TP2Lt_

This is the biggest two-month slowdown in Case-Shiller home price growth since 2014…

https://www.zerohedge.com/sites/default/files/inline-images/2018-10-30.png?itok=k6MAWHOy

On a non-seasonally-adjusted basis, home prices rose 5.77%, down from 5.99%, the lowest since June 2017.

And judging by mortgage rates, it’s about to get a whole lot worse…

https://www.zerohedge.com/sites/default/files/inline-images/2018-10-30_6-12-59.jpg?itok=8UhvPbfH

Of course, the establishment is saying this is “contained”:

“Following reports that home sales are flat to down, price gains are beginning to moderate,” David Blitzer, chairman of the S&P index committee, said in a statement. “There are no signs that the current weakness will become a repeat of the crisis, however.”

Las Vegas had the biggest annual increase at 13.9 percent, followed by San Francisco at 10.6 percent and Seattle at 9.6 percent,

https://www.zerohedge.com/sites/default/files/inline-images/2018-10-30%20%281%29.png?itok=vPBTu7Dq

But Seattle’s price appreciation slumped MoM…the biggest drop since Feb 2011…

https://www.zerohedge.com/sites/default/files/inline-images/2018-10-30_6-23-32.jpg?itok=bTwOj3sb

Is it any surprise that home builder stocks have collapsed along with US housing data?

https://www.zerohedge.com/sites/default/files/inline-images/2018-10-30_5-58-59.jpg?itok=U2x9OqyF

Source: ZeroHedge

The “Rental Affordability Crisis” Explained In Three Charts

Four years ago, the United States Department of Housing and Urban Development (HUD) warned of “the worst rental affordability crisis ever,” citing data that:

“About half of renters spend more than 30% of their income on rent, up from 18% a decade ago, according to newly released research by Harvard’s Joint Center for Housing Studies. Twenty-seven percent of renters are paying more than half of their income on rent.”

This is a significant problem for US consumers, and especially millennials, because as we have noted repeatedly over the past year, and a new report confirms, “rent increases continue to outpace workers’ wage growth, meaning the situation is getting worse.”

In the second quarter of 2017, median asking rents jumped 5% from $864 to $910. In the first half of 2018, they have remained at levels crushing the American worker.

https://www.zerohedge.com/sites/default/files/styles/inline_image_desktop/public/inline-images/Median%20Asking%20Rent%20for%20Vacant%20Units.jpg?itok=bFd4Hwut

While the surge in median asking rents has triggered an affordability crisis, new data now shows just how much a person must make per month to afford rent.

According to HowMuch.Net, an American should budget 25% to 30% of monthly income for rent, but as shown by the New Deal Democrat, workers are budgeting about 50% more of their salaries than a decade earlier. The report specifically looked at the nation’s capital, where a person must make approximately $8,500 per month to afford rent.

https://www.zerohedge.com/sites/default/files/styles/inline_image_desktop/public/inline-images/Rent%20map.png?itok=HHeBBKrU

In California, the state with the largest housing bubble, the monthly income to afford rent is roughly $8,300, followed by Hawaii at $7,800 and New York at $7,220.

https://www.zerohedge.com/sites/default/files/styles/inline_image_desktop/public/inline-images/Rent%20Map%202_0.png?itok=czp0y6sD

In contrast, the Rust Belt and the Southeastern region of the United States, one needs to make only $3,500 per month to afford rent.

“Based on the rule of applying no more than one-third of income to housing, people living in the Northeast must earn at least twice as much as those living in the South just to afford rent for what each market considers an average home,” HowMuch.net’s Raul Amoros told MarketWatch.

Which, however, is not to say that owning a house is a viable alternative to renting. In fact, as Goldman notes in its latest Housing and Mortgage Monitor, “buying is looking increasingly less affordable vs. renting with home prices growing faster than rents.”

https://www.zerohedge.com/sites/default/files/inline-images/goldman%20rental%20affordability.jpg?itok=nuiZGj-s

In short: the situation is not likely to improve in the short-term.

A sign of relief could be coming in the second half of 2019 or entering into 2020 when the US economy is expected to enter a slowdown, if not outright recession. This would reverse the real estate market, thus providing a turning point in rents that would give renters relief after a near decade of overinflated prices.

Source: ZeroHedge

San Francisco Bay Area Expats Are Driving Up Home Prices From Boise To Reno

In the not-too-distant future, it’s not improbable that low-wage laborers in San Francisco will be replaced by ubiquitous machines (the city is already home to the first restaurant run by a robot). And not just fast food workers, either – the jobs of teachers, fire fighters and law enforcement will all be assumed by robots, as NorCal’s prohibitively high cost of living and astronomical home prices spark a mass exodus of families earning less than $250,000 a year.

https://www.zerohedge.com/sites/default/files/inline-images/2018.10.24cali.JPG?itok=aZQnQjNE

While this scenario might seem like an exaggeration (and it very well might be), we’ve paid close attention to the flight of Californians who are abandoning the Bay Area for all of the reasons mentioned above, as well as what Peter Thiel (himself a Bay Area emigre) once described as a political “monoculture” that has made California inhospitable for conservatives. And as if circumstances weren’t already dire enough for would-be homeowners (even miles away from San Francisco, relatively modest homes still sell for upwards of $2 million), a report published earlier this year by realtor.com illustrated how a lapse in new home construction has led to a serious imbalance between home supply and the increasing demand of the state’s ever-growing population, leading to a cavernous supply gap.

https://www.zerohedge.com/sites/default/files/inline-images/2018.10.24california.jpg?itok=ltrugbRz

With this in mind, it shouldn’t be surprising that Californians comprise a majority of the residents moving into other states in the American West – even states like Idaho where the culture is very different from the liberal Bay Area. This week, Bloomberg published a story about how Californians constitute an increasing share of out-of-state homebuyers in small cities like Boise, Phoenix and Reno, which are significantly more affordable than California, and offer some semblance of the walkable urban environment that nesting millennials crave.

https://www.zerohedge.com/sites/default/files/inline-images/2018.10.24maptwo.JPG?itok=fB95lYCO

As Californians sell their homes in the Bay Area in search of roomier, cheaper locales, they’re bringing the curse of surging property prices with them. In fact, the influx of Californians is the primary factor leading to some of the largest YoY price increases in the country, as Bloomberg explains:

About 29 percent of the Idaho capital’s home-listing views are from Californians, according to Realtor.com. Reno and Prescott, Ariz., also were popular. These housing markets are soaring while much of the rest of the country cools. In Nevada, where Californians make up the largest share of arrivals, prices jumped 13 percent in August, the biggest increase for any state, according to CoreLogic Inc. data. It was followed closely by Idaho, with a 12 percent gain.

Even in places like deep-red Idaho, these transplants are beginning to remake the terrain in their own image, as food co-ops and Women’s Marches starting to populate the landscape. Businesses are rushing to Boise to meet every desire of the newly arrived Cali transplants.

D’Agostino, the Bay Area transplant, isn’t ashamed of her progressive views and is finding her place: at the natural foods co-op downtown, the Boise’s Women’s March last year, and with the volunteer group she founded to collect unused food for the needy. But it was also good to get out of her comfort zone, she says. “I can’t remember a time when it’s ever been this divided, so the fact that I can have some interaction with people who might not have exactly the same beliefs as me, that’s fine,” she says. “As long as we can respect each other.”

It’s not new for politics to factor into moving decisions—it’s just that in the age of Trump, tensions get magnified. “What’s different now is how far apart the parties are ideologically,” says Matt Lassiter, a professor of history at the University of Michigan.

Politics aside, businesses are rushing into Boise to fill every West Coast craving. In nearby Eagle, the new Renovare gated community is selling 1,900- to 4,000-square-foot homes with floor-to-ceiling glass and “wine walls” that start at $650,000—a bargain by California standards, says sales agent Nik Buich. About half of buyers are from out of state, he says.

One couple even opened a “boutique taqueria” and another transplant is preparing to start a blog about his experience moving to Idaho.

Julie and John Cuevas left Southern California a year ago to open Madre, a “boutique taqueria” in Boise that would make many of their fellow transplants feel at home. It’s more fusion than typical Mexican fare, with taco fillings including kimchi short rib and the popular “Idaho spud & chorizo.” It would have cost them three times as much to open a restaurant in California, says John, a former chef at a Beverly Hills hotel.

John Del Rio, a real estate agent sporting a beard, baseball cap, and sunglasses, just registered moving2idaho.com, where he’s planning to blog about all the things that make his new home great. He left Northern California two years ago with his wife in search of a place with less crime, lighter regulation, and more open space. Del Rio, a conservative with a libertarian bent, is reassured to see average people walking through Walmart with handguns in their holsters. In Idaho, he says, “nobody even flinches.”

In Boise alone, Californians made up 85% of new arrivals, and have driven home prices up nearly 20% in the span of a year. One realtor described the attitude of transplants as like “they’re playing with monopoly money.”

Nestled against the foothills of the Rocky Mountains, Boise (pop. 227,000) has drawn families for decades to its open spaces and short commutes. It’s been particularly attractive to Californians, who accounted for 85 percent of net domestic immigration to Idaho, according to Realtor.com’s analysis of 2016 Census data. While it has always prided itself on being welcoming, skyrocketing housing costs fueled by the influx is testing residents’ patience. In his state of the city speech last month, Mayor David Bieter outlined steps to keep housing affordable and asked Boise to stay friendly: “Call it Boise kind, our kindness manifesto,” he said.

It’s especially easy for buyers who have sold properties in the Golden State to push up prices in relatively cheap places because they feel like they’re playing with Monopoly money, Kelman says. The median existing-home price in Boise’s home of Ada County was $299,950 last month—up almost 18 percent from a year earlier, but still about half California’s. The influx is great news for people who already own homes in the area, says Danielle Hale, chief economist for Realtor.com. “But if you’re a local aspiring to home ownership, it feels very much that Californians are bringing high prices with them.”

And now that Trump’s tax reform package has been implemented, it’s only a matter of time before a whole new batch of Californian home owners, unwilling to forego their SALT tax write offs, start looking for greener pastures in low-cost red states.

Source: ZeroHedge

Where The Next Financial Crisis Begins

https://macromon.files.wordpress.com/2010/09/cropped-currency11.jpg

(Global Macro Monitor) We are not sure of how the next financial crisis will exactly unfold but reasonably confident it will have its roots in the following analysis. Maybe it has already begun.

The U.S. Treasury market is the center of the financial universe and the 10-year yield is the most important price in the world, of which, all other assets are priced. We suspect the next major financial crisis may not be in the Treasury market but will most likely emanate from it.

U.S. Public Sector Debt Increase Financed By Central Banks 

The U.S. has had a free ride for this entire century, financing its rapid run up in public sector debt,  from 58 percent of GDP at year-end 2002, to the current level of 105 percent, mostly by foreign central banks and the Fed.

Marketable debt, in particular, notes and bonds, which drive market interest rates have increased by over $9 trillion during the same period, rising from 20 percent to 55 percent of GDP.

Central bank purchases, both the Fed and foreign central banks, have, on average, bought 63 percent of the annual increase in U.S. Treasury notes and bonds from 2003 to 2018. Note their purchases can be made in the secondary market, or, in the case of foreign central banks,  in the monthly Treasury auctions.

In the shorter time horizon leading up to the end of QE3,  that is 2003 to 2014, central banks took down, on average, the equivalent of 90 percent of the annual increase in notes and bonds.  All that mattered to the price-insensitive central banks was monetary and exchange rate policy. 

Stunning.

Greenspan’s Bond Market Conundrum

The charts and data also explain what Alan Greenspan labeled the bond market conundrum just before the Great Financial Crisis (GFC).   The former Fed chairman was baffled as long-term rates hardly budged while the Fed raised the funds rate by 425 bps from 2004 to 2006, largely, to cool off the housing market.

The data show foreign central banks absorbed 120 percent of all the newly issued T-notes and bonds during the years of the Fed tightening cycle, freeing up and displacing liquidity for other asset markets, including mortgages. Though the Fed was tight, foreign central bank flows into the U.S., coupled with Wall Street’s financial engineering, made for easy financial conditions.

Greenspan lays the blame on these flows as a significant factor as to why the Fed lost control of the yield curve.  The yield curve inverted because of these foreign capital flows and the reasoning goes that the inversion did not signal a crisis; it was a leading cause of the GFC (great financial crisis) as mortgage lending failed to slow, eventually blowing up into a massive bubble.

Because it had lost control of the yield curve, the Fed was forced to tighten until the glass started shattering.  Boy, did it ever.

Central Bank Financing Is A Much Different Beast

The effective “free financing” of the rapid increase in the portion of the U.S debt that matters most to markets, by creditors who could not give one whit about pricing, displaced liquidity from the Treasury market, while at the same time, keeping rates depressed, thus lifting other asset markets.

More importantly, central bank Treasury purchases are not a zero-sum game. There is no reallocation of assets to the Treasury market in order to make the bond buys.  The purchases are made with printed money.

Reserve Accumulation

It is a bit more complicated for foreign central banks, which accumulate reserves through currency intervention and are often forced to sterilize their purchase of dollars, and/or suffer the inflationary consequences.

Nevertheless, foreign central banks park much of their reserves in U.S. Treasury securities, mainly notes.

Times They Are A Chang ‘en

The charts and data show that since 2015, central banks have on average been net sellers of Treasury notes and bonds to the tune of an annual average of -19 percent of the yearly increase in net new note and bonds issued. The roll-off of the Fed’s SOMA Treasury portfolio, which is usually financed by a further increase in notes and bonds, does not increase the debt stock but, it is real cash flow killer for the U.S. government.

Unlike the years before 2015, the increase in new note and bond issuance is now a zero-sum game and financed by either the reallocation from other asset markets or an increase in financial leverage. The structural change in the financing of the Treasury market is taking place at a unpropitious time as deficits are ramping up.

Because 2017 was unique and an aberration of how the Treasury financed itself due to debt ceiling constraint, the markets are just starting to feel this effect. Consequently, the more vulnerable emerging markets are taking a beating this year and volatility is increasing across the board.

The New Market Meta-Narrative 

We suspect very few have crunched these numbers or understand them and this new meta-narrative supported by the data is the main reason for the increase in market gyrations and volatile capital flows this year.   We are pretty confident in the data, and the construction of our analysis. Feel free to correct us if you suspect data error and where you think we are wrong in our analysis. We look forward to hearing from you.

Moreover, the screws will tighten further as the ECB ends their QE in December.  We don’t think, though we reserve the right to be wrong, as we often are, this is just a short-term bout of volatility, but it is the beginning of a structural change in the markets as reflected in the data.

Interest Rates Will Continue To Rise

It is clear, at least to us, the only possibility for the longer-term U.S. Treasury yields to stay at these low levels is an increase in haven buying, which, ergo other asset markets will have to be sold. If you expect a normal world going forward, that is no recession or sharp economic slowdown, no major geopolitical shock, or no asset market collapse,  by default, you have to expect higher interest rates.  The sheer logic is in the data.

Of course,  Chairman Powell could cave to political pressure and “just print money to lower the debt” but we seriously doubt it and suspect the markets would not respond positively.

Stay tuned.

https://macromon.files.wordpress.com/2018/10/central-bank_2.png

https://macromon.files.wordpress.com/2018/10/central-bank_5.png

https://macromon.files.wordpress.com/2018/10/central-bank_10.png

Source: Global Macro Monitor

September YoY Home Sales Down 13.2%, Median Price Down 3.5%, S&P Down 6.5% From High

New Home Sales (SAAR) in September plunged to their lowest since Dec 2016, crashing 5.5% MoM (and revised dramatically lower in August)… Maybe Trump has a point on Fed rate hikes?

Remember this is the first month that takes the impact of the latest big spike in rates – not good!

This is a disastrous print:

August’s 629k SAAR was revised drastically lower to 585k and September printed 553k (SAAR) massively missing expectations of 625k (SAAR) – plunging to the weakest since Dec 2016…

https://www.zerohedge.com/sites/default/files/inline-images/2018-10-24_7-02-08.jpg?itok=o2oEP3n7

That is a 13.2% collapse YoY – the biggest drop since May 2011

https://www.zerohedge.com/sites/default/files/inline-images/2018-10-24.png?itok=mO5y0zJX

The median sales price decreased 3.5% YoY to $320,000…

https://www.zerohedge.com/sites/default/files/inline-images/2018-10-24%20%281%29.png?itok=hgp-Zkpa

New homes sales were down across all regions … except the midwest.

https://confoundedinterestnet.files.wordpress.com/2018/10/nhstable.pngSource: Confounded Interest

As the supply of homes at current sales rate rose to 7.1 months, the highest since March 2011, from 6.5 months.

https://www.zerohedge.com/sites/default/files/inline-images/2018-10-24%20%282%29.png?itok=kft0a499

The decline in purchases was led by a 40.6 percent plunge in the Northeast to the lowest level since April 2015 and 12 percent drop in the West.

Source: ZeroHedge


70% Of S&P 500 Stocks Are Already In A Correction

Spooked by fears about peak profits, the slowing Chinese economy, Trump’s tariffs, ongoing political turmoil in the UK and Italy, and ongoing jitters among systematic, vol-targeting funds, on Tuesday the S&P tumbled as much as 2.34% in early trade – a drop which almost wiped out all gains for the year – before paring losses and closing only -0.55% lower. The drop pushed the S&P’s decline from its September highs to 6.5%, two-thirds on the way to a technical correction.

https://www.zerohedge.com/sites/default/files/inline-images/S%26P%20from%20highs.jpg?itok=qhSNB0d4

However the relatively stability at the index level has masked turmoil among individual names where some 1,256 stocks hit 52-week lows, while only 21 establishing new highs.

https://www.zerohedge.com/sites/default/files/inline-images/Blood%20on%20Wall%20St.PNG?itok=Om2dtkhx

More concerning, and a testament to the tech-heavy leadership of the market concentrated amid just a handful of stocks, is that while the broader S&P 500 index has yet to enter a correction, more than three quarters of all S&P stocks – or 353 – have already fallen more than 10% from their highs. Worse, of those, more than half 179 have already fallen by 20% or more from their highs, entering a bear market.

https://www.zerohedge.com/sites/default/files/inline-images/stocks%20reuters%201.PNG?itok=5eZQDzEv

The reason why the broader index has so far avoided a similar fate is because Apple, whose $1 trillion market value makes it by far the most heavily weighted stock within the S&P 500, has fallen only 4.6% from its October 3 record high. That has helped the S&P 500 itself stay out of correction territory.

Broken down by sector, the S&P 500 materials index – the closest proxy of Chinese economic growth – has fared the worst in October, leaving it down 19% from its 52-week highs, with the utilities index is the outperformer, down just 5 percent.

https://www.zerohedge.com/sites/default/files/inline-images/Sectors%20vs%2052-week%20highs.PNG?itok=N1dR9Xc5

At the individual level, among the bottom 10 S&P 500 performers, are names likes Wynn Resorts and Western Digital, both highly exposed to China. Nektar Therapeutics and Newell Brands are also among the S&P 500’s worst performers.

https://www.zerohedge.com/sites/default/files/inline-images/Stocks%20furthest%20from%20highs.PNG?itok=t0do72Y-

Taking a step back, despite its relative resilience, the S&P 500 is still on track for its worst month since August 2015, while most global equities are down for the year. North America is still the best performing region with 67% of the six countries having benchmark equities trading higher on the year in US dollar terms, according to Deutsche Bank. In EMEA, only 23% of countries are up, and only 6% of countries in the European Union (in USD). In South American (6 countries) and Asia (18), not a single country has a positive return in USD terms this year.

One day later, and despite widespread call for an imminent market bounce, traders remain completely ambivalent as today’s market cash open action shows:

  • Half of S&P 500 stocks rising, half falling
  • 5 of 11 S&P 500 groups rising, 6 falling
  • 15 DJIA stocks rising, 15 falling

Meanwhile, the Nasdaq has a more negative tone with decliners outpacing advancers. In other words, as Bloomberg’s Andrew Cinko writes, “there’s no follow through on either the upside or the downside after yesterday’s epic rebound. At this moment, he who hesitates isn’t lost, in fact, he’s got a lot of company as stock market pundits engage in verbal duel over where we go from here.”

Source: ZeroHedge

Existing Home Sales Drop For 7th Straight Month As Homebuilders Stocks Collapse

With US home builder stocks having their worst year since 2007, hope is high that September will show the long-awaited rebound in home sales (despite a soaring mortgage rate).

After ‘stabilizing’ unchanged in August, existing home sales were expected to drop 0.9% MoM in September, but instead August’s data was revised notably lower and September plunged… down 3.4% MoM – the biggest drop since Feb 2016.

https://www.zerohedge.com/sites/default/files/inline-images/2018-10-19_7-03-44.jpg?itok=pUjsHZjw

With SAAR at its lowest since Nov 2015…

https://www.zerohedge.com/sites/default/files/inline-images/2018-10-19_7-05-08.jpg?itok=BO6wHo3b

This is the seventh month in a row of annual declines in existing home sales…

https://www.zerohedge.com/sites/default/files/inline-images/2018-10-19_7-00-59.jpg?itok=A_tsfp_0

Sales fell across all price ranges (not just the low-end as we have seen recently).

Median home price rose 4.2% from last year to $258,100

And you can’t blame supply as it rose notably – 4.4 months supply in Sept. vs. 4.3 in Aug.

As NAR notes:

“This is the lowest existing home sales level since November 2015,” he said.

A decade’s high mortgage rates are preventing consumers from making quick decisions on home purchases. All the while, affordable home listings remain low, continuing to spur underperforming sales activity across the country.”

“There is a clear shift in the market with another month of rising inventory on a year over year basis, though seasonal factors are leading to a third straight month of declining inventory,” said Yun.

“Homes will take a bit longer to sell compared to the super-heated fast pace seen earlier this year.”

Home builder stocks are collapsing…

https://www.zerohedge.com/sites/default/files/inline-images/2018-10-19_6-45-35.jpg?itok=cfiJpBtt

This is the worst year for home builder stocks since 2007…

https://www.zerohedge.com/sites/default/files/inline-images/2018-10-19_6-50-06.jpg?itok=J0Hgbodc

Probably nothing. Just keep hiking rates.

Source: ZeroHedge