The latest oil price spike may turn out to be a head-fake, because the economy is already slowing. While the oil cartel can try to fix the supply of oil, it can’t really control the demand side, which is dominated by the economic cycle.
This is clear to us at ECRI because of our enduring focus on cyclical relationships and, in this case, sensitive industrial material prices, including oil. We’ve long maintained a daily price index of these commodities that moves in concert with cycles in industrial growth. About half of the price inputs we monitor are traded on various commodity exchanges, while the rest are priced from commodity producers.
For the past few quarters a very unusual gap has opened up between the two groups, with the prices of non-exchange-traded industrial commodities, which most observers don’t watch, falling, and in some cases plunging. This behavior is in sharp contrast to the bullish sentiment shown, until more recently, by the strength in the prices of commonly-watched exchange-traded commodities.
As the chart shows, because of their links to industrial growth, exchange-traded and non-exchange-traded commodity price inflation rates have historically moved very much in sync.
But the right-side of the chart shows exchange-traded commodity price inflation spiking up through early this year, driven by widely-watched industrial inputs like oil and copper, while non-exchange traded commodity inflation went straight down into negative territory, as the prices of raw materials like rubber and hides dropped precipitously. This is very unusual.
This undeniable weakness in the non-exchange traded commodity prices is in line with our March Bloomberg View Op-ed,The Global Economy’s Wile E. Coyote Moment, about the end of the 2016-17 synchronized global growth upturn. The current downturn in global industrial growth has caught many people off guard because they focus on exchange-traded commodities only. Doing so made it easier to think that demand wasn’t slowing because surging oil and primary metals prices had camouflaged what was really happening.
ECRI’s insight was that the rise in exchange-traded prices was not about demand, which we knew was slowing. Rather, it was about the confluence of a variety of supply shocks, which weren’t cyclical, and thus unsustainable.
Of course, Saudi Arabia and Russia had deliberately kept oil production in check to support oil prices. But also, aluminum and nickel prices had shot up on fears of U.S. sanctions on Russia. Copper prices had surged due to labor problems at major mines, and rule changes regarding Indonesian tin export permits had also caused supply shortages. Meanwhile, zinc prices were pushed up by the shutdown of major Australian, Irish and Canadian mines and China’s environmental clampdown, which had lifted lead prices. What’s more, those pollution controls also hurt the production of synthetic fabrics, which therefore couldn’t make up for the shortfall in Indian cotton exports caused by pink bollworms eating into the cotton supply. It really was this perfect storm of supply constraints – not the strength of global demand – that drove the earlier run-up in these exchange-traded commodity prices.
Stepping back, the real tip-off came from the earlier downturns in ECRI’s leading indexes of global industrial growth, which were then followed by the yawning gap between exchange-traded and non-exchange-traded commodity price inflation that opened up months ago. It’s only in recent weeks that exchange-traded commodity price inflation has turned down. It’s no coincidence that the Eurozone manufacturing PMI just dropped to a 1½-year low and its U.S. counterpart fell to a seven-month low.
Today, growth in the non-exchange-traded commodity prices remains negative, and growth in the exchange-traded commodity prices is closing the gap by dropping to an 11-month low. With the global industrial slowdown manifesting in all these very short-leading indicators, the market may soon start asking if global demand is all it’s cracked up to be.
Good news within a strenuously spunReuters article. Don’t get lost looking at the granules; apparently all of the prior Canadian strategy against President Trump has failed.
For well over a year Justin from Canada and Foreign Minister Chrystia Freeland were confident they could leverage theU.S. Chamber of Commerce, purchased DC politiciansand ideological allies against President Trump in NAFTA negotiations. The result?Fail, failandmore fail.
Running out of options, Canada now attempts to save their NAFTA construct by turning to the executives within the auto industry:
OTTAWA (Reuters)– Canada’s trade minister last week met senior officials from General Motors Co and Fiat Chrysler Automobiles NV in Detroit, as Ottawa takes its lobbying effort directly to the Big Three car makers to avert potential U.S. auto tariffs.
The Liberal government is relying on industry partners to press Canada’s cause in the White House and elsewhere, using their influence to protect Canadian interests, sources with direct knowledge of the discussions told Reuters.
The auto industry, Canada’s biggest exporter, represents about 500,000 direct and indirect jobs and contributes C$80 billion ($60.1 billion) a year to the economy.
“Instead of us galloping all over the United States talking to everybody, it’s really focused right now on the automobile manufacturers, the automobile suppliers,” said one source, who requested anonymity given the sensitivity of the situation.
The Canadian message was “now is the time to speak up, now is the time to exercise whatever influence you might be able to bring to bear,” added the source. (read more)
Or put another way…. “Halp”!
Each sequential step in the Trump trade strategy is designed to head-off any counter position by positioning individual best-interests ahead of any defensive group formation.
The Canadian and Mexican economy (due to NAFTA) cannot survive without importing cheap durable goods from China to use in their assembly-based economies, and then trans-ship into the U.S market. However, the U.S. economy can survive, it can actually expand BIGLY and thrive, without accepting trans-shipped assembled goods from Mexico and Canada.
Put simply, without NAFTA, the assembly processes just moves INTO the U.S because the market *is* the United States. We are the $20 trillion customer. We hold the leverage.
NOTE: “Donnelly said in his opening remarks that there was already a rise in product being diverted to Canada in recent years and signs of even more since the U.S. tariffs began this year.”..
This is evidence of multinationals exploiting the NAFTA loophole to avoid U.S. tariffs. This fatal flaw is at the very heart of the issue within the U.S. trade policy inside NAFTA. As long as Mexico and Canada remain gateways for foreign good assembly and shipment into the U.S. there will never be a way for the U.S. to demand fair and reciprocal trade.
Canada knows their decades-long designed economic position as shipment/assembly trade-brokers is the central issue at the heart of the confrontation with USTR Lighthizer, Commerce Secretary Ross and President Trump. As multinational corporations seek to avoid Trump tariffs they only exacerbate the issue.
If Canada and Mexico don’t try to stop their duplicitous NAFTA benefit scheme, they will end up with even bigger trade surpluses and become even bigger targets for President Trump. In essence, the reason for Canada and Mexico being subject to even more encompassing Trump tariffs’ grows.
If Canada and Mexico do nothing to stop this influx; Trump will levy more than just steel and aluminum tariffs;he’ll likely tax their auto-sector.
As a consequence Canada moves do back down the Red Dragon:
The Canadian government is preparing new measures to prevent a potential flood of steel imports from global producers seeking to avoid U.S. tariffs, according to people familiar with the plans. The Canadian dollar weakened and shares inStelco Holdings Inc.soared.
The measures are said to be a combination of quotas and tariffs aimed at certain countries including China, said the people, asking not to be identified because the matter isn’t public. The moves follow similar “safeguard” measuresbeing consideredby the European Union aimed at warding off steel that might otherwise have been sent to the U.S. It comes alongside Canadian counter-tariffs on U.S. steel, aluminum and other products set to kick in on July 1. (read more)
The bottom line is U.S. market access is what all production countries need for their goods and the sustainability of their economies.
***
The depths of depravity to which both the Clinton and Obama Administrations dove to in their perversely industrious efforts to self-enrich while simultaneously demeaning, undermining, and selling-out all of America to foreign interests is incredibly stunning. And, they even had the entire DOJ rigged to get away with it all scot-free. It is practically surreal.
The Digital Currency Research Lab at the People’s Bank of China has filed more than 40 patent applications so far – all as part of an aim to create a digital currency combining the core features of cryptocurrency and the existing monetary system.
A national digital fiat currency, say what?
Data from China’s State Intellectual Property Office (SIPO) revealed two new patent applications on Friday, pushing the total number submitted by the lab to 41 over the 12 months since itslaunch.
Each of the 41 patent applications focuses on a certain aspect of a digital currency system, and, when combined, would create a technology that issues a digital currency, as well as provides a wallet that stores and transacts the asset in an “end-to-end” fashion.
For instance, the most recently revealed patent application explains how the envisioned digital wallet would allow users to check any transactions made through the service, while earlier documents offered details on how the wallet can facilitate transactions.
The ultimate goal, according to PBoC’s patents, is to “break the silo between blockchain-based cryptocurrency and the existing monetary system” so that the digital currency can sport cryptocurrency-like features, while being widely used in the existing financial structure.
Last week’s patents further explain that the envisioned wallet would not be limited, like a typical cryptocurrency wallet, to merely storing the private key to a certain asset. Nor would it be like another mobile payment service that only reflects a number on an application’s front-end interface without users actually holding the assets in a peer-to-peer manner.
Instead, the patents indicates the wallet would store a digital currency issued by the central bank or any authorized central entity that is encrypted like a cryptocurrency with private keys, offers multi-signature security and is held by users in a decentralized way.
The research lab said in one of the documents that it believes it is building a mechanism that makes a crypto-featured digital currency more applicable in the financial world.
The hybrid approach is also in line with opinions shared by the PBoC’s vice governorFan YifeiandYao Qian, the head of the research lab, who have both argued for a balance between the two polars of centralization and decentralization.
Overall, the patent applications filed so far signal the continuous efforts made by China’s central bank to develop its own central bank digital currency, as well as to potentially widen the application’s role among other central institutions.
The lab notably commented in a patent application released in November 2017:
“The virtual currencies issued by private entities are fundamental flaws given their volatility, low public trust, and limited useable scope. … Therefore, it’s inevitable for the central bank to launch its own digital currency to upscale the existing circulation of the fiat currency.”
Read one of the most recent patent applications below:
Plaintiffs charged that BofA lent the scheme an air of legitimacy and provided critical support
Bank of America Corp.was accused in a lawsuit of providing more than 100 accounts used to perpetrate what the U.S. regulators called a $102 million Ponzi scheme.
The class-action suit filed on behalf of people who lost money follows a complaint last week by the Securities and Exchange Commission alleging that five men and three companies defrauded more than 600 investors.
One of the alleged ringleaders once commissioned a song about himself for a party in Las Vegas with lyrics celebrating his $10,000 suits and his partner’s affinity for champagne, according to Monday’s complaint in federal court in Ocala, Florida.
The brother and sister who sued to recover losses from their late father’s investment claim the fraudsters “could not have perpetuated their scheme without the knowing assistance of their primary banking institution, Bank of America, which lent the scheme an air of legitimacy and provided critical support, including at times when the scheme would have otherwise collapsed,” according to the complaint.
Bank of America spokesman Bill Halldin had no immediate comment on the suit.
The lender is accused of failing to spot suspicious activity, including deposits of hundreds of thousands of dollars into accounts with relatively small, negative or nonexistent balances, followed by transfers within the same week to other accounts or investors seeking to cash out.
The architects of the scheme promised they would put investor funds into profitable and perhaps dividend-paying companies, according to the SEC. But they spent $20 million from the investment pool to enrich themselves, made $38.5 million in “Ponzi-like payments” and transferred much of the rest away from the companies that were supposed to receive the money, the regulator said.
(Bloomberg) — The billionaire George Soros has found a new way to make money from personal-injury lawsuits.
Soros Fund Management is pushing into a branch of litigation finance that few hedge funds have entered. His family office is bankrolling a company that’s creating investment portfolios out of lawsuits, according to a May regulatory filing.
The development is the latest twist on the litigation funding market, which has drawn criticism for monetizing and encouraging the lawsuit culture in the U.S. The firm Soros is backing,Mighty Group, bundles cash advances that small shops extend to plaintiffs in personal injury suits in return for a cut of future settlements. Mighty Group’s approach opens the door to another potential development: securitizing individual lawsuit bets for sale to other investors.
“There are all the ingredients there to securitize these things,” said Adrian Chopin, a managing director at legal finance firm Bench Walk Advisors. “A diversified, granular pool with predictable outcomes. The problem is, you can’t yet get these things rated” by credit agencies.
20% Returns
Wall Street has been betting for a while on commercial litigation, which provides financing of big corporate suits with millions or even billions of dollars at stake. Soros is focused on the consumer side, where plaintiffs receive advances of $2,000 on average for legal claims typically tied to auto and construction accidents. The advances are used to cover personal expenses, such as medical bills and rent.
Soros along with Apollo Capital Management are among the first money managers to jump into this niche of the lawsuit-funding market. It offers steady and predictable returns, which historically have averaged about 20 percent a year at relatively low risk, said Chopin of Bench Walk.
“Everybody is looking for yield, and people are also looking for assets that are not correlated with the major equity and debt markets,” said Christopher Gillock, a managing director at Colonnade Advisors, an investment bank that specializes in financial services. “Litigation funding falls into that category.”
Joshua Schwadron, a co-founder of Mighty, declined to comment on the firm’s investors. Michael Vachon, a spokesman for Soros Fund Management, the billionaire’s New York-based family office, declined to comment.
Political Risk
The investments come with risk from both sides of the political spectrum. The U.S. Chamber of Commerce and the insurance industry criticize litigation financing for clogging the courts with frivolous lawsuits and driving up the costs of settlements. Regulators, on the other hand, have taken the side of consumers, moving to rein in the advances, casting them as loans subject to usury laws.
Industry proponents say the funding helps people win appropriate payouts instead of settling for pennies on the dollar under the pressure of medical bills or missed income from work. In addition, plaintiffs don’t have to pay back the advances if they lose their cases.
“These funding companies are allowing the folks who are injured through some accident to be able to stick around long enough to get paid,” said Joel Magerman, chief executive officer of Bryant Park Capital, an investment bank.
The funding companies don’t always get fully paid since other claims on settlements, such as attorney fees, have priority. This risk of underpayment makes advances difficult to bundle into securities, said Eric Schuller, president of the Alliance for Responsible Consumer Legal Funding, an industry trade group. In contrast to advances, most securitizations are backed by tangible items like a home or car.
“If the case goes south, there is nothing there to go after,” Schuller said. “It’s just a piece of paper.”
Apollo’s Investment
Mighty, originally a software provider, announced in March it had raised more than $100 million from major institutional investors to help litigation finance firms access capital. The May filing shows that a Soros affiliate agreed to provide Mighty with financing, which can also be used to back lawyers’ contingency fees and medical bills slated to be paid when cases settle.
Soros’s move into consumer legal funding is somewhat akin to another investment his family office made last year. It participated in a joint deal to buy as much as $5 billion of loans from Prosper Marketplace, a pioneer in peer-to-peer lending.
Although this form of litigation financing dates back to the mid-1990s, hedge funds had mostly steered clear because the advances and firms that issued them are so small. Only the largest players have been able to obtain financing from big investment firms. For example Leon Black’s Apollo Capital, through its MidCap Financial affiliate, backs Golden Pear Funding of New York, one of the biggest providers of advances.
Magerman anticipates that more investors will jump in the market. “It’s a small niche asset class,” he said. “There is a lot of additional money that can come in.”
***
Here’s your need to know about George Soros…
Host
You’re a Hungarian Jew who escaped the holocaust by posing as a Christian.
Soros
Right.
Host
And you watched lots of people get shipped off to the death camps?
Soros
Right, I was 14 years old and I would say that’s when my character was made.
Host
In what way?
Soros
That one should understand and anticipate events… It was a tremendous threat of evil. It was a very personal experience of evil.
Host
My understanding is that you went out with this “protector” of yours who swore that you were his adopted godson.
Soros
Yes.
Host
… went out, in fact, and helped in the confiscation of property of the Jews.
Soros
That’s right. Yes.
Host
That sounds like an experience that would send lots of people to the psychiatric couch for many, many years. Was it difficult??
Soros
Uh. Not at all, not at all. Maybe as a child you don’t see the connection but it created no problem at all.
Host
No feeling of guilt?
Soros
No.
Host
For example, “I’m Jewish and here I am watching these people go. I could just as easily be there. I should be there.” None of that?
Soros
Well. Of course I could be on the other side. I could be the one from whom the thing is being taken away, uh, but there was no sense I shouldn’t be there because there was – Well, actually, (in a) funny way it’s just like in markets that if I weren’t there (of course I wasn’t doing it) somebody else would be taking it away anyhow. Whether I was there or not (I was only a spectator) the property was being taken away. So – I had no role in taking away that property so I had no sense of guilt.
President Trumpdoubled-down on his planfor “immediate” deportation of illegal immigrants this morning, explaining in a tweet that “hiring many thousands of judges, and going through a long and complicated legal process, is not the way to go,” adding that this deterrence approach “is the way to go to stop illegal immigration in its tracks.”
Hiring manythousands of judges, and going through a long and complicated legal process, is not the way to go – will always be disfunctional. People must simply be stopped at the Border and told they cannot come into the U.S. illegally. Children brought back to their country……
….If this is done, illegal immigration will be stopped in it’s tracks – and at very little, by comparison, cost. This is the only real answer – and we must continue to BUILD THE WALL!
But,as NBC News reports,that hasn’t stopped civil rights attorneys from flocking to the Texas border to ‘protect’ the rights of illegal immigrant parents not to be separated from their children – the exact same policy that is utilized on American parents when they commit a crime with children in tow.
Attorneys have become a lifeline for migrants in detention, responding as would clergy to a disaster or tragedy, as the legal labyrinth of immigration has become more complicated.
Although many are accustomed to the immigration system’s complexities, attorneys are finding the situation created by the Trump “zero-tolerance” prosecutions full of never-before-seen hurdles and restrictions that hamper their access to children and parents and are making their work to ensure those with valid asylum and other claims get to stay more difficult.
Ali Rahnama, an immigration attorney from Washington, D.C. who works on public policy and high impact litigation, said he woke up last Monday and felt he needed to be on the border. He found a private donor to pay for him and a few colleagues to fly to the border.
Another attorney, Sirine Sheboya, is choking back emotion over the lengths mothers and fathers are going to be reunited with their children.
“We have people in there who are considering not continuing on with really strong asylum claims,” she said stopping to catch her breath as the emotion breaks through, “because they think that maybe they will get reunified with their kids faster if they give up their claim. That’s just wrong.“
“We have men and women saying, ‘My 5- and 6-year-old was holding my leg and was taken away,'” said Rahnama, who visited parents and guardians being held in the Port Isabel Detention Center. “They go to court and are told their child will be there when they come back and they come back and there is no child,” he said.
Of course, it’s not just attorneys, Democratic politicians are descending for their moment of social justice and never-Trump warrior glory.
Sen. Elizabeth Warren, D-Mass., spent 2½ hours in the Port Isabel Detention Center on Sunday night. After the visit, she told reporters stationed outside the center that officials of Immigration and Customs Enforcement told her that the center isn’t where parents and children will come together as federal officials have said.
“The [immigration] officials made clear this is not a reunification center. There will be no children brought here. There will be no families brought together in this place,” Warren said. “All that’s happening here is the detention of mothers and fathers who lost their children.”
Warren said she spoke to nine mothers and none the whereabouts of their children or had spoken to them.
“They are crying they are weeping,” she said. “They have said they will do anything … just, please, let them have their babies back.”
One quick question to Ms.Warren – what would you do with the children of an American parent, who took his children along with him as he committed a crime? Do they deserve better or worse treatment under the law than an illegal immigrant – who crosses the border not at a port of entry and then proclaims they are seeking asylum?
NBC News reportsthat DHS said late Saturday that some of the more than 2,000 children – about 522 – have been reunited with parents. Officials said Port Isabel would be its reunification center.
Sometimes it’s not just children who attorneys have to locate, but some of the parents as well. Efrén Olivares of the Texas Civil Rights Project can no longer find three clients who were part of a group of five parents who complained in a petition filed with the Inter-American Human Rights Commission, part of the Organization of American States, about the child separations.
“They were either released to the U.S. with notice to appear (at a court at a later date) or were deported. We are looking diligently to contact them. We gave them a number and asked them to contact us if they were released,” Olivares said.
“We have not heard from them.”
Surprise!
Here is immigration expert Steve Cortes corrected host Fredricka Whitfield on the reality of family separation at the U.S. southern border during CNN’s Newsroom Sunday (via The Daily Caller)…
The U.S. Border Patrol does not separate immigrant families who claim asylum if they appear at a legal point of entry to the U.S., Cortes, the former head of President Donald Trump’s Hispanic Advisory Council, said.
Until recently, only the families that tried to come into the country outside a point of entry – making them illegal immigrants – were separated.
Trump issued an executive order Wednesday that directed the Border Patrol to detain illegal immigrant families together and to begin reuniting children with their detained parents.
Whitfield asked Cortes how he thought Trump’s plan to reunite “immigrant families” would work out.
“Look, it will be a difficult process, but here’s the thing. The best way for — when you say immigrant families, by the way, it’s important to say illegal immigrant families,” Cortes responded, pointing out the omission. “That’s a very, very important adjective to add in there. Immigrant families have never been separated.”
“Illegal immigrant families have been separated, and I would say separated for a very good reason,” Cotez continued. “Why? Because their parents, unfortunately, or guardians … decided to commit a crime with children in tow. Much like an American committing a crime with children in tow, you get separated from you children. And that’s a terrible consequence for the kids.”
Whitfield defended her characterization of immigrants crossing the border illegally, pointing out that many were crossing the border seeking asylum.
“If you show up to a port of entry in the United States with your children and request asylum lawfully, you are not separated from your family,” Cortes shot back, referring to the difference between applying for affirmative and defensive asylum.
Affirmative asylum applies to immigrants entering the U.S. at a port of entry, or immigrants who apply within a year of entering the U.S., whether or not their entry was legal. Immigrants entering the country illegally can apply for defensive asylum while they are being processed for deportation.
“It’s not [legal]. You have to come to a check point, raise your hand and say, ‘I’m here for asylum,’” Cortes said.
“You can’t sneak across the border and then say, once you’re caught, ‘Oh, I meant to apply for asylum. That’s just not correct.”
Finally, we note another of President Trump’s tweets this morning that sums the state of America and its media up very well…
Such a difference in the media coverage of the same immigration policies between the Obama Administration and ours. Actually, we have done a far better job in that our facilities are cleaner and better run than were the facilities under Obama. Fake News is working overtime!
And while we are well aware that comprehending the facts behind this sudden maelstrom of migrant misery headlines, here is the reality of how this all started courtesy of‘The Last Refuge’ excellent twitter thread…
1.Once you see the strings on the marionettes you can never watch the pantomime the same way you did before you noticed them.
2. DATELINE – May 2011 – President Obama travels to the Rio Grande sector of the border to push for his immigration platform (ie. Amnesty). He proclaims the border is safe and secure and famously attacks his opposition for wanting an “alligator moat”.
3. November 2012 – Election year campaign(s). Using wedge issues like “War on Women”, and “Immigration / Amnesty”, candidate Obama promises to push congress for “amnesty”, under the guise of “Comprehensive Immigration Reform”, if elected.
President Obama wins reelection.
4. December 2012 – Immediately following reelection President Barack Obama signs an Executive Ordercreating the “Deferred Action Program“, or DACA. Allowing millions of illegal aliens to avoid deportation.
5. According to White House own internal documents and research, this Deferred Action Program is what the Central American communities immediately began using as the reason for attempted immigration.
7. May 2013 – President Barack Obama visits South America. Following a speech for Mexican entrepreneurs, Obama then traveled to Costa Rica, his first visit as president.
9. The regional network includes the leaders of Belize, El Salvador, Guatemala, Honduras, Nicaragua and Panama. President Obama meets with the leaders of the Central American Countries.
10. Summer 2013 – Numbers of Illegal Unaccompanied Minors reaching the Southern U.S. border from El Salvador, Guatemala, Honduras, Nicaragua doubles. 20,000+ reach U.S. Southern border by travelling through Mexico. Media primarily ignores.fpc.state.gov/documents/orga…
11. October 2013 – At the conclusion of the immigrant travel season. White House receives notification that tens of thousands of illegal Unaccompanied Minors should be anticipated to hit the Southern U.S. border the following Summer [2014].
12. An estimated 850% increase in the number of Unaccompanied Alien Children (UAC’s) were reported to the White House.fpc.state.gov/documents/orga…
[In 2012 less than 10,000 were projected]
13. January 2014 – In response to the projections, the Department of Homeland Security (DHS) posts a jobs notification seeking bids to facilitate 65,000 Unaccompanied Alien Children.fbo.gov/index?s=opport…
14. IMPORTANT. This job posting was January 2014.The Obama administration was *planning for* 65,000 childhood arrivals. In January 2014 they were taking contractor bids for services to be used later in year. Almost no-one noticed.
15. On January 29, 2014, the federal gov. posted an ad seeking bids for a vendor contract to handle “Unaccompanied Alien Children“. Not just any contract mind you, a very specific contract – for a very specific number of unaccompanied minors: “65,000.”fbo.gov/index?s=opport…
17. Spring 2014 – With a full year of DACA, successful transport and border crossing without deportation – DHS begins to notice a significant uptick in number of criminal elements from El Salvador, Guatemala, Honduras and Nicaragua; which have joined with UAC’s to gain entry.
19. June 2014 – Tens-of-thousands of UAC’s from El Salvador, Guatemala, Honduras and Nicaragua hit the border and the headlines. Despite the known planning, and prior internal notifications, the White House claims it did not see this coming.
21. June 20th 2014 – Congressional leadership and key Latino Democrats from the Democrat Hispanic Caucus meet with representatives from El Salvador, Guatemala, Honduras and Mexico.kfgo.com/news/articles/…
23. July 3rd, 2014 – President Obama requests $3,700,000,000 ($3.7 billion) in supplemental budget appropriations to deal with the border crisis. Only $109 million is for actual border security or efforts to stop the outflow from El Salvador, Guatemala, Honduras, and Nicaragua.
24. Hidden inside the massive budget request is Obama seeking legal authorization to spend taxpayer funds for lawyers and legal proceedings on behalf of UAC’s and their families. Congress is being asked to approve/fund executive branch’s violation of immigration law (DACA).
26. July 10th, 2014 – Facing pushback from congress as well as sticker shock at the amount he is requesting, President Obama sends his DHS team to Capitol Hill to ramp up anxiety, and threats of consequences:politico.com/story/2014/07/…
27. “We are preparing for a scenario in which the number of unaccompanied children apprehended at the border could reach up to 90,000 by the end of fiscal 2014,” Johnson’s testimony reads:politico.com/story/2014/07/…
28. Not only did the White House know what was going to happen (as far back as 2012), but White House actually constructed events to fall into a very specific pattern and intentionally did NOTHING to stop the consequences from the DACA executive order issued in December 2012.
29. This is the origin of the crisis.It all started with DACA. Having tracked this issue so closely through the years it often feels futile to discuss. It is an ongoing insufferable political game/scheme within the issue of illegal immigrants and “children”.
30. Massive illegal immigration is supported by both sides of the professional political machine. There are few issues more unifying for the K-Street purchased voices of DC politicians than keeping the borders open and the influx of illegal aliens as high as possible.
31. The U.S. Chamber of Commerce pays politicians to keep this system in place. All Democrats and most Republicans support mass immigration. Almost no DC politicians want to take action on any policy or legislation that stops the influx.
32. There are billions at stake. None of the GOP leadership want to actually stop illegal immigration; it’s a lucrative business. Almost all of the CONservative groups and politicians lie about it.
33. The religious right is also part of the problem. In the past 15 years illegal immigration and refugee settlement has been financially beneficial for them.
34. There is no greater disconnect from ordinary Americans on any singular issue than the policy positions of Democrats and Republicans in Washington DC surrounding immigration.
President Donald Trump is confronting their unified interests.
35. All political opposition to the Trump administration on this issue is structured, planned & coordinated. The issue is a valuable tool for the professional political class to sow chaos amid politicians. The resulting crisis is useful for them; therefore they fuel the crisis.
36. Washington DC and the activist media, are infested with illegal immigration supporters; the issue is at the heart of the UniParty. Follow the money. It’s the Acorn business model:
37. Southwest Key has been given $310,000,000, in taxpayer funds so far in 2018. And that’s just one company, in one part of a year. Prior CTH research showed this specific “Private Company” nets 98.76% of earnings from government grants.taggs.hhs.gov/Detail/RecipDe…
38. Lutheran Immigration and Refugee Service, which provides foster care and other child welfare services to migrant children. “Faith Based Immigration Services” is a code-speak for legalized human smuggling.taggs.hhs.gov/Detail/RecipDe…
39. The “faith-based” crew don’t want it to stop, because facilitating illegal alien import is now the financial bread and butter amid groups in their base of support.taggs.hhs.gov/Detail/RecipDe…
40. The man/woman in the pew might not know; but the corporation minister, preacher or priest (inside the process) surely does. BIG BUSINESS !!taggs.hhs.gov/Detail/RecipDe…
41. These immigration groups, get *MASSIVE* HHS grants and then pay-off the DC politicians and human smugglers. Billions of dollars are spent, and the business end of immigration has exploded in the past six years.
42. It’s a vicious cycle. Trafficked children are more valuable than adults because the organizations involved get more funding for a child than an adult. Each illegal alien child is worth about $56,000 in grant money. The system is full of fraud.
43. Approximately 65% of the money HHS provides is spent on executive pay and benefits, opaque administrative payrolls, bribes, kick-backs to DC politicians and payoffs to the South American smugglers who bring them more immigrants.
45. All of those advocates gnashing their teeth and crying on television have no idea just who is controlling this process; and immigration idiots like Ted Cruz are only adding more fuel, more money, to the bottom line:
"This has to stop," Texas Sen. Ted Cruz said when asked about the separation of migrant families at the border in his state.
He'll also be introducing legislation "that will mandate that kids must stay with their parents." pic.twitter.com/2j0Z515d88
46. By threatening to secure the border, President Trump is threatening a Washington DC-based business model that makes money for a lot of connected interests.
47. Beyond enrichment schemes, the entire process of immigration, and Washington-DC legalized human smuggling, has side benefits for all the participants; child sexploitation, child labor, and yes, much worse (you can imagine).
48. So the next time you see this type of terribly misplaced “crying girl” corporate propaganda:
49. Maybe, just maybe, we can remember the *real* consequences of actual legalized human smuggling that has been created -within the business- by U.S. political policy. This “crying girl”:
In April, an op-ed in The Wall Street Journal titled “So Long, California. Sayonara, New York,” published by conservative economists Arthur Laffer and Stephen Moore, warned about a provision within the brand- new tax bill that could trigger a mass migration of roughly 800,000 people — fleeing California and New York for low-tax states over the next several years.
Now that the SALT subsidy is passed, how bad will it get for high-tax blue states, and more specifically New York?
New evidence suggests that New York City could be the first visible region where the mass migration could begin. Take, for example, the number of homes listed for sale in Manhattan, Brooklyn, and Queens had a parabolic spike in May, with inventory across 60 percent of the boroughs reaching all-time highs, according to the latestStreetEasy Market Report. While residential inventory traditionally peaks at the end of May, this year — the supply set new record highs and could continue through summer.
Laffer and Moore’s prophecy (above) of the great migration from New York – triggered by Trump’s new tax bill could be the most logical explanation of why NYC homeowners are rushing all at once to sell their homes.
Housing inventory in Manhattan rose 16.7 percent compared to last year, the largest y/y increase on StreetEasy record. Brooklyn and Queens saw similar spikes, with inventory up 23.4 percent and 42.8 percent, respectively.
With housing inventory piling up across much of the boroughs, the total number of sales declined for the third consecutive month. StreetEasy said sales plummeted in every submarket across Brooklyn, Manhattan, and Queens; with more significant declines visible in the Upper East Side, Midtown and the Rockaways. Despite the flood of new inventory threatening to stall the market, the StreetEasy Price Index advanced in all three boroughs since last year.
“Sellers are betting on a wave of demand from the peak shopping season, but this summer’s market has turned out to be a crowded one,” says StreetEasy Senior Economist Grant Long.
“However, prices are high and continue to rise. More affordable homes are the hardest to find, and are sure to sell quickly. But higher-end homes, particularly those joining the market from the ongoing stream of new development, will be pressured to lower prices or linger on the market.
This summer is poised to offer an excellent negotiating opportunity for buyers with big budgets.”
As Bloomberg notes, the abnormal amount of supply hitting the NYC residential markets is not sufficiently being met with demand, which could eventually be problematic for prices and serve as a potential turning point. Recently, the mainstream media cleverly changed their narrative and called the ‘housing shortage,’ a ‘housing affordability crisis,’ as it sure seems that the housing bubble, or whatever you want to call it, is in the later innings.
May 2018 Key Findings — Manhattan
Sale prices rose in all submarkets but one. The StreetEasy Manhattan Price Index increased 0.6 percent to $1,157,995. Prices rose in four of the five submarkets, led by an increase in the Upper East Side, where the median home price rose 1.9 percent to $1,038,046. Prices in Downtown Manhattan remained flat at $1,691,204.
Inventory rose at a record pace. Sales inventory in Manhattan rose 16.7 percent year-over-year. The Upper East Side experienced the largest increase, with inventory up 20.2 percent since last year.
One out of every six homes received a discount. Sixteen percent of homes for sale were discounted, an increase of 3.6 percentage points year-over-year.
For-sale homes spent less time on the market. Units in the borough spent a median of 55 days on the market, a three-day dip from last year. The Upper East Side and Upper West Side were the only submarkets where homes lingered longer — up 10 days and 17 days, respectively.
Rents rose in every Manhattan submarket. The StreetEasy Manhattan Rent Index [iv] rose 1.4 percent to $3,183. Rents in Upper Manhattan rose the most — up 2.5 percent to $2,307.
Fewer rentals offered a discount. Sixteen percent of rentals in Manhattan were discounted in May, a decrease of 1.6 percentage points from last year.
May 2018 Key Findings — Brooklyn
Prices reached new highs in North Brooklyn. The StreetEasy North Brooklyn Price Index increased 11.1 percent to $1,229,838, a record high for the submarket despite the looming L train shutdown. Borough-wide, prices rose by just 1.1. percent since last year, to $720,555.
The number of homes with a price cut reached an all-time high. The share of sales with a price cut reached an all-time high of 12.4 percent, a rise of 3.3 percentage points from May 2017.
Sales inventory continued to climb, except in North Brooklyn. Sales inventory in the borough reached a record high — up 23.4 percent over last year. Inventory rose the most in South Brooklyn, which saw a 44.7 percent increase over last year. North Brooklyn was the only submarket where inventory dropped, by 6.7 percent since last year.
Brooklyn homes spent more time on the market. Homes stayed on the market for a median of 53 days in the borough, 6 more days than last year. North Brooklyn homes are coming off the market after an average of 43 days — 26 days faster than last year.
Rents rose in all submarkets except North Brooklyn. The StreetEasy Brooklyn Rent Index increased 1.4 percent year-over-year to $2,562. South Brooklyn experienced the largest spike: up 2.6 percent to a median rent of $1,885. North Brooklyn was the only submarket where rents stagnated, likely because of the L train shutdown starting in April 2019. Rents in the submarket remained flat at $3,062.
May 2018 Key Findings — Queens
Price cuts rose to an all-time high. The share of homes with a price cut reached a new high in Queens at 11.1 percent, an increase of 3.5 percentage points over last year.
Sales inventory swelled. Queens saw the largest year-over-year increase in inventory, rising 42.8 percent. All five submarkets in the borough saw a surge in inventory.
Queens homes are selling slightly faster than last year. The median number of days on market for Queens homes was 56, down 2 days from last year. Homes in Northeast Queens and Northwest Queens took longer to sell than last year, with an increase of 12 days and 6 days on the market, respectively.
Rents remained flat. The StreetEasy Queens Rent Index held at $2,113. But rents in South Queens rose 6.9 percent year-over-year, to a median of $1,775.
Queens was the only borough with an increase in the share of discounted rentals. Seventeen percent of Queens rentals offered discounts: up 2.9 percentage points over last year, and the highest share of the three boroughs analyzed.
Rick Hilton, who is the father of Paris Hilton and chairman of Hilton & Hyland, is all set to sell a 16th-centuryRoman mansion for cryptocurrencies. The auction for the property will be held on June 28, and it will make history as the first ever property to be auctioned onblockchain.
The 11-bedroom house is, reportedly, worth upwards of $35 million. The sale will go online on Propy.com, which is a global property store with decentralized title registry.
Realtors Love Cryptocurrencies and Blockchains
In 2017, at least 20 homes were sold forcryptocurrenciesglobally. This year, the bar could be set much higher.
Hilton said: “The auction shows real estate’s growing trust in blockchain and provides crypto investors an opportunity to diversify and solidify their portfolio with a trophy asset.”
The priciest home ever sold using cryptocurrencies was a seven-bedroom Miami estate. It was sold for455 Bitcoinsor approximately $6 million. The Roman mansion could easily break this record and set a record high.
A Listing Beyond Compare
The Palazzetto, which is a grand mansion designed and built by Michelangelo’s collaborator Giacomo Della Porta, is an Italian landmark. Della Porta was also involved in the building of St. Peter’s Dome, which is another famous landmark in Rome, Italy.
The mansion is composed of two independent but connected luxury units. The property boasts of multiple entrances, an in-house theater, a secret garden, a wellness spa, and a gym.
The rooftop offers 360-degree views of the city and bird’s eye view of the neighborhood along with the Altar of the Fatherland. It has 11 bedrooms, 15 and a half bathrooms, three kitchens and multiple living and dining rooms, complete with four parking spots.
Truffles, the darling of the food scene, are not the chocolate treats that bear the same name. Not dessert truffles, true truffles are a rare delight and not an opportunity to be missed. While they are typically considered expensive food, there are ways to get your truffle fix in the United States through avenues such as truffle oil.
There are white and black truffles, and they’re as different as night and day. There are some similarities – they’re both a subterranean fungus that grows in the shadow of oak trees. However, there are over seven different truffle species found all over the world, from the Pacific Northwest to China to North Africa and the Middle East.
Truffles can be found concentrated in certain areas around the world, with the Italian countryside and French countryside being rich places of growth. Black truffles grow with the oak and hazelnut trees in the Périgord region in France. Burgundy truffles can be found throughout Europe in general, like the black summer truffle.
White truffles are typically found in the Langhe and Montferrat areas of northern Italy around the Piedmont region. Additionally, the countrysides of Alba and Asti are popular truffle hunting areas. White truffles are also found in the hill regions of Tuscany in Italy near certain trees.
Not just localized to Europe, however, New Zealand Australia also see truffles growing. The first black truffle produced in theSouthern Hemispherewas in New Zealand in 1993. In Australia, Tasmania was the origin of the first truffle harvests and the largest truffle from Australia, weighing in at 2 pounds, 6 ounces) was harvestedbyMichael and Gwynneth Williams.
In the Pacific Northwest of the U.S., four species of truffles are commercially harvested: the Oregon black truffle, the Oregon spring white, Oregon winter white truffle, and the Oregon brown truffle.
In the South, the pecan truffle is often found alongside fallen pecans. While farmers once discarded them, the gourmet food scene is slowly starting to incorporate them into seasonal dishes.
Depending which country they hail from, they’re sniffed out by specially trained dogs or pigs, then dug up by the “hunter”. They’re located through the natural aroma they release when they interact with certain plants, mammals, and insects. These interactions also encourage new colonies of the truffle fungus to appear through spore dispersal.
White Truffle fresh from the hunt
Both white and black truffles share the same appearance, that of a lumpy potato, but it’s in taste and shelf-life they differ.
Each kind of truffle is firmly in the “umami” category of taste – very earthy and doesn’t need a lot of salt to trip your tastebuds.
The black truffle is far more common, even in haute cuisine. Available for six to nine months a year, it has a stronger taste and pungent aroma that often needs acquiring. I’ve experienced a black truffle-and-olive tapenade, a perfect use for it, because it evokes a black olive-type taste.
Because of the long season and easier odds of being found, black truffles are more affordable. They’re also freezable, making a less-risky purchase for a restaurant, further enabling them to keep prices down.
On the flip-side are white truffles, Earth’s gold. Typically valued at as much as $3,000 per pound, they inspire a big black market. Even legally, they can be outrageous in price.The Atlantic writes, “In 2010, Macau casino tycoon Stanley Ho spent $330,000 on two pieces that weighed 2.87 pounds.”
Internationally, white truffles are big industry. Autumn may yield a truffle experience for you even here. The USA is currently third world-wide for truffle harvest volumes. Stick to truffle towns where restaurants hunt their own, and you maybe be surprised at bargains you find. I was shocked to only spend $20 for my white truffle meal in Croatia.
White truffles cannot be frozen and have a short shelf-life, up to about 10 days. They’re best devoured as soon as possible. Their season is short too – only three to four months each year, September through to as late as January.
I’ve heard of their seasons ending as early as November, though. They’re more elusive to find, often in different forest clusters than their black counterparts. All this computes to costing big bucks.
Even if you dislike black truffles, try fresh white truffles if you ever can. They’re a completely different flavor profile. Instead of black olives, think Parmesan cheese meets mushrooms. It’s a delicate, aromatic flavor – still earthy, but far from overbearing.
Wine and food pairings must let the white truffle take center stage, lest they overpower it. Think polenta with lots of Parmesan and excessive shavings on top.
If you can’t have the real truffle experience, you can buy truffle products flooding the market. These include truffle-infused oils, jams, tapenades, and so forth. Some will use extracts, which are as authentic to the real thing as any extract is. Think orange or lemon or almond extracts. Are they true to the real experience? Not really, but they have their own appeal.
With a growing popularity on the world market, cunning agriculturalists and truffle hunters are trying to farm truffles with mixed results. So far it seems truffles are Earth’s alchemy – a rare treat to remain rare.
Speaking for myself, I was sure I’d hate the pungent fungus, but I felt obligated to try them. Black truffles were a taste I could grow to appreciate, but I’m not a big fan of black olives either. I had decadently expensive dark chocolate-and-black truffle ice cream, though, and that was tasty.
Still, I long for the day I cross paths with white truffles again. The simple dish of polenta and white truffles stands as one of the greatest meals of my life.
There’s a reason they’re sometimes literally worth more than their weight in gold.
The CFPB had two primary,albeit unspoken, functions. First, it was structured as a holding center for fines and assessments against any financial organizations opposed by progressives. Second, it was a distribution hub for the received funds to be transferred to political allies and groups supportive of progressive causes.
The CFPB defenders then appealed the decision to a select appellate court in Washington DC to continue the construct. The Warren crew won the appeal; but today, in an unrelated jurisdictional ruling a New York judge affirmed the minority opinion setting up a possible supreme court pathway to get a final decision.
NEW YORK (AP)– The U.S. government’s beleaguered consumer finance watchdog agency is unconstitutionally structured, a judge said Thursday as she disqualified the agency from serving as a plaintiff in a lawsuit.
Her ruling related to a lawsuit brought against companies loaning money to former National Football League players awaiting payouts from the settlement of a concussion-related lawsuit and to individuals slated to receive money for injuries sustained when they helped in the World Trade Center site cleanup after the Sept. 11, 2001, terrorist attacks.
She let claims brought by the New York State attorney general proceed, but dismissed those that were brought by the CPFB, saying it “lacks authority to bring this enforcement action because its composition violates the Constitution’s separation of powers.”
In ruling, Preska sided with three judges who dissented from the six-judge majority in a January ruling by the U.S. Court of Appeals in Washington. The majority found that the agency director’s power is not excessive and that the president should not have freer rein to fire that person. (read more)
CFPB Interim Director Mick Mulvaney hasalready saidthe CFPB needs to be disassembled.
Taking the agency down is perfectly ok with the Trump administration.
Chinese capital controls and a slump in foreign buyers? Check.
Trade war with the US? Check.
Things are not looking good for Canada’s national housing market, which as VCG reports, continued its sluggish performance in the month of May. Despite the warmer weather and usually busy spring selling season, buying activity has been awfully quiet. New mortgage regulations which are now in full swing have stymied fringe buyers, particularly millennials. According tonew data from credit bureau TransUnion, new mortgage originations among millennials in Canada fell by 19.5% between the last quarter of 2017 and the first three months of 2018.
That has also been showing up sales data.
As shown in the chart below, national home sales in Canada plunged by 16% Y/Y for the month of May. This was the worst decline since the great financial crisis in 2008 when home sales dipped 17% that May. Furthermore, total home sales of 50,604 marked the lowest total since May 2011.
Seasonally adjusted home sales edged 0.1% lower on a month over month basis, and 15% on a year over year basis. Or, as Steve Saretsky put it, “either way you slice it not a great month for one of the worlds most resilient housing markets.”
And as sales continue to slide inventory is beginning to build. For sale inventory crept up by 4% year over year, increasing for the first time in three years, and the highest May increase since 2010.
In light of the above, it is not surprising that the average sales price dipped 6% year over year in May, which however was not nearly as bad as April when year over year declines registered a head turning 11% decline.
But more troubling is that when looking at the smoothed out index of the MLS HPI prices showed the smallest possible increase of just 1% year over year in May, the lowest since September 2009. Not only did this mark the 13th consecutive month of decelerating year over year gains per theCanadian Real Estate Association, but at the current rate of slowdown, next month Canada will record the first annual drop in home prices since the global financial crisis.
The silver lining: condos continue to hold up well as buyers tumble down the housing ladder; here prices posted a 13% increase from May 2017.
CREA’s chief economist Gregory Klump shouldered much of the blame on tighter borrowing conditions, “This year’s new stress-test became even more restrictive in May, since the interest rate used to qualify mortgage applications rose early in the month. Movements in the stress test interest rate are beyond the control of policy makers. Further increases in the rate could weigh on home sales activity at a time when Canadian economic growth is facing headwinds from U.S. trade policy frictions.”
Klump’s theory stacks up well with recent data which suggests fringe borrowers are being pushed towards the private lending space, particularly in Ontario. Mortgage originations at private lenders in the Q1 2018rose to $2.09 billion in Ontario, a 2.95% increase from last year. The market share of private lending went from 5.71% of originations in Q1 2017, to 7.87% in Q1 2018, despite originations at other channels dropping.
In other words, there is a surge in unregulated, non-bank lending, just as the housing bubble pops, precisely what happened the last time there was a full-blown financial crisis.
When you plant your tree in another man’s orchard, you might end up paying for your own apples; it’s a risk you take…
….and President Trump knows how to use that leverage better than anyone could possibly fathom; because in this metaphor Beijing relies upon the U.S. for both the seeds and the harvest. President Trump drops the $200b M.O.A.T (Mother of All Tariffs):
White House – On Friday, I announced plans for tariffs on $50 billion worth of imports from China. These tariffs are being imposed to encourage China to change the unfair practices identified in the Section 301 action with respect to technology and innovation. They also serve as an initial step toward bringing balance to our trade relationship with China.
However and unfortunately, China has determined that it will raise tariffs on $50 billion worth of United States exports. China apparently has no intention of changing its unfair practices related to the acquisition of American intellectual property and technology. Rather than altering those practices, it is now threatening United States companies, workers, and farmers who have done nothing wrong.
This latest action by China clearly indicates its determination to keep the United States at a permanent and unfair disadvantage, which is reflected in our massive $376 billion trade imbalance in goods. This is unacceptable. Further action must be taken to encourage China to change its unfair practices, open its market to United States goods, and accept a more balanced trade relationship with the United States.
Therefore, today, I directed the United States Trade Representative to identify $200 billion worth of Chinese goods for additional tariffs at a rate of 10 percent. After the legal process is complete, these tariffs will go into effect if China refuses to change its practices, and also if it insists on going forward with the new tariffs that it has recently announced. If China increases its tariffs yet again, we will meet that action by pursuing additional tariffs on another $200 billion of goods. The trade relationship between the United States and China must be much more equitable.
I have an excellent relationship with President Xi, and we will continue working together on many issues. But the United States will no longer be taken advantage of on trade by China and other countries in the world.
We will continue using all available tools to create a better and fairer trading system for all Americans.
Historic Chinese geopolitical policy, vis-a-vis their totalitarian control over political sentiment (action) and diplomacy through silence, is evident in the strategic use of the space between carefully chosen words, not just the words themselves.
Each time China takes aggressive action (red dragon) China projects a panda face through silence and non-response to opinion of that action;…. and the action continues. The red dragon has a tendency to say one necessary thing publicly, while manipulating another necessary thing privately. The Art of War.
President Trump is the first U.S. President to understand how the red dragon hides behind the panda mask.
It is specifically because he understands that Panda is a mask that President Trump messages warmth toward the Chinese people, and pours vociferous praise upon Xi Jinping, while simultaneously confronting the geopolitical doctrine of the Xi regime.
In essence Trump is mirroring the behavior of China while confronting their economic duplicity.
President Trump will not back down from his position; the U.S. holds all of the leverage and the issue must be addressed. President Trump has waiting three decades for this moment. This President and his team are entirely prepared for this.
We are finally confronting the geopolitical Red Dragon, China!
The Olive branch and arrows denote the power of peace and war. The symbol in any figure’s right hand has more significance than one in its left hand. Also important is the direction faced by the symbols central figure. The emphasis on the eagles stare signifies the preferred disposition. An eagle holding an arrow also symbolizes the war for freedom, and its use is commonly referred to the liberation fight of righteous people from abusive influence. The eagle on the original seal created for the Office of the President showed the gaze upon the arrows.
The Eagle and the Arrow – An Aesop’s Fable
An Eagle was soaring through the air. Suddenly it heard the whizz of an Arrow, and felt the dart pierce its breast. Slowly it fluttered down to earth. Its lifeblood pouring out. Looking at the Arrow with which it had been shot, the Eagle realized that the deadly shaft had been feathered with one of its own plumes.
Moral:We often give our enemies the means for our own destruction.
“Markets”
… all in deep contrast with what the past American Presidential Administration were focused on (video)
As the Federal Reserve kicked off its second round of quantitative easing in the aftermath of the Great Financial Crisis, hedge fund managerDavid Tepper predictedthat nearly all assets would rise tremendously in response. “The Fed just announced: We want economic growth, and we don’t care if there’s inflation… have they ever said that before?” He then famously uttered the line “You gotta love a put”, referring to the Fed’s declared willingness to print $trillions to backstop the economy and financial markets. Nine years later we see that Tepper was right, likely even more so than he realized at the time.
The other world central banks followed the Fed’s lead. Mario Draghi of the ECB declared a similar “whatever it takes” policy and has printed nearly $3.5 trillion in just the past three years alone. The Bank of Japan has intervened so much that it now owns over 40% of its country’s entire bond market. And no central bank has printed more than the People’s Bank of China.
It has been an unprecedented force feeding of stimulus into the global system. And, contrary to what most people realize, it hasn’t diminished over the years since the Great Recession. In fact, the most recent wave from 2015-2018 has seen the highest amount of injected ‘thin-air’ money ever:
In response, equities have long since rocketed past their pre-crisis highs, bonds continued rising as interest rates stayed at historic lows, and many real estate markets are now back in bubble territory. As Tepper predicted, financial and other risk assets have shot the moon. And everyone learned to love the ‘Fed put’ and stop worrying.
But as King Louis XV and Bob Dylan both warned us, what’s coming next will change everything.
The Deluge Approaches
This halcyon era of ever-higher prices and consequence-free backstopping by the central banks is ending. The central banks, desperate to give themselves some slack (any slack!) to maneuver when the next recession arrives, have publicly committed to ‘tightening monetary policy’ and ‘unwinding their balance sheets’, which is wonk-speak for ‘reversing what they’ve done’ over the past decade.
Most general investors today just don’t appreciate how gargantuanly significant this is. For the past 9 years, we’ve become accustomed to a volatility-free one-way trip higher in asset prices. It’s been all-glory with no risk while the ‘Fed put’ has had our backs (along with the ‘EBC put’, the ‘BOJ’ put, the ‘PBoC put’, etc). Anybody going long, buying the (few, minor) dips along the way, has felt like a genius. That’s all over.
Based on current guidance from the central banks, “global QE” is expected to drop precipitously from here:
With just the relatively tiny amount of QE tapering so far, 2018 has already seen more market price volatility than any year since 2009. But we’ve seen nothing so far compared to the volatility that’s coming later this year when QE starts declining in earnest. In parallel with this tightening, global interest rates are rising after years of flat lining at all-time lows. And it’s important to note that our recent 0% (or negative) yields came at the end of a 35-year secular cycle of declining interest rates that began in the early 1980s.
Are we seeing a secular cycle turn now that rates are creeping back up? Will rising interest rates be the norm for the foreseeable future? If so, the world is woefully unprepared for it. Countries and companies are carrying unprecedented levels of debt, as are many households. Rising interest rates increases the cost of servicing that debt, leaving less behind to invest or to meet basic operating needs.
Simon Black reminds usthat, mathematically, rising interest rates result in lower valuations for stocks, bonds and housing. But so far, Wall Street hasn’t gotten the message (chart courtesy of Charles Hugh Smith):
So we’re presented with a simple question: What happens when the QE that’s grossly-inflating markets stops at the same time that interest rates rise? The answer is simple, too: Prices fall.
They fall commensurate with the distortion within the system. Which is unprecendented at this stage.
But Wait, There’s More!
So the situation is dire. But it gets worse. Our debt that’s getting more expensive to service? Well, not only are we (in the US) adding to it at a faster rate with our newly-declared horizon of $1+ trillion annual deficits, but we’re increasingly antagonizing the largest buyers of our debt.
This is most notable with China (the #1 Treasury buyer), whom we’ve dragged into a trade war and just announced$50 billion in tariffsagainst. But Japan (the #2 buyer) is also materially reducing its Treasury purchases. And not to be outdone, Russia recentlydumped half of its Treasury holdings, $47 billion worth, in a single fell swoop. Should this trend lead, understandably, to lower demand for US Treasures in the future, that only will put further pressure on interest rates to move higher.
And this is all happening at a time when the stability of the rest of the world is fast deteriorating. Developing (EM) countries are getting destroyed as central bank liquidity flows slow and reverse — as higher interest rates strengthen the USD against their home currencies, their debts (mostly denominated in USD) become more costly while their revenues (denominated in local currency) lose purchasing power. Fault lines are fracturing across Europe as protectionist, populist candidates are threatening the long-standing EU power structure. Italy’s economy is struggling to remain afloat and could take the entire European banking system down with it. The new tit-for-tat tariffs with the US aren’t helping matters. And China, trade war aside, is seeing its fabled economic momentum slow tomulti-decade lows.
All players on the chessboard are weakening.
The Timing Is Becoming Clear
Yes, the financial markets are currently still near all-time highs (or at the high, in the case of the NASDAQ). And yes, expected Q2 US GDP has jumped to ablistering 4.8%. But the writing is increasingly on the wall that these rosy heights won’t last for much longer.
These next three chartsfrom Palisade Research, combined with the above forecast of the drop-off in global QE, paint a stark picture for the rest of 2018 and beyond. The first shows that as the G-3 central banks have started their initial (and still small) efforts to withdraw QE, the Global Financial Stress Indicator is spiking worrisomely:
Next, one of the best predictors of global corporate earnings now forecasts an imminent collapse. As go earnings, so go stock prices:
And looking at trade flows — which track the movement of ‘real stuff’ like air and shipping freights — we see clear signs that the global economy is slowing down (a trend that will be exacerbated if oil prices rise as geologistArt Berman predicts):
The end of QE, higher interest rates, trade wars at a time of slowing global trade, China/Europe weakening, EM carnage — it’s like both legs of the ladder you’re standing on being sawed off, as well all of the rungs underneath you.
Conclusion: a major decline in the financial markets is due for the second half of 2018/first half of 2019.
Actions To Take
Gathering clouds deliver a valuable message: Seek shelter before the storm.
Specifically, it’s time to:
Get liquid. When the rug gets pulled out from under today’s asset prices, ‘flat’ will be the new ‘up’. Simply not losing money will make you wealthier on a relative basis — it’s the easiest, least-risky strategy for most investors to prepare for what’s coming. “Cash is king” in the aftermath of a deflationary downdraft, when your dry power can be then used to purchase high-quality income-producing assets at excellent value — fractions of their current prices. And in the interim, the returns on cash are getting better for investors who know where to look. We’ve recently explained how you can now get 2%+ interest on cash stored in short-term T-bills (that’s 30x more than most banks will pay on cash savings). If you’re sitting on cash and haven’t looked seriously yet at that program, you really should review our report. With more Fed tightening expected in the future, T-bill rates are likely headed even higher.
Get your plan for the correction into place now. In addition to your cash, how is the rest of your portfolio positioned? Do you have suitable hedges in place to mitigate your risk? Does your financial advisor even acknowledge the risks detailed in the above article? The last thing you want to do in a market downdraft is make panicked decisions.
Nibble into commodities. The commodities/equities price ratio is the lowest it has been in 47 years. That ratio has to correct some point soon. Much of that correction will be due to stocks dropping; but the rest will be by commodities holding their own or appreciating. While it’s true that commodities could indeed fall as well during a general deflationary rout, that’s not a guarantee — especially given that many commodities are now selling at prices close to — or in some cases, below — their marginal cost of production. The easiest commodities to own yourself, the precious metals, are ‘dirt cheap’ right now (especially silver), as explained in our recent podcast with Ronald Stoeferle. And with Friday’s bloodbath, they just got even cheaper.
Assess and address your biggest vulnerabilities before the next crisis hits. Are you worried about the security of your current job when the next recession hits? Are rising interest rates causing you to struggle in deciding whether to buy or sell a home? Are you trying to come up with a plan for a resilient retirement? Are you assessing the pros and cons of relocating? Do you have homesteading questions? Are you trying to create new streams of income?
We’re lurching through the final steps of familiar territory as the status quo we’ve known for the past near-decade is ending. The mind-mindbogglingly massive central bank stimulus supporting asset prices are disappearing. Interest rates are rising. It’s hard to overemphasize how seismic these changes will be to world markets and the global economy. The coming years are going to be completely different than what society is conditioned for. Time is running short to get prepared. Because when today’s Everything Bubble bursts, the effect will be nothing short of catastrophic as 50 years of excessive debt accumulation suddenly deflates.
Wealthy Americans living in blue states are scrambling to find tax loopholes that will help them get around one of the most controversial (and for some, infuriating) provisions in President Trump’s tax plan:The capping of the so-called SALT deduction.Enter real-estate planner Jonathan Blattmachr, who this week made the mistake of explaining to aBloombergreporter about a plan he’s devised for his clients who are trying to get out of paying the additional taxes on their summer homes in the Hamptons or Cape Cod. According to theBloombergstory, Blattmachr is planning on transferring the interest in his two New York residences – one in Garden City and one in Southampton – into LLCs, which he will then divide up into five separate trusts that will be based in Alaska.He can then use the trusts to take the maximum $10,000 deduction five separate times. In this way, he can deduct $50,000 in mortgage taxes from his federal tax bill instead of $10,000.
“This is an under-the-radar thing and it’s novel,” said Blattmachr. (Or at least it was under-the-radar until you went blabbing to the media).The trusts that Blattmachr and other savvy estate planners are using to take advantage of this loophole are called non-grantor trusts. While trusts are typically used by the wealthiest Americans to preserve their wealth as it’s handed down from generation to generation, the tax law is giving the merely wealthy an incentive to explore setting up these trusts to pay taxes at rates found in low-tax red states. The trusts can help property owners avoid paying an additional $100,000 in taxes across their properties.
However, the plan isn’t practical for everybody, and even those who can reap the benefits over the long term must take an up-front risk because they must pay the maintenance costs for the trusts – which can be as high as $20,000 – up front. If the IRS ever issues guidance invalidating the loophole, there’s no way to recover those costs.
Setting up dozens of non-grantor trusts for those with six-figure plus property taxes can be impractical and burdensome. Plus, those whose taxes are under six figures feel the new cap most acutely, according to Steffi Hafen, a tax and estate planning lawyer at Snell & Wilmer in Orange County, California. Those clients often have monthly mortgage payments that eat up a big chunk of their take-home pay, Hafen said.
More than 10 percent of taxpayers in New Jersey will see a tax hike under the new law – the highest percentage in the U.S. – followed by Maryland and the District of Columbia at 9.4 percent, 8.6 percent in California and 8.3 percent in New York, according to an analysis earlier this year by the Tax Policy Center. Those who’ll pay more are mostly being affected by the state and local tax deduction limit.
Mark Germain, founder of Beacon Wealth Management in Hackensack, New Jersey, said the strategy is “absolutely viable,” adding that he has about a dozen clients who want to create non-grantor trusts.
Building and administering the trusts could cost about $20,000, according to Brad Dillon, a senior wealth planner at Brown Brothers Harriman. But those expenses would be justified after a few years, said Scott Testa, a lawyer who leads the estates and trusts tax practice at Friedman LLP in East Hanover, New Jersey.
Already, it’s unclear just how much longer individuals will be able to take advantage of the loophole. As Bloomberg explains, an existing provision in the US tax code could easily be revived to prohibit Americans from using trusts to avoid paying SALT taxes. Though it would take effort on the IRS’s part.
Still, the Internal Revenue Service could issue guidance that would prevent taxpayers from using the trusts to get around the SALT cap. An existing provision says that multiple non-grantor trusts with identical beneficiaries and identical grantors – and whose primary purpose is to avoid taxes – can potentially be considered a single entity, with just one $10,000 SALT deduction. But the measure has never been bolstered by regulations, leaving it vague.
That IRS provision could potentially derail the whole strategy, Dillon said. But compared to the other workarounds that have been proposed by high-tax states, the non-grantor trust “is the only one that’s come out of the fray that seems like a viable structure,” Dillon said.
Furthermore, people with large mortgages might have difficulty convincing their lender to allow them to transfer ownership over to an LLC.
The strategy isn’t for everybody: People with large mortgages on their homes might not be able to win approval from the bank to transfer ownership to an LLC. Also taxpayers with a primary residence in Florida, which like Alaska doesn’t have an income tax, can’t take advantage of the scheme because of complex rules surrounding the state’s homestead exemption.
But for those who are curious, here’s an in-depth explanation of how the process works:
Here’s how it works: First, you set up an LLC in a no-tax state such as Alaska or Delaware. Then, you transfer fractions of that LLC into multiple non-grantor trusts, which are trusts that are treated as independent taxpayers (unlike grantor trusts, where the person who creates them are generally taxed on the trust income). Each trust can take a deduction up to $10,000 for state and local taxes.
If a spouse is designated as the beneficiary, another “adverse” party – meaning someone who may want the money also — has to approve any distributions.
Keep in mind that you no longer control or can benefit from anything placed in the trust. And you have to put investment assets in the trust that will generate enough income to balance out the $10,000 deduction. One option would be a vacation home that generates rental income, according to Steve Akers, chair of the estate planning committee at Bessemer Trust. Marketable securities could also work.
Some caveats: If the home placed in the non-grantor trust is sold, the trust recognizes the gains on the sale and has to pay taxes on it – and it won’t be able to take advantage of a special home sale exclusion that’s available under a separate tax rule. For those with New York residences, putting the home in the LLC or the trust could potentially trigger the state’s 1 percent mansion tax, which is levied on sales of homes of at least $1 million.
As we pointed out earlier this year (citing research from BAML),the Northeast and West coast – traditionally liberal bastions and, according to some, explicitly targeted by the Trump administration – generally have higher average amounts and will feel most of the pain. The chart below shows a heat map for average amount claimed under SALT deductions, with redder states farther above $10k and greener states below.
For those who are still getting up to speed on the new tax law,Goldman offered this guideearlier in the year to the most important provisions. Of course, estate planners aren’t the only ones searching for loopholes.Several blue-state governors have threatened “economic civil war”on Washington by devising loopholes for their residents that will allow them to take advantage of a “charitable” fund being set up by certain states that will essentially allow them to convert some of their taxes into charitable contributions that can still be deducted from their federal tax bill. However, the IRS has already warned states not to try and circumvent the SALT deduction caps. The retaliation has sent state lawmakers scrambling for an alternate solution. As next year’s tax deadline draws closer, expect the conflict between blue states and the federal government to intensify.
The Sources Of Tax Revenue For Every US State, In One Chart
In the aftermath of Trump’s tax reform, which many mostly coastal states complained would cripple state income tax receipts and hurt property prices, S&P offered some good news: in a May 30 report, the rating agency said that “[s]tate policymakers have a lot to cheer,” noting the current slowdown in Medicaid signups and dramatically higher revenue collections, to the tune of 9.4%, are significantly boosting state fiscal positions.
Still, the agency’s view is that current conditions are “most likely only a temporary respite” (very much the same as what is going on at the federal level) means that the agency is likely to focus on “a state’s financial management and budgetary performance during these ‘good’ times” to determine its “resilience to stress when the economy eventually softens” according to BofA.
To that end, S&P warns that:
“For those [states] that either stumble into political dysfunction or – out of expedience – assume recent trends will persist, this moment of fiscal quiescence could prove to be a mirage.”
For now, however, let the good times roll, and with real GDP growth tracking at 3.8% for 2Q18, state tax receipts should grow at a rate of over 10% based on historical correlation patterns, with the growth continuing at 9% and 8% in Q3 and Q4.
This is good news for states that had expected a sharp decline in receipts, and is especially important for states heavily skewed to the personal income tax since revenue from that source should rise by over 14%, according to BofA calculations.
Finally, the BofA chart below is useful for two reasons, first, it shows the states most reliant on individual income taxes from the Census Bureau’s most recent annual survey of tax statistics. Oregon – at 69.4% of total tax collections – is most reliant on individual income taxes, followed by Virginia (57.7%), New York (57.2%), Massachusetts (52.9%) and California (52.0%). More notably, it shows the full relative breakdown of how states collect revenues, from the Individual income tax-free states such as Florida, Texas, Washington, Tennessee, and Nevada, to the sales tax-free Alaska, Vermont and Oregon, to the severance-tax heavy Wyoming, North Dakota and Alaska, and everyone in between: this is how America’s states fund themselves.
TheNational Low Income Housing Coalition’s(NLIHC) annual report, Out of Reach, reveals the striking gap between wages and the price of housing across the United States. The report’s ‘Housing Wage’ is an estimate of what a full-time worker on a state by state basis must make to afford a one or two-bedroom rental home at the Housing and Urban Development’s (HUD) fair market rent without exceeding 30 percent of income on housing expenses.
With decades of declining wages and widening wealth inequality via the financialization of corporate America, and thanks to the Federal Reserve’s disastrous policies (whose direct outcome is the ascent of Trump), the recent insignificant countertrend in wage growth for low-income workers has not been enough to boost their standard of living.
The report finds that a full-time minimum wage worker, or the average American stuck in the gig economy, cannot afford to rent a two-bedroom apartment anywhere in the U.S.
According to the report, the 2018 national Housing Wage is $22.10 for a two-bedroom rental home and $17.90 for a one-bedroom rental. Across the country, the two-bedroom Housing Wage ranges from $13.84 in Arkansas to $36.13 in Hawaii.
The five cities with the highest two-bedroom Housing Wages are Stamford-Norwalk, CT ($38.19), Honolulu, HI ($39.06), Oakland-Fremont, CA ($44.79), San Jose-Sunnyvale-Santa Clara, CA ($48.50), and San Francisco, CA ($60.02).
For people earning minimum wage, which could be most millennials stuck in the gig economy, the situation is beyond dire. At $7.25 per hour, these hopeless souls would need to work 122 hours per week, or approximately three full-time jobs, to afford a two-bedroom rental at HUD’s fair market rent; for a one-bedroom, these individuals would need to work 99 hours per week, or hold at least two full-time jobs.
The disturbing reality is that many will work until they die to only rent a roof over their head.
The report warns: “in no state, metropolitan area, or county can a worker earning the federal minimum wage or prevailing state minimum wage afford a two-bedroom rental home at fair market rent by working a standard 40-hour week.”
The quest to afford rental homes is not limited to minimum-wage workers. NLIHC calculates that the average renter’s hourly wage is $16.88. The average renter in each county across the U.S. makes enough to afford a two-bedroom in only 11 percent of counties, and a one-bedroom, in just 43% .
FIGURE 1: States With The Largest Shortfall Between Average Renter Wage And Two-Bedroom Housing Wage
Low wages and widespread wage inequality contribute to the widening gap between what people earn and mandatory outlays, in the price of their housing. The national Housing Wage in 2018 is $22.10 for a two-bedroom rental home and $17.90 for a one-bedroom, the report found.
FIGURE 3: Hourly Wages By Percentile VS. One And Two-Bedroom Housing Wages
Here is how much it costs to rent a two-bedroom in your state:
Case Shiller House Prices have continued to surge to bubble levels with growing demand for rental housing in the decade post the Great Recession.
The report indicates that new rental construction has shifted toward the luxury market because it is more profitable for homebuilders. The number of rentals for $2000 or more per month has more than doubled between 2005 and 2015.
Here are the Most Expensive Jurisdictions for Housing Wage for Two-Bedroom Rentals
“While the housing market may have recovered for many, we are nonetheless experiencing an affordable housing crisis, especially for very low-income families,” said Bernie Sanders quoted in the report.
The fact is, the low-wage workforce is projected to soar over the next decade, particularly in unproductive service-sector jobs and odd jobs in the gig economy, as increasingly more menial jobs are replaced by automation/robots. This is not sustainable for a fragile economy where many are heavily indebted with limited savings; this should be a warning, as many Americans do not understand their living standards are in decline. American exceptionalism is dying.
The bad news is that for the government to combat the unaffordability crisis, deficits would have to explode because even more Americans would demand housing subsidies, setting the US debt on an even more unsustainable trajectory. Even though Congress marginally increased the 2018 HUD budget, the change in funding levels for some housing programs have declined.
Changes In Funding Levels For Key HUD Programs (FY10 Enacted To F18 Enacted)
But wait a minute, something does not quite add up: consider President Trump’s cheer leading on Twitter calling today’s economy the “greatest economy in History of America and the best time EVER to look for a job.”
In many ways this is the greatest economy in the HISTORY of America and the best time EVER to look for a job!
“The Global Bond Curve Just Inverted”: Why JPM thinks a market Crash may be imminent
At the beginning of April, JPMorgan’s Nikolaos Panigirtzogloupointed outsomething unexpected: in a time when everyone was stressing out over the upcoming inversion in the Treasury yield curve, the JPM analyst showed that the forward curve for the 1-month US OIS rate, a proxy for the Fed policy rate, had already inverted after the two-year forward point. In other words, while cash instruments had yet to officially invert, the market had already priced this move in.
One way of visualizing this inversion was by charting the front end between the 2-year and 3-year forward points of the 1-month OIS. Here, as JPM showed two months ago, a curve inversion had arisen for the first time during the first week of January, but it only lasted for two days at the time and the curve re-steepened significantly in the beginning of April.
Fast forward to today when in a follow up note, Panigirtzoglou highlights that this inversion has gotten worse over the past week following Wednesday’s hawkish FOMC meeting. As shown in the chart below which updates the 1-month OIS rate, the difference between the 3-year and the 2-year forward points has worsened, falling to a new low for the year of -5bp.
But in an unexpected development – because as a reminder we already knew that themarket had priced in an inversionin the short-end of the curve – something remarkable happened last week: the entire global bond curve just inverted for the first time since just before the financial crisis erupted.
As JPM notes, while the Fed’s hawkish move was sufficient to invert the short end further, it was not the only central bank inducing flattening this past week: the ECB also pressed lower on the curve via its “dovish QE end” policy meeting this week. And as a result of this week’s broad-based flattening, the yield curve inversion has spilled over to the long end of the global government bond yield curve also.
In particular, the yield spread between the 7-10 year minus the 1-3 year maturity buckets of our global government bond index (JPM GBI Broad bond index) shifted to negative territory this week for the first time since 2007. This can be seen in Figure 2.
But how is it possible that the global government bond yield curve can be inverted when most developed 2s10s cash curves are still at least a little steep? After all, as seen below, After all, the flattest 2s10s government yield curve is in Japan at +17bp and although the 2s10s US government curve – shown below – has been collapsing, it is still 35bp away from inversion.
The answer is in the unequal weighing of US duration in the JPM global bond index: specifically, as Panigirtzoglou explains, the US has a much higher weight in the 1-3 year bucket, around 50%, than in the 7-10 year bucket, where it has a weight of only 25%.
This is because in terms of the relative stocks of government bonds globally, there are a lot more short-dated US government bonds relative to longer-dated ones as the US has lagged other countries in terms of the duration expansion trend that took place over the past ten years.
This is shown in Figure 3 which shows the average duration of various countries’ government bond indices over time. It is very clear that the US has failed to follow other countries in the past decade’s duration expansion race and as a result there are currently a lot more non-US government bonds in longer-dated buckets which are typically lower yielding than the US. And a lot more US government bonds in short-dated buckets which are typically higher yielding.
What are the practical implications? Well, in a word, global investors – those for whom Treasury flows are fungible and have exposure to the entire world’s “safe securities” – now find themselves in inversion.
In other words, with the Fed having pushed the yield on short dated 1-3 year US government bonds to above 2.5%, global bond investors who, by construction, hold more US government bonds in the 1-3 year bucket and more non-US government bonds in the longer-dated buckets, finds themselves with a situation where extending maturities at a global level provides no extra yield compensation.
And the punchline:
This means that while at the local level bond investors are still demanding a premium for longer-dated bonds, at an aggregate level – abstracting from segmentation and currency hedging issues – bond investors globally are no longer demanding such a premium.
Needless to say, although JPM says it anyway, “this is rather unusual as can be seen in Figure 2.”
As for the timing, well it’s troubling to say the least: it did so just before the last two bubbles burst. In fact, the last time the 7-10y minus 1-3y yield spread of JPM’s GBI Broad bond index turned negative was in 2007 ahead of an equity correction and recession at the time. Before then it had turned very negative in late 1990s also, after the 1997/1998 EM crisis but also in 1999 ahead of a burst in the equity bubble and a reversal of Fed policy.
And if that wasn’t enough, here are some especially ominous parting thoughts from the JPM strategist:
In other words, in normal times, bond investors demand a premium to hold longer-dated bonds and to tie their money for a long period of time vs. investing in lower risk short-dated bonds. But when investors have little confidence in the trajectory of the economy or they think monetary policy tightening is overdone or they see a high risk of a correction in risky markets such as equities, they may prefer to buy longer-dated government bonds as a hedge even though they receive a lower yield than short-dated bonds. This is perhaps why empirical literature found that the slope of the yield curve is such a good predictor of economic slowdowns and/or equity market corrections.
In other words, contrary to all those awed but naive interpretations of the short-term market reaction invoked by Powell or Draghi, according to the market, not only the Fed but the ECB engaged in consecutive policy mistakes. And, as JPM confirms, “this week’s central bank meetings exacerbated this flattening trend.”
As a result the yield curve inversion is no longer confined to the front-end of the US curve, but has also emerged at the longer end of the global government bond yield curve.
What this means is that a decade after the last such inversion, bond investors globally no longer require extra premium for holding longer-dated bonds vs short-dated bonds, something that happens rarely, e.g. when investors have little confidence in the trajectory of the economy, or they think monetary policy tightening is overdone or they see a high risk of a correction in risky markets such as equities.
Some people seem to believe that Bitcoin might be worthless, we discuss their arguments.
If there was value in Bitcoin, how would we know?
Shared delusions, are they useful?
The case for Bitcoin having no value at all
(Hans Hauge) If you’ve readanythingI’vewrittenso far, you know that I’m long Bitcoin (BTC-USD). However, that doesn’t mean I’ve turned a blind eye to the crowd that says it’s all an illusion, that Bitcoin is intrinsically worthless.
Let’s take a look at who is making these arguments, and what they’re saying.
So, if I understand correctly, Mr. Dimon’s argument is that every government in the world will soon block all cryptocurrencies. Therefore, Bitcoin is doomed.
Warren Buffet and Charlie Munger of Berkshire Hathaway
In May, 2018, Warren Buffet said that Bitcoin was:
If I understand correctly, Mr. Buffet believes that Bitcoin is super tasty but very poisonous, like a Big Mac times itself, and Charlie Munger is trying to say that the Bitcoin market is pure FOMO, or the Fear of Missing Out. Therefore, Bitcoin is doomed.
Putting these ideas to the test
I hope you are a data driven person like me. I believe there’s no better way to have a clear understanding when people’s tempers are raging than to just look at data and slowly and carefully think about what makes sense.
Let’s start with Jamie Dimon’s argument that all governments in the world will ban Bitcoin. How does this argument stack up? Let’s look at what’s going on in the three largest economies in the world.
All governments to ban Bitcoin?
While China has placed a temporary ban on Bitcoin exchanges and ICOs, China’s state TV recently said that blockchain could beten times more valuable that the internet. While it may seem that China is falling in line with Mr. Dimon’s prediction, it’s worth noting that when the latest ban went into effect, business didn’t stop, it just moved to places with a more friendly regulatory environment, such asSwitzerland, JapanandSouth Korea.
In Japan, eleven Bitcoin exchanges are recognized by theFSA, andBitcoin is legal tender. This would seem to be at odds with the idea that every government in the world is going to ban Bitcoin.
When governments move too quickly to ban new technology, the country they represent ends up getting left behind. Coinbase for example, has20 million users and has traded over 150 billion dollarsof cryptocurrencies to date. This kind of economic activity is creating jobs and driving innovation.
Will governments regulate cryptocurrency exchanges? Of course, and they already are.
Will every government in the world ban cryptocurrency outright? I’m not convinced it’s going to happen, especially with what we’re seeing in the US and Japan so far.
Final thoughts on J.P. Morgan
Mr. Dimon’s comments would make more sense if they were, I don’t know, maybe trying topatent Bitcoin’s technologyand make their own version. But, that would be kind of unethical, don’t you think? I guess it’s not really surprising since J.P. Morgan (JPM) has been fined more than29 billion dollars for abusing the marketsince the year 2000. But,Bitcoin is the fraud?
Bitcoin value is based on nothing but FOMO?
I think people forget that Bitcoin is not some magical beast that lives in isolation. It’s a network with many stakeholders and it represents something different to each group. Bitcoin has created an ecosystem that includesBitcoin Miners, Software Engineers, Exchanges, Cloud infrastructure likeBlockchian as a Service, Merchants, Users, and of course, the speculators and the scammers.
Let’s look at some data.
FOMO or subject of scholarly research?
If Bitcoin was just FOMO, then surely academic interest in the subject would be small, and certainly not growing over time. What’s the big deal after all?
FOMO or a life raft for those living in oppressive regimes?
If Bitcoin was just speculation, surely the countries with the highest search volume for the term “Bitcoin” would be wealthy countries where people are throwing money around, rather than in troubled places where a censorship resistant currency might be of use. As you can see, with the exception Finland in 2012, the interest is overwhelming coming from troubled geographic areas.
Year
Number one Country by Search Volume for the term “Bitcoin”
If Bitcoin was just FOMO, then why are VC firms investing more in blockchain startups each year? Maybe some of them are caught up in the craze, but just look at the chart below.
To say that Bitcoin has no value is to say that academics (students and professors), governments, venture capitalists, software engineers, hiring managers, and people living in the most troubled areas of the world are completely off their rockers because they dare to challenge our assumptions about what value is and the ways in which it might be transferred.
Is Bitcoin a shared delusion? Sure, but so are lines of latitude and longitude, global time standards, our existing money system, right and wrong, cultural norms, beauty, art and hope. The more important question is, does this shared delusion give us something back? Do we gain something by believing in it?
For me, the answer is clear. I think Bitcoin is one of the most powerful forces for the rights of the individual. I think Bitcoin can at onceweaken the oppressors of the downtroddenand create opportunity for the bold.
Conclusion
It may challenge our assumptions that money might come from the crowd, rather than from on high. But, maybe this time it’s up to us to save ourselves? Ask yourself what it might mean to live in a world where currencies exist that reach the entire globe and yet don’t require the backing of a military. I don’t know for sure what it means, but I’ve decided to follow this path and find out for myself, rather than relying on the old guard to hand down truth to me.
California has beaten Illinois for net out-migration from the state. California has become one state that there are more people trying to get out than moving into it. So while California wants to protect illegal aliens and fight with the Federal government over sanctuary cities contrary to the Constitutional Supremacy Clause, according to a November report from the U.S Census Bureau, the Golden State has had 142,932 residents exit the state. This domestic out-migration has been the second largest outflow in the USA behind only New York and New Jersey. The net out-migration from California jumped up 11% compared to 2015.
California’s 168-year run as a single entity, hugging the continent’s edge for hundreds of miles and sprawling east across mountains and desert, could come to an end next year — as a controversial plan to split the Golden State into three new jurisdictions qualified Tuesday for the Nov. 6 ballot.
If a majority of voters who cast ballots agree, a long and contentious process would begin for three separate states to take the place of California, with one primarily centered around Los Angeles and the other two divvying up the counties to the north and south. Completion of the radical plan — far from certain, given its many hurdles at judicial, state and federal levels — would make history.
It would be the first division of an existing U.S. state since the creation of West Virginia in 1863.
“Three states will get us better infrastructure, better education and lower taxes,” Tim Draper, the Silicon Valley billionaire venture capitalist who sponsored the ballot measure, said in an email to The Times last summer when he formally submitted the proposal. “States will be more accountable to us and can cooperate and compete for citizens.”
Small business optimism soared in May to its highest level in 34 years, with some components hitting all-time highs, the National Federation of Independent BusinessessaidTuesday.
The NFIB’s Small Business Optimism Index rose 3 points in May to a reading of 107.8, its second-highest level in 45 years and strongest level of the recovery. Economists were expecting the index to rise to 105.2 from 104.8.
The May reading was just under the 1983 record of 108.
Several measures hit the highest levels ever recorded. Plans for business expansion, reports of positive earnings trends, and compensation increases broke new records. Expectations for strong increases in sales reached their highest level since 1995.
“Small business owners are continuing an 18-month streak of unprecedented optimism which is leading to more hiring and raising wages,” said NFIB Chief Economist Bill Dunkelberg. “While they continue to face challenges in hiring qualified workers, they now have more resources to commit to attracting candidates.”
The NFIB cites tax cuts and regulatory cuts as helping drive the optimism of small businesses.
“The new tax code is returning money to the private sector where history makes clear it will be better invested than by a government bureaucracy,” the NFIB said in its report. “Regulatory costs, as significant as taxes, are being reduced.”
The US is starting to admit that it has a spending problem.
According to the latestMonthly Treasury Statement, in May, the US collected $217BN in receipts – consisting of $93BN in individual income tax, $103BN in social security and payroll tax, $3BN in corporate tax and $18BN in other taxes and duties- a drop of 9.7% from the $240.4BN collected last March and a clear reversal from the recent increasing trend…
… even as Federal spending surged, rising 10.7% from $328.8BN last March to $363.9BN last month.
… where the money was spent on social security ($83BN), defense ($56BN), Medicare ($53BN), Interest on Debt ($32BN), and Other ($141BN).
The surge in spending led to a May budget deficit of $146.8 billion, above the consensus estimate of $144BN, a swing from a surplus of $214.3 billion in April and far larger than the deficit of $88.4 billion recorded in May of 2017.This was the biggest March budget deficit since the financial crisis.
The May deficit brought the cumulative 2018F budget deficit to over $531bn during the first eight month of the fiscal year; as a reminder the deficit is expect to increase further amid the tax and spending measures, and rise above $1 trillion.
The red ink for May deficit brought the deficit for the year to-date to $532.2 billion. Most Wall Street firms forecast a deficit for fiscal 2018 of about $850 billion, at which point things get… worse. As we showed In a recent report, CBO has also significantly raised its deficit projection over the 2018-2028 period.
But while out of control government spending is clearly a concern, an even bigger problem is what happens to not only the US debt, whichrecently surpassed $21 trillion, but to the interest on that debt, in a time of rising interest rates.
As the following chart shows, US governmentInterest Paymentsare already rising rapidly, and just hit an all time high in Q1 2018.
Interest costs are increasing due to three factors: an increase in the amount of outstanding debt, higher interest rates and higher inflation. A rise in the inflation rate boosts the upward adjustment to the principal of TIPS, increasing the amount of debt on which the Treasury pays interest. For fiscal 2018 to-date, TIPS’ principal has been increased by boosted by $25.8 billion, an increase of 54.9% over the comparable period in 2017.
The bigger question is with short-term rates still in the mid-1% range, what happens when they reach 3% as the Fed’s dot plot suggests it will?
* * *
In a note released by Goldman after the blowout in the deficit was revealed, the bank once again revised its 2018 deficit forecast higher, and now expect the federal deficit to reach $825bn (4.1% of GDP) in FY2018 and to continue to rise, reaching $1050bn (5.0%) in FY2019, $1125bn (5.4%) in FY2020, and $1250bn (5.5%) in FY2021.
Goldman also notes that it expects that on its current financing schedule the Treasury still faces a financing gap of around $300bn in FY2019, rising to around $750bn by FY2021, and will thus need to raise auction sizes substantially over the next couple of years to accommodate higher deficits.
What does this mean for interest rates? The bank’s economic team explains:
The increase in Treasury issuance and the ongoing unwind of QE should put upward pressure on long-term interest rates. On issuance, the economic research literature suggests as a rule-of-thumb that a 1pp increase in the deficit/GDP ratio raises 10-year Treasury yields by 10-25bp. Multiplying the midpoint of this range by the roughly 1.5pp increase in the deficit due to the recent tax and spending bills implies a 25bp increase in the 10-year yield. On the Fed’s balance sheet reduction, our estimates suggest that about 40-45bp of upward pressure on the 10-year term premium remains.
And here a problem emerges, because while Goldman claims that “the deficit path is known to markets, but academic research suggests these effects might not be fully priced immediately… the balance sheet normalization plan is known too, but portfolio balance effect models imply that its impact should be gradual” the bank also admits that “the precise timing of these effects is uncertain.”
What this means is that it is quite likely that Treasurys fail to slide until well after they should only to plunge orders of magnitude more than they are expected to, in the process launching the biggest VaR shock in world history, because as a reminder, as of mid-2016, a1% increase in rates would result in a $2.1 trillion loss to government bond P&L.
A battle is playing out in Midland, TX between employee-starved local businesses and multinational energy companies who are poaching local residents left and right for high-paying jobs as the latest Permian Basin shale-oil boom accelerates.
Midland Mayor Jerry Morales says the boom is a double-edged sword; while the energy industry has increased sales-tax revenue by 34% year-over-year, an incredibly low unemployment rate of 2.1% has resulted in a severe shortage of low-paying jobs around town – such as the 100 open teaching positions, according toBloomberg.
Morales, a native Midlander and second-generation restaurateur, has seen it happen so many times before. Oil prices go up, and energy companies dangle such incredible salaries that restaurants, grocery stores, hotels and other businesses can’t compete. People complain about poor service and long lines at McDonald’s and the Walmart and their favorite Tex-Mex joints. Rents soar. –Bloomberg
“This economy is on fire,” said Morales – who is also the proprietor of Mulberry Cafe and Gerardo’s Casita. Unfortunately, the fire is so hot that the Mayor is scrambling to fill open jobs – from local government positions, to cooks at his restaurants.
In the country’s busiest oil patch, where the rig count has climbed by nearly one third in the past year, drillers, service providers and trucking companies have been poaching in all corners, recruiting everyone from police officers to grocery clerks.So many bus drivers with the Ector County Independent School District in nearby Odessa quit for the shale fields that kids were sometimes late to class. The George W. Bush Childhood Home, a museum in Midland dedicated to the 43rd U.S. president, is smarting from a volunteer shortage.
And it doesn’t take much to get hired by the oil industry – which, as Bloomberg summarizes, “will hire just about anyone with basic training“… and it will quickly double, triple or x-ple their pay in the process. “It is crazy” said Jazmin Jimenez, 24, who flew through a two-week training program at New Mexico Junior College about 100 miles north of Midland. Jimenez was hired by Chevron as a well-pump checker. “Honestly I never thought I’d see myself at an oilfield company. But now that I’m here — I think this is it.“
And at $28-an-hour, Jimenez makes double what she was earning as a prison guard at the Lea County Correctional Facility in Hobbs.
Meanwhile, innovations in oilfield technology promise to find new and efficient ways of finding and pulling oil from the pancaked lawyers of rock in the 75,000 square-mile Permian basin – an extraction method which now accounts for 30% of all US output.
The booming shale economy has also effected the local real-estate market – as the supply of homes for sale is the lowest on record according to the Texas A&M Real Estate Center.
The $325,440 average price in Midland is the highest since June 2014, the last time the world saw oil above $100 a barrel. Apartment rents in Midland and Odessa are up by more than a third from a year ago, with the average 863-square-foot unit commanding $1,272 a month.
People who move for jobs are stunned by the cost of living. Armin Rashvand’s apartment is smaller and costs more than the one he rented in Cleveland before moving last August to run the energy-technology program at Odessa College.
“That really surprised me,” he said, because Texas’s reputation is that it’s affordable. “In Texas, yes — except here.”
Some of Rashvand’s students with two-year degrees are making more than he does, despite his master’s degrees in science, electrical and electronic engineering.
Keep on truckin’
And for those who would rather work a bit further upstream from the oilfields, schools that teach how to pass the test for a commercial drivers license (CDL) are packed. “A CDL is a golden ticket around here,” said Steve Sauceda, head of the workforce training program at New Mexico Junior College. “You are employable just about anywhere.”
Truckers in the shale fields can easily make six-figures, such as Jeremiah Fleming, 30, who is on track to make $140,000 driving flatbed trucks for Aveda Transportation & Energy Services Inc., hauling rigs.
“This will be my best year yet,” said Fleming, who used to work in the once-bustling shale play in North Dakota. “I wouldn’t want to go anywhere else.”
So what is Mayor Morales doing?
In order to try and retain employees, Morales has come up with several strategies – such as weekly vs. twice-monthly paychecks, more opportunities for overtime, and a “common-sense pitch” to employees thinking of jumping ship for the oil fields:
“If you’ll stay with me, I can give you three quarters of what the oil will give you but you don’t have to get dirty or worry about getting hurt.”
Why are officials so unwilling to tell their voters (tax donkeys) that pension costs are the underlying factor in their requests for tax increases?
While public and media attention to this week’s primary election focused – understandably so – on contests for governor, U.S. senator and a handful of congressional seats, there were other important issues on Californians’ ballots.
One, which received scant attention at best, was another flurry of local government and school tax and bond proposals.
The California Taxpayers Association counted 98 proposals to raise local taxes directly, or indirectly through issuance of bonds that would require higher property taxes to repay.
The proposed taxes on legal marijuana sales and other retail sales and “parcel taxes” on pieces of real estate were particularly noteworthy for how they were presented to voters.
Most followed the playbook that highly paid strategists peddle to local officials, advising them to promise improvements in popular services, such as police and fire protection and parks, and avoid any mention of the most important factor in deteriorating fiscal circumstances – the soaring cost of public employee pensions.
City, county and school district officials howl constantly, albeit mostly in private, that ever-increasing, mandatory payments to the California Public Employees Retirement System (CalPERS) and the California State Teachers Retirement System (CalSTRS) are driving some entities to the brink of insolvency.
However, those officials are just as consistently unwilling to tell their voters that pension costs are the basic underlying factor in their requests for tax increases.
Why?
Tying tax increases to pensions, rather than popular services, not only would make voters less likely to vote for them but make public employee unions less willing to pony up campaign funds to sell the tax increases to voters. It is, in effect, a conspiracy of silence.
This week’s local tax and bond measures are just a tuneup for what will likely be a much larger batch on the November ballot.
It’s a well-established axiom of California politics that low-turnout elections, such as a non-presidential primary in June, are not as friendly to tax proposals as higher-turnout general elections, such as the one in November. Primaries tend to draw older white voters who often shun taxes, while general elections have younger and more ethnically diverse electorates easily conditioned through social media to believing they might receive a few crumbs from voting in favor of socialist wealth transfer tax schemes.
As local officials make plans to place those proposals on the November ballot, a bill making its way through the Legislature could skew local tax politics even more.
Senate Bill 958 would allow one school district, Davis Unified, to exempt its own employees from paying the $620 per year parcel tax that its voters approved two years ago.
The Senate approved SB 958 on a 24-19 vote last month, sending it to the Assembly. It’s being carried by Sen. Bill Dodd, a Napa Democrat whose district includes Davis.
The bill’s rationale is that housing is so expensive in Davis that teachers and other school employees cannot afford to live there, and that exempting them from the parcel tax would, at least in theory, make housing more affordable.
However, if SB 958 becomes law, it would set a dangerous precedent. It doesn’t take much imagination to see local government and school unions throughout the state demanding similar exemptions from new taxes with the threat, explicit or implicit, that they would refuse to finance tax measure campaigns.
The very people who benefit most from additional taxes by receiving higher salaries and/or better fringe benefits thus would be able to avoid paying those taxes themselves.
Voters in California’s 29th State Senate district recalled freshman Democrat Josh Newman in Tuesdy’s California primary over his vote for Governor Jerry Brown’s 12-cent-per-gallon gas tax hike, replacing him with Republican Ling Ling Chang and definitively denying Democrats a super majority in the upper house.
Election results showed Newman being recalled by a margin of 59.5% to 40.5%, despite the fact that saving his seat was the top priority of California Democrats on Tuesday.
Newman was, of course, not the only state senator to vote for the gas tax hike. He was, however, the most vulnerable, and Republicans targeted him in an effort to undo the Democrats’ super majority.
That super majority no longer existed by the time of the recall election, thanks to several “#metoo” resignations of Democrats who had been accused of sexual harassment.
However, the recall effort pressed ahead, and is an early barometer of voter outrage at the gas tax, amidst higher prices at the pump.
Republicans have likely managed to place a repeal of the gas tax on the November ballot, hoping to tap into a statewide majority thatfavorsrepealing the tax, and to motivate conservative voters to turn out — a task that has been made even easier by the somewhat unexpected second-place finish of Republican businessman John Cox in the primary for governor.
Newman’s recall is a hopeful sign for Republicans, who will need strong statewide turnout to defend several vulnerable congressional seats. Conversely, it is a bitter disappointment for Democrats, who now fear that the highly-anticipated “blue wave” may not materialize in California after all.
A vintage postcard shows the brilliantly lit California State Capitol fountain at night.
Governor Jerry Brown is retiring but not before he passes a few draconian laws as parting gifts for California. Two bills were signed into law on Thursday of last week to “help California be better prepared for future droughts and the effects of climate change.”
The mandatory water conservation standards will be permanent, according to their wording, and not just for use in times of crisis. To make a long story short, now that these bills are law, it’s illegal to take a shower and do a load of laundry in the same day because you’ll exceed your “ration.”
Here’s the wording of the new laws.
Senate Bill 606establishes a “governing body” to oversee all water suppliers, both private and public and will require extensive paperwork from those utility companies.
Assembly Bill 1668is where it gets personal. This establishes limits on indoor water usage for every person in California and the amount allowed will decrease even further over the next 12 years.
The bill, until January 1, 2025, would establish 55 gallons per capita daily as the standard for indoor residential water use, beginning January 1, 2025, would establish the greater of 52.5 gallons per capita daily or a standard recommended by the department and the board as the standard for indoor residential water use, and beginning January 1, 2030, would establish the greater of 50 gallons per capita daily or a standard recommended by the department and the board as the standard for indoor residential water use. The bill would impose civil liability for a violation of an order or regulation issued pursuant to these provisions, as specified.
If you’re wondering how the government would know how much water your family is using, the utility providers will be obligated to rat you out of face massive fines. And they’re encouraged to spy in all sorts of creative ways. They “shall use satellite imagery, site visits, or other best available technology to develop an accurate estimate of landscaped areas.”
Some analysis
Now, if you’re wondering where I get my assertion that you can’t shower and do laundry on the same day, here’s some math:
An 8-minute shower uses about 17 gallons of water
A load of laundry uses about 40 gallons of water
A bathtub holds 80 to 100 gallons of water
A dishwasher uses 6 gallons of water
There are also standards to be established for outdoor use such as landscaping, caring for livestock, and gardening, but those numbers don’t seem to be available at this time. Maybe Californians just get to wait in suspense to see if their chickens are allowed to have water on the same day as their vegetables. Back when I lived in California, we were only “allowed” to water our gardens two times per week, which, in that heat, as you can imagine, didn’t lead to very productive gardens.
Farmers on a larger scale will have to jump through numerous hoops and create water management plans which must then be approved by the people in suits because obviously, they’ll know more about the needs of crops and livestock than the farmers will
Oh, and don’t worry, rich people. There will be “provisions for swimming pools, spas, and other water features.” So you can still have your pretty fountains and pools while the rest of the peons take 2 showers a week. One might wonder if ‘variances” will apply to the wealthy for their landscaping needs.
“The State Water Resources Control Board, which will oversee local agencies’ progress, will also consider possible “variances” for some districts that need additional allowances due to specific local circumstances.” (source)
If you don’t plan to comply it’s going to be way cheaper to move. Here are the fines Californians will be looking at – and it’s not a typo – these fines are PER DAY.
(1) If the violation occurs in a critically dry year immediately preceded by two or more consecutive below normal, dry, or critically dry years or during a period for which the Governor has issued a proclamation of a state of emergency under the California Emergency Services Act (Chapter 7 (commencing with Section 8550) of Division 1 of Title 2 of the Government Code) based on drought conditions, ten thousand dollars ($10,000) for each day in which the violation occurs.
(2) For all violations other than those described in paragraph (1), one thousand dollars ($1,000) for each day in which the violation occurs.
It’s important to note that your usage is only tracked if you have municipal water. If you have a well, at this point, you will probably be okay. Back when I lived there, the idea of metering private wells and billing the owners for use had been floated around, but most people resisted and it wasn’t enforced. If you truck your water in, you can also use as much as you need to.
For years it was illegal to use greywater systems in California, despite the epic droughts. Those regulations have been loosened, however, compliance is still extremely onerous. (Get the details here.) And rainwater catchment is not only legal, it’s encouraged. In fact, there’s a ballot on the table that is a “measure to allow rainwater capture systems to be installed without counting as new construction for the purposes of reassessing property taxes.”
Don’t think this only affects California
Not only are Californians fleeing the state in droves, but there are other ways these restrictive laws can affect the rest of us directly.
These stringent measures set a dangerous precedent for the rest of the country.
There could be a shortage of food coming out of California because there isn’t enough water to produce it.
The food we do get from there will cost a lot more.
It’s important to pay attention to stuff like this and not shrug it off because “I don’t live in California.” In an economy such as ours, we’re all interlinked. A draconian law that gains a footing in one part of the country is much easier to pass in other parts.
Several Silicon Valley employees, including a software engineer for Twitter who made a $160,000 salary,were mocked online after complaining about their living standards inan articlefor The Guardian.
In the article, entitled “Scraping by on six figures? Tech workers feel poor in Silicon Valley’s wealth bubble,” the employee complained that his six-figure salary was “pretty bad” for the area.
“I didn’t become a software engineer just to make ends meet,”proclaimed the employee. “Families are priced out of the market.”
“The biggest cost is his $3,000 rent – which he said is ‘ultra cheap’ for the area – for a two-bedroom house in San Francisco, where he lives with his wife and two children,”reported The Guardiansympathetically. “He’d like a slightly bigger place, but finds himself competing with groups of twenty somethings happy to share accommodation while paying up to $2,000 for a single room.”
“Prohibitive costs have displaced teachers, city workers, firefighters and other members of the middle class, not to mention low-income residents,” they continued. “Now techies, many of whom are among the highest 1% of earners, are complaining they, too, are being priced out.”
The Guardian also covered other Silicon Valley employees in the piece who were earning “between $100,000 and $700,000 a year” but still allegedly had trouble “making ends meet.”
“One Apple employee was recently living in a Santa Cruz garage, using a compost bucket as a toilet. Another tech worker, enrolled in a coding boot camp, described how he lived with 12 other engineers in a two-bedroom apartment rented via Airbnb,” The Guardian reported.
“It was $1,100 for a fucking bunk bed and five people in the same room. One guy was living in a closet, paying $1,400 for a ‘private room,’” one man complained, while a female employee added, “We make over $1m between us, but we can’t afford a house… This is part of where the American dream is not working out here.”
Other established San Francisco residents mocked tech employees for their complaints.
House flipping activitysurged to an 11-year highthis year, with more than 207,000 homes flipped, according to ATTOM Data Solutions, a real estate data firm. But the key is knowing where to be and when. “The sweet spot for successful home flipping is finding the neighborhoods just emerging as the next hot neighborhoods in a city,” says Daren Blomquist, a senior vice president at ATTOM Data Solutions. The firm says the average profit for a housing flip in 2017 was $68,100.
Realtor.com® ranked the 200 largest metros according to the share of all home sales categorized as a flip (defined as any type of home that is bought and resold within a three- to 12-month period). Researchers limited their rankings to two metros per state for geographic diversity and only included markets where the average profit was at least $30,000.
The following are the best housing markets for home flippers, according to realtor.com®:
Brazil Commodities Slammed As Nationwide Strike Intensifies, GDP Estimate Down 38%
Brazil’s nationwide truck driver strike has entered its 10th day
Key exports have been severely affected, from beef and soybeans to coffee and cars
Bloomberg cuts GDP growth estimate from 3.2% to 2%, a decline of 37.5%
Concessions made to truckers will cost the Brazilian government 14.4b Real (US$3.85 Billion) throughout the remainder of 2018
Lower GDP may reduce revenue by additional 20b-25b reais, or 0.25% of GDP, could force govt to cut expenditures further by 3b-10b reais to meet 159b-real fiscal deficit target (Bloomberg)
Brazilian oil workers began a 72-hour strike on Wednesday, and have demanded that Petrobras fire CEOP Petro Parente while permanently lowering fuel prices
Millions of chickens have been prematurely slaughtered as feed failed to reach farmers
The situation in Brazil has gone from bad to worse, as the nationwide trucker strike has expanded into a strike by oil workers, who began a 72-hour strike on Wednesday – affecting several rigs, plants, refineries and ports in the latest challenge for state-owned oil firm Petroleo Brasileiro SA, whose shares have fallen roughly 30% in two weeks. Brazil produces approximately 2.1 million barrels of oil per day, making it Latin America’s largest producer of crude.
The oil worker strike is yet another blow to conservative President Michel Temer, as Brazil’s political climate is fiercely polarized.
Late on Tuesday, Reuters reported that Temer was considering an overhaul of a market-based fuel pricing policy at Petrobras, which could provoke even more investor flight. Temer’s office said in a Wednesday morning statement that he would preserve the policy.
The oil sector strike included workers on at least 20 oil rigs in the lucrative Campos basin of 46 operated by Petrobras, as the company is known, according to FUP, Brazil’s largest oil workers union. Petrobras said any disruption would not have an immediate major impact on its production or overall operations. –Reuters
The strike has crippled virtually every major industry countrywide, while key commodities such as soybeans, beef, coffee and cars have been severely affected.
Most export terminals ran out of soybeans for shipments scheduled for Tuesday and Wednesday, Lucas Trindade de Brito, manager at export group Anec, said in a telephone interview.
Among Brazil’s 109 beef plants, 107 suspended operations and two are running below 50% of capacity, exporter group Abiec said in an email.
Exports of 40,000 tons of beef haven’t been shipped as planned, and thousands of trucks loaded with perishable products, including boned meat, are halted on roads. –Bloomberg
Alas, the strike has also triggered thepremature slaughterof millions of chickens after vital feed failed to reach farmers.
The government announced Sunday that it will cut taxes on diesel fuel, while freezing the price for 60 days followed by a monthly adjustment going forward. The measures will reportedly cost around 9.5 billion reais (US$2.6 billion) through the end of the year, which led Bloomberg to cut GDP growth estimates from 3.2% to 2%.
The measures will cost about 9.5 billion reais ($2.6 billion) through the end of the year, Finance Minister Eduardo Guardia said Monday at a news conference. Part of that bill will be covered by using a government contingency fund and by erasing payroll-tax cuts enjoyed by some industries, but other, as-yet undisclosed, measures will also be required, Mr. Guardia said.
“The loss of tax revenue will need to be compensated,” he said. –WSJ
Meanwhile, as hundreds of demonstrations rage across the country, many are calling for the country to return to a dictatorship that ran for two decades until 1985.
“We need help from the military to resolve our problems in Brasília, to remove the bandits from there and to put the house in order,” said one driver, Gabriel Berestov, 44.
José Lopes, leader of the Brazilian Truck Drivers’ Association, warned on Monday that the strike movement had been hijacked. “There is a very strong group of interventionists,” he told reporters. “They are people who want to bring down the government.”
The subject ricocheted around Brazil. On Tuesday, Temer told foreign journalists he saw “zero risk” of a military intervention. His minister of institutional security, Gen Sergio Etchegoyen, said the armed forces had no intention of intervening and that the idea was a “subject from the last century”.
The theme is deeply controversial in Brazil, which lived under a military dictatorship for 21 years, during which hundreds of regime opponents were executed and thousands more tortured. –The Guardian
Around 15-20% of Brazilians support military intervention, according to Marcus Melo, professor of political science at the Federal University of Pernambuco.
“Those who are still mobilizing are militants and outliers,” he said. “We are in a situation of social convulsion.”
The early stages of a housing cycle are fun for pretty much everyone. Homeowners see their equity start to rise and feel smart for having bought, home seekers have to pay up, but not too much, and fully expect their new home to keep appreciating. People with modest incomes feel a bit of pinch but can still afford to stick around.
But later on the bad starts to outweigh the good. Existing homeowners still enjoy the ride but would-be buyers find themselves priced out of their top-choice neighborhoods. And residents who aren’t tech millionaires find that they can no longer afford to live where they work. Consider the plight of a teacher or cop pretty much anywhere in California these days:
Drew Barclay has a master’s degree in education and three years of experience as an English teacher, but, like most new teachers in Davis, he can’t afford to live there.
Instead, Barclay, 31, shares a rental in Sacramento that costs him $950 a month — about 40 percent of the $2,550 he brings home each month after taxes.
He is so certain that he won’t be able to qualify for a loan for a home in Davis on his $47,000 annual salary that he hasn’t bothered to house hunt. The median price for a house in the city in March was $682,500, according to tracking firm CoreLogic. Renting also is prohibitive, with the average rent in Davis about $2,500 a month, according to Zillow, a real estate website.
Davis Joint Unified officials hope to get a little help from state legislators. Last week, the state Senate voted 24-8 to waive the annual school district parcel tax of $620 for teachers and other employees of the Yolo County school district.
Davis school board member Alan Fernandes said that about two-thirds of the district’s teachers live outside Davis where housing is less expensive. He said the bill would encourage more of the district’s teachers to live in the community they serve.
Davis Joint Unified regularly passes parcel taxes to keep class sizes down and to support classroom programs. In 2016, 71 percent of Davis voters approved Measure H, a yearly tax of $620 on each parcel of taxable real property in the district for eight years. The measure raises $9.5 million a year to support math, reading and science programs and reduced class sizes for elementary grades.
But the roughly $50 a month exemption isn’t likely to help Davis Joint Unified teachers enough to make buying a house affordable. The teachers are some of the lowest-paid educators in the region, with some of the highest health care costs.
Barclay said he knows teachers 10 or 15 years older than he is who are renting rooms in other educators’ homes to get by. He said some teachers have weekend jobs to make enough money to pay their bills.
“Because I’m fairly certain I can’t put down permanent roots here, I don’t see this position as a permanent one,” Barclay said of his job as an English teacher at Davis Senior High School.
California school districts have responded by offering signing bonuses, housing stipends, computers and free tuition to educators who sign up with their districts.
When housing costs reach this point there’s no real fix. Raise taxes to increase teacher pay and there’s political trouble. Cut back on other services and the quality of life declines. “Streamline” the schools and educational outcomes and teacher morale plummet.
There’s a limit, in other words, to the ascent of home prices beyond which the system starts to break down. And when the people who make a town run smoothly – teachers, firefighters, cops, sanitation workers – can no longer afford to live there, that town has clearly crossed the line.
Based on the Case-Shiller home price index, which is now back to its 2007 housing bubble peak, there are a lot more Davis, CAs out there, with all the pathologies that that implies.
A housing bubble, of course, is just a symptom of a bigger problem. Easy money distorts the workings of a market economy by causing the prices of many assets to soar beyond all reason, enriching the owners and impoverishing the users. Typically, when housing reaches this point so have stocks and other financial assets,CEO salaries, corporate concentration, political corruption and a long list of other evils that feed on low interest rates and lax lending standards. The confluence of resulting problems then brings the cycle to a noisy end.
There are a large number of public and private services that measure the change in home prices. The algorithms behind these services, while complex, are primarily based on recent sale prices for comparative homes and adjusted for factors like location, property characteristics and the particulars of the house. While these pricing services are considered to be well represented measures of house prices, there is another important factor that is frequently overlooked despite the large role in plays in house prices.
In August 2016, the 30-year fixed mortgage rate as reported by the Federal Reserve hit an all-time low of 3.44%. Since then it has risen to its current level of 4.50%. While a 1% increase may appear small, especially at this low level of rates, the rise has begun to adversely affect housing and mortgage activity. After rising 33% and 22% in 2015 and 2016 respectively, total mortgage originations were down -16% in 2017. Further increases in rates will likely begin to weigh on house prices and the broader economy. This article will help quantify the benefit that lower rates played in making houses more affordable over the past few decades. By doing this, we can appreciate how further increases in mortgage rates might adversely affect house prices.
Lower Rates
In 1981 mortgage rates peaked at 18.50%. Since that time they have declined steadily and now stands at a relatively paltry 4.50%. Over this 37-year period, individuals’ payments on mortgage loans also declined allowing buyers to get more for their money. Continually declining rates also allowed them to further reduce their payments through refinancing. Consider that in 1990 a $500,000 house, bought with a 10%, 30-year fixed rate mortgage, which was the going rate, would have required a monthly principal and interest payment of $4,388. Today a loan for the same amount at the 4.50% current rate is almost half the payment at $2,533.
The sensitivity of mortgage payments to changes in mortgage rates is about 9%, meaning that each 1% increase or decrease in the mortgage rate results in a payment increase or decrease of 9%. From a home buyer’s perspective, this means that each 1% change in rates makes the house more or less affordable by about 9%.
Given this understanding of the math and the prior history of rate declines, we can calculate how lower rates helped make housing more affordable. To do this, we start in the year 1990 with a $500,000 home price and adjust it annually based on changes in the popular Case-Shiller House Price Index. This calculation approximates the 28-year price appreciation of the house. Second, we further adjust it to the change in interest rates. To accomplish this, we calculated how much more or less home one could buy based on the change in interest rates. The difference between the two, as shown below, provides a value on how much lower interest rates benefited home buyers and sellers.
Data Courtesy: S&P Core Logic Case-Shiller House Price Index
The graph shows that lower payments resulting from the decline in mortgage rates benefited buyers by approximately $325,000. Said differently, a homeowner can afford $325,000 more than would have otherwise been possible due to declining rates.
The Effect of Rising Rates
As stated, mortgage rates have been steadily declining for the past 37 years. There are some interest rate forecasters that believe the recent uptick in rates may be the first wave of a longer-term change in trend. If this is, in fact, the case, quantifying how higher mortgage rates affect payments, supply, demand, and therefore the prices of houses is an important consideration for the direction of the broad economy.
The graph below shows the mortgage payment required for a $500,000 house based on a range of mortgage rates. The background shows the decline in mortgage rates (10.00% to 4.50%) from 1990 to today.
To put this into a different perspective, the following graph shows how much a buyer can afford to pay for a house assuming a fixed payment ($2,333) and varying mortgage rates. The payment is based on the current mortgage rate.
As the graphs portray, home buyers will be forced to make higher mortgage payments or seek lower-priced houses if rates keep rising.
Summary
The Fed has raised interest rates six times since the end of 2015. Their forward guidance from recent Federal Open Market Committee (FOMC) meeting statements and minutes tells of their plans on continuing to do so throughout this year and next. Additionally, the Fed owns over one-quarter of all residential mortgage-backed securities (MBS) through QE purchases. Their stated plan is to reduce their ownership of those securities over the next several quarters. If the Fed continues on their expected path with regard to rates and balance sheet, it creates a significant market adjustment in terms of supply and demand dynamics and further implies that mortgage rates should rise.
The consequences of higher mortgage rates will not only affect buyers and sellers of housing but also make borrowing on the equity in homes more expensive. From a macro perspective, consider that housing contributes 15-18% to GDP, according to the National Association of Home Builders (NAHB). While we do not expect higher rates to devastate the housing market, we do think a period of price declines and economic weakness could accompany higher rates.
This analysis is clinical using simple math to illustrate the relationship, cause, and effects, between changes in interest rates and home prices. However, the housing market is anything but a simple asset class. It is among the most complex of systems within the broad economy. Rising rates not only impact affordability but also the general level of activity which feeds back into the economy. In addition to the effect that rates may have, also consider that the demographics for housing are challenged as retiring, empty-nest baby boomers seek to downsize. To whom will they sell and at what price?
If interest rates do indeed continue to rise, there is a lot more risk embedded in the housing market than currently seems apparent as these and other dynamics converge. The services providing pricing insight into the value of the housing market may do a fine job of assessing current value, but they lack the sophistication required to see around the next economic corner.
Home values have been rising for six straight years, and the gains have been accelerating for the past two years.
The average rate on the 30-year fixed mortgage is nearly a full percentage point higher today than it was in September 2017, its latest low.
Homebuyer demand may be weakening. A monthly survey from Redfin found fewer potential buyers requesting home tours or making offers.
Home values have been rising for six straight years, and the gains have been accelerating for the past two years. Unlike the last housing boom, the gains are not driven by fast and easy mortgage money, but instead by solid buyer demand and very low supply. Still, like the last housing boom, some are starting to warn these price gains cannot continue.
“The continuing run-up in home prices above the pace of income growth is simply not sustainable,” wrote Lawrence Yun, chief economist for the National Association of Realtors, in response to the latest price reading from the much-watched S&P CoreLogic Case Shiller Home Price Indices. “From the cyclical low point in home prices six years ago, a typical home price has increased by 48 percent while the average wage rate has grown by only 14 percent.”
Yun also pointed to rising mortgage interest rates as a factor that would weaken affordability. The average rate on the 30-year fixed mortgage is nearly a full percentage point higher today than it was at its most recent low in September 2017.
Some argue that despite weakened affordability, demand is just so strong that it can support higher home prices. Improving economic factors are seeing to that.
“A generally strong economy and favorable demographic tailwinds driven by the huge millennial generation aging into their home buying prime will help ensure that demand stays high, even as prices rise,” wrote Aaron Terrazas, senior economist at Zillow. “Getting a mortgage remains incredibly affordable compared to paying rent each month.”
But he admits that the “advantage is starting to erode, as mortgage interest rates rise alongside prices and income growth lags behind.”
Weakening Demand
And demand may in fact be weakening. A monthly survey from Redfin found fewer potential buyers requesting home tours or making offers.
“April was the first time in 27 months that we saw a year-over-year decline in the number of customers touring homes,” said Redfin’s chief economist, Nela Richardson. “We believe this was driven by the low levels of new listings in March.”
Richardson points to an increase in new listings in April is a positive turn for home buyers, which could bode well for futures sales. Prices, however, still stand in the way, and the increased inventory was more pronounced in higher-priced tiers.
Meanwhile the home price gains are widest on the low end of the market, where supply is leanest. That is why home sales have been dropping most on the low end. Evidence is now mounting that a growing number of first-time buyers are giving up and dropping out of the market altogether. Sales to first-time buyers dropped 2 percent in the first quarter of this year compared with the first quarter of 2017, according to Genworth Mortgage Insurance.
“This quarter’s decline in first-time home buyer sales reflects a slowdown in cyclical momentum as the first-time home buyer market approached its historical norms. It also reflects a shortage of available homes priced at or below the median first-time home buyer market price of $250,000,” wrote Tian Liu, Genworth’s chief economist. “Supply pressures will continue to drive price appreciation and freeze out a large percentage of the 2.7 million first-time home buyers who are still missing from the market.”
Competition from all-cash investors continues to thwart first-time buyers, most of whom are reliant on mortgage financing. With so little supply available, bidding wars are the rule, rather than the exception.
“When you’re competing against 10 other offers, you have to stand out, so sometimes a letter to the sellers can pull on the emotional heartstrings, but really it’s all about the dollars,” said Karen Kelly, a real estate agent with Compass in the Washington, D.C., area.
Measuring Affordability
Half of the homes on the market in D.C. in April sold in eight days or less, according to the Greater Capital Area Association of Realtors. Home prices in D.C. were over 13 percent higher in April of this year compared with a year ago. The number of listings was down more than 3 percent.
Affordability continues to be a tricky metric to monitor. Some economists argue that housing is no less affordable than it was in the early part of this century, when adjusting for inflation. No question, though, even if home prices are still lower than they were during the last housing boom, adjusting for inflation, the mortgage market today is nothing like it was then.
In fact, affordability was largely meaningless back then, since buyers could put no money down for a home and pay incredibly low monthly payments, using mortgage products that adjusted higher over time and tacked huge costs onto later payments. Those so-called negative amortization loans caused the housing crash and are not offered today.
Thanks to a modest downward revision in February’s print, March’s Case-Shiller 20-City Composite Home Price Index rose at 6.79% YoY – the fastest price appreciation since June 2014.
Surpassing July 2006’s record high…
Broadening out from the 20-City composite, the national home-price gauge climbed 6.5% YoY, matching February’s YoY advance that was the biggest since May 2014.
Of course, since March, interest rates have spiked and along with them mortgage rates, plunging mortgage apps, and as property-price appreciation continues to outpace worker pay (by 3.8 times!), it is proving a disadvantage for younger or first-time buyers even as it means rising homeowner equity for others.
“Months-supply, which combines inventory levels and sales, is currently at 3.8 months, lower than the levels of the 1990s, before the housing boom and bust,” – David Blitzer, chairman of the S&P index committee, said in a statement –
“Until inventories increase faster than sales, or the economy slows significantly, home prices are likely to continue rising.”
All 20 cities in the index showed year-over-year gains, led by a 13 percent increase in Seattle, a 12.4 percent advance in Las Vegas and 11.3 percent pickup in San Francisco.
The next U.S. recession is likely to begin in the first quarter of 2020, according to a poll of 100 economists publishedZillow’s Home Price Expectations Surveyfor the second quarter.
More than half of the survey respondents pointed to monetary policy as the likeliest cause for the next downturn, with only nine of the polled economists predicting that the housing market will be the cause of the next crash. Indeed, most of the economists predicted home values will rise 5.5 percent in 2018 to a median of $220,800. But if the Federal Reserve raises rates too quickly, the economists warned, the economy will start to slow and that could spur a new recession.
“As we close in on the longest economic expansion this country has ever seen, meaningfully higher interest rates should eventually slow the frenetic pace of home value appreciation that we have seen over the past few years, a welcome respite for would-be buyers,” said Zillow Senior Economist Aaron Terrazas. “Housing affordability is a critical issue in nearly every market across the country, and while much remains unknown about the precise path of the U.S. economy in the years ahead, another housing market crisis is unlikely to be a central protagonist in the next nationwide downturn.”
There is a group of bankers for whom “better” means “worse” for everyone else: we are talking, of course, about restructuring bankers who advising companies with massive debt veering toward bankruptcy, or once in it, how to exit from the clutches of Chapter 11, and who – like the IMF, whose chief Christine Lagarde recently said “When The World Goes Downhill, We Thrive” – flourish during financial chaos and mass defaults.
Which is to say that the past decade has not been exactly friendly to the world’s restructuring bankers, who with the exception of two bursts of activity, the oil collapse-driven E&P bust in 2015 and the bursting of the retail “bricks and mortar” bubble in 2017, have been generally far less busy than usual, largely as a result of abnormally low rates which have allowed most companies to survive as “zombies”, thriving on the ultra low interest expense.
However, asMoody’s warned yesterday, and as the IMFcautioned a year ago, this period of artificial peace and stability is ending, as rates rise and as a avalanche of junk bond debt defaults. And judging by their recent public comments, restructuring bankers have rarely been more exited about the future.
Ken Moelis
Take Ken Moelis, who last month was pressed about his rosy outlook for his firm’s restructuring business, describing “meaningful activity” for the bank’s restructuring group.
“Your comments were surprisingly positive,” said JPMorgan’s Ken Worthington,quoted by Business Insider. “Is this sort of steady state for you in a lousy environment? Can things only get better from here?”
Moelis’ response: “Look, it could get worse. I guess nobody could default. But I think between 1% and 0% defaults and 1% and 5% defaults, I would bet we hit 5% before we hit 0%.”
He is right, because as we showed yesterday in this chart from Credit Suisse, after languishing around 1%-2% for years, default rates have jumped the most in 5 years, and are now “ticking higher”
Moelis wasn’t alone in his pessimism: in March, JPMorgan investment-banking headDaniel Pinto saidthat a 40% correction, triggered by inflation and rising interest rates, could be looming on the horizon.
These are not isolated cases where a gloomy Cassandra has escaped from the asylum: already the biggest money managers are positioning for a major economic downturn according to recent research from Bank of America. And while nobody can predict the timing of the next collapse, Wall Street’s top restructuring bankers have one message: it’s coming, and it’s not too far off.
However, the most dire warning to date came from Bill Derrough, the former head of restructuring at Jefferies and the current co-head of recap and restructuring at Moelis: “I do think we’re all feeling like where we were back in 2007,” hetold Business Insider:“There was sort of a smell in the air; there were some crazy deals getting done. You just knew it was a matter of time.”
What he is referring to is not just the overall level of exuberance, but the lunacy taking place in the bond market, where CLOs are being created at a record pace, where CCC-rated junk bonds can’t be sold fast enough, and where the a yield-starved generation of investors who have never seen a fair and efficient market without Fed backstops, means that the coming bond-driven crash will be spectacular.
“Even if there is not a recession or credit correction, with the sheer volume of issuance there are going to be defaults that take place,” said Neil Augustine, co-head of the restructuring practice at Greenhill & Co.
The dynamic is familiar: since 2009, the level of global non-financial junk-rated companies has soared by 58% representing $3.7 trillion in outstanding debt, the highest ever, with 40%, or $2 trillion, rated B1 or lower. Putting this in contest, since 2009, US corporate debt has increased by 49%, hitting a record total of $8.8 trillion, much of that debt used to fund stock repurchases. As a percentage of GDP, corporate debt is at a level which on ever prior occasion, a financial crisis has followed.
The recent glut of debt is almost entirely attributable to the artificially low interest-rate environment imposed by the Federal Reserve and its central bank peers following the crisis. Many companies took advantage and refinanced their debt before 2015 when a large swath was set to mature, kicking the can several years down the road.
But going forward “there’s going to be refinancing at significantly higher rates,” said Steve Zelin, head of the restructuring in the Americas at PJT Partners.
And as theIMF first warned last April, refinancing at higher rates will further shrink the margin of error for troubled companies, as they’ll have to dedicate additional cash flow to cover more expensive interest payments.
“When you have highly leveraged companies and even a modest rise in interest rates, that can result in an increase in restructuring activity,” said Irwin Gold, executive chairman at Houlihan Lokey and co-founder of the firm’s restructuring group.
So with a perfect debt storm coming our way, many restructuring firms have been quietly hiring new employees to be ready when, not if, the economy takes a turn for the worse.
“The restructuring business is a good business during normal times and an excellent business during a recessionary environment,” Augustine said. “Ultimately, when a recession or credit correction does happen, there will be a massive amount of work to do on the restructuring side.” Here are some additional details on recent banker moves from Business Insider:
Greenhill hired Augustine from Rothschild in March to co-head its restructuring practice. The firm also hired George Mack from Barclays last summer to cohead restructuring. The duo, along with Greenhill vet and fellow co-head Eric Mendelsohn, are building out the firm’s team from a six-person operation to 25 bankers.
Evercore Partners in May hired Gregory Berube, formerly the head of Americas restructuring at Goldman Sachs, as a senior managing director. The firm also poached Roopesh Shah, formerly the chief of Goldman Sachs’ restructuring business, to join its restructuring business in early 2017.
“It feels awfully toppy, so people are looking around and saying, ‘If I need to build a business, we need to go out and hire some talent,'” one headhunter with restructuring expertise told Business Insider.
“In our world, people are just anticipating that it’s coming. People are trying to position their teams to be ready for it,” Derrough said. “That was the lesson from last cycle: Better to invest early and have a cohesive team that can do the work right away and maybe be a little bit overstaffed early, so that you can execute for your clients when the music ultimately stops.”
Of course, if the IMF is right (for once), Derrough and his peers will soon see a windfall unlike anything before: last April, the International Monetary Fund predicted that some 20%, or $3.9 trillion, of the total global corporate debt is in danger of defaulting once rates rise.
Although if and when that day comes, perhaps a better question is whether companies will be doing debt-for-equity swaps, or fast forward straight to debt-for-lead-gold-and canned food…
July 6, 2016 marks the point when the US government’s condition became irretrievably terminal. On that date the US Treasury’s 10-year note yield hit its low, 1.34 percent, and has been trending irregularly higher ever since. Historically, debt has been the life support for regimes in extremis. No regime has ever been more in debt than the US government. Its annual deficit and debt service expense are growing, old-age pension and medical programs face a demographic crunch, and now interest rates are rising. One way or the other, the government walking away from some or all of its promises is as set in stone as anything in this life can be.
Gold Surges To Record In Turkey and Other Emerging Markets as Currencies Collapse
Turkey’s election angst, geopolitical risk and collapse of the lira is driving up demand for gold
Turkish lira has collapsed versus gold and now the lowest on record (see chart)
Significant demand for gold coins in Turkey and central bank has repatriated gold and added to gold reserves
“Having the gold physically at home allows countries to feel like they are in control of their reserves” Dr Brian Lucey
Gold acting as a hedge and has been “expensive” not to own gold in Turkey, Syria, Venezuela, Argentina, Angola, Russia and many other countries in the Middle East, Asia, South America, Africa and Europe (see table of worst performing currencies in 2018 including the Swedish krona)
With just a month until elections, shopkeepers at Turkey’s biggest bazaar say they’re seeing a jump in demand for gold coins.
“Turkish people have an interesting behavior — they buy gold when the prices are rising, they think it’s gonna rise more,” said Gokhan Karakan, 32, who runs a gold exchange office in the heart of Istanbul’s Grand Bazaar. “People think there is a trend here and choose to buy gold until uncertainty is out of the way.”
On Friday afternoon, at the Grand Bazaar — one of the world’s oldest covered markets — shopkeepers said more customers were buying gold, instead of selling it, in hopes that the metal will keep its worth as the value of the lira plunges.
Gold priced in lira is more “expensive” than ever, but that’s not deterring buyers, who are looking for asafe haven.
“Turkish people love gold,” said Tekin Firat, 30, who owns and runs a gold store the bazaar. “People think that it will never lose in the long run.”
Citizens are buying up gold as the lira plunges in latest currency crisis. Recep Tayyip Erdogan, who’s about to launch a re-election campaign that may provide the toughest electoral test of his 15 years in power, is an outspoken advocate of cheap money. He’s up against investors demanding higher returns to fund an economy beset by inflation and a swollen current account deficit.
Gold has a special importance in Turkey. The country is to home the ancient kingdom of Lydia, where the earliest knowngold coinageoriginated in the 7th century B.C.
Turkey imported 118 metric tons of bullion, worth $5 billion at today’s prices, in first four months of this year, the most over that period, according todatagoing back to 1995 from the Istanbul Gold Exchange. Last year, imports reached a record.
It’s not just consumers that are snapping up gold. Official reserves have also increased over the past year. The central bank doesn’t comment on its gold strategy, but previously said the changes in its holdings are part of an effort to diversify its reserves.
The reported figure may be misleadingly high because the central bank allows commercial banks to deposit gold as part of their reserves. The government last year launched a campaign to get more “under-the-pillow gold” into the formal banking system. About half of the 216 ton inflow since the start of 2017 can be attributed to this alternative source, according to Matthew Turner, a strategist at Macquarie Group Ltd. in London.
Even so, the purchases have happened a year after Erdogan urged Turks to convert their foreign currency savings into liras and gold, and tensions with the U.S. reached a new low.
“The central bank certainly has been more active in the gold market,” said Turner. “It seems the government would like a larger share of its reserves in assets that’s not related to the U.S. dollar.”
In 2017, the central bank withdrew of its 28.7 tons of gold, worth about $1.2 billion, from Federal Reserve vaults. It didn’t say where the gold went, but holdings increased at Borsa Instanbul, the Bank of England and Bank of International Settlements, according to a report released in April.
The decision for any country to withdraw gold from U.S. vaults is rare — happening only a handful of times in the past decade. Since 2011, Germany, the Netherlands, Hungary and Venezuela have repatriated their gold holdings from the U.S.
Turkey’s decision to withdraw gold may have been a reaction to U.S. court cases against Turkish banks for alleged deals struck with Iran, said Cagdas Kucukemiroglu, a Middle Eastern gold analyst at research firm Metals Focus.
“Having the gold physically at home allows countries to feel like they are in control of their reserves,” said Brian Lucey, a professor of finance at Trinity Business School in Dublin.
Some months ago (October-November, 2017) we wrote that the directors of theCalifornia Association of REALTORS® (CAR) had voted to support a signature drive with the intention of placing a CAR-sponsored initiative on the November 2018 California ballot.
The initiative, if passed, would allow “individuals 55 years of age and older to transfer their property tax basis to any home in the state, to purchase any price home, and to transfer their basis as many times as they wish.”
To appreciate the significance of this, it is necessary to have some idea of California’s property tax system. Property tax valuations are based on purchase price. You buy a house for $700,000, the assessor will value it at $700,000. After that, increases in property tax value are severely limited by formula. A home that was purchased for $500,000 five years ago could still be valued, for tax purposes, in the $500,000 range, even if its actual market value had increased to $700,000.
If you have lived in the same home for 15 — 20 years or more, you are probably enjoying relatively low property taxes because they are based on your low tax valuation. When contemplating a move, one of the things you have to think about is what your new property taxes might be, as they will be based on the purchase price of your new home. The effect of this has been to discourage people from moving down, e.g. from the 4-bedroom family home to a new 2-bedroom in a senior community, because the latter might result in significantly higher property taxes.
Californians sought to solve this problem in 1986 with the passage of Proposition 60. It allowed seniors to keep their property tax base assessment when they moved within the same county. However, in 1988, Proposition 90 was passed which allowed each individual county the option of participating in this tax base transfer by seniors who move from one county to another. This had great significance, because many retirees move to a different county (e.g. in the mountains, or desert) than the ones in which they had lived.
Only eleven of California’s 58 counties will allow a senior from another county to transfer his or her old property tax base to a newly-acquired home in that county. It is estimated that 75% of California homeowners over the age 55 are still living in the same home they lived in since the year 2000. That is not because they still love living there. It is because of the tax consequences.
Suppose that Mr. and Mrs. Baby Boomer bought a home in 2001 for $400,000. It was taxed on a value of $400,000 the first year. Its value for property tax purposes could only increase 2% per year. So now it might have a taxable value of $560,000. At a Proposition 13 tax rate of 1%, that is $5,600, even though the house might now have a market value of $900,000.
If Mr. and Mrs. Boomer sought to move down in size, they might buy a nice (not fantastic) two-bedroom which could cost them $700,000. Under current law their taxes would increase by $1,400 to $7,000.
However, if the CAR tax initiative were in effect, their tax value would be proportionately the same to actual value as with their previous home. In this case, it would be 62%, and their property tax would be $4,340. It would be $2,660 less than it would under current law.
No wonder the initiative garnered more than one million signatures to put it on the ballot (585,407 was the required number). It’s the best idea since sliced bread, right? Well, no; not in everyone’s eyes.
Ballot initiatives are accompanied by a report of the Legislative Analyst’s Office (LAO). In this case the LAO painted a bleak picture of the initiative’s impact on tax revenues. According to one briefing paper, the initiative would result in a $150 million loss for cities and counties and special districts, and another $150 million loss for school districts in the first years. Ultimately, it would grow to a total of $2 billion in losses.
It now appears that the LAO analysis has generated significant opposition to the initiative by city and county governments as well as teacher unions and firefighter associations.
CAR argues that the LAO analysis is flawed because it looks at the potential revenue lost because of the tax savings, but it doesn’t account for the revenue gained as a result of the senior’s home now having a new, increased tax base. It is a “static” analysis rather than a dynamic one.
Now, all of this could be sorted out through an extensive educational campaign; but that costs money, lots of money. It has been estimated that strong opposition could push the costs of backing the initiative into the $90 million range. Frankly, CAR doesn’t have that kind of money lying around.
At their recent meetings (Sacramento, May 2 — 5), CAR directors voted to pursue an alternative to the ballot initiative as well. It would be to seek support to have the legislature place the issue on the ballot in 2020. By seeking such legislative support, CAR would be able to free up resources to address other crucial issues in 2018. Whether this alternative will be possible won’t be known until late June. Stay tuned.
Purchases fell in three of four regions, including a 2.9 percent decline in the South and a 3.3 percent drop in the West
Notably, while single-family home sales decreased 3 percent last month to an annual rate of 4.84 million, purchases of condominium and co-op units rose 1.6 percent to a 620,000 pace.
On a YoY basis, it looks like we have hit peak housing…
“Since NAR began tracking this data in May 2011, the median days a listing was on the market was at an all-time low in April, and the share of homes sold in less than a month was at an all-time high.”
The median existing-home price for all housing types in April was $257,900, up 5.3 percent from April 2017 ($245,000). March’s price increase marks the 74th straight month of year-over-year gains, but price growth is slowing…
And just like new home sales, all the positives are at the higher-end…
“We are seeing no breakout in home sales,” Lawrence Yun, NAR’s chief economist, said at a press briefing accompanying the report. “We are stuck in this narrow range at a time when the economy is doing well.”
“However, inventory shortages are even worse than in recent years, and home prices keep climbing above what many home shoppers can afford,” Yun said in a statement.
There’s an old saying on Wall Street that when times are good, you should focus on the return on your capital, but when times are bad, you should only care about the return of your capital. A flight to quality asset then is anything that tends to go up in times of turmoil because investors perceive it as a safe place to park their money.
Upon first glance, Bitcoin is a terrible candidate for such a role. It’s volatile, hard to understand, and difficult to access given how it exists outside of the traditional banking system.
So why would anyone consider it desirable during a crisis? Because it exists outside of the traditional banking system.
One of the first parabolic up-moves for the cryptocoin began with a banking crisis in Cypress. Back in 2013, while still reeling from the aftermath of the financial crisis, the tiny Mediterranean country found its banking systemteetering, and reached out to the bigger European powers for help.
But instead of offering them a bailout, the EU came back with something more along the lines of a bail-in, as it demanded that Cypriot banks confiscate a portion of their customers deposits to shore up their balance sheets. To add insult to injury, they also imposed capital controls that prevented people from moving their money to a safer jurisdiction.
As you can see on the chart below, a decentralized form of money like Bitcoin, despite its drawbacks, can suddenly look very appealing when the centralized system starts to falter.
Crypto skeptics who tell us that digital money should not be worth anything often forget that fiat money like the Euro is also in of itself worthless. It’s only valuable when someone else is willing to trade a good or service for it. But you can’t get anything in exchange for money that the government is taking or locking up, which is why the Cypriot crisis brought a lot ofattentionto the then relatively unknown Bitcoin.
Government officials don’t like cryptocurrency because they transfer the sovereignty of money from their control to a decentralized consensus mechanism, a transfer that they view as a downgrade in the quality of money. If our existing system of money and banking was always stable, they would have a point.
Buteverytimethereis acrisis, it reminds the public that the folks in charge are not as smart as they think they are. When those same leaders respond to the crisis withdraconian capital controls (or selective bailouts for theironceandfutureemployers on Wall Street) they remind the public that they aren’t as fair as they think they are, either. Bitcoin might be volatile and hard to understand, but it’s always fair, because math does not discriminate, nor does it change the rules when people start to panic.
So why bring this issue up now?Because there is financial trouble brewing in certain corners of the global financial system, and if things continue to deteriorate, this year might serve as an important test of the crypto economy.
IranandVenezuelaare in the midst of the kinds of hyper inflationary currency death spirals that bring societies to their knees. In Argentina, the peso hasfallento an all-time low against the dollar as inflation and interest rates spike. Turkey is having problems ofits own, and China continues to do everything it can to prevent its citizens from liberating their own money.
Some of this weakness was to be expected, because the Federal Reserve is now removing the liquidity it has provided for the past decade. But there’s a bigger issue in play, as the perennial economic mismanagement of developing nations is now rubbing up against the increasing political instability (Brexit, Trump, Catalonia, Five Star) of developed ones.
In the old days, the two best candidates for flight to quality assets were gold and the Dollar. But the former is hard to get a hold of and even harder to store, and the latter is no panacea either. When the Argentinian government last devalued its currency back in 2001, it first forced all local banks to convert the dollar-denominated accounts of its citizens to the Peso. Even the citizens that were smart enough not to trust the local currency had their savings destroyed, learning the valuable lesson that dollars in the bank is not the same as dollars under the mattress.
One of the most important takeaways from past financial crisis is that when the stuff hits the fan, banks are nothing more than a policy tool for the government.
So can a cryptocurrency like Bitcoin be considered a flight to quality asset for certain countries? Given everything we’ve learned in the past 20 years, a better question to ask might be how could it not.
The city of San Francisco is seeking $5.5 million from two Airbnb owners who illegally rented out 14 apartments for nearly one year. They made more than $700,000 from the illegal rentals.
Darren and Valerie Lee own 45 apartments in 17 buildings across the city. San Francisco law restricts building owners to one short-term rental per building — and that apartment must be the owner’s home. According to the city’s lawyer, 14 of the Lees’ apartments were short-term rentals, rented under the names of friends and associates who pretended to be genuine tenants.
During inspection, the couple went through elaborate motions to make it appear like people actually lived there. But it was evident that it was a fraud.
“Every apartment had the same staging: the same Costco food items scattered about, the same arrangement of dirty breakfast dishes in every kitchen sink, same personal products in each bathroom, same damp towels artfully draped over doors as though someone had recently showered, the same collection of shoes and clothes in closets, and same houseplants in each apartment,”city lawyers wrotein the court filing.
The motion to the court seeks a penalty of $750 for every day that each apartment was available and $1,500 for every day that an apartment was rented. The penalty comes out to a grand total of $5.5 million. (Under state law, the penalty could have beenas high as $30 million.)
San Francisco first sued the Lees in 2014 when they evicted tenants to turn their building into a collection of rentals to list on Airbnb. A year later, they settled for $276,000 and a promise to abide by short-term rental law.
The couple’s “greed, fraud and deceit was breathtaking,” city attorney Dennis Herrera said in a statement.
The case will be heard in court on June 12.
Airbnb did not immediately respond to request for comment.
I know Kung Foo, Karate, Bond Yields and forty-seven other dangerous words.
– The Wizard
For forty-four years I have trafficked in the bond markets. I have seen massive inflation, Treasury yields in the stratosphere and risk asset spreads that could barely be included on a chart. At four investment banks I ran Capital Markets, and was on the Board of Directors of those companies, and I have witnessed both extreme anger and one fist fight. It is funny, you know, how people behave when money is sitting there on the table.
One of the things rarely discussed in the Press are the mandates of money managers. Almost no one is unconstrained and virtually everyone is bound by regulations, the tax laws and FINRA and SEC stipulations. Life insurance companies and casualty companies and money managers and Trust Departments and everyone is sidled with something. There are no escapes from the dilemmas.
The markets are a random lottery of meaningless tragedies, a couple of wins and a series of near escapes. So, I sit here and I smoke my cigars, staring raptly at it all. Paying very close attention.
There are two issues, in my mind, to be considered carefully when assessing future interest rates. The first is supply, especially the forward borrowing by the U.S. government. “It’s supply,” Michael Schumacher, head of rate strategy at Wells Fargo (NYSE:WFC), told CNBC’s Futures Now. “When you think about the enormous amount of debt that U.S. Treasury’s got to issue over not just this year, frankly, but next year, it’s staggering,” he said.
Using Michael’s calculations, the Treasury will issue more than $500 billion in notes and bonds in the second to the fourth quarter, pushing the total to around $650 billion for the year. Last year, the total came to just $420 billion. That is approximately a 35% increase in issuance. This raises a fundamental question, who are going to be the buyers and at what levels?
The second issue centers on the Fed and what they might do. They keep calling for rate hikes, like it is a new central bank mantra, and they are increasing the borrowing costs of the nation, corporations and individuals, as a result. I often wonder, in their continual clamor for independence, just who they represent.
You might think that the ongoing demand for higher yields does not exactly help the Treasury’s or the President’s desire to grow the economy as the Fed moves in the opposite direction and tries to slow it down by raising rates. I have often speculated that there might be some private tap on the shoulder, at some point, but no such “tap” seems to have taken place or, if it has occurred, it is certainly being ignored, at least in public.
Here are some interesting questions to ponder:
How much of our U.S. and global growth is real?
How much of it, RIGHT NOW, is still being manufactured by the Fed’s, and the other central banks’, “Pixie Dust” money?
Does the world seem honestly ready to economically walk on its own two feet?
If you answered “No,” to the last question, how do you believe the financial markets will react when they realize that the Central Banks are trying to take away the safety net for the global economies?
Are you really worried about inflation running away from us?
Do you believe that a flat/inverted yield curve has been an accurate predictor of events to come, historically?
Have you run the numbers, can the world’s sovereign nations even afford 4% rates, as predicted by many?
If you answered “No,” do you believe that these nations will suppress yields for as long as they can to push back the “end game?”
Across the pond Reuters states,
Italy’s two anti-establishment parties agreed the basis for a governing accord on Thursday that would slash taxes, ramp up welfare spending and pose the biggest challenge to the European Union since Britain voted to leave the bloc two years ago.
That is quite a strong statement, in my opinion. There are plenty of reasons to be worried about Italy and the European Union now, in my view.
A draft of the accord, reviewed by Reuters, lays out a plan to cut taxes, increase welfare payments and rescind the recent pension reforms. To me, this seems incompatible with the EU’s rules and regulations. These new policies would cost billions of euros and would certainly raise Italy’s debt to GDP ratio, which already stands at approximately 132%. Reuters also states,
The plan promised to introduce a 15 percent flat tax rate for businesses and two tax rates of 15 and 20 percent for individuals – a reform long promoted by the League. Economists say this would cost well over 50 billion euros in lost revenues.
Ratings agency DBRS has already warned that this new proposal could threaten Italy’s sovereign credit rating. If you have been to Rome, you probably visited the Coliseum. I make an observation today:
Over 80% Of 2017 IPO’s Had ‘Negative’ Earnings – Most Since Dot-Com Peak
2017 was a banner year for many things – record low volatility, record high complacency, and record amounts of money printed by the world’s biggest central banks, among many others.
All of which heralded the belief in the super-human, ‘can-do-no-wrong’ venture capitalist… and of course the ‘exit’ cash-out moment.
108 operating companies went public in the U.S. in 2017 with the average first day return a healthy 15.0% – well above the average 12.9% bump seen since the start of the 21st century.
But of most note in years to come, we suspect, is the fact that over 80% of IPOs in 2017 had negative earnings… the most since the peak of the dot-com bubble in 1999/2000…
Put a slightly different way, 2017 was the biggest “money for nothing” year since Pets.com… consider that the next time you’re told to buy the dip. Remember the only reason “the water is warm” is because it has been ‘chummed’ by the the last greater fool ready for the professional sharks to hand their ‘risk’ to…
A California tax department where almost a third of managers are related to another employee is unwinding nepotistic chains of supervision six months after a state audit revealed a problematic concentration of personal relationships among staff.
California Department of Tax and Fee Administration Director Nicolas Maduros reported on Thursday that 141 of his department’s 484 managers has a familial or otherclose personal relationship to another employee.
A handful of those relationships appear to violate the department’s new anti-nepotism policy. Maduros said the department has corrective action plans for 17 of the managers whose relationships present conflicts for the organization.
“We are still working through this,” he told the State Personnel Board.
His department defines nepotism as “any relationship so personal that other CDTFA employees may reasonably perceive that one of the employees may be motivated to treat the other one more favorably than other employees. That includes, but is not limited to, any familial relationship established by blood, adoption, marriage, or registered domestic partnership.” It also includes roommates.
Maduros’ presentation was intended to follow up on the audit’s findings.
“You all have stepped up. You have done a great job,” State Personnel Board member Richard Costigan told him.
The nepotism audit was among the last in a series of critical reports on the Board of Equalization that resulted in the Legislaturegutting the tax-collecting agencyand creating the new California Department of Tax and Fee Administration.
His latest report on nepotism disclosed the number of managers and supervisors who have relatives on staff. The department is addressing those conflicts first, and could later move to address close relationships among rank-and-file workers.
The department also is considering whether a job or promotion candidate has a relative on staff when it makes personnel decisions.
“It’s going to take us time,” he said.
At least one investigation into the former Board of Equalization might still be underway.
Gov. Jerry Brown last year asked Attorney General Xavier Becerra to investigate the tax agency. Staff members from the Board of Equalization told The Bee that they were interviewed by Department of Justice agents.
Neither Brown nor Becerra has released a report. The Attorney General’s Office last month rejected a Public Records Act request from The Sacramento Bee seeking the document. The denial said the review was not complete.
It also said the document would not be releasable through the Public Records Act when it is complete. It said the documents would be exempt because they are “attorney-client privileged records.” The governor is the client.
Last week, I mentioned an insightful comment my friend Peter Boockvar—CIO of Bleakley Advisory Group—made at dinner in New York: “We now have credit cycles instead of economic cycles.”
That one sentence provoked numerous phone calls and emails, all seeking elaboration. What did Peter mean by that statement?
In an old-style economic cycle,recessions triggered bear markets. Economic contraction slowed consumer spending, corporate earnings fell, and stock prices dropped. That’s not how it works when the credit cycle is in control.
Lower asset prices aren’t the result of a recession.They cause the recession. That’s because access to credit drives consumer spending and business investment.
Take it away and they decline. Recession follows.
The Debt/GDP ratio could go higher still, but I think not much more. Whenever it falls, lenders (including bond fund and ETF investors) will want to sell. Then comes the hard part: to whom?
You see, it’s not just borrowers who’ve become accustomed to easy credit. Many lenders assume they can exit at a moment’s notice. One reason for the Great Recession was so many borrowers had sold short-term commercial paper to buy long-term assets.
Things got worse when they couldn’t roll over the debt and some are now doing exactly the same thing again, except in much riskier high-yield debt. We have two related problems here.
Corporate debt and especially high-yield debt issuance has exploded since 2009.
Tighter regulations discouraged banks from making markets in corporate and HY debt.
Both are problems but the second is worse. Experts tell me that Dodd-Frank requirements have reduced major bank market-making abilities by around 90%. For now, bond market liquidity is fine because hedge funds and other non-bank lenders have filled the gap.
The problem is they are not true market makers. Nothing requires them to hold inventory or buy when you want to sell. That means all the bids can “magically” disappear just when you need them most.
These “shadow banks” are not in the business of protecting your assets. They are worried about their own profits and those of their clients.
Gavekal’s Louis Gave wrote a fascinating article on this last week titled, “The Illusion of Liquidity and Its Consequences.” He pulled the numbers on corporate bond ETFs and compared them to the inventory trading desks were holding—a rough measure of liquidity.
Louis found dealer inventory is not remotely enough to accommodate the selling he expects as higher rates bite more.
We now have a corporate bond market that has roughly doubled in size while the willingness and ability of bond dealers to provide liquidity into a stressed market has fallen by more than -80%. At the same time, this market has a brand-new class of investors, who are likely to expect daily liquidity if and when market behavior turns sour. At the very least, it is clear that this is a very different corporate bond market and history-based financial models will most likely be found wanting.
The “new class” of investors he mentions are corporate bond ETF and mutual fund shareholders. These funds have exploded in size (high yield alone is now around $2 trillion) and their design presumes a market with ample liquidity.
We barely have such a market right now, and we certainly won’t have one after rates jump another 50–100 basis points.
Worse, I don’t have enough exclamation points to describe the disaster when high-yield funds, often purchased by mom-and-pop investors in a reach for yield, all try to sell at once, and the funds sell anything they can at fire-sale prices to meet redemptions.
In a bear market you sell what you can, not what you want to. We will look at what happens to high-yield funds in bear markets in a later letter. The picture is not pretty.
Leverage, Leverage, Leverage
To make matters worse, many of these lenders are far more leveraged this time. They bought their corporate bonds with borrowed money, confident that low interest rates and defaults would keep risks manageable.
In fact, according to S&P Global Market Watch, 77% of corporate bonds that are leveraged are what’s known as “covenant-lite.” That means the borrower doesn’t have to repay by conventional means.
Somehow, lenders thought it was a good idea to buy those bonds. Maybe that made sense in good times. In bad times? It can precipitate a crisis. As the economy enters recession, many companies will lose their ability to service debt, especially now that the Fed is making it more expensive to roll over—as multiple trillions of dollars will need to do in the next few years.
Normally this would be the borrowers’ problem, but covenant-lite lenders took it on themselves.
All those reduce growth and, if widespread enough,lead to recession.
Let’s look at this data and troubling chart fromBloomberg:
Companies will need to refinance an estimated $4 trillion of bonds over the next five years, about two-thirds of all their outstanding debt, according to Wells Fargo Securities.
This has investors concerned because rising rates means it will cost more to pay for unprecedented amounts of borrowing, which could push balance sheets toward a tipping point. And on top of that, many see the economy slowing down at the same time the rollovers are peaking.
“If more of your cash flow is spent into servicing your debt and not trying to grow your company, that could, over time—if enough companies are doing that—lead to economic contraction,” said Zachary Chavis, a portfolio manager at Sage Advisory Services Ltd. in Austin, Texas. “A lot of people are worried that could happen in the next two years.”
The problem is that much of the $2 trillion in bond ETF and mutual funds isn’t owned by long-term investors who hold maturity. When the herd of investors calls up to redeem, there will be no bids for their “bad” bonds.
But they’re required to pay redemptions, so they’ll have to sell their “good” bonds. Remaining investors will be stuck with an increasingly poor-quality portfolio, which will drop even faster.
Wash, rinse, repeat. Those of us with a little gray hair have seen this before, but I think the coming one is potentially biblical in proportion.
Dakota Access Pipeline protesters chant outside of the Wells Fargo Bank at Westlake Center in January 2017. The city of Seattle has renewed its contract with Wells Fargo, after it could get no other takers for its banking business. (Lindsey Wasson / The Seattle Times)
Seattle split with Wells Fargo a year ago in protest over the bank’s investments in the Dakota Access Pipeline and fraud scandals. But the two are together again after the city could find no other bank to take its business.
The city of Seattle will keep banking with Wells Fargo & Co. after it could get no other takers to handle the city’s business.
The City Council in February 2017 voted 9-0 to pull its account from Wells Fargo, saying the city needs a bank that reflects its values.
Council members cited the bank’s investments in the Dakota Access Pipeline, as well as a roiling customer fraud scandal, as their reasons to sever ties with the bank.
Some council members declared their vote as a move to strike a blow against not only Wells Fargo, but “the billionaire class.”
“Take our government back from the billionaires, back from [President] Trump and from the oil companies,” Council member Kshama Sawant said at the time.
The contract was set to expire Dec. 31, but as finance managers for the city searched for arrangements to handle the city’s banking,it got no takers, said Glen Lee, city finance director. That was even after splitting financial services into different contracts to try to attract a variety of bidders, including smaller banks.
In the end, there were none at all.
It became clear this was our best and only course of action,” Lee said of the city’s decision to stick with Wells Fargo after all.
The first sign that it would be hard to make the council’s wish a realitycame soon after the votewhen Wells Fargo too-hastily informed the city it could sever its ties immediately with no penalty for breaking the contract. The bank even promised to help the city find a new financial partner.
But it quickly became clear how hard that would be as the city reworked its procurement specifications and searched for months.
Yesterday when looking at the latest MBA Mortgage Application data, we found that, as mortgage rates jumped to the highest level since 2011, mortgage refi applications, not unexpectedly tumbled to the lowest level since the financial crisis, choking off a key revenue item for banks, and resulting ineven more painfor the likes of Wells Fargo.
Today, according to the latest Freddie Mac mortgage rates report, after plateauing in recent weeks, mortgage rates reversed course and reached a new high last seen eight years ago as the 30-year fixed mortgage rate edged up to 4.61% matching the highest level since May 19, 2011.
But while the highest mortgage rates in 8 years are predictably crushing mortgage refinance activity, they appears to be having the opposite effect on home purchases, where there is a sheer scramble to buy, and sell, houses. AsBloomberg notes, citing brokerage Redfin, the average home across the US that sold last month went into contract after a median of 36 only days on the market – a record speed in data going back to 2010.
To Sam Khater, chief economist of Freddie Mac, this was a sign of an economy firing on all cylinders: “This is what happens when the economy is strong,” Khater told Bloomberg in a phone interview. “All the higher-rate environment does is it either causes them to try and rush or look at different properties that are more affordable.”
Of course, one can simply counter that what rising rates rally do is make housing – for those who need a mortgage – increasingly more unaffordable, as a result of the higher monthly mortgage payments. Case in point: with this week’s jump, the monthly payment on a $300,000, 30-year loan has climbed to $1,540, up over $100 from $1,424 in the beginning of the year, when the average rate was 3.95%.
As such, surging rates merely pulls home demand from the future, as potential home buyers hope to lock in “lower” rates today instead of risking tomorrow’s rates. It also means that after today’s surge in activity, a vacuum in transactions will follow, especially if rates stabilize or happen to drop. Think “cash for clunkers”, only in this case it’s houses.
Meanwhile, the short supply of home listings for sale and increased competition is only making their purchases harder to afford: according to Redfin, this spike in demand and subdued supply means that home prices soared 7.6% in April from a year earlier to a median of $302,200, and sellers got a record 98.8% of what they asked on average.
Call it the sellers market.
Furthermore, bidding wars are increasingly breaking out: Minneapolis realtor Mary Sommerfeld said a family she works with offered $33,000 more than the $430,000 list price for a home in St. Paul. The listing agent gave her the bad news: There were nine offers and the family’s was second from the bottom.
For Sommerfeld’s clients, the lack of inventory is a bigger problem than rising mortgage rates. If anything, they want to close quickly before they get priced out of the market — and have to pay more interest.
“I don’t think it’s hurting the buyer demand at all,” she said. “My buyers say they better get busy and buy before the interest rates go up any further.”
Then again, in the grand scheme of things, 4.61% is still low. Kristin Wilson, a loan officer with Envoy Mortgage in Edina, Minnesota, tells customers to keep things in perspective. When she bought a house in the early 1980s, the interest on her adjustable-rate mortgage was 12 percent, she said.
“One woman actually used the phrase: ‘Rates shot up,’” Wilson said. “We’ve been spoiled after a number of years with rates hovering around 4 percent or lower.”
Of course, if the average mortgage rate in the America is ever 12% again, look for a real life recreation of Mad Max the movie in a neighborhood near you…
On the heels of the 10Y treasury yield breaking out of its recent range to its highest since July 2011, this morning’s mortgage applications data shows directly how Bill Gross may be right that the economy may not be able to handle The Fed’s ongoing actions.
As Wolf Richter notes,the 10-year yield functions as benchmark for the mortgage market, and when it moves, mortgage rates move. And today’s surge of the 10-year yield meaningfully past 3% had consequences in the mortgage markets, asMortgage News Dailyexplained:
Mortgage rates spiked in a big way today, bringing some lenders to the highest levels in nearly 7 years (you’d need to go back to July 2011 to see worse). That heavy-hitting headline is largely due to the fact that rates were already fairly close to 7-year highs, although today did cover quite a bit more distance than other recent “bad days.”
The “most prevalent rates” for 30-year fixed rate mortgages today were between 4.75% and 4.875%, according to Mortgage News Daily.
And that is crushing demand for refinancing applications…
Despite easing standards – a net 9.7% of banks reported loosening lending standards for QM-Jumbo mortgages, respectively, compared to a net 1.6% in January, respectively.
According to Wolf Richterover at Wolf Street, the good times in real estate are ending…
The big difference between 2010 and now, and between 2008 and now, is that home prices have skyrocketed since then in many markets – by over 50% in some markets, such as Denver, Dallas, or the five-county San Francisco Bay Area, for example, according to the Case-Shiller Home Price Index. In other markets, increases have been in the 25% to 40% range. This worked because mortgage rates zigzagged lower over those years, thus keeping mortgage payments on these higher priced homes within reach for enough people. But that ride is ending.
And as Peter Reagan writes at Birch Group, granted, even if rates go up over 6%, it won’t be close to rates in the 1980’s (when some mortgage rates soared over 12%). But this time, rising rates are being coupled with record-high home prices that, according to the Case-Shiller Home Price Index, show no signsof reversing (seechartbelow).
So you have fast-rising mortgage rates and soaring home prices. What else is there?
It’s not just home refinancing demand that is collapsing… as we noted yesterday,loan demand is tumbling everywhere, despite easing standards…
Having bounced notably in March, both Housing Starts and Building Permits in April tumbled (-3.7% MoM and -1.78% MoM respectively).
March building permits growth was upwardly revised from +2.5% MoM to +4.1% MoM
March housing starts growth was upwardly revised from +1.9% MoM to +3.6% MoM
Starts dropped 3.7% MoM in April – far worse than the 0.7% drop expected but while permits also dropped 1.8% MoM, this was slightly better than the expected 2.1% drop…
For some context, Starts and Permits remain over 40% below their 2005/6 peaks…
Housing Permits breakdown…
The driver of the tumble in housing starts is a 11.3% plunge in multi-family.. (single-family 893k vs 894k prior and multi-family 374k from 428k)
Three of four regions posted declines in starts, led by a 16.3 percent decrease in the Midwest and a 12 percent drop in the West.
Construction climbed 6.4 percent in the South, reflecting the fastest pace of single-family starts since July 2007.
Havingthrown in the towel on his bond bear market call two weeks ago, Janus Henderson’s billionaire bond investor Bill Gross now believes that the most recent bearish bond price (rise in yields) will stop here as the economy cannot support higher yields.
“Supply from the Treasury is a factor in addition to what the Fed might do in terms of a mild, bearish tone for U.S. Treasury bonds,” Grosstold Bloomberg TV.
“I would expect the 10-year to basically meander around 2.80 to perhaps 3.10 or 3.15 for the balance of the year. It’s a hibernating bear market, which means the bear is awake but not really growling.”
Since then, yields have tested the upper-end of his channel and are breaking out today to their highest since 2011 (10Y)…
and back to their critical resistance levels (30Y)…
And now Gross is out with a pair of tweets (hereandhere) saying that the record bond shorts should not get too excited here…
Bill Gross thinks they won’t be right. He highlights the long-term downtrend over the past 30-years, which comes in a 3.22%.
“30yr Tsy long-term downward yield trend line for the past 3 decades now at 3.22%, only ~4bps higher than today’s yield.”
“Will 3.22% be broken to upside?” he asks.
“I don’t think so. The economy can’t support yields higher than 3.25% for 30s and 10s, nor 3% for 5s.
Continuing hibernating bond bear market is best forecast.”
Asa ForexLive also notes,if he’s right it doesn’t necessarily mean the US dollar will reverse right away but it would be a good sign for stocks and would limit how far the US dollar might run.
So, will Gross be right? Is this latest spike all rate-locks on upcoming IG issuance? And will this leave speculators with a record short position now wondering who will be the one holding the greatest fool bag by the end of the year…
Well worth your time to hear what geo-economic consultant Martin Armstrong has to say.
Consumers, who are already being squeezed by rising interest rates (even as the return on their cash deposits remains anchored near zero), are facing another potential constraint on their already limited purchasing power. And that constraint is rising gasoline prices, which,as we pointed out last month,could erode the stimulative impact of President Trump’s tax plan as rising prices sop up what little money the middle class is saving.
As prices rise and banks scramble to update their forecasts,the Wall Street Journalhas become the latest publication to sound the alarm over what is, in our view, one of the biggest threats facing the US economy in the ninth year of its post-crisis expansion.
In its story warning about $3 a gallon gas (of course, we’re already seeing $4 a gallon in parts of California and other high-tax states), WSJ cited Morgan Stanley’s latest projection that rising gas prices could wipe out about a third of the annual take-home pay generated by the tax cuts.
Rising fuel costs can also feed inflation and pressure interest rates. Even though the Federal Reserve typically looks past volatile energy prices in the short term, higher energy costs help shape consumer confidence. And with the central bank poised to be more active this year, rising energy costs pose an additional risk to the economy.
Morgan Stanley estimates that if gas averages $2.96 this year, it would take an annualized $38 billion from spending elsewhere, an upward revision from the bank’s $20 billion estimate in January. That would wipe out about a third of the additional take-home pay coming from tax cuts this year, the analysts said.
…
Patrick DeHaan, petroleum analyst at GasBuddy”Three dollars is like a small fence. You can get through it, you can get over it,” said Patrick DeHaan, petroleum analyst at GasBuddy, a fuel-tracking app. “But $4 is like the electric fence in Jurassic Park. There’s no getting over that.”
The left-of-center think tank, which of course has every reason to hope that the next recession will materialize on President Trump’s watch, projected that consumers would soon spend about half of the money saved from tax cuts on fuel costs.
And in a report published in April,Deutsche Bank illustrated how rising fuel costswill disproportionately squeeze the most vulnerable among us – a cohort of consumers who already shoulder an outsize share of the country’s household debt.
The FT put it another way…
As the chart above shows, middle-income families – aka the engine of consumption – will be the hardest hit by rising gas prices.
Indeed, small business owners in California, where gas prices are the fifth highest in the nation thanks to taxes and stringent emissions standards, say they’ve seen their energy bills shoot higher in the past few months. Car salesmen say consumers are asking more questions about mileage, according to WSJ.
Robert Lozano, a car salesman in Los Angeles where some gas prices are already above $4, said the dealership’s gas bill has climbed from about $9,000 to about $12,000 a month recently.
Customers are inquiring more about electric vehicles, he said.
“It’s more in the consumer’s mind as to what the most efficient vehicle is.”
With oil already at $70 a barrel, early indicators imply that the summer driving season could see an unusually large spike in demand for gas…
…As the number of Americans intending to take vacations in the next six months climbs to its highest level in decades.
Heightened vacation intentions suggest the number of vehicle miles driven will also climb (because people tend to travel greater distances when they go on vacation). As the chart below shows, fluctuations in miles driven – a close proxy for gas demand – are quickly reflected in prices at the pump.
While the US’s increasing prominence in the oil-export market could soften some of the economic blow as the energy business booms, other large business from airlines to shipping companies would feel the pinch at a time when costs are already rising.
But some economists say the growing importance of energy to the U.S. economy could blunt some of the impact from rising oil prices.
The country has become a more prominent supplier of crude oil and fuel. Domestic production has reached record weekly levels of 10.7 million barrels per day and a lot of it is being exported.
[…]
“People don’t understand how we could double crude oil production” and see higher gas prices, said Tom Kloza, global head of energy analysis at the Oil Price Information Service. “The answer lies in the balance of payment. We are an exporting power right now.”
[…]
Airlines and shipping companies will also be paying more for jet fuel and diesel – costs that may be passed along to consumers. Even companies such as Whirlpool Corp. have noted that higher oil prices have boosted the cost of materials.
Refiner Valero Energy Corp. said it wouldn’t expect consumer demand to drop off until oil prices are at $80 to $100.
But demand is only one factor driving up oil prices. Supply issues have also weighed on oil traders’ minds. Traders pushed oil prices higher as the US pulled out of the Iran deal as some worried that it could impact global supplies (though, as we’ve pointed out, there are plenty of other buyers waiting to step in and buy Iranian crude). Even if the Iranian crude trade isn’t impacted by sanctions,plummeting production capacity in Venezuelacould ultimately have a bigger impact on global supply.
Conflicts in other oil producing regions could also impact supplies, pushing prices higher.
Last week, Bank of America became the first Wall Street bank to call $100/bbl for Brent crude (at the time, it was trading around $77/bbl) in 2019. That could send prices to highs not seen since 2008. Other banks have been scrambling to raise their forecasts as well.
With the Fed changing its language in its latest policy statement to reflect rising inflation expectations, rising oil prices could also inspire the Fed to hike interest rates more quickly for fear that the economy might overheat. That could result in four – or perhaps five – rate hikes this year.
The resulting effect would be like economic kudzu strangling the buying power of consumers and possibly forcing a long-overdue debt reckoning as millennials, who are already drowning in debt, are forced to put off home ownership and family formation until they’re in their late 30s or even their 40s.
One month ago, when discussing the most recent trends in the US subprime auto loan space,ZH revealedhow despite a virtual halt in direct loans by depositor banks to subprime clients following the financial crisis, the US banking sector now has over a third of a trillion dollars in indirect subprime exposure, in the form of loans to non-banks financial firms which in the past decade have become the most aggressive lenders to America’s sub-620 FICO population.
As we further explained, the banks’ total indirect exposure to subprime loans – not just auto loans, but also subprime mortgages, and subprime consumer loans – could be pieced together through public filings, and according to FDIC reports, bank loans to non-banks subprime lenders soared this decade, with the following 5 names standing out:
Wells Fargo: $81 billion, up from $13.4 billion in 2010
Citigroup: $30 billion, up from $4.1 billion in 2010
Bank of America: $30 billion, up from $2.8 billion in 2010
JP Morgan: $28 billion, up from $10.4 billion in 2010
Goldman Sachs: $22 billion
Morgan Stanley: $16 billion
Visually:
But while the supply side of the subprime equation is clearly firing on all cylinders – as only the next crash/crisis will stop desperate yield chasers – things on the demand side are going from bad to worse, and according to thelatest Fitch Autoloan delinquency data, consumers are defaulting on subprime auto loans at a higher rate than during the 2008–2009 financial crisis.
The highly seasonal rate for subprime auto loans more than 60 days past due reached the highest in 22 years – since 1996 – at 5.8%, according to March data; this is well over 2% higher than the comparable March default rate in the low 3%s hit during the peak of the financial crisis a decade ago.
The more recent April data, showed a delinquency rate of 4.3%, higher than the 4.1% last year, and the second highest April on record. Keep in mind, April is the “best” month of the year from a seasonal perspective as that is when the bulk of tax refunds hit, which are then promptly used to repay outstanding bills – it’s all downhill from there… or rather uphill as the chart shows ever higher default rates.
And while delinquencies have been rising, the number of auto loans and leases to subprime borrowers has continued to shrink, falling 10% Y/Y according to Equifax. However, as we showed at the top, it’s not due to supply constraints at the non-bank subprime lenders, the slide in subprime loan volume is all on the demand side: auto-lease origination by subprime customers tumbled by 13.5%.
Meanwhile, asBloomberg reports, the volume of bond sales backed by these loans are likely to remain the same because banks and credit unions don’t turn most of their loans into securities: “ABS is a fraction of the total auto credit market, which is mainly funded on balance sheets,” Wells Fargo analyst John McElravey told Bloomberg in an interview. “If the pullback from subprime is more from the balance-sheet lenders, banks, then maybe securitization keeps moving along.”
Not maybe: definitely. As the following chart show, the percentage of subprime securitization of all auto ABS as a share of total loans has not only surpassed the pre-crisis peak, it is at a new all time high.
Call it the latest “new (ab)normal” paradox: the underlying auto subprime loan market is shrinking fast, and yet the market for subprime auto ABS securitizations has never been stronger.
Subprime-auto asset-backed security sales are on pace with last year at about $9.5 billion compared to $9.6 billion a year ago, according to data compiled by Bloomberg. With new transactions from Santander, GM Financial, Flagship, and Credit Acceptance expected to hit the market this week, volume may exceed 2017’s total of about $25 billion.
And while it is safe to say it will all end in tears – again – as it did a decade ago, with the next recession the catalyst, the shape of the next crash will be very different. As we explained last month, this subprime bond market is vastly different from what it was even a few years ago, let alone during the last crisis as an influx of generally riskier, smaller lenders flooded into it in the post-crisis years, bankrolled by private-equity moneyand funded by big bank loans, pursued the riskiest borrowers in order to stay competitive.
“Neither banks nor credit unions have done ‘deep subprime’ lending,” Gunnar Blix, deputy chief economist at Equifax told Bloomberg. “That’s mainly done by smaller dealer-finance and independent finance companies” who rely almost solely on ABS for funding. According to Bloomberg, only about 10% of $437 billion of outstanding subprime auto loans have been securitized into ABS, according to Wells Fargo, which means that underwriters are generally massively exposed to the subprime auto loan crunch that is already playing out before our eyes, and which will be magnified exponentially in the next recession.
* * *
The latest subprime delinquency data seemed confusing, almost a misprint to Hylton Heard, Senior Director at Fitch Ratings who said that “it’s interesting that [smaller deep subprime] issuers continue to drive delinquencies on the index in an unemployment environment of around 4%, low oil prices, low interest rates — even though they are rising — and a positive economic story overall.” In other words, there is no logical explanation why in a economy as strong as this one, subprime delinquencies should be soaring.
Unless, of course the real, unvarnished, and non-seasonally adjusted economy is nowhere near as strong as the government’s “data” suggests.
Making matters worse, rising interest rates have made interest payment increasingly unserviceable for those subprime borrowers who are currently contractually locked up – hence the surge in delinquency rates – or those consumers with a FICO score below 620 who are contemplating taking out a new loan to buy a car, and suddenly find they could no longer afford it, an ominous development we first described one month ago in “Subprime Auto Bubble Bursts As “Buyers Are Suddenly Missing From Showrooms.“
And even if the subprime bubble hasn’t burst just yet, every incremental 0.25% increase in rates assures it is only a matter of time. For once, St. Louis Fed president James Bullard was not wrong when he warned this morning that he sees Fed policy as the reason behind the flattening of the yield curve, saying that “it’s been the Fed, I think, that has flattened the curve more than worries by investors on the state of the global economy.“
“My personal opinion is the Fed does not need to be so aggressive that we invert the yield curve” he noted, adding that “I do think we’re at some risk of an inverted yield curve later this year or early in 2019,” and “if that happens I think it would be a negative signal for the U.S. economy.”
If he’s correct, it begs the question: why is the Fed seeking to crash the economy and, by implication, the market?
We’ll close with a quote from the last Comptroller of the Currency, Thomas Curry, who during an October 2015 speech said that “what is happening in [the subprime auto lending] space today reminds me of what happened in mortgage-backed securities in the run up to the crisis.” It’s only gotten worse since then.
Today in “free-market capitalism actually benefits consumers” news, rents are being slashed across the board in Queens as landlords make concessions to deal with a supply glut and keep tenants renting. This lowering of rents taking place in Queens – to the tune of 12% YOY –was reported on by Bloombergon Thursday morning:
For New York City apartment hunters, April was another good month to find a deal on rents. But no one fared better than those in northwest Queens.
Rents there dropped 12 percent from a year earlier, to a median of $2,646 a month after landlord giveaways were subtracted, according to a report Thursday by appraiserMiller Samuel Inc.and brokerageDouglas Elliman Real Estate. Those giveaways were offered on 65 percent of all new leases signed in the area, excluding renewals, a record share in data going back to the beginning of 2016.
The result from the price deflation that our Fed pins as the devil incarnate? More renters, more business and higher quality tenants:
The enticements brought in more renters. New leases in northwest Queens — Long Island City, Astoria, Sunnyside and Woodside — jumped 11 percent to 272, the firms said.
“More customers who were originally looking in Manhattan and Brooklyn are considering Queens,” said Hal Gavzie, Douglas Elliman’s executive manager of leasing. “It used to be just 100 percent a different consumer.”
New York City tenants are crossing borders to compare deals in a market groaning under the weight of new supply. Landlords, who’ve accepted they need to compete to keep their units filled, are working to attract new tenants and offering sweeter renewal terms to keep the ones they have, Gavzie said.
Who knew this could happen to industries and sectors where the government is not subsidizing or interfering with the pricing – and where free market capitalism is actually, in some facet, allowed to run its course?
The consumer now has the control because the concessions landlords are making are benefiting the them. Bloomberg continued:
In Manhattan, 44 percent of all new leases came with a landlord concession, such as a free month of rent or payment of broker fees. In Brooklyn, the share was 51 percent, a record for the borough.
Still, the number of new leases in Manhattan and Brooklyn fell 3.5 percent and 1.6 percent, respectively, a sign that renters there found good reason to stay in their current apartments, Gavzie said.
“Tenants negotiating a renewal, they’ve looked around to see what deals they can get,” he said. “So their landlord gives them a sweet offer to stay.”
Manhattan rents in April, after subtracting concessions, fell 2.2 percent, to a median of $3,236, the fifth consecutive month of year-over-year declines. In Brooklyn, where rents have also fallen for five months, the decline was 2.9 percent, to a median of $2,686.
This comes just about one month after we reported about downtown Manhattan basically turning into a ghost towndue to just the opposite – prices rising and government overreach. Pricing out of tenants in some main downtown areas and shopping districts have caused vacancies in areas that have been occupied for decades.
The Fed loves to repeat how necessary and vital inflation is for economic prosperity, but in the case of midtown Manhattan’s “prime” retail real estate, it is doing nothing but helping cause once extremely prominent shopping areas become the very same “ghost towns” they turned into during the 2008 housing crisis.
Mayor DeBlasio’s asinine solution to this issue created in part by faulty government policy: more government and more regulation.
So much for the recovery.
As if brick and mortar retail didn’t have enough problems to deal with being methodically decimated by the ever growing behemoth that is Amazon, store owners are now facing rent that is simply so high it makes it impossible for most to open retail stores and do business in once prominent areas of downtown Manhattan.
If you want to see the future of storefront retailing, walk nine blocks along Broadway from 57th to 48th Street and count the stores.
The total number comes to precisely one — a tiny shop to buy drones.
That’s right: On a nine-block stretch of what’s arguably the world’s most famous avenue, steps south of the bustling Time Warner Center and the planned new Nordstrom department store, lies a shopping wasteland.
To be sure, none of this comes as a surprise to us – or our regular readers – because inlate March we recalled our own 2009 tour of Madison Avenueto discover that it also had turned into a ghost town. Just a week ago we told our readers that the ghost town that was New York’s “Golden Mile” was not surprising: after all the US economy had just been hit with the worst recession since the Great Depression, and only an emergency liquidity injection of trillions of dollars prevented a global financial collapse.
What is more surprising is why nearly 9 years later, at a time of what is supposed to be a coordinated global recovery, a walk along Madison Avenue reveals the exact same picture.
We would love for these two sets of facts to bludgeon the government and regulators over the head and make them realize that inflation isn’t the solution. Rather, they should realize from this that deflation can actually be a reward for capitalism, causing prices to fall, increased competition between sellers, and benefits for buyers.
Wayne Jett, author of “Fruits of Graft”, interviewed by Sarah Westall in an eight part (video) series to discuss in depth the amazing history of events and actions leading up to the Great Depression. They also discuss the activities and actions taken during the Great Depression that caused increased misery for millions of Americans. This is an epic historical view of the Great Depression you have not heard before; that also serves to explain what is really driving most current events we are living through today.
An audible gasp went out in the breakout room I was in at last month’spension eventcosponsored by The Civic Federation and the Federal Reserve Bank of Chicago. That was when a speaker from the Chicago Fed proposed levying, across the state and in addition to current property taxes, a special property assessment they estimate would be about 1% of actual property value each year for 30 years.
Evidently, that wasn’t reality-shock enough. This week the Chicago Fed published that proposal formally. It’slinked here.
It surely ranks among the most blatantly inhumane and foolish ideas we’ve seen yet.
Homeowners with houses worth $250,000 would pay an additional $2,500 per year in property taxes, those with homes worth $500,000 would pay an additional $5,000, and those with homes worth $1 million would pay an additional $10,000.
Is the Chicago Fed blind tohuman consequences? Confiscatory property tax rates have already robbed hundreds of thousands, maybe millions, of Illinois families of their home equity — probably the lion’s share of whatever wealth they had.
Property taxes in many Illinois communitiesalready exceed3%, 4% and even 5% of home values. Across Illinois, the average is a sky-high 2.67 percent, thehighest in the nation.
In south Cook County theyalready average over 5%. Most of those communities are working class, often African-American. The Fed says maybe you could make the tax progressive by exempting lower values, but that’s very difficult to do and, if you did somehow exempt the poor and working class, the bill pushed to the others would be astronomical.
Those rates have already plunged many communities intodeath spirals, demanding an immediate solution, but the Chicago Fed apparently wants to pour on more of the accelerant.
Don’t they understand that people won’t build on or improve property when property taxes are that high? When taxes are 3 percent to 6 percent, any value you add to your home is going to be taxed at that high rate forever. Have they never been to our communities with countless dis-repaired, abandoned homes and commercial properties, which are the result?
Get this, which is part of the Fed’s reasoning: “New taxes wouldn’t affect people thinking of moving to Illinois. While they would have to pay higher property taxes, that would be offset by not having to pay as much for their new homes. In addition, current homeowners would not be able to avoid the new tax by selling their homes and moving because home prices should reflect the new tax burden quickly.”
In other words, just confiscate wealth from current owners because they will pay, whether they stay or not, through an immediate reduction in home value.
This proposed tax would only address the five state pensions. What about the other650-plus pensionsin Illinois, particularly those for overlapping jurisdictions in Chicago which are grossly underfunded? The Fed was asked that at last month’s seminar and they, without explanation, said they didn’t bother to cover that.
I’ve earlier met Rick Mattoon, one of the Chicago Fed authors of the proposal. He’s a smart, likeable guy who I thought had lots of interesting information. For the life of me, however, I can’t understand how he would put his name on this proposal.
Real Property can’t leave, so seize more of it. That’s the basic idea.
In 1923, a young Jewish immigrant from a small town in modern-day Ukraine founded a candy company in Brooklyn, New York that he called “Just Born”.
His name was Samuel Bernstein. And if you enjoy chocolate sprinkles or the hard, chocolate coating around ice cream bars, you can thank Bernstein– he invented them.
Nearly 100 years later, the company is still a family-owned business, producing some well-known brands like Peeps and Hot Tamales.
But business conditions in the Land of the Free have changed quite dramatically since Samuel Bernstein founded the company in 1923.
The costs to manufacture in the United States are substantial. And business regulations can be outright debilitating.
One of the major challenges facing Just Born these days is its gargantuan, underfunded pension fund.
Like a lot of large businesses, Just Born contributes to a pension fund that pays retirement benefits to its employees.
And in 2015, Just Born’s pension fund was deemed to be in “critical status”, prompting management to negotiate a solution with the employee union.
The union simply demanded that Just Born plug the funding gap, as if the company could merely write a check and make the problem go away.
Management pushed back, explaining that the pension gap could bankrupt the company.
And as an alternative, the company proposed to keep all existing retirees and current employees in the old pension plan, while putting all new employees into a different retirement plan.
It seemed like a reasonable solution that would maintain all the benefits that had been promised to existing employees, while still fixing the company’s long-term financial problem.
But the union refused, and the case went to court.
Two weeks ago the judges ruled… and the union won. Just Born would have no choice but to maintain a pension plan that puts the company at serious risk.
It’s literally textbook insanity. The court (and the union) both want to continue the same pension plan and the same terms… but they expect different results.
It’s as if they think the entire situation will somehow magically fix itself.
Those of us living on Planet Earth can probably figure out what’s coming next.
In a few years the fund will be completely insolvent.
And this company, which employs hundreds upon hundreds of well-paid factory workers in the United States, will probably have to start manufacturing overseas in order to save costs.
Honestly it’s some kind of miracle that Just Born is still producing in the US. The owners could have relocated overseas years ago and pocketed tens of millions of dollars in labor and tax savings.
But they didn’t. You’d think the union would have acknowledged that, and tried to find a way to work WITH the company to benefit everyone in the long-term.
Yet thanks to their idiotic union, these workers are stuck with an insolvent pension fund and zero job security.
Now, here’s the really bizarre part: Just Born contributes to something called a “Multi-Employer Pension Fund”.
In other words, it’s not Just Born’s pension fund. They don’t own it. They don’t manage it. And they’re just one of the several large companies (typically within the candy industry) who contribute to it.
So this raises an important question: WHO manages the pension fund?
Why… the UNION, of course.
The multi-employer pension fund that Just Born contributes to is called the Bakery and Confectionery Union and Industry International Pension Fund.
This is a UNION pension fund. It was founded by the Union. And the President of the Union even serves as chairman of the fund.
This is truly incredible.
So basically the union mismanaged its own pension fund, and then legally forced the company into an unsustainable financial position that could cost all the employees their jobs. It’s genius!
Just Born, of course, is just one of countless other businesses that faces a looming pension shortfall.
General Electric has a pension fund that’s underfunded by a whopping $31 billion.
Bloomberg reported last summer that the biggest corporations in the United States collectively have a $382 billion pension shortfall.
Not to worry, though. The federal government long ago set up an agency called the Pension Benefit Guarantee Corporation to bail out insolvent pension funds.
(It’s sort of like an FDIC for pension funds.)
Problem is– the Pension Benefit Guarantee Corporation is itself insolvent and in need of a bailout.
According to the PBGC’s own financial statements, they have a “net financial position” of MINUS $75 billion, and they lost $1.3 billion last year alone.
The federal government isn’t really in a position to help; according to the Treasury Department’s financial statements, Social Security and Medicare have a combined shortfall exceeding $40 TRILLION.
And public pension funds across the 50 states have an estimated combined shortfall of $1.4 TRILLION, according to a 2016 report by the Pew Charitable Trusts.
It doesn’t take a rocket scientist to see what’s coming.
Solvent, well-funded pensions and state/national retirement programs are as rare as mythical unicorns.
Nearly all of them have terminal problems and will likely become insolvent (if they’re not already).
The unions are driving their own pensions into the ground; and the government has ZERO bandwidth to bail anyone out, least of all itself.
So if you’re still more than two decades out from retirement, you can forget about any of these programs being there for you as advertised.
This settlement is on top of the recent $1 billion fine for mortgage lending and auto insurance abuses.
The bank announced Friday afternoon that it reached a new settlement over its sales practices and will pay $480 million to a group of shareholders who accused the bank of making “certain misstatements and omissions” in the company’s disclosures about its sales practices.
The settlement stems from actions originally taken in 2016 by the Consumer Financial Protection Bureau, the Office of the Comptroller of the Currency, and the city and county of Los Angeles to fine the bank$150 millionfor more than 5,000 of the bank’s former employees opening as many as 2 million fake accounts in order to get sales bonuses.
The action led to a class action lawsuit brought on behalf of the bank’s customers who had a fake account opened in their name.
That lawsuit led to a$142 million fake accounts class action settlementthat covers all people who claim that Wells Fargo opened a consumer or small business checking or savings account or an unsecured credit card or line of credit without their consent from May 1, 2002 to April 20, 2017.
But that wasn’t the only legal battle that Wells Fargo was facing.
According to the bank, a putative group of the bank’s shareholders also sued the bank in U.S. District Court for the Northern District of California, alleging the bank committed securities fraud by not being wholly honest in its statements about its sales practices.
Despite stating that it denies the claims and allegations in the lawsuit, Wells Fargo is choosing to settle the case and will pay out $480 million, assuming the settlement amount is approved by the court.
According to the bank, it reached the agreement in principle to “avoid the cost and disruption of further litigation.”
This settlement is also separate from the recent$1 billion finehanded down against the bank by the CFPB and the OCC for mortgage lending and auto insurance abuses.
The bank stated that the new settlement amount of $480 million has been fully accrued, as of March 31, 2018.
“We are pleased to reach this agreement in principle and believe that moving to put this case behind us is in the best interest of our team members, customers, investors and other stakeholders,” Wells Fargo CEO Tim Sloan said in a statement. “We are making strong progress in our work to rebuild trust, and this represents another step forward.”
Last month, a Wall Street Journal op-ed posited that the new tax bill could create a mass exodus of roughly800,000 residentsfrom the state of California who will flee the state for low-tax red states.
“In the years to come, millions of people, thousands of businesses, and tens of billions of dollars of net income will flee high-tax blue states for low-tax red states. This migration has been happening for years. But the Trump tax bill’s cap on the deduction for state and local taxes, or SALT, will accelerate the pace. The losers will be most of the Northeast, along with California. The winners are likely to be states like Arizona, Nevada, Tennessee, Texas and Utah.” –WSJ
Taxes aside, anew report by Next 10 and Beacon Economics suggests the California exodus may get a lot worse, as new housing construction since the Great Recession has been tepid at best, and as a result, California faces a housing backlog of 3.4 million unitsby 2025 if the trend continues – and 2.8 million units at the current rate of construction.
From 2007 to 2017, only 24.7 housing permits were filed for every 100 new residents in California – much lower than the U.S. average of 43.1 permits.
By 2025, California would have a housing backlog of 3.4 million units if the trend continues. At the current pace of construction, California would add just a minimal amount of new housing – about 600,000 new housing units (net of housing unit losses due to demolition and other causes) – leaving the state with a housing gap of 2.8 million units by 2025. –Next10
“California’s current housing supply is not able to support its growing population,” the report concludes, and as such “the low levels of construction will likely result in further increases in home prices, such that fewer and fewer California residents will be able to afford homes.“
According to the report, California lost over a million residents in the decade between 2006 and 2016, due primarily to the high cost of housing disproportionately hurting lower income households. Over 20% of those who moved over that decade did so in 2006 – at the height of the housing bubble.
And since American consumers are genetically predisposed to never learning from their mistakes, median home prices in California are once again gapping well above the national average in a very similar pattern, making housing once again prohibitively expensive:
Meanwhile, migration out of California is mostly tied to income, as most of those leaving the state earn less than $30,000 per year.
Those migration patterns are shaped by socioeconomics. Most people leaving the state earn less than $30,000 per year, even as those who can afford higher housing costs are still arriving. As the report noted, California was also a net importer of highly skilled professionals from the information, professional and technical services, and arts and entertainment industries. On the other hand, California saw the largest exodus of workers in accommodation, construction, manufacturing and retail trade industries. –MarketWatch
Crunched California homeowners spent an average of 21.9% of their income on housing expenses in 2016, while home ownership rates are terrible at just 53.6% of homes owner-occupied; the 49th worst in the nation on both counts. California renters meanwhile come in 48th in the nation when it comes to percentage of income spent on housing at 32.8%.
And how are Californians coping with the skyrocketing costs of housing? One strategy is doubling up – as nearly 14% of renters have more than one person per bedroom, making it the state with the highest percentage of overcroweded renter households.
Another solution?
Leaving.
In a separate analysis noted byMarketWatch‘s Andrea Riquier, “Realtor.com found that the number of people searching real estate listings in the 16 top California markets compared to people living there and searching elsewhere was more than double that of other areas — and growing.”
Searches for homes in pricey California towns – primarily Santa Clara, San Mateo and Los Angeles – experienced virtually no increase over the past year, while views of listings in other parts of the country were up 15%.
So where do most broke Californians move? Texas, Arizona, Nevada, Oregon and Washington .
Two weeks after Deutsche Bank wasted no time at all to lay off 400 US bankers, or roughly 10% of total, as the bank’s post-disastrous earnings purge began, today the purge is accelerating and according to Bloomberg, the biggest European bank is considering a sweeping restructuring, a less scary phrase than “mass termination” in the U.S. “that could result in cutting about 20% of staff in the region” although Bloomberg caveats that a formal decision has not yet been made, the total figure may end up lower.
Deutsche Bank isn’t targeting a specific level of cuts at the U.S. unit and the final figure will depend on each business line’s decisions, according to another person briefed on the matter. The company had about 10,300 employees in the U.S. at the end of 2017, or about a tenth of its global workforce.
The news follows an earlier report that Deutsche Bank’s Barry Bausano, a senior banker in charge of overseeing the company’s relations with hedge fund clients, was leaving as the firm shakes up its U.S. operations.
When Bloomberg asked the bank about its mass termination plans, bank spokesman Joerg Eigendorf said “There are no such plans,” although considering the billions Deutsche has spent on rigging and manipulation, they may be excused if they are not seen as exactly credible.
Separately, Bloomberg also reports that under its new CEO, Christian Sewing, Deutsche Bank is considering cuts to businesses including prime brokerage, rates and repo,according to a bank statement last month and people familiar with the matter. As reported previously, the firm is already planning to close an office in Houston and shrink its presence in New York City, moving from Wall Street to a midtown Manhattan space that’s 30 percent smaller.
Day of Reckoning: Hundreds of thousands of interest-only loan terms expire each year for the next few years.
The Reserve Bank of Australia (RBA), Australia’s central bank, warns of a$7000 Spike in Loan Repaymentsas interest-only term periods expire.
Every year for the next three years, up to an estimated 200,000 home loans will be moved from low repayments to higher repayments as their interest-only loans expire. The median increase in payments is around $7000 a year, according to the RBA.
What happens if people can’t afford the big hike in loan repayments? They may have to sell up, which could see a wave of houses being sold into a falling market. The RBA has been paying careful attention to this because the scale of the issue is potentially enough to send shockwaves through the whole economy.
Interest Only Period
In 2017, the government cracked down hard on interest-only loans. Those loans generally have an interest-only period lasting five years. When it expires, some borrowers would simply roll it over for another five years. Now, however, many will not all be able to, and will instead have to start paying back the loan itself.
That extra repayment is a big increase. Even though the interest rate falls slightly when you start paying off the principal, the extra payment required is substantial.
Loan Payments
RBA Unconcerned
For now, the RBA is unconcerned: “This upper-bound estimate of the effect is relatively modest,” the RBA said.
Australian Government Rolls Out Universal Reverse Mortgage Plan
The Australian government has proposed a wide-ranging reverse mortgage plan that would make an equity release program available to every senior over the age of 65.
Previously restricted to those who partially participate in the country’s social pension program, the government-sponsored plan will extend to any homeowner above the age cutoff, according to areportfrom Australian housing publication Domain.
Under the terms of the government-sponsored plan, homeowners can receive up to $11,799 each year for the remainder of their lives, essentially taken out of the equity already built up in their homes. Domain gives the example of a 66-year-old who can receive a total of $295,000 during a lifetime that ends at age 91.
As in the United States, older Australians have a significant amount of wealth tied up in their homes; the publication cited research showing that homeowners aged 65 to 74 would likely have to sell their homes in order to realize the $480,000 increase in personal wealth the cohort enjoyed over the previous 12-year span.
In fact, the Australian government last year attempted to encourage aging baby boomers to sell their empty nests to free up the properties for younger families. Under that plan, homeowners 65 and older could get a $300,000 benefit from the government, a powerful incentive in a tough housing market for downsizers — and in a government structure that counts income against seniors when calculating pension amounts.
“Typically, older homeowners have been reluctant to sell for both sentimental and financial reasons,” Domainreportedlast year. “Often selling property is costly, and funds left over after buying a smaller home could then be considered in the means test.”
But the baked-in reverse mortgage benefit represents a shift toward helping seniors age in place instead of downsizing. The Australian government’s “More Choices for a Longer Life” plan also expands in-home care access by 14,000 seniors,accordingto the Financial Review, while boosting funding for elder physical-fitness initiatives and other efforts to reduce isolation among aging Australians.
The reverse mortgage plan will offer interest rates of 5.25%, which Domain noted is less than most banks, and will cost taxpayers about $11 million through 2022. Loan-to-value ratios are calculated to ensure that the loan balance can never exceed the eventual sale price of the home.
Greens leader Richard Di Natale has proposed a radical overhaul of Australia’s welfare system through the introduction of a universal basic income scheme, but critics believe this would only increase inequality.
Di Natale gave a speech at the National Press Club on Wednesday, outlining why he thought Australia’s current social security system was inadequate.
“With the radical way that the nature of work is changing, along with increasing inequality, our current social security system is outdated,” Di Natale said.
“It can’t properly support those experiencing underemployment, insecure work and uncertain hours.
“A modern, flexible and responsive safety net would increase their resilience and enable them to make a greater contribution to our community and economy.”
— National Press Club (@PressClubAust) April 4, 2018
To address this, Di Natale called for the introduction of a universal basic income scheme, which he labelled a “bold move towards equality”.
“We need a universal basic income. We need a UBI that ensures everyone has access to an adequate level of income, as well as access to universal social services, health, education and housing,” he said.
“A UBI is a bold move towards equality. It epitomises a government which looks after its citizens, in contrast to the old parties, who say ‘look out for yourselves’. It’s about an increased role for government in our rapidly changing world.
“The Greens are the only party proudly arguing for a much stronger role for government. Today’s problems require government to be more active and more interventionist, not less.”
However Labor’s shadow assistant treasurer Andrew Leigh, responded on Twitter that Australia had the most targeted social safety net in the world and that Di Natale’s plan would increase inequality.
Aust has the most targeted social safety net in the world. Replacing it with a universal basic income, as @RichardDiNatale suggests, would increase inequality. Why give the same amount to billionaires as battlers? #auspolpic.twitter.com/aHefpfWJpn
Leigh was unavailable for comment when contacted by Pro Bono News, but in aspeechgiven at the Crawford School of Public Policy in April last year, he explained why he opposed a UBI.
“As it happens, using social policy to reduce inequality is almost precisely the opposite of the suggestion that Australia adopt a ‘universal basic income’,” Leigh said.
“Some argue that a universal basic income should be paid for by increasing taxes, rather than by destroying our targeted welfare system. But I’m not sure they’ve considered how big the increase would need to be.
“Suppose we wanted the universal basic income to be the same amount as the single age pension (currently $23,000, including supplements). That would require an increase in taxes of $17,000 per person, or around 23 percent of GDP. This would make Australia’s tax to GDP ratio among the highest in the world.”
Liberal Senator Eric Abetz described Di Natale’s plan as “economic lunacy”.
“Its catastrophic impact would see the biggest taxpayers in Australia, the banking sector, become unprofitable and shut down and his plan for universal taxpayer handouts would see our nation bankrupted in a matter of years,” Abetz said.
“This regressive and ultra-socialist approach of less work, higher welfare and killing profitable businesses has been tried and failed around the world and you need only look at the levels of poverty and riots in Venezuela.
“Senator Di Natale must explain… who will pay for this regressive agenda when he runs out of other people’s money.”
Despite this criticism, welfare groups said they welcomed a conversation on a “decent income for all”.
Dr Cassandra Goldie, the CEO of the Australian Council of Social Service, indicated that a UBI would be discussed among their member organisations.
“We are very glad a decent income for all is being discussed. Too many people lack the income they need to cover even the very basic essentials such as housing, food and the costs of children,” Goldie told Pro Bono News.
“We will be discussing basic income options with our member organisations.
“Our social security system has a job to protect people from poverty and help with essential costs and life transitions such as the costs of children and decent housing. It is failing at this. The basic minimum allowance for unemployed people is just $278 per week.
“Budget cuts – including the freezing of family payments – have made matters worse.”
Goldie said that working out if a basic income proposal would increase or reduce inequality depended on the detail.
“We don’t oppose universal payments on principle, but reform of social security should begin with those who have the least. This must be the first priority,” she said.
“The principle that everyone should have access to at least a decent basic income is a good starting point for reform. Let’s have that debate.”
The convenor of the Anti-Poverty Network SA, Pas Forgione, told Pro Bono News that a UBI would only address inequality if payments were set to an adequate level.
“If universal basic income means that everyone gets the same income that people on Newstart gets, roughly $260 a week, then I don’t think that’s going to do much to alleviate poverty,” Forgione said.
“It needs to be set at an adequate level. And I think that involves looking at what it takes to have a reasonable standard of living and a reasonable quality of life in a country like Australia. So it depends on the details.
“If it is set at an adequate level, than it would be a terrific thing for the quality of life for a number of very low income people. I’m not saying that it’s a panacea… but I think you could make a very strong case for looking at a UBI.”
Di Natale’s speech also called for the creation of a nationalised “People’s Bank”, to give more people access to affordable banking services and to add “real competition” to the banking sector.
“A people’s bank, along with more support for co-operatives and mutuals, would inject some real competition into the banking sector,” he said.
“We have a housing crisis that has been created by governments.
“So now is the time for government to step in: through a People’s Bank, by ending policies skewed in favour of investors like negative gearing and the capital gains tax discount, and through a massive injection of funds for social and public housing.”
The Turkish government has withdrawn its reserves of gold from the Federal Reserve. Erdogan clearly is positioning himself to be able to seek its own power that will be contrary to international policy. Erdogan is one of those politicians who still think in the old days of Empire. As a member of NATO, he has constantly been threatening Greece. So what happens if we see a war between two NATO members? Who does NATO then support? When in doubt, bring the gold home in preparation for in time of war, a currency will not suffice.
Anecdotal evidence suggests that corporate borrowers may be due for a reckoning.
A growing spider web of evidence suggests a credit reckoning may be near.
For years, the naysayers have been warning about the precariousness of the corporate credit market. In an environment where balance sheets have become more and more bloated from excess borrowing stoked by the Federal Reserve’s easy-money policies, shrinking bond yield premiums don’t make sense. At some point, they argue, there will have to be a reckoning.
Could we be nearing that point?
On the surface, it’s hard not to like corporate bonds, despite yields being at some of their lowest levels relative to U.S. Treasuries since before the financial crisis. After all,corporate earnings are booming, thanks to an expanding economy and tax cuts, and the default rate is miniscule at less than 3 percent. On top of that, the number of companies poised for an upgrade at S&P Global Ratings is the highest in a decade.
All that said, there’s mounting anecdotal evidence of possible cracks in the credit facade. One place you can see them is in the latest monthly survey put out by the National Association of Credit Management. This organization surveys 1,000 trade credit managers in the manufacturing and service industries across the U.S. Like most surveys of its kind lately, the main index number was down a bit from its recent highs. But some Wall Street strategists are focusing on a more alarming data point showing a collapse in a category called “dollar collections.” The index covering that part of the survey – which measures the ability of creditors to collect the money they are owed from their customers – tumbled to 46.7 in April from 59.6 in March, putting it at its lowest level since early 2009, the height of the financial crisis.
The folks at the NACM aren’t quite sure what to make of the big plunge, which could turn out to be an anomaly. What they do know, however, is that credit conditions are getting weaker. As they describe it, the strengthening economy has forced more companies to boost borrowings to keep pace with their competitors. Now, they may be struggling to keep on top of that debt.
“It looks like creditors are having more challenges as far as staying current, which may be contributing to the very weak dollar collection numbers,” NACM economist Chris Kuehl wrote in a report accompanying the monthly survey results.
There may be something to that. The Institute of International Finance noted in a report last month that U.S. non-financial corporate debt rose to $14.5 trillion in 2017, an increase of $810 billion from 2016 and a figure that equates to 72 percent of the country’s gross domestic product (a post-crisis high). About 60 percent of the rise in debt stemmed from new bank loan creation, which is worrisome since those borrowings roll over more frequently than bonds and are tied to short-term interest rates, which are rising at a much faster clip than long-term rates. As an example, the three-month London Interbank Offered Rate for dollars has jumped to 2.35 percent from 1 percent at the start of 2017. While that’s still low historically, any small increase gets magnified across such a big amount of borrowings.
“Rising interest rates will add pressure on corporates with large refinancing needs,” the Washington-based Institute of International Finance wrote in its report. It estimates about $3.8 trillion of loan repayments will be coming due annually.
Credit is the lifeblood of the economy and financial markets. As such, it has a reputation for being a sort of early-warning system for investors and leading indicator for riskier assets such as equities. The equity strategists at Bloomberg Intelligence say they are noticing that stock performance is starting to correlate strongly with corporate balance sheet health as well as profitability. In an April report, they wrote that over the prior year, stocks of Standard & Poor’s 500 Index members with higher cash ratios outperformed low-ratio counterparts. Also, stocks of companies with higher net-debt ratios relative to both cash flow and market capitalization under performed lower-debt counterparts, with average monthly return differentials of 1.1 percentage points.
A growing number of influential Wall Street firms, from Guggenheim Partners to Pacific Investment Management Co., and from BlackRock Inc. to Greg Lippmann – who helped design the “Big Short” trade against subprime mortgages – are raising the alarm about the dangers growing in credit markets. It may well be that the reckoning is closer than we think.
It is official. Consumers in Colorado appear to be tapped out.
This comes at a time when the recovery is now tied for the second-longest economic expansion in American history. The stock market is near an all-time high, unemployment is the lowest in two decades, consumer confidence is beyond euphoric, and Trump tax cuts are stoking the best earnings quarter since 2011 — unleashing a record amount of corporate stock buybacks.
While a real economic recovery could be plausible this late in the business cycle, the unevenness of the recovery has left many residents in Colorado without a paddle. Accelerating real estate and rent prices across Colorado are squeezing residents out of their homes at an alarming pace.
According toABC Denver 7, Denver metro area’s skyrocketing cost of living, stagnate wage growth, and lack of affordable real estate has fueled an enormous housing crisis — overwhelming the state’s eviction courts.
Colorado Center on Law and Policy (CCLP), which has spent decades advocating for tenant rights, warns that an eviction crisis is underway in the Denver region.
ABC Denver 7 said, “27 percent of all civil cases filed in Colorado in 2017 were evictions, which represents 45,000 cases.” In Denver alone, eviction cases accounted for nearly 18 percent (8,000 eviction cases) of all evictions across the state. Arapahoe County, the third-most populated county outside of Denver, experienced the most significant number of eviction cases at nearly 22 percent (10,000 eviction cases) in 2017.
Jack Regenbogen, attorney and policy advocate for the Colorado center on Law and Policy, told ABC Denver 7 that most tenants are underrepresented in eviction court cases. In return, this has led to more evictions forcing tenants out onto the streets. He says about 90 percent of landlords are represented by legal counsel during an eviction process, but less than one percent of tenants have legal assistance.
“Traditionally, Colorado has been a very friendly state towards landlords. We really need our policymakers to begin investing meaningful resources to address this issue,” said adds.
ABC Denver 7 indicates that more than 50 percent of Coloradans are renting, and as court dockets continue to expand with evictions in 2018, the crisis is far from over.
According to the Denver Metro Association of Realtors (DMAR) May housing trends report, the average cost of a single-family home in the Denver metro area edged up, as it hit $543,059 in April. More and more homes are listing in the range between $500,000 to $750,000 than all of the price ranges below $500,000 combined. A spokesman from DMAR said homes priced between $500,000 and $749,000, is now considered the “new norm.”
“This demonstrates home buyer demand remains robust,” said Steve Danyliw, Chairman of the DMAR Market Trends Committee. “As new listings poured into the market, buyers that were waiting for them quickly gobbled them up, driving the average days on market down to 20 days.”
Danyliw, further said housing activity remains stable, but increasing interest rates could have an eventual impact on the real estate market.
Evidence continues to build that housing affordability is getting worse, particularly for everyday Americans. Colorado is the latest example of consumers physically tapping out, as they can no longer afford soaring real estate/rent prices – which is now overwhelming state courts in Denver.
Argentina’s central bank has raised interest rates for the third time in eight days as the country’s currency, the peso, continues to fall sharply.
On Friday, the bank hiked rates to 40% from 33.25%, a day after they were raised from 30.25%. A week ago, they were raised from 27.25%. The rises are aimed at supporting the peso, which has lost a quarter of its value over the past year.
Analysts say the crisis is escalating and looks set to continue.
Argentina is in the middle of a pro-market economic reform programme under President Mauricio Macri, who is seeking to reverse years of protectionism and high government spending under his predecessor, Cristina Fernandez de Kirchner. Inflation, a perennial problem in Argentina, was at 25% in 2017, the highest rate in Latin America except for Venezuela. This year, the central bank has set an inflation target of 15% and has said it will continue to act to enforce it.
‘Aggressive steps’
Despite the twin rate rises, the peso, which was fixed by law at parity with the US dollar before Argentina’s economic meltdown in 2001-02, is now trading at about 22 to the dollar.
“This crisis looks set to continue unless the government steps in to reassure investors that it will take more aggressive steps to fix Argentina’s economic vulnerabilities,” said Edward Glossop, Latin America economist at Capital Economics. “Risks to the peso have been brewing for a while – large twin budget and current account deficits, a heavy dollar debt burden, entrenched high inflation and an overvalued currency.
“The real surprise is how quickly and suddenly things seem to be escalating.”
Mr Glossop said “a sizeable fiscal tightening” was planned for 2018, but it might now need to be larger and prompter. “Unless or until that happens, the peso is likely to remain under pressure, and there remains a real risk of a messy economic adjustment.” Argentina’s president Mauricio Macri is a controversial figure in a country that is still strongly divided ideologically. But among international investors he is unanimously praised. Since coming to office, he moved swiftly to end capital controls and re-establish trust in economic data coming from Argentina. However, he is not winning a crucial battle in the country – the one against inflation. Markets are taking notice and there has been a sell-off of the peso. The opposition wants to stop Macri from removing subsidies in controlled prices, such as energy and utility tariffs, which may bring more inflation in the short term but could help bring it down from above 20% now to about 5% by 2020.
Friday was a day for emergency measures – a massive hike to 40% in interest rates and another promise to bring down government spending.
Investors still believe Macri has a sound plan to recover Argentina, but they are not convinced he can see it through.
Argentina Raises Interest Rates To 40% To Support Their Currency
Argentina has just raised interest rates to40% trying to support the currency. I have explained many times that interest rates follow a BELL-CURVE and by no means are they linear. This is one of the huge problems behind attempts by central banks to manipulate the economy by impacting demand-side economics. Raising interest rates to stem inflation will work only up to a point and even that is debatable. The entire interrelationship between markets and interest rates has three main phase transitions and each depends upon the interaction with CONFIDENCE of the people in the survivability of the state.
PHASE TWO: Raising interest rates will flip the economy as Volcker did in 1981 ONLY when they exceed the expectation of profits in asset inflation provided there is CONFIDENCE that the government will survive as in the USA back in 1981 compared to Zimbabwe, Venezuela, Russia during 1917 or China back in 1949. In other words, if the nation is going into civil war, then tangible assets will collapse and the solution becomes assets flee the country.
In the case of the USA back in 1981, the high interest rates worked because we were only in Phase Two where there was no civil war or revolution so the survivability of the government did not come into question. Hence, Volcker created DELATION as capital then ran away from assets and into bonds to capture the higher interest rates. Then and only then did rates begin to decline between 1981 into 1986 reflecting the high demand for US government bonds, which in turn drove the US dollar to record highs and the British pound to $1.03 in 1985 resulting in the Plaza Accord and the creation of the G5 (now G20).
So many people want to take issue with me over how the stock market will rise with higher interest rates. It is a BELL-CURVE and you better begin to understand this. If not, just hand-over all your assets to the New York bankers now, go on welfare and just end your misery.
Here are charts of the Argentine share market the currency in terms of US dollars. You can see that the stock market offers TANGIBLE assets that rise in local currency terms because assets have an international value. Here we can see the dollar has soared against the currency and the stock market has risen in proportion the decline in the currency. I do not think there is any other way that is better to demonstrate the BELL-CURVE effect of interest rates than these two charts.
To those who doubt that the stock market can rise with rising interest rates, I really do not know what to say. Keep listening to the talking heads of TV and all the pundits who claim only gold will rise and everything else will fall to dust. Then we have the sublime blind idiots who never look outside the USA and proclaim the dollar will crash and burn not the rest of the world so buy gold and cryptocurrency you cannot spend and certainly with no power grid.
PHASE THREE
Is when no level of interest rate will save the day. Capital simply flees the political state for the risk of revolution or civil war means that tangible assets which are immovable will not hold their value such as companies and real estate. This is the period that Goldbugs envision. At that point, the value of everything will even move into the extreme PHASE FOUR where even gold will decline and the only thing to survive is food. There, the political state completely collapses and a new political government comes into being.
Meanwhile, the following is an analysis update on the pending 2021 LIBOR reset that will affect trillions in debt and derivative instruments across the globe…
Facebook co-founder Chris Hughes wants to tax anyone who makes over $250,000 to the tune of nearly $3 trillion over ten years, then use the proceeds to provide universal basic income (UBI) to every working American who makes under $50,000 a year, including those providing services such as child care and elder care.
Hughes, 34, now devotes his time to evangelizing for higher taxes on the rich, such as himself. He’s proposing that the government give a guaranteed income of $500 a month to every working American earning less than $50,000 a year, at a total cost of $290 billion a year. This is a staggering number, but Hughes points out that it equals half the U.S. defense budget and would combat the inequality that he argues is destabilizing the nation. –Bloomberg
Hughes, who has a relatedbook coming out, has made tackling income inequality his top priority by partnering with theEconomic Security Project– a major recipient of his philanthropic efforts. The group is focused finding solutions to provide “unconditional cash and basic income” in the United States due to the effects of “automation, globalization, and financialization” forcing the discussion.
The plan would essentially be an expansion of the Earned Income Tax Credit (EITC) for low-to-moderate income individuals and families.
The Economic Security Project is a network committed to advancing the debate on unconditional cash and basic income in the United States. In a time of immense wealth, no one should live in poverty, nor should the middle class be consigned to a future of permanent stagnation or anxiety. Automation, globalization, and financialization are changing the nature of work, and these shifts require us to rethink how to create economic opportunity for all. –Economic Security Project
While Hughes notes that the annual $290 billion annual price tag is half the U.S. defense budget, he contends that income inequality is destabilizing the nation – and that there is a “very practical concern that, given that consumer spending is the biggest driver of economic growth in the United States and that median household incomes haven’t meaningfully budged in 40 years,” a Universal Basic Income is vital to maintaining economic national security.
“Cash is just the simplest and most efficient thing to eradicate poverty and stabilize the middle class,” Hughs toldBloombergat the Economic Security Project’s New York offices at Union Square.
There are many ways to pay for a guaranteed income. However, I do think that the resources can and should come from the people who most benefited from the structure of the economy. We had tax rates at 50 percent for several decades after [World War II]. In the same period, we had record economic growth and broad-based prosperity. I’m not making the case, in the book and in general, that we just need higher taxes. It matters what our tax dollars are going to. Cash is just the simplest and most efficient thing to eradicate poverty and stabilize the middle class. –Bloomberg
You can read the rest of Bloomberg‘s interview with Hugheshere.
Rents in all unit sizes picked up steam in April. Among the largest cities, Las Vegas, Denver, and Detroit led the pack.
The Rent Cafe’sMonthly Rent Reportfor the 250 largest US cities shows a 3.2% Y-o-Y surge.
The national average rent in April clocked in at $1,377. This marks the highest annual growth rate since the end of 2016.
By Size
Large cities: Las Vegas sees the fastest increasing rents Y-o-Y (6.0%), followed by Denver (5.8%) and Detroit (5.4%). Apartment prices in Brooklyn and Manhattan continue to slide, while rents in Washington,D.C., Portland, and Austin have been steady, growing by less than 1.5%.
Mid-size cities: Rents in Sacramento cooled down to 6%, but still lead. At the other end of the spectrum are New Orleans (-2.2%), Tulsa (0.5%), and Wichita (1.0%), where rents are growing the slowest.
Small cities see the top 20 most significant rent increases in April. Rents in the Midland-Odessaarea skyrocketed for another month, 35.6% and 32.6% respectively. At the bottom of the list sit Norman (-2.5%), Lubbock (-2.5%), and Alexandria (-1.1%).
No significant fluctuation in prices was noticed in Chicago, Philadelphia, and San Francisco, where apartment rents grew slower than 2% over the year.
The current setup leads to another deflationary collapse as we saw in 2008-2009, not an inflation boom.
“If I were trying to create a deflationary bust, I would do exact exactly what the world’s central bankers have been doing the last six years,” said Stanley Druckenmiller, 2018 recipient of the Alexander Hamilton award.
That is precisely what I have been saying for a long time.
For gold investors, the rising market volatility is no match for the currently growing economy, with gold holdings slumping to a decade low, according to the World Gold Council (WGC).
The WGC reported that global gold demand fell to its lowest first-quarter level since 2008, falling to 973 metric tons in the first quarter of 2018, a 7% drop compared to the 1,047 metric tons in the first quarter of 2017.
U.S. retail investors are losing their appetite for physical gold as buoyant stock markets offer tempting alternatives, sending sales of newly minted coins to their lowest in a decade.
More and more coins are also being sold back onto the market, further eroding demand for newly minted products.
Gold American Eagle bullion coin sales from the U.S. Mint slumped to a third of the previous year’s level in 2017, their weakest since 2007.
They were down nearly 60 percent year on year in the first quarter. Sales so far this month, at 2,500 ounces, are less than half last April’s total, and a fraction of the 105,500 ounces sold in April 2016.
Contrary Indicator
For starters. retail investors dumping gold coins is a contrary indicator. And if they are dumping gold coins to buy Bitcoin or stock that is a contrary indicator for Bitcoin and Stocks.
What About Demand?
Actually, demand for gold bottomed in December of 2015.
How do I know? By looking at the price.
Gold Demand
As noted by the chart, demand for gold peaked in September of 2011. Demand bottomed in December of 2015.
Wait a second, you say, those are prices!
Yes, exactly.
Unlike silver, which is used up industrially, nearly every ounce of gold ever mined is available for sale.
Someone has to own those ounces. The price of gold represents the demand for gold.
Gold Up 31%, Retail Selling
Gold is up 31% but retail investors are selling their coins. That’s a major contrary indicator.
Driver for Gold
The primary driver for the price of gold is faith in central banks. In 2011, there were worries the Eurozone would break up.
In 2012, ECB president Mario Draghi made afamous speech, declaring, “Within our mandate, the ECB is ready to do whatever it takes to preserve the euro. And believe me, it will be enough.”
Curiously, he did not do a thing at the time. The speech restored faith.
Gold vs. Faith in Central Banks
Faith on the Wane
Some believe the Fed is way behind the curve. Others thinks a deflationary bust is coming and the Fed will engage in more QE.
Pick your reason, but faith in central banks is on the wane.
Deflationary Bust
Given the amount of global financial leverage, I strongly suggest a deflationary bust is the most likely outcome looking ahead.
“If I were trying to create a deflationary bust, I would do exact exactly what the world’s central bankers have been doing the last six years,” said Stanley Druckenmiller.
It is late. We have been crunching data for three days, and won’t bore you with too much prose.
We will be back to fill in the blanks in the next few days but will leave you with some nice charts and data to contemplate. They may help explain why the stock market is trading so poorly even with, what appears, to be stellar earnings.
Determination Of The 10-year Yield
There will be many posts to come on this topic as we believe it is the most critical issue investors need to grapple with and get right over the next year.
What is the right price for the U.S. 10-year Treasury yield?
Moreover, how is the yield determined, and how has it been distorted over the past 20 years by central banks, both foreign and the Federal Reserve?
What does the future hold?
Capital Flows
We agree that inflation, growth expectations, and other fundamental factors weigh heavily on determining bond yields but we always maintain, first, and foremost,
“asset prices are always and everywhere determined by capital flows.”
New Issuance, Foreign, and Fed Flows Into The Treasury Market
The following table illustrates the new issuance of marketable Treasury securities held by the public and net purchases by foreign investors, including central banks, and the Federal Reserve over various periods.
The data show since the beginning of the century, foreign investors, mainly central banks, and the Federal Reserve net purchase of Treasury securities, those which trade in the secondary market, is equivalent to 60 percent of all new marketable debt issued by the Treasury since 2000.
We do not suggest all these purchases were made directly in Treasury auctions, though many of the foreign buys certainly were.
From 2000-2010, foreign central banks were recycling their massive build of foreign exchange reserves back into the Treasury market. During this period, the foreign central banks bought the equivalent of 50 percent of the new issuance. Add foreign private investors and the Fed’s primary open market operations, and the total equated to 70 percent of the debt increase over the period.
Alan Greenspan blames the foreign inflows into the Treasury market during this period for Fed losing control of the yield curve, a major factor and cause of the housing bubble, and not excessively loose monetary policy.
Given the decoupling of monetary policy from long-term mortgage rates, accelerating the path of monetary tightening that the Fed pursued in 2004-2005 could not have “prevented” the housing bubble. –Alan Greenspan, March 2009
Greenspan raised the Fed Funds rate 425 bps from June 2004 to June 2006 and the 10-year barely budged, rising only 52 bps. More on this later.
During the Fed’s QE period, 2010-2015, foreign investors and the Fed took down the equivalent of 80 percent of the new debt issuance.
The charts also illustrate that for several of the 3-month rolling periods, net purchases were significantly higher than 100 percent of new supply, distorting not only the 10-year yield, but the valuation of all other asset prices.
Interest rate repression also cause economic distortions, which have political consequences. Most notably,wealth and income disparities.
Rapid Technical Deterioration
Since 2015, flows into the Treasury market have deteriorated markedly, and the timing could not be worse as new Treasury issuance is ballooning with skyrocketing budget deficits.
During the past twelve months, for example, net foreign and Fed flows collapsed to just 17.6 percent of new borrowings. Even worse, the net flows were negative (we estimated March international flows) during the first quarter during a record new issuance of Treasury securities of almost $500 billion.
Can we say, “Gulp”?
Stock Of Outstanding Treasury Securities
Given the rapidly deteriorating technicals and fundamentals — rising inflation –, we believe the 10-year yield should be and will be much higher sometime soon.
That is we are looking for a “super spike” in bond yields, and expect the 10-year to finish the year between 4-5 percent. The term premium, which has been repressed due to all of the above, should begin to normalize.
Why is taking so long?
Aside from the record shorts and natural inertia of markets, the stock of Treasury securities remains favorable, as the bulk is still held by the Fed and foreign central banks, who are not price sensitive.
Debt Stock Shortage, Debt Flow Surplus
Ironically, there remains an artificial shortage of the stock of Treasuries but now a huge glut in the flow. Seeherefor a must read.
The Bund And JGB Anchor?
Treasuries are at almost at record spreads on some maturities vis-à-vis the German bund, and foreigners are on a buying strike as the above data show.
How can an anchor be an anchor if there are no buyers? One asset arbitrage?
It is also not normal for the 10-year to be trading in such a tight range with a record short position in the futures market. The average daily move in the VIX has increased from 0.20 percent in 2016, to 1.37 percent in 2017, and shorts are now hardly spooked by a 500 point flop in the Dow.
Something must be going on beneath the earth’s crust. We have our ideas.
Dollar Strength
The recent dollar strength may be a signal foreigners are getting yield-hungry again, however. We are not so sure the rally has legs.
Market concerns over the political stability of the U.S may trump yield-seeking for the rest of the year.
How Foreign Flows Contributed To The Housing Bubble
We are not going to spend much time here but we are starting coming around to Mr. Greenspan’s reasoning. The lack of response of long-term yields to a 425 bps increase in the Fed Funds rate from 2004-2006 greatly contributed to the housing bubble. The 10-year yield only moved up 52 bps from when the Fed started their tightening to when they paused.
Take a look at the chart.
The Fed’s interest rate hikes didn’t even put a dent in the momentum of the housing bubble. Household mortgage debt continued to rise from 60 to 72 percent of GDP from the first interest rate hike before the market collapsed on itself.
Bubbles are hard to pop.
Why Long-Term Yields Didn’t Respond
Simple.
As, always and everywhere, capital flows or the recycling thereof.
The biggest economic event in the past 25 years, in our opinion, is the exchange rate regime shift that took place in the emerging markets in the late 1990’s. These countries now refuse to allow their currencies to appreciate in any significant magnitude as the result of capital inflows.
They learned some hard lessons in the mid-1990’s with Mexican Peso and Asian Financial Crisis, and the Russian Debt Default.
Balance of payments surpluses are now reconciled with dirty float currency regimes, where central banks intermittently intervene if their currency becomes too strong.
The result was a massive build of global currency reserves, much of which were recycled back into the U.S. Treasury market in the mid-2000’s.
The chart illustrates that foreign central bank net purchases of Treasury securities, alone, were equivalent to the over 66 percent of net Treasury issuance during the Fed 2004-2006 tightening cycle.
International Reserves Drive Gold
The gold price also ramped with international reserves during this period.
We believe the global monetary base, mainly international reserves, is the main driver of gold. Seehere.
Reserves have not been growing witness the punk trading range in gold. This may change as the U.S. current account blows out again.
The Mnuchin crowd are wasting their time in China trying to negotiate lower trade deficits. Trade deficits are the result of internal imbalances where investment exceeds savings. Seeherefor another must read.
Introducing trade distortions to artificially lower the external deficit will only accelerate stagflaton, which is already starting to take hold. Then we will all be worse off. Seehere.
Besides, where is Mr. Mnuchin going to obtain the financing for his proliferating budget deficits if his goal is to run trade surplus or balances with our trading partners?
We are all for better terms of trade and protecting are intellectual property rights, but know and understand thynational income accountingbefore starting trade wars.
Upshot
We have laid out why we believe, and we could be wrong, long-term yields are unlikely to behave as they did during the last monetary tightening. That is the a further collapse in Treasury term premia and a yield curve inversion until something breaks.
Unless the U.S. blows up its current account again, credit expansion accelerates significantly, creating another blast of capital flows into the emerging markets, to be recycled back to the U.S,, the foreign and Fed financing of the U.S. budget deficit is over. Punto!
We are preparing for a significant move higher in bond yields.
What Is The Right Real Yield?
Do you really think with the deteriorating flows in the bond market, coupled with rising inflation warrant a 0.5 percent real 10-year yield?
Au contraire! We believe a 2-3 percent real yield is closer to fair value.
Tack on another 2.5 percent for inflation, generous as shortages seem to be breaking out everywhere, and that gets the 10-year to at least 4 1/2 percent.
Timing
A little CYA. Yields could move a little lower, maybe to 2.80 percent (a stretch), given the dollar strength as Europe slows, and shorts get spooked.
Our suspicions, however, it is going to be a hot summer. Higher interest rates and lower stock prices.
Disclaimer
Now let us add our disclaimer.
Even if all our facts are correct, our conclusions may be completely wrong.
If you have been reading the Global Macro Monitor over the years, you have probably seen it several times.
To illustrate our point, we like to tell the story Abraham Lincoln used to persuade juries when he was an Illinois circuit court lawyer.
Thestory goesthat Lawyer Lincoln was worried he had not convinced the jury during the closing argument of a civil case against a railroad. The jurors had gone to lunch to deliberate. Lincoln followed them and interrupted their dessert with a story about a farmer’s son gripped by panic,
“Pa, Pa, the hired man and sis are in the hay mow and she’s lifting up her skirt and he’s letting down his pants and they’re a fixin’ to pee on the hay.” “Son, you got your facts absolutely right, but you’re drawing the wrong conclusion.”
As if the current global monetary system didn’t put the middle-class at a structural disadvantage versus the wealthy, by taxing them disproportionately with inflation, encouraging dissaving and taxing labor (ordinary income) much higher than capital (long-term gains), we now find out that the middle class has a new reason they’re being pushed into poverty: banks are willingly trying to put them there.
In areport by the Sydney Morning Herald, the newspaper notes that more middle-class Australians are being pushed into poverty. The simple explanation why this is happening: Australian banks are trying to figure out exactly how much they can charge customers before pushing them into poverty; to do this they are using a formula which incorporates a poverty index to calculate the last marginal dollar of disposable income that the middle class has for fees and charges.
Here’s more:
The banking and finance royal commission has cast light on a new type of poverty to emerge in our society: middle class poverty.
To understand it, we have to go back to an earlier government inquiry: the 1972 Commission of Inquiry into Poverty, conducted by Professor Ronald Henderson. That commission had no real policy impact, but its cultural impact was profound. It gave prominence to the Henderson Poverty Index: a measure of consumption described by Henderson as so austere that it was unchallengeable. Updated versions of this index remain a standard benchmark of poverty.
But more than 45 years on, the royal commission into finance is revealing that poverty is no longer just about low income. The commission has heard that Australian banks have adopted actual lending practices (as distinct from their official lending policies) that claim so much household income for contract payments that borrowers are left without enough money to fund basic consumption levels: they are living in poverty.
This isn’t an accident: it is a strategic policy by banks. How much do banks think households need for daily living? According to the Australian Prudential Regulation Authority’s submission to the royal commission, banks “typically use the Household Expenditure Measure [a relative poverty measure] or the Henderson Poverty Index in loan calculators to estimate a borrower’s living expenses”.
And regulators in Australia aren’t doing much to help – in fact, they’ve simply made a blanket “don’t worry about it” type statement while conducting a “targeted review”:
So measures designed to capture the impacts of low incomes are now targeting financially-enmeshed middle-income households, and not as a statement of social shame, but as strategic objects of bank policy.
This has caused embarrassment to APRA, the regulator charged with overseeing those bank practices. In response, it was permitted to make a supplementary submission to the royal commission in March.
APRA now distances itself from use of these lowly measures, claiming them to be an “under-estimation” of household expenses. It reports that in 2017 it conducted a targeted review of a sample of loan files, using external audit firms to ensure independent integrity.
Following the review, one “groundbreaking” conclusion emerged:
The review contended that lending on the basis of either poverty index is not consistent with sound risk management. It assures that its discussions with banks are leading to improvements.
But it doesn’t stop there, as regulators had already identified the problem more than 10 years ago and did nothing to act on it:
The urgency of this attention is disingenuous. In 2007, then APRA chairman John Laker revealed that a survey by APRA showed that “most [banks] use either the Henderson Poverty Index or (the higher) Household Expenditure Survey data from the Australian Bureau of Statistics as the basis for their living expense calculations … Our review indicated that many lenders were, at the time, using estimates of living expenses below the HPI or were not regularly updating their estimates”.
So a decade ago, APRA had already publicly named the problem, in the exact same terms as it names it now. It has simply watched as the practice of using a poverty index to measure a customer’s ability to repay a loan has become normalized as a culture.
A consequence of APRA neglect is that “poverty” now goes significantly up the income scale, well into what we generally call the middle class.
As the report further elaborates, the middle class is far more susceptible to slip into poverty as a result of their financial profiles versus either the upper or lower classes:
Middle income people are the cohort in greatest financial risk. They are highly leveraged: they spend more of their income on loan repayments than do people with higher incomes.
Second, their assets are un-diversified: they own labor market skills, some home equity and some superannuation.
Third, these assets are illiquid (not easily sold): you can’t transfer your skills to another, houses are costly to sell and superannuation is generally inaccessible. By contrast, people at the top of the income distribution also hold more debt, but their assets are more diversified and liquid, and many generate income streams. Conversely, low income people hold proportionately less debt and are more diversified than the middle: they don’t have their (more meager) assets tied up in housing.
Fourth, middle income people are under-insured or, in financial terms, unhedged. Their insurance isn’t keeping up with their borrowing. Low income people are relatively well insured. They face compulsory insurance, such as for cars and health. High income people have also not increased their insurance, but their need is less because they are more diversified and have more discretionary funds.
In a commercial setting, financial units that are highly leveraged, un-diversified, illiquid and un-hedged are considered to be high risk.
So who is advocating for the interests of this cohort? Not the regulators. Their mandate is to ensure that households don’t default at unexpected rates and create problems for financial institution solvency (APRA’s concern) or for wider financial stability (The RBA’s concern). The fact that people are living on the Henderson poverty line is not a concern in itself to the regulators; it only matters if they stop paying their bills.
The article’s author, an emeritus professor of political economy at the University of Sydney, concludes that the regulatory system is rigged set up in such a way so that banks can continue to rip off the middle class, as opposed to making sure that the consumer is actually protected:
So Australia’s regulatory framework is vigilant in ensuring that households don’t create stability problems for the financial system, but no regulator has a mandate to ensure that the financial system doesn’t create stability problems for households. Someone or something has to assume this mantle, for mounting poverty and default risk is surely going to play out as a social crisis, not just a financial one.
This leaves the obvious question: if taxpayers are blanketed with regulation that benefits banks at the expense of the middle class, just why did taxpayers (i.e. the middle class) bail out the world’s banks ten years ago?
Pending Home Sales rose just 0.4% MoM (missing expectations of 0.7% MoM) and saw prior months revised notably lower (Feb down from +3.1% to +2.8%).
Weather remains the ‘go to’ blame factor from realtors as the regional differences suggest…
Northeast fell 5.6%; Feb. rose 10.3%
Midwest up 2.4%; Feb. rose 0.7%
South up 2.5%; Feb. rose 2.9%
West fell 1.1%; Feb. fell 0.7%
Unadjusted pending home sales dropped 4.4% YoY (the 4th straight month of declines – the longest streak since 2014)…
“Healthy economic conditions are creating considerable demand for purchasing a home, but not all buyers are able to sign contracts because of the lack of choices in inventory,” Lawrence Yun, NAR’s chief economist, said in a statement.
“Prospective buyers are increasingly having difficulty finding an affordable home to buy.”
“It is an absolute necessity for there to be a large increase in new and existing homes available for sale in coming months to moderate home price growth,” he said.
“Otherwise, sales will remain stuck in this holding pattern and a growing share of would-be buyers — especially first-time buyers — will be left on the sidelines.”
Purchases dropped 5.6 percent in the Northeast, reflecting multiple winter storms…
“As anticipated, the multiple winter storms and unseasonably cold weather contributed to the decrease in contract signings in the Northeast.”
As a reminder, economists consider pending sales a leading indicator because they track contract signings.
For the 26th month in a row, US spending growth outpaced income growth with the latter rising just 3.7% YoY (the lowest since Oct 2017) and former rising 4.6% YoY (slightly faster than in Feb).
Which prompted a drop in the savings rate and a notable downward revision to the last two months (of notable conservatism) with Jan revised down from 3.2% to 3.0% and Feb down from 3.4% to 3.3% and now March at just 3.1%.
However, while income growth did disappoint (rising just 0.3% MoM vs 0.4% MoM expectations), wage growth was up a notable 4.4% YoY with private wages dominating government worker gains (+4.8% YoY vs +2.5% YoY).
Finally we note that Real Personal Spending rose a disappointing 0.4% MoM (versus 0.5% expectations) as The FT notes that the Fed’s favored inflation measure picked up to its strongest level in 17 months in March, further boosting the case for US policy makers to increase rates two or three more times this year after a lift last month.
The so-called core personal consumption expenditures price index, which excludes the volatile food and energy components, jumped 1.9 per cent on the year last month, according to a report from the Bureau of Economic Analysis.
The rise in consumer spending, which accounts for 70% of the economy, gives the economy some momentum at the end of an otherwise weak quarter, and provide some support for forecasts that consumption will accelerate this quarter as tax cuts and a gradual pickup in wages filter into Americans’ bank accounts and sentiment. However, as Bloomberg notes, at the same time, the income figures were slightly below forecasts, reflecting the weakest gain in wages and salaries since October.
Want to know a sad fact?
$20.00 in 1971 has the same buying power as $123.88 in 2018… in other words, inflation has destroyed savings.
Money is supposed to be:
a) medium of exchange b) unit of account c) STORE OF VALUE
As we anticipatedearlier this year, the first the signs of the coming implosion of the US real-estate bubble are emerging in the high end of the nation’s most overcrowded and expensive housing markets (Manhattan and San Francisco are two salient examples).
And in the latest confirmation of this trend,the Wall Street Journalpublished a report this week highlighting how the business environment for commercial landlords in New York City’s most densely populated borough is growing increasingly dire, as landlords who had left storefronts vacant in the hope of courting the next Bank of America or CVS have inadvertently turned trendy downtownManhattan neighborhoods like SoHointo a“shopping wasteland”.
Thanks in large part to their intransigence, commercial landlords who catered to retail tenants are being hit twice as hard as they otherwise would’ve been, as tenants, no longer able to afford rents higher than $600 per square foot, are now demanding concessions and rent reductions, a phenomenon that has seen average rents in certain neighborhoods plummet on a year-over-year basis.
According to CBRE Group, a real estate services firm that pays close attention to commercial rents in Manhattan, some of the hardest-hit neighborhoods are also some of the borough’s most trendy, including the Meatpacking District, and SoHo.
The average asking rent on Washington Street between 14th and Gansevoort streets in the Meatpacking District dropped to $490 a square foot from last year’s $623, a 21.3% decrease and the largest percentage drop in asking rents among the shopping corridors CBRE tracks.
Average asking rents tumbled 18.1% on both SoHo’s Broadway Avenue and the Upper East Side’s Third Avenue, where asking rents were $556 and $280 a square foot, respectively.
Availability remained flat compared with last year, with 209 ground-floor spaces marketed for direct leasing. The report noted, however, that landlords looking to directly lease space also will have to compete with sublease space, which has increased according to anecdotal reports. Some space available for sublease comes as retailers leave behind old quarters for better locations, Ms. LaRusso said.
Conditions are favorable for tenants, said Andrew Goldberg, vice chairman at CBRE. Landlords are more open to shorter-term leases and provisions allowing tenants to get out of leases if a retail concept doesn’t work.
“I think we will start to see some more of the savvier tenants of companies realize we’re starting to get to a point where they can drive some good deals for themselves,” Mr. Goldberg said.
The problem when rents enter free-fall territory is that it’s a self-reinforcing phenomenon (not unlike the blowup that triggered thedemise of the XIV,but over a much longer period of time). As rents fall, retailers start wondering if they can procure a better deal, possibly in a better neighborhood. All of a sudden, landlords must now essentially compete with themselves as the number of subleases climbs.
Of course, Manhattan is Manhattan. There will always be hoards of boutique merchants, big-name brands and – well, Walgreens – clamoring for commercial rental space.
But after nearly a decade of soaring real-estate valuations, it appears one of America’s hottest housing markets is heading for a “gully.”
On the other end of the property market, a drop in valuations and transaction volumes has inspired some observers to proclaim that“this is the breaking point.”
In short, we wish the Kushner Cos the best of luckas they prepare to buy outthe remaining stake in 666 Fifth Ave. Because overpaying for commercial real-estate in Manhattan in 2018, nine years into one of the longest economic expansions on record sounds like a fantastic plan.
Millennials, the largestand most significant generation for the US labor market,came of age in the era of broken central bank policies, leading to the greatest wealth, income and inequality gap in recent history. While baby boomers promised millennials the world through (expensive) college degrees, this generation discovered that massive student loans coupled with a deteriorating work environment had turned them into permanent debt and rent slaves.
And now, according to anew Axios/Survey Monkey poll, millennials are getting angry, and starting to point fingers and cast blame, with a majority accusing baby boomers of not just making things difficult for them, but, of “ruining their lives.”
The survey found 51% of millennials (18 to 34-year-olds) blame baby boomers (51 to 69-year-olds) for making a raft of poor decisions since the 1980s, that have contributed to a weak political and economic environment; only 13% said the boomers made things better. Gen Xers was not satisfied with the pesky boomers, either; as 42% of them have blamed their life’s troubles on the boomers. Most amusingly, upon self-reflection, 30% of boomers agreed that their generation’s policies had made things worse, while only 32% said they had made it better, and 34% answered it made no difference.
This new Axios/SurveyMonkey online poll was conducted April 9-13 among 4,638 adults in the United States. The modeled error estimate is 2 percentage points. Data have been weighted for age, race, sex, education, and geography using the Census Bureau’s American Community Survey to reflect the demographic composition of the United States age 18 and over. Crosstabs availablehere. (Chart: Axios Visuals)
When asked on how to improve today’s economic and political environment, millennials had several modest proposals:
“Remove all old government officials and term limits for the House and Congress,” a 34-year-old male Republican said.
A number said “Impeach Trump” and “vote.”
“Sleep more because you will be less sensitive to negative emotions,” said a 22-year-old female Democrat.
Axios also said millennials have little confidence in their fiscal responsibility than boomers: 56 percent of millennials said they are “extremely” or “very” efficient in wealth preservation techniques, compared with 80 percent of those over 70-years old.
While the economy has entered its late-cycle phase, the dangerous rift is growing between the millennials and boomers, each wrestling for a smaller pool of jobs and shrinking government handouts. The inter-generational conflict will only escalate due to the historic accumulation of debt, and unprecedented shifts in demographics and automation, which will only accelerate into the 2020s.
But the punchline is that if Millennials loathe Boomers now when the economy is still doing relatively well thanks to a decade of central planning and trillions in liquidity, one can only imagine how delighted they will be when the next recession, or rather depression, hits.
As of 2015,American parents spend, on average, $233,610 on child costs from birth until the age of 17, not including college. This number covers everything from housing and food to child care and transportation costs. As a mother myself, as well as a sociologist who studies families, I have experienced firsthand the unexpected costs associated with having a child.
This spike in costs has broad implications, affecting everything from demographic trends and human capital to family consumption.
Expenses for a deliverycan range from $3,000 to upward of $37,000 per child for a normal vaginal delivery and from $8,000 to $70,000 if a C-section or special care is needed.
These costs are often a result of separate fees charged for each individual treatment. Other factors include hospital ownership, market competitiveness and geographical location.
It’s worth noting that these costs often include additional fees for ultrasounds, blood work or high-risk pregnancies.
As a result, for women who are concerned about the costs related to giving birth, it’s important to explore the average costs at their local hospitals and review their insurance plans before they decide to become pregnant.
Child care and activities
The U.S. Department of Health and Human Servicesdeems child care affordableif no more than 10% of a family’s income is used for that purpose. However,parents currently spend9% to 22% of their total annual income on child care, per child.
Child care has become one of the most expensive costs that a family bears. In fact, in many cities,child care can cost more than the average rent. This is particularly challenging for low-income families who often don’t make more than minimum wage.
What’s more, over the past century, Americans significantly shifted in the way that we see childhood. Whereas in the past, children often engaged in family labor, now children are protected and nurtured.
Another hidden cost associated with having a child is that of time. In my experience, many parents don’t realize how much time they will invest in their children, often at the cost of personal freedom and work expectations.
In fact,the American Time Use Surveyshows that, on average, parents with children under the age of 18 spend about 1.5 hours a day on domestic and child-care responsibilities. Women spend 2.5 hours a day, while men spend roughly only one hour on these tasks.
Weighing the causes
Researchers at Pewargue that the recent decrease in birthrate has as much to do with the Great Recession in 2008 as it does with the increase of women who are not willing to sacrifice their careers for family.
This speaks to yet another cost of having children:Mothers are often pushed out of careersor “opt out,” based on high demands of balancing family and work-life balance.
Researchers have also found a growing trend of men and women who becomesingle parents by choice. This group of parents prioritize children over marriage and often are on single incomes. That also contributes to the reduction in overall childbirth, from a financial and practical perspective.
Ultimately, the decision to have a child is a personal one. The data show that the burden of costs and the stress of family life are real. Yet despite the costs associated with having a child, many parents reportoverall satisfaction with their marriage and family life.
Considering the high costs of having of a child, coupled with the tension in balancing family-work life matters, states and companies are starting to invest in family support policies, parental benefits and competitive education. And individuals are creating more innovative approaches to managing family-work balance, such as a reduction in working schedules, family support and a push for more shared responsibilities within the home.
SocGen’s permabear skeptic Albert Edwards is best known for one thing: predicting that the financial world will end in a deflationary singularity, one which will send yields in the US deep in the negative, and which he first dubbed two decades ago as the “Ice Age.” He is also known for casually and periodically forecasting –as he did a few weeks agoin an interview with Barrons – that the S&P will suffer a historic crash, one which will send it back under the March 2009 low of 666.
In this context, a couple of recent events caught Edwards’ attention.
First, speaking of the above mentioned Barron’s interview, Edwards was taken aback by one commentator who took the SocGen strategist to task for his relentless bearishness. Indirectly responding to the reader, in his latest letter to clients Edwards writes that “its good to have a little humility in this business because its so darn humiliating when forecasts are proved wrong. And the bolder the forecast, the more humiliating it is!” He continues:
That is one reason why most commentators on the sell-side never stray too far from consensus. When I was an avid consumer of sell-side research some 30 years ago, there was one thing about the macro sell-side that I truly marvelled at namely the analysts ability to totally reverse a view and pretend that had been their view all along! In the days before the internet and email, I had to rifle through our storage cupboards to find the evidence of what were often 180 degree handbrake turns. In the internet age, there is no hiding any more.
One of the most leveling experiences at the end of an article or interview about my thoughts is to scroll down and read some of the readers comments. In my case, they often marvel that I am still in any sort of employment at all! Some are witty and make me smile - like the one below in response to a recent interview I did with Barrons.
Edwards refers to the comment titled “Prescient as a Broken Clock?” authored by one Gordon Gould from Boulder, Colorado who writes:
“Barron’s notes that Société Générale’s Albert Edwards is a permabear (“S&P 500 Could Still Test 2009 Lows,” Interview, April 7). However, your readers would surely like to know how some of his previous calls have turned out. A quick Google search revealed that nearly five years ago, Edwards called for the Standard & Poor’s 500 index to hit 450 and gold to exceed $10,000. While even a broken clock is correct twice a day, perhaps in Edwards’ case, we’re talking about a broken calendar on Saturn, which takes about 29 years to orbit the sun.”
Albert summarizes his response to this comment eloquently, using just one word: “ouch.” Hit to his pride aside, Albert asks rhetorically “Where did it all go so wrong?” and explains that in the Barrons interview, “I explain why in my Ice Age thesis I still expect US equity prices to fall to new lows in the next recession.” To be sure, this is familiar to ZH readers, as we highlight every incremental piece from Edwards, because no matter if one agrees or disagrees, he always provides the factual backing to justify his outlook, gloomy as it may be.
He explains as much:
I always expected the equity markets day of reckoning to come in a recession with equity valuations falling to lower lows than in the two previous cyclical bear market bottoms in 2001 and 2009. If I am right, the next recession will see a lower level than the forward PE of 10.5x in March 2009. A forward PE of 7x and a 30% decline in forward earnings would take the market to new lows as part of a long-term secular valuation bear market (which began in 2001). Then the stratospheric rise in the market over the past few years will be seen as just a temporary aberration fuelled by QE.
The moment of truth for my strategic Ice Age view will come when we know how far the equity bear market will fall in the next recession, or conversely whether the bond bull market will continue with 10y US yields, for example, falling into negative territory.
And yet, here we are a decade into central planning, and global stocks are just shy of all time highs. How come?
If I were to identify the major error that led me to be too bearish on equities, it would not be the inflationary impact of QE on asset prices. What I got wrong is that after the end of the Great Moderation, which saw an extended period of economic expansion from Dec 2001 to Dec 2007 as well as low financial volatility, triggering rampant credit growth I expected economic volatility to return to normal. The lesson from Japan I told clients was that once their Great Moderation died in 1990, the economic cycle returned to normal amplitude as private credit growth could no longer be induced to keep it going. Thus I expected that after the 2008 economic debacle the US economic cycle would return to normality and for recessions to become much more frequent events as they were in Japan after 1990. And as in Japan, I expected each rapidly arriving recession would take equity valuations down to new lower lows. After 2008, I expected the US economic recovery to quickly fall back into recession and the cyclical bull run in equities to be surprisingly short-lived. How wrong I was!
Indeed, because as Bank of America observed recently, every time the stock market threatened to tumble, central banks would step in: that, if anything, is what Edwards failed to anticipate. The rest is merely noise:
Despite the economy flirting with outright recession on a couple of occasions, this current recovery has endured to the point where we now have enjoyed the second longest economic cycle in US history. We have not returned to normal economic cycles as I had expected. QE has helped this, one of the most feeble economic recoveries in history, to also hobble into the record books for its length!
To be sure, Edwards will eventually get the last laugh as the constant, artificial interventions assure that the (final) crash will be unlike anything ever experienced: “a recession delayed is ultimately a recession deepened as more and more credit excesses have built up, Minsky-like, in the system.”
Then again, will it be worth having a final laugh if the S&P is hovering near zero, the fiat system has been crushed, modern economics discredited, and life as we know it overturned? We’ll cross that bridge when we come to it, for now however, Edwards has to bear the cross of his own forecasting indignities:
… having stepped away from the crazed run-up in equity prices, my reputation for calling the equity market correctly has been severely dented, if it is not actually in tatters. I know that.
Still, it’s not just Edwards. As the strategist notes, increasingly wiser heads than I, who did not leave the equity party early, are suggesting a top might be close. He then goes on to quote Mark Mobious whowe first referenced earlier this week:
The renowned investor Mark Mobius is also getting nervous. The Financial Express reports that “After Jim Rogers recently warned of the ‘biggest crash in our lifetimes,’ veteran investor and emerging markets champion Mark Mobius warns of a severe stock market correction. “I can see a 30% drop. The market looks to me to be waiting for a trigger to tumble.” He then goes on in the article to cite some possible triggers.
To be fair, there are plenty of others who have recently and not so recently joined Edwards in the increasingly bearish camp (among them not only billionaire traders but economists and pundits like David Rosenberg and John Authers), although one thing missing so far has been the catalyst that will push the world out of its centrally-planned hypnosis and into outright chaos. Now, Edwards believes that this all important trigger has finally emerged:
Perhaps the greatest near-term threat to the stability of the equity markets is seen as the recent surge in bond yields, which are now testing the critical 3% technical level.
As this is so important, I want to repeat verbatim what our own Stephanie Aymes says on this point. She says, referring to the front page chart, the 10Y UST is marching towards the major support (price) of 3.00%/3.05% consisting of the multi-decade channel, 2013-2014 lows, and the 61.8% retracement of the 2009-2016 uptrend. Moreover, this is also the confirmation level of the multi-year Double Top, which if confirmed, would act as a catapult towards the 2-year channel limit at 3.33%/3.43%, and perhaps even towards 2009-2011 levels of 3.77%/4.00%, also the 50% retracement of the 2007-2016 up-cycle. The Monthly Stochastic indicator continues to withstand a pivotal decadal floor (blue line in chart) which emphasizes the relevance of the 3.00%/3.05% support.
“Let me translate: 3% resistance is very strong but if broken, there is big trouble afoot!“
The irony, of course, is that yields blowing out is precisely the opposite of an Ice Age, although to Edwards the implication is simple: once stocks tumble, it will force the Fed to return to active management of markets and risk, and launch the next Fed debt monetization program which will culminate with the end of the current economic paradigm, and Edwards’ long anticipated collapse in risk assets coupled with the long-overdue arrival of the Ice Age.
Or maybe not, as Edwards’ parting words suggest:
I think, like Mark Mobius, that equities are looking for an excuse to sell off and the current rally may abruptly end for any number of reasons. Although I personally do not think it likely that US bonds can break much above 3%, if at all, I discount nothing given the clear end of cycle cyclical pressures that have built up. But if I am wrong on bonds and we have seen the end of the bond bull market, after having been wrong on equities, maybe it is time to think hard on what the Barrons correspondent said and take a sabbatical – maybe on Saturn.
And while we commiserate with Albert’s lament, it could certainly be worse: have you heard of Dennis Gartman?
“I felt a great disturbance in the farce, as if millions of socialist voices suddenly cried out in terror, and were suddenly silenced. I fear something rational has happened.”
With high-profile champions such as Richard Branson, Facebook boss Mark Zuckerberg, and Tesla CEO Elon Musk, backing the idea of governments giving non-working people money (from working people) to do nothing – what could go wrong?
Well, two years after enthusiastically beginning its experiment with a universal basic income – in which people are paid an unconditional salary by the state instead of benefits – Finland is abandoning the project as government enthusiasm wanes and additional funding requests are rejected.
As a reminder,The Telegraphexplains Universal basic income is a form of cash payment given to individuals, without means testing or work requirements. In some models this is at a rate sufficient to cover all living expenses.
Proponents argue that:
The lack of expensive means-testing leads to a higher proportion of the budget going to recipients. This would be more efficient
The transparency of universal payments would drastically reduce the need to detect benefits fraud
One scheme could replace the current complex arrangement of government benefits, rebates and tax rebates
Work will always benefit recipients of this welfare, rather than the ‘benefits trap’ that leaves part-time workers
Critics argue that:
Universal income may be inflationary and, in attempting to move all individuals out of poverty, it may simply raise the level of the poverty line
It may reduce the incentive to work and studies have found some evidence to support this.
A reduction in taxable income would reduce the government’s ability to cover other expenses, such as healthcare
Universal income as a policy dates from at least Thomas Paine’s 1795 Agrarian Justice. It is currently more closely aligned with left-wing politics, where it would be funded through income from nationalised assets.
Several countries have experimented with a universal basic income, including Finland, Canada, Kenya and the Netherlands. And now Finland has killed the plan…(via The Guardian)
Since January 2017, a random sample of 2,000 unemployed people aged 25 to 58 have been paid a monthly €560 (£475) , with no requirement to seek or accept employment. Any recipients who took a job continued to receive the same amount.
Furthermore, the government has also imposed stricter benefits plans, introducing legislation making some benefits for unemployed people contingent on taking training or working at least 18 hours in three months.
“The government is making changes taking the system away from basic income,” Kela’s Miska Simanainen told the Swedish newspaper Svenska Dagbladet.
Of course, the liberal socialist gliterrati are up in arms over Finland’s decision.
Olli Kangas, an expert involved in the trial, told the Finnish public broadcaster YLE:
“Two years is too short a period to be able to draw extensive conclusions from such a big experiment. We should have had extra time and more money to achieve reliable results.”
However, as we previously noted, as automation and AIdestroy millions of middle-income jobs,permanently forcing (primarily male) workers from the workforce, Americans are beginning to reconsider their attitudes toward a radical policy tool that’s popular among some segments of the left: Universal Basic Income.
According toCNBC, a recent poll conducted by Northeastern University and Gallup found that 48% of Americans support the measure. In an association that’s hardly a coincidence, the poll also showed that three-quarters of Americans believe machines will take away more jobs than they’ll generate…
Unsurprisingly 65% of Democrats want to see a universal basic income and 54% of people between the ages of 18 and 35 do. In comparison, just 28% of Republicans support UBI.
While proposals for universal basic income programs vary, the most common one is a system in which the federal government sends out regular checks to everyone, regardless of their earnings or employment. That system is being tested in Canada as well asStockton, California,which recently emerged from bankruptcy but remains mired in poverty.
Perhaps Finland’s failure will wake some of the free shit army up that it can’t end well.
The housing market is starting to overheat. Again.
According to the latest BLS data, average hourly wages for all US workers in November rose at a relativelybrisk 2.7% relative to the previous year, if below the Fed’s “target” of 3.5-4.5% as countless economists are unable to explain how 4.1% unemployment, and “no slack” in the economy fails to boost wage growth. Another problem with tepid wage growth, in addition to crushing the Fed’s credibility, is that it keeps a lid on how much overall price levels can rise by, i.e. inflation. Meanwhile, with record global debt, it has been the Fed’s imperative to boost inflation at any cost to inflate away the debt overhang, however weak wages have made this impossible.
Well, not really.
Because a quick look at US housing shows that while wages may be growing at roughly 2.7%, according to thelatest Case Shiller data, 18 of 20 metro areas in the US saw home prices grow at a higher pace, while 16 of 20 major U.S. cities experienced home price growth of 5.4% or higher, double the average wage growth, and something which even the NAR has been complaining about with its chief economist Larry Yun warning that as the disconnect between prices and wages becomes wider, homes become increasingly unaffordable for most Americans.
Confirming the recent jump in home prices, at the national level in February home prices for the Top 20 metro areas soared 6.8% YoY according to Case Shiller, the fastest rate since June 2014…
… and hitting a new all time high nationwide.
And while this should not come as a surprise – considering we have pointed it out on numerous occasions in the past – one look at the chart below confirms that something very troubling is taking place in San Francisco, which has either become “Vancouver South” when it comes to Chinese hot money laundering, or the second housing bubble has finally arrived on the West Coast. And while according to Case-Shiller data, home prices in San Francisco rose “only” 10.1% Y/Y, a more accurate breakdown of San Fran housing prices fromParagon Real Estateindicates a record 24% annual increase in San Francisco home prices, which increased by $110,000 in just the past quarter.
Behold: a housing bubble…
Also worth keeping an eye on: price appreciation in Sin City has quietly surged in recent months, and in February home prices jumped 11.6% Y/Y, the highest annual increase in years. Considering Las Vegas was the epicenter of the last housing bubble when prices exploded higher only to crash, it may be a good idea to keep a close eye on price tendencies in this metro area for a broader confirmation of the second housing bubble, than just the microcosm that is San Francisco.
* * *
Meanwhile, for those looking to buy for the first time, conditions have never been worse. Growth in property values is outpacing wage gains and limiting affordability, representing a major headwind for first-time buyers, and the broader market.
Finally, putting the above data in context, here are twocharts courtesy of real-estate expert Mark Hanson, the first of which shows how much household income increase is needed to buy the median priced home in key US cities…
… while the next chart shows the divergence between actual household income, and the income needed to buy the median priced house.
It wouldn’t be another day in April 2018 if there wasn’t yet another negative Tesla headline hitting the wire.
That’s right –Tesla has once again been sued, this time as it relates to contract workers at its Fremont factory. Tesla is party to a lawsuit that was also aimed at Balance Staffing, a company responsible for staffing workers at Tesla’s Fremont factory. These workers have alleged not only that they are due additional overtime pay, but also that the service that placed them at Tesla encouraged them to accept debit cards instead of paychecks when it came time to get paid.
The article continues, citing the temp agency’s standards for overtime pay:
Nezbeth-Altimore points to Balance Staffing’s policy to illustrate her claims over failure to pay necessary overtime wages and provide proper rest periods.California law requiresemployees to be paid one-and-a-half times their regular rate of pay if they work more than eight hours a day or 40 hours total in a week. After 12 hours in a day, workers are entitled to double their pay.
In its handbook, Balance Staffing only mentions overtime pay for workers who put in more than 8 hours in a work day or 40 hours in a week, the suit says. It makes no mention of working 12 hours a day, according to the suit,something known to happen at Fremont in the past. (CEO Elon Musksaid this weekthat Tesla will be hiring several hundred workers as part of an effort to run Fremont 24/7 to build more Model 3 sedans.)
“During the relevant time period, Defendants willfully failed to pay all overtime wages owed to Plaintiffs and class members,” the suit says.
Finally, the article notes additional litigation that is outstanding dealing with Tesla’s working conditions, and the obligatory statement from the company, denying it has anything to do with this lawsuit, despite being named a defendant:
Tesla is facing several lawsuits from contract workers over alleged racial bias and abuse at Fremont. One of those cases is moving toward trial,Bloomberg reported last week, as the contract workers aren’t required to settle disputes through binding arbitration, customary for full-time Tesla workers.
In a statement, a Tesla spokesperson said the automaker “goes above and beyond the requirements of California and federal law in providing workers meal and rest breaks and appropriate overtime pay.”
“This is a dispute between a temporary worker and her employer staffing agency, which is responsible for payment of her wages,” the statement said. “There is no specific wrongdoing alleged against Tesla. Regardless, whether Tesla or a staffing agency, we expect employers to act ethically, lawfully and do what is right.”
Is it even possible that both the cash crunch – and the legal issues – at Tesla are getting worse instead of getting better? Regardless, as it relates the company’s finances, those on the short side are starting to smell blood.
Late last weekwe did a reporton Vilas Capital Management – which has a majority of its short book dedicated to Tesla – and its recent reasoning for making its Tesla short such a large percentage of its capital:
We added meaningfully to our Tesla position in the first quarter at prices in the $340 range. We continue to believe that Tesla is extremely overvalued and that it will experience significant financial difficulties over time.
All companies in a capitalistic system need to earn profits and those profits need to be attractive relative to the amount of shareholder capital employed. Tesla has never earned an annual profit. Along with digital currencies and Unicorns, Tesla appears to be caught up in a gold-rush-fever type of emotional response, both from a “they will take over the world” and a “they will save the world” combination of hopes, instead of their owners looking at the numbers.
Tesla bulls will argue that their production will rise to 5000 Model 3’s per week soon and, therefore, the stock will trade meaningfully higher. Given that the company lost $20,000 per Model S and X sold for roughly $100,000 each last year, due to the fact that it cost more to build, sell, service, charge and maintain these cars than they collected in revenue, as it is important to include all costs when evaluating a business, we predict it will impossible for Tesla to make a profit on a $35,000 to $50,000 car.
As anyone with automotive experience knows, profit margins are far higher on bigger, more expensive cars. Therefore, the faster Tesla makes Model 3’s, the more money they will lose.
Vilas continued:
Roughly five institutions make up nearly 50% of Tesla’s freely floating shares. All it will take is for one of them to realize the likely fact that the company won’t ever earn an annual profit, has been overly optimistic, at best, or quite dishonest, at worst, with their projections of cash flow and profit and Tesla’s shares should fall precipitously. We believe that the CEO’s recent tweet that the company will be profitable and will generate positive cash flow in the second half of the year are likely attempts to artificially inflate the stock and keep creditors at bay.
Given that our calculations show that Tesla needs to raise at least $5 billion of equity, if not closer to $8 billion, to stay solvent in the next 14 months, the company needs to find at least another dozen Ron Baron sized investors.
We do not believe that this will be possible given their expected future losses, working capital and capital expenditure needs, lousy execution with the Model 3, falling demand for their somewhat stale Model S and Model X, tax rebates of $7,500 per car that will start going away shortly, impending competition from Jaguar, Mercedes, Porsche, BMW, Audi, etc., the credit rating downgrade by Moody’s to Caa+ while leaving the credit on watch for further downgrades (Caa+ is basically defined as impending default), the NTSB investigation into the accident caused by the “Full Self Driving” option that they collected $3000 for (which may create a class action lawsuit, fines and the disabling of the feature), the fact that they have had 85 letters and investigations back and forth with the SEC (a very unusual pattern), the fact that their three top finance executives (CFO, Chief Accounting Officer, and Director of Finance) have left the company over the last 18 months leaving huge amounts of awarded by unvested shares on the table, a highly suspicious pattern, and the fact that the company owes suppliers roughly $3 billion of unsecured payments, which could be “called” at any time, similar to a run on a bank.
If Tesla’s suppliers simply asked for their past invoices to be paid and to be paid in cash at the time of their next parts delivery, a likely outcome the worse Tesla’s balance sheet gets, it is clear that Tesla would need to file for protection from creditors. Further, the banks lending Tesla money cannot ignore the balance sheet. They have strict rules that regulators enforce about lending to companies with increasingly negative working capital.
The company’s story about further drawing down lines of credit to finance operating losses and capital expenditure needs may seem plausible to novice investors but, in our opinion, not to suppliers and regulated lenders. In a game of financial musical chairs, it is important to sit down quickly.
Who in their right mind would continue to finance this money losing operation? Up to this point, it has been from growth investors who have likely never owned an auto stock before. Once they figure out the industry and the truth about Tesla’s future, we doubt it will continue.
This second lawsuit and continued scrutiny comes at a time when Tesla is publicly under some of the worst pressure its been under since its founding. The media narrative on the company has certainly has certainly become slightly more skeptical and this has, in turn, triggered Elon Musk to set bigger goals and larger milestones for the future.
The tally of bad press, lawsuits and investigations of recent relating to Tesla is starting to pile up.
Critics of the companybelieve that Elon Musk should be a target by the SEC if these goals – once again, easy to promise, not as easy to deliver – aren’t met. They have been the only thing that has kept Tesla’s stock price from falling well below the $300 mark over the last couple of weeks, despite all of the negative press. This new lawsuit is just another negative to add to that pile.
We were not the only ones who were left speechless by Thursday’s Tesla Tanturm: Elon Musk’s bizarre, childish, perhaps intoxicated, meltdown during Tesla’s conference call, in which he interrupted an analysts, cutting him off in the middle of the question for being “boneheaded, boring and dry”
Listen to an excellent podcast at the end of this article.Dense housing makes San Francisco one of the most compact cities in America. Photo via Thinkstock
The mostcontroversialstate housing bill in recent memory died with a pretty resounding thud.
Senate Bill 827,which would have forced cities to allow taller, denser development around public transit, got only four votes on the 13-member Senate Committee on Transportation and Housing. Both Democrat and Republican lawmakers voted against the bill.
Authored by state Sen. Scott Wiener, Democrat from San Francisco, the bill would have allowed developers to build five-story apartment buildings near major public transit stops, including neighborhoods previously zoned for single family homes. The bill received a ton of media attention, including a fairly flattering write-up on the front page of the New York Times.
The mostcontroversialstate housing bill in recent memory died with a pretty resounding thud.
Senate Bill 827,which would have forced cities to allow taller, denser development around public transit, got only four votes on the 13-member Senate Committee on Transportation and Housing. Both Democrat and Republican lawmakers voted against the bill.
Authored by state Sen. Scott Wiener, Democrat from San Francisco, the bill would have allowed developers to build five-story apartment buildings near major public transit stops, including neighborhoods previously zoned for single family homes. The bill received a ton of media att
Urbanist “Yes In My Backyard” (YIMBY) groups mourned the bill’s death as yet another roadblock to building the new housing the state so desperately needs. Cities and anti-gentrification groups cheered the demise of what they viewed as an unprecedented inroad on local control.
What to make of all the hubbub? Some key takeaways:
Enemies, enemies, got a lot of enemies
It’s tough for anyone to take on cities and counties, who wield enormous power in Sacramento and to whom state legislators often give considerable deference. It’s tough for anyone to take on the construction trades’ union, a major source of campaign contributions for Democratic lawmakers. It’s tough for anyone to take on equity and social justice groups, who can bend the ear of progressive legislators.
It’s really tough to take on all three at the same time. That likely wasn’t Sen. Wiener’s strategy when he first introduced SB 827, but that’s ultimately what helped doom the bill. The support of realtors, developers, YIMBYs and a handful of affordable housing advocates couldn’t muster the votes he needed.
Supporters of the bill arguably made a misstep in not courting social justice groups early enough. A flurry ofamendmentsto protect renters from being displaced and to force developers to include units reserved for lower-income tenants failed to calm their concerns.
Last year, Wiener was able to push througha billthat stripped local control over some housing developments by getting labor and affordability advocates on his side. That bill was also part of alarger package of housing legislation that had something for everyone, including a new revenue source. Gov. Jerry Brown was a driving force behind that package.
None of that that happened this time.
The bill did spark a statewide debate on whether to up density to help remedy our housing crisis
Opponents came from San Francisco and its environs to lobby against the bill—and the gentrification they feared it would bring. Photo by Matt Levin for CALmatters
What Wiener was attempting was truly revolutionary. You can debate how dramatically the character of a city would change by building a five-story apartment building next to a single family home. But taking away the power of local governments to block those types of developments was a pretty radical step—a step that a growing number of Californians think is necessary to prevent cities from obstructing new housing.
The bill received a ton of media attention, both in California and nationally. It garnered support from prominent urban planners, environmentalists and civil rights advocates. It’s both cliche and premature to say it shifted the needle on the housing debate. But it certainly framed the conversation squarely around the state’s role in compelling cities to build.
Expect something like this to come back soon.
Nearly every Democratic legislator who voted against SB 827 caveated their opposition by praising the bill’s vision and audacity. Sen. Jim Beall, Democrat from San Jose and chair of the housing committee, said at the hearing that while he couldn’t support the bill in its current form, he was eager to work on something like it in the months ahead.
Could SB 827 ever rise from the dead? Well for his part, Wiener has vowed to re-introduce something like it in the future. Combining his push for density around transit stations with a broader mix of tenant protections and new funding for affordable housing could make it more palatable to the interest groups Wiener needs to succeed.
Rising home prices, rising mortgage rates and rising demand are colliding with a critical shortage of homes for sale. And all of that is slamming housing affordability.
This year, affordability — based on the amount of the monthly mortgage payment will weaken at the fastest pace in a quarter century, according to researchers at Arch Mortgage Insurance.
Other studies that factor in median income also show decreasing affordability because home prices are rising far faster than income growth.
It is the perfect storm: Rising home prices, rising mortgage rates and rising demand are colliding with a critical shortage of homes for sale.
And all of that is slamming housing affordability, which is causing more of today’s buyers to overstretch their budgets. This year, affordability — a metric based solely on the amount of the monthly mortgage payment — will weaken at the fastest pace in a quarter century, according to researchers at Arch Mortgage Insurance.
The average mortgage payment, based on the median-priced home, increased by 5 percent in the first quarter of 2018 nationally and could go up another 10 to 15 percent by the end of the year, according to their report.
Researchers looked at the median-priced home, now $250,000, and estimated price gains this year of 5 percent in addition to mortgage rates going from 4 percent to 5 percent on the 30-year fixed. Other studies that factor in median income also show decreasing affordability because home prices are rising far faster than income growth.
That is a national picture – but all real estate is local, and some markets will see affordability weaken more dramatically. The average monthly payment in Tacoma, Washington, is estimated to increase 25 percent this year, given sharply rising prices. In Baltimore and Boston, it could rise 21 percent in each. Philadelphia, Detroit and Las Vegas could all see 20 percent increases in the average monthly payment.
“If mortgage rates and home prices continue to rise as expected, affordability will get hammered by year-end as demand continues to outstrip supply,” said Ralph DeFranco, global chief economist-mortgage services at Arch Capital Services. “A strong U.S. economy combined with a housing shortage in many markets means that there is little hope of any price drop for buyers. Whether someone is looking to upgrade or purchase their first home, the window to buy before rates jump again is probably closing fast.”
Barely a decade after home values crashed especially, they are now hovering near their historical peak, accounting for inflation. Prices are being driven by record low inventory of homes for sale. Home builders are still producing well below historical norms, and demand for housing is very hot. The economy is stronger, which is giving younger buyers the incentive and the means to buy homes.
Stretching budgets and pushing limits
Maryland real estate agent Theresa Taylor said the supply shortage is hitting buyers hard. She is seeing more clients stretch their budgets to win a deal amid multiple offers.
“People are having to escalate offers on top of rates going up. I’m seeing it in all price ranges,” said Taylor, an agent at Keller Williams. “I am seeing it when I’m getting five offers, and people are trying to package up an offer where they’re pushing their limits.”
Buyers are taking on much higher debt levels today to be able to afford a home. In fact, the share of mortgage borrowers with more than 45 percent of their monthly gross income going to debt payments more than tripled in the second half of last year. Part of that was because Fannie Mae raised that debt-to-income threshold to 50 percent, but clearly there was demand waiting.
“Family income is rising more slowly than home prices and mortgage rates, meaning that the mortgage payment takes a bigger bite out of income for new home buyers,” said Frank Martell, president and CEO of CoreLogic. “CoreLogic’s Market Conditions Indicator has identified nearly one-half of the 50 largest metropolitan areas as overvalued. Often buyers are lulled into thinking these high-priced markets will continue, but we find that overvalued markets will tend to have a slowdown in price growth.”
CoreLogic considers a market overvalued when home prices are at least 10 percent higher than the long-term, sustainable level. High demand makes the likelihood of a national home price decline very slim, but certain markets could see prices cool if supply grows or if there is a hit to the local economy and local employment.
In any case, the more home buyers stretch, the more house-poor they become, and the less money they have to spend in the rest of the economy.
With no relief in either inventory or home price appreciation in sight, the housing market is likely to become even more competitive this year.
At some point, however, there will come a breaking point when sales slow, which is already beginning to happen in some cities. Home prices usually lag sales, so if history holds true, price gains should start to ease next year.
When ZH reported Wells Fargo’s Q4 earningsback in January, they drew readers’ attention to one specific line of business, the one they dubbed the bank’s “bread and butter“, namely mortgage lending, and which as they then reported was “the biggest alarm” because “as a result of rising rates, Wells’ residential mortgage applications and pipelines both tumbled. Specifically in Q4 Wells’ mortgage applications plunged by $10bn from the prior quarter, or 16% Y/Y, to just $63bn, while the mortgage origination pipeline dropped to just $23 billion”, and just shy of the post-crisis lows recorded in late 2013.
Fast forward one quarter when what was already a grim situation for Warren Buffett’s favorite bank, has gotten as bad as it has been since the financial crisis for America’s largest mortgage lender, because buried deep in its presentation accompanyingotherwise unremarkable Q1 results(modest EPS and revenue beats), Wells just reported that its ‘bread and butter’ is virtually gone, and in Q1 2018 the amount in the all-important Wells Fargo Mortgage Application pipeline failed to rebound, and remained at $24 billion, the lowest level since the financial crisis.
Yet while the mortgage pipeline has not been worse since in a decade despite the so-called recovery, at least it has bottomed. What was more troubling is that it was Wells’ actual mortgage applications, a forward-looking indicator on the state of the broader housing market and how it is impacted by rising rates, that was even more dire, slumping from $63BN in Q4 to $58BN in Q1, down 2% Y/Y and the the lowest since the financial crisis (incidentally, a topic we covered just two days ago in “Mortgage Refis Tumble To Lowest Since The Financial Crisis, Leaving Banks Scrambling“).
Meanwhile, Wells’ mortgage originations number, which usually trails the pipeline by 3-4 quarters, was nearly as bad, plunging $10BN sequentially from $53 billion to just $43 billion, the second lowest number since the financial crisis. Since this number lags the mortgage applications, we expect it to continue posting fresh post-crisis lows in the coming quarter especially if rates continue to rise.
Adding insult to injury, as one would expect with the yield curve flattening to 10 year lows just this week, Wells’ Net Interest margin – the source of its interest income – failed to rebound from one year lows, and missed consensus expectations yet again. This is what Wells said about that: “NIM of 2.84% was a stable LQ as the impact of hedge ineffectiveness accounting and lower loan swap income was offset by the repricing benefit of higher interest rates.” But we’re not sure one would call this trend “stable” as shown visually below:
There was another problem facing Buffett’s favorite bank: while NIM fails to increase, deposits costs are rising fast, and in Q1, the bank was charged an average deposit cost of 0.34% on $938MM in interest-bearing deposits, exactly double what its deposit costs were a year ago.
And finally, there was the chart showing the bank’s consumer loan trends: these reveal that the troubling broad decline in credit demand continues, as consumer loans were down a total of $9.5BN sequentially across all product groups, far more than the $1.7BN decline last quarter.
What these numbers reveal, is that the average US consumer can not afford to take out mortgages at a time when rates rise by as little as 1% or so from all time lows. It also means that if the Fed is truly intent in engineering a parallel shift in the curve of 2-3%, the US can kiss its domestic housing market goodbye.
The US is starting to admit they have a terminal spending problem.
According to the latestMonthly Treasury Statement, in March, the US collected $210.8BN in receipts – consisting of $88BN in individual income tax, $98BN in social security and payroll tax, $5BN in corporate tax and $20BN in other taxes and duties- a drop of 2.7% from the $216.6BN collected last March and a clear reversal from the recent increasing trend…
… even as Federal spending surged, rising 7% from $392.8BN last March to $420BN last month, the second highest monthly government outlay on record…
… where the money was spent on social security ($85BN), defense ($58BN), Medicare ($75BN), Interest on Debt ($33BN), and Other ($170BN).
The resulting surge in spending led to a March budget deficit of $208.7 billion, far above the consensus estimate of $186BN, and over 18% higher than $176.2BN deficit recorded a year ago. This was the biggest March budget deficit in US history.
The March deficit brought the cumulative 2018F budget deficit to over $600bn during the first six month of the fiscal year, or roughly $100 billion per month; as a reminder the deficit is expect to rise further amid the tax and spending measures, and rise above $1 trillion, although at the current run rate it is expected to hit $1.2 trillion. As we showed In a recent report, CBO has also significantly raised its deficit projection over the 2018-2028 period.
But while out of control government spending is clearly a concern, an even bigger problem is what happens to not only the US debt, whichrecently surpassed $21 trillion, but to the interest on that debt, in a time of rising interest rates.
As the following chart shows, US governmentInterest Paymentsare already rising rapidly, and just hit an all time high in Q4 2017. That’s when Fed Funds was still in the low 1%’s. What happens when it reaches 3% as the Fed’s dot plot suggests it will?
In a note released by Goldman after the blowout in the deficit was revealed, the bank once again revised its 2018 deficit forecast higher, and now expect the federal deficit to reach $825bn (4.1% of GDP) in FY2018 and to continue to rise, reaching $1050bn (5.0%) in FY2019, $1125bn (5.4%) in FY2020, and $1250bn (5.5%) in FY2021.
Revising Our Deficit and Debt Forecasts
Goldman also notes that it expects that on its current financing schedule the Treasury still faces a financing gap of around $300bn in FY2019, rising to around $750bn by FY2021, and will thus need to raise auction sizes substantially over the next couple of years to accommodate higher deficits.
What does this mean for interest rates? The bank’s economic team explains:
The increase in Treasury issuance and the ongoing unwind of QE should put upward pressure on long-term interest rates. On issuance, the economic research literature suggests as a rule-of-thumb that a 1pp increase in the deficit/GDP ratio raises 10-year Treasury yields by 10-25bp. Multiplying the midpoint of this range by the roughly 1.5pp increase in the deficit due to the recent tax and spending bills implies a 25bp increase in the 10-year yield. On the Fed’s balance sheet reduction, our estimates suggest that about 40-45bp of upward pressure on the 10-year term premium remains.
And here a problem emerges, because while Goldman claims that “the deficit path is known to markets, but academic research suggests these effects might not be fully priced immediately… the balance sheet normalization plan is known too, but portfolio balance effect models imply that its impact should be gradual” the bank also admits that “the precise timing of these effects is uncertain.”
What this means is that it is quite likely that Treasurys fail to slide until well after they should only to plunge orders of magnitude more than they are expected to, in the process launching the biggest VaR shock in world history, because as a reminder, as of mid-2016, a1% increase in rates would result in an estimated $2.1 trillion loss to government bond P&L.
Meanwhile, as rates blow out, US debt isexpected to keep rising, and somehow hit $30 trillion by 2028…
… all without launching a debt crisis in the process.
FromSacramento Bee: California’s government would set prices for hospital stays, doctor visits and other health care services under legislation introduced Monday, vastly remaking the industry in a bid to lower health care costs.
The proposal, which drew swift opposition from the health care industry, comes amid a fierce debate in California as activists on the left push aggressively for a system that would provide government-funded insurance for everyone in the state.
Across the country, rising health care costs have put the industry, lawmaker and employers and consumers at odds.
The proposal in California would affect private health plans, including those offered by employers and purchased by individuals. A nine-member commission appointed by the governor and legislative leaders would set prices for everything from a physical exam to an allergy test to heart bypass surgery. No other state has such a requirement.
“If we do not act now, I’m concerned that health care prices will become unsustainable,” Assemblyman Ash Kalra, a freshman Democrat from San Jose who wrote the legislation, said in a news conference in Sacramento.
The measure faces an uphill battle in the Legislature, where lawmakers are generally cautious about making drastic changes to the health care system and are already juggling a wide range of ambitious proposals.
The proposal is backed by influential unions including the Service Employees International Union, Unite Here and the Teamsters. The unions are frustrated that health care costs are gobbling an increasing share of employee compensation.
“Every dollar that we spend on rising health care prices is a dollar that comes out of a worker’s pocket,” said Sara Flocks, policy coordinator for the California Labor Federation, a union coalition. “This is something that is eating up our wages and it is increasing income inequality. This is a fundamental question of fairness.”
Health care providers say price controls would encourage doctors to move out of state or retire, making it harder for people to see a physician when they’re sick, and force hospitals to lay off staff or, in some cases, close their doors.
The California Medical Association, which represents physicians, called the proposal “radical” and warned that it would reduce choices for consumers.
“No state in America has ever attempted such an unproven policy of inflexible, government-managed price caps across every health care service,” Dr. Theodore Mazer, the CMA president, said in a statement.
Under Kalra’s bill, prices would be tied to Medicare’s rate for a particular service or procedure, with that price as a floor. There would be a process for doctors or hospitals to argue that their unique circumstances warrant payments higher than the state’s standard rate.
Paying hospitals 125 percent of Medicare’s rate would cut $18 billion in revenue and force them to trim nurses and other support staff, said Dietmar Grellman, senior vice president of the California Hospital Association. Private insurers make up for the low payments from government-funded health care, which doesn’t cover the full cost of care, he said.
“That’s why their bill is such an empty promise,” Grellman said. “They take money out of the system with rate regulation, but then they don’t address the huge gaping hole that’s created by Medicare and Medicaid.”
In recent decades health care spending has risen faster than inflation and wages while employers and health plans have shifted more of the costs onto consumers through higher premiums, deductibles and co-pays. Americans spend more per capita on health care than other developed countries.
Meanwhile, a wave of consolidation by hospitals, physician groups and insurance companies has given industry players more power to demand higher rates.
From “Bitcoin is a fraud” in September to “Busted for Bitcoin fraud” in April.
Reuters reportsthat JPMorgan Chase & Co has been hit with a lawsuit in Manhattan federal court accusing it of charging surprise fees when it stopped letting customers buy cryptocurrency with credit cards in late January and began treating the purchases as cash advances.
Simply put, the bank switched from charging regular interest rates to charging, higher, cash advance rates on purchases of cryptocurrencies without notice to customers about the change.
The named plaintiff in the lawsuit, Idaho resident Brady Tucker, was hit with $143.30 in fees and $20.61 in surprise interest charges by Chase for five cryptocurrency transactions between Jan. 27 and Feb. 2, his lawsuit said.
With no advance warning, Chase “stuck the plaintiff with the bill, after the fact of his transactions, and insisted that he pay it,” the lawsuit said.
Hundreds or possibly thousands of other Chase customers were hit with the charges, Tucker said.
The lawsuit is asking for actual damages and statutory damages of $1 million.
Home sales in Manhattan plunged by the most since the recession as buyers at all price levels drove hard bargains and were in no rush to close deals.
Haggling gets more aggressive for listings at all price points
‘People are very anxious about overpaying,’ brokerage CEO says
Sales of all condos and co-ops fell 25 percent in the first quarter from a year earlier to 2,180, according to a report Tuesday by appraiserMiller Samuel Inc.and brokerageDouglas Elliman Real Estate. It was the biggest annual decline since the second quarter of 2009, when Manhattan’s property market froze in the wake of Lehman Brothers Holdings Inc.’s bankruptcy filing and the global financial crisis that followed.
The drop in sales spanned from the highest reaches of theluxury marketto workaday studios and one-bedrooms. Buyers, who have noticed that home prices are no longer climbing as sharply as they have been, are realizing they can afford to be picky. Rising borrowing costs and new federal limits ontax deductions for mortgage interest and state and local levies also are making homeownership more expensive, giving shoppers even more reasons to push back on a listing’s price — or walk away.
While just a few years ago, bidding wars were the norm, “there’s nothing out there today that points to prices going up, and in many buyers’ minds, they point to being flat,” said Pamela Liebman, chief executive officer of brokerage Corcoran Group. “They’re now aggressive in the opposite way: putting in very low offers and seeing what concessions they can get from the sellers.”
Corcoran Group released its own Manhattan market report Tuesday, showing an 11 percent decrease in completed purchases and a 10 percent drop in sales that are pending.
For sellers, to reach a deal in the first quarter was to accept a lower offer. Fifty-two percent of all sales that closed in the period were for less than the last asking price, according to Miller Samuel and Douglas Elliman. Buyers agreed to pay the asking price in 38 percent of deals, but often that figure had already been reduced. Combined, the share of deals without a premium was the biggest since the end of 2012.
“Even with New York real estate prices, you do hit a point in which resistance sets in,” said Frederick Peters, CEO of brokerage Warburg Realty. “People are very anxious about overpaying.”
Peters said that these days, he gets dozens of emails a day announcing price reductions for listings. And buyers are haggling over all deals, no matter how small. In a recent sale of a two-bedroom home handled by his firm, a buyer who agreed to pay $1.5 million — after the seller cut the asking price — suddenly demanded an extra $100,000 discount before signing the contract. They agreed to meet halfway, Peters said.
Buyers also are finding value in co-ops, which in Manhattan tend to be priced lower than condos. Resale co-ops were the only category to have an increase in sales in the quarter, rising 2 percent to 1,486 deals, according to Corcoran Group. Sales of previously owned condos, on the other hand, fell 12 percent as their owners clung to prices near their record highs, the brokerage said.
The median price of all sales that closed in the quarter was $1.095 million, down 5.2 percent from a year earlier, brokerage Town Residential said in its own report. Three-bedroom apartments saw the biggest drop, with a decline of 7 percent to a median of $3.82 million, the firm said.
Prices fell the most in the lower Manhattan neighborhoods of Battery Park City and the Financial District, where the median slid 15 percent from a year earlier to $1.21 million, according to Corcoran Group. On the Upper West Side, the median dropped 8 percent to $1.1 million.
Neither new developments nor resales were spared from buyer apathy. Purchases of newly constructedcondos, which continue to proliferate on the market, plummeted 54 percent in the quarter to 259, Miller Samuel and Douglas Elliman said. Sales of previously owned apartments dropped 18 percent to 1,921.
The plunge in transactions is actually a good thing, in that it may serve as a wake-up call for more sellers to scale back their price expectations, said Steven James, Douglas Elliman’s CEO for the New York City region.
“It sends the sellers a signal that you have to get more reasonable if you want my buy,” James said. “It’s like buyers said, ‘I’ve told you all along, but you wouldn’t listen! Now I have your attention, so let’s talk.”
Once again, when the government intervenes – this time in housing – the left hand is starting a fire that the right hand is trying to put out. Rising prices for homes are once again pricing out prime borrowers and nobody can “figure out” why this is happening.
It is news likethis articlereported this morning by the Wall Street Journal that continues to perpetuate the hilarious notion of Keynesian economics as giving a job to one man digging a hole and another job to another man filling it, simply so that they both have jobs.
There is nothing funnier (or sadder) than “economists” struggling to understand how housing prices got so high and why people are taking on more debt in order to purchase them. However, that is the great mystery that the Wall Street Journal reported on Tuesday morning, making note of the fact that people are “stretching“ in order to purchase homes. What’s the solution to this problem? How about just easing lending standards again? After all, what could go wrong?
Apparently blind to the obvious – that forced inflation could amazingly make things more expensive relative to income – “economists” have hilariously blamed this price/debt delta on lack of supply. Of course, no one has mentioned the credit worthiness of borrowers getting worse or the fact that homes prices are being manipulated in order to offer home ownership to people who otherwise may not be in the market.
More Americans are stretching to buy homes, the latest sign that rising prices are making homeownership more difficult for a broad swath of potential buyers.
Roughly one in five conventional mortgage loans made this winter went to borrowers spending more than 45% of their monthly incomes on their mortgage payment and other debts, the highest proportion since the housing crisis, according to new data from mortgage-data trackerCoreLogicInc. That was almost triple the proportion of such loans made in 2016 and the first half of 2017, CoreLogic said.
The “lack of supply” argument is just wonderful – a bunch of “economists” finding a basic free market capitalism solution to a problem that has nothing to do with free market capitalism. Perhaps “economists” can also argue that building more, despite the lack of prime borrower demand, will also have the added benefit of puffing up GDP. From there, it’s only a couple more steps down the primrose path that leads to China’s ghost cities.
And of course, people are worried that we could have a “weak selling season” upcoming. In a free market economy, weakness is necessary and normal. In Keynesian theory, it’s the devil incarnate. The Wall Street Journal continued:
Consumers are growing more optimistic about the economy and their personal financial prospects but less hopeful that now is the right time to buy a home, according to results of a survey released in late March by the National Association of Realtors.
These factors “are working against affordability and that’s why you get the pressure to ease credit standards,” said Doug Duncan, chief economist atFannie Mae. He said that pressure has to be balanced against the potential toll if underqualified buyers eventually default on their mortgages.
CoreLogic studied home-purchase loans that generally meet standards set by Fannie Mae and Freddie Mac, the federally sponsored providers of 30-year mortgage financing.
The amount of these loans packaged and sold by Fannie and Freddie increased 73% in the second half of 2017, compared with the first half of the year, according to Inside Mortgage Finance, an industry research group. In that same period, overall new mortgages rose 15%.
As if the signs weren’t clear enough that manipulating the economy and manipulating the housing market has a detrimental effect, the article continued that Fannie Mae and Freddie Mac are “experimenting with how to make homeownership more affordable, including backing loans made by lenders whoagree to help pay down a buyer’s student debt“. Sure, solve one government subsidized shit show (student loan debt) with another one!
Is it any wonder that the entire supply and demand environment for housing has been thrown completely out of order? On one hand, the government wants to make housing affordable so that everybody can have it, which closely resembles socialism. On the other hand, they are targeting prices to rise 2% every single year and claim that this is normal and healthy economic policy that we should all be buying into and applauding. The left hand doesn’t know what the right hand is doing!
We wereon this case back in October 2017when we wrote an article pointing out that home prices had again eclipsed their highest point prior to the financial crisis. We knew this was coming. We at the time that the ratio of the trailing twelve month averages of median new home sale prices to median household income in the U.S. had risen to an all time high of 5.454, which following revisions in the data for new home sale prices, was recorded in July 2017. The initial value for September 2017 is 5.437.
In other words, the median new home in the US has never been more unaffordable in terms of current income.
Here we are 6 months later and “economists” are just figuring this out. What’s wrong with this picture?
What’s really happening is clear. Instead of letting the free market determine the pricing and availability of housing, the government has continued to try and manipulate the market in order to give everyone a house. This is simply going to lead to the same type of behavior that led Fannie Mae and Freddie Mac to fail during the housing crisis.
If we are going to have free market capitalism, the reality of the situation is that not everybody is going to own a house.
Furthermore, while there are many benefits to owning a house, there are also many reasons why people rent. Peter Schiff, for instance, often makes the case that renting is generally worth it because you’re saving yourself on upkeep and it allows you to be flexible with where you live and when you have the opportunity to move. He himself rents property for these reasons, which he often notes in his podcast. Sure, there are some benefits of homeownership, namely that a homeowner is supposed to be building equity in something, but looking again at the situation we are in today, is it worth investing in the equity of a home that might see its price crash significantly again, similar to the way housing prices did in 2008?
The government is creating both the problem and the solution here and instead of trying to continually fix the housing market, they should just keep their nose out of it and allow the free market to determine who should own a house and at what price. Call us crazy, but we don’t think that’s going to happen.
Last JuneZH reportedthat according to the Institute of International Finance – perhaps best known for its periodic and concerning reports summarizing global leverage statistics – as of the end of 2016, in a period of so-called “coordinated growth”, global debt hit a new all time high of $217 trillion, over 327% of global GDP, and up $50 trillion over the past decade.
Six months later, on January 4, 2018, theIIF released another global debt analysis, which disclosedthat global debt rose to a record $233 trillion at the end of Q3 of 2017 between $63Tn in government, $58Tn in financial, $68TN in non-financial and $44Tn in household sectors, a total increase of $16 trillion increase in just 9 months.
Now, according to itslatest quarterly update, the IIF has calculated that global debt rose another $4 trillion in the past quarter, to a record $237 trillion in the fourth quarter of 2017, and more than $70 trillion higher from a decade earlier, and up roughly $20 trillion in 2017 alone.
The IIF report, which also sources data from the IMF and BIS, found that the share of global debt remains well above 300% of global GDP, with mature market, i.e., DM, debt/GDP now at 382%. The silver lining: that number was slightly below recent levels, as increasing GDP growth in DMs helped reduce the debt-to-GDP ratio. However, this was more than offset by a surge in debt in emerging markets, where total debt/GDP is now well above 200%.
The good news, if only temporarily, is that on a consolidated basis, global debt/GDP fell for the fifth consecutive quarter as global growth accelerated: the ratio is now around 317.8%, or 4% points below the all time high hit in Q43 2016. To be sure, even a modest slowdown in GDP growth, let alone a contraction, will promptly send the ratio surging to new all time highs.
So what was the culprit for this unprecedented debt surge? Central banks of course.
“Still-low global rates continue to support unprecedented levels of debt accumulation,” officials from the IIF said in a release.
As the report also notes, among mature markets, household debt as a percentage of GDP hit all-time highs in Belgium, Canada, France, Luxembourg, Norway, Sweden and Switzerland, which – as Bloomberg correctly notes – That’s a worrying signal, with interest rates beginning to rise globally. Ireland and Italy are the only major countries where household debt as a percentage of GDP is below 50 percent.
IIF representatives also highlighted the weaker U.S. dollar as having “masked longer-term concerns about debt sustainability, particularly in emerging markets.” The reduction in debt to GDP came mainly from developed markets, such as the United States and Western Europe, but was an overall trend with 36 of the 49 countries in the survey’s sample recording a drop in debt-to-GDP.
Among emerging markets, household debt to GDP is approaching parity in South Korea at 94.6 percent.
Finally, the report also found that U.S. government debt is now 99% of GDP as a sector. With the United States expected to record a $1 trillion budget deficit by 2020, according to the latest just released CBO forecast, the US should cross 100% debt/GDP in the next few months…
From a growth perspective, it doesn’t matter if the world is 7.5 million or 7.5 billion persons…it only matters how many more there are from one year to the next. Economic growth (or the ability to consume more…not produce more) is about the annual growth of the population among those with the income, savings, and access to credit (or governmental social pass-through programs). That’s what this trade war is all about and why it’s just beginning. First it was a fight for decelerating growth…but now it’s about a shrinking pool of consumers.
Nowhere is this decline in potential consumers more acute than East Asia (China, Japan, N/S Korea, Taiwan, plus some minor others). I have previously detailed China’s situationHEREbut the chart below shows the broader East Asia total under 60 year old population (blue line) and annual change in red columns. Peak growth in the under 60yr/old population (consumer base) took place way back in 1969, annually adding 22 million potential consumers. As recently as 1988, an echo peak added 19 million annually but the deceleration of growth since ’88 has been inexorable. Then in 2009, decelerating growth turned to decline and the decline will continue indefinitely. What began as a gentle decline is about to turn into progressively larger tumult. By 2030, the under 60yr/old population will be 9% smaller than present. East Asia’s domestic consumer driven market is collapsing in real time and it’s reliance on exports greater than ever.
The chart below shows the total 0-65 year old global population (minus Africa and India…blue line) and the annual change in that population in the red columns. Why excluding Africa/India? Because they represent nearly all global population growth, consume less than 10% of the global exports, and haven’t the income, savings, or access to credit to consume relative to the rest of the world. Growth (x-Africa/India) peaked in 1988, annually adding 52 million prime consumers. However, the annual growth of that population has decelerated by 2/3rds to “just” 17 million in 2018. Before 2030, the under 65 year old population will peak and begin shrinking.
Simply put, West and East are fighting over a soon to be shrinking pie. Of course, individual companies will perform better than others…but on a macro basis, global demand will be falling indefinitely aside from the debt and monetization schemes federal governments and central bankers can conjure.
From an asset appreciation viewpoint, consider the decelerating (and soon to be declining consumer population) vs. accelerating asset appreciation. The chart below shows the same annual under 65yr/old population growth (x-Africa/India) versus the fast rising Wilshire 5000 (all publicly traded US equities, yellow line) and global debt (red line).
Next, consider the decelerating annual global population growth (as a percentage of total population x-Africa/India) versus the supposed infinite 7.5% appreciation of assets (chart shows the Wilshire 5000 continuously growing at 7.5%) versus fast decelerating consumer growth. Clearly, anticipated asset appreciation is all about rising debt and monetization…not organic growth.
Finally, a peek at the situation in the US. The chart below shows fast decelerating annual growth of the under 65 year old US population as a % of total population (black line), the ebullient Wilshire 5000 (shaded red area), actual and anticipated 7.5% appreciation of US stocks from 1970 through 2025 (dashed yellow line), and total disposable personal income representing the actual economy (blue line).
Infinite growth models are running headlong into very finite limits. Invest accordingly.
We are in the midst of watching the subprime auto lending bubble burst in its entirety. Smaller subprime auto lenders are starting to implode, and we all know what comes next: the larger companies go bust, inciting real capitulation.
In addition to ourcoverage out just days ago talking about how the subprime bubble has burst and, since then has been crunched even further and additionalreports todayare showing that smaller subprime lenders are starting to simply implode after being faced with losses and defaults. In addition,Bloomberg reportedthis morning that there have been allegations of fraud and under reporting losses, tactics that are clearly reminiscent of ➹ throw a dart at any financial crisis/bubble burst over the last 30 years:
Growing numbers of small subprime auto lenders are closing or shutting down after loan losses and slim margins spur banks and private equity owners to cut off funding.
Summit Financial Corp., a Plantation, Florida-based subprime car finance company, filed for bankruptcy late last month after lenders including Bank of America Corp. said it had misreported losses from soured loans. And a creditor to Spring Tree Lending, an Atlanta-based subprime auto lender, filed to force the company into bankruptcy last week, after a separate group of investors accused the company of fraud. Private equity-backedPelican Auto Finance, which specialized in “deep subprime” borrowers, finished winding down last month after seeing its profit margins shrink.
Article continues:
The pain among smaller lenders has parallels with the subprime mortgage crisis last decade, when the demise of finance companies like Ownit Mortgage and Sebring Capital Partners were aharbingerthat bigger losses for the financial system were coming. In both cases, rising interest rates helped trigger more loan losses.
“There’s been a lot of generosity and not a lot of discretion on the part of lenders and investors,” said Chris Gillock, a banker at Colonnade Advisors, which advises companies on subprime auto investments. “There’s going to be more capitulation.”
Representatives for Spring Tree didn’t respond to requests for comment. A lawyer for Summit said “restructuring in a Chapter 11 bankruptcy proceeding is the best strategy to ensure its long term success” and the company is working with its vendors and lenders to meet its obligations.
Astonishingly and ridiculously, the article goes on to talk about this implosion as if it was expected to happen and as if it’s what would have happened during the normal course of business if ridiculous debt and engineered interest rates weren’t a mainstay of current economic policy:
This time around, the financial system’s losses are expected to be much more manageable, because auto lending is a smaller business relative to mortgages, and Wall Street hasn’t packaged as many of the loans into complicated securities and derivatives. As of the end of September, there were about $280 billion of subprime auto loans outstanding, according to the Federal Reserve Bank of New York, compared with around$1.3 trillionin subprime mortgage debt at the start of 2007. There isn’t a standardized definition of subprime borrowers, though it generally encompasses borrowers with FICO credit scores below 600 to 640 on an 850 point scale.
Take, for example, this gem of cognitive dissonance:
“When you think about the effects of housing versus autos, they’re a lot different,” said Kevin Barker, a stock analyst covering specialty finance companies at Piper Jaffray & Co. Losses tend to be less severe for car loans because they are smaller than mortgages and borrowers pay them down faster, he said, and the collateral is easier to repossess. With home loans, in many states foreclosures require a lengthy court process.
As we all saw from the housing crisis, the smaller shops are usually the first ones to go. The law of large numbers plays to the advantage of bigger corporations and usually buys them more time. The bigger the company, the more the government and institutions care if it goes bust. Smaller companies come and go like it’s nothing, because they have no tangible effect on major financial institutions or the US economy. However, this generally only exacerbates the size of the ticking time bomb to come.
In early March of this year, we posted our “Signs of the Peak: 10 Charts Reveal an Auto Bubble on the Brink“. Our timing couldn’t have been better. In that article we pointed out that the key data which seems to suggest that the auto bubble may have run its course comes from the following charts which reveal that traditional banks and finance companies are starting to aggressively slash their share of new auto originations while OEM captives are being forced to pick up the slack in an effort to keep their ponzi schemes going just a little longer.
And while some can claim that this is just a natural result of healthy competition between lenders, what is likely causing sleepless nights at banks who have tens of billions in outstanding loans, is the coming tsunami of lease returns which will lead to a shock repricing for both car prices and existing LTVs once the millions in new cars come back to dealer lots…
Also, just as we expected, between record prices (courtesy of what until recently was easy, cheap debt), record loan terms, and rising rates, shoppers with shaky credit and tight budgets have suddenly been squeezed out of the market. In fact in the first two months of this year, sales were flat among the highest-rated borrowers, while deliveries to those with subprime scores slumped 9 percent, according to J.D. Power.
Confirming our observations, Bloomberg notes that while lenders took chances on consumers with lower FICO scores after the recession, partially on the notion that borrowers prioritize car payments ahead of other expenses, several financial companies started to tighten their standards more than a year ago. The result is a surge in the amount of captive financing shown in the chart above, which as we warned is the clearest indication yet of the popping car bubble.
However, no one wants to make the point that subprime auto also followed in the footsteps of the financial crisis because it was a bubble that was engineered due to the Fed making it easy to take on cheap debt in order to fuel our nonsense “recovery”.
The continued focus on borrowing and spending, instead of saving and under consumption, will ensure not only that these bubbles continue to happen going forward, but they will get larger in size as time progresses.
Wall Street rethinks blockchain projects as euphoria meets reality
NEW YORK (Reuters) – Wall Street has been much more excited about the system underpinning bitcoin than the cryptocurrency itself, but the global financial industry has not yet been able to do much with the technology known as blockchain.
Reuters has found several blockchain projects launched by major financial institutions that have been shelved, as development of the technology enters a hype-meets-reality phase.
The casualties include projects by the Depository Trust & Clearing Corporation (DTCC), BNP Paribas SA (BNPP.PA) and SIX Group, Reuters has found.
These were among the wave of blockchain tests touted by the financial industry over the past few years, as firms bet the new technology would displace much of the sector’s infrastructure, cutting out middlemen, speeding transactions and reducing costs for things like securities and payments processing.
Yet as some projects were developed, companies pulled back for various reasons – from costs to industry readiness, underscoring that, for all its potential, blockchain is still in its early days.
DTCC, known as Wall Street’s bookkeeper, recently put the brakes on a blockchain system for the clearing and settlement of repurchase, or repo, agreement transactions, said Murray Pozmanter, head of clearing agency services at the DTCC.
The project, which had successfully tested with startup Digital Asset Holdings (DA), was shelved because banks and other potential users believed the same results could be achieved more cheaply using current technology, he said.
“Basically, it became a solution in search of a problem,” he said.
Post-trade services provider, SIX Securities Services, a unit of the group that operates Switzerland’s stock exchange, has also decided not take into production a prototype built by DA for the processing of securities, SIX spokesman Jürg Schneider, told Reuters.
“We wanted to go into another direction,” Schneider said.
The partnership with DA, run by former JPMorgan Chase & Co (JPM.N) executive Blythe Masters, was announced in 2016.
French bank BNP Paribas in 2016 said its securities services division had partnered with startups including SmartAngels to build a platform for private small businesses to manage their securities.
The bank stopped work on the project, and will instead team up with other financial institutions on another blockchain initiative called LiquidShare, said a source familiar with the matter. “Creating an enterprise-wide robust blockchain platform requires the full cooperation of the whole post trade ecosystem,” the source said.
PROOFS OF CONCEPT
The DTCC, BNP Paribas and SIX tests were among a barrage of blockchain “proofs of concept” announced with great fanfare by financial institutions.
“A large part of the problem has been expectation management, or rather lack thereof by many vendors and large consultancies that made claims that could not be fulfilled in the time spans they had said on stage at fintech events,” said Tim Swanson, founder of technology advisory Post Oak Labs.
Reuters reported last week JPMorgan was considering spinning off its marquee blockchain project Quorum. In July a partnership between settlement provider Euroclear and startup Paxos to develop a blockchain service was dissolved.
Still, other projects are moving forward.
Pozmanter said the DTCC is still examining another project with DA and that it is close to testing a blockchain-based trade information warehouse set to launch next year.
“We’re still bullish on the technology,” Pozmanter said.
The repo test with DA “met all its stated goals” and led to a new project that DTCC is examining, said DA spokeswoman Vera Newhouse.
SIX is working on a blockchain project with Nasdaq (NDAQ.O) and Australia’s stock exchange ASX Ltd (ASX.AX) said in December that DA will help replace its registry, settlement and clearing system, By one of the most ambitious projects to receive a green light.
Despite all the propaganda that the world had reached utopian levels of ‘globally synchronous recovery’ growth last year, 2018 has seen that narrative collapse as China’s credit impulse dries up, The Fed continues on its path to ‘normalization’, and the world wakes up to Europe’s smoke and mirrors economic renaissance…
And, as if that was not enough to spook even the most ardent bull, Bloomberg notes that rapidly accelerating trade ‘battles’ are focusing minds on that simmering threat to markets: the eventual easing of synchronized global growth.
The U.S. version – which includes economic, credit and corporate indicators – is close to its 2007 peak.
The trade war tensions have arrived at a risky time, with Morgan Stanley’s cycle gauge for the developed world nearing levels last seen before prior recessions.
Federal and local law enforcement officials said this week they have seized around 100 Northern California houses they say were being used to grow cannabis tied to criminal organizations based in China.
The raids conducted Tuesday and Wednesday focused on Chinese nationals living in other states who bought homes in seven California counties, the Associated Press reported. Most of the home buyers were legal residents of the United States. They lived as far away as Georgia, Illinois, New York, Ohio and Pennsylvania. The harvested and processed product was shipped back east to those states for distribution.
None of the home owners have been arrested yet. The U.S. Department of Justice called the bust one of the nation’s largest residential forfeiture seizures. None of the homes were in the San Francisco Bay Area, presumably because it’s cheaper to buy a home more inland, the AP report said.
“This criminal organization has put a tremendous amount of equity into these homes through these wire transfers coming in from China and elsewhere,” U.S. AttorneyMcGregor Scottsaid in an interview with AP. “We’re going to take it. We’re going to take the houses. We’re going to take the equity.”
More details from the AP:
More than 500 law enforcement officials were used in the raids, which also hit two real estate businesses in Sacramento.
Agents from theInternal Revenue Service, the Drug Enforcement Agency and the Federal Bureau of Investigation were deployed with Sacramento sheriff deputies.
Money for home down payments were wired from China’s Fujian Province and stayed below the $50,000 limit restrictions in that country.
Sacramento real estate agents were used as well as straw buyers who represented the homeowners.
The Justice Department said the houses tended to use very high amounts of electricity for grow lights and fans. It’s no wonder the sweep was dubbed “Operation Lights Out.”
It said in addition to the homes, agents hauled in 61,000 marijuana plants, 400 pounds of processed buds (worth $600,000 wholesale) and 15 guns.
Worries about competition from a thriving black market in the state have continued to increase since California legalized recreational, retail cannabis and started taxing it at high rates last January.
A report earlier this week found that state and federal taxes on legal cannabis are so high in California that they may be helping the black market thrive, as consumers look for cheaper sources for cannabis and retail businesses scramble to keep in line with regulations while still making a profit.
The most expensive condo in the leaning, sinking Millennium Tower has just closed escrow at a selling price that is $1 million less than what it had been asking.
Originally priced at $5.99 million when it hit the market in March 2017, Unit 401 was then re-priced, then taken off the market, only to be re-listed at $4.99 million and finally sold for $4.66 million,SocketSite reports.
Two adjacent units on the fourth floor of the eleven-story mid-rise component of San Francisco’s leaning Millennium Tower development (a.k.a. the City Residences) were legally merged back in 2013 to create a single four-bedroom unit #401 which measures 3,814 square feet and sold for $5.3 million in May of 2014 … Keep in mind that the seller was offering financing “for qualified applicants” and Sterling Bank was offering loans with at least 50 percent down, according to the listing.
The Millennium Tower was a massive real estate success when it finally closed its new sales in 2013, raking in $750 million in revenue from properties. A penthouse initially sold for as much at $9.8 million and the average price tag was $1.8 million.
But the building was discovered to be both leaning and sinking two years ago. It has sunk 17 inches and leaned 14 inches to the northwest, sparking a rash of lawsuits and a flight of residents who claim they’ve sold their investments at a loss.
The unit isn’t the first in the troubled tower to see a major dip in value during resale — in mid-December, the two-bedroom, three-bathroom unit #48B sold for a 30 percent loss, bringing in $2.99 million. It had previously sold for $4.25 million in November 2013.
“The seller took about a 30 percent loss over a period where the market appreciated rapidly,” Patrick Carlisle, chief market analyst at brokerage Paragon, who wasn’t involved in the deal, told the Business Times at the time. “That’s got to be pretty painful.”
In light of increasing trade threats between theUSandChina, some perspective on US trade deficits is warranted. Piecing together data from a variety of sources, the following chart shows the US balance of trade since 1790, shortly after the country’s founding.
The US maintained very closely balanced trade for the first 200 years of the country’s history. From 1790 until 1974, the last year in which the US ran a trade surplus, the US exported roughly $102 billion more than it imported. Since 1974, the US has run a cumulative trade deficit exceeding $11.64 trillion. In other words, in the last 44 years the US trade deficit was 113 times larger than the trade surplus it amassed during all previous American history. The massive deterioration in the US balance of trade since the 1970s is both historically anomalous and highly unsustainable. That multiple Presidents and Congresses have come and gone without taking serious action to correct the imbalance is indefensible, particularly given the American people’s near universal recognition of the problem and its deleterious impacts.
The US is not starting a trade war, the US has been in a trade war since the 1970s and it has been losing badly.
As we discussedhere, the bulk of America’s trading problem is not with its free trade partners. The US has entered into free trade agreements with 20 countries and has seen its balance of trade improve with 16 of them since adopting an agreement. The notable exceptions are Mexico and Israel. The following chart shows the indexed change in the balance of trade with the US’s free trade partners since the inception of an agreement.
The majority of the US trade deficit is a result of trade with China. The US trade deficit with China is roughly $375 billion, 66% of the total US deficit. If the US managed to eliminate its trade deficit with every country in the world expect China, it would still have thelargest trade deficit in the world.
The rarely discussed truth of the matter is that, in addition to a host ofnon-tariff trade barriersandintellectual property theft, Chinese import tariffs are over twice as high as import tariffs in the US. That the Chinese feel the need to maintain such high import barriers, despite their huge trade surplus and far lower manufacturing costs, is remarkable. They are trying to protect their high tech industries from American competition while denying the US the same privilege.
About19%of Chinese exports go to the US, making the US the largest export destination for Chinese goods. Conversely, only about8%of US exports go to China, the third largest export destination for the US. Furthermore, trade represent asignificantly larger pieceof the Chinese economy than it does in the US. Chinese exports to the US are also generally products that can be manufactured in other lower labor cost economies such as India, Taiwan, or Mexico.
Given all of these factors, China’sovert unwillingnessto take any action to remedy a clearly unsustainable situation is likely to encourage, not deter, further American tariffs. It will be to everyone’s detriment, but mostly theirs.
The housing market has not only recovered its pre-recession levels, but some observers are actually starting to worry about yetanother housing bubble. Housing prices are on the rise, thanks in large part to extremelytight inventory, so it’s worth asking: are potential home buyers getting priced out of the market? The answer depends on where they live and how much money they make.
We collected average home prices for every state fromZillowwhich we then plugged into a mortgage calculatorto figure out monthly payments. Remember, mortgage payments consist of both the principal and the interest for the loan. The interest rate we used varied from 4 to 5% in each state, depending on the market. The lower the interest rate, the lower the monthly payment. To keep things simple, we assumed buyers could contribute a 10% down payment. Another thing to keep in mind is that financial advisors commonly recommend the total cost of housing take up no more than 30% of gross income (the amount before taxes, retirement savings, etc.). Using this rule as our benchmark, we calculated the minimum salary required to afford the average home in each state.
Top Five Places Where You Need the Highest Salaries to Afford the Average Home
1. Hawaii: $153,520 for a house worth $610,000
2. Washington, DC: $138,440 for a house worth $549,000
3. California: $120,120 for a house worth $499,900
4. Massachusetts: $101,320 for a house worth $419,900
5. Colorado: $100,200 for a house worth $415,000
Top Five Places Where You Need the Lowest Salaries to Afford the Average Home
1. West Virginia: $38,320 for a house worth $149,500
2. Ohio: $38,400 for a house worth $149,900
3. Michigan: $40,800 for a house worth $160,000
4. Arkansas: $41,040 for a house worth $161,000
5. Missouri: $42,200 for a house worth $165,900
Our map creates a quick snapshot of housing affordability across the United States. There are several pockets in which only the upper middle class and above can afford to own even the average home, most notably across the West and in the Northeast. There are only two states west of the Mississippi River where a worker with an annual salary under $40,000 can afford a mid-level home: Missouri and Oklahoma. Colorado stands out as the only landlocked state requiring a significant amount of income ($100,200), thanks in large part to the housing market around Denver.
Homes tend to be more affordable in the eastern half of the country, with a notable pocket of “green” (less expensive) states located in the upper Midwest. The North is generally more affordable than the South and the typical home is significantly easier to buy in places like Michigan or Ohio than in Louisiana or Arkansas. Additionally, our map indicates that workers can more easily afford homes in the East than in the West, which is surprising given how much more land is available out West. It is important to note that there are certainly deep pockets of poverty in all of these places, which suggests that our map obscures the inequality behind averages.
The best takeaway from our map is that housing remains affordable in large swaths of the country, even though there will always be places like California and New York where there is simply too much demand for the available inventory. Thankfully, that doesn’t mean that buying a home is suddenly out of reach for average Americans in Ohio or Mississippi, for example.
In San Francisco, a boom is always associated with its essential – and subsequent counterpart – the bust. They’re as typical to the city as sun and fog. And currently, judging by the insatiable appetite of home buyers in the city’s red-hot real estate market who appear completely unfazed stock-market volatility, tax-law changes, and tech sector gyrations, the city is in one heck of a housing boom, perhaps the biggest one ever, and national indices don’t do justice to how over-the-top mind-blowing crazy the situation has gotten.
Take for example, the S&P/Case-Shiller Home price index which covers not just the city (or county) of San Francisco but includes four other Bay Area counties: Alameda, Contra Costa, Marin, and San Mateo. There are more counties in the Bay Area, but they’re not included in the index. In terms of home prices, the five-county Case-Shiller index for “San Francisco,” though showing a significant, double digit annualgain of just over 10%, waters down the insanity happening every day on the streets of San Francisco.
To get a far more accurate, and granular neighborhood-by-neighborhood data for San Francisco itself, we go toParagon Real Estate Group’s March-April 2018 report, and what we find are vertigo-inducing price increases that have now beautifully spiked.
During the prior nationwide housing bubble that blew up with such fanfare, helped take down the world financial system, and caused central banks and governments to instigate the largest bail-out schemes the world has ever seen – from banks to entire countries – well, during that bubble, while it was still going on, homes in San Francisco reached what afterward were called totally crazy valuations, with the median price topping out in November 2007 at a mind-boggling $895,000. People were shaking their heads at the time. But after the boom came the inevitable bust. By January 2012, the median home price had plunged 31% to $615,000.
By then, however, the tsunami of money that global central bankers had unleashed was already washing over San Francisco from multiple directions: a stock-market and startup boom that the city is so dependent on, a tourist boom from around the world, wave after wave of Chinese, Russian and Petro-oligarchs desperate to park their ill-gotten cash in real estate, and of course, the veritable flood of nearly free funding. Everything came perfectly together. Then, over the course of just a little over three years, the median home price about doubled to $1,225,000, and we duly noted the unprecedented surge in prices back in the spring of 2015.
It turns out, that was just the start, because according to the latest Paragon report, the median sale price of a house in the city has since soared to a record $1.6 million in the first quarter, a 24% jump from a year earlier, and more than double the annual price increase reported by Case-Shiller. Q1 also rose above the previous high set in the fourth quarter of 2017 by $100,000.
This is what a real boom looks like.
As the report’s authors observe, prices in the city have been soaring for several years, as “feverish” demand far outstrips supply. Putting the recent price explosion in context, the median home price is now 80% above the prior-bubble completely mind-boggling median price that afterwards everyone admitted had been based on totally crazy valuations. Surely, this time is be different?
When compared to either California or the US, San Francisco houses and condos are in a world of their own: the median SF house sales price in 2017 was $1,420,000 (up from $1,325,000 in 2016), and for condos, it was $1,150,000 (up from $1,095,000). Looking just at the 4th quarter, median prices were $1,500,000 for houses (up from $1,350,000 in Q4 2016) and $1,185,000 for condos (up from $1,078,000) respectively.
On a neighborhood-by-neighborhood basis, the differences in median home prices are enormous. In the table below, the median house prices range from $960,000 in Bayview, one of the more troubled neighborhoods, to over $5 million in Pacific Heights. It is in this exclusive, gorgeous, and groomed neighborhood, endowed with breathtaking views of the Bay, where you find the humble abode of the champion of the poor, former Speaker of the House Nancy Pelosi.
How much bigger can this bubble get?
As the report’s authors write, “it is still very early in the year to come to definitive conclusions about where the year is going, but right now, in most market segments, buyer demand is competing ferociously for a limited supply of listings. Indeed, by some standard statistical measures of supply and demand – days on market, months supply of inventory, absorption rate – the SF market is about as heated now as it has been at any time in the past 10 years. This is especially true in the more affordable home segments, and particularly for house listings.”
The situation is somewhat more complicated in the highest price ranges, especially in the luxury condo segment where supply has been rapidly increasing. Of course, whatever the property type or price segment, it all ultimately depends on the specific property, and its location, appeal, preparation, marketing and pricing, although if there is a place where the bubble will pop, it will be in the ultra luxury segment, where the supply is off the charts:
The rest of the market, however, remains incredibly tight: only about 2% of house owners are putting their homes on the market each year, which is incredibly low by historical measures – and why should they? For many owners, the house doubles as a real-estate piggy bank where funds are parked for the indefinite future. Meanwhile, about 5% of condo owners sell their homes each year, plus the new-construction condos that come on the market. This dynamic has made houses into the scarce commodity, and has fueled dramatic house price appreciation.
Looking at the charts above, one thing is clear: the dynamics of the housing market in San Francisco have put the 2005-2007 bubble to shame – what is taking place is unprecedented, much the same as parallel events in capital markets. However, just like in the stock market, so among San Francisco housing what the catalyst will be that punctures this appreciation utopia, is still very much unknown.
Historic: A 1906 “video-enhanced” film of an original taken more than a hundred years ago on Market Street in San Francisco, with sounds representative of that time and location. Interesting to note that the average life expectancy in 1906 was 47 years; there were only 8,000 cars on the road in America; only 144 miles of paved roads; and the maximum speed limit was 10 mph. 1906 most popular songs can also be heard as you’re traveling down Market Street. To see the “Raw” film footage from which this enhanced version came from (with a detailed, scene-by-scene description) go to this site: The Library of Congress: https://www.loc.gov/item/00694408
Dennis and Patricia Hall stand beside their Kirkland family home, built by Dennis in 1980. They raised their daughter there and planned to stay for the rest of their lives. But now on a fixed income will be forced out of their home due to parabolic government property tax hikes.
The Seattle Times has collected hundreds of reader responses to the tax hikes. Many who said they’re retired or disabled, and living on fixed incomes, offered emotional stories of being unable to afford the heftier rate.
Dennis Hall imagined living his whole life in the country-style home he and his wife built in Kirkland for $55,000 in 1980. But the couple, now retirees on a fixed income, say the latest tax bill for their property — valued at $1.2 million — is forcing them to rethink their golden years, sell the beloved home and move. “This year was the breaking point. Enough is enough,” said Hall, 65, thinking about the big tax increase, a reflection ofskyrocketing home values, voter-approved levies and a plan by state lawmakers to fully fund public schools. “We were hoping on dying here.” With this round of property-tax notices, the couple are not alone in their worries. As the effects of the higher rates spread statewide, some homeowners are calling the tax increase a tipping point in a period of financial stress that’s forcing too-soon goodbyes to longtime homes. Over the course of weeks,The Seattle Timescollected hundreds of emails, phone calls and responses on social media from people like Hall, many of whom identified as retired or disabled, saying they have limited options for paying the heftier amounts. “Should anything happen to me like an illness or injury, I will be homeless pretty quick,” wrote a 61-year-old homeowner in Seattle’s Ballard neighborhood. “There is no way I can make it; have to sell our home,” another person said in a voicemail. “I don’t know what to say or do.”
Property-tax increases vary greatly from city to city.
A handful of people shared less emotional stories of budgeting without lattes or expansive cable packages to cover the larger bills. A few said the spike is a result of Washington’s regressive tax structure. And in a region with a growing housing- affordability and homelessness crisis, a couple of respondents acknowledged their status as “well-paid” and fortunate enough to afford the tax by simply shifting around their spending.
With Social Security, some seniors hoping to qualify for assistance reported annual incomes that barely surpass the state’s maximum of $45,000 for tax deferrals or $40,000 for exemptions. Recipients of the former eventually have to repay with interest, while tax exemptions reduce amounts due based on various criteria, including income and home value. According to numbers provided by the Washington State Department of Revenue, about 107,000 seniors participated in the exemption program last year — or roughly 7 percent of the state’s total senior population. The department, meanwhile, received 558 applications for deferrals.
House for settling down
Surrounded by spacious fields and livestock, the Kirkland home was ideal for Hall and his wife, Patricia, to settle down in and raise a family, with college and the military behind them. Born and raised in the suburb, he worked in construction while she managed the home. They adopted a baby girl in 1985. “That’s when the house came alive,” he recalled. Nearly four decades later, a time span that included the birth of their grandson, the couple’s budget tightened significantly when he retired in 2010 at age 58. The latest tax increase of $1,500 on the property — not far from Microsoft’s campus — hit hard. They sold the land and home to a local developer soon after and started making plans to move to the Duvall area, where their daughter’s family lives. “I’m not against paying taxes,” Dennis Hall said, so long as the government services he sees are on par with how much he pays. These days, relocating for more affordable living is not a phenomenon unique to Washington retirees. New U.S. census data show populations of retiree-friendly communities rising faster than national population growth,The Wall Street Journal reports. But the shift for homeowners here, in the metropolitan area of King, Snohomish and Pierce counties, comes with incomparable pressure.Single-family-home values in the three counties have been rising faster than anywhere else in the country. Median house prices recently hit records of $777,000 in Seattle and $950,000 on the Eastside. Beyond the surging values, this year’s property-tax increases are largely a result of last year’s bipartisan deal by lawmakers to shift spending on public schools.
In an effort to comply with the stateSupreme Court’s 2012 McClearyruling, which found the state has neglected its constitutional duty to pay for public schooling, lawmakers voted to raise the state property-tax levy for schools to $2.70 per $1,000 of assessed value, up from $1.89 in 2017. The plan will reduce local school levies, but not until next year.“Wondering if ‘laptops for kids’ is worth losing homeowners,” a Bothell reader wrote to the newspaper, saying her family picked the city in 2009 because of its lower taxes compared with the Seattle area.
“Guess that was nine years ago — not the future.”
Property-tax insider
Michelle LeMay, 64, of Seattle, knows the effects of property taxes well. She worked almost two decades in theKing County Assessor’s Officeas an administrative specialist, mailing tax notices to homeowners, fielding phone calls and helping people such as seniors with exemption paperwork. But the tables have turned. Now, she and her husband, on a fixed income, feel they’re being pushed out of their house in Greenwood with this year’s property-tax increase of 22 percent. Their income is barely above the maximum to qualify for a senior tax exemption, she said. “You can’t live in Seattle for $40,000.”In many poorer and rural school districts across Washington, projections for the new law on school spending show cuts in property taxes in future years, while taxes remain higher in richer areas like Seattle, Bellevue and Mercer Island. Voter-approved levies make up a large portion of the hikes in some areas, too, including King County, where the increases range from 9 percent in Normandy Park to 31 percent in Carnation. Among U.S. states, a 2016 report by theTax Foundationfound Washington had the 26th-highest property-tax rate (0.94 percent). That compared with the highest rate of 2.11 percent in New Jersey. It’s unclear how the new taxes may change Washington’s rank. As LeMay and her husband go through their belongings and contemplate selling their home eventually, they told The Times they feel overwhelmed and are looking at possibilities outside King County. “Arizona seems like the place a lot of people are relocating,” LeMay said.Beyond tax exemptions and deferrals for qualified seniors, widows and people with low incomes or disabilities can apply through the state for tax help. Also, homeowners canappeal the assessor’s valuation of their homes,which determines tax increases, by July 1 or within 60 days of receiving notification of their assessment. Kathleen Dellplain, 72, formerly of Seattle’s Fauntleroy neighborhood, moved away before the pack. A retired widow, she noticed herself losing financial ground as the owner of a waterfront home years ago. She put the house on the market after receiving this year’s assessment and moved to a farmhouse in Enumclaw, in Southeast King County. “If I could’ve frozen my tax or kept it with the regular rate of inflation, I would have probably stayed there for the rest of my life,” she said. But costs rose too quickly for her income, she said, especially with her commitment to help grandkids through college.
Neil Cavuto is the defender of multinational Wall Street interests. Cavuto’s boss, Rupert Murdoch has a well known insider nickname: “Mr. Wall Street”… The Murdoch operations (Fox News and Wall Street Journal among them) are ideological advocates for multinational corporations and historic globalist trade practices; to the detriment of the U.S. middle-class. That’s right, they are. Cavuto and Murdoch are also aligned with U.S. Chamber of Commerce President, Tom Donohue, in all things related to Big Multinational Trade.
In this interview there is a very apropos example of the twisted disconnect evident in the multinational corporate media perspective. Please focus on the part that begins around 04:55 and listen closely to Cavuto:
…”and we’re really seeing the effect on the folks who have to pay the bills for this sort of thing … we’re already seeing soybean prices coming down; we’re seeing pork related prices coming down … folks are taking it on the chin, what are you telling them?”… etc.
There it is. Did you catch it?
In discussing futures Cavuto sounds the alarm for “Soybean prices coming down.” “Pork prices coming down”; and “the folks “taking it on the chin.”
Now, think. What Neil Cavuto is saying is that U.S. food futures prices are forecast to come down. In that scenario who exactly is taking it on the chin?
Who is it that Neil Cavuto sees losing out in his position? It’s not the family going to the grocery store… they will see lower prices… so who are these “folks” losing out?
There it is.
Right there.
It’s easy to miss the gas lighting because it is so commonplace. Cavuto doesn’t even see himself doing it.
This is the twisted and controlled market being discussed.
Neil Cavuto is not calling for ‘free markets’, he is advocating for ‘controlled markets’, and his anxiety is because the “folks” he references as “losers” are the Multinational Corporations and Big-AG who control the Pork and Soybean market. Cavuto’s ‘consumers’, those he is advocating for, are Archer Daniels Midland (ADM), Monsanto, Cargill, Unilever, Nestle’ and ConAgra. Those are the names of Cavuto’s folks that he sees as “taking it on the chin.” He is NOT, repeat NOT, talking about people who shop at supermarkets and grocery stores, ie. the middle-class. I cannot emphasize this enough… once you know how to spot this economic disconnect in the arguments by advocates for multinational corporations you can never go back to a time when you don’t see it. This is the most important economic lesson that most Americans simply do not comprehend. We are in an abusive relationship, and most U.S. consumers don’t even know about it. If the U.S. were to exit NAFTA (North American Free Trade Agreement), the price you pay for most foodstuff at the grocery store would drop 10% in the first quarter and likely drop 20% or more by the end of the first year. Here’s why:
Approximately a decade ago the U.S. Dept of Agriculture stopped using U.S. consumer food prices within the reported CORE measures of inflation. The food sector joined the ranks of fuel and energy prices in no longer being measured to track core inflation and backdrop Fed monetary policy. Not coincidentally this was simultaneous to U.S. consumers seeing massive inflation in the same highly consumable sector. There are massive international corporate and financial interests who are inherently at risk from President Trump’s “America-First” economic and trade platform. Believe it or not, President Trump is up against an entire world economic establishment. When you understand how trade works in the modern era you will understand why the agents within the system are so adamantly opposed to U.S. President Trump. The biggest lie in modern economics, willingly spread and maintained by corporate media, is that a system of global markets still exists.
It doesn’t.
Every element of global economic trade is controlled and exploited by massive institutions, multinational banks and multinational corporations. Institutions like the World Trade Organization (WTO) and World Bank control trillions of dollars in economic activity. Underneath that economic activity there are people who hold the reigns of power over the outcomes. These individuals and groups are the stakeholders in direct opposition to principles of America-First national economics. The modern financial constructs of these entities have been established over the course of the past three decades. When you understand how they manipulate the economic system of individual nations you begin to understand understand why they are so fundamentally opposed to President Trump. In the Western World, separate from communist control perspectives (ie. China), “Global markets” are a modern myth; nothing more than a talking point meant to keep people satiated with sound bites they might find familiar. Global markets have been destroyed over the past three decades by multinational corporations who control the products formerly contained within global markets. The same is true for “Commodities Markets”. The multinational trade and economic system, run by corporations and multinational banks, now controls the product outputs of independent nations. The free market economic system has been usurped by entities who create what is best described as ‘controlled markets’. U.S. President Trump smartly understands what has taken place. Additionally he uses economic leverage as part of a broader national security policy; and to understand who opposes President Trump specifically because of the economic leverage he creates, it becomes important to understand the objectives of the global and financial elite who run and operate the institutions. The Big Club. Understanding how trillions of trade dollars influence geopolitical policy we begin to understand the three-decade global financial construct they seek to protect.
That is, global financial exploitation of national markets.
FOUR BASIC ELEMENTS:
♦Multinational corporations purchase controlling interests in various national outputs and industries of developed industrial western nations.
♦The Multinational Corporations making the purchases are underwritten by massive global financial institutions, multinational banks.
♦The Multinational Banks and the Multinational Corporations then utilize lobbying interests to manipulate the internal political policy of the targeted nation state(s).
♦With control over the targeted national industry or interest, the multinationals then leverage export of the national asset (exfiltration) through trade agreements structured to the benefit of lesser developed nation states – where they have previously established a proactive financial footprint. Against the backdrop of President Trump confronting China; and against the backdrop of NAFTA being renegotiated, likely to exit; and against the necessary need to support the key U.S. steel industry; revisiting the economic influences within the modern import/export dynamic will help conceptualize the issues at the heart of the matter. There are a myriad of interests within each trade sector that make specific explanation very challenging; however, here’s the basic outline. For three decades economic “globalism” has advanced, quickly. Everyone accepts this statement, yet few actually stop to ask who and what are behind this – and why? Influential people with vested financial interests in the process have sold a narrative that global manufacturing, global sourcing, and global production was the inherent way of the future. The same voices claimed the American economy was consigned to become a “service-driven economy.” What was always missed in these discussions is that advocates selling this global-economy message have a vested financial and ideological interest in convincing the information consumer it is all just a natural outcome of economic progress.
It’s not.
It’s not natural at all. It is a process that is entirely controlled, promoted and utilized by large conglomerates, lobbyists, purchased politicians and massive financial corporations. Again, I’ll try to retain the larger altitude perspective without falling into the traps of the esoteric weeds. I freely admit this is tough to explain and I may not be successful.
Bulletpoint #1:♦ Multinational corporations purchase controlling interests in various national elements of developed industrial western nations. This is perhaps the most challenging to understand. In essence, thanks specifically to the way the World Trade Organization (WTO) was established in 1995, national companies expanded their influence into multiple nations, across a myriad of industries and economic sectors (energy, agriculture, raw earth minerals, etc.). This is the basic underpinning of national companies becoming multinational corporations. Think of these multinational corporations as global entities now powerful enough to reach into multiple nations -simultaneously- and purchase controlling interests in a single economic commodity. A historic reference point might be the original multinational enterprise, energy via oil production. (Exxon, Mobil, BP, etc.) However, in the modern global world, it’s not just oil; the resource and product procurement extends to virtually every possible commodity and industry. From the very visible (wheat/corn) to the obscure (small minerals, and even flowers). Bulletpoint #2 ♦ The Multinational Corporations making the purchases are underwritten by massive global financial institutions, multinational banks. During the past several decades national companies merged. The largest lemon producer company in Brazil, merges with the largest lemon company in Mexico, merges with the largest lemon company in Argentina, merges with the largest lemon company in the U.S., etc. etc. National companies, formerly of one nation, become “continental” companies with control over an entire continent of nations. …or it could be over several continents or even the entire world market of Lemon/Widget production. These are now multinational corporations. They hold interests in specific segments (this example lemons) across a broad variety of individual nations. National laws on Monopoly building are not the same in all nations. Most are not as structured as the U.S.A or other more developed nations (with more laws). During the acquisition phase, when encountering a highly developed nation with monopoly laws, the process of an umbrella corporation might be needed to purchase the targeted interests within a specific nation. Theexample of Monsantoapplies here.
Bulletpoint #3 ♦The Multinational Banks and the Multinational Corporations then utilize lobbying interests to manipulate the internal political policy of the targeted nation state(s). With control of the majority of actual lemons the multinational corporation now holds a different set of financial values than a local farmer or national market. This is why commodities exchanges are essentially dead. In the aggregate the mercantile exchange is no longer a free or supply-based market; it is now a controlled market exploited by mega-sized multinational corporations. Instead of the traditional ‘supply/demand’ equation determining prices, the corporations look to see what nations can afford what prices. The supply of the controlled product is then distributed to the country according to their ability to afford the price. This is essentially the bastardized and politicized function of the World Trade Organization (WTO). This is also how the corporations controlling WTO policy maximize profits. Back to the lemons. A corporation might hold the rights to the majority of the lemon production in Brazil, Argentina and California/Florida. The price the U.S. consumer pays for the lemons is directed by the amount of inventory (distribution) the controlling corporation allows in the U.S. If the U.S. lemon harvest is abundant, the controlling interests will export the product to keep the U.S. consumer spending at peak or optimal price. A U.S. customer might pay $2 for a lemon, a Mexican customer might pay .50¢, and a Canadian $1.25. The bottom line issue is the national supply (in this example ‘harvest/yield’) is not driving the national price because the supply is now controlled by massive multinational corporations. The mistake people often make is calling this a “global commodity” process. In the modern era this “global commodity” phrase is particularly nonsense. A true global commodity is a process of individual nations harvesting/ creating a similar product and bringing that product to a global market. Individual nations each independently engaged in creating a similar product. Under modern globalism this process no longer takes place. It’s a complete fraud. Massive multinational corporations control the majority of production inside each nation and therefore control the global product market and price. It is a controlled system. EXAMPLE: Part of the lobbying in the food industry is to advocate for the expansion of U.S. taxpayer benefits to underwrite the costs of the domestic food products they control. By lobbying DC these multinational corporations [Archer Daniels Midland (ADM), Monsanto, Cargill, Unilever, Nestle’, ConAgra etc] get congress and policy-makers to expand the basis of who can use EBT and SNAP benefits (state reimbursement rates). Expanding the federal subsidy for food purchases is part of the corporate profit dynamic. With increased taxpayer subsidies, the food price controllers can charge more domestically and export more of the product internationally. Taxes, via subsidies, go into their profit margins. The corporations then use a portion of those enhanced profits in contributions to the politicians. It’s a circle of money. In highly developed nations this multinational corporate process requires the corporation to purchase the domestic political process (as above) with individual nations allowing the exploitation in varying degrees. As such, the corporate lobbyists pay hundreds of millions to politicians for changes in policies and regulations; one sector, one product, or one industry at a time. These are specialized lobbyists.
EXAMPLE:The Committee on Foreign Investment in the United States (CFIUS)
CFIUS is an inter-agency committee authorized to review transactions that could result in control of a U.S. business by a foreign person (“covered transactions”), in order to determine the effect of such transactions on the national security of the United States.
CFIUS operates pursuant to section 721 of the Defense Production Act of 1950, as amended by the Foreign Investment and National Security Act of 2007 (FINSA) (section 721) and as implemented by Executive Order 11858, as amended, and regulations at 31 C.F.R. Part 800.
The CFIUS process has been the subject of significant reforms over the past several years. These include numerous improvements in internal CFIUS procedures, enactment of FINSA in July 2007, amendment of Executive Order 11858 in January 2008, revision of the CFIUS regulations in November 2008, and publication of guidance on CFIUS’s national security considerations in December 2008 (more)
Bulletpoint #4 ♦ With control over the targeted national industry or interest, the multinationals then leverage export of the national asset (exfiltration) through trade agreements structured to the benefit of lesser developed nation states – where they have previously established a proactive financial footprint. The process of charging the U.S. consumer more for a product, that under normal national market conditions would cost less, is a process called exfiltration of wealth. This is the basic premise, the cornerstone, behind the catch-phrase ‘globalism’.
It is never discussed.
To control the market price some contracted product may even be secured and shipped with the intent to allow it to sit idle (or rot). It’s all about controlling the price and maximizing the profit equation. To gain the same $1 profit a widget multinational might have to sell 20 widgets in El-Salvador (.25¢ each), or two widgets in the U.S. ($2.50/each). Think of the process like the historic reference of OPEC (Oil Producing Economic Countries). Only in the modern era massive corporations are playing the role of OPEC and it’s not oil being controlled, thanks to the WTO it’s almost everything. Again, this is highlighted in the example of taxpayers subsidizing the food sector (EBT, SNAP etc.), the corporations can charge U.S. consumers more. Ex. more beef is exported, red meat prices remain high at the grocery store, but subsidized U.S. consumers can better afford the high prices. Of course, if you are not receiving food payment assistance (middle-class) you can’t eat the steaks because you can’t afford them. (Not accidentally, it’s the same scheme in the ObamaCare healthcare system). Agriculturally, multinational corporate Monsanto, ADM, ConAgra says: ‘all your harvests are belong to us‘. Contract with us, or you lose because we can control the market price of your end product. Downside is that once you sign that contract, you agree to terms that are entirely created by the financial interests of the larger corporation; not your farm. The multinational agriculture lobby is massive. We willingly feed the world as part of the system; but you as a grocery customer pay more per unit at the grocery store because domestic supply no longer determines domestic price. Within the agriculture community the (feed-the-world) production export factor also drives the need for labor. Labor is a cost. The multinational corps have a vested interest in low labor costs. Ergo, open border policies. (ie. willingly purchased republicans not supporting border wall etc.). Remember the example ofChina purchasing Smithfield foods?In these examples the state-run economic operation of China operates like a corporation. [More Here] This corrupt economic manipulation/exploitation applies over multiple sectors, and even in the sub-sector of an industry like steel. China/India purchases the raw material, coking coal, then sells the finished good (rolled steel) back to the global market at a discount. Or it could be rubber, or concrete, or plastic, or frozen chicken parts etc. The ‘America First’ Trump-Trade Doctrine upsets the entire construct of this multinationalexport/control dynamic. Team Trump focus exclusively on bilateral trade deals, with specific trade agreements targeted toward individual nations (not national corporations). ‘America-First’ is also specific policy at a granular product level looking out for the national interests of the United States, U.S. workers, U.S. companies and U.S. consumers. Under President Trump’s Trade positions, balanced and fair trade with strong regulatory control over national assets, exfiltration of U.S. national wealth is essentially stopped. This puts many current multinational corporations, globalists who previously took a stake-hold in the U.S. economy with intention to export the wealth, in a position of holding contracted interest of an asset they can no longer exploit. Perhaps now we understand better how massive multi-billion multinational corporations and institutions are aligned against President Trump.
The University of California system voted in March to raise tuition for out-of-state students by nearly $1,000, a hike that will not apply to illegal alien students.
The system’s board of regents approved the proposal to increase out-of-state tuition by $978 by a 12-3 vote,reported The College Fix, but California law allows illegal alien students to evade this charge by enrolling as in-state students.
“All students — regardless of immigration status — are subject to the same tuition and fee structures, based on their residency status,” UC spokeswoman Clair Doan told the Fix.
California assembly bill 540mandatesthat illegal alien students can obtain in-state tuition if they attend high school in the state for a minimum of three years and earn a California high school diploma.
“It’s really incumbent upon Congress to close that loophole now that it’s exposed,” Federation for American Immigration Reform spokesman Ira Mehlman told The Daily Caller News Foundation.
While colleges do not ask students for their immigration status, public schools are constitutionally prohibited from denying K-12 students free public education on the basis of their immigration status, according to the 1982 Supreme Court decision “UC does not ask its students nor applicants for their immigration status,” Doan explained. But the spokeswoman speculated that the UC system enrolled approximately 3,700 illegal alien students.
Doan may have arrived at this number by identifying illegal alien students via the students’ usage of taxpayer ID numbers and not social security numbers, according to Mehlman.
The University of California systemeducatesnearly a quarter of a million students. UC’s board of regents will vote on increasing base tuition by $348 for all students in May, but its members promised to revoke the hike if the state legislature provides the system with more funding. UC regent chair George Kieffer reported that UC students have 31 percent less funding each in 2018 when compared with their 2000 counterparts.
“California is perpetually broke,” Mehlman told TheDCNF. “And yet they manage to come up with services for illegal aliens.”
The immigration advocacy spokesman elaborated on services the state provides to illegal aliens, such as grants, public housing, as well as various other state and local services.
Mehlman postulated that about half of illegal aliens work “off the books” and the other half use “bogus social security numbers.” The demographic costs California taxpayers over $25 billion per year,according to FAIR.
TheDCNF reached out to the California Immigrant Policy Center for comment but received none in time for press.
Over the weekend,ZH looked at the notional amountof non-financial Libor-linked debt (so excluding the roughly $200 trillion in floating-rate derivatives which have little practical impact on the real world until there is a Lehman-like collateral chain break, of course at which point everyone is on the hook), to see what the real-world impact of the recent blow out in 3M USD Libor is on the business and household sector.
To this end, JPM calculated that based on Fed data, there is a little under $8 trillion in pure Libor-related debt…
… and that a 35bps widening in the LIBOR-OIS spread could raise the business sector interest burden by $21 billion. As we wondered previously, “whether or not that modest amount in monetary tightening is enough to “break” the market remains to be seen.”
In other words, unless the Fed – and JPMorgan – have massively miscalculated how much floating-rate debt is outstanding, and how much more interest expense the rising LIBOR will prompt, the ongoing surge in Libor and Libor-OIS, should not have a systemic impact on the financial system, or economy.
What about at the corporate borrower level?
In an analysis released on Monday afternoon, Goldman’s Ben Snider writes that while for equities in aggregate, rising borrowing costs pose only a modest headwind, “stocks with high variable rate debt have recently lagged in response to the move in borrowing costs.”
Goldman cautions that these stocks should struggle if borrowing costs continue to climb – which they will unless the Fed completely reverses course on its tightening strategy – amid a backdrop of elevated corporate leverage and tightening financial conditions.
Indeed, while various macro Polyannas have said to ignore the blowout in both Libor and Libor-OIS because, drum roll, they are based on “technicals” and thus not a system risk to the banking sector (former Fed Chair Alan Greenspan once called the Libor-OIS “a barometer of fears of bank insolvency”), what they forget, and what Goldman demonstrates is what many traders already know well: the share prices of companies with high floating rate debt has mirrored the sharp fluctuation in short-term borrowing costs. This is shown below in the chart of 50 S&P 500 companies with floating rate bond debt (i.e. linked to Libor) amounting to more than 5% of total.
Here are some details on how Goldman constructed the screen:
We exclude Financials and Real Estate, and the screen captures stocks from every remaining sector except for Telecommunication Services. So far in 2018, as short-term rates have climbed, these stocks have lagged the S&P 500 by 320 bp (-4% vs. -1%). The group now trades at a 10% P/E multiple discount to the median S&P 500 stock (16.0x vs. 17.6x). These stocks should struggle if borrowing costs continue to climb, but may present a tactical value opportunity for investors who expect a reversion in spreads. The tightening in late March of the forward-looking FRA/OIS spread has been accompanied by a rebound of floating rate debt stocks and suggests investors expect some mean-reversion in borrowing costs.
Goldman also notes that small-caps generally carry a larger share of floating rate debt than do large-caps, which may lead to a higher beta for the data set due to size considerations.
In any event, the inverse correlation between tighter funding conditions (higher Libor spreads) and the stock under performance of floating debt-heavy companies is unmistakable.
Finally, traders who wish to hedge rising Libor by shorting those companies whose interest expense will keep rising alongside 3M USD Libor, in the process impairing their equity value, here is a list of the most vulnerable names.
Money manager Michael Pento says the biggest unreported story is the skyrocketing interest rate of LIBOR. What’s that? Pento explains, “LIBOR, and people don’t understand or talk about it, is the London Inter-Bank Offered Rate. This rate has gone from 0.3% at the end of 2015 to 2.3% today. The London Inter-Bank Offered Rate is the rate that is applied to $370 trillion of loans and derivatives and loans, from credit cards, to student loans, to auto loans are priced off of LIBOR. . . That is the biggest reason why the stock market is rolling over because the cost of borrowing money. . . is going up very, very sharply. . . All of this is going to hit a crescendo in October of 2018.” Pento Says gold prices are going way up because the Fed will no be able to raise interest rates.
After years of torrid growth that hasfar outstripped wages,national apartment rents have finally plateaued, climbing a scant 2.5% YOY to $1,371 in March, according toRentCafe‘s latest monthly rent report.
Interestingly, the hottest rental markets (Brooklyn, for example), have seen rents retreat from record highs as they grapple with too much development at the high end of the housing market.
Meanwhile, mid-sized cities like Sacramento, Colorado Springs and Tampa have seen strong growth. But by far the strongest growth has been recorded in small cities like Midland, Texas (famously the home of George W Bush) and Yonkers, New York. Midland saw rents increase by a staggering 29% over the past 12 months, while nearby Odessa recorded a nearly 40% rent increase. Meanwhile, Reno, Tacoma and Orlando are in the top ten fastest growing rental markets.
Still, despite a slight year-over-year drop, Manhattan still has the highest average rent in the country, followed by San Francisco, which saw rents rise 2.4% year-over-year.
Of the 250 cities surveyed by RentCafe, Wichita, Kansas had the lowest average rent at $632 a month.
This morning at 8am, the New York Fed, in cooperation with the Treasury Department’s Office of Financial Research, launched a much-anticipated, if largely worthless (for now) benchmark interest rate to replace Libor, together with two other reference rates, which traders and market participants hope will prove more reliable than the infamously rigged and manipulated index after a long and complex switch over.
The so-called Secured Overnight Financing Rate (SOFR), was set at 1.80 percent, roughly 17bp below the GC repo rate and 12bp above the fed effective.
Here is the full breakdown of today’s rates:
Secured Overnight Financing Rate (SOFR) set at 1.80%
Broad General Collateral Rate (BGCR) set at 1.77%
Tri-party General Collateral Rate (TGCR) set at 1.77%
SOFR – which unlike Libor is secured – is based on the overnight Treasury repurchase agreement market, which trades around $800 billion in volume daily. As Reuters notes, publishing the rate is the first step in a multi-year plan to transition more derivatives away from the London interbank offered rate (Libor), which regulators say poses systemic risks if it ceases publication; ironically it also poses systemic risks if it keeps rising as it references a total of $300 trillion in financial (swaps, futs and derivatives) and non-financial (loans, mortgages) debt.
Some are delighted by the new rate: “It’s going to be based on a very, very robust set of transactions. I don’t think a lot of the issues and unknown volatility around Libor is going to exist,” said Blake Gwinn, an interest rate strategist at NatWest Markets in Stamford, Connecticut.
To be sure, the relentless ramp higher in both LIBOR and L-OIS has confused many: “Instances like what we’ve been going through this past month where it’s not even a clear cut bank credit issue or a dollar funding issue per se. It’s kind of got everybody scratching their heads trying to figure out why it’s doing what it’s doing,” Gwinn said.
And speaking of 3M USD Libor, today’s fixing rose yet again, up from 2.3118% to 2.3208%, the highest since November 2008 and up for their 38th straight session, longest streak since November 2005.
Still, a move away from Libor is expected to be gradual and complicated: the most pragmatic reason is that there is not yet a market for term loans such as one and three months, as in Libor. And there may never be one, unless floating debt creators are incented to shift the reference benchmark from Libor to SOFR.
“It’s hard to imagine a way they could come up with a similar calculation for a term rate and that’s the big difference between whether or not people would be comfortable adopting SOFR as a straight replacement for Libor,” said Thomas Simons, a money market economist at Jefferies in New York.
To be sure, it will take a long time to develop liquidity in derivatives based on the rate; it will take even longer to transplant existing Libor-linked securities to SOFR. The CME Group will launch futures trades based on SOFR on May 7, while major dealers will enable swaps trading on the rate this year.
Investors will also need to adjust to the day to day volatility of the repurchase market, where rates typically increase ahead of monthly and quarterly closings.
“A lot of folks have not really followed the repo market and some of the intramonth variations particularly closely,” said Mark Cabana, head of STIR at Bank BofA. “On a day to day basis it will be more volatile, but smoothing out over a three month time horizon it should be similarly volatile.”
Now, the only question is whether it will ever be adopted.
After last week’s “paint the tape ahead of a long-weekend” melt-up into the close, the first trading day of the second quarter was a bloodbath… In fact the worst since The Great Depression…
As David Rosenberg (@EconguyRosie) summed up so precisely: New math: every tweet by @realDonaldTrump subtracts 70 points off the Dow. Keep ’em coming.
Woah…a ubiquitous opening bounce, then puked into Europe’s close, then another attempt to ignite momentum, fails and stocks puked into red for the year again…
3rd dead cat bounce in a week…
The S&P 500 and The Dow broke below their critical 200DMA… (Nasdaq is closest to its 200DMA since Brexit plunge) –
there was a desperate last few minutes attempt to rally ’em back above the 200DMAs – Dow ended back above its 200DMA
First time the S&P has closed below the 200DMA since June 27th 2016 (Brexit)
VIX topped 25, leading the US equity index vols higher today…
Tech led the tumble…
Lowest close for NYSE FANG+ Index since January 5th…
With Tesla bonds…
and Stocks really ugly – We suspect Elon is regretting the April Fools’ joke…
This morning shareholders of Tesla are hardly laughing, with Tesla stock tumbling as much as 5%, down to $254, the lowest level in a year.
Tesla Goes Bankrupt Palo Alto, California, April 1, 2018 — Despite intense efforts to raise money, including a last-ditch mass sale of Easter Eggs, we are sad to report that Tesla has gone completely and totally bankrupt. So bankrupt, you can't believe it.
It was generally a quiet day, with no macro news and equities range-bound, seemingly spooked by the ongoing verbal war between Trump and Jeff Bezos, where first in a tweet then a White House press conference, the president warned that US taxpayers will no longer subsidize Amazon “by the billions.” And, as has been the case recently, every time Trump spoke or tweeted, Amazon turned negative.
And then, just around 2:45pm, aBloomberg headlinehit, according to which President Trump is not formally looking at options to address his concerns with Amazon, which immediately unleashed a buying panic first in Amazon and then across the broader market:
As we detailedon Tuesday, the mortgage refis have cratered to levels not seen since December ’08 amid a spike in interest (and mortgage) rates. Simply put, the population of borrowers who both qualify for a refi and want one given the higher rates has collapsed.
Consequently, the remaining homeowners seeking to refinance are overwhelmingly “cashing out” also known as taking out a new mortgage that’s bigger than the remaining balance on the existing one and using the extra money todo sensible things like home improvementsmaintain their lifestyle.
And why not: just look at all that sweet, sweet equity…
“When rates are low, the primary goal of refinancing is to reduce the monthly payment,” wrote researchers for the Urban Institute in arecent report. “But when rates are high, borrowers have no incentive to refinance for rate reasons. Those who still refinance tend to be driven more by their desire to cash out.”
To better quantify the drop-off in refis,Black Knight reportsthe recent spike in interest rates cut the population of borrowers with an interest rate incentive to refinance by nearly 40 percent in 40 days
Virtually all of the decline in potential refinance candidates was among 2009 and later vintages; Fewer than 100K traditional refinance candidates (720+ credit score, <80 percent loan-to-value (LTV) ratio) remain in 2012 and later vintages
“As people stay in their homes longer we see people reinvesting in their homes by using equity to update their homes and do repair work,” said Rick Sharga, executive VP for Carrington Mortgage Holdings and an industry veteran (viaMarketWatch). “We’ve seen a huge expansion of the types of retirement options people have. One is aging in place and retrofitting your house.”
In the last go-around, many homeowners “blew the money,” in Sharga’s words, on splashy purchases like vacations and boats. But lenders were complicit too, offering loans that were as much as 120% of the existing value of the home.
Do you believe that? While homeowners may not be taking Hummer limos to Vegas with their cashed-out home equity “winnings” like idiots of ten-years past, it should be noted that the U.S. savings rate is at crisis lows, credit card debt has gone “completely vertical,” and 61% of Americansdon’t have enough in savingsto cover a $1,000 emergency.
Here are some troubling charts revealing the true state of the US consumer:
And while it is nobody’s intention to have a negative outlook on things, every several days or so, we notice, and are compelled to point out that there are some very sick looking canaries in familiar coal mines. We would also be remiss if we didn’t caution that home prices may even come down, as once upon a time “markets” moved in a thing called a cycle.
This is one of the most important and valued articles to help you prepare. I think it could be useful, based on our experience with the economic collapse and its effects on the currency. Let me tell you what life is really like when your country has a devalued currency that is nearly worthless.
How Do You Buy Things With Devalued Currency?
These last few days I was asked by a fellow prepper overseas how our internal trading, with such a devalued currency, was going on. He asked if we used silver coins and bartering. I answered him that we use mostly US dollars and Euros for large transactions like vehicles, land, and housing, as far as I know. But the reason people are mostly selling is that they are desperate to get out of the country, and the wealth they have accumulated in previous years vanishes, with the bad deals they seem forced to accept.
On the other hand, for day-to-day payments, bolivars are still used, but the prices go up (always UP by the way) depending on the black market dollar price. This is, though, a perfect evidence that this black market dollar is controlled by the government: look at the evolution price, and you will find it stable just before any important election, political campaigns and such.
This is no surprise, those who benefit the most from this black market are those “companies” that aligned with the dollar river… and nowadays that stream is getting dry.
Bad News For Oil Industry Workers
I received very bad news for those still working in the oil industry. So you can understand what is in store for the employees, I have to explain some background first.
As part of our monthly payment, we received a savings incentive: the company retained the 12.5% of our salary in their accounts until the end of the month, and provided another 12.5% (it sounds like a lot but it is not). So, by the end of the month, we had in the corporative account an additional 25%.
This was one of the main benefits for the oil state workers, and that helped to deal with the high performance demanded by the industry. This money, during better times, was kept there until the end of the year, for a new car, or starting a side business, some fancy vacations, and stuff. However I never used it for traveling overseas, but invested in land, some prepping gear and equipment, assisting my parents and my wife’s family, and short family trips from time to time to the beach, or my folks’ place and such.
We had something like your 704(k), that could be retrieved from the corporate accounts to our payroll bank account. This supposedly was for the retirement of the employees. The economy tanked so fast that this is worthless now.
In one of the speeches a few days ago, the new “cryptocurrency” that is not such, the Petro, is going to substitute the national currency in the savings additions for the employees. My friends that still remain working there told that it was going to be an “option” at first.
But we all know that this is just a way to IMPOSE the Petro on the people and inject it in the national economy despite the US sanctioning. Add to this the fact that most of the workers have NO idea about how to trade with it, nor how to exchange it for food as they use to do with the savings incentive. See my point?. They cut off the employees revenue and give them a worthless “crypto” that is useless. How is going to buy food with that a 58-year-old secretary, for example, without other computer skills than using the social networks, the email and word processors? Even worse, they are FORCING the employees to accept a currency that is prohibited by the US financial authorities, they will be subject to the sanctioning automatically, completely unwilling to trade with that crypto.
What concerns me the most, is that the presidential speech announced that everyone who wants to sell their properties will have to do it in cryptocurrency. (I have the audio file to prove it) This is nothing more than the imposition of the convertible Cuban peso. The hard currencies for the elites, the USDs and Euros, and the garbage currencies that they worked so hard to destroy, for the ignorant, starving masses.
The Dangers Of Alternative Trade
It is unlikely to see someone paying with silver coins, as far as I am aware. Bartering? Sure, but that is mostly in the rural communities. In the cities, bartering is not common. There are some brave initiatives to start paying employees with a dozen eggs a week, additional to the salary, as an incentive. I have seen it in the newspaper ads.
This said, I have seen real bargains in collectible coins, some silver 1-ounce coins memorabilia of our independence, called “Doblón” commonly found here, which means people have used them as wealth storage.
The problem is that if you need to buy food with devalued currency, perhaps you won’t get as much as you need. The currency will be valued by your seller. However, I am sure that if this becomes much more common, in the communities far away from the major cities some sort of local economy will soon be in place.
Some nuts are trying to impose an alternative currency named “Elorza” (you may want to google search it) in a frontier town with the same name in the Apure state. This, besides being illegal is delusional. Years ago I bought a couple of Doblón that were not cased; the following year I needed cash and wanted to sell them at the silver spot price with a plus but, the buyers that contacted me did not want to pay the fair price, even though the silver was down about $2 under the original price I paid for. So I went to a jeweler and could sell them there.
This means that they could be used as currency, but it depends on the culture of the society whether they will accept it or not. The total of those Doblón is 20.000, so their value should increase every year. There are some other commemorative coins, but people are negotiating them in dollars because most of the people want to leave the country.
There has been a place, in a major city, where you barter or exchange your goods for something else that you may need, but criminals made impossible to keep this kind of flea market in public places. I have received alarming reports from friends in the coastal fishing towns. The “colectivos” gang are now forcing the small fishermen to sell them their catch of the day at gunpoint. Ar-15s at the shoulder and all. Then they sell the fish to the people at 3 times the price they pay the fishermen.
The national guard and police do not get involved. They just receive their fee: milk crates filled up with devalued bills. The source of this information is highly trusted, so I can write about this with confidence. It was a friend of mine, a former co-worker who was there and saw everything from his car. His parents live in this coastal city, called Cumana. He was going to buy but after that, he decided to go to a supermarket. The beach market where people used to buy fresh at lower prices is no longer secure.
Other Types Of Enterprise
My father has been working over 25 years as a repairman for electrical farm equipment. Pumps, mill engines, alternators, generators, that kind of stuff. He has been lately charging his customers and receiving staples and supplies: corn flour, pasta, rice, even pork meat, poultry, cheese, eggs and such. When customers don’t have a way to pay, he has also made repairs and received as payment lots of old, worn, used spare parts that he rebuilds whenever he finds some idle time. Once the parts are fully functional, he trades or sells them.
He is a smart trader and always get an edge on his deals. What the customers see as junk he knows that someone else will need it once it is repaired, and he has a good network. Almost everyday someone knocks at his door looking for a spare part. He has adapted all kind of equipment, even upgrading with modern, efficient components, or simplifying some complex control systems. He often gets the parts he has removed as part of his payment, and sometimes the clients are so happy and satisfied with their equipment being up and working again that they just give the parts away to him. So he has always has a lot of spares in his small workshop at home, and a captive market for this. My brother has been learning from him, and he is slowly gaining the needed skills to keep the family business running.
Suggestions For Preparing For a Time When Your Currency Has No Value
I would suggest that small, close communities who are self-reliance oriented start working on a plan with some guidelines in the macro aspects of the economy.
Which coins would be accepted, based on their precious metal content?
What about electronic devices like thumb drives, Sds, solar panels?
Think about everything that could have an intrinsic/bartering value.
YES, drinkable alcohol is one of the best currencies you could stockpile. Even better if you know how to produce it. I have known that our local beer factory in my former town is producing pumpkin and tapioca beer! Is that great or what?
Accumulation of some cash is good, even if it is devalued currency. It saved my sorry backside to be able to leave at the best possible time. But without the needed knowledge, skills and intuition about where things were really going, it would have been much more difficult.
Without the support of a vibrant community, survival will be much, much harder. This is one of my final deductions. This is what I have come with after witnessing how dispersed are my people, and how they don’t support each other.
Thanks for your support to the wonderful worldwide prepper community!
Stay safe.
NOTE: Jose’s wife and child have their plane tickets and are at last on their way out of Venezuela to join him! He is extremely grateful to those who have offered support and good wishes.
Just days afterBeijing officially launchedYuan-denominated crude oil futures (with a bang, as shown in the chart below, surpassing Brent trading volume) which are expected to quickly become the third global price benchmark along Brent and WTI, China took the next major step in challenging the Dollar’s supremacy as global reserve currency (and internationalizing the Yuan) when on ThursdayReuters reportedthat China took the first steps to paying for crude oil imports in its own currency instead of US Dollars.
A pilot program for yuan payments could be launched as soon as the second half of the year and regulators have already asked some financial institutions to “prepare for pricing crude imports in the yuan“,Reuters sourcesreveal.
According to the proposed plan, Beijing would start with purchases from Russia and Angola, two nations which, like China, are keen to break the dollar’s global dominance. They are also two of the top suppliers of crude oil to China, along with Saudi Arabia.
A change in the default crude oil transactional currency – which for decades has been the “Petrodollar“, blessing the US with global reserve currency status – would have monumental consequences for capital allocations and trade flows, not to mention geopolitics: as Reuters notes, a shift in just a small part of global oil trade into the yuan is potentially huge. “Oil is the world’s most traded commodity, with an annual trade value of around $14 trillion, roughly equivalent to China’s gross domestic product last year.” Currently, virtually all global crude oil trading is in dollars, barring an estimated 1 per cent in other currencies. This is the basis of US dominance in the world economy.
However, as shown in the chart below which follows the first few days of Chinese oil futures trading, this status quo may be changing fast.
Superficially, for China it would be a matter of nationalistic pride to see oil trade transact in Yuan: “Being the biggest buyer of oil, it’s only natural for China to push for the usage of yuan for payment settlement. This will also improve the yuan liquidity in the global market,” said one of the people briefed on the matter by Chinese authorities.
There are other considerations behind the launch of the Yuan-denominated oil contract as Goldman explains:
A commercial benchmark and hedging tool. Until now, Chinese oil imports were based on FOB benchmarks, with long-term procurement contracts settling off Platts Oman/Dubai or Dated Brent. The INE contract has therefore the potential to become the pricing reference for CIF China crude oil, enabling corporate financial hedging. Its warehouse structure is however likely to limit its use for physical crude delivery and may in fact at times reduce its hedge efficiency.
A new investment vehicle for onshore investors. The majority of China commodity futures trading volumes are from retail investors, yet these had until now little ability to trade oil futures. China’s capital control was the main bottleneck to trading contracts like Brent as authorities only allow $50,000 outflow a year per person. While several petrochemical and bitumen contracts already trade in China, INE will be the first contract for crude oil, likely drawing significant interest.
Direct access to China’s commodity markets for offshore investors. China offers deep and liquid commodity markets to its onshore investors. Due to China’s tight capital controls, however, foreign investors have so far only been able to trade these through qualified onshore subsidiaries. The INE contract opens up the first channel for offshore investors to trade in its onshore commodity market, with both the USD deposit and capital gains transferable back to offshore accounts. The government further announced last week that it would waive income taxes for foreign investors trading these new contracts for the first three years. The obligation to trade in Yuan will also add a currency risk exposure to offshore investors. We illustrate in Exhibit 6 a likely template (amongst others) of how overseas investors will be able to access INE liquidity.
The danger, of course, is that such a shift would also boost the value of the Yuan, hardly what China needs considering it was just two a half years ago that Beijing launched a controversial Yuan devaluation to boost its exports and economy.
Still, in light of the relative global economic stability, Beijing may be willing to take the gamble on a stronger Yuan if it means greater geopolitical clout and further acceptance of the renminbi.
Which is why restructuring oil fund flows may be the best first step: as of this moment, China is the world’s second-largest oil consumer and in 2017 overtook the United States as the biggest importer of crude oil; its demand is a key determinant of global oil prices.
If China’s plan to push the Petroyuan’s acceptance proves successful, it will result in greater momentum across all commodities, and could trigger the shift of other product payments to the yuan, including metals and mining raw materials.
Besides the potential of giving China more power over global oil prices, “this will help the Chinese government in its efforts to internationalize yuan,” said Sushant Gupta, research director at energy consultancy Wood Mackenzie. In a Wednesday note, Goldman Sachs said that the success of Shanghai’s crude futures was “indirectly promoting the use of the Chinese currency (which, however as noted above, has negative trade offs as it would also result in a stronger Yuan, something the PBOC may not be too excited about).
Meanwhile, China is wasting no time, and Unipec, the trading arm of Asia’s largest refiner Sinopec already signed a deal to import Middle East crude priced against the newly-launched Shanghai crude futures contract, which incidentally is traded in Yuan.
The bottom line here is whether Beijing is indeed prepared and ready to challenge the US Dollar for the title of global currency hegemon. As Rueters notes, China’s plan to use yuan to pay for oil comes amid a more than year-long gradual strengthening of the currency, which looks set to post a fifth straight quarterly gain, its longest winning streak since 2013.
In a sign that China’s recent Draconian capital control crackdowns have sapped market confidence in a freely-traded Yuan, the currency retained its No.5 ranking as a domestic and global payment currency in January this year, unmoved from a year ago, but its share among other currencies fell to 1.7 percent from 2.5 percent, according to industry tracker SWIFT.
A slew of measures put in place in the last 1-1/2 years to rein in capital flowing out of the country amid a slide in yuan value has taken off some its shine as a global payment currency.
But the yuan has now appreciated 3.4 percent against the dollar so far this year, with solid gains in recent sessions.
“For PBOC and other regulators, internationalization of the yuan is clearly one of the priorities now, and if this plan goes off smoothly then they can start thinking about replicating this model for other commodities purchases,” said a Reuters source.
Still, it will be a long and difficult climb before the Yuan can challenge the dollar and for Beijing to shift the bulk of its commodity purchases to the yuan because of the currency’s illiquidity in forex markets. According to the latest BIS Triennial Survey, nearly 90% of all transactions in the $5 trillion-a-day FX markets involved the dollar on one side of a trade, while only 4% use the yuan.
* * *
Still, not everyone is convinced that the new Yuan-denominated contract will create a “petro-yuan” as the following take from Goldman highlights:
The launch of the INE contract is not just about oil, as it will also be the first Yuan denominated commodity contract tradable by offshore investors. Such a set-up meets the PBOC’s monetary policy committee goal to raise the profile of its currency in the pricing of commodities. It has raised however the question of whether the INE contract is an incremental step in achieving the currency reserve status for the Yuan. We do not believe so.
While the INE launch does represent an additional step in the CNY internationalization, the CNY denomination of the INE contract does not in itself imply CNY investments. The INE contract does not represent an opening of China’s capital accounts since foreign deposits operate in a closed circuit, deposited in designated accounts and not to be used to purchase other domestic assets. In practice, the collateral deposit and any capital gains can be transferred back to offshore accounts. The potential for greater foreign ownership of Chinese assets is therefore not impacted by CNY oil invoicing and would require instead oil exporters to recycle their proceeds in local assets, for example. The incentive to do this has not changed with the introduction of the INE contracts. In particular, most Middle East oil producers still have currencies pegged to the dollar and limited ability to hedge CNY exposure.
Whether or not Goldman is right remains to be seen, however it is undeniable that a monumental change is afoot in global capital flows, where the US – whether Beijing wants to or not – will soon be forced to defend its currency status as oil exporters (and investors in this highly financialized market) will now have a choice: go with US hegemony, or start accepting Yuan in exchange for the world’s most important commodity.
A Sacramento, California woman selling a house which has been in her family for half a century will sell to just about anyone – unless they’re a Trump supporter.
The homeowner, who declined to give her name, told CBS Sacramento “I told her [the realtor] that I didn’t want her to sell it to a Trump supporter.”
The woman’s realtor, Elizabeth Weintraub, says that the “no Trump supporter” caveat is a first for her. “We can ask somebody how they voted, but they don’t have to tell us,” said Weintraub.
But is it actually legal? Attorney Allen Sawyer thinks not: “That’s an unlawful contractual term that infringes the freedom of association and first amendment rights,” said Sawyer.
According to the Fair Housing Act, political party affiliation doesn’t fall into one of the seven protected classes. They include race, religion, color, disability. National origin, sex and familial status. –CBS Sacramento
“People have a right to believe what they want to believe and they shouldn’t be restricted from purchasing property based on that,” said Sawyer.
Either way – the seller is clearly limiting the buying pool according to certified appraiser Ryan Lundquist – who notes that “39 percent of voters voted for Donald Trump in the Sacramento region. That’s an absolute fact.”
The homeowner doesn’t care: “When you’re talking about principals, morals, and ethics, it’s very very deep,” she said.
The Legendary Trace Mayer – Bitcoin’s Cold Winter: How Many Will Get Wrecked While Some Reap Riches
After an epic rise from $162 up to $19,886 in just over two years, the price of Bitcoin fell by nearly 70% between December 17, 2017 and February 6, 2018, to under $6,000. Alternative cryptocurrencies (altcoins) came under tremendous pressure too, and some of them lost 80-90% of their recently achieved all-time highs. Meanwhile, at least Bitcoin was able to recover some of those losses and temporarily reached $11,300 again. But over the past three weeks, the whole sector has came under tremendous pressure again.
Housing, aswe’ve pointed out in the past,is perhaps the most reliable bellwether of widening economic inequality in the US. And in its latest quarterly report on housing affordability in the US, ATTOM discovered that median-priced homes aren’t affordable to average wage earners in an astounding 68% of US housing markets.
In its report, the company calculated affordability by incorporating the amount of income needed to make monthly home payments – including mortgage payments, property tax payments and insurance – on a median-priced home, assuming a 3% down payment and a 28% maximum “front-end” debt-to-income ratio.
That required income was then compared with the median home price.
The 304 counties where a median-priced home in the first quarter was not affordable for average wage earners included Los Angeles County, California; Maricopa County (Phoenix), Arizona; San Diego County, California; Orange County, California; and Miami-Dade County, Florida. Meanwhile, the 142 counties (32 percent of the 446 counties analyzed in the report) where a median-priced home in the first quarter was still affordable for average wage earners included Cook County (Chicago), Illinois; Harris County (Houston), Texas; Dallas County, Texas; Wayne County (Detroit), Michigan; and Philadelphia County, Pennsylvania.
Already, the “hottest” housing markets are seeing an exodus of working- and middle-class individuals who can no longer afford to pay the high rents – let along afford to set aside enough money for a down payment.
Eight of the top 10 counties with the highest median home prices in Q1 2018 posted negative net migration in 2017: Kings County (Brooklyn), New York (25,484 net migration decrease); Santa Clara County (San Jose), California (5,559 net migration decrease); New York County (Manhattan), New York (3,762 net migration decrease); Orange County, California (3,750 net migration decrease); and San Mateo, Marin, Napa and Santa Cruz counties in Northern California.
Furthermore, ATTOM’s data found that this problem is getting worse, not better, with 41% of housing markets less affordable than their historical average during the first quarter. That’s up from 35% the quarter before.
Meanwhile, a staggering 73% of markets posted worsening affordability compared with a year ago, including Los Angeles, Cook County (home to Chicago), Maricopa County (Phoenix) and Kings County (Brooklyn).
The counties where the average wage earner would need to spend the highest share of their income to buy a median-priced home are Baltimore, Bibb County (Macon, Georgia) and Wayne County (Detroit).
Continuing with the trend of home prices rising more than twice as quickly as wages, home-price appreciation outpaced wage growth in 83% of housing markets.
When Fed Chairman Jerome Powellwarned last monththat “valuations are still elevated across a range of asset classes” and that he fears “signs of rising non-financial leverage” it’s possible that he was still understating the problem.
The REALTORS® Confidence Index is a key indicator of housing market strength based on a monthly survey sent to over 50,000 real estate practitioners. Practitioners are asked about their expectations for home sales, prices and market conditions. In addition, the “Questions of the Month,” feature results of a timely aspect of the housing market.
Note: the REALTOR® Confidence Index is provided by NAR solely for use as a reference. Resale of any part of this data is prohibited without NAR’s prior written consent.
Highlights
Properties were typically on the market for 37 days (45 days in February 2017).
First-time buyers accounted for 29 percent of sales (32 percent in February 2017).
Cash sales made up 24 percent of sales (27 percent in February 2017).
REALTORS® report “low inventory” and “interest rate” as the major issues affecting transactions in February 2018.
Steven Seagal – actor, Zen master, musician, director, martial arts instructor and now crypto ambassador – has reportedly walked away from the Bitcoiin project, along with its anonymous founders, after closing out an ICO that may or may not have raised its targeted $75 million.
No one knows, really, and that seems to be a recurring problem with ICOs, highlighting the danger of celebrity-sponsored coins that seem exciting but offer no protection from potential fraud.
Seagal may have been the face of the alt coin, but the founders remain masked.
Rolled out in January this year, Bitcoiin andBitcoiin2Genset out to raise $75 million during its initial coin offering (ICO), which was scheduled to wrap up on 30 March until the plug was pulled a week early, with both Seagal and the mysterious founders exiting,according to Cointelegraph.
No one knows how much they raised, buttheir websitesuggests they hit their mark. The problem is, there no way to verify that.
Thefounders claimthat they have withdrawn their association with the company to help establish total decentralization, explaining that Bitcoiin will become an anonymous cryptocurrency controlled by no one, with a new CEO appointed to lead the website.
“As Bitcoiin goes through the conversion phase from token to mineable coin we wish to advise that Bitcoiin will join the likes of the original Bitcoin and become a truly open source. Therefore a big thank you to the Founders and to our Brand Ambassador whom we wish all the best in their future endeavors. However, from this point on Bitcoiin will function within its ecosystem and become a genuinely anonymous cryptocurrency with no individual or individuals having control over the entity!”
And Seagal has remained tight-lipped.
So Seagal ostensibly helped give birth to Bitcoiin, and now it’s time to set it free to grown independently. But many will wonder whether this is practical crypto parenting, or a trip down Ponzi scheme lane.
Following his appointment as the coin’s brand ambassador, the U.S. Securities and Exchange Commission (SEC)ruledthat “Steven Seagal has to ensure that the Bitcoiin investments are appropriate and in compliance with federal and state securities laws.”
The SEC hasn’t been at all keen on celebrity involvement in promoting cryptocurrencies, issuingearlier warningsabout ICOs with celebrity ambassadors.
In recent months, celebrities such as actors Jamie Foxx and William Shatner, boxer Floyd Mayweather and hotel heiress Paris Hilton, among others, have publicly endorsed several projects ahead of their respective token sales.
U.S. regulators targeted Bitcoin and Steven Seagal earlier this month, following a March 7th securitiesfraudcease and desist order issued by New Jersey. Shortly afterwards, Tennessee followed suit with its own investorwarning.
BehindMLM, a blog that tracks marketing schemes, claims that Bitcoiin is essentially a Ponzi scheme that will end in disaster, much like Bitconnect.
“B2G will likely follow the trajectory of other altcoin Ponzi schemes. A flurry of initial trading will see the value briefly pump, before reality sets in and B2G plummets to $0,” BehindMLM wrote.
Bitconnectcurrently faces a mounting series of lawsuits and regulatory action following its quick rise and fall as one of the most notorious crypto exit scams.
Over the past few months, theSEC has hinted at a crackdownon ICOs. The SEC has recently reiterated its earlier position that many “tokens” sold in ICOs are in fact securities and must be treated as such and register with the regulatory body.
ICO proceeds havesurged, from $96.3 million in 2016 to little under $4 billion last year. More than 180 new ICOs are scheduled to launch in 2018 and they’ve already flown past regulatory radar.
The SEC’s crypto statements have become increasingly vehement as the dangers of fraud compound daily. Last month, the agency reportedly sentsubpoenasto dozens of tech companies and individuals involved in cryptocurrency.
US housing data has been disappointing so far in 2018 as affordability plummets on the heels of rising rates, but that didn’t stop Case-Shiller Home Prices from surging at a faster-than-expected 6.4% YoY in January.
Home sales, permits, and starts have been underwhelming so far this year…
But according to Case-Shiller, home prices are accelerating at their fastest rate since July 2014 (up 6.4% YoY vs 6.15% YoY exp)…
All 20 cities in the index showed year-over-year gains, led by a 12.9 percent increase in Seattle and an 11.1 percent gain in Las Vegas.
After seasonal adjustment, Seattle, San Francisco and Atlanta had the biggest month-over-month gains.
Washington has the smallest month-over-month advance at 0.2 percent.
“The home price surge continues,” David Blitzer, chairman of the S&P index committee, said in a statement.
“Two factors supporting price increases are the low inventory of homes for sale and the low vacancy rate among owner-occupied housing.”
The 20-City Home price index is less than 1% away from the record highs of 2006…
But the National home price index is over 6% above 2006 highs…
To visualize the impact the recent spike in mortgage rates is having on the US housing market in general, and home refinancing activity in particular…
… look no further than this recent chart from theJanuary Mortgage Monitor slidepack by Black Knight: it shows the recent collapse of the refi market using the recent jump in 30Y and mortgage rates.
As Black Knight writes, it looks at the – quite dramatic – effect the mortgage rate rise has had on the population of borrowers who could both likely qualify for and have interest rate incentive to refinance. It finds that the number of potential refinance candidates has tumbled to the lowest since December 2008.
Some more details from the source:
the recent spike in interest rates cut the population of borrowers with an interest rate incentive to refinance by nearly 40 percent in 40 days
Virtually all of the decline in potential refinance candidates was among 2009 and later vintages; Fewer than 100K traditional refinance candidates (720+ credit score, <80 percent loan-to-value (LTV) ratio) remain in 2012 and later vintages
Approximately 1.4 million borrowers lost the interest rate incentive to refinance in just the first six weeks of 2018
2.65 million potential candidates could still both benefit from and likely qualify for a refinance at today’s rates
That is the smallest this population has been since late 2008, prior to the initial decline in rates during the recession
Though the population is only 10 percent off its February 2017 mark, rate/term refinance production could see a more significant impact than this might suggest due to increasing burnout in the market
A corresponding drop in the average credit score of refinance originations is typically observed when rates rise
To be sure, it is hardly a shock that after a decade of record low rates, the current rise in rates means a collapse in refi activity: after all anyone who could, and would, refinance, already has, while the universe of those who have yet to take advantage of lower rates and are eligible to do so, has collapsed.
Which is bad news not only for homeowners, but also for the banks, whose refi pipeline – a steady source of income and easy profit – is about to vaporize.
Here are some more detailsfrom the WSJ: last year, 37% of mortgage-origination volume was because of refinancings, according to industry research group Inside Mortgage Finance. That is the smallest proportion since 1995, and the number of refinancings is widely expected to shrink again this year. In 2012, refinancings were 72% of originations.
While purchase activity has climbed steadily from a post-financial-crisis nadir in 2011, growth in 2017 wasn’t enough to offset a $366 billion decline in refinancing activity. The result: The overall mortgage market fell around 12%, to $1.8 trillion, according to Inside Mortgage Finance.
“The market has just gotten so very competitive because every loan matters,” said Ed Robinson, head of the mortgage business at Fifth Third Bancorp . He added that the bank is contacting homeowners who could be eligible for a refinancing in coming years to help maintain that business, and it is also instructing mortgage-loan officers to focus more on purchases.
We demonstrated this plunge inbank mortgage financing last quarterwhen we showed the near record low mortgage application activity at America’s largest traditional mortgage lender, Wells Fargo.
Non-traditional lenders face even greater peril: Quicken Loans Inc. got about 70% of its mortgage-origination volume last year from refinancings, according to Inside Mortgage Finance—a higher proportion than any other large lender.
Of course, the higher rates rise, the more mortgage applications drop, suggesting that contrary to expectations for a rebound in interest expense as Net Interest Margin rises, bank will be far worse off as a result of rising rates as refi activity grinds to a crawl.
Or, as the WSJ explains it, “increased mortgage rates can hamper refinancing activity because many homeowners have rates that are already lower than what lenders can now offer. In other cases, the higher rates cut into the savings a homeowner stands to reap by refinancing a mortgage.”
The Mortgage Bankers Association expects nothing short of a bloodbath: it forecasts overall mortgage-purchase volume to grow about 5% in 2018 but refinancing volume to drop 27%. Refinance applications fell 5% in the week ended March 16 from the prior one, according to the group.
Here is another example of how higher rates are crushing – not helping – traditional banks: since around the beginning of 2017, Valley National Bancorp , based in Wayne, N.J., has transitioned its mortgage business to 40% refinancing from 90%, said Kevin Chittenden, who runs residential lending. The bank previously relied largely on attracting homeowners through its ads for low-cost refinancings, but has since engaged with outside sales reps who are focused on purchases.
“Refi goes with the rates,” Mr. Chittenden said. “So you definitely don’t want to be too leveraged on refinancings.”
It’s about to get worse.
Guy Cecala, chief executive of Inside Mortgage Finance, said he expects some smaller nonbank lenders to sell themselves by the end of the year because of the drop in the refinancing market and mortgage originations overall. Unlike banks, nonbank lenders typically don’t rely on branches or ties to local agents, which are traditional tools for capturing mortgage purchases.
Another risk: the return of subprime borrowers. As the WSJ adds, the waning of the refinancing boom also attracts a different type of homeowner than at the beginning. As mortgage rates go up, the average credit score of refinancings tends to go down, according to industry research.
That is partly because savvy borrowers are the ones who tend to take advantage of low interest rates first. Also, some borrowers who are refinancing now are doing so to get rid of their mortgage insurance: Home prices in many parts of the country are going up, meaning some homeowners are less leveraged even if they have paid down only a small portion of their mortgage.
As for “new” mortgage platforms such as Quicken Loans which face an imminent calamity as their refi platform implodes, Chief Executive Jay Farner said the company is still enjoying demand for both purchases and refinancings, including from homeowners whose decision to refinance is focused less on rates and more on consolidating debt or switching to a shorter-term loan.
But, he added, “You’ve got to be a little bit more strategic about how you market, versus what we saw lenders do in the last few years, which is, ‘Hey, rates are low, you should do something now.’”
* * *
The biggest irony in all of the above, of course, is that there are still those who will claim that higher rates in the “new normal” are good for banks. For the far more unpleasant reality: see a chart of Wells Fargo stock.
Silver is down 1% year-to-date, while the dollar has tumbled 3.5% and gold has surged 4%, sending a possible warning signal to the broader market.
This dramatic divergence between gold and silver prices has sent the ratio of the two to multi-year highs.
The divergence between the two means prices for gold are 82 times those of silver, which is 27% more than the 10-year average.
AsThe Wall Street Journal reports,a higher gold-to-silver ratio is viewed by some investors as a negative economic indicator because money managers tend to favor gold when they think markets might turn rocky and discard silver when they are worried about slower global growth crimping consumption.
“There’s just not many people looking to buy silver at this point in time,” said Walter Pehowich, senior vice president at Dillon Gage Metals.
“There’s a lot of silver that comes out of the refineries, and they can’t find a home for it.”
The precious metals ratio last stayed above 80 in early 2016, when worries about a Chinese economic slowdown roiled markets, and in 2008 during the financial crisis. The ratio’s recent rise comes as speculators have turned the most bearish ever on silver and inventories in warehouses have risen, a sign there could be too much supply.
While investors have flocked toward gold with equity markets wobbling, money managers seeking safety or alternative assets haven’t favored silver.
“It’s not seeing great hedge demand because it’s just easy to go to gold,” said Dan Denbow, who manages the USAA Precious Metals and Minerals Fund . “Gold is a bit more predictable.”
As WSJ conclude, some analysts think silver’s underperformance is a negative sign for precious metals broadly because it is a less actively traded commodity, making it more vulnerable to bigger price swings on the way up and down.
In an interview about the trade sanctions that President Trump is throwing at China and at Corporate America – whose supply chains go through China in search of cheap labor and other cost savings – Ambassador Cui Tiankai defended the perennial innocence of China, as is to be expected, and trotted out the standard Chinese fig leafs and state-scripted rhetoric that confirmed in essence that Trump’s decision is on the right track.
Speaking onBloomberg TV, he also trotted out all kinds of more or less vague and veiled threats – such as, “We will take all measures necessary,” or “We’ll see what we’re doing next” – perhaps having forgotten that China and Hong Kong combined exportthree times as muchto the US as the other way around, and the pain of a trade war would be magnified by three on the Chinese side.
When asked about the possibility of China’s cutting back on purchases of US Treasuries – the ultimate threat, it seems, these days as Congress is piling on record deficits leading to a ballooning mounting of debt that requires a constant flow of new buyers – Ambassador Cui Tiankai said:
“We are looking at all options. That’s why we believe any unilateral and protectionist move would hurt everybody, including the United States itself. It would certainly hurt the daily life of American middle-class people, and the American companies, and the financial markets.”
So let’s dig into this threat.
China held $1.17 trillion in Treasuries as of January. That’s about 5.5% of the $21 trillion in total Treasury debt. So it’s not like they have a monopoly on it. These holdings have varied over the years and are down nearly $100 billion from November 2015:
So over the years, the Chinese haven’t been adding Treasuries anyway. Instead, they’ve been shedding some. At the moment, they’re replacing securities that are maturing and nothing more. So they could decide not to replace any maturing Treasuries or they could decide to sell Treasuries. How much impact would that have?
If China dumped its Treasury holdings, in theory, new buyers would have to emerge to buy them, and these new buyers would have to be induced by higher yields. Hence long-term Treasury yields would have to rise.
The vast majority of Treasury debt is held by pension funds of the US government and of state and local governments, and by Americans, either directly or via bond funds, or via stocks in companies like Apple and Microsoft, whose “offshore” cash is invested in all kinds of US securities, including large amounts of US Treasuries, and shareholders of those companies own those securities.
Then there’s the Fed. It holds $2.42 trillion in US Treasuries, or $1.64 trillion more than before the Financial Crisis as a result of QE. If push comes to shove, the Fed could easily mop up a trillion of Treasuries, as it has done before.
In addition, everyone is now fretting about an “inverted yield curve,” which is the phenomenon when long-term yields, such as the 10-year yield, fall below short-term yields, such as the three-month yield or the two-year yield.The last time this happened was before the Financial Crisis.
The Fed’s rate hikes, which started in December 2015, have pushed up short-term yields. For example, the three-month yield went from 0% in late 2015 to 1.74% today. But the 10-year yield, at around 2.2% in December 2015, then declined to a historic low. It has since risen, but only to 2.82% today. In other words, since December 2015, it has gained 62 basis points, while the three-month yield has gained 174 basis points.
What the Fed wants to accomplish with its rate hikes is push up long-term rates. But markets have been fighting the Fed so far. So a sort of a monetary shock, administered from China’s dumping US Treasuries and thus pushing up US long-term yields, would solve that problem. And the Fed can go about its path of raising short-term yields, confident that the Chinese authorities will do their part to push up long-term yields faster than the Fed is pushing up short-term yields. This would steepen the yield curve.
For people who dread and want to avoid a flat or an inverted yield curve, China’s dumping of US Treasuries would be a God send. So China’s threats of this type of retaliation make good media soundbites but are ultimately vacuous.
Amid rising trade and political tensions, US equities dipped nearly 6% this week, the worst weekly performance in two years. REITs fell 5% while home builders declined 3%.
A flurry of headlines reignited volatility this week including a Fed rate hike, retaliatory tariffs from China, a major data breach at Facebook, and a $1.3 trillion spending bill.
Investors are increasingly anxious that protectionism threatens to upend the best period of global economic growth in a decade. Real estate sectors are relatively immune from these negative effects.
Yield-sensitive equity sectors, including REITs and home builders, have outperformed during the past month as interest rates and inflation expectations have retreated.
The effects of tax reform and rising mortgage rates are beginning to impact housing markets. Existing home sales are higher by just 1% as first-time buyers remain on the sidelines.
Real Estate Weekly Review
2017 was a year of remarkable tranquility in financial markets, but 2018 has been quite the opposite. After going an entire year without a 2% weekly move, the S&P 500 (SPY) has recorded eight such weekly moves through the first twelve weeks of 2018. This week, volatility was reignited by a flurry of headlines centering around US trade policy, a political “data breach” at Facebook (NASDAQ:FB), a “hawkish hike” by the Federal Reserve, and a $1.3 trillion spending bill.
This week, the S&P 500 (SPY) dipped nearly 6%, which was the worst week for US stocks in more than two years. Investors are increasingly anxious that rising protectionism threatens to upend the best period of global economic growth in a decade. Others, however, remain confident that the Trump administration’s hard-line stance on trade is a negotiating tactic that will inevitably result in lower overall trade barriers. Real estate sectors are relatively immune from these effects. REITs (VNQ andIYR) and home builders (XHBandITB) outperformed this week, dropping 5% and 3%, respectively. Yield-sensitive equity sectors, including REITs and home builders, have outperformed over the past month as interest rates and inflation expectations retreated.
(Hoya Capital Real Estate, Performance as of 4pm Friday)
The 10-Year Yield ended the week 2bps lower at 2.83% after climbing to 2.90% following the Federal Reserve’s “hawkish hike.” The Fed hiked short-term rates by 25bps, as expected, but compared to the last meeting, more Fed officials now expect four rate hikes in 2018. Since inflation remains relatively subdued, investors fear that a rate-hike plan this aggressive may be unnecessarily restrictive and slow the US economy, indicated by the flattening yield curve.
Across other areas of the real estate sector, mortgage REITs (REM) declined by nearly 4% while international real estate (VNQI) fell roughly 3%. Within the Equity Income categories, we note the performance and current income yield of the Utilities, Telecom, Consumer Staples, Financials, and Energy. Within the Fixed Income categories, we look at Short-, Medium-, and Long-Term Treasuries, as well as Investment Grade and High Yield Corporates, Municipal Bonds, andGlobal Bonds.
Cell towers, manufactured housing, malls, self-storage were the best performing sectors of the week. Winners this week included Washington Prime (WPG), Crown Castle (CCI), SBA Communications (SBAC), Tanger (SKT), American Homes (AMH), and Taubman (TCO). Growth REIT sectors including hotels, office, and industrials were among the weakest-performing. DiamondRock (DRH), Brandywine (BDN), Pebblebrook (PEB), and QTS (QTS) each dropped more than 9% this week.
REITs are now lower by nearly 12% YTD, under performing the 4% rise in the S&P 500. Home builders are off by 11%. REITs remain more than 20% off their all-time highs in 2016. The 10-Year Yield has climbed 43 basis points since the start of the year.
REITs ended 2017 with a total return of roughly 5%, lower than the 20-year average annual return of 12%. Going forward, absent continued cap-rate compression, it is reasonable to expect REITs to return an average of 6-8% per year with an annual standard deviation averaging 5-15%. This risk/return profile is roughly in line with large-cap US equities.
Real Estate Economic Data
(Hoya Capital Real Estate, HousingWire)
New and Existing Home Sales Continue to Be Soft
Last week, we analyzed February housing starts data, which indicated that housing construction activity has slowed in recent quarters, dragged down by a sustained pullback in multifamily building. Single-family construction remains relatively solid, but rising mortgage rates and changes to the tax code threaten to stall the plodding housing recovery. Total housing starts have grown just 2.0% over the past twelve months, the slowest rate of growth since 2011.
This week, new and existing home sales data was released. Both new and existing home sales were strong in early 2017 but faded into year-end, likely due to rising mortgage rates, unaffordability issues, and continued tight supply levels. Existing homes were sold at a 5.54m seasonally adjusted annualized rate in February, slightly missing expectations. Existing sales have risen just 1% over the past year, the weakest rate of growth since early 2015.
New homes were sold at a 618k rate, which was roughly in line with expectations after upward revisions to past months. New home sales, which are primarily comprised of single-family homes, have been the relative bright spot, growing 7.5% on a TTM basis. This rate of growth, however, is also the second slowest since early 2015.
At roughly 600k per year, the rate of new home sales remains well below pre-recession levels and remains low by historical standards. The period between 1970 and 2000 saw an average of 650k home sales per year while the average population during that time was 30-40% below current levels. The rate of existing home sales, however, remains relatively healthy. At around 7% per year, the turnover rate of existing homes is roughly in line with pre-2000 levels. A number of factors have contributed to the “wide bottom” in new single-family housing construction: the lingering effects of overbuilding in the run-up to the housing bubble, a generational shift to renting, restrictive zoning restrictions, and lower investment returns from home building.
Existing home inventory remains near historically low levels, primarily a result of this “wide bottom” in new single-family housing construction. Existing housing supply was just 3.4 months in February, down from 3.8 months in February 2017. Other effects are at play, too, including the increased institutional presence in the single-family rental markets and the rising rate of home ownership among the older demographics. First-time home buyers made up 29% of total existing home sales, down from the 32% in February 2017. The rate of first-time home buyers remains stubbornly below the pre-bubble level of 40-45% and the bubble-peak of 52%. We have yet to see the younger demographics enter the home ownership markets in any significant numbers.
Real Estate Earnings Update
Last week, we published our Real Estate Earnings Review for 4Q17. Earnings season concluded last week in the real estate sector. Overall, 4Q17 results were slightly better than expected (80% beat or met estimates), but REITs raised caution heading into 2018. As supply growth has intensified, fundamentals continue to moderate across the real estate sector as rental markets approach supply/demand equilibrium after nearly a decade of above-trend rent growth. Same-store NOI grew 2.6% in 2017, the slowest rate of growth since 2011. Occupancy levels remain near record highs, however, as real estate demand growth continues to be robust.
Bottom Line
Amid rising trade and political tensions, US equities dipped nearly 6% this week, the worst weekly performance in two years. REITs fell 5% while home builders declined 3%. A flurry of headlines reignited volatility this week including a Fed rate hike, retaliatory tariffs from China, a major data breach at Facebook, and a $1.3 trillion spending bill. Investors are increasingly anxious that protectionism threatens to upend the best period of global economic growth in a decade. Real estate sectors are relatively immune from these negative effects.
Yield-sensitive equity sectors, including REITs and home builders, have outperformed during the past month as interest rates and inflation expectations have retreated. The effects of tax reform and rising mortgage rates are beginning to impact housing markets. Existing home sales are higher by just 1% as first-time buyers remain on the sidelines.
Last week, we published our quarterly update on the cell tower sector:Cell Tower REITs Shrug Off SpaceX Launch. Cell towers were the best performing REIT sector in 2017. After strong 4Q17 earnings results, cell towers remain the lone REIT sector in positive territory so far in 2018. The enormous spectacle of the SpaceX launch and the grand ambitions of Elon Musk to launch a competing satellite-based internet service temporarily jolted investor confidence in the sector. Despite potential competition from small-cells and satellite, macro towers continue to be the most economical way to provide comprehensive coverage. The risk of technological obsolescence is often overstated. Positive catalysts are on the horizon for 2018.
We also published our quarterly update on the industrial sector:Industrial REITs: Only A Trade War Can Spoil The Good Times. Over the past five years, industrial REITs have emerged as the hottest real estate sector. Booming global trade and the growth of e-commerce have boosted demand for warehouse distribution space. While supply growth has picked up in recent years, markets remain tight. Occupancy is near record highs, rent growth is relentless, and demand indicators suggest that there’s further room to run. Fears of a “trade war” have escalated after the US enacted tariffs on steel and aluminum imports. Uncertainty over trade policy could disrupt supply chains and weaken industrial REIT fundamentals.
Please add your comments if you have additional insight or opinions. We encourage readers to follow our Seeking Alpha page (click “Follow” at the top) to continue to stay up to date on our REIT rankings, weekly recaps, and analysis on the real estate and income sectors.
I am going to break from regular market commentary to step back and think about the big picture as it relates to debt and inflation. Let’s call it philosophical Friday. But don’t worry, there will be no bearded left-wing rants. This will definitely be a market-based exploration of the bigger forces that affect our economy.
One of the greatest debates within the financial community centers around debt and its effect on inflation and economic prosperity. The common narrative is that government deficits (and the ensuing debt) are bad. It steals from future generations and merely brings forward future consumption. In the long run, it creates distortions, and the quicker we return to balancing our books, the better off we will all be.
I will not bother arguing about this logic. Chances are you have your own views about how important it is to balance the books, and no matter my argument, you won’t change your opinion. I will say this though. I am no disciple of the Krugman “any stimulus is good stimulus” logic.
Thebroken window fallacyis real and digging ditches to fill them back in is a net drain on the economy. Full stop. You won’t hear any complaints from me there.
Yet, the obsession with balancing the government’s budget is equally damaging. In a balance sheet challenged economy the government is often the last resort for creating demand. Trying to balance a government deficit in this environment (like the Troika imposed on Greece during the recent Euro-crisis) is a disaster waiting to happen.
Have a look at these charts from the NY Times outlining the similarity of the Greece depression to the American Great Depression of the 1930s.
Now you might look at these charts and say, “Greece spent too much and suffered the consequences. Ultimately they will be better off taking the hit and reorganizing in a more productive economic fashion.” If so, you probably also still have this poster hanging in your room at your parent’s house where you grew up.
Personally, I don’t want to even bother discussing the possibility of this sort of Austrian-style-rebalancing coming to Western democracies. Yeah, it might be your dream, but it’s just a dream. I have Salma Hayek on myfreebie list, but what do I think of my chances? About as close to zero without actually ticking at the perfect zero level. It’s not a “can’t happen,” but it’s certainly a “it’s not going to happen in a million years.”
Governments were faced with a choice during the 2008 Great Financial Crisis. Credit was naturally contracting, and the economy wanted to go through a cleansing economic rebalancing where debt would be destroyed through a severe recession. Yet, governments had practically zero appetite to allow this sort of cathartic cleansing to happen. Instead, they stepped up and stopped the credit contraction through government spending and quantitative easing.
I believe that government spending is not all bad, and at times, it plays an important role in our economy. I am a huge fan ofRichard Koo’swork. When economies’ interest-rate policies become zero bound, governments are crucial in engaging in anti-cyclical spending. All debt is not bad. Take debt your company might issue for instance. Borrowing a million dollars to invest in capital equipment to make your firm more productive is a much different prospect than taking out a loan to engage in a Krugman-inspired-all-you-can-drink-party-headlined-by-the-Killers. Sure, the party sounds like fun, but it’s not going to benefit your firm past one night of excitement. Governments shouldn’t perpetuate unproductive pension grabs by workers, but instead actually spend money on infrastructure that will make the economy more productive. During the 1950s Eisenhower invested in the American highway system, helping America secure its place as the world’s most economically dominant country. Today that sort of infrastructure spending would be shouted down as irresponsible. Well, not continuing to invest in your country’s productive capacity is the irresponsible part.
The point is that not all spending is bad, but nor is all spending good. And even more importantly, government spending should be anti-cyclical. No sense spending more when your economy is rocking. Better to save the bullets to ebb the natural flow of the business cycle.
But I digress. Let’s get back to debt.
Creating debt is inflationary, while paying down debt is deflationary. That’s pretty basic.
The easiest way for me to demonstrate this fact is to look at an area where debt has been created for spending in a specific area. No better example than student loans.
Over the past fifteen years, inflation in college tuition has exploded. It’s been absolutely bonkers. Here is the chart of regular CPI versus tuition CPI.
But it should really be no surprise. If we add the student loan debt versus Federal debt series, it becomes clear that a tremendous amount of credit has been extended to students.
So let’s agree that credit creation is inflationary, and by definition, credit destruction should be deflationary.
Therefore when the market pundits that I like to affectionately call deflationistas argue that this next chart is ultimately deflationary, I understand where they are coming from.
If you assume that this debt needs to be paid back, then it’s easy to understand their argument. When debt starts to contract and this chart heads lower, this will be deflationary. And if you assume that governments start to balance their books, then there is every reason to expect that future deflation is the worry, not inflation. After all, the money has already been spent. The inflation from that spending is already in the system.
I can already hear the deflationistas argument – over 100% of GDP is unsustainable therefore credit growth will at worst go sideways, but most likely actually contract in coming years.
Really? How about Japan?
The same argument was made at the turn of the century when Japan was running a debt that was over 150% of GDP, yet they somehow managed to push that up another 80% to 230% without causing some sort of apocalyptic collapse.
Now before you send me an angry email about the moral irresponsibility of suggesting debt can go higher, save your clicks. I understand your argument. I am not interested in debating what should be done, but rather I am trying to determine what will be done. You might believe governments and Central Banks will gain religion and start conducting prudent and responsible policies. So be it. If you believe that, then by all means – load up on long-dated sovereign bonds as they will continue to be the trade of the century.
I, on the other hand, believe that Central Banks will continue printing until, as my favourite West Coast skeptic Bill Fleckenstein says, “the bond market takes away the keys.” And even when Central Banks are mildly responsible, politicians are sitting in the wings waiting to spend at any chance they get. Take Trump’s recent stimulus program. We are now more than eight years into an economic recovery, and he just pushed through one of the most stimulative fiscal policies of the past couple of decades. Regardless of where you stand politically regarding these tax cuts, there can be no denying they were much more needed in 2008 than today.
This is a long-winded way of saying that although I agree that the creation of debt is inflationary, and that the destruction of debt is deflationary, I don’t buy the argument that any sort of absolute amount of debt means the trend has to change. I don’t look at the 100% debt-to-GDP figure and worry that the US government will somehow institute deflationary policies to pay that back. Nope, I don’t see anything but a sea of growing deficits and debts. And in fact, the larger debts grow, the less likely they are to be paid back.
How will Japan pay back their debt that is 230% of GDP? The answer is that they can’t. It will be inflated away.
It’s foolish to believe that the end-game is anything but inflation. And even though increasing debt seems scary, if there is one thing that I am sure of, it’s that they will figure out a way to make even more of it.
Rant over. And no more big picture philosophy for a while – I promise.
With Trump signing a record $1.3 trillion spending bill, of which $700 billion is set to go to the military, average Americans are wondering if they will each get some cash, or at least an army tank, from the government. And, if they were resident of Hong Kong instead of the US today, the answer would be yes (to the cash that is, not the tank), as the local government is literally making money rain.
Today, more than 2.8 million Hong-Kongers who did not benefit from this year’s budget will receive a cash handout of HK$4,000 (US$510) each from the government, following intense public and political pressure on Financial Secretary Paul Chan Mo-po to further share the bumper HK$138 billion surplus announced in last month’s budget, theSCMP reported. And faced with demands to do more for the needy, the government decided to fork out an extra HK$11 billion in handouts.
Financial Secretary Paul Chan said the new scheme shows the government’s goal of caring for the community. “[We are] trying to cover more people who may not directly benefit from the budget,” he said at a press conference on Friday. What he meant is that his is just another way to short-circuit conventional economics and directly bribe the population.
Protesters calling for cash handouts and measures to benefit the poor during the announcement of the 2018 budget.
Asked by reporters, Chan said he would not promise that there will be similar handouts in the future. Secretary for Labor and Welfare Law Chi-kwong said he could not give an exact date when residents could receive the benefits, but said he hoped it will happen before the next budget is issued.
Predictably, handing out cash to some but not others leads to anger, and Chan in his financial blueprint – the first by the government of Chief Executive Carrie Lam Cheng Yuet-ngor – dished out a combination of salary and profits tax rebates and increased old age and disability allowances for at least two million Hong Kongers. The 2018 budget was criticized by many, including lawmakers from both camps, for neglecting specific groups, in particular low-income people who pay no taxes, do not own property and do not receive government benefits.
Asked if the new measure was made after receiving pressure from both camps, Chan responded that he said he would look into further measures two days after the budget was issued.
“[W]e mainly heard the voices in society, and we reflected calmly after listening to these voices and opinions. We agreed that the budget’s caring and sharing component could provide wider coverage,” he said.
Democratic Party lawmaker James To said he welcomed the new measure (duh): “We do not want the government to give cash handouts every year, but the original budget was unfair,” he said. “The Financial Secretary has to think about not giving land rates rebate to big corporations.”
What he meant is that he wants the government to give cash handouts every year.
* * *
According to a poll conducted by the University of Hong Kong’s public opinion program one to two days after the budget announcement, the 500 people surveyed gave the budget 42.8 marks out of 100, meaning satisfaction with the government’s financial strategy plunged to a seven-year low.
Which explains the highly popular cash handout.
However the money is distributed today, Hong Kong has now set a very dangerous precedent, one where the government literally has to hand out cash to quell public anger. Call it pork for the people, which is great as long as government funding is cheap and ample – like in the case of the US and its $1.3 trillion porkulus package – however one the money dries out, such “universal cash handouts” just happen to be the fastest road to a revolution by a suddenly disgruntled “free shit” army.
This morning the market has been on edge over, and traders are obsessed with just one question: how will China retaliate to Trump’s trade war and tariffs… further. After all, theinitial response of a modest 15-25% tariffon $3 billion in 128, mostly agricultural, products, seemed laughably small and appeared to be more of a warning shot than a real response to Trump’s $50BN in Section 301 tariffs.
One answer was revealedmoments ago when as we reportedthat China’s ambassador to the US Cui Tiankai did not rule out the possibility of scaling back purchases of Treasuries in response to Trump’s tariffs.
“We are looking at all options,” he said, when asked whether China would consider reduced purchases of Treasuries. “That’s why we believe any unilateral and protectionist move would hurt everybody, including the United States itself. It would certainly hurt the daily life of American middle-class people, and the American companies, and the financial markets.”
But the more likely reaction is that China will simply escalate with a “brute force” tit-for-tat retaliation, and as Citi notes, the editor-in-chief of the state-controlled Chinese newspaper Global Times, Hu Xijin, confirmed precisely that when he tweeted: “I learned that Chinese govt is determined to strike back.”
More importantly, he explained the confusion over the “disproportionate” $3 billion response, noting that “Friday’s plan to impose $3b tariffs is simply to retaliate to tariffs on steel and aluminum products“, i.e. a response to the previous, Section 232 round of tariffs, and has nothing to do with the latest round of $50 billion in Section 301 tariffs.
Instead, Hu warns that “China’s retaliation lists against the 301 investigation will target US products worth $ tens of billions. It is in the making.“
I learned that Chinese govt is determined to strike back. Friday's plan to impose $3b tariffs is to retaliate tariffs on steel and aluminum products. China's retaliation lists against the 301 investigation will target US products worth $ tens of billions. It is in the making.
Or, in other words, China’s real retaliation – one which is guaranteed to infuriate Trump with its proportionality and lead to further tit-for-tat responses – is about to hit.
As a reminder, here is a list of the main US exports to China, which – if this warning is accurate – are about to be crushed.
China has hit back at the Trump administration’s plan to slap tariffs on $50 billion in Chinese goods, retaliating with a list of similar duties on key U.S. imports including soybeans, planes, cars, whiskey and chemicals. Beijing’s list of 25% additional tariffs on U.S. goods covers 106 items with a trade value that is also $50 billion.
China will retaliate to any new US tariffs against alleged violations of intellectual property rights with “the same proportion, scale and intensity”, its U.S. ambassador Cui Tiankai vowed on state TV overnight.
This is the first time new home sales declined for 3 straight months since Q1 2014
Single-family home sales increased 4.2 percent last month to an annual rate of 4.96 million. Purchases of condominium and co-op units declined 6.5 percent to a 580,000 pace (down 4.9% YoY – the worst since Sept 2014)
However, the inventory of available properties plunged 8.1% YoY to 1.59mm, the lowest for February in data going back to 1999.
While purchases rose 11.4%MoM in The West, The NorthEast saw a 12.3% MoM plunge in sales (blamed on weather)
“There’s no letup in home-price growth, another testament to the solid, strong housing demand in the marketplace,” Lawrence Yun, NAR’s chief economist, said in a conference call with reporters.
“If prices were weakening that may be signaling a possible turning point but we are not really seeing that.” Inventory conditions remain “very tight,” he said.
However, it’s not been a pretty start to 2018 for US housing data as the Hurricane/Flood bump fades…
San Francisco housing has entered into a new reality. Tech money and foreign cash continues to flood the market and pushing prices to astronomical levels. The typicalSan Francisco crap shacknow will cost you $1.42 million, a new record high with condos going for $1.15 million. The city is entering into escape velocity of gentrification. You have olderTaco Tuesday baby boomerswith rudimentary tech knowledge that bought decades ago living next to a new generation of wealth and tech savvy professionals. You see this as well in Los Angeles. Some real estate “experts” barely have a working understanding of tech but definitely know how to navigate to Zillow to view their inflated prices. San Francisco is such an odd case study. A city that outwardly states it supports the poor but when you look at prices even making $100,000 a year makes you part of a new high income poor – at that income level a sizable amount of your net income is going to go to simply paying for housing unless you want to be part of themega commuting culturethat is now emerging in California. What is going on in San Francisco?
The new ultra rich in San Francisco
It is hard for people to wrap their minds around the cost of housing in a place like California. Not so much that it is expensive, but once you look at the property and price you realize people are paying high prices for crap shacks.
Take a look at prices in San Francisco:
And people are still active and buying. You’ll notice that prices for the U.S. and California overall are merely back to their previous peak price points. Adjusting for inflation, things are moving along more carefully. In San Francisco, we are in a different dimension.
You have foreign money flooding the market and you also have dual income high tech households trying to buy up what little inventory exists. This new class of wealth would rather live in a million dollar dump than spend horrendous hours in a commute. The new sign of status is living near your work, not a McMansion out in the middle of nowhere.
And properties are moving along nicely in San Francisco even at a median price of $1.42 million:
What is telling is that the media is now in unison championing why real estate is a great buy, even at these prices. Forget about the multitude of factors that now face our economy including jobs that don’t last for a lifetime or the necessity for mobility with the new workforce. You have the Taco Tuesday baby boomer mentality where people want to stay put forever and assume everyone is going to follow in their same footsteps. Apple wasn’t built following the old. Facebook wasn’t built by following the old. Tesla wasn’t built by following the old. This generation is different and their need in housing are reflecting a changing tone.
Beyond the obvious, even at $1.42 million most are not going to have the money to buy these properties. So what does this do to the current market? What does it do to neighborhoods? Or how about the local school systems?
I think people just assume that high prices are always going to be part of the equation in California. But recent history shows that we go in booms and busts. For those that seem to think the market can only go up they should be out in the market buying real estate. That is their position. For those renting, you are already taking a position. And many parts of the state are becoming renting majority counties.
San Francisco real estatecontinues to go up. Who is buying right now? Funny how those buying real estate at these levels don’t see it as speculation but think stocks or crypto are “crazy” – everyone picks their “investment” product and the market seems frothy across all areas.
Production of meat and seafood around the world will double to 1.2 trillion pounds by 2050. Our planet cannot afford to supply the water, fuel, pesticides, and fertilizer that industrialized animal production requires. It can’t afford the polluted water or the biodiversity loss. It can’t afford the moral inconsistencies. And they think it’s unlikely that people will consistently choose plant-based alternatives over chicken, beef, pork, and seafood. The world needs a solution to these realities. With plants providing nutrients for animal cells to grow, they believe they can produce clean meat and seafood that is over 10x more efficient than conventional meat production. All this without confining or slaughtering a single animal and with a fraction of the greenhouse gas emissions and water use. Their approach will claim to be transparent and unquestionably safe, free of antibiotics and have a much lower risk of food borne illness. The right choice will be obvious.
On the same day Ben Carson, head of The United States Department of Housing and Urban Development (Commonly known as HUD)testifiedbefore Congress about the dire need to upgrade the Department of Housing and Urban Development’s computer systems, its chief information officer resigned amid corruption allegations.
Johnson Joy submitted his resignation to Carson on Tuesday, according to areportfrom The Guardian, and the secretary accepted. Whistleblower Katrina Hubbard, Joy’s former executive assistant, filed a complaint about potential corruption in the CIO’s office, including suspicious over payments of a subcontractor.
Hubbard also claims that she was transferred and then fired after reporting the suspected fraud, with HUD citing job performance issues.
Joy first came under scrutiny last weekend, when The Guardian reported hisconnectionto GJH Global Ministries, a religious charity that solicited donations but did not have a clear objective. The group’s website had mission statements copied from other churches, and was soon locked after The Guardian began asking questions about it.
“We literally did nothing,” GJH Global Ministries director Stephen Austin told a Guardian reporter.
Another HUD official whoresignedamid questions about his background, Naved Jafry, was also involved in the charity; Jafry was a subcontractor associated with the same firm that allegedly received inflated payments.
The DC palace intrigue comes as Carson, a former Republican US Presidential Candidate and Trumps pick to head up HUD tries to weather the MSM (main stream media) hype controversy surrounding his office’s attempted purchase of a $31,000 dining room set, which was cancelled amid critical news coverage. Carson was againthumpedin the MSM for his response to the situation during a Congressional hearing Tuesday, in which he appeared to blame his wife — who is not a HUD employee — for arranging the purchase and claiming that the old furniture was a safety hazard.
During the same hearing, Carson repeatedly emphasized the importance of upgrading the Federal Housing Administration’s aging information technology infrastructure, which he claimed weathers 2,000 to 3,000 hacking attempts per week — and is based on software that dates back decades.
“We have to get the IT systems at FHA up to par. We are putting a lot of money and a lot of people in jeopardy by continuing this,” he said.
The global economy has been living through a period of central bank insanity, thanks to a little-understood expansion strategy known as quantitative easing, which has destroyed main-street and benefited wall street.
Central Banks over the last decade simply created credit out of thin air. Snap a finger, and credit magically appears. Only central banks can perform this type of credit magic. It’s called printing money and they have gone on therecord saying they are magic people.
Increasing the money supply lowers interest rates, which makes it easier for banks to offer loans. Easy loans allow businesses to expand and provides consumers with more credit to buy goods and increase their debt. As a country’s debt increases, its currency eventually debases, and the world is currently athistoric global debt levels.
Simply put, the world’s central banks are playing a game of monopoly.
With securities being bought by a currency that is backed by debt rather than actual value,we have recently seen $9.7 trillionin bonds with a negative yield. At maturity, the bond holders will actually lose money, thanks to the global central banks’ strategies.The Federal Reserve has already hintedthat negative interest rates will be coming in the next recession.
These massive bond purchases have kept volatility relatively stable, but that can change quickly. High inflation is becoming a real possibility. China, which is planning to dethrone thedollar by backing the Yuan with gold, may survive the coming central banking bubble. Many other countries will be left scrambling. Some central banks are attempting to turn the current expansion policies around. Both the Federal Reserve, the Bank of Canada, and the Bank of England have plans to hike interest rates. The European Central Bank is planning to reduce its purchases of bonds. Is this too little, too late?
The recentglobal populist movementis likely to fuel government spending and higher taxes as protectionist policies increase. The call to end wealth inequality may send the value of overvalued bonds crashing in value. The question is, how can an artificially stimulated economic boom last in a debtors’ economy?
Central bankers began to embrace their quantitative easing strategies as a remedy to the 2007 economic slump. Instead of focusing on regulatory policies, central bankers became the rescuers of last resort as they snapped up government bonds, mortgage securities, and corporate bonds. For the first time, regulatory agencies became the worlds’ largest investment group. The strategy served as a temporary band-aid as countries slowly recovered from the global recession. The actual result, however, has been a tremendous distortion of asset valuationas interest rates remain low, allowing banks to continue a debt-backed lending spree.
It’s a monopoly game on steroids.
The results of the central banks’ intervention were mixed. While a small, elite wealthy segment was purchasing assets, the rest of the population felt the widening income gap as wage increases failed to meet expectations and the cost of consumer goods kept rising. The policies of the Federal Reserve were not having the desired effect. While the Federal Reserve Bank began to reverse its quantitative easing policy, other central banks, such as the European Central Bank, the Swiss National Bank, and the European National Bank have become even more aggressive in the quantitative easing strategies by continuing to print money with abandon. By 2017, the Bank of Japan was the owner of three-quarters of Japan’s exchange-traded funds, becoming the major shareholder trading in the Nikkei 225 Index.
The Swiss National Bank is expanding its quantitative easing policy by including international investments. It is now one of Apple’s major shareholders,with a $2.8 billion investment in the company.
Centrals banks have become the world’s largest investors, mostly with printed money. This is inflating global asset prices at an unprecedented rate. Negative bond yields are just one consequence of this financial distortion.
While the Federal Reserve is reducing its investment purchases, other global banks are keeping a watchful eye on the results. Distorted interest rates will hit investors hard, especially those who have sought out riskier and higher yields as a consequence of quantitative easing (malinvestment).
The policies of the central banks were unsustainable from the start. The stakes in their monopoly game are rising as they are attempting to rectify their negative-yield bond purchasing with purchases of stocks. This is keeping the game alive for the time being. However, these stocks cannot be sold without crashing the market. Who will end up losers and winners? Middle America certainly isn’t going to be happy when the game ends. If central banks continue in their role as stockholders funded by fiat currency, it will change the game completely.
A timely book byPeter Schweizer, “Secret Empires”, explains how Chinese companies purchased U.S. politicians to gain trade advantages, aka the Beltway Swap. When you understand this process, you better understand why those same politicians today are against the Trump trade policy that is antithetical to their purchased interests.
Must watch…
Reminder:U.S. Chamber of Commerce President Tom Donohue is warning President Trump not to take any trade action against China or he will unleash his purchased control agents within congress and financial media to destroy his presidency.
Allow me to re-emphasize:
All opposition to President Trump stems from the underlying financial and economic policy. All opposition is about money!
When you ask the “why” question five times you end up discovering the financial motive for all opposition. It doesn’t matter who the group is; the opposition is ultimately about money. There are trillions at stake.
Donohue takes-in hundreds of millions in payments from multinational corporations who hold a vested interest in keeping the U.S. manufacturing economy subservient to China. The U.S. CoC then turns those corporate funds into lobbyist payments to DC politicians for legislative action that benefits their Chinese trade deals. The U.S. Chamber of Commerce is the #1 lobbyist in DC; there are trillions at stake.
Wall Street’s famous CONservative mouthpieces then take their cues from Donohue and decry any Trump trade policy that might impact their multinational benefactors. They hide behind catch phrases like “free trade”, or “free markets”. However, what they are really hiding is the truth, there is no free market – it is a controlled market. It’s a circle of trade and economic propaganda driven by the most well known guests that appear on Fox News. Ben Shapirois one such example; there are hundreds more.
WASHINGTON (Reuters)– The head of the most influential U.S. business lobbying group warned the Trump administration that unilateral tariffs on Chinese goods could lead to a destructive trade war that will hurt American consumers and U.S. economic growth.
U.S. Chamber of Commerce President Thomas Donohue said in a statement on Thursday that such tariffs, associated with a probe of China’s intellectual property practices, would be “damaging taxes on American consumers.”
His comments came after White House trade adviser Peter Navarro said that Trump would in coming weeks get options to address China’s “theft and forced transfer” of American intellectual property as part of the investigation under Section 301 of the U.S. Trade Act of 1974.
Reuters reported on Tuesday that Trump was considering tariffs on up to $60 billion worth of Chinese information technology, telecommunications and consumer products, along with U.S. investment restrictions for Chinese companies.
Donohue said the Trump administration was right to focus on the negative economic impact of China’s industrial policies and unfair trade practices, but said tariffs were the wrong approach to dealing with these.
“Tariffs of $30 billion a year would wipe out over a third of the savings American families received from the doubling of the standard deduction in tax reform,” Donohue said. “If the tariffs reach $60 billion, which has been rumored, the impact would be even more devastating.”
He urged the administration not to proceed with such a plan.
“Tariffs could lead to a destructive trade war with serious consequences for U.S. economic growth and job creation,” hurting consumers, businesses, farmers and ranchers.
In Beijing, Chinese foreign ministry spokesman Lu Kang said Donohue’s comments were correct, adding that recently more and more American intellectuals had made their rational voices heard. (read more)
Everyone admits the past 40+ years of U.S. trade deals have resulted in the massive export of U.S. wealth via jobs and manufacturing gains within other nations. The financial beneficiaries of those prior trade positions were: Wall Street, multinational corporations and multinational banks.
The losers of all prior trade priorities was the U.S. middle-class. This point is inarguable, just look around. Stop the nonsense and quit listening to those who control the markets.
So ask yourself, friends and family this very important question:
If prior U.S. trade policies resulted in the export and redistribution of U.S. wealth… What happens when you reverse the process?
In the answer to that question you discover the opposition to U.S. President Trump.
When Main Street economic principles are applied Wall Street will initially lose. There’s no way for this not to happen. Most of Wall Street is built on the Multinational platform of economic globalism. Weaken the grip of the multinational corporations and financial interests on the U.S. economy and Wall Street will drop… this is not difficult to predict. This is also necessary.
Homebuyers in the U.S. have plenty to grouse about these days. Prices have climbed steeply in many metro areas, mortgage rates are rising and inventory is thin. But for people looking to purchase their first home, it’s ugly out there.
“Starter homes have become scarcer, pricier, smaller, older and more likely in need of some TLC” than they were six years ago, the real estate website TruliareportedWednesday after analyzing housing stock across the country. Trulia began tracking prices and inventory in 2012.
Oh, Give Me a Home …
The supply of U.S. homes is up 3.3%, driven by a 13.3% jump in the premium category, while starter-home inventory has hit its lowest level since Trulia started keeping track in 2012.
It’s grim all over. American homes are at their least affordable in the report’s history. But the median listing price of available starter homes has risen 9.6 percent in the past year, easily beating out the trade-up and premium categories, while starter-home supply has fallen to a new low this quarter, Trulia reported.
Perhaps the most striking finding is that the very buyers who are typically least able to plunk down a lot of money are confronted with the least affordable homes. The share of income needed by those in the market for a premium home was 15 percent, and for a trade-up home 27 percent. For a starter it was 41 percent.
Adding insult to injury, the homes aimed at first-time buyers are less likely to be ready for human habitation than others, with fixer-uppers accounting for 11.2 percent of the category. They’re about nine years older than they were in 2012, and 2 percent smaller.
On the bright side, 2 percent isn’t a whole lot smaller. Until you learn that homes overall are more than 8 percent bigger.
Californians are bailing on the Golden State in droves as the tax burden and housing costs make the price of living unbearable for far too many. Many of those fleeing are the hearty middle-class who are being pushed into poverty by the socialist policies forced on them by the state’s elites.
The trend is a symptom of the state’s housing crunch and the ever increasing taxation.Census Bureau data showCalifornia lost just over 138,000 people to domestic migration in the 12 months ended in July 2017. Lower-cost states such as Arizona, Texas, and Nevada are popular destinations for relocating Californians.
The surging number of those working in Silicon Valley and still unable to afford adequate housing should be a warning about big government, but it sure doesn’t seem like anyone is taking notice as their taxes continue to rise. As governmentscreep toward socialism though, poverty becomes the norm,not the exception. Silicon Valley has the highest median income in the nation. But a soaring tax burden and expensive regulations have caused housing prices to increase which has also caused homelessness to surge. –SHTFPlan
“There’s nowhere in the United States that you can find better weather than here,”said Dave Senser, who lives on a fixed income near San Luis Obispo, California, and now plans to move to Las Vegas.
“Rents here are crazy if you can find a place, and they’re going to tax us to death. That’s what it feels like. At least in Nevada, they don’t have a state income tax. And every little bit helps.”
Senser added that he previously lived in the east San Francisco Bay region, and said…
…housing costs and gas prices are “significantly lower in Las Vegas. The government in the state of California isn’t helping people like myself. That’s why people are running out of this state now.”
AUSC Dornsife/Los Angeles Times Pollof Californians last fall found that the high cost of living, including housing, was the most important issue facing the state. It also found more than half of Californians wanted to repeal thestate’s new gas tax, which raised fees by a whopping 40 percent further burdening those already living paycheck to paycheck.
During the 12-month period that ended in July of 2017, California saw a net loss of just over 138,000 people, while Texas had a net increase of more than 79,000 people. Arizona gained more than 63,000 residents, and Nevada gained more than 38,000.
“You can literally have a lot of buying power for the dollar in Southern Nevada versus Southern California,” said Christopher Bishop, president of the Greater Las Vegas Association of Realtors.
“So it has been a major trend over the year, year and a half, and we’re seeing it increase.”
“There are no signs of recession. Employment growth is strong. Jobless claims are low and the stock market is up.”
This is heard almost daily from the media mainstream pablum.
The problem with a majority of the “analysis” done today is that it is primarily short-sighted and lazy, produced more for driving views and selling advertising rather than actually helping investors.
For example:
“The economy is currently growing at more than 2% annualized with current estimates near 2% as well.”
If you are growing at 2%, how could you have a recession anytime soon?
Let’s take a look at the data below of real economic growth rates:
January 1980: 1.43%
July 1981: 4.39%
July 1990: 1.73%
March 2001: 2.30%
December 2007: 1.87%
If you look at each of those dates, the economy was clearly growing. But each of those dates is the growth rate of the economy immediately prior to the onset of a recession.
You will remember that during the entirety of 2007, the majority of the media, analyst, and economic community were proclaiming continued economic growth into the foreseeable future as there was “no sign of recession.”
I myself was rather brutally chastised in December of 2007 when I wrote that:
“We are now either in, or about to be in, the worst recession since the ‘Great Depression.’”
Of course, a full year later, after the annual data revisions had been released by the Bureau of Economic Analysis (BEA), the recession was officially revealed. Unfortunately, by then it was far too late to matter.
It is here the mainstream media should have learned their lesson. But unfortunately, they didn’t.
The chart below shows the S&P 500 index with recessions and when the National Bureau of Economic Research dated the start of the recession.
There are three lessons that should be learned from this:
The economic “number” reported today will not be the samewhen it is revised in the future.
The trend and deviation of the data are far more important than the number itself.
“Record” highs and lowsare records for a reason as they denote historical turning points in the data.
For example, the level of jobless claims is one data series currently being touted as a clear example of why there is “no recession” in sight. As shown below, there is little argument that the data currently appears extremely “bullish” for the economy.
However, if we step back to a longer picture we find that such levels of jobless claims have historically noted the peak of economic growth and warned of a pending recession.
This makes complete sense as “jobless claims” fall to low levels when companies“hoard existing labor”to meet current levels of demand. In other words, companies reach a point of efficiency where they are no longer terminating individuals to align production to aggregate demand. Therefore, jobless claims naturally fall.
But there is more to this story.
Less Than Meets The Eye
The Trump Administration has taken a LOT of credit for the recent bumps in economic growth. We have warned this was not only dangerous, credibility-wise, but also an anomaly due to three massive hurricanes and two major wildfires that had the“broken window”fallacy working overtime.
“The fallacy of the ‘broken window’ narrative is that economic activity is only changed and not increased. The dollars used to pay for the window can no longer be used for their original intended purpose.”
If economic destruction led to long-term economic prosperity, then the U.S. should just regularly drop a “nuke” on a major city and then rebuild it. When you think about it in those terms, you realize just how silly the whole notion is.
However, in the short-term, natural disasters do “pull forward” consumption as individuals need to rebuild and replace what was previously lost. This activity does lead to a short-term boost in the economic data, but fades just as quickly.
A quick look at core retail sales over the last few months, following the hurricanes, shows the temporary bump now fading.
The other interesting aspect of this is the rise in consumer credit as a percent of disposable personal income. The chart below indexes both consumer credit to DPI and retail sales to 100 starting in 1993. What is interesting to note is the rising level of credit card debt required to sustain retail sales.
Given that retail sales make up roughly 40% of personal consumption expenditures which in turn comprises roughly 70% of GDP, the impact to sustained economic growth is important to consider.
Furthermore, what the headlines miss is the growth in the population. The chart below shows retails sales divided by the current 16-and-over population. (If you are alive, you consume.)
Retail sales per capita were previously on a 5% annualized growth trend beginning in 1992. However, after the financial crisis, the gap below that long-term trend has yet to be filled as there is a 23.2% deficit from the long-term trend. It is also worth noting the sharp drop in retail sales per capita over just the last couple of months in particular.
Since 1992, as shown below, there have only been 5-other times in which retail sales were negative 3-months in a row (which just occurred). Each time, the subsequent impact on the economy, and the stock market, was not good.
So, despite record low jobless claims, retail sales remain exceptionally weak. There are two reasons for this which are continually overlooked, or worse simply ignored, by the mainstream media and economists.
The first is that despite the “longest run of employment growth in U.S. history,” those who are finding jobs continues to grow at a substantially slower pace than the growth rate of the population.
If you don’t have a job, and are primarily living on government support (1-of-4 Americans receive some form of benefit) it is difficult to consume at higher levels to support economic growth.
Secondly, while tax cuts may provide a temporary boost to after-tax incomes, that income boost is simply being absorbed by higher energy, gasoline, health care and borrowing costs. This is why 80% of Americans continue to live paycheck-to-paycheck and have little saved in the bank. It is also why, as wages have continued to stagnate, the cost of living now exceeds what incomes and debt increases can sustain.
As I have discussed several times during the 4th-quarter of 2017:
“Very likely, the next two quarters will be weaker than expected as the boost from hurricanes fade and higher interest rates take their toll on consumers. So, when mainstream media acts astonished that economic growth has once again slowed, you will already know why.”
Not surprisingly the economic data rolling in has been exceptionally weak and the first quarter GDP growth is now targeted at less than 2% annualized growth.
However, it is not only in the U.S. the economic “bump” is fading, but globally as well as Central Banks have started to remove their monetary accommodations. As noted by theECRI:
“Our prediction last year of a global growth downturn was based on our 20-Country Long Leading Index, which, in 2016, foresaw the synchronized global growth upturn that the consensus only started to recognize around the spring of 2017.
With the synchronized global growth upturn in the rear view mirror, the downturn is no longer a forecast, but is now a fact.
The chart below shows that quarter-over-quarter annualized gross domestic product growth rates in the three largest advanced economies — the U.S., the euro zone, and Japan — have turned down. In all three, GDP growth peaked in the second or third quarter of 2017, and fell in the fourth quarter. This is what the start of a synchronized global growth downswing looks like.”
“Still, the groupthink on the synchronized global growth upturn is so pervasive that nobody seemed to notice that South Korea’s GDP contracted in the fourth quarter of 2017, partly due to the biggest drop in its exports in 33 years. And that news came as the country was in the spotlight as host of the winter Olympics.
Because it’s so export-dependent, South Korea is often a canary in the coal mine of global growth. So, when the Asian nation experiences slower growth — let alone negative growth — it’s a yellow flag for the global economy.
The international slowdown is becoming increasingly obvious from the widely followed economic indicators. The most popular U.S. measures seem to present more of a mixed bag. Yet, as we pointed out late last year, the bond market, following the U.S. Short Leading Index, started sniffing out the U.S. slowdown months ago.”
You can see the slowdown occurring “real time” by taking a look at Personal Consumption Expenditures (PCE) which comprises roughly 70% of U.S. economic growth. (It is also worth noting that PCE growth rates have been declining since 2016 which belies the “economic growth recovery” story.)
The point here is this:
“Economic cycles are only sustainable for as long as excesses are being built. The natural law of reversions, while they can be suspended by artificial interventions, cannot be repealed.”
While there may currently be “no sign of recession,” there are plenty of signs of “economic stress” such as:
The shift caused by the financial crisis, aging demographics, massive monetary interventions and the structural change in employment which has skewed the seasonal-adjustments in economic data. This makes every report from employment, retail sales, and manufacturing appear more robust than they would be otherwise. This is a problem mainstream analysis continues to overlook but will be used as an excuse when it reverses.
While the calls of a “recession” may seem far-fetched based on today’s economic data points, no one was calling for a recession in early 2000 or 2007 either. By the time the data is adjusted, and the eventual recession is revealed, it won’t matter as the damage will have already been done.
As Howard Marks once quipped:
“Being right, but early in the call, is the same as being wrong.”
While being optimistic about the economy and the markets currently is far more entertaining than doom and gloom, it is the honest assessment of the data, along with the underlying trends, which are useful in protecting one’s wealth longer-term.
Is there a recession currently? No.
Will there be a recession in the not so distant future? Absolutely.
But if you wait to “see it,” it will be too late to do anything about it.
Whether it is a mild, or “massive,” recession will make little difference to individuals as the net destruction of personal wealth will be just as damaging. Such is the nature of recessions on the financial markets.
Versus other developed nations, the United States is losing ground in terms of the rate of home ownership, new research finds.
Compared to 17 other first-world countries around the globe, the U.S. home ownership rate has fallen over time, an indicator that the American Dream is becoming less attainable, according to research published by the Urban Institute.
Researchers Laurie Goodman, vice president for housing finance policy at the Urban Institute, and Chris Mayer, professor of real estate at Columbia Business School and CEO of reverse mortgage company Longbridge Financial, prepared the findings.
Among the 18 countries for which home ownership was considered, the U.S. ranked 10th in 1990 with a 63.9% home ownership rate compared with its ranking of 13th in 2015. Several European countries followed a similar shift, with Bulgaria, Ireland, and the United Kingdom seeing slides between 1990 and 2015; the proportion of homeowners also declined in Mexico over that span.
Thirteen of the countries saw increases in their rate of home ownership, including a 39.6% spike in the Czech Republic and a 29.6% gain in Sweden.
“While cross-country comparisons are difficult, the slip in US home ownership relative to the rest of the world, and the historically low home ownership rates for Americans ages 44 and younger, should motivate us to look at US housing policies,” the researchers wrote in ablog poston the research published by the Urban Institute.
Home ownership among the senior demographic has been touted within the reverse mortgage industry as a clear retirement windfall.
Yet even for those who choose not to tap into their home equity, the option to use the property rent-free once the mortgage is paid can play an important role in retirement savings, the researchers noted in discussing the amount of home equity currently held among seniors in European countries.
Sky news reportsthat Twitter is preparing to prohibit a range of cryptocurrency advertisements amid looming regulatory intervention in the sector.
The microblogging platform is following similar moves by Facebook and Google which have restricted financial advertisements due to concerns about illicit activities.
Sky News understands that the new advertising policy will be implemented in two weeks and currently stands to prohibit advertisements for initial coin offerings (ICOs), token sales, and cryptocurrency wallets globally.
The reaction was swift, just as we have seen to the other crypto ad bans… smashing Bitcoin back below $7500 (into mystery-dip-buyer territory)…
But Ethereum and Ripple have been the worst performers since the crypto ad bans began…
Reportedly, Twitter has experienced an influx of fake accounts pretending to advertise cryptocurrency giveaways, often by users posing asfamous crypto sphere personaslikeLitecoin’sCharlie Lee.
For 8 years, we took every opportunity to point out that under Barack Obama’s administration, US debt was rising at a alarmingly rapid rate,having nearly doubled, surging by $9.3 trillion during Obama’s 8 years. It now appears that the trajectory of US debt under the Trump administration will be no different, and in fact based on Trump’s ambitious fiscal spending visions, may rise even faster than it did under Obama.
We note this because as of close of Friday, theUS Treasury reportedthat total US debt has risen above $21 trillion for the first time; or $21,031,067,004,766.25 to be precise.
Putting this in context, total US debt has now risen by over $1 trillion in Trump’s first year… and the real spending hasn’t even begun yet.
What is amusing is that Trump – who has a tweet for every occasion – and who no longer even pretends to care about the unsustainability of US spending was extremely proud as recently as a year ago by how little debt has increased during his term.
The media has not reported that the National Debt in my first month went down by $12 billion vs a $200 billion increase in Obama first mo.
We doubt today’s milestone will be celebrated on Trump’s twitter account.
And while some can argue – especially adherents of the socialist Magic Money Tree, or MMT, theory – that there is no reason why the exponential debt increase can’t continue indefinitely…
… one can counter with the followingchart from Goldman, which shows that if one assumes a blended interest rate of roughly 3.5% as the Fed does, and keeps America’s debt/GDP ratio constant, in a few years the US will be in what Goldman dubbed “uncharted territory” and warned that “the continued growth of public debt raises eventual sustainability questions if left unchecked.”
The bad news, however, is that debt/GDP will not be constant, as the CBO recently forecast in what was actually an overly optimistic prediction.
Yesterday, in “Here Comes The Main Event: Trade War With China, And What Is Section 301“, we wrote that Trump’s recently announced global steel and aluminum tariffs were just a (Section 232) preview of the (Section 301) main course: Trump’s imminent trade war with China, which will be unveiled any moment in the form of tariffs and restrictions on trade with China, reportedly in retaliation for Chinese IP violations.
Today, Goldman’s chief political economist Alec Philips, picks up on this and confirms that he too expects “the Trump Administration to announce tariffs on imports from China in coming weeks, as part of an intellectual property-related investigation that could also include restrictions on Chinese corporate investment in the US and restrictions on the export of intellectual property to China.”
Conveniently, we already know in rough terms what this escalation will look like: in a preview of his trade war with China, Trump in January said in a Reuters interview that “we have a very big intellectual property potential fine going, which is going to come out soon,” and more recently announced that the “U.S. is acting swiftly on Intellectual Property theft” after a series of tweets on trade policy.
And while the White House has not provided its own estimate of the cost of IP infringement, a frequently cited estimate from the Commission on the Theft of American Intellectual Property puts the annual cost to the US economy at $225bn overall. The US International Trade Commission (US ITC) placed the cost of lost sales, royalties, and licensing fees due to infringement by Chinese companies at $48bn in 2009 (or over $60bn in 2017, if held constant as a share of world GDP).
As we explained yesterday, and as Goldman reiterates, in 2017, US imports from China totaled around $500bn, so tariffs equal to the low end of the range of estimated economic damages from IP-related policies would require a 12% tariff on all imports from China, or a much higher rate on a narrower segment.
This is confirmed by recent reports by Politico and Reuters suggesting that the categories of imports targeted could total $30bn to $60bn. This suggests that the Trump Administration might be leaning toward high tariff rates on a narrow segment of imports.
But which Chinese imports will be targeted: that is a critical question as the resulting tariffs will send prices of the products surging, with significant downstream consequences for both US producers and consumers, as well as corporate margins.
Ultimately, the decision which factors to consider will depend in part on who is advising the President on trade policy. Goldman here expects that USTR Robert Lighthizer will take the lead in developing the list, with input from White House trade adviser Peter Navarro and, ultimately, the President himself. The Treasury will play a larger role in determining the investment restrictions.
With that in mind, in attempting to answer what goods might be targeted when/if Trump decides to follow through with Chinese import tariffs, Goldman has looked at imports from China in 57 categories. The answer is shown in the table below.
Click graph for larger view
Commenting on the ranking above, Goldman first separates categories in which the US runs a bilateral trade surplus, as it seems unlikely that the Administration would impose tariffs here. These categories are shown at the bottom of the table. From there, industries are ranked using a weighted average z-score across the five criteria shown:
the US-China bilateral trade balance,
the US-China tariff differential,
the share of imports that go to final use (generally consumption or investment) rather than use as intermediate inputs into other industries,
imports from China as a share of total domestic intermediate and final demand,
and whether the category was highlighted as a priority in the Made in China 2025 report.
Power tools and electrical appliances top the list, based on a substantial bilateral trade deficit, higher tariffs applied in China versus the US, and high share of imports going to final (in this case, consumer) use.
Sporting goods, toys, jewelry, and consumer electronics like TVs rank highly, for the same general reasons. However, in most of these categories, imports from China constitute a large share of total domestic sales of these products.
This is not true in the next set of product categories, ranging from aeronautical and marine navigation equipment , rail equipment and ships to furniture and household appliances, where Chinese imports represent a small share of total domestic sales, in some cases because domestic production still exists.
By contrast, the White House seems very unlikely to apply tariffs in categories where the US enjoys a trade surplus, such as aircraft, soybeans and other agricultural exports.
Of course, these will be the first categories Chinese policymakers consider when they impose retaliatory tariffs against the US, which should happen just days after Trump launches the China trade war.
Just about a month or so ago, many agents where laughing about Bitcoin, blockchain, and other cryptocurrencies, talking about how people won’t use it to buy real estate. Hmmm…
Where did this transaction happen?
In Burlington, Vermont.
The first property to be sold this way in the United States.
It was sold entirely through the blockchain. Completely.
Ethereum was the token used. This puts Vermont on the map.
Propy is a company in San Francisco. Propy handled the entire transaction including recording of the documents and contracts instead of using the city system.
Vermont is the first state to allow this kind of transaction and soon coming up are Colorado and Arizona.
The encryption technology in blockchain is the best available at this time.
This transaction used cryptocurrency for the purchase and it was then turned into the fiat money on the other end.
The first Bitcoin to Bitcoin transaction in the United States was when Michael Komaransky sold his Miami mansion for 455 Bitcoin which was the most expensive Bitcoin real estate transaction to date.
While most people will still not do a cryptocurrency real estate transaction, it is here, and it will be here to stay.
The different tokens will fail and others will rise. Ethereum is very stable. Blockchain is here to stay and evolve.
February is traditionally not a good month for the US government income statement: that’s when it usually runs a steep monthly deficit as tax returns drain the Treasury’s coffers. However, this February was worse than usual, because as spending rose and tax receipts slumped, the US deficit jumped to $215 billion, the biggest February deficit since 2012.
According to the CBO, receipts declined by 9.4% from last year as tax refunds rose and the new withholding tables went into effect. On a rolling 12 month basis, government receipts rose only 2.1%, a clear slowdown after rising 3.1% in December after contracting as recently as March 2017. At this rate of decline, the US will post a decline in Federal Receipts by mid-2018.
Outlays meanwhile rose by 2% due to higher Social Security and Medicare benefits rose and additional funds were released for disaster relief.
Putting these two in context, in Fiscal 2000, Treasury receipts in the Oct-Feb period were $741.8 bn, nearly matching outlays of $741.6 bn. In Fiscal 2018 meanwhile, receipts in the Oct-Feb period are $1.286 tn while outlays are $1.677 tn. Receipts are growing an average 4% per year, while outlays are rising an average 7%.
Here is a snapshot of February and Fiscal YTD receipts and outlays.
But most troubling was the jump in interest on the public debt, which in the month of February jumped to $28.434 billion, up 10.6% from last February and the most for any February on record. In the first five months of this fiscal year, that interest is $203.234 bn, up 8.0% y/y and the most on record for any Oct-Feb period. The sharp increase comes as the US public debt rapidly approaches $21 trillion. And with the effective interest rate now rising with every passing month, it is virtually assured that this number will keep rising for the months ahead.
In upstate-New York, the City of Plattsburgh is moving toward installing a moratorium on commercial cryptocurrency mining operations, amid concerns from the council that it could drain the city’s electricity supplies.
The WaterTown Daily Times reportsthat the problem is that mining for cryptocurrency, such as Bitcoin, absorbs a tremendous amount of energy in generating the virtual currency. Municipal Lighting Department Manager Bill Treacy says there are two mining farms in the city that they know of – one in the former Imperial Mill and one in Skyway Plaza, and there may be some smaller private mining operations in households in the city, he said.
The mining farms in the City of Plattsburgh have cropped up over the past year, officials say; and at times they have used up to 11.2 megawatts of power per month, which can be about 10 percent of the city’s power supply — more than is consumed by Georgia-Pacific, one of the city’s largest users.
This is a problem because, as part of the Municipal Electric Utility Association since the 1950s, the city is allotted a certain amount of inexpensive hydro power generated on the St. Lawrence River.
The cheap power has allowed the city to maintain attractive electric rates for households and businesses for more than half a century.
At one time, the city was touted as having some of the lowest rates in the nation.
But when usage is high, the system is in jeopardy of going over its allotment of inexpensive hydro power.
When that happens, the city must buy much more-expensive power on the open market to supplement its supply, which drives up the cost for consumers, Treacy said.
The hydro power costs 4.92 cents per megawatt hour, compared with 37 cents for alternative power. And that means ‘average’ Plattsburghians are facing notably higher costs due to the mining operations.
When the city has to purchase more power, its customers see a spike in their monthly bills.
Treacy said the average home will probably see an increase of $30 to $40 or more in their monthly bill.
“People are surprised when their bills are so high because they say that they turn the lights off when it is cold to save energy, but lights don’t really use much power,” he said.
“It’s the electric heat that is costly.”
Read said the moratorium is proposed not only to give the city time to explore the cost impact, but for health and safety factors.
Pursuant to the authority and provisions of Section 10 of the Municipal Home Rule Law of the State of New York and the statutory powers vested in the Common Council of the City of Plattsburgh to regulate and control land use and to protect the health, safety and welfare of its residents, the Common Council of the City of Plattsburgh hereby declares an eighteen (18) month moratorium, on all applications or proceedings for applications, for the issuance of approvals or permits for the commercial cryptocurrency mining operations in the City of Plattsburgh. This moratorium will allow time for the zoning code and municipal lighting department regulations to be amended to regulate this potential use.
…
It is the purpose of this Local Law to allow the City of Plattsburgh the opportunity to consider zoning and land use laws and municipal lighting department regulations before commercial cryptocurrency mining operations results in irreversible change to the character and direction of the City.
Further, it is the purpose of this Local Law to allow the City of Plattsburgh time to address through planning and legislation, the promotion of the protection, order, conduct, safety health and well-being of the residents of the City which are presented as heightened risks associated with commercial cryptocurrency mining operations.
It is the purpose of this Local Law to facilitate the adoption of land use and zoning and/or municipal lighting department regulations to protect and enhance the City’s natural, historic, cultural and electrical resources.
As WCAX reports, one of the mining operators, David Bowman of the Plattsburgh BTC, suggested a solution:
“You know you need to like protect people in the town from being adversely affected by increased electricity rates but I think there are ways to do that like possibly charging the miners more,”
“I think it’s not a great idea to just completely ban the whole thing– it’s just too new.”
Yet no one interviewed the Bitcoin miners. We wonder why?
The largest public pension fund in the United States is the California Public Employees Retirement System (CalPERS) for civil servants. California is in a state of very serious insolvency. We (Martin Armstrong) strongly advise our clients to get out before it is too late. I have been warning that CalPERS was on the verge of insolvency. I have warned that they were secretly lobbying Congress to seize all 401K private pensions and hand it to them to be managed. Mingling private money with the public would enable them to hold off insolvency a bit longer. Of course, CalPERS cannot manage the money they do have so why should anyone expect them to score a different performance with private money? Indeed, they would just rob private citizens to pay the pensions of state employees and politicians.
CalPERS has been making reckless investments with retiree capital to be politically correct with the environment rather than looking at projects that are economically based. Then, CalPERS has been desperate tocover this and other facts upto deny the public any transparency. Then, because stocks they thought were overpriced last year, they moved to bonds buying right into the Bond Bubble. Clearly, California’s economypeaked right on targetand ever since there has been a steady migration of residents out of the state.
Meanwhile, Governor Jerry Brown has been more concerned about bucking the trend with Trump effectively threateningtreasonagainst the Constitution. The insolvency at CalPERS has exceeded $100,000 owed by every private citizen in California to government employees. It was$93,000that every Californian owed back in 2016 for their state employees. In January 2017, Jerry Brown wanted a42% increasein gas taxes to bailout CalPERS. California is an extremely liberal state – but that means they are also LIBERAL in spending the FUTURE earning of residents on public employees.
The pension crisis at CalPERS is getting worse by the day. The State looks to be totally bankrupt by 2021-2022. CalPERS has just decided to increase the contribution of local governments and cities to their fund. The cities say they are approaching bankruptcy because of rising subsidies, but CalPERS itself is approaching insolvency. The problem is that there really is no honest reform in sight. The choice is clear – CUT pension benefits of government employees or RAISE TAXES!
CalPERS simply needs a bailout and very soon. It looks like they are hunting for it by sharply increasing taxes where ever they can get away with it, for state employees to grab whatever they can of your future income for themselves. This is a trend that will bring down Western society as a whole – a Sovereign Debt Crisis of untold proportions.
Board Member Steve Westly even toldThe Mercury Newsthat a bailout was needed and soon. Currently, CalPERS manages approximately $350 billion of future pension claims of its members. Recently, CalPERS passed an amendment to the statutes, which resulted in higher contributions for the California municipalities. The amount of contributions has been increased several times over the past few years and this time the cities do not appear to be able to handle the increased costs. With the Trump tax reform, the real incompetence of local government is coming to a head.
Once CalPERS was 100% funded with assets under management. In fact, they had a surplus in the good old days before Quantitative Easing. Right now, the system no longer has more than two-thirds of future claims covered. CalPERS itself expects an annual return of 7% on its financial investments when it needs 8% minimum. Most pension funds run by the States are insolvent or on the brink of financial disaster. This is what I have been warning about that the Quantitative Easing set the stage for the next crisis – the Pension Crisis. The Illinois Pension Fund needs to borrow up to $107 billion to meet its payment obligations with no prayer of repayment. Promises to state employees are over the top and off the charts. This is why Janet Yellen at the Fed kept trying to raise rates stating that interest rates had to be “normalized” for this was the crisis she knew was coming. And guess what – Europe is even worse and Draghi will not raise rates for fear that government will be unable to fund themselves. The ECB is creating a vast European Pension Crisis while trying to keep member state governments on life-support. It has purchased 40% of all sovereign debt and appears trapped and cannot reverse this process. The choice is pensions collapse or state collapse.
There is NO WAYOUT of this crisis. The portfolio would have to be completely restructured and benefits reduced. Lame Duck Jerry Brown will do everything in his power to raise taxes and fees to try to hold CalPERS together. That is by no means a long-term solution. If you can transfer to one of the 7 states without state income tax – do it NOW before it is too late.
It is now time to sound the alarm bells on the economic prospects for the Millennial Generation in the Western world, but more importantly, in the United Kingdom. This generation of citizens aged 18 to 36, is the first in modern developed economies on course to have a lower standard of living than their parents.
Housing affordability and a decaying job environment are some of the most pressing issues affecting Millennials. The future is bleak for this avocado and toast generation, as Western world economies have likely plateaued regarding economic growth. Surging debt and rising government bond yields are producing an environment that could lead to more hardships for this lost generation.
Landlords in the United Kingdom have taken full advantage of broke Millennials by offering “adult arrangements” for a roof over their heads. Yes, you heard this correctly, Millennials are trading sex for a place to sleep — unearthed in a new documentary by theBritish Broadcasting Corporation(BBC), which provides a chilling insight into just how bad the Millennial generation has it.
BBC reporter Ellie Flynn went undercover to expose the scale of the ‘Rent For Sex’ issue in the United Kingdom, in which landlords on Craigslist are advertising “free” accommodation in exchange for sexual acts.
Ellie portrayed herself as a broke, 24-year-old nursing student with very little alternatives. She confronted one man in a Newcastle cafe who defended his actions and told cameras: “I’m not doing anything wrong… it’s not just about sex, it’s about companionship.”
“BBC Three’s Ellie Undercover: Rent For Sex also met up with a landlord who had built a log cabin in his garden where tenants could sleep if the agreed to have sex in return for a ‘physical arrangement once a week,” theDaily Mailreported.
“The man offers to show Ellie around after saying: ‘That’s where you sleep, it’s a log cabin, alright,” the Daily Mail reported.
He later denied knowing the practice of asking for sex in exchange for housing is a serious offense in the United Kingdom, saying: “I don’t know, I can’t truthfully answer that .”
One landlord put Ellie in touch with a former tenant who told of “how he tried touching her while she was staying rent-free with him,” said the Daily Mail.
“I would just feel almost paralyzed every time he tried to touch me but he didn’t force himself on me,” said the unnamed woman.
The woman added: “The idea of consent gets mashed up because a woman thinks this is the exchange I have to give this man in order for me to have a roof over my head.”
In fact, the number of listings on Craigslist and social media websites offering rent for sex is exploding. Latest figures from the Housing Charity Shelter are absolutely mind-numbing, more than 250,000 women over the last five years have been asked for “adult arrangements” in exchange for housing.
UK Millennials lack a living wage, therefore, this generation sees nothing wrong in offering their bodies to landlords for a roof over their heads. Apparently, the smartest generation to ever step foot on planet earth is the first generation since the 1950s to fail to do better than their parents, as this chart shows:
The home ownership rate for UK Millennials is so low that these levels have not been seen since World War I:
According to the Office for National Statistics, millennials have largely been priced out of the real estate market as prices soar above 2008 levels.
Over the same period of rising real estate prices, UK Millennials have dealt with stagnating wages:
Real estate price increases and low personal savings rate for U.K. Millennials have been mostly fueled by low-interest rates, set by the Bank of England (BoE). Some ten years ago, the BoE decided to juice the economy by suppressing UK lending rates to a zero lower bound with cheap money after the 2008 crisis:
“In our society, it seems acceptable for people to wield their power over the vulnerable in order to get what they want, no questions asked,” explains Ellen Moran of Acorn, a tenants union and anti-poverty group.
“That power is entrenched and such actions are ignored by law enforcers. Sometimes, though, this happens because people are alienated in their society to such an extent that they crave physical affection without knowing considerate ways to get it. Sometimes it is a mixture of those two things,” she added.
Unfortunately, the ‘Rent For Sex’ issue in the United Kingdom will only get worse as the economic prospects continue to deteriorate for the Millennial generation. There is no end in sight for this madness, and it will only be a matter of time before this trend washes up on the shores of the United States. It seems as failed Central Bank policy has given landlords one new perk to owning real estate: sex with millennials.
When it comes to the US economy, there is overall consumer spending, and then there is spending on vices – a true leading indicator of overall consumer confidence and discretionary spending as Americans generally won’t splurge on hookers, blackjack and blow until they are absolutely positive they won’t need the cash for something else. ConvenientlySouthBay Researchhas a “Vice Index” that that tracks spending on gambling, alcohol, drugs, and prostitution. And as of February, the vice index just tumbled, suggesting that after a brief burst in late 2017 and 2018, the consumer-driven economy is again in trouble.
Or, asSouthBay’s Andrew Zatlinwrites, the “Vice Index Points to Tax Cut Hangover: Slower Pace of Consumer Spending for 1Q“
Shown below is SouthBay’s proprietary Vice Index (lagged by 6 months) which tumbled in February to -2%, its worst print since 2012.
Here is the same Vice Index shown unlagged: it shows that the impact of the Trump tax Cut was “Short but Sweet”, and ominous warning for the broader economy.
As Southbay notes, unlagged the Vice Index reflects two recent major swings:
The 2016 Reflation: The US and global economies rebounded in late 2016 with a firming up of oil and materials prices, as well as the Trump election. As a function of its leading indicator qualities, the Vice Index began surging July 2016.
Trump tax Cut: The Trump tax overhaul was approved in December 2017 but consumers began spending before then. Meanwhile the Vice Index began to surge October.
The point being that the Vice Index is a very reliable gauge of shifts in the economy as they impact consumer spending. And, as Zatlin writes, “it is pointing to a sharp down turn in consumer spending. As if the Tax cut never happened.” It’s very possible that the pace of spending will pick up over the year. But first some household financial healing needs to take place.
Some further observations from SouthBay Research on the state of the US consumer:
Personal Consumption Shows Household Financial Stress
Why would the Vice Index point to a looming pullback in the pace of consumer spending? Here’s a snapshot of Household finances
Coming into January
Spending outpaced incomes by $133B
Savings had dropped (-$148B)
But January saw a $106B one-month jump in disposable income thanks to
a 2% jump in cost of living adjustments to Government benefits (Medicare, Medicaid, Social Security)
a drop in taxes (taxes fell -3.3% from December to January)
That’s a ‘permanent’ 5.3% jump in disposable income.
Financial healing first, spending next
Consumers pre-spent a lot of the Trump tax cut: In anticipation of the tax cut, Households went on a spending spree. You can see that in the pace and timing of the drop in savings: a little drop in September (when the tax cut seemed likely) and a bigger drop in November when the cut was agreed. Consumers were spending ahead of the expected savings.
Spending actually slowed in January: In the 2H 2017, PCE averaged $60B+ per month. In January it was half or $31B. In fact, of the January $106B gain, all but $5B went to savings.
Watch the cost of debt: Since September, more debt and higher rates has driven interest rate payments up $22B (a 7% growth)
* * *
Here’s what to expect according to Zatlin:
1Q: Relatively slow pace of retail spending. There’s a consumer hangover as savings get repaired and the big holiday bills get paid.
2Q: Spending resumes. By April, US households will be enjoying tax rebates and also factoring in the additional $100B per month from lower taxes and COLA. Higher interest rates and inflation will nibble away at some of this will boost spending. Spending to pick up in 2Q. It’s a consumer hangover following the First the savings hole must be re-filled. Then the holiday spending bills must be re-paid.
Perhaps the spending rebound will take place as expected… but first have a chat with your friendly, neighborhood drug dealer: when it comes to spending trends and inflection points in the US, he just may have the most valuable information.
As automation and AIdestroy millions of middle-income jobs,permanently forcing (primarily male) workers from the workforce, Americans are beginning to reconsider their attitudes toward a radical policy tool that’s popular among some segments of the left: Universal Basic Income.
According toCNBC, a recent poll conducted by Northeastern University and Gallup found that 48% of Americans support the measure. In an association that’s hardly a coincidence, the poll also showed that three-quarters of Americans believe machines will take away more jobs than they’ll generate…
Unsurprisingly 65% of Democrats want to see a universal basic income and 54% of people between the ages of 18 and 35 do. In comparison, just 28% of Republicans support UBI.
While proposals for universal basic income programs vary, the most common one is a system in which the federal government sends out regular checks to everyone, regardless of their earnings or employment. That system is being tested in Canada and Finland, as well asStockton, California,which recently emerged from bankruptcy but remains mired in poverty.
Support for UBI and wariness about automation/AI have become closely linked in the public consciousness. The movement has even inspired America’s first “anti-automation” presidential candidate: New York businessman Andrew Yang is launchinga “longer-than-long-shot bid”for the 2020 Democratic nomination, on a platform of adopting a “freedom dividend” (a fancy term for UBI), to help offset the impact of automation.
Advocates say all of the UBI-focused experiments being conducted are an opportunity to show that the policy could boost both productivity, as well as individual happiness and overall wellbeing.
“The claim is often made that if you give people a basic income, they’ll become lazy and stop doing work,” said Guy Standing, co-founder of the Basic Income Earth Network. “It’s an insult to the human condition. Basic incomes tend to increase people’s work rather than reduce it.”
Political philosopher and economist Karl Widerquist remembers a poll from 10 years ago that showed just 12 percent of Americans approved of a universal basic income.
“It’s an enormous increase in support,” Widerquist said.
“We don’t need to threaten people with homelessness and poverty to get them to work,” he added.
“It’s capitalism where income doesn’t start at zero.”
Of course, the odds of UBI actually being enacted in the US are highly unlikely.
Robert Greenstein, president of the Center on Budget and Policy Priorities, estimates that a program providing everyone with $10,000 annually could cost more than $3 trillion a year, a bill that is more likely to increase poverty than reduce it.
“This single-year figure equals more than three-fourths of the entire yearly federal budget – and double the entire budget outside Social Security, Medicare, defense, and interest payments,” Greenstein wrote in a CBPP commentary last year.
Still, arecent McKinsey studyfound that automation could eliminate up to 800 million jobs by 2030…
…If such a dire outlook comes to pass, the US – and practically every government – will need to devise a plan for mitigating the devastating impact this will have on employment.
So – in ten years, eight of which were ruled over by President Obama – the proportion of Americans who want more free shit for doing nothing has quadrupled (from 12% to 48%)… now that is ‘conditioning’!!
A newstudypublished in the Journal of Personality and Social Psychology posits there’s a good chance you can tell if someone is rich or poor just by looking at them.
“The relationship between well-being and social class has been demonstrated by previous research,” R. Thora Bjornsdottir, a graduate student at the University of Toronto and co-author of the study, tellsCNBC Make It. In general, people with money tend to live happier, less anxious lives compared to those struggling to make ends meet. She and her team demonstrated “that these well-being differences are actually reflected in people’s faces.”
Bjornsdottir and her co-author, psychology professor Nicholas O. Rule, had undergraduate subjects of various ethnicities look at gray-scale photographs of 80 white males and 80 white females. None showed any tattoos or piercings. Half of the photos were of people who made over $150,000 a year, which they designated as upper class, and the other half were people who made under $35,000, or working class.
When the subjects were asked to guess the class of the people in the photos, they did so correctly 68 percent of the time, significantly higher than random chance.
“I didn’t think the effects would be quite as strong, especially given how subtle the differences are” in the faces, Rule told The Cut. “That’s the most surprising part of the study to me.”
“People are not really aware of what cues they are using when they make these judgments,” Bjornsdottir told the University of Toronto. “If you ask them why, they don’t know. They are not aware of how they are doing this.”
But the researchers wanted to know, so they zoomed in on facial features. They found that subjects were still able to guess correctly when they just looked at the eyes, and the mouth was an even better clue. But neither isolated part was as a reliable an indicator as the whole face.
The effect is “likely due to emotion patterns becoming etched into their faces over time,” says Bjornsdottir. The chronic contraction of certain muscles can actually lead to changes in the structure of your face that others can pick up on, even if they aren’t aware of it.
When the researchers showed the undergrads photos of people looking visibly happy, they could not discern socioeconomic status any better than chance. The expressions needed to be neutral for the subtle cues to have an effect.
“Well-being differences are actually reflected in people’s faces.”
“Over time, your face comes to permanently reflect and reveal your experiences,” Rule told theUniversity of Toronto. “Even when we think we’re not expressing something, relics of those emotions are still there.”
Finally, to show how these kinds of first impressions could come into play in the real world, they asked the undergrads to decide who in the photos would be most likely to land a job as an accountant. More often than not, they went with people from the upper class, showing how these kinds of snap judgment can create and reinforce biases.
“Face-based perceptions of social class may have important downstream consequences,” they concluded.
“People talk about the cycle of poverty,” Rule said, “and this is potentially one contributor to that.”
This home on Plymouth Drive in Sunnyvale, Calif. recently set the highest price per square foot ever recorded by the Multiple Listing Service. The two bedroom, two bath home – 848 square feet in size – sold in two days for $2 million. It had been listed for $1.45 million. That means it sold for $2,358 per square foot, which is the highest price per square foot in Sunnyvale recorded by MLS Listings which has data going back to Jan. 1, 2000.
SUNNYVALE — The small, unassuming home in the Cherry Chase neighborhood was on the market just two days before it sold for $2 million, a whopping $550,000 over its asking price.]
In this red-hot real estate market, the price tag barely caused a stir. What did was the other number that turned the home into another Bay Area record-breaker: It sold for the highest square-foot price recorded in Sunnyvale — a stunning $2,358, according to MLSListings, which tracks homes sales going back to 2000.
The jaw-dropping price tag suggests Sunnyvale, which has traditionally been less expensive than neighboring cities Cupertino or Palo Alto, is becoming a real estate destination in itself.
“I was blown away by it,”Doug Larson of Coldwell Banker, the real estate agent who sold the home, said of the price it fetched.
There’s nothing particularly breathtaking about the modest, one-story house on quiet, tree-lined Plymouth Drive. But it sits nestled at the center of one of the country’s most expensive real estate markets. As prices continue to increase throughout the Bay Area,pushing out even some highly paid tech workers, experts say more residents are flocking to relatively affordable Sunnyvale, driving up prices there.
“It’s become the new hot market,” said Jim Harrison, president and CEO of MLSListings.
Homes in Sunnyvale sold for a median price of $1.57 million in January, according to Zillow. That’s affordable compared to neighboring Cupertino, with a median sale price of $2.2 million, or Palo Alto, with a median price of $3 million.
But it may not stay that way for long. So far this year, homes in Sunnyvale are selling for an average of 28 percent over their listed price and are spending just nine days on the market, Harrison said. A four-bedroom, two-bath, 2,000 square foot house in the city recentlysold for close to $800,000 over its listing price, fetching $2.47 million.
The Plymouth Drive house is small by comparison, just 848 square feet, which contributed to its high per-square-foot price. But it’s on a large lot — 6,000 square feet. That makes it a prime candidate for the new owner to tear it down and build something else, Harrison said.
Realtor Juliana Lee of Keller Williams, who represents the buyer of the Plymouth Drive home, declined to comment on behalf of herself and her client.
Listing photos of the home show a small, beige house with a huge backyard, hardwood floors and a large front window with white shutters. Before the sale, the most expensive per-square-foot price recorded in Sunnyvale was $2,175, according to MLSListings. That was for a 1,839-square-foot, two-bedroom home on a 36,155 square foot lot, which sold for $4 million.
Sunnyvale has become popular in part because of its proximity to Silicon Valley’s tech jobs, said realtor James Morris of James Morris Homes, which has offices in San Jose and Saratoga. LinkedIn is headquartered in the city, Apple is just next door in Cupertino, and Google is on the other side in Mountain View.
Millennials don’t want to endure long commutes on the Bay Area’s clogged freeways, Morris said.
“They will pay that premium to be close to their jobs and not have to drive,” he said.
When Larson put the Plymouth Drive house on the market on Feb. 7, he asked for $1.45 million and assumed his client would get about $1.6 million. The next day, he opened the house for a realtor tour so the community’s agents could check out the property and determine if it was something their clients might want. It generated a lot of interest, Larson said, with some agents indicating they had buyers willing to offer as much as $1.8 million.
Friday morning, a realtor called Larson and told him she was sending over an offer. Larson told her his client wasn’t accepting offers until the following Wednesday, but the persistent realtor refused to take no for an answer and sent her client’s offer that afternoon.
It was too tempting to pass up — $2 million, all cash, closing in 10 days. The seller was shocked.
“She said, ‘What?’” Larson said. “She was as taken aback as I was.”
I think we’ve figured out why President Trump is doing the Steel and Aluminum tariffs ahead of the NAFTA withdrawal. Perhaps, the wolverine administration is using Steel and Aluminum to draw attention to theNAFTA fatal flaw.
Earlier today Canadian Foreign Minister Chrystia Freelandstated:
“Should restrictions be imposed on Canadian steel and aluminum products, Canada will take responsive measures to defend its trade interests and workers,” Foreign Minister Chrystia Freeland said in a statement, calling any trade restrictions“absolutely unacceptable.” (link)
The key word in that statement from Freeland is “products”. Why? because Canada doesn’t make raw Steel. (Top 40 List) The Canadians, like the Mexicans, import their raw steel from China. Canada then fabricates products from the Chinese steel. This nuanced point is almost always lost on people who discuss trade. This point of origination is also the fatal flaw within NAFTA.
In essence Canada is a brokerage for Chinese manufactured material, and NAFTA is the access trade-door exploited by China for entry into the U.S. market. More on that in a moment. First watch Justin from Canada explain his country’s position. (prompted, just hit play):
See, that verbal parseltongue twisting is what happens when you attempt to walk the precarious fine-line of talking points on trade. Canada doesn’t manufacture steel, they purchase steel and manufacture ‘products’. A considerable difference.
Now, here’s where I think President Trump is using the steel example to highlight theNAFTA flawand awaken people to the larger hidden issues within the heavily manipulated North American Free Trade Agreement.
There’s always that vocal group of GOPe Wall Street defenders, the professional political and purchased republicans, who attempt to hide theNAFTA flaw. So for those who are dismissive, and for the purpose of intellectual honesty, allow me to introduce the example of Chinese Billionaire Mr. Liu Zhongtian.
Mr. Liu Zhongtian is one of the Chinese billionaires who are extremely skilled at exploiting the NAFTA loophole, generating profit and hiding the reality of NAFTA from the American people. Mr. Liu is not alone, he is simply one of many – Mr. Liu is also the Deputy Secretary of China’s communist party.
Mr. Liu has imported over one million metric tonnes of aluminum ingots into Mexico, that’s over 6% of the world supply, and he stores them there in order to avoid tariffs from the United States.
Chinese billionaire Liu Zohgtian uses Mexico’s NAFTA backdoor access to avoid any U.S. tariff.
2016 […] The pile, worth $2 billion and measuring one million metric tons, represents six per cent of the world’s aluminum.
It was discovered two years ago after a California aluminum executive sent a pilot over San José Iturbide, a city in central Mexico, the Wall Street Journal reported in an investigative piece Friday.
Trade representative Jeff Henderson believes Chinese billionaire Liu Zhongtian, an aluminum magnate, routed merchandise through Mexico to avoid paying US tariffs.
Liu controls China Zhongwang Holdings Ltd, the world’s second largest aluminum producer in its category. His current fortune is estimated at $3.2 billion according to Forbes.
Aluminum manufacturers receive subsidies in China. This means Chinese companies could be able to sell aluminum at a lower price than American firms.
The United States protected domestic trade by enforcing tariffs, which have to be paid when aluminum is imported.
Bringing in merchandise through Mexico would enable a Chinese manufacturer such as Zhongwang to avoid paying those tariffs. (read more)
A photograph of Mr. Liu Zhongtian’s aluminum stockpile in Mexico.
In its current form NAFTA is an exploited doorway into the coveted U.S. market. Asian economic interests, large multinational corporations, invested in Mexico and Canada as a way to work around any direct trade deals with the U.S.
By shipping parts to Mexico and/or Canada; and by deploying satellite manufacturing and assembly facilities in Canada and/or Mexico; China, Asia and to a lesser extent EU corporations exploited a loophole. Through a process of building, assembling or manufacturing their products in Mexico/Canada those foreign corporations can skirt U.S. trade tariffs and direct U.S. trade agreements. The finished foreign products entered the U.S. under NAFTA rules.
Why deal with the U.S. when you can just deal with Mexico, and use NAFTA rules to ship your product directly into the U.S. market?
This exploitative approach, a backdoor to the U.S. market, was the primary reason for massive foreign investment in Canada and Mexico; it was also the primary reason why candidate Donald Trump, now President Donald Trump, wanted to shut down that loophole and renegotiate NAFTA.
This loophole was the primary reason for U.S. manufacturers to relocate operations to Mexico. Corporations within the U.S. Auto-Sector could enhance profits by building in Mexico or Canada using parts imported from Asia/China. The labor factor was not as big a part of the overall cost consideration as cheaper parts and imported raw materials.
If you understand the reason why U.S. companies benefited from those moves, you can begin to understand if the U.S. was going to remain inside NAFTA President Trump would have remained engaged in TPP.
As soon as President Trump withdrew from TPP the problem with the Canada and Mexico loophole grew. All corporations from TPP nations would now have an option to exploit the same NAFTA loophole.
Why ship directly to the U.S., or manufacturer inside the U.S., when you could just assemble in Mexico and Canada and use NAFTA to bring your products to the ultimate goal, the massive U.S. market?
From the POTUS Trump position, NAFTA always came down to two options:
Option #1 – renegotiate the NAFTA trade agreement to eliminate the loopholes. That would require Canada and Mexico to agree to very specific rules put into the agreement by the U.S. that would remove the ability of third-party nations to exploit the current trade loophole. Essentially the U.S. rules would be structured around removing any profit motive with regard to building in Canada or Mexico and shipping into the U.S.
Canada and Mexico would have to agree to those rules; the goal of the rules would be to stop third-party nations from exploiting NAFTA. The problem in this option is the exploitation of NAFTA currently benefits Canada and Mexico. It is against their interests to remove it. Knowing it was against their interests President Trump never thought it was likely Canada or Mexico would ever agree. But he was willing to explore and find out.
Option #2 – Exit NAFTA. And subsequently deal with Canada and Mexico individually with structured trade agreements about their imports. Canada and Mexico could do as they please, but each U.S. bi-lateral trade agreement would be written with language removing the aforementioned cost-benefit-analysis to third-party countries (same as in option #1.)
All nuanced trade-sector issues put aside, the larger issue is always how third-party nations will seek to gain access to the U.S. market through Canada and Mexico. [It is the NAFTA exploitation loophole which has severely damaged the U.S. manufacturing base.]
This is not direct ‘protectionism’, it is simply smart and fair trade.
Unfortunately, the U.S. CoC, funded by massive multinational corporations, is spending hundreds of millions on lobbying congress to keep the NAFTA loophole open.
The U.S. has to look upstream, deep into the trade agreements made by Mexico and Canada with third-parties, because it is possible for other nations to skirt direct trade with the U.S. and move their products through Canada and Mexico into the U.S.
If the U.S. were to exit NAFTA (North American Free Trade Agreement), the price you pay for most foodstuff at the grocery store would drop 10% in the first quarter and likely drop 20% or more by the end of the first year. Here’s why:
Approximately a decade ago the U.S. Dept of Agriculture stopped using U.S. consumer food prices within the reported measures of inflation. The food sector joined the ranks of fuel and energy prices in no longer being measured to track inflation and backdrop Fed monetary policy. Not coincidentally this was simultaneous to U.S. consumers seeing massive inflation in the same highly consumable sector.
There are massive international corporate and financial interests who are inherently at risk from President Trump’s “America-First” economic and trade platform. Believe it or not, President Trump is up against an entire world economic establishment.
When you understand how trade works in the modern era you will understand why the agents within the system are so adamantly opposed to U.S. President Trump.
The biggest lie in modern economics, willingly spread and maintained by corporate media, is that a system of global markets still exists.
It doesn’t.
Every element of global economic trade is controlled and exploited by massive institutions, multinational banks and multinational corporations. Institutions like the World Trade Organization (WTO) and World Bank control trillions of dollars in economic activity. Underneath that economic activity there are people who hold the reigns of power over the outcomes. These individuals and groups are the stakeholders in direct opposition to principles of America-First national economics.
The modern financial constructs of these entities have been established over the course of the past three decades. When you understand how they manipulate the economic system of individual nations you begin to understand understand why they are so fundamentally opposed to President Trump.
In the Western World, separate from communist control perspectives (ie. China), “Global markets” are a modern myth; nothing more than a talking point meant to keep people satiated with sound bites they might find familiar. Global markets have been destroyed over the past three decades by multinational corporations who control the products formerly contained within global markets.
The same is true for “Commodities Markets”. The multinational trade and economic system, run by corporations and multinational banks, now controls the product outputs of independent nations. The free market economic system has been usurped by entities who create what is best described as ‘controlled markets’.
U.S. President Trump smartly understands what has taken place. Additionally he uses economic leverage as part of a broader national security policy; and to understand who opposes President Trump specifically because of the economic leverage he creates, it becomes important to understand the objectives of the global and financial elite who run and operate the institutions. The Big Club.
Understanding how trillions of trade dollars influence geopolitical policy we begin to understand the three-decade global financial construct they seek to protect.
That is, global financial exploitation of national markets.
FOUR BASIC ELEMENTS:
♦Multinational corporations purchase controlling interests in various national outputs and industries of developed industrial western nations.
♦The Multinational Corporations making the purchases are underwritten by massive global financial institutions, multinational banks.
♦The Multinational Banks and the Multinational Corporations then utilize lobbying interests to manipulate the internal political policy of the targeted nation state(s).
♦With control over the targeted national industry or interest, the multinationals then leverage export of the national asset (exfiltration) through trade agreements structured to the benefit of lesser developed nation states – where they have previously established a proactive financial footprint.
Against the backdrop of President Trump confronting China; and against the backdrop of NAFTA being renegotiated, likely to exit; and against the necessary need to support the key U.S. steel industry; revisiting the economic influences within the modern import/export dynamic will help conceptualize the issues at the heart of the matter.
There are a myriad of interests within each trade sector that make specific explanation very challenging; however, here’s the basic outline.
For three decades economic “globalism” has advanced, quickly. Everyone accepts this statement, yet few actually stop to ask who and what are behind this – and why?
Influential people with vested financial interests in the process have sold a narrative that global manufacturing, global sourcing, and global production was the inherent way of the future. The same voices claimed the American economy was consigned to become a “service-driven economy.”
What was always missed in these discussions is that advocates selling this global-economy message have a vested financial and ideological interest in convincing the information consumer it is all just a natural outcome of economic progress.
It’s not.
It’s not natural at all. It is a process that is entirely controlled, promoted and utilized by large conglomerates, lobbyists, purchased politicians and massive financial corporations.
Again, I’ll try to retain the larger altitude perspective without falling into the traps of the esoteric weeds. I freely admit this is tough to explain and I may not be successful.
Bulletpoint #1:♦ Multinational corporations purchase controlling interests in various national elements of developed industrial western nations.
This is perhaps the most challenging to understand. In essence, thanks specifically to the way the World Trade Organization (WTO) was established in 1995, national companies expanded their influence into multiple nations, across a myriad of industries and economic sectors (energy, agriculture, raw earth minerals, etc.). This is the basic underpinning of national companies becoming multinational corporations.
Think of these multinational corporations as global entities now powerful enough to reach into multiple nations -simultaneously- and purchase controlling interests in a single economic commodity.
A historic reference point might be the original multinational enterprise, energy via oil production. (Exxon, Mobil, BP, etc.)
However, in the modern global world, it’s not just oil; the resource and product procurement extends to virtually every possible commodity and industry. From the very visible (wheat/corn) to the obscure (small minerals, and even flowers).
Bulletpoint #2 ♦ The Multinational Corporations making the purchases are underwritten by massive global financial institutions, multinational banks.
During the past several decades national companies merged. The largest lemon producer company in Brazil, merges with the largest lemon company in Mexico, merges with the largest lemon company in Argentina, merges with the largest lemon company in the U.S., etc. etc. National companies, formerly of one nation, become “continental” companies with control over an entire continent of nations.
…. or it could be over several continents or even the entire world market of Lemon/Widget production. These are now multinational corporations. They hold interests in specific segments (this example lemons) across a broad variety of individual nations.
National laws on Monopoly building are not the same in all nations. Most are not as structured as the U.S.A or other more developed nations (with more laws). During the acquisition phase, when encountering a highly developed nation with monopoly laws, the process of an umbrella corporation might be needed to purchase the targeted interests within a specific nation. Theexample of Monsantoapplies here.
Bulletpoint #3 ♦ The Multinational Banks and the Multinational Corporations then utilize lobbying interests to manipulate the internal political policy of the targeted nation state(s).
With control of the majority of actual lemons the multinational corporation now holds a different set of financial values than a local farmer or national market. This is why commodities exchanges are essentially dead. In the aggregate the mercantile exchange is no longer a free or supply-based market; it is now a controlled market exploited by mega-sized multinational corporations.
Instead of the traditional ‘supply/demand’ equation determining prices, the corporations look to see what nations can afford what prices. The supply of the controlled product is then distributed to the country according to their ability to afford the price. This is essentially the bastardized and politicized function of the World Trade Organization (WTO). This is also how the corporations controlling WTO policy maximize profits.
Back to the lemons. A corporation might hold the rights to the majority of the lemon production in Brazil, Argentina and California/Florida. The price the U.S. consumer pays for the lemons is directed by the amount of inventory (distribution) the controlling corporation allows in the U.S.
If the U.S. lemon harvest is abundant, the controlling interests will export the product to keep the U.S. consumer spending at peak or optimal price. A U.S. customer might pay $2 for a lemon, a Mexican customer might pay .50¢, and a Canadian $1.25.
The bottom line issue is the national supply (in this example ‘harvest/yield’) is not driving the national price because the supply is now controlled by massive multinational corporations.
The mistake people often make is calling this a “global commodity” process. In the modern era this “global commodity” phrase is particularly nonsense.
A true global commodity is a process of individual nations harvesting/creating a similar product and bringing that product to a global market. Individual nations each independently engaged in creating a similar product.
Under modern globalism this process no longer takes place. It’s a complete fraud. Massive multinational corporations control the majority of production inside each nation and therefore control the global product market and price. It is a controlled system.
EXAMPLE: Part of the lobbying in the food industry is to advocate for the expansion of U.S. taxpayer benefits to underwrite the costs of the domestic food products they control. By lobbying DC these multinational corporations get congress and policy-makers to expand the basis of who can use EBT and SNAP benefits (state reimbursement rates).
Expanding the federal subsidy for food purchases is part of the corporate profit dynamic.
With increased taxpayer subsidies, the food price controllers can charge more domestically and export more of the product internationally. Taxes, via subsidies, go into their profit margins. The corporations then use a portion of those enhanced profits in contributions to the politicians. It’s a circle of money.
In highly developed nations this multinational corporate process requires the corporation to purchase the domestic political process (as above) with individual nations allowing the exploitation in varying degrees. As such, the corporate lobbyists pay hundreds of millions to politicians for changes in policies and regulations; one sector, one product, or one industry at a time. These are specialized lobbyists.
EXAMPLE:The Committee on Foreign Investment in the United States (CFIUS)
CFIUS is an inter-agency committee authorized to review transactions that could result in control of a U.S. business by a foreign person (“covered transactions”), in order to determine the effect of such transactions on the national security of the United States.
CFIUS operates pursuant to section 721 of the Defense Production Act of 1950, as amended by the Foreign Investment and National Security Act of 2007 (FINSA) (section 721) and as implemented by Executive Order 11858, as amended, and regulations at 31 C.F.R. Part 800.
The CFIUS process has been the subject of significant reforms over the past several years. These include numerous improvements in internal CFIUS procedures, enactment of FINSA in July 2007, amendment of Executive Order 11858 in January 2008, revision of the CFIUS regulations in November 2008, and publication of guidance on CFIUS’s national security considerations in December 2008 (more)
Bulletpoint #4 ♦ With control over the targeted national industry or interest, the multinationals then leverage export of the national asset (exfiltration) through trade agreements structured to the benefit of lesser developed nation states – where they have previously established a proactive financial footprint.
The process of charging the U.S. consumer more for a product, that under normal national market conditions would cost less, is a process called exfiltration of wealth. This is the basic premise, the cornerstone, behind the catch-phrase ‘globalism’.
It is never discussed.
To control the market price some contracted product may even be secured and shipped with the intent to allow it to sit idle (or rot). It’s all about controlling the price and maximizing the profit equation. To gain the same $1 profit a widget multinational might have to sell 20 widgets in El-Salvador (.25¢ each), or two widgets in the U.S. ($2.50/each).
Think of the process like the historic reference of OPEC (Oil Producing Economic Countries). Only in the modern era massive corporations are playing the role of OPEC and it’s not oil being controlled, thanks to the WTO it’s almost everything.
Again, this is highlighted in the example of taxpayers subsidizing the food sector (EBT, SNAP etc.), the corporations can charge U.S. consumers more. Ex. more beef is exported, red meat prices remain high at the grocery store, but subsidized U.S. consumers can better afford the high prices.
Of course, if you are not receiving food payment assistance (middle-class) you can’t eat the steaks because you can’t afford them. (Not accidentally, it’s the same scheme in the ObamaCare healthcare system)
Agriculturally, multinational corporate Monsanto says: ‘all your harvests are belong to us‘. Contract with us, or you lose because we can control the market price of your end product. Downside is that once you sign that contract, you agree to terms that are entirely created by the financial interests of the larger corporation; not your farm.
The multinational agriculture lobby is massive. We willingly feed the world as part of the system; but you as a grocery customer pay more per unit at the grocery store because domestic supply no longer determines domestic price.
Within the agriculture community the (feed-the-world) production export factor also drives the need for labor. Labor is a cost. The multinational corps have a vested interest in low labor costs. Ergo, open border policies. (ie. willingly purchased republicans not supporting border wall etc.).
This corrupt economic manipulation/exploitation applies over multiple sectors, and even in the sub-sector of an industry like steel. China/India purchases the raw material, coking coal, then sells the finished good (rolled steel) back to the global market at a discount. Or it could be rubber, or concrete, or plastic, or frozen chicken parts etc.
The ‘America First’ Trump-Trade Doctrine upsets the entire construct of this multinational export/control dynamic. Team Trump focus exclusively on bilateral trade deals, with specific trade agreements targeted toward individual nations (not national corporations).
‘America-First’ is also specific policy at a granular product level looking out for the national interests of the United States, U.S. workers, U.S. companies and U.S. consumers.
Under President Trump’s Trade positions, balanced and fair trade with strong regulatory control over national assets, exfiltration of U.S. national wealth is essentially stopped.
This puts many current multinational corporations, globalists who previously took a stake-hold in the U.S. economy with intention to export the wealth, in a position of holding contracted interest of an asset they can no longer exploit.
Perhaps now we understand better how massive multi-billion multinational corporations and institutions are aligned against President Trump.
Apple CEO Tim Cook has one big hope for the future – that he lives to see the end of money.
“…I’m hoping that I’m still going to be alive to see the elimination of money.”
Speaking at a meeting for Apple shareholders in Cupertino, California earlier this month, Cook made it clear that he is firmly on the side of the war-on-cash establishment.
“Because why would you have this stuff! Why go through all the expense of printing this stuff and then some people steal it, and you’ve got to worry about counterfeits and all these things,” he continued.
As Apple’s CEO talked about the downsides of cash,BI reportedyour credit card ripped off, I’m sure a lot of you have, I have, it’s not a good experience.”that he became more animated, revealing his real passion about the topic…
“We can provide a solution for the customer that’s simpler, more convenient, you don’t carry around a wallet with a bunch of cards in it, or a purse with a bunch of cards in it,” Cook said.
“And it’s more secure, if you’ve ever had your credit card ripped off, I’m sure a lot of you have, I have, it’s not a good experience.”
They want large transactions to be made electronically so government can follow them. Yet these are some of the same European politicians who blew a gasket when they learned that U.S. counter terrorist officials were monitoring money through the Swift global system. Criminals will find a way, large bills or not.
The real reason the war on cash is gearing up now is political: Politicians and central bankers fear that holders of currency could undermine their brave new monetary world of negative interest rates. Japan and Europe are already deep into negative territory, and U.S. Federal Reserve ChairJanet Yellen said last week the U.S. should be prepared for the possibility. Translation: That’s where the Fed is going in the next recession.
Negative rates are a tax on deposits with banks, with the goal of prodding depositors to remove their cash and spend it to increase economic demand. But that goal will be undermined if citizens hoard cash. And hoarding cash is easier if you can take your deposits out in large-denomination bills you can stick in a safe. It’s harder to keep cash if you can only hold small bills.
So, presto, ban cash. This theme has been pushed by the likes of Bank of England chief economist Andrew Haldane and Harvard’s Kenneth Rogoff, who wrote in the Financial Times that eliminating paper currency would be “by far the simplest” way to “get around” the zero interest-rate bound “that has handcuffed central banks since the financial crisis.” If the benighted peasants won’t spend on their own, well, make it that much harder for them to save money even in their own mattresses.
All of which ignores the virtues of cash for law-abiding citizens. Cash allows legitimate transactions to be executed quickly, without either party paying fees to a bank or credit-card processor. Cash also lets millions of low-income people participate in the economy without maintaining a bank account, the costs of which are mounting as post-2008 regulations drop the ax on fee-free retail banking. While there’s always a risk of being mugged on the way to the store, digital transactions are subject to hacking and computer theft.
Cash is also the currency of gray markets—amounting to 20% or more of gross domestic product in some European countries—that governments would love to tax. But the reason gray markets exist is because high taxes and regulatory costs drive otherwise honest businesses off the books. Politicians may want to think twice about cracking down on the cash economy in a way that might destroy businesses and add millions to the jobless rolls. The Italian economy might shut down without cash.
By all means people should be able to go cashless if they like. But it’s hard to avoid the conclusion that the politicians want to bar cash as one more infringement on economic liberty. They may go after the big bills now, but does anyone think they’d stop there? Why wouldn’t they eventually ban all cash transactions much as they banned gold and silver as mediums of exchange?
Beware politicians trying to limit the ways you can conduct private economic business. It never turns out well.
But the swing to America’s corporatocracy calling for a war on cash is not for your own good ‘Murica.
All of this anti-cash angst from Cook can be summed up in 3 short words – Use Apple Pay – and followsVisa’s Andy Gerlt, who last year proclaimed: “We are declaring war on cash.”
Cashless transactions would always include some intermediary or third-party.
Increased government access to personal transactions and records.
Certain types of transactions (gambling, etc.) could be barred or frozen by governments.
Decentralized cryptocurrency could be an alternative for such transactions
2. Savings
Savers could no longer have the individual freedom to store wealth “outside” of the system.
Eliminating cash makes negative interest rates (NIRP) a feasible option for policymakers.
A cashless society also means all savers would be “on the hook” for bank bail-in scenarios.
Savers would have limited abilities to react to extreme monetary events like deflation or inflation.
3. Human Rights
Rapid demonetization has violated people’s rights to life and food.
In India, removing the 500 and 1,000 rupee notes has caused multiple human tragedies, including patients being denied treatment and people not being able to afford food.
Demonetization also hurts people and small businesses that make their livelihoods in the informal sectors of the economy.
4. Cybersecurity
With all wealth stored digitally, the potential risk and impact of cybercrime increases.
Hacking or identity theft could destroy people’s entire life savings.
The cost of online data breaches is already expected to reach $2.1 trillion by 2019, according to Juniper Research.
As the War on Cash accelerates, many shots will be fired. The question is: who will take the majority of the damage?
Over the weekend on Saturday morning, amid its usual fanfare and attention, Warren Buffett’s company Berkshire Hathaway released itsannual reportto the public.
This is a pretty big deal each year. Investors and financial reporters typically wait with baited breath to hear what the Oracle himself has to say in his legendary annual letter.
Buffett’s topics in previous letters have covered a lot of ground– the state of the US economy, value investing education, why Wall Street is so deeply flawed, commentary on financial markets, etc.
This year’s letter was, as usual, quite interesting… but primarily because of what Buffett said about his own business.
Berkshire Hathaway is an enormous enterprise; it’s essentially a $500 billion holding company that owns dozens of smaller businesses, all of which collectively generate tens of billions in free cash flow.
Buffett’s primary mission is to acquire more businesses and expand Berkshire’s portfolio… and then ensure that each of those subsidiaries has top quality management to grow the cashflow.
And that’s what was so interesting about this year’s letter: Buffett couldn’t really do his job.
According to Warren Buffett himself:
In our search for new stand-alone businesses, the key qualities we seek are durable competitive strengths; able and high-grade management; good returns on the net tangible assets required to operate the business; opportunities for internal growth at attractive returns; and, finally, a sensible purchase price.
That last requirement proved a barrier to virtually all deals we reviewed in 2017, as prices for decent, but far from spectacular, businesses hit an all-time high.
Now, consider that Berkshire Hathaway’s cash pile rose to an astonishing $116 billion at the end of 2017.
With that much money on hand, very few companies are out of Buffett’s reach.
Specifically, $116 billion would have been enough money to acquire any one of 465 out of the 500 largest companies in the United States– including Nike, Starbucks, UPS, Netflix, and Ford.
Even more, Buffett had enough cash to collectively acquire a full TWENTY FIVE of the smallest companies in the S&P 500 (including AutoNation, Staples, Bed Bath & Beyond) and still have several billion dollars left over.
But he didn’t.
Even though one of his key roles is to acquire businesses and bring them into the Berkshire Hathaway tent, he didn’t acquire a single one of those companies.
Why? Because they’re ALL overpriced.
Read that quote again: “[P]rices for decent, but far from spectacular, businesses hit an all-time high.”
He went on to write, “Indeed, price seemed almost irrelevant to an army of optimistic purchasers.”
Investors are essentially paying record prices for shares of businesses that aren’t even all that great.
Now, Buffett didn’t specifically advise people to avoid stocks. But actions speak louder than words. And Buffet’s not buying.
Think about that: one of the richest guys in the world– one of the most successful investors in history– thinks assets are too expensive to buy.
People don’t tend to get rich (or stay that way) by buying mediocre assets at all-time highs.
The time to buy is when prices crash… when the highest quality assets can be acquired for peanuts.
And as sure as night follows day, prices will decline. Asset prices always move in boom/bust cycles.
As Buffett himself wrote in the annual report,
In the next 53 years our shares (and others) will experience declines resembling those in the table. No one can tell you when these will happen. The light can at any time go from green to red without pausing at yellow.
He knows there will always be periods of panic and fear when asset prices crash. But “[w]hen major declines occur, however, they offer extraordinary opportunities. . .”
Taking advantage of these opportunities requires having sufficient ammunition. Namely, cash.
If you want to be able to acquire the highest quality assets when prices crash, you have to be liquid. You can’t have your wealth tied up in illiquid assets whose prices have just crashed.
This is another area where Buffett’s actions speak louder than words.
Over the course of 2017, he increased Berkshire Hathaway’s cash position to $116 billion– a whopping 35% increase over the previous year.
Put these two observations together: Buffett’s NOT buying… and he’s greatly increasing his cash position.
It’s almost as if he’s preparing for a major decline… and getting ready to pounce when assets are cheap.
Actions speak louder than words. And his actions are definitely worth considering.
Peter Thiel and his band oflibertarian-leaning Silicon Valley-typesaren’t the only ones scrambling to leave the Bay Area: As we’ve noted time and time again, staggering economic inequality is a daily fact of life in the area surrounding San Francisco – largely because rapidly growing home valuations have left couplesearning as much as $500,00 a year feeling like they’re being steadily priced out.
And while we’ve previously covered the exodus of renters to low-cost states like Texas, in a report published Saturday, theEast Bay Timesexplores an even more troubling trend: Landlords are increasingly taking the cue from their tenants and joining in the exodus.
After all, with one in four US homes sold during 2017 going for more than $500,000 above their asking – particularly in hot real-estate markets like San Francisco, where buyers battling for the highest bid have begun relying on clauses that will automatically – and incrementally – raise their bids until they either emerge victorious,or reach a predetermined ceiling.
For at least the last nine months, the Bay Area has led the country in the number of departing residents, as everybody who isn’t a tech worker – including essential civil servants like police and fire fighters – begins to feel like a secondary servile class. One landlord said several of his tenants asked if they could move with him when he announced he was selling the building and departing for Colorado
Tony Hicks moved to San Jose in 1981, but he’s had enough.
Hicks told his 11 tenants he would soon place the three homes he owns on the market. He expected disappointment. Instead, most wanted to move with him to Colorado.
“It didn’t take them long,” Hicks said. “I was surprised.”
Hicks first bonded with many of his tenants over their shared appreciation for conservative politics in an environment that is openly hostile to views that don’t conform to the dominant neoliberal ideology.
“I’ve been thinking about this for a long time,” said Dan Harvey, 60, a retiree in one of Hicks’ rentals who is concerned about the traffic he fights on his Harley Davidson and the high cost of living. “A fresh start.”
Rising prices, high taxes and his suspicion that the next big earthquake is just a few tremors away convinced the retired engineer to put his South San Jose properties up for sale.
The groundswell to leave Silicon Valley — the place of fortunes, world-changing tech and $2,500 a-month-garage apartments — has been building. For at least the last nine months, the San Francisco metro area has led the nation in the number of residents moving out, according to a survey by online brokerage Redfin.
San Jose real estate agent Sandy Jamison has seen many long-time residents and natives leave the state recently. The lack of available housing, leading to some of the priciest real estate in the country, is driving many from the region, she said.
The landlord and tenants came together through Hick’s rental ads on Craigslist and in the newspaper over the last two decades. They grew close with common bonds of conservative politics, religious faith and motorcycles.
It’s an unlikely collection of 10 men and one woman — a retired engineer, a few military veterans, blue collar workers and others on fixed incomes. Few say they could afford to go it alone in the sky-high housing market in San Jose, where a typical two bedroom rents for about $2,500 a month, far more than what they pay Hicks.
Most of the men are divorced, widowed or never married, and many suffer from health ailments and a crankiness exacerbated by Bay Area traffic, crowding and the state’s liberal policies on crime and immigration.
Hicks, 58, was an engineer and marketing executive at IBM, Xerox and other companies before retiring in his early 40s to raise his daughter from his first marriage.
…
He bought a few investment properties in South San Jose, and looked for long-term returns when he sold them. He kept rents low — between $500 to $1,200 a month for one bedroom — and never raised prices once a tenant signed a lease.
Many of his tenants have been with him for more than a decade.
“We became brothers,” said Mike Leyva. The 64-year-old Army veteran and retiree signed a lease in 2004 and never left.
And Hicks and his compatriots aren’t alone – not by a long shot: A five-county poll conducted for the Silicon Valley Leadership Group and the East Bay Times found that more than one-third of Bay Area apartment renters and one-quarter of residents in their 20s and 30s say they are struggling to afford their housing.
Many longtime residents also describe a feeling of alienation that seemed to accompany the tech boom.
According to one real estate agent, the top reasons people leave the Bay Area are as follows: high taxes, cost of living, quality of life from traffic to homelessness, politics and high housing prices. For many long-time residents, she said, “they feel like they don’t belong here any more.”
For Hicks, lofty real estate valuations were the last incentive he needed.
In recent years, Hicks began to believe there was a better life outside the valley.
Vaulting real estate prices added incentive. He kept up on tax laws that could maximize the returns on his property. Selling his San Jose rental houses and buying new properties with the proceeds would allow him to defer taxes. “It’s a great financial move,” he said.
Hicks was also moved by discussions with his pastor and sermons at his church, the Vietnamese Living Word Community Church, about Biblical journeys. His spiritual beliefs guided him to his decision to move with his new wife, Fidessa, 31, and her 8-year-old daughter.
Cautiously, he broke the news to his friends.
“I was totally shocked,” Leyva said. “I thought he was joking me. I had a lot of questions about it.”
The tenants who are accompanying Hicks expect to save hundreds of dollars a month in rent when they relocated to Colorado…
QUOTE
Levya spent two days researching the move and became convinced. He expects to slash his rent from $1,200 to about $800 a month, with more room in a newer home bought by Hicks. “I’m excited,” Leyva said. “It’s going to be a new journey in my life.”
Ed Blomgren, 70, pays $495 a month for one bedroom and a shared bathroom. The retired machinist, a Navy veteran, lives on a fixed income and couldn’t afford market-rate rent.
Blomgren grew up in Colorado, and he welcomes a chance to return to his home state, where he still has family. “At my age,” he said, “I think it might be a good thing.”
After he finishes selling off his portfolio of Bay Area propterties, Hicks expects to get a much bigger bang for his buck when he buys a new home in Colorado. The median home value in Colorado Springs is $263,000,compared with $1 million for a single family home in San Jose, according to real estate website Zillow.
Hicks’ plan, as it stands, is to sell all three homes and buy a half-dozen newer, bigger and cheaper homes in the smaller, mountain town that’s home to the US Air Force Academy.
Within a day of listing his Raposa Court home, Hicks had two offers in hand that – like most sales in the area – were well above his $1 million asking price…
Homebuyers increasingly can’t afford what they want.
Higher mortgage rates, combined with the loss of homeowner tax breaks in some of the nation’s most expensive markets, are taking away buying power.
New home sales were also down 9% in December
New home sales down 7.8% in January, on top of being down 9% in December
Sales of newly built homes are falling, and the culprit is clear. Homebuyers increasingly can’t afford what they want. Higher mortgage rates, combined with the loss of homeowner tax breaks in some of the nation’s most expensive markets, are taking away buying power.
Sales fell in December, when the new tax law was signed, and then again in January, when mortgage rates moved higher. Sales are now at their lowest level since August of last year.
The government’s measure of new home sales is based on signed contracts during the month, reflecting the people who are out shopping and signing deals with builders. It is therefore a strong read on current reactions to home affordability. Mortgage rates moved a full quarter of a percentage point higher during January, from below 4 percent to about 4.25 percent. It then took off further from there.
“It seems that the jump in mortgage rates in January had an immediate impact on contract signings,” wrote Peter Boockvar, chief investment officer at Bleakley Advisory Group. “You can’t get more interest rate sensitive when it comes to homes and cars with the associated cost to finance.”
Higher home prices are adding to the difficulty for buyers. The median price of a newly built home rose to $323,000, a 2.5 percent gain compared with January 2017. Builders are not only increasing prices, but they are also mostly focused on the move-up market, not the entry level where homes are needed most.
While there is a severe shortage of existing homes for sale, the opposite appears to be the case in the new home market. Supply rose to the highest level in four years, another sign that new construction is increasingly out of financial reach for today’s home buyers.
“The drop in sales may be due to saturation in the upper price range of the market, which should compel builders to follow the market and build more moderately priced homes,” wrote Joseph Kirchner, senior economist at Realtor.com. “We may be beginning to see this with the largest drop for new home sales in homes priced above $500,000.”
The expectation had been for an increase in new home sales in January, after the sharp drop in December. Some economists argue that when rates begin to rise, there is an initial surge reaction from buyers who want to get in before rates increase even further. That did not happen, likely because affordability stood in the way.
Builders did note a drop in buyer traffic in January, according to a monthly sentiment survey from the National Association of Home Builders. That measure did not improve in February, when rates moved even higher. Builder confidence remains high, but largely due to sales expectations over the next six months, not current sales conditions or buyer traffic.
Builders may be counting on the tight supply in the existing home market to push more business their way. Sales of existing homes fell in January as well, with the blame laid squarely on a severe shortage of homes for sale.
“This report is undoubtedly disappointing. Like 2017, 2018 isn’t setting up to be particularly favorable for builders — construction materials and permitting costs are high and rising, labor is tight, and desirable, buildable land is scarce and expensive,” wrote Aaron Terrazas, senior economist at Zillow. “It seems clear that we shouldn’t expect a big breakthrough in new home sales any time soon, and should instead look for incremental progress at best. At this point, we’ll take whatever we can get.”
After new- and existing-home sales tumbled in December, expectations were for a modest 0.5% rebound in January (despite plunging mortgage applications and soaring rates). But that did not happen as existing home sales tumbled 3.2% MoM to its lowest level since Aug 2016.
NOTE – this data is based on signed contracts from Nov/DEC, which means the recent spike in rates is not even hitting this yet)
Existing home sales are down 4.8% YoY – the biggest drop since August 2014.
The West (-5.0%) and Midwest (-6.0%) saw the biggest drop in sales and while the blame (see below) was put on inventories, data shows a 4.1% increase in “available for sale” homes?
Of course NAR is careful to blame inventories – and not soaring rates affecting affordability: Lawrence Yun, NAR chief economist, says January’s retreat in closings highlights the housing market’s glaring inventory shortage to start 2018.
“The utter lack of sufficient housing supply and its influence on higher home prices muted overall sales activity in much of the U.S. last month,” he said.
“While the good news is that Realtors® in most areas are saying buyer traffic is even stronger than the beginning of last year, sales failed to follow course and far lagged last January’s pace.
“It’s very clear that too many markets right now are becoming less affordable and desperately need more new listings to calm the speedy price growth.”
The median existing-home price in January was $240,500, up 5.8% from January 2017.
First-time buyers were 29 percent of sales in January, which is down from 32 percent in December 2017 and 33 percent a year ago.
“The gradual uptick in wages over the last few months is a promising development for the housing market, but there’s risk these income gains could be offset by the recent jump in mortgage rates,” said Yun.
“That is why the pace of added new and existing supply in the months ahead is worth monitoring. If inventory conditions can improve enough to cool the swift price growth in several markets, most prospective buyers should be able to absorb the higher borrowing costs.”
So, will higher rates break housing market momentum?
The following chart suggest ‘yes’ – that surge in rates will have a direct impact on home sales (or prices will be forced to adjust lower) as affordability collapses…
Another day, another confirmation that the US economy is heating up just a little more than most expected.
With Wall Street expecting housing starts and permits of 1.234MM and 1.300MM, respectively, moments ago the US Census reported number that blew away expectations, with starts printing at 1.326MM in January, a 9.7% increase relative to the 3.5% expected, while permits jumped by 7.4% from 1.300MM to 1.396MM, on expectations of an unchanged print.
What is notable in today’s number is that single-family units were largely in line, declining for Permits from 881K to 866K, while single-family Starts rose from 846K to 877K, still well below November’s 946K.
So where did the bounce come from? The answer: multi-family, or rental units, which surged for Permits from 382K to 479K, while multi-family Starts surged from 360K to 431K, the highest number since December 2016.
Here is the visual breakdown, first Starts:
then Permits:
While it is very early to infer causality, the jump in rental unit construction could potentially add a modest disinflationary pressure to rents, which in recent months have seen declines across some of America’s largest MSAs. Whether or not this impacts Fed policy is too early to determine.
Critics of “New Age” monetary policy have been predicting that central banks would eventually run out of ways to trick people into borrowing money.
There are at least three reasons to wonder if that time has finally come:
Wage inflation is accelerating
Normally, towards the end of a cycle companies have trouble finding enough workers to keep up with their rising sales. So they start paying new hires more generously. This ignites “wage inflation,” which is one of the signals central banks use to decide when to start raising interest rates. The following chart shows a big jump in wages in the second half of 2017. And that’s before all those $1,000 bonuses that companies have lately been handing out in response to lower corporate taxes. So it’s a safe bet that wage inflation will accelerate during the first half of 2018.
The conclusion: It’s time for higher interest rates.
The financial markets are flaking out
The past week was one for the record books, as bonds (both junk and sovereign) and stocks tanked pretty much everywhere while exotic volatility-based funds imploded. It was bad in the US but worse in Asia, where major Chinese markets fell by nearly 10% — an absolutely epic decline for a single week.
Normally (i.e., since the 1990s) this kind of sharp market break would lead the world’s central banks to cut interest rates and buy financial assets with newly-created currency. Why? Because after engineering the greatest debt binge in human history, the monetary authorities suspect that even a garden-variety 20% drop in equity prices might destabilize the whole system, and so can’t allow that to happen.
The conclusion: Central banks have to cut rates and ramp up asset purchases, and quickly, before things spin out of control.
So – as their critics predicted – central banks are in a box of their own making. If they don’t raise rates inflation will start to run wild, but if they don’t cut rates the financial markets might collapse, threatening the world as we know it.
There’s not enough ammo in any event
Another reason why central banks raise rates is to gain the ability to turn around and cut rates to counter the next downturn.
But in this cycle central banks were so traumatized by the near-death experience of the Great Recession that they hesitated to raise rates even as the recovery stretched into its eighth year and inflation started to revive. The Fed, in fact, is among the small handful of central banks that have raised rates at all. And as the next chart illustrates, it’s only done a little. Note that in the previous two cycles, the Fed Funds rate rose to more than 5%, giving the Fed the ability to cut rates aggressively to stimulate new borrowing. But – if the recent stock and bond market turmoil signals an end to this cycle – today’s Fed can only cut a couple of percentage points before hitting zero, which won’t make much of a dent in the angst that normally dominates the markets’ psyche in downturns.
Most other central banks, meanwhile, are still at or below zero. In a global downturn they’ll have to go sharply negative.
So here’s a scenario for the next few years: Central banks focus on the “real” economy of wages and raw material prices and (soaring) government deficits for a little while longer and either maintain current rates or raise them slightly. This reassures no one, bond yields continue to rise, stock markets grow increasingly volatile, and something – another week like the last one, for instance – happens to force central banks to choose a side.
They of course choose to let inflation run in order to prevent a stock market crash. They cut rates into negative territory around the world and restart or ramp up QE programs.
And it occurs to everyone all at once that negative-yielding paper is a terrible deal compared to real assets that generate positive cash flow (like resource stocks and a handful of other favored sectors like defense) – or sound forms of money like gold and silver that can’t be inflated away.
The private sector sells its bonds to the only entities willing to buy them – central banks – forcing the latter to create a tsunami of new currency, which sends fiat currencies on a one-way ride towards their intrinsic value. Gold and silver (and maybe bitcoin) soar as everyone falls in sudden love with safe havens.
And the experiment ends, as it always had to, in chaos.


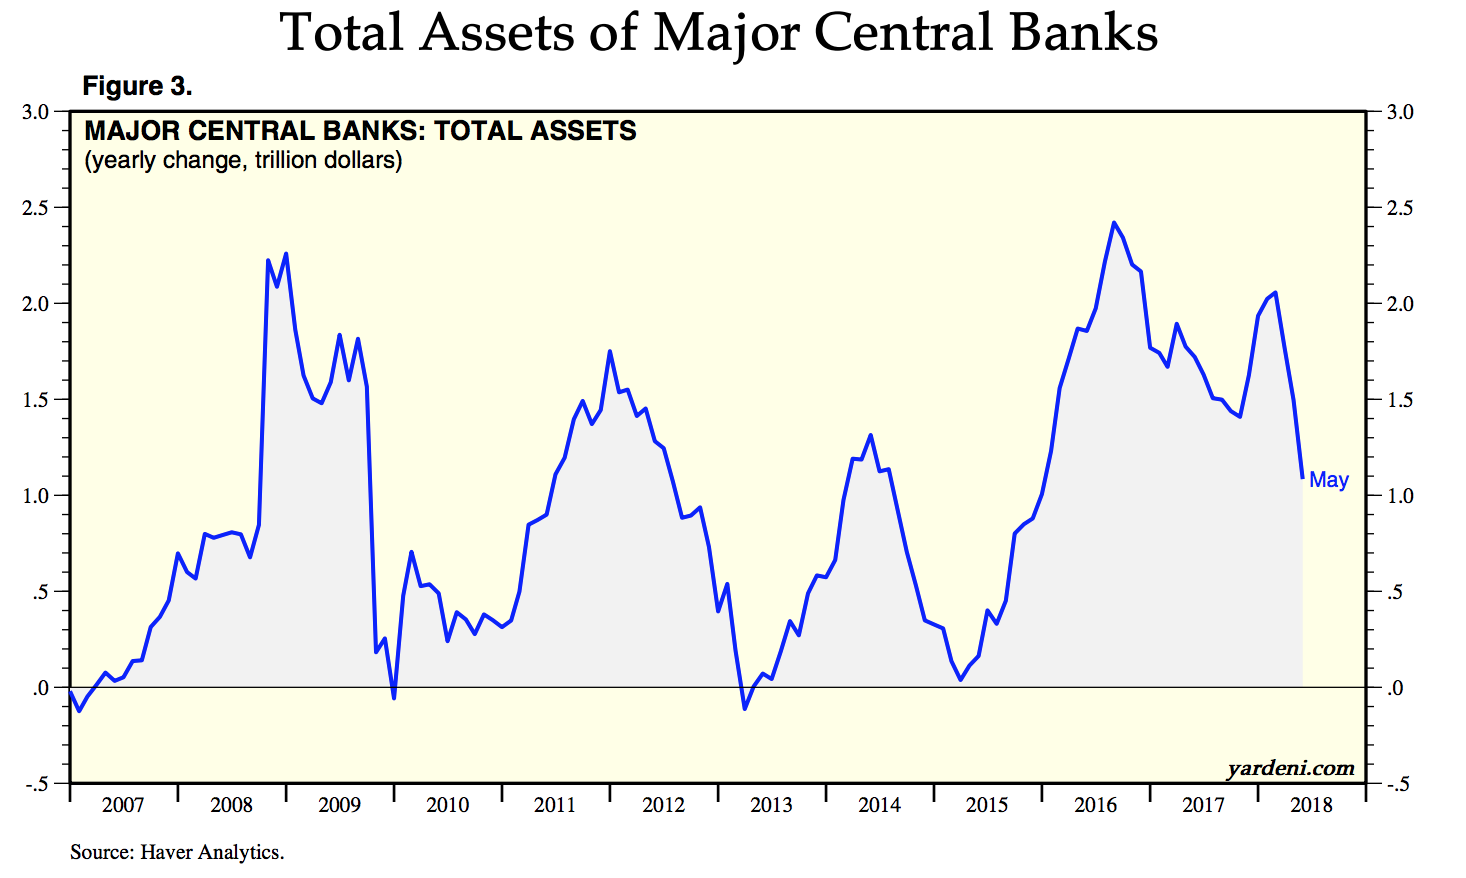
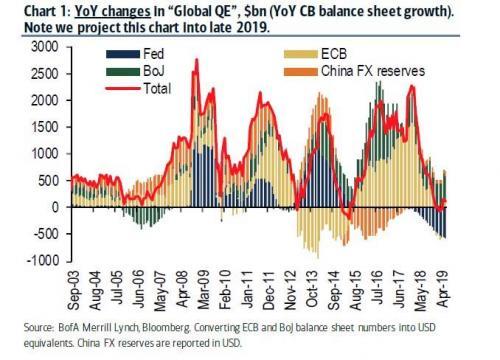
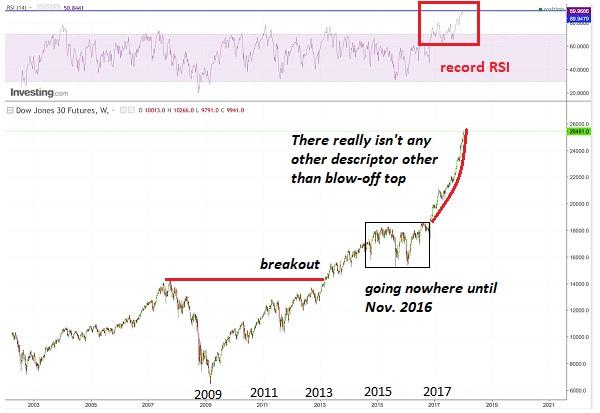
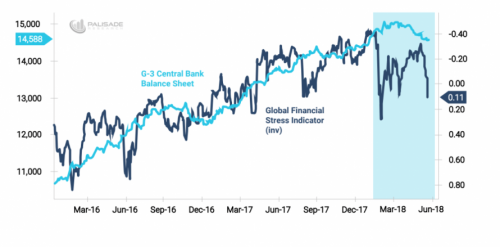
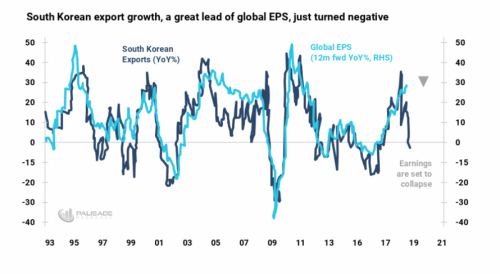
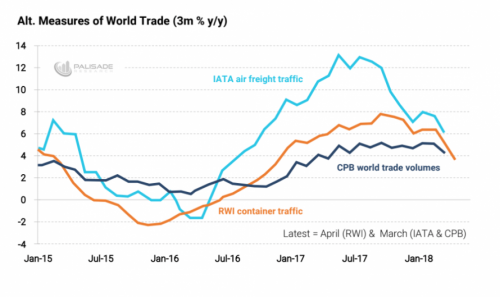


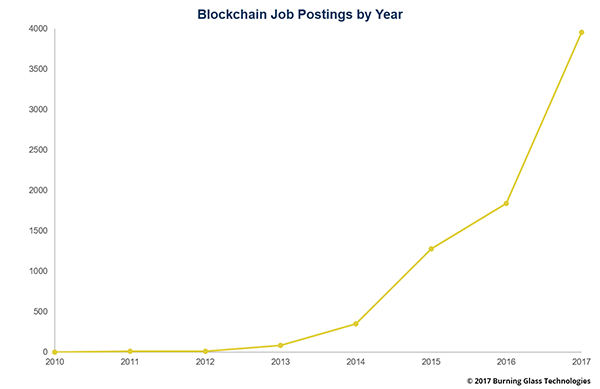
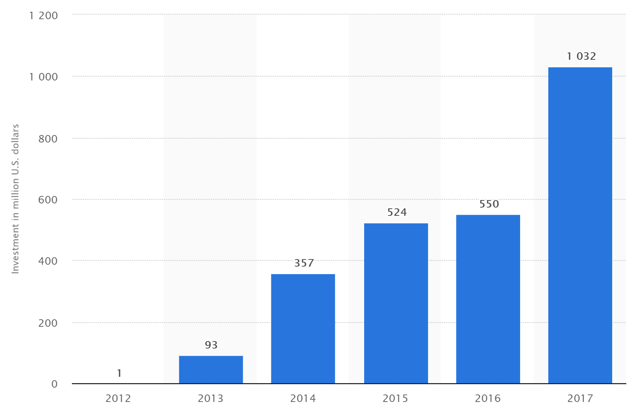

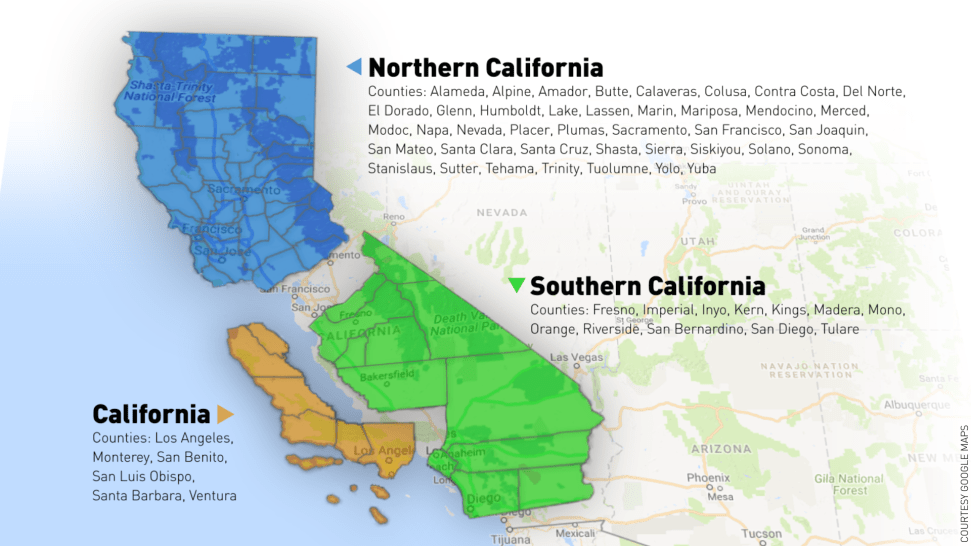


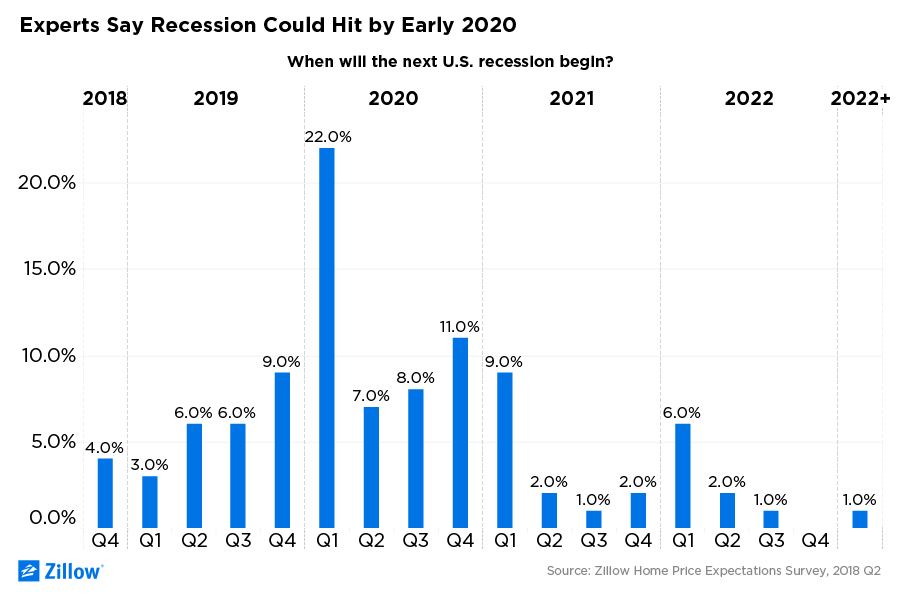


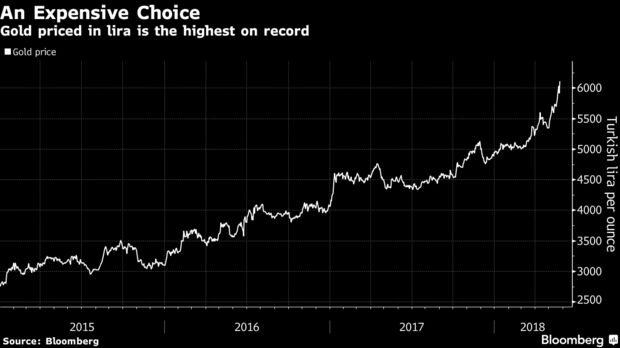
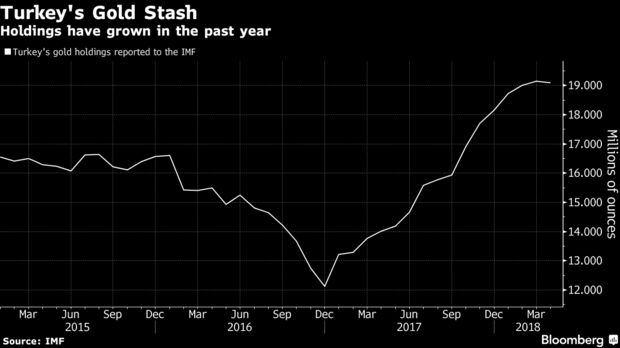
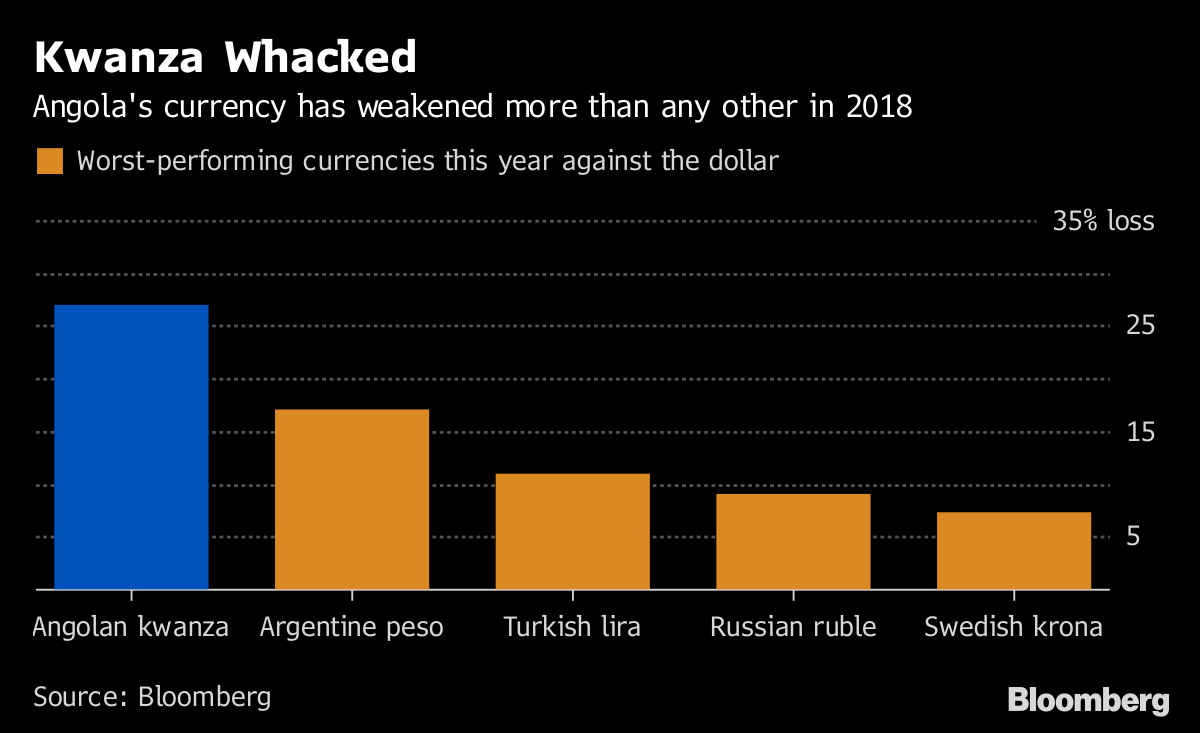


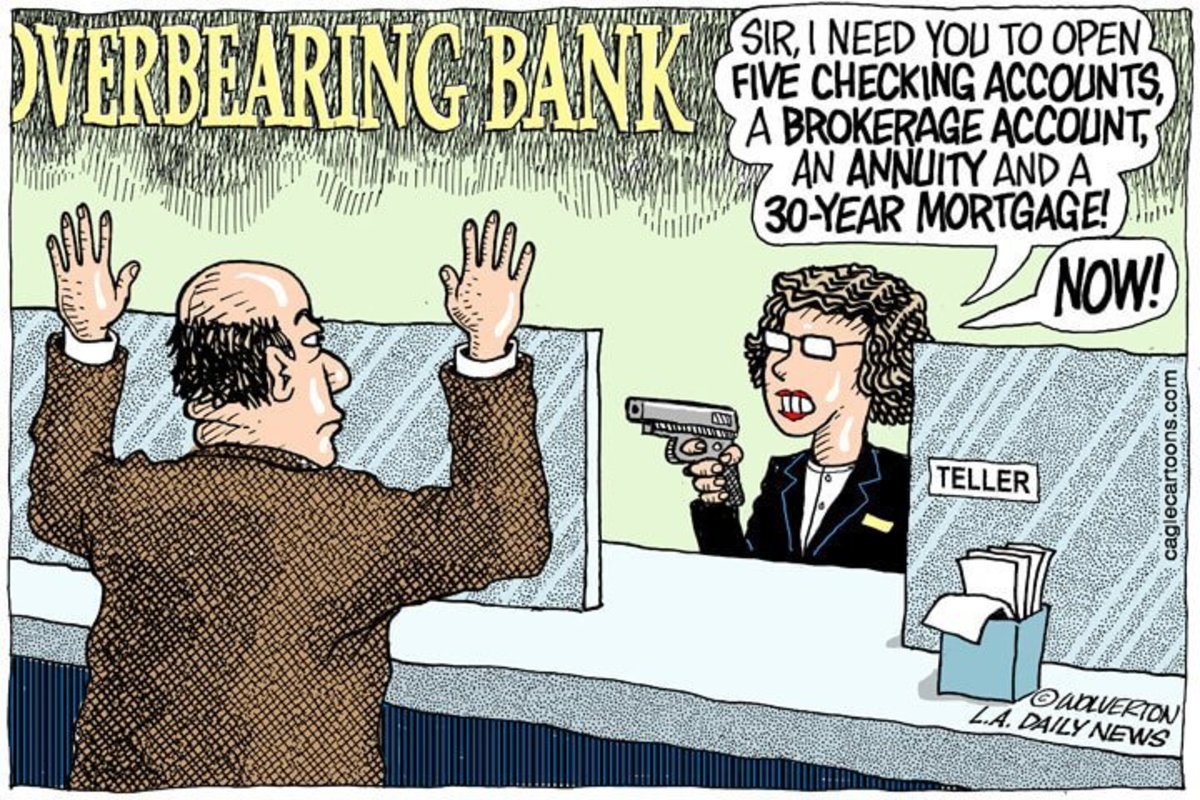


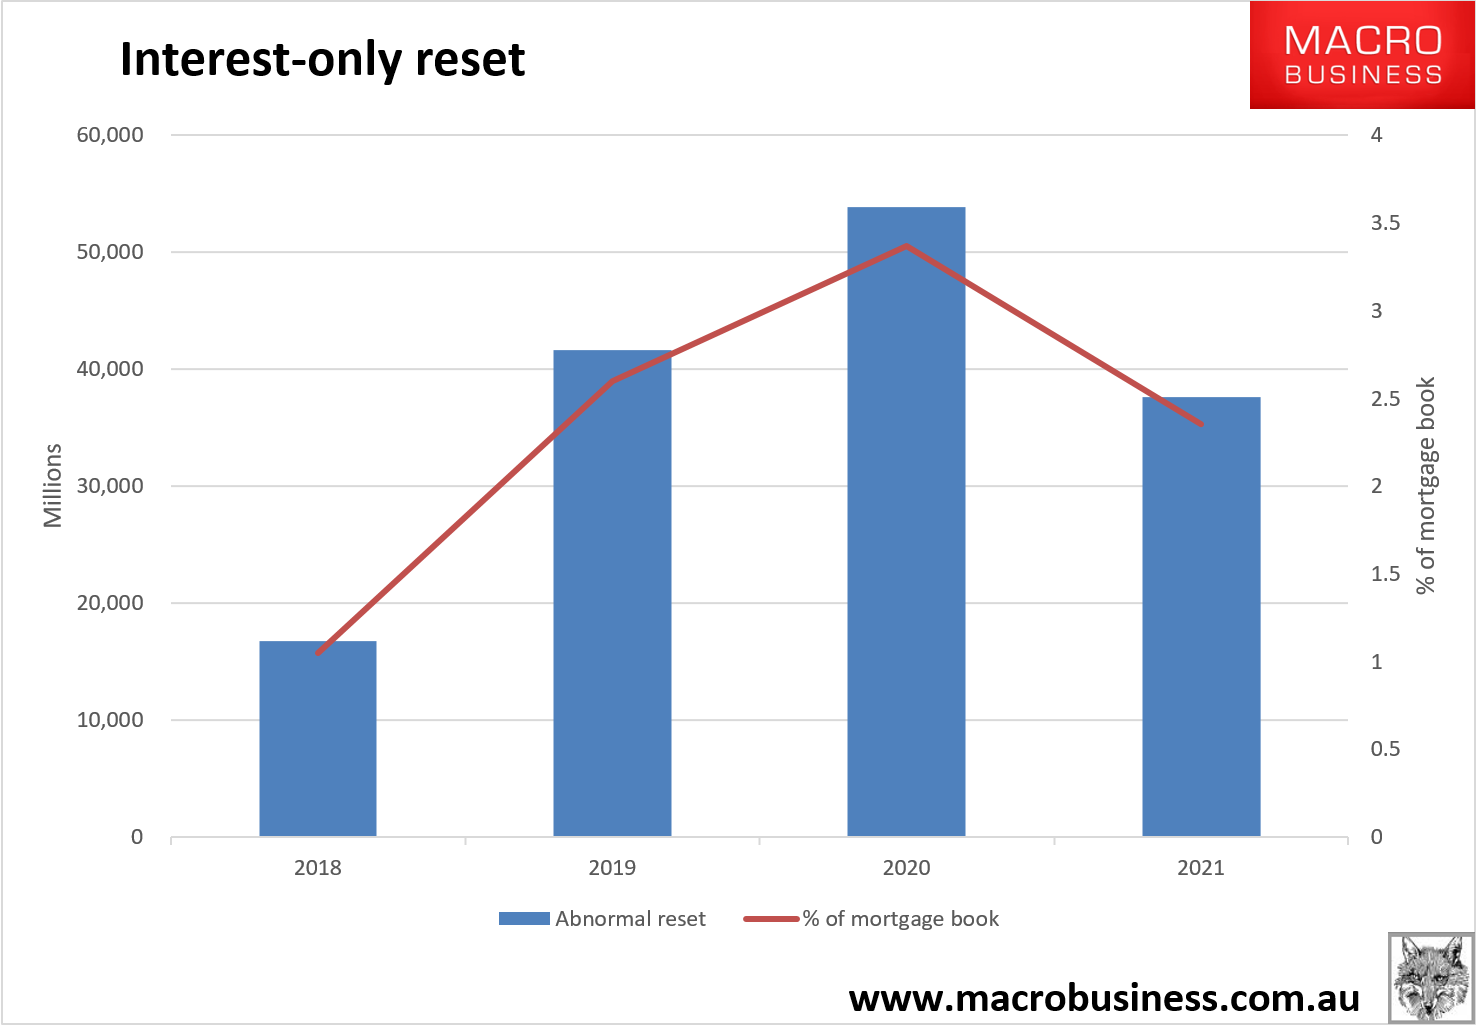


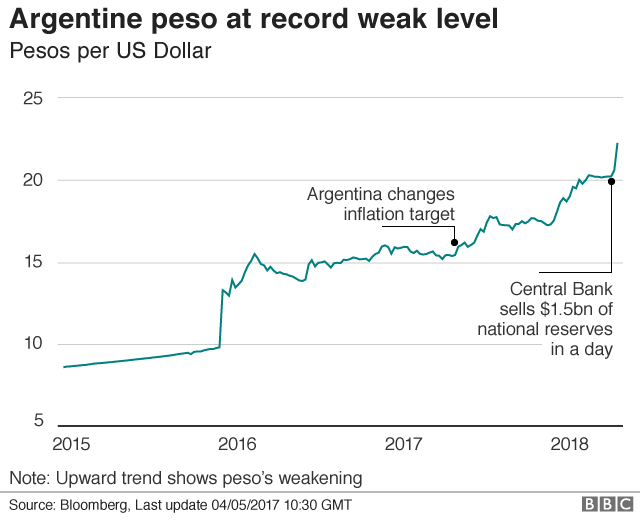
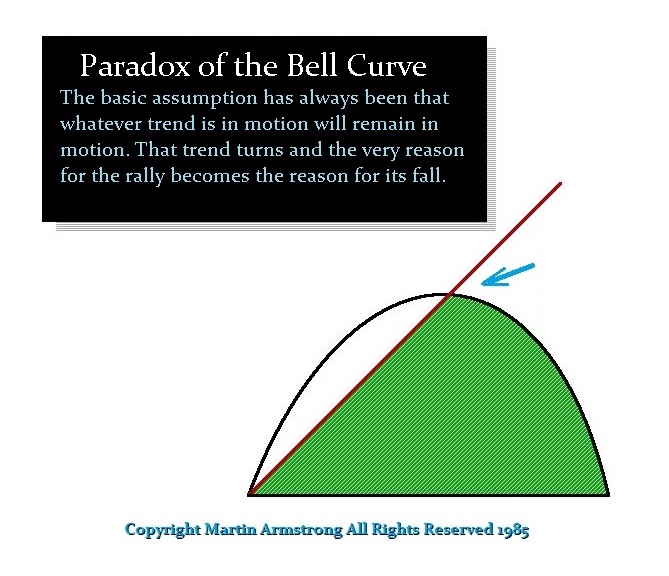
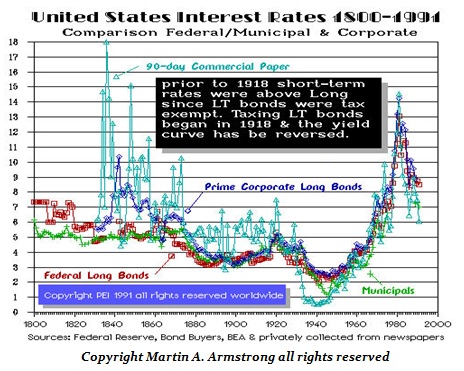
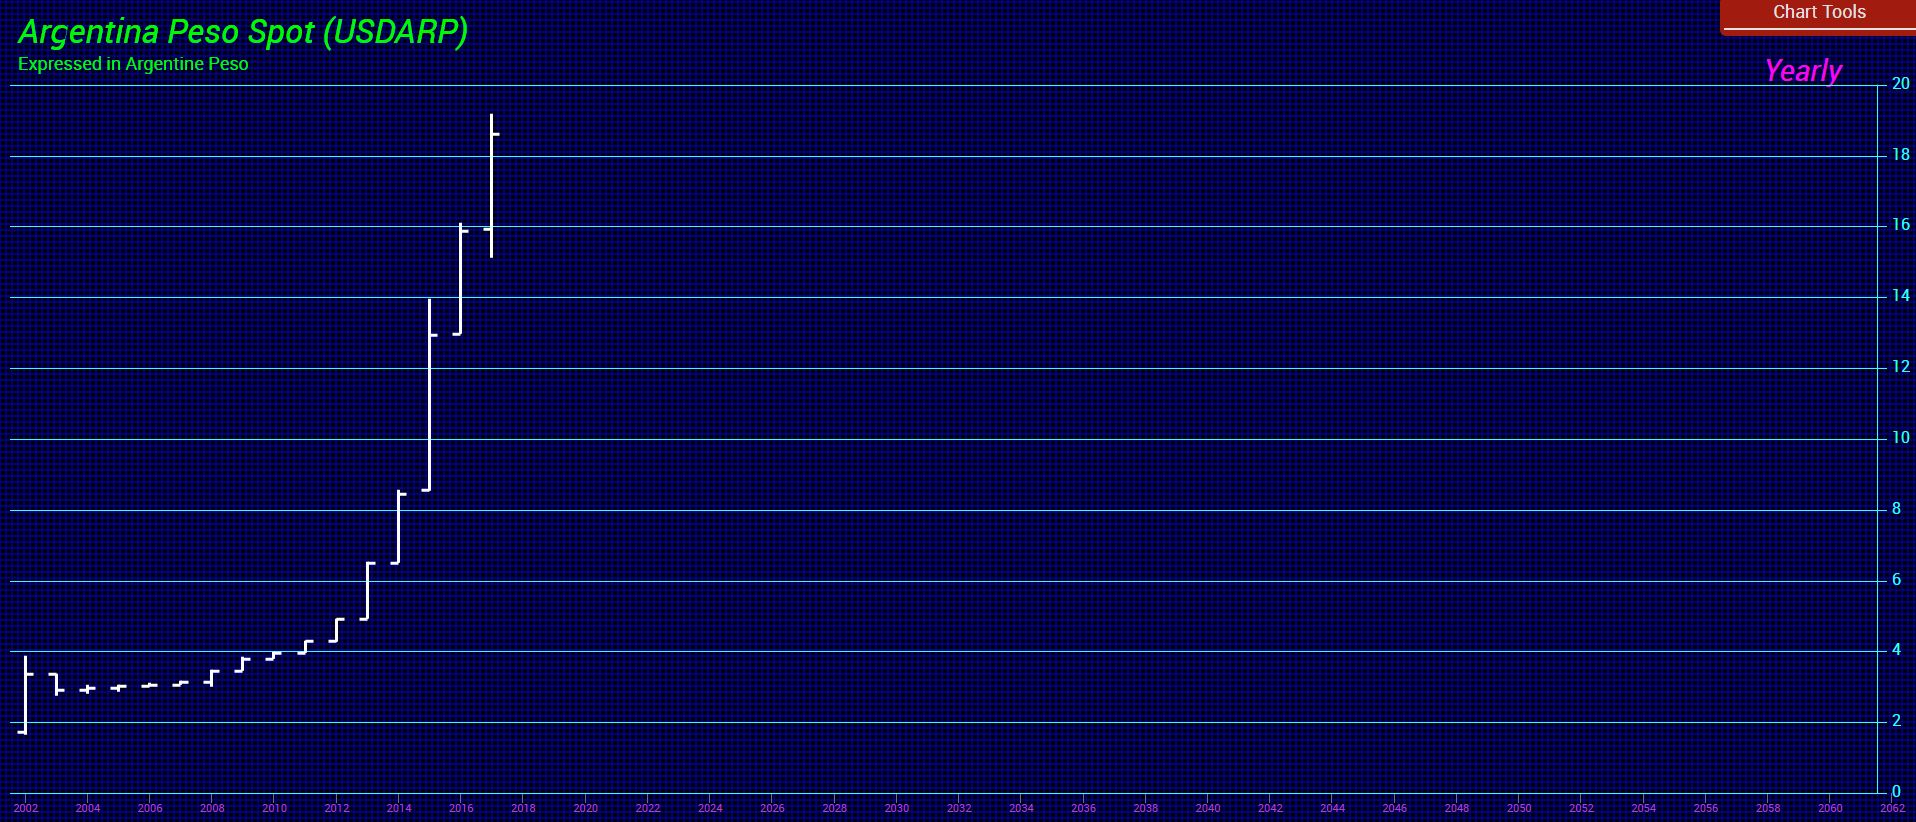
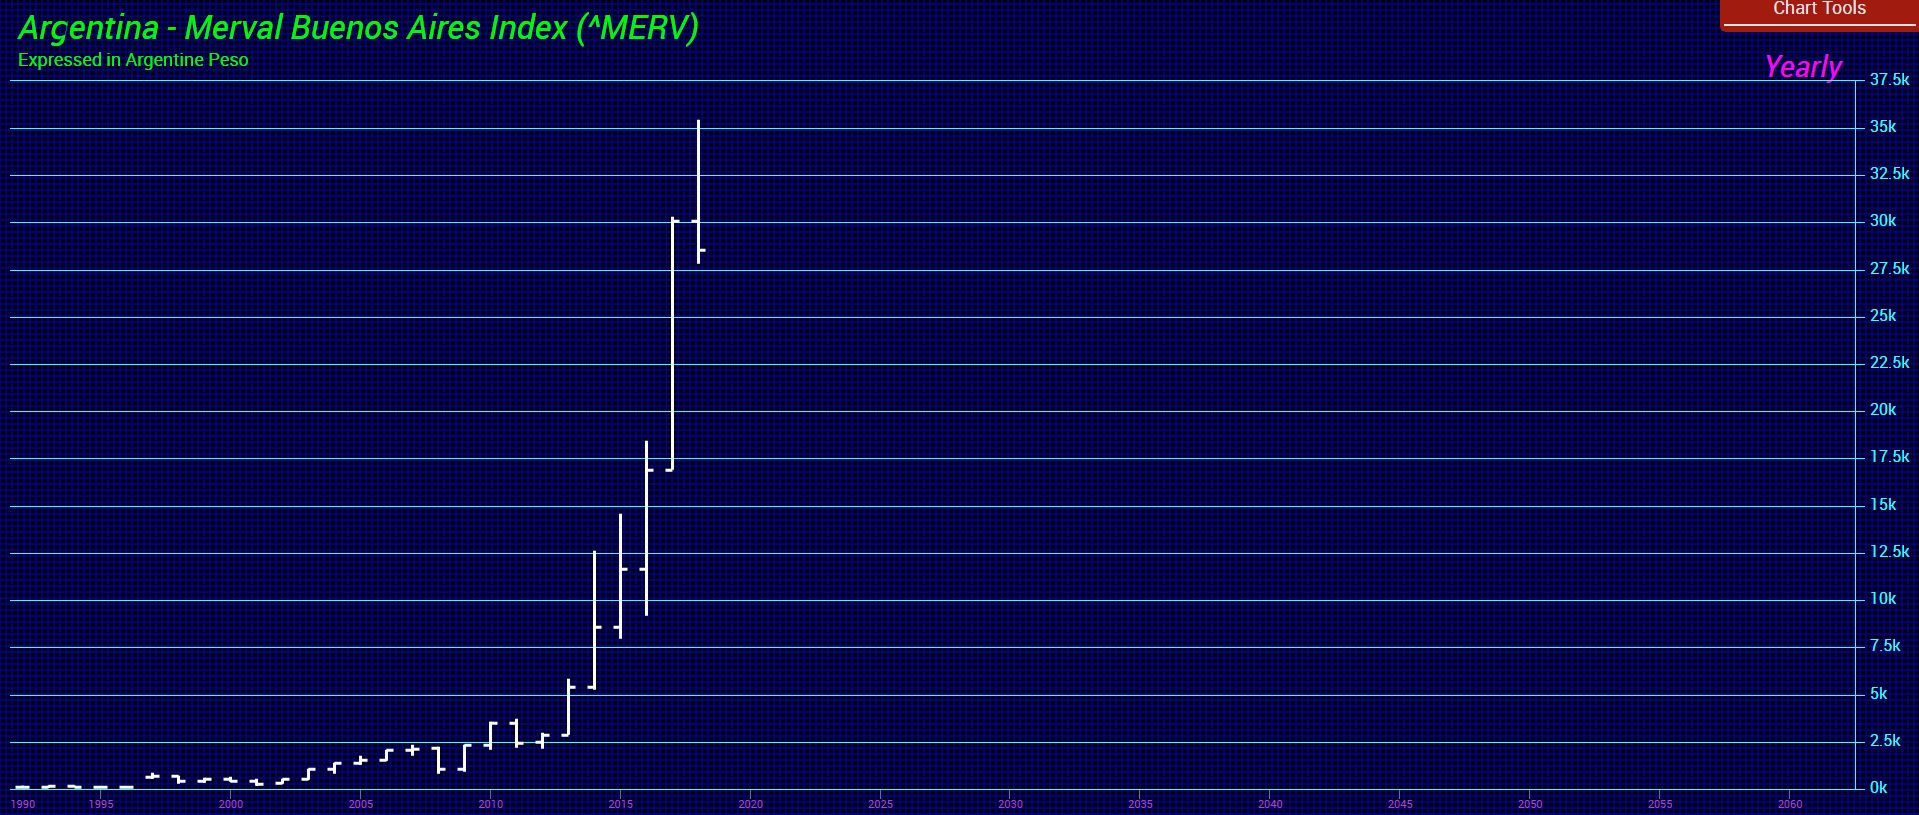


/cdn.vox-cdn.com/uploads/chorus_image/image/49760311/Brownstone-Lead.0.jpg)


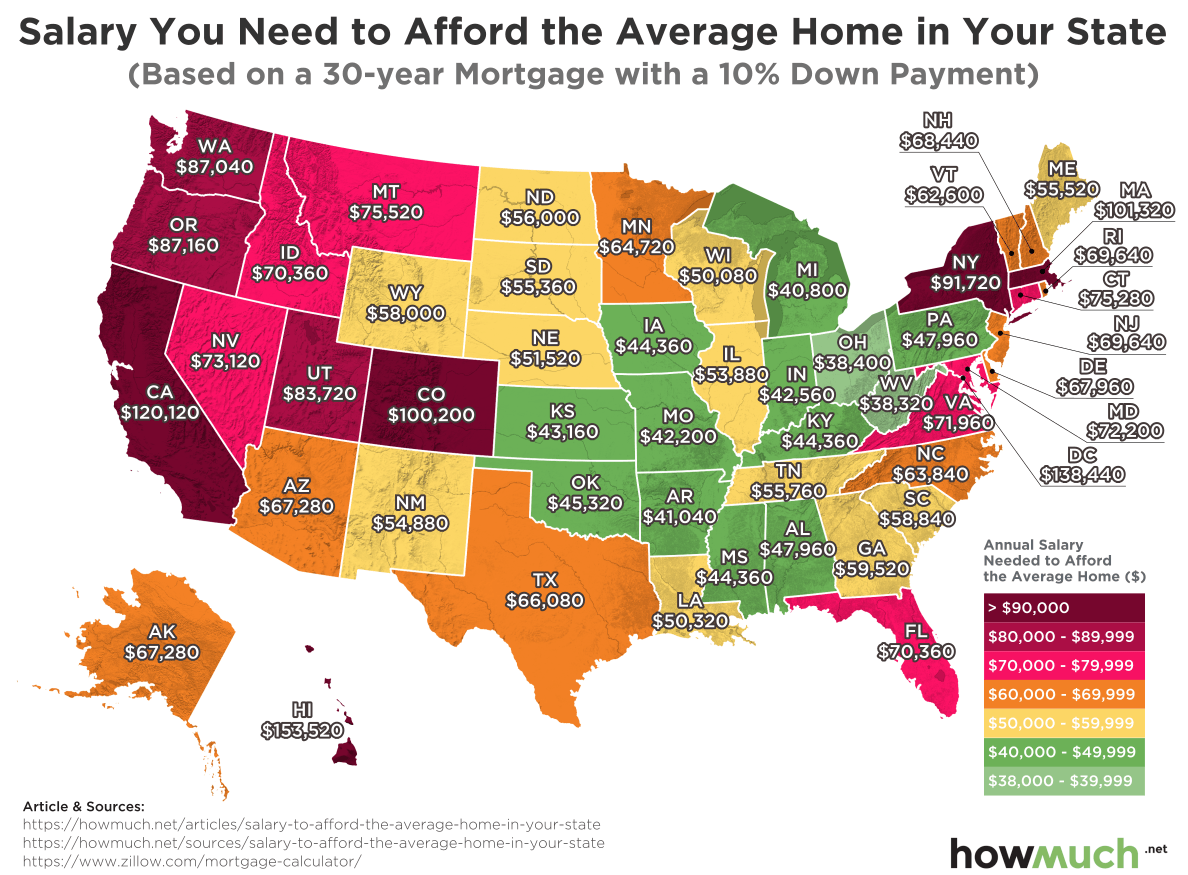


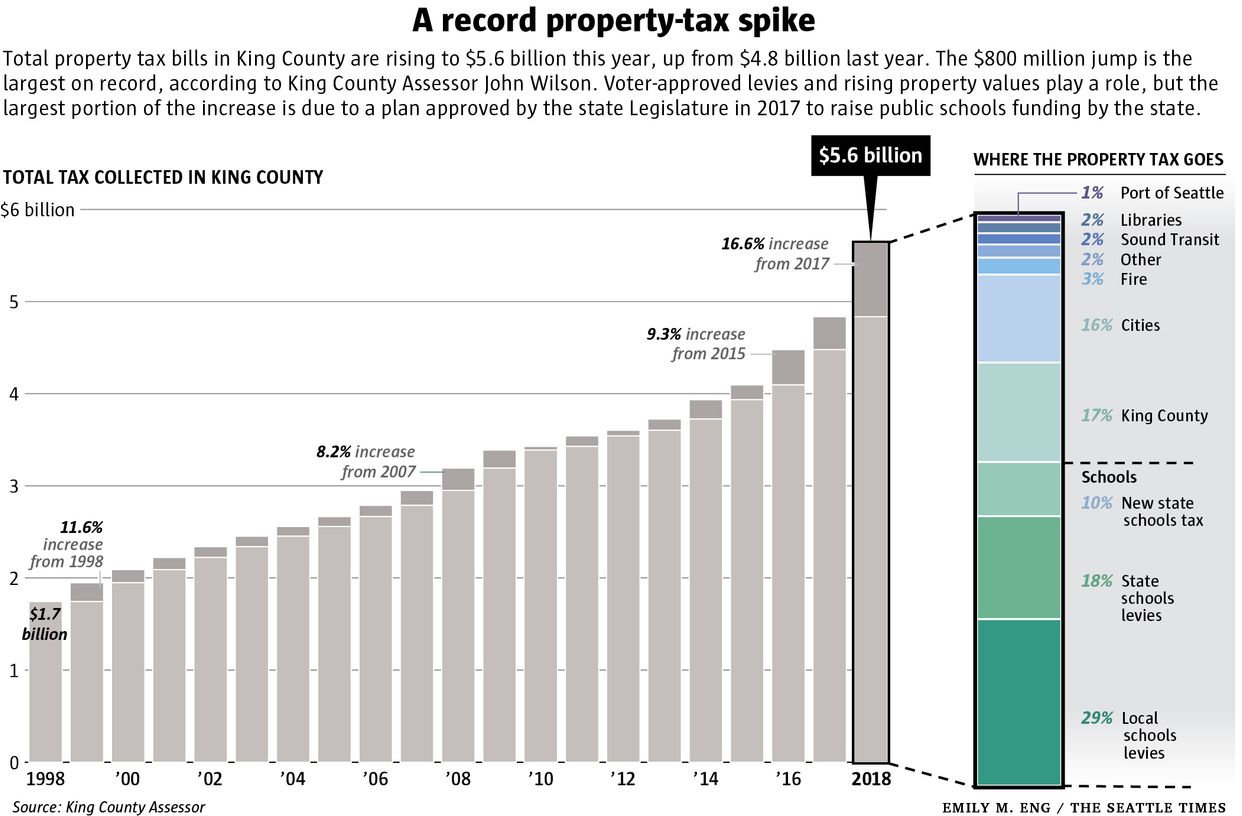


 Steven Seagal – actor, Zen master, musician, director, martial arts instructor and now crypto ambassador – has reportedly walked away from the Bitcoiin project, along with its anonymous founders, after closing out an ICO that may or may not have raised its targeted $75 million.


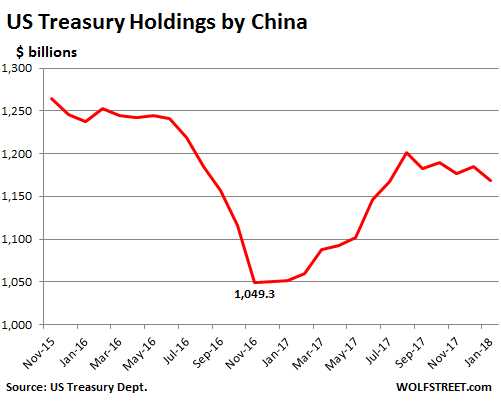

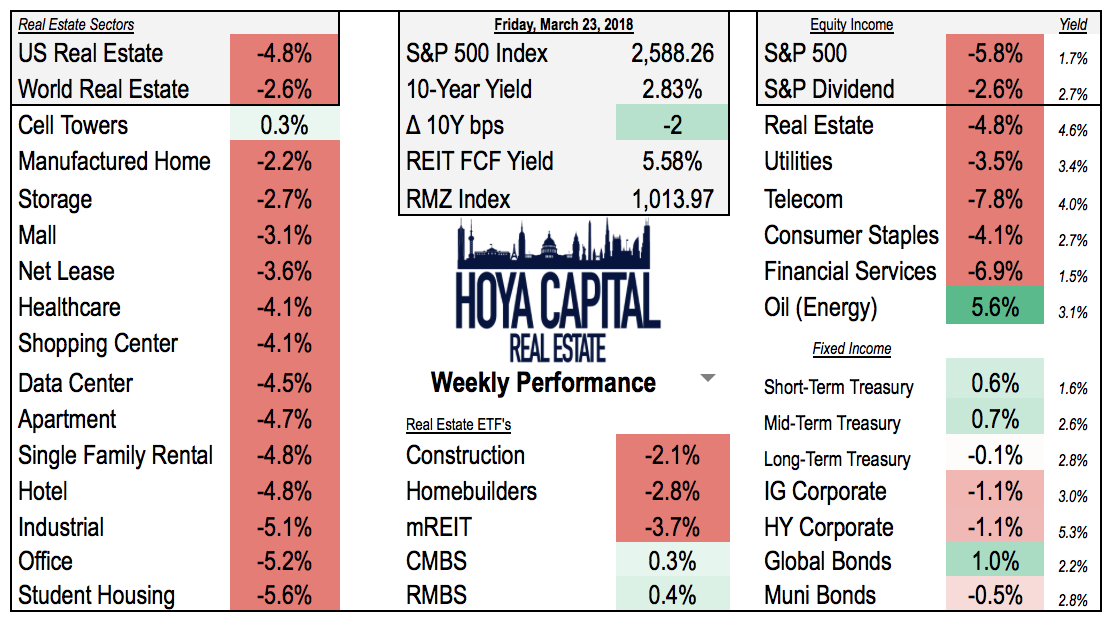
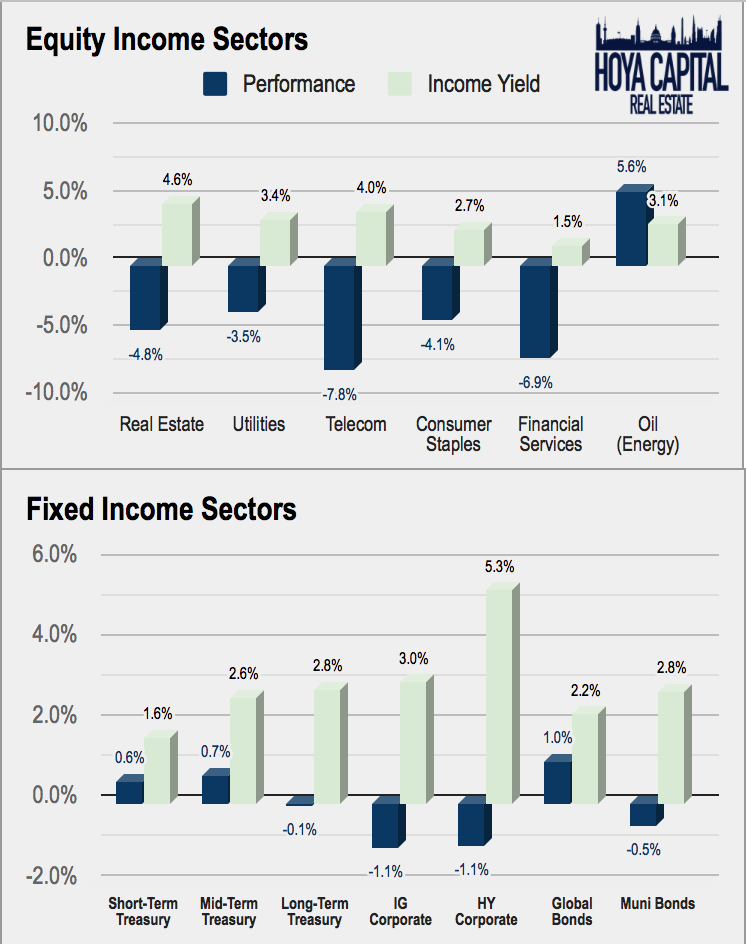
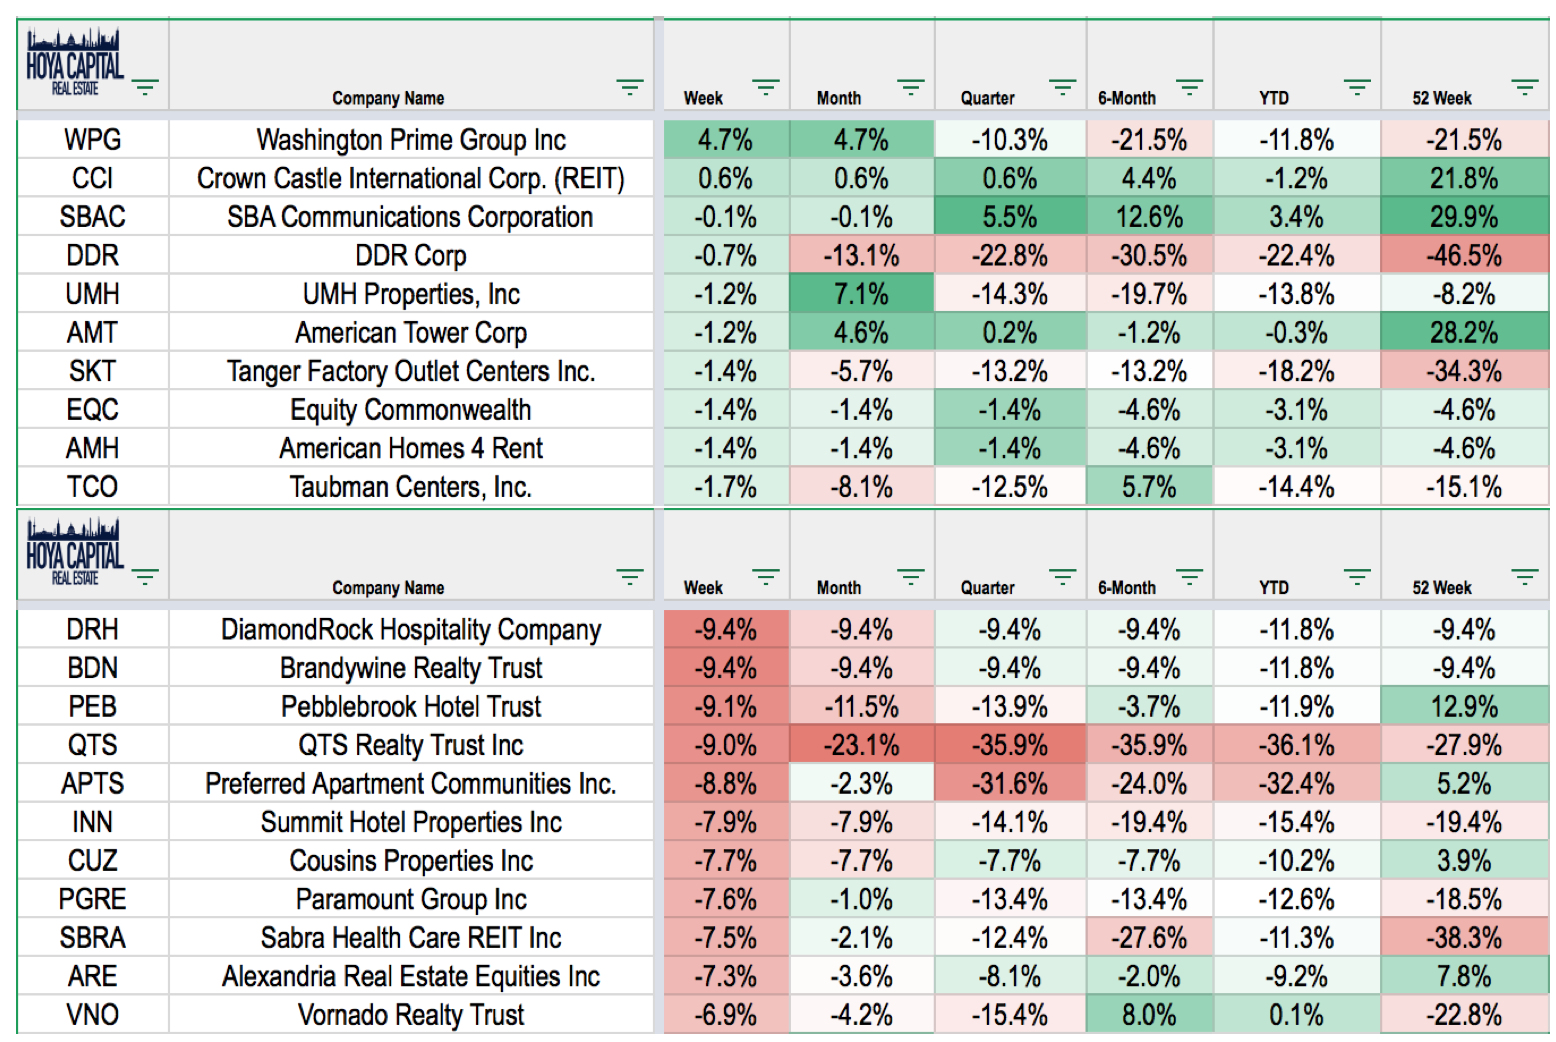
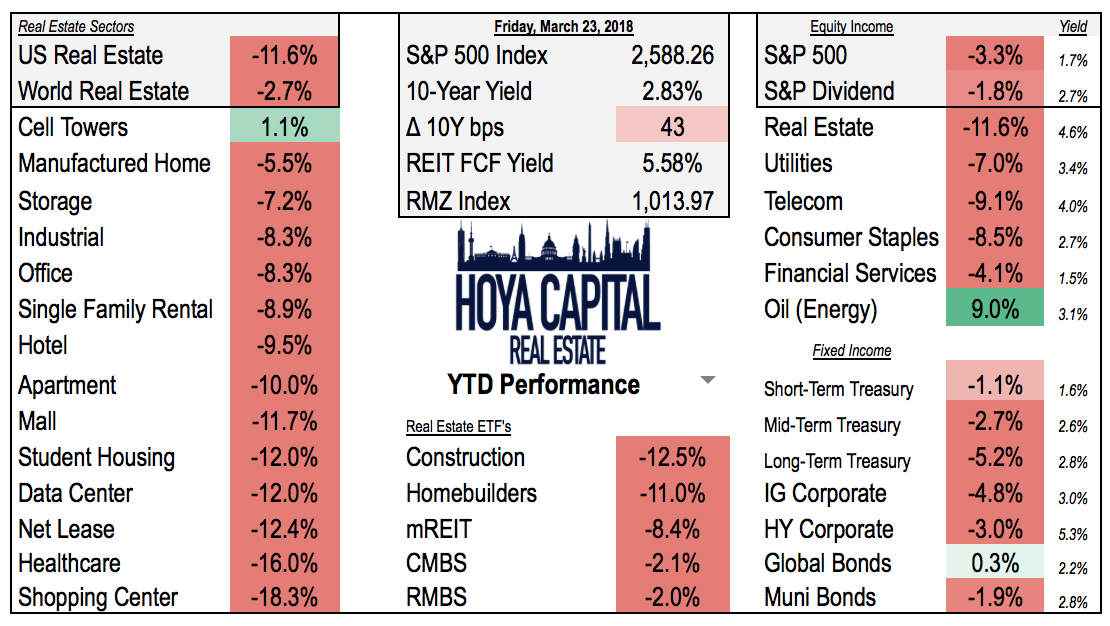
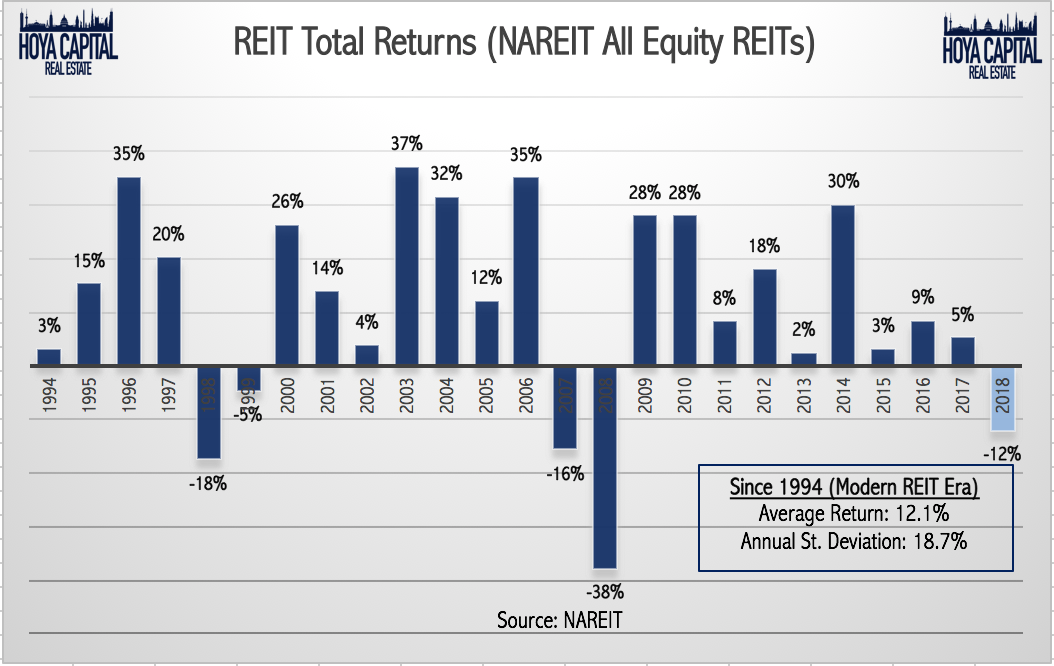
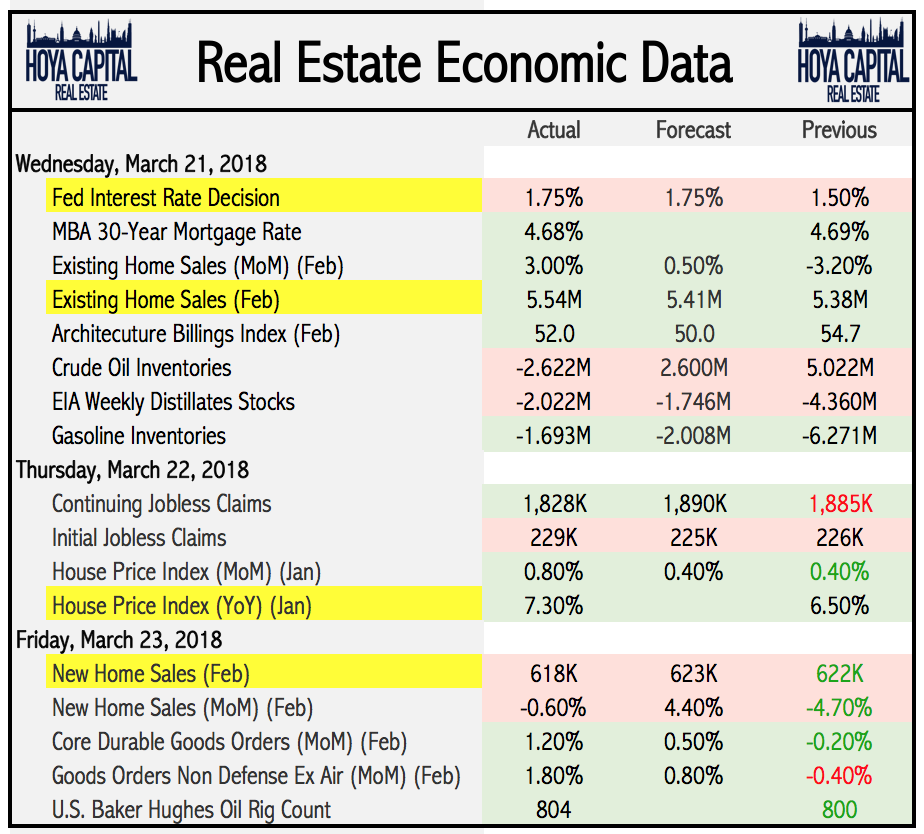
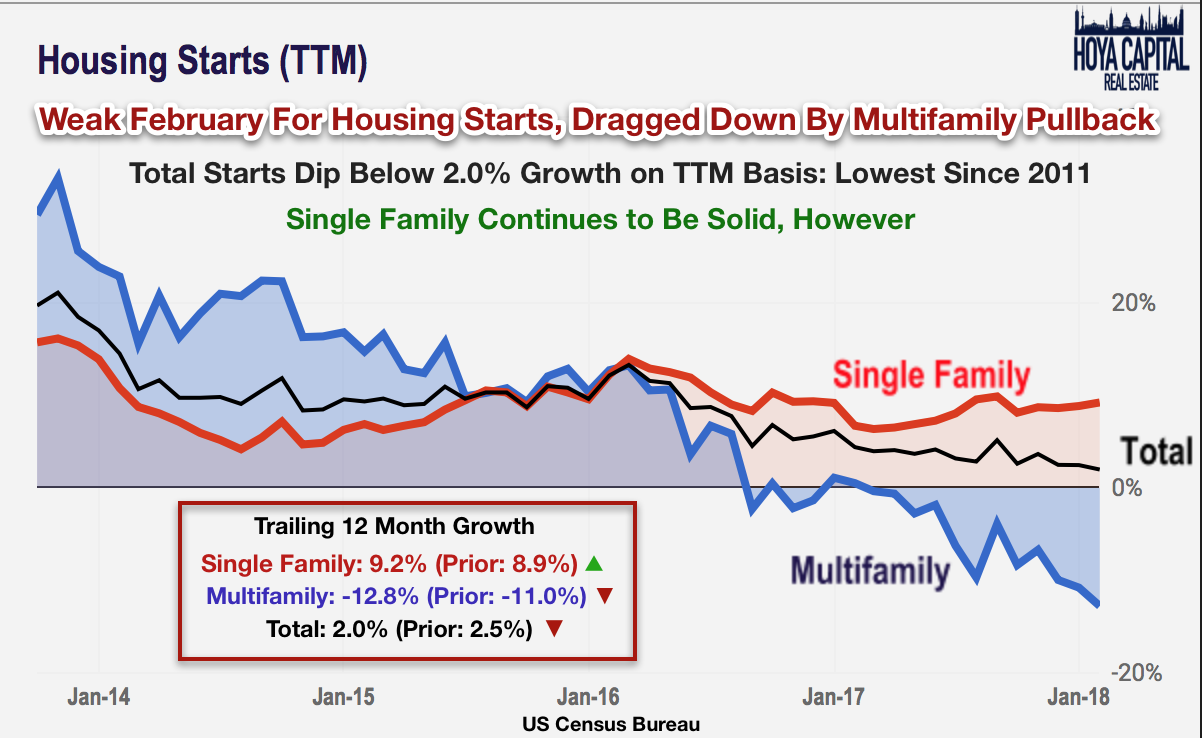
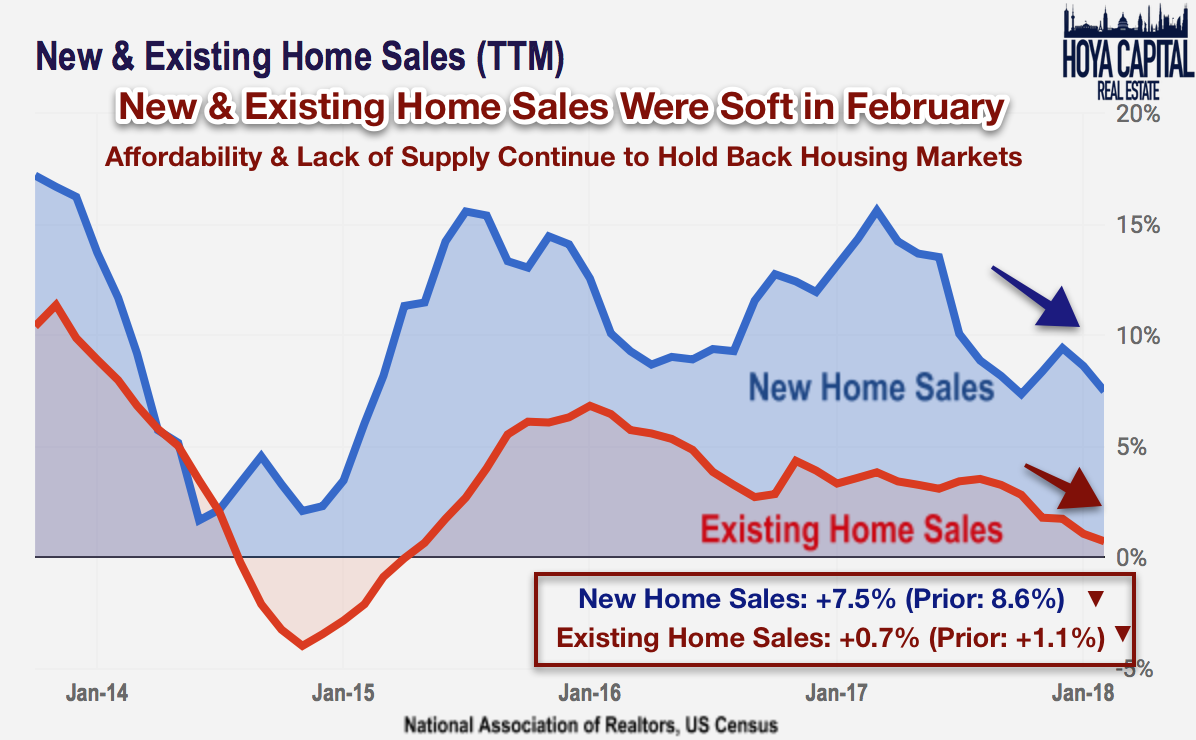
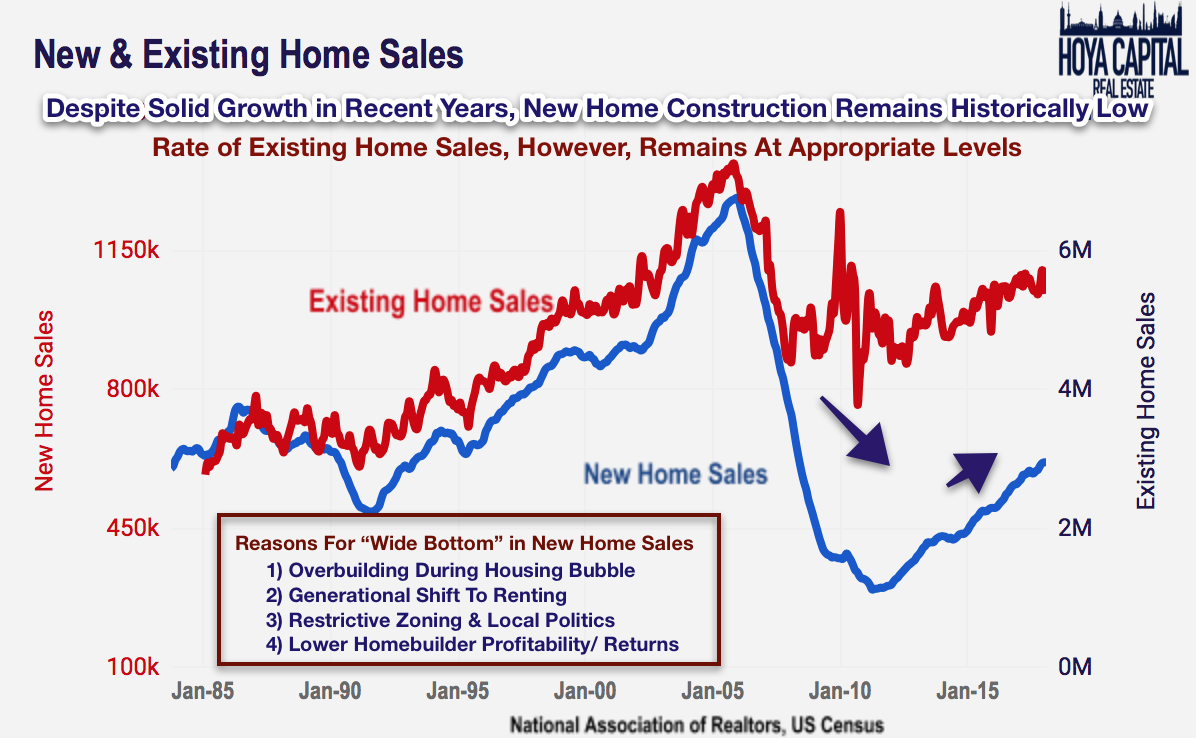
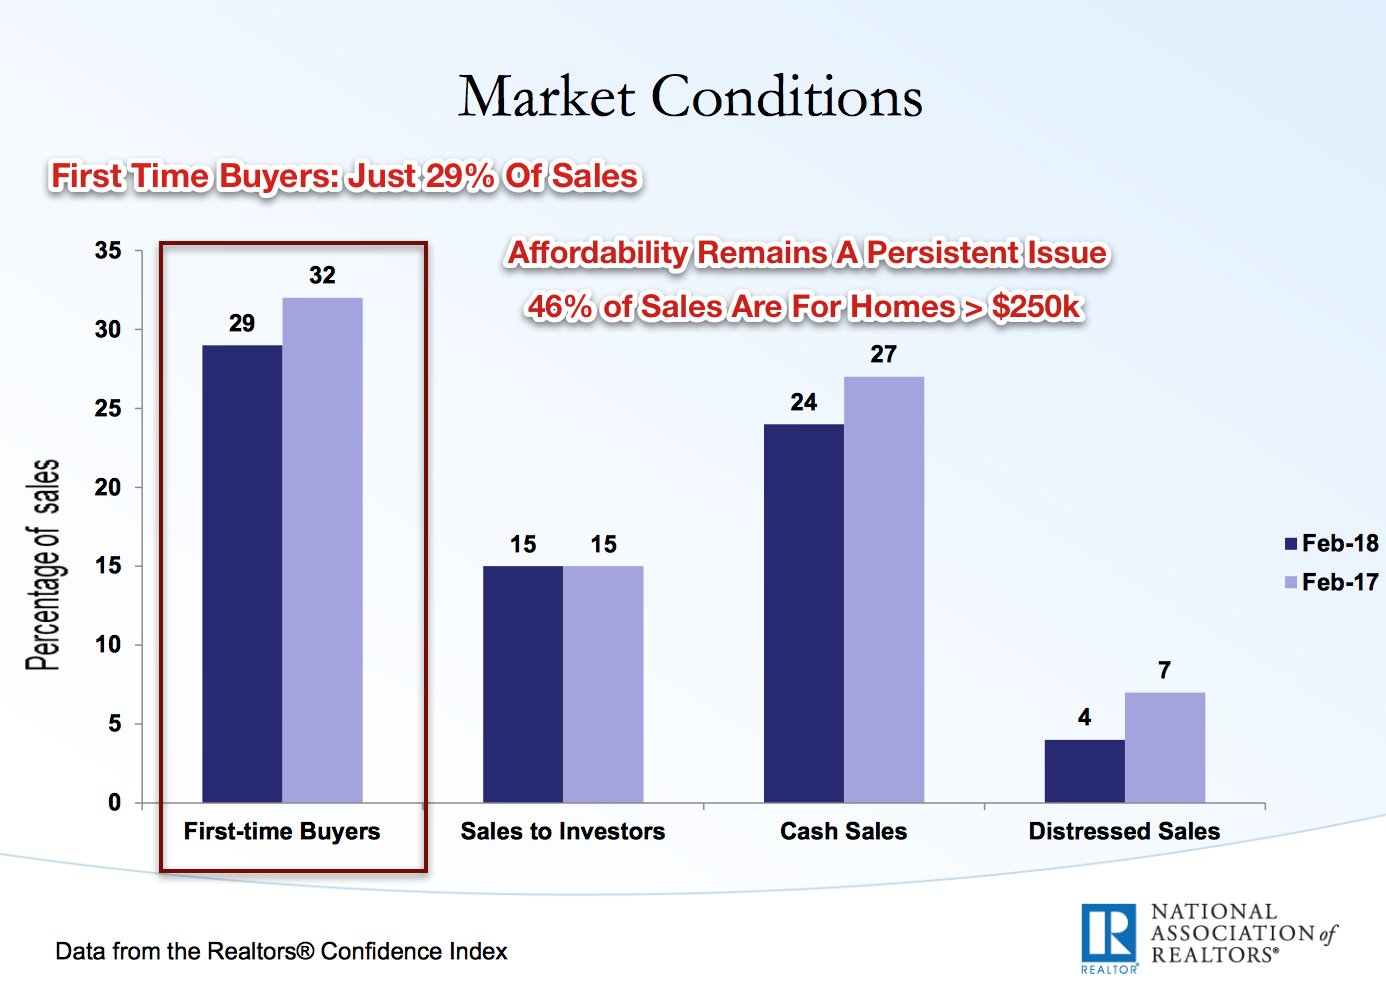


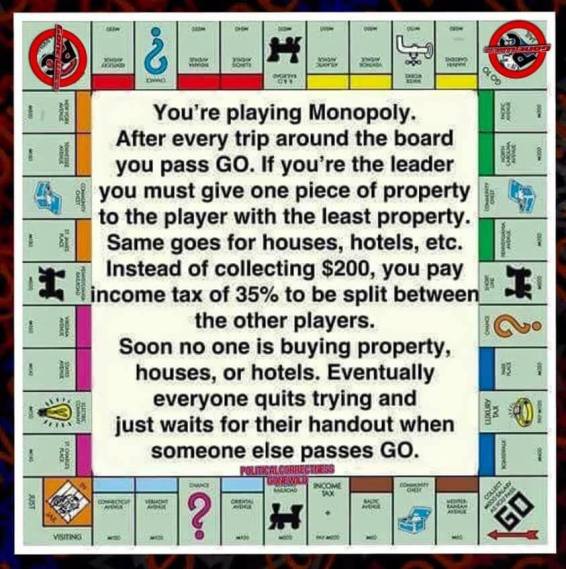


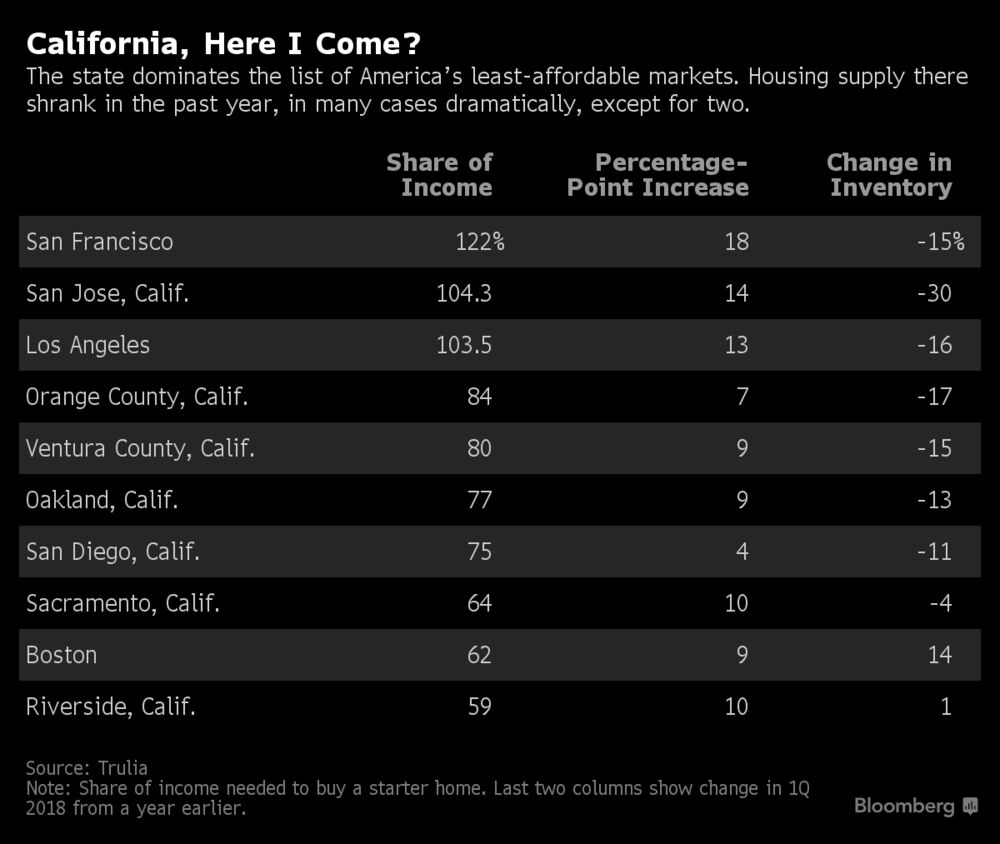


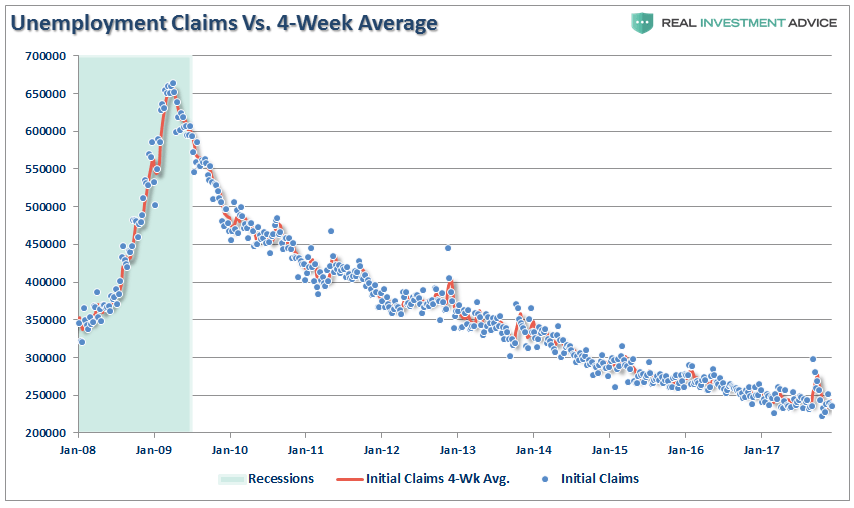


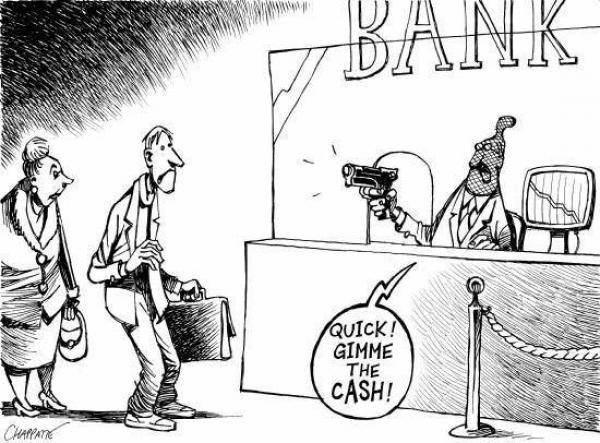


You must be logged in to post a comment.