Author Archives: Bone Fish

The Art of Capital Flight

Contemporary art and apartments in major cities such as New York, London and Vancouver has become the two most important stores of wealth internationally. Forget gold as an inflation hedge; buy paintings.

by Kenneth Rogoff in Project Syndicate

CAMBRIDGE – What impact will China’s slowdown have on the red-hot contemporary art market? That might not seem like an obvious question, until one considers that, for emerging-market investors, art has become a critical tool for facilitating capital flight and hiding wealth. These investors have become a major factor in the art market’s spectacular price bubble of the last several years. So, with emerging market economies from Russia to Brazil mired in recession, will the bubble burst?

Just five months ago, Larry Fink, Chairman and CEO of BlackRock, the world’s largest asset manager, told an audience in Singapore that contemporary art has become one of the two most important stores of wealth internationally, along with apartments in major cities such as New York, London, and Vancouver. Forget gold as an inflation hedge; buy paintings.


What made Fink’s elevation of art to investment-grade status so surprising is that no one of his stature had been brave enough to say it before. I am certainly not celebrating the trend. I tend to agree with the philosopher Peter Singer that the obscene sums being spent on premier pieces of modern art are disquieting.

https://i0.wp.com/www.pablopicasso.org/images/paintings/the-women-of-algiers.jpg

The Women of Algiers, 1955 by Pablo Picasso

We can all agree that these sums are staggering. In May, Pablo Picasso’s “Women of Algiers” sold for $179 million at a Christie’s auction in New York, up from $32 million in 1997. Okay, it’s a Picasso. Yet it is not even the highest sale price paid this year. A Swiss collector reportedly paid close to $300 million in a private sale for Paul Gauguin’s 1892 “When Will You Marry?”

Picasso and Gauguin are deceased. The supply of their paintings is known and limited. Nevertheless, the recent price frenzy extends to a significant number of living artists, led by the American Jeff Koons and the German Gerhard Richter, and extending well down the food chain.

For economists, the art bubble raises many fascinating questions, but an especially interesting one is exactly who would pay so much for high-end art. The answer is hard to know, because the art world is extremely opaque. Indeed, art is the last great unregulated investment opportunity.

Much has been written about the painting collections of hedge fund managers and private equity art funds (where one essentially buys shares in portfolios of art without actually ever taking possession of anything). In fact, emerging-market buyers, including Chinese, have become the swing buyers in many instances, often making purchases anonymously.

But doesn’t China have a regime of strict capital controls that limits citizens from taking more than $50,000 per year out of the country? Yes, but there are many ways of moving money in and out of China, including the time-honored method of “under and over invoicing.”

For example, to get money out of China, a Chinese seller might report a dollar value far below what she was actually paid by a cooperating Western importer, with the difference being deposited into an overseas bank account. It is extremely difficult to estimate capital flight, both because the data are insufficient and because it is tough to distinguish capital flight from normal diversification. As the late MIT economist Rüdiger Dornbusch liked to quip, identifying capital flight is akin to the old adage about blind men touching an elephant: It is difficult to describe, but you will recognize it when you see it.

Many estimates put capital flight from China at about $300 billion annually in recent years, with a marked increase in 2015 as the economy continues to weaken. The ever-vigilant Chinese authorities are cracking down on money laundering; but, given the huge incentives on the other side, this is like playing whack-a-mole.

Presumably, the anonymous Chinese buyers at recent Sotheby’s and Christie’s auctions had spirited their money out of the country before bidding, and the paintings are just an investment vehicle that is particularly easy to hold secretively. The art is not necessarily even displayed anywhere: It may well be spirited off to a temperature- and humidity-controlled storage vault in Switzerland or Luxembourg. Reportedly, some art sales today result in paintings merely being moved from one section of a storage vault to another, recalling how the New York Federal Reserve registers gold sales between national central banks.

Clearly, the incentives and motives of art investors who are engaged in capital flight, or who want to hide or launder their money, are quite different from those of ordinary investors. The Chinese hardly invented this game. It was not so long ago that Latin America was the big driver in the art market, owing to money escaping governance-challenged economies such as Argentina and Venezuela, as well as drug cartels that used paintings to launder their cash.

So how, then, will the emerging-market slowdown radiating from China affect contemporary art prices? In the short run, the answer is ambiguous, because more money is leaking out of the country even as the economy slows. In the long run, the outcome is pretty clear, especially if one throws in the coming Fed interest-rate hikes. With core buyers pulling back, and the opportunity cost rising, the end of the art bubble will not be a pretty picture.

Miami’s One Thousand Museum Tower Enjoys $1 Million an Hour Sales Rate

The developers of Miami’s new and uber-luxe One Thousand Museum reported approximately $24 million in new condo sales contracts signed within 24 hours of their 24-hour concrete pour.

https://i0.wp.com/www.worldpropertyjournal.com/assets_c/2015/09/One-Thousand-Museum---Miami-Fl-Vertical-View-thumb-400x621-26145.jpg

“If we knew we’d sell $1M an hour, we would have poured longer,” said Louis Birdman, one of the developers of the 62-story skyscraper. Four contracts were signed during the pour with buyers from the US, Mexico City, and Argentina. All sales were for half-floor units ranging in price from $5.8 to $6.5 million.
 
The 83-unit tower, slated for completion in late 2017, will expect 4,800 pieces of the project’s revolutionary exoskeleton being shipped from Dubai to initiate this installation.

Once complete, One Thousand Museum will be the first building in the country to utilize this glass-fiber reinforced concrete (GFRC) outer shell as a permanent formwork.
 
“Zaha Hadid is a visionary. The buildings she designs not only make headlines worldwide, but also garner critical acclaim and promise to be in history books for generations to come,” said Louis Birdman on the architectural component of the project.
 
Some noted amenities include 30,000 square feet of luxury communal areas include a two-story amenity space at the top of the tower, an aquatic center, garden areas, event spaces, a two-story health spa, multiple art galleries, a theater, and the city’s only private rooftop helipad.

https://i0.wp.com/www.worldpropertyjournal.com/assets_c/2015/09/One-Thousand-Museum---Miam-Fl-Penthouse-Views-thumb-780x257-26143.jpg

Via Miho Favela in World Property Journal

‘Most Expensive’ Mansion Listing In U.S., Palazzo di Amore Cut Price By $46 Million

http://www.trbimg.com/img-55e8ae10/turbine/la-fi-hotprop-palazzo-di-amore-20150903-001/900/900x506

Despite the $46-million price cut, the 53,000-square-foot Beverly Hills home is still asking a top-of-the-charts $149 million. (Marc Angeles | Inset: Tribune Publishing)

http://www.trbimg.com/img-545bbe83/turbine/la-fi-hotprop-195-million-estate-20141106-pict-011/1200/1200x675

As Shanghai Stock Market Tanks, China Makes Mass Arrests: ‘You Could Disappear at any Time’

The Shanghai stock exchange, which has been creating global stock market convulsions while trimming 39 percent off its value since June, will be closed for the next two days. The Chinese holiday started on Thursday in Beijing with a big parade and show of military might to commemorate the 70th anniversary of V-Day and the defeat of Japan in World War II.

The massive military pageantry and display of weaponry was widely seen as a move by President Xi Jinping to reassert his authoritarian rule in the wake of a sputtering domestic economy, $5 trillion in value shaved off the stock market in a matter of months, and the need to devalue the country’s currency on August 11 in a bid to boost exports.

Tragically, what has received far less attention than melting China stocks is the mass arrests of dissidents, human rights activists, attorneys and religious leaders. More recently, the government has begun to “detain” journalists and finance executives in an apparent attempt to scapegoat them for the stock market’s selloff.

The mass arrests began in July, the same time the China stock market started to crater in earnest. Last evening, the Financial Times had this to say about the disappearance of Li Yifei, a prominent hedge fund chief at Man Group China.

“The whereabouts of Ms Li remained unclear on Wednesday. Her husband, Wang Chaoyong, told the Financial Times that her meetings with financial market authorities in Beijing had concluded, and ‘she will take a break for a while.’ ”

Bloomberg Business had previously reported that Li Yifei was being held by the police as part of a larger roundup of persons they wanted to interview regarding the stock market rout.

The reaction to these authoritarian sweeps has worsened the stock market situation in China. Volume on the Shanghai market, according to the Financial Times, has skidded from $200 billion on the heaviest days in June to just $66 billion this past Tuesday.

On Tuesday afternoon, a Wall Street Journal reporter was interviewed by phone from Beijing on the business channel, CNBC. He said “waves” of arrests were taking place. That interview followed an article in the Wall Street Journal on Monday, which appeared with no byline (perhaps for the safety of the Beijing-based reporter) that shed more light on the arrests:

“Chinese police on the weekend began rounding up the usual suspects, which in this case are journalists, brokers and analysts who have been reporting stock-market news. Naturally, the culprits soon confessed their non-crimes on national television. A reporter for the financial publication Caijing was shown on China Central Television on Monday admitting that he had written an article with ‘great negative impact on the market.’ His offense was reporting that authorities might scale back official share-buying, which is what they soon did. On Sunday China’s Ministry of Public Security announced the arrest of nearly 200 people for spreading rumors about stocks and other incidents.”

Also on Tuesday, David Saperstein, the U.S. Ambassador-at-large for religious freedom, publicly demanded that China release attorney Zhang Kai and religious leaders who had been swept up by the government the very day before Saperstein had been scheduled to meet with them. In an interview with the Associated Press, Saperstein called the state actions “outrageous,” particularly since he had been invited to China to observe religious freedom in the country.

Christianity is growing rapidly in some regions of China and strong religious leaders or movements are seen as a threat to communist party rule. Religious leaders had been protesting the state’s removal of crosses from the tops of churches.

On July 22, the New York Times reported that over 200 human rights lawyers and their associates had been detained. Using the same humiliating tactic as used recently against the financial journalist, The Times reports that some of the “lawyers have been paraded on television making humiliating confessions or portrayed as rabble-rousing thugs.” One of the lawyers who was later released, Zhang Lei, told The Times: “This feels like the biggest attack we’ve ever experienced. It looks like they’re acting by the law, but hardly any of the lawyers who disappeared have been allowed to see their own lawyers. Over 200 brought in for questioning and warnings — I’ve never seen anything like it before.”

U.S. Ambassador to the United Nations, Samantha Power, is also demanding the release of female prisoners in China, including Wang Yu, who was arrested with her husband in July.

According to a detailed interview that Wang Yu gave the Guardian prior to her detention and disappearance on July 9, people are being arrested, grabbed off the street, sent to mental hospitals or detention centers. She said: ‘You could disappear at any time.’

As a documentary made by the Guardian shows, one of Wang Yu’s cases involved the alleged rape of six underage girls by the headmaster of their school. Wang Yu took the case and organized a protest, handing out literature on child protection laws to pedestrians and people passing by in automobiles.

Parents of the young girls who had originally consented to their legal representation soon withdrew the consent, saying they were being monitored by the government and had been told not to speak to journalists or lawyers. Wang Yu said that cases like this are happening every minute and everywhere in China.

Yesterday, the Mail & Guardian reported that Wang Yu’s whereabouts remain a mystery.

On August 18, Reuters reported that Chinese government officials “had arrested about 15,000 people for crimes that ‘jeopardized Internet security,’ as the government moves to tighten controls on the Internet.”

Against this horrific backdrop, China’s authoritarian President Xi Jinping is slated to visit the United States late this month for a meeting with President Obama and state dinner at the White House. According to the Washington Post’s David Nakamura, a bipartisan group of 10 senators sent President Obama a letter in August calling on him to raise the issue of human rights abuses when Xi visits. The Post published the following excerpt from the letter:

“We expect that China’s recent actions in the East and South China Seas, economic and trade issues, climate change, as well as the recent cyber-attacks, will figure prominently in your discussions. While these issues deserve a full and robust exchange of views, so too do human rights. Under President Xi, there has been an extraordinary assault on rule of law and civil society in China.”

Given the delicacy with which President Obama is likely to broach this subject with Xi, a mass demonstration outside of the White House by human rights activists and lawyers in this country during the White House visit might send a more powerful message. Last year, U.S. consumers and businesses purchased $466.8 billion in goods from China. Should these human rights abuses continue, China should be made aware that consumers in the U.S. know how to check labels for country of origin.

By Pam Martens and Russ Martens, featured in Wall Street On Parade

Margin Calls Mount On Loans Against Stock Portfolios Used To Buy Homes, Boats, “Pretty Much Everything”

Boat house good for family vacations: Ultimate Spider-Man, Crui Ships, Yachts Design, Swim Pools, Palms Trees, Tropical Islands, Ocean View, Heavens, Super Yachts

Take the Ultimate Vacation on Tropical Island Paradise Super yacht

In a securities-based loan, the customer pledges all or part of a portfolio of stocks, bonds, mutual funds and/or other securities as collateral. But unlike traditional margin loans, in which the client uses the credit to buy more securities, the borrowing is for other purchases such as real estate, a boat or education.

The result was “dangerously high margin balances,” said Jeff Sica, president at Morristown, N.J.-based Circle Squared Alternative Investments, which oversees $1.5 billion of mostly alternative investments. He said the products became “the vehicle of choice for investors looking to get cash for anything.” Mr. Sica and others say the products were aggressively marketed to investors by banks and brokerages.

From the Wall Street Journal article: Margin Calls Bite Investors, Banks

Today’s article from the Wall Street Journal on investors taking out large loans backed by portfolios of stocks and bonds is one of the most concerning and troubling finance/economics related articles I have read all year.

Many of you will already be aware of this practice, but many of you will not. In a nutshell, brokers are permitting investors to take out loans of as much as 40% of the value from a portfolio of equities, and up to a terrifying 80% from a bond portfolio. The interest rates are often minuscule, as low as 2%, and since many of these clients are wealthy, the loans are often used to purchase boats and real estate.

lakehouse!: Lake Houses, Dreams Home, Dreams Houses, Lakes Houses, Boats Houses, Boathouse, Garage, Vacations Houses, Dreamhous

At the height of last cycle’s credit insanity, we saw average Americans take out large home loans in order to do renovations, take vacations, etc. While we know how that turned out, there was at least some sense to it. These people obviously didn’t want liquidate their primary residence in order to do these things they couldn’t actually afford, so they borrowed against it.

In the case of these financial assets loans, the investors could easily liquidate parts of their portfolio in order to buy their boats or houses. This is what a normal, functioning sane financial system would look like. Rather, these clients are so starry eyed with financial markets, they can’t bring themselves to sell a single bond or share in order to purchase a luxury item, or second home. Of course, Wall Street is encouraging this behavior, since they can then earn the same amount of fees managing financial assets, while at the same time earning money from the loan taken out against them.

I don’t even want to contemplate the deflationary impact that this practice will have once the cycle turns in earnest. Devastating momentum liquidation is the only thing that comes to mind.

So when you hear about margin loans against stocks, it’s not just to buy more stocks. It’s also to buy “pretty much everything…”

From the Wall Street Journal:

Loans backed by investment portfolios have become a booming business for Wall Street brokerages. Now the bill is coming due—for both the banks and their clients.

Among the largest firms, Morgan Stanley had $25.3 billion in securities-based loans outstanding as of June 30, up 37% from a year earlier. Bank of America, which owns brokerage firm Merrill Lynch, had $38.6 billion in such loans outstanding as of the end of June, up 14.2% from the same period last year. And Wells Fargo & Co. said last month that its wealth unit saw average loans, including these loans and traditional margin loans, jump 16% to $59.3 billion from last year.

In a securities-based loan, the customer pledges all or part of a portfolio of stocks, bonds, mutual funds and/or other securities as collateral. But unlike traditional margin loans, in which the client uses the credit to buy more securities, the borrowing is for other purchases such as real estate, a boat or education.

Securities-based loans surged in the years after the financial crisis as banks retreated from home-equity and other consumer loans. Amid a years long bull market for stocks, the loans offered something for everyone in the equation: Clients kept their portfolios intact, financial advisers continued getting fees based on those assets and banks collected interest revenue from the loans.

This is the reason Wall Street loves these things. You earn on both sides, while making the financial system much more vulnerable. Ring a bell?

The result was “dangerously high margin balances,” said Jeff Sica, president at Morristown, N.J.-based Circle Squared Alternative Investments, which oversees $1.5 billion of mostly alternative investments. He said the products became “the vehicle of choice for investors looking to get cash for anything.” Mr. Sica and others say the products were aggressively marketed to investors by banks and brokerages.

Even before Wednesday’s rally, some banks said they were seeing few margin calls because most portfolios haven’t fallen below key thresholds in relation to loan values.

“When the markets decline, margin calls will rise,” said Shannon Stemm, an analyst at Edward Jones, adding that it is “difficult to quantify” at what point widespread margin calls would occur.

Bank of America’s clients through Merrill Lynch and U.S. Trust are experiencing margin calls, but the numbers vary day to day, according to spokesman for the bank. He added the bank allows Merrill Lynch and U.S. Trust clients to pledge investments in lieu of down payments for mortgages.

Clients may be able to borrow only 40% or less of the value of concentrated stock positions or as much as 80% of a bond portfolio. Interest rates for these loans are relatively low—from about 2% annually on large loans secured by multi million-dollar accounts to around 5% on loans less than $100,000.

80% against a bond portfolio. Yes you read that right. Think about how crazy this is with China now selling treasuries, and U.S. government bonds likely near the end of an almost four decades bull market.  
 

About 18 months ago, he took out a $93,000 loan through Neuberger Berman, collateralized by about $260,000 worth of stocks and bonds, and used the proceeds to buy his share in a three-unit investment property in the Bushwick section of Brooklyn, N.Y. He says that his portfolio, up about 3% since he took out the loan, would need to fall 25% before he would worry about a margin call.

Regulators earlier this year had stepped up their scrutiny of these loans due to their growing popularity at brokerages. The Financial Industry Regulatory Authority put securities-based loans on its so-called watch list for 2015 to get clarity on how securities-based loans are marketed and the risk the loans may pose to clients.

“We’re paying careful attention to this area,” said Susan Axelrod,head of regulatory affairs for Finra.

Beach Vacations

I think the window for “paying close attention” closed several years ago.

All I have to say about this is, good lord.

by Mike Kreiger

America’s Home Buyers Being Targeted as Washington’s ‘Pay-For’ Piggy Bank

Would-be home buyers recently averted a major price hike by the narrowest of margins. No, this potential hike had little to do with the wholesale cost of building materials, the cost of borrowing capital, a scarcity of inventory, or the transaction costs of builders, Realtors or lenders. Rather, the latest proposed tax on new homeowners was designed to cover the cost of maintaining our nation’s bridges and roads.

Wait a second — what, if anything, does highway spending have to do with the cost of a residential mortgage? If you guessed “absolutely nothing at all” you’d be correct. Unless, of course, you happen to be a member of the 114th Congress. In that case, America’s newest class of would-be homeowners represents something similar to years past when homeowners were taxed to cover things like the payroll tax reduction extension.

In the Washington of today — similar to past occasions, the American homeowner is all-too-often referred to as a “pay for.”

In this case, various members of Congress sought an offset for a proposed $47 billion federal highway spending bill.

As crazy as it sounds, the latest unsuccessful home ownership “pay-for” proposal isn’t the first time such a plan has been considered. In fact, if you bought a home after December 2011 with a mortgage purchased by Fannie Mae and Freddie Mac, you’re already paying for much more than the cost of a place to live.

The Temporary Payroll Tax Cut Continuation Act of 2011 — H.R. 3765 of the 112th Congress charged new homeowners an additional 10 basis points in guarantee fee costs over the life of a 30-year mortgage. The proceeds were intended to help cover an increase in a two-month extension of the payroll tax credit and also unemployment compensation payments to long-term unemployed workers for roughly two months, from mid-December 2011 until February 29, 2012.

The law states that loan guarantee fees at Fannie and Freddie will rise “by not less than an average increase of 10 basis points for each origination year or book year above the average fees imposed in 2011 for such guarantees.” This means that an estimated $36 billion in additional fees collected over 10 years will be used to offset $33 billion in up-front costs tallied by a mere eight weeks of payroll tax deductions and unemployment insurance.

Kap / Spain, Cagle Cartoons

Of course none of this has anything to do with the financial health of Fannie Mae and Freddie Mac or the creditworthiness of the individual borrower, but it directly impacts the cost of a new home purchase or refinance. It happened because there’s value in home ownership — value that some congressional leaders think can be taxed for almost anything.

The recent flurry of loan guarantee fee increases at Fannie Mae and Freddie Mac (three times in just over four years) has nothing to do with the risk expected within the overall portfolios of loan business purchased by either of the two mortgage guarantor giants Fannie Mae or Freddie Mac during this time frame. The overall creditworthiness of loan portfolios purchased by both Fannie Mae and Freddie Mac has risen significantly over the last six years. In fact, both GSEs carry loan portfolios with aggregate average FICO scores well in excess of the average American. Yet, loan guarantee fees at Fannie Mae and Freddie Mac have skyrocketed by more than 160 percent over the exact same time period.

One reason for the recent rise in “g-fee” expenses has to do with congressional spending packages brokered by both parties for all sorts of concerns. Add to this equation the simple fact that the GSEs themselves are essentially a government-controlled duopoly, and one can understand exactly how the last six years of guarantee fee hikes came to pass.

Fannie Mae and Freddie Mac both currently operate under federal conservatorship administered by the Federal Housing Finance Agency (FHFA). Now in its 84th consecutive month, this “temporary” conservatorship has continued for almost seven years with no proposed plan for a future model. Freddie Mac declared over $8 billion in profits in 2014 alone. Fannie Mae recently declared profits of $4.6 billion in the brief April-through-June time period of 2Q 2015 by itself. Meanwhile, home buyers, cities, communities and the lenders and real estate agents that support the home ownership market have continued to struggle to recover from the housing financial crisis.

Keep in mind, the true cost of capital for Fannie Mae and Freddie Mac alike, is essentially zero — they are “conservatees” of the federal government. The notion of passing the cost of capital to the consumer, much like a private sector bank would, simply does not apply in the same sense.

The damage that a deliberate yet unwarranted campaign of GSE guarantee fee has done to American home ownership is clear. With wrongheaded policies such as these, it is easy to understand how the U.S. home ownership rate has dropped to the lowest level in almost 50 years.

It bears mentioning that not everyone on Capitol Hill is interested in using your nest egg as their fiscal piggy bank. Various members of Congress from both political parties have stood in unison to say “enough.” Republican Senator Bob Corker of Tennessee recently joined Democratic Senator Mark Warner of Virginia in authoring an open letter to Senate Majority Leader Mitch McConnell (R) and Senate Minority Leader Harry Reid (D) in opposition to the “homes for highways” pay-for gambit.

“Each time guarantee fees are extended, increased or diverted for unrelated spending, homeowners are charged more for their mortgages and taxpayers are exposed to additional risk,” said Senators Corker and Warner. Exactly.

It took a (rare) bipartisan effort led by Senators Corker and Warner to publicly shame Congress into upholding the same measure prohibiting such g-fee “pay-for” deals that they themselves passed only months ago.

It has happened before, and it will undoubtedly happen again. It’s just too easy, and it makes almost everyone happy. Everyone except the unsuspecting homeowner, that is. Various constituent groups get whatever spending item they’re after today, fiscal watchdogs get the satisfaction of knowing that at least someone, somewhere, is on the hook to pay the added cost. The problem is, if you’re in the market to buy a home in the foreseeable future or planning to refinance your existing home loan, that “someone” will most likely be you.

Prospective new homeowners have all sorts of pressing concerns to consider. Strapping the cost of a federal highway spending bill onto their backs by way of artificially inflated loan guarantee fees paid over the life of a 30-year mortgage shouldn’t be one of them.

Read more by Garrick T. Davis in The Huffington Post

Nine Elms: sky pool to be suspended 10-storeys high between two apartment blocks

https://d3llm9uqwxjhoi.cloudfront.net/sites/default/files/430-sky-pool-2_0.jpg
Described as a “world first”, a 90ft-long “sky pool” that floats in the air is the latest show stopper at Nine Elms, the capital’s new riverside district beside Battersea Power Station

A spectacular  glass-encased outdoor swimming pool, suspended 10 storeys up and providing a “bridge” between two apartment blocks with communal rooftop sun terraces, is the latest architectural show stopper at Nine Elms, the riverside district wrapping around Battersea Power Station.

The pool at Embassy Gardens, a 2,000-home complex being built alongside the new American Embassy, is described as a “world first”.

Entirely transparent, it measures 90 feet long by 19 feet wide and is nearly 10 feet deep, with a water depth of about four feet. It is the inspiration of Sean Mulryan, chairman and founder of developer Ballymore. Next month, the group will unveil Legacy Buildings, the second phase of the scheme.

 
https://d3llm9uqwxjhoi.cloudfront.net/sites/default/files/430-sky-pool_0.jpg
 

Using eight-inch-thick glass, the  so-called “sky pool” appears to float in the air and resembles a giant aquarium.

It will be for the private use of residents, who will be able to swim from one building to the next and enjoy a dramatic vista of the Palace of Westminster and the London Eye. The linked sky deck at the top of the two buildings will have a summer bar and sun loungers, a spa and orangery.

read more in homes & property luxury

Pension Funds Sue Big Banks over Manipulation of $12.7 Trillion Treasuries Market

At least two government pension funds have sued major banks, accusing them of manipulating the $12.7 trillion market for U.S. Treasury bonds to drive up profits, thereby costing the funds—and taxpayers—millions of dollars.

As with another case earlier this year, in which major banks were found to have manipulated the London Inter bank Offered Rate (LIBOR), traders are accused of using electronic chat rooms and instant messaging to drive up the price that secondary customers pay for Treasury bonds, then conspiring to drop the price banks pay the government for the bonds, increasing the spread, or profit, for the banks. This also ends up costing taxpayers more to borrow money.

In the latest complaint, the Oklahoma Firefighters Pension and Retirement System is suing Barclays Capital, Deutsche Bank, Goldman Sachs, HSBC Securities, Merrill Lynch, Morgan Stanley, Citigroup and others, according to Courthouse News Service. Last month State-Boston Retirement System (SBRS) filed a similar complaint against 22 banks, many of which are the same defendants in the Oklahoma suit.

“Defendants are expected to be ‘good citizens of the Treasury market’ and compete against each other in the U.S. Treasury Securities markets; however, instead of competing, they have been working together to conclusively manipulate the prices of U.S. Treasury Securities at auction and in the when-issued market, which in turn influences pricing in the secondary market for such securities as well as in markets for U.S. Treasury-Based Instruments,” the Oklahoma complaint states.

The State-Boston suit, which named Bank of America Corp’s Merrill Lynch unit, Citigroup, Credit Suisse Group, Deutsche Bank, Goldman Sachs, HSBC, JPMorgan Chase, UBS and 14 other defendants, makes similar charges.

SBRS uncovered the scheme when it hired economists to analyze Treasury securities price behavior, which pointed to market manipulation by the banks.

“The scheme harmed private investors who paid too much for Treasuries, and it harmed municipalities and corporations because the rates they paid on their own debt were also inflated by the manipulation,” Michael Stocker, a partner at Labaton Sucharow, which represents State-Boston, said in an interview with Reuters. “Even a small manipulation in Treasury rates can result in enormous consequences.”

Both the suits are seeking treble unnamed damages from the financial institutions involved. The LIBOR action earlier this year involved a settlement of $5.5 billion.

The U.S. Justice Department has reportedly launched its own investigation into the alleged Treasury market conspiracy.

by Steve Straehley in allgov.com

To Learn More:

Banks Rigged Treasury Bonds, Class Claims (by Lorraine Baily, Courthouse News Service)

State-Boston Retirement System, on behalf of itself and v. Bank of Nova Scotia (Courthouse News Service)

Lawsuit Accuses 22 Banks of Manipulating U.S. Treasury Auctions (by Jonathan Stempel, Reuters)

Four Banks Guilty of Currency Manipulation but, as Usual, No One’s Going to Jail (by Steve Straehley and Noel Brinkerhoff, AllGov)

7 Million People Haven’t Made A Single StudentLoan.gov Payment In At Least A Year


Perhaps it’s all the talk about across-the-board debt forgiveness or maybe the total amount of outstanding student debt has simply grown so large ($1.3 trillion) that even those with no conception of how much money that actually is realize that it’s simply never going to paid back so there’s no point worrying about, but whatever the case, the general level of concern regarding America’s student debt bubble doesn’t seem to be at all commensurate with the size of the problem. 

And it’s not just the sheer size of the debt pile that’s worrisome. There’s also the knock-on effects, such as delayed household formation and the attendant downward pressure on the home ownership rate, and of course hyperinflation in the rental market. 

Of course one reason no one is panicking – yet – is that the severity of the problem is masked by artificially suppressed delinquency rates. As we’ve documented in excruciating detail, if one excludes loans in deferment and forbearance from the numerator in the delinquency calculation, but includes those loans in the denominator then the delinquency rate will be deceptively low. In any event, as WSJ reports, even if one looks at something very simple like, say, the number of borrowers who haven’t made a payment in a year, the picture is not pretty and it’s getting worse all the time. Here’s more:

Nearly seven million Americans have gone at least a year without making a payment on their federal student loans, a staggering level of default that highlights how student debt continues to burden households despite an improving labor market.

As of July, 6.9 million Americans with student loans hadn’t sent a payment to the government in at least 360 days, quarterly data from the Education Department showed this week. That was up 6%, or 400,000 borrowers, from a year earlier.

The figures translate into about 17% of all borrowers with federal loans being severely delinquent—and that share would be even higher if borrowers currently in school were excluded. Additionally, millions of other borrowers who haven’t hit the 360-day threshold that the government defines as a default are months behind on their payments.

Each new crop of students is experiencing the same problems” with repaying, said Mark Kantrowitz, a higher-education expert and publisher of the information website Edvisors.com. “The entire situation isn’t getting better.”

The development carries big implications for borrowers, taxpayers and the economy. Economists have warned of student-debt defaults damaging borrowers’ credit standing, which would hurt their ability to borrow for things like cars and homes. That in turn would hamper the economy, which relies heavily on consumer purchases for economic activity. Delinquencies also drain government revenues, which are used to make future loans.

So what’s the solution you ask? According to the government, the answer is the income based repayment plans. Here’s The Journal again:

 Education Secretary Arne Duncan said declines [in some categories of delinquencies] resulted from rising participation in income-based repayment plans, which lower borrowers’ monthly bills by tying payments to their incomes. Enrollment in the plans surged 56% over the past year among direct-loan borrowers.

The administration has urgently promoted the plans, mainly through emails to borrowers, over the past two years in an effort to stem defaults. The plans set payments as 10% or 15% of their discretionary income, defined as adjusted gross income minus 150% the federal poverty level.

The plans carry risks, though, for both borrowers and the government. Many borrowers’ payments aren’t enough to cover the interest on their debt, allowing their balances to grow and threatening to trap them under debt for years.

At the same time, the government could be left forgiving huge amounts of debt if borrowers stay in the plans. The government forgives balances after 10, 20 or 25 years of on-time payments, depending on the plan.


But aside from the fact that these plans will cost taxpayers an estimated $39 billion over the next decade – and that’s just counting those expected to enroll in plans going forward and ignoring the $200 billion or so in loans already enrolled in an IBR plan – the most absurd thing about Duncan’s claim is that, as we’ve shown, IBR programs don’t drive down delinquency rates, they just change the meaning of the term “payment”:

See how that works? If you can’t afford to pay, just tell the Department of Education and they’ll enroll you in an IBR plan where your “payments” can be $0 and you won’t be counted as delinquent.

So we suppose we should retract the statement we made above. You are correct Mr. Duncan, these plans are actually very effective at bringing down delinquencies and the method is remarkably straightforward: the government just stopped counting delinquent borrowers as delinquent.

Source: Zero Hedge

Scared Foreign “Smart Money” Sees US Housing as Safe Haven, Pours into Trophy Cities, Drives up Prices

https://i0.wp.com/www.toptennewhomes.com/blog/wp-content/uploads/2012/05/Chinese-Buys-US-Homes.jpgWealthy, very nervous foreigners yanking their money out of their countries while they still can and pouring it into US residential real estate, paying cash, and driving up home prices – that’s the meme. But it’s more than a meme as political and economic risks in key countries surge.

And home prices are being driven up. The median price of all types of homes in July, as the National Association of Realtors (NAR) sees it, jumped 5.6% from a year ago to $234,000, now 1.7% above the totally crazy June 2006 peak of the prior bubble that blew up in such splendid manner. But you can’t even buy a toolshed for that in trophy cities like San Francisco, where the median house price has reached $1.3 million.

And the role of foreign buyers?

[N]ever have so many Chinese quietly moved so much money out of the country at such a fast pace. Nowhere is that Sino capital flight more prevalent than into the US residential real estate market, where billions are rapidly pouring into the American Dream. From New York to Los Angeles, China’s nouveau riche are going on a housing shopping spree.

So begins RealtyTrac’s current Housing News Report.

“For economic and political reasons, Chinese investors want to protect their wealth by diversifying their assets by buying US real estate,” William Yu, an economist at UCLA Anderson Forecast, told RealtyTrac. “The best place for China’s smart money to invest is the United States.”

In the 12-month period ending March 2015, buyers from China have for the first time ever surpassed Canadians as the top foreign buyers, plowing $28.6 billion into US homes, at an average price of $831,800, according to the NAR. In dollar terms, Chinese buyers accounted for 27.5% of the $104 billion that foreign buyers spent on US homes. It spawned a whole industry of specialized Chinese-American brokers.

Political and economic instability in China along with the anti-corruption drive have been growing concerns for wealthy Chinese, Yu said. “China’s real estate market has peaked already. Their housing bubble has popped.”

So they’re hedging their bets to protect their wealth. And more than their wealth….

“China’s economic elites have one foot out the door, and they are ready to flee en masse if the system really begins to crumble,” explained David Shambaugh Professor at George Washington University in Washington, D.C.

China has capital controls in place to prevent this sort of thing for the average guy. But Yu said there are ways for well-connected Chinese to transfer money to the US, particularly those with business relationships in Hong Kong or Taiwan.

But in the overall and immense US housing market, foreign buying isn’t exactly huge. According to NAR, foreign buyers acquired 209,000 homes over the 12-month period, or 4% of existing home sales. But foreign buyers go for the expensive stuff, and in dollar terms, their purchases amounted to 8% of existing home sales.

In most states, offshore money accounts for only 3% or less of total homes sales. But in four states it’s significant: Florida (21%), California (16%), Texas (8%), and Arizona (5%). And in some trophy cities in these states, the percentages are huge.

“On the residential side, Chinese buyers are looking for very specific things,” Alan Lu, owner of ALTC Realty in Alhambra, California, told RealtyTrac. “They are looking for grand houses with large footprints. And they want lots of upgrades. It’s a must. They also like new homes.”

Among California cities that are hot with Chinese investors: Alhambra, Arcadia, Irvine, Monterey Park, San Francisco, San Marino, and in recent years Orange County, “a once heavily white middle-class suburb that is now 40% Asian and becoming increasingly expensive,” according to RealtyTrac:

Buyers from China, including investors from Hong Kong and Taiwan, are driving up prices and fueling new construction in Southern California areas such as Arcadia, a city of 57,000 people with top-notch schools, a large Chinese immigrant community, and a constellation of Chinese businesses.

For example, at a new Irvine, California development Stonegate, where homes are priced at over $1 million, upwards of 80% of the buyers in the new Arcadia development are overseas Chinese, according to Bloomberg….

Similar dynamics are playing out in New York.

“In Manhattan, we estimate that 15% of all transactions are to foreign buyers,” Jonathan Miller, president of New York real estate appraisal firm Miller Samuel Inc., told RealtyTrac. “Luxury real estate is the new global currency,” he said. “Foreigners are putting their cash into a hard asset.” And they see US real estate as “global safe haven.”

And then there’s Florida, where offshore money accounts for 25% of all real estate sales, twice as high as in California, according to a join report by the Florida Realtors and NAR. In 2014, foreigners gobbled up 26,500 properties for $8 billion. Based on data by the Miami Downtown Development Authority, offshore money powered 90% of residential real estate sales in downtown Miami.

In other places it isn’t quite that high….

“About 70% of our buyers are foreign, but recently there’s definitely been a slowdown in the international buyer market,” explained Lisa Miller, owner of Keller Williams Elite Realty in Aventura, Florida. “We still have a large amount of Latin American buyers, but the Russian buyers have dropped off,” she said, pointing at the fiasco in the Ukraine, the plunging ruble, and the sanctions on Russia.

But there’s a little problem:

http://imagesus.homeaway.com/mda01/b831e93e-3e1d-450b-8c4d-89820688907a.1.10

“We have an enormous amount of condo inventory in South Florida,” Miller said. “We have 357 condo towers either going up or planned in South Florida. We have a ton of condo inventory.”

Brazilians are among the top buyers in South Florida’s luxury condo market. “Brazilians like the water,” explained Giovanni Freitas, a broker associate with The Keyes Company in Miami. “They love to shop. They want high-end properties. They also buy the most expensive properties. And they love brand-name products.”

Capital flight accounts for 80% of his Brazilian business, he said; Brazilians are fretting over the economy at home and the left-leaning policies of President Dilma Rousseff. Miami Beach is a magnet for them. For instance, according to NBC, they own nearly half of the condos at the W South Beach.

Other nationalities, including Canadian snowbirds, play a role as well. Even the Japanese. They’re increasingly worried about their government’s dedication to resolving its insurmountable debt problem by crushing the yen. Miyuki Fujiwara, an agent with the Keyes Company in Miami, told RealtyTrac: “Many of my Japanese customers buy two or three condo units at a time.”

by Wolf Street

Why Insider Trading Should Be Legal

wall streetTIVOLI, New York — It’s hot here in the Hudson River Valley.

People are taking it easy, sitting on benches in the shade. We had to put in a window air conditioner to take some of the heat out. Still, we sweat … and we wait for the cool of the evening.

The markets are lackluster, too. A little up, a little down. Languid. Summertime slow.

Counterfeit information

We have been focusing on technology — sometimes directly, often obliquely.

It is the subject of our next monthly issue of The Bill Bonner Letter, requiring us to do some homework with the help of our resident tech expert, Jeff Brown.

But today, let’s look at how the stock market reacts to new technology.

Investors are supposed to look ahead. They are expected to dole out the future earnings of technology stocks and figure out their present value.

Not that they know immediately and to the penny what Twitter or Tesla should be worth, but markets are always discovering prices, based on public information flowing to investors.

The problem is the feds have distorted, twisted, and outright counterfeited this information. They falsified it for the benefit of the people it’s supposed to be protecting us against: the insiders.

The entire edifice of federal regulation and policing is a scam — at least when it comes to the stock market.

First the feds claimed to be creating a “level playing field” by prohibiting “insider trading.”

If you had privileged information — say, as the accountant for a Fortune 500 company, or the lawyer for an upcoming merger — you were supposed to play dead.

“Front-running” — buying or selling in advance of the public release of information — is against the law. And in 1934, Congress set up a special bureaucracy, the Securities Exchange Commission — to enforce it.

Tilting the playing field

But the SEC never leveled the playing field. Instead, it tilted it even more in the insiders’ favor.

Those who knew something were not supposed to take advantage of it, so this information became even more valuable.

That is why so many investors turned to “private equity.” Insiders at private companies — held close to the vest by the investment firms that owned them — could trade on all the inside information they wanted.

The law prohibits insiders from manipulating a publicly traded stock for their benefit.

But there’s an odd exemption for the people who control a public company. General Motors announces a share buyback plan, for example. It will spend $5 billion to buy back its shares in the open market and then cancel them. This raises the earnings per share of the outstanding shares, making them more valuable as a result.

Why would an automaker — recently back from the dead, thanks to a handout from the feds — take its precious capital and give it to management (in the form of more valuable stock options) and shareholders (in the form of higher stock prices)?

There you have your answer: GE execs and their insider shareholders (mostly hedge funds) joined forces to manipulate the stock upward and give themselves a big payday.

Reports the Harvard Business Review:

quote

‘A little coup de whiskey’

Here at the Diary, we disagree …

The feds should not ban share buybacks. Instead, insider trading should be legal for everyone.

And the feds shouldn’t bail out the insiders, either. The government bailed out GM to the tune of $50 billion in return for a 61% equity stake in the company.

gm general motors

But at the end of 2013, Washington was able to sell off the last of its GM shares … for “just” an $11 billion loss.

How?

The Fed fiddled with stock market prices … by pushing down the so-called “risk-free” rate on bonds. A lower rate means less opportunity cost for stock market investors.

Just look at the valuations of today’s tech companies. They’re over the top, much like they were at the peak of the dot-com bubble in 2000. They are driven to extraordinary levels not by a prudent calculation of anticipated earnings but by the Fed’s EZ money regime.

This conclusion, by the way, was buttressed by our look at the automakers of 100 years ago.

Now, there was a game-changing industry!

It was so promising and so crowded with new entrants that you could barely walk down Shelby Street in Detroit without getting run over by an automobile you’d never heard of.

Most of those companies went broke within a few years. A few, however, prospered.

GM’s share price barely budged between 1915 and 1925 — when the company was one of the greatest success stories of the greatest new tech industry the world had ever seen.

But then, in 1927, the influential New York Fed President Benjamin Strong gave the market “a little coup de whiskey.”

The Fed not only bought $445 million of government bonds, resulting in the biggest increase in bank reserves the US had ever seen, but it also cut its key lending rate from 4% to 3.5%.

After that, it was off to the races! GM shares rose 2,200%.

In other words, the prices of “tech” stocks were manipulated then, as now, by the feds.

Cheap credit — not an honest calculation of anticipated earnings — is what sent GM soaring in the late 1920s.

And it is why our billion-dollar tech babies are flying so high today.

New Cars Could Limit Mortgage Options

Could that shiny new car you just financed with a big dealer loan or lease put a damper on your ability to refinance your mortgage or move to a different house? Could your growing debt — for autos, student loans and credit cards — make it tougher to come up with all the monthly payments you owe? Absolutely.

And some mortgage and credit analysts are beginning to cast a wary eye on the prodigious amounts of debt American homeowners are piling up. New research from Black Knight Financial Services, an analytics and technology company focused on the mortgage industry, reveals that homeowners’ non-mortgage debt has hit its highest level in 10 years.

New debt taken on to finance autos accounted for 81 percent of the increase — a direct consequence of booming car sales and attractive loan deals. The average transaction price of a new car or pickup truck in April was $33,560, according to Kelley Blue Book researchers.

Student-loan debt is also contributing to strains on owners’ budgets. Balances are up more than 55 percent since 2006.Credit-card debt is another factor, but it has not mushroomed like auto and student loans have. Nonetheless, homeowners carrying balances on their cards owe an average $8,684, according to Black Knight data.The jump in non-mortgage debt is especially noteworthy among owners with Federal Housing Administration and Veterans Affairs home loans. These borrowers — who typically have lower credit scores and make minimal down payments (as little as 3.5 percent for FHA, zero for VA) — now carry non-mortgage debt loads that average $29,415. By contrast, borrowers using conventional Fannie Mae and Freddie Mac financing have significantly lower debt loads — an average $22,414 — but typically have much higher credit scores and have made larger down payments.

Is there reason for concern? Bruce McClary, vice president at the National Foundation for Credit Counseling, thinks there could be if the pattern continues.

Some people have lost sight of the ground rules for responsible credit and are “pushing the boundaries,” he said.

Auto costs — monthly loan payments plus fuel and maintenance — shouldn’t exceed

15 to 20 percent of household income, he said. Yet some people who already have debt-strained budgets are buying new cars with easy-to-obtain dealer financing that knocks them well beyond prudent guidelines.

According to a recent study by credit bureau Equifax, total outstanding balances for auto loans and leases surged by

10.5 percent during the past 12 months. Of all auto loans originated through April, 23.5 percent were made to consumers with subprime credit scores.

Ben Graboske, senior vice president for data and analytics at Black Knight Financial Services, cautions that although rising debt loads might look ominous, there is no evidence that more borrowers are missing mortgage payments or heading for default. Thanks to rising home-equity holdings and improvements in employment, 30-day delinquencies on mortgages are just 2.3 percent, he said, the same level as they were in 2005, before the housing crisis. Even FHA delinquencies are relatively low at 4.53 percent.

But Graboske agrees that other consequences of high debt totals could limit homeowners’ financial options: They “are going to have less wiggle room” in refinancing their current mortgages or obtaining a new mortgage to buy another house.

Why?

Because debt-to-income ratios are a crucial part of mortgage underwriting and are stricter and less flexible than they were a decade ago. The more auto, student-loan and credit-card debt you have along with other recurring expenses such as alimony and child support, the tougher it will be to refinance or get a new home loan.

If your total monthly debt for mortgage and other obligations exceeds 45 percent of your monthly income, lenders who sell their mortgages to giant investors Fannie Mae and Freddie Mac could reject your application for a refinancing or new mortgage, absent strong compensating factors such as exceptional credit scores and substantial cash or investments in reserve. FHA is more flexible but generally doesn’t want to see debt levels above 50 percent.

Bottom line: Before signing up for a hefty loan on a new car, take a hard, sober look at the effect it will have on your debt-to-income ratio. When it comes to what Graboske calls your mortgage wiggle room, less debt, not more, might be the way to go.

Read more in The Columbus Dispatch where author Kenneth R. Harney covers housing issues on Capitol Hill for the Washington Post Writers Group. kenharney@earthlink.net

House Prices In ‘Gayborhoods’ Have Soared 20% In Three Years

Commercial Street in Provincetown on Cape Cod.

Gay Americans can take pride in these house prices.

Over the last three years, home prices in neighborhoods popular with cohabiting, married or partnered gay men have grown by an average of 23%, according to research by the real-estate website Trulia. Similarly, prices have risen in neighborhoods that are popular with cohabiting, married or partnered gay women — by an average of 18%. “In honor of Gay Pride this year [the last weekend in June in many U.S. cities], we wanted to revisit these neighborhoods and find out what’s changed,” says Trulia housing economist Ralph McLaughlin.

Among the areas characterized as male “gayborhoods,” prices rocketed 65% to $260 per square foot in the 92262 ZIP Code of Palm Springs, Calif., between 2012 and 2015 and rose 47% to $768 in the 94131 ZIP Code, which comprises the Noe Valley, Glen Park and Diamond Heights neighborhoods of San Francisco. One theory: “If you are not raising children, you have two male incomes and have more money to devote to improve their home environment,” says Gary Gates, a demographer and research director of the Williams Institute for Sexual Orientation Law and Public Policy at the University of California.

Among neighborhoods popular with lesbians, prices rose 64% to $389 per square foot in the Redwood Heights/Skyline area of Oakland, Calif.

Many of these neighborhoods are in metro areas that have also experienced sharp price gains. But housing in almost all of the so-called gayborhoods was more expensive than in nearby sections, Trulia found. Homes in the Castro neighborhood of San Francisco cost $948 per square foot, which is 34% more expensive than the San Francisco metro area as a whole, while West Hollywood, Calif., and Provincetown, Mass., are 123% and 119% more expensive, respectively. Guerneville, Calif., was the only area less expensive than its wider metro-area comparable, but only by 2%.

Where gay men’s neighborhoods are getting more expensive
ZIP Code and city Median price per sq. foot, June 2012 Median price per sq. foot, June 2015 % change in price per sq. foot, June 2012–June 2015
92262: Palm Springs, Calif. $158 $260 65%
94131: Noe Valley/Glen Park/Diamond Heights, San Francisco $522 $768 47%
92264: Palm Springs, Calif. $174 $240 38%
48069: Pleasant Ridge, suburban Detroit $137 $188 37%
94114: Castro, San Francisco $699 $948 36%
90069: West Hollywood, Los Angeles $611 $802 31%
75219: Oak Lawn, Dallas $185 $225 22%
33305: Wilton Manors, Fort Lauderdale, Fla. $249 $292 17%
19971: Rehoboth Beach, Del. $193 $203 5%
02657: Provincetown, Cape Cod, Mass. $604 $616 2%
Average for all gay men’s neighborhoods $188 $238 23%
Note: Only ZIP Codes with at least 1,000 persons are included in the analysis. Average growth rate is weighted by number of gay households, so the listed percentage increase is different than the simple percentage change between average price per foot in 2012 and 2015. Data in this report are different from our report in June 2012 because of new MSA definitions and observed time period of listings (month vs. previous year in the June 2012 report)

Using the 2010 Census, McLaughlin calculated the share of households with same-sex couples in every ZIP Code. Focusing on the top 10 among these ZIP Codes, he then calculated the median price per foot of homes for sale in each ZIP Code on Trulia as of June 1, 2015, and compared it with June 1, 2012. He excluded neighborhoods with populations of less than 1,000. Gayborhoods are defined in the census as those with the highest proportion of same-sex cohabiting couples. (The census doesn’t measure sexual orientation.)

Why the discrepancy in price growth between the two? “The top gay-men neighborhoods are places where prices were already high relative to their metros and were not hit as hard during the housing crash as other less expensive neighborhoods,” McLaughlin says. Gay female couples are more than twice as likely to have children as are gay male couples, he adds, “so it could be that gay women seek up-and-coming neighborhoods with good schools to raise their children.”

Many of the neighborhoods on the list of gayborhoods are also places where people are less likely to have children, Gates says. “This survey is picking up neighborhoods where proportionally, fewer households have children in them,” Gates says. “This survey could be picking up a very practical economic reality.” Wellfleet and Provincetown, both on Cape Cod in Massachusetts; Rehoboth Beach, Del.; and Palm Springs are also popular among retirement communities, he says. “The Castro in San Francisco, while popular with both gay men and lesbians, is not high for child-friendly amenities for families,” he says.

Where gay women’s neighborhoods are getting more expensive
ZIP Code and city Median price per sq. foot, June 2012 Median price per sq. foot, June 2015 % change in price per sq. foot, June 2012–June 2015
94619: Redwood Heights/Skyline, Oakland, Calif. $237 $389 64%
30002: Avondale Estates, suburban Atlanta $114 $173 52%
02130: Jamaica Plain, Boston $303 $414 37%
94114: Castro, San Francisco $699 $948 36%
95446: Guerneville, north of San Francisco $270 $335 24%
01060: Northampton, Mass. $197 $216 10%
19971: Rehoboth Beach, Del. $193 $203 5%
01062: Northampton, Mass. $190 $196 3%
02657: Provincetown, Cape Cod, Mass. $604 $616 2%
02667: Wellfleet, Cape Cod, Mass. $326 $323 -1%
Average for all gay women’s neighborhoods $133 $157 18%
Note: Only ZIP Codes with at least 1,000 persons are included in the analysis. Average growth rate is weighted by number of gay households, so the listed percentage increase is different than the simple percentage change between average price per foot in 2012 and 2015. Data in this report are different from our report in June 2012 because of new MSA definitions and observed time period of listings (month vs. previous year in the June 2012 report)

There are other possible limitations to house-price rises within a gayborhood. A neighborhood may need to be “socially liberal” for an increase in same-sex households to increase house prices, a 2011 study by researchers at Konkuk University in Seoul and Tulane University in New Orleans found. They looked at Columbus, Ohio, and, adjusting for factors such as housing, crime and school quality, analyzed house prices with how residents voted in a 2004 ballot initiative on the Defense of Marriage Act. They found a “positive and significant” impact on prices, but only in more liberal locales.

Diversity is good for the economic development of cities and housing prices, according to Richard Florida, an urban theorist and author of “The Rise of the Creative Class: And How It’s Transforming Work, Leisure, Community, and Everyday Life,” a book that was republished last year a decade after it was first released.

Florida found that high-tech hot spots followed the locational patterns of gay people. Other measures he created, such as the Bohemian Index, which measured the prevalence of artists, writers and performers, had similar results. “Artistic and gay populations,” he wrote, “cluster in communities that value open-mindedness and self-expression.”

By Quentin Fottrell. Read more in Market Watch

Welcome To The Revenue Recession


The “Revenue Recession” is alive and well, at least when it comes to the 30 companies of the Dow Jones Industrial Average. 

Every month we look at what brokerage analysts have in their financial models in terms of expected sales growth for the Dow constituents.  This year hasn’t been pretty, with Q1 down an average of 0.8% from last year and Q2 to be down 3.5% (WMT and HD still need to report to finish out the quarter).  The hits keep coming in Q3, down an expected 4.0% (1.4% less energy) and Q4 down 1.8% (flat less energy). 

The good news is that if markets discount 2 quarters ahead, we should be through the rough patch because Q1 2015 analyst numbers call for 1.9% sales growth, with or without the energy names of the Dow. The bad news is that analysts tend to be too optimistic: back in Q3 last year they thought Q2 2015 would be +2%, and that didn’t work out too well. 

Overall, the lack of revenue growth combined with full equity valuations (unless you think +17x is cheap) is all you need to know about the current market churn. And why it will likely continue.

The most successful guy I’ve ever worked for – and he has the billions to prove it – had the simplest mantra: “Don’t make things harder than they have to be”.  In the spirit of that sentiment, consider a simple question: which Dow stocks have done the best and worst this year, and why?  Here’s the answer:

The three best performing names are UnitedHealth (+19.3%), Visa (+18.2%) and Disney (14.2%).

The worst three names are Dupont (-28.3%), Chevron (-23.5%) and Wal-Mart (-16.0%).

Now, consider the old market aphorism that “Markets discount two quarters ahead” (remember, we’re keeping this simple).   What are analysts expecting for revenue growth in Q3 and Q4 that might have encouraged investors to reprice these stocks higher in the first 7 months of the year?


For the three best performing stocks, analysts expect second half revenues to climb an average of 14.1% versus last year. 

And for the worst three?  How about -22.1%. Don’t make things harder than they have to be.

That, in a nutshell, is why we look at the expected revenue growth for the 30 companies of the Dow every month.  Even though earnings and interest rates ultimately drive asset prices, revenues are the headwaters of the cash flow stream.  They also have the benefit of being easier for an analyst to quality control than earnings.  Not easy, mind you – just easier.  Units, price and mix are the only three drivers of revenues you have to worry about.  When those increase profitably the rest of the income statement – including the bottom line – tends to take care of itself.  

By both performance and revenue growth measures, 2015 has been tough on the Dow. It is the only one of the three major U.S. “Indexes” to be down on the year, with a 2.3% decline versus  +1.2% for the S&P 500 and +6.3% for the NASDAQ.  Ten names out of the 30 are lower by 10% or more, or a full 33%.  By comparison, we count 107 stocks in the S&P 500 that are lower by 10% or greater, or only 21% of that index.  

Looking at the average revenue growth for the Dow names tells a large part of the story, for the last time the Average enjoyed positive top line momentum was Q3 2014 and the next time brokerage analysts expect actual growth isn’t until Q1 2016. The two largest problems are well understood: declining oil and other commodity prices along with an increase in the value of the dollar. For a brief period there was some hope that declining energy company revenues would migrate to other companies’ top lines as consumers spent their energy savings elsewhere.  That, of course, didn’t quite work out.  

Still, we are at the crosswords of what could be a turn back to positive growth in 2016. Here’s how Street analysts currently expect that to play out:

At the moment, Wall Street analysts that cover the companies of the Dow expect Q3 2015 to be the trough quarter for revenue growth for the year.  On average, they expect the typical Dow name to print a 4.0% decline in revenues versus last year.  Exclude financials, and the comp gets a little worse: 4.4%.  Take out the 2 energy names, and the expected comp is still negative to the tune of 1.5%.

Things get a little better in Q4, presumably because we start to anniversary the declines in oil prices as well as the strength of the dollar.  These both began to kick in during Q4 2014, and as the old Wall Street adage goes “Don’t sweat a bad quarter – it just makes next year’s comp that much easier”.  That’s why analysts are looking for an average of -1.8% revenue comps for Q4, and essentially flat (-0.01%) when you take out the Dow’s energy names.

Go all the way out to Q1 2016, and analysts expect revenue growth to finally turn positive: 1.9% versus Q1 2015, whether you’re talking about the whole Average or excluding the energy names Better still, analysts are showing expected revenue growth for all of 2016 at 4.1%.  OK, that’s probably overly optimistic unless the dollar weakens next year.  But after 2015, even 1-3% growth would be welcome.

We’re still keeping it simple, so let’s wrap up.  What ails the Dow names also hamstrings the U.S. equity market as whole.  We need better revenue growth than the negative comps we’ve talked about here or the flattish top line progressions of the S&P 500 to get stocks moving again. The third quarter seems unlikely to provide much relief.  On a more optimistic note, our chances improve in Q4 and even more so in Q1 2016. Until we see the U.S. economy accelerate and/or the dollar weaken and/or oil prices stabilize, the chance that investors will pay even higher multiples for stagnant earnings appears remote.  That’s a recipe for more volatility – potentially a lot more.

Via Zero Hedge … Via ConvergEx’s Nick Colas

GUNDLACH: If oil goes to $40 a barrel something is ‘very, very wrong with the world’

Jeffrey Gundlach

Jeff Gundlach – bond trader

West Texas Intermediate crude oil is at a 6-year low of $43 a barrel. 

And back in December 2014, “Bond King” Jeff Gundlach had a serious warning for the world if oil prices got to $40 a barrel.

“I hope it does not go to $40,” Gundlach said in a presentation, “because then something is very, very wrong with the world, not just the economy. The geopolitical consequences could be — to put it bluntly — terrifying.”

Writing in The Telegraph last week, Ambrose Evans-Pritchard noted that with Brent crude oil prices — the international benchmark — below $50 a barrel, only Norway’s government is bringing in enough revenue to balance their budget this year. 

And so in addition to the potential global instability created by low oil prices, Gundlach added that, “If oil falls to around $40 a barrel then I think the yield on ten year Treasury note is going to 1%.” The 10-year note, for its part, closed near 2.14% on Tuesday. 

On December 9, 2014, WTI was trading near $65 a barrel and Gundlach said oil looked like it was going lower, quipping that oil would find a bottom when it starts going up. 

WTI eventually bottomed at $43 in mid-March and spend most all of the spring and early summer trading near $60. 

On Tuesday, WTI hit a fresh 6-year low, plunging more than 4% and trading below $43 a barrel. 

WTI

In the last month, crude and the entire commodity complex have rolled over again as the market battles oversupply and a Chinese economy that is slowing.

And all this as the Federal Reserve makes noise about raising interest rates, having some in the market asking if these external factors — what the Fed would call “exogenous” factors — will stop the Fed from changing its interest rate policy for the first time in over almost 7 years. 

In an afternoon email, Russ Certo, a rate strategist at Brean Capital, highlighted Gundlach’s comments and said that the linkages between the run-up, and now collapse, in commodity prices since the financial crisis have made, quite simply, for an extremely complex market environment right now. 

“There is a global de-leveraging occurring in front of our eyes,” Certo wrote. “And, I suppose, the smart folks will determine the exact causes and translate what that means for FUTURE investment thesis. Today it may not matter other than accurately anticipating a myriad of global price movements in relation to each other.”

CRB commodity price index

Why U.S. Oil Production Remains High While Prices Tank – Bakken Update

Summary

  • US production remains high due to high-grading, well design, cost efficiencies, and lower oil service contracts.
  • High-grading from marginal to core areas can increase per well production from 200% to 500% depending on area, which means one core well can equate to several marginal producers.
  • Shorter stages, increased proppant and frac fluids increase production and flatten the depletion curve.
  • EOG’s work in Antelope field provides a framework for other operators to increase production while completing fewer wells.
  • Few operators are currently developing Mega-fracs, this provides significant upside to US shale production as others start producing more resource per foot.
by Michael Filloon, Split Rock Private Trading and Wealth Management

US Oil production remains at volumes seen when WTI was at $100/bbl. Many analysts believed operators couldn’t survive, but $60/bbl may be good enough for operators to drill economic wells. Oil prices have decreased significantly, and the US Oil ETF (NYSEARCA:USO) with it. Many were wrong about US production, and the belief $60/bbl oil would decrease US production. Although completions have been deferred, high-grading and mega-fracs have made up for fewer producing wells. When calculating US production going forward, it is important to account for the number of new completions. If more wells are completed, the higher the influx of production should be. We are finding the quality of geology and well design have a greater effect on total production than originally thought.

(click to enlarge)

(Source: Shaletrader.com)

There are several factors influencing US production. Operators have moved existing rigs to core areas. This decreases its ability getting acreage held by production. In the Bakken, rigs have moved near the Nesson Anticline.

In the Eagle Ford, Karnes seems to be the area of interest. Midland County in the Permian has also been attractive. Operators have decided to complete wells with better geology. When an operator completes wells in core acreage versus marginal leasehold, we see increased production per location. This is just part of the reason US production remains high.

The average investor does not understand the significance. Most think wells have like production, but areas are much different. When oil was at a $100/bbl, it allowed operators to get acreage held by production, although payback times were not as good. Marginal acreage was more attractive, even at lower IRRs. Operators have a significant investment in acreage, and do not want to lose it. Because of this, many would operate in the red expecting future rewards. Just because E&Ps lose money, does not mean the business isn’t economic. It is the way business is done in the short term as oil is an income stream. Wells produce for 35 to 40 years, and once well costs are paid back there are steady revenues. Changes in oil prices have changed this, as now operators will have to focus on better acreage.

Re-fracs are starting to influence production. Although most operators have not begun programs, interest is high. Re-fracs may not be a game changer, but could be an excellent way to increase production at a lower cost. This is not as significant with well designs of today, but older designs left a significant amount of resource. More importantly, when operators began, it was drilling the best acreage. Archaic well designs could leave some stages completely untouched. Current seismic can now identify this, and provide for a better re-frac. We expect to see some very good results in 2016. In conjunction with high-grading, well design continues to be the main reason production has maintained. Changes to well design have been significant, and the resulting production increases much better than anticipated.

No operator is better than EOG Resources (NYSE:EOG) at well design. From the Bakken, to the Eagle Ford and Permian it continues to outperform the competition.

The following map courtesy of ShaleMapsPro.com does a good job of illustrating EOG’s exposure in the Eagle Ford.

EagleFord.SeekingAlpha

(Source: Shalemapspro.com)

EOG’s focusing of frac jobs closer to the well bore has provided for much better source rock stimulation (fraccing). Since more fractures are created, there is a greater void in the shale. This means more producing rock has contact with the well. EOG continues to push more sand and fluids in the attempt to recover more resource per foot. To evaluate production, it must be broken into days over 6 to 12 months. To evaluate well design, locations must be close to one another and by the same operator. This consistency allows us to see advantages to well design changes. Lastly, we compare marginal acreage it is no longer working to the high-grading program. This is how operators are spending less and producing more.

EOG is working in the Antelope field of northeast McKenzie County. This is Bakken core acreage and considered excellent in both the middle Bakken and upper Three Forks.

(click to enlarge)
(Source: Welldatabase.com)

The center of the above map is the location of both its Riverview and Hawkeye wells. These six wells are located in two adjacent sections. The pad is just west of New Town in North Dakota. Riverview 100-3031H was completed in 6/12. It is an upper Three Forks well. 39 stages were used on an approximate 9000 foot lateral. 5.7 million pounds of sand were used with 85000 barrels of fluids.

(click to enlarge)
(Source: Welldatabase.com)

Date Oil (BBL) Gas ((NYSEMKT:MCF)) BOE
6/1/2012 4,384.00 3,972.00 3972
7/1/2012 27,133.00 15,337.00 15337
8/1/2012 24,465.00 17,223.00 17223
9/1/2012 21,457.00 9,190.00 9190
10/1/2012 18,040.00 12,601.00 12601
11/1/2012 19,924.00 13,366.00 13366
12/1/2012 28,134.00 22,259.00 22259
1/1/2013 15,382.00 12,661.00 12661
2/1/2013 3,429.00 2,451.00 2451
3/1/2013 15,242.00 22,774.00 22774
4/1/2013 15,761.00 8,479.00 8479
5/1/2013 13,786.00 18,372.00 18372
6/1/2013 14,485.00 18,555.00 18555
7/1/2013 15,668.00 27,250.00 27250
8/1/2013 12,084.00 23,876.00 23876
9/1/2013 13,841.00 46,815.00 46815
10/1/2013 11,388.00 45,800.00 45800
11/1/2013 2,711.00 10,533.00 10533
12/1/2013 0 0 0
1/1/2014 5,953.00 35 35
2/1/2014 11,368.00 20,851.00 20851
3/1/2014 8,784.00 11,179.00 11179
4/1/2014 5,607.00 8,479.00 8479
5/1/2014 4,727.00 5,663.00 5663
6/1/2014 8,359.00 12,726.00 12726
7/1/2014 8,799.00 22,957.00 22957
8/1/2014 7,958.00 31,621.00 31621
9/1/2014 7,218.00 44,318.00 44318
10/1/2014 3,778.00 14,058.00 14058
11/1/2014 3,701.00 9,951.00 9951
12/1/2014 6,612.00 18,435.00 18435
1/1/2015 6,181.00 24,142.00 24142
2/1/2015 3,517.00 10,722.00 10722
3/1/2015 5,218.00 24,175.00 24175
4/1/2015 4,275.00 24,233.00 24233

(Source: Welldatabase.com)

Riverview 100-3031H was a progressive well design for 2012. It produced well. To date it has produced 379 thousand bbls of crude and 615 thousand Mcf of natural gas. This equates to $24 million in revenues. Over the first 360 days (using the true number of production days) it produced 240,036 bbls of crude. The month of December 2013, this well was shut in for the completion of an adjacent well. There was a return to production but no significant jump in production from pressure generated by the new locations. This well declined 42% over 12 months. This is much lower than estimates shown through other well models. The next year we see a 35% decline. 10 months later we see an additional decline of approximately 55%. The decline curve of a well is very specific to geology and well design. Keep in mind averages are just that, and do not provide specific data. These averages should not be used to evaluation acreage and operator as there are wide average swings. Also, averages are generally over a long time frame. Production in the Bakken began in 2004 (first horizontal well completed). Wells in 2004 produce nothing like wells today. Updated averages based on year (IP 360) are more useful. Riverview 100-3031H was part of a two well pad. A middle Bakken well was also completed.

Riverview 4-3031H began producing a month after Riverview 100-3031H. It was a 38 stage 9000 foot lateral. 4.3 million lbs of sand were used and 69000 bbls of fluids.

(click to enlarge)
(Source: Welldatabase.com)

The Riverview and Hawkeye wells analyzed in this article were drilled in a southern fashion.

Date Oil Gas BOE
7/1/2012 20,529.00 12,537.00 12537
8/1/2012 16,553.00 16,903.00 16903
9/1/2012 17,096.00 10,148.00 10148
10/1/2012 23,197.00 17,914.00 17914
11/1/2012 20,122.00 14,402.00 14402
12/1/2012 27,340.00 33,217.00 33217
1/1/2013 16,044.00 24,394.00 24394
2/1/2013 4,267.00 4,946.00 4946
3/1/2013 27,516.00 26,219.00 26219
4/1/2013 20,792.00 7,940.00 7940
5/1/2013 17,516.00 35,948.00 35948
6/1/2013 15,457.00 50,500.00 50500
7/1/2013 13,480.00 50,807.00 50807
8/1/2013 11,254.00 42,300.00 42300
9/1/2013 9,319.00 40,341.00 40341
10/1/2013 8,559.00 33,116.00 33116
11/1/2013 2,190.00 40 40
12/1/2013 0 0 0
1/1/2014 1,124.00 11 11
2/1/2014 5,271.00 81 81
3/1/2014 8,931.00 9,827.00 9827
4/1/2014 5,469.00 7,940.00 7940
5/1/2014 4,807.00 5,748.00 5748
6/1/2014 8,522.00 13,819.00 13819
7/1/2014 7,982.00 17,983.00 17983
8/1/2014 7,169.00 26,755.00 26755
9/1/2014 5,750.00 22,586.00 22586
10/1/2014 1,349.00 3,194.00 3194
11/1/2014 6,495.00 15,947.00 15947
12/1/2014 6,442.00 18,806.00 18806
1/1/2015 5,840.00 22,126.00 22126
2/1/2015 4,171.00 18,682.00 18682
3/1/2015 4,221.00 18,539.00 18539
4/1/2015 3,878.00 19,725.00 19725

(Source: Welldatabase.com)

Riverview 4-3031H has produced 361 thousand bbls of crude and 657 thousand Mcf of natural gas. It under produced Riverview 100-3031H, but this is consistent with well design. 360 day production totaled 237,735 bbls of oil. We do not know if the Three Forks is a better pay zone than the middle Bakken as the well design was not consistent. Most operators have reported better results from the middle Bakken. The Three Forks well used one more stage (less feet per stage should mean better fracturing). It also used significantly more sand and fluids. Either way both wells were good results. Riverview 4-3031H only declined approximately 36% in a comparison of the first month to month 12. This was 7% better than 100-3031H. It declined another 41% in year two on a month to month comparison. This was 6% greater. 56% was seen when compared to adjusted production for 5/15. The Three Forks well declines slower in later production than 4-3031H. This may be due to well design. The well with more stages, proppant and fluids continues to out produce the Bakken well. It is possible the source rock is better. There are many other variables to look at, but this data provides why EOG continues to push ahead with more complex locations.

In September of 2012, EOG drilled its next well in this area. Hawkeye 100-2501H is a 13700 foot lateral targeting the upper Three Forks. It is a 47 stage frac. 14 million pounds of sand were used with 158000 bbls of fluids.

(click to enlarge)
(Source: Welldatabase.com)

Of the three pads, this well is located in the center. It was an interesting design, given the length of the lateral.

Date Oil Gas BOE
9/1/2012 21,959.00 444 444
10/1/2012 54,927.00 155 155
11/1/2012 47,557.00 57,300.00 57300
12/1/2012 55,367.00 92,144.00 92144
1/1/2013 33,396.00 55,877.00 55877
2/1/2013 22,100.00 32,810.00 32810
3/1/2013 36,631.00 57,544.00 57544
4/1/2013 29,075.00 32,696.00 32696
5/1/2013 22,210.00 33,351.00 33351
6/1/2013 17,544.00 25,794.00 25794
7/1/2013 15,872.00 23,600.00 23600
8/1/2013 19,647.00 28,746.00 28746
9/1/2013 15,486.00 22,352.00 22352
10/1/2013 21,325.00 31,678.00 31678
11/1/2013 6,418.00 9,214.00 9214
12/1/2013 0 0 0
1/1/2014 0 0 0
2/1/2014 0 0 0
3/1/2014 29,699.00 23,822.00 23822
4/1/2014 39,782.00 32,696.00 32696
5/1/2014 35,267.00 61,543.00 61543
6/1/2014 27,554.00 49,551.00 49551
7/1/2014 7,229.00 12,565.00 12565
8/1/2014 31,155.00 98,086.00 98086
9/1/2014 12,617.00 32,742.00 32742
10/1/2014 2 4 4
11/1/2014 7,769.00 15,996.00 15996
12/1/2014 15,487.00 49,147.00 49147
1/1/2015 4,427.00 9,918.00 9918
2/1/2015 9,344.00 20,654.00 20654
3/1/2015 8,459.00 25,171.00 25171
4/1/2015 7,235.00 24,752.00 24752

(Source: Welldatabase.com)

Hawkeye 100-2501H had some excellent early production numbers. From that perspective, it is one of the best wells to date in the Bakken. It has already produced 655,000 bbls of crude and 960,000 Mcf of natural gas. It has revenues in excess of $42 million to date. This includes roughly four non-producing or unproductive months. Crude production over the first 360 days was 389,835 bbls. Over the first 12 months, this well produced crude revenues in excess of $23 million. Decline rates were higher, as the first full month of production declined 65% over the first year. This isn’t important as early production rates were some of the highest seen in North Dakota. It is important to note, decline rates are emphasized but higher pressured wells may deplete faster depending on choke and how quickly production is propelled up and out of the wellbore. Any well that produces very well initially will have higher decline rates, but this does not lessen the value of the well. This specific well is depleting faster, but no one is complaining about payback times well under a year. Decline rates decrease significantly in year two at 11%. This well saw a marked increase in production when adjacent wells were turned to sales. The additional pressure associated with well communication increased production from 20,000 bbls/month to 35,000 bbls/month on average. This occurred over a 6 month period.

(click to enlarge)
(Source: Welldatabase.com)

Hawkeye 102-2501H was the fourth completion. This 14,000 foot 62 stage lateral targeted the upper Three Forks. It used 14.5 million pounds of sand and 164,000 bbls of fluids.

Date Oil Gas BOE
1/1/2013 18,486.00 41 41
2/1/2013 27,120.00 8,705.00 8705
3/1/2013 39,702.00 15,748.00 15748
4/1/2013 17,714.00 30,501.00 30501
5/1/2013 41,368.00 57,489.00 57489
6/1/2013 26,602.00 34,399.00 34399
7/1/2013 0 0 0
8/1/2013 133 0 0
9/1/2013 0 0 0
10/1/2013 0 0 0
11/1/2013 0 0 0
12/1/2013 0 0 0
1/1/2014 5,163.00 6,403.00 6403
2/1/2014 41,917.00 74,353.00 74353
3/1/2014 36,439.00 18,111.00 18111
4/1/2014 19,477.00 30,501.00 30501
5/1/2014 26,388.00 43,071.00 43071
6/1/2014 27,480.00 49,456.00 49456
7/1/2014 14,529.00 33,072.00 33072
8/1/2014 24,542.00 62,753.00 62753
9/1/2014 17,613.00 53,460.00 53460
10/1/2014 17,451.00 66,544.00 66544
11/1/2014 9,634.00 33,366.00 33366
12/1/2014 16,338.00 76,547.00 76547
1/1/2015 11,450.00 65,277.00 65277
2/1/2015 8,971.00 50,919.00 50919
3/1/2015 3,177.00 14,820.00 14820
4/1/2015 6,495.00 13,616.00 13616

(Source: Welldatabase.com)

It has produced 458,000 bbls of crude and 839,000 Mcf to date. This equates to roughly $30 million over well life. 360 day production was 394,673 bbls of crude. Production was interesting as initial production was outstanding. The big production numbers were hindered as many of the early months had missed production days. We don’t know if there were production problems, but do know the well was shut when adjacent wells were turned to sales. Production was over 1000 bbls/d over the first six months. It was shut in for another six months. After this production jumped, but this is misleading. Given the fewer days of production per month, there wasn’t much of an increase when the new wells were turned to sales. The decline over the first year on a monthly basis is 20%. The second year is much greater at 80%. We have seen recent production decrease significantly, and is something to watch. Lower decline rates initially are more important. This is because production rates are higher. It equates to greater total production.

Hawkeye 01-2501H was completed in January of 2013.

(click to enlarge)
(Source: Welldatabase.com)

It is a 64 stage, 15000 foot lateral targeting the middle Bakken. This well used 172,000 bbls of fluids and 15 million pounds of sand.

Date Oil Gas BOE
1/1/2013 18,792.00 43 43
2/1/2013 30,211.00 13,879.00 13879
3/1/2013 42,037.00 17,648.00 17648
4/1/2013 17,433.00 36,881.00 36881
5/1/2013 38,754.00 63,501.00 63501
6/1/2013 28,602.00 48,817.00 48817
7/1/2013 0 0 0
8/1/2013 134 1 1
9/1/2013 0 0 0
10/1/2013 0 0 0
11/1/2013 0 0 0
12/1/2013 0 0 0
1/1/2014 6,311.00 7,186.00 7186
2/1/2014 43,713.00 74,099.00 74099
3/1/2014 39,156.00 18,492.00 18492
4/1/2014 23,408.00 36,881.00 36881
5/1/2014 21,681.00 33,498.00 33498
6/1/2014 28,502.00 51,543.00 51543
7/1/2014 18,795.00 45,017.00 45017
8/1/2014 25,512.00 58,837.00 58837
9/1/2014 20,522.00 60,662.00 60662
10/1/2014 19,137.00 68,576.00 68576
11/1/2014 12,093.00 37,043.00 37043
12/1/2014 16,587.00 45,980.00 45980
1/1/2015 14,246.00 62,819.00 62819
2/1/2015 9,220.00 35,931.00 35931
3/1/2015 3,617.00 6,634.00 6634
4/1/2015 13,702.00 42,551.00 42551

(Source: Welldatabase.com)

It has produced 492,170 bbls of crude and 866,520 Mcf of natural gas. 360 day production was 412,072 bbls of oil.

(click to enlarge)
(Source: Welldatabase.com)

This is an excellent well, but the location of focus is Hawkeye 02-2501H. It was completed last in this group. This well provides the link between changes in well design to production improvements.

Date Oil Gas BOE
12/1/2013 3,022.00 6,533.00 6533
1/1/2014 37,385.00 75,940.00 75940
2/1/2014 30,066.00 58,949.00 58949
3/1/2014 22,876.00 50,690.00 50690
4/1/2014 26,703.00 43,926.00 43926
5/1/2014 31,987.00 55,124.00 55124
6/1/2014 27,777.00 47,166.00 47166
7/1/2014 31,500.00 50,279.00 50279
8/1/2014 51,709.00 99,583.00 99583
9/1/2014 43,292.00 98,069.00 98069
10/1/2014 40,143.00 98,927.00 98927
11/1/2014 24,064.00 50,495.00 50495
12/1/2014 31,488.00 99,684.00 99684
1/1/2015 27,087.00 94,621.00 94621
2/1/2015 22,207.00 94,490.00 94490
3/1/2015 22,590.00 125,634.00 125634
4/1/2015 17,707.00 94,910.00 94910

(Source: Welldatabase.com)

The production numbers are significant. In less than a year and a half, it has produced 490,000 bbls of crude and 1.25 Bcf of natural gas. Revenues to date are $33.2 million. Its 360 day crude production was 427,663 bbls. The production is impressive but the decline curve is more important. This Hawkeye well has a steady production rate with only a slight decline. This is where the analysts may be getting it wrong, as decline curves change significantly by area and well design. What EOG has done is not only increased production significantly, but also flattened the curve. Initial production is interesting as we don’t see peak production until nine months. This means our best month is August of 2014, and not the first full month. When we analyze the production after one full year of production, there is no drop off.

This 12800 foot 69 stage lateral is a very good middle Bakken design. EOG decided to pull back some of the lateral length. There are several possible reasons for this. We think it is possible EOG has discovered it was having difficulty in getting proppant to the toe of the well. But this is why operators test the length. More importantly, the increase in stages in conjunction with a shorter lateral provides for shorter stages. This means the operator will probably do a better job of stimulating the source rock. This well also used massive volumes of fluids and sand. 460,000 bbls of fluids were used with over 27 million lbs of proppant. I don’t normally break down the types of sand, as it can be trivial to some but in this case I have as the design seems somewhat unique. This well used approximately 16 million lbs of 100 mesh sand, 7 million lbs of 30/70 and 4 million 40/70. The large volumes of mesh sand are interesting. It would seem EOG is trying to push the finest sand deep into the fractures to maintain deeper shale production.

Well Date Lateral Ft. Stages Proppant Lbs. Fluids Bbls. 12 mo. Oil Production Bbls. Production/Ft.
Riverview 100-3031H 6/12 9,000 39 5.7M 85,000 240,036 26.67
Riverview 4-3031H 7/12 9,000 38 4.3M 69,000 237,735 26.42
Hawkeye 100-2501H 9/12 13,700 47 14M 158,000 389,835 28.46
Hawkeye 102-2501H 1/13 14,000 62 14.5M 164,000 394,673 28.19
Hawkeye 01-2501H 1/13 15,000 64 15M 172,000 412,072 27.47
Hawkeye 02-2501H 12/13 12,800 69 27M 460,000 427,663 33.41

I completed the above table for several reasons. The first was to show well design’s effect on one year total production. We used 360 days as a base. We didn’t use 12 months as that will skew data, as some wells don’t produce every day of every month. Wells are shut in for service or more importantly when new production from adjacent locations are turned to sales. So these are a specific number of days and not estimates. We also broke down production per foot of lateral. This may be more important than any other factor. Production per well is important, but lateral length is a key as it shows how well the source rock was stimulated. In reality, production per foot matters more at longer lateral lengths. Many operators don’t like to do laterals longer than 10,000 feet, as production per foot decreases sharply. When looking at well production data, it is obvious that production per foot suffers as the toe of the lateral gets farther from the vertical.

There are several other ETFs that focus on U.S. and world crude prices:

  • iPath S&P Crude Oil Total Return Index ETN (NYSEARCA:OIL)
  • ProShares Ultra Bloomberg Crude Oil ETF (NYSEARCA:UCO)
  • VelocityShares 3x Long Crude Oil ETN (NYSEARCA:UWTI)
  • ProShares Ultrashort Bloomberg Crude Oil ETF (NYSEARCA:SCO)
  • U.S. Brent Oil ETF (NYSEARCA:BNO)
  • PowerShares DB Oil ETF (NYSEARCA:DBO)
  • VelocityShares 3x Inverse Crude Oil ETN (NYSEARCA:DWTI)
  • PowerShares DB Crude Oil Double Short ETN (NYSEARCA:DTO)
  • U.S. 12 Month Oil ETF (NYSEARCA:USL)
  • U.S. Short Oil ETF (NYSEARCA:DNO)
  • PowerShares DB Crude Oil Long ETN (NYSEARCA:OLO)
  • PowerShares DB Crude Oil Short ETN (NYSEARCA:SZO)
  • iPath Pure Beta Crude Oil ETN (NYSEARCA:OLEM)

All six wells had fantastic results. The first two Riverview wells are still considered sand heavy fracs and produced almost a quarter of a million barrels of oil. This does not include natural gas in the estimates, but EURs for these wells are approximately 1200 MBo. We don’t put much emphasis on EURs other than an indicator of how good production is in comparison. Since locations will produce from 35 to 40 years, we are more inclined to emphasize one year production. Although the Hawkeye wells drilled on 9/12 and 1/13 didn’t show a large uptick in production per foot, it is still quite impressive considering the lateral length. Overall production uplift was exceptional, and these wells produce decent payback times at current oil price realizations.

There is no doubt this area has superior geology. It is definitely a core area, but may not be as good as Parshall field. Because of this, we know other areas would not produce as well, but still it provides a decent comparison for the upside to well design. Geology is still key and this is probably why EOG recently drilled a 15 well pad in the same general area. These wells are still in confidential status, so we do not know the outcome. Given the results in this area, these wells could be very interesting. The most important reason to focus on these Mega-Fracs is repeatability. If EOG can do this, so can other operators. Our expectations are many operators will be able to complete wells this good within the next 12 to 24 months. If this occurs we could see production maintained at much lower prices and fewer completions.

Gov Jumbo vs. Private Jumbo Loans Today

Government-backed jumbo loans can be cheaper and easier to get than jumbos that exceed the $625,500 federal limit

https://i0.wp.com/si.wsj.net/public/resources/images/BN-JS449_JCONFO_M_20150805104039.jpgSave Money With Smaller Jumbos by Anya Martin in The Wall Street Journal

Home buyers trying to purchase a pricey property will probably need a jumbo loan—a mortgage that exceeds government limits. But there are different types of jumbos, and some are a little easier and cheaper to get than others.

But first, a handy breakdown for those befuddled by the confounding terminology of the mortgage business:

Conforming mortgages are capped at $417,000 and backed by government agencies, such as Fannie Mae, Freddie Mac, the Federal Housing Administration (FHA) and the Veterans Administration (VA).

Conforming jumbo mortgages exceed $417,000 and can go up to $625,500—the exact limit depends on housing costs in your area. The loans are sometimes called “super conforming loans” or “agency jumbos” because they’re still guaranteed by government agencies.

Jumbo mortgages exceed government limits and, thus, are typically held by the lender as part of its portfolio or bundled and sold to investors as mortgage-backed securities.

Borrowers typically pay lower interest rates on conforming loans than on non-conforming jumbo mortgages. (Rates and qualification requirements vary by lender.)

Escalating home-sales prices are pushing more buyers into both conforming and non-conforming jumbos, says Tim Owens, who heads Bank of America’s retail sales group.

Jumbo mortgage volume totaled about $93 billion in the second quarter of 2015, up 33% over the first quarter, according to Inside Mortgage Finance, an industry publication.

The volume of government-backed conforming jumbos also saw brisk growth, increasing 32% between the first and second quarters to $34.2 billion—more than double since a year ago, Inside Mortgage Finance data show.

“The agency jumbo market is firing on all cylinders—purchase, refinance and every loan program,” says Guy Cecala, publisher of Inside Mortgage Finance. The biggest jump was in FHA jumbo mortgages, with volume up 136% between the first and second quarters, he adds.

The spike in FHA mortgages, in particular, comes after the agency on Jan. 26 reduced its required mortgage insurance premiums, Mr. Cecala says. Premiums dropped from 1.35% to 0.85% of the balance on fixed-rate FHA loans with terms above 15 years.

More lenient credit requirements spur borrowers to prefer agency jumbo mortgages over non-conforming loans, says Mathew Carson, a broker with San Francisco-based First Capital Group. He is working with a professional couple borrowing $511,000 for a home in Petaluma, Calif., where the government’s loan limit is $520,950. The couple, both first-time home buyers, could opt for a conforming or a non-conforming jumbo loan but chose a conforming jumbo backed by the FHA. Why? The FHA mortgage required a 3.5% down payment, whereas lenders for a non-conforming loan could require the standard 20% down payment.

Fannie Mae and Freddie Mac also reduced their minimum down payments to 3.5% of the loan amount in December.

Another benefit to conforming loans is lower credit-score requirements, with minimums in the 600s for Fannie Mae and Freddie Mac mortgages and in the 500s for FHA loans, says Tom Wind, executive vice president of home lending at Jacksonville, Fla.-based EverBank. Most lenders prefer to see 700 and above for their privately held jumbos, he adds.

An increase in the volume of VA mortgages is most likely due to more awareness of the benefit among active military and veterans, says Tony Dias, Honolulu branch manager of Veterans United, which specializes in VA loans. In Hawaii alone, Veterans United’s loan volume for 2015 is projected to reach $320 million, he adds.

Here are a few more considerations when choosing between a conforming and a non-agency jumbo mortgage:

• Mortgage insurance. Fannie Mae and Freddie Mac mortgages with less than a 20% down payment require mortgage insurance, but borrowers can drop the insurance once their loan-to-value (LTV) ratio dips below 80%, meaning the loan amount can’t exceed 80% of the value of the home. FHA borrowers must pay the insurance for the duration of the loan, adding to the lifetime cost of the loan, unless they refinance.

• Bonus for veterans. VA jumbos require no mortgage insurance and no down payment unless the amount borrowed exceeds the area’s conforming-loan limit. Even then, the 25% down payment only applies to the amount above the loan limit, so, for example, a borrower would only have to put down $25,000 on an $821,000 loan in Honolulu where the limit is $721,050, Mr. Dias says.

• Additional lender restrictions. Fannie Mae mortgages can have a debt-to-income ratio (DTI) as high as 50%, meaning the borrower’s monthly expenses can be as high as 50% of her gross monthly income. Most lenders typically stick to 43% DTI (prescribed by federal rules for privately held qualified mortgages) for their conforming jumbos as well, Mr. Carson says.

A Luxury Tear Down In LA’s Bird Streets

http://www.trbimg.com/img-55bc0e76/turbine/la-fi-0802-tear-downs-03-jpg-20150731/900/900x506

A luxury tear-down in the Bird Streets. 9212 Nightingale Drive, priced at $13.8 million, the 5,000-square-foot house on more than half an acre is being marketed as the site for a 12,000-square-foot home that developers hope would garner as much as $70 million.

By Neal J. Leitereg in The Los Angeles Times

The actual house didn’t factor much into the equation when Dr. Dre parted with his Hollywood Hills West home in January for $32 million.

The contemporary-style residence behind gates on Oriole Way was not purchased for its 9,696 square feet of space, but rather for its land value and potential to build an astonishing $100-million-plus estate on what has been called the best view lot in Los Angeles.

Such is life in the so-called Bird Streets, an enclave that has long been popular among celebrity and mogul types, where a developers flush with cash look to double down on a surging luxury market.

At 9212 Nightingale Drive, a home taken down to the studs and built new last year is now being shopped as a tear-down, according to listing agent Benjamin Bacal of Rodeo Realty Beverly Hills. That’s how popular and sought-after the area has become.

Priced at $13.8 million, the 5,000-square-foot house on more than half an acre is being marketed as the site for a 12,000-square-foot home that developers hope would garner as much as $70 million.

If that sounds like a pie-in-the-sky figure, Bacal points to two other homes on the same street where $70 million seems to be the magic number.

Three doors down, Global Radio founder and president Ashley Tabor has invested more than $30 million into a two-house compound he bought from Megan Ellison, the film producer and daughter of billionaire Larry Ellison, in 2013 for $26.25 million.

In similar fashion, billionaire Ted Waitt, who co-founded Gateway Inc., has put about $30 million toward his home on Nightingale. Also purchased from Ellison in 2013, the corner-lot property cost $20.5 million.

Each could end up worth $70 million, as long as the tear-down market stays red hot.

‘Housing Bubble 2’ Has Bloomed Into Full Magnificence

The current housing boom has Dallas solidly in its grip. As in many cities around the US, prices are soaring, buyers are going nuts, sellers run the show, realtors are laughing all the way to the bank, and the media are having a field day. Nationwide, the median price of existing homes, at $236,400, as the National Association of Realtors sees it, is now 2.7% higher than it was even in July 2006, the insane peak of the crazy housing bubble that blew up with such spectacular results.

Housing Bubble 2 has bloomed into full magnificence: In many cities, the median price today is far higher, not just a little higher, than it was during the prior housing bubble, and excitement is once again palpable. Buy now, or miss out forever! A buying panic has set in.

And so the July edition of D Magazine – “Making Dallas Even Better,” is its motto – had this enticing cover, sent to me by David in Texas, titled, “The Great Dallas Land Rush”:

Dallas Land Rush

“Dallas Real Estate 2015: The Hottest Market Ever,” the subtitle says.

That’s true for many cities, including San Francisco. The “Boom Town,” as it’s now called, is where the housing market has gone completely out of whack, with a median condo price at $1.13 million and the median house price at $1.35 million. This entails some consequences [read… The San Francisco “Housing Crisis” Gets Ugly].

The fact that Housing Bubble 2 is now even more magnificent than the prior housing bubble, even while real incomes have stagnated or declined for all but the top earners, is another sign that the Fed, in its infinite wisdom, has succeeded elegantly in pumping up nearly all asset prices to achieve its “wealth effect.” And it continues to do so, come heck or high water. It has in this ingenious manner “healed” the housing market.

But despite the current “buying panic,” the soaring prices, and all the hoopla round them, there is a fly in the ointment: overall home ownership is plunging.

The home ownership rate dropped to 63.4% in the second quarter, not seasonally adjusted, according to a new report by the Census Bureau, down 1.3 percentage points from a year ago. The lowest since 1967!

home ownershipWolf Street

The process has been accelerating, instead of slowing down. The 1.2 percentage point plunge in 2014 was the largest annual drop in the history of the data series going back to 1965. And this year is on track to match this record: the drop over the first two quarters so far amounts to 0.6 percentage points. This accelerated drop in home ownership rates coincides with a sharp increase in home prices. Go figure.

The plunge in home ownership rates has spread across all age groups, but to differing degrees. Younger households have been hit the hardest. In the age group under 35, the home ownership rate in Q2 saw a slight uptick to 34.8%, from the dismal record low of 34.6% in the prior quarter. Either a feeble ray of hope or just one of the brief upticks, as in the past, to be succeeded by more down ticks on the way to lower lows.

This chart by the Economics and Strategy folks at National Bank Financial shows the different rates of home ownership by age group. The 35-year and under group is where the first-time buyers are concentrated; and they’re being sidelined, whether they have no interest in buying, or simply don’t make enough money to buy (represented by the sharply descending solid black line, left scale). Note how the oldest age group (dotted blue line, right scale) has recently started to cave as well:

homeownership ratesWolf Street

The bitter irony? In the same breath, the Census Bureau also reported that the rental vacancy rate dropped to 6.8%, from 7.5% a year ago, the lowest since 1985. America is turning into a country of renters.

This chart shows the dynamics between home ownership rates (black line, left scale) and rental vacancy rates (red line, right scale) over time: they essentially rise and dive together. It makes sense on an intuitive basis: as people abandon the idea of owning a home, they turn into renters, and the rental market tightens up, and vacancy rates decline.

homeownership rate v rental vacancy rateWolf Street

This too has been by design, it seems. Since 2012, private equity firms bought several hundred thousand vacant single-family homes in key markets, drove up prices in the process, and started to rent them out. Thousands of smaller investors have jumped into the fray, buying homes, driving up prices, and trying to rent them out. This explains the record median home price across the country, and the totally crazy price increases in some key markets, even as regular Americans are trying to figure out how to pay for a basic roof over their heads.

This has worked out well. By every measure, rents have jumped. According to the Census Bureau’s report, the median asking rent in the US rose 6.2% from a year ago, and 17.6% since 2011. So inflation bites. But the Fed is still desperately looking for signs of inflation and simply cannot find any.

And how much have incomes risen over these years to allow renters to meet these rising rents? OK, that was a rhetorical question. We already know what has been happening to incomes.

That’s what it always boils down to in the Fed’s salvation of the economy: people who can’t afford to pay the rising rents with their stagnant or declining incomes should borrow the money to make up the difference and then spend even more on consumer goods. After us, the deluge.

A Clever Hotel Room ‘Loft’ Designed for Longer Stays

hotel room loft designed for longer stays zoku loft (2)

The 24m2 (258 sq ft) Zoku Loft is designed as a living/working hybrid for ‘global nomads’ who typically seek temporary residence for between five days and several months. The designers add:

“In a regular hotel room or studio apartment, the bed always dominates. At Zoku, a big kitchen table serves as focal point. Use it to work across time zones, host dinner parties or gently rest your head after making a deadline. You decide. Then feel free to change your mind. The same goes for swapping the art on your walls, after which you can enjoy the view from your comfy Muuto design furniture.”

hotel room loft designed for longer stays zoku loft (1)


The loft has space-saving features like a retractable staircase and hide-away storage areas. It also includes a king size bed, dishwasher and commonly used home/office supplies. The first Zoku lofts are set to open in August in the eastern Canal District of Amsterdam. You can find much more information at the links below.

https://twistedsifter.files.wordpress.com/2015/07/hotel-room-loft-designed-for-longer-stays-zoku-loft-8.jpg?w=800&h=600

https://twistedsifter.files.wordpress.com/2015/07/hotel-room-loft-designed-for-longer-stays-zoku-loft-9.jpg?w=800&h=600https://twistedsifter.files.wordpress.com/2015/07/hotel-room-loft-designed-for-longer-stays-zoku-loft-1.jpg?w=800&h=600hotel room loft designed for longer stays zoku loft (5)hotel room loft designed for longer stays zoku loft (6)hotel room loft designed for longer stays zoku loft (4)hotel room loft designed for longer stays zoku loft (3)

Source: Twisted Sifter

Rents Have Been Skyrocketing In These 13 US Cities

Seven years ago, the American home ownership “dream” was shattered when a housing bubble built on a decisively shaky foundation burst in spectacular fashion, bringing Wall Street and Main Street to their knees. 

In the blink of an eye, the seemingly inexorable rise in the American home ownership rate abruptly reversed course, and by 2014, two decades of gains had disappeared and the ashes of Bill Clinton’s National Home ownership Strategy lay smoldering in the aftermath of the greatest financial collapse since the Great Depression.

In short, decades of speculative excess driven by imprudence, greed, and financial engineering and financed by the world’s demand for GSE debt had come crashing down and in relatively short order, a nation of homeowners was transformed into a nation of renters. 

It wasn’t difficult to predict what would happen next.

As demand for rentals increased and PE snapped up foreclosures, rents rose, just as a subpar jobs market, a meteoric rise in student debt, tougher lending standards, and critically important demographic shifts put further pressure on home ownership rates. Now, America faces a rather dire housing predicament: buying and renting are both unaffordable. Or, as WSJ put it last month, “households are stuck between homes they can’t qualify for and rents they can’t afford.”

We’ve seen evidence of this across the country with perhaps the most telling statistic coming courtesy of The National Low Income Housing Coalition who recently noted that in no state can a minimum wage worker afford a one bedroom apartment. 

In this context, Bloomberg is out with a list of 13 cities where single-family rents have risen by double-digits in just the last 12 months. Note that in Iowa, rents have risen more than 20% over the past year alone.

More color from Bloomberg:

Landlords have been preparing to raise rents on single-family homes this year, Bloomberg reported in April. It looks like those plans are already being put into action.

The median rent for a three-bedroom single-family house increased 3.3 percent, to $1,320, during the second quarter, according to data compiled by RentRange and provided to Bloomberg by franchiser Real Property Management. Median rents are up 6.1 percent over the past 12 months. Even that kind of increase would have been welcome in 13 U.S. cities where single-family rents increased by double digits.

It’s more evidence that rising rents have affected a broad scope of Americans. Sixty percent of low-income renters spend more than 50 percent of their income on rent, according to a report in May from New York University’s Furman Center. High rents have also stretched the budgets of middle-class workers and made it harder for young professionals to launch careers and start families.

“You’re finding that people who wouldn’t have shared accommodations in the past are moving in with friends,”says Don Lawby, president of Real Property Management. “Kids are staying in their parents’ homes for longer and delaying the formation of families.”

And for those with short memories, we thought this would be an opportune time to remind you of who became America’s landlord in the wake of the crisis…

Source: Zero Hedge

Energy Companies Face “Come-To-Jesus” Point As Bankruptcies Loom

Last week, amid a renewed bout of crude carnage, Morgan Stanley made a rather disconcerting call on oil. 

“On current trajectory, this downturn could become worse than 1986: An additional +1.5 mb/d [of OPEC supply] is roughly one year of oil demand growth. If sustained, this could delay the rebalancing of oil markets by a year as well. The forward curve has started to price this in: as the chart shows, the forward curve currently points towards a recovery in prices that is far worse than in 1986. This means the industrial downturn could also be worse. In that case, there would be little in analysable history that could be a guide to this cycle,” the bank wrote, presaging even tougher times ahead for the O&G space.

If Morgan Stanley is correct, we’re likely to see tremendous pressure on the sector’s highly indebted names, many of whom have been kept afloat thus far by easy access to capital markets courtesy of ZIRP.

With a rate hike cycle on the horizon, with hedges set to roll off, and with investors less willing to throw good money after bad on secondaries and new HY issuance, banks are likely to rein in credit lines in October when the next assessment is due. At that point, it will be game over in the absence of a sharp recovery in crude prices. 

https://s15-us2.ixquick.com/cgi-bin/serveimage?url=http%3A%2F%2Fts1.mm.bing.net%2Fth%3Fid%3DJN.ZLR3KYf8IWnQf4RM8n3EFg%26pid%3D15.1%26f%3D1&sp=357f055eb112ef212bb5189aeccf6ad8

Against this challenging backdrop, we bring you the following commentary from Emanuel Grillo, partner at Baker Botts’s bankruptcy and restructuring practice who spoke to Bloomberg Brief last week.  

*  *  *

Via Bloomberg Brief

How does the second half of this year look when it comes to energy bankruptcies?

A: People are coming to realize that the market is not likely to improve. At the end of September, companies will know about their bank loan redeterminations and you’ll see a bunch of restructurings. And, as the last of the hedges start to burn off and you can’t buy them for $80 a barrel any longer, then you’re in a tough place.

The bottom line is that if oil prices don’t increase, it could very well be that the next six months to nine months will be worse than the last six months. Some had an ability to borrow, and you saw other people go out and restructure. But the options are going to become fewer and smaller the longer you wait.

Are there good deals on the horizon for distressed investors?

A: The markets are awash in capital, but you still have a disconnect between buyers and sellers. Sellers, the guys who operate these companies, are hoping they can hang on. Buyers want to pay bargain-basement prices. There’s not enough pressure on the sellers yet. But I think that’s coming. 

https://s16-us2.ixquick.com/cgi-bin/serveimage?url=http%3A%2F%2Fts4.mm.bing.net%2Fth%3Fid%3DJN.WRi8a7AqdL7XZWEYpZehUA%26pid%3D15.1%26f%3D1&sp=65edb29198ceb6054d44a4f53685920c

Banks will be redetermining their borrowing bases again in October. Will they be as lenient this time around as they were in April?

A: I don’t know if you’ll get the same slack in October as in April, absent a turnaround in the market price for oil. It’s going to be that ‘come-to-Jesus’ point in time where it’s about how much longer can they let it play. If the banks get too aggressive, they’re going to hurt the value for themselves and their ability to exit. So they’re playing a balancing act.

They know what pressure they’re facing from a regulatory perspective. At the same time, if they push too far in that direction, toward complying with the regulatory side and getting out, then they’re going to hurt themselves in terms of what their own recovery is going to be. All of the banks have these loans under very close scrutiny right now. They’d all get out tomorrow if they could. That’s the sense they’re giving off to the marketplace, because the numbers are just not supporting what they need to have from a regulatory perspective.

Source: Zero Hedge

Should You Buy A House Today?

By Ramsey Su

Examining the reasons to buy a house today may give us some idea where the housing market is heading in the future.

There are three reasons to buy a house:

Reason 1 – Utility

A house (any dwelling) is a shelter.  It provides enjoyment, a home to raise one’s family, or just a place to watch that big screen TV.  Utility is not quantifiable and it differs from household to household.

Reason 2 – Savings

If financed, a mortgage is a way of saving something every month until the mortgage is paid in full.  If paid for, the savings come in the form of “owners’ equivalent rent”, which is what the census bureau uses to measure inflation in housing.

Reason 3 – Asset appreciation

At 5% appreciation per year, a $100k house today will be worth $412k in 30 years. Even a more modest 3% appreciation would result in better than a double.

 house, modern
Why Not to Buy a House Today

Based on the reasons above, it appears to be a slam dunk decision.  Why would anyone not want to buy a house?  There are three obstacles:

Obstacle 1 – Affordability

Housing, as a percentage of household income, is too expensive.  A decade of ill-conceived government intervention and Federal Reserve accommodations prevented natural economic forces from driving house prices to equilibrium.  As a result, not only is entry difficult, but many are struggling and are stuck in dire housing traps.  Corelogic estimated that as of the 1st quarter of 2015, 10.2% of mortgages are still under water while 9.7 million households have less than 20% equity.

Obstacle 2 – High Risk

Say you are young couple that purchased a home two years ago, using minimal down financing.  The wife is now pregnant and the husband has an excellent career opportunity in another city.  The couple has insufficient savings and the house has not appreciated enough to facilitate a sale, which results in negative equity after selling expenses.  The house can become a trap that diminishes a life time of income stream.

Obstacle 3 – “Dead zones”

Say you live in the middle of the country, in Kane County Illinois.  For the privilege of living there, you pay 3% in property taxes.  That is like adding 3% to a mortgage that never gets paid down.  Your property would have to appreciate 3% per year just to break even. By the way, “appreciation” is unheard of in Kane County, good times or bad.  There are many Kane Counties in the US.  Real estate in these counties should be named something else and should not be co-mingled with other housing statistics.  Employment is continuing to trend away from these areas.  What is going to happen to real estate in these markets?

 courthouseLGThe Kane County court house: where real estate goes to vegetate

The factors listed above are nothing new.  They provide some perspective as to where are are heading.  Looking at each of the reasons and obstacles, they are all trending negatively.

The country is spending too much on housing, a luxury that is made possible by irresponsible Fed policies.  50% debt to income ratios are just insane and Ms. Yellen has the gall to call mortgage lending restrictive.  Can we not see what is happening to Greece?

Fed MBS holdingsMortgage backed securities held by the Federal Reserve System, a non-market central economic planning institution that is the chief instigator of house price inflation. Still growing, in spite of QE having officially ended – via Saint Louis Federal Reserve Research, click to enlarge.

Real estate is an investment that matures over time.  The first few years are the toughest, until equity can be built up.  With appreciation slowing, not to mention the possibility of depreciation, it is taking much longer to reach financial safety.  The current base is weak, with too high a percentage of low equity and no equity ownership.  The stress of a recession, or just a few years of a flat market, can impact the economy beyond expectations.  The risks that might have been negligible once upon a time are much higher today.  Many who purchased ten years ago are still living with the consequences of that ill-timed decision today.

By stepping back and looking at the big picture, we can see that real estate should be correcting and trending down.  The reasons why our grandparents bought their homes have changed.  Government intervention cannot last forever.  It will change from accommodation to devastation, when they finally run out of ideas.

Conclusion

In summary, my working life had its origins in real estate and I am not trying to bite the hand that fed me.  However, the reality is that the circumstances that prevailed when I entered the market are non-existent today.  I seriously doubt that I would chose real estate as a career, or as an investment avenue, if I were starting over.  As for buying a house, I would consider it more of a luxury as opposed to an investment, and one has to be prepared for the possibility of it being a depreciating asset, especially if one decides to move.

Payment Buyers Picked Up Slack Left By Investors During First Half Of 2015

https://i0.wp.com/nationalmortgageprofessional.com/sites/default/files/All_Cash_Home_Sales_Pic.jpg

RealtyTrac has released its June and Midyear 2015 U.S. Home Sales Report, which shows distressed sales, cash sales and institutional investor sales in June were all down from a year ago to multi-year lows even as sales to first-time home buyers and other buyers using FHA loans increased compared to a year ago in June and reached a two-year high in the second quarter. Buyers using Federal Housing Administration (FHA) loans—typically low down payment loans utilized by first-time home buyers and other buyers without equity to bring to the closing table—accounted for 23 percent of all single family home and condo sales with financing—excluding all-cash sales—in the second quarter of 2015, up from 20 percent in the first quarter and up from 19 percent in the second quarter of 2014 to the highest share since the first quarter of 2013.

The report also shows 914,291 single family and condo sales through April 2015—the most recent month with complete sales data available—at the highest level through the first four months of a year since 2006, a nine-year high. 

“As the investor-driven housing recovery faded in the first half of 2015, first-time home buyers, boomerang buyers and other traditional owner-occupant buyers started to step into the gap and pick up the slack,” said Daren Blomquist, vice president at RealtyTrac. “This is good news for sellers in many markets, providing them with strong demand from a larger pool of buyers, and U.S. sellers so far in 2015 are realizing the biggest gains in home price appreciation since 2007. In June sellers sold for above estimated market value on average for the first time in nearly two years.”

Cash buyers down nationwide, up in New York City and 20 other markets
All-cash buyers accounted for 22.9 percent of all single family home and condo sales in June, down from 24.7 percent of all sales in the previous month and down from 29.1 percent of all sales in June 2014 to the lowest share of monthly cash sales nationwide since August 2008. The June cash sales share was almost half the peak of 42.1 percent in February 2011. Metros with highest share of cash sales in June were Homosassa Springs, Florida (53 percent), Naples-Marco Island, Florida (52 percent); Miami (50 percent); Sebastian-Vero Beach, Fla. (50 percent); and New York (49 percent).

“The first six months of sales in South Florida have been at a record pace. The millennials are entering the market along with many home buyers who had difficulty during the last recession while the investor market has quieted,” said Mike Pappas, CEO and president of Keyes Company, covering the South Florida market. “It is a real market with real buyers and sellers. The buyers have many lending options and are still enjoying low interest rates and many sellers are selling at their peak prices.”

In New York and 20 other markets analyzed for the report, the share of cash sales increased from a year ago, counter to the national trend. The New York metro share of cash sales increased from 40 percent in June 2014 to 49 percent in June 2015. Other markets with an increasing share of cash sales included Raleigh, North Carolina; Greenville, South Carolina; Bellingham, Washington located between Seattle and Vancouver, Canada; Knoxville, Tennessee; Providence, Rhode Island; and San Jose, Calif.

“Cash buyers have been a significant player in the Seattle housing market over the past 18 months, but the modest drop in this buyer segment doesn’t come as a surprise given the aggressive rise in home prices in recent months,” said Matthew Gardner, chief economist at Windermere Real Estate, covering the Seattle market. “Higher prices are forcing these buyers to dig deeper into their pockets and this process has started to push some out of the market. The same can be said for first time buyers; many of them are having a hard time qualifying for a loan also due to the rise in home prices in Seattle.”

Institutional investor share in June matches record low
Institutional investors—entities purchasing at least 10 properties during a calendar year—accounted for 1.7 percent of all single family and condo sales in June, the same share as in May but down from 3.5 percent of all sales in June 2014. The 1.7 percent share of institutional investor sales in May and June was the lowest monthly share going back to January 2000—the earliest data is available—and was less than one-third of the monthly peak of 6.1 percent in February 2013.

Metro areas with the highest share of institutional investor sales in June 2015 were Macon, Georgia (10.2 percent); Columbia, Tenn. (9.5 percent); Memphis, Tenn. (8.7 percent); Detroit (7.8 percent); and Charlotte (5.3 percent).

Other major metros with a high percentage of institutional investor sales included Tampa (4.3 percent); Atlanta (4.0 percent); Tulsa, Oklahoma (3.9 percent); Oklahoma City (3.7 percent); and Nashville (3.7 percent).

The share of institutional investors increased from a year ago in just four markets: Detroit; Macon, Georgia; Lincoln, Nebraska; and Birmingham, Alabama.

Distressed sales drop to new record low
Distressed sales—properties in the foreclosure process or bank-owned when they sold—accounted for eight percent of all single family and condo sales in June, down from 10.6 percent of all sales in May and down from 19.0 percent of all sales in June 2014 to the lowest monthly share since January 2011—the earliest that data is available. The share of distressed sales reached a monthly peak of 45.9 percent of all single family and condo sales in February 2011.

Metro areas with the highest share of distressed sales in June were Salisbury, North Carolina (30.6 percent); Gainesville, Ga. (23.8 percent); Jacksonville, N.C. (22.2 percent); Boone, N.C. (22.1 percent); and Marion, Ohio (21.9 percent).

Major metro areas with a high share of distressed sales in June included Chicago (14.7 percent); Baltimore (14.4 percent); Orlando (13.8 percent); Jacksonville, Fla. (13.6 percent); and Memphis (13.4 percent).

Markets with highest and lowest share of FHA loan purchases in first half of 2015
Nationwide, buyers using FHA loans accounted for 22 percent of all financed sales in the first half of 2015, up from 19 percent of all sales in 2014 and up from 20 percent of all sales in 2013.

Among markets with a population of 1 million or more, those with the highest share of buyers using FHA loans in the first six months of 2015 were Riverside-San Bernardino-Ontario in inland Southern California (35 percent); Las Vegas (32 percent); Oklahoma City (31 percent); Salt Lake City (30 percent); and Phoenix (29 percent).

Major markets with the lowest share of buyers using FHA loans in the first six months of 2015 were San Jose, California (7 percent); Hartford, Connecticut (10 percent); San Francisco (12 percent); Boston (12 percent); and Milwaukee (13 percent). 

First-half 2015 sellers realized highest home price gains since 2007
Single family home and condo sellers in the first half of 2015 sold for an average of 13 percent above their original purchase price, the highest average percentage in home price gains realized by sellers since 2007, when it was 30 percent.

Major markets where sellers in the first half of 2015 realized the biggest average home price gains were San Jose, Calif. (41 percent); San Francisco (37 percent); Denver (29 percent); Portland (25 percent); Los Angeles (25 percent); and Seattle (20 percent).

There were six major markets where sellers in the first half of 2015 on average sold below their original purchase price: Chicago (seven percent below); Cleveland (seven percent below); Hartford, Conn. (three percent below); Jacksonville, Fla. (two percent below); St. Louis (one percent below); and Orlando (one percent below).

Homes sold in June sold above estimated market value on average
Single family homes and condos in June sold for an average of $291,450 compared to an average $287,634 estimated market value for those same homes at the time of sale—a 101 percent price-to-value ratio. June was the first time since July 2013 that the national price-to-value ratio exceeded 100 percent.

Major metro areas with the highest price-to-value ratios—where homes sold the most above estimated market value—were San Francisco (106 percent); Hartford, Conn. (105 percent); Baltimore (105 percent); Rochester, N.Y. (104 percent); and Providence, R.I. (103 percent).

Other major markets with price-to-value ratios above 100 percent in June included Washington, D.C. (103 percent); Phoenix (103 percent); Sacramento (103 percent); Portland (103 percent); Seattle (102 percent); San Jose (102 percent); and St. Louis (102 percent).

Sales volume at highest level since 2006 in 16 percent of markets analyzed
The number of single family homes and condos sold in the first four months of 2015 were at the highest level in the first four months of any year since 2006 in 43 out of 264 (16 percent) metropolitan statistical areas with sufficient home sales data. Markets at nine-year highs included Tampa; Denver; Columbus, Ohio; Jacksonville, Fla. and San Antonio.

There were 23 markets where sales volume in the first four months of 2015 was at 10-year highs, including Denver; Columbus, Ohio; San Antonio; Tucson, Ariz.; and Palm Bay-Melbourne-Titusville, Fla.

Among major metro areas with a population of one million or more, 22 out of 51 markets (43 percent) were at eight-year highs for single family home and condo sales in the first four months of the 2015, including New York, Dallas, Houston, Seattle and Portland.

Source: National Mortgage Professional Magazine

These Are the Top 20 Cities Americans Are Ditching

Soaring costs of living meant residents left New York City and its suburbs in droves.

El Paso Texas Skyline

  Erin Roman and Wei Lu in Bloomberg News

 New York City, Los Angeles, Honolulu: They’re all places you would think would be popular destinations for Americans. So it might come as a surprise that these are among the cities U.S. residents are fleeing in droves.

The map below shows the 20 metropolitan areas that lost the greatest share of local people to other parts of the country between July 2013 and July 2014, according to a Bloomberg News analysis of U.S. Census Bureau data. The New York City area ranked 2nd, losing about a net 163,000 U.S. residents, closely followed by a couple surrounding suburbs in Connecticut. Honolulu ranked fourth and Los Angeles ranked 14th. The Bloomberg calculations looked at the 100 most populous U.S. metropolitan areas.

https://i0.wp.com/assets.bwbx.io/images/iqz1n74BplHE/v1/-1x-1.jpg

Interestingly, these are also the cities with some of the highest net inflows of people from outside the country. That gives many of these cities a steadily growing population, despite the net exodus of people moving within the U.S.

So what’s going on here? Michael Stoll, a professor of public policy and urban planning at the University of California Los Angeles, has an idea. Soaring home prices are pushing local residents out and scaring away potential new ones from other parts of the country, he said. (Everyone knows how unaffordable the Manhattan area has become.)

And as Americans leave, people from abroad move in to these bustling cities to fill the vacant low-skilled jobs. They are able to do so by living in what Stoll calls “creative housing arrangements” in which they pack six to eight individuals, or two to four families, into one apartment or home. It’s an arrangement that most Americans just aren’t willing to pursue, and even many immigrants decide it’s not for them as time goes by, he said.

In addition, the growing demand for high-skilled workers, especially in the technology industry, brought foreigners who possess those skills to the U.S.  They are compensated appropriately and can afford to live in these high-cost areas, just like Americans who hold similar positions. One example is Washington, D.C., which had a lot of people from abroad arriving to soak up jobs in the growing tech-hub, Stoll said.

Other areas weren’t so lucky. Take some of the Rust Belt cities that experienced fast drops in their American populations, like Cleveland, Dayton and Toledo, even though they are relatively inexpensive places to live. These cities didn’t get enough international migrants to make up for the  those who left, a reflection of the fact that locals were probably leaving out of a lack of jobs.

This is part of a multiple-decade trend of the U.S. population moving away from these manufacturing hubs to areas in the Sun Belt and the Pacific Northwest, Stoll said. Retiring baby boomers are also leaving the Northeast and migrating to more affordable places with better climates.

This explains why the majority of metropolitan areas in Florida and Texas, as well as west-coast cities like Portland, had an influx of people.

El Paso, Texas, the city that residents fled from at the fastest pace, also saw a surprisingly small number of foreigners settling in given how close it is to Mexico.

“A lot of young, reasonably educated people are having a hard time finding work there,” Stoll said. “They’re not staying in town after they graduate,” leaving for the faster-growing economies of neighboring metro areas like Dallas and Austin, he said.

Methodology: Bloomberg ranked 100 of the most populous U.S. metropolitan areas based on their net domestic migration rates, from July 1, 2013 to July 1, 2014, as a percentage of total population as of July 2013. Domestic migration refers to people moving within the country (e.g. someone moving from New York City to San Francisco). A negative rate indicates more people leaving than coming in. International migration refers to a local resident leaving for a foreign country or someone from outside the U.S. moving into the U.S.

US Home Sales Surge In June To Fastest Pace In 8-Plus Years

WASHINGTON (AP) — Americans bought homes in June at the fastest rate in over eight years, pushing prices to record highs as buyer demand has eclipsed the availability of houses on the market.

The National Association of Realtors said Wednesday that sales of existing homes climbed 3.2 percent last month to a seasonally adjusted annual rate of 5.49 million, the highest rate since February 2007. Sales have jumped 9.6 percent over the past 12 months, while the number of listings has risen just 0.4 percent.

Median home prices climbed 6.5 percent over the past 12 months to $236,400, the highest level reported by the Realtors not adjusted for inflation.

Home-buying has recently surged as more buyers are flooding into the real estate market. Robust hiring over the past 21 months and an economic recovery now in its sixth year have enabled more Americans to set aside money for a down payment. But the rising demand has failed to draw more sellers into the market, causing tight inventories and escalating prices that could cap sales growth.

“The recent pace can’t be sustained, but it points clearly to upside potential,” said Ian Shepherdson, chief economist at Pantheon Macroeconomics.

A mere five months’ supply of homes was on the market in June, compared to 5.5 months a year ago and an average of six months in a healthy market.

Some markets are barely adding any listings. The condominium market in Massachusetts contains just 1.8 months’ supply, according to a Federal Reserve report this month. The majority of real estate agents in the Atlanta Fed region – which ranges from Alabama to Florida- said that inventories were flat or falling over the past year.

Some of the recent sales burst appears to come from the prospect of low mortgage rates beginning to rise as the Federal Reserve considers raising a key interest rate from its near-zero level later this year. That possibility is prompting buyers to finalize sales before higher rates make borrowing costs prohibitively expensive, noted Daren Blomquist, a vice president at RealtyTrac, a housing analytics firm.

The premiums that the Federal Housing Administration charges to insure mortgages are also lower this year, further fueling buying activity, Blomquist said.

It’s also possible that home buyers are checking the market for listings more aggressively, making it possible for them to act fast with offers despite the lack of new inventory.

“Buyers can more quickly be alerted of new listings and also more conveniently access real estate data to help them pre-search a potential purchase before they even step foot in the property,” Blomquist said. “That may mean we don’t need such a large supply of inventory to feed growing sales.”

Properties typically sold last month in 34 days, the shortest time since the Realtors began tracking the figure in May 2011. There were fewer all-cash, individual investor and distressed home sales in the market, as more traditional buyers have returned.

Sales improved in all four geographical regions: Northeast, Midwest, South and West.

Still, the limited supplies could eventually prove to be a drag on sales growth in the coming months.

Ever rising home values are stretching the budgets of first-time buyers and owners looking to upgrade. As homes become less affordable, the current demand will likely taper off.

Home prices have increased nearly four times faster than wages, as average hourly earnings have risen just 2 percent over the past 12 months to $24.95 an hour, according to the Labor Department.

Some buyers are also bristling at the few available options on the market. Tony Smith, a Charlotte, North Carolina real estate broker, said some renters shopping for homes are now choosing instead to re-sign their leases and wait until a better selection of properties comes onto the market.

New construction has yet to satisfy rising demand, as builders are increasingly focused on the growing rental market.

Approved building permits rose increased 7.4 percent to an annual rate of 1.34 million in June, the highest level since July 2007, the Commerce Department said last week. Almost all of the gains came for apartment complexes, while permits for houses last month rose only 0.9 percent.

The share of Americans owning homes has fallen this year to a seasonally adjusted 63.8 percent, the lowest level since 1989.

Real estate had until recently lagged much of the six-year rebound from the recession, hobbled by the wave of foreclosures that came after the burst housing bubble.

But the job market found new traction in early 2014. Employers added 3.1 million jobs last year and are on pace to add 2.5 million jobs this year. As millions more Americans have found work, their new paychecks are increasingly going to housing, both in terms of renting and owning.

Low mortgage rates have also helped, although rates are now starting to climb to levels that could slow buying activity.

Average 30-year fixed rates were 4.09 percent last week, according to the mortgage giant Freddie Mac. The average has risen from a 52-week low of 3.59 percent.

for AP News

Southern California Home Sales Soar in June

https://i0.wp.com/lyonhomes.com/images/region/slides/socal1.jpg

The Southern California housing market, known for its dramatic swings, is settling into a more normal, healthy pattern.

Home sales are up. All-cash and investor purchases are down. And home prices are rising at a more sustainable pace than in the last few years.

Economists said those factors put the regional housing market on a path for growth that won’t wash away in a tsunami of foreclosures and ruined credit scores.

“The healing continues,” said Stuart Gabriel, director of UCLA’s Ziman Center for Real Estate.


On Thursday, fresh evidence of that trend emerged in a report from CoreLogic. Home sales posted a sizable 18.1% pop in June from a year earlier, while the median price rose 5.7% from June 2014 to $442,000, the real estate data firm said.

The sales increase, the largest in nearly three years, put the number of sales just 9.6% below average, CoreLogic said. A year ago, sales were nearly 24% below average.

Notably, it appears more families are entering the market as the economy improves. Although still elevated in comparison to long-term averages, the share of absentee buyers — mostly investors — slid to 21.1%, the lowest percentage since April 2010, CoreLogic said.

“This is the real recovery,” Christopher Thornberg, founding partner of Beacon Economics, said of a market where increasingly buyers actually want to live in the houses they purchase. “The last was the investor recovery.”

Sustained job growth has given more people the confidence to buy houses, CoreLogic analyst Andrew LePage said. California added a robust 54,200 jobs in May, one of the strongest showings in the last year.

The housing market improvement extends nationally, with sales of previously owned homes up in May to the highest pace in nearly six years, partly because more first-time buyers entered the market, according to data from the National Assn. of Realtors.

One factor driving deals is an expected decision from the Federal Reserve to raise its short-term interest rate later this year, real estate agents say.

In response, families rushed to lock in historically low rates this spring, agents say. CoreLogic’s sales figures represent closed deals, meaning most went into escrow during May.

Leslie Appleton-Young, chief economist for the California Association of Realtors, cautioned that the market still has too few homes for sale and that prices have risen to a point where many can’t afford a house.

Unless that changes, sales are unlikely to reach levels in line with historical norms, she said.

“I am not saying the housing market isn’t robust,” she said.

“I think housing affordability is a big issue…The biggest problem is losing millennials to places like Denver and Austin and Seattle.”

For now, deals are on the rise and people are paying more.

Sales and prices climbed in all six south land counties: Los Angeles, Orange, Riverside, San Bernardino, San Diego and Ventura. In Orange County, the median price rose 4.9% from a year earlier to $629,500.

In Los Angeles County, prices climbed 8.7% to $500,000. 

Source: Origination News

Wealthy Russians Rush to Buy Up Luxury Greek Villas

https://i0.wp.com/s.newsweek.com/sites/www.newsweek.com/files/styles/headline/public/2015/07/08/russians-buying-luxury-greek-villas.jpg

Russian buyers are scrambling to buy bargain properties in Greece as the financial meltdown has eroded luxury real-estate prices, Damien Sharkov reported for Newsweek.

Just to give you an idea of the scale of sales: The Greek real-estate agency IRM Aegean Estate has put properties in package deals, with two villas in Corfu —private beach and all — selling together for $4.9 million.

According to the German magazine Bild, the number of luxury Greek villas bought by Russians has more than doubled in the past year, Newsweek reported.

That’s partially because of Russia’s own currency crisis — rich people are looking for safe places to park cash — but also because real-estate prices in Greece have fallen roughly 50% since 2009, Bild reported.

“If a villa on the Greek island of Syros still cost €1.6m a few years ago, it is now selling for just €800,000,” IRM founder Isabelle Razi told Newsweek. That’s a fall to roughly $870,000 from $1.74 million with today’s exchange rates.

The strengthening relationship between Russian buyers and their Greek holdings is mirrored by ties between their national governments.

Last month the two countries agreed to build a $2.27 billion gas pipeline, Sharkov reported for Newsweek, and some critics are concerned the move signifies a tug-of-war between the West and Russia, as Athens may be inching toward the Kremlin’s umbrella of influence.

Foreign Buyer Demand for Caribbean Real Estate Spikes in 2015

https://i0.wp.com/www.worldpropertyjournal.com/news-assets/Cruz-Bay-St-John-keyimage.jpg

According to analysis of inquiries conducted by Caribbean luxury property specialist 7th Heaven Properties, demand for Caribbean real estate has doubled during the first six months of 2015 compared to the same period last year.

Analysis of inquiries received via the 7th Heaven Properties website and the company’s magazine The Caribbean Property Investor indicates that interest in residential and commercial real estate in the Caribbean has increased dramatically across all price brackets.
 
Caribbean Market Highlights:

  • The majority of inquiries originate from the USA, Canada and the UK with inquiries from American and Canadian buyers more than doubling and inquiries from British buyers up over 30%.
  • Particularly high increase in inquiries for residential real estate in St Kitts & Nevis, Turks & Caicos Islands, Antigua and the Dominican Republic.
  • Inquiries for properties in all price brackets up: Inquiries for properties priced from $1m to $2m USD more than doubling, and a proportion of inquiries for properties priced below $1m USD increasing from 39% to 44%.
  • St Lucia and Jamaica have also seen a notable increase in inquiries for commercial real estate, including hotels for sale and land for development.

According to Walter Zephirin, Managing Director of London-based 7th Heaven Properties, “Inquiries for Caribbean real estate have increased dramatically during the first half of this year as economic growth in the USA, Canada and the UK has stimulated buyer confidence. Growth in demand for Caribbean property has been underpinned by the impressive performance of the region’s tourism sector, particularly in locations such as the Dominican Republic and the Turks & Caicos Islands, and the continued success of highly attractive Citizenship by Investment Programs in St Kitts & Nevis and Antigua. “
 
Zephirin added, “The outlook for the second half of 2015 is extremely promising with a strong sales pipeline. A succession of announcements on increasing airlift to the region and major resort developments linked to Robert de Niro in Antigua & Barbuda and Leonardo DiCaprio in Belize, as well as the first licensed casino in Jamaica have boosted the Caribbean’s profile and enhanced its accessibility and appeal to buyers.”

Read more at the World Property Channel

An Inside Look At Manhattan’s Billionaires’ Row

https://i0.wp.com/ei.marketwatch.com//Multimedia/2015/07/02/Photos/ZH/MW-DP322_billio_20150702162956_ZH.jpg

Along Manhattan’s 57th Street, stretching from Columbus Circle on the west side to Park Avenue on the east, you’ll soon find more than a half-dozen glittering, ultra-exclusive condominium towers that will offer unparalleled views of Central Park — and virtually the entire city. Welcome to Manhattan’s Billionaires’ Row, the current trophy real estate of the 1%.

The mega projects, with some penthouse floor plans such as those at 432 Park Ave. expanding to more than 8,200 square feet, are expected to list on average for more than $14.5 million (or $4,375 a square foot). Some even have living rooms bigger than most condominium units in Manhattan (the average size of a condo unit in Manhattan being 1,100 square feet.)

The sky-high prices on Billionaires’ Row will also help push the average price for a unit at new developments in Manhattan to $7 million (or $2,787 a square foot) by 2017, according to Gabby Warshawer, head of research for CityRealty, a New York real-estate research firm. Manhattan condo units on average were just $1 million as recently as 2005, says Warshawer.

An inside look at ‘Billionaires’ Row’

For the Manhattan, and global, elite, trophy apartments in the sky, overlooking Central Park, will set new marks for luxury and price.

Aside from the luxuriously appointed apartments and the central location, there’s something else that’s appealing about the apartments: As Noble Black, a real-estate agent who has marketed condominium units in One57, points out, unlike many city co-ops — whose boards are famously picky and have turned down such notables as pop singer Madonna and former President Richard Nixon as potential residents — buyers on Billionaires’ Row don’t need to open up their financial books to co-op boards or even submit to interviews.

Here’s a look at what $14 million–plus will buy you along Billionaires’ Row …

These sky-high trophy homes overlooking Central Park set new marks for both luxury and price

https://i0.wp.com/ei.marketwatch.com//Multimedia/2015/07/02/Photos/ZH/MW-DP317_billio_20150702161940_ZH.jpg

157 West 57 St.

One57, built by developer Extell, was the first on the Billionaires’ Row strip to be built and is 75 stories tall and more than 1,000 feet high. The building, which includes a Park Hyatt hotel with services catering to owners’ every whim, with room service, maid service and a spa and gym, saw its penthouse apartment sell for a record $100.5 million in December 2014 to a yet-unnamed buyer. All told, the entire building’s 92 condo units were worth an estimated $2 billion and will sell for an average of $6,300 a square foot, according to CityRealty.

111 West 57th St.

Built by JDS Development Group, this extraordinarily slender skyscraper will rise 80 stories and more than 1,400 feet. That’s taller than the Empire State Building. The 60 apartments will start at $14 million according to the developer’s website and rise to $100 million, according to CityRealty. Completion is expected in 2018.

https://i0.wp.com/ei.marketwatch.com//Multimedia/2015/07/02/Photos/ZH/MW-DP320_billio_20150702162415_ZH.jpg

550 Madison Ave.

The rehab of the 37-story Sony Building will include a $150 million penthouse and possibly a five-star hotel. The skyscraper, completed in 1983, was sold to Joseph Chetrit, a real-estate developer for more than $1 billion in 2013. The sell-out price for the property will likely approach $2 billion, or more than $4,400 a square foot, CityRealty says.

https://i0.wp.com/ei.marketwatch.com//Multimedia/2015/07/02/Photos/ZH/MW-DP321_billio_20150702162545_ZH.jpg

432 Park Ave.

Currently the tallest residential building in the city at 1,396 feet, the condominium development by CIM Group/Macklowe Properties recently sold its penthouse for $99.5 million.The building’s total sales will be worth an estimated $3 billion (or nearly $6,300 a square foot), according to CityRealty, assuming the 144-unit building is sold out. Closings on the remaining units — which range from $17 million to $81 million — are expected to start at the end of the year.

53 W. 53rd St.

Hines Development’s 77-story condominium has been in the works for 10 years but has only recently started marketing its 100-plus units. The 1,050-foot-high trapezoidal tower with geodesic elements is set to be completed in 2018 and to include a unit priced at $70 million, according to CityRealty. All told, the sell-out price is anticipated at upward of $2 billion.

by Daniel Goldstein for Market Watch


Why Were So Many Chinese Company Stocks Suspended? – Bank loans against stocks

https://i0.wp.com/assets.bwbx.io/images/i_6JMcx1npDo/v1/1200x-1.jpg

At least 1,331 companies have halted trading on China’s mainland exchanges, freezing $2.6 trillion of shares, or about 40 percent of the country’s market value, Bloomberg News reports today.

The Shanghai Composite Index has fallen 5.9 percent on Wednesday, July 8th, 2015. It was about 32 percent below the peak of 5,166 it reached on June 12. The unwinding of margin loans is adding fuel to the fire. Individual investors, we all know by now, have used generous margin financing terms to enter the stock market and then build up their portfolios. Less known is that Chinese companies have been doing the exact same thing by using their own corporate stock to secure loans from banks.

This means that they stood to lose a lot when those share prices start trending dramatically lower. 

Says Nick Lawson at Deutsche Bank: “Stocks are being suspended by the companies themselves because many have bank loans backed by shares which the banks themselves may want to liquidate, joining the queues of margin sellers.”

Nomura analysts add that: “Some bank loans have been extended with shares of listed companies put up as collateral.”

Numbers here are sketchy, but the team at Nomura estimate that the total amount of such loans may be 500-600 billion yuan ($80 billion – $96 billion), which sounds like a lot but is equivalent to about 1 percent of total loans to Chinese enterprises.

Still, the dynamic now at play is reminiscent of the troubles encountered by U.S. energy firms thanks to the plunging price of oil. Many shale explorers have bank loans tied to the value of their oil and gas reserves. When the price of oil began sinking last year, those credit lines were generally reassessed at a lower value, limiting the amount of credit available to the energy companies and creating further pressure for firms that were already dealing with the fallout from dramatically lower crude prices.

The easiest way to stop a painful cycle of lower share prices leading to curbed corporate credit, further troubles for Chinese companies and then ever-increasing share price pressures is to halt stock trading altogether.

Speaking of which, the latest move from Chinese regulators announced on Wednesday bans corporate executives from selling stock for six months.

Source: Bloomberg

This vicious circle described above also explains why China’s central bank has quickly moved to support the market in an effort to limit its impact on the wider economy. 

by Tracy Alloway for Bloomberg Business News

NAR Releases Mid-2015 U.S. Economic and Housing Forecast

https://i0.wp.com/www.worldpropertyjournal.com/news-assets/Economic-Data-Chart-keyimage.jpg

According to the National Association of Realtors (NAR), the U.S. housing market will continue its gradual pace of recovery as more home buyers enter a tight housing market for the balance of 2015, being nudged by rising mortgage rates and improving consumer confidence.

NAR’s chef economist Lawrence Yun has released the following observations for the US economy at large, and for the U.S. housing market specifically:

The U.S. Economy

  • GDP growth was slightly negative in the first quarter but will pick up in the second half.  For the year as whole, GDP will expand at 2.1 percent.  Not bad but not great.  A slow hum.
  • Consumer spending will open up because of lower gasoline prices.  Personal consumption expenditure grew at 2.1 percent rate in the first quarter.  Look for 3 percent growth rate in the second half.
  1. Auto sales dropped a bit in the first quarter because of heavy snow, but will ramp up nicely in the second half. 
  2. Spending for household furnishing and equipment has been solid, growing 6 percent in the first quarter after clocking 6 percent in the prior.  Recovering housing sector is the big reason for the nice numbers.
  3. Spending at restaurants was flat.  That is why retail vacancy rates are not notching down.
  4. Online shopping is up solidly.  That is why industrial and warehouse vacancy rates are coming down.
  5. Spending for health care grew at 5 percent in the first quarter, marking two consecutive quarters of fast growth.  The Affordable Care Act has expanded health care demand.  The important question for the future is will the supply of new doctors and nurses expand to meet this rising demand or will it lead to medical care shortage?


  • Business spending was flat in the first quarter but will surely rise because of large cash holdings and high profits.
  1. Spending for business equipment rose by 3 percent in the first quarter.  Positive and good, but nothing to shout about.
  2. Spending for business structures (building of office and retail shops, for example) fell by 18 percent.  The freezing first-quarter weather halted some construction.  This just means pent-up construction activity in the second half.
  3. In the past small business start-ups spent and invested.  It was not uncommon to experience double-digit growth rates for 3 years running for business equipment.  Not happening now.  But business spending will inevitably grow because of much improved business financial conditions of lower debt and more profits and rising GDP.
  4. What has been missing is the “animal spirit” of entrepreneurship.  The number of small business start-ups remains surprisingly low at this phase of economic expansion.  


  • Residential construction spending increased 6 percent in the first quarter.  Housing starts are rising and therefore this component will pick up even at a faster pace in the second half.
  • Government spending fell by 1 percent.  At the federal level, non-defense spending grew by 2 percent, while national defense spending fell by 1 percent.  At the state and local level, spending fell by 1 percent. 
  1. The federal government is still running a deficit.  Even though it is spending more than what it takes in from tax revenue, the overall deficit level has been falling to a sustainable level.  It would be ideal to run a surplus, but a falling deficit nonetheless does provide the possibility of less severe sequestration.   
  2. U.S. government finances are ugly.  Interestingly though, they are less ugly than other countries.  That is why the U.S. dollar has been strengthening against most other major currencies.  It’s like finding the least dirty shirt from a laundry basket.
  • Imports have been rising while exports have been falling.  The strong dollar makes it so.   Imports grew by 7 percent while exports fell by 6 percent.  The net exports (at minus $548 billion) were the worst in seven years.  Fortunately, with the West Coast longshoremen back at work, the foreign trade situation will not worsen, which means it will help GDP growth.
  • All in all, GDP will growth by 2.5 to 3 percent in the second half.  That translates into jobs.  A total of 2.5 million net new jobs are likely to be created this year.
  1. Unemployment insurance filings have been rising in oil-producing states of Texas and North Dakota.
  2. Unemployment insurance filings for the country as a whole have been falling, which implies lower level of fresh layoffs and factory closings.  That assures continuing solid job growth in the second half of the year.
  • We have to acknowledge that not all is fine with the labor market.  The part-time jobs remain elevated and wage growth remains sluggish with only 2 percent annual growth.  There are signs of tightening labor supply and the bidding up of wages.  Wages are to rise by 3 percent by early next year.  The total income of the country and the total number of jobs are on the rise.

 
The U.S. Housing Market Mid-2015 Trends
  

  • Existing home sales in May hit the highest mark since 2009, when there had been a homebuyer tax credit … remember, buy a home and get $8,000 from Uncle Sam.  This tax credit is no longer available but the improving economy is providing the necessary incentive and financial capacity to buy.  Meanwhile new home sales hit a seven-year high and housing permits to build new homes hit an eight-year high.  Pending contracts to buy existing homes hit a nine-year high.
  • Buyers are coming back in force.  One factor for the recent surge could have been due to the rising mortgage rates.  As nearly always happens, the initial phase of rising rates nudges people to make decision now rather than wait later when the rates could be higher still.
  1. The first-time buyers are scooping up properties with 32 percent of all buyers being as such compared to only 27 percent one year ago.  A lower fee on FHA mortgages is helping.
  2. Investors are slowly stepping out.  The high home prices are making the rate of return numbers less attractive.
  • Buyers are back.  What about sellers?  Inventory remains low by historical standards in most markets.  In places like Denver and Seattle, where a very strong job growth is the norm, the inventory condition is just unreal – less than one month supply.
  • The principal reason for the inventory shortage is the cumulative impact of homebuilders not being in the market for well over five years.  Homebuilders typically put up 1.5 million new homes annually.  Here’s what they did from 2009 to 2014:
  1. 550,000
  2. 590,000
  3. 610,000
  4. 780,000
  5. 930,000
  6. 1.0 million
  7. Where is 1.5 million?  Maybe by 2017.


  • Building activity for apartments has largely come back to normal.  The cumulative shortage is on the ownership side.     
  • Builders will construct more homes.  By 1.1 million in 2015 and 1.4 million in 2016.  New home sales will follow this trend.  This rising trend will steadily relieve housing shortage.
  • There is no massive shadow inventory that can disrupt the market.  The number of distressed home sales has been steadily falling – now accounting for only 10 percent of all transactions. It will fall further in the upcoming months.  There is simply far fewer mortgages in  the serious delinquent stage (of not being current for 3 or more months). In fact, if one specializes in foreclosure or short sales, it is time to change the business model.
  • In the meantime, there is still a housing shortage.  The consequence is a stronger than normal home price growth.  Home price gains are beating wage-income growths by at least three or four times in most markets.  Few things in the world could be more frustrating and demoralizing than for renters to start a savings program but only to witness home prices and down payment requirements blowing past them by.        
  • Housing affordability is falling.  Home prices rising too fast is one reason.  The other reason is due to rising mortgage rates.  Cash-buys have been coming down so rates will count for more in the future.
  • The Federal Reserve will be raising short-term rates soon.  September is a maybe, but it’s more likely to be in October.  The Fed will also signal the continual raising of rates over the next two years.  This sentiment has already pushed up mortgage rates.  They are bound to rise further, particularly if inflation surprises on the upside.
  • Inflation is likely to surprise on the upside.  The influence of low gasoline prices in bringing down the overall consumer price inflation to essentially zero in recent months will be short-lasting.  By November, the influence of low gasoline prices will no longer be there because it was in November of last year when the oil prices began their plunge.  That is, by November, the year-over-year change in gasoline price will be neutral (and no longer big negative).  Other items will then make their mark on inflation.  Watch the rents.  It’s already rising at near 8-year high with a 3.5 percent growth rate.  The overall CPI inflation could cross the red line of above 3 percent by early next year.  The bond market will not like it and the yields on all long-term borrowing will rise.
  • Mortgage rates at 4.3% to 4.5% by the year end and easily surpassing 5% by the year end of 2016.
  • The rising mortgage rates initially rush buyers to decide but a sustained rise will choke off as to who can qualify for a mortgage.  Fortunately, there are few compensating factors to rising rates.
  1. Credit scores are not properly aligned with expected default rate.  New scoring methodology is being tested and will be implemented.  In short, credit scores will get boosted for many individuals after the new change.
  2. FHA mortgage premium has come down a notch thereby saving money for consumers.  By the end of the year, FHA program will show healthier finances.  That means, there could be additional reduction to premiums in 2016.  Not certain, but plausible.
  3. Fannie and Freddie are owned by the taxpayers.  And they are raking-in huge profits as mortgages have not been defaulting over the past several years.  The very high profit is partly reflecting too-tight credit with no risk taking.  There is a possibility to back a greater number of lower down payment mortgages to credit worthy borrowers without taking on much risk.  In short, mortgage approvals should modestly improve next year.     
  4. Portfolio lending and private mortgage-backed securities are slowly reviving.  Why not?  Mortgages are not defaulting and there is fat cash reserves held by financial institutions.  Less conventional mortgages will therefore be more widely available.
  • Improving credit available at a time of likely rising interest rates is highly welcome.  Many would-be first-time buyers have been more focused about getting a mortgage (even at a higher rate) than with low rates.
  • All in all, existing and new home sales will be rising.  Combined, there will be 5.8 million home sales in 2015, up 7 percent from last year.  Note the sales total will still be 25 percent below the decade ago level during the bubble year.  Home prices will be rising at 7 percent.  For the industry, the business revenue will be rising by 14 percent in 2015.  The revenue growth in 2016 will be additional 7 to 10 percent. 

London Is Now The Global Money-Laundering Center For The Drug Trade, Says Crime Expert

London’s financial center skyline

The City of London is the money-laundering center of the world’s drug trade, according to an internationally acclaimed crime expert.

UK banks and financial services have ignored so-called “know your customer” rules designed to curb criminals’ abilities to launder the proceeds of crime, Roberto Saviano warned. Mr Saviano, author of the international bestseller Gomorrah, which exposed the workings of the Neapolitan crime organization  Camorra, said: “The British treat it as not their problem because there aren’t corpses on the street.”


His warning follows a National Crime Agency (NCA) threat assessment which stated: “We assess that hundreds of billions of US dollars of criminal money almost certainly continue to be laundered through UK banks, including their subsidiaries, each year.”


Last month, the NCA warned that despite the UK’s role in developing international standards to tackle money laundering, the continued extent of it amounts to a “strategic threat to the UK’s economy and reputation”. It added that the same money-laundering networks used by organized crime were being used by terrorists as well.

https://i0.wp.com/www.independent.co.uk/incoming/article10366294.ece/alternates/w460/8-saviano-teri-pengilley2.jpg

Roberto Saviano’s ‘Gomorrah’ has sold 10 million copies around the world (Teri Pengilley)

Interviewed by The Independent on Sunday, Mr Saviano said of the international drugs trade that “Mexico is its heart and London is its head”. He said the cheapness and the ease of laundering dirty money through UK-based banks gave London a key role in drugs trade. “Antonio Maria Costa of the UN Office on Drugs and Crime found that drug trafficking organizations were blatantly recycling dirty money through European and American banks, but no one takes any notice,” he said. “He found that banks were welcoming dirty money because they need cash, liquidity during the financial crisis. The figures are too big to be rejected …. Yet there was no reaction.”

Referring to HSBC’s record $1.9bn (£1.2bn) US fine for money laundering for the Mexican Sinaloa drugs cartel in 2012, Mr Saviano said: “The biggest UK bank! Yet it has scarcely been written about. The British treat it as not their problem, because there aren’t corpses on the streets.

“They think it’s all happening ‘over there somewhere’, so they needn’t worry about it. Sure, HSBC has been reported but there has been no debate. You need to fill the papers. The intellectuals have said nothing. [David] Cameron has said nothing. It’s his country. How can he say nothing on such a piece of news?”

US justice officials concluded HSBC was guilty of “stunning failures of oversight – and worse, that led the bank to permit narcotics traffickers and others to launder hundreds of millions of dollars through HSBC subsidiaries and facilitate hundreds of millions more in transactions with sanctioned countries”, including money banked for Middle East terror groups.

He accused the British Government, together with Austria, of consistently blocking anti-money-laundering moves by the European Union. “They will carry on like that until someone gets killed here by the Russians or the Italians. ” he said. Mr Saviano said he feared one reason was because banks are a key source of political funding.

“Every time there’s an election campaign, I wonder if someone will come forward and start a campaign on money laundering … but it never happens. The reason, I am convinced but I don’t have the proof, is that a good part of the money that comes from money laundering goes into the election campaign. Not illegally, legally, because it can come in because of a lack of regulation.”

Labour MP David Lammy is worried about London’s dirty money

Labour MP David Lammy is worried about London’s dirty money (Getty)

Twenty years ago, drug money was laundered offshore because the top international banks “were afraid of opening their doors to dirty money, they were afraid of losing control”, he said. “The more criminal capital comes in, the more criminals there are on the boards. The Mafia set up its own bank, Michele Sindona’s Banca Privata Finanziaria, and the other banks would have nothing to do with them,” he said. “Not any more. Now, because of the problem of cash, they can’t wait to get the Mafia organizations in.”

Labour MP David Lammy, who met Mr Saviano last week, said the UK needed to take “very seriously” his claims about its financial services’ role in the international drugs trade. Mr Lammy, who is seeking to become Mayor of London in 2016, said: “We are rightly proud of our financial services industry in this country, but we cannot afford to be complacent.

“I am particularly concerned that London’s inflated property prices are fuelled by dirty money and I will do everything in my power as mayor to ensure that money laundering and tax evasion are rooted out by the authorities.”

 by James Hanning

Sugar Daddies Are Paying Their Share Of The $1.3 Trillion Student Loan Balance

As noted previously, we are in a new dark age where college does not pay. At $1.3 trillion, the student debt balance is not getting any smaller. Facing a lifetime of debt slavery, the millennial generation is doing whatever they can to avoid homelessness. Whether it’s stripping or working at Rent A Gent, all options are on the table. Now, they are flocking to Seeking Arrangement to prostitute themselves so they can pay for school. Since 2009, the number of student sugar babies has increased by 1,200%!

The labor force participation rate for college graduates has been on a relentless downtrend.

Bachelor Degree Labor Force Participation

It is getting even more expensive to go to school. Even after adjusting for inflation, college costs have gone up more than 400% in the last 30 years.

College Tuition

The student loan balance has nearly tripled in the last decade.

Student Loans

Many young people don’t see any good alternatives to going to school, so they jump in head first. Facing enormous bills, they turn to sites like Seeking Arrangement for help. These aren’t just women either. 15% of student sugar babies are men, and plenty of sugar mommas are on the site too.

Here are the numbers.

Seeking Arrangement Stats

And here are the sugar babies by major.

Top Sugar Baby Majors

The abundance of nurses on Seeking Arrangement shouldn’t be surprising for regular readers. Personal care aides and nurses are the fastest growing jobs in America.

Most New Jobs

Here are the perks of Seeking Arrangement.

Sugar Baby Perks

And here are the sugar babies.

Sugar Babies

Previously, it was common for students to take food and service jobs, but soon, you will hear college students casually sharing their day with their sugar daddy. Welcome to the modern hooker economy.

by Daniel Drew

The ‘new normal’ in America’s job market

https://i0.wp.com/static6.businessinsider.com/image/55969e4eeab8ea716a45608b-600-/unemployment-union-line-4.jpg

A job seeker yawns as he waits in front of the training offices of Local Union 46, a union representing metallic lathers and reinforcing iron workers, in the Queens borough of New York.

WASHINGTON (AP) — Even after another month of strong hiring in June and a sinking unemployment rate, the U.S. job market just isn’t what it used to be.

Pay is sluggish. Many part-timers can’t find full-time work. And a diminished share of Americans either have a job or are looking for one.

Yet in the face of global and demographic shifts, this may be what a nearly healthy U.S. job market now looks like.

An aging population is sending an outsize proportion of Americans into retirement. Many younger adults, bruised by the Great Recession, are postponing work to remain in school to try to become more marketable. Global competition and the increasing automation of many jobs are holding down pay.

Many economists think these trends will persist for years despite steady job growth. It helps explain why the Federal Reserve is widely expected to start raising interest rates from record lows later this year even though many job measures remain far below their pre-recession peaks.

“The Fed may recognize that this is a new labor-market normal, and it will begin to normalize monetary policy,” said Patrick O’Keefe, an economist at accounting and consulting firm CohnReznick.

Thursday’s monthly jobs report from the government showed that employers added a solid 223,000 jobs in June and that the unemployment rate fell to 5.3 percent from 5.5 percent in May. Even so, the generally improving job market still bears traits that have long been regarded as weaknesses. Among them:

— A shrunken labor force.

The unemployment rate didn’t fall in June because more people were hired. The rate fell solely because the number of people who had become dispirited and stopped looking for work far exceeded the number who found jobs.

The percentage of Americans in the workforce — defined as those who either have a job or are actively seeking one — dropped to 62.6 percent, a 38-year low, from 62.9 percent. (The figure was 66 percent when the recession began in 2007.) Fewer job holders typically means weaker growth for the economy. The growth of the labor force slowed to just 0.3 percent in 2014, compared with 1.1 percent in 2007.

“It is highly unlikely that we are going to see our (workforce) participation rate move anywhere near where it was in 2007,” O’Keefe says.

This marks a striking reversal. The share of Americans in the workforce had been steadily climbing through early 2000, and a big reason was that more women began working. But that influx plateaued in the late 1990s and has drifted downward since.

— The retirement of the vast baby boom generation.

The aging population is restraining the growth of the workforce. The pace of retirements accelerated in 2008, when the oldest boomers turned 62, when workers can start claiming some Social Security benefits. Economists estimate that retirements account for about half the decline in the share of Americans in the workforce since 2000.

From that perspective, the nation as a whole is beginning to resemble retirement havens such as Florida. Just 59.3 percent of Floridians are in the workforce.

— Younger workers are starting their careers later.

Employers are demanding college degrees and even postgraduate degrees for a higher proportion of jobs. Mindful of this trend, teens and young people in their 20’s are still reading textbooks when previous generations were punching time clocks.

The recession “basically told everybody that they need an education to get better jobs,” says John Silvia, chief economist at Wells Fargo. “So how would young people respond? They stayed in school.”

Fewer than 39 percent of 18- and 19-year-olds are employed, down from 56 percent in 2000. For people ages 20 to 24, the proportion has fallen to 64 percent from 72 percent.

— The number of part-timers who would prefer full-time work remains high.

About 6.5 million workers are working part time but want full-time jobs, up from 4.6 million before the recession began. This is partly a reflection of tepid economic growth. But economists also point to long-term factors: Industries such as hotels and restaurants that hire many part-timers are driving an increasing share of job growth, researchers at the Federal Reserve Bank of San Francisco have found.

As more young adults put off working, some employers are turning to older workers to fill part-time jobs. Older workers are more likely to want full-time work, raising the level of so-called involuntary part-time employment.

Many economists also point to the Obama administration’s health care reforms for increasing part-time employment. The law requires companies with more than 100 employees to provide health insurance to those who work more than 30 hours.

Michael Feroli, an economist at JPMorgan Chase, says this could account for as much as one-third of the increase in part-time jobs.

— Weak pay growth.

The average hourly U.S. wage was flat in June at $24.95 and has risen just 2 percent over the past year. The stagnant June figure dispelled hopes that strong job growth in May heralded a trend of steadily rising incomes.

In theory, steady hiring is supposed to reduce the number of qualified workers who are still seeking jobs. And a tight supply of workers tends to force wages up.

Yet a host of factors have complicated that theory. U.S. workers are competing against lower-paid foreigners. And automation has threatened everyone from assembly line workers to executive secretaries.

Still, economists at Goldman Sachs forecast that average hourly pay will grow at an annual pace of about 3.5 percent by the end of 2016. That is a healthy pace. But it will have taken much longer to reach than in previous recoveries.

Crude Oil Remains A ‘Sell’ After Rising Imports Fuel Surprise Inventory Build

Summary

  • Crude oil prices closed down 4% yesterday, breaking through a 2-month support level at $57/barrel, after an EIA report showed an unexpected build in inventories.
  • I argue that the domestic supply/demand balance has not improved and is just as bearish now as it was last winter when oil was in free fall.
  • Based on my analysis of supply/demand data presented in this article, I believe crude oil has further to fall.
  • My trading strategy, including holdings, price targets, and entry/exit points are discussed in detail.
 

By Force Majeure

After trading tightly range-bound between $58/barrel and $61/barrel since mid-April, crude oil finally broke down yesterday, after an EIA Petroleum report showed that crude oil inventories increased more than expected. The commodity slid 4.2% – its largest single-day loss since April 8 – to a 9-week low closing price of $56.92/barrel. The commodity is down 6.6% since recording a peak of $61/barrel one week ago on Tuesday. Further weighing on prices were unclear reports of a draft of an Iranian nuclear deal that would relax sanctions and permit a resumption of exports, as well as continued fears over Greece’s exit from the eurozone. This article will discuss yesterday’s EIA inventory report and use this data to support my argument that crude oil supply and demand remain just as unbalanced presently as when oil was trading at $45 per share, justifying my continued bearish position on the commodity.

In yesterday’s Petroleum Report for the week ending June 26, the EIA announced that crude oil inventories increased by 2.4 million barrels, versus the analyst consensus for a 2-million barrel storage withdrawal. The storage build was also markedly bearish compared to last week’s 4.9 million barrel withdrawal, last year’s 3.2 million barrel withdrawal and the 5-year average 4.1 million barrel withdrawal. It was the first storage injection in 9 weeks since the week ending April 24. Storage injections during the final week of June are highly unusual, and last week’s build was the first storage injection during the last week of June since the week ending June 29, 2007, and only the third this millennium.

At 480 million barrels, total crude oil storage is 90 million barrels above the five-year average inventory level and 80 million barrels above last year’s level, versus a 84 and 75 million barrel surplus last week, respectively. The increase in crude oil surplus is a sharp departure from the past two months which had seen surpluses, versus the five-year average decline in 8 of the past 9 weeks from a peak of over 113 million barrels. Figure 1 below shows the storage surplus versus the five-year average and 2014 over the past year.

(click to enlarge)

Figure 1: Crude oil storage surplus versus 2014 and the 5-year average showing an increase in the surplus after several weeks of decline. [Source: Chart is my own, data from the EIA.]

What happened over the past week that led to such an abrupt change in crude oil supply/demand balance?

Not much, I argue. And that is the problem.

There are three components of US supply/demand balance – domestic production, demand (measured by refinery inputs), and imports.

Domestic production was largely unchanged last week, declining by 9,000 barrels per day, from 9.604 million barrels per day the previous week to 9.595 million barrels last week. Domestic production remains at record highs, despite an oil rig count that has fallen 60% since October. Production is up 1.2 million barrels year-over-year.

Crude oil demand was likewise flat week-over-week, declining a negligible 1,000 barrels per day last week to 16.531 million barrels per day. Demand is up 313,000 barrels per day year-over-year. Note that this is well shy of the 1.2 million barrel per day year-over-year increase in production. As a result, the purely domestic supply/demand picture – demand minus US production – is markedly loose compared to last year. Figure 2 below compares the purely domestic supply/demand picture for 2015 versus 2014.

(click to enlarge)

Figure 2: Purely domestic crude oil supply/demand balance equal to demand minus domestic production. Supply/demand remains loose to 2014 and has been flat over the past 2 months, indicating minimal tightening of the market. [Source: Chart is my own, data from the EIA.]

Note that last year at this time, demand exceeded domestic production by 7.8 million barrels per day, while last week, this spread was just 6.9 million barrels. Further, despite all of the hullabaloo over record demand and declining domestic production, this spread is sitting near the 2015-to-date average of 6.6 million barrels, and has been essentially flat since late April.

It is the third component of the US supply/demand picture – imports – that drove last week’s bearish storage build and had been masking the persistent supply/demand mismatch shown above in Figure 2 that allowed crude oil to rally more than 30% off the March lows. Imports increased by 748,000 barrels per day last week to 7.513 million barrels per day. It was the largest week-over-week increase since the week ending April 3rd and the largest daily average since the week of April 17th. Nevertheless, the 7.5 million barrel per day tally was a mere 170,000 barrels per day above the 1-year average import level. Figure 3 below plots crude oil imports versus the 1-year average over the last 12 months.

(click to enlarge)

Figure 3: Crude oil imports versus the 1-year average. After 2 months well below the 1-year average, crude oil demand rebounded last week. [Source: Chart is my own, data from the EIA.]

Note that after hovering in the 6.75-7.25 million barrel per day range since late April, last week’s imports were merely a return to the baseline. Furthermore, imports have room to go even higher. Figure 4 below shows the week-over-week change and the departure from 2015-to-date average imports by country.

(click to enlarge)

Figure 4: Crude oil imports by nation with week-over-week and departure versus the 2015 average included. While imports from Canada rebounded last week, large deficits versus the 2015 average remain in Canada, Saudi Arabia, and Mexico. [Source: Chart is my own, data from the EIA.]

Note that the second-largest weekly increase in imports last week came from our biggest oil trading partner, Canada, where imports increased by 142,000 barrels per day. However, thanks to persistent wildfires in Alberta’s prolific oil sands, imports are still 187,000 barrels per day below their 2015 average. As these wildfires have largely diminished, I expect Canadian imports will continue to increase, from 2.8 million barrels per day last week back to their 3.0 million barrel per day 2015 average in coming weeks. An even more impressive departure versus the 2015 average was seen in Saudi Arabia, where imports remained flat at 700,000 barrels per day last week, more than 250,000 barrels below their 2015 average of 992,000 barrels per day. Saudi Arabia is a country whose rig count is at record highs and which is spearheading the effort to destroy the US shale oil industry, so I expect these imports will recover rapidly over the next month. Finally, our third-largest trading partner, Mexico, saw its imports slide 290,000 barrels per day last week, and currently sit 215,000 barrels per day below its 2015 average – likely another short-term anomaly. Were just these three countries to have had their imports at 2015 baseline levels, last week’s storage build would have been a massive 7.1 million barrels. The gains seen in Venezuela, Kuwait, and other smaller trading partners that sent tallies above their 2015 averages may be at least partially attributable to a surge in Gulf Coast imports following delays caused by Tropical Storm Bill, and therefore, may decline in coming weeks. However, I expect the net change in imports to be upwards over the next month, putting further pressure on the supply/demand balance.

My rationale for emphasizing imports compared to US production and demand is that I believe that they have been artificially creating the appearance of a tightening supply/demand balance. Thanks to wildfires in Canada, Tropical Storm Bill interrupting shipments in the Gulf of Mexico, and unrest in the Middle East, imports during April, May, and early June (as shown in Figure 3) were depressed below the five-year average. This correlated strongly with a transition to storage withdrawals that helped to fuel the back-end of crude oil’s 30% rally from the March low of $43/barrel to $61/barrel. Figure 5 below compares crude oil weekly storage injections/withdrawals to imports.

(click to enlarge)

Figure 5: Crude oil storage changes versus imports. There is a strong correlation between storage withdrawals between May and late June and a decline in imports. Storage injections resumed last week, following a surge in imports. This supports imports being the major driver of the domestic supply/demand balance over the past few months. [Source: Chart is my own, data from the EIA.]

During this same period (as shown in Figure 2), domestic production and demand remained relatively unchanged. As a result, I firmly believe that the decline in imports hoodwinked many investors into thinking that the supply/demand balance was permanently tightening, due either to increasing demand from cheap oil or declining production from the declining rig count, when it was really a temporary drop in imports. Now that imports have returned to a baseline level, this “masking” of the supply/demand balance has been lifted, and the result was a bearish injection similar to those seen during oil’s springtime free fall – but during a time when the market expects withdrawals. It is therefore unsurprising that oil retreated to the tune of 4% yesterday.

What I believe to be even more concerning is that there is little room to go higher on the demand front. Refinery utilization – the percentage of US refinery capacity that is being utilized to convert crude oil to gasoline and other finished products – was at 95.0% last week. This is the highest refinery utilization during the final week of June over the last 10 years. Figure 6 below shows refinery utilization for the last week of June from 2006 to the present.

(click to enlarge)

Figure 6: Refinery utilization during the final week of June for the past 10 years showing that, at 95%, 2015’s utilization is the highest of the decade. [Source: Chart is my own, data from the EIA.]

Furthermore, the maximum refinery utilization during any week in the last 10 years was 95.4%, recorded several times, most recently last December. As a result, at 95.0% refinery, utilization is nearly at its maximum capacity. The fact that we saw a 2.4 million barrel storage injection, with demand near its maximal level pulling hard at crude oil inventories and with imports still with room to run higher, suggests to me that oil still has room to fall.

Oil’s 4% decline to under $57/barrel represented a major breakdown not only from a fundamental level, as discussed above, but from a technical level. During the 44-day period from April 29 to June 30, crude oil had traded within a tight $4.17 range between $61.43/barrel and $57.26/barrel, the narrowest range since March 2004. Oil broke out of that range yesterday. Figure 7 plots the price of crude oil over the last 3 months, showing the rally, range-bound action, and the breakdown yesterday.

(click to enlarge)

Figure 7: Crude oil prices over the last 2 months showing range-bound trading largely between $58/barrel and $61/barrel. followed by a breakdown yesterday. [Source: Chart is my own, data from the EIA.]

Now that oil has fallen below its 2-month support level, I would not be surprised if more investors head for the exits.

I continue to hold three positions betting on a continued downtrend in crude oil prices. I own a 10% short position in the popular United States Oil ETF (NYSEARCA:USO) – increased from 5% last week – a large 15% short position in the leveraged VelocityShares 3x Long Crude Oil ETN (NYSEARCA:UWTI), and a 5% short position in the Market Vectors Russia ETF (NYSEARCA:RSX). The latter provides short exposure to an oil-driven economy, as well as the turmoil encompassing Europe. The short UWTI position is a higher-risk play on leverage-induced decay due to choppy trading. USO, of course, is a safer direct play on declining oil prices.

Should oil drop to $55/barrel – which has long been my short-term price target – I will begin to aggressively cover my UWTI short position to protect profits in a highly volatile trade, which is currently up 20% and would likely be pushing 35% if oil reaches $55/barrel. I will likewise plan to close out my RSX short around the same level to lock in profits, should the European crisis appear to be resolving.

However, I plan to hold USO for the foreseeable future. Following yesterday’s decline, contango in the oil futures market is again rising, with the 4-month spread up to $1.21, or 2.2%, after bottoming out at $0.86 last week. Should oil continue to fall, the contango will likely widen further, and I could easily see contango-generated returns topping 5% on a position held through the Fall. I feel USO is a safer, less volatile long-term hold than UWTI (despite the fact that UWTI triples the contango-generated gains and also benefits from leverage-induced decay). My price target to close out my USO position is currently $50/barrel. Factors that would likely cause me to cover sooner would include any socioeconomic forces that look like they would suppress imports for an extended period, or if US production (finally) begins declining in a meaningful way. As a result, my “stop” is a fundamental stop, and I do not have a specific stop price. Should oil rally in the face of the current bearish fundamentals, I will even consider adding to my USO short position up to 15%. If I had no crude oil short exposure, I would be reluctant to open a position here with oil down 7% in a week. Rather, I would wait for a bounce before initiating any position.

In conclusion, I believe that US crude oil demand and production remain in a stable, bearish pattern. Instead, the fundamental supply/demand picture is, and has been, dictated by fluctuations in crude oil imports. I do not believe that the underlying fundamental picture has changed since March, and that a return to baseline import levels last week following months of temporary suppression unmasked this persistent supply/demand imbalance. With crude oil demand unlikely to go higher with refineries near peak capacity, domestic production stable, and crude oil imports with room to go even higher, particularly from Canada and Saudi Arabia, I expect continued weakness in crude oil in the months to come. Once the summer driving season fades and demand declines, I would not be surprised to see the domestic oil surplus climb back above 100 million barrels over the next 1-3 months. Further exacerbating bearish sentiment are the possible resumption of Iranian exports and continued anxiety over Greece and the eurozone, although I believe these fears to be secondary to the ongoing domestic storage glut. My 1-3 month price target is $55/barrel, with a potential to drop as low as $50/barrel during this time. As a result, I plan to hold my large basket of crude oil short positions in USO, UWTI, and RSX.

Additional disclosure: As noted in the article, I am also short RSX and UWTI.

The Recovery Ship Has Sailed

“Today is Day 1 of Year 7 of the ‘recovery’, and yet economists everywhere proclaims 3% growth is just around the corner,” rages Jim Bianco as he addresses what ‘bugs him’, exclaiming “that ship has sailed.” Bianco and Santelli go on to slay Keynesian big government dragons and the incessant bullshit from officials like Jack Lew who opine on Greece and other potential systemic risks as being a non-event – “what is priced in is that everything will work itself out at the 11th hour,” leaving a huge asymmetric risk.

Well worth the price of admission…

Source: Zero Hedge


California Housing Market Slows Considerably

Non-distressed sales drop for the first time since 2005

https://i0.wp.com/images.china.cn/attachement/jpg/site1007/20090305/001ec94a26ba0b198ebd25.jpg

California’s massive housing market is slowing down in almost every way imaginable, according to the latest California Real Property Report from PropertyRadar.

California single-family home and condominium sales dropped 3.5% to 36,912 in May from 38,249 in April

However, the report explained that what is unusual this month is that the decrease in sales was due to a decline in both distressed and non-distressed property sales that fell 8.6% and 2.5%, respectively.  The monthly decline in non-distressed sales is the first May decline since 2005.

On a yearly basis, sales were up slightly, gaining 2.3% from 36,096 in May 2014. 

“With the exception of a few counties, price increases have slowed considerably,” said Madeline Schnapp, director of economic research for PropertyRadar. “You cannot defy gravity.”

“The environment of rising prices on lower sales volumes was destined not to last.  Higher borrowing costs since the beginning of the year and decreased affordability was bound to impact sales sooner or later. We may also be seeing the fourth year in a row where prices jumped early in the year, only to roll-over and head lower later the rest of the year,” Schnapp continued.

Back in March, PropertyRadar’s report showed California was finally ramping up for the spring homebuying season, posting that March single-family home and condominium sales surged to 31,989, a 33.1% jump from 24,031 in February. It was the biggest March increase in three years. 

Meanwhile, May’s median price of a California home was nearly unchanged at $396,750 in May, down 1.8% from $404,000 in April. 

Within California’s 26 largest counties, most experienced slight increases in median home prices, edging higher in 21 of California’s largest 26 counties.

Year-over-year, the median price of a California home was nearly unchanged, up 0.4% from $395,000 dollars in April 2014.

While at the county level most of California’s 26 largest counties exhibited slower price increases, four counties continued to post double digit gains.

Bank Stock Prices Fall When Interest Rates Rise: Lessons from Bank Of America 1974

by Donald Van Deventer

Summary

  • Wm. Mack Terry explained the basics of how rates impact bank stocks at Bank of America in 1974. Net income goes up, margins go up, and stock price goes down.
  • We value a bank by replication, assembling a series of Treasury securities with the same financial characteristics as a bank. All of Mr. Terry’s conclusions are correct.
  • A more technical analysis and references are provided. Correlations with 11 different Treasury yields are added in Appendix A. Finally, a worked example is given in Appendix B.
 

We want to thank our readers for the very strong response to our June 17, 2015, note “Bank Stock Prices and Higher Interest Rates: Lessons from History.” For those readers who asked “is the correlation between Treasury yields and bank stock prices negative at other maturities besides the 10 year maturity?” – we include Appendix A. Appendix A shows that for all nine bank holding companies studied, there is negative correlation between the bank’s stock price and Treasuries for all maturities but two. One exception is the 1-month Treasury bill yield, which is the shortest time series reported by the U.S. Department of the Treasury. The 1-month Treasury bill yield has only been reported since July 31, 2001. The correlation between the longer 3-month Treasury bill yield series and the stock prices of all nine bank holding companies is negative. The other series that occasionally has positive correlations is the 20 year U.S. Treasury yield, which is the second shortest yield series provided by the U.S. Department of the Treasury.

In this note, we use modern “no arbitrage” finance and a story from 1974 to explain why there is and there should be a negative correlation between bank stock prices and interest rates. We finish with recommendations for further reading for readers with a very strong math background.

Wm. Mack Terry and Lessons from the Bank of America, 1974

In the summer of 1974 I began the first of two internships with the Financial Analysis and Planning group at Bank of America (NYSE:BAC) in San Francisco. My boss was Wm. Mack Terry, an eccentric genius from MIT and one of the smartest people ever to work at the Bank of America. One day he came to me and made a prediction. This is roughly what he said:

“Interest rates are going to go up, and two things are going to happen. Our net income and our net interest margins are going to go up, and our senior management is going to claim credit for this. But they’ll be wrong when they do so. Our income will only go up because we don’t pay interest on our capital. Shareholders are smart and recognize this. When they discount our free cash flow at higher interest rates, even with the increase on capital, our stock price is going to go down.”

Put another way, higher rates never increase the value of investments of capital funds, and the hedged interest rate spread is a long term fixed rate security that drops in value when rates rise. That is unless the leading researchers are completely wrong in their finding that credit spreads narrow when rates rise.

Everything Mack predicted came true. The 1-year U.S. Treasury yield was in the 8 percent range in the summer of 1974. It ultimately peaked at 17.31% on September 3, 1981. The short run impact of the rate rise was positive at Bank of America, but the long run impact was devastating. By the mid-1980s, the bank was in such distress that my then employer First Interstate Bancorp launched a hostile tender to buy Bank of America.

Their biggest problem was an interest rate mismatch, funding 30 year fixed rate mortgages with newly deregulated consumer deposits when rates went up.

The point of the story is not the anecdote about Bank of America per se. Why was Mack’s prediction correct? We give the formal academic references below, but we can use modern “no arbitrage” financial logic to understand what happened. We model a bank that’s assumed to have no credit risk by replication, assembling the bank piece by piece from traded securities. This was the approach taken by Black and Scholes in their famous options model, and it’s a common one in modern “no arbitrage” finance. We take a more complex approach in the “Technical Notes” section. For now, let’s make these assumptions to get at the heart of the issue:

  1. We assume the bank has no assets that are at risk of default.
  2. All of its profits come from investing at rates higher than U.S. Treasuries and by taking money from depositors at rates lower than U.S. Treasury yields
  3. We assume that the bank borrows money in such a way that all assets financed with borrowed money have no interest rate risk: the credit spread is locked in. We assume the net interest margin is locked in at a constant dollar amount that works out to $3 per share per quarter.
  4. We assume this constant dollar amount lasts for 30 years.
  5. With the bank’s capital, we assume the bank either buys 3-month Treasury bills or 30-year fixed rate Treasury bonds. We analyze both cases.
  6. We assume taxes are zero and that 100% of the credit spread cash flow is paid out as dividends to keep things simple.
  7. We assume the earnings on capital are retained and grow like the proceeds of a money market fund.

We use the U.S. Treasury curve of June 18 to analyze our simple bank. The present value of a dollar received in 3 months, 6 months, 9 months, etc. out to 30 years can be calculated using U.S. Treasury strips (zero coupon bonds) whose yields are shown here:

(click to enlarge)

We write the present value of a dollar received at time tj as P(tj). The first quarter is when j is 1. The last quarter is when j is 120. The cash flow thrown off to shareholders from the hedged borrowing and lending is the sum of $3 per quarter times the correct discount factors out to 30 years.

The sum of the discount factors is 81.02. When we say “the sum of the discount factors,” note that means that the entire 30 year Treasury yield curve is used in valuing the bank’s franchise, even if the bank makes that $3 per quarter rolling over short term assets and liabilities. When we multiply the sum of the discount factors by $3 per quarter, the value of the hedged lending business contributes $3 x 81.02 = $243.06 to the share price. This calculation is given in Appendix B.

How about the value of earnings on capital? And how much capital is there? The short answer is that it doesn’t matter – we’re just trying to illustrate valuation principals here. But let’s assume the $3 in quarterly “spread” income, $12 a year, is 1% of assets. That makes assets $1200 (per share). With 5% capital, we’ll use $60 as the bank’s capital. We analyze two investment strategies for capital: Strategy A is to invest in 3-month Treasury bills. They are yielding 0.01% on June 18. Strategy B is to invest in the current 30 year Treasury bond, yielding 3.14% on June 18. Let’s evaluate the stock price right now under both strategies. If rates don’t move, the current outlook is this if the bank invests its capital in Treasury bills using Strategy A:

Net income will be $12.006 per year. The value of capital at time zero is $60 because we’ve invested $60 in T-bills worth $60. The value of the hedged “spread lending” franchise, discounted over its 30-year life, is $243.060. That means the stock price must be the sum of these two pieces or there’s a chance for risk-less arbitrage. The stock price must be $303.060.

What happens to the stock price if, one second after we buy the stock, zero coupon bond yields across the full yield curve rise by 1%, 2%, or 3%? This is a mini-version of the Federal Reserve’s Comprehensive Capital Analysis and Review stress tests. The stock price changes like this:

Higher rates are “good for the bank” in the sense that net income will rise because earnings on the 3-month Treasury bills will be 1%, 2% or 3% higher. This is exactly what Mack Terry explained to me in 1974. This has no impact on stock price, however, because the investment in T-bills is like an investment in a money market fund. Since the discount factor rises when the income rises, the value is stable. So the value of the invested capital is steady at $60. See the “Technical Notes” references for background on this. What happens to the value of the spread lending franchise? It gets valued just like a constant payment mortgage that won’t default or prepay. The value drops from $243.06 to either $215.04, $191.55 or $171.72. The calculations also are given in Appendix B. The result is a stock price that’s lower in every scenario, dropping 9.25%, 17.00% or 23.54%.

But wait, one might ask. Won’t the amount of lending increase and credit spreads widen at higher rates? Before we answer that question, we can calculate our breakeven expansion requirements. For the value of the lending franchise to just remain stable, we need to restore the value from 215.04, 191.55 or 171.72 to 243.06. This requires that the cash flow expand by 243.06/215.04-1 in the “up 1%” scenario. That means our cash flow has to expand by 13.03% from $12 a year to $13.56 per year. For the up 2% and up 3% scenarios, the increases have to be by 26.89% or 41.54%.

Just from a common sense point of view, this expansion of lending volume seems highly unlikely at best. A horde of academic studies discussed in Chapter 17 of van Deventer, Imai and Mesler also have found that when rates rise, credit spreads shrink rather than expand. Selected references are given in the “Technical Notes.”

Is Strategy B a better alternative? Sadly, no, because the income on invested capital stays the same (3.14% times $60) and the present value of the 30-year bond investment falls. Here are the results:

Good News and Conclusions

There is some good news in this analysis. Given the assumptions we have made, this bank will never go bankrupt. Because the assets funded with borrowed money are perfectly hedged from a rate risk point of view, the bank is in the “safety zone” that Dr. Dennis Uyemura and I described in our 1992 introduction to interest rate management, Financial Risk Management in Banking. The other good news is that Mack Terry’s example shows that the entire spectrum of Treasury yields is used to value bank stocks because the cash flow stream from the banking franchise spans a 30-year time horizon.

This example shows that, under simple but relatively realistic assumptions, the value of a bank can be replicated as a portfolio of Treasury-related securities. This portfolio falls in value when rates rise. The negative correlation between Treasury yields that 30 years of history shows is not spurious correlation – it’s consistent with the fundamental economics of banking when interest rate risk is hedged.

Wm. Mack Terry knew this in 1974, and legions of interest rate risk managers of banks have replicated this simple example in their regular interest rate risk simulations that are required by bank regulators around the world. What surprises me is that people are surprised to learn that higher interest rates lower bank stock prices.


Technical Notes

When writing for a general audience, some readers become concerned that the author only knows the level of analysis reflected in that article. We want to correct that impression in this section. We start with some general observations and close with references for technically oriented readers:

  1. For more than 50 years, beginning with the capital asset pricing model of Sharp, Mossin and Lintner, securities returns have been analyzed on an excess return basis relative to the risk free rate as a function of one or more factors. It is well known that the capital asset pricing model itself is not a very accurate description of security returns as a function of the risk factors.
  2. Arbitrage pricing theory expanded explanatory power by adding factors. Merton’s inter-temporal capital asset pricing model (1974) added interest rates driven by one factor with constant volatility.
  3. Best practice in modeling traded asset returns is defined by Amin and Jarrow (1992), who build on the multi-factor Heath, Jarrow and Morton interest rate model which allows for time varying and rate varying interest rate volatility. Amin and Jarrow also allow for time varying volatility as a function of interest rate and other risk factors.
  4. This is the procedure my colleagues and I use to decompose security returns. An important part of that process is an analysis of credit risk, as explained by Campbell, Hilscher and Szilagyi (2008, 2011). Jarrow (2013) explains how credit risk is incorporated in the Amin and Jarrow framework. This is the procedure we would explain in a more technical forum, like our discussion with clients.
  5. Asset return analysis is built on the Heath Jarrow and Morton interest rate simulation. The most recent 100,000 scenario simulation for U.S. Treasury yields (“The 3 Month T-bill Yield: Average of 100,000 Scenarios Up to 3.23% in 2025“) was posted on Seeking Alpha on June 16, 2015.

References for random interest rate modeling are given here:

Heath, David, Robert A. Jarrow and Andrew Morton, “Bond Pricing and the Term Structure of Interest Rates: A Discrete Time Approach,” Journal of Financial and Quantitative Analysis, 1990, pp. 419-440.

Heath, David, Robert A. Jarrow and Andrew Morton, “Contingent Claims Valuation with a Random Evolution of Interest Rates,” The Review of Futures Markets, 9 (1), 1990, pp.54 -76.

Heath, David, Robert A. Jarrow and Andrew Morton,”Bond Pricing and the Term Structure of Interest Rates: A New Methodology for Contingent Claim Valuation,” Econometrica, 60(1), 1992, pp. 77-105.

Heath, David, Robert A. Jarrow and Andrew Morton, “Easier Done than Said”, RISK Magazine, October, 1992.

References for modeling traded securities (like bank stocks) in a random interest rate framework are given here:

Amin, Kaushik and Robert A. Jarrow, “Pricing American Options on Risky Assets in a Stochastic Interest Rate Economy,” Mathematical Finance, October 1992, pp. 217-237.

Jarrow, Robert A. “Amin and Jarrow with Defaults,” Kamakura Corporation and Cornell University Working Paper, March 18, 2013.

The impact of credit risk on securities returns is discussed in these papers:

Campbell, John Y., Jens Hilscher and Jan Szilagyi, “In Search of Distress Risk,” Journal of Finance, December 2008, pp. 2899-2939.

Campbell, John Y., Jens Hilscher and Jan Szilagyi, “Predicting Financial Distress and the Performance of Distressed Stocks,” Journal of Investment Management, 2011, pp. 1-21.

The behavior of credit spreads when interest rates vary is discussed in these papers:

Campbell, John Y. & Glen B. Taksler, “Equity Volatility and Corporate Bond Yields,” Journal of Finance, vol. 58(6), December 2003, pages 2321-2350.

Elton, Edwin J., Martin J. Gruber, Deepak Agrawal, and Christopher Mann, “Explaining the Rate Spread on Corporate Bonds,” Journal of Finance, February 2001, pp. 247-277.

The valuation of bank deposits is explained in these papers:

Jarrow, Robert, Tibor Janosi and Ferdinando Zullo. “An Empirical Analysis of the Jarrow-van Deventer Model for Valuing Non-Maturity Deposits,” The Journal of Derivatives, Fall 1999, pp. 8-31.

Jarrow, Robert and Donald R. van Deventer, “Power Swaps: Disease or Cure?” RISK magazine, February 1996.

Jarrow, Robert and Donald R. van Deventer, “The Arbitrage-Free Valuation and Hedging of Demand Deposits and Credit Card Loans,” Journal of Banking and Finance, March 1998, pp. 249-272.

The use of the balance of the money market fund for risk neutral valuation of fixed income securities and other risky assets is discussed in technical terms by Heath, Jarrow and Morton and in a less technical way:

Jarrow, Robert A. Modeling Fixed Income Securities and Interest Rate Options, second edition, Stanford Economics and Finance, Stanford, 2002.

Jarrow, Robert A. and Stuart Turnbull, Derivative Securities, second edition, South-Western College Publishing, 2000.

Appendix A: Expanded Correlations

The expanded correlations in this appendix use data from the U.S. Department of the Treasury as distributed by the Board of Governors of the Federal Reserve in its H15 statistical release.

It is important to note that the 1-month Treasury bill rate has only been reported since July 31, 2001, and that is the reason that the correlations between bank stock prices and that maturity are so different from all of the other maturities. The history of reported data series is taken from van Deventer, Imai and Mesler, Advanced Financial Risk Management, 2nd edition, 2013, chapter 3.

(click to enlarge)

Bank of America Corporation Correlations

(click to enlarge)

(click to enlarge)

Bank of New York Mellon Correlations

(click to enlarge)

(click to enlarge)

BB&T Correlations

(click to enlarge)

(click to enlarge)

Citigroup Inc. Correlations

(click to enlarge)

(click to enlarge)

JP Morgan Chase & Co. Correlations

(click to enlarge)

(click to enlarge)

State Street Correlations

(click to enlarge)

(click to enlarge)

Sun Trust Correlations

(click to enlarge)

(click to enlarge)

U.S. Bancorp Correlations

(click to enlarge)

(click to enlarge)

Wells Fargo & Company Correlations

(click to enlarge)

(click to enlarge)

Appendix B

Valuing the Banking Franchise: Worked Example

The background calculations for today’s analysis are given here. The extraction of zero coupon bond prices from the Treasury yield curve is discussed in van Deventer, Imai and Mesler (2013), chapters 5 and 17.

(click to enlarge)

(click to enlarge)

(click to enlarge)

RIAs Join Brokers In Promoting Securities-Backed Lending

These loans are growing quickly beyond wire houses, but some are concerned about the risks and conflicts of interest

http://www.investmentnews.com/storyimage/CI/20150611/FREE/150619979/AR/0/AR-150619979.jpg&imageversion=superwide&maxw=800&maxh=500&q=90&cci_ts=20150611145635

Traditionally a major focus at bank-owned brokerage firms, securities-backed loans — where a wealthy investor puts up their portfolio as collateral for a big-money purchase &mash; are increasingly being marketed through independent registered investment advisers.

In the past two years, use of the products has soared as custodians beef up their lending capabilities. Pershing Advisor Solutions, a subsidiary of The Bank of New York Mellon Corp., began offering the loans to RIAs last year and has already issued 254 of them worth $1 billion through more than 20% of its 570 RIA clients. Fidelity Investments, which serves about 3,000 RIAs, has seen balances for securities-backed loans increase 63% in its RIA segment over the past two years.

“Non purpose loans have gotten more attention over the last year-plus with the custodians,” said John Sullivan, a former lending specialist at Smith Barney who is now a relationship manager at Dynasty Financial Partners. “Every effort is being made by firms like Dynasty and the various custodians that are out there to be able to replicate or in some cases exceed the existing platform” at the wirehouses.

For years, the loans have been a popular product at the wirehouses, including Bank of America Merrill Lynch and Morgan Stanley Wealth Management. They are billed as a way for wealthy investors to make large purchases, such as a yacht or vacation home, without having to sell a portion of their portfolio or incur capital gains taxes in the short term. Bank of America Merrill Lynch had $11.7 billion in margin loans outstanding, according to its most recent SEC filings from March.

There is no upfront cost to set up a securities-based line of credit, and firms offer competitive rates, which are sometimes lower than a traditional bank loan and are particularly attractive now with low interest rates. The loans can be made in a relatively shorter period of time than traditional bank loans as well. They take as few as eight business days at Pershing.

But there are other reasons firms, including the wirehouses like securities-backed lending. The loans provide another income source from clients in fee-based accounts and can be more profitable for the firm than other investment products because they don’t have to share as much of the revenue with their advisers who sells the clients on the loan.

“Lending growth will enhance the stability of revenue and earnings for the firm as a whole and make our client relationships deeper and stickier,” Morgan Stanley & Co.‘s former chief financial officer, Ruth Porat, said in an earnings call in July.

RIAs specifically don’t receive any additional compensation from a bank or custodian for selling securities-backed loans, but there are other benefits. For example, the loans allow wealthy clients to make multimillion dollar purchases without cutting into the assets under management. Bob LaRue, a managing director at BNY Mellon, said new business from clients often results as well — and, of course, the dollars left in the portfolio have the potential for gains, which raise AUM.

Herein lies the rub, according to Tim Welsh, president and consultant of Nexus Strategy, a wealth management consulting firm. “They don’t sell, so the assets under management stay the same — so it inherently has a conflict of interest,” he said.

That can be a problem, Mr. Welsh said, particularly because client demand typically is highest for these kinds of loans at the wrong time.

“In every bull market I’ve seen, this is always a predictor of the top,” Mr. Welsh said. “When people start borrowing money against their assets, they’re really confident that they’re going up. And investors are always one step behind in terms of tops and bottoms.”

The risk is that if the value of a client’s portfolio drops, the firm can sell the securities or ask that the client put down more money to back that up. Using securities as collateral can be subject to greater volatility than other types, such as a home equity loan.

“When the markets rationalize, bills come due, and if you don’t have liquidity, all of a sudden you have to sell,” Mr. Welsh said. “It definitely raises the risk profile up immediately.”

Adviser Josh Brown of Ritholtz Wealth Management has dubbed the growth in these loans a “rich man’s subprime.”

“Once again, super-cheap financing based on an asset whose value can fluctuate wildly (a stock and bond portfolio, in this case) is being used for the purchase of assets that can be significantly less liquid, like real estate, fine art or business expansion,” Mr. Brown wrote in a story last year on the growth of the loans in the wirehouse space. “Don’t say I didn’t warn you.”

Regulators have taken notice as well. The Financial Industry Regulatory Authority Inc., which oversees broker-dealers, warned in January that it was looking into the marketing of securities-backed loans as part of this year’s regulatory agenda.

“Finra has observed that the number of firms offering [securities-backed loans] is increasing, and is concerned about how they are marketed,” the regulator said.

That said, Mr. Sullivan and others who defend securities-backed lending said it works well if that risk is taken into account.

“It’s really about staying invested for the long-term and meeting short-term cash flow needs with some borrowing that’s not going to exceed a certain percentage on the assets,” Mr. Sullivan said.

Mr. LaRue said advisers have to consider whether it makes sense to trade leverage for the tax benefits.

“The appropriateness of leverage depends on each individual client’s needs,” he said. “If you are borrowing [to avoid the capital gains] taxes and keep a favorable investment strategy in place, then perhaps leveraging those assets at a low interest rate makes sense.”

By Mason Braswell for Investment News

The Biggest Threat To Your Retirement Portfolio: Mild Dementia

Summary

  • Self-directed investors take appropriate steps to protect their assets should they become fully disabled, but ignore the threat posed by the changes characteristic of early dementia.
  • The many different causes of dementia have very different patterns of onset. Some are particularly dangerous to investors because sufferers don’t immediately lose their memories – just their judgment.
  • Because physicians are slow to pronounce people incapable of managing their affairs, a proactive strategy is needed to protect you from yourself should you lose judgment or emotional control.

by Psycho Analyst in Seeking Alpha:
The Biggest Threat To Your Retirement Portfolio: Mild Dementia

https://i0.wp.com/images.wisegeek.com/older-woman-with-head-on-shoulder-of-older-man.jpg

By the time they have reached retirement age, most investors who have significant assets have made wills, set up trusts, and acted responsibly to make sure that after their deaths their money goes where they want it to go. Most have also drawn up Powers of Attorney, which give someone they choose the ability to manage their affairs if they are incapacitated by illness or dementia and no longer able to manage them on their own. They also discuss with their spouse or heirs how they would suggest these beneficiaries invest their money once they have passed on.

Having done this, these retirees relax, convinced they have taken care of all the unpleasant situations we all prefer not to think about, and can safely go back to not thinking about them.

But this kind of planning does not take care of the biggest threat to the assets of these self-directed investors: the very poor decisions they are likely to make with their investments should they become one of the one in seven people who will begin to experience the earliest phases of dementia in their late sixties or subsequent decades.

Dementia Can Be Very Hard to Detect

Unless you have seen a loved one go through this process, you are probably unaware of how insidious it can be, and, most importantly for your assets, how long a person who is in these early phases of mental deterioration can keep their loved ones from realizing just how poorly they are functioning and continue to manage their money while making increasingly poor decisions as their brains erode.

The most typical pattern with many forms of dementia is that loved ones only realize there is a problem after the big checks have been written to scammers, the good investments sold at bad prices, or the abusive annuities and whole life policies purchased.

People are able to make these disastrous investing decisions in the earliest stages of dementia because their loved ones, who assume dementia announces itself with forgetfulness, don’t realize there are quite a few syndromes that develop into dementia whose first symptoms are not forgetfulness, but are instead loss of judgment, impulse control, and emotional balance.

Dementia Is Not One Condition But Many With Different Patterns of Onset

http://i2.wp.com/caregiverrelief.com/wp-content/uploads/2013/05/problem-solved.jpg?resize=300%2C336

That is because there are many different conditions that produce dementia which afflict the elderly. They include the classic form of Alzheimer’s, where the earliest symptoms are the loss of memory and verbal abilities. But the elderly also develop vascular dementia, where they experience a series of micro strokes that slowly diminish their faculties. And when this happens, the symptoms depend heavily on which parts of the brain are affected by the strokes.

Other conditions that cause differing forms of cognitive deterioration including Parkinson’s Disease, Lewy Body Dementia, and Frontotemporal Dementia. In some of these conditions, the emotions deteriorate before other cognitive abilities fade, leaving the person prone to excessive fear or rage. In others, risk-taking behavior accelerates. People with these conditions may lose their fear of strangers and their ability to discriminate between friends and exploiters, making them very easy to con.

Similar changes in mood, cognition, and behavior can also be caused by pharmaceutical drugs commonly prescribed to the elderly, sometimes in combinations that can be toxic to the elderly brain.

When memory loss is evident, relatives are quick to suspect dementia. If you get lost driving home, your loved ones likely to take a look at how you are managing your finances and if they see problems, intervene. People who have these forms of dementia are themselves more likely to be aware that something is wrong, early on, too, and ask for help.

If you are repeatedly forgetting how to find your investment accounts on your computer and forgetting which bank you put your money in, as terrible as your condition may be, it is less threatening to your portfolio than when you have other, more subtle forms of deterioration. Because when these more subtle forms occur, people are much less likely to be aware that they have become impaired, and are much more resistant to having others take over managing their affairs.

Loss of Impulse Control, Mood, and Judgment, Not Memory, Pose the Biggest Threats to Your Portfolio

In these more subtle forms of dementia, the first symptoms are not memory loss. Instead they involve loss of impulse control, emotional balance, or judgment. When dementia presents in this fashion, and you start exhibiting more signs of rage or anxiety than normal, your loved ones will tend to assume you are just getting crotchety, as is to be expected with the elderly.

But when that anxiety leads you to sell all your stocks one morning because you read a MarketWatch scare headline that terrified you, the damage to your retirement can be irreversible. Likewise, if the emotion that goes out of control as your frontal cortex deteriorates is greed, you may sell all your dividend stocks and put them into the tech IPOs or penny stock biotech, because some pumper posting online has told you it is a sure ten-bagger that will make you rich.

While doctors can usually pick up that a patient is suffering from classic Alzheimer’s with a few simple screening tests, they are slow to diagnose dementia in older people based only on more subtle changes in their mood, emotions, or even behavior.

Relatives may be helpless to call a doctor’s attention to these problems as HIPAA forbids doctors to even discuss a person’s health with a concerned relative or friend unless the patient has specifically authorized them to do so in writing.

Relatives may not even know there is a problem when the person with very early dementia is an experienced investor who manages their own portfolio. While they may notice there is a problem when grandpa, who never gambled, starts going to the casino every week, when grandpa starts gambling with naked options bought on margin, the only evidence is buried in his account statements, which are available online only to those who are able to log into grandpa’s account.

So this is why it is when people are in these very early phases of dementia that the worst kinds of financial elder abuse occur. This is when elderly retired professors likely wire all the money in their savings accounts to Nigeria. It is then that elderly widows fall in love with handsome young strangers they meet on cruise ships and turn their assets over to them to invest. There is an entire industry made up of boiler shop weasels who do nothing but telemarket the elderly all day hoping to find one in this state on whom they can unload penny stocks and sleazy annuities.

It Can Happen Here

Readers who are currently managing their assets very well will nod their heads, all the while thinking, “This can’t happen to me.” But the sad fact is that it can. Because the hallmark of this kind of dementia is that it can happen to anyone and when it does, it comes on so insidiously that, unlike classic Alzheimer’s, the person affected has no idea that it has affected them. NIH research has found that one in seven Americans over age 71 is affected by some form of dementia. Various studies suggest that the incidence rises with each subsequent decade of age.

If you are affected by the earliest stages of dementia, it will be very hard for you to realize anything is wrong, even if you have made plans about handing over control of your investments should you become impaired. You might start buying and selling more impulsively without noticing it. You may lose your ability to analyze stocks using the techniques that you used to build up your portfolio and rely increasingly on what TV pundits or writers on sites like this tell you are “can’t fail” opportunities. While markets are rising, the damage might be slight. But your ability to weather a bear market may decline, and worst case, you will end up like the many retirees who sold everything in 2008 and never reentered the market.

So, to protect your assets as you age from what you might do as you begin to lose your judgment or emotional control, you need to do more than choose someone to exercise your Power of Attorney, because that person can only step in when you have been declared incompetent.

What You Can Do Now To Keep Your Investments Safe Later

The first and most important thing is to make sure that your loved ones understand how dangerous the early, hard to detect changes caused by dementia can be. Make them aware that what may seem like small behavioral changes they see in you may be more significant than they appear and that the time to act is before you have made some unrecoverable error of judgment.

Make Your Doctor an Ally

https://i0.wp.com/blogforalzheimers.com/wp-content/uploads/2012/02/EarlyAlzheimersDiseaseDiagnosis.jpg

Sign the forms available at your physician’s office that give your loved ones the ability to talk to your doctors about your mental state, if they see behaviors that trouble them so that the doctor can help them determine if you may be posing a risk to yourself. If there is any doubt, get a referral to a gerontologist, a doctor who specializes in the treatment of the elderly.

Periodically ask your loved ones if they detect differences in your emotions, judgment, or behavior, which might mean that you are making questionable decisions. If they admit that they do, take immediate steps to bring in another individual to keep an eye on your investments.

Instruct your loved ones that if your emotional control goes and you get angry in inappropriate ways when told you are mismanaging your investments, they should contact your physician and begin the process of bringing in someone else to check that you are still capable of managing your assets.

To facilitate this process give your doctor now, while you are obviously mentally capable, a notarized statement describing the kinds of circumstances under which you would want the doctor to declare you incapable of managing your finances. Also give a copy of this statement to your POA.

Make it clear that significant signs of poor judgment or loss of emotional control, not just memory loss, should be grounds for such a declaration. Without such a declaration from your physician, your POA cannot take over the managing of your finances no matter how much you may need it. And without such a statement from you, doctors may err on the side of caution and declare you mentally capable as long as you know what day it is and can repeat a list of words a few minutes after hearing them.

Bring Your POA into Your Investment Process Now While You Are Functioning Well

Another important thing to do is to give the person you have appointed as your Power of Attorney the ability to see how you are investing, so they can intervene before you make severe mistakes. Give them the ability to access and review your investment records. If you are not comfortable having them access your accounts, at least ask them to review your transactions periodically to make sure that you aren’t departing from your usual investment style. Let this person periodically look over your bank and credit card statements, too, looking for unusual spending patterns.

If you aren’t comfortable giving them this access now, when you can explain the decisions you make and how you are using your money, you might consider finding another person to act as your POA. If you don’t trust them with your accounts now, when you are there to oversee things, how can you trust them to manage your money for you should you become incapacitated?

By working jointly with your POA now, you will get a much better idea of whether they are the right person to manage your affairs should the need arise. They, in turn, will get a much better understanding of why you are invested the way you are and how to manage your investments in harmony with the principles you embrace.

You should also discuss with your POA any major gifts you plan to make to charities. A lot of seemingly legitimate charities, including religious groups, hospitals, and universities, target well-off older people with high-pressure sales tactics, wining and dining them and offering to name things after them in return for large donations. To avoid being exploited by charities as you age, write out a list now of which institutions you plan to contribute to and in what amounts, and give this document to the person you have chosen as your POA so they can refer to it in the future and keep you from being swayed by marketers who appeal to your vanity as your emotions and judgment begin to weaken.

Another approach that may be helpful to some investors, rather than relying entirely on their appointed power of attorney, is to develop a “buddy system” with another retiree or two who invest using a style similar to their own. Keep each other up-to-date with portfolio changes, and ask that if your buddy observes behavior that sets off warning signals, they inform your family that it might be time to call for help.

Consider Paying a Professional

https://i0.wp.com/dementiaroadmap.info/walthamforest/wp-content/uploads/sites/17/homepage-walthamforest2-860x360.jpg

If the person you have appointed as your POA turns out not to be able to understand your current investments, this is a good sign that you are investing in a way that could be very perilous to your retirement savings should anything happen to you. Since you may live for a decade or more in a condition where your POA would have to manage your resources, and since managing them well means the difference between living in an upscale assisted living facility and a hellhole nursing home, it is essential that if your POA can’t understand and manage your current investment strategy on their own, you either find one who can, simplify your investments to where your current POA can manage them, or turn your assets over to a well-recommended professional fee-paid investment advisor.

If your POA is your spouse, you might want to reconsider this choice if they are near your age because the risk of developing subtle mental changes also applies to them. Some studies suggest that dementia is actually more prevalent among older women than it is in men, possibly because less healthy men are less prone to survive to older ages so older men who do survive are more healthy.

If you can’t find a relative who has the understanding, education and integrity needed to manage your investments, you may have to enlist the services of a carefully screened, fee-paid financial advisor. This will involve trade-offs, as advisors will invest their way, not yours. But even the worst advisor is more likely to preserve your wealth better than an ignorant relative or a spouse who is also becoming demented.

And if you need to find such an advisor, the time to do it is now, when your brain is working well. Intellectual incapacity can strike very suddenly, and you should not expect a POA who is overwhelmed with the responsibility of handling your affairs to be able to find someone capable of managing your affairs when they are in the middle of a crisis involving hospital visits or moving you to a rehabilitation facility or into assisted living.

When you interview advisors, ask probing questions to see how well they listen and how willing they are to invest your money the way you want it invested. Ask who takes over if they retire or leave. If you can’t find an advisor you trust, or balk at paying their hefty fees, an inexpensive, partially automated advisory service like the Vanguard Personal Advisor Service might be a safe choice. If Vanguard’s index funds are good enough for Warren Buffett to recommend to his own wife, they probably will work for you. The fee-paid Vanguard service supposedly will also optimize your investment allocation to take into account your tax situation.

If you don’t have family or don’t trust your family with your financial affairs, it is essential that you find someone now who can take on this role. Perhaps a trusted accountant or attorney would be the appropriate person to turn to. Yes, it will cost money, but not nearly as much as you can lose if you don’t take steps to protect yourself from what happens should you unknowingly experience the early stages of dementia.


Consumers Can’t Void Second Mortgage In Bankruptcy, SCOTUS Rules

By Ashlee Kieler

Consumers taking out a second mortgage will now have to consider the fact that if they encounter financial difficulties and file for bankruptcy, they won’t be able to strip off the additional loan obligation.

The Wall Street Journal reports that the Supreme Court ruled in favor of banks when it came to determining that struggling homeowners can’t get rid of a second mortgage using Chapter 7 bankruptcy protection, even if the home’s value is less than the amount owed on the first mortgage.

Monday’s unanimous ruling involved two cases in which Florida homeowners sought to cancel their second mortgages – issued by Bank of America – under the argument that when both primary and subsequent loans are underwater, the second is worthless.

The homeowners in the cases were previously allowed by lower courts to nullify the second mortgages. Back in 2013, those rulings were affirmed by the Atlanta-based 11th U.S. Circuit Court, the Associated Press reports.

However, Bank of America maintained that the rulings conflicted with Supreme Court precedent, arguing that even if the primary mortgage is underwater, it shouldn’t affect the lien securing the second loan.

According to the bank, there remains a possibility that the second loan would be repaid if the property’s value rose in the future.

https://i0.wp.com/i1.mirror.co.uk/incoming/article4797897.ece/alternates/s615/Zombie-businesses-and-interest-rates.jpgThe company also claimed that after the Circuit Court ruling, hundreds – if not thousands – of struggling homeowners had moved to nullify their second loans, the AP reports.

Justice Clarence Thomas said on Monday that the SCOTUS decision took into consideration the shifting nature of property, the WSJ reports.

“Sometimes a dollar’s difference will have a significant impact on bankruptcy proceedings,” he wrote in the decision.

Supreme Court: ‘Underwater’ Homeowners Can’t Void Second Mortgages in Bankruptcy [The Wall Street Journal]
Supreme Court says homeowners underwater on loans can’t void second mortgage in bankruptcy [The Associated Press]

Not Buying a Home Could Cost You $65,000 a Year

Renters are missing out on savings in most metros

https://i0.wp.com/media.gotraffic.net/images/i8RsMVwGVLHw/v1/1200x-1.jpg Patrick Clark for Bloomberg

Not buying a home right now will cost you, because home prices and interest rates are going to rise. Many renters would like to own, but they can’t afford down payments or don’t qualify for mortgages. Those two conclusions, drawn from separate reports released this week, sum up the housing market dilemma for many young professionals: Buyers get more for their money than renters—but most renters can’t afford to enter the home buying market.

The chart below comes from data published today by realtor.com that estimates the financial benefits of buying a home based on projected increases in mortgage rates and home prices in local housing markets. Specifically, it shows the amount that buyers gain, over a 30-year period, over renters in the country’s largest metropolitan areas.

https://i0.wp.com/media.gotraffic.net/images/is4gW1ykViVo/v1/-1x-1.png

The penalties for waiting to buy tend to be greater in smaller metro areas, especially in California. For example, the estimated cost of waiting one year was $61,805 in San Jose and $65,780 in Santa Cruz. Over the course of 30 years, homeowners save more than $1 million in Santa Cruz, the largest amount of any U.S. city.


To compile those numbers, realtor.com compared median home prices and the cost of renting a three-bedroom home in 382 local markets, then factored in estimates for transaction costs, price appreciation, future mortgage rates, and interest earned on any money renters saved when it was cheaper to rent.

In other words, researchers went to a lot of trouble to quantify something that renters intuitively know: They would probably be better off if they could come up with the money to buy. Eighty-one percent of renters said they would prefer to own but can’t afford it, according to a new report on Americans’ economic well-being published by the Federal Reserve.

https://i0.wp.com/media.gotraffic.net/images/i4uyDyFenhdY/v1/-1x-1.png

Not all markets favor buyers over renters. In Dallas, the benefit of buying was about $800 over 30 years, according to realtor.com’s model, which expects price appreciation to regress to historical norms. In many popular markets, though, there are greater benefits to owning.

“It shouldn’t be a surprise that the places where you can have the highest reward over time also have the highest prices,” said Jonathan Smoke, chief economist for realtor.com. “It’s not true that if you’re a median-income household, that you can’t find a home that’s affordable, but in places like San Jose and Santa Cruz, less than 10 percent of inventory would be affordable.”

Or as Logan Mohtashami, a senior loan officer at AMC Lending Group in Irvine, Calif., told Bloomberg Radio this week: “The rich have no problem buying homes.”


In Stadium Property Finance, Goldman Sachs Dominates

http://www.trbimg.com/img-555ffb71/turbine/la-la-sp-carson-stadium3-jpg-20150522/750/750x422By Tim Logan for Los Angeles Times

When San Diego Chargers executives needed help raising $1.7 billion for a football stadium in Carson, they turned to the professionals: Goldman Sachs.

The giant investment bank has become a major player in the high-stakes stadium financing game, crafting 30 deals with pro teams in the last decade.

Goldman has seized an opportunity in an era when cities and states are increasingly leery of subsidizing sports palaces for billionaires. The firm offers the next-best thing: upfront Wall Street money, along with help crafting creative deals that maximize a team’s profits and minimize its taxes.

Along the way, the bank and the investors it recruits pull in seven-figure returns and can even influence where franchises end up playing.

http://www.trbimg.com/img-555ffb70/turbine/la-apphoto-nfl-los-angeles-football3-jpg-20150522/750/750x422

The firm has financed some of the biggest deals in sports, including the new Yankee Stadium in New York and the San Francisco 49ers’ new Levi’s Stadium in Santa Clara, Calif. Now Goldman is at the center of the Chargers and Oakland Raiders plan for a new stadium in Carson, where it has crafted a complex public-private partnership to build the nation’s most expensive stadium.

The stadium plan still needs approval from the NFL, and the league could choose to go with a competing plan for a $1.86-billion stadium in Inglewood from St. Louis Rams owner Stan Kroenke, the league’s second-richest owner.

But Goldman’s money and influence give confidence to the Carson plan’s boosters.

“Inglewood likes to say they have the money, because they have Kroenke and he’s worth $6.3 billion,” said Carson Mayor Albert Robles. “Actually, we have more money — because we have Goldman Sachs.”

The Chargers first hired Goldman several years ago to advise them on a new stadium in San Diego. But talks with the city stalled amid disagreements over sites and public financing. When the team then looked to Los Angeles, Goldman had a ready blueprint in the $1.3-billion deal to build Levi’s Stadium.

It is the first NFL stadium built in California since the mid-1960s, financed in a city about the same size as Carson with little upfront tax money and big potential profits for the team.

“It showed that, in a big market, you can do this,” said Mark Fabiani, who’s in charge of stadium efforts for the Chargers. “That definitely affected our thinking.”

The Chargers drove the stadium planning before inviting the Raiders to join earlier this year.

In Santa Clara, and in Carson, Goldman’s plan was to create a public authority to build and own the stadium, using the proceeds of a construction loan raised from private investors. The loan would be paid back using revenue from sponsorships, high-end seating and non-NFL events at the stadium and, in a two-team stadium in Carson, using as much as $800 million in personal seat licenses — upfront payments that allow fans to buy season tickets.

The structure of the deal would also save both teams a lot of money in the long run, said John Vrooman, a sports economist at Vanderbilt University.

Using a tax-exempt public authority to sell personal seat licenses and sponsorships allows the teams to avoid many taxes on those sales, saving them tens, perhaps hundreds, of millions of dollars, Vrooman said. The teams would also avoid property taxes on the building, though they would pay rent and other local taxes on the private use of a public facility.

Public agency bonds for the stadium would be tax exempt and sell at lower interest rates.

“Goldman Sachs’ job is to use, if not disguise, every public funding tax shelter and loophole,” Vrooman said.

Goldman’s investors also prefer the opportunities for private profits in L.A., which San Diego can’t match. That makes the Carson stadium a much safer bet. Building something similar in San Diego without generous public subsidies would require the Chargers to borrow more money at higher interest rates. The economics don’t work, Fabiani said.

“In L.A., the naming rights are worth more. Suite sales are worth more. Sponsorships are worth more,” he said. “In San Diego we just don’t have those advantages. Even though we’d like to do the same thing in San Diego, we couldn’t finance it.”

Goldman declined to make members of its stadium financing team available for interviews. But at a recent Carson City Council meeting, Tim Romer, who heads the firm’s West Coast public-sector financing operation, said he’s confident that this plan can succeed in the L.A. market.


“We’re committed to making this happen,” he said. “We’ve concluded the financing is viable.”

Some have their doubts. Tony Manolatos, a spokesman for San Diego’s stadium task force, says Goldman’s plan in Carson leans too heavily on personal seat licenses. To raise $800 million, the Chargers and Raiders both would have to sell more seat licenses than anyone except the Dallas Cowboys and 49ers ever have — in a market where neither team has deep roots — while competing with each other.

“No one has ever sold that amount of [personal seat licenses] in a new market,” he said.

San Diego officials last week countered with an offer that includes $242 million in city and county subsidies, $173 million in construction bonds and $225 million from the sale of city-owned land near the stadium. The Chargers would put up $300 million and the NFL would pay $200 million. Team officials say they’re reviewing the proposal.

If Goldman is right, their investors should see a solid return. The Santa Clara deal generated about $75 million in interest and fees, according to financing documents, with more potentially to come when construction bonds are refinanced later this year. In Carson — where the stadium would cost $400 million more — financiers could easily recoup $100 million.

“They’re basically the middlemen,” said Roger Noll, a Stanford University economist who watched the Santa Clara stadium deal unfold.

Goldman should have no trouble raising money, said Randy Gerardes, a senior municipal bond analyst at Wells Fargo Securities.

“A market like L.A. is attractive,” Gerardes said. “Just like it’s attractive to the NFL, it’s attractive to investors. There’s a lot of money there, a big corporate base.”

tim.logan@latimes.com Twitter: @bytimlogan Copyright © 2015, Los Angeles Times

Sales of $100 Million Homes Rise to Record Worldwide

Source: Bloomberg Businesshttps://i0.wp.com/www.ealuxe.com/wp-content/uploads/2013/08/this-is-what-you-could-wake-up-to-every-day.jpgThe Odeon, Monaco Penthouse: most expensive penthouse in the world

The ultra-luxury housing market is scaling new heights as a record number of properties around the world command prices topping $100 million.Demand for mega-mansions and penthouses has accelerated as wealthy buyers seek havens for their cash and search for alternative investments such as art and collectible real estate, according to a report Thursday by Christie’s International Real Estate, owned by auction house Christie’s. Five homes sold for more than $100 million last year, with at least 20 more on the market with nine-figure asking prices, the brokerage said.“You’re looking at a universe of over 1,800 billionaires who are starting to become members of this club of collectors of the most unique and incredible real estate in the world,” Dan Conn, chief executive officer of Christie’s International Real Estate, said in a telephone interview. “It’s something they’ll hold onto for a lifetime, the same way they’ll hold onto a Picasso or a Warhol or any number of the great pieces of art we’ve sold over the years.”


Sales are likely to increase this year with more newly built properties and off-market homes trading for at least $100 million, Conn said. Demand is growing among affluent Americans and Europeans; billionaires from unstable economies, such as Russia and Middle Eastern countries; and buyers from mainland China, who were barred from investing overseas before 2012 and since have snapped up houses in cities including Hong Kong, Los Angeles, New York and London, he said.

https://i0.wp.com/www.ealuxe.com/wp-content/uploads/2013/08/most-expensive-penthouse-in-the-world-odeon-ealuxe.jpgThe penthouse and pool area of the Tour Odeon residential apartment block. At least 18 residences have asking prices of $100 million or more, led by the $400 million Monaco penthouse. Source: Realis/SCI Odeon via Bloomberg

‘Can Boast’

“People want trophy homes,” Eyal Ofer, a Monaco-based shipping and real estate magnate, said in interview earlier this week at the Milken Institute Global Conference in Beverly Hills, California. “They’re a scarce commodity. And they’re better than gold because you can boast about it.”

Last year’s sales of homes for at least $100 million were led by an East Hampton, New York, estate purchased for $147 million by Barry Rosenstein, managing partner at hedge fund Jana Partners. The other top sales were a $146 million villa in Saint-Jean-Cap-Ferrat, France; a $120 million estate in Greenwich, Connecticut; a $104 million Hong Kong residence; and a $100.5 million duplex penthouse in New York’s One57 condominium tower, according to Christie’s.

Not all the properties went for close to the asking price. The Greenwich estate that sold for $120 million was originally listed for $190 million.

‘Fundamentally Different’

The fact that asking and sales prices for ultra-luxury properties are reaching new heights isn’t a sign of problems in the broader market and shouldn’t raise concerns that last decade’s housing bubble will be repeated, Conn said.

“I think of this market as fundamentally different from the rest of the market,” Conn said in an interview Thursday on Bloomberg Television’s “Market Makers.” “In order to buy one of these properties, you have to be in the billionaires club.”

Just one home sale exceeded the $100 million mark in 2013, following four such transactions in 2012 and three in 2011, Christie’s reported.

Residences currently on the market with asking prices at that level include a $400 million Monaco penthouse, a $365 million London manor and a $195 million estate in Beverly Hills, California, according to Christie’s. France’s Cote d’Azur, a getaway for jet-setters, has homes with asking prices of $425 million and $215 million.

The report analyzed home sales in 10 cities known for prime property and 70 additional markets, including weekend getaways, vacation resorts and suburban locations. The 10 cities are Dubai, Hong Kong, London, Los Angeles, Miami, New York, Paris, San Francisco, Sydney and Toronto.

Location, Privacy

The average starting price for a luxury home was $2 million in the areas Christie’s studied. It defines a luxury home as having a combination of location, such as a prominent street address, and amenities such as privacy, urban conveniences or collectible architectural quality.

London luxury homes averaged $4,119 a square foot, the most expensive of the top 10 cities. Beverly Hills and neighboring areas of Los Angeles had the highest luxury entry-price point, at $8 million. Toronto had the fastest sales pace, with prime properties finding a buyer an average of 31 days after listing. Dubai had the highest share of international and non-local buyers, at 75 percent.

Thinking About Selling Your Home? ― They Already Know

How Real Estate Agents Are Using Big Data to Track Prospects


Tech-savvy agents are teaming with data companies to identify cognition

Sitting in bed at 1:40 a.m. one morning last November, Jon Hoefling was thinking about selling his 4,300-square-foot home in Morgan Hill, Calif. While browsing Facebook on his phone, he clicked on a real-estate ad offering to estimate his home’s value. His future listing agent, who paid for the ad, was waiting.

Mr. Hoefling, the 50-year-old owner of an office-furniture resale company, had been targeted for the ad—along with 1,500 others in California’s Silicon Valley area—by an algorithm that identified him as a likely home seller. The telltale signs: Mr. Hoefling has lived in the home for more than 15 years, and his home’s market value is high for the area. Most important, his youngest son will soon leave for college. Empty nesters might as well wear a bull’s-eye.

To target prospective clients in competitive markets, tech-savvy agents are buying data subscriptions and teaming up with firms that identify potential buyers using increasingly precise metrics. Exotic-car owners can be courted to buy a car-collector’s mansion. Equestrians are rounded up for ranch homes

Last year, Sotheby’s International Realty announced a partnership with Wealth-X, a consulting group that uses public records and research staff to manually track the habits of “ultrahigh-net-worth individuals.” There are about 211,000 people world-wide valued at more than $30 million, according to the company’s president and co-founder, David Friedman—and the firm’s goal is to write a detailed dossier on each one of them.

These reports may contain everything from an individual’s net worth and social circles to even more personal details. For example, the dossier for one Australian multimillionaire notes that he is likely fond of topiary, because he proposed to his wife in front of a massive topiary created by artist Jeff Koons.

Mark Lowham, managing partner at TTR Sotheby’s in Washington, D.C., enlisted Wealth-X to help find a buyer for a penthouse apartment listed at $9 million in the Georgetown neighborhood. His team first established a basic description of the people they were looking for: Homeowners with a combined income of $2 million who have lived in a house assessed at more than $4 million for at least five years.

Consulting group Wealth-X was enlisted to find prospective buyers for this penthouse, which is asking $9 million in Washington, D.C. Photo: Sean Shanahan.

Then, they got more specific: Art collectors, because the condo has ample wall space. Empty nesters, because they prefer single-floor living. Private-aircraft users, because the area attracts jet-setters.

Using a combination of data from Wealth-X and their client contact base of about 700,000, they might be left with 400 targeted leads, Mr. Lowham says. The listing isn’t public yet, but the next step is to launch a mail campaign to their targeted list of prospects.

Sophisticated data collection has been crucial to the growth of the Agency, says Billy Rose, co-founder of the Beverly Hills, Calif.-based real-estate firm. His company, which launched in 2011, closed on 12 transactions of $20 million or more last year. He says the Agency so far has spent about $800,000 to create a database of people with high-net worth. “When I have a house coming up for sale with a garage for six cars, I’ll reach out to my Lamborghini owners,” he says.

Mr. Rose declined to describe the sources that make up the database, but says they have 100,000 individuals in their direct network and another half-million through partnerships. People familiar with the system say it incorporates data from credit-card companies, as well as sales information from luxury brands.

Scanning obituaries for leads has long been a tactic of up-and-coming real-estate agents looking for new business. Today, the practice is getting a 21st-century makeover. Tracking major life events—marriage, divorce, death, all of which frequently entail a home purchase or sale—is big business for a number of new firms.

Cuba’s Next Revolution: Real Estate

Cuba's Next Revolution: Real Estate

Source: World Property Channel

In Cuba, 220 miles south of Miami, real estate is considered hotter than any other commodity on the world market today. But most Americans and foreigners so far are mostly shut out of this potentially lucrative product.

That’s because Raul Castro, President since 2006, has become an ardent pro-business advocate in a Communist country. He is allowing Cuban residents to buy and sell their own homes. That has never happened in such volume since Raul’s ailing brother Fidel took over the island country 54 years ago.

But while bonafide Cuban residents may be enjoying what they perceive as a real estate revolution, foreigners, meanwhile, are blocked out of this new market. That has been the situation since 1962 when Fidel Castro seized nearly all foreign-owned real estate in Cuba without giving them a peso for it. 

 At that time, Fidel, now 88, nationalized most private companies. He also confiscated property belonging to Cubans who fled the country.  Raul so far is not saying whether his government would give back those properties to Cubans who later return to permanently reside in Cuba.

Havana,-Cuba-at-night.png

So what can frustrated, cash-loaded American and foreign investors do right now to enter the Cuban real estate arena? Nothing legally by Americans specifically, based on the Trading With the Enemy Act passed by the U.S. Congress in 1961.  But plenty of action is possible in under-the-table activity involving Americans and foreigners.

For example, an American investor could consider funneling funds to a Cuban resident friend in Cuba to purchase properties and hold the title under the friend’s name. The hope here is that Raul Castro’s government, sometime in the near future, would allow non-Cuban Americans to legally buy real estate in Cuba with no restrictions attached.

The risk, of course, is that such a move by Raul might be many years away, thereby leaving the property in the Cuban friend’s name for an unknown period.

Another example of how some non-American, non-Cuban investors are skirting Cuban property purchase laws, involves the investor marrying a Cuban woman and both beginning to live permanently in Cuba. The property could be bought in the woman’s name. She would hold the title for life. And if the two divorce, the property remains in the woman’s name. True love would have to blossom and endear in this situation.

But what about Cuban Americans now permanently living in South Florida and other U.S. locations?  They, too, would be shut out of the market under the U.S. Trading With the Enemy Act. However, there are more loopholes around for them than there are for other American and foreign investors.

https://i0.wp.com/i2.cdn.turner.com/cnn/dam/assets/141111115409-21-oceania-club-nea-moudania-greece-horizontal-gallery.jpg

For instance, right now Cuban Americans can send $8,000 annually to relatives and others in Cuba. On top of that amount, they can also bring with them up to $10,000 in cash each time they visit the island.

Using that formula, Cuban Americans quickly could be accumulating thousands in funds for their relatives to buy properties — in the relatives’ names, of course.  The hope is that Raul Castro might change the regulations in his lifetime to allow Cuban Americans to buy in their own name.

Although the current real estate rush in Cuba sounds exciting to Cuban residents at least, there still remain several roadblocks, even for them.  For example, permanent resident Cubans can own only two homes, a primary residence and a vacation site. This allows the government to continue keeping tight control over the market.

So can a non-American, non-Cuban buy anything at all right now in Cuba? 

The answer is yes, with qualifications. There still are around two dozen dilapidated apartment buildings developed 20 years ago in the Havana market. Foreigners are allowed to buy them. And unconfirmed reports from Cuban Americans claim those properties are being scooped up quickly.

Additionally, Raul Castro previously announced his Communist government has decided to go ahead with long-delayed plans to develop a golf resort and sell million-dollar-plus villas, townhouses and apartments to foreigners and Cuban residents – but not to legitimate Americans, of course. That project’s development and completion, however, are perceived to be five to 10 years away.

But how can Cuban residents today find out what properties are available in their own home markets? Not easily, because most Cubans still don’t have Internet access because the government hasn’t gotten around to building a working cyberspace infrastructure for them to use. The ban on cell phone use was only lifted in 2006.

https://i0.wp.com/www.worldpropertyjournal.com/news-assets/Havana%2C-Cuba-mural-in-city.png

Instead, many Cubans turn to local weekly or daily penny-saver-like shopper tabloids that sell for pennies to a dollar a copy.

According to Cuban-American real estate broker Pablo Tacon, who is opening a new office in Havana this month called Cuba Tacon Inmobiliaria — it’s a tale of two markets in Cuba. Simply put, there are two different ways in which Cuba’s real estate market functions; one for the locals, the other for outsiders.

Tacon tells The World Property Journal, “One market is called Permuta, which is for Cuban Nationals only as the buyers and the sellers amongst themselves, with the Permutaeros as agents; the other is for foreign investors only with particular designated properties and intermediaries.”

In many ways, Cuba’s way of transacting real estate today is archaic, opaque and fragmented. Yet, given it natural beauty, proximity to the Florida, thawing U.S. political relationship and global tourism allure, Cuba could deliver big results in the coming decade for property speculators worldwide.


The 90,000 Square Foot, 100 Million Dollar Home That Is A Metaphor For America

Just like “America’s time-share king”, America just keeps on making the same mistakes over and over again.  Prior to the financial collapse of 2008, time-share mogul David Siegel and his wife Jackie began construction on their “dream home” near Disney World in Orlando, Florida.  This dream home would be approximately 90,000 square feet in size, would be worth $100 million when completed, and would be named “Versailles” after the French palace that inspired it.  In fact, you may remember David and Jackie from an excellent 2012 documentary entitled “The Queen of Versailles”.  That film documented how the Siegels almost lost everything after the financial collapse of 2008 devastated the U.S. economy because they were over leveraged and drowning in debt.

Source: Zero Hedge – Author: Michael Snyder

https://i0.wp.com/www.zerohedge.com/sites/default/files/images/user3303/imageroot/2015/05/20150509_vers1.jpg

But since that time, David’s time-share company has bounced back, and the Siegels now plan to finally finish construction on their dream home and make it bigger and better than ever before.


But before you pass judgment on the Siegels, it is important to keep in mind that we are behaving exactly the same way as a nation.  Instead of addressing our fundamental problems after the last financial crisis, we have just continued to make the exact same mistakes that we made before.  And ultimately, things are going to end very, very badly for us. As Americans, we like to think that we are somehow entitled to the biggest and best of everything.  We have been trained to believe that we are the wealthiest and most prosperous nation on the entire planet and that it will always be that way.  This generation was handed the keys to the greatest economic machine in world history, but instead of treating it with great care, we have wrecked it.  Our economic infrastructure is being systematically dismantled, Wall Street has been transformed into the biggest casino in the history of the planet, we have piled up a mountain of debt unlike anything the world has ever seen, and the reckless Federal Reserve is turning our currency into Monopoly money.  All of our decisions have been designed to make things better for ourselves in the short-term without any consideration about what we were doing to the future of this country.

That is why “Versailles” is such a perfect metaphor for America.  The Siegels always had to have the biggest and the best of everything, and they almost lost it all when the financial markets crashed

David Siegel (“They call me the time-share king”) and his wife, Jackie Siegel — titular star of the 2012 documentary “The Queen of Versailles” — began building their dream home near Disney World about a decade ago. Soon it became evident that the sheer size of the mansion was almost unprecedented in America; it’s thought that only Biltmore House and Oheka Castle are bigger and still standing, and both of those are now run as tourist attractions, not true single-family homes.

But when the bottom fell out of the financial markets in 2008, their fortunes were upended too. By the time the documentary ended, their dream home had gone into default and they’d put it on the market. The listing asked for $100 million finished — “based on the royal palace of Louix XIV of the 17th century or to the buyer’s specifications — or $75 million “as is with all exterior finishings in crates in the 20-car garage on site.”

But just like the U.S. economy, the Siegels have seemingly recovered, at least for the moment.

Thanks to a rebound in the time-share business, the Siegels plan to finally complete their dream home and make it bigger and better than ever

The unfinished home sits on 10 acres of lakefront property and when completed will feature 11 kitchens, 30 bathrooms, 20-car garage, two-lane bowling alley, indoor rollerskating rink, three indoor pools, two outdoor pools, video arcade, ballroom, two-story movie theater modeled off the Paris Opera House, fitness center with 10,000-square-foot spa, yoga studios, 20,000-bottle wine cellar and an exotic fish aquarium.

Two tennis courts, a baseball diamond and formal garden will be included on the grounds.

The couple admitted that some of their plans for the house – such as children’s playrooms – will have to be modified now that their kids are older.

However, they are determined to see the project through.

‘I’m not at the ending to my story yet, but so far, it’s a happy ending, and I’m really looking forward to starting the next chapter of my life and moving into my palace, finishing it and throwing lots of parties – anxious for the world to see it,’ Mrs Siegel said.

It is easy to point fingers at the Siegels, but the truth is that they are just behaving like we have been behaving as an entire nation.

When our financial bubbles burst the last time, our leaders did not really do anything to address our fundamental economic problems.  Instead, they were bound and determined to reinflate those bubbles and make them even larger than before.

Now we stand at the precipice of the greatest financial crisis in our history, and we only have ourselves to blame.

Just consider what has happened to our national debt.  Just prior to the last recession, it was sitting at about 9 trillion dollars.  Today, it has just crossed the 18 trillion dollar mark…

Total Public DebtYou may not think that you are to blame for this, but most of the people that will read this article voted for politicians that fully supported all of this borrowing and spending.  And yes, that includes most Democrats and most Republicans.

We have stolen trillions of dollars from future generations of Americans in a desperate attempt to prop up our failing standard of living in the present.  What we have done is a horrific crime, and if we lived in a just society a whole lot of people would be going to prison over this.

A similar pattern emerges when we look at the spending habits of ordinary Americans.  This next chart shows one measure of consumer credit in America.  During the last recession, we actually had a brief period of deleveraging (which was good), but now we are back on the exact same trajectory as before…

Consumer Credit 2015Even though we had a higher standard of living than all previous generations of Americans, that was never good enough for us.  We always had to have more, and we have borrowed and spent ourselves into oblivion.

We have also shown absolutely no respect for our currency.  Having the primary reserve currency of the world has been an incredible advantage for the U.S. economy, but we are squandering that privilege.  Like I said at the top of the article, the Federal Reserve has been treating the U.S. dollar like Monopoly money in recent years in an attempt to prop up the financial system.  Just look at what “quantitative easing” has done to the Fed balance sheet since the last recession…

Fed Balance SheetMost of the new money that the Fed has created has been funneled into the financial markets.  This has created some financial bubbles which are absolutely insane.  For example, just look at how the NASDAQ has performed since the last financial crisis…

NASDAQThese Fed-created bubbles are inevitably going to implode, because they have no relation to economic reality whatsoever.  And when they implode, millions of Americans are going to be financially wiped out.

Just like David and Jackie Siegel, we simply can’t help ourselves.  We just keep on making the same old mistakes.

And in the end, we will all pay a great, great price for our utter foolishness.

Ramshackle San Francisco home sells for $1.2 million

This San Francisco fixer-upper proves the old real estate adage, “Location, location, location.”

by Daniel Goldstein  Click here to see more images of the home.

The tale of this otherwise humble two-story home selling for more than $1.2 million has gone viral and has much of the real-estate chattering class talking.

“This is not a joke,” wrote SFist’s Jay Barmann. “[T]his is the world we live in.” He called the 1907 four-bedroom, two-bath Craftsman home “ramshackle.” A “total disaster,” chimed in Tracy Elsen, a real-estate blogger in San Francisco.

Indeed, it might not look like much from the outside or on the inside, but where it is — 1644 Great Highway, San Francisco, CA, 94122 — is where it is.

The 1,832-square-foot house, listed on Redfin.com as a “contractor’s special” in a “deteriorative state” that “needs everything,” just sold, on March 24, for a whopping $1.21 million in cash (or $660 a square foot) after being listed in February for $799,000 (a premium of $411,000). At that per-square-foot price, this house, on San Francisco’s often-chilly western fringe, was more expensive than the going rates in Boston, Washington and New York.

The home, even though it has been gutted, has an unobstructed view of the Pacific Ocean and sits a short walk across San Francisco’s Great Highway to the beach, and it is just five blocks from San Francisco’s famed Golden Gate Park. Oh, and it’s got off-street parking, not a small thing in the City by the Bay.

The house sold for $340,000 in August of 1997 and was sold for $935,000 in June of 2008, when it looked a lot better.

A minimalist museum and a literary landmark

Since then, the house has taken a pounding. Many of the Craftsman-era fixtures common to Bay Area homes, including stained glass and Tiffany-style lamps, have been ripped out, as have most of the fixtures and carpeting and, evidently, the outdoor hot tub that was listed in 2008 but not mentioned in the 2015 listing. A second-story deck in the front of the house with a view of the ocean remains, but it is badly weathered, as is the forest-green paint, in sharp contrast with the careful upkeep evident in 2008.

But some of what made this home a gem in 2008 remains intact, including its picture windows, its decked garden, the fireplaces with wood mantels, the built-in cabinets common to Craftsman homes, the wainscoting and a gas O’Keefe & Merritt stove that dates back to the late 1940s or early 1950s (collector’s items that are prized by many homeowners in the Bay Area).

And given the fact that San Francisco’s median home price recently hit $1 million, and that it rose 10% between February 2014 and February 2015 and is expected to gain another 4.3% through February 2016, the price for this house, on this lot, might just prove to be a bargain.

Is $50 “Hard Floor” Oil Price Already In?

Volte-Face Investments believes that it is …

https://martinhladyniuk.com/wp-content/uploads/2015/04/011bb-peak-oil-situation-31-jul-12.jpg

The Last Two Oil Crashes Show Peak Oil Is Real

Summary

  • Recent oil crashes show you the hard floor for gauging value oil company equities.
  • Properly understood, the crashes lend an insight into the concept of Peak Oil.
  • All oil equity investors should understand the overarching upward trend on display here.
 

Note: ALL prices used in this article are using current 2015 dollars, inflation adjusted using the
US BLS inflation calculator.

Generally, when I invest, I try to keep my thesis very simple. Find good companies, with good balance sheets and some kind of specific catalytic event on the horizon. But when one starts to concentrate their holdings in a sector, as I have recently in energy (see my recent articles on RMP Energy (OTCPK:OEXFF) and DeeThree Energy (OTCQX:DTHRF), you need to also get a good handle on the particular tail or headwinds that are affecting it. Sometimes a sector like oil (NYSEARCA:USO) can be subjected to such forces, like the recent oil price crash, where almost no company specific data mattered.

One of the biggest arguments, normally used by proponents of owning oil stocks as core holdings, in the energy sector is “Peak Oil.” For the unfamiliar, it is a theory forwarded first by M. King Hubbert in the 1950s regarding U.S. oil production. Essentially, the theory stated that the U.S. would reach a point where the oil reserves would become so depleted that it would be impossible to increase oil production further, or even maintain it at a given level, regardless of effort. This would inevitably lead to oil price rises of extreme magnitudes.

Since those early beginnings, the details have been argued over in an ever-evolving fashion. The argument has shifted with global events, technological developments, and grown to encompass nearly every basin in the world (even best-selling books have been written about peak oil like Twilight in the Desert: The Coming Saudi Oil Shock and the World Economy by Matt Simmons about a decade ago) consuming endless bytes of the Internet in every kind of investment forum and medium of exchange.

In general, I believe that the term “peak oil” is a highly flawed one. Some picture peak oil in a Mad Max fashion, with oil supplies running out like a science fiction disaster movie. Others simply dismiss peak oil as having failed to predict these so-called peaks repeatedly (the world is producing a record amount of oil right now, so all previous absolute “Peak Oil” calls below these amounts are obviously wrong). But what people should be stating when they use these terms is a Peak Oil Price.

Using my own thinking and phrasing, I believe civilization has probably passed $25 Peak Oil. This means that if you set the oil price to $25 a barrel, there is no method available to humanity to provide enough oil to meet demand over any period of time that’s really relevant. I also believe we are in the middle of proving that we have also passed $50 Peak Oil. My final conjecture here is that we will prove in the near-term future to have reached $75 Peak Oil. I don’t believe we are quite at $100 Peak Oil.

Notice that in my formulation the term Peak Oil is always stated as a peak price. Oil is not consumed in a vacuum. The price affects the demand the world has for the product and simultaneously changes the ability of all sorts of entities (businesses and governments) to retrieve deposits of it. This is what I hope to prove in this article.

So what data could I bring to this crowded table?

Well we have one thing we now have that previous entrants into the Peak Oil melee didn’t, which is the recent price crash in oil. Peak oil is often falsely portrayed as a failed idea since it hasn’t resulted in a super squeeze to ultra high prices. These spike prices are viewed as the really critical element by energy investors since they are trying to find the best case. After all, who doesn’t want to own an oil producer if they can identify a spot in which oil prices will rise to some enormous number.

But that is the wrong way to go about it for your oil investments over the long haul. Because what $50 Peak Oil really provides is a floor. In a world where we have passed $25 Peak Oil, it should be impossible, without exogenous events of enormous magnitude (world war, etc.), to press the price of the product below that price. If you could do so, you would immediately disprove the thesis. You would then know the floor provided by whichever peak oil price level you selected was wrong. The same idea seems to hold true for $50 Peak Oil now.

To prove this “floor” we need to choose times of extreme stress in the oil markets, and look at those oil prices and see what the bottoms were. For these examples, let’s select WTI oil, whose weekly average prices are reported all the way back to 1986 by the EIA.

Let’s take the three big crashes in the oil markets. I will use a full year’s average to try to smooth out the various difficulties presented by weather, seasonal effects, or various one-off events (outages, etc.). The first crash I will use as a benchmark is The 1986 Oil Crash. The 1986 breakdown was a supply crash, caused by supply swamping demand. How big a disaster was it for the oil industry?

In 1986, the Saudis opened the spigot and sparked a four-month, 67 percent plunge that left oil just above $10 a barrel. The U.S. industry collapsed, triggering almost a quarter-century of production declines, and the Saudis regained their leading role in the world’s oil market.

This was quite a crash obviously. Triggering a 25 year decline? Not going to find a lot worse than this. So in inflation adjusted dollars what was WTI oil at for the year of 1986? It sold for around $32 a barrel. Now let’s note that at this time WTI crude was actually at a higher price vs. Brent and other world prices. On a Brent basis, crude would have been just around $25 for the year. This will prove to be an important point in a short while.

The next crash we will use to benchmark was the 2008 Financial Crisis. On this website, I should hope that this world crisis will need no introduction and little explanation. This crash in oil prices (and just about every other thing priced by human beings) was a demand crash. The financial disintegration across the world led to massive drops in demand, as jobs were lost across the world by the millions. So with this demand crash what was the average price of WTI crude in the year 2009? It sold in that year for a little over $60.

The last crash I will add is the current drop, starting sometime around October by my reckoning. I would find it hard to imagine any reader of this article is unfamiliar with the current situation in North America or the world regarding oil, at least in a headline sense. This seems to be a supply crash again, where North American-led tight oil drillers have caused an increase in production that the world’s demand couldn’t handle at the $100 price level. Since then, prices have dropped down to a level that suppresses the production of oil and enhances demand.

In the first four months of 2015, the North American oil rig count has already dropped by more than 50% as compared to last year and the demand for oil has begun to increase according to EIA statistics. The current price of WTI oil has been just over $49 as an average for the year 2015. However, let us note that WTI oil now sells for a large discount to world prices, and during the previous two crashes, WTI sold for a premium.

Now we have three data points. Each one is a fairly long period of time, not just a single week. We know that the world in 1986 nearly ended for the oil industry, yet in current dollars, WTI oil was unable to trade for a year below $30 a barrel. Then we had in 2008 and 2009 an economic crisis which was widely described as being the most dire financial disaster since WWII. In 2009, WTI oil still ended up trading well over the 1986 low. In fact it was nearly double that price. This shows just how hard it can be using almost any technique to push oil prices below a true peak number.

Now we have another supply led crunch. One that is widely described as the worst oil crash since 1986, a nearly 30 year time gap. We are attacking the oil price from the supply side instead of 2008’s demand side. Yet thus far, in 2015, oil is still trading more than 50% higher than the 1986 year average, inflation adjusted. In fact, WTI, when adjusted for its current discount to world prices, is trading close to its 2009 average price. Again, nearly double the price of the 1986 crash.

What does this all mean for investing? It means to me that $25 Peak Oil is behind us. You couldn’t really hit and maintain that number in the 1986 crash when many more virgin conventional reservoirs of oil were available. Despite the last three oil crises, not one of them could get WTI oil to $25 and keep it there. Now, using much more expensive oil resources (shale fracing, deep water drilling, arctic development, etc.), it doesn’t seem like the last two disasters have been able to press WTI oil much below $50 for a material length of time. In this recent crash, the $50 floor was able to be reached only with several years of hyper-investment made possible by the twin forces of sustained high prices and access to ultra-cheap capital. Both of these forces are no longer present in the oil markets.

Therefore, I think using a $50 Peak Oil number is a very reasonable hard floor to use when stress testing your oil stocks. It means that when I am choosing a stock that produces oil, it can survive both from supply and the demand led crashes using the worst the world can throw at it.

Some will say this reasoning is simplistic. One could claim any number of variables in the future (technology, peace in the Middle East, etc.) could change all the points I am relying on here. But we have thrown everything at the oil complex between 2008 and now; both from the supply side and the demand sides; breakdowns of the whole world economy, wars, sanctions, natural disasters, hugely stupid governmental policies, OPEC’s seeming fade to irrelevance, biofuels, periods of ultra-high prices, technological progress, electric cars, etc. Yet, here we stand with these numbers staring us in the face.

In conclusion, I feel these price points prove the reality of $50 Peak Oil (WTI). If WTI oil averages more than $50 in 2015 (which I strongly feel the data shows will happen), then it will confirm my thesis that no matter what happens in the world, human beings cannot seem to produce the amount of oil they require for less than that number. Therefore, one will know what the hard floor for petroleum is provided by the hugely complex interplay of geology, politics, economics, and technology by simply measuring those effects on one easy-to-measure point of data, namely price. This version of peak oil also means I have a minimum to test my selections on. I can buy companies that can at least deal with that floor, then make large profits as the prices rise from that hard floor. All oil fields deplete, and for the past twenty years, the solution has universally been to add more expensive technological solutions, exploit smaller or more physically difficult deposits, or use more expensive alternatives. The oil market does not have the same options available to it like it did 1986. Large, cheap conventional oil deposits are no longer available in sufficient supply, which is likely what the oil price is telling us by having higher Peak Floors during crashes. Without the magic of sustained ultra high prices, the investment levels that made this run at the $50 Peak Oil level will not exist going into the future. This means that the Peak Oil floor price should be creeping higher as a sector tailwind, giving a patient and selective investor a tremendous advantage for themselves.

Read more: Volte-Face Investments: The Last Two Oil Crashes Show Peak Oil Is Real

US Oil Rig Count Decline Quickened This Week

Idle rigs in Helmerich & Payne International Drilling Co.'s yard in Ector County, Texas. North Dakota has also been hit hard, forcing gains in technology.

Source: Rigzone

The fall in U.S. rigs drilling for oil quickened a bit this week, data showed on Friday, suggesting a recent slowdown in the decline in drilling was temporary, after slumping oil prices caused energy companies to idle half the country’s rigs since October.

Drillers idled 31 oil rigs this week, leaving 703 rigs active, after taking 26 and 42 rigs out of service in the previous two weeks, oil services firm Baker Hughes Inc said in its closely watched report.

With the oil rig decline this week, the number of active rigs has fallen for a record 20 weeks in a row to the lowest since 2010, according to Baker Hughes data going back to 1987.
Since the number of oil rigs peaked at 1,609 in October, energy producers have responded quickly to the steep 60 percent drop in oil prices since last summer by cutting spending, eliminating jobs and idling rigs.

After its precipitous drop since October, the U.S. oil rig count is nearing a pivotal level that experts say could dent production, bolster prices and even coax oil companies back to the well pad in the coming months.

https://jafrianews.files.wordpress.com/2015/04/shia-houthi-threatens-to-attack-saudi-arabia-it-air-strikes-continue.jpg

Pioneer Natural Resources Co, a top oil producer in the Permian Basin of West Texas, said this week it will start adding rigs in June as long as market conditions are favorable. U.S. crude futures this week climbed to over $58 a barrel, the highest level this year, as a Saudi-led coalition continued bombings in Yemen.

That was up 38 percent from a six-year low near $42 set in mid March on oversupply concerns and lackluster demand, in part on expectations the lower rig count will start reducing U.S. oil output.

After rising mostly steadily since 2009, U.S. oil production has stalled near 9.4 million barrels a day since early March, the highest level since the early 1970s, according to government data.

The Permian Basin in West Texas and eastern New Mexico, the nation’s biggest and fastest-growing shale oil basin, lost the most oil rigs, down 13 to 242, the lowest on record, according to data going back to 2011.

Texas was the state with the biggest rig decline, down 19 to 392, the least since 2009.
In Canada, active oil rigs fell by four to 16, the lowest since 2009. U.S. natural gas rigs, meanwhile, climbed by eight to 225, the same as two weeks ago.

Bankruptcies Suddenly Soar Across Corporate America, Worst First Quarter Since 2009

by Wolf Street

“Come down to Houston,” William Snyder, leader of the Deloitte Corporate Restructuring Group, told Reuters. “You’ll see there is just a stream of consultants and bankruptcy attorneys running around this town.”

But it’s not just in Houston or in the oil patch. It’s in retail, healthcare, mining, finance…. Bankruptcies are suddenly booming, after years of drought.

In the first quarter, 26 publicly traded corporations filed for bankruptcy, up from 11 at the same time last year, Reuters reported. Six of these companies listed assets of over $1 billion, the most since Financial-Crisis year 2009. In total, they listed $34 billion in assets, the second highest for a first quarter since before the financial crisis, behind only the record $102 billion in 2009.

The largest bankruptcy was the casino operating company of Caesars Entertainment that has been unprofitable for five years. It’s among the zombies of Corporate America, kept moving with new money from investors that had been driven to near insanity by the Fed’s six-plus years of interest rate repression.

Next in line were Doral Financial, security services outfit Altegrity, RadioShack, and Allied Nevada Gold. The first oil-and-gas company showed up in sixth place, Quicksilver Resources [Investors Crushed as US Natural Gas Drillers Blow Up].

Among the largest 15 sinners on the list, based on Bankruptcydata.com, are six oil-and-gas related companies. But mostly in the lower half. So far, larger energy companies are still hanging on by their teeth.

US-bankruptcies-Q1-2015This isn’t the list of a single troubled sector that ran out of luck. This isn’t a single issue, such as the oil-price collapse. This is the list of a broader phenomenon: too much debt across a struggling economy. And now the reckoning has started.

So maybe the first-quarter surge of bankruptcies was a statistical hiccup; and for the rest of the year, bankruptcies will once again become a rarity.

Wishful thinking? The list only contains publicly traded companies that have already filed. But the energy sector, for example, is full of companies that are owned by PE firms, such as money-losing natural gas driller Samson Resources. It warned in March that it might have to use bankruptcy to restructure its crushing debt.

Similar troubles are building up in other sectors with companies owned by PE firms. As a business model, PE firms strip equity out of the companies they buy, load them up with debt, and often pay special dividends out the back door to themselves. These companies are prime candidates for bankruptcy.

Restructuring specialists are licking their chops. Reality is setting in after years of drought when the Fed’s flood of money kept every company afloat no matter how badly it was leaking. These folks are paid to renegotiate debt covenants, obtain forbearance agreements from lenders, renegotiate loans, etc. At some point, they’ll try to “restructure” the debts.

“There is a ton of activity under the water,” explained Jon Garcia, founder of McKinsey Recovery & Transformation Services.

Just on Wednesday, gun maker Colt Defense, which is invoking a prepackaged Chapter 11 filing, proposed to exchange its $250 million of 8.75% unsecured notes due 2017 for new 10% junior-lien notes due in 2023, according to S&P Capital IQ/LCD. But at a pro rata of 35 cents on the dollar!

Equity holders are out of luck. The haircut would “address key issues relating to Colt’s viability as a going concern,” the filing said. It would allow the company “to attract new financing in the years to come.” Always fresh money!

Also on Wednesday, Walter Energy announced that it would skip the interest payment due on its first-lien notes. In early March, when news emerged that it had hired legal counsel to explore restructuring options, these first-lien notes plunged to 64.5 cents on the dollar and its shares became a penny stock.

None of them has shown up in bankruptcy statistics yet. They’re part of the “activity under water,” as Garcia put it.

But these Colt Defense and Walter Energy notes are part of the “distressed bonds” whose values have collapsed and whose yields have spiked in a sign that investors consider them likely to default. These distressed bonds, according to Bank of America Merrill Lynch index data, have more than doubled year over year to $121 billion.

The actual default rate, which lags behind the rise in distressed debt levels, is beginning to tick up. Yet it’s still relatively low thanks to the Fed’s ongoing easy-money policies where new money constantly comes forward to bail out old money.

But once push comes to shove, equity owners get wiped out. Creditors at the lower end of the hierarchy lose much or all of their capital. Senior creditors end up with much of the assets. And the company emerges with a much smaller debt burden.

It’s a cleansing process, and for many existing investors a total wipeout. But the Fed, in its infinite wisdom, wanted to create paper wealth and take credit for the subsequent “wealth effect.” Hence, with its policies, it has deactivated that process for years.

Instead, these companies were able to pile even more debt on their zombie balance sheets, and just kept going. It temporarily protected the illusory paper wealth of shareholders and creditors. It allowed PE firms to systematically strip cash out of their portfolio companies before the very eyes of their willing lenders. And it prevented, or rather delayed, essential creative destruction for years.

But now reality is re-inserting itself edgewise into the game. QE has ended in the US. Commodity prices have plunged. Consumers are strung out and have trouble splurging. China is slowing. Miracles aren’t happening. Lenders are getting a teeny-weeny bit antsy. And risk, which everyone thought the Fed had eradicated, is gradually rearing its ugly head again. We’re shocked and appalled.


Fed’s Dudley Warns about Wave of Municipal Bankruptcies

The Fed is doing workshops on municipal bankruptcies now.

It has been a persistent ugly list of municipal bankruptcies: Detroit, MI; Vallejo, San Bernardino, Stockton, and Mammoth Lakes, CA; Jefferson County, AL. Harrisburg, PA; Central Falls, RI; Boise County, ID.

There are many more aspirants for that list, including cities bigger than Detroit. Detroit was the test case for shedding debt. If bankruptcy worked in Detroit, it might work in Chicago. Illinois Gov. Bruce Rauner wants to make Chapter 9 bankruptcies legal for cities in his state, which is facing its own mega-problems.

“Bankruptcy law exists for a reason; it’s allowed in business so that businesses can get back on their feet and prosper again by restructuring their debts,” Rauner said. “It’s very important for governments to be able to do that, too.”

His plan for sparing Illinois that fate is to cut state assistance to municipalities, which doesn’t sit well with officials at these municipalities. Chicago Mayor Rahm Emanuel’s office countered that balancing the state budget on the backs of the local governments is itself a “bankrupt” idea.

Puerto Rico doesn’t even have access to a legal framework like bankruptcy to reduce its debts, but it won’t be able to service them. It owes $73 billion to bondholders, about $20,000 per-capita – more than any of the 50 states. If you own a muni bond fund, you’re probably a creditor. Bond-fund managers use its higher-yielding debt to goose their performance. But now some sort of default and debt relieve is in the works. The US Treasury Department is involved too.

“People before debt,” the people in Puerto Rico demand. It’s going to be expensive for bondholders.

That’s the ugly drumbeat in the background of New York Fed President William Dudley’s speech today at the New York Fed’s evocatively  named workshop, “Chapter 9 and Alternatives for Distressed Municipalities and States.”

So they’re doing workshops on municipal bankruptcies now….

“We at the New York Fed are committed to playing a role in ensuring the stability of this important sector,” he said, referring to the sordid finances of state and local governments. But he wasn’t talking about future bailouts by the Fed. He was issuing a warning to municipalities and their creditors about “the emerging fiscal stresses in the sector.”

It’s a big sector. State and local governments employ about 20 million people – “nearly one in seven American workers.” The sector accounts for about $2 trillion, or 11%, of US GDP. And its services like public safety, education, health, water, sewer, and transportation, are “absolutely fundamental to support private sector economic activity.”

The problem is how all this and other budget items have gotten funded. There are about $3.5 trillion in municipal bonds outstanding. So Dudley makes a crucial distinction:

When governments invest in long-lived capital goods like water and sewer systems, as well as roads and bridges, it makes sense to finance these assets with debt. Debt financing ensures that future residents, who benefit from the services these investments produce, are also required to help pay for them. This principle supports the efficient provision of these long-lived assets.

“Unfortunately,” he said, governments borrow to “cover operating deficits. This kind of debt has a very different character than debt issued to finance infrastructure.” It’s “equivalent to asking future taxpayers to help finance today’s public services.”

In theory, 49 states require a balanced budget every year, but it’s easy enough to “find ways to ‘get around’ balanced budget requirements” and cover operating expenses with borrowed money, he said, including the widespread practice of “pushing the cost of current employment services into the future” by underfunding pensions and retiree healthcare benefits for current public employees.

The total mountain of unfunded liabilities remains murky, but estimates for unfunded pension liabilities alone “range up to several trillion dollars.” With these unfunded liabilities, employees are the creditors. That would be on top of the $3.5 trillion in official debt, where bondholders are the creditors.

And eventually, high debt levels and the provision of services clash as in Detroit and Stockton, he said, and render public sector finances “unsustainable.”

But cutting services to the bone to be able to service the ballooning debt entails a problem: citizens can vote with their feet and move elsewhere, thus reducing the tax base and economic activity further. To forestall that, municipalities may alter their priorities and favor the provision of services over debt payments. “This may occur well before the point that debt service capacity appears to be fully exhausted,” he said.

In other words, the prioritization of cash flows to debt service may not be sustainable beyond a certain point. While these particular bankruptcy filings [by Detroit and Stockton] have captured a considerable amount of attention, and rightly so, they may foreshadow more widespread problems than what might be implied by current bond ratings.

That was easy to miss: foreshadow more widespread problems than what might be implied by current bond ratings. Dudley in essence said that current bond ratings – and therefore current bond prices and yields – don’t reflect the ugly reality of state and municipal financial conditions.

It was a warning for states and municipalities to get their financial house in order “before any problems grow to the point where bankruptcy becomes the only viable option.”

It was a warning for public employees and retirees – in their role as creditors – to not rely on promises made by their governments concerning pensions and retiree healthcare benefits.

And it was a warning for municipal bondholders that their portfolios were packed with risky, but low-yielding securities that might end up being renegotiated in bankruptcy court, along with claims by public employees and what’s left of their pension funds. And it was a blunt warning not to trust the ratings that our infamous ratings agencies stamp on these municipal bonds.

Some states are worse than others. Even with capital gains taxes from the booming stock market and startup scene raining down on my beloved and crazy state of California, it ranks as America’s 7th worst “Sinkhole State,” where taxpayers shoulder the largest burden of state debt.

Millions Facing Higher Flood Insurance Premiums

FILE - In this Oct. 30, 2012 file photo, a boat floats in the driveway of a Lindenhurst home on New York’s Long Island, in the flooding aftermath of Superstorm Sandy. Under new legislation that went into effect in April 2015, those living in high-risk flood regions, like some of the communities that experienced Sandy's wrath in 2012, are paying 18 percent increases in their federal flood insurance.

A $24 billion sea of red ink has millions of Americans in vulnerable flood zones, including homeowners still struggling to recover from Superstorm Sandy, facing steep increases in flood insurance premiums.

New legislation that went into effect this month — the second time in two years Congress has tweaked the troubled National Flood Insurance Program — allows rate increases of up to 18 percent.

“This appears to be death by a thousand cuts,'” said Scott Primiano, an Amityville, New York, insurance broker who has been holding seminars for clients to explain the new legislation. “The concept sounds good, but no one can say what the full risk is. … They are going to take it in bits and pieces every year and it keeps going until Congress determines we’ve had enough.”

Federal Emergency Management Agency spokesman Rafael Lemaitre said the flood insurance program has for decades been paying out more than it took in, with the United States as a whole totaling more than $260 billion in flood-related damages between 1980 and 2013. He said the new legislation is “intended to improve the long-term sustainability of the program while being sensitive to needs of policyholders.”

Lemaitre noted that a previous overhaul in 2012 had socked many policyholders with even higher rate hikes — as much as 25 percent annually.

In addition to rate increases capped at 18 percent annually for those with mortgages living in high-risk flood regions, the new legislation means all flood insurance customers nationwide will pay at least a $25 surcharge on their annual premiums. And homeowners with a “secondary residence,” such as vacation properties, will pay a $250 surcharge.

The law gives FEMA 18 months to complete a study on flood insurance affordability and up to 36 months to find a way to offer targeted assistance to policyholders who can’t afford high premiums. Congress also said FEMA should set a goal of limiting annual premiums to no more than $2,500 per year for $250,000 in coverage, but didn’t offer any suggestions on how to do that.

https://i0.wp.com/i.usatoday.net/news/graphics/2010/0820-flood-insurance/floodInsurance-map.jpg

“Most of the 30 million homeowners have no idea that their flood insurance is going to rise,” says George Kasimos of Toms River, New Jersey, who founded the grass-roots group Stop FEMA Now after learning of increases in flood insurance premiums. “The exorbitant rise in flood insurance increases is going to make the 2007 housing bubble look like a walk in the park.”

Tom Daniels, a 66-year-old retiree from Lindenhurst, New York, said his home had 3 1/2 feet of water after Sandy struck, and received $97,000 in insurance to pay for the damage. He said his flood insurance rates are up $600 a year, and now pays more than $2,800 annually.

“I had a feeling they were going to go up,” he said. “I think I’m one of the lucky ones because I only have to pay $50 a month more. I understand that and we’re grateful for what we’ve got.”

Susan Goldstone said she is still struggling to assist her parents in their attempts to get their Oceanside, New York, home repaired after Sandy flooded up to 8 feet of their house.

“We’re still paying for flood insurance, but we’re still not back in the house,” she said. “How do they expect people to stay in their home? It’s crazy high and then you have to deal with the taxes. When does it end? There must be some other alternative.”

Here’s What Could Point To More Upside For Oil

https://i0.wp.com/thumbnails.cnbc.com/VCPS/Y2015/M04D16/3000371772/5ED2-REQ-0416TradeNationOilBounce_mezz.jpgClick here to play video

Crude oil has already bounced back by 30 percent over the past month. But according to Richard Ross of Evercore ISI, currency market moves are predicting more upside for the battered commodity.

Over the past week, oil-exposed currencies such as the Canadian dollar, the Norwegian krone and the Australian dollar have surged in value against the U.S. dollar. And since these currencies tend to be correlated with crude, Ross extrapolates that oil has more upside.

Crude-exposed currencies “are really firming here, and they have been firming over the past month or so along with crude oil itself, and I think that holds bullish implications,” Ross said.

Looking at the Canadian currency in particular, Ross predicts that “the Canadian dollar continues to firm against the U.S. dollar, and this should be supportive of crude.”

Even the crumbling Russian ruble has had a great run over the past month, Ross points out.

“Earlier this year, the ruble was staring into the abyss,” he said in a Thursday “Trading Nation” segment. “Strength in the Russian ruble, once again, has a positive read-through for crude oil.”

However, not everyone buys the thesis.

Referring to the commodity currencies, Boris Schlossberg of BK Asset Management said that “they’re kind of reactive. It’s hard to make that case completely.”

In other words, crude is driving currencies like the Canadian dollar, and not the other way around.

Denver Tops New List of Hottest Housing Markets

https://richmerritt.files.wordpress.com/2012/03/la_skyline_mountains2.jpgby Phil Hall

The hottest single-family housing markets in the nation are located across the Southwest and the South, according to the latest data released by Auction.com.

Among the nation’s 49 largest markets, Denver topped the list when it came to a combination of strong housing demand and favorable affordability coupled with a vibrant economy and demographic conditions. According to Auction.com, Denver experiences a 9.2 percent year-over-year home price growth and a 4.6 percent year-over-year home sales growth.

But why Denver, of all places?

“I’m tempted to tell you it is a Rocky Mountain high,” said Rick Sharga, executive vice president at Auction.com. And while Sharga admitted that the legalization of recreational marijuana in Colorado has helped to boost Denver’s tourism and hospitality industries, the city is enjoying a sturdy economic growth in the professional services sector. “They have exceptional job growth, about three times the national average.”

Rounding out the top 10 for the strongest markets are San Antonio, Nashville, Fort Lauderdale, Dallas, Fort Worth, Seattle, San Francisco, Phoenix and Charlotte. Conspicuously absent from the upper level of strong markets were Northeastern cities—the highest ranked on the Auction.com list was Boston in 34th place.

“We are seeing sort of the opposite of what we’re seeing in the South or Southwest,” said Sharga about the Northeast’s economic health and housing environment. “The population growth is flat or negative and there is not a lot of the job growth that we see in other markets.”

As a national whole, Sharga stated that housing has seen and hopes to see better days. “We’re off to a worse than expected start,” he said of the 2015 housing picture. “I expect a fairly healthy spring, approaching five units in sales. But we should be in the area of six units in sales.”

Hobbiton is a Real Place in New Zealand

https://twistedsifter.files.wordpress.com/2015/03/hobbiton-movie-set-tour-new-zealand-13.jpgsource: Twisted Sifter

When Peter Jackson spotted the Alexander Farm during an aerial search of the North Island for the best possible locations to film The Lord of The Rings film trilogy, he immediately thought it was perfect for Hobbiton.

Site construction started in March 1999 and filming commenced in December that year, continuing for three months. The set was rebuilt in 2011 for the feature films “The Hobbit: An Unexpected Journey”, “The Hobbit: The Desolation of Smaug”, and “The Hobbit: There and Back Again”.

It is now a permanent attraction complete with hobbit holes, gardens, bridge, Mill and The Green Dragon Inn.

hobbiton movie set tour new zealand (7)

hobbiton movie set tour new zealand (3)

Matamata, home of the Hobbiton Movie Set, is a small agricultural town in the heart of the Waikato region, nestled at the base of the Kaimai ranges. It is about a 2 hour drive from Auckland and you can also find other nearby places and estimated travel times below:

From Hamilton: A 45-minute drive.
From Rotorua: A 45-minute drive.
From Taupo: One-and-a-half-hour drive.
From Tauranga: 45-minute drive.
From Waitomo: One-and-a-half-hour drive.

hobbiton movie set tour new zealand (10)

hobbiton movie set tour new zealand (11)

hobbiton movie set tour new zealand (12)

Thirty-seven hobbit holes were originally created with untreated timber, ply and polystyrene. After the 2011 rebuild, there are now 44 unique hobbit holes, the Green Dragon Pub, Mill, double arched bridge and the famous Party Tree.

hobbiton movie set tour new zealand (8)

hobbiton movie set tour new zealand (6)

The Alexanders moved to the 1250 acre (500 hectare) property, in 1978. Since then it has been farmed as a traditional New Zealand sheep and beef farm. It is still farmed the same today and is run by the brothers and their father.
 
The property runs approximately 13,000 sheep and 300 Angus beef cattle hence the major sources of income are mutton, wool and beef. The brothers shear all the sheep on the property themselves, approximately every eight months. [source]

hobbiton movie set tour new zealand (5)

hobbiton movie set tour new zealand (1)

hobbiton movie set tour new zealand (4)

hobbiton movie set tour new zealand (2)

hobbiton movie set tour new zealand (14)

How To Avoid Fake Vacation Rentals

The home-sharing economy is heating up. Inevitably, more and more of us have been getting fleeced on fake vacation rentals.

Vacation planning often begins with excitement, optimism and nowadays the Internet. The online search leads far into a world of glossy photos, descriptive blurbs and, of course, countless promises of customer satisfaction. Even if you’re not inclined to rent a stranger’s house, you may find that for the most popular destinations, traditional hotels are booked or inadequate. So renting a vacation home is a natural alternative. According to the Vacation Rental Managers Association, 24 percent of leisure travelers report having stayed in a vacation home, up from around 11 percent in 2008.

Before the Internet, the search for a private vacation rental was slow and impractical. It involved trading a lot of phone calls, mailing printed packages and coordinating to solve all kinds of problems. Hoteliers like Marriott, Hilton and Hyatt Hotels built empires based on the wealthy traveler’s desire for luxury and reticence to deal with this process.

Then along came online portals like VRBO, Airbnb and Craigslist. All of a sudden, we’re in the mood to share.

For the most part, the rise of all of this house sharing has been positive. Sophisticated channels like Airbnb and HomeAway try especially hard to protect renters by providing secure payment, user comments and star ratings. But even they are not immune from deceit.

Vacation rental scams come in many different forms. Some Web portals are run by technologists with no connection to the actual real estate. Through smart search engine optimization, these sites attract users, and then sell the lead to the true agent, who offsets the cost with higher rent.

Sure, it looks like the perfect spot for a vacation. But will it be there when you arrive?

The worst rip-offs seduce would-be vacationers with fabulous pictures of fictitious properties. Once the renter is hooked, the phony landlord collects an up-front “security deposit” and runs for the hills. Victims are left unaware they’ve been cheated until weeks later, when they show up at the address with their luggage in hand.

Other variations on the scam are only slightly less fraudulent. Some fakes use the bait-and-switch method by showing unavailable properties, only to divert the renter to another, less desirable spot. Other tricksters may double-book a property, then send whichever vacationer arrives last to a second-rate backup, along with sincere apologies.

You’re too sharp to be ensnared in any of these scams, right? Real estate is my business, so I used to believe the same thing. Then I tried renting a vacation home in Aspen, Colorado, for a summer holiday.

I found many remarkable online listings — only to discover after contacting their presumed representatives that the properties were always booked. After many failed tries and long phone calls I realized I was being conned. I stopped browsing and hired a high-quality local real estate broker to show me real listings.

My experience could have been worse — some friends from Germany were recently snared here in Miami. Fortunately, they insisted on withholding their security deposit from their seemingly delightful contact until after completing a property inspection. Still, she pressured these visitors to wire funds — right up to the time they were driving to the property after their long flight. Having stood their ground, they arrived at the home, which appeared exactly as it did online. Unfortunately, it was occupied by its unsuspecting owner — who had no intention to rent. Of course, my friends never again succeeded in connecting with their agent and had to scramble to locate a hotel room.

Why aren’t authorities cracking down? Perhaps because the dollar figures involved in each case simply aren’t enough to justify an intercontinental examination. The victims, by definition, don’t live anywhere near the jurisdiction of the reported crime. Most often, the crooks don’t either.

So how do you protect yourself? Here’s a list of 10 ways to combat this scam:

  1. Don’t be fooled by photography. In particular, be wary of the nicest-looking, most Photoshopped property photos. Ask the owner for additional photos — an honest lessor will always have them. Or ask your agent to use technology like FaceTime or Skype to show you the property live. At the very least, use Google GOOG -0.11% Earth and Google’s Street View feature to confirm that the property you’re renting actually exists at the address advertised. You can also use those Google tools to get an unvarnished look at the property’s exterior.
  2. Be careful of the cheapest properties. If prices seem too good to be true, they probably are. If you don’t have a feel for what a reasonable price is in an area, get one. Scammers often go after people who aren’t that savvy. And drive a hard bargain — not just to get a better deal, but also to detect odd behavior from the other party.
  3. Never pay with cash. The preferred methods of payment among criminals are cash and cash-transfer services like MoneyGram and Western Union WU 0%. Use a credit card instead — Visa, MasterCard and American Express will all allow you to recover money you lose to fraud. Reputable sites like Airbnb will hold your security funds in escrow. They play middleman, making sure you’ve put the funds in place before you get keys. (Some portals offer insurance against fraud — but it’s expensive and may not cover much; read the policy closely.)
  4. Use a trusted local agent. Yes, you should expect to pay them. But they can show you bona fide listings or go look at the properties that you’ve seen on the Internet for you. Be sure to check their license.
  5. Confirm legitimacy. For ownership and all documents, confirm that the owner’s name on the lease is the same as the one shown on public property appraiser records. Then have a lawyer review the lease, just like you would a full-year agreement.
  6. Read the comments. The feedback from previous renters that appears on sites like Airbnb and VRBO is invaluable. And in some cases, you’re even allowed to pose questions to other users.
  7. Trust your instincts. If you apply some skepticism to the process, you’re more likely to see red flags. You’re also more likely to catch suspicious behavior. My Germans looked back after their experience and realized their phony realty agent had exhibited all kinds of weird tics. They were so excited about their trip to Miami that they failed to pick up on them.
  8. Take your time. No need to rush. For long vacations, consider going ahead of time to check out the property, or not renting a house for the first week — stay at a hotel for a few nights. It will give you an opportunity to see the property you’re renting in person before turning over your security deposit.
  9. Be a regular. If you rent a home you like, stick with it. You’ll develop a relationship with the owner if you go back to the same place year in, year out — and avoid the risk of being scammed on a new property. If you’re traveling to a new place, try to find a friend who lives there and will give you honest feedback on potential rentals, good neighborhoods, etc.
  10. Beware group think. If you’re vacationing with a half-dozen other people, everybody tends to figure that somebody else is paying attention to the details and making sure the group isn’t getting ripped off. Then, when the amazing six-bedroom place you all rented together is nowhere to be found and your security deposit evaporates, everybody’s pointing fingers.

Demand for Housing Hits All-Time Low

by Colin Wilhelm

Consumer demand for housing has dropped to its lowest recorded level due to reduced confidence in financial security and income raises, a new survey from Fannie Mae says.

The government-sponsored enterprise’s March national housing survey found that 41% of Americans expect their financial situation to improve over the next year, and 22% said their income had increased substantially over the last year.

Most importantly, the percentage of respondents who said they planned to buy a home dropped five basis points to 60%, an all-time survey low.

“We’ve seen modest improvement in total compensation resulting from a strengthened labor market,” Fannie Mae chief economist Doug Duncan said in a release.

“However, income growth perceptions and personal financial expectations both eased off of recent highs, consistent with Friday’s weak jobs report. Simultaneously, the share of consumers expecting to buy on their next move has declined. Meanwhile, the wait for housing expansion continues.”

One Third Of U.S. Companies’ Q1 Job Cuts Due To Oil Prices

https://i0.wp.com/www.jobcutnews.com/wp-content/uploads/2011/10/pink-slips.jpgby Olivia Pulsinelli

Oil prices caused one-third of the job cuts that U.S.-based companies announced in the first quarter, according to a new report. March was the fourth month in a row to record a year-over-year increase in job cuts, Chicago-based outplacement consultancy Challenger, Gray & Christmas Inc. reports. And 47,610 of the 140,214 job cuts announced between January and March were directly attributed to falling oil prices. Not surprisingly, the energy sector accounted for 37,811 of the job cuts — up a staggering 3,900 percent from the same quarter a year earlier, when 940 energy jobs were cut. However, U.S. energy firms only announced 1,279 job cuts in March, down about 92 percent from the 16,339 announced in February and down nearly 94 percent from the 20,193 announced in January. The trend held true in Houston, where several energy employers announced job cuts in January and February, while fewer cuts were announced in March. Overall job-cut announcements are declining, as well. U.S. employers announced 36,594 job cuts in March, down 27.6 percent from the 50,579 announced in February and down 31 percent from the 53,041 announced in January. In December, 32,640 job cuts were announced. “Without these oil related cuts, we could have been looking one of lowest quarters for job-cutting since the mid-90s when three-month tallies totaled fewer than 100,000. However, the drop in the price of oil has taken a significant toll on oil field services, energy providers, pipelines, and related manufacturing this year,” John Challenger, CEO of Challenger, Gray & Christmas, said in a statement.

The U.S. Oil Boom Is Moving To A Level Not Seen In 45 Years

by Myra P. Saefong

Peak U.S. oil production is a ‘moving target’

SAN FRANCISCO (MarketWatch) — U.S. oil production is on track to reach an annual all-time high by September of this year, according to Rystad Energy. If production does indeed top out, then supply levels may soon hit a peak as well. That, in turn, could lead to shrinking supplies. The oil-and-gas consulting-services firm estimates an average 2015 output of 9.65 million barrels a day will be reached in five months — topping the previous peak annual reading of 9.64 million barrels a day in 1970. Coincidentally, the nation’s crude inventories stand at a record 471.4 million barrels, based on data from U.S. Energy Information Administration, also going back to the 1970s. The staggering pace of production from shale drilling and hydraulic fracturing have been blamed for the 46% drop in crude prices CLK5, -1.08% last year. But reaching so-called peak production may translate into a return to higher oil prices as supplies begin to thin.

Rystad Energy’s estimate includes crude oil and lease condensate (liquid hydrocarbons that enter the crude-oil stream after production), and assumes an average price of $55 for West Texas Intermediate crude oil. May WTI crude settled at $49.14 a barrel on Friday. The forecast peak production level in September is also dependent on horizontal oil rig counts for Bakken, Eagle Ford and Permian shale plays stabilizing at 400 rigs, notes Per Magnus Nysveen, senior partner and head of analysis at Rystad. Of course, in this case, hitting peak production isn’t assured. “Some will be debating whether the U.S. has reached its peak production for the current boom, without addressing the question of what level will U.S. production climb to in any future booms,” said Charles Perry, head of energy consultant Perry Management. “So one might also say U.S. peak production is a moving target.” James Williams, an energy economist at WTRG Economics, said that by his calculations, peak production may have already happened or may occur this month, since the market has seen a decline in North Dakota production, with Texas expected to follow.

Permian Basin Idles Five Rigs This Week

by Trevor Hawes

Drilling rig

The number of rigs exploring for oil and natural gas in the Permian Basin decreased five this week to 285, according to the weekly rotary rig count released Thursday by Houston-based oilfield services company Baker Hughes.

The North American rig count was released a day early this week because of the Good Friday holiday, according to the Baker Hughes website.

District 8 — which includes Midland and Ector counties — shed four rigs, bringing the total to 180. The district’s rig count is down 42.68 percent on the year. The Permian Basin is down 46.23 percent.

At this time last year, the Permian Basin had 524 rigs.

TEXAS

Texas’ count fell six this week, leaving 456 rigs statewide.

In other major Texas basins, there were 137 rigs in the Eagle Ford, unchanged; 29 in the Haynesville, down three; 23 in the Granite Wash, down one; and six in the Barnett, unchanged.

Texas had 877 rigs a year ago this week.

UNITED STATES

The number of rigs in the U.S. decreased 20 this week, bringing the nationwide total to 1,028.

There were 802 oil rigs, down 11; 222 natural gas rigs, down 11; and four rigs listed as miscellaneous, up two.

By trajectory, there were 136 vertical rigs, down eight; 799 horizontal rigs, down 13; and 93 directional rigs, up one. The last time the horizontal rig count fell below 800 was the week ending June 4, 2010, when Baker Hughes reported 798 rigs.

There were 993 rigs on land, down 17; four in inland waters, unchanged; and 31 offshore, down three. There were 29 rigs in the Gulf of Mexico, down four.

The U.S. had 1,818 rigs at this time last year.

TOP 5s

The top five states by rig count this week were Texas; Oklahoma with 129, down four; North Dakota with 90, down six; Louisiana with 67, down five; and New Mexico with 51, unchanged.

The top five rig counts by basin were the Permian; the Eagle Ford; the Williston with 91, down six; the Marcellus with 70, unchanged; and the Cana Woodford and Mississippian with 40 each. The Mississippian idled three rigs, while the Cana Woodford was unchanged. The Cana Woodford shale play is located in central Oklahoma.

CANADA AND NORTH AMERICA

The number of rigs operating in Canada fell 20 this week to 100. There were 20 oil rigs, up two; 80 natural gas rigs, down 22; and zero rigs listed as miscellaneous, unchanged.

The last time Canada’s rig count dipped below 100 was the week ending May 29, 2009, when 90 rigs were reported.

Canada had 235 rigs at this time last year.

The total number of rigs in the North America region fell 40 this week to 1,128. North America had 2,083 rigs a year ago this week.

The “Revolver Raid” Arrives: A Wave Of Shale Bankruptcies Has Just Been Unleashed

by Tyler Durden

Back in early 2007, just as the first cracks of the bursting housing and credit bubble were becoming visible, one of the primary harbingers of impending doom was banks slowly but surely yanking availability (aka “dry powder”) under secured revolving credit facilities to companies across America. This also was the first snowflake in what would ultimately become the lack of liquidity avalanche that swept away Lehman and AIG and unleashed the biggest bailout of capitalism in history. Back then, analysts had a pet name for banks calling CFOs and telling them “so sorry, but your secured credit availability has been cut by 50%, 75% or worse” – revolver raids.Well, the infamous revolver raids are back. And unlike 7 years ago when they initially focused on retail companies as a result of the collapse in consumption burdened by trillions in debt, it should come as no surprise this time the sector hit first and foremost is energy, whose “borrowing availability” just went poof as a result of the very much collapse in oil prices.
As Bloomberg reports, “lenders are preparing to cut the credit lines to a group of junk-rated shale oil companies by as much as 30 percent in the coming days, dealing another blow as they struggle with a slump in crude prices, according to people familiar with the matter.


Sabine Oil & Gas Corp. became one of the first companies to warn investors that it faces a cash shortage from a reduced credit line, saying Tuesday that it raises “substantial doubt” about the company’s ability to continue as a going concern.

It’s going to get worse: “About 10 firms are having trouble finding backup financing, said the people familiar with the matter, who asked not to be named because the information hasn’t been announced.”

Why now? Bloomberg explains that “April is a crucial month for the industry because it’s when lenders are due to recalculate the value of properties that energy companies staked as loan collateral. With those assets in decline along with oil prices, banks are preparing to cut the amount they’re willing to lend. And that will only squeeze companies’ ability to produce more oil.

Those loans are typically reset in April and October based on the average price of oil over the previous 12 months. That measure has dropped to about $80, down from $99 when credit lines were last reset.

That represents billions of dollars in reduced funding for dozens of companies that relied on debt to fund drilling operations in U.S. shale basins, according to data compiled by Bloomberg.

“If they can’t drill, they can’t make money,” said Kristen Campana, a New York-based partner in Bracewell & Giuliani LLP’s finance and financial restructuring groups. “It’s a downward spiral.”

As warned here months ago, now that shale companies having exhausted their ZIRP reserves which are largely unsecured funding, it means that once the secured capital crunch arrives – as it now has – it is truly game over, and it is just a matter of months if not weeks before the current stakeholders hand over the keys to the building, or oil well as the case may be, over to either the secured lenders or bondholders.

The good news is that unlike almost a decade ago, this time the news of impending corporate doom will come nearly in real time: “Publicly traded firms are required to disclose such news to investors within four business days, under U.S. Securities and Exchange Commission rules. Some of the companies facing liquidity shortfalls will also disclose that they have fully drawn down their revolving credit lines like Sabine, according to one of the people.”

Speaking of Sabine, its day of reckoning has arrived

Sabine, the Houston-based exploration and production company that merged with Forest Oil Corp. last year, told investors Tuesday that it’s at risk of defaulting on $2 billion of loans and other debt if its banks don’t grant a waiver.

Another company is Samson Resource, which said in a filing on Tuesday that it might have to file for a Chapter 11 bankruptcy protection if the company is unable to refinance its debt obligations. And unless oil soars in the coming days, it won’t. 


Its borrowing base may be reduced due to weak oil and gas prices, requiring the company to repay a portion of its credit line, according to a regulatory filing on Tuesday. That could “result in an event of default,” Tulsa, Oklahoma-based Samson said in the filing.

Indicatively, Samson Resources, which was acquired in a $7.2-billion deal in 2011 by a team of investors led by KKR & Co, had a total debt of $3.9 billion as of Dec. 31. It is unlikely that its sponsors will agree to throw in more good money after bad in hopes of delaying the inevitable.

The revolver raids explain the surge in equity and bond issuance seen in recent weeks:

Many producers have been raising money in recent weeks in anticipation of the credit squeeze, selling shares or raising longer-term debt in the form of junk bonds or loans.

Energy companies issued more than $11 billion in stock in the first quarter, more than 10 times the amount from the first three months of last year, Bloomberg data show. That’s the fastest pace in more than a decade.

Breitburn Energy Partners LP announced a $1 billion deal with EIG Global Energy Partners earlier this week to help repay borrowings on its credit line. EIG, an energy-focused private equity investor in Washington, agreed to buy $350 million of Breitburn’s convertible preferred equity and $650 million of notes, Breitburn said in a March 29 statement.

Unfortunately, absent an increase in the all important price of oil, at this point any incremental dollar thrown at US shale companies is a dollar that will never be repaid.

Finally, speaking of Samson, its imminent bankruptcy should not come as a surprise. Back in January we laid out the shale companies which will file for bankruptcy first. The recent KKR LBO was one of them.

Many more to come as the countdown to the day of reckoning for the US shale sector has just about run out.

Six Bullet Proof Ways To Get Listings Without Cold Calling

Does anyone actually like cold calling?  I’m definitely not a natural cold caller.  And I’m assuming there are a fair number of you out there who would rather generate listings through other methods.  So, I’m focusing on providing the best tactics for you get more listings, listing leads, and ultimately more money all without you having to do cold calling.

by Easy Agent Pro

1) Target Divorcees

targeting divorcee for real estate listings

This is a slightly taboo topic but presents a great opportunity for agents looking for listings.  Did you know that most judges mandate that couples sell their current property?  This is part of the reason for the huge number of divorcees that list their homes each year!

Over 31% of people going through a divorce will list their home within 6 months of filing for their divorce.  This gives you a huge opportunity!  Not only can you list their property, but you can garner two buyers from the transaction.

If 31% of people going through a divorce end up selling their home and there are 1.2 million divorces in the United States a year, that means over 300,000 people list their home within 6 months of filing.

That’s a lot of transactions in a very short period of time! And a list of VERY motivated sellers.

There is very little competition for being the divorce listings expert! You can easily setup Facebook ads like this that target these home sellers:

get home listings without cold calling

And then use landing pages to collect their contact information:

This method will make you the divorce listings expert in no time! You should even place a section on your website or blog about this topic to start collecting leads.

2) Inherited Homes

inherited homes for real estate listings

Did you know that over 1 million people inherit a home every year?  That’s an amazing opportunity for agents!

Think about it, would you want to move into a home that you recently inherited?  Probably not. It might not be in the right location. Maybe it needs too many repairs.  A huge majority of these new homeowners end up selling the property.

You need to target these people! And here’s how:

1) You’ll first want to find an online search for all the local cases in your county.  This is typically held on a “county clerk’s” website. And you are looking for cases in regards to “inheritance.” A simple Google search will do the trick:

get listings without cold calling

Then, you’ll have access to search public data and records.  You should be able to secure the name of the former property owner. At this point, you head over to YellowPages and click “Search People.”  Enter the person’s name into the form:

get listings

You should be able to find the address of the property that was recently inherited.  Now, simply prospect away!

Another tactic for attracting sellers of inherited properties is through Real Estate Farming.  You can learn how to farm in real estate with SEO here.

3) Send Letters To FSBO

get real estate listings fsbo

Do you mail FSBO’s?  I’m sure a lot of you answered yes to that question.  But how many of you have a pre-thought out series of mailers that you send once every 4-7 days?  The percentage of realtors that follow up with their mailer is very small.  In fact, over 65% of sales people never follow up with a marketing idea.

That’s bad.  It takes between 5 and 12 points of contact for someone to be interested in doing business with you.  You have to nurture these people along and get them warm to the idea of doing business with you.  One way of doing this is sending FSBO’s a series of mailers.  How many pain points does the typical prospecting session for FSBO’s contain? It’s usually 3-7 different pain points!  You can think of 5 different things you’d like to explain to a FSBO, write them out in letter format, and then mail them to the home owner.

The marketing costs for this are incredibly low!  Maybe 5 stamps, a Real Estate Logo, and some paper?  The thing with FSBO’s is that they’ve probably been burned by a realtor before.  So, you’re instantly standing out from the crowd by being the most persistent person out there.

I can’t stress enough the value of following up with your marketing actions.  This is the key to experiencing great success in real estate.

4) Vacant Homes

vacant homes for real estate listings

The US Census Bureau shows that there were 104 million vacant homes at the end of the 1st quarter in 2014.  By the end of the second quarter, there were only 93.2 million vacant homes.  By the end of the third quarter, 96.1 vacant homes. And by the end of the fourth quarter, 94.5 vacant homes.

That’s a lot of transactions taking place!

If I were a realtor, I’d hire an admin or local college student to help prospect vacant homes.  You can pay them hourly or work out a commission based arrangement for finding properties.  This way, you save your time while still being the first realtor to find the vacant properties!  Once you find them, it’s just a matter of time before the previous homeowner wants to sell.

You can use your local county clerk’s website to prospect for homes that might be vacant.

5) Look Into Property Taxes

property taxes for real estate listings

Speaking of the county clerk’s website again, you can research homes that are behind in paying their property taxes while you are there!  These houses give you an enormous opportunity! Did you know that over 23% of homes that are sold in any given year have some type of back tax to pay?

The fact that this many sellers are behind on property taxes is a critical determining factor in finding motivated sellers!  You can prospect for these buyers in several ways.

1) Launch a niche SEO Campaign for keywords related to property taxes and selling your home.  Look at this:

low seo competition

2) Start advertising online: Google Adwords and Facebook ads are very expensive if you target: Dallas Homes For Sale.  But if you’re targeting “Sell A Home Quickly In Dallas Due To Taxes” there is a lot less competition!

3) Mail Individuals You Find On The Clerk’s Website: You can create a series of mailers you send to people who are behind on their taxes!

6) Partner With Small Local Banks Or Small Builders

get real estate listings

Finally, you aren’t in this battle alone!  Small local banks, builders, mortgage providers, plumbers, electricians, marriage counselors, dentists, etc., etc., etc. are all looking for business just like you.  They are entrepreneurs looking to grow their businesses.  And most of them probably wouldn’t mind a realtor giving them referrals.  Why not start with the YellowPages and find a business in each major category to be your recommended provider?

Now, this won’t help you if you just spend 1 hour once talking with that person.  Be sure to put them into your CRM, and follow up with them every month.  Maybe even get coffee with them once a month.  Figure out concrete ways for the two of you to work together! Incorporate this spirit of working together into your entire real estate brand and real estate slogans.


Cheaper Foreign Oil Caps US Drilling Outlook

https://irancorner.files.wordpress.com/2012/05/spiegel-iran-oil-embargo1.jpg

By Chris Tomlinson | Houston Chronicle | MRT.com

The shale oil revolutionaries are retreating in disarray, and cheap foreign oil may banish them to the margins of the market.

As oil and natural gas move into a period of low prices, new data shows that North American drillers may not have the wherewithal to keep producing shale wells, which make up 90 percent of new drilling. In fact, if prices remain low for years to come, which is a real possibility, then investors may never see a return on the money spent to drill shale wells in the first place.

The full cost of producing oil and natural gas at a representative sample of U.S. companies, including capital spent to build the company and buy assets, is about $80 per barrel of oil equivalent, according to a study from the Bureau of Economic Geology’s Center for Energy Economics at the University of Texas.

The analysis of 2014 corporate financial data from 15 of the top publicly traded producers, which I got an exclusive look at before it’s published this week, determined that companies will have a hard time recovering the capital spent that year and maintaining production unless prices rise above $80 a barrel.

The price for West Texas Intermediate has spent most of the year below $50 a barrel.

Low prices, though, won’t mean that producers will shut in existing wells. Many of these same companies can keep pumping to keep cash coming into the company, and they can still collect a 10 percent return above the well’s operating costs at $50 a barrel of oil. They just won’t make enough money to invest in new wells or recover the capital already spent.

This harsh reality of what it will take to keep the shale revolution going shows how vulnerable it is to competition from cheap overseas oil.

“Everyone walks around thinking that they know how much this stuff costs because they see published information on what people spend to just drill wells,” explained Michelle Foss, who leads the Houston-based research center. “That is not what it takes for a company to build these businesses, to recover your capital and to make money.” The bureau was founded in 1909 and functions as the state geological agency.

Low oil prices will also exacerbate the economic impact of low natural gas prices. For years natural gas has kept flowing despite prices below $4 for a million British thermal units because about 50 percent of wells produced both gas and liquids, such as crude oil and condensate.

True natural gas costs

High oil prices have helped companies subsidize natural gas wells, but lower oil prices mean natural gas wells that don’t produce liquids will need to stand on their own economics.

The center’s analysis found that among the sample companies focused primarily on gas, prices will need to top $6 a million BTUs just to cover full costs and rise above $12 a million BTUs to recover the capital expended to develop the wells.

“We have important resources, but people have to be realistic about the challenges of developing them,” Foss told me. “There will have to be higher prices.”

Everyone predicts prices will rise again. The only questions are how quickly and to what price. Some experts predict WTI prices will reach $70 a barrel by the end of 2015, while others see $60. The soonest most expect to see $80 a barrel oil is in 2017. Saudi Arabian officials have said they believe the price has stabilized and don’t see oil returning to $100 a barrel for the next five years.

High prices and shale

https://i0.wp.com/www.arabamericannews.com/news/images/articles/2008_05/1049/u1_SAUDI.gif

The Saudi opinion is particularly important because that nation can produce oil cheaper than any other country and can produce more oil than any other country. As the informal leader of the Organization of the Petroleum Exporting Countries, Saudi Arabia kept the price of oil inside a band between $80 and $100 a barrel for years. Now, the Saudis appear ready to keep the price low.

That’s because high prices inspired the shale revolution, where American companies figured out how to economically drill horizontally into tight rocks and then hydraulically fracture them to release oil and natural gas. Since OPEC countries rely on high oil prices to finance their governments, everyone assumed OPEC would cut production and keep revenues high.

Arab leaders, though, were more concerned about holding on to market share and allowed prices to fall below levels that make most shale wells economic. Foss, who recently returned from meetings in the United Arab Emirates, said OPEC is unlikely to change course because developing countries are seeking alternatives to oil and reducing demand.

“The Saudis and their partners see pressures on oil use everywhere they look, and what they want is their production, in particular their share of the global supply pie, to be as competitive as it can be to ensure they’ve got revenue coming into the kingdom for future generations,” she said.

OPEC is afraid rich countries like the U.S. are losing their addiction to oil, and by lowering prices hope to keep us hooked. And OPEC has plenty of product.

“There’s 9 million barrels a day in current and potential production capacity in Iraq and Iran that is tied up by political conflicts, and if you sort that out enough, that’s a flood of cheap oil onto the market,” Foss said.

On the losing end

If prices remain low, the big losers will be the bond holders and shareholders of indebted, small and medium-size companies that drill primarily in North America. Since these companies are not getting high enough prices to pay off capital expenditures through higher share prices or interest payments , they are in serious trouble.

The inability of Denver-based Whiting Petroleum to sell itself is an example. The board of the North Dakota-focused company was forced to issue new shares, reducing the company’s value by 20 percent, and take on more expensive debt. Quicksilver Resources, based in Fort Worth, filed for Chapter 11 bankruptcy on March 17 because it couldn’t make the interest payments on its debt and no one was willing to invest more capital.

Until one of these companies is bought, we won’t know the true value of the shale producers at the current oil and natural gas prices.

But as more data reaches the market, there is a real danger that these companies are worth even less than investors fear, even though they may have high-quality assets.

How Did They Survive Childhood?

Are you one of the baby boomers, born between 1946 and 1964? How did you survive without government intervention?

[090322-b-cigs.jpg]

Their mothers smoked and/or drank while pregnant.

They took aspirin, ate blue cheese dressing, tuna from a can and didn’t get tested for diabetes.

Then after that trauma, they were put to sleep on their tummies in baby cribs covered with brightly colored, lead-based paints.

There were no childproof lids on medicine or special locks on cabinet doors.

They rode bikes, we wore baseball caps, not specially engineered helmets.

As infants, they rode in cars without car seats or booster seats, no seat belts and no air bags. Sometimes, as tots, they rode in small moving boxes packed with blankets and toys.

They rode in the back of pickup trucks and no one was arrested or cited.

They drank water from garden hoses, not from plastic bottles.

They shared a single bottle of Coca-Cola with three friends — and no one died.

They ate cupcakes with food coloring, white bread, real butter and bacon. In fact, we drank Kool-Aid mixed with tablespoons of real sugar.

Yet they weren’t overweight, because we were always outside playing.

They would leave home in the morning and play all day, as long as they were back when dusk fell. And no one was able to reach them all day. And: they were okay.

They spend hours in the forest with Daisy rifles, or building go-carts without brakes, or sledding with wooden and steel monstrosities that could sever a limb.

They didn’t have Playstations, Nintendo’s and X-Boxes. There were no video games, no cable television, no DVD players. There were no computers, no web, no Facebook, no Twitter.

They had friends and we went outside and found them… without cell phones or text messages.

They fell out of trees, got cut, broke bones and teeth and there were no lawsuits resulting from these accidents. They ate worms and mud pies made from dirt, and the worms did not live in them forever.

They were given BB guns and knives for their birthdays, made up games with sticks and tennis balls, played lawn darts and, although they were told it would happen, they did not put out many eyes.

They rode bikes or walked to a friend’s house and knocked on the door or rang the bell, or just walked in and talked to them.

Little League had tryouts and not everyone made the team. Those who didn’t had to learn to deal with disappointment.

The boomers have produced some of the best risk-takers, problem solvers, inventors and entrepreneurs ever.

The last 50 years have seen an explosion of innovation and new ideas.

They had freedom, failure, success and responsibility, and they learned how to deal with it.


https://i0.wp.com/www.hacer.org/usa/wp-content/uploads/2012/01/rulesforradicalscover.jpg

Then they started reading this…

https://i0.wp.com/cdn1.epictimes.com/richardebeling/wp-content/uploads/sites/15/2015/01/Obama-and-the-Declaration-of-Independence.png

that opposed this.

https://i0.wp.com/media-cache-ak0.pinimg.com/736x/0b/06/19/0b06190a4ab0f51c20749d8189b487e3.jpg

and gave up everything for this.

https://i0.wp.com/media-cache-ec0.pinimg.com/736x/f0/70/52/f07052a5fadf7e3ac00a6500cc3fc8b1.jpg

Why US Stock And Bond Markets Are High

We’ve been saying for quite some time now that the US equity market’s seemingly inexorable (until this week) tendency to rise to new highs in the absence of the Fed’s guiding hand is almost certainly in large part attributable to the fact that in a world where you are literally guaranteed to lose money if you invest in safe haven assets such as negative-yielding German bunds, corporations can and will take advantage of the situation by issuing debt and using the proceeds to buy back stock, thus underwriting the rally in US equities. Here’s what we said after stocks turned in their best month in three years in February:

It also explains why, in the absence of the Fed, stocks continue to rise as if QE was still taking place: simply said, bondholders – starved for any yield in an increasingly NIRP world – have taken the place of the Federal Reserve, and are willing to throw any money at companies who promise even the tiniest of returns over Treasuries, oblivious if all the proceeds will be used immediately to buyback stock, thus pushing equity prices even higher, but benefiting not only shareholders but management teams who equity-linked compensation has likewise never been higher.

If you need further proof that this is precisely what is going on in US markets, consider the following from Citi: 

Companies are rapidly re-leveraging…

…and the proceeds sure aren’t being invested in future productivity, but rather in buy backs and dividends…
https://i0.wp.com/www.zerohedge.com/sites/default/files/images/user92183/imageroot/2015/03/Leverage2.jpg
…and Citi says all that debt issued by struggling oil producers may prove dangerous given that “default risk in the energy space has jumped [and considering] the energy sector now accounts for 18% of the market”…
…and ratings agencies are behind the curve…
https://i0.wp.com/www.zerohedge.com/sites/default/files/images/user92183/imageroot/2015/03/Leverage4.jpg
We’ll leave you with the following:

To be sure, this theater of financial engineering – because stocks are not going up on any resemblance of fundamental reasons but simply due to expanding balance sheet leverage – will continue only until it can no longer continue.

Read more at Zero Hedge

Housing Contribution To US GDP Lowest In Post-War Era

In “Underwater Homeowners Here To Stay” we highlighted a report from Zillow which showed that negative equity has now become a permanent fixture of the US housing market. The report also showed that the percentage of homeowners who are underwater was flat from Q314 to Q414, breaking a string of 10 consecutive quarters of declines. We also recently noted that a completely ridiculous new home sales print that defied all logic notwithstanding, housing data, including starts and existing home sales, has come in below expectations. On a side note, home price appreciation has outpaced wage growth at a rate of 13:1, to which we would add: 

Of course, the biggest determinant of home price appreciation over the past 2 years has nothing to do with US consumers, or household formation, as confirmed by the collapse in first-time home buyers or the unprecedented depression in new mortgage origination, and everything to do with what we first suggested is one of the main drivers of the US housing bubble – foreigners parking their illegally procured cash in the US and evading taxes, now that US housing, with the NAR’s anti-money laundering exemption blessing, is the new normal’s Swiss Bank Account. That and flipping homes from one “all-cash” buyer to another “all-cash” buyer in hopes of a quick capital appreciation and the constant presence of the proverbial dumb money.

Against this backdrop, Deutsche Bank is out predicting that a sluggish US housing market is likely to impact the supply of MBS going forward. As DB notes, housing isn’t the GDP contributor it once was and not by a long shot. Not only that, but when it comes to recoveries, the housing market’s GDP contribution was 7 times below its post WW2 average in year one and has fared even worse since. Here’s DB with more:

The contribution of housing to US GDP continues to run at some of the lowest levels since the end of World War II. New construction of single- and multi-family homes, renovations, broker fees and the like still only make up a bit more than 3% of current GDP, well below the post-war average of 4.7%. Not only has the level of lift from housing come in low, but it has bounced out of the last official recession slowly, too. Housing on average has contributed a half a percentage point to GDP a year after the end of every post-war US recession. This time around, housing added only 7 bp. And the contribution of housing in the second and third years after the recent recession also has fallen well below post-war averages.And while “insufficient supply” (not enough homes) was cited as a possible contributor to the existing home sales miss, DB notes that at least as of today, there appears to still be a “supply hangover” (although it’s waning):

US home ownership started the decade at 66.9%, peaked in 2004 at 69.2% and ended at 66.5%. It has since dropped to 64.0%. The exodus of owners initially threatened to leave a lot of extra houses behind and reduce the need to build new ones. But investors have come in to pick up the keys, and many houses have found a new home in the market for single-family rentals. This has helped reduce the supply of distressed homes, although it’s still higher than the levels that prevailed in the early 1990s when homeownership last ranged around 64% . The supply hangover isn’t done but should be in the next two or three years.

And demand isn’t looking so hot either: 

Demand has likely played a part in slow housing, too, starting with owners that bought their homes in the last decade. Thanks to a 38% drop in home prices nationally from 2006 to 2012, according to Case-Shiller, a lot of those owners walked out the front door without any equity and without the ability to reenter the market as buyers. This has almost certainly contributed to the drop in rental unit vacancies from 10.6% in mid-2009 to 7.0% today. As for potential new owners, Americans, even before the crisis, started moving into their own place at a much slower pace than the long-term average of 1.2 million new households a year, that is, until recently. Demand from former and potential new owners has been soft.

Even in the best case scenario is which supply falls and demand rises, banks’ reluctance to lend could end up hobbling the market for the foreseeable future. 

Although the market seems to be clearing out the lingering housing supply and the economy and the labor market look likely to repair demand, the availability of credit could prove to be the lasting constraint. Today’s lending standards reflect limits designed to keep the last decade’s boom and bust from happening again. Borrowers today without the ability to repay will not get a loan. But it looks like some borrowers with the ability to repay—but with low FICO scores or with needs that keep them outside the agency or prime jumbo markets—will also not get a loan. The market is reducing risk today to avoid risk tomorrow. But it also is likely reducing housing growth today to avoid a downturn tomorrow.

And here’s further confirmation of this from BofAML:


So there is your housing recovery in a nutshell: supply hangover, lackluster demand, and reluctant lenders all coalescing in a housing market whose contribution to US economic growth is virtually nonexistent. 

And if you’re looking for the next shoe to drop, here’s a hint: 

Read more at Zero Hedge

Low Mortgage Rates Are Killing the Real Estate Industry

Source: Wolf Street

“Mortgage Rates need to go up. There it is. They do. These rates are killing the industry. The DC Real Estate Market is the Poster Child for why interest rates need to go up.”

https://i0.wp.com/www.fedprimerate.com/libor/libor-rates-history-chart-long.gif

Since the beginning of this year, I have lost two clients to the decision to rent for another year. I have written 11 contracts for would-be home buyers, and I have only been able to secure two of those contracts. I promise this is not because I’m a horrible agent. It is because I have a conscience, and I don’t let clients do stupid things on my watch.

The bidding wars are insane and when the going gets tough, I advise people to take their money and keep looking. I realize that steering people away from buying houses and wishing rates would go up makes me the anti-Agent, but flying with the pack is overrated.

It is profoundly problematic for interest rates to stay so low for this long. The primary reason is that it shifts demand and supply into different time frames instead of letting the economy adjust and self-correct.

Buyers live in “today,” and if they think rates will go up, they panic. If rates tick up an eighth of a point, they feel robbed and cheated. They lament the fact that they didn’t get the house they bid on last week. Then, a few days pass, and rates drop back down, and they kick up their feet and start singing again. They run back out to see more houses. Feeling the looming threat of a rate increase again, they scramble to buy something – anything, just to lock in the low rate. Operating solely out of fear of a rate hike, they become desperate. They make the mistake of overpaying.

We see it every single day, but it bears repeating: low rates encourage desperate buyers to bid prices up, sometimes to an unrealistic number. The demand of the future is effectively robbed because next year’s home buyer is buying now.

That desperate buyer out there? They are not the only one. There are plenty of others, competing for homes and driving prices up, all in the name of interest rates and not necessarily because of real need. Many of these buyers will get homes that need work, are imperfect, are not in desirable areas, because it was all they could get, and they wanted to lock in while the rates were low.

Instead of a balanced market where these less than desirable homes sell for lower prices, the low rates make even the duds look better. Two more problems stem from this scenario.

https://i0.wp.com/storage.ubertor.com/lisagibson.myubertor.com/content/image/218.jpg

First, these homes will still be duds in several years unless the location magically improves or the owner renovates to make the home more desirable. When markets are more balanced, buyers aren’t interested in these homes if they can get one in a better area or better condition for a similar price.

Second, many of the homes purchased today would be on the market again in 5-10 years due to normal changes in people’s lives that require them to sell. If prices stabilize or even slide when this looming rate hike hits, anyone who overpaid will be faced with three options: sell for a loss (which many won’t do), stay, or rent the house to someone else. So now the supply for the future is compromised too.

Many of today’s home sellers have locked in or refinanced at low rates and can make money if they rent. They can move on to another house and let their current one become an investment. And look at that! They don’t even have to refinance to loan-to-value ratios of 75% that are required of investors.

If they recently refinanced while this was their primary home, they can have a much higher loan-to-value ratio than if they were to purchase the same house at the same price but strictly as an investment. Why sell? Seems like a home run to just rent it, which many do, so they can take some monthly cash flow with them and move on. So there’s another house that will not be on the market for sale this spring.

https://i0.wp.com/www.finfacts.ie/artman/uploads/3/Irish-home-prices-dec042009.jpg

There are also cases where people need or want to move, but are priced out of buying anything else. I recently had a chat with someone who asked my advice on this issue. Because of a schooling situation with their child, they were considering moving from Maryland to Virginia for several years, then moving back and wanted to know what they could sell their house for. I asked why they would sell it, given the costs of selling, moving, buying, selling again, and moving back. They wisely noted, “Yes, and in 3 years, we probably couldn’t afford our neighborhood again since we really couldn’t afford to buy again right now.”

I stopped them from four needless transactions and advised them to rent their home out and rent a place to live so they could come back to their home when they were ready. Well, there’s another four transactions that won’t be happening in the next decade. And I’m not sorry.

After this weekend of house tours, I’ll be writing 5 contracts for 2 different clients with the hopes that they each walk away with a house. Crossing my fingers. And I’ve told both of these clients as well as all my others: things are looking too unstable for the near future and not to plan on selling in the next 10 years. They need to buy the best house they can get for the best deal possible, not be afraid to walk away from overpriced homes, and not get into a bidding war. If they can commit to that, they stand a chance of making a decent investment.

By Melissa Terzis, Realtor, City Chic Real Estate, Washington, DC

Why Oil Price Should Bottom In April

Summary

  • Oil production continues to eclipse record highs on a weekly basis despite the oil rig count declining 49% since October.
  • A single oil-well declines exponentially up to 75% in its first year of production. However, in a process known as Convolution, older wells buffer the rapid decline from new rigs.
  • This article provides a comprehensive analysis of principles behind oil drilling and production, applies it to the current crude oil climate, and predicts future production, rig counts, and oil price.
  • Based on my analysis, I remain short-term bearish but long-term bullish on the commodity. My trading strategy based on this analysis is discussed in detail.

by Force Majeure | Seeking Alpha

On Friday, March 20, Baker Hughes (NYSE:BHI) reported that the crude oil rig count had fallen an additional 41 rigs to 825 active rigs. This was the 15th straight week and 25th out of 26 weeks that the rig count has declined. Active oil rigs are now at the lowest level since the week ending March 18th, 2011 and total drilling rigs (oil + natural gas) are the fewest since October 2009. Overall, the oil rig count is down 49% in the 23 weeks since peaking in October. Nevertheless, in its weekly Petroleum Report, the EIA announced last Wednesday that domestic oil production set yet another record high of 9.42 million barrels per day. Since the rig count peaked the week of October 10, 2014 and began its subsequent collapse, oil production has climbed 460,000 barrels per day, or 5.2%. This continued increase in production in the face of a plummeting rig count has confounded journalists, flummoxed investors, and inflated supplies to record highs leading to a continued slump in oil prices.

The two main questions on traders’ minds are 1) why is oil production still at record highs five months after the rig count started dropping? And 2) when, if at all, will oil production begin to fall and how far will it fall? This article provides a comprehensive analysis of the principles behind the relationship between oil drilling and production, applies it to the current crude oil climate, and predicts where both production and the rig count will go in the coming year.

Before we discuss the real-world oil production and drilling situation – an extremely complex picture with over 1 million rigs producing oil – let’s look at a simple, hypothetical situation. The first key point is that once an oil well is drilled, its production is not constant. In fact, production not only begins to decline almost immediately, it does so in an exponential fashion. After analyzing production curves from multiple wells, I will be estimating weekly oil production from a single oil well by the following equation:

Equation 1:

Daily Oil Production From Single Well = (Initial Daily Production)/(1+ (Week # from start of production*K)

Where K is a constant equal to 0.06

When graphed using a well that initially produces 1000 barrels of oil per week this equation is represented by Figure 1 below:

Figure 1: Crude oil production curve of single, hypothetical well showing exponential decay.

There are two take home points to note from this chart. First, initial decay is very rapid, with weekly production declining by about 75% after 1 year. Second, after the initial rapid decay, production declines much slower and becomes approximately linear with decay rates of 5-10% per year. Although this graph ends after 2 years or 104 weeks, production continues slowly and steadily beyond 5 years.

Figure 1 represents production from a single well. What happens when we add multiple wells over a period of time? The process by which multiple functions – in this case, oil wells – are added over time is known as Convolution. As noted before, even after an oil well has been active for many years, it is still producing a small volume of oil, a fraction of its initial output. However, there are a LOT of these old, low-output rigs – over 1.1 million in fact. When the number of drilling rigs decreases – thus reducing the number of new wells that come into the service – the old, stable wells plus the production from the declining number of new wells is initially enough to buffer the decline in rig count and net output will continue to rise.

Let’s illustrate this with a simple example. Imagine a new oil field monopolized with a single company that owns 30 oil rigs. The company adds five new rigs each month. Each rig is able to drill 1 new well per month. After six months, the company has deployed all of its rigs to the field. Unfortunately, shortly thereafter the company encounters financial difficulties and is forced to withdraw rigs at a rate of 5 per month until zero remain drilling. Figure 2 below compares active drilling rigs and total wells in this field.

Figure 2: Rig count and total well count of hypothetical oil field

Note that after the rig count peaks and begins to decline, total wells continue to increase before ultimately peaking at 180, where it remains for the remainder of the 20-month period.

Each well initially produces 200 barrels of oil per day and declines according to Equation 1 and the chart in Figure 1. Figure 3 below shows total oil field production overlaid with the total rig count of the field.

Figure 3: Oil Production from hypothetical oil field illustrating how crude oil production can continue to climb despite a sharp reduction in the rig count due to convolution.

Oil production initially climbs rapidly as more rigs are added to the field, reaching 500,000 barrels per month by the time the rig count peaks after 6 months. However, even though the rig count declines to zero six months later, total production continues to increase and peaks at 770,000 barrels per month in month 10 – 4 months after the rig count peaked. Production then begins to decline, but slowly. Even by month 20 after the rig count has been at zero for eight months, production has only declined by 33%.

This is obviously a simply, insular example, but it illustrates several important points. First, there is a delay between when the rig count peaks and when production begins to decline as the combination of old, accumulated oil wells and the continued addition of new wells by the declining rigs is sufficient to coast production higher initially. Second, even when production begins to decline, it is blunted, with production declining a fraction of the actual reduction in rig count. For those interested, the Following Article delves into these principles further and provides useful insight.

Let’s now apply these principles to actual domestic oil production. Before we can set up the model, there are three baseline metrics that need to be established: 1) Rate that rigs drill a well, 2) Time between initial spudding of a well and when it begins production, and 3) Initial production rate of new oil wells.

The EIA has released well counts on a quarterly basis for the past two years. Their data shows that the ratio of new wells to rigs has increased slowly from around 4.75 per quarter in 2012 to 5.3 per quarter in 2014. This equates to about 0.4 wells per week per rig presently. For the model, I used a linear reduction in drilling efficiency with drilling rates down to 0.3 wells per week per rig in 2006.

It takes 15-30 days to drill a new oil well. Once the hole is dug, the well must be completed. It typically takes another week for the rig to be removed and new equipment to be set up. A further week is devoted to hydraulic fracturing. Initial flow back and priming of production takes place over the next 3-4 days. Over the final week, the well is primed for continuous production including installation of tank batteries, the pump jack, and assorted power connections. The well is then connected to the pipeline and permanent production begins. Thus, it takes roughly two months from initial spudding of the well to when it begins production. However, once a well is completed it does not always begin to produce immediately and may not do so for up to six months.

Initial oil production rates have increased markedly over the past decade as drilling technology has improved. The EIA released the chart shown below in Figure 4 showing yearly initial production rates in the Eagleford Shale.

Figure 4: Yearly production rates in Eagleford Shale Formation showing rapidly increased initial rates of production 2009-2014. (Source: EIA)

Initial rates increased from less than 50 barrels per day (or 350 per week) in 2009 to nearly 400 barrels per day (or 2800 per week) in 2014. Note that the decay rate has also increased such that by 2-3 years, all wells are approaching the same output despite the significant differences in increased production. This is a relatively new oil formation and older formations produced more oil initially prior to 2010. For my model, I assumed initial production of 2625 barrels of oil per well per week in 2014-2015 with initial production declining to 1400 barrels per well per week in 2006.

Using this data and the methodology discussed in the example above, a modeled projection of U.S. oil production is created dating back to 2006. This data is shown in Figure 5 below and is compared to actual oil production, calculated on a weekly basis. My preferred unit of time is 1 week as this is the frequency that both the rig count and oil production numbers are released.

Figure 5: Projected oil production based on my model vs. observed crude oil production vs. Baker Hughes Rig Count [Sources: Baker Hughes, EIA]

Overall, this model accurately projects oil production based on active drilling rigs. Between 2006 and 2015, the average error was 88,000 barrels per day, or 1.2%. Over the past six months, this error has averaged just 44,000 barrels per day. The model correctly shows production continuing to increase despite the sharp reduction in active drilling rigs. It is interesting to note that the largest deviation between projected oil production and observed production occurred in late 2009 and early 2010, or shortly after the rig count bottomed out from the previous oil price collapse. The model predicted that oil production would decline somewhat while actual production actually just leveled off before beginning a new rally once the rig count rebounded later in 2010.

This model can be used to project how oil production might behave heading into the future. To do so, we must make assumptions about how the rig count might behave heading into the future. First, let’s pretend that the rig count stays unchanged at 825 active oil rigs for the next 1 year. Figure 6 below projects crude oil production to 1 year.

Figure 6: Projected oil production based the rig count remaining unchanged at 825 [Sources: Baker Hughes, EIA]

Using this projection, crude oil production will peak during the week ending April 10 at 9.51 million barrels per day and then begin declining. By next March 2016, production will have declined to 8.68 million barrels per day, down 9.5% from the projected peak. Again, this goes to show the buffering capacity of older rigs, given that a sustained 50% reduction in the rig count results in a comparatively small <10% decrease in output.

Two qualifying notes are necessary. This model shows a relatively short period of time between production plateauing and production beginning its decline. 1) Given that this model assumes all completed wells are producing oil within 3 months of spudding, it is certainly possible that the production curve may flatten out for a longer period of time due to additional completed wells that have been idle are slowly hooked up to pipelines over the next several months. 2) This model also makes the assumption that all rigs produce oil equally. If rigs drilling less-productive oil fields have been selectively retired while those drilling richer fields have remained active, the rate of decline will similarly be slower and less than projected.

The most recent historical comparison to the events currently unfolding took place in 2008-2009 following the collapse of oil from record highs during the great recession from a high of $146/barrel to near $30/barrel. The rig count during that event was likewise slashed by 50% before rapidly recovering when prices rebounded. However, this is not an apples-to-apples comparison since drilling technology has changed substantially – decline rates are much more rapid, initial production is nearly double that in 2008, etc – and inferences cannot necessarily be made about the future of production. However, let’s assume that the current rig count follows a similar trend. If so, the rig count will slow its descent and bottom out in roughly six weeks near 760-780. If the rig count follows the trend seen in 2009, the count will then rapidly rise and will reach 1330 by this time next year. Production will again peak during the week of April 10, before declining. Production will bottom out in late October near 8.9 million barrels per day, down just 6.3% from its peak before again increasing late in the year.

However, the decline in oil in 2008-2009 was based more on the combination of a bubble bursting and a slumping economy than fundamental forces while the current slump is predicated on a supply/demand mismatch. I expect this will keep prices and rigs down significantly longer than in 2008-2009. Let’s amplify the 2008-2009 rig count curve and project instead that rigs bottom out near 730-750 and that the rate of recovery is roughly half that of 2008-2009 with total rigs at just 950 this time next year. Using this model, production will continue to slowly decline through the New Year and flatten out near 8.7 million barrels per day by March 2016, down 8.4% from the peak. I believe that this is a more realistic model for crude oil production. This projection is shown below in Figure 7.

Figure 7: Projected oil production based on 2008-2009 rig count [Sources: Baker Hughes, EIA]

What does this mean for the supply/demand situation? As I have discussed in my previous articles, crude oil supply and demand are severely mismatched. This has led to oil inventories skyrocketing to a record high of 458 million barrels, a huge 98.7 million barrels above the five-year mean for March. Applying the projected production curve shown in Figure 7 to crude oil storage yields some surprising results. Even with just an 8.7% reduction in supply, the inventory surplus will narrow markedly. These results are shown below in Figure 8, which compares the five-year average storage level and current and projected storage levels. Note: These projections assume that total imports will remain flat and that total demand will follow the five-year average.

Figure 8: Projected crude oil storage based on projected oil production data vs. 5-year average [Source: EIA]

While the rig count continues to climb and then plateaus, I expect that the storage surplus will continue to widen with total inventories approaching 500 million barrels by early May. However, as production drops off, the inventory surplus begins to decline. By the last week of 2015, total supply has declined by 4.7 million barrels per week and projected inventory levels cross the five-year average for the first time since October 2014. Should the rig count begin the slow rise that is projected, by March of 2016, total storage levels will be 50 million barrels BELOW the five-year average. Even if the two qualifying statements discussed above verify or the rig count rises more rapidly than projected, I expect that, based on the drop in rig count already, crude oil inventories will be at or below average this time next year.

https://i0.wp.com/www.doomsteaddiner.net/blog/wp-content/uploads/2015/02/end_is_nigh.jpg

What does this mean for crude oil prices? There is a chicken and egg situation going on here. This article makes references to the rebound in rig count after bottoming out in the next month or two. This, of course, is predicated on a rise in price to make drilling again profitable. Without a rally, the count will continue to fall or, at the very least NOT rise, putting further pressure on supply and down-shifting the projected production curve further, making it more likely that prices will THEN rally. Until they finally do. One way or another, I do not see how crude oil can remain priced at under $45/barrel for longer than a few months. Something has to give. Drilling technology is simply not yet to the point where this is a profitable price range for the majority of companies.

Given that these projections show production increasing through early April, I would not be surprised to see continued short-term pressure on oil prices. As I discussed in My Article Last Week, storage at Cushing, the closely watched oil pipeline hub, continues to fill rapidly and threatens to reach capacity by early May. I would welcome such an event, as crude oil would likely drop under $40/barrel presenting an even better buying opportunity. I therefore maintain a short-term bearish, long-term bullish stance on oil.

https://i0.wp.com/i1.ytimg.com/vi/FwzUzFhyo00/maxresdefault.jpg

My favorite way to play a rally in oil is to short the VelocityShares 3x Inverse Crude Oil ETN (NYSEARCA:DWTI) to gain long exposure. This takes advantage of leverage-induced decay to at least partially negate the impact of contango on the ETF. The United States Oil ETF USO), on the other hand, is intended to track 1x the price of oil and leaves an investor directly exposed to contango, which is now 15% over the next six months. The same applies to the VelocityShares 3x Long Crude Oil ETN (NYSEARCA:UWTI), except that exposure to contango is now tripled to 45%.

The advantage to USO is in its safety. A short position in DWTI theoretically leaves an investor open to infinite losses should the price of oil continue to drop. Further, shares must be borrowed to short, which can cost 3-5% annually depending on the broker. And if, once a trader has a position, these shares are no longer available, the position can be forcibly closed at an inopportune time. A slightly less risky position would be the ProShares UltraShort Bloomberg Crude Oil ETF (NYSEARCA:SCO) that is more liquid and less volatile.

For this reason, I started a small position in USO on Thursday at $16.05 when oil erased its post-Fed Remarks gains from Wednesday. This position is equal to just 2% of my portfolio. I will add to my USO position once oil breaks $45/barrel and then again should the commodity break $42/barrel for a total exposure of 6% of my portfolio. Should oil continue to decline to under $40/barrel, I will begin to sell short DWTI at what I assume to be a safer entry point until 10% of my portfolio is allocated to oil ETFs.

https://i0.wp.com/s1.hubimg.com/u/8463556_f260.jpg

Should oil rebound, I will look to take profits. Once the rig count bottoms, I will begin taking profits once oil reaches $50/barrel. I will selectively sell USO initially. I prefer to close out the position most exposed to contango initially in the event that oil reverses and I would otherwise be stuck holding it for an extended period of time. I will then close out DWTI if and when crude oil again reaches $60/barrel. While I believe that oil may ultimately see higher prices, I am concerned at the speed at which rigs may be re-deployed once drilling again becomes profitable. I believe that this will keep oil under $70/barrel for the foreseeable future and will look to exit prior to this level.

In conclusion, an oil production model based on 9 years of domestic production and rig count data is used to project oil production for the past 1 year. This model suggests that oil will bottom around the week ending April 10. However, this is just a modeled projection and the actual peak in production will depend on nuances in drilling discussed above. Nevertheless, I believe that the peak in oil production will represent a significant psychological inflection point and that crude oil is poised for a rally once production begins to roll over.

Private Equity Pours Money into Self-Storage Deals

by Robert Carr

Investors are crowding into self-storage as the sector continues to post the highest long-term returns of any commercial property type, according to a recent quarterly industry survey.

Marc Boorstein, a principal with Chicago-based MJ Partners Self Storage Group, said in his full year and fourth quarter overview that the average 2014 investment return for self-storage REITs was 31.4 percent. The REITs are the major owners in a largely fragmented sector, as about 80 percent of self-storage properties are owned by small mom-and-pop-type firms. But according to Boorstein, private equity is starting to enter the sector.

Long-term returns for self-storage beat out all other commercial real estate sectors, Boorstein says. The five-year average return for self-storage is at 24.4 percent, the 10-year average is at 17.8 percent and the 15-year average is at 20.3 percent, beating out the closest sector, multifamily, by about 400 basis points for each category. These numbers, as well as a lack of new supply and unusually high demand, have led to increased competition for assets.

“There’s just a lot of transaction activity going on, for every $50 million portfolio there [are] 20 offers,” Boorstein says. “Average occupancy has increased to more than 91 percent, and new supply was at less than 100 new properties last year. That compares to about 3,665 new properties that opened in the peak year of 2005. Even if we have 300 to 500 new properties in 2015, as Extra Space Storage CEO Spencer Kirk predicts, that’s still not enough to even match the population growth.”

The recession created more renters, and the urban movement further increased self-storage customer base, Boorstein notes. Investors have flocked to the industry because of how quickly rents can be increased. A customer who pays $125 per month will tend not to move if the rent is increased incrementally, to $140 per month.

“That doesn’t sound like much each month, but multiply that by owning a thousand units and that’s a huge impact on revenue,” Boorstein says. New income generators such as self-storage insurance and improved digital advertising and management platforms have also boosted bottom lines, he adds.

The returns have attracted private equity firms new to the sector, such as the Carlyle Group partnering with self-storage operator William Warren Group last year, as well as increased activity from investors such as Prudential, Fortress, Morgan Stanley and Harrison Street. The four major REITs—Public Storage, Extra Space Storage, CubeSmart and Sovran Self Storage—are able to take down the large deals of more than $75 million, but there are aggressive bidding wars by private equity for the smaller portfolios, Boorstein says.

“If it’s a mid-sized deal, say between $20 million and $70 million, there’s four times as many private equity groups looking to purchase than there were two years ago,” he says. “There [are] groups bidding that have barely been in the market that long. Cap rates have plunged because of all this competition and partnering that’s going on.”

For example, Roseville, California-based Life Storage secured more than $120 million from TPG Real Estate and Jasper Ridge Partners late last year. “Not only is there strong continued support for self-storage, the industry remains very fragmented, which should provide opportunities for consolidation and attractive follow-on acquisitions,” said Avi Banyasz, partner and co-head of TPG, in a statement regarding the investment.

Michael Mele, senior director with Marcus & Millichap’s national self-storage group, says he agrees that private investment in the sector is “bigger than it has ever been.” He says while these investors can’t compete with the REITs in the large deals, there’s much more competition for the second-tier properties.

https://i0.wp.com/sentinelselfstore.com/wp-content/uploads/2014/11/Sentinel-Self-Store-Unites-Mandoors.jpg

“Mom-and-pop ownership of self-storage is declining because of the demand by private investment,” Mele says. “There’s also a continued consolidation of the industry, with a lot more private firms going after large portfolios with the help of the REITs, or using the REITs as third-party managers. You’re going to start seeing, in major and secondary markets, the same people owning many of the properties.”

Scott Humphreys, self-storage acquisitions director at Austin, Texas-based Virtus Real Estate Capital, says a new trend in the industry being employed by many of the REITs and larger regional players is purchasing sites in construction or shortly after they open. This eliminates some of the risk/liability associated with the development timeframe, and has also allowed the REITs to move forward with new site development without the added overhead and expense of keeping a full coterie of development resources in house. For example, Extra Space recently bought a portfolio of three self-storage properties in Austin from Endeavor Real Estate Group. All three properties were new, with two of the three having been opened less than a year at the time of sale.

“The difficult element to this type of purchase is the valuation gap, and determining how much to pay for yet-to-be leased space,” Humphreys says. “In core and growth markets, the risk is obviously not as great, and this allows you to rely on ‘merchant-build’ type development resources who know the local municipalities, and their nuances, well.”

How to Zombie-Proof Your Home (Just in Case)

by Michael Park

https://i0.wp.com/rdcnewscdn.realtor.com/wp-content/uploads/2015/02/zombie-proof-house-1.jpg

It’s only natural to make hypothetical plans for fortifying your home—just in case the human dead rise from their graves and wander the earth, feasting on the flesh of the living. Totally normal.

https://i0.wp.com/media-cache-ak0.pinimg.com/736x/c5/1a/4f/c51a4ff7845e34c481369fa37feb9efa.jpg

OK, it’s not all that normal, but it’s fun. But of course your spouse is freaking out when he or she sees you drawing up blueprints for a moat surrounding your house. And he or she has a good point: How much would zombie fortifications cost? And what would they do for the value of your home?

Well, let’s take a look. We’ll consider the most critical zombie-proofing improvements you can make for your home, keeping in mind that CONOP 8888, the Pentagon’s zombie-invasion plan (seriously, it made a zombie-invasion plan—don’t worry, more as a thought exercise than for fear of an actual undead uprising … we hope), estimates that any zombie outbreak wouldn’t last more than 40 days. We’re also assuming that we’re dealing with slow, dumb “classic” George Romero-type zombies, rather than fast Danny Boyle-style zombies.

Doors

https://i0.wp.com/web-images.chacha.com/images/galleryimage521904060-jul-16-2012-600x619.jpg

The first thing you’re going to want to do to shore up your zombie defenses is to strengthen the most obvious points of entry: outside doors. At the lowest end of the scale, you can follow the lead of 99% of your zombie-movie victims and board up your doors with a series of two-by-fours, four-by-eight sheets of plywood, and long nails, essentially barricading yourself inside your home till the cavalry comes. That’ll set you back little more than the cost of a nail gun, wood, and nails ($200–$300), and it’s not a permanent addition to the house, so you won’t affect the price of the home—unless you’re really horrible at using a nail gun. The downside is that your defenses will be as strong as your carpentry, and as soon as that first zombie gets its fingers into a weak point, your entire home is compromised.

An intermediate step is a security bar or security gate on the doors, which is a permanent addition to the home that frees you up to spend your first zombie-outbreak hours on quickie weapons training and other pressing needs instead of noisily hammering a bunch of wood planks to the walls. Security bars and security gates can run anywhere from $100 to several thousand dollars before installation costs (you’ll want to get them professionally installed, so that they’re anchored securely), and they probably won’t affect the value of your home for good or ill. But, as the inimitable zombie expert Max Brooks points out in “The Zombie Survival Guide,” “Experience has shown that as few as three walking dead can tear them down in less than twenty-four hours.”

Your best bet, and not necessarily your most expensive, is installing high-end steel doors at entry points, with steel frames and heavy-duty locks (remember to get secure bolt-style locks for the bottom of the door, too). A big plus is that steel doors generally run cheaper than wooden doors. But they tend to show more wear and need to be replaced more often, because they don’t weather the elements well (the salt air of homes near the oceans, for example, can quickly corrode steel doors). Expect the cost of an exterior steel door, with installation fees, to start at about $500 at the lowest end. But this may be the easiest zombie-proofing improvement to sell to a more practical-minded spouse: According to remodeling.hw.net, which tracks the cost of home improvements vs. their resale value, replacing an existing front door with a midrange 20-gauge steel door is worth 117% more than the money you put into it (an average cost of $1,230 vs. an average value of $1,446).

Windows

https://i0.wp.com/www.zombieagency.org/wp-content/uploads/2013/04/Window-Protection-1170x877.jpg

For some reason, Hollywood zombies seem to prefer trying to get to living people through the windows rather than the front door. Hollywood heroes tend to respond by dragging flimsy furniture in front of the bay windows and then hoping for the best. But you can do better!

If you want to keep things as cheap as possible, go the two-by-four route again. Assuming you already bought a nail gun for the door and still have a bucket of nails to dig into, you’ll have only to shell out for a few more two-by-fours for first-floor and basement windows—a couple of bucks per plank, or $15 or so for a four-by-eight sheet of 5/8-inch plywood. Reinforcing all the windows of, say a six-window first floor might run as little as $100.

https://i0.wp.com/media-cache-ec0.pinimg.com/236x/73/6d/c3/736dc34ba38d5ec486e35b07b7c191da.jpg

A better, but vastly more expensive, bet would be to install hurricane shutters on all your first-floor windows—essentially the same kind of roll-down steel gates that city shopkeepers pull down to secure their stores at the end of the night. They’re easy to operate, offer the best protection for existing windows against both zombies and storms, and, depending on where you live, could greatly increase the value of your home.

“In a place like Florida, which sees a lot of storms, hurricane shutters would be very positive,” says Bill Lublin, CEO of Century 21 Advantage Gold. “And they roll up and go out of the way, so even in the Northeast, you’d probably see some slight improvement, or they’d be revenue-neutral.”

The downside? Price. Hurricane shutters cost a pretty penny—around $55 per square foot.

Rooftop and basement defenses

https://i0.wp.com/i.dailymail.co.uk/i/pix/2013/01/28/article-2269371-17346A47000005DC-430_634x350.jpg

If you’ve watched any zombie movie, you know you’ll be spending a lot of your time waiting out the undead apocalypse on rooftops and in basements. So it makes sense that you prepare by getting those two locations shipshape now.

Rooftops are an ideal location to serve as a lookout for incoming zombie hordes, as a sniper’s nest for reanimated attackers, and to enjoy sunshine in relative safety—classic zombies aren’t big climbers, after all. The roof could easily end up being your command-and-control headquarters. All you really need to make your roof a usable perch is some cushions from the couch, a thermos of coffee, and an extra ladder that you can use to escape in case the house itself is compromised (a two-story escape ladder runs about $60).

But, if you don’t already have one, a roof deck could be a much more comfortable and functional space. First, check with your local zoning laws about whether you’re allowed to put up a roof deck. Then make sure your house can actually support a deck up there—a deck isn’t going to do much good if all it does is add a gaping hole to your roof. From that point, you should count on a roof deck running you at least $3,000 (depending on the materials you use, size, and circumstances of your home) and likely more in the $10,000 range or higher (keep in mind that you might have to put in stairs and pay for an additional safety assessment). The great thing about roof decks, though, is that they can be great for property value.

“If you’re down the Jersey shore and you’ve got a rooftop view of the ocean, or a skyline view of Center City, Philadelphia, a rooftop deck provides good value,” Lublin says. “If there’s good interior egress to it, it’s a great place to drop that deck.”

https://i0.wp.com/stagetecture.com/wp-content/uploads/2012/09/basement-mancave.jpg

Though Brooks advises strongly against relying on basements (his primary advice for people besieged in houses is to get to the second floor and destroy the staircase), 40 days is a long time to spend hanging out in your sister’s bedroom. If you’re confident the windows and doors are secure, it might be worthwhile turning the basement into a place to keep not just necessary supplies but also recreational material—as long as the undead outside can’t see or hear you, of course. With a home generator and a decent library of DVDs, a finished basement can help survivors fend off cabin fever or worse till help comes—and as we all know from watching “The Walking Dead,” living human beings are their own worst enemies. Plus: excellent excuse to finally get that man cave you wanted!

“A finished basement, maybe with a nice kitchen or alternative food-preparation area and home theater with recliners and good video or audio media, would be beneficial for the zombie apocalypse and add to value,” Lublin says.

Border security

https://c2.staticflickr.com/4/3288/2899691306_a14057d13c_z.jpg?zz=1

What about keeping the zombies away from your home in the first place? If you want to go full medieval, you could rent a backhoe and dig a moat that’s at least six feet deep and 10 feet wide around your home, then fill it with water. (You’d want to make sure it’s deep and steep enough that zombies can’t simply walk over one another to get to you.) Renting a full-size backhoe can cost between $200 and $350 a day, but you might consider just buying a used backhoe starting at around $7,000. That all, of course, is assuming that your town allows you to build a moat (it’s a good bet no), and not factoring in any additional costs for water bills, maintenance, the inevitable cleanup for when everyone in your area starts using it as a trash dump, and the permanent ill will of your neighbors. As for how much value a moat adds to your home, well…

“I don’t know—I’ve never sold a house with a moat,” Lublin says.

Common sense, of course, says that a gaping ring of stagnant water around your home is going to turn more home buyers off than on. Lublin says the best analogy might be with swimming pools in the North.

“Swimming pools sometimes have a negative impact on the value of a property, especially if the next person isn’t looking for one, and the geography means it’s only used so much for the year,” he says.

And remember, a moat is basically a giant, dirty swimming pool that no one wants and that no one gets to swim in, ever.

https://i0.wp.com/wallpaper.pickywallpapers.com/2560x1440/the-walking-dead-zombies-behind-the-fence.jpg

A better choice might be a much more conventional chain-link fence, as Brooks suggests: “A good ten-foot, chain-link fence can hold dozens of zombies for weeks, even months, provided their numbers remain at Class 1.” A commercial-grade chain-link fence can run around $40 a foot, which can quickly add up if you’re trying to enclose your entire home. (That’s $100,000 off the bat to cover a lot that’s 100 feet by 25 feet, for example.) And 10-foot-high chain-link fences around a house make home buyers immediately assume that there are serious security concerns in the area, making the house that much harder to sell.

Brooks recommends a steel-rod-reinforced, concrete-filled cinder-block wall if you’re concerned about more serious “Class 2″ zombie outbreaks, but it’s much pricier, and walls topping eight feet require specialized machinery—don’t be surprised if your contractor quotes you a price of at least $200 per linear foot for a wall of 10 feet or higher. Your town officials and neighbors are almost certainly going to have a problem with this, and if you think a chain-link fence is going to put off potential home buyers, imagine what a 10-foot concrete wall will make them think.

Additional improvements

https://i0.wp.com/image.made-in-china.com/2f0j00wMKTkHdsPAbP/Natural-Gas-Generator-Set-NG5500H-E-.jpg

A backup home generator could keep food and medical supplies from perishing, keep the lights, heat, and radios on, and help maintain sanity by letting everyone watch back seasons of “Mad Men.” And because it actually serves a genuine purpose in the real world, Lublin says it’s “a real plus” in any part of the country that’s ever experienced a blackout—which is probably all of them. Expect to pay between $3,000 and $7,000 for a natural-gas-powered backup generator for whole-home use, not including fuel and installation costs.

https://i0.wp.com/media-cache-ec0.pinimg.com/736x/35/93/e6/3593e6cd18faabccd95049cd4c601915.jpg

Inexpensive security-camera systems are now also available that can help you keep tabs on zombie lurkers at blind points around the house—or errant kids and pets when there isn’t an undead uprising going on—Nest’s Dropcams run $150 a pop and stream wirelessly to your generator-powered computer.

Ultimately, though, Lublin recommends making the improvements you want for your home regardless of the zombie situation.

“I wouldn’t spend too much time worrying about zombies, though it never does hurt to be prepared,” he says. “Consulting a Realtor® is always a good idea to ensure that an improvement is actually going to add to the value of your home.

Leading Texas Golf Resort Communities Revealed

By Scott Kauffman | World Property Journal

Tops in Texas: Leading Golf Resort Communities Revealed

While much of America struggled during the last financial crisis, Texas grew in greater economic stature on a number of levels. Fueled by a thriving energy economy, strong tech sector and job market, one strong growth area was real estate development.

Texans have always had a strong affinity to golf so it’s no surprise real estate communities, resorts and private clubs feature golf as a central component.  Two top leisure properties in Texas are 72-hole Horseshoe Bay Resort in Texas Hill Country and TPC Four Seasons at Las Colinas, home to the AT&T Byron Nelson Championship.

On the private club front, the “Big D” features a collection of renowned golf clubs, including Brook Hollow Country Club, Dallas National and Preston Trail Golf Club, where initiation fees start at $125,000.

The following is a handful of golf and resort-style communities leading the Lone Star State’s leisure real estate sector today.

Vaquero Club, Westlake, Texashttps://i0.wp.com/d2sa73fkuaa019.cloudfront.net/listings/ntreis/2474052/photo_1.jpg

When it comes to country club living, this Dallas-area private club is as luxurious as they come. Originally developed by Discovery Land Company, the Beverly Hills, Calif.-based company known for creating such elite clubs as Estancia in Scottsdale, Ariz. the Madison Club in La Quinta, Calif., and Kukio on the Big Island of Hawaii, Vaquero Club is now member-owned and fresh off an extensive $2.8 million renovation to its Tom Fazio-designed golf course.

According to club executives, part of the motivation behind the project was to enhance real estate vistas and create a more core-golf experience. A perfect example of this took place on the club’s drivable par-4 fourth hole, where new tee boxes were added, as well as on nine other holes.

This means resident members inside Vaquero’s stately manors have even more beautiful views to enjoy. Of an estimated dozen listings by the Jeff Watson Group of Briggs Freeman Sotheby’s International Realty, Vaquero’s most affordable home is currently listed at $1.295 million for a 4-bedroom, 4 1/2 -bath residence and it goes up to $5.995 million for a 5-bedroom estate on 3.8 acres featuring a 5-car garage and wine cellar with 1,500-bottle capacity.

The Vaquero Club consists of 385 equity memberships with an initiation fee approaching $200,000. Besides world-class golf, the club also offers a family-friendly Fish Camp, wine programs and other member amenities and services.

Cordillera Ranch, Boerne, Texas

Cordillera-Ranch-Home.jpg

Located 30 minutes northwest of San Antonio, Cordillera Ranch is a debt-free 8,700-acre master-planned residential community in the Texas Hill Country. The family-owned and operated development is not short on activities, considering residents of the gated community can join The Clubs of Cordillera Ranch that feature seven resort-style clubs in one location: The Golf Club, The Social Club, The Tennis and Swim Club, The Equestrian Club, The Rod and Gun Club, The Spa and Athletic Club and The River Club.

Opened in 2007, the community’s Jack Nicklaus Signature golf course has consistently been ranked among the best in Texas, most recently placing fifth on the Dallas Morning News‘ annual poll. Its par-3 16th has claimed the No. 1 spot as “Most Beautiful Hole” by the same publication for the past five years.  

Among the community’s newest real estate offerings are golf course frontage lots, villas and an entirely new section aimed at young families. Overall, Cordillera Ranch boasts ¼-acre villa homes, valley-view and Guadalupe River-front homes, hilltop home sites and 1-to-10-acre estate residences.

According to the developer, 2014 was a banner year in both real estate and membership sales. For instance, Cordillera Ranch sold 33 homes at an average of $886,000 and total lot sales increased by 32 percent.

Trending in 2015: 46 new homes are under construction totaling more than $60 million in new starts – easily the highest total of any upscale community in the San Antonio area, according to the developer. Another 39 homes are in the architectural review approval process – a 65 percent increase over 2013.

Since its inception in 1997, more than 1,200 lots have been sold and approximately 700 homes have been completed. At final build-out, this low-density Hill Country community will total approximately 2,500 homes and preserve approximately 80 percent of the land in its natural vegetation. More than 70 new members were added in 2014, bucking the national trend of private club membership attrition.

“We’re excited and humbled to be a leader in the luxury lifestyle category,” says Charlie Hill, Vice President of Development at Cordillera Ranch. “With the economy thriving and the San Antonio area continuing to prosper, we expect the upward trend in real estate sales to continue in 2015.”

Cordillera Ranch credits much of its growth to being in the highly acclaimed Boerne School District, which is regarded as one of the best in Texas and boasts schools ranked in numerous national-best lists. The community is also benefitting from being in the prosperous Eagle Ford Shale. While other oil-rich areas have struggled with the drop in oil prices, the Eagle Ford Shale has continued to produce. That has attracted oil and gas executives to come to the Texas Hill Country and settle down in communities like Cordillera Ranch.

Boot Ranch, Fredericksburg, Texas

Boot-RanchMiscellaneous.jpg

Three years after being put up for sale, the once-bankrupt Boot Ranch community has kicked back into high sales gear. This posh 2,051-acre master-planned golf community in Texas Hill Country’s Gillespie County started selling luxury lots in 2005 and opened a golf course designed by PGA Tour star Hal Sutton in 2006.

But sales were sluggish as the real estate market started to collapse worldwide and Lehman Brothers eventually foreclosed on the property in 2010. Then, the Municipal Police Employees Retirement System of Louisiana, one of Sutton’s original backers and a past partner on the project, sued a number of Boot Ranch partnerships and corporations, putting the project under further stress.

With all of these financial and legal troubles behind them, Boot Ranch is now able to focus on a revitalized real estate market and the renewed life is paying off for this private golf and family community near the popular town of Fredericksburg.

Case in point is Boot Ranch is coming off an eight-year record high for home and property sales, highlighted last year by $13.781 million in year-to-date sales through Sept. 30. Of the $13.781 million in sales, $9.057 million came from estate home sites; another $1.524 million was from Overlook Cabin home sites and $2.825 million were sales of fractional shares of the club’s Sunday Houses.

https://martinhladyniuk.com/wp-content/uploads/2015/03/7d89d-golfer3.jpg

Overall, Boot Ranch sold 135 lots last year and had 16 homes completed with another 20 under construction or in the planning stages. Boot Ranch real estate options range from fractional ownership shares of 4,500-square-foot Sunday Houses to large Overlook Cabins priced from the $800,000s to estate home sites from $300,000 to $2.5 million for 2-18 acres.

“The booming demand for luxury ranch living is a byproduct of the successful Texas economy, particularly the energy business,” says Sean Gioffre, Boot Ranch director of marketing and sales. “The advent of hydraulic fracturing and the achievements of prized shale formations, like the Eagle Ford, Permian and Bakken, have pushed oil and gas production to record highs. With low interest rates, many people are looking to second homes as a hedge against inflation and as a tangible asset in which to put their money.”

Five miles north of the historic town of Fredericksburg, Boot Ranch is a master-planned retreat featuring one of the rare Sutton-designed courses, and a 34-acre practice park comprised of a short game range and executive par-three course. Other amenities at Boot Ranch include access to the 55,000-square-foot Clubhouse Village, casual and fine dining, a fully-stocked wine cellar, golf shop, ReStore Spa & Fitness Center, the 4.5-acre Ranch Club with pavilion, pools, tennis and sports courts, 10 member/guest lodge suites, a trap and skeet range overlooking Longhorn Lake, hiking, mountain biking, canoeing and fishing.

Construction is under way on a fishing pier and comfort station near Boot Ranch’s signature tenth hole on the golf course.

“We call Boot Ranch the ‘American Dream Texas Style,'” says co-director of marketing and sales Andrew Ball. “The motivation for buyers seems to be for recreational property – somewhere where owners can golf, fish, dine, swim, relax and generally enjoy the Texas outdoors. Many people say they just want to get their kids and grandkids out of the city, even if for only a few days or weeks at a time.”

Traditions Club and Community, Bryan, TX

traditions-gc-Carlton-Wade-photo--sunrise-light-small.jpg

This new upscale golf and country club development gives Texas A&M loyalists something else to brag about in Aggieland. Located less than 10 minutes from 10 minutes from a bustling college town and burgeoning health and research center, it’s no surprise why this is shaping up to be another successful Texas real estate project.

Traditions Club and Community is the private golf and residential community in “Aggieland” and home to the Texas A&M men’s and women’s golf teams. Located in Bryan-College Station, the club rests in the shadow of the university and in the heart of The Research Valley’s “One Health Plus Biocorridor.”

From custom-garden homes to large estate lots, Traditions Club has a wide range of developments that cater to many buyers. Future plans to attract even more residents call for a multi-use retail, entertainment and health/fitness complex to be built within the neighboring Biocorridor area that would mirror one of the top suburbs in Houston, The Woodlands.

Traditions’ tournament-caliber, Jack Nicklaus/Jack Nicklaus II-designed golf course hosts many high-profile junior, collegiate and amateur events. Other amenities include a 21,000-square foot, four-building clubhouse with men’s and women’s locker rooms; 25-meter junior Olympic lap and sport-leisure pools; family swim center with beach-like wading pool; and fully-equipped fitness center.

Casual fare is offered at the Poole Grille and fine dining at the clubhouse, home to an impressive wine cellar. Overnight accommodations are available in two-, three- and four-bedroom cottages and casitas located just walking distance from all the club’s amenities.

Overlooking stately oak trees, gently rolling terrain and the lush green fairways of the golf course, the Traditions Club and Community is an enclave of custom estates, Game Day Cottages, cozy casitas, villas, garden homes and luxurious condominiums. Home sites range from .25 acres up to an acre, with homes spanning 1,800 to 8,000 square feet.

Traditions-Clubhouse.jpg

Traditions Clubhouse

The newest phase being marketed is the Blue Belle home sites, a collection of 34 lots designed for two and three-bedroom custom homes. Overlooking a heavily wooded and rolling landscape in a peaceful and quiet enclave, the home sites encompass up to one-third of an acre and are priced with the home. The residences range from 2,200 to 3,500 square-feet and start in the low $400,000s.

Blue Belle residents can enjoy the outdoors without having to worry about extensive home and yard maintenance. Creative landscaped patios open up to peaceful settings that exemplify private community living. A multi-use trail meandering around a small lake is perfect for short walks and hikes

Interiors exude Texas Hill County elegance, with hardwood flooring, granite countertops, gourmet kitchens, high ceilings and open living area. The floor plans are highly personalized, providing a rich, distinguished selection of upscale finishes and features.

“Real estate sales in vibrant college towns like Bryan/College Station continue to thrive as master-planned communities like Traditions build to suit an array of buyers,” says Spencer Clements, Traditions Club Principal. “Empty-nesters or those seeking a second home with minimal maintenance will find Blue Belle offers the square-footages, relaxing setting and customized features catering to their needs and lifestyle.”

Tribute, The Colony, Texas

Tribute-Residence.jpg

The Tribute, a Matthews Southwest, Wynne/Jackson master-planned community on the shores of Lake Lewisville, is one of the more ambitious golf and country club developments in the Dallas-Fort Worth metroplex.

Located just 23 miles from Dallas-Fort Worth International Airport, the Tribute is a 36-hbole upscale semi-private facility whose original plans call for 1,150 single-family homes, 160 golf villas, 183 townhomes, and 700 European condominium units.

The community’s newest course, Old American Golf Club, opened in the summer of 2009 and was designed by Tripp Davis and PGA Tour player and native son Justin Leonard. When Old American opened (it was originally called the
New Course), the developers offered premium lake-view, golf course-fronting lots in the Balmerino Village.

This initial phase of lots, located adjacent to the No. 5 green and the No. 6 tee box featured unobstructed views of Lake Lewisville and ranged in price from $135,000 to $275,000 for little more than 1/3 of an acre.

What makes the Tribute so unique it its Scottish links-inspired setting. For instance, the Tribute’s namesake layout, or “Old Course” as it’s often called, is patterned after the legendary courses of Scotland and the Open Championship what with its wind-swept dunes and fescue grasses.

The first and 18th holes share the same broad fairway, just the Old Course at St. Andrews, and you’ll also find a likeness of Royal Troon’s Postage Stamp hole and experience replica holes from Prestwick, Muirfield, Western Gailes and Royal Dornoch. For a special treat, make sure to stay in one of the overnight guest suites above the clubhouse that overlook the course.

The Tribute’s newest course pays homage to famed golf course architects such as Donald Ross and A.W. Tillinghast, many of whom came to the United States from Great Britain around the turn of the century.

According to an Old American spokesman, the new course currently has about 58 resident members of the club, which represents approximately 25 percent of the overall membership. Among the other amenities enjoyed by members are first-class amenity centers, pools, parks, playgrounds, on-site schools, hike-and-bike trails, landscaped canals and hundreds of acres of accessible open space reminiscent of the Scottish Highlands.

Junk-Rated Oil & Gas Companies in a “Liquidity Death Spiral”

by Wolf Richter

https://ashwinikumar007.files.wordpress.com/2011/06/blackmoney.jpg

On the face of it, the oil price appears to be stabilizing. What a precarious balance it is, however.

Behind the facade of stability, the re-balancing triggered by the price collapse has yet to run its course, and it might be overly optimistic to expect it to proceed smoothly. Steep drops in the US rig count have been a key driver of the price rebound. Yet US supply so far shows precious little sign of slowing down. Quite to the contrary, it continues to defy expectations.

So said the International Energy Agency in its Oil Market Report on Friday. West Texas Intermediate plunged over 4% to $45 a barrel.

The boom in US oil production will continue “to defy expectations” and wreak havoc on the price of oil until the power behind the boom dries up: money borrowed from yield-chasing investors driven to near insanity by the Fed’s interest rate repression. But that money isn’t drying up yet – except at the margins.

Companies have raked in 14% more money from high-grade bond sales so far this year than over the same period in 2014, according to LCD. And in 2014 at this time, they were 27% ahead of the same period in 2013. You get the idea.

Even energy companies got to top off their money reservoirs. Among high-grade issuers over just the last few days were BP Capital, Valero Energy, Sempra Energy, Noble, and Helmerich & Payne. They’re all furiously bringing in liquidity before it gets more expensive.

In the junk-bond market, bond-fund managers are chasing yield with gusto. Last week alone, pro-forma junk bond issuance “ballooned to $16.48 billion, the largest weekly tally in two years,” the LCD HY Weekly reported. Year-to-date, $79.2 billion in junk bonds have been sold, 36% more than in the same period last year.

But despite this drunken investor enthusiasm, the bottom of the energy sector – junk-rated smaller companies – is falling out.

Standard & Poor’s rates 170 bond issuers that are engaged in oil and gas exploration & production, oil field services, and contract drilling. Of them, 81% are junk rated – many of them deep junk. The oil bust is now picking off the smaller junk-rated companies, one after the other, three of them so far in March.

On March 3, offshore oil-and-gas contractor CalDive that in 2013 still had 1,550 employees filed for bankruptcy. It’s focused on maintaining offshore production platforms. But some projects were suspended last year, and lenders shut off the spigot.

On March 8, Dune Energy filed for bankruptcy in Austin, TX, after its merger with Eos Petro collapsed. It listed $144 million in debt. Dune said that it received $10 million Debtor in Possession financing, on the condition that the company puts itself up for auction.

On March 9, BPZ Resources traipsed to the courthouse in Houston to file for bankruptcy, four days after I’d written about its travails; it had skipped a $60 million payment to its bondholders [read… “Default Monday”: Oil & Gas Companies Face Their Creditors].

And more companies are “in the pipeline to be restructured,” LCD reported. They all face the same issues: low oil and gas prices, newly skittish bond investors, and banks that have their eyes riveted on the revolving lines of credit with which these companies fund their capital expenditures. Being forever cash-flow negative, these companies periodically issue bonds and use the proceeds to pay down their revolver when it approaches the limit. In many cases, the bank uses the value of the company’s oil and gas reserves to determine that limit.

If the prices of oil and gas are high, those reserves have a high value. It those prices plunge, the borrowing base for their revolving lines of credit plunges. S&P Capital IQ explained it this way in its report, “Waiting for the Spring… Will it Recoil”:

Typically, banks do their credit facility redeterminations in April and November with one random redetermination if needed. With oil prices plummeting, we expect banks to lower their price decks, which will then lead to lower reserves and thus, reduced borrowing-base availability.

April is coming up soon. These companies would then have to issue bonds to pay down their credit lines. But with bond fund managers losing their appetite for junk-rated oil & gas bonds, and with shares nearly worthless, these companies are blocked from the capital markets and can neither pay back the banks nor fund their cash-flow negative operations. For many companies, according to S&P Capital IQ, these redeterminations of their credit facilities could lead to a “liquidity death spiral.”

Alan Holtz, Managing Director in AlixPartners’ Turnaround and Restructuring group told LCD in an interview:

We are already starting to see companies that on the one hand are trying to work out their operational problems and are looking for financing or a way out through the capital markets, while on the other hand are preparing for the events of contingency planning or bankruptcy.

Look at BPZ Resources. It wasn’t able to raise more money and ended up filing for bankruptcy. “I think that is going to be a pattern for many other companies out there as well,” Holtz said.

When it trickled out on Tuesday that Hercules Offshore, which I last wrote about on March 3, had retained Lazard to explore options for its capital structure, its bonds plunged as low as 28 cents on the dollar. By Friday, its stock closed at $0.41 a share.

When Midstates Petroleum announced that it had hired an interim CEO and put a restructuring specialist on its board of directors, its bonds got knocked down, and its shares plummeted 33% during the week, closing at $0.77 a share on Friday.

When news emerged that Walter Energy hired legal counsel Paul Weiss to explore restructuring options, its first-lien notes – whose investors thought they’d see a reasonable recovery in case of bankruptcy – dropped to 64.5 cents on the dollar by Thursday. Its stock plunged 63% during the week to close at $0.33 a share on Friday.

Numerous other oil and gas companies are heading down that path as the oil bust is working its way from smaller more vulnerable companies to larger ones. In the process, stockholders get wiped out. Bondholders get to fight with other creditors over the scraps. But restructuring firms are licking their chops, after a Fed-induced dry spell that had lasted for years.

Investors Crushed as US Natural Gas Drillers Blow Up

by Wolf Richter

The Fed speaks, the dollar crashes. The dollar was ripe. The entire world had been bullish on it. Down nearly 3% against the euro, before recovering some. The biggest drop since March 2009. Everything else jumped. Stocks, Treasuries, gold, even oil.

West Texas Intermediate had been experiencing its biggest weekly plunge since January, trading at just above $42 a barrel, a new low in the current oil bust. When the Fed released its magic words, WTI soared to $45.34 a barrel before re-sagging some. Even natural gas rose 1.8%. Energy related bonds had been drowning in red ink; they too rose when oil roared higher. It was one heck of a party.

But it was too late for some players mired in the oil and gas bust where the series of Chapter 11 bankruptcy filings continues. Next in line was Quicksilver Resources.

It had focused on producing natural gas. Natural gas was where the fracking boom got started. Fracking has a special characteristic. After a well is fracked, it produces a terrific surge of hydrocarbons during first few months, and particularly on the first day. Many drillers used the first-day production numbers, which some of them enhanced in various ways, in their investor materials. Investors drooled and threw more money at these companies that then drilled this money into the ground.

But the impressive initial production soon declines sharply. Two years later, only a fraction is coming out of the ground. So these companies had to drill more just to cover up the decline rates, and in order to drill more, they needed to borrow more money, and it triggered a junk-rated energy boom on Wall Street.

At the time, the price of natural gas was soaring. It hit $13 per million Btu at the Henry Hub in June 2008. About 1,600 rigs were drilling for gas. It was the game in town. And Wall Street firms were greasing it with other people’s money. Production soared. And the US became the largest gas producer in the world.

https://martinhladyniuk.com/wp-content/uploads/2015/03/be197-deathspiral2.jpg

But then the price began to plunge. It recovered a little after the Financial Crisis but re-plunged during the gas “glut.” By April 2012, natural gas had crashed 85% from June 2008, to $1.92/mmBtu. With the exception of a few short periods, it has remained below $4/mmBtu – trading at $2.91/mmBtu today.

Throughout, gas drillers had to go back to Wall Street to borrow more money to feed the fracking orgy. They were cash-flow negative. They lost money on wells that produced mostly dry gas. Yet they kept up the charade. They aced investor presentations with fancy charts. They raved about new technologies that were performing miracles and bringing down costs. The theme was that they would make their investors rich at these gas prices.

The saving grace was that oil and natural-gas liquids, which were selling for much higher prices, also occur in many shale plays along with dry gas. So drillers began to emphasize that they were drilling for liquids, not dry gas, and they tried to switch production to liquids-rich plays. In that vein, Quicksilver ventured into the oil-rich Permian Basin in Texas. But it was too little, too late for the amount of borrowed money it had already burned through over the years by fracking for gas below cost.

During the terrible years of 2011 and 2012, drillers began reclassifying gas rigs as rigs drilling for oil. It was a judgement call, since most wells produce both. The gas rig count plummeted further, and the oil rig count skyrocketed by about the same amount. But gas production has continued to rise since, even as the gas rig count has continued to drop. On Friday, the rig count was down to 257 gas rigs, the lowest since March 1993, down 84% from its peak in 2008.

US-rig-count_1988_2015-03-13=gas

Quicksilver’s bankruptcy is a consequence of this fracking environment. It listed $2.35 billion in debts. That’s what is left from its borrowing binge that covered its negative cash flows. It listed only $1.21 billion in assets. The rest has gone up in smoke.

Its shares are worthless. Stockholders got wiped out. Creditors get to fight over the scraps.

Its leveraged loan was holding up better: the $625 million covenant-lite second-lien term loan traded at 56 cents on the dollar this morning, according to S&P Capital IQ LCD. But its junk bonds have gotten eviscerated over time. Its 9.125% senior notes due 2019 traded at 17.6 cents on the dollar; its 7.125% subordinated notes due 2016 traded at around 2 cents on the dollar.

Among its creditors, according to the Star Telegram: the Wilmington Trust National Association ($361.6 million), Delaware Trust Co. ($332.6 million), US Bank National Association ($312.7 million), and several pipeline companies, including Oasis Pipeline and Energy Transfer Fuel.

Last year, it hired restructuring advisers. On February 17, it announced that it would not make a $13.6 million interest payment on its senior notes and invoked the possibility of filing for Chapter 11. It said it would use its 30-day grace period to haggle with its creditors over the “company’s options.”

Now, those 30 days are up. But there were no other “viable options,” the company said in the statement. Its Canadian subsidiary was not included in the bankruptcy filing; it reached a forbearance agreement with its first lien secured lenders and has some breathing room until June 16.

Quicksilver isn’t alone in its travails. Samson Resources and other natural gas drillers are stuck neck-deep in the same frack mud.

A group of private equity firms, led by KKR, had acquired Samson in 2011 for $7.2 billion. Since then, Samson has lost $3 billion. It too hired restructuring advisers to deal with its $3.75 billion in debt. On March 2, Moody’s downgraded Samson to Caa3, pointing at “chronically low natural gas prices,” “suddenly weaker crude oil prices,” the “stressed liquidity position,” and delays in asset sales. It invoked the possibility of “a debt restructuring” and “a high risk of default.”

But maybe not just yet. The New York Post reported today that, according to sources, a JPMorgan-led group, which holds a $1 billion revolving line of credit, is granting Samson a waiver for an expected covenant breach. This would avert default for the moment. Under the deal, the group will reduce the size of the revolver. Last year, the same JPMorgan-led group already reduced the credit line from $1.8 billion to $1 billion and waived a covenant breach.

By curtailing access to funding, they’re driving Samson deeper into what S&P Capital IQ called the “liquidity death spiral.” According to the New York Post’s sources, in August the company has to make an interest payment to its more junior creditors, “and may run out of money later this year.”

Industry soothsayers claimed vociferously over the years that natural gas drillers can make money at these prices due to new technologies and efficiencies. They said this to attract more money. But Quicksilver along with Samson Resources and others are proof that these drillers had been drilling below the cost of production for years. And they’d been bleeding every step along the way. A business model that lasts only as long as new investors are willing to bail out old investors.

But it was the crash in the price of “liquids” that made investors finally squeamish, and they began to look beyond the hype. In doing so, they’re triggering the very bloodletting amongst each other that ever more new money had delayed for years. Only now, it’s a lot more expensive for them than it would have been three years ago. While the companies will get through it in restructured form, investors get crushed.


Oil Production Falling In Three Big Shale Plays, EIA Says

HOUSTON – It’s official: The shale oil boom is starting to waver.

And, in a way, it may have souped-up rigs and more efficient drilling technologies to thank for that.

Crude production at three major U.S. shale oil fields is projected to fall this month for the first time in six years, the U.S. Energy Information Administration said Tuesday.

It’s one of the first signs that idling hundreds of drilling rigs and billions of dollars in corporate cutbacks are starting to crimp the nation’s surging oil patch.

But it also shows that drilling technology and techniques have advanced to the point that productivity gains may be negligible in some shale plays where horizontal drilling and hydraulic fracturing have been used together for the past several years.

Because some plays are already full of souped-up horizontal rigs, oil companies don’t have as many options to become more efficient and stem production losses, as they did in the 2008-2009 downturn, the EIA said.

The EIA’s monthly drilling productivity report indicates that rapid production declines from older wells in three shale plays are starting to overtake new output, as oil companies drill fewer wells.

In the recession six years ago, the falling rig count didn’t lead to declining production because new technologies boosted how fast rigs could drill wells.

But now that oil firms have figured out how to drill much more efficiently, “it is not clear that productivity gains will offset rig count declines to the same degree as in 2008-09,” the EIA said.

Energy Information Agency

Overall, U.S. oil production is set to increase slightly from March to April to 5.6 million barrels a day in six major fields, according to the EIA.

But output is falling in the Eagle Ford Shale in South Texas, North Dakota’s Bakken Shale and the Niobrara Shale in Colorado, Wyoming, Nebraska and Kansas.

In those three fields, net production is expected to drop by a combined 24,000 barrels a day.

The losses were masked by production gains in the Permian Basin in West Texas and other regions.

Efficiency improvements are still emerging in the Permian, faster than in other oil fields because the region was largely a vertical-drilling zone as recently as December 2013, the EIA said.

Net crude output in the Bakken is expected to decline by 8,000 barrels a day from March to April. In the Eagle Ford, it’s slated to fall by 10,000 barrels a day. And in the Niobrara, production will dip by roughly 5,000 barrels a day.

But daily crude output jumped by 21,000 barrels in the Permian and by 3,000 barrels in the Utica Shale in Ohio and Pennsylvania.

Read more at MRT.com

Airbnb And Other Short-Term Rentals Worsen Housing Shortage, Critics Say

https://i0.wp.com/www.alicesgardentravelbuzz.com/wp-content/uploads/2011/03/Venice-California-Canal-Photo-Alice-Joyce1.jpg

Landlords in Venice and other tourist-friendly areas are converting units into short-term rentals, worsening the area’s housing shortage, a study says.

The last time he advertised one of his apartments, longtime Los Feliz landlord Andre LaFlamme got a request he’d never seen before.

A man wanted to rent LaFlamme’s 245-square-foot bachelor unit with hardwood floors for $875 a month, then list it himself on Airbnb.

“Thanks but no thanks,” LaFlamme told the prospective tenant. “You’ve got to be kidding me.”

But he understood why: More money might be made renting to tourists a few days at a time than to a local for 12 months or more.

Where are the short-term rentals?

About 12,700 rental units were listed on Airbnb in Los Angeles County on Dec. 22, 2014, but they were not spread out equally. In parts of Venice and Hollywood, Airbnb listings accounted for 4% or more of all housing units.

As short-term rental websites such as Airbnb explode in popularity in Southern California, a growing number of homeowners and landlords are caving to the economics. A study released Wednesday from Los Angeles Alliance for a New Economy, a labor-backed advocacy group, estimates that more than 7,000 houses and apartments have been taken off the rental market in metro Los Angeles for use as short-term rentals. In parts of tourist-friendly neighborhoods such as Venice and Hollywood, Airbnb listings account for 4% or more of all housing units, according to a Times analysis of data from Airbnb’s website.

That’s worsening a housing shortage that already makes Los Angeles one of the least affordable places to rent in the country.

“In places where vacancy is already limited and rents are already squeezing people out, this is exacerbating the problem,” said Roy Samaan, a policy analyst who wrote the alliance’s report. “There aren’t 1,000 units to give in Venice or Hollywood.”

https://i0.wp.com/socalbeachmag.net/images/572_2005_05_24_venice_beach_san_clemente_santa_monica_laguna-beaches_037-resize-logo2.JPG

Fast-growing Airbnb and others like it say they help cash-strapped Angelenos earn a little extra money. Airbnb estimates that 82% of its 4,500 L.A. hosts are “primary residents” of the homes they list, and that nearly half use the proceeds to help pay their rent or mortgage. And the effect on the broader housing market is so small that it’s all but irrelevant, said Tom Davidoff, a housing economist at the University of British Columbia whom Airbnb hired to study its impact.

“Over the lifetime of a lease, rents maybe go up 1.5%,” he said. “That’s peanuts relative to the increases we’ve seen in housing costs in a lot of places.”

But there are growing signs of professionalization of the short-term rental world, from property-manager middlemen like the one who e-mailed LaFlamme to Airbnb “hosts” who list dozens of properties on the site. The Los Angeles Alliance study estimates that 35% of Airbnb revenue in Southern California comes from people who list more than one unit.

“I don’t think anyone would begrudge someone renting out a spare bedroom,” Samaan said. “But there’s a whole cottage industry that’s springing up around this.”

City Council member Mike Bonin, whose coastal district includes Venice, and Council President Herb Wesson want to study how these rentals have affected the city. No regulations have been drafted, and Bonin said the council would seek extensive community input. Current rules bar short-term rentals in many residential areas of the city, but critics say they’re rarely enforced.

As city officials craft new ones, they’ll certainly be hearing from Airbnb and its allies. Last year, the company spent more than $100,000 lobbying City Hall and released a study touting its economic impact in L.A. — more than $200 million in spending by guests, supporting an estimated 2,600 jobs. A group representing short-term rental hosts has made the rounds of City Council offices as well.

This industry “needs to be regulated and regulated the right way,” said Sebastian de Kleer, co-founder of the Los Angeles Short Term Rental Alliance and owner of a Venice-based vacation rental company. “For a lot of people, this is a very new issue.”

Neighborhood groups are sure to weigh in too, especially in Venice.

https://i0.wp.com/fc09.deviantart.net/fs4/i/2004/194/c/7/canals_of_venice_california_11.jpgThe beach neighborhood has the highest concentration of Airbnb listings in all of metro Los Angeles. Data collected by Beyond Pricing, a San Francisco-based start-up that helps short-term rental hosts optimize pricing, show that in census tracts along Venice Beach and Abbott-Kinney Boulevard, Airbnb listings accounted for 6% to 7% of all housing units — about 10 times the countywide average.

A letter last fall from the Venice Neighborhood Council to city officials estimated that the number of short-term rental listings in the area had tripled in a year, citing a “Gold Rush mentality” among investors looking for a piece of the action. That’s hurting local renters, said Steve Clare, executive director of Venice Community Housing.

“Short-term rentals are really taking over a significant portion of the rental housing market in our community,” Clare said. “It’s going to further escalate rents, and take affordable housing out of Venice.”

Along the Venice boardwalk, a number of apartment buildings now advertise short-term rentals, and houses on the city’s famed “walk streets” routinely show up in searches on Airbnb. Even several blocks inland, at Lincoln Place Apartments — a 696-unit, newly renovated complex that includes a pool, gym and other tourist-friendly amenities — Roman Barrett recently counted more than 40 listings on Airbnb and other sites. Barrett, who moved out over the issue, said Airbnb effectively drives up the rent. He paid $2,700 a month for a one-bedroom; now he’s looking farther east for something he can afford.

“It’s making places like Santa Monica and Venice totally priced out. Silver Lake is impossible. I’m looking in Koreatown right now,” Barrett said. “They need to make a law about this.”


https://i0.wp.com/solotravelerblog.com/wp-content/uploads/2014/03/Venice-Beach-California.jpg

A new law of some sort is the goal at City Hall. New York, San Francisco and Portland, Ore., have crafted regulations to govern taxes, zoning and length of stay in short-term rentals, and Airbnb says it’s glad to help in that process here.

“It’s time for all of us to work together on some sensible solutions that let people share the home in which they live and contribute to their community,” spokesman Christopher Nulty said in a statement Tuesday.

Will Youngblood, the man who e-mailed LaFlamme about managing his apartment in Los Feliz, says he’d also appreciate clearer rules and an easier way to pay occupancy taxes.

Youngblood runs five Airbnb apartments, mostly in Hollywood. A former celebrity assistant, he’s been doing this for two years; it’s a full-time job. Most of Youngblood’s clients own their homes but travel a lot or live elsewhere. One, he rents and lists full time. He’s been looking around for another.

“I’m honest about what I do,” he said. “Some [landlords] are like, ‘That’s insane. No way.’ Other people say, ‘We’d love that.'”

If the city decides it doesn’t like what he’s doing, Youngblood said, he’ll go do something else. But for now, he said, it’s a good way to make some cash and meet interesting people.

But he won’t meet LaFlamme. The longtime landlord concedes he “might be old-fashioned,” but he just doesn’t like the idea of strangers traipsing through his apartments. He prefers good, long-term tenants, and in L.A.’s red-hot rental market he has no problem finding them.

“I almost find it painful to rent things these days,” he said. “There’s so much demand and so many people who are qualified and nice people who I have to turn away.”

For that apartment in Los Feliz, LaFlamme said, he found a tenant in less than 24 hours.

25 Percent of all U.S. Foreclosures Are Zombie Homes

https://i0.wp.com/www.csmonitor.com/var/ezflow_site/storage/images/media/content/2013/0110-zombie-foreclosures.jpg/14727985-1-eng-US/0110-zombie-foreclosures.jpg_full_600.jpgby Michael Gerrity

RealtyTrac’s Q1 2015 Zombie Foreclosure Report, found that as of the end of January 2015, 142,462 homes actively in the foreclosure process had been vacated by the homeowners prior to the bank repossessing the property, representing 25 percent of all active foreclosures.

The total number of zombie foreclosures was down 6 percent from a year ago, but the 25 percent share of total foreclosures represented by zombies was up from 21 percent a year ago.

“While the number of vacated zombie foreclosures is down from a year ago, they represent an increasing share of all foreclosures because they tend to be the problem cases still stuck in the pipeline,” said Daren Blomquist vice president at RealtyTrac. “Additionally, the states where overall foreclosure activity has been increasing over the past year — counter to the national trend — tend to be states with a longer foreclosure process more susceptible to the zombie problem.”

“In states with a bloated foreclosure process, the increase in zombie foreclosures is actually a good sign that banks and courts are finally moving forward with a resolution on these properties that may have been sitting in foreclosure limbo for years,” Blomquist continued. “In many markets there is plenty of demand from buyers and investors to snatch up these distressed properties as soon as they become available to purchase.”

Florida, New Jersey, New York have most zombie foreclosures

https://www.homevalueleads.com/wp-content/uploads/crazy.jpg

Despite a 35 percent decrease in zombie foreclosures compared to a year ago, Florida had the highest number of any state with 35,903 — down from 54,908 in the first quarter of 2014. Zombie foreclosures accounted for 26 percent of all foreclosures in Florida.

Zombie foreclosures increased 109 percent from a year ago in New Jersey, and the state posted the second highest total of any state with 17,983 — 23 percent of all properties in foreclosure.

New York zombie foreclosures increased 54 percent from a year ago to 16,777, the third highest state total and representing 19 percent of all residential properties in foreclosure.

Illinois had 9,358 zombie foreclosures at the end of January, down 40 percent from a year ago but still the fourth highest state total, while California had 7,370 zombie foreclosures at the end of January, up 24 percent from a year ago and the fifth highest state total. 

“We are now in the final cycle of the foreclosure crisis cleanup, in which we are witnessing a large final wave of walkaways,” said Mark Hughes, Chief Operating Officer at First Team Real Estate, covering the Southern California market. “This has created an uptick in vacated or ‘zombie’ foreclosures and the intrinsic neighborhood issues most of them create.

“A much longer recovery, a largely veiled underemployment issue, and growing examples of faster bad debt forgiveness have most likely fueled this last wave of owners who have finally just walked away from their American dream,” Hughes added.

Other states among the top 10 for most zombie foreclosures were Ohio (7,360), Indiana (5,217), Pennsylvania (4,937), Maryland (3,363) and North Carolina (3,177).

“Rising home prices in Ohio are motivating lending servicers to commence foreclosure actions more quickly and with fewer workout options offered to delinquent homeowners, creating immediate vacancies earlier in the foreclosure process,” said Michael Mahon, executive vice president at HER Realtors, covering the Ohio housing markets of Cincinnati, Dayton and Columbus. “Delinquent homeowners need to understand how prices have increased in recent months, and how this increase in equity may provide positive options for them to avoid foreclosure.”

https://martinhladyniuk.com/wp-content/uploads/2015/03/f9c9a-zombie1.jpg

Metros with most zombie foreclosures: New York, Miami, Chicago, Tampa and Philadelphia. The greater New York metro area had by far the highest number of zombie foreclosures of any metropolitan statistical area nationwide, with 19,177 — 17 percent of all properties in foreclosure and up 73 percent from a year ago.

Zombie foreclosures decreased from a year ago in Miami, Chicago and Tampa, but the three metros still posted the second, third and fourth highest number of zombie foreclosures among metro areas nationwide: Miami had 9,580 zombie foreclosures,19 percent of all foreclosures but down 34 percent from a year ago; Chicago had 8,384 zombie foreclosures, 21 percent of all foreclosures but down 35 percent from a year ago; and Tampa had 7,838 zombie foreclosures, 34 percent of all foreclosures but down 25 percent from a year ago.

Zombie foreclosures increased 53 percent from a year ago in the Philadelphia metro area, giving it the fifth highest number of any metro nationwide in the first quarter of 2015. There were 7,554 zombie foreclosures in the Philadelphia metro area as of the end of January, 27 percent of all foreclosures.

Other metro areas among the top 10 for most zombie foreclosures were Orlando (3,718), Jacksonville, Florida (2,368), Los Angeles (2,074), Las Vegas (1,832), and Baltimore, Maryland (1,722).

Metros with highest share of zombie foreclosures: St. Louis, Portland, Las Vegas

Among metro areas with a population of 200,000 or more and at least 500 zombie foreclosures as of the end of January, those with the highest share of zombie foreclosures as a percentage of all foreclosures were St. Louis (51 percent), Portland (40 percent) and Las Vegas (36 percent).

Metros with biggest increase in zombie foreclosures: Atlantic City, Trenton, New York

Among metro areas with a population of 200,000 or more and at least 500 zombie foreclosures as of the end of January, those with the biggest year-over-year increase in zombie foreclosures were Atlantic City, New Jersey (up 133 percent), Trenton-Ewing, New Jersey (up 110 percent), and New York (up 73 percent).

https://i0.wp.com/www.worldpropertyjournal.com/news-assets/Metros-with-Most-Zombie-Foreclosures.jpg
https://i0.wp.com/www.worldpropertyjournal.com/news-assets/Metros-with-Highest-Share-of-Zombie-Foreclosures.jpg
https://i0.wp.com/www.worldpropertyjournal.com/news-assets/US-States-with-Most-Zombie-Foreclosures.jpg
https://i0.wp.com/www.worldpropertyjournal.com/news-assets/Metros-with-Biggest-Increases-in-Zombie-Foreclosures.jpg

Tenants Benefit When Rent Payment Data Are Factored Into Credit Scores

by Kenneth R. Harney | LA Times

It’s the great credit divide in American housing: If you buy a home and pay your mortgage on time regularly, your credit score typically benefits. If you rent an apartment and pay the landlord on time every month, you get no boost to your score. Since most landlords aren’t set up or approved to report rent payments to the national credit bureaus, their tenants’ credit scores often suffer as a direct result.

All this has huge implications for renters who hope one day to buy a house. To qualify for a mortgage, they’ll need good credit scores. Young, first-time buyers are especially vulnerable — they often have “thin” credit files with few accounts and would greatly benefit by having their rent histories included in credit reports and factored into their scores. Without a major positive such as rent payments in their files, a missed payment on a credit card or auto loan could have significant negative effects on their credit scores.

You probably know folks like these — sons, daughters, neighbors, friends. Or you may be one of the casualties of the system yourself, a renter with a perfect payment history that creditors will never see when they pull your credit. Think of it this way and the great divide gets intensely personal.

But here’s some good news: Growing numbers of landlords are now reporting rent payments to the bureaus with the help of high-tech intermediaries who set up electronic rent-collection systems for tenants.

One of these, RentTrack, says it already has coverage in thousands of rental buildings nationwide, with a total of 100,000-plus apartment units, and expects to be reporting rent payments for more than 1 million tenants within the year. Two others, ClearNow Inc. and PayYourRent, also report to one of the national bureaus, Experian, which includes the data in consumer credit files. RentTrack reports to Experian and TransUnion.

Why does this matter? Two new studies illustrate what can happen when on-time rent payments are factored into consumers’ credit reports and scores. RentTrack examined a sample of the tenants in its database and found that 100% of renters who previously were rated as “unscoreable” — there wasn’t enough information in their credit files to evaluate — became scoreable once they had two months to six months of rental payments reported to the credit bureaus.

https://i0.wp.com/blog.phroogal.com/wp-content/uploads/2013/05/CreditScoreRanges.png

Tenants who had scores below 650 at the start of the sampling gained an average of 29 points with the inclusion of positive monthly payment data. Overall, residents in all score brackets saw an average gain of 9 points. The scores were computed using the VantageScore model, which competes with FICO scores and uses a similar 300 to 850 scoring scale, with high scores indicating low risk of nonpayment.

Experian, the first major credit bureau to begin integrating rental payment records into credit files, also completed a major study recently. Using a sample of 20,000 tenants who live in government-subsidized apartment buildings, Experian found that 100% of unscoreable tenants became scoreable, and that 97% of them had scores in the “prime” (average 688) and “non-prime” (average 649) categories. Among tenants who had scores before the start of the research, fully 75% saw increases after the addition of positive rental information, typically 11 points or higher.

Think about what these two studies are really saying: Tenants often would score higher — sometimes significantly higher — if rent payments were reported to the national credit bureaus. Many deserve higher credit scores but don’t get them.

Matt Briggs, chief executive and founder of RentTrack, says for many tenants, their steady rent payments “may be the only major positive thing in their credit report,” so including them can be crucial when lenders pull their scores.

Justin Yung, vice president of ClearNow, told me that “for most [tenants] the rent is the largest payment they make per month and yet it doesn’t appear on their credit report” unless their landlord has signed up with one of the electronic payment firms.

Is this something difficult or complicated? Not really. You, your landlord or property manager can go to one of the three companies’ websites (RentTrack.com, ClearNow.com and PayYourRent.com), check out the procedures and request coverage. Costs to tenants are either minimal or zero, and the benefits to the landlord of having tenants pay rents electronically appear to be attractive.

Everybody benefits. So why not?

kenharney@earthlink.net Distributed by Washington Post Writers Group. Copyright © 2015, Los Angeles Times

This Chart Shows the True Collapse of Fracking in the US

by Wolf Richter
https://feww.files.wordpress.com/2009/08/rex-wtillerson-exxon.jpg

Rex Tillerson, Exxon Mobile CEO

“People need to kinda settle in for a while.” That’s what Exxon Mobil CEO Rex Tillerson said about the low price of oil at the company’s investor conference. “I see a lot of supply out there.”

So Exxon is going to do its darnedest to add to this supply: 16 new production projects will start pumping oil and gas through 2017. Production will rise from 4 million barrels per day to 4.3 million. But it will spend less money to get there, largely because suppliers have had to cut their prices.

That’s the global oil story. In the US, a similar scenario is playing out. Drillers are laying some people off, not massive numbers yet. Like Exxon, they’re shoving big price cuts down the throats of their suppliers. They’re cutting back on drilling by idling the least efficient rigs in the least productive plays – and they’re not kidding about that.

In the latest week, they idled a 64 rigs drilling for oil, according to Baker Hughes, which publishes the data every Friday. Only 922 rigs were still active, down 42.7% from October, when they’d peaked. Within 21 weeks, they’ve taken out 687 rigs, the most terrific, vertigo-inducing oil-rig nose dive in the data series, and possibly in history:

US-rig-count_1988_2015-03-06=oilAs Exxon and other drillers are overeager to explain: just because we’re cutting capex, and just because the rig count plunges, doesn’t mean our production is going down. And it may not for a long time. Drillers, loaded up with debt, must have the cash flow from production to survive.

But with demand languishing, US crude oil inventories are building up further. Excluding the Strategic Petroleum Reserve, crude oil stocks rose by another 10.3 million barrels to 444.4 million barrels as of March 4, the highest level in the data series going back to 1982, according to the Energy Information Administration. Crude oil stocks were 22% (80.6 million barrels) higher than at the same time last year.

“When you have that much storage out there, it takes a long time to work that off,” said BP CEO Bob Dudley, possibly with one eye on this chart:

US-crude-oil-stocks-2015-03-04So now there is a lot of discussion when exactly storage facilities will be full, or nearly full, or full in some regions. In theory, once overproduction hits used-up storage capacity, the price of oil will plummet to whatever level short sellers envision in their wildest dreams. Because: what are you going to do with all this oil coming out of the ground with no place to go?

A couple of days ago, the EIA estimated that crude oil stock levels nationwide on February 20 (when they were a lot lower than today) used up 60% of the “working storage capacity,” up from 48% last year at that time. It varied by region:

Capacity is about 67% full in Cushing, Oklahoma (the delivery point for West Texas Intermediate futures contracts), compared with 50% at this point last year. Working capacity in Cushing alone is about 71 million barrels, or … about 14% of the national total.

As of September 2014, storage capacity in the US was 521 million barrels. So if weekly increases amount to an average of 6 million barrels, it would take about 13 weeks to fill the 77 million barrels of remaining capacity. Then all kinds of operational issues would arise. Along with a dizzying plunge in price.

In early 2012, when natural gas hit a decade low of $1.92 per million Btu, they predicted the same: storage would be full, and excess production would have to be flared, that is burned, because there would be no takers, and what else are you going to do with it? So its price would drop to zero.

They actually proffered that, and the media picked it up, and regular folks began shorting natural gas like crazy and got burned themselves, because it didn’t take long for the price to jump 50% and then 100%.

Oil is a different animal. The driving season will start soon. American SUVs and pickups are designed to burn fuel in prodigious quantities. People will be eager to drive them a little more, now that gas is cheaper, and they’ll get busy shortly and fix that inventory problem, at least for this year. But if production continues to rise at this rate, all bets are off for next year.

Natural gas, though it refused to go to zero, nevertheless got re-crushed, and the price remains below the cost of production at most wells. Drilling activity has dwindled. Drillers idled 12 gas rigs in the latest week. Now only 268 rigs are drilling for gas, the lowest since April 1993, and down 83.4% from its peak in 2008! This is what the natural gas fracking boom-and-bust cycle looks like:

US-rig-count_1988_2015-03-06=gasYet production has continued to rise. Over the last 12 months, it soared about 9%, which is why the price got re-crushed.

Producing gas at a loss year after year has consequences. For the longest time, drillers were able to paper over their losses on natural gas wells with a variety of means and go back to the big trough and feed on more money that investors were throwing at them, because money is what fracking drills into the ground.

But that trough is no longer being refilled for some companies. And they’re running out. “Restructuring” and “bankruptcy” are suddenly the operative terms.


“Default Monday”: Oil & Gas Face Their Creditors

by Wolf Richter

https://i0.wp.com/www.macleans.ca/wp-content/uploads/2013/02/MAC04_OILSANDS01-wide.jpg

Debt funded the fracking boom. Now oil and gas prices have collapsed, and so has the ability to service that debt. The oil bust of the 1980s took down 700 banks, including 9 of the 10 largest in Texas. But this time, it’s different. This time, bondholders are on the hook.

And these bonds – they’re called “junk bonds” for a reason – are already cracking. Busts start with small companies and proceed to larger ones. “Bankruptcy” and “restructuring” are the terms that wipe out stockholders and leave bondholders and other creditors to tussle over the scraps.

https://martinhladyniuk.com/wp-content/uploads/2015/03/27560-bankruptcy.jpg

Early January, WBH Energy, a fracking outfit in Texas, kicked off the series by filing for bankruptcy protection. It listed assets and liabilities of $10 million to $50 million. Small fry.

A week later, GASFRAC filed for bankruptcy in Alberta, where it’s based, and in Texas – under Chapter 15 for cross-border bankruptcies. Not long ago, it was a highly touted IPO, whose “waterless fracking” technology would change a parched world. Instead of water, the system pumps liquid propane gel (similar to Napalm) into the ground; much of it can be recaptured, in theory.

Ironically, it went bankrupt for other reasons: operating losses, “reduced industry activity,” the inability to find a buyer that would have paid enough to bail out its creditors, and “limited access to capital markets.” The endless source of money without which fracking doesn’t work had dried up.

https://i0.wp.com/fm.cnbc.com/applications/cnbc.com/resources/img/editorial/2013/09/03/101003666-89cb3e34560372ba5382f629569eaecb4db09256.530x298.jpg

On February 17, Quicksilver Resources announced that it would not make a $13.6 million interest payment on its senior notes due in 2019. It invoked the possibility of filing for Chapter 11 bankruptcy to “restructure its capital structure.” Stockholders don’t have much to lose; the stock is already worthless. The question is what the creditors will get.

It has hired Houlihan Lokey Capital, Deloitte Transactions and Business Analytics, “and other advisors.” During its 30-day grace period before this turns into an outright default, it will haggle with its creditors over the “company’s options.”

On February 27, Hercules Offshore had its share-price target slashed to zero, from $4 a share, at Deutsche Bank, which finally downgraded the stock to “sell.” If you wait till Deutsche Bank tells you to sell, you’re ruined!

When I wrote about Hercules on October 15, HERO was trading at $1.47 a share, down 81% since July. Those who followed the hype to “buy the most hated stocks” that day lost another 44% by the time I wrote about it on January 16, when HERO was at $0.82 a share. Wednesday, shares closed at $0.60.

Deutsche Bank was right, if late. HERO is headed for zero (what a trip to have a stock symbol that rhymes with zero). It’s going to restructure its junk debt. Stockholders will end up holding the bag.

https://i0.wp.com/bloximages.newyork1.vip.townnews.com/tulsaworld.com/content/tncms/assets/v3/editorial/f/d8/fd890ea6-d8e7-59fc-b849-cf74b6c4a4cd/527b48bba3b05.preview-300.jpg

On Monday, due to “chronically low natural gas prices exacerbated by suddenly weaker crude oil prices,” Moody’s downgraded gas-driller Samson Resources, to Caa3, invoking “a high risk of default.”

It was the second time in three months that Moody’s downgraded the company. The tempo is picking up. Moody’s:

The company’s stressed liquidity position, delays in reaching agreements on potential asset sales and its retention of restructuring advisors increases the possibility that the company may pursue a debt restructuring that Moody’s would view as a default.

Moody’s was late to the party. On February 26, it was leaked that Samson had hired restructuring advisers Kirkland & Ellis and Blackstone’s restructuring group to figure out how to deal with its $3.75 billion in debt. A group of private equity firms, led by KKR, had acquired Samson in 2011 for $7.2 billion. Since then, Samson has lost $3 billion. KKR has written down its equity investment to 5 cents on the dollar.

This is no longer small fry.

https://i0.wp.com/www.yourindustrynews.com/upload_images/BPZ_Energy.jpg

Also on Monday, oil-and-gas exploration and production company BPZ Resources announced that it would not pay $62 million in principal and interest on convertible notes that were due on March 1. It will use its grace period of 10 days on the principal and of 30 days on the interest to figure out how to approach the rest of its existence. It invoked Chapter 11 bankruptcy as one of the options.

If it fails to make the payments within the grace period, it would also automatically be in default of its 2017 convertible bonds, which would push the default to $229 million.

BPZ tried to refinance the 2015 convertible notes in October and get some extra cash. Fracking devours prodigious amounts of cash. But there’d been no takers for the $150 million offering. Even bond fund managers, driven to sheer madness by the Fed’s policies, had lost their appetite. And its stock is worthless.

https://i0.wp.com/b.vimeocdn.com/ts/433/407/433407397_640.jpg

Also on Monday – it was “default Monday” or something – American Eagle Energy announced that it would not make a $9.8 million interest payment on $175 million in bonds due that day. It will use its 30-day grace period to hash out its future with its creditors. And it hired two additional advisory firms.

One thing we know already: after years in the desert, restructuring advisers are licking their chops.

The company has $13.6 million in negative working capital, only $25.9 million in cash, and its $60 million revolving credit line has been maxed out.

But here is the thing: the company sold these bonds last August! And this was supposed to be its first interest payment.

That’s what a real credit bubble looks like. In the Fed’s environment of near-zero yield on reasonable investments, bond fund managers are roving the land chasing whatever yield they can discern. And they’re holding their nose while they pick up this stuff to jam it into bond funds that other folks have in their retirement portfolio.

Not even a single interest payment!

Borrowed money fueled the fracking boom. The old money has been drilled into the ground. The new money is starting to dry up. Fracked wells, due to their horrendous decline rates, produce most of their oil and gas over the first two years. And if prices are low during that time, producers will never recuperate their investment in those wells, even if prices shoot up afterwards. And they’ll never be able to pay off the debt from the cash flow of those wells. A chilling scenario that creditors were blind to before, but are now increasingly forced to contemplate.

Another Dubious Jobs Report

Source: Prison Planet

https://i0.wp.com/s1.ibtimes.com/sites/www.ibtimes.com/files/styles/v2_article_large/public/2013/09/29/jobs-report.jpg

According to the payroll jobs report today (March 6) the economy created 295,000 new jobs in February, dropping the rate of unemployment to 5.5%. However, the BLS also reported that the labor force participation rate fell and the number of people not in the labor force rose by 354,000.

In other words, the unemployment rate dropped because the labor force shrunk.

If the economy was in recovery, the labor force would be growing and the labor force participation rate would be rising.

The 295,000 claimed new jobs are highly suspect. For example, the report claims 32,000 new retail jobs, but the Census Bureau reports that retail sales declined in December and January. Why would retailers experiencing declining sales hire more employees?

Construction spending declined 1.1% in January, but the payroll jobs report says 29,000 construction jobs were added in February.

Zero Hedge reports that the decline in the oil price has resulted in almost 40,000 laid off workers during January and February, but the payroll jobs report only finds 2,900 lost jobs in oil for the two months.http://www.zerohedge.com/news/2015-03-06/did-bls-once-again-forget-count-tens-thousands-energy-job-losses

There is no sign in the payroll jobs report of the large lay-offs by IBM and Hewlett Packard.

These and other inconsistencies do not inspire confidence.

By ignoring the inconsistencies the financial press does not inspire confidence.

Let’s now look at where the BLS says the payroll jobs are.

 photo JobBulletinBoard.jpg

All of the goods producing jobs are accounted for by the 29,000 claimed construction jobs. The remaining 259,000 new jobs–90%–of the total–are service sector jobs. Three categories account for 70% of these jobs. Wholesale and retail trade, transportation and utilities account. for 62,000 of the jobs. Education and health services account for 54,000 of which ambulatory health care services accounts for 19,900. Leisure and hospitality account for 66,000 jobs of which waitresses and bartenders account for 58,700 jobs.

These are the domestic service jobs of a turd world country.

John Williams (shadowstats.com) reports: “As of February, the level of full-time employment still was 1.0 million shy of its pre-recession peak.”

Paul Craig Roberts was Assistant Secretary of the Treasury for Economic Policy and associate editor of the Wall Street Journal. He was columnist for Business Week, Scripps Howard News Service, and Creators Syndicate. He has had many university appointments. His internet columns have attracted a worldwide following. His latest book, The Failure of Laissez Faire Capitalism and Economic Dissolution of the West is now available.


Dreaming Big: Americans Still Yearning for Larger Homes

by Ralph McLaughlin | Trulia

https://i0.wp.com/media-cache-ec0.pinimg.com/736x/4e/db/ef/4edbef39bc7ca7378eb266f56b71a350.jpg

43% of adults would prefer homes bigger than where they currently live, but attitudes differ by age. Baby boomers would prefer to upsize rather than downsize by only a small margin, while the gap among millennials is much wider, with GenXers falling in between. Would-be downsizers outnumber upsizers only among households living in the largest homes.

Last year, we found that Baby Boomers were especially unlikely to live in multi-unit housing. At the same time, we noted that the share of seniors living in multi-unit housing rather than single-family homes has been shrinking for decades. These findings got us thinking about how the generations vary in house-size preference. So we surveyed over 2000 people at the end of last year to figure out if boomers have different house-size preferences than their younger counterparts. And that led us to ask: What size homes do Americans really want?

Image 1

Most Americans are not living in the size home they want

https://i0.wp.com/tinyhouseblog.com/wp-content/uploads/2011/06/Rustic-guest-cottage-8.jpg

As a whole, Americans are living in a world of mismatch – only 40% of our respondents said they are living in the size home that’s ideal. Furthermore, over 43% answered that the size of their ideal residence is somewhat or much larger than their current digs. Only 16% told us that their ideal residence is smaller than their existing home. However, these overall figures mask what is going on within different generations.

It’s natural to think that baby boomers are the generation most likely to downsize.  After all, their nests are emptying and they may move when they retire.  As it turns out though, more boomers would prefer to live in a larger home than a smaller one: 21% said their ideal residence is smaller than their current home, while 26% wanted a larger home – a 5-percentage-point difference. Clearly, boomers don’t feel a massive yearn to downsize. On the contrary, just over half (53%) said they’re already living in their ideally sized home. Nonetheless, members of this generation are more likely to want to downsize than millennials and GenXers.

In fact, those younger generations want some elbow room. First, the millennials. They’re looking to move on up by a big margin: just over 60% told us their ideal residence is larger than where they live now – the largest proportion among the generations in our sample. By contrast, only a little over 13% of millennials said they’d rather have a smaller home than their existing one – which is also the smallest among the generations in our sample. The results are clear: millennials are much more likely to want to upsize than downsize.

The next generation up the ladder, the GenXers, are hitting their peak earning years and many in this group may be in a position to trade up. Many aren’t living in their ideally sized home. Just 38% said where they live now is dream sized. Nearly a majority (48%) said their dream home is larger, while only 14% of GenXers would rather have a smaller home.  This is the generation that bore the brunt of the foreclosure crisis. So, some of this mismatch could be because a significant number of GenXers lost homes during the housing bust and may now be living in smaller-than-desired quarters. But a much more probable reason is that many GenXers are in their peak child-rearing years. With kids bouncing off the walls, the place may be feeling a tad crowded.

Even the groups that seem ripe for downsizing don’t want smaller homes

Of course, age doesn’t tell the whole story about why people might want to downsize. It could be that certain kinds of households, – such as those without children, and living in the suburbs or in affordable areas – might be more likely to live in larger homes than they need. But our survey shows that households in these categories are about twice as likely to want a larger than a smaller home. For those with kids especially, the desire to upsize is strong: 39% preferred a larger home versus 18% who liked a smaller home.  For those living in the suburbs, the disparity is even greater – 42% to 16%. And even among those living in the most affordable zip codes, where ideally-sized homes might be within the budgets of households, 40% of our respondents preferred larger homes versus 20% who said smaller.

Image 2

Are all households more likely to upsize than downsize?

At this point you might be asking, “Are there any types of households that want to downsize?” The answer is yes. But only one kind of household falls into this category – those living in homes larger than 3,200 square feet.  Of this group, 26% wanted to downsize versus 25% that wanted to upsize – a slight difference. But, when we looked overall at survey responses based on the size of current residence, households wanting a larger home kicked up as current home size went down. We can see this clearly when we divide households into six groups based on the size of the home they’re living in now. Among households living in 2,600-3,200 square foot homes, 37% prefer a larger home versus 16% a smaller home; in 2,000–2,600 square foot homes, its 34% to 18%; 38% to 18% in 1,400–2,000 square foot homes; 55% to 13% in 800–1,400 square foot homes; and 66% to 13% in homes less than 800 square feet. This makes intuitive sense.  Those living in the biggest homes are most likely to have gotten a home larger than their ideal size. And those in the smallest homes are probably the ones feeling most squeezed.

Image 3 (2)

The responses to our survey show significantly more demand for larger homes than for smaller ones. But the reality, of course, is that households must make tradeoffs between things like accessibility, amenities, and affordability when choosing what size homes to get. The “ideal” sized home for most Americans may be larger than where they’re living now. But that spacious dream home may not be practical.  As result, the mismatch between what Americans say they want and what best suits their circumstances may persist.

Chart Of The Day: Recession Dead Ahead?

By Tyler Durden

The chart below showing the annual increase, or rather, decrease in US factory orders which have now declined for 6 months in a row (so no one can’t blame either the west coast port strike or the weather) pretty much speaks for itself, and also which way the US “recovery” (whose GDP is about to crash to the 1.2% where the Atlanta Fed is modeling it, or even lower is headed.

https://i0.wp.com/www.zerohedge.com/sites/default/files/images/user5/imageroot/2015/03/Factory%20Orders%20YY.jpg

As the St Louis Fed so kindly reminds us, the two previous times US manufacturing orders declined at this rate on an unadjusted (or adjusted) basis, the US economy was already in a recession.

https://i0.wp.com/www.zerohedge.com/sites/default/files/images/user5/imageroot/2015/03/fed%20recession%20NSA.jpg

And now, time for consensus to be shocked once again when the Fed yanks the rug from under the feet of the rite-hike-istas.

Texas Home Buyers Are Better Off Than National Average

by Rye Durzin

Texas homebuyers

The March 2015 Texas Home buyers and Sellers Report from the Texas Association of Realtors shows that between July 2013 and June 2014 median household income for Texas home buyers increased 5.9 percent year-over-year compared with a national increase of only 1.4 percent.

Home buyers in Texas are older, more likely to be married and make more money than the national averages, according to the March 2015 Texas Home buyers and Sellers Report from the Texas Association of Realtors.

The study shows that between July 2013 and June 2014 median household income for Texas home buyers increased 5.9 percent year-over-year compared with a national increase of only 1.4 percent. However, the percentage of first-time home buyers in Texas fell 4 points to 29 percent, compared to a 5 percent decline nationally to 33 percent.

Home buyers in Texas are also two years older compared to the previous period, edging up to 45 years of age, and 72 percent of home buyers are married, compared to 65 percent nationally.

Texans are also buying larger and newer homes than other buyers across the U.S. In Texas, the typical three-bedroom, two-bathroom home had 2,100 square feet and was built in 2002, compared to the typical national home built in 1993 with 1,870 square feet.

Forty-seven percent of first-time home buyers in Texas said that finding the right property was the most difficult step in buying a home, as did 48 percent of repeat home buyers.

For Texans selling homes, 21 percent said that the reason for selling was because of job relocation, followed by 16 percent who said that their home was too small. The median household income for a Texas home seller was $120,800, compared with a national media income of $96,700 among home sellers.

Texas home buyers (overall): July 2013 – June 2014

  • Median household income: +5.9% to $97,500
  • Percent of homes bought that were new: 28% (-1% from July 2012 – June
  • 2013)
  • Percentage of first-time home buyers: 29% (-4% from July 2012 – June
  • 2013)
  • Age of typical home buyer: 45 years old (+2 years from July 2012 – June 2013)
  • Average age of first-time home buyer: 32 years old (+1 year from July
  • 2012 – June 2013)
  • Average age of repeat home buyer: 50 years old (unchanged from July 2012 – June 2013)
  • Median household income for first-time home buyers: +5.8% to $72,000 (compared to July 2012 – June 2013)
  • Median household income for repeat home buyers: -8.9% to $97,500 (compared to July 2012 – June 2013)
  • Percent of married home buyers: 72% (+1% from July 2012 – June 2013)
  • New homes purchased: 28% (-2% from July 2012 – June 2013)
  • Median household income for home sellers: $120,800
  • Age of average home seller: 49 years

National home buyers (overall): June 2013 – July 2014

  • Median household income: +1.4% to $84,500
  • Percent of homes bought that were new: 16% (constant from July 2012 – June 2013)
  • Percentage of first-time home buyers: 33% (-5% from July 2012 – June 2013)
  • Age of typical home buyer: 44 years old (+2 years from July 2012 – June
  • 2013)
  • Average age of first-time home buyer: 31 years old (unchanged from July
  • 2012 – June 2013)
  • Average age of repeat home buyer: 53 years old (+1 year from July 2012 – June 2013)
  • Median household income for first-time home buyers: +2.3% to $68,300 (compared to July 2012 – June 2013)
  • Median household income for repeat home buyers: -1% to $95,000 (compared to July 2012 – June 2013)
  • Percent of married home buyers: 65% (-1% from July 2012 – June 2013)
  • New homes purchased: 16% (unchanged from July 2012 – June 2013)
  • Median household income for home sellers: $96,700
  • Age of average home seller: 54 years

Housing Industry Frets About the Next Brick to Drop

by Wolf Richter

Stephen Schwarzman, CEO and co-founder of Blackstone Group, the world’s largest private-equity firm with $290 billion in assets under management, made $690 million for 2014 via a mix of dividends, compensation, and fund payouts, according to a regulatory filing. A 50% raise from last year.

The PE firm’s subsidiary Invitation Homes, doped with nearly free money the Fed’s policies have made available to Wall Street, has become America’s number one mega-landlord in the span of three years by buying up 46,000 vacant single-family homes in 14 metro areas, initially at a rate of $100 million per week, now reduced to $35 million per week.

As of September 30, Invitation Homes had $8.7 billion worth of homes on its balance sheet, followed by American Homes 4 Rent ($5.5 billion), Colony Financial ($3.4 billion), and Waypoint ($2.6 billion). Those are the top four. Countless smaller investors also jumped into the fray. Together they scooped up several hundred thousand single-family houses.

A “bet on America,” is what Schwarzman called the splurge two years ago.

The bet was to buy vacant homes out of foreclosure, outbidding potential homeowners who’d actually live in them, but who were hobbled by their need for mortgages in cash-only auctions. The PE firms were initially focused only on a handful of cities. Each wave of these concentrated purchases ratcheted up the prices of all other homes through the multiplier effect.

Homeowners at the time loved it as the price of their home re-soared. The effect rippled across the country and added about $7 trillion to homeowners’ wealth since 2011, doubling equity to $14 trillion.

But it pulled the rug out from under first-time buyers. Now, only the ludicrously low Fed-engineered interest rates allow regular people – the lucky ones – to buy a home at all. The rest are renting, in a world where rents are ballooning and wages are stagnating.

Thanks to the ratchet effect, whereby each PE firm helped drive up prices for the others, the top four landlords booked a 23% gain on equity so far, with Invitation Homes alone showing $523 million in gains, according to RealtyTrac. The “bet on America” has been an awesome ride.

But now what? PE firms need to exit their investments. It’s their business model. With home prices in certain markets exceeding the crazy bubble prices of 2006, it’s a great time to cash out. RealtyTrac VP Daren Blomquist told American Banker that small batches of investor-owned properties have already started to show up in the listings, and some investors might be preparing for larger liquidations.

“It is a very big concern for real estate professionals,” he said. “They are asking what the impact will be if investors liquidate directly onto the market.”

But larger firms might not dump these houses on the market unless they have to. American Banker reported that Blackstone will likely cash out of Invitation Homes by spinning it off to the public, according to “bankers close to the Industry.”

After less than two years in this business, Ellington Management Group exited by selling its portfolio of 900 houses to American Homes 4 Rent for a 26% premium over cost, after giving up on its earlier idea of an IPO. In July, Beazer Pre-Owned Rental Homes had exited the business by selling its 1,300 houses to American Homes 4 Rent, at the time still flush with cash from its IPO a year earlier.

Such portfolio sales maintain the homes as rentals. But smaller firms are more likely to cash out by putting their houses on the market, Blomquist said. And they have already started the process.

Now the industry is fretting that liquidations by investors could unravel the easy Fed-engineered gains of the last few years. Sure, it would help first-time buyers and perhaps put a halt to the plunging home ownership rates in the US [The American Dream Dissipates at Record Pace].

But the industry wants prices to rise. Period.

When large landlords start putting thousands of homes up for sale, it could get messy. It would leave tenants scrambling to find alternatives, and some might get stranded. A forest of for-sale signs would re-pop up in the very neighborhoods that these landlords had targeted during the buying binge. Each wave of selling would have the reverse ratchet effect. And the industry’s dream of forever rising prices would be threatened.

“What kind of impact will these large investors have on our communities?” wondered Rep. Mark Takano, D-California, in an email to American Banker. He represents Riverside in the Inland Empire, east of Los Angeles. During the housing bust, home prices in the area plunged. But recently, they have re-soared to where Fitch now considers Riverside the third-most overvalued metropolitan area in the US. So Takano fretted that “large sell-offs by investors will weaken our housing recovery in the very same communities, like mine, that were decimated by the sub prime mortgage crisis.”

PE firms have tried to exit via IPOs – which kept these houses in the rental market.

Silver Bay Realty Trust went public in December 2012 at $18.50 a share. On Friday, shares closed at $16.16, down 12.6% from their IPO price.

American Residential Properties went public in May 2013 at $21 a share, a price not seen since. “Although people look at this as a new industry, there’s really nothing new about renting single-family homes,” CEO Stephen Schmitz told Bloomberg at the time. “What’s new is that it’s being aggregated, we’re introducing professional management and we’re raising institutional capital.” Shares closed at $17.34 on Friday, down 17.4% from their IPO price.

American Homes 4 Rent went public in August 2013 at $16 a share. On Friday, shares closed at $16.69, barely above their IPO price. These performances occurred during a euphoric stock market!

So exiting this “bet on America,” as Schwarzman had put it so eloquently, by selling overpriced shares to the public is getting complicated. No doubt, Blackstone, as omnipotent as it is, will be able to pull off the IPO of Invitation Homes, regardless of what kind of bath investors end up taking on it.

Lesser firms might not be so lucky. If they can’t find a buyer like American Homes 4 Rent that is publicly traded and doesn’t mind overpaying, they’ll have to exit by selling their houses into the market.

But there’s a difference between homeowners who live in their homes and investors: when homeowners sell, they usually buy another home to live in. Investors cash out of the market. This is what the industry dreads. Investors were quick to jump in and inflated prices. But if they liquidate their holdings at these high prices, regular folks might not materialize in large enough numbers to buy tens of thousands of perhaps run-down single-family homes. And then, getting out of the “bet on America” would turn into a real mess.

Chicago PMI Crashes to 5 1/2 Year Low: Production, New Orders, Backlogs Suffer Double Digit Declines

by Mike “Mish” Shedlock

Fourth quarter GDP was revised lower today to 2.2 percent from 2.6 percent previously estimated.

Looking ahead, I think we are going to see some shocking downward estimates in the months to come. Meanwhile, a shocking PMI report came out today.

Chicago PMI Crashes to 5 1/2 Year Low

ISM Chicago reports Chicago Business Barometer At 5½-Year Low

The Chicago Business Barometer plunged 13.6 points to 45.8 in February, the lowest level since July 2009 and the first time in contraction since April 2013. The sharp fall in business activity in February came as Production, New Orders, Order Backlogs and Employment all suffered double digit losses, leaving them below the 50 level which separates contraction from expansion.

New Orders suffered the largest monthly decline on record, leaving them at the lowest since June 2009. Lower order intake and output levels led to a double digit decline in Employment which last month increased markedly to a 14-month high.

Disinflationary pressures were still in evidence in February, although the slight bounce back in energy costs pushed Prices Paid to the highest since December – although still below the breakeven 50 level. Some purchasers cited weakness in some metals prices including copper and brass, but others said suppliers were slow to pass along lower prices to customers.

Commenting on the Chicago Report, Philip Uglow, Chief Economist of MNI Indicators said, “It’s difficult to reconcile the very sharp drop in the Barometer with the recent firm tone of the survey. There’s some evidence to point to special factors such as the port strike and the weather, although we’ll need to see the March data to get a better picture of underlying growth.“

Blame it on the Ports

Everyone was quick to blame this on the ports and bad weather.

But the LA port issue has been festering for months. Weren’t economists aware of the ports? Of bad weather?

The reason I ask is the Bloomberg Consensus Estimate was 58.7. The range was 55.5 to 59.6. Who predicted 59.6?

Housing Crash In China Steeper Than In Pre-Lehman America

China has long frustrated the hard-landing watchers – or any-landing watchers, for that matter – who’ve diligently put two and two together and rationally expected to be right. They see the supply glut in housing, after years of malinvestment. They see that unoccupied homes are considered a highly leveraged investment that speculators own like others own stocks, whose prices soar forever, as if by state mandate, but that regular people can’t afford to live in.

Hard-landing watchers know this can’t go on forever. Given that housing adds 15% to China’s GDP, when this housing bubble pops, the hard-landing watchers will finally be right.

Home-price inflation in China peaked 13 months ago. Since then, it has been a tough slog.

Earlier this month, the housing news from China’s National Bureau of Statistics gave observers the willies once again. New home prices in January had dropped in 69 of 70 cities by an average of 5.1% from prior year, the largest drop in the new data series going back to 2011, and beating the prior record, December’s year-over-year decline of 4.3%. It was the fifth month in a row of annual home price declines, and the ninth month in a row of monthly declines, the longest series on record.

Even in prime cities like Beijing and Shanghai, home prices dropped at an accelerating rate from December, 3.2% and 4.2% respectively.

For second-hand residential buildings, house prices fell in 67 of 70 cities over the past 12 months, topped by Mudanjiang, where they plunged nearly 14%.

True to form, the stimulus machinery has been cranked up, with the People’s Bank of China cutting reserve requirements for major banks in January, after cutting its interest rate in November. A sign that it thinks the situation is getting urgent.

So how bad is this housing bust – if this is what it turns out to be – compared to the housing bust in the US that was one of the triggers in the Global Financial Crisis?

Thomson Reuters overlaid the home price changes of the US housing bust with those of the Chinese housing bust, and found this:

The US entered recession around two years after house price inflation had peaked. After nine months of recession, Lehman Brothers collapsed. As our chart illustrates, house price inflation in China has slowed from its peak in January 2014 at least as rapidly as it did in the US.

Note the crashing orange line on the left: year-over-year home-price changes in China, out-crashing (declining at a steeper rate than) the home-price changes in the US at the time….

US-China-housing-crash

The hard-landing watchers are now wondering whether the Chinese stimulus machinery can actually accomplish anything at all, given that a tsunami of global stimulus – from negative interest rates to big bouts of QE – is already sloshing through the globalized system. And look what it is accomplishing: Stocks and bonds are soaring, commodities – a demand gauge – are crashing, and real economies are languishing.

Besides, they argue, propping up the value of unoccupied and often unfinished investment properties that most Chinese can’t even afford to live in might look good on paper, but it won’t solve the problem. And building even more of these units props up GDP nicely in the short term, and therefore it’s still being done on a massive scale, but it just makes the supply glut worse.

Sooner or later, the hard-landing watchers expect to be right. They know how to add two and two together. And they’re already smelling the sweet scent of being right this time, which, alas, they have smelled many times before.

But it does make you wonder what the China housing crash might trigger when it blooms into full maturity, considering the US housing crash helped trigger of the Global Financial Crisis. It might be a hard landing for more than just China. And ironically, it might occur during, despite, or because of the greatest stimulus wave the world has ever seen.

Stocks, of course, have been oblivious to all this and have been on a tear, not only in China, but just about everywhere except Greece. But what happens to highly valued stock markets when they collide with a recession? They crash.


What to Expect When This Stock Market Meets a Recession

Last week I had a fascinating conversation with Neile Wolfe, of Wells Fargo Advisors, LLC., about high equity valuations and what happens when they collide with a recession.

Here is my monthly update that shows the average of the four valuation indicators: Robert Shiller’s cyclically adjusted price-to-earnings ratio (CAPE), Ed Easterling’s Crestmont P/E, James Tobin’s Q Ratio, and my own monthly regression analysis of the S&P 500:

Click to View

Based on the underlying data in the chart above, Neile made some cogent observations about the historical relationships between equity valuations, recessions and market prices:

  • High valuations lead to large stock market declines during recessions.
  • During secular bull markets, modest overvaluation does not produce large stock market declines.
  • During secular bear markets, modest overvaluation still produces large stock market declines.

Here is a table that highlights some of the key points. The rows are sorted by the valuation column.

Beginning with the market peak before the epic Crash of 1929, there have been fourteen recessions as defined by the National Bureau of Economic Research (NBER). The table above l ists the recessions, the recession lengths, the valuation (as documented in the chart illustration above), the peak-to-trough changes in market price and GDP. The market price is based on the S&P Composite, an academic splicing of the S&P 500, which dates from 1957 and the S&P 90 for the earlier years (more on that splice here).

I’ve included a row for our current valuation, through the end of January, to assist us in making an assessment of potential risk of a near-term recession. The valuation that preceded the Tech Bubble tops the list and was associated with a 49.1% decline in the S&P 500. The largest decline, of course, was associated with the 43-month recession that began in 1929.

Note: Our current market valuation puts us between the two.

Here’s an interesting calculation not included in the table: Of the nine market declines associated with recessions that started with valuations above the mean, the average decline was -42.8%. Of the four declines that began with valuations below the mean, the average was -19.9% (and that doesn’t factor in the 1945 outlier recession associated with a market gain).

What are the Implications of Overvaluation for Portfolio Management?

Neile and I discussed his thoughts on the data in this table with respect to portfolio management. I came away with some key implications:

  • The S&P 500 is likely to decline severely during the next recession, and future index returns over the next 7 to 10 years are likely to be low.
  • Given this scenario, over the next 7 to 10 years a buy and hold strategy may not meet the return assumptions that many investors have for their portfolio.
  • Asset allocation in general and tactical asset allocation specifically are going to be THE important determinant of portfolio return during this time frame. Just buying and holding the S&P 500 is likely be disappointing.
  • Some market commentators argue that high long-term valuations (e.g., Shiller’s CAPE) no longer matter because accounting standards have changed and the stock market is still going up. However, the impact of elevated valuations — when it really matters — is expressed when the business cycle peaks and the next recession rolls around. Elevated valuations do not take a toll on portfolios so long as the economy is in expansion.

How Long Can Periods of Overvaluations Last?

Equity markets can stay at lofty valuation levels for a very long time. Consider the chart posted above. There are 1369 months in the series with only 58 months of valuations more than two Standard Deviations (STD) above the mean. They are:

  • September 1929 (i.e., only one month above 2 STDs prior to the Crash of 1929)
  • Fifty-one months during the Tech bubble (that’s over FOUR YEARS)
  • Six of the last seven months have been above 2 STDs

Stay tuned.

Affordable Housing Plan Slaps Fee on California Property Owners

https://texaslynn.files.wordpress.com/2010/11/california-flag-peoples-republic.jpg

by Phil Hall

The speaker of California’s State Assembly is seeking to raise new funds for affordable housing development by adding a new $75 fee to the costs of recording real estate documents.

Toni Atkins, a San Diego Democrat, stated that the new fee would be a permanent addition to the state’s line-up of fees and taxes and would apply to all real estate documents except those related to home sales. Atkins conspicuously avoided citing the $75 figure in a press statement issued by her office, only briefly identifying it as a “small fee” while insisting that she had broad support for the plan.

“The permanent funding source, which earned overwhelming support from California’s business community, will generate hundreds of millions annually for affordable housing and leverage billions of dollars more in federal, local, and bank investment,” Atkins said. “This plan will reap benefits for education, healthcare and public safety as well. The outcomes sought in other sectors improve when housing instability is addressed.”

Atkins added that her plan should add between $300 million to $720 million a year for the state’s affordable housing endeavors. But Atkins isn’t completely focused on collecting revenue: She is simultaneously proposing that developers offering low-income housing should receive $370 million in tax credits, up from the current level of $70 million.

This is the third time that a $75 real estate transaction fee has been proposed in the state legislature. Earlier efforts were put forward in 2012 and 2013, but failed to gained traction. Previously, opponents to the proposal argued that transactions involving multiple documents would be burdened with excess costs because the fee applies on a per-document basis and not a per-transaction basis.

One of the main opponents of Atkins’ proposal, Jon Coupal, president of the Howard Jarvis Taxpayers Association, told the San Francisco Chronicle that the speaker was playing word games by insisting this was merely a fee and that she was penalizing property owners to finance a problem that they did not create.

“It’s clearly a tax, not a fee,” said Coupal. “There is not a nexus between the fee payer and the public need being addressed. It’s not like charging a polluter a fee for the pollution they caused. It’s a revenue that is totally divorced from the so-called need for affordable housing.”

Gundlach: If The Fed Raises Rates By Mid-Year “The Sinister Side Of Low Oil may Raise Its Head

jeffrey gundlach

Photo by Reuters | Eduardo Munoz.  Article by by Robert Huebscher in Advisor Perspective

The Fed should reject its inclination to raise rates, according to Jeffrey Gundlach. It’s rare that he agrees with Larry Summers, but in this case the two believe that the fundamentals in the U.S. economy do not justify higher interest rates.

Gundlach, the founder and chief investment officer of Los Angeles-based Doubleline Capital, spoke to investors in a conference call on February 17. The call was focused on the release of the new DoubleLine Long Duration Fund, but Gundlach also discussed a number of developments in the economy and the bond market.

Signals of an impending rate increase have come from comments by Fed governors that the word “patient” should be dropped from the Fed meeting notes, according to Gundlach. That word has taken on special significance, he explained, since Janet Yellen attached a two-month time horizon to it.

“If they drop that word,” Gundlach said, “it would be a strong signal that rates would rise in the following two months.”

The Fed seems “philosophically” inclined to raise rates, Gundlach said, even though the fundamentals do not justify such a move. Strong disinflationary pressure coming from the collapse in oil prices should caution the Fed against raising rates, he said.

Gundlach was asked about comments by Gary Shilling that oil prices might go as low at $10/barrel. “We better all hope we don’t get $10,” he said, “because something very deflationary would be happening in this world.” If that is the case, Gundlach said investors should flock to long-term Treasury bonds.

“I’d like to think that the world is not in that kind of deflationary precipice,” he said.

Oil will break below its previous $44 low, Gundlach said. But he did not put a price target on oil.

Gundlach warned that by mid-year, if the Fed does raise rates, “the sinister side of low oil may raise its head.” At that time, lack of hiring or layoffs in the fracking industry could cripple the economy, according to Gundlach.

In the short term, Gundlach said that the recent rise in interest rates is a signal that the “huge deflationary scare” –which was partly because of Greece – has dissipated. Investors should monitor Spanish and Italian yields, he said. If they remain low, it is a signal that Greece is not leaving the Eurozone or that, if it does, “it is not a big deal.”

http://www.advisorperspectives.com/newsletters15/Gundlach_to_the_Fed.php

The War On Success Of Small Business In America

Source: Zero Hedge

This is the war on success that our government is waging. They are almost trying to make the economy worse by putting companies out of business. To Quote Jim Clifton of Gallup:

Our leadership keeps thinking that the answer to economic growth and ultimately job creation is more innovation, and we continue to invest billions in it. But an innovation is worthless until an entrepreneur creates a business model for it and turns that innovative idea in something customers will buy. Because we have misdiagnosed the cause and effect of economic growth, we have misdiagnosed the cause and effect of job creation.

For the first time in 35 years, American business deaths now outnumber business births.

Let’s get one thing clear: This economy is never truly coming back unless we reverse the birth and death trends of American businesses. It is catastrophic to be dead wrong on the biggest issue of the last 50 years — the issue of where jobs come from…when small and medium-sized businesses are dying faster than they’re being born, so is free enterprise.

And when free enterprise dies, America dies with it.

Mike Maloney explains…

Courts Confirm Fannie and Freddie Are Sovereign Credits: Report

by Jacob Passy

Recent court decisions against Fannie Mae and Freddie Mac shareholders have put to rest the notion that the two mortgage giants exist as anything but instrumentalities of the U.S. government, according to a report released Thursday by Kroll Bond Rating Agency.

Private equity investor groups recently have raised lawsuits against the Federal Housing Finance Agency, in an effort to regain control of the two entities. The failure of these legal actions points to the de facto nature of the two entities as sovereign credits, given their complete backing by the U.S. government.

The KBRA report also suggests that Fannie Mae and Freddie Mac have morphed into insurance agents rather than insurance companies, since they cannot produce the capital to bear the risk of their guarantees that the FHFA prices to begin with.

Still, the two bodies’ investors take issue with the 3rd Preferred Stock Purchase Agreement that directs all of Fannie Mae and Freddie Mac’s profits to the government, the KBRA report said.

But these investors’ suits have been unsuccessful because, in judges’ eyes, the legislation passed by Congress that saved Fannie Mae and Freddie Mac from the brink gives the U.S. Treasury and FHFA the right to manage the two companies as they see fit. But KBRA finds instead that “the 3rd PSPA simply compensates the Treasury for the capital injection made in 2008 and, more important, the open-ended support of the U.S. taxpayer.”

The report goes on to argue that these investors misinterpret the support the U.S. government lent to the two mortgage entities. Prior to the capital injection, Fannie Mae and Freddie Mac had negative net worth, meaning that Treasury’s aid only brought them to zero.

But, as the report reads, all of the profits the two make now represent therefore the return on the government’s investment, so to recapitalize Fannie Mae and Freddie Mac would essentially involve taxpayer money, which the report found “galling.”

“They are not talking about injecting any of their own cash into the companies,” KBRA writes. “If you accept the idea that the taxpayers are due a return on both the implicit and explicit capital advanced to keep the mortgage market operating, there are no earnings to be retained in the GSEs.”

The report did contend that while this may not spell out good news for the two mortgage agencies’ equity investors, it should end some of the uncertainty bond investors have faced by confirming their standing in the eyes of government.


Fannie Mae Ended 2014 on a Sour Note

by Phil Hall

Fannie Mae hit more than a few financial potholes during 2014, closing the year with significantly lower net income and comprehensive income and a stated concern that things may not get better during 2015.

The government-sponsored enterprise reported annual net income of $14.2 billion and annual comprehensive income of $14.7 billion in 2014, far below 2013’s levels of $84 billion in net income and $84.8 billion in comprehensive income.

The fourth quarter of 2014 was especially acute: Fannie Mae’s net income of $1.3 billion and comprehensive income of $1.3 billion for this period, a steep drop from the net income of $3.9 billion and comprehensive income of $4.0 billion for the third quarter. Fourth quarter net revenues were $5.5 billion, down from $6 billion for the third quarter, while fee and other income was $323 million for the fourth quarter, compared with $826 million for the third quarter. Net fair value losses were $2.5 billion in the fourth quarter, up substantially from $207 million in the third quarter.

Fannie Mae explained that its fourth quarter results were “driven by net interest income, partially offset by fair value losses on risk management derivatives due to declines in longer-term interest rates in the quarter.” Nonetheless, Fannie Mae reported a positive net worth of $3.7 billion as of Dec. 31, 2014, which resulted in a dividend obligation to the U.S. Department of the Treasury of $1.9 billion that will be paid next month.

In announcing its 2014 results, Fannie Mae offered a blunt prediction that this year will see continued disappointments.

“[Fannie Mae] expects its earnings in future years will be substantially lower than its earnings for 2014, due primarily to the company’s expectation of substantially lower income from resolution agreements, continued declines in net interest income from its retained mortgage portfolio assets, and lower credit related income,” said Fannie Mae in a press statement. “In addition, certain factors, such as changes in interest rates or home prices, could result in significant volatility in the company’s financial results from quarter to quarter or year to year. Fannie Mae’s future financial results also will be affected by a number of other factors, including: the company’s guaranty fee rates; the volume of single-family mortgage originations in the future; the size, composition, and quality of its retained mortgage portfolio and guaranty book of business; and economic and housing market conditions.”


 Default Risk Index For Agency Purchase Loans Hits Series High

by Brian Honea

Agency Loan Mortgage Default Risk

The default risk for mortgage loan originations rose in January, marking the fifth straight month-over-month increase, according to the composite National Mortgage Risk Index (NMRI) released by AEI’s International Center on Housing Risk.

In January, the NMRI for Agency purchase loans increased to a series high of 11.94 percent. That number represented an increase of 0.4 percentage points from the October through December average and a jump of 0.8 percentage points from January 2014.

“With the NMRI once again hitting a series high, the risks posed by the government’s 85 percent share of the home purchase market continue to rise,” said Stephen Oliner, co-director of AEI’s International Center on Housing Risk.

Default risk indices for Fannie Mae, FHA, and VA loans hit series highs within the composite, according to AEI. The firm attributes to the consistent monthly increases in risk indices to a substantial shift in market share from large banks to non-bank accounts, since the default risk tends to be greater on loans originated by non-bank lenders.

AEI’s study for January revealed that the volume of high debt-to-income (DTI) loans has not been reduced by the QM regulation. About 24 percent of loans over the past three months had a total DTI above 43 percent, compared to 22 percent for the same period a year earlier. The study also found that Fannie Mae and Freddie Mac were compensating to a limited extent for the riskiness of their high DTI loans.

Further, the NMRI for FHA loans in January experienced a year-over-year increase of 1.5 percentage points up to 24.41 percent – meaning that nearly one quarter of all recently guaranteed home purchase loans backed by FHA would be projected to default if they were to experience an economic shock similar to 2007-08. AEI estimates that if FHA were to adopt VA’s risk management practices, the composite index would fall to about 9 percent.

“Policy makers need to be mindful of the upward risk trends that are occurring with respect to both first-time and repeat buyers,” said Edward Pinto, co-director of AEI’s International Center on Housing Risk. “Recent policy moves by the FHA and FHFA will likely exacerbate this trend.”

AEI said the cause of the softness in mortgage lending is not tight lending standards, but rather reduced affordability, loan put back risk, and slow income growth among households.

More than 180,o00 home purchase loans were evaluated for the January results, bringing the total number of loans rated in the NMRI since December 2012 to nearly 5.5 million, according to AEI.

Study: Government’s Control of Land Is Hurting Oil Production, Job Growth

by Ben Smith

Current government regulations imposed by the Bureau of Land Management are harming energy production and holding back the U.S. economy, a new study reveals.

“While federally owned lands are also full of energy potential, a bureaucratic regulatory regime has mismanaged land use for decades,” write The Heritage Foundation’s Katie Tubb and Nicolas Loris.

The report focuses on the Federal Lands Freedom Act, introduced by Rep. Diane Black, R-Tenn., and Sen. James Inhofe, R-Okla. It is designed to empower states to regain control of their lands from the federal government in order to pursue their own energy goals. That is a challenge in an oil-rich state like Colorado.

“We need to streamline the process as there are very real consequences to poor [or nonexistent] management,” Tubb, a Heritage research associate, told The Daily Signal.

“Empowering the states is the best solution. The people who benefit have a say and can share in the benefits. If there are consequences, they can address them locally with state and local governments that are much more responsive to elections and budgets than the federal government.”

Emphasizing the need to streamline the process, Tubb pointed to the findings in the new report.

“The Bureau of Land Management estimates that it took an average of 227 days simply to complete a drill application,” Tubb said.

That’s more than the average of 154 days in 2005 and more than seven times the state average of 30 days, according to the report.

The report blames this increase in the application process on the drop in drilling on federal lands.

“Since 2009,” Tubb and Loris write, “oil production on federal lands has fallen by nine percent, even as production on state and private lands has increased by 61 percent over the same period.”

Despite almost “43 percent of crude oil coming from federal lands,” government-owned lands have seen a 13-point drop in oil production, from 36 percent to 23 percent.

The report also examines the recent oil-related job boom.

“Job creation in the oil and gas industry bucked the slow economic recovery and grew by 40 percent from 2007 to 2012, in comparison to one percent in the private sector over the same period,” according to the report.

That boom has had a big impact on jobs.

Map: John Fleming

“Energy-abundant states like Colorado and Alaska would stand to benefit tremendously. We’ve seen oil and natural gas production increase substantially in Colorado over the past eight years, bringing jobs and economic activity to the state,” said Loris, an economist who is Heritage’s Herbert and Joyce Morgan fellow.

Tubb cautioned that any change will happen slowly. “The federal government likely will not release the land that easily.”

Loris agreed, noting the long-running debate about the Arctic National Wildlife Refuge.

“It was no surprise that the Alaskan delegation was up in arms when the administration proposed to permanently put ANWR off limits to energy exploration,” Loris told The Daily Signal. “Many in the Alaskan delegation and Alaskan natives, including village of Kaktovik—the only town in the coastal plain of ANWR, support energy development.”

“We are putting power to the people,” Tubb concluded.

A Raw Deal for Real-Estate Agents

Real estate can be risky for agents themselves. Fickle buyers, unforeseen structural issues, setbacks in financing can all scuttle a deal.

THE COMMITMENT-PHOBE Known for repeatedly pulling out of the purchase right before the contract is signed. Illustration: Laszlito Kovacs

By Nancy Keates | Wall Street Journal, Feb. 19, 2015

She saw a ghost. That was the excuse, anyway, for one buyer’s decision to back out at the last minute from closing on a $1.4 million house in San Francisco, losing a roughly $21,000 deposit in the process.

Her real-estate agent, Amanda Jones of Sotheby’s International Realty, estimates she spent about 250 hours over six months showing the prospective buyer about 130 houses in the Bay Area. In the end, she believes the woman just changed her mind. “It was horrible,” the agent says.

Few professions demand as much upfront time and legwork with the risk of zero return on the effort as real-estate sales. Fickle buyers, unforeseen structural issues, setbacks in financing can all scuttle a sale. Now, there’s another common deal breaker: an overheated housing market in which frenzied bidding wars lead to rash decisions—followed by buyers’ remorse.

“It’s such a fast-paced market right now. Buyers are expected to make offers after seeing a place once at a packed house, so they don’t have time to think things through,” says Kaitlin Adams, an agent with New York-based Compass.

THE NERVOUS NELLIE Spends countless hours to find the perfect home, but backs out at the last minute, saying it just doesn’t ‘feel right.

Nationally, median home prices in 2014 rose to their highest level since 2007, while housing inventory continued to drop—falling 0.5% lower than a year ago, according to the National Association of Realtors. The percentage of buyers backing out of contracts has gone up by about 8%—to 19.1% in the third quarter of 2014 from 17.76% in the third quarter of 2012, according to Evercore ISI, an investment-banking advisory firm.

The war stories come mostly at the high end in select markets, where affluent buyers are less affected by the prospect of losing thousands in earnest money or down payments. Cormac O’Herlihy of Sotheby’s International Realty in Los Angeles recently had buyers he calls “nervous nellies” back out on a $6 million house. “They enjoy an overabundance of financial ability,” Mr. O’Herlihy says.

Julie Zelman, a New York-based agent with Engel & Völkers, spent the past year searching for an apartment for a recently divorced client in his 40s who said he wanted to move from Manhattan’s Upper East Side to a building downtown—preferably one populated by celebrities. Twice the client was about to close when he changed his mind: The first time was at a building called Soho Mews—he’d read it was the home of an Oscar-nominated actress and a Grammy-winning musician. The man offered $2.8 million for a two-bedroom unit but then backed out. Another time, he walked away after offering $3.1 million on a two-bedroom unit in 1 Morton Square, where a popular TV actress once lived.

“He was wasting everyone’s time. It was humiliating for me,” says Ms. Zelman, who thinks the client wasn’t mentally ready for such a big change. The client ended up renting an apartment on the Upper East Side.

THE FAULT FINDER Cites microscopic flaws to quash the deal—and get the earnest money back.

When buyers change their minds before signing a contract, they don’t lose any money. Nataly Rothschild, a New York-based broker, says she thought she had finally closed a deal after a couple’s yearlong house hunt. Because there were five other offers pending, her clients offered $200,000 over the almost $2 million asking price on the three-bedroom, three-bathroom listed for $1.8 million on Manhattan’s Upper East Side. Then Ms. Rothschild, an agent at Engel & Völkers, got a call from the couple’s attorney saying the buyer, who was nine months pregnant, had broken down in tears, saying she just couldn’t sign because it didn’t feel right. “I felt miserable for her,” says Ms. Rothschild. “But we were all shocked.”

Buyers who change their minds after signing a contract typically lose their earnest money, a deposit that shows the offer was made in good faith. That money is often held by the title company or in an escrow account and later applied to down payment and closing costs. If the deal falls through, whoever holds the deposit determines who gets the earnest money. In standard contracts, the earnest money goes to the seller. If, however, a contingency spelled out in the contract emerges—the buyer’s financing falls through, for example—the buyer usually gets the earnest money back.

Vivian Ducat, an agent with Halstead Property in New York, had a client lose $55,000 in earnest money after a change of heart on a $550,000 co-op. The woman, who was living in California, had wanted to buy a place in New York because one of her children was living there. At the last minute she balked, emailing that she “couldn’t handle the New York lifestyle.” She’d signed the contract and even filled out all the paperwork for the co-op board.

THE OVER BIDDER. Gets caught up in the frenzy of the bidding war, then realizes he didn’t mean to spend so much.

In rare instances, buyers can get their earnest money back through arbitration if they can prove a valid cause. Ms. Adams, the Compass agent, represented the sellers of a one-bedroom apartment in Brooklyn Heights that was listed for just under $600,000. When a bidding war with five offers ensued, the unit went for $70,000 above asking price to a couple from the West Coast who wanted to use it as a part-time residence. After the contract was signed, the building’s co-op board enacted a new rule that owners had to live in the building full time. As a result, the West Coast couple got their earnest money back, and the unit sold to another buyer at about $80,000 above the asking price.

Even if the real reason is simply buyer’s remorse, real-estate agents say buyers can get back earnest money as long as they can find some valid-sounding reason for dissatisfaction. Ms. Jones in San Francisco had clients withdraw an offer on a $1.1 million house. They’d been looking for two years and when the house came up the wife was traveling abroad; the husband said he was sure she would love it. Turns out the wife didn’t like it at all. The couple used the excuse of a leak found in the inspection process and got their $33,000 deposit back.

And about that ghost. A buyer who put down $43,000 in earnest money pulled out after a neighbor told them the previous owner had died in the home, among other things. The matter went into arbitration, and the potential buyer got the entire deposit back.

Ever since then, Ms. Jones says she has sellers disclose in their contracts the possibility that there might be a ghost. “You have to prepare for anything,” she says.

How The Baltic Dry Index Predicted 3 Market Crashes: Will It Do It Again?

Summary

  • The BDI as a precursor to three different stock market corrections.
  • Is it really causation or is it correlation?
  • A look at the current level of the index as it hits new lows.
 by Jonathan Fishman

The Baltic Dry Index, usually referred to as the BDI, is making historical lows in recent weeks, almost every week.

The index is a composition of four sub-indexes that follow shipping freight rates. Each of the four sub-indexes follows a different ship size category and the BDI mixes them all together to get a sense of global shipping freight rates.

The index follows dry bulk shipping rates, which represent the trade of various raw materials: iron, cement, copper, etc.

The main argument for looking at the Baltic Dry Index as an economic indicator is that end demand for those raw materials is tightly tied to economic activity. If demand for those raw materials is weak, one of the first places that will be evident is in shipping prices.

The supply of ships is not very flexible, so changes to the index are more likely to be caused by changes in demand.

Let’s first look at the three cases where the Baltic Dry Index predicted a stock market crash, as well as a recession.

1986 – The Baltic Dry Index Hits Its first All-time Low.

In late 1986, the newly formed BDI (which replaced an older index) hit its first all-time low.

Other than predicting the late 80s-early 90s recession itself, the index was a precursor to the 1987 stock market crash.

(click to enlarge)

1999 – The Baltic Dry Index Takes a Dive

In 1999, the BDI hit a 12-year low. After a short recovery, it almost hit that low point again two years later. The index was predicting the recession of the early 2000s and the dot-com market crash.

(click to enlarge)

2008 – The Sharpest Decline in The History of the BDI

In 2008, the BDI almost hit its all-time low from 1986 in a free fall from around 11,000 points to around 780.

(click to enlarge)

You already know what happened next. The 2008 stock market crash and a long recession that many parts of the global economy is still trying to get out of.

Is It Real Causation?

One of the pitfalls that affects many investors is to confuse correlation and causation. Just because two metrics seem to behave in a certain relationship, doesn’t tell us if A caused B or vice versa.

When trying to navigate your portfolio ahead, correctly making the distinction between causation and correlation is crucial.

Without doing so, you can find yourself selling when there is no reason to, or buying when you should be selling.

So let’s think critically about the BDI.

Is it the BDI itself that predicts stock market crashes? Is it a magical omen of things to come?

My view is that no. The BDI is not sufficient to determine if a stock market crash is coming or not. That said, the index does tells us many important things about the global economy.

Each and every time the BDI hit its lows, it predicted a real-world recession. That is no surprise as the index follows a fundamental precursor, which is shipping rates. It’s very intuitive; as manufacturers see demand for end products start to slow down, they start to wind-down production and inventory, which immediately affects their orders for raw materials.

Manufacturers are the ultimate indicator to follow, because they are the ones that see end demand most closely and have the best sense of where it’s going.

But does an economic slowdown necessarily bring about a full-blown market crash?

Only if the stock market valuation is not reflecting that coming economic downturn. When these two conditions align, chances are a sharp market correction is around the corner.

2010-2015 – The BDI Hits All-time Low, Again

In recent weeks, the BDI has hit an all-time low that is even lower than the 1986 low point. That comes after a few years of depressed prices.

(click to enlarge)

Source: Bloomberg

What does that tell us?

  1. The global economy, excluding the U.S., is still struggling. Numerous signs for that are the strengthening dollar, the crisis in Russia and Eastern Europe, a slowdown in China, and new uncertainties concerning Greece.
  2. The U.S. is almost the sole bright spot in the landscape of the global economy, although it’s starting to be affected by the global turmoil. A strong dollar hits exporters and lower oil prices hit the American oil industry hard.

Looking at stock prices, we are at the peak of a 6-year long bull market, although earnings seem to be at all-time highs as well.

(click to enlarge)

Source: Yardeni

What the BDI might tell us is that the disconnect between the global economy’s struggle and great American business performance across the board might be coming to an end.

More than that, China could be a significant reason for why the index has taken such a dive, as serious slowdowns on the real-estate market in China and tremendous real estate inventory accumulation are disrupting the imports of steel, cement and other raw materials.

Conclusion

The BDI tells us that a global economic slowdown is well underway. The source of that downturn seems to be outside of the U.S., and is more concentrated in China and the E.U.

The performance of the U.S. economy can’t be disconnected from the global economy for too long.

The BDI is a precursor for recessions, not stock market crashes. It’s not a sufficient condition to base a decision upon, but it’s one you can’t afford to ignore.

Going forward, this is a time to make sure you know the companies you invest in inside and out, and make sure end demand for their products is bound for continued growth and success despite overall headwinds.

HSBC Bank: Secret Origins To Laundering The World’s Drug Money

https://i0.wp.com/i1.tribune.com.pk/wp-content/uploads/2010/12/dollar-640x480.jpg
by GreatGameIndia

#SwissLeaks what the media has termed it is a trove of secret documents from HSBC’s Swiss private banking arm that reveals names of account holders and their balances for the year 2006-07. They come from over 200 countries, the total balance over $100 billion. But nowhere has the HSBC Swiss list touched off a more raging political debate than in India.

That’s why to obtain and investigate the Indian names, The Indian Express partnered in a three-month-long global project with the Washington-based International Consortium of Investigative Journalists (ICIJ) and the Paris-based Le Monde newspaper. The investigation revealed 1,195 Indian HSBC clients, roughly double the 628 names that French authorities gave to the Government in 2011. The new revelation— published as part of a global agreement — is expected to significantly widen the scale and scope of the ongoing probe by the Special Investigation Team (SIT) appointed by the Supreme Court.

For years, when banks have been caught laundering drug money, they have claimed that they did not know, that they were but victims of sneaky drug dealers and a few corrupt employees. Nothing could be further from the truth. The truth is that a considerable portion of the global banking system is explicitly dedicated to handling the enormous volume of cash produced daily by dope traffickers.

Contrary to popular opinion, it is not “demand” from the world’s population which creates the mind destroying drug trade. Rather, it is the world financial oligarchy, looking for massive profits and the destruction of the minds of the population it is determined to dominate, which organized the drug trade. The case of HSBC underscores that point. Serving as the central bank of this global apparatus, is HSBC.

East India Company Origins

The opium trade began in the early 1700s as an official monopoly of the British East India Company, which conquered India, and ran it on behalf of the British Crown and the financiers operating through the City of London. Indian-grown opium became a key component in the trade for tea and silk in China.  The East India Company had a thriving business selling British textiles and other manufactured products in India, and selling Chinese silk and tea in Britain. But the Company ran into problems with the opium end of the trade. The influx of opium caused major problems for China, and led the Emperor to issue an edict in 1729 prohibiting opium consumption. Then, in 1757, the Emperor restricted all foreigners and foreign vessels to a trading area in the port city of Canton. A stronger edict in 1799 prohibited the importation and use of opium under penalty of death.

None of this stopped the British from continuing to flood China with opium, creating millions of addicts, but it did cause the East India Company to protect its tea and silk trade by shifting its Chinese opium operations to nominally independent drug runners who bought opium legally from the East India Company in Calcutta, and smuggled it into China. The most prominent of these drug-running firms was Jardine Matheson & Co. It was founded in 1832 by two Scotsmen, William Jardine and James Matheson.  Jardine had been a ship’s surgeon with the East India Company, while Matheson was the son of a Scottish baronet. The firm today is controlled by the Keswick family. In 1839, the Chinese Emperor launched an anti-opium offensive, which included the confiscation of all opium stocks in the hands of Chinese and foreign merchants. The merchants put up a fight, but were ultimately forced to concede, turning in their opium stocks after being indemnified against losses by British officials.

In response, however, the British launched a propaganda campaign against China, accusing it of violating Britain’s right to “free trade.” Britain sent its fleet to China, to force the Chinese to capitulate to the opium trade. The action, known as the First Opium War, resulted in the Treaty of Nanking in 1842, under which China not only capitulated to the opium trade, but also agreed to pay reparations to the opium runners and gave the British control of the island of Hong Kong. However, the treaty did not specifically legalize opium, so the British launched a second Opium War, which resulted in the 1856 Treaty of Tientsin, which legitimized the opium trade and opened China up to foreigners even more.

As the opium and other trade with China expanded, Britain’s new territory of Hong Kong became a major imperial commercial center. The opium dealers gathered together to form a bank, the Hongkong and Shanghai Bank, as the financial flagship of the British opium trade. Over time, the bank—now known as HSBC—would extend its reach into the drug fields of the Middle East and Ibero-America, as befitting its role as the financial kingpin of Dope, Inc.

https://www.princeton.edu/~ina/images/data/drugs/trafficking.jpg

Role of Secret Societies

In 1783 Lord Shelbourne launched the Chinese opium trade with Scottish merchants from the East India Company and members of the House of Windsor-allied Knights of St. John Jerusalem.

Shelbourne’s chief propagandist was Adam Smith who worked for East India Company, which emerged from the slave-trading Levant Company and later became known as Chatham House, home to the powerful Royal Institute for International Affairs (RIIA). In 1776 the high seas pirate Adam Smith wrote Wealth of Nations, which became the bible of international capitalism.

In the Far East the British organized the Chinese Triad Society, also known as the Society of Heaven and Earth, to smuggle their opium.  Beginning in 1788 the Freemason Grand Lodge of England established lodges in China, one of which was the Triad Society.  Another was known as the Order of the Swastika.

In 1839 William Jardine- a Canton-based opium trafficker- steered Britain into the first Opium War after Chinese officials confiscated his stash. The second Opium War lasted from 1858-1860.  Lord Palmerston commanded both expeditions for the Brits.  He was also the High Priest of Scottish Rite Freemasonry in the British Empire.

Throughout the 19th century the British families of Matheson, Keswick, Swire, Dent, Inchcape, Baring and Rothschild controlled the Chinese heroin traffic.  The Inchcape’s and Baring’s Peninsular & Orient Steam Navigation Company (PONC) transported the dope around the world.

To the US West Coast, the families brought Chinese coolies to build JP Morgan’s railroads, slave laborers who were kidnapped (shanghaied) by the Triads.  The Triads came along too, setting up opium dens in San Francisco and Vancouver and using a network of Chinatowns as a channel for heroin.  This network exists today.  To the US East Coast the families brought African slaves and cotton.  These same families built plantations and became kings of southern cotton on the backs of shanghaied Africans.

The American families Perkins, Astor and Forbes made millions off the opium trade.  The Perkins’ founded Bank of Boston, which is today known as Credit Suisse First Boston.  The Perkins and Morgan families endowed Harvard University.  William Hathaway Forbes was a director at Hong Kong Shanghai Bank shortly after it was founded in 1866.  John Murray Forbes was the US agent for the Barings banking family, which financed most of the early drug trade.  The Forbes family heirs later launched Forbes magazine. Steve Forbes ran for President in 1996.  John Jacob Astor invested his opium proceeds in Manhattan real estate and worked for British intelligence.  The Astor family home in London sits opposite Chatham House.

These families launched the Hong Kong Shanghai Bank Corporation (HSBC) after the second Opium War as a repository for their opium proceeds.  HSBC, a subsidiary of the London-based HSBC Holdings, today prints 75% of Hong Kong’s currency, while the British Cecil Rhodes-founded Standard Chartered Bank prints the rest.  HSBC’s Hong Kong headquarters sits next to a massive Masonic Temple.

Freemasonry is a highly secretive society, making it an ideal vehicle for global drugs and arms trafficking.  According to 33rd Degree Mason Manly Hall, “Freemasonry is a fraternity within a fraternity – an outer organization concealing an inner brotherhood of the elect…the one visible and the other invisible.  The visible society is a splendid camaraderie of ‘free and accepted’ men enjoined to devote themselves to ethical, educational, fraternal, patriotic and humanitarian concerns.  The invisible society is a secret and most august fraternity whose members are dedicated to the service of an arcanum arcandrum (sacred secret).”

Wealth derived from selling this Chinese opium during British colonial rule, helped build many landmarks on India’s west coast. The Mahim Causeway, The Sir JJ School of Art, David Sassoon Library and Flora Fountain, landmarks in modern Mumbai, were built by prominent Parsi and Jewish traders from profits made by a flourishing opium and later cotton trade with China.

Prominent families from Mumbai’s past, names that adorn today’s famous institutions such as the Wadia’s, Tata’s, Jejeebhoy’s, Readymoney’s, Cama’s and Sassoon’s sold opium to China through the British. By the end of the nineteenth century, when the opium trade went bust, cotton from India’s western state of Gujarat, which had already developed strong trade links with Canton profited. The Paris’s ploughed profits from the trade with the Chinese back into India, setting up several schools, hospitals and banks. Historical records prove that some of India’s prominent Parsi traders at the time, were founders of the Hong Kong and Shanghai Banking Corporation (HSBC) founded in 1865. For a detailed report read Rothschild colonization of India.

It is this deadly opium empire that Gandhiji was very much conscious about and spoke out against for which he was jailed in 1921 by India’s British rulers for “undermining the revenue”. Having seen generations of Chinese youths rendered docile and passive Gandhijis was concerned over opium and its deadly effects on India which is clear from his letters. These opium production activities ran until 1924 in India and were stopped with the heroic efforts of Mahatma Gandhi who first agitated to remove opium production from India and destruction of China using Indian soil. Finally the British transferred the entire production to Afghanistan in 1924 handing the production to southern Afghani tribals which after 90 years became the golden crescent of opium production. Though the production is in the hands of Afghan tribals the distribution finance market control is still exercised by the same old British business houses or their proxies.

Afghan Opium for Bankers and Terrorists

There is a general impression that Afghanistan has always been the center of opium production. In fact, it has not. Prior to the Soviet invasion in 1979, opium production in Afghanistan was less than 1,000 tons; that grew to 8,200 tons (based on conservative UN Office on Drugs and Crime/UNODC figures) in 2008. Throughout this period, Afghanistan was in a state of war. Following the Soviet invasion, the anti-Soviet powers, particularly, the US, UK, and Saudi Arabia, began generating larger amounts of drug money to finance much of the war to defeat the Soviets. Since 1989, after the Soviet withdrawal, there has been an all-out civil war in Afghanistan, as the US-UK-Saudi-created mujahideen dipped further into the opium/heroin money.

What was happening in Afghanistan during this period that caused opium production to soar to those levels? History shows that the US invasion in 2001 came close to wiping out the Taliban forces; the Afghan people, at least at that point in time, because of the Pakistani-Saudi links to the Taliban and the oppressive nature of the Wahhabi-indoctrinated regime, supported the invading American and NATO forces. That began to change in 2005.

The year 2005 is important in this context, since one of the most damning parts of the US Senate report details HSBC’s relationship with the Saudi-based Al Rajhi Bank, a member of Osama bin Laden’s “Golden Chain” of important al-Qaeda financiers. The HSBC-Al Rajhi relationship has spanned decades; perhaps that is why, even when HSBC’s own internal compliance offices asked that it be terminated in 2005, and even when the US government discovered hard evidence of Al Rajhi’s relationship with terrorism, HSBC continued to do business with the bank until 2010.

In fact, the report said, Al Rajhi’s links to terrorism were confirmed in 2002, when US agents searched the offices of a Saudi non-profit US-designated terrorist organization, Benevolence International Foundation. In that raid, agents uncovered a CD-ROM listing the names of financiers in bin Laden’s Golden Chain. One of those names was Sulaiman bin Abdul Aziz Al Rajhi, a founder of Al Rajhi bank.

Recently an operation by German Customs official revealed that the British Queen financed Osama Bin Laden. German officials in an operation raided two containers passing through Hamburg Port and seized 14,000 documents establishing that Osama bin Laden was funded by UK Queen’s bank Coutts, which is part of the Royal Bank of Scotland.

HSBC & 26/11 Mumbai Attacks

Why did HSBC not terminate its links with the Al Rajhi in 2005? The answer lies in what was then put in place in Afghanistan to generate large amounts of cash. When it comes to opium/ heroin and offshore banks, Britain rules supreme. In 2005, poppy fields in southern Afghanistan began to bloom, and it became evident to the bankers and the geo-politicians of Britain and the US that cash to support the financial centers and the terrorists could be made right there.

It was announced on Jan. 27, 2006 in the British Parliament that a NATO International Security Assistance Force (ISAF) would be replacing the US troops in Helmand province as part of Operation Herrick. The British 16 Air Assault Brigade would make up the core of the force. British bases were then located in the districts of Sangin, Lashkar Gah, and Gereshk.

As of Summer 2006, Helmand was one of the provinces involved in Operation Mountain Thrust, a combined NATO/Afghan mission targeted at Taliban fighters in the south of the country. In July 2006, the offensive essentially stalled in Helmand, as NATO (primarily British) and Afghan troops were forced to take increasingly defensive positions under heavy insurgent pressure. In response, British troop levels in the province were increased, and new encampments were established in Sangin and Gereshk. In Autumn 2006, some 8,000 British troops began to reach “cessation of hostilities” agreements with local Taliban forces around the district centers where they had been stationed earlier in the Summer, and it is then that drug-money laundering began in earnest.

This drug money, at least a good part of it, is generated in this area with the help of Dawood Ibrahim, who also played a role in helping the Mumbai attackers by giving them the use of his existing network in Mumbai. At the time, Ibrahim worked on behalf of the British, and ran his operation through the British-controlled emirate of Dubai. Drugs came into Dubai through Dawood’s “mules,” protected by the Pakistani ISI and British MI6; the dope was shipped in containers which carried equipment sent there for “repair” from Kandahar and elsewhere in southern Afghanistan. British troops controlled Helmand province, where 53% of Afghanistan’s gargantuan 8,200 tons of opium was produced in 2007.

The drugs were converted, and still are today, to cash in Dubai, where Dawood maintains a palatial mansion, similar to the one he maintains in Karachi. Dubai is a tax-free island-city, and a major offshore banking center. The most common reason for opening an offshore bank account is the flexibility that comes with it.

With the development of the Dubai International Financial Centre (DIFC), which is the latest free-trade zone to be set up there, flexible and unrestricted offshore banking has become big business. Many of the world’s largest banks already have significant presence in Dubai – big names such as Abbey National Offshore, HSBC Offshore, ABN Amro, ANZ Grindlays, Banque Paribas, Banque de Caire, Barclays, Dresdner, and Merrill Lynch, all have offices in the Emirate already.

In addition to Dubai, most of the offshore banks are located in former British colonies, and all of them are involved in money laundering. In other words, the legitimization of cash generated from drug sales and other smuggled illegitimate goods into the “respectable banks” is the modus operandi of these offshore banks. The drugs that Dawood’s mules carry are providing a necessary service for the global financial system, as well as for the terrorists who are killing innocents all over the world.

In December of 2007, this Britain-run drug-money-laundering and terrorist-networking operation was about to be exposed when Afghan President Hamid Karzai learned that two British MI6 agents were working under the cover of the United Nations and the European Union behind his back, to finance and negotiate with the Taliban. He expelled them from Afghanistan. One of them, a Briton, Michael Semple, was the acting head of the EU mission in Afghanistan and is widely known as a close confidant of Britain’s Ambassador, Sir Sherard Cowper-Coles. Semple now masquerades as an academic analyst of Afghanistan, and was associated with the Harvard Kennedy School’s Carr Center. The second man, an Irishman, Mervin Patterson, was the third-ranking UN official in Afghanistan at the time that he was summarily expelled.

These MI6 agents were entrusted by London with the task of using Britain’s 7,700 troops in the opium-infested, Pushtun-dominated, southern province of Helmand to train 2,000 Afghan militants, ostensibly to “infiltrate” the enemy and “seek intelligence” about the lethal arms of the real Taliban. Karzai rightly saw it as Britain’s efforts to develop a lethal group within Afghanistan, a new crop of terrorists.

The drug money thus generated to fund the financial centers and terrorists through HSBC was also responsible for ongoing terrorist attacks that have destabilized most of South Asia. The most important of these was the massive attack on Mumbai.

The mode used to launder such drug money is through diamonds. A 2003 Report assessed various alternative financing mechanisms that could be used to facilitate money laundering and or terrorist financing. Trading in commodities, remittance systems, and currency were assessed on each of their abilities to earn, be moved, and store value. Diamonds were the only alternative financial device that fit into all of these assessment criteria.

Diamonds can be vulnerable for misuse for money laundering and terrorist financing purposes because they can transfer value and ownership quickly, often, with a minimal audit trail. They provide flexibility and an easy transportation of value.

Top diamond traders of the country, several of whom are now settled abroad, figure on what the media calls as the #SwissList, with mostly Mumbai addresses given. Many persons on the list are Gujarati diamond merchants with offices all over world having roots in Palanpur.

However their involvement in not just limited to money laundering. Almost 6 months before 26/11 2008 Mumbai Attacks the Financial Intelligence Unit of India (FIU-IND) (the central national agency responsible for receiving, processing, analyzing and disseminating information relating to suspect financial transactions) was already tracking the diamond industry for suspicious activities by terrorists.

“A year ago, some people from Mumbai began purchasing diamonds worth crores of rupees. When the industry tried to trace the traders, they turned out to be non-existent,” said Vanani.

The FIU traced all foreign transactions of Surat’s diamond industry, especially those emanating from Belgium. It found that a great deal of money was being invested by terrorist groups.

However in May 2014 eight of these Belgium based diamond dealers were given a clean chit by the Income Tax department in the black money case. The I-T department said a probe was initiated against the eight individuals, but there was no proof of tax evasion by them. Why is the Government reluctant in disclosing Black Money related data; be it NDA and even UPA before it ? For a detailed report on the issue read 26/11 – The Black Money Trail.

From the Far East to the Middle East to Ibero-America to India, everywhere the drug trade is flourishing, you will find HSBC. It may not handle the dope, but it does handle the money, making sure that the “citizens above suspicion” who run the empire get their cut of the proceeds.  Now HSBC has been caught red-handed laundering money in the U.S., India, China, Argentina almost everywhere the sun shined through the colonies. This is a bank which has abused us, assaulted our people, and violated the law with abandon. Isn’t it time we set an example and revoke its charter to do business here in India ?


HSBC Whistle Blower Spills Lynch Evidence To Senate

by Jerome Corsi | WMDcapitol


NEW YORK – The Senate Judiciary Committee on Wednesday conducted a two-hour session with HSBC whistle blower John Cruz in its investigation of attorney general nominee Loretta Lynch’s role in the Obama administration’s decision not to prosecute the banking giant for laundering funds for Mexican drug cartels and Middle Eastern terrorists, WND sources have confirmed.

WND was first to report in a series of articles beginning in 2012 charges by Cruz, a former HSBC vice president and relationship manager, based on his more than 1,000 pages of evidence and secret audio recordings.

The staff of the Senate Judiciary Committee focused Wednesday on Cruz’s allegations, first reported by WND Feb. 6, that Lynch, acting then in her capacity as the U.S. attorney for the Eastern District of New York, engaged in a Department of Justice cover-up. Obama’s attorney general nominee allowed HSBC to enter into a “deferred prosecution” settlement in which the bank agreed to pay a $1.9 billion fine and admit “willful criminal conduct” in exchange for dropping criminal investigations and prosecutions of HSBC directors or employees.

On Feb. 12, the Senate Judiciary Committee announced Chairman Sen. Chuck Grassley, R-Iowa, had decided to postpone the Senate vote on Lynch’s confirmation until the last week of February, when Congress returns from the Presidents Day recess. The decision is widely attributed to allowing Vitter and the Senate Judiciary Committee staff time to pursue the allegations concerning Lynch’s role in the HSBC scandal.

Read the explosive backstory inside the HSBC scandal – how WND first exposed the massive money-laundering scheme, the fallout from the eye-popping discovery and the role Loretta Lynch played in “Launder-gate.”

Cruz called the $1.9 billion HSBC fine “a joke,” explaining to WND that HSBC bank auditors had told him in 2009 that senior managers and compliance officers in New York were fully aware the London-headquartered bank was engaged in a criminal scheme to launder money internationally for Mexican drug cartels and Middle Eastern terrorists.

“The auditors warned me investigating the money laundering could cost me my job,” Cruz said. “The auditors told me in 2009 that nobody in the bank was going to go to jail and that HSBC had already put aside $2 billion in reserves to pay the fine they somehow had reason to suspect back then that the Department of Justice would demand to settle the case.”

Cruz argued that a $1.9 billion fine of an international bank the size of Hong Kong Shanghai Bank, the official name of HSBC, amounted to no more than “a few days operating profit.” He described it as “a cost of doing business” once HSBC had decided to launder money for international criminals.

Senate investigators to hear HSBC recordings

Confidential sources in Washington confirmed to WND that Jason Foster, the chief investigative counsel at the Senate Judiciary Committee, was directing the investigation into Cruz’s allegations against Lynch.

Cruz’s charges and documentation were brought to Sen. David Vitter, R-La., a member of the Senate Judiciary Committee, before the senator announced Feb. 11 that he was opening his own investigation of Lynch.

Like the reporting you see here? Sign up for free news alerts from WND.com, America’s independent news network.

Foster is considered on Capitol Hill to be one of the Senate’s best, most experienced investigators. A graduate of Georgetown University Law Center, he had more than 15 years experience directing fact-finding inquiries for the Senate Committee on Finance, Senate Homeland Security Committee and the House Committee on Government Reform, before becoming chief investigative counsel for the Senate Judiciary Committee in January 2011.

The Senate Judiciary Committee’s staff questioning of Cruz and his attorney focused on approximately 1,000 pages of HSBC customer account records that Cruz turned over to WND early in 2012. The records were pulled from the HSBC computer system before he was fired by HSBC senior management who didn’t want to investigate his claim to have discovered illegal money-laundering activity at the bank.

As WND reported in a series of articles beginning Feb. 1, 2012, Cruz was able to document a complex criminal scheme that involved wiring billions of dollars of money for Mexican drug cartels and Middle Eastern terrorists thorough thousands of bogus accounts created through identity theft. The scheme used the names and Social Security numbers of hundreds of unsuspecting current and former customers. It allegedly had the active participation of regional bank managers, branch managers and employees, as well as bank compliance officials at hundreds of HSBC locations throughout the nation. The money ultimately was wired by the bank to undisclosed bank accounts internationally.

Foster, on behalf of the Senate Judiciary Committee, has requested that Cruz to submit some 70 hours of conversations Cruz secretly recorded of bank management and compliance officers in New York. He also recorded his conversations with law-enforcement authorities, including the Suffolk County District Attorney’s office, the Department of Homeland Security and the IRS.

Cruz played for WND an audio recording he made of a phone call he placed to Jeremy Scileppi, the bureau chief at the office of the Suffolk County district attorney June 25, 2012. Scileppi told Cruz Suffolk County did not want to duplicate other investigations of HSBC money-laundering allegations.

Scileppi explained the Suffolk district attorney had turned over Cruz’s documentation to HSBC security personnel, “so the bank could conduct their own internal investigation,” as well as to the Brooklyn district attorney’s office and to the FBI, a division of the Department of Justice, as is the U.S. attorney’s office for the Eastern District of New York.

“We generally back off the investigation if the FBI or another federal agency is involved,” Scileppi explained. The way it works is that we don’t want two different agencies to chase the same squirrel up the same tree from two different sides, because, then, nobody gets the squirrel. The FBI told us to back off because they were working the HSBC money-laundering investigation.”

Cruz: ‘DHS stonewalled’

One day after WND’s first article on the HSBC money-laundering scandal was published in February 2012, WND received an email from Sgt. Frank J. DiGregorio, a DHS employee in New York.

“I have read your article in WND pertaining to the allegations by John Cruz against HSBC Bank. As a supervisor for Homeland Securities Investigators, I would very much like the opportunity to meet with Mr. Cruz and speak with him,” DiGregario said.

On Feb. 7, 2012, WND attended a meeting with DiGregorio and Graham R. Klein, special agent for the Department of Homeland Security, in an office building on Manhattan’s lower east side that bore no DHS designation, with Cruz attending by telephone.

With Cruz’s approval, WND handed over to DHS all the written documentation and audio recordings Cruz had provided, offering with Cruz’s permission to assist in the investigation in any way possible.

In a meeting lasting over an hour that Cruz audio-recorded without WND’s knowledge, DiGregorio and Klein promised to investigate the evidence and allegations Cruz had presented.

“This is an ongoing investigation,” DiGregorio told WND at the conclusion of the meeting. “Cruz made very serious allegations, and it takes time for us to do our work. But we have not forgotten about Cruz, and we will get back to him just as soon as we can.”

DiGregorio explained that as a detective sergeant in the office of the Queens County district attorney, he is currently assigned to Homeland Security Investigations, where he supervises Special Agent Klein.

Subsequent to the meeting, Cruz told WND he was shocked DHS claimed it was their first contact with him.

“Back in 2010, my attorney turned over information regarding HSBC to DiGregorio,” Cruz said, as reported by WND in an article published May 13, 2012. “Then, on Feb 7, 2012, Homeland Security said my attorneys never spoke to them, that they didn’t know who I am.”

Cruz was shocked.

“DiGregorio called me; he was belittling me,” Cruz recounted. “DiGregorio said I was a disgruntled employee, that I was just here for the money. They said, ‘Why did it take you two years to come forward?’”

IRS continues to stonewall Cruz

WND reported May 13, 2012, Cruz explained he had also presented his allegations and evidence to Internal Revenue Service Special Agent David Wagner and Supervisory Special Agent Kevin B. Sophia. Both were of the U.S. Department of Treasury, IRS, Criminal Investigation Division.

“I met with them in Denver, Colorado, on April 12, 2012, at the IRS office,” Cruz said. “I gave them a computer disc with all the HSBC documents on it. Agent Sophia asked, ‘What would make us believe HSBC employees would acknowledge illegal activity?’ I told them I recorded everything.”

Cruz also handed over to the IRS two discs with approximately 19 to 20 hours he had recorded of his discussions with HSBC employees concerning his allegations.

Cruz told WND the IRS agents were overwhelmed with the volume and detail of the information he handed over.

“The IRS agents said, ‘This is mind-boggling,’” Cruz recounted. “They told me that if the information on the computer disk and in the audio files was as I represented, the IRS agents were talking about arresting HSBC bank employees.”

Cruz noted the IRS was stunned at the dollar magnitude of the suspicious bank transactions he had documented, noting that billions of dollars in tax revenue was being lost, with bank employees transferring money into and out of bogus accounts set up for illegal gain.

The IRS explained to Cruz that the individuals whose identities may have been stolen to set up the apparently fraudulent accounts would also have to be investigated, to see if they were part of the suspicious activity or merely victims.

Either way, the Social Security numbers associated with the suspicious HSBC accounts turned out to be authentic numbers identified in many cases with present or former customers of the bank. And the billions of dollars traveling through the accounts had never been reported for income tax purposes.

“The IRS denied my request to be a whistle blower in the HSBC case,” Cruz told WND. “The IRS said the information I provided did not result in the collection of any fines, so I was not owed any fee by the federal government.”

Cruz: ‘I no longer trust DHS or the IRS’

As WND also reported May 13, 2012, Cruz handed over to WND audio recordings he made of his meetings with DHS and IRS officials – recordings he made without disclosing to the DHS and IRS.

Cruz explained that he no longer trusts even federal law enforcement to do their job investigating and prosecuting HSBC employees who may be involved in illegal bank transactions, as he alleges.

“It’s a circle,” Cruz explained. “I turn over the information to law enforcement, and law enforcement turns around and gives the information right back to the bank for the bank to conduct their own internal investigation.”

Cruz says he was fired by HSBC for bringing forth his charges.

“This is how the bank and employees in the bank make money,” he argued, explaining why he was fired instead of being given awards for meritorious service disclosing the suspicious activities. “It’s a lot easier to make money off fraudulent transactions than it is to make money off legal transactions.”

He indicated he was not concerned HSBC and/or its employees might sue him for libel or defamation.

“Sue me,” he said defiantly, “sue me all you want. Then bring out the proof. I will ask for every document. I will ask for a lot of documents. I will show that I am right, and I will give every tape recording to the public on air, so they can listen to these individuals talking.”

Cruz explained he taped the conversations with federal law enforcement authorities “to cover myself.”

“You never know what’s going to happen,” he explained. “Somebody could say, ‘Oh, you’re involved.’ I need to explain that I’m not involved, but that I reported it. Then, if they deny I reported it, I have the tapes to prove I reported it.”

Cruz affirmed to WND he was accusing by name federal officials in DHS and IRS, as well as officials in the district attorneys offices in Suffolk County and Queens County, New York, of not taking steps to stop immediately what he alleges is money laundering billions of dollars in the United States around the world.

He noted his contact with the IRS was relatively recent, and he has reason to believe the IRS has opened an investigation.

IRS agents Wagner and Sophia did not return WND calls for comment.

HSBC ‘a criminal organization’

Cruz began working at HSBC Jan. 14, 2008, as a commercial bank accounts relationship manager and was terminated for “poor job performance” on Feb. 17, 2010, after he refused to stop investigating the HSBC criminal money-laundering scheme from within the bank.

In his position as a vice president and a senior account relationship manager, Cruz worked in the HSBC southern New York region, a which accounts for approximately 50 percent of HSBC’s North American revenue. He was assigned to work with several branch managers to identify accounts to which HSBC might introduce additional banking services.

Cruz told WND he recorded hundreds of hours of meetings he conducted with HSBC management and bank security personnel in which he charged that various bank managers were engaging in criminal acts.

“I have hours of hours of recordings, ranging from bank tellers, to business representatives, to branch managers, to executives,” he said. “The whole system is designed to be a culture of fraud to make it look like it’s a legal system. But it’s not.”

Cruz explained that after many repeated efforts, he gave up on the idea that HSBC senior management or bank security would pursue his allegations to investigate and stop the wrongdoing.

“My conclusion was that HSBC wasn’t going to do anything about this account, because HSBC management from the branch level, to senior bank security, to executive senior management was involved in the illegal activity I found,” he said.

After repeated attempts to bring the information to the attention of law enforcement officers, Cruz hit a brick wall until WND examined his documentation and determined his shocking allegations were sufficiently substantiated.

“HSBC is a criminal organization,” he stressed. “It is a culture of crime.”

In 2011, Cruz published a book about his experience with HSBC, titled “World Banking World Fraud: Using Your Identity.”

We Live In An Era Of Dangerous Imbalances

by Tyler Durden

The intervention by the world’s central banks has resulted in today’s bizarro financial markets, where “bad news is good” because it may lead to more (sorry, moar) thin-air stimulus to goose asset prices even higher.

The result is a world addicted to debt and the phony stimulus now essential to sustaining it. In the process, a tremendous wealth gap has been created, one still expanding at an exponential rate.

History is very clear what happens with dangerous imbalances like this. They correct painfully. Through class warfare. Through currency crises. Through wealth destruction.

Is that really the path we want? Because we’re for sure headed for it.

Increasing Rent Costs Present a Challenge to Aspiring Homeowners

https://i0.wp.com/dsnews.com/wp-content/uploads/sites/25/2013/12/rising-arrows-two.jpgby Tory Barringer

Fast-rising rents have made it difficult for many Americans to save up a down payment for a home purchase—and experts say that problem is unlikely to go away any time soon.

Late last year, real estate firm Zillow reported that renters living in the United States paid a cumulative $441 billion in rents throughout 2014, a nearly 5 percent annual increase spurred by rising numbers of renters and climbing prices. Last month, the company said that its own Rent Index increased 3.3 percent year-over-year, accelerating from 2013 even as home price growth slows down.

Results from a more recent survey conducted by Zillow and Pulsenomics suggest that rent prices will continue to be a problem for the aspiring homeowner for years to come.

Out of more than 100 real estate experts surveyed, 51 percent said they expect rental affordability won’t improve for at least another two years, Zillow reported Friday. Another 33 percent were a little more optimistic, calling for a deceleration in rental price increases sometime in the next one to two years.

Only five percent said they expect affordability conditions to improve for renters within the next year.

Despite the challenge that rising rents presents to home ownership throughout the country, more than half—52 percent of respondents—said the market should be allowed to correct the problem on its own, without government intervention.

“Solving the rental affordability crisis in this country will require a lot of innovative thinking and hard work, and that has to start at the local level, not the federal level,” said Zillow’s chief economist, Stan Humphries. “Housing markets in general and rental dynamics in particular are uniquely local and demand local, market-driven policies. Uncle Sam can certainly do a lot, but I worry we’ve become too accustomed to automatically seeking federal assistance for housing issues big and small, instead of trusting markets to correct themselves and without waiting to see the impact of decisions made at a broader local level.”

On the topic of government involvement in housing matters: The survey also asked respondents about last month’s reduction in annual mortgage insurance premiums for loans backed by the Federal Housing Administration (FHA). The Obama administration has projected that the cuts will help as many as 250,000 new homeowners make their first purchase.

The panelists were lukewarm on the change: While two-thirds of those with an opinion said they think the changes could be “somewhat effective in making homeownership more accessible and affordable,” just less than half said the new initiatives are unwise and potentially risky to taxpayers.

Finally, the survey polled panelists on their predictions for U.S. home values this year. As a whole, the group predicted values will rise 4.4 percent in 2015 to a median value of $187,040, with projections ranging from a low of 3.1 percent to a high of 5.5 percent.

“During the past year, expectations for annual home value appreciation over the long run have remained flat, despite lower mortgage rates,” said Terry Loebs, founder of Pulsenomics. “Regarding the near-term outlook, there is a clear consensus among the experts that the positive momentum in U.S. home prices will continue to slow this year.”

On average, panelists said they expect median home values will pass their precession peak ($196,400) by May 2017.

OPEC Can’t Kill American Shale

https://i0.wp.com/static3.businessinsider.com/image/542c5b786da8118e288b4570/morgan-stanley-here-are-the-16-best-stocks-for-playing-the-american-shale-boom.jpgby Shareholdersunite

Summary

  • OPEC is supposedly out to beat, or at least curtail the growth of American shale oil production.
  • For a host of reasons, especially the much shorter capex cycle for shale, they will not succeed unless they are willing to accept permanent low oil prices.
  • But, permanent low oil prices will do too much damage to OPEC economies for this to be a credible threat.

We’re sure by now you are familiar with the main narrative behind the oil price crash. First, while oil production outside of North America is basically stagnant since 2005.

The shale revolution has dramatically increased supply in America.

(click to enlarge)

The resulting oversupply has threatened OPEC and the de-facto leader Saudi Arabia has chosen a confrontational strategy not to make way for the new kid on the block, but instead trying to crush, or at least contain it. Can they achieve this aim, provided it indeed is their aim?

Breakeven price
At first, one is inclined to say yes, for the simple reason that Saudi (and most OPEC) oil is significantly cheaper to get out of the ground.

(click to enlarge)

This suggests that all OPEC has to do is to keep output high and sooner or later the oversupply will work itself off the market, and expensive oil is more likely to see cutbacks than cheaper oil, although this critically depends on incentives facing individual producers.

Capex decline
It is therefore no wonder that we’ve seen significant declines in rig counts and numerous companies have announced considerable capex declines. While this needs time to work out into supply cutbacks, these will eventually come.

For instance BP (NYSE:BP) cutting capex from $22.9B in 2014 to $20B in 2015, or Conoco (NYSE:COP) reducing expenditures by more than 30% to $11.5B this year on drilling projects from Colorado to Indonesia. There are even companies, like SandRidge (NYSE:SD), that are shutting 75% of their rigs.

Leverage
It is often argued that the significant leverage of many American shale companies could accelerate the decline, although it doesn’t necessarily have to be like that.

While many leveraged companies will make sharp cutbacks in spending, which has a relatively rapid effect on production (see below), others have strong incentives to generate as much income as possible, so they might keep producing.

Even the companies that go belly up under a weight of leverage will be forced to relinquish their licenses or sell them off at pennies to the dollar, significantly lowering the fixed cost for new producers to take their place.

Hedging
Many shale companies have actually hedged much of their production, so they are shielded from much of the downside (at a cost) at least for some time. And they keep doing this:

Rather than wait for their price insurance to run out, many companies are racing to revamp their policies, cashing in well-placed hedges to increase the number of future barrels hedged, according to industry consultants, bankers and analysts familiar with the deals. [Reuters]

Economics
Being expensive is not necessarily a sufficient reason for being first in line for production cuts. For instance, we know that oil from the Canadian tar sands is at the high end of cost, but simple economics can explain why production cuts are unlikely for quite some time to come.

The tar sands involve a much higher fraction as fixed cost:

Oil-sands projects are multibillion-dollar investments made upfront to allow many years of output, unlike competing U.S. shale wells that require constant injections of capital. It’s future expansion that’s at risk. “Once you start a project it’s like a freight train: you can’t stop it,” said Laura Lau, a Toronto-based portfolio manager at Brompton Funds. Current oil prices will have producers considering “whether they want to sanction a new one.” [Worldoil]

So, once these up-front costs are made, these are basically sunk, and production will only decline if price falls below marginal cost. As long as the oil price stays above that, companies can still recoup part of their fixed (sunk) cost and they have no incentive to cut back production.

But, of course, you have tar sand companies that have not yet invested all required up-front capital and new capex expenditures will be discouraged with low oil prices. So, there is still the usual economic upward sloping supply curve operative here.

Swing producer
The funny thing is American shale oil is at the opposite end of this fixed (and sunk) cost universe, apart from acquiring the licenses. As wells have steep decline curves, production needs constant injection of capital for developing new wells.

Production can therefore be wound down pretty quickly should the economics require, and it can also be wound back up relatively quickly, which we think is enough reason why American shale is becoming the new (passive) swing producer. This has very important implications:

  • The relevant oil price to look at isn’t necessarily the spot price, but the 12-24 months future price, the time frame between capex and production.
  • OPEC will not only need to produce a low oil price today, that price needs to be low for a prolonged period of time in order to see cutbacks in production of American shale oil. Basically, OPEC needs the present oil price to continue indefinitely, as soon as it allows the price to rise again, shale oil capex will rebound and production will increase fairly soon afterwards.

So basically, shale is the proverbial toy duck which OPEC needs to submerge in the bathtub, but as soon as it releases the pressure, the duck will emerge again.

Declining cost curves
The shale revolution caught many by surprise, especially the speed of the increase in production. While technology and learning curves are still improving, witness how production cost curves have been pushed out in the last years:

There is little reason this advancement will come to a sudden halt, even if capex is winding down. In fact, some observers are arguing that producers shift production from marginal fields to fields with better production economics, and the relatively steep production decline curves allow them to make this shift pretty rapidly.

Others point out that even the rapid decline in rig count will not have an immediate impact on production, as the proportion of horizontal wells and platforms where multiple wells are drilled from the same location are increasing, all of which is increasing output per rig.

Another shift that is going on is to re-frack existing wells, instead of new wells. The first is significantly cheaper:

Beset by falling prices, the oil industry is looking at about 50,000 existing wells in the U.S. that may be candidates for a second wave of fracking, using techniques that didn’t exist when they were first drilled. New wells can cost as much as $8 million, while re-fracking costs about $2 million, significant savings when the price of crude is hovering close to $50 a barrel, according to Halliburton Co., the world’s biggest provider of hydraulic fracturing services. [Bloomberg]

Production cuts will take time
The hedging and shift to fields with better economics is only a few of the reasons why so far there has been little in the way of actual production cuts in American shale production, the overall oil market still remains close to record oversupply. The International Energy Agency (IEA) argues:

It is not unusual in a market correction for such a gap to emerge between market expectations and current trends. Such is the cyclical nature of the oil market that the full physical impact of demand and supply responses can take months, if not years, to be felt [CNBC].

In fact, the IEA also has explicit expectations for American shale oil itself:

The United States will remain the world’s top source of oil supply growth up to 2020, even after the recent collapse in prices, the International Energy Agency said, defying expectations of a more dramatic slowdown in shale growth [Yahoo].

OPEC vulnerable itself
Basically, the picture we’re painting above is that American shale will be remarkably resilient. Yes, individual companies will struggle, sharp cutbacks in capex are already underway, and some companies will go under, but the basic fact is that as quick as capex and production can fall, they can rise as quickly again when the oil price recovers.

How much of OPEC can the storm of the oil price crash, very much remains to be seen. There is pain all around, which isn’t surprising as one considers that most OPEC countries have budgeted for much higher oil prices for their public finances.

(click to enlarge)
You’ll notice that these prices are all significantly, sometimes dramatically, higher than what’s needed to balance their budgets. Now, many of these countries also have very generous energy subsidies on domestic oil use, supposedly to share the benefits of their resource wealth (and/or provide industry with a cost advantage).

So, there is a buffer as these subsidies can be wound down relatively painless. Some of these countries also have other buffers, like sovereign wealth funds or foreign currency reserves. And there is often no immediate reason for public budgets to be balanced.

But to suggest, as this article is doing, that OPEC is winning the war is short-sighted.

Conclusion
While doing damage to individual American shale oil producers and limiting its expansion, the simple reality is that for a host of reasons discussed above, OPEC can’t beat American shale oil production unless it is willing to accept $40 oil indefinitely. While some OPEC countries might still produce profitably at these levels, the damage to all OPEC economies will be immense, so, we can’t really see this as a realistic scenario in any way.

Global Capital Will Continue to Flow into Real Estate in 2015

Global Capital to Continue to Flow into Real Estate in 2015
By Michael Gerrity
According to LaSalle Investment Management’s new 2015 Investment Strategy Annual (ISA) report, money will continue to flow into real estate from across the capital markets worldwide, but investors should be increasingly concerned about getting caught late in the cycle and should anticipate  the next cyclical downturn in a few years.
 
ISA report states that different regions of the world will be growing at different speeds in 2015, investors need to prepare their portfolios for world where interest rates begin to rise more quickly in some parts than others.
 
Jacques Gordon, LaSalle’s Global Head of Research and Strategy said, “Where we are in the real estate cycle is one of the most commonly asked questions of real estate investment managers and with good reason. Investors are concerned about what might happen if capital markets turn away from property.  Timing strategies are difficult to apply to a relatively illiquid asset class like real estate. Nevertheless, adjusting portfolios as assets and markets move through their respective cycles can improve performance by enhancing returns and reducing risk.”ISA Investor Advice Includes:

  • Diversify their holdings across a number of countries that are in different stages of the capital market cycle.
  • Anticipate different interest rate environments by allocating to real estate assets with income streams that keep pace with rising inflation or debt costs in growing economies like the U.K or the U.S. Also, focus on high quality properties and locations in markets where growth/interest rates will stay “lower for longer”, such as Japan or Western Europe.
  • Invest in secular trends, rather than cyclical ones, that will be less exposed to a downturn. The ISA found that investments linked to Demographics, Technology and Urbanization (DTU) – first identified last year – are likely to be key in helping investors to identify such trends.
  • Continue to place a high emphasis on sustainability factors, like energy efficiency and recycling, when buying, improving and operating buildings. Tenants and the capital markets will be paying much more attention to environmental standards in the years ahead.

Gordon also noted that markets around the world are at very different stages in terms of market fundamentals and capital markets, and hence future performance. Thus, it makes sense to have an investment program that takes advantage of real estate cycles. Examples of cycle-sensitive strategies include: Harvesting gains and selling properties in frothy capital markets, taking advantage of higher levels of leasing/rental growth in growth markets, and focusing on locations/sectors that are positioned to qualify as mainstream “core” assets in a few years.
 
Other themes for 2015 identified by the ISA include:

  • Money is likely to continue to flow into real estate as long as the yields on property continue to offer a premium to investment-grade bonds.
  • The debt markets are also embracing real estate, although lending is not yet as aggressive as it was during the peak of the credit bubble.
  • Taken together, this is likely to keep pushing prices up, while continuing to lower the expected future returns on real estate.
  • It could also lead to an escalation in new development. After many years of low levels of new construction in nearly all G-20 countries, most major markets can easily absorb moderate additions to inventory without creating an oversupply problem.


Key Trends in The United States

 
Overall, North America is in a good position for 2015 with healthy real estate markets and economic growth. Despite global headwinds, the U.S. economy and real estate markets will improve at a faster pace over the next three years, a welcome trend after five years of below average recovery. Capital flows to real estate will remain very strong next year, with overall real estate transaction levels close to or surpassing the pre-recession peak. Both equity and debt will be plentiful, and lenders will become increasingly aggressive in deploying capital.
 
In addition, occupancy rates will continue to improve for industrial, retail and most notably office in 2015. However, occupancy rates will be stable in the apartment sector as new supply matches demand, while rental rates in select markets such as San Francisco, New York City and Portland will outpace the national average.
 
The Investment Strategy Annual also predicts that many firms will be willing to pay higher rents in 2015 for properties located in Central Business Districts, because these locations greatly improve the ability to recruit talented Millennials. Moreover, E-commerce will continue to take market share in the retail sector, although new fashion trends, convenience, services, and out-of-home dining will keep the best shopping centers full and able to raise rents. Urban retail will continue to outperform due to strong tenant demand and little new supply.
 
Key Trends in Canada
 
The Investment Strategy Annual predicts that Canada’s near-term economic growth in 2015 will trail the United States, yet remain ahead of most other G7 countries. While slower global growth could impact demand in Canada’s resources sector, improvement in the U.S. economy will benefit Canada in the form of stronger export volumes in 2015 and beyond. Private consumption is forecast to grow more slowly in 2015 given elevated housing prices and high household debt levels. Stronger business investment and government expenditures should partially offset this.
 
Growth in the Alberta oil sands will slow in 2015 as oil prices face downward pressure and U.S. production escalates. However, traditional oil and gas drilling is re-emerging as fracking technology improves and pipeline expansion delays have been alleviated by significant growth in rail transport. Consequently, economic growth and real estate demand in cities in Western Canada will continue to outpace the nation.
 
In addition, e-commerce adoption will continue to grow as a share of overall retail trade and drive further changes among retailers and distribution chains in Canada. Retailers with a proven, established e-commerce platform will grow at the expense of those with less efficient or no models.
 
Key Trends in Mexico
 
Given its close links to the U.S., Mexico’s economy should outperform many other emerging markets in 2015 and beyond. Economic growth should accelerate in 2015, led by export-oriented manufacturing. In addition, the negative effects of the 2014 tax reforms will fade out and the government will implement a more expansive fiscal policy for large infrastructure projects.

Falling Oil Prices Threaten Houston Building Boom

One-Sixth of U.S. Office Space Under Construction Is Here, but Need Is Waning

Construction giant Skanska AB is developing two office buildings in Houston’s “Energy Corridor.” The one that is nearly complete is mostly leased; the other building doesn’t yet have any tenants. Photo: Michael Stravato for Wall Street Journal. Article by Eliot Brown

HOUSTON—The jagged skyline of this oil-rich city is poised to be the latest victim of falling crude prices.

As the energy sector boomed in recent years, developers flocked to Houston, so much so that one-sixth of all the office space under construction in the entire U.S. is in the metropolitan area of the Texas city.

But now, the need for more offices is drying up, thanks to a drop in oil prices that has spun energy companies from an outlook of optimism and growth to anxiety and cutbacks. Oil prices have fallen by more than 50% since June.

Demand for office space is “going to basically stop,” said Walter Page, director of office research at property data firm CoStar Group Inc. “It hurts a lot more when you have a lot of construction.”

By the end of 2014, construction had started on about 80 buildings with about 18 million square feet of office space in the greater Houston area, according to CoStar. Many of the buildings were planned or started when oil was above $100 a barrel. On Tuesday, oil futures traded around $50. The amount under construction is equal to Kansas City, Mo.’s entire downtown office market and is 16% of all U.S. office development under way.

The rush of building has created thousands of jobs—not only at building sites, but also at window manufacturers, concrete companies and restaurants that feed the workers.

But just as the wave of office-space supply approaches, energy companies, including Halliburton Co. , Baker Hughes Inc., Weatherford International and BP PLC, have collectively announced that more than 23,000 jobs would be cut, with many of them expected to be in Houston.

Fewer workers, of course, means less need for office space. Employers have rushed to sublease space in recent months, with 5.2 million square feet of space on the market as of last month, up about 1 million square feet from mid-2014, according to brokerage firm Savills Studley. BP, for example, is trying to sublet 240,000 square feet of space at its campus in the Westlake neighborhood, which represents about 11% of BP’s space at the campus, according to CoStar. A BP spokesman said the company is “consolidating” its footprint.

Conditions could improve if oil prices rise. The International Energy Agency on Tuesday said oil companies’ recent cutbacks in production will likely slow the growth of U.S. oil output, which in turn would lead to a rebound in prices.

But the current building boom is Houston’s biggest since the 1980s, when an oil bust, coupled with a rash of empty skyscrapers, made Houston a national symbol of overbuilding. Then, armed with debt from a banking sector eager to lend, developers brought a tidal wave of building to Houston, in some years increasing the office stock by well over 10%. Vacancy rates shot up past 30% from single digits, property values plummeted and landlords defaulted on mortgages.

That contributed to a wave of failures for banks stuffed with commercial-property loans. More than 425 Texas institutions between 1980 and 1989 failed, including nine of the state’s 10 largest banks.

Few are predicting a shock near that scale this time. Even if oil prices stay low, the local economy is more diversified than in the 1980s with sectors such as health care and higher education comprising a larger share of the workforce. In addition, new construction represents about 6.3% all the area’s total office stock, and there is far less speculative construction done before a tenant is signed up.

“Everybody here in Houston is waiting to exhale,” said Michael Scheurich, chief executive of general contractor Arch-Con Corp., which currently is building two midsize office projects in the area. Mr. Scheurich said his company has grown to about 80 employees from fewer than 25 in 2011 amid the construction boom. Now he is hoping the local economy will have “a soft landing.”

Still, cranes abound throughout Houston, thanks to publicly traded real-estate companies, pension funds and other interests like Swedish construction giant Skanska AB, which are funding construction without as much reliance on debt as in the 1980s.

Everybody here in Houston is waiting to exhale.

—Michael Scheurich, chief executive at Arch-Con Corp.


Running west from the downtown along Interstate 10, numerous midsize construction projects aimed at the “upstream” companies focused on energy extraction are being built in the so-called Energy Corridor.

Analysts say this shows how the sector is highly susceptible to booms and busts because of the long lag time between when buildings are started and when they are delivered, compounded by the tendency of developers and financiers to start projects en masse, late in cycles.

Developers are often victims of “herding and group think,” said Rachel Weber, an urban planning professor at the University of Illinois at Chicago who is writing a book about office over development in Chicago. “There is a sense that if everybody is moving in the same direction and acting the same way, that you do better to mimic that kind of behavior.”

Many of those building are bracing for a sting in the short-term. It could be even more painful if oil prices stay low.

It “is going to be a soft year—it’s hard not to see that,” said Mike Mair, an executive vice president in charge of Houston-area development for Skanska. The company is putting the finishing touches on a new 12-story tower in the Energy Corridor that is 62% leased. Construction is under way on a nearly identical building next door for which it doesn’t have any tenants.

Still, Mr. Mair said he believes in the city’s economic strength in the mid- and long-term, giving him confidence to finish work on the second tower. “I’m not afraid of ’16 and ’17,” he said.

Of course, higher vacancy rates would mean lower rents, which is good for anyone signing a lease. Rents at top-quality buildings averaged $34.51 a square foot at the end of 2014, up about 15% from early 2012, according to CoStar. But brokers say landlord incentives have grown, and rents typically follow the direction of oil prices, with a lag of one or two quarters. Still, the rents are a bargain compared with other major cities such as New York, where top-quality offices rent for an average $59 a square foot.

The city of Houston, for one, could be a beneficiary of lower rents. The government had been planning to build a new police department headquarters at an estimated cost of between $750 million and $1 billion.

Late last month, the mayor’s office said it was examining the possibility of leasing the building that Exxon Mobil is leaving, which would cost far less than the city’s original plan.

Inaccurate Zillow ‘Zestimates’ A Source Of Conflict Over Home Prices

https://i0.wp.com/ei.marketwatch.com/Multimedia/2013/05/14/Photos/ME/MW-BC704_zillow_20130514170200_ME.jpg

By Kenneth R. Harney

When “CBS This Morning” co-host Norah O’Donnell asked the chief executive of Zillow recently about the accuracy of the website’s automated property value estimates — known as Zestimates — she touched on one of the most sensitive perception gaps in American real estate.

Zillow is the most popular online real estate information site, with 73 million unique visitors in December. Along with active listings of properties for sale, it also provides information on houses that are not on the market. You can enter the address or general location in a database of millions of homes and probably pull up key information — square footage, lot size, number of bedrooms and baths, photos, taxes — plus a Zestimate.

Shoppers, sellers and buyers routinely quote Zestimates to realty agents — and to one another — as gauges of market value. If a house for sale has a Zestimate of $350,000, a buyer might challenge the sellers’ list price of $425,000. Or a seller might demand to know from potential listing brokers why they say a property should sell for just $595,000 when Zillow has it at $685,000.

Disparities like these are daily occurrences and, in the words of one realty agent who posted on the industry blog ActiveRain, they are “the bane of my existence.” Consumers often take Zestimates “as gospel,” said Tim Freund, an agent with Dilbeck Real Estate in Westlake Village. If either the buyer or the seller won’t budge off Zillow’s estimated value, he told me, “that will kill a deal.”

Back to the question posed by O’Donnell: Are Zestimates accurate? And if they’re off the mark, how far off? Zillow CEO Spencer Rascoff answered that they’re “a good starting point” but that nationwide Zestimates have a “median error rate” of about 8%.

Whoa. That sounds high. On a $500,000 house, that would be a $40,000 disparity — a lot of money on the table — and could create problems. But here’s something Rascoff was not asked about: Localized median error rates on Zestimates sometimes far exceed the national median, which raises the odds that sellers and buyers will have conflicts over pricing. Though it’s not prominently featured on the website, at the bottom of Zillow’s home page in small type is the word “Zestimates.” This section provides helpful background information along with valuation error rates by state and county — some of which are stunners.

For example, in New York County — Manhattan — the median valuation error rate is 19.9%. In Brooklyn, it’s 12.9%. In Somerset County, Md., the rate is an astounding 42%. In some rural counties in California, error rates range as high as 26%. In San Francisco it’s 11.6%. With a median home value of $1,000,800 in San Francisco, according to Zillow estimates as of December, a median error rate at this level translates into a price disparity of $116,093.

Some real estate agents have done their own studies of accuracy levels of Zillow in their local markets.

Last July, Robert Earl, an agent with Choice Homes Team in the Charlottesville, Va., area, examined selling prices and Zestimates of all 21 homes sold that month in the nearby community of Lake Monticello. On 17 sales Zillow overestimated values, including two houses that sold for 61% below the Zestimate.

In Carlsbad, Calif., Jeff Dowler, an agent with Solutions Real Estate, did a similar analysis on sales in two ZIP Codes. He found that Zestimates came in below the selling price 70% of the time, with disparities ranging as high as $70,000. In 25% of the sales, Zestimates were higher than the contract price. In 95% of the cases, he said, “Zestimates were wrong. That does not inspire a lot of confidence, at least not for me.” In a second ZIP Code, Dowler found that 100% of Zestimates were inaccurate and that disparities were as large as $190,000.

So what do you do now that you’ve got the scoop on Zestimate accuracy? Most important, take Rascoff’s advice: Look at them as no more than starting points in pricing discussions with the real authorities on local real estate values — experienced agents and appraisers. Zestimates are hardly gospel — often far from it.

kenharney@earthlink.net Distributed by Washington Post Writers Group.

Oil Glut Gets Worse – Production, Inventories Soar to Record

https://i0.wp.com/bloximages.newyork1.vip.townnews.com/oaoa.com/content/tncms/assets/v3/editorial/9/14/914424e8-aaf0-11e4-ac1c-b74346c3e35b/54cf9855658eb.image.jpgby Wolf Richter

February 4th, 2015: Crude oil had rallied 20% in three days, with West Texas Intermediate jumping $9 a barrel since Friday morning, from $44.51 a barrel to $53.56 at its peak on Tuesday. “Bull market” was what we read Tuesday night. The trigger had been the Baker Hughes report of active rigs drilling for oil in the US, which had plummeted by the most ever during the latest week. It caused a bout of short covering that accelerated the gains. It was a truly phenomenal rally!

But the weekly rig count hasn’t dropped nearly enough to make a dent into production. It’s down 24% from its peak in October. During the last oil bust, it had dropped 60%. It’s way too soon to tell what impact it will have because for now, production of oil is still rising.

And that phenomenal three-day 20% rally imploded today when it came in contact with another reality: rising production, slack demand, and soaring crude oil inventories in the US.

The Energy Information Administration reported that these inventories (excluding the Strategic Petroleum Reserve) rose by another 6.3 million barrels last week to 413.1 million barrels – the highest level in the weekly data going back to 1982. Note the increasingly scary upward trajectory that is making a mockery of the 5-year range and seasonal fluctuations:

US-crude-oil-stocks-2015-02-04
And there is still no respite in sight.

Oil production in the US is still increasing and now runs at a multi-decade high of 9.2 million barrels a day. But demand for petroleum products, such as gasoline, dropped last week, according to the EIA, and so gasoline inventories jumped by 2.3 million barrels. Disappointed analysts, who’d hoped for a drop of 300,000 barrels, blamed the winter weather in the East that had kept people from driving (though in California, the weather has been gorgeous). And inventories of distillate, such as heating oil and diesel, rose by 1.8 million barrels. Analysts had hoped for a drop of 2.2 million barrels.

In response to this ugly data, WTI plunged $4.50 per barrel, or 8.5%, to $48.54 as I’m writing this. It gave up half of the phenomenal three-day rally in a single day.

Macquarie Research explained it this way:

In our experience, oil markets rarely exhibit V-shaped recoveries and we would be surprised if an oversupply situation as severe as the current one was resolved this soon. In fact, our balances indicate the absolute oversupply is set to become more severe heading into 2Q15.

Those hoping for a quick end to the oil glut in the US, and elsewhere in the world, may be disappointed because there is another principle at work – and that principle has already kicked in.

As the price has crashed, oil companies aren’t going to just exit the industry. Producing oil is what they do, and they’re not going to switch to selling diapers online. They’re going to continue to produce oil, and in order to survive in this brutal pricing environment, they have to adjust in a myriad ways.

“Efficiency and innovation, when price falls, it accelerates, because necessity is the mother of invention,” Michael Masters, CEO of Masters Capital Management, explained to FT Alphaville on Monday, in the middle of the three-day rally. “Even if the investment only spits out quarters, or even nickels, you don’t turn it off.”

Crude has been overvalued for over five years, he said. “Whenever the return on capital is in the high double digits, that’s not sustainable in nature.” And the industry has gotten fat during those years.

Now, the fat is getting trimmed off. To survive, companies are cutting operating costs and capital expenditures, and they’re shifting the remaining funds to the most productive plays, and they’re pushing 20% or even 30% price concessions on their suppliers, and the damage spreads in all directions, but they’ll keep producing oil, maybe more of it than before, but more efficiently.

This is where American firms excel: using ingenuity to survive. The exploration and production sector has been through this before. And those whose debts overwhelm them – and there will be a slew of them – will default and restructure, wiping out stockholders and perhaps junior debt holders, and those who hold the senior debt will own the company, minus much of the debt. The groundwork is already being done, as private equity firms and hedge funds offer credit to teetering oil companies at exorbitant rates, with an eye on the assets in case of default.

And these restructured companies will continue to produce oil, even if the price drops further.

So Masters said that, “in our view, production will not decrease but increase,” and that increased production “will be around a lot longer than people are forecasting right now.”

After the industry goes through its adjustment process, focused on running highly efficient operations, it can still scrape by with oil at $45 a barrel, he estimated, which would keep production flowing and the glut intact. And the market has to appreciate that possibility.


Rigs Down By 21% Since Start Of 2015
Permian Basin loses 37 rigs first week in February

by Trevor Hawes

The number of rigs exploring for oil and natural gas in the Permian Basin fell 37 this week to 417, according to the weekly rotary rig count released Friday by Houston-based oilfield service company Baker Hughes.

This week’s count marked the ninth-consecutive decrease for the Permian Basin. The last time Baker Hughes reported a positive rig-count change was Dec. 5, when 568 rigs were reported. Since then, the Permian Basin has shed 151 rigs, a decrease of 26.58 percent.

For the year, the Permian Basin has shed 113 rigs, or 21.32 percent.

In District 8, which includes Midland and Ector counties, the rig count fell 19 this week to 256. District 8 has shed 58 rigs, 18.47 percent, this year.

Texas lost 41 rigs this week for a statewide total of 654. The Lone Star State has 186 fewer rigs since the beginning of the year, a decrease of 22.14 percent.

In other major Texas basins, there were 168 rigs in the Eagle Ford, down 10; 43 in the Haynesville, unchanged; 39 in the Granite Wash, down one; and 19 in the Barnett, unchanged.

The Haynesville shale is the only major play in Texas to have added rigs this year. The East Texas play started 2015 with 40 rigs.

At this time last year, there were 483 rigs in the Permian Basin and 845 in Texas.

In the U.S., there were 1,456 rigs this week, a decrease of 87. There were 1,140 oil rigs, down 83; 314 natural gas rigs, down five; and two rigs listed as miscellaneous, up one.

By trajectory, there were 233 vertical drilling rigs, down two; 1,088 horizontal drilling rigs, down 80; and 135 directional drilling rigs, down five.

The top five states by rig count this week were Texas; Oklahoma with 176, down seven; North Dakota with 132, down 11; Louisiana with 107, down one; and New Mexico with 78, down nine.

The top five basins were the Permian; the Eagle Ford; the Williston with 137, down 11; the Marcellus with 71, down four; and the Mississippian with 53, down one.

In the U.S., there were 1,397 rigs on land, down 85; nine in inland waters, down three; and 50 offshore, up one. There were 48 rigs in the Gulf of Mexico, up one.

Canada’s rig count fell 13 this week to 381. There were 184 oil rigs, down 16; 197 natural gas rigs, up three; and zero rigs listed as miscellaneous, unchanged. Canada had 621 rigs a year ago this week, a difference of 240 rigs compared to this week’s count.

The number of rigs exploring for oil and natural gas in the North America region, which includes the U.S. and Canada, fell 100 this week to 1,837. There were 2,392 rigs in North America last year.

Rigs worldwide

On Friday, Baker Hughes released its monthly international rig count for January. The worldwide total was 3,309 rigs. The U.S. ended January with 1,683 rigs, just more than half of all rigs worldwide.

The following are January’s rig counts by region, with the top three nations in each region in parentheses:

Africa: 132 (Algeria: 97; Nigeria: 19; Angola: 14)

Asia-Pacific: 232 (India: 108; Indonesia: 36; China offshore: 33)

Europe: 128 (Turkey: 37; United Kingdom offshore: 15; Norway: 13)

Latin America: 351 (Argentina: 106; Mexico: 69; Venezuela: 64)

Middle East: 415 (Saudi Arabia: 119; Oman: 61; Iraq: 60)

Odessa migrant worker 1937

Migrant oil worker and wife near Odessa, Texas 1937

Photographer: Dorothea Lange Created: May 1937 Location: OdessaTexas

Call Number: LC-USF34-016932 Source: MRT.com

Farmer Mac: Super Profitable But Cheap Due To GSE Aversion

Source: Seeking Alpha About: Federal Agricultural Mortgage Corporation (AGM), Includes: FNMA

Summary

  • Farmer Mac, the Fannie Mae of agriculture, trades at 1 times book and 7 times earnings despite delivering sustainable 15-20% ROEs.
  • Organizational improvements are finally enabling Farmer Mac to rapidly gain share; penetration remains low, so the growth runway is long.
  • Investors drew the wrong lesson from Fannie Mae’s failure. GSE privileges enable super profits from mundane activities. Fannie failed because it strayed from its core business.

Farmer Mac’s Birth

During the late 1980s, plunging agricultural prices threatened the solvency of the Farm Credit System (FCS), a problem congress tried to address in the usual manner. They bailed it out. Non-FCS banks weren’t happy about that since they thought the FCS’ (“unfair”) advantages were the primary cause of the boom-bust cycle that required the bailout in the first place. So congress chartered Farmer Mac (NYSE:AGM) to help level the playing field for banks by providing a secondary market for their loans.

The FCS is old and big; it was chartered by the Feds in 1916 and it supplies ~40% of US farm credit. (All you really need to know about the FCS is that its institutions have lower long-term funding costs than deposit fueled banks; and they’re supposed to restrict their lending to agricultural and certain rural development situations.) It’s hierarchically structured and cooperatively owned. Agricultural operators borrow from and own stock in its retail lenders (Farm Credit Associations, FCAs, of which there are presently ~80); FCAs borrow from and own stock in wholesale lenders (Farm Credit Banks, FCBs, 4); who borrow from and own stock in the FCS Funding Corp. which taps capital markets; these proceeds then flow down through wholesalers to retailers to farmers. The FCS Insurance Corp. which has a $10b line of credit with Treasury guarantees FCS bond issuances. The system can borrow longer and cheaper than any purely private sector entities of lesser quality than, say, ExxonMobil, which enables the usual GSE competitive edge (like Fannie Mae, (OTCQB:FNMA) at funding long-term fixed rate assets. The system is exempt from taxes on certain types of lending. For these privileges the FCS is constrained to lend to underserved rural America, which it likes to define as widely as possible (a wholesaler recently lent to Verizon Wireless!). Though wholesale FCS institutions are in some ways similar to AGM they’re not allowed the leverage necessary to be an effective maker of secondary markets; and they can’t deal with non-FCS lenders (commercial banks). (See Bert Ely’s articles on the FCS for an insightful banker side point of view.) Anyway, back to the chronology.

Ag Banks, by which I mean non-FCS commercial banks with agriculturally concentrated portfolios, always hated the FCS for their privileges. So you can imagine their displeasure with the 1987 FCS bailout.

Farmer Mac was the bone congress threw to banks to apologize for the bailout of their rival. If a bank couldn’t offer a borrower as low a long-term fixed rate as a “predatory” FCS lender, they could still originate the loan and keep the customer by selling it to AGM. The rate ought to be FCS competitive since AGM, with their $1.5b emergency Treasury line of credit, can borrow cheap and long like the other GSEs. And banks could still make maybe 0.7% risk-free for servicing the sold loan. That was the idea at least, but it’s taken some time for things to work that way.

1996 Reform Launches Farmer Mac..Sort of

AGM, which was chartered in 1987 and operationalized in 1989, had nothing to do with the ag recovery that was gaining steam in 1995. They’d executed less than $1b in securitizations (transactions where purchased loans are pooled, made into a bond, guaranteed by AGM and sold) to that point, a trivial fraction of their potential addressable market. When AGM’s charter was initially being considered experts had expected $2-3b in securitizations per year.

In 1995 having never turned a profit and with just 43%, or $12m, of their original capital remaining, AGM appealed to congress to liberalize their straitjacket of a charter. They got what they asked for in the form of the 1996 Ag Reform Act.

The first key change was the elimination of the skin in the game rule that required originators to hold loan residuals, the first 10% loss position on loans sold. That provision in practice meant sellers retained all the credit risk. So selling banks had been getting neither relief of credit risk nor required capital.

Secondly, the Act let AGM bypass loan poolers (insurers and big banks) to buy loans directly from originators. It’s unclear to me why direct purchase was ever forbidden since an extra pooling intermediary adds cost and complexity, and makes both AGM and ag banks dependent on the efforts and interests of third parties. But anyway, the 1996 Act transformed AGM. The removal of these two key restrictions let them generate the business volume necessary to immediately turn and remain profitable. Business volume and profits grew rapidly from 1996 through 2003. Though the majority of the growth, especially between 2000 and 2003, was generated by transactions between FCS lenders and Farmer Mac!

(click to enlarge)

Internal Problems Limit Farmer Mac’s Growth With non-FCS Lenders

Much of their growth in this era was produced by a product called long-term standby purchase commitments (LTSPCs) which are sold primarily to FCS associations (they generate the Guarantee fee income you see above). These “credit enhancements,” or default insurance, are promises to buy defaulted loans from a predefined eligible pool in exchange for a guarantee fee of 20-50 bps assessed based on the size and quality of the pool. They reduce a lender’s required capital and credit concentrations, but leave it with the interest rate risk. The FCS prefers them to outright loan sales because they’re simple and cheap and because the FCS is less worried about rate risk than banks are. FCS lenders like LTSPCs; banks like outright loan sales. (AGM’s LTSPCs are held off-balance sheet, but they are required to allocate capital to them.)

By 2003 the popularity of LTSPCs meant that the FCS was doing three times more business with AGM than banks; an irony and an outrage for AGM’s initial supporters!

In 2003 the Independent Community Bankers Association (ICBA) told congress that AGM wasn’t doing a good job for its constituents. You see, there are 1,500 ag banks in the US and yet in any given year between the late 1990s and 2010 only 40-80 of them transacted with AGM. Of those, the top 10 would often comprise 90% of their volume. So most years AGM truly mattered to less than 1% of US ag banks! In contrast, ~30 of the 80 FCS associations bought LTSPCs each year. This is not how Farmer Mac was supposed to operate.

The asymmetry between FCS and bank participation was caused by two things. First, ag banks tend to be smaller than FCS lenders, and AGM’s programs were too clunky and time consuming for small lenders to participate in. Second, AGM was less rigid in the loan structures they were willing to guarantee with LTSPCs than the ones they’d purchase.

All Systems Go

Flash forward. After a decade of little quantifiable progress in expanding breadth, the number of banks who sold loans to AGM in 2013 nearly tripled to 220 from 80 in 2010; eligible and approved sellers tripled too, to more than 600. Here is the path of the dollar volume of loan purchases between 2008 and 2013: $196m, $195, $382, $495, $570, $825. Most tellingly, the top ten 2013 loan sellers comprised just 53% of AGM’s record $825m in 2013 volume. Breadth of participation is exploding. Right now.

What changed?

First, whereas the ICBA said underwriting took weeks or months back in 2003, AGM now targets two days. The 2005 launch of their web-based underwriting system (AgPower LOS), and its subsequent iterative improvement, deserves much of the credit.

Second, AGM was a young company back in 2003; officially 14 years old, but really just seven. It didn’t help that the data required to model prepayment speeds and credit losses was tough to come by. The result was rigid underwriting. For example, in 2003 the vast majority of their fixed rate portfolio loans carried prepayment protection, which borrowers hate; now it’s just 2%. (AGM never cared about prepayment protection in their LTSPC book because the lender kept the loans and interest rate risk on their own book.)

Third, was their outreach. AGM formed alliances with the American Banking Association (ABA) in 2005, and ICBA in 2009 featuring, among other things, pricing discounts for members and a commitment to get in the field to educate and learn from ag banks. This doesn’t sound important, but I gather that sleepy $25m rural banks aren’t the most proactive institutions, which in some ways is a good thing when I think about Countrywide and Indymac. Anyway.

In 2010, a ripe AGM collided with an amenable macro environment, with borrowers scrambling to refinance into long-term fixed rate loans, and their volume exploded. Today 75% of new loan and LTSPC transaction volume comes from non-FCS bank lenders, which is the way it always should have and would have been if AGM’s organization weren’t so immature until recently.

The fraction of US ag banks working with AGM has tripled from 5% to 15% since 2010; and AGM’s share of existing farm debt is still well under 5%. Low and rapidly growing penetration is the sort of thing you want to get exposure to. CEO Tim Buzby told the ABA in 2013, “…if you had told me five years ago that we were going to purchase $1 billion in loans [including $400m USDA guaranteed loans] in 2012, I would have said, ‘You need to explain to me how we’re going to do that.’ Now, if you told me that we’re not going to do $2 billion annually five years from now, I’d ask you to explain to me why not.'”

(click to enlarge)

[The source for the graphics and tables are AGM’s most recent investor presentation.]

Let me summarize before I move on. AGM’s charter restricted their growth before 1996; its liberalization enabled rapid (but narrowly fueled) growth and increasing profitability through 2003. With their addressable FCS market addressed, growth then stalled due to organizational problems that hindered their ability to serve non-FCS banks, which is ironic because it’s these entities who their funding capabilities complement best. More efficient underwriting, smarter and more flexible pricing, and successful outreach programs prepared the ground that spurred re-ignition of gradual growth in 2008-2010 and explosive growth post-2010 when the macro environment turned favorable. AGM has been posting 15-20% ROEs since 2010 and looks poised to do similarly in the future, as they continue to penetrate a huge non-FCS addressable market.

GSE Business Model Fundamentals

An institution’s structure determines what it ought to do. Farmer Mac can borrow cheap and long; and it’s allowed ~3 times the leverage of an ordinary bank. Therefore they are uniquely capable of transforming low credit risk, low fixed rate assets into substantial ROEs. And since it’s easy to underwrite prime assets originated by third parties they can run the business with 1/10th the overhead of an ordinary bank, amplifying their competitiveness in their niches.

Basic ag loans and LTSPCs, the stuff I’ve talked about so far, are actually the riskiest and most profitable bucket of assets AGM is exposed to. The other half of their program volume (assets + off-balance sheet guarantees) contains virtually no credit risk. For example, 13% of assets are USDA guaranteed rural loans backed by the full faith and credit of the US government. Another 32% are general obligation bonds issued by high quality credits like Metlife, all of which are 100-111% collateralized by eligible ag loans. Last, 17% of volume is a combination of direct and AgVantage (collateralized bond) exposure to Rural Utilities loans, which are highly regulated entities that enjoy the safety of cost-plus pricing. Their charter was expanded to include this business in 2008.

Spreads are low in these other business lines, but a 0.6% match-funded spread (locked-in by matched duration debt issuance) with no credit risk, requiring little labor to underwrite, levered 25-30 times (including preferred equity; 40 times on common equity), is a highly profitable risk adjusted deal. GSE charter privileges let you earn big profits in mundane ways.

Getting back to the “Farm & Ranch Segment,” which is how AGM collectively refers to their portfolioed ag loans and off-balance sheet guarantees: I’d mentioned that these are their riskiest assets. How risky?

(click to enlarge)

Not very. Cumulative losses are 1 bp per year; that is $1 on each $10,000 of loans. Total historical losses of $31m equate to about $2.00 per share fully-taxed. AGM’s actual book value is ~$30; it’d be $32 if they’d never lost a penny since 1989. Excluding a 2006 foray into ethanol facilities, which has been aborted, historical losses are half as large, 1/2 bp per year.

Credit losses are historically immaterial. And by every metric credit is more pristine than ever. The weighted average loan-to-value ratio is presently 44% based on originally appraised real estate values; factoring in land price appreciation, the market LTV is surely below 40%. That sort of collateral with sub 0.5% delinquency rates means minimal credit risk.

The Bull Thesis

Fannie Mae beat the market by a factor of 7.5 between 1984 and 1999. Digest that.

GSE privileges are valuable if you don’t venture from the core business model, which is pretty simple: don’t take substantial credit risk. Ever. Fannie imploded because, in an effort to gain back lost market share and to prove their social worth, they ventured into subprime and alt-a exposures between 2004-2006. Their prime book of business did just fine during this period.

AGM is priced at 1 times their ~$30 book value; and ~7 times their ~$4-4.40 EPS run-rate. With the organization and processes (finally) in place to play an ever increasing role in non-FCS agricultural/rural lending, I think they can grow program volume and earnings by 10-15% per year; and that they can maintain ROE in a 13-20% range indefinitely, at manageable risk. Obviously the market disagrees. What is AGM worth? Play around with how book value grows over long horizons at a 15%+ ROE; and with expansion in P/Book from a starting value of 1.0 to an ending value of 2.0, or 3.0. A 15% ROE for five years and an ending P/Book of 2.0 gives us a target of $120, 300% upside.

The Bear Thesis

Its corporate governance is awkward to say the least. Us “C” class shareholders can’t vote. The A and B shares are respectively restricted to non-FCS financial institutions, and FCS ones, who each elect 5 board reps. The remaining 5 reps of the 15 member board are presidential appointees who, I’d assume, are there to make sure everyone plays nice. As AGM’s role in banking grows at the expense of the FCS board, which seems to be functioning fine presently, may become more interesting. Further, AGM and the FCS share a common regulator, the Farm Credit Agency (FCA). If you ask bankers they’ll tell you the FCA is captured by the FCS. That’s not clear to me but do your own diligence.

Secondly, though AGM’s assets appear superbly safe, their leverage means the error margin is small. For example, AGM may not have survived 2008 if not for a capital injection from a group of concerned counterparties. The problems stemmed not at all from the core business; their liquidity portfolio contained Fannie and Lehman preferred stock! They’ve since tightened their investment standards considerably, but the Fannie/Lehman writedowns were life threatening only because AGM is so levered. Relatedly, though AGM’s interest rate risk management has dealt well with the stress of the last 7 years, and their duration gap never is more than a few months, it’s hard to tell what would happen if rates spiked 3-5% quickly.

Lastly, with the sector so healthy and liquid, there’s the risk that AGM won’t be needed. Back in 2003-2004, AGM blamed its shrinking program volume on just that. But in retrospect, I think we see that the problems were internal, not macroeconomic, because today, in a similarly healthy environment, we see their program volume and breadth marking new records quarterly.

Wrapping It Up

Michael Burry allocates his attention to investments that inspire in investors a reaction of superficial disgust; “ick!”. AGM does that. People see AGM and think Fannie, Leverage, whoa what happened in 2008 and what heck is an LTSPC? (Like this Seeking Alpha contributor does here.) Sure, they’ve been delivering ~18% ROEs in recent years, but that probably just reflects the blow-up risk they’re taking.

All these impressions are wrong in a nuanced way. AGM’s leverage has proven appropriate, maybe even inadequate, relative to the volatility of their core assets. Fannie was one of the best performing stocks on earth for 15 years; and their implosion was the product of stupidly straying into credit markets they never belonged in during the biggest housing bubble ever. And AGM’s problems in 2008 reflected specific, fixable mistakes in their liquidity portfolio, not a fundamental problem with the core business.

With a broader view we see a company that is constantly, concretely, and quantifiably improving its ability to translate its unique privileges into an abnormally high and steady return on equity. And those of us prone to long term, optimistic thinking can’t help but analogize to Fannie’s millionaire making run between 1984 and 1999.

I could be wrong. But I don’t think many folks have put the time in to find out.

5 Real Estate Trusts To Outperform In 2015

by Morgan Myro

Summary

  • Economic conditions are ripe for real estate trusts with short-term leases to improve, while longer lease duration REIT types will advance at a reduced rate.
  • A presentation that suggests storage REITs are expensive and as such, other short-term lease property sectors are more desirable.
  • A review of 5 U.S. REITs set to outperform, specifically in the apartment and hotel spaces.

“Strength does not come from winning. Your struggles develop your strengths. When you go through hardships and decide not to surrender, that is strength.” – Arnold Schwarzenegger

One of the most popular long-term holdings for income investors involves the real estate market. While single-property investments carry returns through a landlord-type management system, whether personally attained or through a management company, REITs (real estate investment trusts) offer professionally managed real estate portfolios that operate property, manage an ideal portfolio and use leverage to grow.

An investor with an after-debt market value of $1 MM in a personal real estate book could offer between one and several properties depending on market value, as well as income which investors call the “nut.” While is well known, these mom-and-pop type investors could fare much better in terms of growth and reduced risk to trade their entire real estate portfolio (save their own home) for a slice of several multi-million and billion-dollar, professionally managed REITs that pay dividends.

With the U.S. economy expanding and rates set to rise, major implications signal that the environment exists now to favor REITs with short-term leases, especially in terms of single-family and longer-term lease holdings in the real estate market.

The U.S. REIT Market Sub-Sectors

The REIT market is heavily divided into several sub-sectors, such as hotels, apartments and healthcare. While there are non-traditional categories as well, such as resource, mortgage (mREITs) and structural REITs (such as cell phone towers, golf courses, etc…), this article focuses on what is known as traditional, equity REITs (eREITs).

The following map is a guide to discovering the wonderful world of REITs.

REIT Categories Set To Outperform Today

When it comes to REIT diversification, most investors classify their REIT portfolio in a traditional sense and avoid the non-traditional areas such as resource and mREITs. Income investors who do use mREITs to boost portfolio yield would be smart to categorize them as dividend stocks, as they do not generally own real estate.

Today the U.S. economy is fascinating investors as it continues to grow in the face of global turbulence, albeit at a slower post-recessionary recovery rate than normal. While this fact has caused concern, the economic trade-off is potentially very lucrative: slower long-term growth versus higher short-term growth followed by a recession.

In times of recession, short-term leases are not generally favorable as there is a general decline in demand for real estate. Those with long-term leases in stable sectors would be preferred, as companies such as Wal-Mart Stores, Inc. (NYSE:WMT) and other stable, long-term leaseholders would continue to operate.

In times of economic improvement, short-term leases are favored as there is a general uptick in demand for real estate. More people are working in upturns, which increases the supply of those looking to spend on all sorts of goods and services, of which real estate benefits.

Where Is The U.S. Economy Headed?

In looking at the U.S. unemployment rate, the clear trend is that more workers are entering the workforce (source: BLS) and that this trend will continue into 2015 with an estimated year-end unemployment rate of 5.2-5.3% (source: FOMC).

In addition to a trend of higher U.S. employment, U.S. GDP growth is also expected to continue to trend higher in 2015. The real GDP growth of 2.4% in 2014 is expected to increase to a range of 2.6% to 3.0% according to the Fed (central tendency), while Goldman Sachs (NYSE:GS) anticipates 3.1% growth on the heels of world GDP growth of 3.4%.

(click to enlarge)

In addition to favorable U.S. macroeconomic conditions, the U.S. dollar has trended higher in terms of both the U.S. dollar index versus leading currencies as well as in terms of emerging market and commodity nation currencies.

Termed currency risk, the flight to U.S. dollars increases the value of U.S. assets in terms of other global currencies while promoting the U.S. in terms of lowered-borrowing costs and an increase in investment demand.

All of these circumstances favor the U.S. real estate market and as such, the conditions for short-term lease operators in diversified publicly traded REITs are favorable for success.

5 Short-Term Lease REITs Set To Outperform

There are a few short-term lease operator types that may do well, which includes the residential, storage and hotel categories of the traditional REIT class.

While the self-storage outlook remains bright as this property sector has a short duration and a lower economic sensitivity to the business cycle, the aggregate sector valuation is high and the accompanying yields are relatively low with modest growth prospects.

In addition to the high valuations and low yields, the top U.S. storage REITs have increased on average 26% in the past six months. The following charts include Public Storage (NYSE:PSA), Extra Space Storage Inc. (NYSE:EXR), Cube Smart (NYSE:CUBE), and Sovran Self Storage Inc. (NYSE:SSS).

These companies are all large players in the self-storage segment of the traditional, equity REIT class.

(click to enlarge)

There has been a huge run-up in the self-storage REITs over the past six months, with annualized returns of 52.89% on an equal-weighted average. When compared to the U.S. traditional equity REIT market as represented by the Vanguard REIT ETF (NYSEARCA:VNQ), self-storage has significantly outperformed.

(click to enlarge)

In looking at the average yield in the self-storage property sector versus the VNQ, self-storage is more expensive.

(click to enlarge)

With the apartment and hotel sectors, there are companies that offer above-average yields while taking advantage of the short lease-durations that should outperform in conjunction with U.S. economic growth.

(click to enlarge)

To refocus on the lease durations, hotels are able to raise prices very quickly, while apartment landlords may increase rents after a year. Also, to note, the barriers to entry are constrained in a construction/approval cycle of two years for hotels and 1 to 1.5 years for the hotel and apartment landlords, respectively. Finally, the economic sensitivity is highest here, which equates to a faster uptick in demand during economic booms.

Hotel & Apartment Landlords To Outperform

The larger REITs in any property sector are generally more expensive versus smaller peers, which equates to a lower dividend and much larger acquisitions or developments needed (relative to smaller peers) to move the growth needle.

As seen by the average annualized six-month return of the five hotel and apartment REITs selected for this portfolio versus the VNQ, there hasn’t been such a dramatic over-performance versus the traditional equity REIT index.

In terms of yield, the group here easily outperforms the VNQ as well, with an average yield of 4.89%, versus 3.35% for VNQ. This represents 46% more income for investors of this select REIT portfolio versus the VNQ.

1. Camden Property Trust (NYSE:CPT)

Camden is the top under $10 billion apartment community landlord that focuses on high-growth markets in the sun-belt states.

Camden’s Diversified Portfolio As Of 11/5/14

The company recently announced a raise to their quarterly dividend by 6.1% and as such, their 5-year CAGR (compound annual growth rate) of their dividend is an impressive 9.24%.

The company also has $1 billion in development projects that are currently in construction and has $684 million in the pipeline for future development. Using the midpoint of 2015 FFO guidance of $4.46 per share and a share price of $76.99, the company has a FWD P/FFO ratio of 17.26, or a FWD FFO yield of 5.8%.

2. Mid-America Apartment Communities (NYSE:MAA)

Mid-America Apartment Communities is slightly smaller than CPT with a market capitalization of $5.92 billion versus CPT’s $6.83 billion. MAA is also a takeover candidate, as the company is valued at much less than CPT (16.1x 2014 FFO versus CPT 18.3x 2014 FFO) but has a very similar and overlapping portfolio.

MAA raised their dividend 5.5% this year and over the past five years, the company has a dividend CAGR of 4.6%.

3. Preferred Apartment Communities (NYSEMKT:APTS)

APTS is a new player to the U.S. REIT market; however, it is only valued at 9.69x 2014 FFO and is run by John Williams, the founder of Post Properties Inc. (NYSE:PPS), a $3.3 billion apartment landlord and developer.

APTS Property Map

The company recently traded at $10.05 per share, just above the 2011 IPO price of $10. Regarding the dividend, the quarterly payout was raised 9.4% in December 2014.

From their first December payout of $0.125 in 2011 to the recent December 2014 payout of $0.175 (due to short operating history), the company has a three-year dividend CAGR of 11.87%, which is higher than both CPT and MAA’s 5-year CAGR.

4. Chatham Lodging Trust (NYSE:CLDT)

Chatham is a small-cap hotel operator that has shown significant growth over the past year. They have converted the dividend to monthly distributions, which is sure to appease income investors. Since going public in 2010, the dividend has increased by an average of 11.38% per year.

Chatham is an owner of the business/family segment of the hotel properties. Name brands include Residence at Marriott, Courtyard by Marriott, Homewood Suites by Hilton, Hyatt Place and Hampton Inn. While diversified, the company has a major interest in Silicon Valley, CA, home of several major U.S. technology companies.

The company just financed a secondary offering that raised ~$120 million in gross proceeds, which surely will help fuel future growth in same-store sales as well as property acquisitions.

5. Hospitality Properties Trust (NYSE:HPT)

Hospitality Properties Trust is the owner of hotels as well as travel centers throughout the U.S. They own mid-tier hotels in a similar fashion to Chatham, including similarly branded properties such as Courtyard by Marriott and Residence Inn by Marriott.

HPT Property Map

With gas prices down and the economy up, both car travel and commercial trucking should have strong demand this year. As such, the travel center aspect of the business should do well.

The company offers a high-yield of ~6% currently, however the five-year dividend CAGR is less impressive at 1.72%. Investors should look at this company to operate in more of a bond-like fashion, with limited dividend increases and a slow increase in the value of the stock.

Conclusion

While many investors have suffered losses from the energy sector as well as many foreign holdings over the past year, one can only look forward to succeed. With the economic conditions ripe for short lease-duration U.S. REITs to advance, the potential return within this area of investment is too alluring to ignore.

When considering hotels, apartments and storage, storage looks expensive with a huge recent run-up while hotels and apartments look appealing. Rather than surrender to index investing, smart investors may choose to strengthen their portfolio with hotel and apartment REITs that are positioned today for continued growth and above-average dividend distributions.

To learn more about CPT, MAA and APTS, please read “Currency Risk: The New Normal,” published February 3, 2015.

To learn more about CLDT and HPT, please read Chatham Lodging Trust: Still An Attractive Yield PlayandHospitality Properties Trust: High-Yield Play Continues To Deliver,” both published by Bret Jensen on December 11, 2014 and August 12, 2014, respectively.

To learn more about property sector lease durations and characteristics of these sectors, please read Cohen & Steers July 2014 Viewpoint report, “What History Tells Us About REITs And Rising Rates.”

Millennials Are Finally Entering The Home Buying Market

First-time buyers Kellen and Ben Goldsmith are shown in their new town home, which they purchased for $620,000 in Seattle’s Eastlake neighborhood. (Ken Lambert / Tribune News Service.  Authored by Kenneth R. Harney

Call them the prodigal millennials: Statistical measures and anecdotal reports suggest that young couples and singles in their late 20s and early 30s have begun making a belated entry into the home-buying market, pushed by mortgage rates in the mid-3% range, government efforts to ease credit requirements and deep frustrations at having to pay rising rents without creating equity.

Listen to Kathleen Hart, who just bought a condo unit with her husband, Devin Wall, that looks out on the Columbia River in Wenatchee, Wash.: “We were just tired of renting, tired of sharing with roommates and not having a place of our own. Finally the numbers added up.”

Erin Beasley and her fiance closed on a condo in the Capitol Hill area of Washington, D.C., in January. “With the way rents kept on going,” she said, “we realized it was time” after five years as tenants. “With renting, at some point you get really tired of it — you want to own, be able to make changes” that suit you, not some landlord.

Hart and Beasley are part of the leading edge of the massive millennial demographic bulge that has been missing in action on home buying since the end of the Great Recession. Instead of representing the 38% to 40% of purchases that real estate industry economists say would have been expected for first-timers, they’ve lagged behind in market share, sometimes by as much as 10 percentage points. But new signs are emerging that hint that maybe the conditions finally are right for them to shop and buy:

• Redfin, a national real estate brokerage, said that first-time buyers accounted for 57% of home tours conducted by its agents mid-month — the highest rate in recent years. Home-purchase education class requests, typically dominated by first-timers, jumped 27% in January over a year earlier. “I think it is significant,” Redfin chief economist Nela Richardson said. “They are sticking a toe in the water.”

• The Campbell/Inside Mortgage Finance HousingPulse Tracking Survey, which monthly polls 2,000 realty agents nationwide, reported that first-time buyer activity has started to increase much earlier than is typical seasonally. First-timers accounted for 36.3% of home purchases in December, according to the survey.

• Anecdotal reports from realty brokers around the country also point to exceptional activity in the last few weeks. Gary Kassan, an agent with Pinnacle Estate Properties in the Los Angeles area, says nearly half of his current clients are first-time buyers. Martha Floyd, an agent with McEnearney Associates Inc. Realtors in McLean, Va., said she is working with “an unusually high” number of young, first-time buyers. “I think there are green shoots here,” she said, especially in contrast with a year ago.

Assuming these early impressions could point to a trend, what’s driving the action? The decline in interest rates, high rents and sheer pent-up demand play major roles.

But there are other factors that could be at work. In the last few weeks, key sources of financing for entry-level buyers — the Federal Housing Administration and giant investors Fannie Mae and Freddie Mac — have announced consumer-friendly improvements to their rules. The FHA cut its punitively high upfront mortgage insurance premiums and Fannie and Freddie reduced minimum down payments to 3% from 5%.

Price increases on homes also have moderated in many areas, improving affordability. Plus many younger buyers have discovered the wide spectrum of special financing assistance programs open to them through state and local housing agencies.

Hart and her husband made use of one of the Washington State Housing Finance Commission’s buyer assistance programs, which provides second-mortgage loans with zero interest rates to help with down payments and closing costs. Dozens of state agencies across the country offer help for first-timers, often with generous qualifying income limits.

Bottom line: Nobody knows yet whether or how long the uptick in first-time buyer activity will last, but there’s no question that market conditions are encouraging. It just might be the right time.

kenharney@earthlink.net Distributed by Washington Post Writers Group. Copyright © 2015, LA Times

http://youtu.be/cR7ApVgOz8s

Millions of Boomerang Buyers Poised to Re-Enter Housing Market

Millions of Boomerang Buyers Poised to Re-Enter Housing Marketby WPJ

According to RealtyTrac, the first wave of 7.3 million homeowners who lost their home to foreclosure or short sale during the foreclosure crisis are now past the seven-year window they conservatively need to repair their credit and qualify to buy a home as we begin 2015.

In addition, more waves of these potential boomerang buyers will be moving past that seven-year window over the next eight years corresponding to the eight years of above-normal foreclosure activity from 2007 to 2014.

Potential-Boomerang-Buyers-Nationwide-1.png

“The housing crisis certainly hit home the fact that home ownership is not for everyone, but those burned during the crisis should not immediately throw the baby out with the bathwater when it comes to their second chance at home ownership,” said Chris Pollinger, senior vice president of sales at First Team Real Estate, covering the Southern California market which has more than 260,000 potential boomerang buyers. “Home ownership done responsibly is still one of the best disciplined wealth-building strategies, and there is much more data available for home buyers than there was five years ago to help them make an informed decision about a home purchase.”

  • Nearly 7.3 million potential boomerang buyers nationwide will be in a position to buy again from a credit repair perspective over the next eight years.
  • Markets with the most potential boomerang buyers over the next eight years among metropolitan statistical areas with a population of at least 250,000.
  • Markets with the highest rate of potential boomerang buyers as a percentage of total housing units over the next eight years among metro areas with at least 250,000 people.
  • Markets most likely to see the boomerang buyers materialize are those where there are a high percentage of housing units lost to foreclosure but where current home prices are still affordable for median income earners and where the population of Gen Xers and Baby Boomers — the two generations most likely to be boomerang buyers — have held steady or increased during the Great Recession.
  • There were 22 metros among those with at least 250,000 people where this trifecta of market conditions is in place, making these metros the most likely nationwide to see a large number of boomerang buyers materialize in 2015 and beyond.

Potential-Boomerang-Buyers-Nationwide-2.png

Potential-Boomerang-Buyers-Nationwide-3.png

Potential-Boomerang-Buyers-Nationwide-4.png


Latest S&P/Case-Shiller Data Points to Potential Woes

by Phil Hall

The latest data from the S&P/Case-Shiller Home Price Indices found housing prices slowing down during November 2014, leading to concern of a possibly weak housing market for this year.

The 10-City Composite gained 4.2 percent year-over-year in November, but that was down from 4.4 percent in October. The 20-City Composite gained 4.3 percent year-over-year, which was down from 4.5 percent in October. The S&P/Case-Shiller U.S. National Home Price Index, which covers all nine U.S. census divisions, recorded a 4.7 percent annual gain in November 2014, slightly above the 4.6 percent level recorded one month earlier.

However, there was good news from November’s numbers: Miami and San Francisco posted annual gains of 8.6 percent and 8.9 percent, respectively, while Tampa, Atlanta, Charlotte, and Portland also saw year-over-year housing price increases.

David Blitzer, managing director and chairman of the Index Committee at S&P Dow Jones Indices, acknowledged that the housing market could be stronger.

“With the spring home buying season, and spring training, still a month or two away, the housing recovery is barely on first base,” Blitzer said. “Prospects for a home run in 2015 aren’t good. Strong price gains are limited to California, Florida, the Pacific Northwest, Denver, and Dallas. Most of the rest of the country is lagging the national index gains. Moreover, these price patterns have been in place since last spring. Existing home sales were lower in 2014 than 2013, confirming these trends.

“Difficulties facing the housing recovery include continued low inventory levels and stiff mortgage qualification standards,” Blitzer added. “Distressed sales and investor purchases for buy-to-rent declined somewhat in the fourth quarter. The best hope for housing is the rest of the economy where the news is better.”

Another Beloved Icon Bites the Dust

https://notinfrontofthechildren.files.wordpress.com/2012/09/skymall-zoom.jpgby Barbara Hollingsworth

SkyMall, the mail-order catalogue company that hawked its quirky wares to millions of bored airline passengers for 25 years, has filed for bankruptcy.

The in-flight purveyor of items you didn’t know you needed – from a glow-in-the-dark toilet seat to a serenity cat pod to baby blanket that looks like a tortilla – has gone belly up, the apparent victim of stiff competition from online retailers.

The company’s revenue plunged from $33.7 million in 2013 to $15.8 million during the first nine months of 2014, and company officials said e-commerce was largely to blame.

“With the increased use of electronic devices on planes, fewer people browsed the SkyMall in-flight catalog,” acting CEO Scott Wiley said in a statement on Friday.

The decreased readership led Delta Air Line to cancel the catalogue last year and Southwest Airlines planned to follow suit, according to the bankruptcy documents.

“We are extremely disappointed in this result and are hopeful that SkyMall and the iconic ‘SkyMall’ brand find a home to continue to operate.”

So does the Twitterverse, which erupted with sadness and nostalgia at news of the loss:

“Goodbye life-size Garden Yeti: A tribute to SkyMall, the best inflight magazine ever,” tweeted one fan.

“What the hell am I going to read on flights now? A real book?!? I think not,” tweeted another.


What Does The Bank Of Canada Know That We Don’t?

“Unprecedented deflation are pushing rates down. However, investors are holding 1/3 outstanding shares of ETF | TLT short: Betting that rates will go up.”

Article and video commentary by Christine Hughes

In a totally unexpected move, the Bank of Canada cut the overnight interest rate by 25 basis points on Wednesday. This of course should make you wonder what the Bank of Canada knows that the rest of us don’t! I mean usually the Bank indicates a bias towards cutting interest rates, but this was just out of the blue. It signals that the oil shock on the economy is going to be a lot more significant than anyone expected.

The Canadian dollar dropped vs. the US dollar thanks to the surprise move. Gold and silver prices climbed on safe-haven demand. Canadian bond yields plunged. As per Bloomberg: “’It’s a big shock,’ David Doyle, a strategist at Macquarie Capital Markets, said by phone from Toronto. “They’re going to try to provide the necessary medicine here for the soft landing from slowing debt growth, from slowing investment in the oil sands, and I think they thought it needed some stimulus here.”

No one probably stands to hurt more from plunging oil prices than Alberta.

Energy companies have started cutting capital expenditure, and this means job losses, which means a slowing housing market. In fact, plunging oil prices have seen home sales in Calgary tumble 37% in the first half of January, compared to a year earlier. Prices dropped 1.5%. And active listings soared by nearly 65%.

As you can see in the chart below, while you may have thought Toronto was a hot housing market these past several years, you’d be wrong. It was Calgary.
jan21
What’s the most worrisome about this is that everyone thinks Canada’s mortgages are different than what caused the US housing market to blow up. Well, not exactly. See, mortgage standards vary by province, and things in Alberta don’t look good.

There are two types of mortgages Alberta can issue: recourse and non-recourse. In a recourse mortgage, the bank can cease your house, sell it, and you will still owe the remaining balance of your mortgage. In a non-recourse mortgage, the bank can seize your house, and you the borrower can walk away. If the asset doesn’t sell for at least what you owe, then the bank has to absorb the loss.

Below is a chart, courtesy of RBC Capital Markets, which outlines that 35% of all Alberta mortgages (by the big 6 banks) are non-recourse. They can walk away!  Pay attention to Royal Bank especially:
jan21
There’s definitely a reason why the Bank of Canada is very concerned! By Christine Hughes

  • If things are getting better, why do global rates keep falling?
  • To much debt is causing deflation.
  • US has the highest relative rates, hence where everybody wants to invest.

http://youtu.be/dJh1OFrIobo

Why The Energy Selloff Is So Dangerous To The US Economy

https://i0.wp.com/www.topnews.in/files/job_losses.jpg
By Pam and Russ Martens:

Summary:

  • The global economy is producing far to much supply of most things, chasing to-little-demand from cash strapped consumers.
  • Prices of other industrial commodities are in steep decline.
  • Billions of dollars in investment capital are “risk off”.
  • An untold number of jobs spread across America are at risk.

Television pundits and business writers who are relentlessly pounding the table on how cheaper home heating oil and gas at the pump is going to provide a consumer windfall and ramp up economic activity have a simplistic view of how things work.

Oil-related companies in the U.S. now account for between 35 to 40 percent of all capital spending. Announcements of sharp cutbacks in capital spending and job reductions by these companies create big ripples, forcing related companies to trim their own budgets, revenue assumptions, and payrolls accordingly.

The announcements coming out of the oil patch are picking up steam and it’s not a pretty picture. Last week Schlumberger said it would eliminate 9,000 jobs, approximately 7 percent of its workforce, and trim capital spending by about $1 billion. Yesterday, Baker Hughes, the oilfield services company, announced 7,000 in job cuts, roughly 11 percent of its workforce, and expects the cuts to all come in the first quarter. Baker Hughes also announced a 20 percent reduction in capital spending. This morning, the BBC is reporting that BHP Billiton will cut 40 percent of its U.S. shale operations, reducing its number of rigs from 26 to 16 by the end of June.

When Big Oil cuts capital spending, we’re not talking about millions of dollars or even hundreds of millions of dollars; we’re talking billions. Last month, ConocoPhillips announced it had set its capital budget for 2015 at $13.5 billion, a reduction of 20 percent. Smaller players are also announcing serious cutbacks. Yesterday Bonanza Creek Energy said it would cut its capital spending by 36 to 38 percent.

Other big industrial companies in the U.S. are also impacted by the sharp slump in oil, which has shaved almost 60 percent off the price of crude in just six months. As the oil majors scale back, it reduces the need for steel pipes. U.S. Steel has announced that it will lay off approximately 750 workers at two of its pipe plants.

On January 15, the Federal Reserve Bank of Kansas City released a dire survey of what’s ahead in its “Fourth Quarter Energy Survey.” The survey found: “The future capital spending index fell sharply, from 40 to -59, as contacts expected oil prices to keep falling. Access to credit also weakened compared to the third quarter and a year ago.  Credit availability was expected to tighten further in the first half of 2015.” About half of the survey respondents said they were planning to cut spending by more than 20 percent while about one quarter of respondents expect cuts of 10 to 20 percent.

The impact of all of this retrenchment is not going unnoticed by sophisticated stock investors, as reflected in the major U.S. stock indices. On days when there is a notable plunge in the price of crude, the markets are following in lockstep during intraday trading. Yes, the broader stock averages continued to set new highs during the early months of the crude oil price decline in 2014 but that was likely due to the happy talk coming out of the Fed. It is also useful to recall that the Dow Jones Industrial Average traveled from 12,000 to 13,000 between March and May 2008 before entering a plunge that would take it into the 6500 range by March 2009.

Both the Federal Open Market Committee (FOMC) and Fed Chair Janet Yellen have assessed the plunge in oil prices as not of long duration. The December 17, 2014 statement from the FOMC and Yellen in her press conference the same day, characterized the collapse in energy prices as “transitory.” The FOMC statement said: “The Committee expects inflation to rise gradually toward 2 percent as the labor market improves further and the transitory effects of lower energy prices and other factors dissipate.”

If oil were the only industrial commodity collapsing in price, the Fed’s view might be more credible. Iron ore slumped 47 percent in 2014; copper has slumped to prices last seen during the height of the financial crisis in 2009. Other industrial commodities are also in decline.

A slowdown in both U.S. and global economic activity is also consistent with global interest rates on sovereign debt hitting historic lows as deflation takes root in a growing number of our trading partners. Despite the persistent chatter from the Fed that it plans to hike rates at some point this year, the yield on the U.S. 10-year Treasury note, a closely watched indicator of future economic activity, has been falling instead of rising. The 10-year Treasury has moved from a yield of 3 percent in January of last year to a yield of 1.79 percent this morning.

All of these indicators point to a global economy with far too much supply and too little demand from cash-strapped consumers. These are conditions completely consistent with a report out this week from Oxfam, which found the following:

“In 2014, the richest 1% of people in the world owned 48% of global wealth, leaving just 52% to be shared between the other 99% of adults on the planet. Almost all of that 52% is owned by those included in the richest 20%, leaving just 5.5% for the remaining 80% of people in the world. If this trend continues of an increasing wealth share to the richest, the top 1% will have more wealth than the remaining 99% of people in just two years.”

Crude Oil (WTI) Trading Versus the Dow Jones Industrial Average, December 1, 2014 Through January 12, 2015

Oil Bust will hurt housing in Texas, Oklahoma and Louisiana

https://i0.wp.com/eaglefordtexas.com/wp-content/uploads/sites/9/2015/01/gas-prices-620x330.jpg

Source: MRT.com

The oil boom that lifted home prices in Texas, Oklahoma and Louisiana is coming to an end.

Crude oil prices have crashed since June, falling by more than 54 percent to less than $50 a barrel. That swift drop has started to cripple job growth in oil country, creating a slow wave that in the years ahead may devastate what has been a thriving real estate market, according to new analysis by the real estate firm Trulia.

“Oil prices won’t tank home prices immediately,” Trulia chief economist Jed Kolko explained. “Rather, falling oil prices in the second half of 2014 might not have their biggest impact on home prices until late 2015 or in 2016.”

History shows it takes time for home prices in oil country to change course.

Kolko looked at the 100 largest housing markets where the oil industry accounted for at least 2 percent of all jobs. Asking prices in those cities rose 10.5 percent over the past year, compared with an average of 7.7 percent around the country.

Prices climbed 13.4 percent in Houston, where 5.6 percent of all jobs are in oil-related industries. The city is headquarters to energy heavyweights such as Phillips 66, Halliburton and Marathon Oil. Asking prices surged 10.2 percent in Fort Worth and 10.1 percent in Tulsa, Oklahoma. In some smaller markets, oil is overwhelmingly dominant — responsible for more than 30 percent of the jobs in Midland for instance.

The closest parallel to the Texas housing market might have occurred in the mid-1980s, when CBS was airing the prime-time soap opera “Dallas” about a family of oil tycoons.

In the first half of 1986, oil prices plunged more than 50 percent, to about $12 a barrel, according to a report by the Brookings Institution, a Washington-based think tank.

Job losses mounted in late 1986 around Houston. The loss of salaries eventually caused home prices to fall in the second half of 1987.

That led Kolko to conclude that since 1980, it takes roughly two years for changes in oil prices to hit home prices.

Of course, there is positive news for people living outside oil country, Kolko notes.

Falling oil prices lead to cheaper gasoline costs that reduce family expenses, freeing up more cash to spend.

“In the Northeast and Midwest especially, home prices tend to rise after oil prices fall,” he writes in the analysis.

Midland Texas, Hunkering Down For The Oil Bust

 Oilfield worker on a rigOilfield worker on a rig
Active pumping rig located on Highway 385 south of Odessa, photographed Tuesday, Sept. 24, 2014. James Durbin/Reporter-Telegram.  Source: MRT.com 

MIDLAND — With oil prices plummeting by more than 50 percent since June, the gleeful mood of recent years has turned glum here in West Texas as the frenzy of shale oil drilling has come to a screeching halt.

Every day, oil companies are decommissioning rigs and announcing layoffs. Small firms that lease equipment have fallen behind in their payments.

In response, businesses and workers are getting ready for the worst. A Mexican restaurant has started a Sunday brunch to expand its revenues beyond dinner. A Mercedes dealer, anticipating reduced demand, is prepared to emphasize repairs and sales of used cars. And people are cutting back at home, rethinking their vacation plans and cutting the hours of their housemaids and gardeners.

Dexter Allred, the general manager of a local oil field service company, began farming alfalfa hay on the side some years ago in the event that oil prices declined and work dried up. He was taking a cue from his grandfather, Homer Alf Swinson, an oil field mechanic, who opened a coin-operated carwash in 1968 — just in case.

“We all have backup plans,” Allfred said with a laugh. “You can be sure oil will go up and down, the only question is when.”

Indeed, to residents here in the heart of the oil patch, booms and busts go with the territory.

“This is Midland and it’s just a way of life,” said David Cristiani, owner of a downtown jewelry store, who keeps a graph charting oil prices since the late 1990s on his desk to remind him that the good times do not last forever. “We are always prepared for slowdowns. We just hunker down. They wrote off the Permian Basin in 1984, but the oil will always be here.”

It is at times like these that Midland residents recall the wild swings of the 1980s, a decade that began with parties where people drank Dom Pérignon out of their cowboy boots. Rolls-Royce opened a dealership, and the local airport had trouble finding space to park all the private jets.

By the end of the decade, the Rolls-Royce dealership was shut and replaced by a tortilla factory, and three banks had failed.

There has been nothing like that kind of excess over the past five years, despite the frenzy of drilling across the Permian Basin, the granddaddy of U.S. oil fields. Set in a forsaken desert where tumbleweed drifts through long-forgotten towns, the region has undergone a renaissance in the last four years, with horizontal drilling and fracking reaching through multiple layers of shale stacked one over the other like a birthday cake.

But since the Permian Basin rig count peaked at around 570 last September, it has fallen to below 490, and local oil executives say the count will probably go down to as low as 300 by April unless prices rebound.

The last time the rig count declined as rapidly was in late 2008 and early 2009, when the price of oil fell from more than $140 to under $40 a barrel because of the financial crisis.

Unlike traditional oil wells, which cannot be turned on and off so easily, shale production can be cut back quickly, and so the field’s output should slow considerably by the end of the year.

The Dallas Federal Reserve recently estimated that the falling oil prices and other factors will reduce job growth in Texas overall from 3.6 percent in 2014 to as low as 2 percent this year, or a reduction of about 149,000 jobs created.

Midland’s recent good fortune is plain to see. The city has grown in population from 108,000 in 2010 to 140,000 today, and there has been an explosion of hotel and apartment construction. Companies like Chevron and Occidental are building new local headquarters. Real estate values have roughly doubled during the past five years, according to Mayor Jerry Morales.

The city has built a new fire station and recruited new police officers with the infusion of new tax receipts, which increased by 19 percent from 2013 to 2014 alone. A new $14 million court building is scheduled to break ground next month.

But the city has also put away $39 million in a rainy-day fund for the inevitable oil bust.

“This is just a cooling-off period,” Morales said. “We will prevail again.”

Expensive restaurants are still full and traffic around the city can be brutal. Still, everyone seems to sense that the pain is coming, and they are preparing for it.

“We are responding to survive, so that we may once again thrive when we come out the other side,” said Steven H. Pruett, president and chief executive of Elevation Resources, a Midland-based oil exploration and production company. “Six months ago there was a swagger in Midland and now that swagger is gone.”

Pruett’s company had six rigs running in early December but now has only three. It will go down to one by the end of the month, even though he must continue to pay a service company for two of the rigs because of a long-term contract.

The other day Pruett drove to a rig outside of Odessa he feels compelled to park to save cash, and he expressed concern that as many as 50 service workers could eventually lose their jobs.

But the workers themselves seemed stoic about their fortunes, if not upbeat.

“It’s always in the back of your mind — being laid off and not having the security of a regular job,” said Randy Perry, a tool-pusher who makes $115,000 a year, plus bonuses, managing the rig crews. But Perry said he always has a backup plan because layoffs are so common — even inevitable.

Since graduating from high school a decade ago, he has bought several houses in East Texas and fixed them up, doing the plumbing and electrical work himself. At age 29 with a wife and three children, he currently has three houses, and if he is let go, he says he could sell one for a profit he estimates at $50,000 to $100,000.

Just a few weeks ago, he and other employees received a note from Trent Latshaw, the head of his company, Latshaw Drilling, saying that layoffs may be necessary this year.

“The people of the older generation tell the young guys to save and invest the money you make and have cash flow just in case,” Perry said during a work break. “I feel like everything is going to be OK. This is not going to last forever.”

The most nervous people in Midland seem to be the oil executives who say busts may be inevitable, but how long they last is anybody’s guess.

Over a lavish buffet lunch recently at the Petroleum Club of Midland, the talk was woeful and full of conspiracy theories about how the Saudis were refusing to cut supplies to vanquish the surging U.S. oil industry.

“At $45 a barrel, it shuts down nearly every project,” Steve J. McCoy, Latshaw Drilling’s director of business development, told Pruett and his guests. “The Saudis understand and they are killing us.”

Pruett nodded in agreement, adding, “They are trash-talking the price of oil down.”

“Everyone has been saying ‘Happy New Year,’” Pruett continued. “Yeah, some happy new year.”

GUNDLACH: Don’t Be Bottom-Fishing In Oil Stocks And Bonds

ducks bottom feedingSource: Business Insider

NEW YORK (Reuters) – DoubleLine Capital’s Jeffrey Gundlach said on Tuesday there is a possibility of a “true collapse” in U.S. capital expenditures and hiring if the price of oil stays at its current level.

Gundlach, who correctly predicted government bond yields would plunge in 2014, said on his annual outlook webcast that 35 percent of Standard & Poor’s capital expenditures comes from the energy sector and if oil remains around the $45-plus level or drops further, growth in capital expenditures could likely “fall to zero.”

Gundlach, the co-founder of Los Angeles-based DoubleLine, which oversees $64 billion in assets, noted that “all of the job growth in the (economic) recovery can be attributed to the shale renaissance.” He added that if low oil prices remain, the U.S. could see a wave of bankruptcies from some leveraged energy companies.

Brent crude approached a near six-year low on Tuesday as the United Arab Emirates defended OPEC’s decision not to cut output and traders wondered when a six-month price rout might end.

Brent has fallen as low as just above $45 a barrel, near a six-year low, having averaged $110 between 2011 and 2013.

Gundlach said oil prices have to stop going down so “don’t be bottom-fishing in oil” stocks and bonds. “There is no hurry here.”

Energy bonds, for example, have been beaten up and appear attractive on a risk-reward basis, but investors need to hedge them by purchasing “a lot, lot of long-term Treasuries. I’m in no hurry to do it.”

High-yield junk bonds have also been under severe selling pressure. Gundlach said his firm bought some junk in November but warned that investors need to “go slow” and pointed out “we are still underweight.”

Gundlach said U.S. stocks could outperform other countries’ equities as the economic recovery looks stronger than its counterparts, though double-digit gains cannot be repeated.

He also reiterated that it’s possible yields on the benchmark 10-year Treasury note could drop to 1 percent in 2015. The 10-year yield traded around 1.91 percent on Tuesday, little changed from late on Monday after hitting 20-month low of 1.8640 percent.

“The 10-year Treasury could join the Europeans and go to 1 percent. Why not?” Gundlach told Reuters last month. “If oil goes to $40, then the 10-year could be going to 1 percent.”

The yield on 10-year German Bunds stood at 0.47 percent on Tuesday.


Meanwhile…

Jeff Gundlach Unveils His Outlook For 2015

Screen Shot 2015 01 13 at 4.13.56 PM

by: Myles Unland

“V”

This is the title of the latest webcast from DoubleLine Capital’s Jeffrey Gundlach, who just wrapped up a webcast giving his outlook for 2015.

We last heard from Gundlach in December when he held a presentation called “This Time It’s Different,” in which he talked about the oil markets, the dollar, and how the 10-year Treasury bond could get to 1%.

Among the things Gundlach believes 2015 has in store for the market is more volatility, lower Treasury yields, and a Federal Reserve rate hike, “just to see if they can do it.”

Gundlach spent a good chunk of his open talking about the effects that the decline in oil will have on jobs growth and capital investment in the US, noting that 35% of capital investment from the S&P 500 is related to the energy sector.

The bull case for the US in 2015, Gundlach said, is predicated primarily on the strength of the US labor market. Meanwhile the chart of the year so far is the US 10-year yield against other major economies, with the US clearly having space to converge towards the super-low yields seen on 10-year bonds in Japan, Germany, and Switzerland.

We’ve broken out a number of Gundlach’s slides below and added commentary taken as he spoke live on Tuesday.

  • 4:22 PM

  • Gundlach’s leading slide.

Screen Shot 2015 01 13 at 4.21.40 PM

  • 4:22 PM

  • Gundlach says of the title that it stands for the fifth year that he’s being these webcasts, but also has a market theme. “Most risk markets have gone into a V since about June.”

Says that the “touchdown” part of the drop in oil is that consumers get more money in their pocket. “I think that’s one of the reasons, rightly, that people view the oil decline as somewhat positive.”

Gundlach says that there is a sinister side to the oil decline, which is potential impacts on employment in the US, particularly in the energy space.

Gundlach says “all of the job growth” from the recession until today can be attributed to the shale oil boom.

  • 4:25 PM

  • Gundlach says that if oil stays anywhere near where it is today, we’re going to see leveraged energy companies go bankrupt.

“And maybe some other things related to that.”

  • 4:27 PM

  • Gundlach said that in 2014 he thought bonds would return 6%. The Barclays Aggregate Bond Index returned 6%.

Screen Shot 2015 01 13 at 4.26.43 PM

  • 4:28 PM

  • Gundlach says, as he did in December, “TIPS are for losers, that’s for sure.”

  • 4:30 PM

  • Every yield curve flattened in 2014.

Screen Shot 2015 01 13 at 4.29.59 PM

  • 4:31 PM

  • “It wasn’t the US of A in 2014, but the US of Only.”

US stocks were the only really strong equity markets among major developed economies. Chinese and Indian stocks were big winners among emerging markets.

Screen Shot 2015 01 13 at 4.30.40 PM

  • 4:34 PM

  • Gundlach says he’s been positive on the US dollar since 2011. This was a huge consensus trade in 2014, and Gundlach says sometimes the consensus is right.

“It looks to me like the dollar is headed higher.”

Gundlach says he knows long dollar is a crowded trade, but the fundamentals bolstering a strong dollar remain in tact.

Additionally, Gundlach thinks the Fed will raise rates with a few more months of strong payrolls gains, which will only make the dollar stronger.
Screen Shot 2015 01 13 at 4.32.01 PM

  • 4:35 PM

  • Gundlach says his investments are still dollar-denominated.

  • 4:36 PM

  • What a year for the ruble.

Screen Shot 2015 01 13 at 4.35.43 PM

  • 4:37 PM

  • Mutual fund flows in 2014 looked a lot like 2007.

Screen Shot 2015 01 13 at 4.37.07 PM

  • 4:38 PM

  • The Long Bond had one of the best years ever in 2014.

Screen Shot 2015 01 13 at 4.38.03 PM

  • 4:39 PM

  • Gundlach said that in 2012, when bonds hit their low he had a 90% conviction that that would THE low for bonds. His conviction is less than that now.

  • 4:40 PM

  • 2014 was a disaster for commodities.

The best commodity in 2014 was gold.

Screen Shot 2015 01 13 at 4.39.46 PM

  • 4:42 PM

  • The white line is the commodity index, the yellow line is the commodity index you can actually invest in.

Investable commodities have been losers for years.

Gundlach says you lost 800 basis points per annum over the last 10 years investing in commodities.

Screen Shot 2015 01 13 at 4.40.56 PM

  • 4:42 PM

  • Gold gained ground in basically every currency except the US dollar in 2014.

Screen Shot 2015 01 13 at 4.42.11 PM

  • 4:43 PM

  • “Gold is on a stealthy rally and I suspect gold is going to be headed higher not lower.”

  • 4:43 PM

  • Gold gained 89% in ruble terms last year.

Screen Shot 2015 01 13 at 4.43.19 PM

  • 4:45 PM

  • “Bitcoin is on its way to being relegated to the ash heap of digital currencies.”

  • 4:47 PM

  • “One of the great vintages of Chateau Mouton.”

Screen Shot 2015 01 13 at 4.46.31 PM

  • 4:49 PM

  • Gundlach says the labor market is the backbone of the US bull case in 2015.

The number of companies worrying about poor sales is dropping, while there is a modest increase concerns about the quality of labor.

Gundlach says he is “from Missouri” on this one. He will wait to see wage growth show up before making the case for a lift off in wages.

  • 4:50 PM

  • The job scenario is stronger as fewer people apply for disability.

Screen Shot 2015 01 13 at 4.49.14 PM

  • 4:50 PM

  • Food stamp usage has been flat over the last few years.

Screen Shot 2015 01 13 at 4.50.01 PM

  • 4:52 PM

  • This is the most bullish chart of 2015.

Oil prices have been correlated with GDP growth 18 months forward.

And so this chart implies 3+% global growth going forward.

“On balance this should be viewed as an encouraging indicator.”

Gundlach doesn’t think, however that global growth is going to be upgraded in 2015, and like the last several years will be downgraded as the year goes along.

Screen Shot 2015 01 13 at 4.51.07 PM

  • 4:53 PM

  • The S&P 500 has been strong against the rest of the world since 2010, but this trend really accelerated in June of 2015.

Screen Shot 2015 01 13 at 4.52.34 PM

  • 4:54 PM

  • Gundlach says US outperformance “isn’t really a great sign.” But says US is probably the preferred place to invest against the rest of the world, however.

“It’s almost impossible for the gains from June 2014 to now to be repeated this year.”

  • 4:55 PM

  • Bear case is three big slides, Gundlach says.

  • 4:55 PM

  • The stock market has never been up seven years in a row.

Screen Shot 2015 01 13 at 4.55.26 PM

  • 4:56 PM

  • Gundlach adds that its rare for the bond market to go up three years in a row, and that happened in 2010, 2011, and 2012.

“Lo and behold, they didn’t go up in 2013.”

  • 4:57 PM

  • Margin debt has peaked, and with Fed raising rates, Gundlach says it seems likely that margin debt would likely shrink.

Screen Shot 2015 01 13 at 4.56.47 PM

“Let’s just say the S&P 500 has not gone up.”

“This seems to have been a predictable headwind, and it’s staring at us again.”

Screen Shot 2015 01 13 at 4.57.27 PM

  • 4:59 PM

  • Gunlach says stocks diverging from junk bonds is the most worrying signal coming out of markets right now.

  • 5:02 PM

  • Gundlach thinks we could go into an “overshoot” of low yields with yields rising in the second part of this year.

The path of least resistance to Gundlach seems to be for lower bond yields.

  • 5:04 PM

  • “I’ll bet you dollars to donuts the red line goes down.”

Gundlach says that oil just can’t stop going down. Last year, Treasury yields couldn’t stop going down, and this year oil can’t seem to stop going down.

Adds that contrarianism is dagnerous in commodities and stocks, says that contrarian investing is tempting, but oil is just a dangerous trade right now.

Screen Shot 2015 01 13 at 5.03.19 PM

  • 5:06 PM

  • Gundlach says that once oil broke $70, it would create acceptance that oil isn’t going back to $95, causing producers to increase production because they need the revenue, not cut production to boost prices.

And so here we are.

  • 5:08 PM

  • “When one sector gets weak, don’t make the rookie mistake of thinking that everything around it is fine.”

“It’s too early to be going all-in on the concept that we’re at the bottom of the oil or junk bond cycle.”

“Go slow.”

Gundlach says DoubleLine is still underweight junk bonds.

Gundlach says CPI is down over the last six months, and it is going to be negative.

Screen Shot 2015 01 13 at 5.08.32 PM

  • 5:10 PM

  • “So the Fed is kind of in a dilemma.”

The employment situation looks like it might be time to raise rates, but the inflation data is saying the opposite.

  • 5:10 PM

  • Non-government inflation data is also cratering.

Screen Shot 2015 01 13 at 5.10.03 PM

  • 5:11 PM

  • “The bloodless verdict of the bond market says that inflation will be negative for two years.”

Screen Shot 2015 01 13 at 5.10.39 PM

  • 5:14 PM

  • The chart of the year for bonds so far.

Screen Shot 2015 01 13 at 5.14.14 PM

  • 5:15 PM

  • Gundlach says the bond chart of the year is part of the argument about why oil at $40, weighing on inflation, could bring the 10-year below its 2012 lows.

  • 5:16 PM

  • “Watch this closely.”

Gundlach says something happened when investors got scared of Spanish and Italian bonds.

Screen Shot 2015 01 13 at 5.15.43 PM

  • 5:17 PM

  • “A harbinger of doom for the eurozone.”

Screen Shot 2015 01 13 at 5.16.17 PM

  • 5:19 PM

  • “This is what I think is going to happen in the US.”

Since the financial crisis, every interest rate hike has been accompanied by a reversal, and Gundlach thinks this will happen again.

Gundlach says, as he did in December, that he thinks the Fed is going to raise rates “just to do it.”

Screen Shot 2015 01 13 at 5.18.12 PM

  • 5:19 PM

  • Gundlach says that not a single OPEC member can balance their budget at current oil prices.

  • 5:20 PM

  • “I am quite sure that one of the things ‘V’ can represent in 2015 is volatility.”

“I expect this year to have substantially higher volatility than past years.”

Screen Shot 2015 01 13 at 5.19.54 PM

  • 5:21 PM

  • This chart corroborates the idea that maybe $50 is normal and that $100 oil was the outlier.

Screen Shot 2015 01 13 at 5.20.57 PM

  • 5:22 PM

  • 35% of CapEx in the S&P 500 is in the energy space, Gundlach says.

“That could cause some trouble.”

  • 5:24 PM

  • There are essentially no cities in China with rising home prices.

Screen Shot 2015 01 13 at 5.24.10 PM

  • 5:25 PM

  • “No wonder China is talking about a $10 trillion stimulus program.”

  • 5:25 PM

  • “You wonder how many lives this cat can have.”

Gundlach on the real estate market in China.

  • 5:26 PM

  • The good news? We won’t see high-yield debt defaults for a few years because everyone has refinanced their debt.

“There are lots of reasons to think rates should rise in five years, but not much in five days or five months.”
Screen Shot 2015 01 13 at 5.25.39 PM

  • 5:28 PM

  • Let’s talk about something you should not own …

Mall REITS.

Gundlach says that with online sales at 9% of retail sales coming online, it seems low. But consider that you can’t buy gasoline online, you don’t really buy groceries online.

“People don’t want the median banana.”

  • 5:29 PM

  • The Mall REIT index is up 35% or so in the last 12 months.

This seems like a horrible idea, Gundlach says.

“If you hate corporate bonds yielding 3%, if you hate mortgages yielding 3%, then how could you want to own a Mall REIT yielding 3%?”

Screen Shot 2015 01 13 at 5.28.43 PM

  • 5:31 PM

  • Gundlach says Russia doesn’t become a good speculative bet until oil stops dropping.

“You’ve got to see oil put in a low, a consolidation. Until then, Russia is dagnerous.”

  • 5:33 PM

  • Thoughts on Tesla, given oil …

“I think of all the car companies, Tesla is less of a car company than any other.”

“I’m surprised that anyone would change their car buying habits based on the six-month price of oil. Tesla isn’t so much a play on cars being sold, but on batteries being transformative in many phases of life.”

Gundlach again talking about potential for Tesla’s batteries to get homes entirely off the grid.

“Tesla has as good a chance as anybody to develop a battery that can change the world.”

Says that the stock is hugely overvalued if you just look at the auto sales.

21 Hot Housing Trends

Everyone wants to be hip, and the latest trends in design can help distinguish one home from another. And it’s not all flash; many new home fads are geared to pare maintenance and energy use and deliver information faster. Here’s a look at what’s coming.


This time of the year, we hear from just about every sector of the economy what’s expected to be popular in the coming year. Foodies with their fingers on the pulse of the restaurant industry and hot TV chefs will tell us to say goodbye to beet-and-goat cheese salad and hello roasted cauliflower, and there’s no end to the gadgets touted as the next big thing.

In real estate, however, trends typically come slowly, often well after they appear in commercial spaces and fashion. And though they may entice buyers and sellers, remind them that trends are just that—a change in direction that may captivate, go mainstream, then disappear (though some will gain momentum and remain as classics). Which way they’ll go is hard to predict, but here are 21 trends that experts expect to draw great appeal this year:


  1. Coral shades
    . A blast of a new color is often the easiest change for sellers to make, offering the biggest bang for their buck. Sherwin-Williams says Coral Reef (#6606) is 2015’s color of the year because it reflects the country’s optimism about the future. “We have a brighter outlook now that we’re out of the recession. But this isn’t a bravado color; it’s more youthful, yet still sophisticated,” says Jackie Jordan, the company’s director of color marketing. She suggests using it outside or on an accent wall. Pair it with crisp white, gray, or similar saturations of lilac, green, and violet.

  2. Open spaces go mainstream
    . An open floor plan may feel like old hat, but it’s becoming a wish beyond the young hipster demographic, so you’ll increasingly see this layout in traditional condo buildings and single-family suburban homes in 2015. The reason? After the kitchen became the home’s hub, the next step was to remove all walls for greater togetherness. Design experts at Nurzia Construction Corp. recommend going a step further and adding windows to better meld indoors and outdoors.
  3. Off-the-shelf plans. Buyers who don’t want to spend time or money for a custom house have another option. House plan companies offer myriad blueprints to modify for site, code, budget, and climate conditions, says James Roche, whose Houseplans.com firm has 40,000 choices. There are lots of companies to consider, but the best bets are ones that are updating layouts for today’s wish lists—open-plan living, multiple master suites, greater energy efficiency, and smaller footprints for downsizers (in fact, Roche says, their plans’ average now is 2,300 square feet, versus 3,500 a few years ago). Many builders will accept these outsiders’ plans, though they may charge to adapt them.
  4. Freestanding tubs. Freestanding tubs may conjure images of Victorian-era opulence, but the newest iteration from companies like Kohler shows a cool sculptural hand. One caveat: Some may find it hard to climb in and out. These tubs complement other bathroom trends: open wall niches and single wash basins, since two people rarely use the room simultaneously.
  5. Quartzite. While granite still appeals, quartzite is becoming the new hot contender, thanks to its reputation as a natural stone that’s virtually indestructible. It also more closely resembles the most luxe classic—marble—without the drawbacks of staining easily. Quartzite is moving ahead of last year’s favorite, quartz, which is also tough but is manmade.

  6. Porcelain floors
    . If you’re going to go with imitation wood, porcelain will be your 2015 go-to. It’s less expensive and wears as well as or better than the real thing, says architect Stephen Alton. Porcelain can be found in traditional small tiles or long, linear planks. It’s also available in numerous colors and textures, including popular one-color combos with slight variations for a hint of differentiation. Good places to use this material are high-traffic rooms, hallways, and areas exposed to moisture.
  7. Almost Jetson-ready. Prices have come down for technologies such as web-controlled security cameras and motion sensors for pets. Newer models are also easier to install and operate since many are powered by batteries, rather than requiring an electrician to rewire an entire house,says Bob Cooper at Zonoff, which offers a software platform that allows multiple smart devices to communicate with each other. “You no longer have to worry about different standards,” Cooper says.
  8. Charging stations. With the size of electronic devices shrinking and the proliferation of Wi-Fi, demand for large desks and separate home office is waning. However, home owners still need a dedicated space for charging devices, and the most popular locations are a corner of a kitchen, entrance from the garage, and the mud room. In some two-story Lexington Homes plans, a niche is set aside on a landing everyone passes by daily.
  9. Multiple master suites. Having two master bedroom suites, each with its own adjoining bathroom, makes a house work better for multiple generations. Such an arrangement allows grown children and aging parents to move in for long- or short-term stays, but the arrangement also welcomes out-of-town guests, according to Nurzia Construction. When both suites are located on the main level, you hit the jackpot.
  10. Fireplaces and fire pits. The sight of a flame—real or faux—has universal appeal as a signal of warmth, romance, and togetherness. New versions on the market make this amenity more accessible with more compact design and fewer venting concerns. This year, be on the lookout for the latest iteration on this classic: chic, modern takes on the humble wood stove.
  11. Wellness systems. Builders are now addressing environmental and health concerns with holistic solutions, such as heat recovery ventilation systems that filter air continuously and use little energy, says real estate developer Gregory Malin of Troon Pacific. Other new ways to improve healthfulness include lighting systems that utilize sunshine, swimming pools that eschew chlorine and salt by featuring a second adjacent pool with plants and gravel that cleanse water, and edible gardens starring ingredients such as curly blue kale.

  12. Storage
    . The new buzzword is “specialized storage,” placed right where it’s needed. “Home owners want everything to have its place,” says designer Jennifer Adams. More home owners are increasingly willing to pare the dimensions of a second or third bedroom in order to gain a suitably sized walk-in closet in their master bedroom, Alton says. In a kitchen, it may mean a “super pantry”—a butler’s pantry on steroids with prep space, open storage, secondary appliances, and even a room for wrapping gifts. “It minimizes clutter in the main kitchen,” says architect Fred Wilson of Morgante-Wilson.

  13. Grander garages
    . According to Troon Pacific, the new trends here include bringing the driveway’s material into the garage, temperature controls, sleek glass doors, specialized zones for home audiovisual controls, and a big sink or tub to wash pets. For home owners with deeper pockets, car lifts have gone residential so extra autos don’t have to be parked outside.
  14. Keyless entry. Forget your key (again)? No big deal as builders start to switch to biometric fingerprint door locks with numerical algorithms entered in a database. Some systems permit home owners to track who entered and when, says Malin of Troon Pacific.
  15. Water conservation. The concerns of drought-ravaged California are spreading nationwide. Home owners can now purchase rainwater harvesting tanks and cisterns, gray water systems, weather-controlled watering stations, permeable pavers, drought-tolerant plants, and no- or low-mow grasses.

  16. Salon-style walls
    . Instead of displaying a few distinct pieces on a wall, the “salon style” trend features works from floor to ceiling and wall-to-wall. Think Parisian salon at the turn of the century. HGTV designer Taniya Nayak suggests using a common denominator for cohesiveness, such as the same mat, frame color, or subject matter. Before she hangs works, she spaces them four to five inches apart, starting at the center and at eye level and working outward, then up and down. She uses Frog Tape to test the layout since it doesn’t take paint off walls. Artist Francine Turk also installs works this way, but prefers testing the design on the floor like a big jigsaw puzzle.

  17. Cool copper
    . First came pewter; then brass made a comeback. The 2015 “it” metal is copper, which can exude industrial warmth in large swaths or judiciously in a few back splash tiles, hanging fixture, or pots dangling from a rack. The appeal comes from the popularity of industrial chic, which Restoration Hardware’s iconic style has helped promote, says designer Tom Segal.
  18. Return to human scale. During the McMansion craze, kitchens got so big they almost required skates to get around. This year we’ll see a return to a more human, comfortable scale, says Mark Cutler, chief designer of design platform nousDecor. In many living or family rooms that will mean just enough space for one conversation grouping, and in kitchens one set of appliances, fewer counter tops, and smaller islands.

  19. Luxury 2.0
    . Getting the right amount of sleep can improve alertness, mood, and productivity, according to the National Sleep Foundation. With trendsetters such as Arianna Huffington touting the importance of sleep, there’s no doubt this particular health concern will go mainstream this year. And there’s no space better to indulge the desire for quality rest than in a bedroom, says designer Jennifer Adams. “Everyone is realizing the importance of comfort, quality sleep, and taking care of yourself,” she says. To help, Adams suggests stocking up on luxury bedding, a new mattress, comfortable pillows, and calming scents.

  20. Shades of white kitchens
    . Despite all the variations in colors and textures for kitchen counters, backsplashes, cabinets, and flooring, the all-white kitchen still gets the brass ring. “Seven out of 10 of our kitchens have some form of white painted cabinetry,” says builder Peter Radzwillas. What’s different now is that all-white does not mean the same white, since variations add depth and visual appeal. White can go from stark white to creamy and beyond to pale blue-gray, says Radzwillas. He also notes that when cabinets are white, home owners can choose bigger, bolder hardware.
  21. Outdoor living. Interest in spending time outdoors keeps mushrooming, and 2015 will hold a few new options for enhancing the space, including outdoor showers adjacent to pools and hot tubs along with better-equipped roof decks for urban dwellers. Also expect to see improvements in perks for pets, such as private dog runs and wash stations, says landscape architect Jean Garbarini of Damon Farber Associates.

While it’s fun to be au courant with the latest trends, it’s also wise to put what’s newest in perspective for your clients. Remind them that the ultimate decision to update should hinge on their needs and budgets, not stargazers’ tempting predictions.

Bill Gross Sees No Rate Increase Until Late 2015 ‘If at All’

Bill Gross

for Bloomberg News

Bill Gross, the former manager of the world’s largest bond fund, said the Federal Reserve won’t raise interest rates until late this year “if at all” as falling oil prices and a stronger U.S. dollar limit the central bank’s room to increase borrowing costs.

While the Fed has concluded its three rounds of asset purchases, known as quantitative easing, interest rates in almost all developed economies will remain near zero as central banks in Europe and Japan embark on similar projects, Gross said today in an outlook published on the website of Janus Capital Group Inc. (JNS:US), where he runs the $1.2 billion Janus Global Unconstrained Bond Fund.

“With the U.S. dollar strengthening and oil prices declining, it is hard to see even the Fed raising short rates until late in 2015, if at all,” he said. “With much of the benefit from loose monetary policies already priced into the markets, a more conservative investment approach may be warranted by maintaining some cash balances. Be prepared for low returns in almost all asset categories.”

Benchmark U.S. oil prices fell below $50 a barrel for the first time in more than five years today, as surging supply signaled that the global glut that drove crude into a bear market will persist. Gross, the former chief investment officer of Pacific Investment Management Co. who left that firm in September to join Janus, said in a Dec. 12 Bloomberg Surveillance interview with Tom Keene that the Fed has to take lower oil prices “into consideration” and take more of a “dovish” stance.

Yields on the 10-year U.S. Treasury note fell to 2.05 percent today, the lowest level since May 2013. Economists predict the U.S. 10-year yield will rise to 3.06 percent by end of 2015, according to a Bloomberg News survey with the most recent forecasts given the heaviest weightings.

Midland Texas Posts Largest Percentage Gain In Employment Again

Down town Midland TX, financial center of the Permian Basin.  Article Source: Midland Reporter – Telegram

For the second straight month, Midland showed the nation’s largest over-the-year percentage gain in employment, according to figures released last week by the Bureau of Labor Statistics.

Midland reported a 6.2 percent increase in employment during the month of November. The number of employed increased from 95,200 to 96,000. Odessa (a drilling town next door to Midland) was second in the nation with a growth rate of 4.7 percent.

Midland also bettered its position among the metropolitan statistical areas with the lowest unemployment rates. In October, Midland was tied for fifth with a 2.5 percent jobless rate. In November, with the rate dropping to 2.3 percent, Midland was ranked fourth. Lincoln, Nebraska, took home the top spot with a 2.1 percent rate. Makato, Minnesota, and Fargo, North Dakota, tied for second at 2.2 percent.

There were 14 MSAs with unemployment rates at or below 3 percent during the month of November, including Odessa at 2.8 percent. There were 34 MSAs at 3.5 percent or below.

The following are the lowest unemployment rates in the nation during the month of November, according to the Bureau of Labor Statistics:

  • Lincoln, Nebraska, 2.1
  • Mankato, Minnesota, 2.2
  • Fargo, North Dakota, 2.2
  • Midland 2.3
  • Bismarck, North Dakota, 2.5
  • Ames, Iowa, 2.5
  • Logan, Utah, 2.5
  • Iowa City, Iowa, 2.6
  • Rochester, Minnesota, 2.6
  • Grand Forks, North Dakota, 2.7
  • Sioux Falls, South Dakota, 2.7
  • Odessa 2.8
  • Minneapolis, St. Paul, 3.0
  • Omaha, Nebraska, 3.0

Lowest rates from October:

Bismarck, North Dakota, 2.0; Fargo, North Dakota, 2.2; Lincoln, Nebraska, 2.3. Also: Midland 2.5

Lowest rates from September:

Bismarck, North Dakota 2.1; Fargo, North Dakota 2.3; Midland 2.6

Lowest rates from August:

Bismarck, North Dakota 2.2, Fargo North Dakota 2.4; Midland 2.8.

Lowest rates from July:

Bismarck, North Dakota, 2.4; Sioux Falls, South Dakota, 2.7; Fargo, North Dakota, 2.8; Midland 2.9.

Lowest rates from June:

Bismarck, North Dakota, 2.6, Midland 2.9, Fargo, North Dakota, 3.0.

Lowest rates from May:

Bismarck, North Dakota, 2.2, Fargo, North Dakota, 2.5, Logan, Utah, 2.5, Midland 2.6.

Lowest rates from April:

Midland 2.3, Logan, Utah 2.5, Bismarck, North Dakota 2.6, Ames, Iowa 2.7.

Lowest rates from March:

Midland 2.7, Houma-Bayou Cane-Thibodaux, La. 3.1, Bismarck, N.D. 3.1, Odessa 3.3, Fargo, N.D. 3.3, Ames, Iowa 3.3, Burlington, Vt. 3.3

Lowest rates from February:

Houma-Bayou Cane-Thibodaux, La. 2.8; Midland 3.0; Lafayette, La. 3.1

Lowest rates from January:

Midland 2.9; Logan, Utah 3.3; Bismarck, N.D. 3.4

Lowest rates from December:

Bismarck, N.D. 2.8; Logan, Utah 2.8; Midland 2.8

Gundlach, new “King Of Bonds” sees 10Y Treasury testing 1.38% in 2015

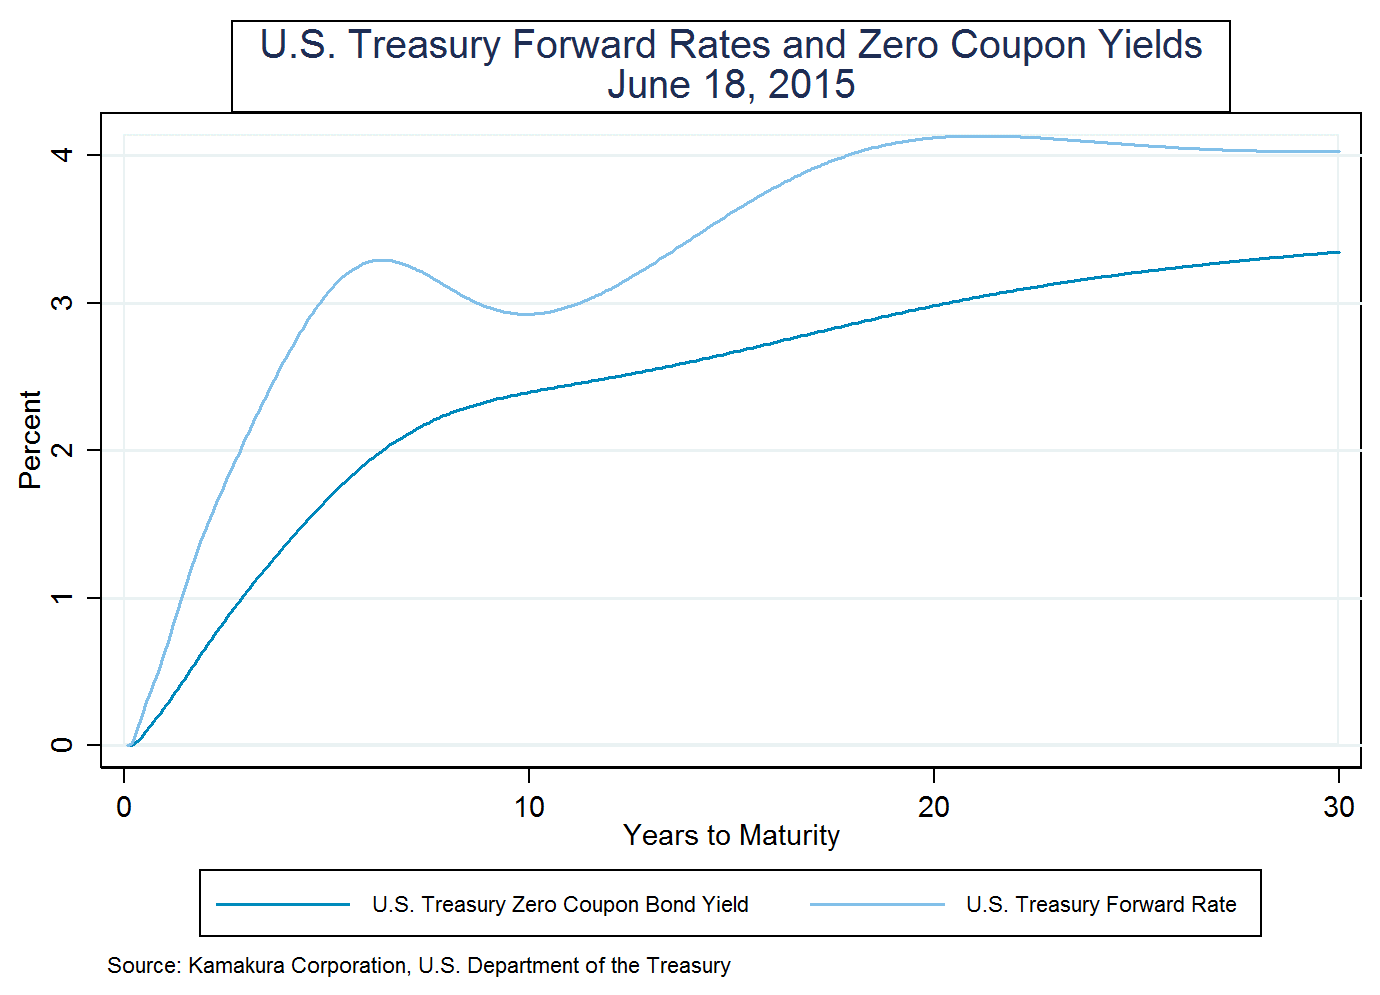
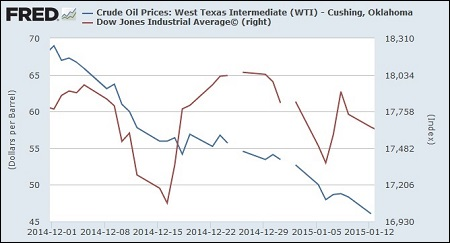
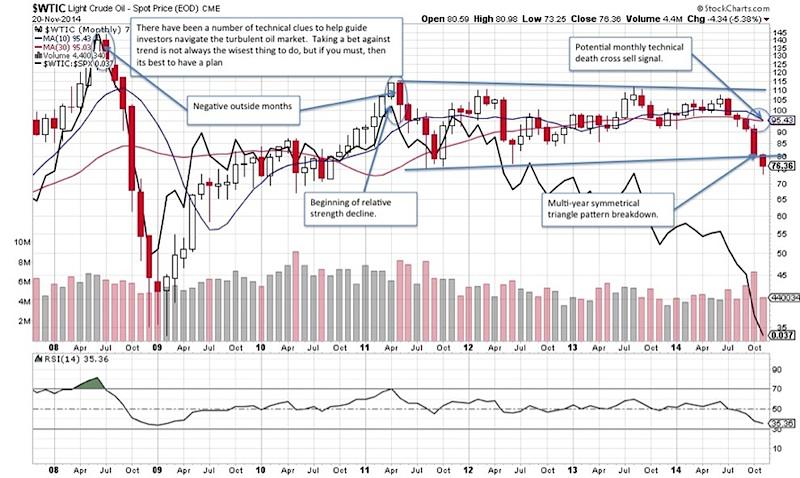
Having totally and utterly failed in 2014, the consensus for 2015 is once again higher rates (well they can’t go any lower right?) with year-end 2015 expectations of 3.006% currently (having already plunged from over 3.65% in July). However, at the other end of the spectrum, DoubleLine’s Jeff Gundlach told Barron’s this weekend, the 10-yr Treasury yield may test the 2012 low of 1.38% as the Fed’s short-term rate increase is poised to trigger “surprising flattening” of the yield curve.     Source: Zero Hedge

Gundlach’s forecast is ‘very’ anti-consensus…

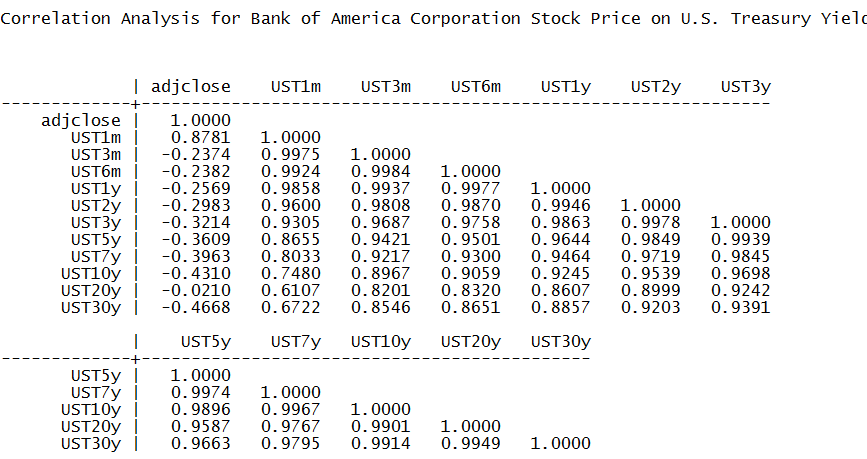
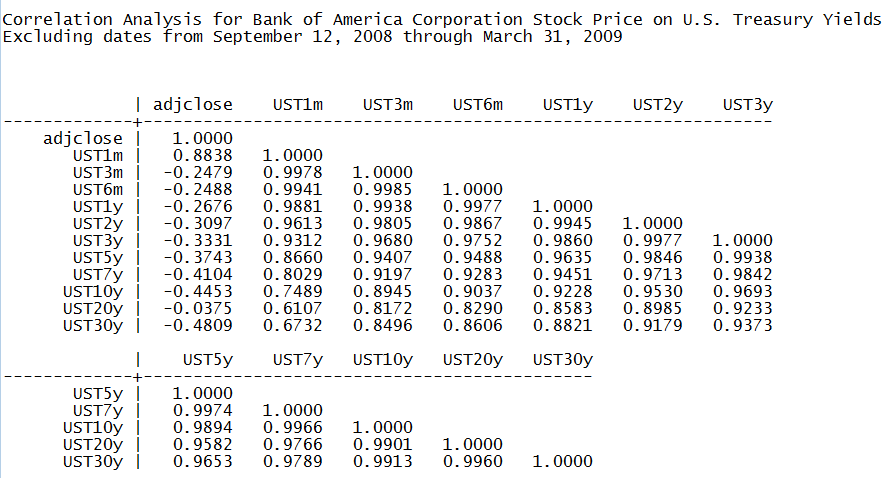
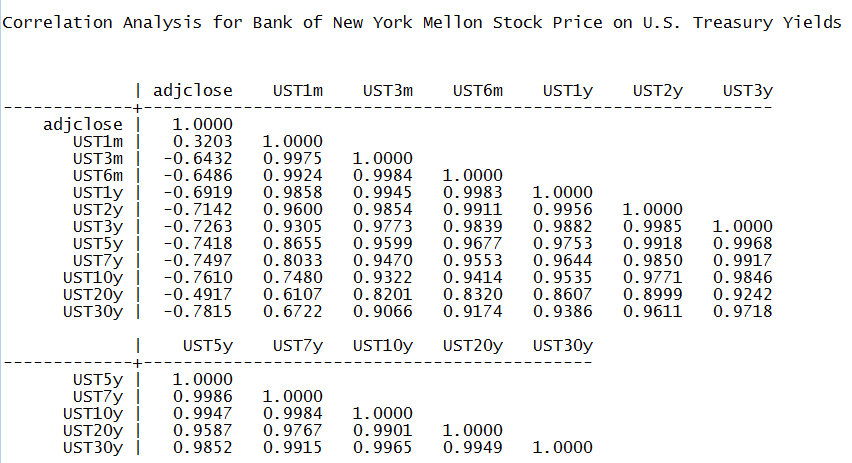
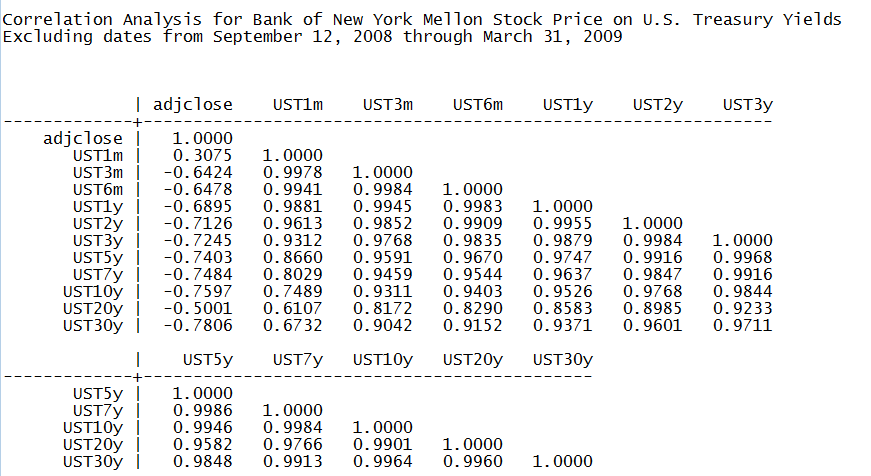
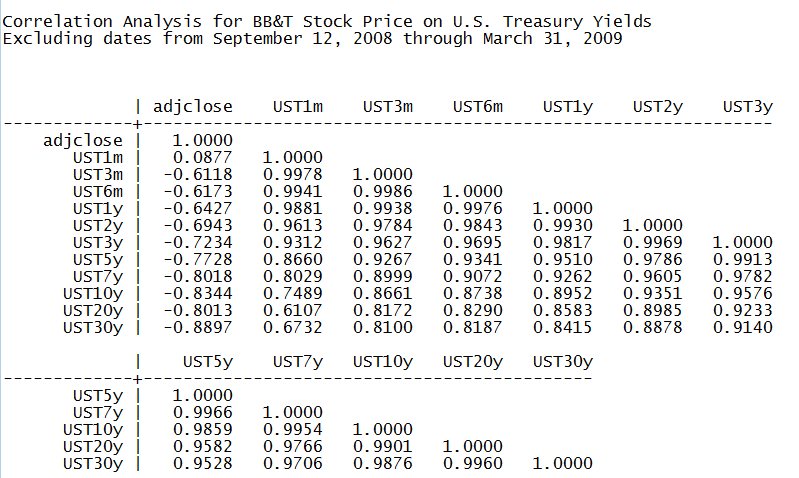
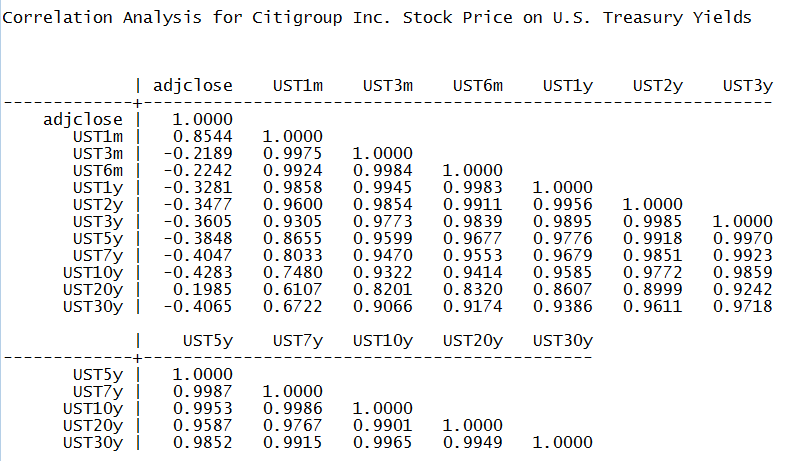
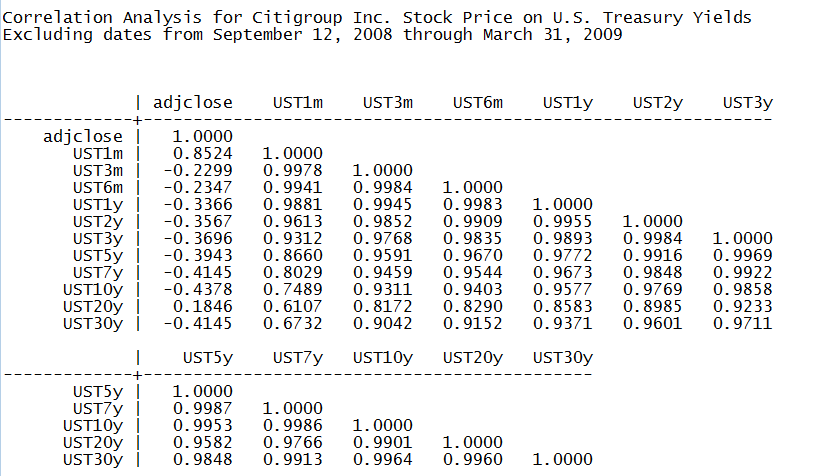
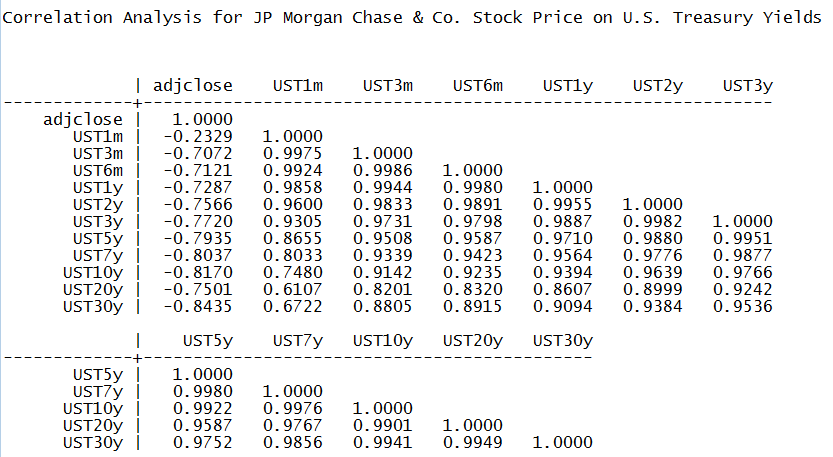
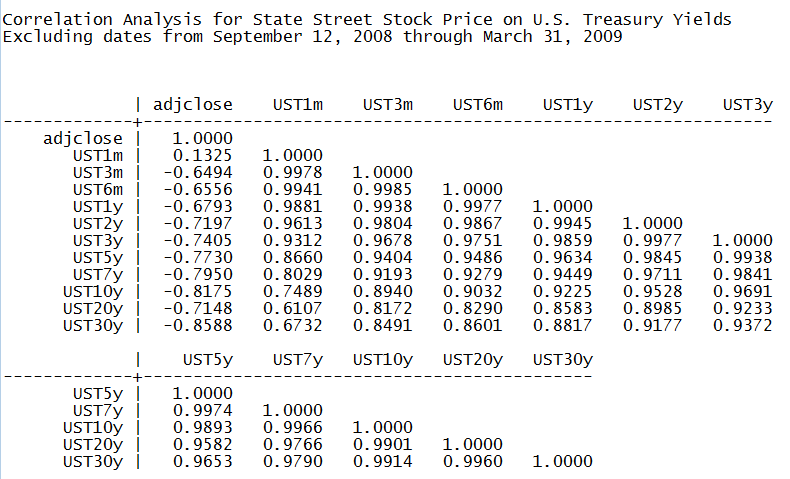
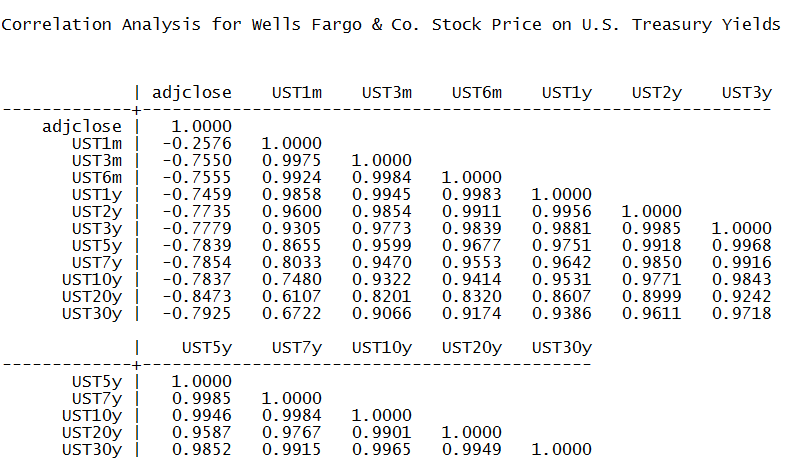
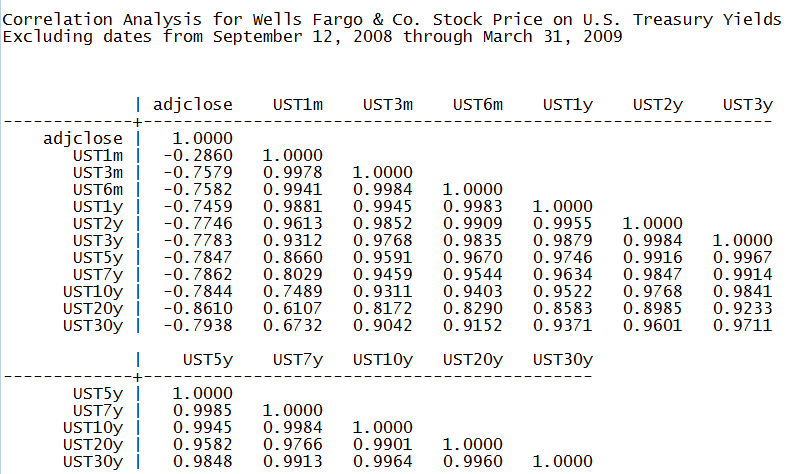
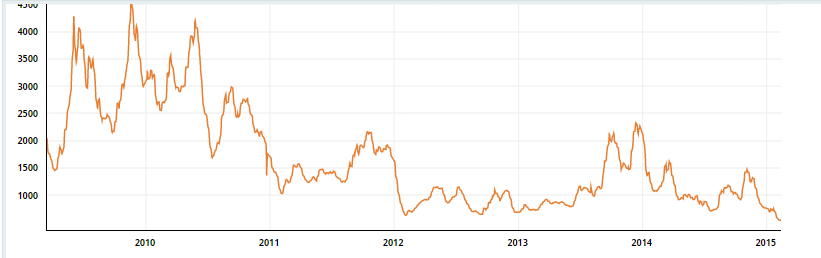
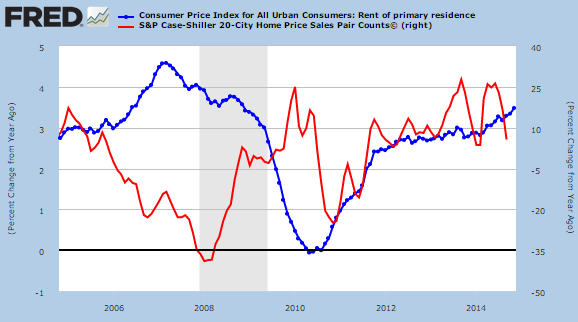
as the curve has already flattened dramatically…

Following the 2002-06 path almost unbelievably perfectly…

Gundlach adds,

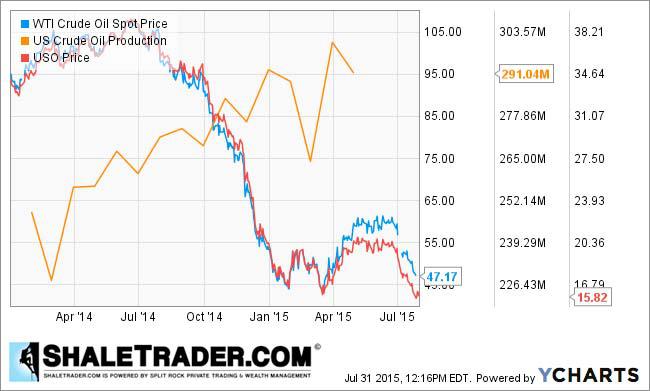
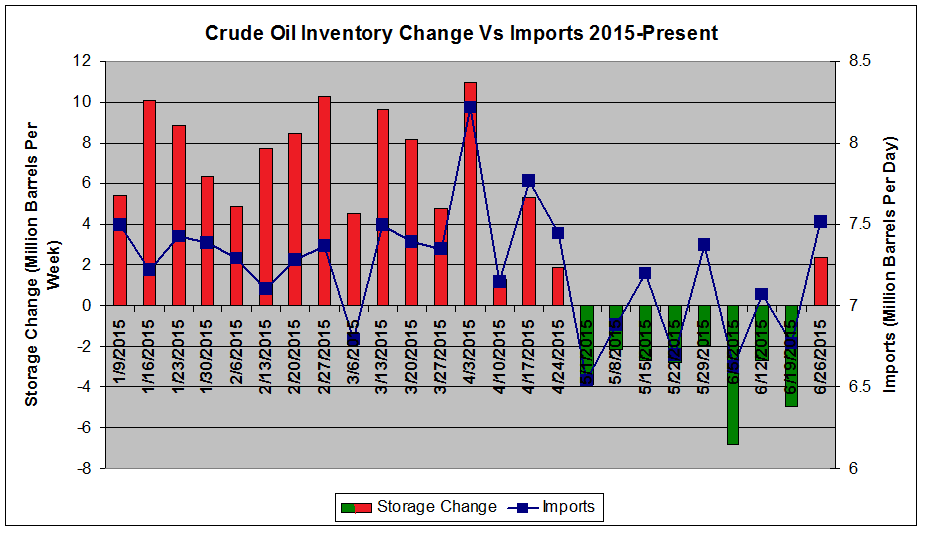
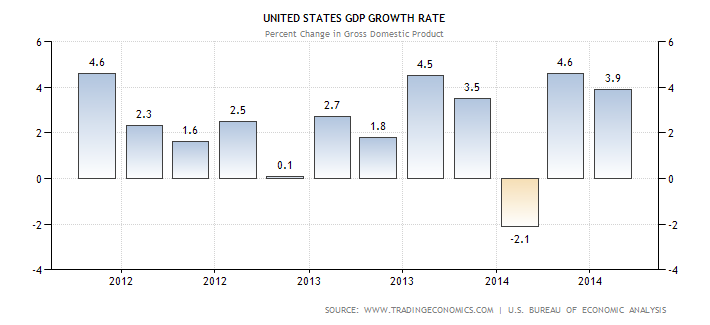
U.S. GDP growth for ’15, ’16 may not achieve 3%+ target as dollar strength hurts exporters, oil price drops cause deflationary pressure, job and spending cuts for energy industries, Gundlach said

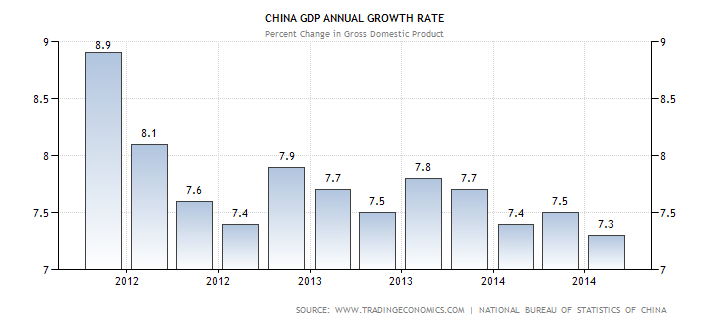
USD appreciation will continue as growth stumbles in other parts of the world, making U.S. bonds “all the more attractive” for foreign buyers, Gundlach said

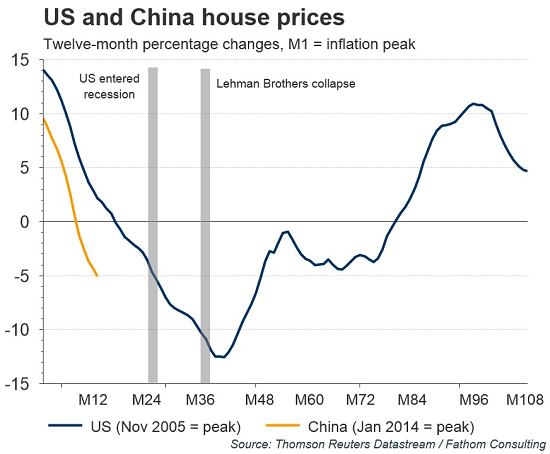
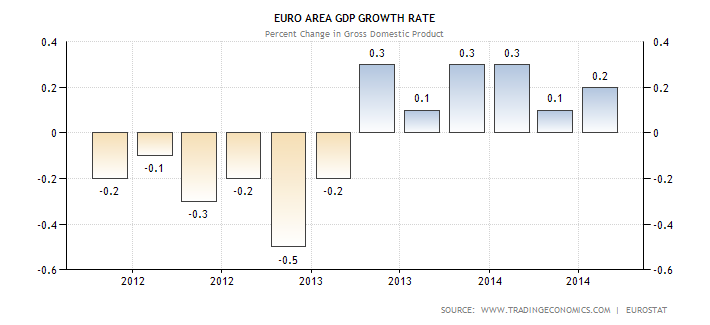
“Trouble lies ahead” for the euro zone; people in Europe “are obviously losing confidence and scared” as German yield turns negative, Gundlach told Barron’s

And here is Jeff Gundlach’s latest chartapalooza presentation…
12-9-14 This Time – JEG Webcast Slides – FINAL for Distribution

—————————————————————–

Glory To The New Bond King

This story by Matt Schfrin appears in the November 24, 2014 issue of Forbes.

The master of his domain: DoubleLine founder Jeffrey Gundlach relaxes among his Warhols in Los Angeles (photo: Ethan Pines

Bill Gross’ spectacular fall from the top of the bond market has put tens of billions in play at a time when minuscule yields demand a fixed-income superstar. A brilliant, battle-scarred billionaire, Jeffrey Gundlach, stands ready to be coronated.

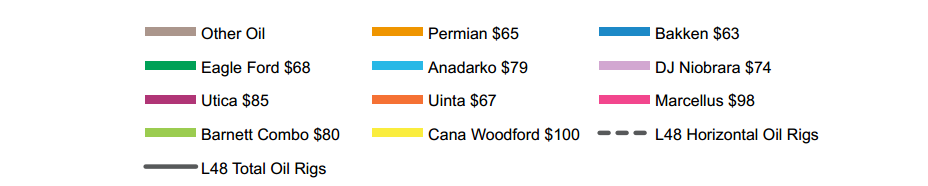
Bond manager Jeffrey Gundlach is wearing a white T-shirt, faded blue jeans and worn leather boat shoes as he traipses about the blooming morning glories in his perfectly landscaped backyard, perched high above a canyon overlooking the deep blue Pacific Ocean. It’s the middle of the afternoon on a work Monday in October; European bank stocks are tumbling; oil prices are down 25% since June; and against the backdrop of an anemic economy and 2.25% ten-year Treasury, the Federal Open Market Committee is about to make an important announcement. These are unsettling times in the financial markets, but for Gundlach it’s a picture-perfect autumn day in southern California, and he is living in paradise.

What’s next for the Fed? Gundlach would much rather discuss the iconic framed “Lemon Marilyn,” by Andy Warhol, above his mantel or how his “Progressions,” by minimalist Donald Judd, in the hallway is influenced by the Fibonacci sequence. “It is negative and positive space governed by a rule that happens to describe the shape of the solar system, which is exactly the opposite of what was popular in the ’50s, all this emotional stuff,” he says, pointing to his de Kooning. A few moments later he is explaining to a visitor that the geometry of the lot on which his new 13,000-square-foot, $16 million Tuscan mansion sits was designed to be in perfect harmony with the canyon cliff side it mirrors.

It is a paradise, but importantly Gundlach is finally feeling at ease because his new sanctuary is well fortified. Anyone wanting to get close to him or his prize paintings must breach the 8-foot wall surrounding his suburban residence or face the scrutiny of an armed naval vet at his front gate who asks visitors for a picture ID. Gundlach makes a point to show off one of the 50 concrete foundation caissons supporting his property. Each measures 3 feet in diameter and extends down as much as 75 feet through the porous desert soil into California bedrock.

After 30 years of staring into the black-and-green abyss of a Bloomberg terminal managing bond portfolios, Gundlach is making a statement with his magnificent new residence, one that underscores his ascendance in the business. Casa Gundlach is unlikely to succumb to the sudden mudslides known to take down other California palaces in places like Mill Valley or Malibu. And with a stellar performance record, $60 billion in assets under management and a killer contemporary art collection accumulated over the last decade, Jeffrey Gundlach has finally joined the billionaires club. More importantly, Los Angeles-based DoubleLine Capital, the house that Gundlach built in under five years, couldn’t be on better footing.

Just about a month earlier Bill Gross of Pacific Investment Management Co., the reigning master of the bond universe for two decades, requested an audience with Gundlach. In a scene that can only be described as Shakespearean, the incumbent bond king drove an hour up the 405 Freeway in the middle of the afternoon to Gundlach’s new castle to more or less grovel at his feet. Gross was certain PIMCO’s German owners were about to fire him, and he was asking his nemesis for a job–a portfolio manager position at DoubleLine. Gross said he wanted to run an “unconstrained” bond fund a small fraction of the size of the $200 billion-plus Total Return Fund he was famous for building. With the sun falling over the Pacific and shimmering on the surface of Gundlach’s infinity pool, Gross was deep in suck-up mode.

“He said to me, ‘I’m Kobe Bryant, you’re LeBron James. I’ve got five rings, you’ve got two, but you are maybe on your way to five and you’ve got time,’ ” says Gundlach, 55. (Gross, 70, refuses to comment on the meeting.) “ Bill was in his own world,” says a house-proud Gundlach, with a tone of disdain. “He doesn’t say anything [about my place]. Nothing. Doesn’t eat anything or even take a sip of water in three hours.”

Gross left the meeting with no deal in hand and ultimately jumped to Denver-based stock manager Janus Capital. From his office in Orange County’s Newport Beach, Gross now manages a $79 million mutual fund for Janus, roughly 0.03% the amount of assets he used to control.

Though a Gundlach-Gross alliance would have surely quickened the asset flight to DoubleLine from PIMCO–which has reported redemptions of $48 billion since Gross was forced to resign on Sept. 26–Gundlach claims to be relieved. “Our clients would have asked, ‘What is this? How is this going to work?’ I hear he is a difficult guy.”

Jeffrey Gundlach: A big thinker whose ambitions go beyond bonds (photo credit: Ethan Pines)

With Gross’ banishment the battle was over, but the spoils of the greatest market share shakeup in the history of the $45 trillion bond business is just getting under way. There may be as much as $100 billion in PIMCO assets in play, and DoubleLine is vying for them against larger rivals BlackRock, Dodge & Cox, Loomis Sayles and even index fund giant Vanguard. All are strong competitors, but none has lead managers like Gundlach, who combine bold market predictions with impressive long-term performance.

Gundlach’s superstar status can be viewed as both a blessing and a curse for DoubleLine. Like Gross–who has helped transform stodgy bond investing from a financial backwater to a lucrative playground for young M.B.A.s and Ph.D.s–Gundlach is well known for his arrogance, eccentricities and volatility. Institutional investors loathe the type of drama that unfolded at PIMCO–also, unfortunately, the hallmark of Gundlach’s style.

“You can’t please everybody, and I’m not gonna try,” insists Gundlach, as Pandora’s Sinatra Radio streams over his home’s sound system. “They point to our key man risk, and we say, ‘Everyone knows that it is key man reward.’ ” The lesson of Bill Gross is: Don’t put your money with a star manager who is owned by a parent company that controls him.”

The importance of being in control is something that Gundlach learned the hard way. For most of his 24-year tenure at Los Angeles’ Trust Company of the West (TCW), leading up to 2009, Gundlach was pegged as a star, a brash and brilliant money manager with a knack for calling markets. His specialty is mortgage-backed securities. The mutual fund he managed through 2009 beat 98% of all mutual funds in its category for a decade. Even more impressive was that he correctly foresaw the coming collapse of the housing market in 2007 and managed to hold on to more of his pre-crisis gains than any of his peers. In 2005, at age 46, he was made chief investment officer of mighty TCW, and by 2009 he was overseeing some $70 billion of its $110 billion in assets under management. In 2009 alone Gundlach’s annual compensation totaled no less than $40 million.

But despite his immense contribution to TCW’s success, at the end of the day Gundlach was still just a hired hand with no equity or control of his own destiny. He wanted more. He wanted to be named chief executive of TCW, but perhaps because of his abrasive style, the firm’s French owners, Société Générale and its billionaire founder, Robert Day, didn’t think he was fit for the job.

DoubleLine’s global developed credit chief Bonnie Baha and Luz Padilla (seated), who heads the firm’s emerging markets team (photo credit: Ethan Pines for Forbes)

“Look, it is clear that Jeffrey doesn’t suffer fools gladly, and he doesn’t tolerate people not thinking before opening their mouths,” says Bonnie Baha, a 19-year TCW veteran who has witnessed Gundlach’s biting tongue but is currently DoubleLine’s global developed credit chief.

Gundlach’s unhappiness prompted him to consider alternatives. He was courted by competitors, including Western Asset Management and PIMCO, which according to court documents considered him a potential successor to Gross. Then on Friday, Dec. 4, 2009, just after the market closed in New York, TCW fired Gundlach preemptively and had its outside counsel chase him out of its downtown L.A. office tower. In an effort to prevent institutional investors from taking their money and leaving with him, TCW simultaneously acquired cross-town bond manager Metropolitan West. In what former TCW employees describe as a surreal scene, Gundlach team members showed up the following Monday morning to find Met West traders sitting at their desks.

Despite promises of huge pay raises by TCW, 40 Gundlach loyalists defected, and within a month Gundlach had formed DoubleLine Capital. He found backers in Howard Marks and Bruce Karsh of Oaktree Capital Management, who had a similar acrimonious divorce from TCW 14 years earlier. (Distressed bond specialist Oaktree shares an office tower with DoubleLine and still owns 20% of the firm.) TCW had been gutted of its best fixed-income talent, and some $30 billion in assets eventually fled the firm.

But the drama was only beginning. Ugly lawsuits and counter lawsuits were filed. Gundlach was sued for more than $300 million and accused of everything from stealing hard drives to maintaining stashes of porno and pot. Distraught, Gundlach called a meeting of the 45 TCW coworkers he had lured away with a handshake promise of equity. His new firm had no assets and faced an immense potential liability, but he pledged that if the firm was forced out of business, he would find them all jobs. Gundlach counter sued for more than $500 million in fees he said he was owed.

The whole ordeal lasted two years, including a six-week jury trial in Los Angeles County Superior Court. All the while Gundlach and his bond traders persevered. The group continued to outperform, and DoubleLine assets swelled. By late 2010, barely a year after the firm opened its doors, assets reached $7 billion, hitting break-even, according to Gundlach.

Ultimately in late 2011 the jury found that Gundlach & Co. stole TCW’s trade secrets, but no damages were awarded. Instead, the jury awarded Gundlach $67 million for compensation he was owed. Before the appeals could be filed, TCW and Gundlach settled.

By then DoubleLine funds were already a screaming success and fast on the way to $50 billion in assets. Meanwhile, Morningstar’s “fund manager of the decade,” Bill Gross, was suffering from subpar returns in his mighty PIMCO Total Return fund. In 2011 he bet wrong on rates, missing the rally in Treasury bonds. That left PIMCO’s Total Return fund 87th among its competitors, returning just 4.2% to investors, compared with 9.5% for Gundlach’s flagship Total Return fund.

On Dec. 4, 2012, exactly three years from the day he had been fired from TCW, Gundlach rented a restaurant in the lobby of TCW’s headquarters to throw a lavish party. Cristal champagne was flowing, and his now wealthy employees and partners were treated to filet mignon and tuna tartare. A banner that read “DoubleLine $50 billion” was hung over the bar for all of TCW’s remaining salary men to see as they filed out of the building.

A brilliant analytical thinker who is both meticulous with his facts and mercenary in making rational decisions, Gundlach cares deeply for the loyalists who followed him to DoubleLine but rarely shows any emotion. He almost never socializes with his 125 co-workers.

A native of suburban Buffalo, N.Y., Gundlach’s DNA practically preordained him for entrepreneurial success. His paternal grandfather, Emanuel, was the son of a German minister and became a stockbroker during the roaring 1920s. Gundlach claims his grandfather foresaw the 1929 crash and banked the sizable sum of $30,000 ($400,000 in today’s dollars) ahead of the Great Depression. He then became a bathtub chemist, concocting hair tonic from the roots of witch hazel shrub. His product, Wildroot Hair Cream, became a national brand by the 1950s.

“He would give us bottles when I was a kid,” says Gundlach. “It was called greasy kid’s stuff. You know, like the Fonz.”

Gundlach’s uncle Robert was a physicist and renowned inventor, coming up with a process that allowed Rochester, N.Y.’s Haloid Photographic Co. (later known as Xerox) to make the copy machine commercially viable.

Gundlach’s father was a chemist for coatings maker Pierce & Stevens, and his mother a teacher and homemaker from a working-class family. Though the extended Gundlach clan spent summers at his grandfather’s rural upstate New York retreat, Starlit, his branch of the family never enjoyed the affluence of his famous uncle Robert, who had dozens of Xerox patents. “My uncle was very parsimonious–never wanted to spend a dime,” laments Gundlach.

Thus Gundlach was raised squarely in the middle class and to this day is uncomfortable hobnobbing with moneyed society members. Gundlach recalls that his maternal grandparents had such a distrust for the upper crust that they lobbied for his older brother Brad to go to the University of Buffalo over Princeton. (He eventually chose Tiger orange and black.) To this day Gundlach continues to brag about his “hammer swinging” eldest brother, Drew, who never went to college and remodels houses in upstate New York. Gundlach spends his Fourth of July and Thanksgiving holidays at Drew’s home.

Gundlach was a top student in high school with a near perfect score on the math SAT. Financial aid allowed him to attend Dartmouth, where he graduated summa cum laude in 1981 with a degree in math and philosophy. He considered becoming a philosophy professor, but then after studying the works of Austrian-British philosopher Ludwig Wittgenstein, he gave up. “I stopped caring about philosophy,” he says, explaining, “Wittgenstein was a mathematical philosopher, and his whole thing is that philosophy is just words that don’t mean anything. It’s like a fly that goes into a fly bottle and can’t find its way out. What is the meaning of life? It sounds like a , but it doesn’t mean anything.”

So Gundlach dived deeper into mathematics and was accepted in the doctoral program at Yale.

“My thesis was the probabilistic implications of the nonexistence of infinity,” explains Gundlach. “There is no infinity. It’s an illusion; there is absolutely nothing empirical that suggests infinity exists and nothing that operates under the assumption of infinity that has any practical implications.”

Apparently Gundlach’s thesis not only didn’t please his Yale advisor but was diametrically opposed to the work of one of the most influential mathematicians since Aristotle, Austrian logician Kurt Gödel and his Incompleteness Theorem.

So in 1985 Gundlach, who had been playing drums in bands while at Dartmouth and Yale, donned a spiky bleached-blond haircut and moved to Los Angeles to become an alternative rock star. A series of bands he played in, including one called Radical Flat, had limited success, and Gundlach was forced to hold down a day job in the actuarial department of Transamerica. He decided to apply for a job in the investment business after he watched a Lifestyles of the Rich and Famous episode lauding the profession as the highest paying.

A blind solicitation letter ultimately landed Gundlach in the fixed-income
department of the Trust Company of the West. He devoured the math-heavy bond market primer Inside the Yield Book the week before starting, learned trading on the job and eventually came to be the most powerful mortgage-backed securities money manager in the company.

It’s late October, and Gundlach is delivering the keynote speech at ETF.com’s Inside Fixed Income conference in Newport Beach, Calif. before an audience of 175 investment professionals and advisors. It’s about a month after the Bill Gross resignation bombshell shook the bond market, so attendance is higher than expected and the audience hangs on his every word.

“People like my macro stuff,” he muses. “There is very little patience for long wonky bond presentations, but people are interested in different ways of interpreting the forces behind macroeconomic events and geopolitics.”

His 56-slide PowerPoint presentation is entitled This Time It’s Different–directly thumbing his nose at legendary investor Sir John Templeton’s famous warning that those are the four most dangerous words in investing.

But Gundlach means it. His first slide is a quote from Greek philosopher Heraclitus: “No man ever steps in the same river twice, for it’s not the same river, and he’s not the same man.”

Gundlach is referring to the bizarre current market environment and insists that analysts studying the economic and monetary policy axioms of the past are making a serious mistake.

“In the past the feds would raise rates to be preemptive against inflation. There is no inflation today, and you see finance ministers saying that one of the dark clouds hanging over the global economy is that inflation is not accelerating,” he says. “So raising interest rates against that mentality is very different, and taking an average of the past rate-raising cycles is not going to give you a good road map as to where things go this time around.”

Here is the new bond king’s view of the world today:

The Fed may raise the federal funds rate for the wrong reasons.

“They don’t really need the rates to be higher, but they seem to want to reload the gun so they aren’t stuck at zero without any tools.”

Deflationary forces will accelerate if the Fed raises rates.

“With a tightening, the dollar is going to not just be strong, but it will run up like a scalded dog. If that happens, then commodity prices are going down, we will import deflation and you will see an episode of deflationary scare.”

The long end of the Treasury curve will stay put and possibly go down further.

“There’s a 30% chance that importing deflation creates a panic into Treasurys creating a ‘melt-up,’ moving rates to German Bund levels today of around 1%.

It’s not okay to own risk assets when the Fed starts hiking rates.

“What is fascinating is, if you sell junk bonds and buy Treasurys, the minute the Fed hikes the first time, going back to 1980, in every case you did well.”

Don’t be surprised to see the yield curve flatten and possibly invert.

“Long rates have done nothing but fall. That tells me the market is saying to the Fed, ‘Go ahead, make my day.’ The curve is going to invert when and if fed funds hit 2.5 to 3%.”

Be long the dollar, especially in emerging market bonds.

“We have been all dollar [denominated in our foreign bond holdings] since 2011. For a while it didn’t really matter, but now it matters a lot. If you are nondollar you are really in trouble.”

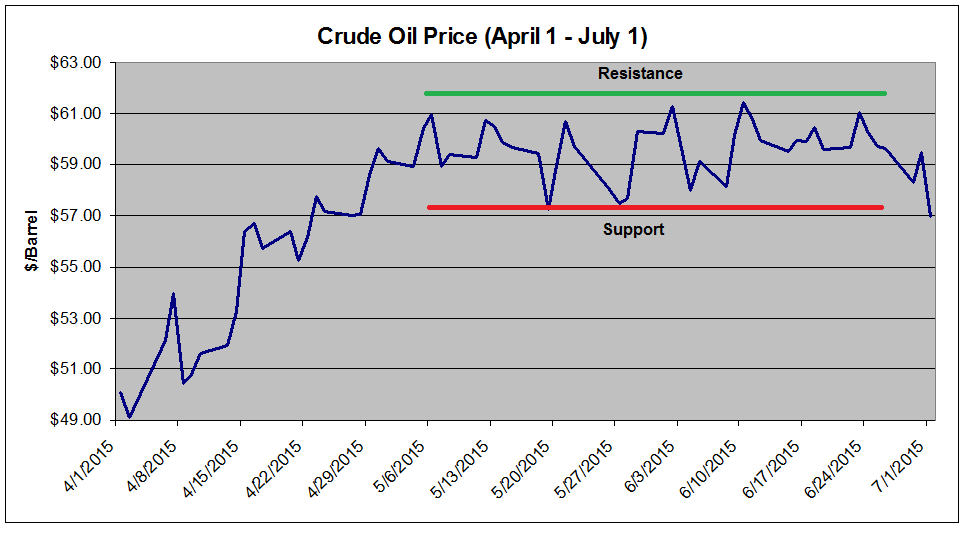
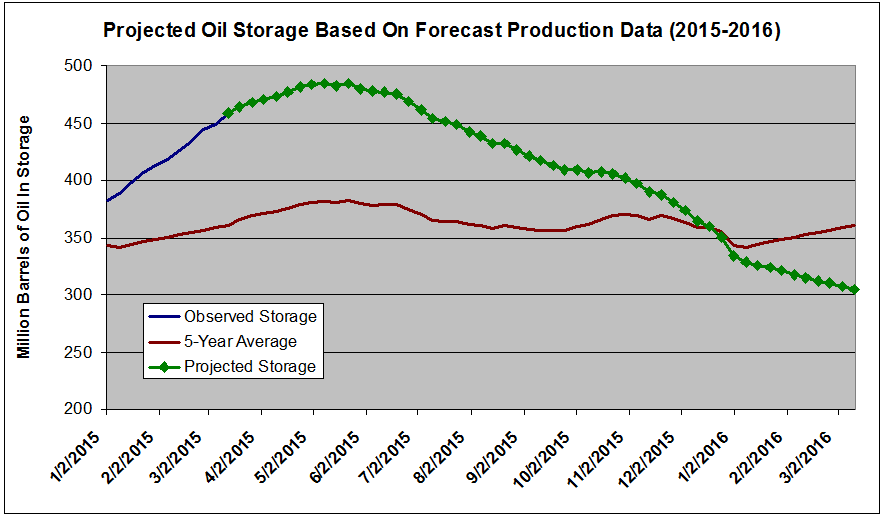
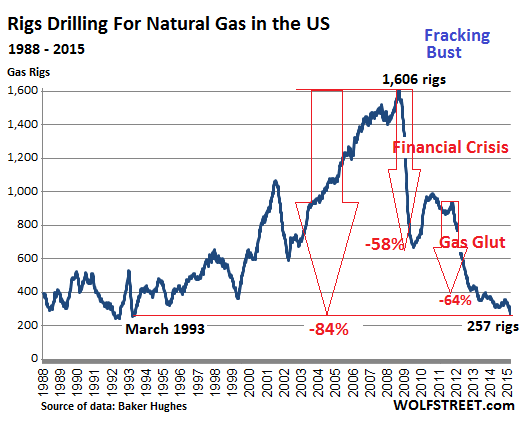
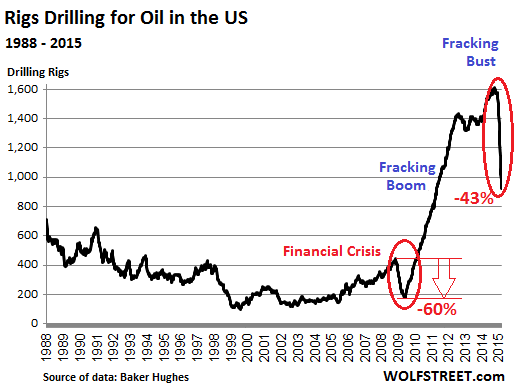
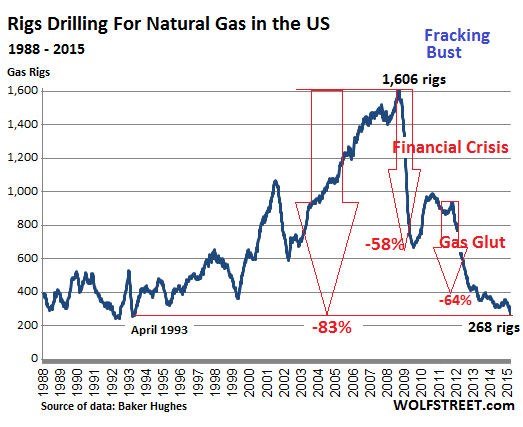
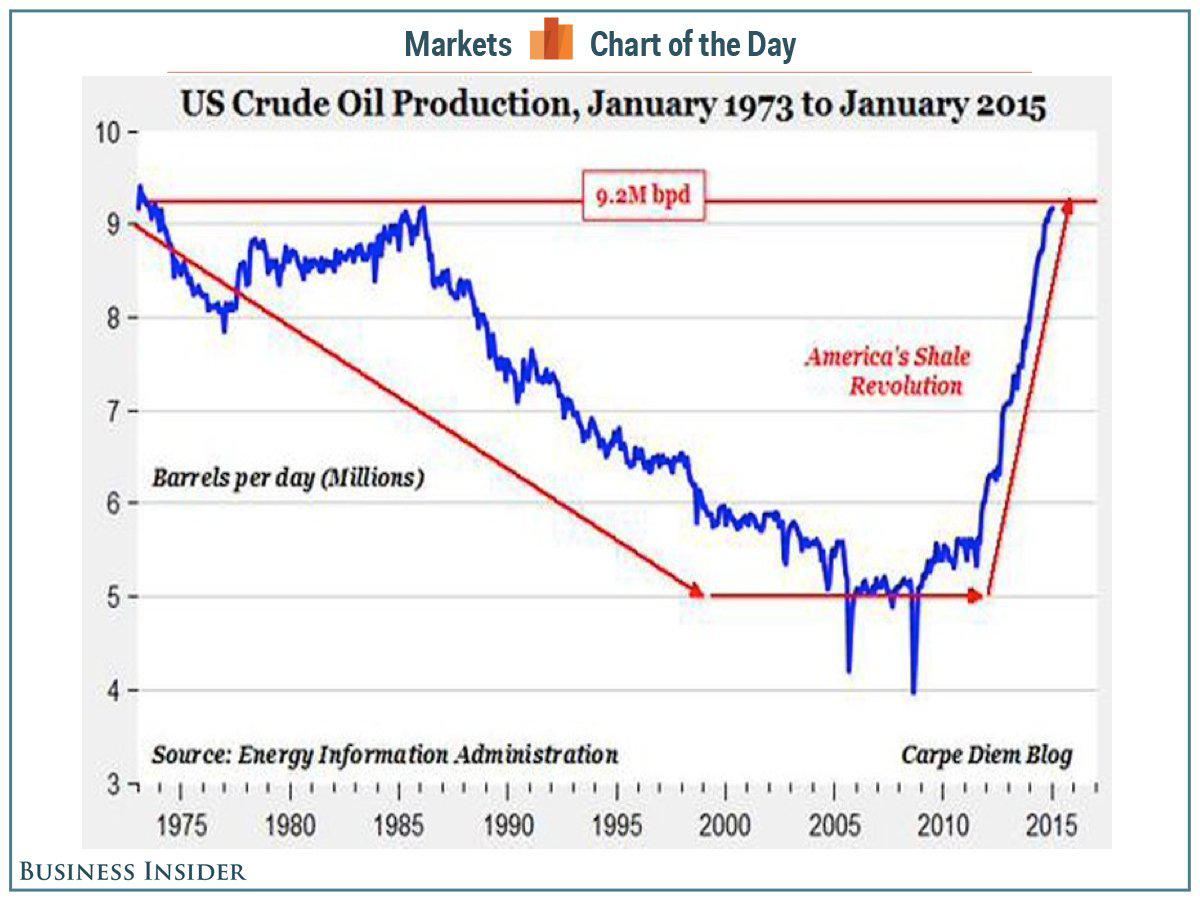
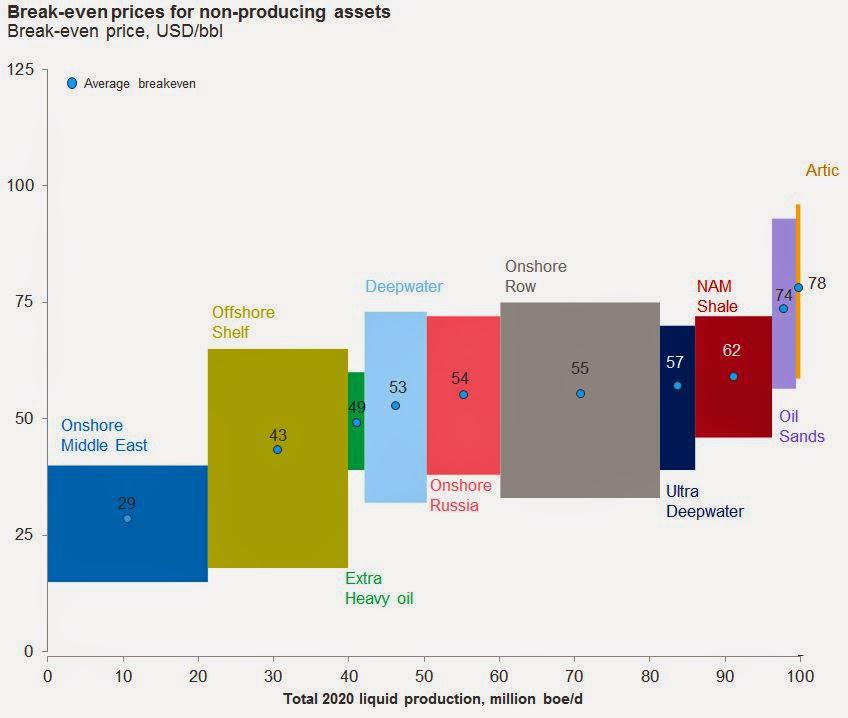
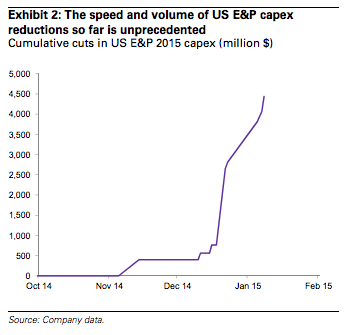
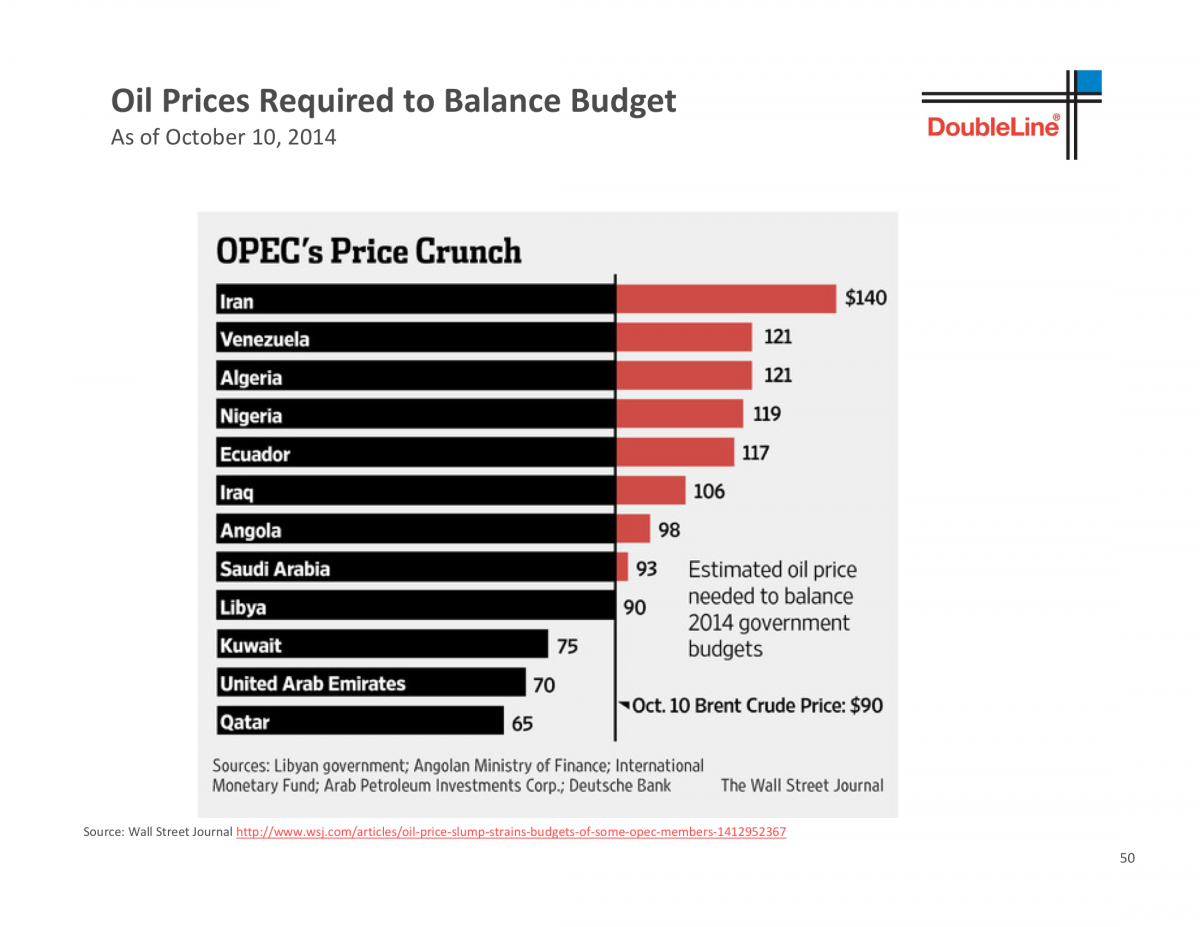
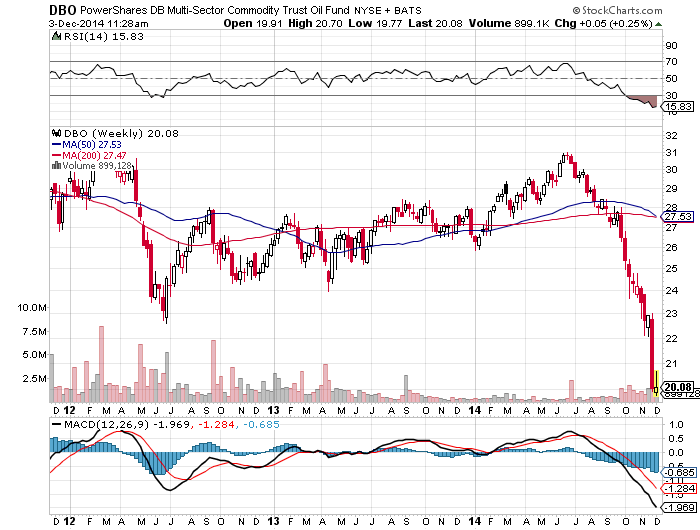
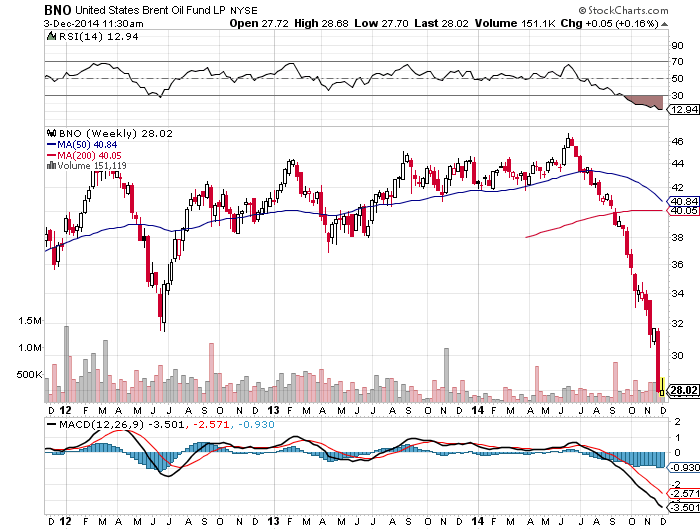
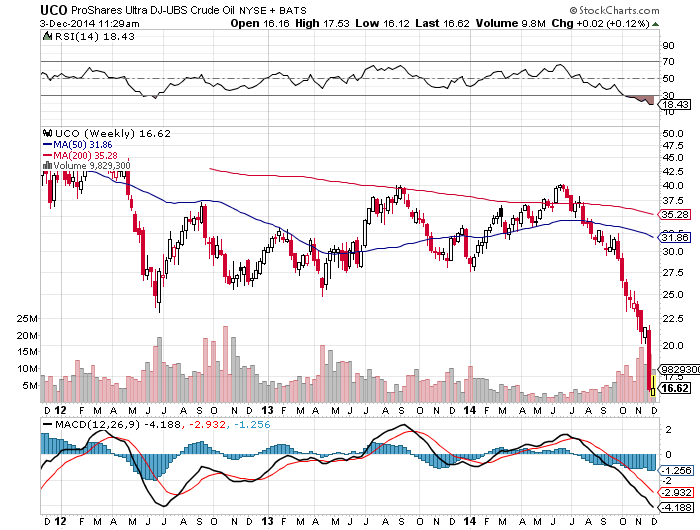
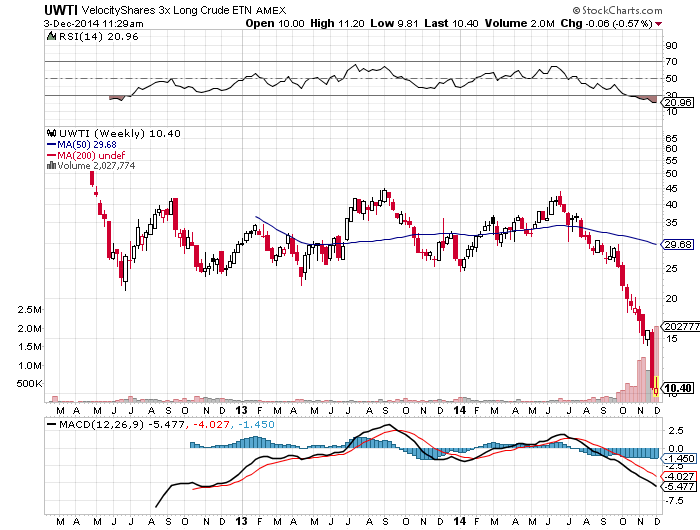
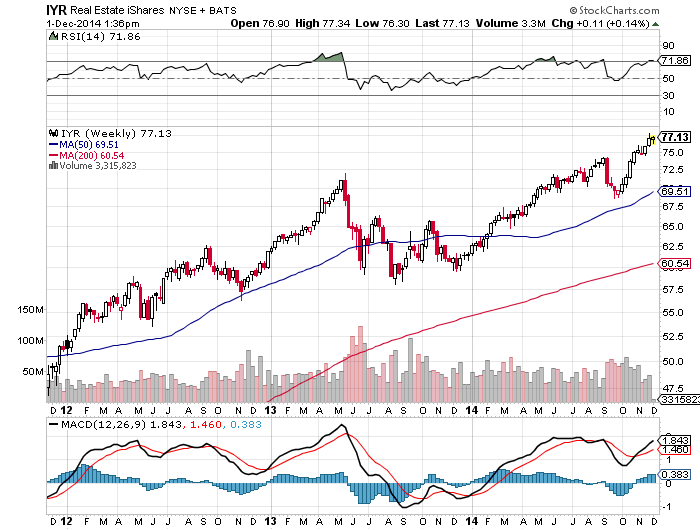
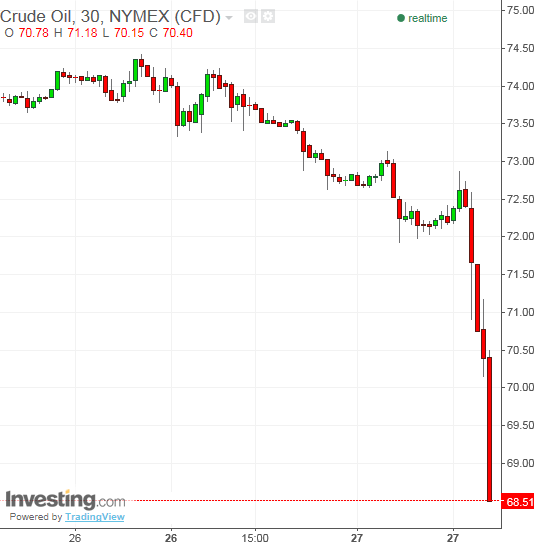
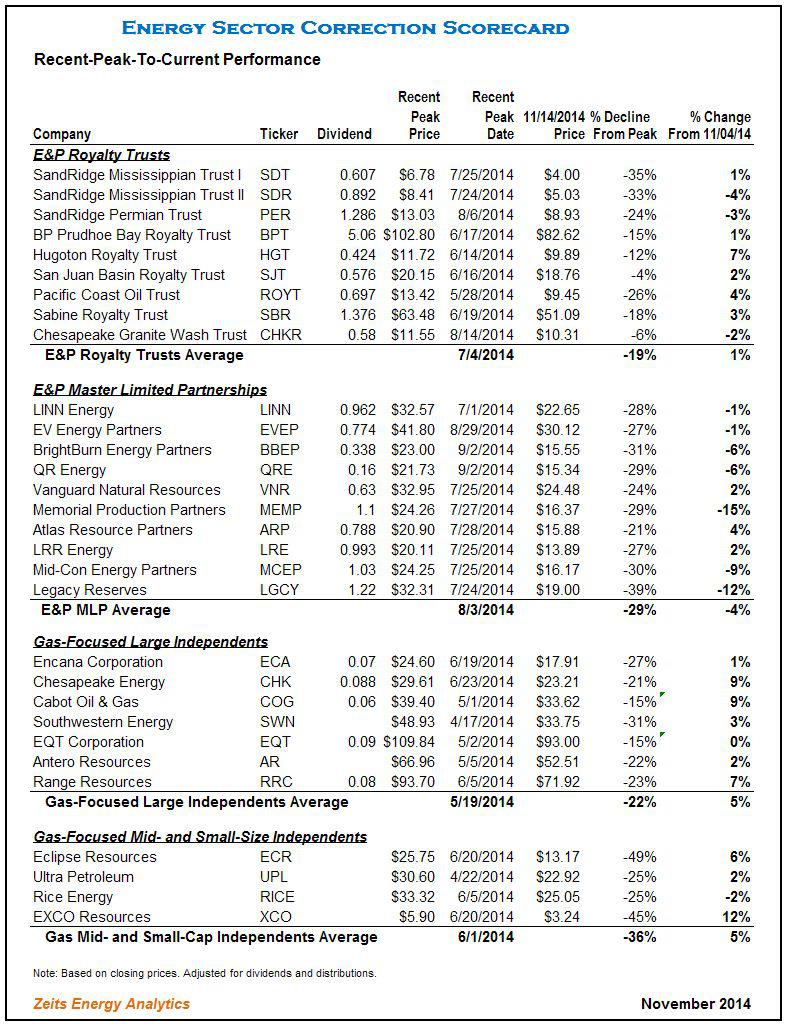
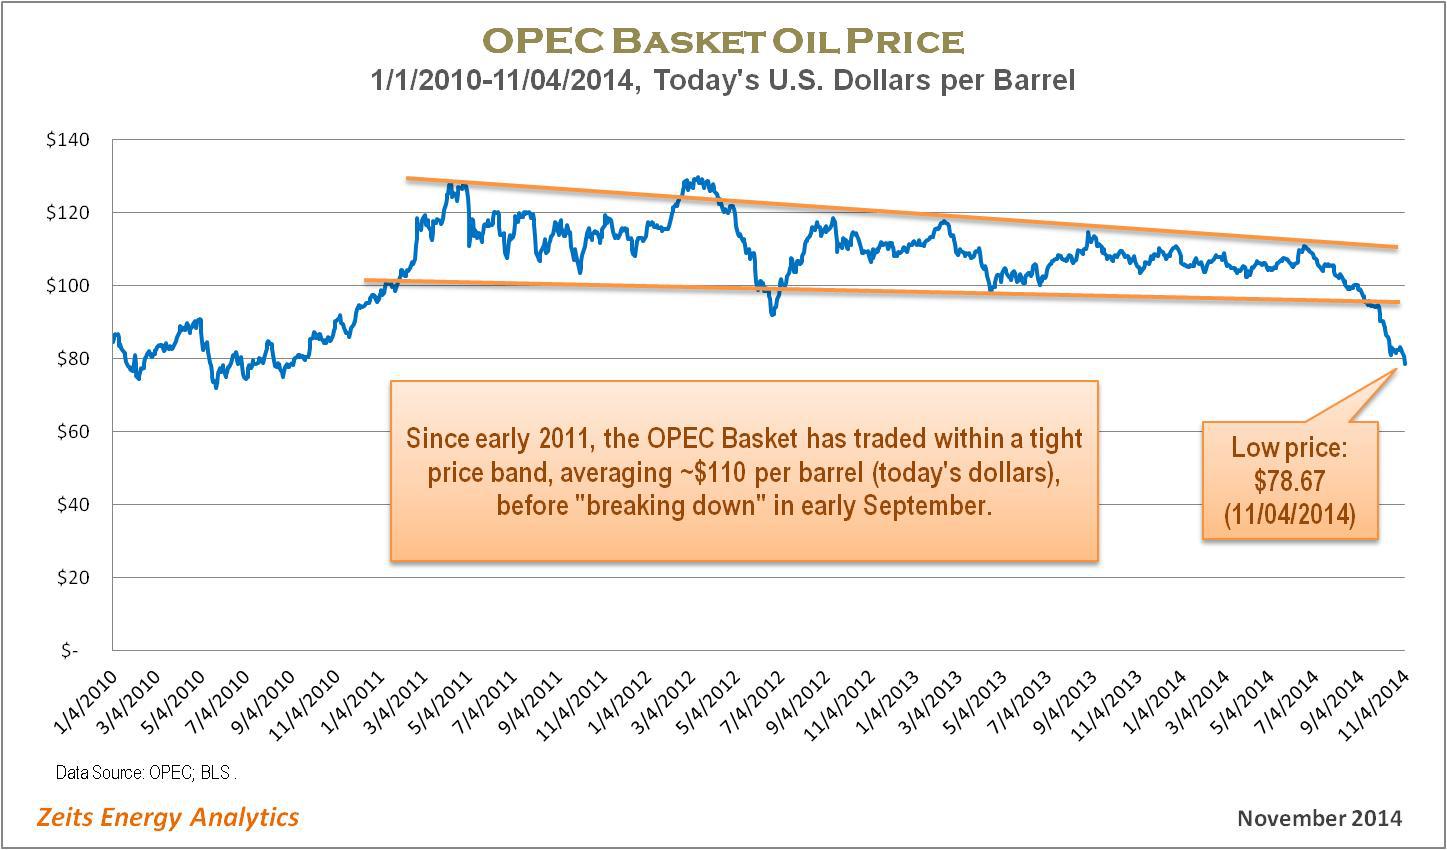
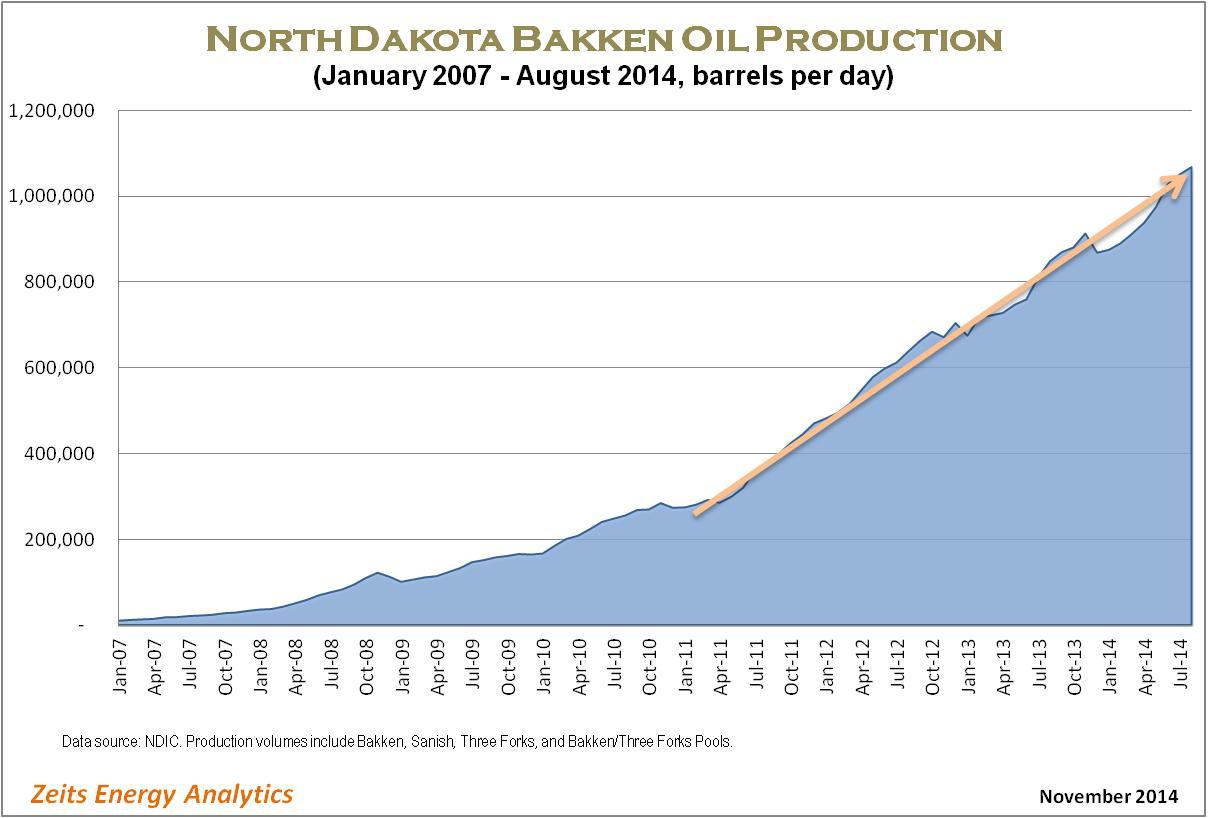
Stay away from home builders, TIPs and mortgage REITs, and oil will fall further.

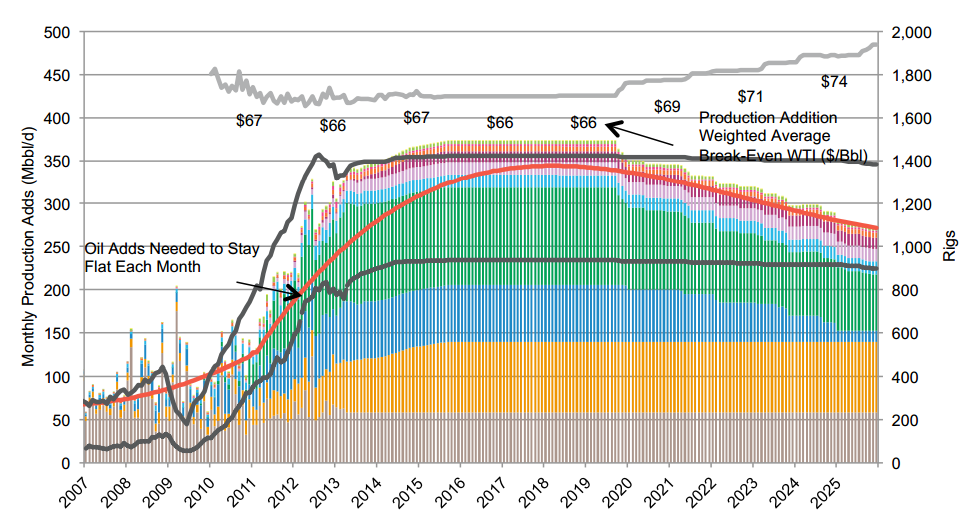
“I am convinced the Saudis want the price of a barrel of oil to go to $70. They don’t care if they run a short-term deficit if it slows down U.S. fracking and turns the screws on countries in their region that mean them harm.”

As we get closer to 2020 interest rates and inflation (and taxes) could really start rising.

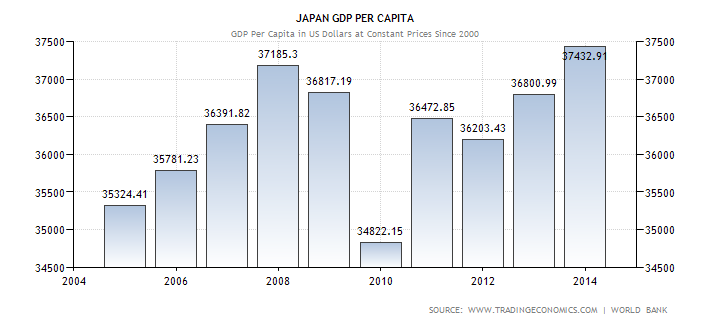
“We are in the calm right now before the hurricane. I’m talking about the aging of the great powers, which is undeniable and can’t be quickly reversed. The retiree-to-worker ratios, the size of labor forces globally. China will have no one in the labor force. Italy’s losing 39% of labor force in the next generation and a half. Japan has an implosion of working population and no immigration. Russia is facing one of the greatest demographic crisis in the history of the world, absent famine, war and disease. It’s pretty bad. Italy has no hope,” says Gundlach matter-of-factly.

“The Federal Reserve bought the bonds from the deficits of 2011, 2012 and 2013, and those will roll off increasingly over time. Come 2020 you are not just financing massive entitlements like Social Security and Medicare but also old debt. No one talks about that. It’s a big deal. China doesn’t have the demographics to buy that debt. Who’s going to buy it?”

The coming debt storm–which Gundlach says is too early to worry about tactically–will hit financial markets just as DoubleLine approaches its tenth anniversary in business.

Giant pension funds and endowments are typically plodding in the redeployment of assets because it often requires coordinating board meetings, soliciting bids from new firms, listening to presentations and gathering votes. But with tens of billions likely to shift out of PIMCO over the next few months, DoubleLine is buzzing with activity. The task at hand is proving to existing clients and to new ones that the drama days are over and DoubleLine is all grown up.

“I don’t think the controversies surrounding his TCW days are really relevant anymore in the analysis of DoubleLine,” says Michael Rosen, the chief investment officer at Angeles Investment Advisors, whose firm advises on $47 billion in pension and endowment money and who had resisted recommending DoubleLine to clients in the past. “That is ancient history at this point.”

Perhaps because of Gundlach and DoubleLine’s toxic inception the majority of its $60 billion in assets is held by individuals in the firm’s mutual funds, predominantly his mortgage-heavy DoubleLine Total Return Bond Fund, which has $38 billion under management and is up 8.93% annually since inception in 2010, and DoubleLine Core Fixed Income Fund, which is up 7.19% annually since inception. DoubleLine also has $4.5 billion in its Opportunistic Income, a hedge fund strategy, which uses leverage and deploys an amalgam of its manager’s best ideas.

So far Gundlach reports that it has gulped down $4 billion in new assets since Gross’ departure. However, competitors like BlackRock, Loomis Sayles and Vanguard are also seeing big inflows.

Somewhat unique to DoubleLine among big competitors is that it has no interest in the low-fee bond index fund money that BlackRock and Vanguard specialize in. He also insists he will close his funds to new investors before they get too large. “Our so-called flagship strategy Total Return will never go to $100 billion unless the bond market grows ten times in size,” he says. “We are not ambulance chasers.” Still Gundlach is clearly drooling at the prospect of feasting on PIMCO’s remains, because he doesn’t hesitate to gun at his competition.

What does he say about the reorganization of Bill Gross’ famous Total Return Fund? “Who’s managing it?” says Gundlach. “I don’t buy for a second that they will all work together and with no conflict. ”

Of PIMCO’s newly named Chief Investment Officer Daniel Ivascyn: “
He is their hottest performer in recent times. I hear he is reasonably good at explaining things, the fact that he read from a teleprompter and couldn’t answer any of the real questions notwithstanding. I’m sure he’s articulate.”

Gundlach even feels the need to neutralize two seemingly nonexistent threats, Bill Gross and Mohamed El-Erian, the former PIMCO co-chief investment officer executive, who remains on the payroll of PIMCO parent Allianz.

“People are too harsh on Gross’ performance. It’s not bad, it’s just average,” he says. “This past year it’s been bad, but for 5 years it’s been average.”

As for El-Erian, “Mohamed’s track record is hard to find, and when you find it, it’s bad.”

Gundlach protege, Jeffrey Sherman: Gumdlach says he is the rare quant manager with the “special sauce.” (photo credit: Ethan Pines for Forbes)

Meanwhile DoubleLine is bending over backward to show off the breadth and depth of its bench as Gundlach’s top portfolio managers make the rounds with salesmen. Key in this pursuit are veteran emerging markets manager Luz Padilla, global developed credit manager Bonnie Baha, mortgage-backed manager Vitaliy Liberman and a young portfolio manager named Jeffrey Sherman.

Sherman, 37, rides shotgun to Gundlach at DoubleLine’s monthly fixed-income asset allocation meeting, attended by all key portfolio managers. Gundlach sits at the head of the table, but Sherman organizes large parts of the 70-plus slides Gundlach presents at these important meetings covering macro themes and sector allocations for the firm’s multi-asset strategies. Sherman is emerging as the front-runner to eventually succeed Gundlach.

With his shoulder-length brown hair parted in the middle and his hipster beard, Sherman gives off a laid-back California surfer vibe, yet he impresses visitors with his ability to demystify complicated economic concepts as well as articulate big-picture strategies.

“What we are trying to do in these asset allocation programs is look at the entire portfolio. We are not allocating to each sector and asking each manager to outperform each month, we are thinking about how the whole portfolio works,” says Sherman, mentioning that government bond chief Gregory Whiteley, for example, is currently being asked to underweight his sector and hold long-duration bonds. “We are paid not on assets that each one of us is managing but on the collective success of the firm. That is very deeply entrenched in our process and very different from other firms.”

Like Gundlach, Sherman has humble roots. Neither of his parents attended college: His father worked in the oilfields of Bakersfield, Calif., and his mother is a bookkeeper. Also like Gundlach, a scholarship helped pay for his applied mathematics degree at University of the Pacific, where he also taught statistics. Upon graduating in 1999, Sherman saw the wave of quants heading to Wall Street and wound up pursuing an M.S. in financial engineering from Claremont Graduate University. A summer internship led him to the risk analytics department of TCW, and ultimately he defected to DoubleLine.

“Sherman is extremely analytic, which I am always attracted to,” says Gundlach. “But he also understands psychology. There are a lot of people who are quants, and they think you can explain the world with an econometric model. You just get the coefficients right and you can explain everything about the future. Sherman understands all of the coefficients and can derive all the equations just like I used to do, but he understands that it won’t predict where the market is going to be in a month. He is also good at explaining, which, of course, is the secret sauce of this business.”

In addition to Sherman’s key role in DoubleLine’s multi-asset strategies, Gundlach has put him in charge of new product development. This is critical to long-term growth because DoubleLine is still largely perceived as a mortgage bond specialist.

Besides two new NYSE-listed closed-end funds, DoubleLine has developed a commodities strategy, gathered $164 million in an enhanced S&P 500 stock index fund created in partnership with Nobel laureate Robert Shiller and started a small-cap stock fund. It’s also developing an infrastructure loan fund and a commercial-mortgage-backed-securities fund.

“I am really interested in doing distressed funds when the credit cycle turns, but you have to wait,” says Gundlach in anticipation of the debt woes on the horizon. “That’s one reason why we have been expanding our capabilities in bank loans, high yield, emerging markets debt and CMBS.”

Original backer Oaktree Capital, which has never wavered in its Gundlach bet, has already taken out more than $90 million in distributions on its original $20 million investment ( Oaktree also invested $20 million in DoubleLine’s hedge fund) through September 2014, and its 20% stake is estimated to be worth close to $400 million. Says Howard Marks, Oaktree chairman: “Jeffrey thinks beyond being a bond manager, and I don’t know if you noticed, he is a pretty confident guy.”

Gundlach is so self-assured that he has even taken to painting in the style of the masters in his art collection. Piet Mondrian–the inspiration for DoubleLine’s red, blue and black logo–is his favorite. Says Gundlach, “I knocked [Mondrian] off. Very hard to do. Surprisingly hard. Hard to make the lines crisp. Mine are more crisp than his, but that’s because I used tape.” Gundlach pauses, reflecting on his work. “It’s an interesting thing: There is this moment when you are not sure if you are done or not.”

Oil Doomsayers Were Wrong In 2009: 4 Reasons Why They’re Wrong Now

https://i0.wp.com/img0.etsystatic.com/000/0/6787557/il_340x270.350576144.jpgSource: Hawkinvest

Summary

  • Oil is extremely oversold and due for a rebound.
  • Oil consumption remains strong and is likely to increase thanks to cheaper prices.
  • Historically oil rebounds quite quickly, especially when the U.S. and global economy are growing.
  • Investors are overly negative on oil ever since the OPEC meeting, but production cuts could still be on the way.

Ever since the November 27th OPEC meeting the price of oil has plunged by about 20% and many stocks are off by much, much more. The doomsayers and shorts are out in force now, emboldened by the weakness in this sector. There is a tremendous amount of negative sentiment towards oil now. But this extreme level of negativity appears to be very overdone. It also seems to be based on psychology, forced margin call selling, panic selling and tax-loss selling. With all these factors, it’s been a perfect storm that has brought some small-cap oil stocks back to levels not seen since the depths of the financial crisis. Back in 2009, oil plunged to the $40 range, but the U.S. and the global economy were in free fall and oil consumption was also falling. The factors that drove oil to collapse in 2009 like bank failures, financial system imploding, home prices collapsing, massive layoffs, and other negatives that just do not exist today. That is why it does not make sense to be expecting oil to plunge back towards the lows seen in 2009. Furthermore, it is really important to realize that even when oil plunged in 2009, it rebounded very, very quickly (in spite of all the doomsayers back then). That is another big factor to consider because since the global economy is significantly stronger now, it could rebound sooner than most investors realize. Here are a few more reasons why this is a buying opportunity as oil is not likely to go down much more and why it is not likely to stay down for very long:

Reason #1: Energy company insiders are calling the recent plunge in stocks a “fire sale” and they are buying at a pace that has not been seen in years. Oil industry insiders have seen the ups and downs in oil prices and have experienced market pullbacks before. If oil company insiders are buying en masse now, there is a good chance that they see bargains and a strong future for oil. This supports the idea that there is a disconnect between the current market price of many oil stocks and the longer-term fundamentals of this industry. Citigroup (NYSE:C) recently made a strong case that indicates there is a disconnect between asset prices in the oil industry and the fundamentals. A Bloomberg article details some of the recent insider activity, it states:

“This is an absolute fire sale,” he said. “It’s an overreaction and the result is it’s oversold.” With valuations at a decade low, oil executives such as Rochford and Chesapeake Energy Corp.’s (NYSE:CHK) Archie Dunham are driving the biggest wave of insider buying since 2012, data compiled by the Washington Service and Bloomberg show. They’re snapping up stocks after more than $300 billion was erased from share values as crude slipped below $70 for the first time since 2010.”

Reason #2: Just because OPEC did not act at the November 27th meeting, it does not mean they won’t act. OPEC is scheduled to meet again in 2015, but there is always the possibility for an emergency meeting at any time. Even a statement from OPEC discussing the willingness to cut production or to address “cheating” by some members who are producing more than their quota allows could cause a significant short-covering rebound in the oil sector. A CNBC article points out that some industry watchers believe OPEC could act soon with an extraordinary or “emergency” meeting, it states:

“We see the possibility they call an extraordinary meeting sometime next year,” said Dominic Haywood, crude and products analyst with Energy Aspects. “We think they’re going to address countries not living within their quota.” OPEC has a quota of 30 million barrels a day, but it has been producing more.

On December 2, a Saudi Prince stated that his country would cut production if other countries would also participate. This seems the first “olive branch” since the OPEC meeting and it appears to be in response to the slide in oil since that meeting took place.

Reason #3: The perceived “glut” of oil is much smaller than most people realize. Furthermore, that excess supply could be taken out rather rapidly because cheaper oil is likely to lead to more demand and consumption. Toyota (NYSE:TM) just reported that sales of its 4Runner sport utility vehicle just jumped by 53% in November and sales of the Prius fell by 14% in the same period. This is just one example of how quickly demand for oil can rise and if you multiply even slight increases in global oil consumption because of much lower prices the numbers get quite large. Urban Carmel (a former McKinsey consultant and President of UBS Securities in Asia) believes that oil is going back to $80 per barrel and a recent article he wrote explains why the perceived glut is not going to last long, he states:

“Excess oil supply (over demand) is presently about 1 mbd. That would be a problem for oil prices except for one thing: existing fields lose about 6% of their production capacity each year, equal to about 5.5 mbd. That means that even if demand is flat, at least 4.5 mbd in new production is needed. Opec has spare capacity of only about 3 mbd. The remainder must come from new investment. New deep water and oil sand projects have a breakeven cost of about $80-90. There will be little incentive to make these investments unless the price of oil is at least $80. If the price stays lower than $80, supply will be insufficient for demand. It’s exactly under those circumstances that spikes higher in oil prices have occurred in the past.”

Reason #4: Oil can be very volatile, but it historically rebounds very quickly because it is used in very large quantities every day. The chart below shows that oil has reached a level that is giving investors a buy signal. Also, it is worth noting that prior oil price slides typically lasted about 20 weeks and the current slide is on week 25 which is another sign a rebound is way overdue. Oil and most oil stocks are extremely oversold now and that means a powerful relief and short covering rally could be coming soon. Some “smart money” investors are recognizing the buying opportunity at hand. Hedge funds are starting to position for a rebound in oil as there is a growing belief that the oil slide has run its course and is now due for a rally.

Oil is already down by about 40%, and the global economy is not in a current state that would support drastically lower prices as some are predicting. It is worth noting that most analysts and economists have a terrible track record when it comes to forecasting oil prices. If you had told anyone that oil was going to surge to over $100 within a couple years of the financial crisis you would have been ridiculed. I believe that the inaction at the OPEC meeting triggered margin call selling, and as we know, selling begets selling especially at this time of year when tax-loss selling fuels even more downside pressure. Some investors are making too much of the oil price decline by trying to connect the dots which should not be connected. I don’t believe that oil’s decline is a major sign of global economic weakness, I believe it is partially because supplies are temporarily a bit higher than needed, the dollar has been strong, and because too many speculators held futures contracts that were suddenly liquidated after the OPEC meeting sparked a sell-off. This has created bargains, especially in small-cap oil stocks. I have been primarily focusing my buying on companies that have no direct exposure to the price of oil and significant contract backlogs. This has led me to buy stocks like McDermott International (NYSE:MDR) which is now incredibly cheap at less than $3 per share. This company is an engineering and construction firm that specializes in the energy industry. It has a $4 billion contract backlog and it has about $900 million in cash and (incredibly) a market cap of just $584 million. That means that this company could buy all the outstanding shares and still have over $300 million left in cash on the balance sheet. McDermott shares are also trading for less than half of the stated book value which is $6.30 per share. On November 14, David Trice (a director) bought 20,000 shares at $4.16, which was about $83,000 worth of stock. But, due to immensely negative sentiment in the oil sector, panic selling, margin call selling, and tax-loss selling, this stock is down by about 40% just from when this insider bought, even though this company has no direct exposure to oil prices and enough business (with the $4 billion+ contract backlog) to keep it busy for the next two years. It also does projects for the natural gas industry and investors seem to have overlooked that natural gas prices have remained solid.

I also see opportunity in Willbros Group (NYSE:WG) which trades for just over $4 now (down from a high of about $13 this year). It specializes in pipeline projects for the energy industry which includes oil and gas, petrochemicals, refining as well as electric power. This stock took a hit several weeks ago when the company announced it would restate earnings due to a charge on a pipeline project that was estimated to reverse about $8 million in previously reported pre-tax income. This caused the company to be delayed in filing the latest financial report and the market overreacted by knocking off about $160 million in market cap in just a few days after the restatement issue was announced. Willbros Group has a strong balance sheet and a $1.7 billion backlog which absolutely dwarfs the restatement numbers and the market cap of just about $215 million. It also recently announced plans for an asset sale that is estimated to generate up to $125 million. For more details, read my recent article on Willbros Group.

I expect that small cap stocks like McDermott and Willbros will rebound as tax-loss selling should fade by December 19th which is the Friday before the holiday season. This causes most traders and investors to have completed their tax planning issues before taking off for the holidays and that often leads to a significant “Santa Claus” and “January Effect” rally in beaten-down small caps.

Keep An Eye On Futures

https://i0.wp.com/www.jamierood.com/art/var/resizes/Oilfield/PumpJacks/PumpjackAtSnowySunset.jpg

Oil Futures Structure Seen as Encouraging Traders to Store Crude. 

By Mohammed Aly Sergie

Brent oil in a contango will encourage traders to take delivery of crude and wait for higher prices, according to U.S. economist Dennis Gartman.

Brent for February delivery is $6.10 a barrel cheaper than the February 2016 contract. February Oman oil traded on the Dubai Mercantile Exchange is $8.30 cheaper than the year later contract after being $6 more expensive about six months ago.

“Not enough people pay attention to the importance of term structure,” Dennis Gartman, author of the Suffolk, Virginia-based Gartman Letter, said yesterday in a phone interview. “The market is saying it will pay traders to go into storage.”

Gartman said contango arbitrage is easier to trade on the broader benchmarks than the Oman contract because banks prefer to provide financing for markets that are more heavily traded. Investors can earn a “nearly riskless return” of 8 percent by selling crude futures and storing oil at current prices, Gartman said.

The cost of warehousing and lending has hindered popularity of the trade, Gartman said. Shipbroker Charles R. Weber said this month that oil tanker rates are too high to spur floating storage. There are 28.8 million barrels of oil being stored at Cushing, Oklahoma, about three million barrels above the 2014 average.

20 Stunning Facts About Energy Jobs In The US

https://i0.wp.com/www.paradinerecruiting.com/wp-content/uploads/2014/07/oil-jobs.jpgby Tyler Durden

For all those who think the upcoming carnage to the shale industry will be “contained” we refer to the following research report from the Manhattan Institute for Policy Research:

  • The United States is now the world’s largest and fastest-growing producer of hydrocarbons. It has surpassed Saudi Arabia in combined oil and natural gas liquids output and has now surpassed Russia, formerly the top producer, in natural gas. [ZH: that’s about to change]
  • The increased production of domestic hydrocarbons not only employs people directly but also radically reduces the drag on growth and job formation associated with America’s trade deficit.
  • As the White House Council of Economic Advisers noted this past summer: “Every barrel of oil or cubic foot of gas that we produce at home instead of importing abroad means more jobs, faster growth, and a lower trade deficit.” [the focus now is not on the oil produced at home, which is set to plunge, but the consumer “tax cut” from plunging oil prices]
  • Since 2003, more than 400,000 jobs have been created in the direct production of oil & gas and some 2 million more in indirect employment in industries such as transportation, construction, and information services associated with finding, transporting, and storing fuels from the new shale bounty.
  • All told, about 10 million Americans are employed directly and indirectly in a broad range of businesses associated with hydrocarbons.
  • There are 16 states with more than 150,000 people employed in hydrocarbon-related activities. Even New York, which continues to ban the production of shale oil & gas, is seeing job benefits in a range of support and service industries associated with shale development in adjacent Pennsylvania.

  • Direct employment in the oil & gas industry had been declining for 30 years but has recently reversed course, with the availability of new technologies to develop shale fields. Nearly 300,000 direct oil & gas jobs have been created following the 2003 nadir in that sector’s direct employment.
  • The five super-major oil companies—Exxon, BP, Chevron, Shell, Conoco—that operate in the U.S. account for only 10 percent of Americans working directly in the oil & gas business.
  • Meanwhile, more than 20,000 other firms are directly involved in the oil & gas industry, and they produce over 75 percent of America’s oil & gas output. The median independent oil & gas firm has fewer than 15 employees. (Note that these data exclude gasoline stations, which employ nearly 1 million people and are overwhelmingly owned by individuals or small businesses.)
  • As in the oil & gas industry, most Americans are employed by firms with fewer than 500 employees. Small businesses not only employ half of all American workers but also generate nearly half the nation’s economic output. Young firms tend to be small firms; and young firms tend to emerge disproportionately in areas of rapid growth or new opportunities—such as in and around America’s shale fields.

  • A broad array of small and midsize oil & gas companies are propelling record economic and jobs gains—not just in the oil fields but across the economy. The enormous expansion in employment, exports, and tax revenues from the domestic oil & gas revolution is largely attributable to a core and defining feature of America: small businesses.
  • The oil & gas sector boom creates “induced” and energy-related jobs. For every direct job, there are, on average, three jobs created in industries such as housing, retail, education, health care, food services, manufacturing, and construction.
  • In the 10 states at the epicenter of oil & gas growth, overall statewide employment gains have greatly outpaced the national average. There we see the ripple-out effect on overall (not just oil & gas) employment. The shale boom’s broad jobs benefits are most visible in North Dakota and Texas, of course, where overall state employment growth in all sectors has vastly outpaced U.S. job recovery. Similarly, in the other states that have experienced recent growth in hydrocarbon production—notably, Pennsylvania, Colorado, Louisiana, Oklahoma, Wyoming—statewide overall (again, not just oil & gas) employment growth has also outpaced the U.S. recovery.
  • In addition to the direct and induced jobs, America is beginning to see the economic and jobs impact of a renaissance in energy-intensive parts of the manufacturing sector, from plastics and chemicals to fertilizers. Examples include an Egyptian firm planning a $1 billion fertilizer plant in Iowa and a South Korean tire company with an $800 million plan for a Tennessee plant. Germany’s BASF recently announced expansion of its American investments, including production and research. BASF calculated that its German operations’ energy bill would be $700 million a year lower if it could pay American prices for energy
  • The Marcellus shale fields in Pennsylvania were responsible for enabling statewide double-digit job growth in 2010 and 2011 and now account for more than one-fifth of that state’s manufacturing jobs. For every $1 that the Marcellus industry spends in the state, $1.90 of total economic output is generated.
  • The typical wage effect of the oil & gas revolution is most clearly visible in Texas. In the 23 counties atop the Eagle Ford shale, average wages for all citizens have grown by 14.6 percent annually since 2005, compared with the 6.8 and 6.3 percent average for Texas and the U.S., respectively, over the same period. The top five counties in the Eagle Ford shale have experienced an average 63 percent annual rate of wage growth. These are the kinds of wage effects sought in every state and by every worker.

  • Given the persistent, slow job recovery from the Great Recession, there could not be a more important time in modern history to find ways to foster more small businesses of all kinds, given that they are not only the core engine for growth but also frequently grow rapidly.

Punchline #1:

  • The $300–$400 billion overall annual economic gain from the oil & gas boom has been greater than the average annual GDP growth of $200–$300 billion in recent years—in other words, the economy would have continued in recession if it were not for the unplanned expansion of the oil & gas sector.

Punchline #2:

  • Hydrocarbon jobs have provided a greater single boost to the U.S. economy than any other sector, without requiring any special taxpayer subsidies—instead generating tax receipts from individual incomes and business growth.

And the final punchline:

  • The National Association of Manufacturers estimated that the shale revolution will lead to 1 million manufacturing jobs over the coming decade. Manufacturing jobs pay nearly 30 percent more than the industrial average and generate $1.48 of economic activity for every $1 spent, making manufacturing the highest economic multiplier of all industrial sectors.

Sorry, not anymore.

Now, thanks to John Kerry’s “secret pact“, and America’s close “ally” in the middle-east, Saudi Arabia whose “mission” it no longer to bankrupt Russia but to crush America’s shale industry, the only question surround the only bright spot for America’s economy over the past 6 years is how long before most of the marginal producers file Chapter 11, or 7.

Trend Towards Renter Households Will Continue Deep Into 2015

https://i0.wp.com/www.rentalhousingdeals.com/uploaded/haimage/1378772288_GlendaleCA.jpg

If you bought or rented in 2014 a larger portion of your income went to housing.  Rents and housing values are quickly outpacing any pathetic gains to be had with wages.  With the stock market at a peak, talking heads are surprised when the public is still largely negative on the economy.  Can it be that many younger adults are living at home or wages are stagnant?  It can also be that our housing market is still largely operated as some feudal operation.  Many lucrative deals were done with big banks and generous offers circumventing accounting rules.  This works because many perceive they are temporarily embarrassed Trumps, only one flip away from being a millionaire.  Why punish financial crimes when you will likely need those laws to protect your gains once you join the club?  The radio talk shows are all trying to convince people to over leverage and buy a home because you know, this time is the last time ever to buy.  Yet home sales are pathetic because people don’t have the wages to support current prices.  So sales drop and many sellers pull properties off the market.  You want to play, you have to pay today.  Rents are also rising and this is where a large portion of household growth has occurred.  2015 will continue to see housing consume a large portion of income and will lead many into a new modern day serfdom.

The Gain Of 7 Million Rental Households

Over the last decade we have added 7 million renting households.  Is this because of population growth?  No.  This trend was driven because of the boom and bust in the housing market.  Investors crowded out regular home buyers in buying single family homes and now, we have millions of new renters out in the market.  Many of these people are folks who lost their homes via foreclosure.

Take a look at the obvious jump in renters:

renter-occupied

For better or worse, home ownership is a path to building equity.  It is a forced saving account for many.  Most Americans don’t even benefit from the stock market peaking because nearly half of the country doesn’t even own stocks.  And many own only a small amount.  Most Americans derive their net worth from their primary residence.  With fewer buying and more renting, I doubt that on a full scale people are suddenly buying stocks for the long-term.  But it is also the case that many are simply renting because that is all they can afford.  Many young Americans have so much debt that this is all they can pay.  Think of places like San Francisco where jobs pay well but rents are simply out of this world and home prices are nutty.

Rents More Stable Versus Wild Housing Prices

Thanks to low rates, generous tax structures, and the American Dream marketing machine home values are operating in a casino like environment.  This wasn’t the case in previous generation but take a look at fluctuations in rents versus home prices:

rents and home prices

A crazy year for rents is when rents go up over 4 percent year-over-year.  For home values we routinely had year-over-year gains of 25 percent in the last 20 years (including the latest boom in 2013).  Rents are driven by net income of local families.  No funny leverage here.  But with buying homes, you have investors chasing yields, or loans that allow tiny down payments for buyers but then tack on a massive 30 year mortgage with a monthly nut that seems reasonable but only because of a low interest rate.  Some of these people have no retirement account yet take on a $600,000 or $800,000 mortgage without batting an eye.  So what we find is this psychological shift where some that want to buy are convinced that they need to start at the bottom of the ladder and pay an enormous price tag just to get in.  To move out of serfdom, you have to embrace the cult of Mega Debt.

Young Adults More Likely To Stay Close To Home – And Rent

Young adults are facing the biggest impact of the housing crunch.  Many are living at home because they can’t even afford current rents.  Those that do venture out, will likely rent as their first step.  A recent survey found that many young adults are planning on staying local.  Say you live with your baby boomer parents in Pasadena or San Francisco.  You want to buy like they did but good luck.  So many have their network within said community and will likely rent (or live with mom and dad deep into their 30s and 40s):

rentals young adults

I found this data interesting.  People are simply moving less from their home area.  So this will create more demand for rentals in these markets.  In California, we have 2.3 million adults living at home.  Pent up demand?  Unlikely.  The main reason they are at home is because of financial constraints.  These are people that can’t even afford a rental.  I’m sure this trend is occurring in other higher priced metro areas as well.

Rental Income Soaring For Investors

Rental income has soared since the bust happened.  The biggest winners?  Those who bought properties to become the new feudal landlords.  You can see by the below chart that there was a larger concerted effort to consolidate rental income beyond the mom and pop buyers of former years:

rental income

Serfdom is also occurring to many households buying.  They are leveraging every penny into their mortgage payment.  Think you own your place?  Try missing a few payments and become part of the 7 million completed foreclosures since the crisis hit.  2014 simply saw more net income going into housing.  Is this good?  Not really since housing is a dud for the economy unless we have new construction being built but that is not happening on a large scale.  2015 will likely see this continuation of serfdom via renting or buying but at least you might save a few bucks with lower oil!  The road to serfdom apparently runs through housing.

Source: Dr. Housing Bubble

Texas: Recession In 2015?

https://i0.wp.com/i.imwx.com/web/news/2012/january/snow-txdrillrig-iwit-mlallison-440x297-010911.jpgby Josh Young

Summary

  • Texas is by far the largest producer of oil in the US.
  • Oil production represents a disproportionate portion of Texas’s economy.
  • With oil prices down 45%, oil’s share of Texas GDP may fall 50% or more.
  • Unlike Russia and other countries, Texas cannot depreciate its own currency, magnifying the economic effect.

Texas is the largest oil producer in the US. And oil prices are down almost 50% in the past 4 months. Yet nowhere in the news do we hear about the risk of Texas entering a recession. The facts and figures below should concern investors in securities with economic exposure to the Texas economy. The risk is real.

As seen in the below chart by the EIA, Texas is the largest oil producing state in the US, producing 3x as much oil as the next largest producing state.

In September, Texas produced 3.23 million barrels of oil per day. This compares to 1.1 million barrels of oil per day produced in the second largest oil producing state, North Dakota, and much smaller quantities by other traditional oil producing states such as Alaska, California, and Oklahoma. And by comparison, Russia produces 10.9 million barrels per day.

Quantifying the value of this production, at $100 oil, that would be $323 million worth of oil produced per day, or $118 billion of oil produced per year. With the current price of oil hovering around $55 per barrel, that same oil production is only worth $178 million per day, or $65 billion. This is a loss of $53 billion of oil sales revenue just in the state of Texas.

This $53 billion in lost revenues compares to Texas’s GDP of $1.4 trillion in 2013 – it would be 3.8% of the State’s GDP, which is now “missing” due to oil prices having fallen. This is only the direct loss to the state – the indirect loss is likely several times as much. Direct oilfield activity is slowing down dramatically, as oil producing companies cut their capital expenditure budgets for 2015. Oilfield services stocks (NYSEARCA:OIH) are already down 37% from their peak earlier this year in anticipation of an activity slowdown. And for every job lost on a rig or in an oil company’s office, there are several additional jobs that may be lost, from the gas station manager to the sales clerk at a store to the front desk worker at a hotel.

The oil industry is unusual in that both the upstream independent producers and the service companies tend to outspend their cash flow, typically on local (to Texas) goods and services, on everything from drill pipe to rig manufacturing to catering. This means that for every dollar of lost oil sales from the lower oil price, there may be several dollars less spent across the Texas economy. This could be devastating for the Texas economy, and has not yet been widely discussed in the financial media.

To see an extreme example of the impact of lower oil prices on an economy tied to oil production, we can look at Russia (NYSEARCA:RSX). The Russian economy is more oil dependent than Texas’s. Russia’s GDP was $2.1 trillion in 2013. This compares to Texas’s GDP of $1.4 trillion. So Russia produces 3.3x as much oil as Texas, but only has 1.5x the GDP. So on a direct basis, assuming “ceteris paribus” conditions, a $1 decline in the price of oil would have 2.2x the impact to the economy of Russia as to the economy of Texas.

So what is happening in Russia? Already, the ruble has dropped in value by 50% in the past year. And numerous sources are calling for a severe recession in 2015. This would be expected, considering the high portion of the GDP that is attributable to oil production.

However, Russia has an advantage that Texas does not have. It has its own currency. While a 50% drop in a currency may not sound great if you’re looking to spend that currency elsewhere, it is crucial if you are an exporter and your primary export just dropped in price by 45%. The ruble denominated impact of the drop in the price of oil is a mere 10%. Unfortunately, for Texas, the dollar denominated drop in oil is 45%. So despite the lower economic exposure to oil, Texas does not have the benefit of a falling currency to buffer the blow of lower oil prices.

It may get even worse. With less drilling activity, oil production growth in Texas may slow, and eventually may decline. Depending on the speed of this slowdown, Texas could even see production decline by the end of 2015. This is because most of the new production has been coming from fracking unconventional wells, which can decline in production by as much as 80% in the first year. Production growth has required an increasing number of wells drilled, and has been funded with 100% of oil company cash flow along with hundreds of billions of dollars of equity and debt over the past few years. With the recent crash in oil stock prices (NYSEARCA: XOP) and in oil company bonds (NYSEARCA: JNK), oil drillers may be forced to spend within cash flow, and that cash flow will be down at least 45% in 2015 if the oil price stays on the path projected in the futures market.

All of this means that in 2015, Texas oil wells could be producing less than the 3.23 million barrels of oil per day it was producing in September 2014, and their owners could be receiving 45% less revenue per barrel produced. Again applying an economic multiplier, the results could be devastating. And without the cushion of a weak currency that benefits countries like Russia, it is hard to see how Texas could avoid a recession in 2015 if the price of oil stays near its current low levels.

Remembering Christmas, 1776

https://i0.wp.com/en.academic.ru/pictures/enwiki/87/Washington_Crossing_the_Delaware_by_Emanuel_Leutze%2C_MMA-NYC%2C_1851.jpg

The American Revolution and its ultimate victory was hinged on a pivotal time in history, Christmas 1776, and it was all due to George Washington…

This Christmas, remember this lesson from history when Patriot George Washington gave the greatest Christmas present to the United States. The gift of hope. The gift of victory. The gift of America.

The Continental Army and the American Revolution was all but over in December 1776 and on the American side, despair and hopelessness were the order of the day.. The United States of America was finished.

It appeared that New York and New Jersey would be firmly back under King George’s “protection” within just a few months. They had already humiliated the Continentals out of New York, inflicting heavy damage on Washington’s army. The Continental Army was disintegrating. Unpaid, ill-equipped, cold, and hungry, soldiers in the Continental Army were deserting or walking away as soon as their enlistments expired.

There was no reason for the British to mess up their Christmas in 1776. Everything was going their way.

In those days, it was customary that armies rest and refit in the winter months in preparation for the campaign seasons of spring and summer. And the British were all about custom and tradition.

The situation was worse than grim for the Americans and the cause was all but over. Except for one man, that is – a man who refused to give up. George Washington.

In spite of countless setbacks and up against incredible odds, Washington never threw in the towel. He never gave up.

In a display of desperation and determination, on Christmas night 1776, General George Washington led the rag-tag Continental Army across the Delaware River to attack the outpost at Trenton, New Jersey.

Washington’s army commenced its crossing of the half-frozen river at three locations. The 2,400 soldiers led by Washington successfully braved the icy and freezing river and reached the New Jersey side of the Delaware just before dawn.

Washington’s force, separated into two columns, and reached the outskirts of Trenton. Trenton’s 1,400 defenders were groggy from the previous evening’s festivities and underestimated the Patriot threat after months of decisive British victories throughout New York. Washington’s men quickly overwhelmed their defenses, and surrounded the town. Several hundred escaped, and nearly 1,000 were captured at the cost of only four American lives.

It was a brilliant victory for George Washington – and a tremendous morale boost for the Americans. Within a few days, Washington followed up his victory with another at Princeton, and then quartered his troops at Morristown. The British were forced to redeploy in a way that gave up most of New Jersey and limited their reach in New York. It was a masterful campaign that stabilized the American Revolution and made victory possible.

The lesson learned…
Unconventional warfare, thinking outside the box, and a surprise attack when the enemy was most vulnerable – all made the difference in the ultimate victory. One battle, although itself not extremely significant, made all the difference for the eventual outcome. It boosted moral. It gave hope to those on the fence… You see, one person can make a difference. It could even be you…

“Houston, You Have A Problem” – Texas Is Headed For A Recession Due To Oil Crash, JPM Warns

https://i0.wp.com/i.qkme.me/3rq0zl.jpg
by
Tyler Durden

It was back in August 2013, when there was nothing but clear skies ahead of the US shale industry that we asked “How Much Is Oil Supporting U.S. Employment Gains?” The answer we gave:

The American Petroleum Institute said last week the U.S. oil and natural gas sector was an engine driving job growth. Eight percent of the U.S. economy is supported by the energy sector, the industry’s lobbying group said, up from the 7.7 percent recorded the last time the API examined the issue. The employment assessment came as the Energy Department said oil and gas production continued to make gains across the board. With the right energy policies in place, API said the economy could grow even more. But with oil and gas production already at record levels, the narrative over the jobs prospects may be failing on its own accord…. The API’s report said each of the direct jobs in the oil and natural gas industry translated to 2.8 jobs in other sectors of the U.S. economy. That in turn translates to a total impact on U.S. gross domestic product of $1.2 trillion, the study found.

Two weeks ago we followed up with an article looking at “Jobs: Shale States vs Non-Shale States” in which we showed the following chart:

And added the following:

According to a new study, investments in oil and gas exploration and production generate substantial economic gains, as well as other benefits such as increased energy independence.  The Perryman Group estimates that the industry as a whole generates an economic stimulus of almost $1.2 trillion in gross product each year, as well as more than 9.3 million permanent jobs across the nation. 

The ripple effects are everywhere. If you think about the role of oil in your life, it is not only the primary source of many of our fuels, but is also critical to our lubricants, chemicals, synthetic fibers, pharmaceuticals, plastics, and many other items we come into contact with every day. The industry supports almost 1.3 million jobs in manufacturing alone and is responsible for almost $1.2 trillion in annual gross domestic product. If you think about the law, accounting, and engineering firms that serve the industry, the pipe, drilling equipment, and other manufactured goods that it requires, and the large payrolls and their effects on consumer spending, you will begin to get a picture of the enormity of the industry.


Another way of visualizing the impact of the shale industry on the US economy comes courtesy of this chart from the Manhattan Institute which really needs no commentary:

The Institute had this commentary to add:

The jobs recovery since the 2008 recession has been the slowest of any post recession recovery in the U.S. since World War II. The number of people employed has yet to return to the 2007 level. The country has suffered a deeper and longer-lasting period of job loss than has followed any of the ten other recessions since 1945.

There has, however, been one employment bright spot: jobs in America’s oil & gas sector and related industries. Since 2003, more than 400,000 jobs have been created in the direct production of oil & gas and some 2 million more in indirect employment in industries such as transportation, construction, and information services associated with finding, transporting, and storing fuels from the new shale bounty.

In addition, America is seeing revitalized growth and jobs in previously stagnant sectors of the economy, from chemicals production and manufacturing to steel and even textiles because of access to lower cost and reliable energy.

The surge in American oil & gas production has become reasonably well-known; far less appreciated are two key features, which are the focus of this paper: the widespread geographic dispersion of the jobs created; and the fact that the majority of the jobs have been created not in the ranks of the Big Oil companies but in small businesses, even more widely dispersed.

Fast forward to today when we are about to learn that Newton’s third law of Keynesian economics states that every boom, has an equal and opposite bust.

Which brings us to Texas, the one state that more than any other, has benefited over the past 5 years from the Shale miracle. And now with crude sinking by the day, it is time to unwind all those gains, and give back all those jobs. Did we mention: highly compensated, very well-paying jobs, not the restaurant, clerical, waiter, retail, part-time minimum-wage jobs the “recovery” has been flooded with.

Here is JPM’s Michael Feroli explaining why Houston suddenly has a very big problem.

  • In less than five years Texas’ share of US oil production has gone from around 25% to over 40%
  • By some measures, the oil intensity of the Texas economy looks similar to what it was in the mid-1980s
  • The 1986 collapse in oil prices led to a painful regional recession in Texas
  • While the rest of the country looks to benefit from cheap oil, Texas could be headed for recession

The collapse in oil prices will create winners and losers, both globally and here in the US. While we expect the country, overall, will be a net beneficiary from falling oil prices, two states look like they will bear the brunt of the pain: North Dakota and Texas. Given its much larger size, the prospect of a recession in Texas could have some broader reverberations. 

By now, most people are familiar with the growth of the fossil fuel industry in places like Pennsylvania and Ohio. However, that has primarily been a natural gas story. The renaissance of US crude oil production has been much more concentrated: over 90% of the growth in the past five years has been in North Dakota and Texas; with Texas alone accounting for 67% of the increase in the nation’s crude output over that period.

In the first half of 1986, crude oil prices fell just over 50%. At the end of 1985, the unemployment rate in Texas was equal to that in the nation as a whole; at the end of 1986 it was 2.6%- points higher than the national rate. There are some reasons to think that it may not be as bad this time around, but there are even better reasons not to be complacent about the risk of a regional recession in Texas.

Geography of a boom

The well-known energy renaissance in the US has occurred in both the oil and natural gas sectors. Some states that are huge natural gas producers have limited oil production: Pennsylvania is the second largest gas producing state but 19th largest oil producer. The converse is also true: North Dakota is the second largest crude producer but 14th largest gas producer. However, most of the economic data as it relates to the energy sector, employment, GDP, etc, often lump together the oil and gas extraction industries. Yet oil prices have collapsed while natural gas prices have held fairly steady. To understand who is vulnerable to the decline in oil prices  specifically we turn to the EIA’s state-level crude oil production data.

The first point, mentioned at the outset, is that Texas, already a giant, has become a behemoth crude producer in the past few years, and now accounts for over 40% of US production. However, there are a few states for which oil is a relatively larger sector (as measured by crude production relative to Gross State Product): North Dakota, Alaska, Wyoming, and New Mexico. For two other states, Oklahoma and Montana, crude production is important, though somewhat less so than for Texas. Note, however, that these are all pretty small states: the four states where oil is more important to the local economy than Texas have a combined GSP that is only 16% of the Texas GSP. Finally, there is one large oil producer, California, which is dwarfed by such a huge economy that its oil intensity is actually below the national average, and we would expect it, like the country as a whole, to benefit from lower oil prices.

Texas-sized challenges

As discussed above, Texas is unique in the country as a huge economy and a huge oil producer. When thinking about the challenges facing the Texas economy in 2015 it may be useful, as a starting point, to begin with the oil price collapse of 1986. Then, like now, crude oil prices collapsed around 50% in the space of a few short months. As noted in the introduction, the labor market response was severe and swift, with the Texas unemployment rate rising 2.0%-points in the first three months of 1986 alone. Following the hit to the labor market, the real estate market suffered a longer, slower, burn, and by the end of 1988 Texas house prices were down over 14% from their peak in early 1986 (over the same period national house prices were up just over 14%). The last act of this tragedy was a banking crisis, as several hundred Texas banks failed, with peak failures occurring in 1988 and 1989.

How appropriate is it to compare the challenges Texas faces today to the ones they faced in 1986? The natural place to begin is by getting a sense of the relative energy industry intensity of Texas today versus 1986. Unfortunately, the GSP-by-industry data have a definitional break in 1997, but splicing the data would suggest a similar share of the oil and gas sector in Texas GSP now and in 1985: around 11%. Employment in the mining and logging sector (which, in Texas, is overwhelmingly dominated by the oil and gas sector) was around 3.7% in 1985 and is 2.7% now. This is consistent with a point we have been making in the national context: the oil and gas sector is very capital-intensive, and increasingly so. Even so, as the 1986 episode demonstrated, there do seem to be sizable multiplier effects on non-energy employment. Finally, there does not exist capital spending by state data, but at the national level we can see the flip side of the increasing capital intensive nature of energy: oil and gas related cap-ex was 0.58% of GDP in 4Q85, and is 0.98% of GDP now.

Given this, what is the case for arguing that this time is different, and the impact will be smaller than in 1986? One is that now, unlike in 1986, natural gas prices haven’t moved down in sympathy with crude oil prices, and the Texas recession in 1986 may have owed in part also to the decline in gas prices. Another is that, as noted above, the employment share is somewhat lower, and thus the income hit will be felt more by capital-holders – i.e. investors around the country and the world. Finally, unlike 1986, the energy industry is experiencing rapid technological gains, pushing down the energy extraction cost curve.

While these are all valid, they are not so strong as to signal smooth sailing for the Texas economy. Financially, oil is a fair bit more important than gas for Texas, both now and in 1986, with a dollar value two to three times as large. Moreover, while energy employment may be somewhat smaller now, we are not talking about night and day. The current share is about 3/4ths what it was in 1986. (Given the higher capital intensity, there are some reasons to think employment may be greater now in sectors outside the traditional oil and gas sectors, such as pipeline and heavy engineering construction).

As we weigh the evidence, we think Texas will, at the least, have a rough 2015 ahead, and is at risk of slipping into a regional recession. Such an outcome could bring with it the usual collateral damage that occurs in a slowdown. Housing markets have been hot in Texas. Although affordability in Texas looks good compared to the national average, it always does; compared to its own history, housing in some major Texas metro areas looks quite dear, suggesting a risk of a pull-back in the real estate market.

The national economy performed quite well in 1986, in spite of the Texas recession. We expect the US economy will perform well next year too , though some  regions – most notably Texas – could significantly under perform the national average.

* * *
So perhaps it is finally time to add that footnote to the “unambiguously good” qualified when pundits describe the oil crash: it may be good for everyone… except Texas which is about to enter a recession. And then Pennsylvania. And then North Dakota. And then Colorado. And then West Virginia. And then Alaska. And then Wyoming. And then Oklahoma. And then Montana, and so on, until finally we find just where the new equilibrium is following the exodus of hundreds of thousands of the best-paying jobs created during the “recovery” offset by minimum-wage waiters, bartenders, retail workers and temps.

BofA Analyst Credits Falling Oil Prices for Lower Mortgage Rates

https://i0.wp.com/www.syntheticoilchangeprice.com/wp-content/gallery/cheap-oil-change/cheap_oil_change_hero.jpgby Phil Hall

The precipitous drop in global oil prices has created a domino effect that led to a new decline in lower mortgage rates, according to a report by Chris Flanagan, a mortgage rate specialist at Bank of America Merrill Lynch.

“The oil collapse of 2014 appears to have been a key driver [in declining mortgage rates],” stated Flanagan in his report, which was obtained by CBS Moneywatch. “Further oil price declines could lead the way to sub-3.5 percent mortgage rates.”

Flanagan applauded this development, noting that the reversal of mortgage rates might propel housing to a stronger recovery.

“We have maintained the view that 4 percent mortgage rates are too high to allow for sustainable recovery in housing,” he wrote. Flanagan also theorized that if rates fell into 3.25 percent to 3.5 percent range, it would boost “supply from both refinancing and purchase mortgage channels.”

Flanagan’s report echoes the sentiments expressed by Frank Nothaft, Freddie Mac’s chief economist, who earlier this week identified the link between oil prices and housing.

“The recent drop in oil prices has been an unexpected boon for consumers’ pocketbooks and most businesses,” Nothaft stated. “Economic growth has picked up over the final nine months of 2014 and lower energy costs are expected to support growth of about 3 percent for the U.S. in 2015. Therefore we expect the housing market to continue to strengthen with home sales rising to their best sales pace in eight years, national house price indexes up, and rental markets continuing to display low vacancy rates and the highest level of new apartment completions in 25 years.”

But not everyone is expected to benefit from this development. A report issued last week by the Houston Association of Realtors forecast a 10 percent to 12 percent drop in home sales over the next year, owing to a potential slowdown in job growth for the Houston market’s energy industry if oil prices continue to plummet.

Why Cheap Oil May Be Here To Stay

https://i0.wp.com/m.wsj.net/video/20141212/121214table3/121214table3_1280x720.jpg
By
Kyle Spencer

Summary

  • Many investors are still skeptical that Saudi Arabia will hold firm on oil production.
  • Increased global consumption due to falling prices is unlikely to offset North American production.
  • US consumption is in a secular, structural decline due to increased efficiency and demographic changes. That’s unlikely to change any time soon.
  • The floor may not be where the Saudis think it is.

Investors are slowly waking up to the fact that Saudi Arabia is willing to take OPEC hostage to defend its market share, with Oil Minister Ali Al-Naimi declaring that –

In a situation like this, it is difficult, if not impossible, that the kingdom or OPEC would carry out any action that may result in a reduction of its share in market and an increase of others’ shares.

Alas, rather than embrace the cheap petroleum paradigm that has dominated most of the 20th century, many investors continue to cling to old shibboleths. Case in point: Brian Hicks, a portfolio manager at US Global Investors, recently noted that

The theme going into 2015 is mean reversion. Oil prices are below where they should be (emphasis mine), and hopefully they will start gravitating back to the equilibrium price of between $US80 and $US85 a barrel.

I emphasize the words “below where they should be” because the notion that oil (NYSEARCA:USO) prices belong somewhere – and it’s always higher, somehow – is the linchpin of the bullish thesis. But the question of why a high price regime should prevail over a low price regime is never satisfactorily explained.

Higher extraction costs? A sizable chunk of those costs are sunk costs that can simply be ignored in production decisions and lowering the effective breakeven price. A tighter focus on already drilled wells in areas with mature infrastructure could lower costs even further. Moreover, service sector costs fall as rigs are idled. Depleted reserves? Most resource-producing basins are experiencing an increasing yield over time despite the rapid depletion of individual wells. A lot of that is due to extraction efficiency, which is increasing at a phenomenal rate; in fact, one rig today brings on four times the amount of gas in the Barnett Shale than it did in 2006. Drill times in the Bakken are also falling, while new well production per rig is steadily rising since 2011.

Drill Times (Spud to Rig) 2004-2013

(SOURCE: ITG Research)

Technically oversold? Good luck catching that knife. Traders have been pounding the table on “oversold conditions” since $80. Proponents of the Oversold Hypothesis who like to point historical examples of oil’s extreme short-term volatility for validation are conveniently ignoring the vast number of counter-examples like this TIME Magazine headline from June, 1981, which almost reads as if it could have been written yesterday:

(Source: TIME Archives)

1981 is an intriguing date for another reason: It marked the first time in over a decade that Non-OPEC nations countries outproduced OPEC. Despite repeated cuts by OPEC, it took five years for capitulation to set in. Nor are lower prices guaranteed to lead to cuts. Indeed, when oil prices plummeted from $4/bbl to 35 cents in 1862, the Cleveland wildcatters didn’t idle their pumps; they pumped faster to pay the interest on their debt.

Don’t Iran and Venezuela require higher oil prices in order to balance their budgets and head off domestic upheaval? Please. The Saudis don’t care about Iran’s budget problems. Venezuela is a non-entity despite it’s immense reserves. In fact, Venezuela’s hell-in-a-handbasket status was one of the major reasons for Cuba’s recent defection to the US.

Asian stimulus? The only reason that Japanese consumers know that oil prices are lower is from Western news headlines. The share of a day’s wages to buy a single gallon of gas in Japan is 5.59% vs. 2.45% in the US. Nevertheless, the Japanese are riding high compared to the BRICS: In Brazil, it’s 17.62%; in Russia, 7.95%; in India it’s 114.92%; in China it’s 23.54%. Not the most fertile ground for a demand-side revolution; especially since oil is priced in dollars rather than yen, reals, rubles, or rupees.

What about the US? Won’t lower prices lead to higher consumption? Despite what you read about our “insatiable thirst” for oil, Americans don’t actually drink the stuff. Our machines do, and those machines are becoming more and more efficient due to CAFE standards and new transportation technologies, especially NGVs. Demographic changes are also leading a secular decline in consumption. Fig. 2 below highlights the steady march down for miles traveled per capita as the Baby Boomers retire to slower paced lives.

(Source: Citigroup, Census, CIRA)

The reality is that there’s little that an uptick in demand can do to offset oil’s continuing price collapse if the Saudis aren’t prepared to cut to the bone. The wildcatters certainly aren’t going to; on the contrary, they have every incentive (and no real alternative at this point) to pump like crazy to pay down debt and break OPEC’s back. Most doom and gloom prognostications for North American shale use full-cycle breakeven estimates like the ones presented in Figure 2.

Full-Cycle Breakeven Costs by Resource (Assuming Zero Efficiency Gains)

Unfortunately for the bulls, all-in sustaining cost (full-cycle capex) is a totally irrelevant metric for establishing a floor on commodity prices. Commodities prices are based on the marginal cost of production of the most prolific producers, not the full-cycle costs of marginal, high cost producers lopped in with the market leaders. As Seth Kleinman’s group at Citi has pointed out

…what counts at this stage is half-cycle costs, which are in the significantly lower band of $37 to $45 a barrel. This means that the floor is falling and may not be nearly as firm as the Saudi view assume(s).

How To Buy Your Own Greek Island

About 20 privately owned Greek islands are currently up for sale, some for the first time in generations.

Skorpios island was sold last year to Ekaterina Rybolovleva, daughter of Russian billionaire Dmitry Rybolovlev. European Pressphoto Agency.   Article written by Stelios Bouras and Nektaria Stamoul

It’s the ultimate dream property of the super rich: your own Greek island, drenched in sunshine and surrounded by turquoise water.

Traditionally, these islands have rarely come up for sale, staying in the same families from one generation to the next. But Greek’s private-island property market is perking up, bolstered by growing interest from foreign investors, a drop in prices and changes to Greek tax laws. Some 20 privately owned Greek islands are currently up for sale.

Brett Taylor/The Wall Street Journal
Greek shipping tycoon Aristotle Onassis and Jacqueline Kennedy on Skorpios in 1969. They were married there the previous year. Agence France-Presse/Getty Images


Notable new island-owners include Ekaterina Rybolovleva, the 25-year-old daughter of Russian billionaire Dmitry Rybolovlev. Early last year, a company belonging to a trust affiliated with Ms. Rybolovleva bought the Greek isle of Skorpios from Athina Onassis Roussel, the granddaughter of Greek shipping tycoon Aristotle Onassis. (The island was the site, 45 years earlier, of the wedding of the magnate and former first lady Jacqueline Kennedy.) The sale price was reportedly £100 million, or $158 million; a representative for Ms. Rybolovleva confirmed the sale but wouldn’t comment on the price.

“After Skorpios was sold, and especially during the past year, there has been an intense interest in the islands’ market,” says Alexandros Moulas, an agent for real-estate firm Savills . “An intermediate usually gets in touch with us and the name of the actual investor is kept as a closely guarded secret.”

Ms. Rybolovleva’s neighbor a few islands to the south on the islet of Oxia, is reportedly the former emir of Qatar, Sheik Hamad bin Khalifa Al-Thani. Last year, the Athens-based investment group Pima bought the islet—a 1,236-acre uninhabited island in the Ionian Sea off Greece’s west coast—for about €5.5 million, or $6.9 million. A representative for the investment group says Pima was acting on its own, though two local government officials say the group was buying on behalf of the former emir. Efforts to reach the former emir were not successful.

Prices for these islands can run anywhere from a few million euros to more than €100 million, depending on amenities such as running water, electricity—and, in some cases, mooring facilities for a yacht. Still, property experts say prices are down overall—as much as 30% from pre-crisis levels.

Most of the 20 islands on the market are completely undeveloped; some have wooded areas, while others are mostly rock. Nissos island, in the Ionian sea five nautical miles off mainland Greece, is priced at about $6.8 million and can accommodate six houses of up to 130 square meters each, according to broker Savills. Nearby Omfori Island, priced at nearly $62 million, has one small building on the island with permissions in place to build on 20% of the 1,112-acre island, according to the real-estate listings site Private Islands Online.

The Ionian island of Oxia. Agence France-Presse/Getty Images

With some 6,000 islands and islets, Greece has no shortage of supply, but island ownership can come with its share of headaches. Most islands aren’t suitable for development, and access to many of them is difficult—especially given Greece’s restrictions on private seaplanes. The red tape is fearsome: To buy an island, up to 32 bureaucratic steps are required, including background checks to determine whether a prospective buyer would pose a threat to the country’s national security.

Another turnoff for some buyers is that, in Greece, all beaches are public. That means no matter how remote the island or how high the price tag, anyone with a yacht can show up, uninvited, for a swim.

Sometimes, there are issues with the locals. Greek businessman Yannis Perrotis, managing director of real-estate company Atria Property Services, set his sights on developing the small, privately owned island of Arkoudi in the Ionian Sea almost a decade ago. He is considering building an exclusive super high-end resort with luxury villas, a hotel spa, a marina, and recreational and sports facilities and sports facilities—all at a cost of between $312 million and $375 million.

But Mr. Perrotis discovered that his uninhabited island actually had residents: a shepherd and his flock of goats. It took him more than two years to get them off the island.

“I went through a few years of real trials and tribulations followed by a few years of anger,” said Mr. Perrotis. “But now I have something in my hands that has additional value and tangible prospects.”

Some Greek island owners—many bequeathed their islands from distant family forebears—are reassessing the value of their land in the face of the financial crisis and the new tax laws. Athens, under pressure from its international creditors from the Eurozone and the International Monetary Fund to fix its public finances, this year introduced its first permanent tax on real estate.

After a decade in which only a handful of deals have taken place, say property experts, suddenly, a private island has become a possession that many owners no longer have the luxury to maintain.

“I have customers telling me they need to sell as quickly as possible. They say they can’t handle the tax burden,” says Yannis Kriaras, a real-estate agent based on the island of Crete. “Most of them resent having even inherited an island.”

Oil Bust Contagion Hits Wall Street, Banks Sit on Losses

https://i0.wp.com/www.bloomberg.com/image/iptmX9f9f1vc.jpgby Wolf Richter

Oil swooned again on Wednesday, with the benchmark West Texas Intermediate closing at $60.94. And on Thursday, WTI dropped below $60, currently trading at $59.18. It’s down 43% since June.

Yesterday, OPEC forecast that demand for its oil would further decline to 28.9 million barrels a day next year, after having decided over Thanksgiving to stick to its 30 million barrel a day production ceiling, rather than cutting it. It thus forecast that there would be on OPEC’s side alone 1.1 million barrels a day in excess supply.

Hours later, the US Energy Information Administration reported that oil inventories in the US had risen by 1.5 million barrels in the latest week, while analysts had expected a decline of about 3 million barrels.

So the bloodletting continues: the Energy Select Sector ETF (XLE) is down 26% since June; S&P International Energy Sector ETF (IPW) is down 34% since July; and the Oil & Gas Equipment & Services ETF (XES) is down 46% since July.

Goodrich Petroleum, in its desperation, announced it is exploring strategic options for its Eagle Ford Shale assets in the first half next year. It would also slash capital expenditures to less than $200 million for 2015, from $375 million for 2014. Liquidity for Goodrich is drying up. Its stock is down 88% since June.

They all got hit. And in the junk-bond market, investors are grappling with the real meaning of “junk.”

Sabine Oil & Gas’ $350 million in junk bonds still traded above par in September before going into an epic collapse starting on November 25 that culminated on Wednesday, when they lost nearly a third of their remaining value to land at 49 cents on the dollar.

In early May, when the price of oil could still only rise, Sabine agreed to acquire troubled Forest Oil Corporation, now a penny stock. The deal is expected to close in December. But just before Thanksgiving, when no one in the US was supposed to pay attention, Sabine’s bonds began to collapse as it seeped out that Wells Fargo and Barclays could lose a big chunk of money on a $850-million “bridge loan” they’d issued to Sabine to help fund the merger.

A bridge loan to nowhere: investors interested in buying it have evaporated. The banks are either stuck with this thing, or they’ll have to take a huge loss selling it. Bankers have told the Financial Times that the loan might sell for 60 cents on the dollar. But that was back in November before the bottom fell out entirely.

As so many times in these deals, there is a private equity angle to the story: PE firm First Reserve owns nearly all of Sabine and leveraged it up to the hilt.

The same week, a $220-million bridge loan, put together by UBS and Goldman Sachs for PE firm Apollo Group’s acquisition of oilfield-services provider Express Energy, was supposed to be sold. But investors balked. As of December 2, the loan was still being marketed, “according to two people with knowledge of the deal,” Bloomberg reported. If it can be sold at all, it appears UBS and Goldman will end up with a loss.

And so energy-related leveraged loans are tanking. These ugly sisters of junk bonds are issued by junk-rated corporations, and they have everyone worried [Treasury Warns Congress (and Investors): This Financial Creature Could Sink the System]. Their yields have shot up from 5.1% in August to 7.4% in the latest week, and to nearly 8% for those of offshore drillers [“Yes, it Was a Brutal Week for the Oil & Gas Loan Sector”].

Six years of the Fed’s easy money policies purposefully forced even conservative investors to either lose money to inflation or venture way out on the risk curve. So they ventured out, many of them without knowing it because it happened out of view inside their bond funds. And they funded the fracking boom and the offshore drilling boom, and the entire oil revolution in America, no questions asked.

Energy junk bonds now account for a phenomenal 15.7% of the $1.3 trillion junk-bond market. Alas, last week, JPMorgan warned that up to 40% of them could default over the next few years if oil stays below $65 a barrel. Bond expert Marty Fridson, CIO at LLF Advisors, figured that of the 180 “distressed” bonds in the BofA Merrill Lynch high-yield index, 52 were issued by energy companies. And Bloomberg reported that the yield spread between energy junk bonds and Treasuries has more than doubled since September to 942 basis points (9.42 percentage points).

The toxicity of energy junk bonds is spreading to the broader junk-bond market. The iShares iBoxx High Yield Corporate Bond ETF fell 1.2% to $88.43 on Thursday, the lowest since June 2012. And at the riskiest end of the junk-bond market, it’s getting ugly: the effective yield index for bonds rated CCC or lower jumped from 7.9% in late June to 11.4% on Wednesday.

After not finding any visible yield in the classic spots, thanks to the Fed’s policies, institutional investors – the folks that run your mutual fund or pension fund – took big risks just to get a tiny bit of extra yield. And to grab a yield of 5% in June, they bought energy junk debt so risky that it now has lost a painfully large part of its value, and some of it might default.

Oil and gas are inseparable from Wall Street. Over the years, as companies took advantage of the Fed’s policies and issued this enormous amount of risky debt at a super-low cost, and as they raised money by spinning off subsidiaries into over-priced IPOs that flew off the shelf in one of the most inflated markets in history, and as they spun off other assets into white-hot MLPs, and as banks put now iffy bridge loans together, and as mergers and acquisitions were funded, at each step along the way, Wall Street extracted its fees.

Now the boom is turning into a bust, and the contagion is spreading from the oil patch to Wall Street. Energy companies are cutting back. BP, Chevron, Goodrich…. They’re not cutting back production by turning a valve. They’ll keep the oil and gas flowing to generate cash to stay alive, and it will contribute to the glut.

Instead, they’re cutting back on exploration and drilling projects. It will hit local economies in the oil patch and ripple beyond them. As energy companies slash their capex and their stock buybacks, they’ll borrow less, those that can still borrow at all, and there won’t be many energy IPOs, and there may not be a lot of spinoffs into MLPs or any of the other financial maneuvers that Wall Street got so fat on during the fracking and offshore drilling boom. The fees will dry up. And some of the losses will come home to roost on bank balance sheets.

The contagion is already visible on Wall Street. Susquehanna Financial Group downgraded Goldman Sachs to neutral on Wednesday, citing the mayhem in the oil markets and the impact it has on junk bonds and leveraged loans and the other financial mechanism by which Goldman’s investment and lending divisions sucked fees out of the oil patch and its investors. And this is just the beginning.

CFPB Tells Lenders: Don’t Scrutinize Disability Recipients Applying For Home Loans

https://i0.wp.com/www.creditcardguide.com/credit-cards/wp-content/uploads/2012/07/cfpb-badge.jpgby IBD editorial

Disparate Impact: The president’s new credit watchdog agency is warning lenders they could be investigated for discrimination if they scrutinize welfare recipients applying for home loans. Here we go again.

In an agency bulletin, the Consumer Financial Protection Bureau specifically advised mortgage lenders not to verify the income of people receiving Social Security Disability Insurance benefits.

SSDI enrollment has exploded under Obama, and fraud is rampant in the program. A recent probe by Congress found doctors rubber-stamping claims for the generous benefits. A random review found more than 1-in-4 cases failed to provide evidence to support claims.

No wonder mortgage lenders are asking for verification.

Last year, the number of Americans receiving payments skyrocketed to a record 15 million-plus. A disproportionate share of enrollees are African-American — blacks make up 12% of the population, but over 17% of all SSDI recipients — and black groups have complained to regulators that mortgage underwriters are making unreasonable demands for income verification.

The NAACP argues disability payments are a “critical source of financial support” for blacks, noting their average monthly benefit is almost $1,000.

“The program’s benefits provide a significant income boost to lower-earning African-Americans,” NAACP asserted, noting the share of blacks on federal disability is more than double that for whites.

In response, CFPB has issued a five-page edict warning mortgage lenders they could face “disparate impact” liability if they question whether “all or part” of a minority applicant’s income “derives from a public assistance program.”

If they know what’s good for them, they’ll “avoid unnecessary documentation requests and increase access to credit for persons receiving Social Security disability income.”

In a separate warning, HUD was more forceful: “A lender shouldn’t ask a consumer for documentation or about the nature of his or her disability under any circumstances.”

We can’t say we’re shocked. As we’ve reported — contrary to other media reporting — CFPB’s new Qualified Mortgage rule mandates payments from “government assistance programs are acceptable” forms of income for home loan qualification. (It’s in the 804-page regulation, if financial journalists would just take the time to read it.)

More, the Justice Department has ordered the biggest mortgage lenders in the country, including Wells Fargo and Bank of America, to offer loans to people on “public assistance.” They’re even required to post branch notices promoting the risky welfare acceptance policy.

The administration is actually forcing banks to target high-risk borrowers for 30-year debt under threat of prosecution.

Though President Obama’s worried about a plunge in new-home buying among jobless minorities, he’s just setting them up for failure all over again. A mortgage requires a stable job and income to avoid defaults and foreclosures.

Failure to require income documentation contributed to the mortgage crisis and was something CFPB was created to stop.

Exempting public-assistance income from the rules exposes the bogus nature of Obama’s financial “reforms.”

Bank of America Sees $50 Oil As OPEC Dies

“Our biggest worry is the end of the liquidity cycle. The Fed is done. The reach for yield that we have seen since 2009 is going into reverse”, said Bank of America.

https://i0.wp.com/media0.faz.net/ppmedia/aktuell/wirtschaft/759001933/1.2727518/article_multimedia_overview/umweltpolitisch-hoch-umstritten-hilft-fracking-hier-in-colorado-amerika-dabei-unabhaengiger-von-den-opec-mitgliedern-zu-werden.jpgBy Ambrose Evans-Pritchard

The OPEC oil cartel no longer exists in any meaningful sense and crude prices will slump to $50 a barrel over the coming months as market forces shake out the weakest producers, Bank of America has warned.

Revolutionary changes sweeping the world’s energy industry will drive down the price of liquefied natural gas (LNG), creating a “multi-year” glut and a much cheaper source of gas for Europe.

Francisco Blanch, the bank’s commodity chief, said OPEC is “effectively dissolved” after it failed to stabilize prices at its last meeting. “The consequences are profound and long-lasting,“ he said.

The free market will now set the global cost of oil, leading to a new era of wild price swings and disorderly trading that benefits only the Mid-East petro-states with deepest pockets such as Saudi Arabia. If so, the weaker peripheral members such as Venezuela and Nigeria are being thrown to the wolves.

The bank said in its year-end report that at least 15pc of US shale producers are losing money at current prices, and more than half will be under water if US crude falls below $55. The high-cost producers in the Permian basin will be the first to “feel the pain” and may soon have to cut back on production.

The claims pit Bank of America against its arch-rival Citigroup, which insists that the US shale industry is far more resilient than widely supposed, with marginal costs for existing rigs nearer $40, and much of its output hedged on the futures markets.

Bank of America said the current slump will choke off shale projects in Argentina and Mexico, and will force retrenchment in Canadian oil sands and some of Russia’s remote fields. The major oil companies will have to cut back on projects with a break-even cost below $80 for Brent crude.

It will take six months or so to whittle away the 1m barrels a day of excess oil on the market – with US crude falling to $50 – given that supply and demand are both “inelastic” in the short-run. That will create the beginnings of the next shortage. “We expect a pretty sharp rebound to the high $80s or even $90 in the second half of next year,” said Sabine Schels, the bank’s energy expert.

Mrs Schels said the global market for (LNG) will “change drastically” in 2015, going into a “bear market” lasting years as a surge of supply from Australia compounds the global effects of the US gas saga.

If the forecast is correct, the LNG flood could have powerful political effects, giving Europe a source of mass supply that can undercut pipeline gas from Russia. The EU already has enough LNG terminals to cover most of its gas needs. It has not been able to use this asset as a geostrategic bargaining chip with the Kremlin because LGN itself has been in scarce supply, mostly diverted to Japan and Korea. Much of Europe may not need Russian gas at all within a couple of years.

Bank of America said the oil price crash is worth $1 trillion of stimulus for the global economy, equal to a $730bn “tax cut” in 2015. Yet the effects are complex, with winners and losers. The benefits diminish the further it falls. Academic studies suggest that oil crashes can ultimately turn negative if they trigger systemic financial crises in commodity states.

Barnaby Martin, the bank’s European credit chief, said world asset markets may face a stress test as the US Federal Reserve starts to tighten afters year of largesse. “Our biggest worry is the end of the liquidity cycle. The Fed is done and it is preparing to raise rates. The reach for yield that we have seen since 2009 is going into reverse”, he said.

Mr Martin flagged warnings by William Dudley, the head of the New York Fed, that the US authorities had tightened too gently in 2004 and might do better to adopt the strategy of 1994 when they raised rates fast and hard, sending tremors through global bond markets.

Bank of America said quantitative easing in Europe and Japan will cover just 35pc of the global stimulus lost as the Fed pulls back, creating a treacherous hiatus for markets. It warned that the full effect of Fed tapering had yet to be felt. From now on the markets cannot expect to be rescued every time there is a squall. “The threshold for the Fed to return to QE will be high. This is why we believe we are entering a phase in which bad news will be bad news and volatility will likely rise,” it said.

What is clear is that the world has become addicted to central bank stimulus. Bank of America said 56pc of global GDP is currently supported by zero interest rates, and so are 83pc of the free-floating equities on global bourses. Half of all government bonds in the world yield less that 1pc. Roughly 1.4bn people are experiencing negative rates in one form or another.

These are astonishing figures, evidence of a 1930s-style depression, albeit one that is still contained. Nobody knows what will happen as the Fed tries to break out of the stimulus trap, including Fed officials themselves.

The Most Expensive Billionaire Homes In The World

Introduction
by
Erin Carlyle

Jana Partners founder Barry Rosenstein recently purchased an East Hampton estate for $147 million, setting a new record for the most expensive home ever purchased in the United States. But compared to other homes owned by FORBES billionaires around the world, that price tag was a relative bargain.

Case in point: less than two weeks ago, Reuters broke the news that a penthouse at prestigious One Hyde Park in London’s tony Knightsbridge neighborhood had sold for $237 million, setting a new world record for the priciest apartment sale ever. Although the buyer remains unknown, the purchaser is an Eastern European, reports Reuters. Given the cash involved, the new owner is also very likely a FORBES billionaire. (In 2011, Ukraine’s richest man, billionaire Rinat Ahkmetov, paid $221 million for a penthouse in the same development. At the time, that was the most expensive apartment sale ever.)

Throughout the global economic crisis and recovery, the super-wealthy have been putting their money into the comparative safe haven of real estate. “After years on the outskirts of asset allocation, property is starting to move into the prime investment arena traditionally occupied by stocks and bonds,” says the Candy GPS (Global Prime Sector) Report, produced by Deutsche Asset & Wealth Management with research from Savills. As demand for real estate pushes property values up the world over, the price tags of homes already owned by the super rich also increase. Last year when we combed through property records to identify some of the most expensive homes owned by members of the FORBES Billionaires List, many estates fell well below the $100 million mark. This year, when we repeated the same exercise, only six of the top 20 most expensive homes owned by billionaires were priced less than $100 million–and several are valued at more than twice that figure.

The title of the most outrageously expensive property in the world still belongs to Mukesh Ambani’s Antilia in Mumbai, India. The 27-story, 400,000-square-foot skyscraper home–which is named after a mythical island in the Atlantic–includes six stories of underground parking, three helicopter pads, and reportedly requires a staff of 600 to keep it running. Construction costs for Antilia have been reported at a range of $1 billion to $2 billion. To put that into perspective, 7 World Trade Center, the 52-story tower that stands just north of Ground Zero in Manhattan with 1.7 million square feet of office space, cost a reported $2 billion to build.

In second place is Lily Safra’s Villa Leopolda, in Villefranche-sur-mer, France. The estate is reportedly one of several waterside homes that King Leopold II of Belgium built for his many mistresses. Set on 20 acres, the massive home was valued at 500 million euros ($750 million at the time), when Russian billionaire Mikhail Prokhorov tried to buy it in 2008. Prokhorov eventually backed out of deal, losing his 50 million euro deposit.

The third-most expensive billionaire home–and the most expensive in the United States–has to be Fair Field, Ira Rennert’s Sagaponack, N.Y., enclave. Although Rennert built the property and it has never traded hands, the local assessor’s office peg its value at about $248.5 million in its latest (2014) tentative tax assessment. Since no Hamptons estate has ever sold for so much (Rosenstein’s recent $147 million buy set both the Hamptons and U.S. record), it’s hard to know if the home would really ever fetch such a sum. In the meantime, the property taxes on Rennert’s 29-bedroom, 39-bath estate have got to be monstrous. (Larry Ellison’s 23-acre Japanese-style estate in Woodside, Calif. enjoys the opposite situation: the home reportedly cost $200 million to build, but was assessed at just over $73.2 million in 2013. Nice property tax break.)

As 2014 continues, the list of outrageously-priced homes owned by billionaires is stacking up. Although the market cooled off a bit in in 2013, with no properties trading hands above the $100 million mark (2011 and 2012 both saw $100 million transactions), 2014 has kicked off with a bang. London set a new record, and three homes have sold for more than $100 million so far this year in the U.S. alone.

Just weeks before Rosenstein (who is not on the FORBES Billionaires List) snapped up the East Hampton estate formerly belonging to investment manager Christopher Browne in a private deal, an unknown buyer purchased Connecticut’s Copper Beech Farm for $120 million from timber tycoon John Rudey–at the time the most expensive home sale ever in the United States. Set on 50 acres of Greenwich waterfront, the estate includes a 13,519-square-foot main house with 12 bedrooms, seven full baths and two half baths and a wood-paneled library. Also included: a solarium, a wine cellar, and a three-story-high, wood-paneled foyer. David Ogilvy, the agent who brokered the sale, tells FORBES the buyer plans to keep the home intact rather than tear it down (a common tactic among the rich). We’d bet money that individual is a billionaire.

At the end of March, the Los Angeles Times broke the news that Suzanne Saperstein had sold her expansive Holmby Hills estate, Fleur de Lys, for $102 million. That property, too, went to an unknown buyer. Although the property tax bill will be mailed to a law firm that shares an address with the Milken Institute, a Milken spokesperson told FORBES that neither Michael Milken nor his Institute are the buyer.

The latest sales continue the ongoing trend of billionaires and $100-million-plus property buys. In November 2012, Softbank billionaire Masayoshi Son, of Japan, snapped up a Woodside, Calif., estate for $117.5 million. Russian venture capitalist Yuri Milner purchasing $100 million on a property in Los Altos Hills (paying 100% more than its market value, according to tax assessors) in 2011. In 2007, billionaire fund manager Ron Baron paid $103 million for 52 undeveloped waterfront acres in New York’s East Hampton–and that was before construction costs. With properties like Dallas’ $135 million Crespi-Hicks Estate and the $90 million Carolwood Estate still on the market, more news is sure to come down the road.

1. Antilia, Mumbai, India1. Antilia, Mumbai, India

Owner: Mukesh Ambani, net worth $23.9 billion

Value: upward of $1 billion 

The twenty-seven story, 400,000-square foot skyscraper residence, named after a mythical island in the Atlantic, has six underground levels of parking, three helicopter pads, a ‘health’ level, and reportedly requires about 600 staff to run it. It is the world’s most expensive home far and away with construction costs topping $1 billion.

2. Villa Leopolda, Villefranche-sur-mer, France2. Villa Leopolda, Villefranche-sur-mer, France

Owner: Lily Safra, net worth $1.3 billion

Purchase Price: 500 million euro ($750 million at the time) in 2008

King Leopold II reportedly built a series of waterside homes for his many mistresses. This 20-acre estate was valued at 500 million euros in 2008, when Russian billionaire Mikhail Prokhorov attempted to buy it. He eventually pulled out of the deal, forfeiting a 50 million euro deposit.

3. Fair Field, Sagaponack, N.Y.3. Fair Field, Sagaponack, N.Y.

Owner: Ira Rennert, net worth $6 billion

Property value: about $248.5 million, according to 2014 tentative tax assessment

The industrial billionaire’s hulking 29-bedroom, 39-bath Hamptons compound has not one, but three swimming pools, plus its own power plant on premises.

7. Ellison Estate, Woodside, Calif.7. Ellison Estate, Woodside, Calif.

Owner: Larry Ellison, net worth $51.4 billion

Value: estimated $200 million to construct

The Oracle founder, arguably the world’s most avid collector of real estate, built his 23-acre Japanese-style estate in 2004 with 10 buildings, a man made lake, a tea house, a bath house and a koi pond. The property is was assessed at $73.2 million in 2013.

10. Xanadu 2.0, Seattle, Wash.10. Xanadu 2.0, Seattle, Wash.

Owner: Bill Gates, net worth $77.5 billion

Market Value: $120.5C million, 2014 tax assessment

The high-tech Lake Washington complex owned by the world’s second-richest man boasts a pool with an underwater music system, a 2,500- square foot gym and a library with domed reading room.

11. Copper Beech Farm, Greenwich, Conn.11. Copper Beech Farm, Greenwich, Conn.

Owner: Unknown

Sale Price: $120 million in April 2014

The property, originally listed for $190 million in May 2013, dropped to $140 million in September 2013 before selling in April 2014. Copper Beech Farm boasts a 13,519-square-foot main house with 12 bedrooms, seven full baths and two half baths and a wood-paneled library. Additional selling points: a solarium, a wine cellar, and a three-story-high, wood-paneled foyer. It was previously owned by timber tycoon John Rudey.

12. Mountain Home Road, Woodside, Calif.

12. Mountain Home Road, Woodside, Calif.

Owner: Masayoshi Son, net worth $17.3 billion

Purchase Price: $117.5 million in 2012

The most expensive home sale on record includes a 9,000-square foot neoclassical house, a 1,117-square foot colonnaded pool house, a detached library, a “retreat” building, a swimming pool, a tennis court and formal gardens.

13. Further Lane de Menil, East Hampton, N.Y.13. Further Lane de Menil, East Hampton, N.Y.

Owner: Ron Baron, net worth $1.9 billion 

Purchase Price: $103 million in 2007

The investment guru snapped up more than 50 acres of undeveloped oceanfront Hamptons land during the market’s height with the intention of constructing his own home.

14. Fleur de Lys, Holmby Hills, Calif.14. Fleur de Lys, Holmby Hills, Calif.

Owner: Unknown

Purchase Price: $102 million in March 2014

The 50,000-square-foot estate known as Fleur de Lys is the most expensive home ever sold in Los Angeles County. Suzanne Saperstein, ex-wife of Metro Networks founder David Saperstein, is the seller but the buyer remains unknown. However, tax bills for the property are mailed to a law firm at the same address as the Milken Institute.

15. Silicon Valley Mansion, Los Altos Hills, Calif.15. Silicon Valley Mansion, Los Altos Hills, Calif.

Owner: Yuri Milner, net worth $1.7 billion

Purchase Price: $100 million in 2011

Bought as a secondary home, the Facebook investor broke records with the purchase of a French chateaux-inspired limestone abode that touts indoor and outdoor pools, a ballroom and second-floor living areas that gaze out on San Francisco Bay.

16. Maison de L'Amitie, Palm Beach, Fla.16. Maison de L’Amitie, Palm Beach, Fla.

Owner: Dmitry Rybolovlev, net worth $8.8 billion

Purchase Price: $95 million in 2008

Originally listed for $125 million, the sprawling oceanfront 60,000-square foot compound, bought from real estate billionaire Donald Trump, includes diamond and gold fixtures and a garage with space for nearly 50 cars.

17. Promised Land, Montecito, Calif.17. Promised Land, Montecito, Calif.

Owner: Oprah Winfrey, net worth $2.9 billion

Market Value: $90.3 million, according to 2014 tax assessment

Purchased in 2001 for nearly $52 million, the media queen’s 23,000-square-foot Georgian-style manse sits on more than 40 acres, boasting a tea house, more than 600 rose bushes and an upscale outhouse.

Click here for the entire top 20 list for 2014

Oil Markets: Sentiment And Lame Thinking Are Currently In The Driver’s Seat

Summary

  • The oil markets have hit multi-year lows on unsubstantiated theories about a supply glut and fears of cooling demand.
  • Meanwhile, the geopolitical risks around the world have oddly disappeared in H2 2015.
  • Nevertheless, the facts prove that the real thing is way too far from evaporating geopolitical risks or a material deterioration of the global supply-demand fundamentals that can justify a slump.
  • The unprecedented downward pressure on oil prices is a headline-driven and sentiment-driven event.
  • The oil price will definitely rise significantly in 2015.

Introduction

The stock market will always give the investors a chance to make a blunder, especially for those who allow emotions to overrule facts and factual thinking. The emotional blunders are part of the game in the stock market. And if you run your portfolio based on lame-thinking and emotion, you will most likely follow the herd mentality and sell at the wrong time, because lame-thinking and emotion will always cloud your judgment.

Things get worse for your portfolio when you allow the analysts and the opinion makers who show up daily on CNBC and Bloomberg, to tell you what is really going on with a sector. To me, many of these guys are not just incompetent. To me, they are dangerous because their advice can ruin your wealth in a record time. It is easy to throw out statements without backing them up with any math, and it is easy to make overly simplistic interpretations of the global supply/demand dynamics. “So easy even a caveman can do it,” as GEICO’s commercial states.

And as clearly illustrated by the following charts, insanity and panic are currently hovering over the oil markets, due to the fact that many incompetent oil prognosticators have flooded the media with their lame opinions over the last months. For instance, the charts for the bullish ETFs (NYSEARCA:USO), (NYSEARCA:DBO) and (NYSEARCA:OIL) that track WTI are below:

(click to enlarge)

and below:

(click to enlarge)

and below:

(click to enlarge)

This is the chart for the bullish ETF (NYSEARCA:BNO) that tracks Brent:

(click to enlarge)

And the charts for the leveraged bullish ETFs (NYSEARCA:UCO) and (NYSEARCA:UWTI) are below:

(click to enlarge)

and below:

(click to enlarge)

All these bullish ETFs have returned back to their 2010 levels amid irrational fears for oversupply. But, these fears are completely unsubstantiated and they do not justify at all the sentiment-driven slump in the oil price over the last 4 months.

Andre Kostolany and The Oil Price

Obviously, all these sellers ignore Andre Kostolany who has said that:

“Imagine a man walking, one step at a time, on a country lane for a mile or so. He is accompanied by his dog, which follows the man like a dog follows his master: one step forward, one step backward. While the man is walking slowly, his dog is jumping around back and forth. There will be times when the man is ahead; he will wait for the dog and then there will be times when the dog is ahead and the dog will wait. In this example, the man represents the economy, and the dog the stock market.”

And for those who do not know Andre Kostolany, Kostolany is a stock market legend. Kostolany’s great quote describes what is going on with the oil price these days. The dog (oil price) currently is behind the man (oil supply/demand dynamics) and will catch him sooner rather than later.

In other words, I am a strong believer that Brent is not going to stay below $75/barrel for long, and the dubious Thomas are welcome to read the facts that will propel Brent higher than its current levels by early 2015.

What They Were Telling You In 2013 And H1 2014

Back in 2013 and H1 2014, when Brent was trading around $110/bbl, the analysts and several other opinion makers were calling for oil to hit $150 per barrel. Let’s see some more details and the reasons behind these calls:

1) In H1 2013, the U.S. Department of Energy reported that China overtook the U.S. as the world’s largest net oil importer. That was the time when a report from the Paris-based OECD (Organization for Economic Co-Operation and Development) came out and noted:

“Based on plausible demand and supply equations, there is a risk that prices could go up to anywhere between $150 and $270 per barrel in real terms by 2020, depending on the responsiveness of oil demand and supply and on the size of the temporary risk premium embedded in current prices due to fears about future supply shortages.”

OECD also noted in that report:

“There is a strong price increase needed despite this new oil production coming on stream.”

2) In H1 2013, Energy Aspects, an energy research consultancy, noted as linked above “All estimates point to Asian demand propelling growth.” It also said that the implications of the U.S. shale-oil boom could be overstated for the rest of the world if demand from Asia keeps up.

3) In H1 2013, some analysts from Goldman Sachs wrote that Brent crude oil prices could rise to $150 per barrel in H2 2013 because:

“Despite the boom in U.S. shale gas, the oil price remains high, which he attributed primarily to sanction-related supply disruptions in Iran. Trying to compensate for this, Saudi Arabia has already increased its oil production to a 30-year high this year.”

Mr. Currie added that:

“While global oil demand has increased at a slower pace, it is still higher than the production increases in non-OPEC countries. Upside risks for oil prices include low inventory levels, limited OPEC spare capacity, and geopolitical risks which are likely near an all-time high with production in a very large number of countries at risk, including Egypt, Iran, Iraq, Libya, Nigeria, Sudan, Syria and Venezuela. Europe still faces economic and policy headwinds, China just experienced a significant food inflation surprise (and the livestock impacts from last year’s agriculture price spike will only be felt this year) and the US still faces risks from the debt ceiling debate, the automatic spending cuts (or “sequestration”) and impending tax increases.”

4) In H2 2013, when Brent was still around $115/bbl, the French bank Societe Generale said:

“Brent crude is likely to rise towards $125 a barrel if the West launches airstrikes against Syria, and could go even higher if the conflict spills over into the rest of the Middle East.”

5) As linked above, another report from JBC Energy in Vienna said in H2 2013:

“Current developments such as low spare capacity in Saudi Arabia, stockpiles falling in the U.S., disappointing supply developments around the world and signs of an improving global economy are pointing to tighter markets.”

6) In late 2013, the analysts at the National Bank of Abu Dhabi in UAE noted:

“Average oil price was $112 per barrel in 2012. The average price of crude oil is forecast at $105 per barrel in 2013, $101 per barrel in 2014 and $100 per barrel in 2015. The base case is for oil prices to soften mildly, but remain close to $100 per barrel through 2018. Thereafter, prices rise by a few dollars each year in this scenario.”

7) Even a few months ago in June 2014, the analysts were telling you:

A) This is from Nordea Bank (OTCPK:NRBAY):

“If Iraq, accounting for 3.7% of the world’s total oil production, suffers a serious disruption to its oil supplies, we will see a sharp upswing in oil prices as the OPEC effective spare capacity buffer is low, making the global oil market highly sensitive to further supply disturbances. If Iraqi oil production would fall back to the low levels seen during the invasion of Iraq in 2003, oil prices could easily rise by up to $30 a barrel as this would push the global spare capacity back to the lows when oil prices reached $150 a barrel in July 2008. High oil prices would put the world economic recovery at risk.”

B) This is from PVM Oil Associates:

“The deteriorating situation in Iraq could be the source of an oil price and therefore a financial shock should be sending economic-growth forecasters back to the drawing board. There can be no doubt that if Iraq’s southern oil operations are impacted Brent could reach $125 a barrel and beyond. Saudi Arabia may have 2 million barrels a day of capacity it can turn on reasonably quickly but that leaves no spare capacity margin.”

C) This is from Commerzbank (OTCPK:CRZBY):

“It is hard to imagine that the oil production in northern Iraq will return to the market in the foreseeable future. So far, oil production in the south of Iraq, which accounts for 90% of Iraq’s oil exports, has been unaffected by the fighting in the north and center of the country. However, the sharp price rise in the last two days shows that this oil supply is no longer viewed as secure, either. Without the oil production from the south of Iraq, the market would be stripped of an estimated 2.5 million barrels per day.”

D) This is from the research consultancy Energy Aspects:

“Look at any forecast, they are calling for Iraqi production to be around 7-8 million barrels a day by 2018/2020 for oil prices to not rise substantially. And I think that’s the key, because that’s not going to happen. If this is contained within Iraq that’s one thing, but there’s a very different implication if it becomes a bigger regional conflict. That’s the biggest problem. Iraq’s at the heart of this big oil-producing region.”

What They Are Telling You In H2 2014

Let’s see now what the analysts and several other oil experts have been telling you lately:

1) In October 2014, Goldman Sachs slashed its 2015 oil price forecast. Goldman sees Q1 2015 WTI crude at $75/bbl versus $90/bbl previously and Q1 2015 Brent at $85/bbl versus $100/bbl previously. The U.S. investment bank said rising production will outstrip demand, joining other oil analysts who predict consumption will be dented by slower global economic growth and lead to a supply glut.

2) Other analysts who joined the bearish party lately, predict that the bear market in crude will continue with prices falling as low as $50 a barrel, in part because the global economy is slowing, pushing supply levels higher.

3) In late October 2014, fellow newsletter editor Dennis Gartman showed up and implied that oil could go to $40-$50 per barrel because among others, Lockheed Martin (NYSE:LMT) was working on a compact fusion reactor that could be ready within 10 years. He said:

“Fusion is going to be the great nuclear power of the next 150 years. And finally, we are driving less and less. We are using so much less gasoline than we ever have, in global terms, in national terms, in per capital terms. All of those things, I think, are going to be weighing heavily on crude oil. And where could it go? A lot lower, a lot lower.”

So within ten years from now, we will fit a nuclear fusion reactor on the back of our cars dumping our gas tanks. Let Star Trek come to life! Obviously, Gartman’s thesis also implies that Star Trek’s high-tech, innovative and game-changing tools will be on clearance, so all the people from China and India to Africa and America will not afford to overlook this irrationally cheap nuclear fusion reactor. I don’t even understand why an investor can take Gartman’s approach on oil seriously.

4) The technical traders also showed up a few weeks ago calling for $40/bbl, based on the following chart:

(click to enlarge)

2013/H1 2014 vs. H2 2014: No Major Fundamental Change While Geopolitical Risks Deteriorate

According to Forbes, these are the world’s biggest oil consumers today:

1) United States.

2) China.

3) Japan.

4) India.

5) Euro area.

As also shown in the previous paragraph, the calls in 2013 and H1 2014 for $150/bbl were based on the geopolitical tensions in the Middle East and the expectations about global growth with a focus on demand from the growing Asian markets, which are high in the list with the world’s biggest oil consumers.

And the facts below prove that nothing has changed over the last six months to justify a drop of 35% in the oil price that has occurred lately. In contrast, the geopolitical risks in the Middle East have deteriorated, and the security situation both in Iraq and in Libya has worsened recently. Even International Monetary Fund [IMF] admits that the geopolitical risks have worsened since H1 2014, according to its latest report.

Also, the world’s biggest oil consumers are growing at rates that either are in line with 2013 rates or exceed expectations. There is nothing to indicate that global supply and demand imbalance has fundamentally changed in the past six months. There is just too much speculation, emotion, panic and short-term lame thinking that have been used to determine the value of the oil price lately, and this slump in oil prices is clearly a result of sentiment and emotion.

Let’s proceed now with the facts:

1) Geopolitical risks deteriorate primarily due to ISIS, Iran and Libya: The extremist Islamic State of Iraq and Syria (ISIS) is still there, and the U.S. military and its allies hit ISIS forces with 15 air strikes in Iraq and Syria during a three-day period, The U.S. Central Command revealed a couple of days ago. Thirteen attacks were carried out in Iraq since last Wednesday and two more targeted Islamic State in Syria.

Meanwhile, ISIS keeps advancing in Iraq and Syria, after seizing Iraq’s second largest city Mosul on June 10th. The attacks have been escalating since 2013 and H1 2014, while American, British and Syrian soldiers were beheaded in October 2014 and November 2014, which is confirmed by Obama Administration. Apparently, there is no improvement compared to the situation in 2013 or H1 2014.

Furthermore, world powers failed to reach a nuclear agreement with Iran last week and extended talks for seven months. This means that the Western economic sanctions are not going to be lifted anytime soon, freezing the ability of Iranian banks to conduct international transactions while Iran’s daily oil export restrictions will remain too. This also means that Iran will continue working on its nuclear program by the summer of 2015, impacting negatively the destabilization risk in the region. And there is obviously no improvement compared to the situation in 2013 or H1 2014.

Also, there is no risk improvement in Libya compared to the situation in 2013 or H1 2014. In late August 2014, Libya’s ambassador to the United Nations warned of “full-blown civil war,” if the chaos and division in the North African country continue.

Libya currently has two competing parliaments and governments. The first government and elected House of Representatives relocated to Tobruk a few months ago after an armed group from the western city of Misrata seized the capital Tripoli and most government institutions, as well as the eastern city of Benghazi. The rival previous parliament remains in Tripoli and is backed by militias.

And just a couple of weeks ago, Libya’s political strife intensified as the rival government that has seized the capital took control of Libya’s largest oilfield (El Sharara), according to Reuters. Libya’s oil production rose above 900,000 bopd in September 2014, sharply above lows of 100,000 bopd in June 2014, but it has already fallen to around 500,000 bopd at most, as a recovery in Libya has faltered so far, according to Reuters. This translates into a material drop of approximately 400,000 bopd from Libya only.

2) GDP Growth Rates: Let’s take a look now at the GDP growth rates of the world’s biggest oil consumers:

A) United States: According to the latest news of September 2014, the U.S. economy grew 4.6% in Q2 2014, exceeding earlier estimates. And according to the latest news of November 2014, the U.S. economy grew 3.9% in Q3 2014, exceeding once again the consensus estimate of 3.3%, as illustrated below:

(click to enlarge)

B) China: China grew 7.6% in 2013 and grows 7.4% (on average) to date, as shown below:

(click to enlarge)

Also, China’s GDP per capita continues growing in 2014 at the same pace it has been growing over the last couple of years, as illustrated below:

(click to enlarge)

On top of that, the Chinese central bank initiated an easing cycle just a few weeks ago. How can a serious investor ignore this initiative that will have material effects on China’s future growth and China’s oil consumption of course?

C) Japan: The Japanese economy grew in Q1 2014 and contracted in Q2 and Q3 2014, as illustrated below:

(click to enlarge)

But on average, Japan grew 1.52% in 2013 and grew 0.89% in 2014 too, based on the three quarterly GDP figures to date.

Additionally, Japan’s GDP per capita continues growing in 2014 compared to 2013, as illustrated below:

(click to enlarge)

D) India: As shown below, the Indian economy grew 4.5% in 2013:

(click to enlarge)

That was the time when the analysts were saying that these GDP numbers were below their expectations. Please see some analysts’ and officials’ statements about India’s GDP growth from late 2013:

i) “There is no light at the end of the tunnel visible in India’s GDP release.”

ii) “It was slightly below expectations but I feel the overall growth rate of 4.9% would be achieved this year (2014)” said C. Rangarajan, Chairman of the Prime Minister’s Economic Advisory Council.

iii) “These numbers clearly show that attaining a growth rate of 4.9% in 2014 is not possible.”

That was also the time when Brent was around $110/bbl and all the oil prognosticators were projecting $150/bbl, as shown in the previous paragraph.

However, the Indian economy picked up steam and rebounded to a 5.7% rate in Q2 2014 from 4.6% in Q1 2014, led by a sharp recovery in industrial growth and gradual improvement in services.

And under the Modi government and thanks to a series of fundamental economic reforms, the Indian economy continued its growth and grew 5.3% in Q3 2014, as illustrated below:

(click to enlarge)

Needless to mention that these GDP rates in Q2 2014 and Q3 2014 were well above the analysts’ expectations.

Additionally, India’s GDP per capita continues rising in 2014 compared to 2013, as illustrated below:

(click to enlarge)

And according to yesterday’s news from Reuters, Indian factory activity expanded at its fastest pace in nearly two years in November 2014. The HSBC Manufacturing Purchasing Managers’ Index (PMI) rose to 53.3 in November 2014 from 51.6 in October 2014, its highest since February 2013, and the thirteenth consecutive month of expansion in activity. The analysts had expected manufacturing activity to lose some steam and predicted the index would fall to 51.2.

On top of that, India overtook Japan as the world’s third-biggest crude oil importer in 2013 and the U.S. Energy Information Administration [EIA] projects that India will become the world’s largest oil importer by 2020.

E) Europe: Europe continues growing in 2014 albeit in a slow rate, as illustrated below:

(click to enlarge)

But the current slow growth in Europe was there in 2013 too. In fact, Europe has been limping forward for years and this is nothing new, as clearly illustrated at the previous chart.

The Half-Truths And The Peak Oil

Given the fact that neither the geopolitical risks have declined since H1 2014 nor the average GDP growth rates in the world’s biggest oil consumers have dropped compared to 2013, the oil bears had to discover something else to strengthen their lame approach to oil and the supposedly supply glut.

Therefore, it does not surprise me the fact that I have seen the chart below more than 20 times in numerous online articles over the last weeks, given also that there are always willing authors who behave like parrots repeating what they hear:

The thing is that this chart itself tells you half-truths for the following three reasons that you will not find all together in any of the recent bearish articles about oil:

1) This chart above compares apple to oranges. It compares Saudi’s conventional production with U.S. oil production which is primarily a result of drilling unconventional shale wells that peter out quickly. The gap between the extraction cost in Saudi Arabia and the U.S. is approximately $60/bbl. Extracting oil from shale costs $60 to $100 a barrel, compared with $25 a barrel on average for conventional supplies from the Middle East, according to the International Energy Agency [IEA].

In other words, new oil is not cheap and the rising oil production in the U.S. over the last couple of years has been conditional upon the high oil price. Most of the wave of the U.S. production is currently unprofitable and the current low oil price discourages new drilling.

2) The U.S. shale players are on a steep rate treadmill because of the high decline rates of the unconventional wells, and an investor must be in denial to not see it.

3) The sweet spots and the spots with high productivity in the main oil basins in the U.S. (Williston, EF, Permian) cover a finite amount of land and eventually the number of the wells at the sweet spots is not infinite. The shale producers say that they have reserves [RLI] for approximately 10 years but this does not mean that their drilling locations are sweet spots.

The shale producers have already drilled in many of the best areas, or sweet spots. Once those areas have been drilled out completely, operators will have to move to more-marginal locations and well productivity will fall precipitously. Meanwhile, the advances in technology cannot make wonders to boost the recovery rates overnight.

As such, it is imperative to keep in mind that the peak oil in the U.S. is not a myth. At the current oil price, the supply of the unconventional oil production in the U.S. will quickly prove self-correcting. Both the oil production and the crude inventories in the U.S. will stall soon and will go into a permanent decline effective H1 2015 as a result of the ongoing reduction in drilling activity, the high depletion rates of the unconventional wells and the finite number of the sweet spots.

In fact, the rapid decline has already started. First, the Energy Information Administration said yesterday U.S. crude-oil supplies declined 3.7 million barrels on the week ended Nov. 28. Analysts surveyed by Platts had expected crude inventories to increase by 380,000 barrels on the week.

According also to today’s news from Seeking Alpha, new permits, which outline what drilling rigs will be doing 60-90 days in the future, showed heavy declines for the first time this year across the top three U.S. onshore fields: the Permian Basin, Eagle Ford and Bakken shale. Specifically, there is an almost 40% decline in new well permits issued across the U.S. in November 2014, with only 4,520 new well permits approved last month, down from 7,227 in October 2014.

These numbers indicate a sizable dent in U.S. production in the not too distant future. Most of that dent will come from the highly leverage players holding lower quality land.

The Oil Sector In 2015 And The Real Estate Analog

The ETFs (NYSEARCA:IYR) and (NYSEARCA:VNQ) measure the performance of the real estate sector of the U.S. equity market and include large-, mid- or small-capitalization companies known as real estate investment trusts (“REITs”). Their charts over the last couple of years are illustrated below:

(click to enlarge)

and below:

(click to enlarge)

All the investors know the fundamental problems behind the slump of the real estate sector in the U.S. a few years ago. Given that no fundamental improvement can take place overnight, it took the real estate sector in the U.S. a few years to recover from its lows in 2009.

I am sure now that many readers wonder why I talk about the real estate sector in an oil-related article. What is the relation between the real estate sector and the oil markets?

I mention this example because I strongly believe that the oil price will recover like the real estate sector has recovered from its bottom over the last three years. But, there is also a big difference here. The recovery of the oil price will be much quicker than the recovery of the real estate sector, given that this slump of the oil price has been driven by lame thinking, arbitrary speculation and sentiment, while having nothing to do with evaporating geopolitical risks around the world or a material deterioration of the global supply-demand fundamentals.

On top of that, there are some additional geopolitical clouds on the horizon that can make oil jump by H1 2015. For instance, the current low oil price has brought many OPEC members to their knees, while the holders of those countries’ sovereign debt are toast as long as oil stays at the current levels. Iran, Iraq, Libya, Algeria and Venezuela are not prepared to withstand low oil prices for long and they are now in serious danger of political upheaval at current prices. According to yesterday’s news from CNBC, the first signs of an escalating social unrest in Venezuela are already there, and things will definitely get worse over the next weeks.

Furthermore, Russia and Saudi Arabia will be anxiously watching the rapid depletion of their sovereign wealth funds, which will make the political situation in these two countries dicey over the next months.

In other words, I obviously agree with Andrew John Hall, who is known as the God of Crude Oil Trading. Although many investors and readers do not know this oil legend, Hall is secure in his view that the price of oil is destined to rise sooner rather than later, mocking those who are convinced that a U.S. shale boom will mean long-term cheap, abundant energy.

My Takeaway

Fellow investors, please educate yourselves for your own benefit. Everyone talks about buying low and selling high, but he often does the opposite. The typical investor often buys high because he feels good. And he sells low because of panic and lame thinking.

Therefore, this is the essence of my investment thesis. This oil price fall is a sentiment-driven slump. This is short term and sentiment-driven noise in the big picture story. Right now, oil has come to the point where it is unloved, which is exactly when you have to expose yourself to the sector. This oil downturn cannot last long and oil will bounce back by early 2015.

On the supply side, there are not any “elephant” conventional discoveries over the last years, and this is why the conventional oil production from the U.S., the North Sea, Mexico, North Africa and the Middle East has been falling over the last years. Cheap and easy oil is gone forever, and the global marginal barrel currently is in the $80 to $90 range.

Due to the current low oil price, oil supplies will become critically tight by early 2015, largely because production leader Saudi Arabia is not able to pump as much extra oil as many people believe. In fact, Saudi oil production has peaked at approximately 10 million bopd over the last years, as illustrated below:

On the demand side, the investors must not ignore that world population keep growing at a satisfactory rate in an energy intensive world, as witnessed by the GDP growth rates and the GDP per capita for the world’s biggest oil consumers mentioned above. As a result, global oil demand continues growing unabated at average of 1 million barrels per year.

Meanwhile, the geopolitical tensions are escalating and the crude oil price is best proxy for geopolitical risk.

After all, how can the investors weather this temporary storm and benefit from this oil price shock? Well, big fortunes will be made to those with the patience and foresight to pick right and hold tight. Just pick quality oil stocks with low key metrics (i.e. EV/EBITDA, EV/Production, EV/Reserves), sit tight, and you are going to do very well given that the strong players will remain and the weak ones will vanish.

For instance, stay far from the heavily indebted companies with a high Net Debt to EBITDA ratio, because many highly leveraged U.S. shale producers will go broke over the next couple of years. The rising tide will not lift all boats. Even if WTI jumps at $85/bbl tomorrow, several U.S. shale oil producers will not avoid bankruptcy while others will be sold for pennies on the dollar. Beggars cannot be choosers.

And now you know why I sent out last Thursday a Market Update to the subscribers of “Nathan’s Bulletin,” urging them to load specific quality picks. And when Brent crests that $90 mark again, they will be glad they did.

https://i0.wp.com/static.seekingalpha.com/uploads/2009/11/11/saupload_world_20in_20oil_lr_shutterstock_4174132.jpg
Comments (149)


  • mike904

    Comments (741) | Send Message


    I would be obvious to a garden gnome that any rise in the price of Brendt crude above $115 causes a recession. This has been true ever since 2007. The US cannot afford $4 gasoline.


    The reason oil stayed as high as it did was the fact that India and China subsidized it. The fact that China passed the US in imports misses the point. China uses 36mm boe in coal every year. They manufacture 700 million tons of steel versus 40 in the US. This is due largely to $5 trillion in QE. In the process of this absurd borrowing, they have wiped out most of their neighbors.


    Earnest and Young estimates that there is 300 million tons of excess steel capacity in the world and China is STILL building new capacity. That 300 million tons is assuming China continues to use 640 million tons internally. Once countries start to protect their steel producers, China is going to collapse. Steel requires 11 BOE of energy per ton. 300 million tons is the equivalent of 10 million BOE of energy per day. If there’s a recession, you could see total energy use drop by 15-20 million BOE per day.


    Demand isn’t what people want, demand is what they can pay for. Once the wold starts defaulting on this junk corporate debt, petroleum demand is going to collapse. The last time we went through a shock like this was 1982 and 6 million BPD of demand came of the market. This one is going to be far far worse. You could easily see oil go to $50 and stay there for a decade. According to Evans-Ambrose Prichard, Jim Chanos and Kyle Bass, China is going to collapse.

    4 Dec, 07:50 AMReplyLike7
     
  • Global Investor

    Comments (309) | Send Message


    Excellent write up, as usual! Your excerpt below says it all:


    ” The recovery of the oil price will be much quicker than the recovery of the real estate sector, given that this slump of the oil price has been driven by lame thinking, arbitrary speculation and sentiment, while having nothing to do with evaporating geopolitical risks around the world or a material deterioration of the global supply-demand fundamentals”.


    and this one:


    ” In fact, the rapid decline has already started. First, the Energy Information Administration said yesterday U.S. crude-oil supplies declined 3.7 million barrels on the week ended Nov. 28. Analysts surveyed by Platts had expected crude inventories to increase by 380,000 barrels on the week.


    According also to today’s news from Seeking Alpha, new permits, which outline what drilling rigs will be doing 60-90 days in the future, showed heavy declines for the first time this year across the top three U.S. onshore fields: the Permian Basin, Eagle Ford and Bakken shale. Specifically, there is an almost 40% decline in new well permits issued across the U.S. in November 2014, with only 4,520 new well permits approved last month, down from 7,227 in October 2014. “


    I did not actually expect such big declines so soon. Both declines really surprised me. How long can an investor remain in denial?

    4 Dec, 10:54 AMReplyLike9
     
  • Doug Dallam

    , contributor
    Comments (8116) | Send Message


    mike


    “China is going to collapse.”


    People have been saying that for around, well, forever.

    4 Dec, 11:27 AMReplyLike17
     
  • IncomeYield

    Comments (1847) | Send Message


    The opposite could happen.


    How many people world-wide have been sitting on the proverbial sidelines at $100+ oil? Waiting to start or expand a biz. Waiting to buy a car?


    All of a sudden, poof, 40% off on the COGS!
    Possibly a big demand shock coming.

    4 Dec, 12:34 PMReplyLike5
     
  • bettheranch

    Comments (19) | Send Message


    “How many people world-wide have been sitting on the proverbial sidelines at $100+ oil? Waiting to start or expand a biz. Waiting to buy a car?”


    Answer: None.

    4 Dec, 12:42 PMReplyLike5
     
  • IncomeYield

    Comments (1847) | Send Message


    Exactly, “None”, or did you mean “Zero”?

    4 Dec, 12:55 PMReplyLike0
     
  • Josh Young

    , contributor
    Comments (704) | Send Message


    Great article. I like that you incorporated the drilling permit drop, seen here: http://seekingalpha.co…

    4 Dec, 02:41 PMReplyLike1
     
  • bettheranch

    Comments (19) | Send Message


    Zero. Zip. Nada.


    Most people (Americans) can’t even tell you who Ben Franklin was, much less tell you the price of oil.


    They can’t even remember how much their last tattoo cost them, or their boyfriend.

    4 Dec, 06:08 PMReplyLike12
     
  • trader57

    Comments (253) | Send Message


    GI, if those numbers for well permits are not seasonally adjusted, then it’s possible that a big part of that drop is caused by seasonal factors related to weather. It could be that many drillers do not start new wells after November in places like the Bakken play and the DJ Basin, and thus the latest month that they get permits could be October. So those permit number have to be seasonally adjusted to be meaningful.


    Nonetheless, I don’t buy some of the talk I’m reading on the internet that “the US shale drillers will keep right on going with oil at $65”. That idea is just totally ridiculous. The operating cash flow generated by US shale producers will decline dramatically if oil stays below $80 and they won’t be able to raise nearly as much capital because of lower stock prices and substantially higher yields required to sell bonds. So US shale drillers will be forced to cut back on drilling activity because of a simple lack of capital and cash flow to pay for horizontal drilling, which is expensive. This big drop in drilling activity, which will happen for sure if oil stays below $80, should cause US oil production growth to drop sharply in the first half of next year and that drop will probably cause the oil market to correct back up into the 80s by the second half of next year.


    I’ve been surprised that the Saudis have been willing to let oil prices fall all the way below $70. I’m starting to wonder if anyone really knows what oil price they need to balance their national budget. Same thing with the Russians–it’s difficult to get good credible information from the Middle East, South America, and Russia about national budgets and other subjects like what kind of oil production technology they’re using today and what their marginal cost of production is today. Do Wall Street analysts and those sleepy international agencies in Europe really know what’s going on in the Middle East and Russia? I’m starting to wonder.

    4 Dec, 08:41 PMReplyLike5
     
  • jj1937

    Comments (1455) | Send Message


    Dow 18,000 by XMAS. It’ll probably happen by Monday.

    4 Dec, 10:59 PMReplyLike0
     
  • Skaterdude

    Comments (698) | Send Message


    Oil and coal are not fungible and they are not used primarily for the same purposes. BOE is nice if you’re assessing overall energy consumption, but it’s not a good way to think about consumption across all energy sources. If steel production drops, how will that affect the people driving vehicles in Beijing or other metropolitan areas? If coal producers in the US close mines, how will that affect oil prices and consumption? Not as much as you might propose just by looking at BOE. People don’t fuel cars with coal, and power companies are building NG fueled power plants because NG is cheaper and cleaner. So if coal production drops in the US, it’s not going to directly cause gasoline prices to rise. My point in these examples is not to argue whether oil or NG prices will rise or fall, but simply to illustrate the lack of connection between markets and demand.

    4 Dec, 11:44 PMReplyLike4
     
  • Value Digger

    , contributor
    Comments (3663) | Send Message


    Author’s reply » Global Investor,


    Thank you for your compliments. The huge divergence between the reality and the market perception is more than apparent in the oil markets now.


    The geopolitical risks have worsened compared to 2013 and H1 2014, the GDP growth rates in 2014 are at or above expectations in the world’s largest oil consumers compared to 2013, while the crude inventories and the new permits have already started to drop rapidly. We talk for a 40% decline here.


    To me, this is the definition of: THEATER OF THE ABSURD.


    Let’s see how long this THEATER OF THE ABSURD will go on.


    Regards,
    VD

    5 Dec, 06:08 AMReplyLike4
     
  • Value Digger

    , contributor
    Comments (3663) | Send Message


    Author’s reply » Josh,


    Thank you for your compliments. As mentioned above, what is going on now in the oil markets is the definition of the: THEATER OF THE ABSURD.


    Let’s see how long the oil bears will keep behaving in this irrational manner trying to make money at the bottom although the facts are not there.


    Regards,
    VD

    5 Dec, 06:12 AMReplyLike3
     
  • TraderFool

    Comments (504) | Send Message


    Hello trader57,


    Re: “I don’t buy some of the talk I’m reading on the internet that “the US shale drillers will keep right on going with oil at $65″. That idea is just totally ridiculous. The operating cash flow generated by US shale producers will decline dramatically if oil stays below $80 and they won’t be able to raise nearly as much capital because of lower stock prices and substantially higher yields required to sell bonds”


    If oil price keeps going down, and I’m a shale driller with sunk cost already, wouldn’t I want to try to keep pumping MUCH, MUCH more first to try to keep my fixed costs even lower, to try my best to survive, before the inevitable happens? In other words, I think we might just be seeing the beginning of the price fall … sure, 6-12 months down the road, we’ll see some real bust happening (not all producers have enough liquidity to last 6-12 months), but the time from today to the next 3-6 months could be really painful for longs … before they cut production, I think, they’ll try to produce a heck of a lot more to try to survive, before the financial constraints starts to work – remember, financials have many avenues, some will still pump more, borrow from banks to suvive, etc. i.e. we could be looking at 6-12 months pain before recovery, before the banks finally say enough is enough, before capital markets starts to rate the bonds as junk, etc. These process could last a long time, and until then, we might be seeing continued increased weekly production which will keep depressing crude oil prices …


    Originally, I plan to go long on crude oil stocks, but I’m now thinking of holding back my longs until I see a real bottom in prices. I like to see US production slows down for 2 to 3 weeks in a row, and right now, we are just not seeing this happening at all – US producers keep producing more oil every week, and with Saudis not cutting down, the supply of oil on a weekly basis keeps going up, and prices inevitably must come down … I have a feeling, $65 will not be the immediate bottom yet … but let’s see …

    5 Dec, 08:44 AMReplyLike6
     
  • trader57

    Comments (253) | Send Message


    It will take a few months for drilling activity to decline. The OPEC meeting was only a week ago. Oil producers are not going to stop drilling any wells that they’ve already started, and I would think they have some contracts for a few months that can only be canceled in extreme dire situations. By March 2015 we should start seeing a substantial decline in oil rig counts. Production growth will then start declining quickly and US production could even start dropping by mid-summer.

    5 Dec, 11:32 AMReplyLike4
     
  • Holthusen

    Comments (638) | Send Message


    Very funny! Yet sadly correct, and getting worse. We are raising a generation of Electronic Gamers. They live in another world instead of the real world.

    5 Dec, 11:36 AMReplyLike4
     
  • blondguysc2001

    Comments (55) | Send Message


    Interesting article…lots of good data points, particularly how well you call out the “analysts” and hold them accountable for their calls. These people truly are nothing but weathervanes….at least the vast majority of them.


    I do think there is a temporary glut of supply that triggered the decline, coupled with the obligatory unwinding of long positions…crude prices may capitulate further, but they won’t stay down for long. The tricky part is staying patient and waiting for a tradeable bottom, and separating the long term winners from the ones with excess leverage and poor fundamentals. We know the hedge funds are herd animals so expect more piling on of short positions to drive crude lower.

    4 Dec, 07:54 AMReplyLike17
     
  • Value Digger

    , contributor
    Comments (3663) | Send Message


    Author’s reply » blondguysc2001,


    I am getting sick when I see how quickly all these highly paid “gurus” change their mind depending on which way the wind blows, while ignoring the facts. And they behave like parrots repeating the words and imitating the actions of another.


    This is why, I felt the need to write this factual article that clearly demonstrates what these “gurus” were telling us in 2013 and H1 2014, and what could drive prices at $150/bbl.


    Also, separating the wheat from the chaff is something that ALL the investors must do now. They must NOT make the mistake to load the heavily indebted energy companies because it will be a “dead cat bounce”, if these companies ever bounce back.


    Regards,
    VD

    5 Dec, 06:23 AMReplyLike5
     
  • Duago

    Comments (70) | Send Message


    Value Digger,
    I greatly value your research, time and effort put into you articles.
    However, timing is everything. This piece feels desperate. I have read a lot of details on the subject of late and there were many signs of this slump in prices coming that were not accounted for by those who only see oil prices as going up.
    Prices go up and they go down. I don’t see the compelling evidence that it will suddenly go up soon.

    4 Dec, 08:11 AMReplyLike9
     
  • TraderFool

    Comments (504) | Send Message


    Duago,
    Just pull up the price charts of crude oil over the past 20 years.
    You’ll see this current price drop is the 2nd longest drop over that period.
    The only time when crude had a bigger drop was back in 2008, from a peak of $147, down to a low of $33, near the 200 month MA. Today, we are near the 200 month MA as well which is currently around $60-$65 … we can’t time it precisely, but over the next few months, I feel we are close to the current bottom, and it makes sense to pick good quality issues relating to crude oil, and slowly work your way inside. Never go on margin, this is really Value Investing at its finest, and if you are not scared, you are not doing Value Investing properly – I won’t bat an eyelid if the purchases made this week drops by 50% more at the bottom, because history has shown that they will rise much, much more. I’m looking at +100% gains over the next 1-3 years at the least …

    4 Dec, 04:13 PMReplyLike13
     
 
  • Dan Teodor

    , contributor
    Comments (110) | Send Message


    Duago,


    Demand for oil in the six segments that simply cannot stop are impervious to economic slowdown (plastics, oceangoing freight, train freight, fertilizer, aviation, modern armies). Regardless of consumer slowdowns, these six segments represent 80% of oil and net gas consumed around the world. When economies slow down, the food, freight, aviation and military segments do not, they continue on. A recession in Europe or China would only slow the rise in demand, not reverse it. Look at the demand trend of the past year and understand that even if demand only rises at one half the slope is has followed from 2004 until now, it will still outstrip current expected global production for Q1 2015. Oil price strip is highly elastic to tiny percentage changes in the supply-demand balance. Current situation is creating the coiled spring and that coiled spring WILL unwind before the end of 2015.


    We just hope it is a measured controlled unwind throughout the year, otherwise we will have the $140 spike we saw in 2008 for a month or two before settling down to something in the $90 – $100 brent range.


    Set your DCF and NAV models for $90 brent / $85 WTI. This is going to get ugly before the weather gets cold again in 2015. I’m willing to go out on a limb and say you can quote me on this one.


    Here is the reality when Brent is $70/bbl for more than one or two months…


    1. Venezuela is cash flow negative and cannot make coupon payments on its foreign debt. Venezuela WILL default on its debt before end of 2015 in this price regime.


    2. Iran cannot feed its army at this price. The mullahs depend on the support of their army to maintain power. Kicking this leg out from under the government stool makes their continued existence precarious. Martial law kind of precarious.


    3. The government in Tripoli cannot feed their guard at these prices. If the government in Tripoli cannot do this, they cannot protect the pipes that carry crude to their northern port. When that happens the other government in the west breaks through and shuts the pipe down to prevent revenue from reaching the Tripoli government and thereby trying to strangle it. 800,000 bbl/day go off stream.


    4. Saudi Arabia is burning $2b/month from their sovereign wealth fund. At that burn rate, the ENTIRE sovereign wealth fund runs dry in 60 months. They need to turn the boat around long before that happens because if they burn through more than about 25% of it, angry men with beards and automatic rifles start to hang around the palace gates. Not a stable internal situation. Riyadh has made major financial promises to its citizens in return for peace and their support. And in Saudi Arabia, the citizens do not have peaceful protest marches when they are aggrieved.


    5. Russia is burning $2.5b/month form their sovereign wealth fund. At that burn rate, the ENTIRE sovereign wealth fund runs dry in 48 months. They will tighten their belts, suffer, freeze, grit their teeth and tough it out. BUT! (and this is a big one) understand that at the back of the mind of every strategist in the Kremlin is the nagging thought that all they have to do to cause a global geopolitical crisis and force the price of energy to whipsaw back up to $100/bbl in the course of a week is to kick the hornets nest: Roll the tanks into Donetsk and Lukhansk. Overnight crisis and EU buckles because it is now winter and Germany will freeze without the Ukrainian transit gas (Nordstream can only supply about one third of what Europe needs to stay warm).


    6. I can’t even begin to fathom what the dynamics going on in Syria / Iraq are right now, but it can’t be good. I’m sure Baghdad had to guarantee Kurdistan a minimum cut in the negotiation to let them export. Well, either Baghdad or Kurdistan is not going to get that minimum cut agreed in that negotiation. How do you think things are panning out in their relations now?


    This situation has the makings of a new Arab Spring / Cold War settling in… and it cannot remain in equilibrium for a whole 12 months.

    4 Dec, 07:12 PMReplyLike23
     
  • rjj1960

    Comments (1370) | Send Message


    Value Digger,one of 3 people on SA with brains. Good job , appreciate the effort.

    4 Dec, 08:29 PMReplyLike10
     
  • Value Digger

    , contributor
    Comments (3665) | Send Message


    Author’s reply » Duago,


    Thank you for your comment. But, my article is full of facts as always. If you disagree with the facts, it is your choice.


    Regards,
    VD

    5 Dec, 06:26 AMReplyLike2
     
  • Value Digger

    , contributor
    Comments (3665) | Send Message


    Author’s reply » rjj1960,


    Thank you for your compliments. Good luck with your investments.


    Regards,
    VD

    5 Dec, 06:29 AMReplyLike1
     
  • ainjibi

    Comments (13) | Send Message


    Who are the other 2 with brain on SA ? Would appreciate the info. !

    5 Dec, 02:57 PMReplyLike2
     
  • rjj1960

    Comments (1370) | Send Message


    Filloon and Fitzsimmons.

    5 Dec, 05:50 PMReplyLike2
     
  • ainjibi

    Comments (13) | Send Message


    Thanks !

    5 Dec, 06:01 PMReplyLike0
     
  • ggig2000

    Comments (10) | Send Message


    who are the other two? ; )

    6 Dec, 10:36 AMReplyLike0
     
  • mikenh

    Comments (223) | Send Message


    The change in commodity prices, oil included, was triggered by a change in financing attitudes of some buyers. Changing Fed policy added uncertainty to a sure bet. Same thing happened on a smaller scale when Bernancke hinted that bond buying might stop someday.

    4 Dec, 08:26 AMReplyLike2
     
  • themacguy521

    Comments (26) | Send Message


    VD. Thanks and could not agree more.


    Oil Bears and Analysts are driving the oil price down with their unrealistic attitude towards:


    a) Negative growth;
    b) India’s energy appetite; and
    c) The fallacy of Nirvana in the Middle East.


    Not to mention that Pick-Ups and large SUVs are back in vogue in North America…


    I also believe that Putin will rattle his sabre and agitate conflict somewhere, to raise uncertainty and thus prices – if the drought in Oil prices remains lower much longer. After all, the fall in the price of crude in the mid 80’s (and Reagan) brought the USSR to its knees. He will not repeat that. Guaranteed.


    Waiting for a firm bottom – then backing up the truck for more PTA.

    4 Dec, 08:34 AMReplyLike9
     
  • Old Rick

    Comments (512) | Send Message


    Please let us all know when there is a firm bottom so we can all benefit from your insight.

    4 Dec, 03:34 PMReplyLike7
     
  • TraderFool

    Comments (504) | Send Message


    Old Rick,


    No one will know the absolute bottom, at the “Hard Right Edge” of the charts. Bottoms are only know once some time are passed, and by then, you won’t be able to buy at the bottom price. That’s the reality of prices. The key is Money Management – always make sure to have enough cash to buy at lower prices when bargains avails themselves. For highly cyclical stocks, a rough yardstick is 75% fall in prices from the peak for decent names. E.g. SDRL is one that I think could be interesting – peak price was $48 in 2013, and is now trading near $12, or 75% fall. I would allocate around 4% of my portfolio to this, to be split into 4 bullets, and have actually deployed first bullet at $13.50. I’ll be looking for a final buy price of around $7 (approximately 50% fall from my first entry), and these types of buys are just put into the drawer and forget. When the drawer is opened in 1-3 year’s time, you will most likely earn anywhere from 50% to 100% gains or more.


    Meanwhile, have the stomach to see the value of what you bought dropped by 50% from what you purchased. Don’t ever think about selling then, because the Reward to Risk of holding is much, much better.


    And diversify into 3 issues at the very least, so that total exposure to crude oil is no more than say 12% trading capital. I am just very cautious, but of course, at the very bottom, for the 4th buy, you could double or triple the buy size and raise the 12% up to say 15%-20% capital … but these type of substantial increase must show capitulation, i.e. big price drops with big volumes …. (SDRL has shown the first capitulation last week and this week, and usually, there’s more than 1 capitulation). And if you are a nimble trader, you would also consider adding on the way up, e.g. when Weekly RSI(14) crossed above 20 and Daily RSI(14) dropped back down to around 30-40 or so ie. dipping on the way up, if you are worried that you only have 3% capital in this during the bottom.


    PS. SDRL falls into my screen, because at $13.50, it is trading at NAV, and well below Replacement Cost. So, if it falls to $7, that would be trading at 50% NAV approximately, and is good enough for me.

    4 Dec, 04:21 PMReplyLike9
     
  • Value Digger

    , contributor
    Comments (3665) | Send Message


    Author’s reply » themacguy521,


    Thank you for your compliments. Also, good luck with PTA (Petroamerica Oil) which is debt free with a pristine balance sheet, as shown in my previous articles.


    Regards,
    VD

    5 Dec, 06:29 AMReplyLike1
     
  • Value Digger

    , contributor
    Comments (3665) | Send Message


    Author’s reply » Old Rick,


    Warren Buffett has said more than once that he has NEVER managed to buy at the bottom and sell at the top. Nevertheless, he is a billionaire.


    Regards,
    VD

    5 Dec, 06:31 AMReplyLike5
     
  • les2005

    Comments (15) | Send Message


    excellent article. While I’m hesitant to predict WHEN oil prices will go back up, it’s obvious that they will. Outside the middle east, most resources cannot be economically accessed at a price below $70, so while the market price may go below, the pendulum invariably will swing back because
    – more and more suppliers will go out of business or reduce supply
    – consumption and hence demand will rise if oil is that cheap.
    There are a lot of factors at play as you well demonstrated – geopolitical, GDP growth, but also competing energy sources (and I’m not talking nuclear fission, but renewables). But the overriding factors appear to be speculation and herd behaviour. And we all know they can only go for so long into one direction.

    4 Dec, 08:37 AMReplyLike8
     
  • Value Digger

    , contributor
    Comments (3665) | Send Message


    Author’s reply » les2005,


    Thank you for your compliments.


    Regards,
    VD

    5 Dec, 06:32 AMReplyLike0
     
  • Mark_Stphens

    Comments (13) | Send Message


    I’ve been keeping an eye on all of the airlines. Since gas prices are so low right now, almost ALL of them have had large gains the past month.

    4 Dec, 08:45 AMReplyLike2
     
  • Family Investor

    Comments (558) | Send Message


    Great article, appreciate you sharing your research.

    4 Dec, 09:01 AMReplyLike5
     
  • Value Digger

    , contributor
    Comments (3665) | Send Message


    Author’s reply » Family Investor, Thank you for your compliments. Regards, VD

    5 Dec, 06:32 AMReplyLike0
     
  • Old Mule

    Comments (25) | Send Message


    The article makes some very sound points. I must disagree with the view that the shale plays are going to “play out” in the near future. If anything, we have continually underestimated what innovation and knowledge are achieving in exploring and producing from tight formations. Lower prices will slow the growth in shale exploration and production, but the quantity of resource present in shale plays is enormous and not fully understood.

    4 Dec, 09:04 AMReplyLike5
     
 
  • bettheranch

    Comments (19) | Send Message


    Old Mule, you are correct. We have, indeed, continually underestimated what innovation and knowledge are achieving.


    Also, not all shale formations are so thin as to horizontally support only single laterals. Some, like the Wolfcamp, are very thick, and the first wells drilled are really only the first of many stacked laterals.


    Back to innovation and knowledge, that is not limited to shale plays, either. Not all of the new oil production is shale production. At least some if not much of it is from new horizontal development of non-shale assets. For example, look at the Spraberry in W TX.


    Also, the shale wells that are drilled and produced typically hold under the leases of unsophisticated lessors other zones that have not yet been tapped.


    There is more to be squeezed out of these formations than most people realize, and with advances in cost savings along the way, there still remains quite a bit of money to be made.

    4 Dec, 11:07 AMReplyLike2
     
  • Doug Dallam

    , contributor
    Comments (8116) | Send Message


    Old


    If it is “not fully understood” then you cannot say anything about future shale production. Currently, the author is correct. Until production is realized, such as current retrievable shale oil, for investment purposes, it doesn’t exist.

    4 Dec, 11:30 AMReplyLike3
     
  • bettheranch

    Comments (19) | Send Message


    To the contrary, even though it is not fully understood, we know for sure that we are not getting all out of it, and there has to be a way to get more out of it as technology and knowledge improve and as economic opportunities arise.


    What it is going to take to send men to Mars is not fully understood, either. But that does not mean that we cannot say anything about sending men to Mars at some point in the future.

    4 Dec, 11:46 AMReplyLike2
     
  • Value Digger

    , contributor
    Comments (3665) | Send Message


    Author’s reply » Old Mule,


    Thank you for your kind words.


    In terms of the shale oil and the technology, I believe that the technology cannot make wonders overnight. And more importantly, the current technology cannot get a lot better overnight, given that it took us (George Mitchell) many years to improve this shale process and bring it to the point where we are now.


    If the oil price remains at the current levels for long, the peak oil event will occur in 2015, in my view.


    Regards,
    VD

    5 Dec, 06:39 AMReplyLike1
     
  • Dr. Z.

    Comments (93) | Send Message


    Breaking News: Publisher of oil newsletter bullish on oil.

    4 Dec, 09:11 AMReplyLike11
     
  • Jion

    Comments (528) | Send Message


    An oil newsletter that contains short ideas too.

    4 Dec, 09:38 AMReplyLike9
     
  • samberpax

    Comments (115) | Send Message


    Dr. Z.:Breaking News: Publisher of oil newsletter bullish on oil.


    ———————-…


    Please let me know when the majority of oil newsletter writers turn bearish, that is when I’ll be a buyer.


    best,
    -samberpax

    4 Dec, 09:47 PMReplyLike1
     
  • Value Digger

    , contributor
    Comments (3665) | Send Message


    Author’s reply » Dr. Z.,


    You are NOT a subscriber of my newsletter that was out just 3 months ago, in September 2014, when the oil price was already falling.


    If you were a subscriber, you could check my picks and the recommended entry prices.


    And please let me know and I will gladly send you the returns from my picks in H1 2015, based on the recommended entry prices.


    Regards,
    VD

    5 Dec, 06:48 AMReplyLike1
     
  • Emmanuel Daugeras

    , contributor
    Comments (44) | Send Message


    Good article. I like the attitude to keep one’s head cool and act on facts, not emotions.
    I buy the long case for Oil, long term. But the question is that of how long it will take to come back.
    The political unrest in the middle east ist not necessarily a cause for less supplies: the ISIS for instance uses Oil to finance their war. The anarchy actually can dislocate the production discipline and lead to lower prices. But agreed with you, anarchy is not sustainable and Oil prices will eventually move up again.

    4 Dec, 09:20 AMReplyLike2
     
  • Value Digger

    , contributor
    Comments (3665) | Send Message


    Author’s reply » Emmanuel, Thank you for the kind words. The political unrest in the Middle East often leads to production disruptions, statistically speaking. And things in the Middle East are not better now than in H1 2014. In contrast, things now are much worse.


    Rgeards,
    VD

    5 Dec, 06:53 AMReplyLike1
     
  • Timothy Coates

    Comments (9) | Send Message


    Wow!! Talk about talking up your book! There are so many things wrong with this article it makes it hard to even take it seriously. I’m wondering if this is Dan Dicker writing under a different name with his whole “Barrels at risk” theory that artificially buoyed prices for the 5 years between 2009 and now.


    The author seeks to discount the additional 3.5 million barrels the US produces that were not available 5 years ago by saying the wells dry up fast and the production cost are too high. That is the true “lame thinking” here. I heard estimates that some production cost in the Bakken are as low as $29 dollars and that $70 is actually on the high end. His cost estimates are from years ago. Good ole American ingenuity drives down the cost of recovering this oil daily.


    The author doesn’t deal with the death spiral that OPEC currently finds itself in. The more profligate members need a high oil price in order to maintain their spending. If I can’t make my revenue with a high oil price what is my alternative? That’s right pump more. Their state goal at this last meeting was to keep the production quotas in place. What was unsaid and the real reason oil took another dive is cheating on production quotas will reach an all time high over the coming months as these governments seek to shore up their finances.


    Finally, the author displays several charts but proceeds to ignore what the charts say. We have firmly broken all uptrends and any recovery will be very difficult. I would further break his argument down but that would just give more credence to yesterday’s theory about the state of energy supplies in the world.

    4 Dec, 09:28 AMReplyLike13
     
  • Short&Stocky

    Comments (40) | Send Message


    Comments like this are what give me confidence that oil bulls will make money

    4 Dec, 11:33 AMReplyLike13
     
  • thkalinke

    Comments (134) | Send Message


    The OPEC death-spiral, with poorer members exceeding quotas, has been going on for at least a couple of decades, nothing new there. As far as a Bakken play that can produce for $29 and keep it there – if you find one, please share.

    4 Dec, 11:37 AMReplyLike8
     
  • Timothy Coates

    Comments (9) | Send Message


    I picked up the $29 number from a Market Watch article written by Tim Mullaney entitled “Opec is wrong to think it can outlast U.S. on oil prices”. If that number is incorrect it’s not because I made it up. I agree that cheating has been going on since OPEC’s inception but never before have the weaker members of OPEC been in such tenuous positions with their populace which I believe will spur further more pronounced cheating.

    4 Dec, 01:30 PMReplyLike2
     
  • Class VI

    Comments (3) | Send Message


    The author argues that saudi has already reached or near’d max capacity pumping…


    So whats the max production capacity for the rest of OPEC for them to keep ‘pumping more’ to make budgets meet?

    4 Dec, 01:52 PMReplyLike2
     
  • quantcoyote

    Comments (66) | Send Message


    TC: I don’t necessarily disagree with your scepticism, but apart from Saudi Arabia there is very little spare capacity in OPEC (Libya’s may be higher than the rest, but even that’s not so high and Libya is likely to have real problems for a while). So the capacity to cheat is limited, even if the will to do so may not be. I’m beginning to wonder if SA gives a toss about OPEC at all. They can’t get the other members to cut (because they will cheat), and they need not be concerned about them increasing output.

    4 Dec, 02:33 PMReplyLike1
     
  • Timothy Coates

    Comments (9) | Send Message


    quant: you could be very well right about their lack of capacity. I have read though in the last couple days about another 300k barrels coming online from a Kurdish/Iraqi government agreement as well. My point was simply that US shale drilling cost are only dropping so that isn’t supportive of higher prices and OPEC isn’t cutting or even holding to the quotas they agree on.

    4 Dec, 03:17 PMReplyLike2
     
  • Noah Research Partners

    Comments (6) | Send Message


    While you are not wrong, I have a hard time understanding why this wasn’t presented or “paraded” 6 and 12 months ago.. Surely this has not been an overnight occurrence.


    Secondly, just like in October when everybody “woke up!!” and sent the market down 10%, because NOW the world is going into recession, good call btw. I highly doubt you bears are any more correct on your reactionary projections after crude fell from $90, you must be rich predicting this stuff.


    As an aside Gartman has been one of the best contrarian indicators of the past 2 years.


    And just to put my money where it counts, not that seeking alpha isn’t awesome.I recently sold multiple strike puts on EOG, NOV, PXD, XOM, CLR. Implied volatility is ridiculously high, and if history is any indicator its a very high probability trade.

    4 Dec, 06:07 PMReplyLike2
     
  • Value Digger

    , contributor
    Comments (3665) | Send Message


    Author’s reply » Excellent said, Short&Stocky.

    5 Dec, 08:01 AMReplyLike1
     
  • Jion

    Comments (528) | Send Message


    It’s the “follow the trend” guys. Until its end….but usually they realize the end too late.

    6 Dec, 07:10 AMReplyLike0
     
 
  • Edmund Shing

    , contributor
    Comments (31) | Send Message


    Good, detailed piece, even if I am running the risk of confirmation bias (I am long oil stocks). But one thing. Nuclear fusion reactor on the back of a car – that is Back to the Future, rather than Star Trek!
    Edmund

    4 Dec, 09:29 AMReplyLike8
     
  • MAYHAWK

    Comments (528) | Send Message


    Edmund,


    Yes, that would be Dennis “Marty McFly” Gartman. To be honest, I would rather have the sports almanac than my oil stocks right now.

    4 Dec, 03:21 PMReplyLike1
     
  • Value Digger

    , contributor
    Comments (3665) | Send Message


    Author’s reply » Edmund,


    Thank you for the compliments. And when it comes to the nuclear fusion reactor, I do not disagree with you. We can definitely see it both ways.


    Regards,
    VD

    5 Dec, 06:56 AMReplyLike1
     
  • contrarianadvisor

    Comments (997) | Send Message


    A few months ago with oil above $100, I was a lonely bear calling for sub $50 oil. Now that oil has fallen $35, I have lots of company in the bear camp. Still there are lots of analysts and investors trying to call a bottom in oil prices here so i would say that sentiment is somewhat equally divided between bulls and bears here. I think we have a ways to go before oil bottoms. First, we just had a major trend break and those don’t turn around quickly. Second, most of the recent decline was in reaction to OPEc deciding not to cut output. In other words, the focus has been on supply while I think what drives oil below $40 in 2015 will be much weaker demand than is currently being assumed, fueled by a global contraction.


    Both oil and oil stocks have a lot further to fall in upcoming months. There will be a far better entry point for both later in 2015. Investors would be wise to exercise some patience here and let things play out for a while. Buying the first sharp break is rarely a good idea, particularly not when there are so many signals indicating that the global economy is losing momentum.

    4 Dec, 09:33 AMReplyLike8
     
  • blittrell

    Comments (8) | Send Message


    Ironic that an analyst writes an article encouraging investors to ignore the analysts.


    Oil prices will ultimately come back, until then focus on the myriad of economic sectors that benefit from cheaper energy. It should also present a great buying opportunity for a whole host of energy stocks.


    This piece has too much emotion embedded in it for my liking.

    4 Dec, 09:40 AMReplyLike4
     
  • Value Digger

    , contributor
    Comments (3665) | Send Message


    Author’s reply » blittrell,


    I am not a professional analyst who is living from this analysis.
    I am an investor instead.


    Regards,
    VD

    5 Dec, 06:58 AMReplyLike4
     
  • 745

    Comments (211) | Send Message


    Good article Digger. Whether people agree with your points or not, I don’t see how any investor could disagree with the first two paragraphs of the article. You nailed it spot on. One question though, would you care to share any specific names of shale producers that You feel will be extinct within a few years?

    4 Dec, 09:48 AMReplyLike8
     
  • Value Digger

    , contributor
    Comments (3665) | Send Message


    Author’s reply » 745,


    Thank you for your compliments.


    Please see my previous articles and comments to find my bearish calls on several energy stocks over the last months i.e. Halcon Resources (HK), Goodrich Petroleum (GDP), Cobalt International (CIE), GMX Resources (GMXRQ), ATP Oil and Gas (ATPGQ), CAMAC Energy (CAK), Pinecrest Energy (PRY.V), Midstates Petroleum (MPO) etc.


    Regards,
    VD

    5 Dec, 07:05 AMReplyLike1
     
  • Trade In Mexico

    , contributor
    Comments (598) | Send Message


    Absolutely brilliant title and analysis!!!!


    The title really sums up how stupid investors are being now. The current daily correlation between a 50 cent or $1 move in oil taking down oil stocks by a few percent is ridiculous. Dennis Gartman has no credibility, I don’t understand why CNBC has him on regularly.


    Thanks again for the article!

    4 Dec, 10:09 AMReplyLike6
     
  • contrarianadvisor

    Comments (997) | Send Message


    “Dennis Gartman has no credibility, I don’t understand why CNBC has him on regularly.”


    They have Jim Cramer on, so why not Dennis Gartman? They both change their minds on a daily basis and do it with conviction.

    4 Dec, 10:39 AMReplyLike7
     
  • Doug Dallam

    , contributor
    Comments (8116) | Send Message


    Cramer needs to take my friends 100 level college logic class. The first thing my friend tells his students, on the first day is, “Getting louder doesn’t make your argument better.”

    4 Dec, 11:34 AMReplyLike5
     
  • Trade In Mexico

    , contributor
    Comments (598) | Send Message


    Contrarian, That is true about Cramer but the difference is that CNBC could eject Gartman with ease, while getting rid of Cramer would mean getting new anchors and having to replace his show.


    Right now, small cap oil stocks should be bought for a year end rally, stocks like MDR, WG, etc could see huge gains from current levels.

    4 Dec, 07:00 PMReplyLike2
     
  • Value Digger

    , contributor
    Comments (3665) | Send Message


    Author’s reply » Trade In Mexico,


    Thank you for your compliments.


    Regards,
    VD

    5 Dec, 07:06 AMReplyLike0
     
  • CSilver

    Comments (16) | Send Message


    Oil prices are bound to rise again… Just wait. Everoyne is getting excited over low gas prices but we all know it’s a cycle. If we’re at the bottom, you know the peak is on the way

    4 Dec, 10:14 AMReplyLike3
     
  • moatfrog

    Comments (749) | Send Message


    Everyone seems to have an opinion on oil pricing and what will happen to stocks. Up – down talk gets to be nauseating. Some articles are short winded while others (this one) are long winded. One equals the other. Forgetting all of that, I thoroughly know is that I filled up my car yesterday smiling at my lower fuel bill. I also realize, OPEC be damned, oil prices present a buying opportunity both at the pump and with the cheaper share prices of the big producers. Observing more cars on our roads and those in China and elsewhere just adds frosting to the cake. What are you doing? Are you immersing yourselves in the noise presented by this article and others of its ilk, or are you adding some oil shares to your portfolio?

    4 Dec, 10:40 AMReplyLike1
     
  • Noah Research Partners

    Comments (6) | Send Message


    Couldn’t agree more, everyone in the world is now an oil analyst. Specifically, since oil has dropped considerably, they project more declines..what are the odds?!!


    I think investors need to pull the trigger on stocks they wanted lower instead of watching tv for a buying signal.

    4 Dec, 06:07 PMReplyLike3
     
  • Realtoi

    Comments (318) | Send Message


    Buy quality that has paid uninterrupted dividends for decades, despite what happened with oil prices. That way you’ve got whatever situation we’re in now covered. You get paid for waiting..

    4 Dec, 07:32 PMReplyLike2
     
  • Value Digger

    , contributor
    Comments (3665) | Send Message


    Author’s reply » Noah Research Partners,


    What you describe is the definition of “HERD MENTALITY” that has brought the oil price at the current ridiculously low levels.


    But Einstein has said: “Two things are infinite: the Universe and human stupidity. And I am not sure about the Universe.”


    Regards,
    VD

    5 Dec, 07:10 AMReplyLike1
     
  • irishmaninbelgium

    Comments (49) | Send Message


    I agree that the ‘glut’ in supply is a bit of a nonsense and I’ve read a few articles recently lending weight to this argument.


    However, the claim that $80-$100 is the breakeven for shale seems unfounded – I think it was the IEA that said that only 4% of production uneconomic under $70?


    I also read a very interesting article today, I think on CNBC (apologies for the lack of sources), that discussed how transportation costs have plummeted in the past years.
    It mentioned that in 2011, companies were paying up to $28 a barrel in transport costs. It is now $1-$3 because of pipeline construction.
    If that is indeed the case, it is clear that a lot of shale is economic way below $70.


    Gartman and his nuclear fusion. What a tool. I made the exact same point elsewhere that unless engines are replaced with fusion reactors and someone discovers how to make plastic from ‘fusion’ we will be using oil for some time to come…


    I think the plummeting oil prices are the result of speculation more than any other factor but, as always, the market can remain irrational for longer than most of us can remain solvent.


    GL

    4 Dec, 10:56 AMReplyLike4
     
  • Vincent1966

    Comments (329) | Send Message


    I hope he’s right…that we’re not going to see a “new normal” in oil prices, but it’s too early to tell. Don’t underestimate the impact of overhead supply in oil stocks. A whole lot of damage has been done here and if we don’t see a rapid reversal, it’s going to be a long and painful thing to watch as holders bail out on any rally attempt.

    4 Dec, 11:00 AMReplyLike3
     
 
  • meridian6

    Comments (339) | Send Message


    It’s simple. Saudi Arabia is the only low cost producer in the world, but the rest of OPEC has costs similar to the US.


    Saudi only produces 10M bbl out of 30M bbl. I predict NOCs can only withstand the pain for 6 months. after that, they can elect to exit OPEC, and form a non-Saudi cartel to sell at $80-$90 band. Saudi can sell their 10M bbl cheap if they elect to, but that’s not enough to meet global demand, so buyers will have to pay non-Saudi price.


    4 Dec, 11:01 AMReplyLike5
     
  • bettheranch

    Comments (19) | Send Message


    Value Digger I do not think that Seeking Alpha is including your articles in their daily email of “Today’s articles on Energy Investing.” Or at least I have not been seeing them there.

    4 Dec, 11:10 AMReplyLike1
     
  • Value Digger

    , contributor
    Comments (3665) | Send Message


    Author’s reply » bettheranch, I do not have any idea about it. Thank you for the heads-up.
    Regards, VD

    5 Dec, 07:11 AMReplyLike0
     
  • irishmaninbelgium

    Comments (49) | Send Message


    Also: Andrew John Hall has been dead wrong for the past few years.


    He is betting that the price of oil will increase. He is correct in this assertion. Everyone knows the price of oil is going to go up, eventually.


    ““When you believe something, facts become inconvenient obstacles,” Hall wrote in April, taking issue with an analyst who predicted a shale renaissance could result in $75-a-barrel oil over the next five years.”


    He should listen to his own advice, it seems.

    4 Dec, 11:11 AMReplyLike2
     
  • Doug Dallam

    , contributor
    Comments (8116) | Send Message


    Fusion Reactors, indeed. Right around the corner.


    Here is one article where the “5 year” buzz line comes from:
    http://bit.ly/1viOe43


    “The team acknowledges that the project is in its earliest stages, and many key challenges remain before a viable prototype can be built. However, McGuire expects swift progress. The Skunk Works mind-set and “the pace that people work at here is ridiculously fast,” he says. “We would like to get to a prototype in five generations. If we can meet our plan of doing a design-build-test generation every year, that will put us at about five years, and we’ve already shown we can do that in the lab” . . . . An initial production version could follow five years after that.”


    And then ramping up commercialization of fusion power, another decade? we’re looking at 15-20 years best case scenario before fusion has any affect on fossil fuel prices. This just goes to support the author’s conclusion that oil prices are low due to “lame thinking.”

    4 Dec, 11:49 AMReplyLike2
     
  • Vijoda

    Comments (69) | Send Message


    Growing up, my neighbor Roy had the coolest mom. She let him put up a poster in his room of an eagle swooping down on a little mouse that had a single finger extended in the air. That visual flashed in my mind as I read this.


    No chart of the relationship between the strength of the dollar and the price of oil. Is it relevant?


    Good luck with your picks.

    4 Dec, 11:57 AMReplyLike3
     
  • ant21b

    Comments (539) | Send Message


    Oil will stay low for at least a few years the world economy is contracting not expanding and the U.S will enter a recession in about 2.5 years or so tops as part of the business cycle. Look at how oil stayed low in the 80s and 90s after being high in the 70s it was not a short term phenomena.

    4 Dec, 12:02 PMReplyLike0
     
  • billcharlesdixon

    Comments (1705) | Send Message


    I agree with you; oil should rise in 2015 if not this month. I don’t see much if any downside: we all knew that opec would probably not cut production; yet when they ratified that fact, oil prices went down another 10%. The whole thing is overdone, and what went down (in this case) must go up again.

    4 Dec, 12:03 PMReplyLike1
     
  • Flash Crash Gordon

    Comments (403) | Send Message


    Lot of knives likely left to be caught in this paradigm shifting move…not saying don’t dollar average, but be wary more pain likely lies ahead.

    4 Dec, 12:29 PMReplyLike3
     
  • Ruben12345

    Comments (418) | Send Message


    It would have been helpful to foresee this decline in oil was coming but no one did. .. To now claim we know what happens next seems not credible (again)

    4 Dec, 12:39 PMReplyLike4
     
  • IncomeYield

    Comments (1847) | Send Message


    Seems that some did. Some fairly large oil related positions and assets were sold over the past year or so.

    4 Dec, 01:01 PMReplyLike0
     
  • john001

    Comments (671) | Send Message


    Value Digger….another informative article. Thanks


    To all those investors who believe operators in the unconventional reservoirs can keep producing while oil prices are dropping, check out their H1 budget forecasts for negative changes in CAPEX. That will remove much of the guess work and hand waving on how profitable they expect their operations to be. They know better than the analysts and economists on when to turn the taps off.

    4 Dec, 01:03 PMReplyLike3
     
  • Value Digger

    , contributor
    Comments (3665) | Send Message


    Author’s reply » john001, Thank you for the compliments. Regards, VD

    5 Dec, 07:14 AMReplyLike0
     
  • juscallmej

    Comments (38) | Send Message


    good article.. totally agree.
    gartman is the worst of the worst in my opinion. he really is clueless. I dont know why they keep having him on every other day on fast money and the like.
    Its funny how media affect sentiment changes on a dime that makes everyone forget the bigger picture as you referenced above.
    remember ebola and the airline stocks in october? ignore the noise.

    4 Dec, 01:47 PMReplyLike4
     
  • Value Digger

    , contributor
    Comments (3665) | Send Message


    Author’s reply » juscallmej, Thank you for the compliments. Truth is that some people had better not speak publicly so often because they shoot themselves in the foot.
    Regards,
    VD

    5 Dec, 07:16 AMReplyLike1
     
  • Freddyfred

    Comments (4) | Send Message


    That was NOT a LAME article ! Great Job! You covered a lot of material.


    I think at some point sooner than the media and herd thinks that oil will bounce hard upward. OPEC made a good move to instigate a needed correction and put the industry in check. Now I think (in the short term) we will see a scary drop lower fueled by more moves by OPEC such as todays move to cut prices from SA to Asia/India and USA. SA sees India as growing and needs to subdue the fact that demand is growing. I would not be surprised if massive amounts of capital is also used to force the commodity down further to keep the herd moving ion that direction. OPEC knows that they can turn it around very quickly (just tell the world they are cutting production and the herd reverses quickly) when they need to so they are in the drivers seat for sure.

    4 Dec, 02:00 PMReplyLike4
     
  • Value Digger

    , contributor
    Comments (3665) | Send Message


    Author’s reply » Freddyfred,


    Thank you for the compliments.


    A LOT of people and greedy oil speculators will be burned by shorting at the current levels. They have to pay for their mistakes and their greed, as always.


    Regards,
    VD

    5 Dec, 07:18 AMReplyLike0
     
  • nino91007

    Comments (226) | Send Message


    Oil fluctuates….down, then up. The question is how much MORE down it will go before it goes up…..yes $100+ is real but when? 2015 or 2018.

    4 Dec, 02:20 PMReplyLike1
     
  • goldenretiree

    Comments (932) | Send Message


    Lot of chutzpah here. You denigrate those with opposite viewpoints, then present everything you say as “facts.” When the fact of the matter is, nobody has a perfect crystal ball. Yes, oil will go back up. Question right now is “when.” The other question, how far does it fall from here? When you can definitively answer those questions, you can invest with confidence. Let us know when that occurs. Lot of good research here if you tone down the ego.

    4 Dec, 02:34 PMReplyLike4
     
  • Value Digger

    , contributor
    Comments (3665) | Send Message


    Author’s reply » goldentree,


    There is nothing about ego here. You misunderstood it. I have a clear opinion that I support it with facts and links. If you have a different opinion, you are welcome to present it coupled with facts in another article. If you present speculation only, it will not help, I think.


    Regards,
    VD

    5 Dec, 07:21 AMReplyLike3
     
 
  • charles hinton

    Comments (2798) | Send Message


    value ,i agree with golden…there is too much ego.


    when you started quoting your” gods ” and casting scorn on any who disagree i lost interest.


    ps mr market is always right no matter how much fundamentalist cry.

    5 Dec, 11:11 AMReplyLike2
     
  • Dirk43

    Comments (17) | Send Message


    Gartman is surely way to optimistic with his fusion forecast but a better and more immediate alternative is already here, Hydrogen powered cars. With new technical breakthroughs coming rapidly such as graphene membranes, Hydrogen will replace electric cars this decade and will start to make a serious dent in gasoline as well.
    Another paradigm changing event already mentioned is China. The enormous real estate debt bubble and steel production bubble also fueled by debt has to come to a head soon. Yes, the collapse of China has been forecasted “forever” but so was the 2007 US recession which also was belittled for years right up to the edge. So was the collapse of the Soviet Union. The Chinese Govmnt has been able to keep the ball in the air because they control most of the economy but the Piper stands at the door. A Chinese economic collapse which WILL come will also collapse the oil price. Maybe it will recover some first but no energy investor can afford to ignore this.
    Caveat Emptor!

    4 Dec, 02:52 PMReplyLike0
     
  • firstinsnow

    Comments (509) | Send Message


    I don’t know, I’m not sure of any of this, and I’m standing by my
    position, firmly. [until I change it]
    What I am sure of, is that this situation will change, and that change
    is inevitable.
    NO, I am not an analyst.

    4 Dec, 03:30 PMReplyLike3
     
  • D. Rockefeller

    Comments (135) | Send Message


    I don’t know what the price of oil will be, just look at the charts and they are still going down. China is buying up a lot of excess oil and sticking it in tankers etc.
    What I want to know is a chart from the EIA on Zero Hedge showing retail gasoline sales in the USA have declined almost 75%!!!! since 2004. Then Bloomberg showed a photo of the first gas station in America selling gas for below $ 2.00. Weird that below the gas price it showed Diesel selling for $3.39 plus! The EIA does not explain that stuff well why diesel is much more expensive than gasoline.(a six cents higher tax from the Feds. low suphur costs and “demand” globally????) Then the EIA shows gasoline production in the USA has risen!!! OK that tells me big oil is exporting refined petroleum products to other countries to make tons of money off us. Killing diesel over environmental EPA type stuff for political reasons because gasoline costs more to make than Diesel even with the other factors and six cent tax, and Exxon is back in Green River developing their shale oil in situ electro-fracking method for the largest oil play on earth-TRILLIONS of BARRELS in AMERICA. All comes down to costs, the big boys games, and ignorance of the average US citizen willing to be played and fleeced.
    Yes overall your article was good but there’s a lot more going on the secret weird world of big oil than any of us will understand like how in the 70’s the US “government” supposedly allowed Saudi Arabia to shut down our nation in the WINTER and I froze waiting in gas lines? The USA??? Biggest army on earth plus Standard Oil of California developed the Saudi oil???? Or that their lawyer, John J. McCloy told at least seven US “presidents” what to do and say through Reagan and HW Bush? Heck he even ran the Warren Commission with Dulles and World War 11. Harold Hamm says he can drill existing wells in the “Scoop” at 99 cents a barrel and tried to sue OPEC. He is not going to shut down next year and plans on ramping up oil production big no matter what the price is. He wants to ream OPEC and make them blink unlike the 1986 oil bust when we went broke.
    All highly interesting and I am watching and going to buy back when I think oil has hit the low-could be next year though?

    4 Dec, 04:43 PMReplyLike1
     
  • justforfun777

    Comments (16) | Send Message


    too much time spent making fun of the analysts.


    why are you looking at GDP growth rates when talking about oil demand when oil demand figures for those same countries are available?


    I dislike articles that spend their time making fun of other oracles and then turn around and make their own guesses of what the future holds. It’s an emotional argument.

    4 Dec, 05:15 PMReplyLike1
     
  • TraderFool

    Comments (504) | Send Message


    Re: “too much time spent making fun of the analysts.”


    Actually, I like that part – in my nearly 2 decade experience, I’ve seen far too many investors put too much faith on analysts and it’s important to show actual real life examples where analysts are fallible also.


    For example, take a look at SDRL. When SDRL was above $40, there were not many analysts telling investors to sell, the prevailing tone was “crude oil is going up, up, up, and buy, buy, buy”.. But when SDRL cuts dividends to zero at $15-$20, they are now downgrading SDRL. Buy at $40, sell at $20? I think you can go to the poorhouse very fast following these “anal-ysts”.


    SDRL is not an isolated example. Today, after massive price falls, I see Zacks now telling investors to sell their energy mutual funds after these funds have massive falls …


    As for the future, no one knows what is going to happen, you have to follow your own investing/trading thesis. For me, I think SDRL has fallen 75% from peak, cut dividends to zero, so, I am slowly starting to accumulate SDRL, looking to spend up to 4% capital when it finally gets down to say $7. Yes, no guarantee it will fall down that far when today is only $12, but I like the fact that it has fallen from a peak of $48 down to $12 … that’s my unsubstantiated opinion also, and probably emotional as well 🙂 And yes, I’m starting to think of accumulating when analysts consensus is to sell … it worked very well for me over the past decade ….

    4 Dec, 05:36 PMReplyLike3
     
  • samberpax

    Comments (115) | Send Message


    justforfun777: I dislike articles that spend their time making fun of other oracles and then turn around and make their own guesses of what the future holds.


    ———————-…


    Exactly so! I am elevating my standard by lowering theirs. Sad, very sad indeed.


    Best,
    -samberpax

    4 Dec, 10:26 PMReplyLike0
     
  • stockdunn

    Comments (245) | Send Message


    XOM is my largest holding; also have PBA, SE, and LNCO (oops). However, this Bloomberg article has some “paradigm shift” ideas that should be entered into the conversation. Oil is no longer the only game in town, and that has to be considered. Also, just because our politicians refuse to take climate change seriously, doesn’t mean the rest of the world isn’t taking notice and preparing to do something about it:


    http://bloom.bg/12CBfjp


    Here is the link to Lockheed-Martin’s compact fusion announcement. These researchers/engineers are the best of the best, I would think, so if they’re making an announcement, they must have something legitimate up their sleeve, I would think:


    http://lmt.co/1yJEu5x

    4 Dec, 05:41 PMReplyLike2
     
  • TraderFool

    Comments (504) | Send Message


    Hello stockdunn,


    Interesting article on Fusion, nice read.
    However, the recent crude oil price fall down to $66 is most likely unrelated to Lockheed-Martin’s fusion piece, as that piece seems more about promoting Lockheed-Martin in research and what they think they could achieve in 5 years time, and still not yet confirmed …. but good to cast a quick glance from time to time on these sort of things ….


    If Lockheed-Martin managed to bring this to commercial production at small enough sizes at reasonable prices (that’s a BIG IF), then, I think we first see Lockheed-Martin’s stock price zooms up first a lot more than what we’ve seen so far, before we see global crude oil prices comes down significantly … that’s just my gut feel …

    4 Dec, 05:54 PMReplyLike2
     
  • TraderFool

    Comments (504) | Send Message


    PS. Regarding “paradigm shifts”, I would treat that with a huge grain of salt. In 2008, crude oil fell from $147 down to $33, and a lot of articles came out with “paradigm shifts”. If you had invested in crude oil counters then, you would be laughing with +100%-+400% gains when crude makes its way back up to $110 in just 2-3 years …


    There is no guarantee we’ve seen bottom in crude yet, but I feel we are now entering a period where Value Investors should start to feel excited on some of the high quality issues that are beaten up hugely, to trade below NAV and trade well below Replacement Costs …


    Cheers,
    TF

    4 Dec, 07:17 PMReplyLike1
     
  • stockdunn

    Comments (245) | Send Message


    TF: Thanks for your response. I agree, the LMT fusion concept probably has nothing to do with the drop we’ve seen, and any shift would be sometime down the road. Yet, these things sometimes land on your lap before you realized they would.


    I haven’t sold any of my oil stocks, but I haven’t added yet, either. Would love to buy some LNCO to bring down my cost basis, but I’m concerned they’ll have to cut, or pull a Seadrill and eliminate, their dividend.

    4 Dec, 11:13 PMReplyLike1
     
  • CheeseLover

    Comments (2) | Send Message


    After I read your article http://bit.ly/1thepsy, I was quite impressed with your reasoning and knowledge.
    I have been waiting for a follow-up and this seems to be the one.
    Again I am impressed by your knowledge and your reasoning but I’m a bit disappointed too. Especially by not addressing points 3 and 4 of these 8 major reasons.

    4 Dec, 06:04 PMReplyLike1
     
  • samberpax

    Comments (115) | Send Message


    CheeseLover: Again I am impressed by your knowledge and your reasoning but I’m a bit disappointed too. Especially by not addressing points 3 and 4 of these 8 major reasons.


    ———————-


    Just to refresh, points 3 and 4 of these 8 major reasons:


    3) The weakening of the U.S. dollar.
    4) OPEC’s decision to cut supply in November 2014.


    Best,
    -samberpax

    4 Dec, 10:41 PMReplyLike0
     
  • Value Digger

    , contributor
    Comments (3665) | Send Message


    Author’s reply » Cheeselover, this is the follow up article as you guessed correctly. And you need to give it some time, as I also note.


    Please bear in mind that the HERD MENTALITY is like the TITANIC cruise ship. The big ships need a couple of miles to turn….


    Regards,
    VD

    5 Dec, 07:28 AMReplyLike1
     
  • TraderFool

    Comments (504) | Send Message


    VD,


    Agree this is very much a TITANIC cruise ship that will take a few miles to turn … apparently, the weekly US Oil production figure need to show 2 to 3 consecutive week of decline at the very least first. Until then, odds are crude oil will keep falling (short term momentum). I now feel we may be close to bottom, but we are not confirmed there yet, and I won’t be surprised if crude makes $30 very briefly, before a strong and fast recovery once a few of these marginal producers are out of the picture …


    Just as Saudis and US are stubborn right now to curtail production, in a year’s time when a few of the US producers goes bust, the Saudis will have achieved their objective and cut production, and just as quick, I see crude oil could rise back to $100 very fast … the US production numbers are always a surprise to markets, I expect the Saudi’s response to also be a surprise to the market when they cut back production in 6-12 months time – those looking for signs will not find it, I believe it will be a surprise to the market when it happen anytime within the next 12 months …

    5 Dec, 09:11 AMReplyLike0
     
  • Go Lakers

    Comments (1377) | Send Message


    “Also, the world’s biggest oil consumers are growing at rates that either are in line with 2013 rates or exceed expectations. There is nothing to indicate that global supply and demand imbalance has fundamentally changed in the past six months.”


    Whilst I agree with your base thesis and believe that the price of oil is going back up to what are more “normal” levels, some of the biggest consumers of oil on the planet are likely going to use less-and-less of it as time goes on. For example, there are pretty strict rules in place for future vehicle mileage requirements in the US, the EU has been clamping down hard on emissions for a pretty long time and lots of companies are now involved in the business of making energy efficient equipment and machinery. The list is long – GE, Siemens, Caterpillar, Deere, Hitachi, Volvo, Komatsu…..and so on.


    The historical environment for oil consumption is becoming more-and-more dated when compared to what the oil consumption environment will look like going forward. It’s hard if not impossible to use the past as an accurate guide to the future.


    The future oil consumption environment in two words – different and lower.

    4 Dec, 06:16 PMReplyLike1
     
  • rajprasad

    Comments (450) | Send Message


    every article on oil price that I read these days are bullish on oil price. May be one should take opposite view and stay short

    4 Dec, 06:56 PMReplyLike1
     
  • TraderFool

    Comments (504) | Send Message


    raj,
    If you are short on crude oil, I don’t see a reason why you need to close your shorts now as crude keeps falling. You should only close it when you see a confirmed uptrend, at least, that’s my view.


    Value Investors though are a different breed – they ease their way in specific value stocks, and now, many oil related stocks are trading at below NAV and well below Replacement Costs with strong cashflows during the last oil crisis … these stocks could still fall by another 25%-50% or close to bottom, no one really knows and so, they start to accumulate a little bit at a time … history has shown that crude oil will eventually recover, and they could be looking at +100% returns in 1-3 years time … the Value approach does not require market timing, and crude oil being highly cyclical in nature means we will definitely see $80-$100 crude oil again eventually over the next 1-3 years, we just don’t know exactly when. If it goes back to $100, you can be sure many of these crude related counters will go back up to their former levels, potentially 100%-300% gains …


    Mr Market has presented a compelling opportunity, the key is Money Management, accumulate a few high quality counters, and once bought, lock them up in a drawer and don’t worry about the daily price volatilities. In 1-3 years time, the gains of +100%-300% can be had … know the strategies in advance, never allocate more than 15%-20% portfolio to oil related counters at the bottom, and certainly, never go on margins. I have been staying cash majority of my portfolio, I just recently allocate 2% capital on oil counters, and plan to slowly work my way to 15%-20% assuming these stocks could fall up to 50% from current levels … This is a no-brainer approach, I just don’t care about the daily price volatilities.


    Cheers,
    TF.

    4 Dec, 07:12 PMReplyLike1
     
  • rajprasad

    Comments (450) | Send Message


    TF


    i am heavily long on oil and hurting badly but i keep buying as price drops. i am in your camp

    4 Dec, 07:29 PMReplyLike0
     
  • TraderFool

    Comments (504) | Send Message


    raj,


    Oil futures, stocks or options? I hope it is not leveraged instruments? The trend is still down …

    4 Dec, 07:45 PMReplyLike0
     
 
  • rajprasad

    Comments (450) | Send Message


    stocks with covered calls, naked puts no leverage – i can sustain the loss for a long time

    4 Dec, 07:52 PMReplyLike1
     
  • stockdunn

    Comments (245) | Send Message


    TF: Care to share what you’re buying?

    4 Dec, 11:17 PMReplyLike0
     
  • rajprasad

    Comments (450) | Send Message


    i bought ect voc per eroc and several others

    5 Dec, 12:22 AMReplyLike0
     
  • TraderFool

    Comments (504) | Send Message


    stockdunn,


    I’m eyeing SDRL – originally, I plan to go in with 4 bullets, at $13.50 (already done), $11, $9 and $7 very roughly speaking, but now, I will most likely try to take advantage of the short term down momentum (I am a trader) to cut loss some and take wait to pick it up at lower prices, and wait for a better technical signal. Allocating just 4% capital for SDRL.


    The other 2 counters are HP (this is a Dividend Aristocrat that keeps paying higher dividends every year for over 25 years) and NE (this is a nice Value play), but I haven’t triggered any buys in either yet as Crude keeps falling and the counters keep falling … Again, 4 bullets each, total 12% capital when I’m done all the 3 buys at the bottom.


    Originally, I plan to make a “simple” buy approach of just buying at set levels, but the more I study the crude markets fundamentally, the more I realize that I can fine-tune my entry better, so, let’s see if this is successful or not …


    How about you? What counters are you looking at?

    5 Dec, 09:23 AMReplyLike0
     
  • TraderFool

    Comments (504) | Send Message


    Hello raj,


    Glad you didn’t go for futures / options with time expiries – I just don’t know how long these crude oil price can fall – it can keep falling and falling, and the bottom and recovery I believe will be a huge surprise to me.


    Personally, I prefer safer, large caps, very liquid stocks that institutional buys with average daily volume greater than 500k to 1000k shares, and try to buy using a combination of writing puts and directly, and sell covered calls also.


    Whilst my current list is SDRL, HP and NE, if I find something else better, I’ll most likely drop one for that …


    Good luck.


    Cheers,
    TF

    5 Dec, 09:29 AMReplyLike0
     
  • rajprasad

    Comments (450) | Send Message


    TF


    Oil company stock valuation is based on EV/B/D; EV/EBITDA and EV/Reserve; It does not matter whether large cap or debt; In case of low rev they can always curtail drilling and be very liquid to pay down debt. Worse come worse they will sell their reserves for better price than current valuation. We just bid on various leases offered by Chevron and we did not get it as there are numerous buyers willing to pay higher price.


    raj

    5 Dec, 06:41 PMReplyLike0
     
  • Carlos San

    Comments (22) | Send Message


    This is an awful lot of cut and paste combined with high handed comments intimating the writer is a genius who knows more than everyone else. It is not original analysis. The fact that so many comments suggest this ois “excellent analysis” goes a long way toward explaining the somewhat sad state of oil and gas investment. I’m not hating, but re-read this article. It is just not analysis. Period.

    4 Dec, 07:24 PMReplyLike1
     
  • seanthome

    Comments (49) | Send Message


    But how much cheaper will oil go to before it starts to bounce back up?

    4 Dec, 08:07 PMReplyLike2
     
  • noobie107

    Comments (117) | Send Message


    That’s impossible to call.
    One could make educated guesses based on the geopolitical actions/goals of the major oil producing countries, changes in demand, etc.
    I’d rather see oil stay around these levels for a while as I accumulate.

    4 Dec, 08:11 PMReplyLike1
     
  • blahblahblahblahblar

    Comments (34) | Send Message


    What’s interested me is the issue of sovereign debt and reliance on oil revenues for certain countries.


    Looking at Venezuela and Iran for example – the oil price before the crash, at it’s peak…was nowhere near the quoted figures given for these countries to approach break even; so who goes broke first…small shale producers in the USA or the countries that need $150 oil to just break even, or do they just continue to go broke forever?


    I don’t think the OPEC decision is targeted solely at US shale plays…there’s others that are in far more pain over this, the rest of the global economy benefits while oil producers suffer a small but probably needed shakeout: I’ve got investments in oil but it’s ok to lose paper money on one part of the portfolio if another part benefits… I think sovereign default would be a lot worse for everyone involved. Oil will go back up in price eventually, and the median price will rise over time as the asset depletes. When is actually not that important unless you need your money tomorrow.

    4 Dec, 08:32 PMReplyLike3
     
  • Value Digger

    , contributor
    Comments (3665) | Send Message


    Author’s reply » blahblahblah,


    Please see the excerpt below:


    ” On top of that, there are some additional geopolitical clouds on the horizon that can make oil jump by H1 2015. For instance, the current low oil price has brought many OPEC members to their knees, while the holders of those countries’ sovereign debt are toast as long as oil stays at the current levels. Iran, Iraq, Libya, Algeria and Venezuela are not prepared to withstand low oil prices for long and they are now in serious danger of political upheaval at current prices.


    According to yesterday’s news from CNBC, the first signs of an escalating social unrest in Venezuela are already there, and things will definitely get worse over the next weeks.


    Furthermore, Russia and Saudi Arabia will be anxiously watching the rapid depletion of their sovereign wealth funds, which will make the political situation in these two countries dicey over the next months. “


    Regards,
    VD

    5 Dec, 08:05 AMReplyLike1
     
  • rrb1981

    Comments (11) | Send Message


    What will be quite interesting to see is if all of the pundits are correct regarding shale production being a “Ponzi scheme” etc.


    The sharp increase in production in the US over the past 5 years is simply amazing, however, it would be interesting to see what the overall average decline rate is for the US over the same time period.


    I’m inclined to believe that the decline rate is substantially higher in part due to the tremendous number of unconventional wells that have been drilled in the past few years and the fact that they are in the steep part of the decline curve. So, while production has been climbing, it seems that the Saudi’s are hoping to curb drilling and therefore let the decline curve catch up with the industry. With a sustained drop in prices, eventually borrowing base redeterminations will result in at least a moderate decrease in drilling, perhaps even drilling within cash flow!


    Also, while my opinions mean very little, I think it is important to point out somewhat misleading comments about certain plays being profitable at $40 or whatever they want to insert. Yes, if lease operating expenses and field level costs, transportation, ad valorem etc are $25-$40 per barrel, then those wells will be cash flow positive as long as pricing remains above that price.


    However $25-$40 oil will not provide a decent IRR for new wells. Remember most of these shale wells exhibit very high initial production and have sharp hyperbolic type declines. Producers need to get full payout in the first 12-24 months. Wells might decline 60-70% within the first 24 months. Look at the NPV of many of the Bakken wells at $60/bbl. Not nearly as attractive as when they were $100.


    I don’t know what oil pricing will do in the next few months, nor do I know what OPEC and the Saudi’s will do in 6 months. I do however believe that US oil producers will eventually have to reign in drilling budgets as cash flow wanes. I don’t know if that will mean production growth will taper, if production will hold steady with new production offsetting natural decline or if total US production will slowly decrease. I do know that it will be interesting to see it unfold.


    And while my opinion isn’t worth much, I believe that we will eventually find some happy medium where US producers can achieve decent IRRs and production can grow modestly. My guess is $75-$80 bbl.

    4 Dec, 08:49 PMReplyLike4
     
  • samiam911

    Comments (13) | Send Message


    I thoroughly enjoy VD’s articles, despite the fact that now all 4 of my positions initiated based on his recommendations are down from 30-60%. I still value them because their fundamental analysis, as outlined by VD, shows that they are still good investments; I will hold onto them for the long term.


    While VD is great at pointing out value, guessing what will happen to the price of oil will always be speculation. I like the argument given here, but the truth is that no one really knows.


    Investors in oil-producing companies should do so because they believe that their fundamentals will allow them to be successful and profitable in any environment of oil pricing.

    4 Dec, 10:45 PMReplyLike1
     
  • Value Digger

    , contributor
    Comments (3665) | Send Message


    Author’s reply » Samiam, thank you for your comments but I believe you have to keep in mind two things:


    – The recommended entry price for my picks, given that timing matters when it comes to investing. Buying a good company is not enough.


    – The investment horizon, given that I am not a day trader.


    Regards,
    VD

    5 Dec, 07:32 AMReplyLike1
     
  • samiam911

    Comments (13) | Send Message


    VD,


    Thanks for your reply. One of the things I appreciate about your articles is always standing by your track record. Given that, here are some of your picks from this year:


    CAZFF Recommended 5/15/14 – market price $0.30, currently at $0.14.


    PTAXF Recommended 8/26/14 – Market price $0.38, currently at $0.14


    LNREF Recommended 6/7/14 – Market price $0.35, currently at $0.19


    They have all experienced significant losses (on average 52%). However, I agree that I am not a day trader so if I liked these companies enough to buy them, I would still hold on as long as the fundamentals have not changed. As Buffet said, if you aren’t willing to lose half of your investment in the market, you shouldn’t be there.


    I remain long, but the simple fact is that there have been some significant losses in the short term.

    6 Dec, 08:58 AMReplyLike1
     
  • Value Digger

    , contributor
    Comments (3665) | Send Message


    Author’s reply » samiam,


    I was wondering why you did not mention:


    AEI.T recommended at C$4.95, now at C$6.85, up 40% despite the slump of the energy stocks.


    CKE.T recommended at C$0.82, now at C$1.25, up 50% despite the slump of the energy stocks.


    CAZ.T was recommended at C$0.24 in May 2014.


    LNR was recommended at $0.32 in June 2014.


    PTA.V was recommended at C$0.39 AND C$0.25 in October 2014:


    http://seekingalpha.co…


    and for reference, Oasis (OAS) has dropped from $55 to $14,


    Sandridge (SD) from $7 to $2.4


    Magnum (MHR) from $8.6 to $3.9


    Penn Virginia (PVA) from $17 to $4.8


    Quicksilver (KWK) from $3 to $0.40


    and many many other producers have returned back to their 2010 levels. I can continue if you want. This might help you see the big picture.


    Regards,
    VD

    6 Dec, 10:38 AMReplyLike0
     
  • CAPTAIN SIR

    Comments (7) | Send Message


    HEY VD U B DA MAN KEEP NSIPPN DAT 1 BUCK CHAMPAIGN ON yr boat/and kickn ass-ITS A BOAT TIME U CORRALATED GEOPOLY WIT/REALITY==keep dign bro.

    4 Dec, 10:50 PMReplyLike2
     
  • Kevin Hess

    , contributor
    Comments (153) | Send Message


    Best comment in this article.

    5 Dec, 09:05 AMReplyLike0
     
  • CAPTAIN SIR

    Comments (7) | Send Message


    good advice-keep guzzlin bro/try puttn more geo poly wit/da articles like this-thanks.

    4 Dec, 11:21 PMReplyLike0
     
  • 8596381

    Comments (7) | Send Message


    Rrb1981, agree $40/bbl would probably cover variable cost and thus existing producing tight oil wells would not be shut in. But you are right that much higher price needed for new wells to be economic. From what I Recall best locations in Baaken formation could probably be economic for new wells at $65, maybe a little lower. Eagle Ford would be something like $55, believe Niobrara in between. But, many wells have been drilled in less productive parts of these formations and those need much higher oil price to be economic. Again, these are rough, directional estimates. In reality production techniques keep improving, and some companies are will better, or have better locations, than others.


    My view is some new tight oil wells would still be drilled if oil stayed below $70, but likely not enough to overcome the rapid depletion from existing wells. I believe we will start to see US production drop sometime in H2 2015, but until then US production keeps going up. Think it will take maybe 6 months for wells already committed to be drilled and completed. After that market should at some point get back to $80-$85, maybe 12 months. But likely to be a volatile ride along the way. I personally think we have not seen bottom yet. Too much downward momentum, global oil production likely to keep increasing for the near term.


    Best to prepare for the volatility and try to recognize the opportunities as they play out, IMO. So many things could intervene ( geopolitics, global economic activity, China credit, etc)!


    Take care

    4 Dec, 11:22 PMReplyLike1
     
 
  • Nawar Alsaadi

    , contributor
    Comments (432) | Send Message


    Excellent article Value Digger, I share your outlook on oil as well. I would strongly advice reading this article as well in regards to the significant risks of $150B in cancelled oil capex in 2015 and a subsequent supply crunch later in the decade. At current prices up to 12.2m barrels in new supply are at risk between today and 2025:


    http://bit.ly/12EquNo


    Regards,
    Nawar

    5 Dec, 12:03 AMReplyLike1
     
  • Value Digger

    , contributor
    Comments (3665) | Send Message


    Author’s reply » Nawar,


    Thank you for your compliments and your insightful comment. Yes, the news you mention is another very strong bullish indicator.


    Regards,
    VD

    5 Dec, 08:08 AMReplyLike0
     
  • rv3lynn

    Comments (438) | Send Message


    The one and singular reason that world oil prices have collapsed is that U.S. shale production has gone from zero to 5 million BOEPD in 5 years.


    If this 5 million BOEPD were not on the world market today, where would we be?


    We would be short on oil.


    Instead, we are long on barrels because every dumba** American oilman that drills a good well immediately turns around and puts all of the cash flow from his good well into ANOTHER well. Plus he borrows a few million bucks to drill a few more wells.


    How else can you explain the unprecedented exponential oil production growth in this country?


    I wish these geniuses would spend their profits on wine, women, song, jet airplanes, country houses or something, besides plowing every single dollar of profit back into the ground.

    5 Dec, 01:20 AMReplyLike1
     
  • Dr. Z.

    Comments (93) | Send Message


    Excellent suggestion for the next shareholders meeting. What were they thinking…

    5 Dec, 02:49 AMReplyLike2
     
  • Goldens

    Comment (1) | Send Message


    This is all about the Ukraine. Saudi is the US’s bitch and driving down the price of oil is simply to put the hurt on Russia. Price of oil will bounce back once Russia gets the hell out of the Ukraine. As far as the laws of supply and demand all you need to do is take a look at copper. The LME is sitting at a 5+ year low and the price is below $3. Don’t make the mistake of thinking the markets make any sense. Listen to technicals.

    5 Dec, 09:06 AMReplyLike2
     
  • IOROUSSO

    Comments (19) | Send Message


    Good article. This market is not for traders, but for real investors. When you are a true investor you must be cool, sober, analytical but especially well informed. This is exactly what Value Digger is doing. I think his analysis is excellent and his <<cool blood>> will win in the end. Do you really believe that the oil sector will be destroyed? I don’t. But careful don’t spent your OWN money at once, keep them for worst times. There is no other way to make money in these markets. Value Digger you have my respect.

    5 Dec, 09:48 AMReplyLike2
     
  • Holthusen

    Comments (638) | Send Message


    Value Digger, thank you for another informative article of Petroleum production, pricing and demand. The amount of comments is indicative of your timely in depth analysis.


    You make a statement in your piece that sums up your whole thesis: “new oil is not cheap.”


    Any way we look at the supply situation, most new production will continue to come from expensive unconventional means such as shale or tar sands. Surely there are new conventional pockets of crude to be found, but they won’t be Elephants and will probably be expensive “deep water” reservoirs.
    Petroleum remains a key product for Global Energy & Industrial production and current low prices will NOT allow future demand to be satisfied.

    5 Dec, 04:32 PMReplyLike2
     
  • charles hinton

    Comments (2798) | Send Message


    pumping oil back into ground makes up alot of demand
    Us reserves….
    http://bit.ly/1vYF4uf


    china oil reserves
    http://bit.ly/1vYF4ug

    5 Dec, 05:25 PMReplyLike2
     
  • Brett Fromme

    Comments (6) | Send Message


    Value Digger,


    I agree with much of what you wrote.


    In a recent interview with Jim Cramer, Boone Pickens stated that the Saudis will eventually have to cut production. (my comments: OPEC will not survive if the Saudis let Venezuela, Iran, Algeria, Nigeria, Libya, as well as Russia descend into chaos. Not to mention destabilizing an already fragile world economic situation. When the Saudis cut, oil will soar.) B.P. also stated that the producers will be forced to cut CapEx. As they do US production will come down. Based on this, B.P. thought oil would rebound to $100 by mid-2015. Most people will dismiss Boone Picken’s comments. But when a wise old billionaire oilman speaks, I pay attention.


    I think most oil services companies will have a rough 2015 (buying opportunity for HAL, SLB). Also, highly leveraged small producers may be forced into bankruptcy, but stronger producers will benefit by picking up their producing acreage and reserves for pennies on the dollar.

    5 Dec, 11:36 PMReplyLike2
     
  • Holthusen

    Comments (638) | Send Message


    Brett, I watched the same interview and although his projects over the past several years have not really been home runs, this slump in pricing is certainly not his first rodeo! As you aptly stated “when a wise old billionaire oilman speaks, I pay attention.”

    6 Dec, 09:23 AMReplyLike0
     
  • Watermellon56

    Comments (451) | Send Message


    Thanks for the food for thought.
    Regarding Syria, it seems clear the US has opted to fight a war of attrition in northern Iraq rather than cut the head off the snake in Syria. This approach takes care of a number of problems (high casualties on both sides) and is training a whole new generation of US pilots and drone operators.
    I take your comments regarding portable fusion to be light hearted because the neutron flux off such reactors would kill everyone in the car.
    The greatest proof against Fleischmann–Pons knuckleheaded claims of nuclear fusion at room temperature was that they were alive at the announcement. The thought that Fleischmann & Pons conducted such an experiment in an occupied building should have been grounds for dismissal or incarceration.
    LMT is relying on plasma (not room temperature). This compounds the problems with having some random drunk driving around with a nuclear fusion device. Perhaps LMT can make electricity that is too cheap to meter, which would be big, but it is just speculation and not 5 years away.
    In the end, the House of Saud is still in control of the price of oil. Thank God the Iranians are not in that seat.
    By the way, in 1938, the US producers predicted the US has a 10 year supply of oil. I think producers can only see ten years ahead.

    6 Dec, 09:56 AMReplyLike0
     
  • KiteFlyer

    Comments (36) | Send Message


    Value Digger,


    Thanks for your article!


    It confirms what I have been thinking, although without the sources that you cite!


    Geo-politically, the world is a much more uncertain place at present! As for the pace of economic activity in the U. S. and elsewhere, the numbers are always after the fact! Can’t measure what hasn’t happened yet! Prognostication is fine for what it is, but it is just that- a guess, however educated!


    Oil prices may have further to decline, I don’t know, but the value of some of the oil stocks, I find compelling at these levels.

    6 Dec, 10:42 AMReplyLike0

Capital Controls Feared As Russian Rouble Collapses

‘Funding problems are increasing dramatically.  We think Russia is now flirting with systemic problems,’ said Danske Bank

https://i0.wp.com/l2.yimg.com/bt/api/res/1.2/WmBton1MRYnr0RMDXl9XMw--/YXBwaWQ9eW5ld3M7Zmk9ZmlsbDtoPTM3NztweG9mZj01MDtweW9mZj0wO3E9NzU7dz02NzA-/http%3A//globalfinance.zenfs.com/images/SG_AHTTP_OLGBBUS_Wrapper_NewFeed_1/2014-11-10T132927Z_1_LYNXNPEAA90JQ_RTROPTP_3_RUSSIA-CENBANK-CAPITAL_original.jpg

The currency has been in free fall since Saudi Arabia and the Gulf states vetoed calls by weaker OPEC members for a cut in crude oil output. By Ambrose Evans-Pritchard, The Telegraph

The Russian Rouble has suffered its steepest one-day drop since the default crisis in 1998 as capital flight accelerates, raising the risk of emergency exchange controls and tightening the noose on Russian companies and bodies with more than $680bn (£432bn) of external debt.

The currency has been in free fall since Saudi Arabia and the Gulf states vetoed calls by weaker OPEC members for a cut in crude oil output, a move viewed by the Kremlin as a strategic attack on Russia.

A fresh plunge in Brent prices to a five-year low of $67.50 a barrel on Monday caused the dam to break, triggering a 9pc slide in the Rouble in a matter of hours.

Analysts said it took huge intervention by the Russian central bank to stop the rout and stabilize the Rouble at 52.07 to the dollar. “They must have spent billions,” said Tim Ash, at Standard Bank.

It is extremely rare for a major country to collapse in this fashion, and the trauma is likely to have political consequences. “This has become disorderly. There are no real buyers of the Rouble. We know that voices close to president Vladimir Putin want capital controls, and we cannot rule this out,” said Lars Christensen, at Danske Bank.

“Funding problems are increasing dramatically. We think Russia is now flirting with systemic problems,” he added.

Some Russian banks have already started limiting withdrawals of dollars and euros to $10,000, an implicit lock down for big depositors.

Rouble against the dollar since December 2012.

Russian premier Dmitry Medvedev said 10 days ago that capital controls are out of the question. “The government, myself, my colleagues and the central bank have repeatedly stated that we are not going to impose any special restrictions on capital flows,” he said.

Ksenia Yudaeva, the central bank’s deputy governor, said the authorities are battening down the hatches for a “$60 oil scenario” lasting deep into next year. “A long decline is highly probable,” she said.

Russia has lost its ranking as the world’s eighth biggest economy, shrinking in just nine months from a $2.1 trillion petro-giant to a mid-size player comparable with Korea or Spain.

In a further setback, Mr Putin gave the clearest signal yet that the South Stream gas pipeline – intended to supply Europe without going through Ukraine – may never be built. “If Europe does not want to carry it out, then it will not be carried out,” he said.

Oil and gas provide two-thirds of Russia’s exports and cover half of its fiscal revenues, a classic case of the “Dutch Disease” that leaves the country highly exposed to the ups and down of the commodity cycle.

Protracted slumps in crude prices crippled the Soviet Union in late 1980s, and caused Russia to go bankrupt in the late-1990s. “The Rouble will not stabilize until oil does,” said Kingsmill Bond, at Sberbank.

The bank said Russia faces a mounting deficit on its capital account. The country is no longer generating a big enough trade surplus to cover capital outflows. Sberbank warned that reserves are “likely” to fall to levels that ultimately require capital controls, unless Western sanctions are lifted.

While Russia has $420bn of foreign reserves, this war chest is not as a large as it seems for a country with chronic capital outflows that relies heavily on foreign funding. Lubomir Mitov, from the Institute of International Finance, said investors may start to fret about reserve cover if the figure falls to $330bn.

The Rouble’s slide has led to fury in the Duma, where populist politician Evgeny Fedorov has called for a criminal investigation of the central bank. Critics say the institution had been taken over by “feminist liberals” and is a tool of the International Monetary Fund. The office of the Russia general prosecutor said on Monday it was opening a probe.

The central bank has refused to intervene to defend the Rouble over recent weeks, letting the exchange rate take the strain rather than burning through reserves to delay the inevitable, as Nigeria and Kazakhstan are doing. It squandered $200bn of reserves in a six-week period in late 2008 and triggered an acute banking crisis, learning the hard way that currency intervention entails monetary tightening.

By letting the Rouble fall, it shields the Russian budget from the slump in global oil prices, though not entirely. Deutsche Bank said the fiscal balance turns negative at crude prices below $70.

Yet the devaluation is causing prices to spiral upwards in the shops and may at some point cause a self-feeding crisis if it evokes bitter memories of past currencies crashes. The finance ministry said it expects inflation to reach 10pc in the first quarter of 2015.

There is already a dash to buy washing machines, cars and computers before they shoot up in price, a shift in behavior that signals stress.

The Rouble slide is ratcheting up the pressure on Russian companies facing $35bn of redemptions of foreign debt in December alone, mostly in dollars. Yields on Lukoil’s 10-year bonds have jumped by 250 basis points since June to 7.5pc.

Most Russian companies have been shut out of global capital markets since the escalation of Western sanctions, following the downing of Malaysia Airlines Flight 17 in July. They are forced to pay back debt as it comes due, seek support from the Russian state or default. The oil giant Rosneft has requested $49bn in state aid.

Sberbank said companies must repay $75bn next year in dollar debt and cannot hope to roll over more than a tiny sliver of this. Nor can they expect more than $10bn of fresh capital from China.

The bank said there are companies that are profiting nicely from the devaluation, since they sell abroad yet their costs are local. These include the base metals groups Norilsk and Rusal, as well as steel producers, and fertilizer groups such as Uralkali and PhosAgro. “Some of these are making a lot of money right now, and their stocks are flying,” said one trader.

The Russian equity index is trading at 0.5pc of book value. Rarely has a market ever been so cheap.

The Real Reason Saudis Didn’t Cut Oil Production

https://i0.wp.com/www.touristmaker.com/images/saudi-arabia/medina-saudi-arabia.jpgby Martin Vleck

Summary

  • There have been plenty of explanations why OPEC didn’t cut production quotas.
  • Most of them make sense. But they fail to explain the whole strategic long-term picture.
  • There is a rarely mentioned strategic reason why – counter intuitively – oil prices falling and staying low in 2015 is in the best long-term interest of most oil exporters.
  • Moreover, the current status threatens OPEC’s influence over oil prices. OPEC will need to reform and include virtually all major oil producers in quota negotiations. Otherwise, OPEC will become irrelevant.
  • There is also an unexpected historical parallel for the current oil slump.

The conventional explanations for OPEC not cutting the production

The OPEC leaving production quotas unchanged has naturally been the top news last week and most investors have spent at least some time over the weekend to reflect on the implications of the move on their portfolios. There have been several theories and explanations as to why the OPEC didn’t cut. The obvious reasons stretch from the lack of agreement between OPEC members on whether to cut, by how, and most importantly, how much production each country sacrifices. Other explanations include the strategy of the dominant OPEC member, Saudi Arabia, to let the prices fall in order to squeeze out high-cost oil producers, such as Canadian oil sands and U.S. shale oil. The explanations or speculations also include some supposed secret deal between the U.S. and Saudi Arabia to damage Russia, Iran, ISIS and other “rogue” regimes or interest groups around the world. There are certainly many more theories for why OPEC didn’t cut.

Saudis are most probably thinking long term, so any explanation needs to include a combination of short term and long-term strategic goals. And the question also lingers whether OPEC still has enough power over oil prices.

Is this the real reason why Saudis didn’t cut?

There have been plenty of explanations why the OPEC didn’t cut production quotas. But there is one very long-term strategic reason why the price fall may be welcome by OPEC. This explanation has not been discussed too much, at least I haven’t seen it mentioned. Yet over the very long, very strategic time horizon, this would be the most probable explanation for letting the price of oil to fall now.

Who is the biggest competitor for the Saudis, or OPEC countries? Is it Canada? Is it the U.S.? Russia? Offshore Africa? The answer is no. Let me give you a hint. What is the biggest threat to not just Saudi Arabia, or OPEC, but to all oil producers? The answer is simple:

The biggest threat to all oil producers of the world is the high oil price. (No, that’s not a typo).

Alternative energy sources are the true competitor of all participants in the oil and gas industry.

High price of oil spurs faster development and implementation of alternative energy technologies. It is just a matter of time before solar, wind and other alternative sources of energy will become competitive or cheaper than oil and gas in many applications. In some places they already are. Sometimes even without any subsidies and including the benefits that oil and gas industry receives in the form of free negative externalities, such as the damage to the water and environment in general. To be fair, the negative environmental impact of the solar panel production and disposition is rarely mentioned.

Moreover, the cost of generating alternative energy has been falling and there is no reason why the cost should stop falling as the technological process keeps leaping ahead. It will probably take centuries before the world runs out of good sunny or windy spots (Sahara, Saudi desert – interestingly, Southern U.S. for solar and plenty of shores for wind are just some examples), so the costs to extract additional alternative energy megawatts will not rise. Plus, the sun rises every day, so the source of this energy is almost infinite and doesn’t deplete or deteriorate. It is like a fixed cost which will never rise over time.

On the other hand, the reserves of oil and gas are finite and the cost of extracting an additional barrel of oil has been rising – and will most probably keep rising – due to cheap sources of oil being always extracted first as well as due to generally rising overall costs associated with oil production.

Alternative energy space is rapidly developing

The recent technical development in the area of electricity storage (batteries, etc.) and alternative energy is surprisingly fast. Panasonic, Tesla and many others are investing in cheaper and more efficient large-scale batteries for economically viable electricity storage. The sales of electric cars, while still tiny, grow at rapid annual rates globally. Hydrogen fuel cell powered cars are emerging (Honda, Hyundai and Toyota already sold/leased some hydrogen models to the public, Audi has a fully functional prototype, many other brands are at similar stages but the technology is evolving rapidly). Ironically, hydrogen is usually produced from natural gas or methane. However, the efficiency is roughly 80%, which is extremely high, much higher than conventional combustion engines. Natural gas also has a much lower value for the oil and gas producers than the oil (lots of it is still just burnt on the spot). So the overall revenue for the oil and gas industry will be significantly lower from a hydrogen-powered car than from a conventional gasoline car. The same holds true for electric cars of course. The hydrogen fueling stations infrastructure is in its infancy, and only a true fan would buy/rent a hydrogen car now, but judging from the hydrogen car mileage and activities of car manufacturers, fuel cell infrastructure may be just 2-3 years behind the electric vehicle infrastructure. If some favorable legislation chips in, the gap could actually close very soon.

But cars are just one of many examples of how alternative energy sources threaten to replace significant volumes of oil in the future. On the other end of the spectrum are speculative developments, such as the fusion power which has been a fata-morgana for many decades. Even a working solution now would probably take five to ten years to make it commercially available. However, Lockheed Martin now claims to have made a breakthrough in fusion technology, offering no details though. So their claim may easily be just part of a creative PR campaign. (I am not suggesting they are lying, but I have to discount the information because there is no way to prove it)

Oil is here to stay for decades

Of course lots of oil will still need to be consumed, for many decades to come. But the market will be shrinking or stagnant in dollar terms. Actual physical volumes may moderately rise. The improvements in power consumption efficiencies are not exactly going to help the price and volume. On the other hand, growing global population and rising buying power of a global consumer is a major positive factor. All in all, I believe the current oil price weakness will continue only in the short run. The prices of WTI crude should stabilize in the medium term of several months or quarters at the level of $60-$80 per barrel.

http://allsortsofposts.files.wordpress.com/2013/02/riyadh-saudi-arabia.jpg

The only way many oil and gas exporting countries can survive in the long run

Oil and gas revenues are often a dominant source of income for the producing countries. To say many are very dependent on oil and gas revenues is a gross understatement. Preserving at least some oil and gas revenue is a matter of life and death for these countries. Therefore, the only way to survive the next few decades for most oil and gas producing countries is to cut the price of oil drastically NOW. That is their only chance to at least slow down the development and implementation of alternative energy sources into widespread usage, before it is too late from their point of view. If they fail, the price of oil will get stuck at much lower levels almost permanently.

OPEC will lose relevance if it doesn’t manage to reform and include virtually all major oil producers in quota negotiations

Higher-cost producers are planning to increase their oil/oil products exports to global markets. For example, Canada prepares to sign a free trade agreement with South Korea “in the coming months” which will cut crude oil and LNG duties by 3% and by 8% on refined products virtually immediately upon signing the deal, and this deal would serve as a “gateway to the wider Asia-Pacific region”). Similarly, the U.S. has been warming up to the idea of looser oil export policies and discussing a free trade deal with the EU. The fact that Saudi Arabia recently cut price for its Asian customers while raising them for the U.S. would give some more support the theory that the North American market and its producers are the prime target of its strategy. And this is probably the medium-term goal of the Saudis, according to my opinion.

The fact that oil prices topped in the middle of June, almost exactly on the date when the message about the planned free trade agreement with South Korea was officially released (June 16, 2014), is certainly an interesting coincidence. Or is it? Additionally, it is likely that the Saudis see the waning pricing power of OPEC due to flexible production from the U.S. shale oil fields which can be quickly boosted or cut in order to influence the total world production. This ability takes away the power over oil from the Saudis which have possessed this power to adjust production until recently. Therefore, the Saudis probably try to reign in all OPEC members and force them to respect the set quotas and share any potential cuts among all members, without the Saudis bearing most of the quota cut. But the falling oil price has an interesting historical parallel and implications.

Lower price of oil serves as an inverse oil price shock (the opposite of the 70’s)

Besides the conventional explanations for the current oil price slump, there is a surprising inverse historical parallel – the first and second oil price shock in the 70’s (1973 and 1979). Back then, prices of oil spiked rapidly and remained high and the time was generally characterized by booming population growth, young population, rapid inflation, high interest rates which subsequently caused a supply-side shock and a recession. But this period also spurred unprecedented innovation around the world with advances in robotics, miniaturization, semiconductors, and other fields which radically improved efficiencies which decreased energy and material intensity of production, especially in Japan.

The current situation is almost exactly the opposite. The price of oil is not rising but falling rapidly. Inflation is extremely low (parts of the world already experience deflation), aggregate demand is sluggish amid falling real income, almost non-existent population growth and aging population (in the U.S. and other developed countries). All this discourages investments in energy innovation and energy efficiency (low interest rates help a lot, though).

Existing alternative energy solutions are becoming more and more uneconomical compared to falling price of oil and gas, and the opportunity cost of using subsidized “green” energy is rising relative to cheaper oil. Existing subsidies suddenly may not be high enough to cover the costs to install further alternative energy capacities. Investments into further alternative energy R&D will be hard to obtain due to low potential ROI of the innovations if the future price of oil is expected to remain low. This will help conserve the status quo or at least slow down alternative energy advances. For the current oil producers – from all around the world, not only for Saudi Arabia or OPEC – lower prices are great news in the long run, even though they are painful now.

My oil price outlook

In the short run (several months and quarters), I am very bearish on oil prices because the oil producers have motivation to keep the price low until the highly leveraged, high-cost oil producers go out of business or are bought for pennies by their stronger competitors. Also, oil producing countries would need to maintain at least several quarters of weak oil to discourage long-term investments into alternative energy innovation, possibly until the current round of alternative energy R&D companies and some solar energy companies go out of business or consolidate.

However, over the medium to long term (years and decades), I am neutral to moderately bullish on oil prices as I believe the markets and industry will find a decent equilibrium around $60-80 per barrel. However, I don’t expect long-lasting spikes above $90-100 per barrel (barring the global security situation getting out of hand) because the flexible U.S. shale producers currently hold a permanent “call option” on the oil market. Every time the price spikes, they will quickly add more production, balancing the market. It is quite similar to the Bernanke put option, just working the opposite way and in oil.

Investment implication

I opened a long position in United States Oil ETF (NYSEARCA:USO) (selling covered calls to help mitigate contango issues) and Seadrill (NYSE:SDRL) late last week. I am also considering establishing a long position in British Petroleum (NYSE:BP). Furthermore, for long-term investors with high risk tolerance, I recommend smaller positions in more speculative and risky oil and gas services small-cap stocks which I analyzed in the past few weeks. These include Tidewater (NYSE:TDW), TGC Industries (NASDAQ:TGE), Dawson Geophysical (NASDAQ:DWSN), GulfMark Offshore (NYSE:GLF), Ion Geophysical (NYSE:IO) and CGG Industries (NYSE:CGG). I don’t hold any positions in any of these due to my preference for a highly concentrated portfolio but may decide to open long positions depending on future situation.

Retail Disaster: Holiday Sales Crater by 11%, Online Spending Declines: NRF Blames Shopping Fiasco On “Stronger Economy”

Last year was bad. This year is an outright disaster.  By Tyler Durden

As we reported earlier using ShopperTrak data, the first two days of the holiday shopping season were already showing a -0.5% decline across bricks-and-mortar stores, following a “cash for clunkers”-like jump in early promotions which pulled demand forward with little follow through in the remaining shopping days. However, not even we predicted the shocker just released from the National Retail Federation, the traditionally cheery industry organization, which just reported absolutely abysmal numbers: sales during the four-day Thanksgiving holiday period crashed by a whopping 11% from $57.4 billion to $50.9 billion, confirming what everyone but the Fed knows by now: the US middle class is being obliterated, and that key driver of 70% of US economic growth is in the worst shape it has been since the Lehman collapse, courtesy of 6 years of Fed’s ruinous central planning. 

Demonstrating the sad state of America’s “economic dynamo”, shoppers spent an average only $380.95, down 6.4% from $407.02 a year earlier. In fact, as the NRF charts below demonstrate, there was a decline across virtually every tracked spending category (source):

As the WSJ reports, NRF’s CEO Matt Shay attributed the drop to a combination of factors, including the fact that retailers moved promotions earlier this year in attempt to get people out sooner and avoid what happened last year when people didn’t finish their shopping because of bad weather.

Also did we mention the NRF is perpetually cheery and always desperate to put a metric ton of lipstick on a pig? Well, hold on to your hats folks:

He also attributed the declines to better online offerings and an improving economy where “people don’t feel the same psychological need to rush out and get the great deal that weekend, particularly if they expected to be more deals,” he said.

And of course the sprint vs marathon comparisons, such as this one: “The holiday season and the weekend are a marathon not a sprint,” NRF Chief Executive Officer Matthew Shay said on a conference call. Odd how that metaphor is never used when the (seasonally-adjusted) sprint beats the marathoners.

So there you have it: a 11% collapse in retail spending has just been spun as super bullish for the US economy, whereby US consumers aren’t spending because the economy is simply too strong, and the only reason they don’t spend is because they will spend much more later. Or something.

Apparently the plunge in Americans who even care about bargains is also an indication of an economic resurgence:

The retail trade group said the number of people who went shopping over the four-day weekend declined by 5.2% to 134 million, from 141 million last year.

Finally, what we said earlier about a surge in online sales, well forget it – it was a lie based on the now traditional skewed perspectives from a few self-serving industry organizations:

Despite many retailers offering the same discounts on the Web as they offered in stores, the Internet didn’t attract more shoppers or more spending than last year. Online sales accounted for 42% of sales racked up over the four-day period, the same percentage as last year, though up from 26% in 2006, the trade group said.

In fact, it was worse: “Shoppers spent an average $159.55 online, down 10.2% from $177.67 last year.”

But the propaganda piece de resistance is without doubt the following:

“A highly competitive environment, early promotions and the ability to shop 24/7 online all contributed to the shift witnessed this weekend,” Mr. Shay said.

So to summarize: holiday sales plunged, and Americans refused to shop because the economy is “stronger than ever” and because Americans have the option of shopping whenever, which is why they didn’t shop in the first place. That, and of course plunging gasoline prices leading to… plunging retail sales, just as all the economists “correctly” predicted.

U.S. Median Home Price in October Increases to Highest Level Since September 2008, Still 19 Percent Below Peak

https://i0.wp.com/assets.urbanturf.com/dc/images/blog/2014/10/caphillhomesaleresize.jpg

– Price Appreciation Slowing in More than Half of Major U.S. Markets –
  – 20 Major Metros Reach New Post-Recession Price Peaks in 2013 or 2014 –
  – REO and Short Sales Down from a Year Ago, Foreclosure Auction Sales Increase –

IRVINE, Calif. – Nov. 26, 2014 — RealtyTrac® (www.realtytrac.com), the nation’s leading source for comprehensive housing data, today released its October 2014 Residential & Foreclosure Sales Report, which shows the median sales price of U.S. single family homes and condos in October was $193,000, up 2 percent from the previous month and up 16 percent from a year ago to the highest level since September 2008 — a 73-month high.

“This U.S. recovery is largely being driven by investors, and as the lower-priced, often distressed inventory most appealing to investors dries up in a given market, investor activity will slow down in that market and move to other markets with more ideal inventory available,” said Daren Blomquist, vice president at RealtyTrac. “This has created a ripple-effect recovery moving out from traditional investor hot spots such as Phoenix, Atlanta and many California markets and into markets such as Charlotte, Columbus, Ohio, Dallas and Oklahoma City.

“More than 32 percent of all single family homes and condos purchased so far in 2014 are non-owner occupied compared to 68 percent that are owner-occupied,” Blomquist added. “That is the highest share of investor purchases since we began tracking in 2001.”

The October median sales price — which included both distressed sales of homes in some stage of foreclosure and non-distressed sales — was up 37 percent from a trough of $141,000 in March 2012 but still 19 percent below the previous peak of $237,537 in August 2006. Among 97 metropolitan statistical areas with a population of 500,000 or more with sufficient home price data, 20 have reached new post-recession median sales price peaks in 2013 or 2014, including Denver, Pittsburgh, Columbus, Ohio, and Charlotte.

“Home prices have risen substantially in the lower price ranges — generally under $400,000.  That has led most underwater properties out of trouble,” said Phil Shell, Managing Broker of RE/MAX Alliance, covering the Denver market, where median home prices reached a new post-recession peak in July 2014.  “We are seeing a ‘compression’ in the market because we are experiencing record low inventories.  Prices on the low end are coming up, and while the high end is not necessarily coming down, it has flat-lined.  So we are seeing prices compress in the middle.  A homeowner wanting to move up into the market at $550,000 or above will find substantial value and a terrific opportunity.”
 
 The median sales price of distressed homes — those in the foreclosure process or bank-owned — was $128,701 nationwide in October, 36 percent below the median sales price of non-distressed properties, $200,000. But distressed home prices increased at a faster pace, up 18 percent from a year ago while non-distressed home prices were up 11 percent during the same time period.

“The demand is strong for a lessening distressed inventory and pushing prices to their highest level since 2008,” said Mike Pappas, CEO and president of the Keyes Company, covering the South Florida market. “Additionally, due to the long delay in our judicial foreclosure system we are now seeing a higher quality of distressed inventory being liquidated, although overall home prices have begun to gradually level off over the past few months as the market normalizes.”

Markets with highest home price appreciation
Among metro areas with a population of 500,000 or more and sufficient home price data, those with the biggest annual increase in median sales price were Toledo, Ohio (up 33 percent), Detroit (up 27 percent), Cleveland (up 21 percent), McAllen-Edinburg-Mission, Texas (up 21 percent), and Dayton, Ohio (up 20 percent).

Other major markets with double-digit appreciation compared to a year ago included Memphis, Tenn. (up 18 percent), Austin, Texas (up 17 percent), Miami (up 16 percent), Houston (up 16 percent), Cincinnati (up 15 percent), and Chicago (up 15 percent).

“While price appreciation has leveled off month to month, home prices have increased significantly from a year ago and we expect this trend to continue,” said Craig King, COO of Chase International, covering the Lake Tahoe and Reno, Nev., markets.  The median sales price in Reno was unchanged from September to October but up 15 percent from a year ago — the 29th consecutive month with a year-over-year increase in the market.

“A number of things have lined up regionally to provide game changing growth as we look forward,” continued King. “The world is aware that Tesla is making a move in to Northern Nevada with their Giga factory, but there are other huge projects on tap as well.  Collectively, these projects could account for population gains of 20 to 25 percent in the region over the next four to five years. With limited inventory the demand for housing will be unprecedented.”

Markets with accelerating home price appreciation
Home price appreciation accelerated in 45 of the 97 (46 percent) metro areas nationwide with a population of half a million or more and with sufficient home price data.

Markets with the fastest-accelerating appreciation included Cincinnati (15 percent annual appreciation this year compared to 4 percent annual depreciation last year), Cleveland (21 percent annual appreciation this year compared to 2 percent annual appreciation last year), Nashville (13 percent annual appreciation this year compared to 1 percent annual appreciation last year), Charlotte (10 percent annual appreciation this year compared to 1 percent annual depreciation last year), and Columbus, Ohio (14 percent annual appreciation this year compared to 3 percent annual appreciation last year.

Other major markets with accelerating home price appreciation were Chicago (15 percent annual appreciation this year compared to 11 percent a year ago), Dallas (11 percent annual appreciation this year compared to 7 percent a year ago), Pittsburgh (8 percent annual appreciation compared to 5 percent a year ago), Seattle (10 percent annual appreciation this year compared to 7 percent a year ago), Tampa (15 percent annual appreciation this year compared to 12 percent a year ago) and  Baltimore (2 percent annual appreciation this year compared to 0 percent a year ago).

“The continued rise in Seattle median home prices is largely a result of a strong local economy, low housing supply, and high buyer demand,” said OB Jacobi, president of Windermere Real Estate, covering the Seattle market. The percentage of distressed home sales in Seattle has returned to pre-mortgage crisis levels, with activity being driven by the hardships that have always instigated short sales, such as job loss, divorce, illness, and job relocation. Most of the distressed properties have shifted into the outlying areas around Seattle and are selling for well under the median home price.” 

Markets with slowing home price appreciation
Home price appreciation slowed compared to a year ago in 52 of the 97 (54 percent) metro areas nationwide with a population of half a million or more and with sufficient home price data.

Some of the fastest-appreciating markets in 2013 have seen substantial slowdowns in price appreciation this year, including Phoenix (6 percent annual appreciation in October 2014 compared to 25 percent a year ago), Los Angeles (9 percent annual appreciation this year compared to 24 percent a year ago), Oxnard-Thousand Oaks-Ventura in Southern California (7 percent annual appreciation this year compared to 24 percent a year ago), Jacksonville, Fla. (4 percent annual appreciation this year compared to 23 percent a year ago), Boston (3 percent annual appreciation this year compared to 21 percent a year ago), and San Diego (8 percent this year compared to 19 percent a year ago).

Other major markets with decelerating home price appreciation in October were New York (1 percent annual appreciation this year compared to 4 percent a year ago), Philadelphia (4 percent annual depreciation this  year compared to 5 percent annual appreciation a year ago), Houston (16 percent annual appreciation this year compared to 27 percent a year ago), Miami (16 percent annual appreciation this year compared to 20 percent a year ago), Atlanta (13 percent annual appreciation this year compared to 25 percent a year ago), and San Francisco (12 percent annual appreciation this year compared to 34 percent a year ago).

Las Vegas, Central California and Central Florida post highest distressed sale share
Short sales and distressed sales — in foreclosure or bank-owned — combined accounted for 13.8 percent of all residential property sales in October, up slightly from 13.7 percent the previous month, but down from 14.7 percent in October 2013.

Markets with the highest percentage of distressed and short sales combined were Las Vegas (33.6 percent), Stockton, Calif., (33.6 percent), Modesto, Calif., (31.7 percent), Lakeland, Fla., (28.9 percent), and Orlando (28.4 percent).

Short sales share close to pre-recession levels nationwide, up from a year ago in 12 states
Short sales accounted for 5.0 percent of all residential property sales in October, unchanged from the previous month and a year ago and not far above the pre-recession average of 4.5 percent a month in 2006.

Markets with the highest percentage of short sales were in Orlando (14.2 percent), Lakeland, Fla., (13.0 percent), Palm bay-Melbourne-Titusville, Fla., (11.8 percent), Cape Coral-Fort Myers, Fla., (11.8 percent), and Las Vegas (11.5 percent).

Twelve states saw an increase in short sales share compared to a year ago, including New Jersey (7.1 percent compared to 4.6 percent a year ago), Illinois (9.9 percent compared to 6.6 percent a year ago), Maryland (9.3 percent compared to 7.2 percent a year ago), Ohio (5.4 percent compared to 4.7 percent a year ago), Nevada (10.8 percent compared to 9.8 percent a year ago), California (4.6 percent compared to 4.3 percent a year ago), Michigan (6.5 percent compared to 6.2 percent a year ago) and Arizona (5.8 percent compared to 5.6 percent a year ago).

Bank-owned sales share matches lowest level since January 2011
Sales of bank-owned properties nationwide accounted for 7.5 percent of all U.S. residential sales in October, the same as previous month but down from 9.1 percent a year ago. The share of bank-owned sales in September and October was the lowest share since January 2011.

Markets with the highest percentage of bank-owned sales were in Stockton, Calif. (23.5 percent), Modesto, Calif., (19.3 percent), Bakersfield, Calif., (18.8 percent), Las Vegas (18.6 percent), Riverside-San Bernardino, Calif., (18.3 percent), and Phoenix (16.4 percent).

“Distressed sales remain a small percentage of the overall marketplace in Southern California as prices stabilize and market health continues to improve,” said Chris Pollinger, senior vice president of sales at First Team Real Estate, covering the Southern California market.

Foreclosure auction sales share increases most in Midwest, Rust Belt cities
Sales at the public foreclosure auction accounted for 1.3 percent of all U.S. residential property sales in October, up from 1.2 percent in September and up from 0.7 percent in October 2013.

Markets with the highest percentage of sales at foreclosure auction were Lakeland, Fla. (5.4 percent), Orlando (4.2 percent), Palm Bay-Melbourne-Titusville (4.1 percent), Miami (4.1 percent), Tampa (4.0 percent) and Las Vegas (3.5 percent).

Markets with the biggest annual increases in share of foreclosure auctions were Des Moines (1.9 percent compared to 0.1 percent a year ago), Akron, Ohio (2.1 percent compared to 0.1 percent a year ago), Philadelphia (1.9 percent compared to 0.1 percent a year ago), Chattanooga, Tenn., (1.3 percent compared to 0.1 percent a year ago), and Fresno, Calif., (0.9 percent compared to 0.1 percent a year ago).

Major metros with an annual increase in share of foreclosure auction sales included Dallas (1.8 percent compared to 0.4 percent a year ago), Cincinnati (1.2 percent compared to 0.3 percent a year ago), Columbus (3.0 percent compared to 0.7 percent a year ago), San Antonio (1.5 percent compared to 0.4 percent a year ago), Cleveland (2.2 percent compared to 0.6 percent a year ago), Houston (1.6 percent compared to 0.6 percent a year ago), Jacksonville, Fla., (3.5 percent compared to 1.4 percent a year ago), Oklahoma City (1.3 percent compared to 0.8 percent a year ago), Virginia Beach (1.4 percent compared to 0.8 percent a year ago), and Atlanta (2.3 percent compared to 3.3 percent a year ago).

http://youtu.be/MbUYOBfjTJ0

Report methodology
The RealtyTrac U.S. Residential Sales Report provides counts and median prices for sales of residential properties nationwide, by state and metropolitan statistical areas with a population of 500,000 or more. Data is also available at the county level upon request. The report also provides a breakdown of short sales, bank-owned sales and foreclosure auction sales to third parties. The data is derived from recorded sales deeds and loan data, which is used to determine cash sales and short sales. Sales counts for recent months are projected based on seasonality and expected number of sales records for those months that are not yet available from public record sources but will be in the future given historical patterns. Statistics for previous months are revised when each new monthly report is issued as more deed data becomes available for those previous months.

Definitions
Residential property sales: sales of single family homes, condominiums/town homes, and co-ops, not including multi-family properties.

Annualized sales: an annualized estimate of the number of residential property sales based on the actual number of sales deeds received for the month, accounting for expected sales records for that month that will be received in future months as well as seasonality.

Distressed sales: sale of a residential property that is actively in the foreclosure process or bank-owned when the sale is recorded.

Distressed discount: percentage difference between the median distressed sales price and the median non-distressed sales price in a given geographic area.

Bank-Owned sales: sales of residential properties that have been foreclosed on and are owned by the foreclosing lender (bank).

Short sales: sales of residential properties where the sale price is below the combined total of outstanding mortgages secured by the property.

Foreclosure Auction sales: sale of a property at the public foreclosure auction to a third party buyer that is not the foreclosing lender.

Report License
The RealtyTrac U.S. Residential & Foreclosure Sales report is the result of a proprietary evaluation of information compiled by RealtyTrac; the report and any of the information in whole or in part can only be quoted, copied, published, re-published, distributed and/or re-distributed or used in any manner if the user specifically references RealtyTrac as the source for said report and/or any of the information set forth within the report.

Data Licensing and Custom Report Order
Investors, businesses and government institutions can contact RealtyTrac to license bulk foreclosure and neighborhood data or purchase customized reports. For more information contact our Data Licensing Department at 800.462.5193800.462.5193 or datasales@realtytrac.com.

About RealtyTrac
RealtyTrac is a leading supplier of U.S. real estate data, with nationwide parcel-level records for more than 129 million U.S. parcels that include property characteristics, tax assessor data, sales and mortgage deed records, Automated Valuation Models (AVMs) and 20 million active and historical default, foreclosure auction and bank-owned properties. RealtyTrac’s housing data and foreclosure reports are relied on by the Federal Reserve, U.S. Treasury Department, HUD, numerous state housing and banking departments, investment funds as well as millions of real estate professionals and consumers, to help evaluate housing trends and make informed decisions about real estate.

Media Contacts:
Jennifer von Pohlmann
949.502.8300949.502.8300, ext. 139
jennifer.vonpohlmann@realtytrac.com

Ginny Walker
949.502.8300949.502.8300, ext. 268
Ginny.walker@realtytrac.com

Data and Report Licensing:
800.462.5193800.462.5193
datasales@realtytrac.com

Housing Price Gains Slow For 9th Straight Month, Says S&P/Case-Shiller

https://i0.wp.com/www.fortunebuilders.com/wp-content/uploads/2014/11/detroit-housing-market-summary.jpgby Erin Carlyle

Growth in home sales prices continued to slow across the nation in September, marking nine straight months of deceleration, data from S&P/Case-Shiller showed Tuesday.

U.S. single-family home prices gained just 4.8% (on a seasonally-adjusted basis) over prices one year earlier, down from a 5.1% annual increase in August, the S&P/Case-Shiller National Home Price Index shows. The measure covers all nine Census divisions. Significantly, September also marked the first month that the National Index decreased (by 0.1%) on a month-over-month basis since November 2013.

“The overall trend in home price increases continues to slow down,” says David M. Blitzer, chairman of the Index Committee at S&P Dow Jones Indices. “The only region showing any sustained strength is the Southeast led by Florida; price gains are also evident in Atlanta and Charlotte.”

Price gains have been steadily slowing since December after a streak of double-digit annual price increases in late 2013 and early 2014. Eighteen of the 20 cities Case-Shiller tracks reported slower annual price gains in September than in August, with Charlotte and Dallas the only cities where annual price gains increased. Miami (10.3%) was the only city to report double-digit annual price gains.
CaseShiller

The chart above depicts the annual returns of the U.S. National, the 10-City Composite and the 20-City Composite Home Price Indices. The S&P/Case-Shiller U.S. National Home Price Index, which covers all nine U.S. census divisions, recorded a 4.8% annual gain in September 2014. The 10- and 20-City Composites posted year-over-year increases of 4.8% and 4.9%, compared to 5.5% and 5.6% in August.

National Index, year-over-year change in prices (seasonally adjusted):

June 2013: 9.2%
July 2013: 9.7%
August 2013: 10.2%
September 2013: 10.7%
October 2013: 10.9%
November 2013: 10.8%
December 2013: 10.8%
January 2014: 10.5%
February 2014: 10.2%
March 2014: 9.0%
April 2014: 8.0%
May 2014: 7.1%
June 2014: 6.3%
July 2014: 5.6%
August 2014: 5.1%
September 2014: 4.8%

“Other housing statistics paint a mixed to slightly positive picture,” Blitzer said. “Housing starts held above one million at annual rates on gains in single family homes, sales of existing homes are gaining, builders’ sentiment is improving, foreclosures continue to be worked off and mortgage default rates are at precrisis levels. With the economy looking better than a year ago, the housing outlook for 2015 is stable to slightly better.”

Blitzer is referring to a report last week that showed housing starts (groundbreakings on new homes) down 2.8% in October, but still at a stronger pace than one year earlier. What’s more, single-family starts showed a 4.2% increase over the prior month. Also, in October existing (or previously-owned) home sales hit their fastest pace in more than one year. (Both reports are one month ahead of the S&P/Case-Shiller report, the industry standard but unfortunately with a two-month lag time.) Taken together, the data suggest that the rapid price gains seen late last year and in the first part of this year are mostly behind us.

https://i0.wp.com/www.housingwire.com/ext/resources/images/editorial/Places/Phoenix.jpg

“The days of double-digit home value appreciation continue to rapidly fade away as more inventory comes on line, and the market is becoming more balanced between buyers and sellers,” said Stan Humphries, Zillow’s chief economist. “Like a perfectly prepared Thanksgiving turkey, it’s important for things to cool off a bit in the housing market, because too-fast appreciation risks burning both buyers and sellers. In this more sedate environment, buyers can take more time to find the right deal for them, and sellers can rest assured they won’t be left without a seat at the table when they turn around and become buyers. This slowdown is a critical step on the road back to a normal housing market, and as we approach the end of 2014, the housing market has plenty to be thankful for.”

As of September 2014, average home prices across the U.S. are back to their spring 2005 levels for the National Index (which covers 70% of the U.S. housing market), while both the 10-City and 20-City Composites are back to their autumn 2004 levels. For the city Composite indices, prices are still off their mid-summer 2006 peaks by about 15% to 17%. Prices have bounced back from their March 2012 lows by 28.8% and 29.6% for the 10-City and 20-City composites.

S&P/Case-Shiller is now releasing its National Home Price Index each month. Previously, it was published quarterly, while the 10-City and 20-City Composites were published monthly. The “July” numbers above for the National Index above reflect a roll-up of data for the three-month average of May, June and July prices.

OPEC Refuses to Cut Production, Oil Plunges off the Chart

https://martinhladyniuk.com/wp-content/uploads/2014/11/a4b67-a2boil2bworker2bin2bnorth2bdakota.jpg

   Oil rig in North Dakota. Increased US drilling is a factor in the current decline in prices.  This article by Wolf Richter

The global oil glut, as some call it, is caused by the toxic mix of soaring production in the US and lackluster demand from struggling economies around the world. Since June, crude oil prices have plunged 30%. It drove oil producers in the US into bouts of hand wringing behind the scenes, though they desperately tried to maintain brittle smiles and optimistic verbiage in public.

But everyone in the industry – particularly junk bondholders that have funded the shale revolution in the US – were hoping that OPEC, and not the US, would come to its senses and cut production.

So the oil ministers from OPEC members just got through with what must have been a tempestuous five-hour meeting in Vienna, and it was not pretty for high-cost US producers: the oil production target would remain unchanged at 30 million barrels per day.

“It was a great decision,” Saudi Oil Minister Ali al-Naimi said with a big smile after the meeting.

Saudi Arabia and other Gulf states were thus overriding the concerns from struggling countries such as Venezuela which, at these prices – and they’re plunging as I’m writing this – will head straight into default, or get bailed out by China, at a price, whatever the case may be.

Venezuelan Foreign Minister Rafael Ramirez emerged from the meeting, visibly steaming, and refused to comment.

The US benchmark crude oil grade, West Texas Intermediate, plunged instantly. Even before the decision, it was down 30% from its recent high in June. As I’m writing this, it crashed through the $70-mark without even hesitating. It currently trades for $68.51. Chopped down by a full third from the peak in June.

This is what that Thanksgiving plunge looks like:

US-WTI_2014-11-27

Nigerian Oil Minister said OPEC and Non-OPEC producers should share responsibility to stabilize the markets. I don’t know what he was thinking; maybe some intervention by central banks around the world, such as the coordinated announcement of “QE crude infinity” perhaps?

Ecuadorian Oil Minister called the decision a rollover. However, the Iranian Oil Minister, whose country must have a higher price, kept a positive face, saying, “I’m not angry.”

The next OPEC meeting will be held in June, 2015. So this is going to last a while. And there is no deus ex machina on the horizon.

It seems OPEC, or rather Saudi Arabia and some of the Gulf States, decided for now to live with the circumstances, to let the markets sort it out. High-cost producers around the world will spill red ink. Governments might topple. Junk bondholders and shareholders of oil-and-gas IPOs that have blindly funded the miraculous shale revolution in the US, lured by ever increasing hype, will watch more of their money go up in thick smoke.

And the bloodletting in the US fracking revolution will go on until the money finally dries up.

And the state where richest people live is…

A new survey lists the states with the highest number of ultra rich

               CA US Senior Senator Dianne Feinstein’s net worth estimated at over $40 million

by Quentin Fottrell

Which U.S. state has the wealthiest residents of them all? It’s the home state of Facebook Chief Executive Mark Zuckerberg but not America’s richest man, Bill Gates, who lives in the state of Washington.

California is the state with the highest number of ultra wealthy individuals, according to a report from private wealth consultancy Wealth-X. There are 13,445 ultrahigh-net-worth individuals — defined as those with $30 million and above in net assets — based in the Golden State, up 6% on a year-over-year basis. They’re mostly located in San Francisco (5,460 people) and Los Angeles (5,135). In fact, California’s population of ultra wealthy individuals is larger than the ultrawealthy population in the entirety of the United Kingdom (11,510).

                       Facebook founder Mark Zuckerberg: Born in New York state, resides in California.

Other states are experiencing a super-rich surge. New York was No. 2 on the list, with 9,530 ultrahigh-net-worth individuals in 2014, up 6% in the last year, and — perhaps unsurprisingly — 8,655, or 91%, of them were based in New York City. The population of people with $30 million or more rose 14% on a year-over-year basis to 80 in North Dakota, which is currently experiencing an energy oil boom. Florida’s ultrahigh-net-worth population increased by more than 10%, adding almost 500 new individuals to 4,710 in 2014 due to strong growth in the state’s financial and real-estate sectors.


click here to see larger image

OPEC’s Prisoner’s Dilemma Unfolding

https://i0.wp.com/www.econlife.com/wp-content/uploads/imported/16422_8.26_000005651286XSmall.jpg
by Marc Chandler

Summary

  • OPEC faces internal and external challenges.
  • A large cut in output is unlikely.
  • Prices may have to fall by another $10 a barrel or so to begin having impact on production.

Prisoner’s Dilemma Unfolding. The oil producing cartel will be 55 years old next year. It is not clear, but it may be experiencing an existential crisis. It’s share of the world oil production has fallen with the rise of non-OPEC sources, like Russia, Norway, the UK, Canada, and significantly in recent years, increasingly the US.

In addition to the external threat, OPEC faces internal challenges, There is a divergence of perceptions of national interest by the political elite. Indeed, Middle East politics is arguably incomprehensible without appreciating the tension between Saudi Arabia and Iran.

Generally speaking, OPEC countries have tended to fall into one of two groups. The first has greater oil reserves relative to population. Saudi Arabia and Kuwait are the obvious examples. The second have relatively less oil and more people. Iran and Iraq are examples. This has often created conflicting strategies. The former wants to protect the value of their reserves by discouraging alternatives, which means relatively low prices. The latter want to maximize their current value.

OPEC, like all cartels, have governance or enforcement challenges. It long faced difficulty ensuring that the production agreements and quotas are respected. By OPEC’s own reckoning, there is often production in excess of the prevailing agreement. Last month, while oil prices were falling, OPEC says that it produced 30.25 mln barrels a day, which is 250k barrels a day over the production agreement. This may under-estimate OPEC’s production. Iran, for example, appears to be selling greater amounts of (condensate) oil than the sanctions allow.

The prisoner’s dilemma is both within OPEC and without. For the Saudis to continue to act as the swing producer, it would mean the surrender of revenue and market share to its rival Iran. Iran would very likely use the proceeds for purposes that would frustrate Saudi Arabia’s strategic interest. In a similar vein, a substantial cut in OPEC output, even if it could be agreed up, would benefit non-OPEC producers and only encourage the expansion of US shale development.

https://i0.wp.com/static2.businessinsider.com/image/54748126ecad04c815222db7/russia-doesnt-have-a-great-reputation-with-opec.jpg

Putin with Igor Sechin (right)

Contrary to the some conspiracy theorists who claim Saudi Arabia is doing US bidding by allowing the price of oil to fall to squeeze Russia, it has its own reasons not to want do Russia favors. Putin’s support for Assad in Syria and the Iranian regime puts Russia in opposition to Saudi Arabia. If the Saudis pick up the mantle again as the swing producer, Russia would a beneficiary. A recovery in oil prices would allow Putin to replenish his coffers, which would make its foreign assistance program even more challenging.

Moreover, and this is a key point, given OPEC’s reduced leverage in the oil market, a large cut in the Middle East production of mostly heavy sour crude might not be sufficient to support prices. It could lead to a loss of both revenue and market share. It could also lead to new widening of the spread between Brent, the international benchmark, and WTI, the US benchmark.

The significant drop in oil prices over the last several months has not deterred the expansion of US output. In the week ending November 7, the US produced nine mln barrels a day, which was the most in more than two decades. Output slipped in the week through November 14 by less than 60k barrels a day, but we would not read much into that.

Industry estimates suggest that more than three-quarters of the new light oil production next year is expected to be profitable between $50 and $69 a barrel. The press reports that rather than be deterred by the decline in prices, some companies, like Encana (NYSE:ECA) plan to dramatically increase the number of wells in the US Permian Basin (Texas) next year.

https://i0.wp.com/oilindependents.org/wp-content/uploads/2013/05/Permian-Basin-drilling-info-5-1-13.jpg

Reports do suggest that parts of nearly 20 fields are no longer profitable at $75 a barrel. There has been a very modest reduction of oil rigs. However, this has been largely offset by the rise in productivity of the existing wells. For example, in the North Dakota Bakken area, the output per well has risen to a record. In addition, industry reports suggest that the costs of shale and horizontal drilling is falling.

Although the price of oil has fallen below budget levels for many oil producing countries, the situation is not particularly urgent. Seasonally this is a high demand period. Most countries have ample reserves to cover the shortfall in the coming months. Around March, the seasonal factors shift and demand typically eases. That is when some key decisions will have to be made. It may not sound like a significant tell, but when the next OPEC meeting is scheduled may be indicative of a sense of urgency. A meeting in the February-March period may indicate higher anxiety than say a meeting in the middle of next year.

One study by Bloomberg found that only two OPEC quota cuts have been for less than one million barrels. A Bloomberg’s survey found that the respondents were evenly split between expecting a cut and not, few seem to be actually anticipating a significant cut. This suggests the scope for disappointment may be limited. That said, there is gap risk on the US oil futures contract come Friday, when they re-open after Thursday’s holiday.

As a consequence of lower oil prices, some oil producers may have to draw down their financial reserves to close the funding gap. Some will assume this will translate into liquidation of US Treasuries. However, it is not as easy as that. According to US Treasury data, in the first nine months of this year, OPEC increased its holdings of US Treasuries by $41 bln. In some period last year, it had sold about $17 bln of Treasuries. Could OPEC countries also be unwinding the diversification of reserves into euros, with yields so low and officials explicitly seeking devaluation (something not seen in the US since Robert Rubin first articulated a “strong dollar” policy almost two decades ago).

There may be political fallout from a continued decline in oil prices. An agreement between Baghdad and Kurds may be more difficult. Pressure in Libya and Nigeria is bound to increase, for example.

Back in 2009 when some observers began warning that higher food prices were the result of the extremely easy and unorthodox monetary policy. We argued that the shock was more on the supply side than the demand side and that commercial farmers would respond to the price signal by boosting output. Oil is similar but opposite. Oil prices will bottom after producers respond to the price signal by cutting production because they have to, not because they want to. Fear not greed will be the driver. It does not look like this can happen until Brent falls below $70 a barrel and WTI is nearer $60-$65.

https://i0.wp.com/www.mapsofworld.com/images/world-opec-members-countries-map.jpg

Avoid these common sales presentation mistakes

https://i0.wp.com/www.fileboard.com/wp-content/uploads/2013/01/death-by-powerpoint.jpg

by Rosalie Berg

A sales presentation can make or break your business. You can spend days or weeks preparing for a sales pitch, but if it’s done incorrectly, it will fall on deaf ears. Here are five mistakes to avoid making at all costs:

1. Quickly dive into your speech

This might be one of the worst standard practices in business: salespeople start their meeting with introductions, proceed with a company overview and then dive into their sales pitch. By doing so, they’ve missed a huge opportunity to get to know the prospect. Instead, it’s best to start with an open discussion, and end with a presentation — not the other way around.

The focus of a sales meeting should be on getting to know the prospect, their challenges and their goals. Only after asking a lot of questions and understanding the prospect should a salesperson talk about what they are selling.

2. Make a lackluster first impression

It seems like most companies expect their salespeople to be talented writers and artists, too. These poor salespeople go to see prospects armed with decks that are dull and unimpressive. From there, it’s an uphill battle to win over the prospect. Why skimp on this very important detail? A great artist can create a killer presentation deck sure to wow every prospect you face. In fact, of all the marketing materials we create or edit, few are as critical as the sales deck.

3. Focus on canned features and benefits

Most salespeople think that talking about how great their company, product or service is will help them sell. But it won’t. Prospects don’t buy products or services. They invest in answers to their problems. If you can show them how your product solves their challenges better than anyone else, you’ll have a sale.

4. Give lengthy slide presentations

Some confuse Power Point slides with brochures. This is not the place for a dissertation. Today’s business executives are far too busy for long presentations. They want to get the key reasons why they should be interested and how much it will cost them.

5. Talk, talk, talk

Yes, this is a presentation, but it need not be a monologue. Ask your prospect questions and get their commentary during your presentation. Not only will it show your prospects you take interest in their thoughts, but it will help you tailor the presentation to their needs and keep them engaged.

Above all, don’t underestimate the huge importance of a sharp looking sales deck. Work with a talented writer and artist to help you create it. Once you’ve nailed it, you’ll be able to customize it and impress prospects for months ahead.

Luxury Home Sales Are Surging In Southern California

Luxury home sales sizzle

The number of Southern California homes bought for $2 million or more in recent months is the highest on record. Above, Rafael Lopez, left, and his wife, Jacqueline, step out of a model luxury home in Irvine’s Orchard Hills community. (Cheryl A. Guerrero, Los Angeles Times)

by Tim Logan

By most measures, the housing market these days is a bit sluggish. Prices are flat. Sales are drooping. A lot of people are priced out.

But not everyone. The high end is hopping.

Luxury home sales in Southern California are hitting levels not seen in decades. The number of homes bought for $2 million or more in recent months is the highest on record. Sales worth $10 million or more are on pace this year to double their number from the heights of the housing bubble.

“It’s pretty mind-blowing, to be honest,” said Cindy Ambuehl, an agent with the Partners Trust in Brentwood. “The luxury market has been completely on fire.”

Low interest rates, a strong stock market and waves of cash sloshing in from overseas are boosting demand for high-dollar homes. A record 1,436 homes worth $2 million or more were sold in the six-county Southland in the second quarter, according to CoreLogic DataQuick.
In the more recent third quarter, 1,431 were sold. That was up 14% from the third quarter of 2013, and well ahead of any three-month period in the housing bubble years of the mid-2000s. This comes even as the broader market has plateaued, with prices in the Southland still about one-fifth below their pre-crash highs and sales at less than two-thirds their 2005 pace.
It reflects a housing market that is now moving at two speeds, said Selma Hepp, senior economist for the California Assn. of Realtors. Fast for the high end, sluggish for the rest.
“It’s just a completely different story between the two segments of the market,” she said. “Those who are doing well are doing really well.”

between now and a decade ago is that the world is smaller, said Drew Fenton, an agent who specializes in high-end homes at Hilton & Hyland in Beverly Hills. Wealthy international buyers are scooping up second homes, investment properties and safe havens for their cash. And it’s easier for them to scout — and travel — the world to do so.

“Everything’s just more global now,” he said. Ten years ago “it was much harder to reach those people and they didn’t travel as much.”

Now they are, and so are the agents who cater to them. Sandra Miller, a broker at Volker & Engels in Santa Monica, last week was jet-lagged from a trip to London, where she met with nearly two dozen brokerages that represent high-end buyers. At the end of the month, she’s off to Kuwait. Every week, she has a conference call with international agents.

The South land scores points with these buyers for its weather, its glamor and a population diverse enough that nearly any transplant can feel at home. And despite its reputation as one of the nation’s least-affordable housing markets, Los Angeles can look like a steal compared with other high-end havens.

“We talk to private wealth managers around the world who think California is a very good market right now,” Miller said. “Compared to New York or London, L.A. real estate is a bargain.”

But it’s not just foreign money that’s heating up the high end.

A surging stock market has boosted portfolios for domestic buyers in recent years, especially for those who have money to invest. Low interest rates have made mortgages cheap. And banks — still risk-averse — are offering lower rates and better terms to deep-pocketed borrowers than to cash-strapped first-time buyers. Meanwhile, wealthier households have seen their incomes grow faster than average in recent years.

Builders are recognizing this. Aliso Viejo based home builder New Home Co. has several developments underway in Orange County targeting high-end buyers, including 6,700 square-foot five-bedroom homes in Irvine and ocean-view condos in Newport Beach.
Sales have been brisk, said Joan Marcus Colvin, New Home’s senior vice president of sales, marketing and design, especially at that Newport condo building, the Meridian, where 34 units have sold since February, at an average price of nearly $3 million. That’s without even having a model home to show customers — the site is still under heavy construction. Renderings and drone shots of the views are all that’s offered.

Meridian Newport Beach, California

“It’s quite a testament to the strength of the high end of the market,” Colvin said. “These were bought sight unseen. We couldn’t even stand people there and show them it.”

But it’s the first new home development in Newport Center in a quarter-century, Colvin said, so there’s demand. And income growth has been strong in coastal Orange County, minting new buyers for high-dollar homes. The same trend is happening in places less associated with luxury than Fashion Island.

High-end home sales are surging in “Silicon Beach,” too, with tech entrepreneurs and Bay Area transplants scooping up multimillion-dollar homes in Santa Monica, Venice and Marina del Rey. Many of the buyers work in the area, said Miller, and prefer walkable neighborhoods, relatively close to work, to the traditional hubs of Westside glitz.

“These people don’t want to commute an hour and a half to Beverly Hills, which is a whole 13 miles away,” Miller said.

Then there’s the formerly sleepy South Bay. The average sales price in Manhattan Beach through the first nine months of the year topped $2.2 million, said Barry Sulpor at Shorewood Realtors. That’s up from $1.85 million in the same period last year. Even empty lots in the beach town’s “Tree Section” are going for $1.3 million.

http://southbaysparkle.files.wordpress.com/2012/01/downtownmb.jpg

Downtown Manhattan Beach

“That’s just lot value,” Sulpor said. “And as you get closer to the beach it goes up from there.”
Prices have been climbing so fast that even fairly recent buyers say they’re lucky they got in when they did. About 18 months ago, Ray Ahn and his wife bought a place half a block from the beach, a pocket listing that was never widely marketed. Before the purchase even closed, the house’s appraised value started climbing. And of the eight or so houses that neighbor Ahn’s, three have gotten high-end remodels since he moved in.

“I probably wouldn’t be able to buy here today,” said Ahn, who works for an investment firm in downtown Los Angeles.

But to live by the beach, he said, it’s worth it. So did Daphna Oyserman. She and her husband — professors who relocated from the University of Michigan to USC — spent $2.2 million in January for a house just a few blocks from the sand. They expected to pay a premium to live in a nice beach town, Oyserman said, and they did. But, although their house is “half the size at three times the price” of what they owned in Ann Arbor, Mich., Manhattan Beach offers amenities Michigan can’t.

“We thought, if we’re moving to L.A., we’d like to enjoy it,” she said. “In the morning I go for a run on the beach. When we go to sleep we can hear the ocean.”

These well-heeled professionals have played a big part in the South Bay’s surge, said Sulpor, along with those in the tech industry who prefer a more laid-back scene than Santa Monica and a growing cadre of professional athletes. Then there are young buyers who walk in with trust funds or family money.

“A lot of folks in their 20s and 30s are coming in and taking properties off the table at $3 million or $4 million,” Sulpor said. “Sometimes all-cash.”

Ambuehl said her luxury buyers also are starting to skew younger. Among her clients, tech entrepreneurs and other wealthy shoppers in their 20s and 30s are gradually replacing baby boomers, who often weren’t as young when they earned enough to afford a big-ticket house. They’re looking for different kinds of homes — often with more outdoor space — and in different neighborhoods. And, she predicts, they’ll be driving up the high end of the market for a long time.

“You’ve got 70 million baby boomers. You also have 70 million Gen Yers. They are a huge part of our buyer pool,” she said. “It’s a market we have to pay attention to.”

Oil & Gas Stocks: ‘Stability At The Bottom’ May Be A Positive Sign

https://i0.wp.com/www.avidtrader.com/wordpress/wp-content/uploads/2012/10/oil_and_gas.jpgby Richard Zeits

Summary:

  • The article provides “correction scorecards” by stock and by group versus commodities.
  • In the past two weeks, oil & gas stocks firmed up, despite the continued slide in the price of oil.
  • Small- and mid-capitalization oil-focused E&Ps were the strongest winners.
  • Emerging markets Oil Majors and Upstream MLPs were the worst performers.

During the two weeks since my previous update, stocks in the Oil & Gas sector demonstrated what an optimist might interpret as “stability at the bottom.” The net effect of another sequence of high-amplitude intraday moves was a slight recovery from the two weeks ago levels across the vast majority of segments and stock groups, as shown on the chart below. It should be no surprise that those groups that had declined the most were also the biggest gainers in the past two weeks.

Most notable is the fact that the descend trend in the Oil & Gas stocks was interrupted (and even marginally reversed) in spite of the new lows posted by the price of oil. One could try to interpret this performance as an indication that the current price levels already discount the market’s fear that the oil price paradigm has shifted. This stability may also indicate that the wave of forced liquidations by hedge funds and in individual margin accounts has run its course and the worst part of this correction may be already behind us.

Even though this recent stock price “stability” is a welcome development, it provides little consolation to investors in the Oil & Gas sector who still see their positions trading far below the peak levels achieved last summer. The correction scorecard graph below summarizes average “peak-to-current” performance by individual stocks that are grouped together by sector and size. Individual stock performance is provided in full detail in the spreadsheets at the end of this note.

Mid- and small-capitalization stocks, in both Upstream and Oil Service segments, remain the worst performing groups, now trading at an average discount to each individual stock’s recent peak price of over 40%, a staggering decline. Large-capitalization E&P independents and large-capitalization oil service stocks are trading at a 20%-24% average discount.

Emerging Markets Oil Majors Post A Strong Decline:

Emerging markets Oil Majors were one of the worst performing categories during the past two weeks:

Petrobras (NYSE:PBR) continued to slide down, moving 12% down since my previous update. Petrobras stands out as one of the most disappointing Oil Majors in terms of stock performance in the past five years, having lost a staggering three-quarters of its value during that period. The company’s market capitalization currently stands at only $62 billion.

· Lukoil (OTCPK:LUKOY) and Petrochina (NYSE:PTR) are other examples of strong declines in the past two weeks, with the stocks losing 8% and 7%, respectively. Lukoil’s performance may in fact be interpreted as “solid,” given the continued deterioration of Russia’s political and credit risk.

A strong contrast is the performance of the three oil super-majors – Exxon (NYSE:XOM), Chevron (NYSE:CVX) and Shell (NYSE:RDS.A) – that gained ~2% during the past two weeks and remain the best performing group in the Oil & Gas sector. I have argued in my earlier notes that, given the combined $0.9 trillion market capitalization of these three stocks, the resilient performance by the Super-majors has effectively isolated the correction in the Oil & Gas sector from the broader markets. From a fundamental perspective, the Super-majors are characterized by very low financial leverage, high proportion of counter-cyclical production sharing contracts (“PSAs”) and the effective hedge from downstream assets, which limits their exposure to the oil price decline.

Small-Capitalization E&P Stocks Bounce Back:

After a dramatic underperformance, small- and mid-capitalization E&P stocks posted meaningful gains in the past two weeks. However, in most cases the recovery is “a drop in the bucket,” given that high-percentage moves are measured off price levels that sometimes are a fraction of recent peak prices. The sector remains a menu of bargains for those investors who believe in a recovery in oil prices.

  • Enerplus (NYSE:ERF): +20%
  • Northern Oil & Gas (NYSEMKT:NOG): +17%
  • Concho Resources (NYSE:CXO): +15%
  • Approach Resources (NASDAQ:AREX): +48%
  • Goodrich Petroleum (NYSE:GDP): +24%
  • Synergy Resources (NYSEMKT:SYRG): +15%
  • Penn Virginia (NYSE:PVA): +17%
  • Comstock Resources (NYSE:CRK): +25%

E&P MLPs Retreat:

Upstream MLPs were one of the exceptions in the E&P sector, declining by an average of 4% in the past two weeks. The largest Upstream MLP, Linn Energy (NASDAQ:LINE) and its sister entity LinnCo(NASDAQ:LNCO), are again trading close to their lows, after having enjoyed a strong bounce a month ago. The previously very wide gap in relative performance between Upstream MLPs and other Upstream equities has contracted substantially which, arguably, makes sense given that both categories of companies participate in the same business, irrespective of the corporate envelope.

Oil & Gas Sector Correction Scorecards:


The Cruel Injustice of the Fed’s Bubbles in Housing


by Charles Hugh Smith

As the generational war heats up, we should all remember the source of all the bubbles and all the policies that could only result in generational poverty: The Federal Reserve.

Federal Reserve chair Janet Yellen recently treated the nation to an astonishing lecture on the solution to rising wealth inequality–according to Yellen, low-income households should save capital and buy assets such as stocks and housing.

It’s difficult to know which is more insulting: her oily sanctimony or her callous disregard for facts. What Yellen and the rest of the Fed Mafia have done is inflate bubbles in credit and assets that have made housing unaffordable to all but the wealthiest households.

Fed policy has been especially destructive to young households: not only is it difficult to save capital when your income is declining in real terms, housing has soared out of reach as the direct consequence of Fed policies.

Two charts reflect this reality. The first is of median household income, the second is the Case-Shiller Index of housing prices for the San Francisco Bay Area.

I have marked the wage chart with the actual price of a modest 900 square foot suburban house in the S.F. Bay Area whose price history mirrors the Case-Shiller Index, with one difference: this house (and many others) are actually worth more now than they were at the top of the national bubble in 2006-7.

But that is a mere quibble. The main point is that housing exploded from 3 times median income to 12 times median income as a direct result of Fed policies. Lowering interest rates doesn’t make assets any more affordable–it pushes them higher.

The only winners in the housing bubble are those who bought in 1998 or earlier. The extraordinary gains reaped since the late 1990s have not been available to younger households. The popping of the housing bubble did lower prices from nosebleed heights, but in most locales price did not return to 1996 levels.

As a multiple of real (inflation-adjusted) income, in many areas housing is more expensive than it was at the top of the 2006 bubble.

While Yellen and the rest of the Fed Mafia have been enormously successful in blowing bubbles that crash with devastating consequences, they failed to move the needle on household income. Median income has actually declined since 2000.

Inflating asset bubbles shovels unearned gains into the pockets of those who own assets prior to the bubble, but it inflates those assets out of reach of those who don’t own assets–for example, people who were too young to buy assets at pre-bubble prices.

Inflating housing out of reach of young households as a matter of Fed policy isn’t simply unjust–it’s cruel. Fed policies designed to goose asset valuations as a theater-of-the-absurd measure of “prosperity” overlooked that it is only the older generations who bought all these assets at pre-bubble prices who have gained.

In the good old days, a 20% down payment was standard. How long will it take a young family to save $130,000 for a $650,000 house? How much of their income will be squandered in interest and property taxes for the privilege of owning a bubblicious-priced house?

If we scrape away the toxic sludge of sanctimony and misrepresentation from Yellen’s absurd lecture, we divine her true message: if you want a house, make sure you’re born to rich parents who bought at pre-bubble prices.

As the generational war heats up, we should all remember the source of all the bubbles and all the policies that could only result in generational poverty: The Federal Reserve.

How Low Can the Price of Oil Plunge?

https://i0.wp.com/www.gulf-times.com/NewsImages/2014/10/27/30d677e0-63da-4004-ac67-2ce174ec36a9.jpgby Wolf Richter

It is possible that a miracle intervenes and that the price of oil bounces off and zooms skyward. We’ve seen stocks perform these sorts of miracles on a routine basis, but when it comes to oil, miracles have become rare. As I’m writing this, US light sweet crude trades at $76.90 a barrel, down 26% from June, a price last seen in the summer of 2010.

But this price isn’t what drillers get paid at the wellhead. Grades of oil vary. In the Bakken, the shale-oil paradise in North Dakota, wellhead prices are significantly lower not only because the Bakken blend isn’t as valuable to refiners as the benchmark West Texas Intermediate, but also because take-away capacity by pipeline is limited. Crude-by-rail has become the dominant – but more costly – way to get the oil from the Northern Rockies to refineries on the Gulf Coast or the East Coast.

These additional transportation costs come out of the wellhead price. So for a particular well, a driller might get less than $60/bbl – and not the $76.90/bbl that WTI traded for at the New York Mercantile Exchange.

Fracking is expensive, capital intensive, and characterized by steep decline rates. Much of the production occurs over the first two years – and much of the cash flow. If prices are low during those two years, the well might never be profitable.

Meanwhile, North Sea Brent has dropped to $79.85 a barrel, last seen in September 2010.

So the US Energy Information Administration, in its monthly short-term energy outlook a week ago, chopped down its forecast of the average price in 2015: WTI from $94.58/bbl to $77.55/bbl and Brent from $101.67/bbl to $83.24/bbl.

Independent exploration and production companies have gotten mauled. For example, Goodrich Petroleum plunged 71% and Comstock Resources 58% from their 52-week highs in June while Rex Energy plunged 65% and Stone Energy 54% from their highs in April.

Integrated oil majors have fared better, so far. Exxon Mobil is down “only” 9% from its July high. On a broader scale, the SPDR S&P Oil & Gas Exploration & Production ETF (XOP) is down 28% from June – even as the S&P 500 set a new record.

https://i0.wp.com/maxspeak.net/wp-content/uploads/2014/08/34852468Rick-Santelli-380x190.jpg

So how low can oil drop, and how long can this go on?

The theory is being propagated that the price won’t drop much below the breakeven point in higher-cost areas, such as the tar sands in Canada or the Bakken in the US. At that price, rather than lose money, drillers would stop fracking and tar-sands operators would shut down their tar pits. And soon, supplies would tighten up, inventories would be drawn down, and prices would jump.

But that’s not what happened in natural gas. US drillers didn’t stop fracking when the price of natural gas plunged below the cost of production and kept plunging for years. In April 2012, it reached not a four-year low but a decade-low of about $1.90 per million Btu at the Henry hub. At the time, shorts were vociferously proclaiming that gas storage would be full by fall, that the remaining gas would have to be flared, and that the price would then drop to zero.

But drillers were still drilling, and production continues to rise to this day, though the low price also caused an uptick in consumption that coincided with a harsh winter, leaving storage levels below the five-year minimum for this time of the year.

The gas glut has disappeared. The price at the Henry hub has since more than doubled, but it remains below breakeven for many wells. And when natural gas was selling for $4/MM Btu at the Henry hub, it was selling for $2/MM Btu at the Appalachian hubs, where the wondrous production from the Marcellus shale comes to market. No one can make money at that price.

And they’re still drilling in the Marcellus.

Natural gas drillers had a cover: a well that also produced a lot of oil and natural gas liquids was profitable because they fetched a much higher price. But this too has been obviated by events: on top of the rout in oil, the inevitable glut in natural gas liquids has caused their prices to swoon too (chart).

Yet, they’re still drilling, and production is still rising. And they will continue to drill as long as they can get the moolah to do so. They might pick and choose where they drill, and they might back off a smidgen, but as long as they get the money, they’ll drill.

Money has been flowing into the oil and gas business like a tsunami unleashed by yield-desperate investors who, driven to near insanity by the Fed’s policies, do what the Fed has been telling them to do: close their eyes and hold their noses and disregard risk and hand over their money, and borrow money for nearly free and hand over that money too.

Oil and gas companies have issued record amounts of junk bonds. They’ve raised record amounts of money via a record number of IPOs. They’ve raised money by spinning off assets into publicly traded MLPs. They’ve borrowed from banks that then packaged these loans into securities that were then sold. The industry has taken this cheap money and has drilled it into the ground.

This is one of the consequences of the Fed’s decision to flood the land with free liquidity. When the cost of capital is near zero, and when returns on low-risk investments are near zero as well, or even below zero, investors go into a sort of coma. But when they come out of it and realize that “sunk capital” has taken on a literal meaning, they’ll shut off the spigot.

Only then will drilling and production decline. As with natural gas, it can take years. And as with natural gas, the price might plunge through a four-year low and hit a decade low – which would be near $40/bbl, a price last seen in 2009. The bloodletting would be epic. To see where this is going, watch the money.

https://i0.wp.com/www.independent.co.uk/incoming/article9783416.ece/alternates/w620/pg-58-oil-getty.jpg

Consistency Is What Drives Your Success

https://i0.wp.com/www.gofitcoach.com/wp-content/uploads/2013/11/Consistency.jpgby Douglas Smith

I was out on the West Coast recently delivering a sales workshop for a group of about 40 loan originators. Our mission was to explore ideas for capitalizing on the summer home buying season and discover ways to increase their purchase loan application volume.

Early in the session, I handed out colored index cards and asked the participants to record their answers to this question: If a mortgage originator is serious about growing his or her purchase loan business over the next few months, what are three things he or she should be doing?

Everyone wrote down their best ideas, and I collected the cards so we could see their advice.

As you might imagine, we ended up with a lot of reoccurring themes and ideas. Overall, here are the top five suggestions they offered:

1. Work hard; put in the hours it takes.

2. Get out and see your Realtor and business partners.

3. Contact your database with cards and letters asking for referrals.

4. Attend local events and talk to people who might be in the market to buy.

5. Follow up on your pre-approvals, your leads and the contacts you make.

What do you notice about this list? There is nothing new! In all 40 index cards I collected, there was not a single suggestion that was original, earth-shattering or eye-popping. And that is exactly the point I wanted to make to that group and to you today: there is nothing new about success.

There are mortgage originators in the market today with 15 to 20 loans in their pipelines. There are originators closing $5 million a month and more.

Are they doing anything special? Absolutely not. Do they have “secrets” and strategies most others have never considered? Far from it. High producers and top performers have come to terms with the most important lesson about success—that success in this business is primarily caused by one enormously important factor: consistency.

Taking our cue from the list above, let’s apply this rule:

1. It’s not about working hard every so often, it’s about working a full eight- to nine-hour day, every day, five days a week. There’s no coming in late and no blowing out early on Friday afternoon. You can’t take two-hour lunch breaks and run personal errands on work time. You have to work hard at your job and put in a full day, every single day. Consistently.

2. It’s not about getting out to see your Realtor and other business partners when you can, when you are caught up, or when you feel like it.  It’s about getting out to visit your Realtor and business partners every week, week after week. Consistently.

3. It’s not about contacting your database with an arbitrary email at accidental intervals. It’s about having a pre-determined marketing plan to contact your database with cards, letters and phone calls on an ongoing monthly basis. Consistently.

4. It’s not about attending a local community, networking or industry event once every few months or on the off-chance when the opportunity arises. It’s about getting out of the office once or twice a week to meet new people, make new contacts and generate potential prospects. Consistently.

5. It’s not about following up on your leads and pre-approvals when you get time (after you’ve read all your emails or once you have combed through your loan files for the 10th time today). It’s about following up on potential leads, referrals and pre-approvals every single day. Consistently.

https://i0.wp.com/media-cache-ak0.pinimg.com/736x/53/50/ff/5350ff2b554103c48d3e0c9b3b709044.jpg

“Success is not sexy,” a very successful loan originator once told me. “Success comes from doing the simple, basic, mundane things you need to do day after day after day.” His recommendation is right on.

Too many mortgage originators today are searching for that magic pill that will make them more successful without having to exert much effort. Guess what; it doesn’t exist. There is no easy road to success in this business—never has been, never will be. Success is the end result of doing the right things consistently over a long period of time.

As we discovered at my sales seminar, most of the loan originators in attendance knew what to do and most were doing all the right things.

But for many, their production volume wasn’t where they wanted it to be because they weren’t doing what they needed to do consistently. They were working hard, but not every day. They were connecting with their Realtors, but not all that often.

They were building and marketing a database, but only when they had time to get around to it. They were engaged in some networking events, but maybe only once every few months.

And they were following up on their pre-approvals and prospects in a haphazard, random sort of way.

Does that also describe how you are running your business right now? If so, perhaps the most effective strategy to growing your purchase loan business over the summer home buying season has less to do with adding new activities and more to do with doing what you are already doing, but with more (wait for it…) consistency.

You have a tremendous opportunity ahead of you over the upcoming months. Activity is picking up, buyers are out there looking at properties, homes are selling, and mortgages are being made.

If you are consistent in doing what you need to do you’ll score a lot of opportunities, take a lot of applications, help a lot of people, close a lot of loans, and make a lot of money.  Isn’t that what this business is all about?

http://crystalash3.files.wordpress.com/2014/02/consistency.jpg

Doug Smith is a nationally known industry speaker, author and sales trainer. For more information, please visit http://www.DougSmithOnline.com or call Douglas Smith & Associates at 877-430-2329.

OPEC Forecasts $110 Nominal Price Through End Of This Decade:

OPEC’s World Oil Outlook And Pivot To Asia

https://i0.wp.com/www.sweetcrudereports.com/wp-content/uploads/2013/06/OPEC-conference.jpgby Jennifer Warren

Summary

  • OPEC published its recent global oil market outlook, which offers a slightly different and instructional viewpoint.
  • OPEC sees its share of crude oil/liquids production reducing in light of increases in U.S. and Canada production.
  • OPEC also indicates a pivot toward Asia, where it sees the greatest demand for its primary exports in the future.

In perusing through OPEC’s recently released “World Oil Outlook,” several viewpoints are noteworthy. According to OPEC, demand grows mainly from developing countries and U.S. supply slows its run up after 2019. After 2019, OPEC begins to pick up the slack, supplying its products more readily. In OPEC’s view, Asia becomes a center of gravity given global population growth, up nearly 2 billion by 2040, and economic prosperity. The world economy grows by 260% versus that of 2013 on a purchasing power parity basis.

During the period 2013-2040, OPEC says oil demand is expected to increase by just over 21 million barrels per day (mb/d), reaching 111.1 mb/d by 2040. Developing countries alone will account for growth of 28 mb/d and demand in the OECD will fall by over 7 mb/d (p.1). On the supply side, “in the long-term, OPEC will supply the majority of the additional required barrels, with the OPEC liquids supply forecast increasing by over 13 mb/d in the Reference Case from 2020-2040,” they offer (p.1). OPEC shaved off 0.5 million barrels from their last year’s forecast to 2035. Asian oil demand accounts for 71% of the growth of oil demand.

Morgan Stanley pulled out the following items:

The oil cartel released its World Oil Outlook last week, showing OPEC crude production falling to 29.5 million barrels per day in 2015 and 28.5 million barrels per day in 2016. This year’s average of 30 million barrels per day has helped flood the market and push oil prices to multi-year lows.

In the period to 2019, this chart illustrates where the barrels will flow:

Prices

With regard to price, OPEC acknowledges that the marginal cost to supply barrels continues to be a factor in expectations in the medium and long term. This sentiment has been echoed by other E&P CEOs in various communiques this year. OPEC forecasts a nominal price of $110 to the end of this decade:

On this evidence, a similar price assumption is made for the OPEC Reference Basket (ORB) price in the Reference Case compared to that presented in the WOO 2013: a constant nominal price of $110/b is assumed for the rest of the decade, corresponding to a small decline in real values.

Real values are assumed to approach $100/b in 2013 prices by 2035, with a slight further increase to $102/b by 2040. Nominal prices reach $124/b by 2025 and $177/b by 2040. These values are not to be taken as targets, according to OPEC. They acknowledge the challenge of predicting the world economy as well as non-OPEC supply. The Energy Information Administration (EIA) forecast a price for Brent averaging over $101 in 2015 and West Texas Intermediate (WTI) of over $94 as of their October 7th forecast. (This will have likely changed as of November 12th after the steep declines of October are weighed into their equations.) WTI averaged around the $97 range for 2013 and 2014. Importantly, U.S. supply may ratchet down slightly (green broken line) in response to price declines, if they continue.

It’s also the cars, globally

In 2013, OPEC says gasoline and diesel engines comprised 97% of the passenger cars total in 2013, and will hold 92% of the road in 2040. The diesel share for autos rises from 14% in 2013 to 21% in 2040. Basically, the number of cars buzzing on roads doubles from now to 2040. And 68% of the increase in cars comes from developing countries. China comprises the lion’s share of car volume growing by more than 470 million between 2011-2040, followed by India, then OPEC members will attribute 110 million new cars on the road. These increases assume levels similar to advanced economy (OECD) car volumes of the 1990s. In spite of efficiency and fuel economy, oil use per vehicle is expected to decline by 2.2%.

Commercial vehicles gain 300 million by 2040 from about 200 million in 2011. There are now more commercial vehicles in developing countries than developed.

U.S. Supply and OPEC

According to OPEC, U.S. and Canada supply increases through the period to 2019, the medium term. After 2017, they believe U.S. supply tempers from 1.2 million barrels of tight oil increases between 2013 and 2014 to 0.4 million in 2015, and less incremental increases thereafter. This acknowledges shale oil’s contribution to supply, with other supply sources declining, i.e., conventional and offshore.

OPEC Suggests:

The amount of OPEC crude required will fall from just over 30 mb/d in 2013 to 28.2 mb/d in 2017, and will start to rise again in 2018. By 2019, OPEC crude supply, at 28.7 mb/d, is still lower than in 2013.

However, the OPEC requirements are expected to ramp back up after 2019. By 2040, they expect to be supplying the world with 39 mb/d, a 9 million barrel/d increase from 2013. OPEC’s global share of crude oil supply is then 36%, above 2013 levels of about 30%. A select few firms like Pioneer Natural Resources (NYSE:PXD), Occidental Petroleum (NYSE:OXY), Chevron (NYSE:CVX) and even small-cap RSP Permian (NYSE:RSPP) are staying the course on shale oil production in the Permian for the present. After the first of the year, they will evaluate the price environment.

How does this outlook by OPEC inform the future? From the appearances in its forecasts, OPEC has slightly lower production in the medium term (to 2019), a decline of 1.3 million b/d in 2019 from the 2014 production of 30 million b/d. Thus, the main lever for an increase in prices for oil markets is for OPEC to restrict production, or encourage other members to keep to the current quota of 30 million b/d. Better economic indicators also could help. However, Saudi Arabia, the swing producer, has shown interest in maintaining its market share vis-à-vis the price cuts it has offered China, first, and then the U.S. more recently.

The global state of crude oil and liquids and prices has fundamentally changed with the addition of tight oil or shale oil, particularly from the U.S. While demand particulars have dominated the price regime recently, the upcoming decisions by OPEC at the late November meeting will have an influence on price expectations. In an environment of softer perceived demand now because of global economics and in the future because of non-OPEC supply, it would seem rational for OPEC to indicate some type of discipline among members’ production.

Source: OPEC “2014 World Oil Outlook,” mainly from the executive summary.

The Next Housing Crisis May Be Sooner Than You Think

How we could fall into another housing crisis before we’ve fully pulled out of the 2008 one.

https://i0.wp.com/cdn.citylab.com/media/img/citylab/2014/11/RTR2LDPC/lead_large.jpgby Richard Florida

When it comes to housing, sometimes it seems we never learn. Just when America appeared to be recovering from the last housing crisis—the trigger, in many ways, for 2008’s grand financial meltdown and the beginning of a three-year recession—another one may be looming on the horizon.

There are at several big red flags.

For one, the housing market never truly recovered from the recession. Trulia Chief Economist Jed Kolko points out that, while the third quarter of 2014 saw improvement in a number of housing key barometers, none have returned to normal, pre-recession levels. Existing home sales are now 80 percent of the way back to normal, while home prices are stuck at 75 percent back, remaining undervalued by 3.4 percent. More troubling, new construction is less than halfway (49 percent) back to normal. Kolko also notes that the fundamental building blocks of the economy, including employment levels, income and household formation, have also been slow to improve. “In this recovery, jobs and housing can’t get what they need from each other,” he writes.

Americans are spending more than 33 percent of their income on housing.

Second, Americans continue to overspend on housing. Even as the economy drags itself out of its recession, a spate of reports show that families are having a harder and harder time paying for housing. Part of the problem is that Americans continue to want more space in bigger homes, and not just in the suburbs but in urban areas, as well. Americans more than 33 percent of their income on housing in 2013, up nearly 13 percent from two decades ago, according to newly released data from the Bureau of Labor Statistics (BLS). The graph below plots the trend by age.

Over-spending on housing is far worse in some places than others; the housing market and its recovery remain highly uneven. Another BLS report released last month showed that households in Washington, D.C., spent nearly twice as much on housing ($17,603) as those in Cleveland, Ohio ($9,061). The chart below, from the BLS report, shows average annual expenses on housing related items:

(Bureau of Labor Statistics)

The result, of course, is that more and more American households, especially middle- and working-class people, are having a harder time affording housing. This is particularly the case in reviving urban centers, as more affluent, highly educated and creative-class workers snap up the best spaces, particularly those along convenient transit, pushing the service and working class further out.

Last but certainly not least, the rate of home ownership continues to fall, and dramatically. Home ownership has reached its lowest level in two decades—64.4 percent (as of the third quarter of 2014). Here’s the data, from the U.S. Census Bureau:

(Data from U.S. Census Bureau)

Home ownership currently hovers from the mid-50 to low-60 percent range in some of the most highly productive and innovative metros in this country—places like San Francisco, New York, and Los Angeles. This range seems “to provide the flexibility of rental and ownership options required for a fast-paced, rapidly changing knowledge economy. Widespread home ownership is no longer the key to a thriving economy,” I’ve written.

What we are going through is much more than a generational shift or simple lifestyle change. It’s a deep economic shift—I’ve called it the Great Reset. It entails a shift away from the economic system, population patterns and geographic layout of the old suburban growth model, which was deeply connected to old industrial economy, toward a new kind of denser, more urban growth more in line with today’s knowledge economy. We remain in the early stages of this reset. If history is any guide, the complete shift will take a generation or so.

It’s time to impose stricter underwriting standards and encourage the dense, mixed-use, more flexible housing options that the knowledge economy requires.

The upshot, as the Nobel Prize winner Edmund Phelps has written, is that it is time for Americans to get over their house passion. The new knowledge economy requires we spend less on housing and cars, and more on education, human capital and innovation—exactly those inputs that fuel the new economic and social system.

But we’re not moving in that direction; in fact, we appear to be going the other way. This past weekend, Peter J. Wallison pointed out in a New York Times op-ed that federal regulators moved back off tougher mortgage-underwriting standards brought on by 2010’s Dodd-Frank Act and instead relaxed them. Regulators are hoping to encourage more home ownership, but they’re essentially recreating the conditions that led to 2008’s crash.

Wallison notes that this amounts to “underwriting the next housing crisis.” He’s right: It’s time to impose stricter underwriting standards and encourage the dense, mixed-use, more flexible housing options that the knowledge economy requires.

During the depression and after World War II, this country’s leaders pioneered a series of purposeful and ultimately game-changing polices that set in motion the old suburban growth model, helping propel the industrial economy and creating a middle class of workers and owners. Now that our economy has changed again, we need to do the same for the denser urban growth model, creating more flexible housing system that can help bolster today’s economy.

https://i0.wp.com/www.thefifthestate.com.au/wp-content/uploads/2012/10/High_Density_Housing_____20120101_800x600.jpg
Dream housing for new economy workers
?

Energy Workforce Projected To Grow 39% Through 2022

The dramatic resurgence of the oil industry over the past few years has been a notable factor in the national economic recovery. Production levels have reached totals not seen since the late 1980s and continue to increase, and rig counts are in the 1,900 range. While prices have dipped recently, it will take more than that to markedly slow the level of activity. Cycles are inevitable, but activity is forecast to remain at relatively high levels.  

An outgrowth of oil and gas activity strength is a need for additional workers. At the same time, the industry workforce is aging, and shortages are likely to emerge in key fields ranging from petroleum engineers to experienced drilling crews. I was recently asked to comment on the topic at a gathering of energy workforce professionals. Because the industry is so important to many parts of Texas, it’s an issue with relevance to future prosperity.  


Although direct employment in the energy industry is a small percentage of total jobs in the state, the work is often well paying. Moreover, the ripple effects through the economy of this high value-added industry are large, especially in areas which have a substantial concentration of support services.  

Petroleum Engineer

Employment in oil and gas extraction has expanded rapidly, up from 119,800 in January 2004 to 213,500 in September 2014. Strong demand for key occupations is evidenced by the high salaries; for example, median pay was $130,280 for petroleum engineers in 2012 according to the Bureau of Labor Statistics (BLS).  

Due to expansion in the industry alone, the BLS estimates employment growth of 39 percent through 2022 for petroleum engineers, which comprised 11 percent of total employment in oil and gas extraction in 2012. Other key categories (such as geoscientists, wellhead pumpers, and roustabouts) are also expected to see employment gains exceeding 15 percent. In high-activity regions, shortages are emerging in secondary fields such as welders, electricians, and truck drivers.  

The fact that the industry workforce is aging is widely recognized. The cyclical nature of the energy industry contributes to uneven entry into fields such as petroleum engineering and others which support oil and gas activity. For example, the current surge has pushed up wages, and enrollment in related fields has increased sharply. Past downturns, however, led to relatively low enrollments, and therefore relatively lower numbers of workers in some age cohorts. The loss of the large baby boom generation of experienced workers to retirement will affect all industries. This problem is compounded in the energy sector because of the long stagnation of the industry in the 1980s and 1990s resulting in a generation of workers with little incentive to enter the industry. As a result, the projected need for workers due to replacement is particularly high for key fields.

The BLS estimates that 9,800 petroleum engineers (25.5 percent of the total) working in 2012 will need to be replaced by 2022 because they retire or permanently leave the field. Replacement rates are also projected to be high for other crucial occupations including petroleum pump system operators, refinery operators, and gaugers (37.1 percent); derrick, rotary drill, and service unit operators, oil, gas, and mining (40.4 percent).  

http://jobdiagnosis.files.wordpress.com/2010/03/petroleum-engineer.jpg

Putting together the needs from industry expansion and replacement, most critical occupations will require new workers equal to 40 percent or more of the current employment levels. The total need for petroleum engineers is estimated to equal approximately 64.5 percent of the current workforce. Clearly, it will be a major challenge to deal with this rapid turnover.

Potential solutions which have been attempted or discussed present problems, and it will require cooperative efforts between the industry and higher education and training institutions to adequately deal with future workforce shortages. Universities have had problems filling open teaching positions, because private-sector jobs are more lucrative for qualified candidates. Given budget constraints and other considerations, it is not feasible for universities to compete on the basis of salary. Without additional teaching and research staff, it will be difficult to continue to expand enrollment while maintaining education quality. At the same time, high-paying jobs are enticing students into the workforce, and fewer are entering doctoral programs.  

Another option which has been suggested is for engineers who are experienced in the workplace to spend some of their time teaching. However, busy companies are naturally resistant to allowing employees to take time away from their regular duties. Innovative training and associate degree and certification programs blending classroom and hands-on experience show promise for helping deal with current and potential shortages in support occupations. Such programs can prepare students for well-paying technical jobs in the industry. Encouraging experienced professionals to work past retirement, using flexible hours and locations to appeal to Millennials, and other innovative approaches must be part of the mix, as well as encouraging the entry of females into the field (only 20 percent of the current workforce is female, but over 40 percent of the new entries).

Industry observers have long been aware of the coming “changing of the guard” in the oil and gas business. We are now approaching the crucial time period for ensuring the availability of the workers needed to fill future jobs. Cooperative efforts between the industry and higher education/training institutions will likely be required, and it’s time to act.

https://i0.wp.com/oilandcareers.com/wp-content/uploads/2013/04/Petroleum-Engineer.jpg

$195 Million ‘Palazzo di Amore’ Is America’s New Most Expensive Home For Sale

https://i0.wp.com/specials-images.forbesimg.com/imageserve/afbd94a32b6cab843fa03cbcefe1b886/0x495.jpgby Erin Carlyle, Forbes staff.

Billionaire  real estate investor Jeff Greene’s massive Palazzo di Amore in Beverly Hills hit the market today for $195 million, making it America’s new most expensive home for sale.

Set on 25 acres overlooking Los Angeles about five to seven minutes by car to Rodeo Drive, the estate includes a 35,000-square-foot main home plus a 15,000-square-foot entertainment center and a separate guest home, containing a total of 12 bedrooms and 23 bathrooms across the various structures. The massive Mediterranean-style spread also comes with a working vineyard that produces six types of wine. Joyce Rey and Stacy Gottula, both of Coldwell Banker Previews International, are the listing agents.

https://i0.wp.com/specials-images.forbesimg.com/imageserve/da6b52ab92ee65bc95b551adaddcee5b/0x495.jpg

Building the Palazzo was a seven-and-a-half-year labor of love for Greene. In 2007 the real estate investor, who has a net worth of $3 billion, according to Forbes, purchased the home out of bankruptcy proceedings from the previous owners–a Middle Eastern businessman and his wife–paying a reported $35 million. “I have no logical explanation for why we spent the next seven-and-a-half years building this house,” Greene told Forbes. “But that’s the world of building very detailed custom homes.”

Greene hired mega-mansion builder Mohamed Hadid to do the lion’s share of the design, but remained intimately involved in nearly every decision (along with his wife), pouring in tens of millions to complete the estate. (Finishing touches were just put on last month.) At one point, a Peruvian woodcarver was on site for four months to hand-carve the fireplace mantels, Greene says.

Because the property was purchased out of bankrutpcy, Greene got the deed but not the house plans, he says. The partially-finished palazzo had no driveways, so Greene and Hadid had to design and build one. Same for the swimming pool. The land also came with a curious concrete foundation with nothing on it. At first, Greene and his wife planned to tear it out. Then they changed course to: ”Let’s just build an entertainment complex,” Greene says. Today, that space houses a bowling alley, a 50-seat private screening room, and a ballroom with a DJ booth and a revolving dance floor

Palazzo di Amore would make the ideal setting for some grand entertaining. The first floor of the main house features a chef’s kitchen with a commercial size walk-in refrigerator, plus a secondary staff kitchen, butler’s pantry, two staff rooms, a three-car attached garage and two private offices with separate entry. The living room, dining room, breakfast room, game room, office and family room all open onto grounds that face a waterfall set into the hillside. A separate guest house brings the total livable square footage to 53,000. And the property features garage parking for 27 cars and can accommodate up to 150 cars on site.

https://i0.wp.com/specials-images.forbesimg.com/imageserve/4494de06adb7d19df526268da6fd3bc1/0x495.jpg

Plus, what better way to impress all these hypothetical guests than with your own private wine? When Greene purchased the land in 2007, the vineyards were producing grapes but hadn’t yet been turned into wine. So the billionaire hired three full-time people to turn make the vineyards productive. Now, “Beverly Hills Vineyards” produces between 350 and 500 cases a year of six varietals: Sangiovese, Syrah, Cabernet, Merlot, Rose, and Sauvignon Blanc. “We drink it all the time,” Greene says.

The estate also features facilities for showing off that home-grown wine, with a 3,000-bottle wine cellar as well as a tasting room in the main house; as well as lower-level space for an additional 10,000 bottles (plus barrels) in a temperature-controlled room, flanked by an additional tasting room.

https://i0.wp.com/specials-images.forbesimg.com/imageserve/ea8f1ee5a82fa1cbef79c64c2066d705/0x495.jpg

Of course, the home would also make a fabulous private retreat. The private living space on the second floor of the main home contains two wings, one with a guest suite and the 5,000-square-foot master suite, with hand-carved fireplace mantel, Juliet balconies, and his-and-hers baths. The ‘his’ bath features a Turkish-style spa with hand-painted wood panels, a fireplace, and floor-to-ceiling Moroccan tiles. On the opposite wing, there are four additional bedroom suites, including one VIP suite with silk-upholstered walls and a full kitchen. The grounds surrounding the home contain a 128-foot reflecting pool and fountain. Also, a swimming pool, a spa, a barbecue area and a tennis court.

The massive Mediterranean-style spread was originally designed by architect Bob Ray Offenhauser and designer Alberto Pinto. Rey, the listing agent, says she expects the home to sell to a foreign buyer, since all the Los Angeles area homes over $50 million sold this year have gone to foreigners.

https://i0.wp.com/specials-images.forbesimg.com/imageserve/626d24250c327f246c73a5bf989714c6/0x495.jpg

To date, the most expensive home sold in the U.S. is the $147 million East Hampton spread picked up by Jana Partners founder Barry Rosenstein earlier this year. The record-setting price tag is based on nation-wide sales of major properties priced around $100 million, Rey says. She cited Copper Beech Farm, the $120 million Greenwich, Conn., property that sold earlier this year, as well as the penthouse at One57, the new luxury condominium towers in Midtown Manhattan, that billionaire Bill Ackman and a group of investors reportedly purchased for north of $90 million. “None of those properties had the land, the amenities that we’re offering here,” Rey says.

As for Greene, who lives in Florida and has a home in Malibu and another house in the Hamptons, he’s simply ready to move on with his life. ”I’m a control freak, and that’s why these projects aren’t good for me,” he says. “It’s just too many years, too long. But hopefully the buyer will come along who will appreciate the fruits of our labor.”

https://i0.wp.com/specials-images.forbesimg.com/imageserve/c94a76947dbc4790f54948cac33f2b4c/0x495.jpg

Today’s Hottest Trend In Residential Real Estate

The practice of multigenerational housing has been on the rise the past few years, and now experts are saying that it is adding value to properties.
by Lauren Mennenas

The practice of multigenerational housing has been on the rise the past few years, and now experts are saying that it is adding value to properties.

In a recent Wall Street Journal article, several couples across the country are quoted saying that instead of downsizing to a new home, they are choosing to live with their adult children.

This is what many families across the country are doing for both a “peace of mind” and for “higher property values.”

“For both domestic and foreign buyers, the hottest amenity in real estate these days is an in-law unit, an apartment carved out of an existing home or a stand-alone dwelling built on the homeowners’ property,” writes Katy McLaughlin of the WSJ. “While the adult children get the peace of mind of having mom and dad nearby, real-estate agents say the in-law accommodations are adding value to their homes.”

And how much more are these homes worth? In an analysis by Zillow, the homes with this type of living accommodations were priced about 60 percent higher than regular single-family homes.

Local builders are noticing the trend, too. Horsham based Toll Brothers are building more communities that include both large, single-family homes and smaller homes for empty nesters, the company’s chief marketing officer, Kira Sterling, told the WSJ.

https://i0.wp.com/media-cache-ec0.pinimg.com/736x/88/da/9b/88da9b983c6165c6ecfde072e1c7876f.jpg

New RICO-Fraud Class Action Against Ocwen For Abusive Fee Schemes Against Home Loans Serviced

https://i0.wp.com/poncie.com/wp-content/uploads/2011/08/ocwen-reo-appl-banner.jpg
by
Reclaim Our Republic

This new class action against Ocwen addresses the marked-up default services fees that Ocwen is charging homeowners, particularly distressed homeowners, as part of a scheme of self-dealing with companies such as Altisource, and with the involvement of William C. Erbey, Executive Chairman, who has a leadership role on the Board of Ocwen and Altisource:

Weiner v Ocwen Financial Corporation a Florida Corporation COMPLAINT.
Weiner v. Ocwen Fin. Corp. and Ocwen Loan Servicing, LLC, No 2:14-cv-02597 (E.D.Cal.), filed Nov. 5, 2014.

52. Ocwen’s scheme works as follows: Ocwen directs Altisource to order and coordinate default-related services, and, in turn, Altisource places orders for such services with third-party vendors. The third-party vendors charge Altisource for the performance of the default-related services, Altisource then marks up the price of the vendors’ services, in numerous instances by 100% or more, before “charging” the services to Ocwen. In turn, Ocwen bills the marked-up fees to homeowners.

58.Thus, the mortgage contract discloses to homeowners that the servicer will pay for default-related services when reasonably necessary, and will be reimbursed or “paid back” by the homeowner for amounts “disbursed.” Nowhere is it disclosed to borrowers that the servicer may engage in self-dealing to mark up the actual cost of those services to make a profit. Nevertheless, that is exactly what Ocwen does.

[Ed.: Explanation of Modern Relationship Between Loan Servicers and Home Loan Borrowers]

America’s Lending Industry Has Divorced itself from the Borrowers it Once Served

18. Ocwen’s unlawful loan servicing practices exemplify how America’s lending industry has run off the rails.

19. Traditionally, when people wanted to borrow money, they went to a bank or a “savings and loan.” Banks loaned money and homeowners promised to repay the bank, with interest, over a specific period of time. The originating bank kept the loan on its balance sheet, and serviced the loan — processing payments, and sending out applicable notices and other information — until the loan was repaid. The originating bank had a financial interest in ensuring that the borrower was able to repay the loan.

20. Today, however, the process has changed. Mortgages are now packaged, bundled, and sold to investors on Wall Street through what is referred to in the financial industry as mortgage backed securities or MBS. This process is called securitization. Securitization of mortgage loans provides financial institutions with the benefit of immediately being able to recover the amounts loaned. It also effectively eliminates the financial institution’s risk from potential default. But, by eliminating the risk of default, mortgage backed securities have disassociated the lending community from homeowners.

21. Numerous unexpected consequences have resulted from the divide between lenders and homeowners. Among other things, securitization has led to the development of an industry of companies which make money primarily through servicing mortgages for the hedge funds and investment houses who own the loans.

22. Loan servicers do not profit directly from interest payments made by homeowners. Instead, these companies are paid a set fee for their loan administration services. Servicing fees are usually earned as a percentage of the unpaid principal balance of the mortgages that are being serviced. A typical servicing fee is approximately 0.50% per year.

23. Additionally, under pooling and servicing agreements (“PSAs”) with investors and note holders, loan servicers assess fees on borrowers’ accounts for default-related services. These fees include, inter alia, Broker’s Price Opinion (“BPO”) fees, appraisal fees, and title examination fees.

24. Under this arrangement, a loan servicer’s primary concern is not ensuring that homeowners stay current on their loans. Instead, they are focused on minimizing any costs that would reduce profit from the set servicing fee, and generating as much revenue as possible from fees assessed against the mortgage accounts they service. As such, their “business model . . . encourages them to cut costs wherever possible, even if [that] involves cutting corners on legal requirements, and to lard on junk fees and in-sourced expenses at inflated prices.”3

25. As one Member of the Board of Governors of the Federal Reserve System has explained:
While an investor’s financial interests are tied more or less directly to the performance of a loan, the interests of a third-party servicer are tied to it only indirectly, at best. The servicer makes money, to oversimplify it a bit, by maximizing fees earned and minimizing expenses while performing the actions spelled out in its contract with the investor. . . . The broad grant of delegated authority that servicers enjoy under pooling and servicing agreements (PSAs), combined with an effective lack of choice on the part of consumers, creates an environment ripe for abuse.4 (citing See Sarah Bloom Raskin, Member Board of Governors of the Federal Reserve System, Remarks at the National Consumer Law Center’s Consumer Rights Litigation Conference, Boston Massachusetts, Nov. 12, 2010, available at http://www.federalreserve.gov/newsevents/speech/raskin20101112a.htm (last visited Jan. 23, 2012).

Don’t Count On A Major Slowdown In U.S. Oil Production Growth

https://i0.wp.com/upachaya.com/wp-content/uploads/2014/05/fracking.jpgby Richard Zeits

Summary

  • The presumption that North American shale oil production is the “swing” component of global supply may be incorrect.
  • Supply cutbacks from other sources may come first.
  • Growth momentum in North American unconventional oil production will likely carry on into 2015, with little impact from lower oil prices on the next two quarters’ volumes.
  • The current oil price does not represent a structural “economic floor” for North American unconventional oil production.

The recent pull back in crude oil prices is often portrayed as being a consequence of the rapid growth of North American shale oil production.

The thesis is often further extrapolated to suggest that a major slowdown in North American unconventional oil production growth, induced by the oil price decline, will be the corrective mechanism that will bring oil supply and demand back in equilibrium (given that OPEC’s cost to produce is low).

Both views would be, in my opinion, overly simplistic interpretations of the global supply/demand dynamics and are not supported by historical statistical data.

Oil Price – The Economic Signal Is Both Loud and Clear

The current oil price correction is, arguably, the most pronounced since the global financial crisis of 2008-2009. The following chart illustrates very vividly that the price of the OPEC Basket (which represents waterborne grades of oil) has moved far outside the “stability band” that seems to have worked well for both consumers and producers over the past four years. (It is important, in my opinion, to measure historical prices in “today’s dollars.”)

(Source: Zeits Energy Analytics, November 2014)

Given the sheer magnitude of the recent oil price move, the economic signal to the world’s largest oil suppliers is, arguably, quite powerful already. A case can be made that it goes beyond what could be interpreted as “ordinary volatility,” giving the hope that the current price level may be sufficient to induce some supply response from the largest producers – in the event a supply cut back is indeed needed to eliminate a transitory supply/demand imbalance.

Are The U.S. Oil Shales The Culprit?

It is debatable, in my opinion, if the continued growth of the U.S. onshore oil production can be identified as the primary cause of the current correction in the oil price. Most likely, North American shale oil is just one of several powerful factors, on both supply and demand sides, that came together to cause the price decline.

The history of oil production increases from North America in the past three years shows that the OPEC Basket price remained within the fairly tight band, as highlighted on the graph above, during 2012-2013, the period when such increases were the largest. Global oil prices “broke down” in September of 2014, when North American oil production was growing at a lower rate than in 2012-2013.

(Source: OPEC, October 2014)

If the supply growth from North America was indeed the primary “disruptive” factor causing the imbalance, one would expect the impact on oil prices to become visible at the time when incremental volumes from North America were the highest, i.e., in 2012-2013.

Should One Expect A Strong Slowdown in North American Oil Production Growth?

There is no question that the sharp pullback in the price of oil will impact operating margins and cash flows of North American shale oil producers. However, a major slowdown in North American unconventional oil production growth is a lot less obvious.

First, the oil price correction being seen by North American shale oil producers is less pronounced than the oil price correction experienced by OPEC exporters. It is sufficient to look at the WTI historical price graph below (which is also presented in “today’s dollars”) to realize that the current WTI price decline is not dissimilar to those seen in 2012 and 2013 and therefore represents a signal of lesser magnitude than the one sent to international exporters (the OPEC Basket price).

(Source: Zeits Energy Analytics, November 2014)

Furthermore, among all the sources of global oil supply, North American oil shales are the least established category. Their cost structure is evolving rapidly. Given the strong productivity gains in North American shale oil plays, what was a below-breakeven price just two-three years ago, may have become a price stimulating growth going into 2015.

Therefore, the signal sent by the recent oil price decline may not be punitive enough for North American shale oil producers and may not be able to starve the industry of external capital.

Most importantly, review of historical operating statistics provides an indication that the previous similar WTI price corrections – seen in 2012 and 2013 – did not result in meaningful slowdowns in the North American shale oil production.

The following graph shows the trajectory of oil production in the Bakken play. From this graph, it is difficult to discern any significant impact from the 2012 and 2013 WTI price corrections on the play’s aggregate production volumes. While a positive correlation between these two price corrections and the pace of production growth in the Bakken exists, there are other factors – such as takeaway capacity availability and local differentials – that appear to have played a greater role. I should also note that the impact of the lower oil prices on production volumes was not visible in the production growth rate for more than half a year after the onset of the correction.

(Source: Zeits Energy Analytics, November 2014)

Leading U.S. Independents Will Likely Continue to Grow Production At A Rapid Pace

Production growth track record by several leading shale oil players suggests that U.S. shale oil production will likely remain strong even in the $80 per barrel WTI price environment. Several examples provide an illustration.

Continental Resources (NYSE:CLR) grew its Bakken production volumes at a 58% CAGR over the past three years (slide below). By looking at the company’s historical production, it would be difficult to identify any impact from the 2012 and 2013 oil price corrections on the company’s production growth rate. Continental just announced a reduction to its capital budget in 2015 in response to lower oil prices, to $4.6 billion from $5.2 billion planned initially. The company still expects to grow its total production in 2015 by 23%-29% year-on-year.

(Source: Continental Resources, October 2014)

EOG Resources (NYSE:EOG) expects that its largest core plays (Eagle Ford, Bakken and Delaware Basin) will generate after-tax rates of return in excess of 100% in 2015 at $80 per barrel wellhead price. EOG went further to suggest that these plays may remain economically viable (10% well-level returns) at oil prices as low as $40 per barrel. The company expects to continue to grow its oil production at a double-digit rate in 2015 while spending within its cash flow. EOG achieved ~40% oil production growth in 2012-2013 and expects 31% growth for 2014. While a slowdown is visible, it is important to take into consideration that EOG’s oil production base has increased dramatically in the past three years and requires significant capital just to be maintained flat. Again, one would not notice much impact from prior years’ oil price corrections on EOG’s production growth trajectory.

(Source: EOG Resources, November 2014)

Anadarko Petroleum’s (NYSE:APC) U.S. onshore oil production growth story is similar. Anadarko increased its U.S. crude oil and NLS production from 100,000 barrels per day in 2010 to close to almost 300,000 barrels per day expected in Q4 2014. Anadarko has not yet provided growth guidance for 2015, but indicated that the company’s exploration and development strategies remain intact. While recognizing a very steep decline in the oil price, Anadarko stated that it wants “to watch this environment a little longer” before reaching conclusions with regard to the impact on its future spending plans.

(Source: Anadarko Petroleum, October 2014)

Devon Energy (NYSE:DVN) posted company-wide oil production of 216,000 barrels per day in Q3 2014. While Devon will provide detailed production and capital guidance at a later date, the company has indicated that it sees 20% to 25% oil production growth and mid‐single digit top‐line growth “on a retained‐property basis” (pro forma for divestitures) in 2015.

The list can continue on.

In Conclusion…

Based on preliminary 2015 growth indications from large shale oil operators, North American oil production growth in 2015 will likely remain strong, barring further strong decline in the price of oil.

No slowdown effect from lower oil prices will be seen for at least six months from the time operators received the “price signal” (August-September 2014).

Given the effects of the technical learning curve in oil shales and continuously improving drilling economics, the current ~$77 per barrel WTI price is unlikely to be sufficient to eliminate North American unconventional production growth.

North American shale oil production remains a very small and highly fragmented component of the global oil supply.

The global oil “central bank” (Saudi Arabia and its close allies in OPEC) remain best positioned to quickly re-instate stability of oil price in the event further significant decline occurred.

High Stakes in Dracula’s Transylvania

House hunters are turning to Romania’s central region of Transylvania, popularized by the tale of Count Dracula. Restrictions were lifted this year on local purchases of local real estate by European Union nationals. Bran Castle, above, in Bran, Brasov county, is marketed as the home of Count Dracula, but in reality it was a residence of Romanian Queen Marie in the early 20th century.Romania draws foreign buyers looking for historic mansions and modern villas in resort areas

Count Dracula, the central character of Irish author Bram Stoker’s classic vampire novel, eagerly left for England in search of new blood, in a story that popularized the Romanian region of Transylvania. Today, house hunters are invited to make the reverse journey now that Romania is a member of the European Union and that restrictions were lifted this year on purchases of local real estate by the bloc’s nationals.

Britain’s Prince Charles, for one, unwinds every year in Zalanpatak. The mud road leading to the remote village stretches for miles, with the clanging of cow bells accompanying tourists making the trek.

Elsewhere in the world, the heir to the British throne occupies great castles and sprawling mansions. In rural Romania, he resides in a small old cottage. His involvement, since 2006, in the restoration of a few local farmhouses has given the hamlet global popularity and added a sense of excitement about Transylvania living.

A living room in Bran Castle, a Transylvania property marketed as Count Dracula’s castle. The home is for sale, initially listed for $78 million.A living room in Bran Castle, a Transylvania property marketed as Count Dracula’s castle. The home is for sale, initially listed for $78 million.

Transylvania, with a population of more than seven million in the central part of Romania, has a number of high-end homes on the market. And, yes, one is a castle. Bran Castle in Brasov county is marketed as the home of Count Dracula. In reality it was a residence of Romanian Queen Marie in the early 20th century. In 2007, the home was available for $78 million. The sellers are no longer listing a price, said Mark A. Meyer, of Herzfeld and Rubin, the New York attorneys representing the queen’s descendants, but will entertain offers.

Foreign buyers had been focused on Bucharest, where there was speculative buying of apartments after the country joined the EU in 2007. But Transylvania has been luring house hunters away from the capital city.

A guesthouse on the property in Zalanpatak, Transylvania, that is owned by Britain’s Prince Charles. His presence has boosted interest in Romanian real estate.A guesthouse on the property in Zalanpatak, Transylvania, that is owned by Britain’s Prince Charles. His presence has boosted interest in Romanian real estate.

Transylvania means “the land beyond the forest” and the region is famous for its scenic mountain routes. Brasov, an elegant mountain resort and the closest Transylvanian city to the capital, has many big villas built in the 19th century by wealthy merchants. A 10-room townhouse from that period in the historic city center is listed for $2.7 million. For $500,000, a 2,200-square-foot apartment offers rooftop views of the city and the surrounding mountains.

A seven-bedroom mansion in the nearby village of Halchiu, close to popular skiing resorts, is on the market for $2.4 million. The modern villa features two huge living rooms, a swimming pool, a tennis court and spectacular views of the Carpathian Mountains.

The village, founded by Saxons in the 12th century, has rows of historic houses across the street. Four such buildings were demolished to make way for the mansion, completed in 2010.

A $2.4 million mansion is for sale in Halchiu village.A $2.4 million mansion is for sale in Halchiu village.

“Rather than invest a million or more to buy an existing house, the wealthy prefer to build on their own because construction materials and work is cheaper,” said Raluca Plavita, senior consultant at real-estate firm DTZ Echinox in Bucharest.

Non-EU nationals can’t purchase land outright—although they may use locally registered companies to circumvent the restriction—but they can buy buildings freely, said Razvan Popa, real-estate partner at law firm Kinstellar. High-end properties are out of reach for many Romanians, who make an average of $500 in monthly take-home pay.

The country saw a rapid inflation of real-estate prices before 2008, on prospects of Romania’s entry to the EU and the North Atlantic Treaty Organization, as well as aggressive lending by banks. Values then fell by half during the global financial crisis.

The economy is stronger now, with the International Monetary Fund estimating 2.4% growth this year. But the country is still among Europe’s poorest. Its isolation during the dictatorship of Nicolae Ceausescu gave it a bad image.

The interior of the seven-bedroom Halchiu mansion, which was built on the site of four traditional Saxon homes.The interior of the seven-bedroom Halchiu mansion, which was built on the site of four traditional Saxon homes.

“Interest in Romania isn’t comparable with Prague or Budapest where some may be looking to buy a small apartment with a view of Charles Bridge or the Danube,” said Mr. Popa, the real-estate lawyer.

The international publicity around Prince Charles’s properties offers a counterbalance to some of the negative press Romania has received in Western Europe, which is worried about well-educated Romanians moving to other countries to provide inexpensive labor.

The Zalanpatak property is looked after by Tibor Kalnoky, a descendant of a Hungarian aristocratic family. The 47-year-old studied in Germany to be a veterinarian and, after reclaiming family assets in Romania, has managed the prince’s property and has hosted him during his visits.

These occasional visits are enough to attract scores of tourists throughout the year to the formerly obscure village in a Transylvanian valley. The fact that few street signs lead there, that the property offers no Internet or TV and that cellphone signals are absent for miles, seems only to add to the mystery of the place.

Single Family Construction Expected to Boom in 2015

https://i0.wp.com/s3.amazonaws.com/static.texastribune.org/media/images/Foster_Jerod-9762.jpgKenny DeLaGarza, a building inspector for the city of Midland, at a 600-home Betenbough development.

Single-family home construction is expected to increase 26 percent in 2015, the National Association of Home Builders reported Oct. 31. NAHB expects single-family production to total 802,000 units next year and reach 1.1 million by 2016.

Economists participating in the NAHB’s 2014 Fall Construction Forecast Webinar said that a growing economy, increased household formation, low interest rates and pent-up demand should help drive the market next year. They also said they expect continued growth in multifamily starts given the nation’s rental demand.

The NAHB called the 2000-03 period a benchmark for normal housing activity; during those years, single-family production averaged 1.3 million units a year. The organization said it expects single-family starts to be at 90 percent of normal by the fourth quarter 2016.

NAHB Chief Economist David Crowe said multifamily starts currently are at normal production levels and are projected to increase 15 percent to 365,000 by the end of the year and hold steady into next year.

The NAHB Remodeling Market Index also showed increased activity, although it’s expected to be down 3.4 percent compared to last year because of sluggish activity in the first quarter 2014. Remodeling activity will continue to increase gradually in 2015 and 2016.

Moody’s Analytics Chief Economist Mark Zandi told the NAHB that he expects an undersupply of housing given increasing job growth. Currently, the nation’s supply stands at just over 1 million units annually, well below what’s considered normal; in a normal year, there should be demand for 1.7 million units.

Zandi noted that increasing housing stock by 700,000 units should help meet demand and create 2.1 million jobs. He also noted that things should level off by the end of 2017, when mortgage rates probably will  rise to around 6 percent.

“The housing market will be fine because of better employment, higher wages and solid economic growth, which will trump the effect of higher mortgage rates,” Zandi told the NAHB.

Robert Denk, NAHB assistant vice president for forecasting and analysis, said that he expects housing recovery to vary by state and region, noting that states with higher levels of payroll employment or labor market recovery are associated with healthier housing markets

States with the healthiest job growth include Louisiana, Montana, North Dakota, Texas and Wyoming, as well as farm belt states like Iowa.

Meanwhile Alabama, Arizona, Nevada, New Jersey, New Mexico and Rhode Island continue to have weaker markets.